climate change and coastal flooding in metro boston
TRANSCRIPT
Climate change and coastal flooding in MetroBoston: impacts and adaptation strategies
Paul Kirshen & Kelly Knee & Matthias Ruth
Received: 15 January 2004 /Accepted: 23 January 2008# Springer Science + Business Media B.V. 2008
Abstract Sea level rise (SLR) due to climate change will increase storm surge height alongthe 825 km long coastline of Metro Boston, USA. Land at risk consists of urban waterfrontwith piers and armoring, residential areas with and without seawalls and revetments, andundeveloped land with either rock coasts or gently sloping beachfront and low-lying coastalmarshes. Risk-based analysis shows that the cumulative 100 year economic impacts ondeveloped areas from increased storm surge flooding depend heavily upon the adaptationresponse, location, and estimated sea level rise. Generally it is found that it is advantageousto use expensive structural protection in areas that are highly developed and less structuralapproaches such as floodproofing and limiting or removing development in less developedor environmentally sensitive areas.
1 Introduction
The Intergovernmental Panel on Climate Change (IPCC 2007, p 10) states that,“Discernible human influences (due to observed increases in globally averaged temper-atures very likely due to the observed increase in anthropogenic greenhouse gasconcentrations) now extend to other aspects of climate, including ocean warming,continental-average temperatures, temperature extremes and wind patterns” One of theimpacts has been an increase in sea level because of the melting of ice on land and thermal
Climatic ChangeDOI 10.1007/s10584-008-9398-9
P. Kirshen (*)Tufts Water: Systems,Science, and Society (WSSS) Graduate Education Program and Research Professor,Civil and Environmental Engineering (CEE) Department, Tufts University, Medford, MA 02155, USAe-mail: [email protected]
K. KneeApplied Science Associates, 70 Dean Knauss Road, Narragansett, RI 02882, USAe-mail: [email protected]
M. RuthCenter for Integrative Environmental Research, Engineering and Public Policy, University of Maryland,2202 Van Munching Hall, College Park, MD 20742, USAe-mail: [email protected]
expansion of the ocean as it is warmed (the sum of both is eustatic sea level rise, Pugh2004). IPCC (2007) reports that the historic eustatic rate over the period 1961 to 2003 is 1.8±0.5 mm/year with an increase to 3.1±0.7 mm/year from 1993 to 2003. Sea level elevationrelative to land is also related to processes that affect a specific region, including tectonicuplift and down dropping, isostatic rebound and depression, land surface changes due tocompaction, dewatering, fluid extraction, and diagenetic processes. For example in coastalBoston in the northeastern United States (USA), land subsidence is estimated to have been1.5 mm/year or 0.15 m in the last 100 years (Nucci Vine Associates, Inc. 1992). An estimateof 2 mm/year for historical subsidence in Revere, nearby to the north of Boston, wasreported in Clark et al. (1998). Eustatic sea level rise (SLR) combined with land subsidenceis referred to as relative SLR. The effects of SLR in the coastal zone include displacementand loss of wetlands, inundation of low-lying property, increased erosion of the shoreline,change in the extent of flood zones, changing water circulation patterns, and more saltwater intrusion into groundwater. It is also possible that due to climate change there couldbe changes in coastal storm patterns that alter the frequency and intensity of coastalflooding, for example, see Emanuel (2005).
Most experts (IPCC 2001; Natural Resources Canada 2002) agree with the IPCC (1990)formulation that adaptation responses to SLR include protection, accommodation, andretreat. Protection attempts to manage the hazard with “hard” structures such as seawallsand groins or “soft” measures such as beach nourishment. Accommodation allows humanactivities and the hazard to coexist through actions such as flood proofing. Retreat removeshuman activity from the hazard area which generally is accomplished by abandoning landas the sea rises. Each of these strategies has different economic, social, and environmentalimpacts and policy implications that are highly site dependent.
In the Boston research, we examine periodic losses from flooding quantified by areas at-risk and cost of likely damages and adaptation actions under four possible adaptationstrategies. This research expands the coastal flooding section of the Climate’s Long-termImpacts on Metro Boston (CLIMB) research project which examined the integrated, multi-sector impacts of climate change upon the region's infrastructure services. The CLIMBproject was conducted from 1999 to 2004 by a multidisciplinary research team from TuftsUniversity, University of Maryland, and Boston University with assistance from theMetropolitan Area Planning Council (MAPC) and a Stakeholder Advisory Committeecomposed of representatives of government and other interest groups and infrastructure andplanning experts. The methodology and results are summarized in Ruth and Kirshen (2001)and Kirshen et al. (2008a, b), and are available in full in Kirshen et al. (2004). The CLIMBregion or Metro Boston, which is located in the northeastern USA, is shown in Fig. 1 andincludes the major cities of Boston and Cambridge and the other 99 municipalities withinapproximately 20 miles of Boston. The area is bordered on the east by Boston Harbor (theconfluence of three major rivers) and on the south, west, and north approximately by thecircumferential Route 495, covering an area of 3,683 km2. Metro Boston’s population isapproximately 3.2 million and is expected to increase to 4.0 million by 2050. Land usevaries from densely populated urban areas in the east, suburbs in the center, andundeveloped farmland and some urban “sprawl” on the fringes. It is the heart of the NewEngland economy and provides its major airport, and seaport facilities. The region iscurrently experiencing pressure on most of its infrastructure systems and severedevelopment pressure in the municipalities just outside of the core city areas. It ischaracterized by a climate with four distinct seasons with annual precipitation of 1,000 mmrelatively evenly distributed throughout the year; some falling as snow in the winter. Theaverage monthly temperature is approximately 10°C. For the purpose of analysis, the
Climatic Change
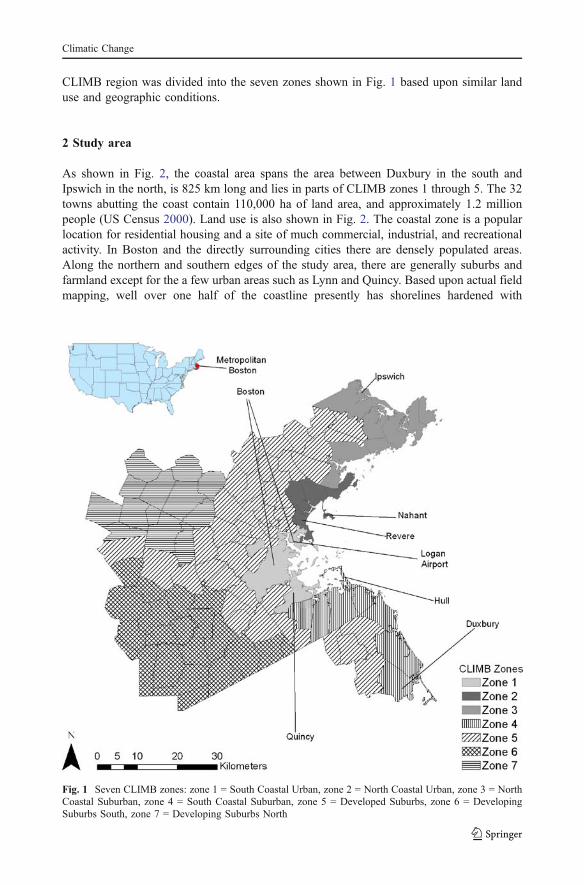
CLIMB region was divided into the seven zones shown in Fig. 1 based upon similar landuse and geographic conditions.
2 Study area
As shown in Fig. 2, the coastal area spans the area between Duxbury in the south andIpswich in the north, is 825 km long and lies in parts of CLIMB zones 1 through 5. The 32towns abutting the coast contain 110,000 ha of land area, and approximately 1.2 millionpeople (US Census 2000). Land use is also shown in Fig. 2. The coastal zone is a popularlocation for residential housing and a site of much commercial, industrial, and recreationalactivity. In Boston and the directly surrounding cities there are densely populated areas.Along the northern and southern edges of the study area, there are generally suburbs andfarmland except for the a few urban areas such as Lynn and Quincy. Based upon actual fieldmapping, well over one half of the coastline presently has shorelines hardened with
Fig. 1 Seven CLIMB zones: zone 1 = South Coastal Urban, zone 2 = North Coastal Urban, zone 3 = NorthCoastal Suburban, zone 4 = South Coastal Suburban, zone 5 = Developed Suburbs, zone 6 = DevelopingSuburbs South, zone 7 = Developing Suburbs North
Climatic Change
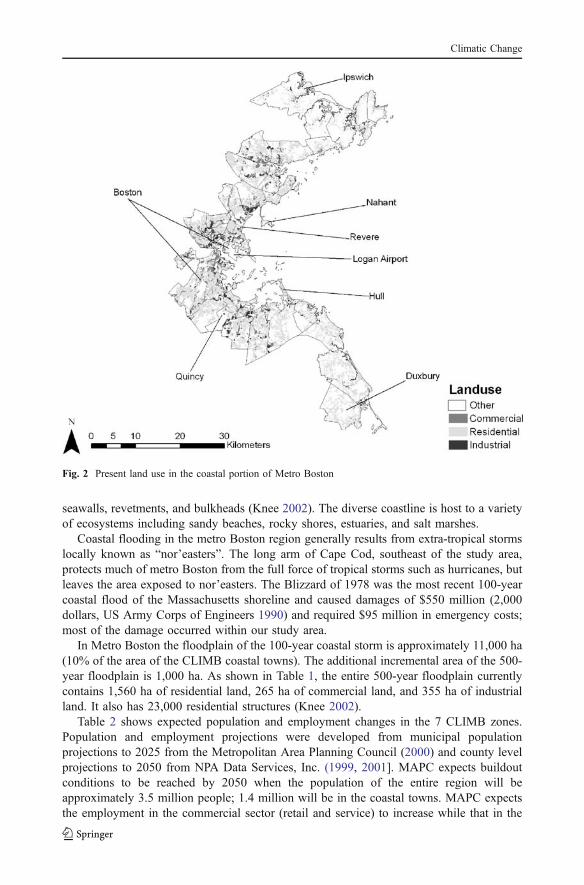
seawalls, revetments, and bulkheads (Knee 2002). The diverse coastline is host to a varietyof ecosystems including sandy beaches, rocky shores, estuaries, and salt marshes.
Coastal flooding in the metro Boston region generally results from extra-tropical stormslocally known as “nor’easters”. The long arm of Cape Cod, southeast of the study area,protects much of metro Boston from the full force of tropical storms such as hurricanes, butleaves the area exposed to nor’easters. The Blizzard of 1978 was the most recent 100-yearcoastal flood of the Massachusetts shoreline and caused damages of $550 million (2,000dollars, US Army Corps of Engineers 1990) and required $95 million in emergency costs;most of the damage occurred within our study area.
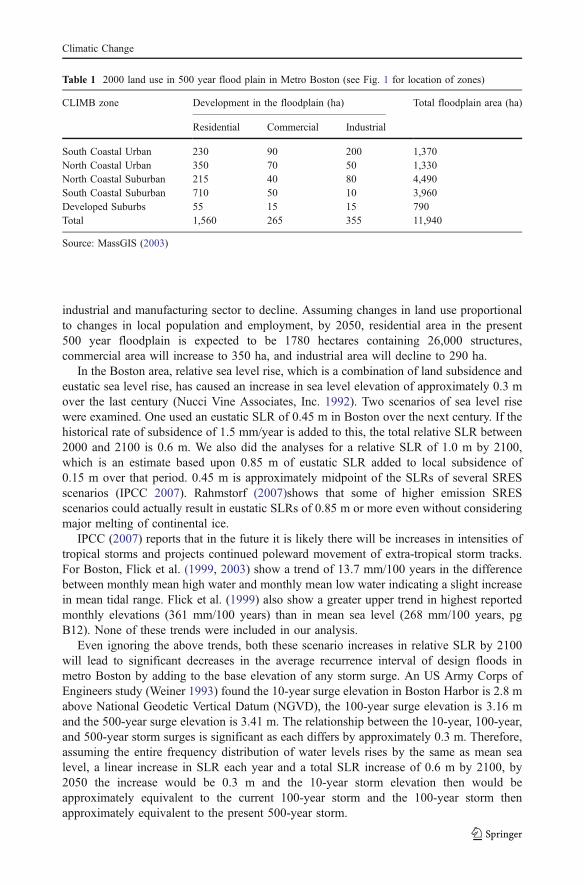
In Metro Boston the floodplain of the 100-year coastal storm is approximately 11,000 ha(10% of the area of the CLIMB coastal towns). The additional incremental area of the 500-year floodplain is 1,000 ha. As shown in Table 1, the entire 500-year floodplain currentlycontains 1,560 ha of residential land, 265 ha of commercial land, and 355 ha of industrialland. It also has 23,000 residential structures (Knee 2002).
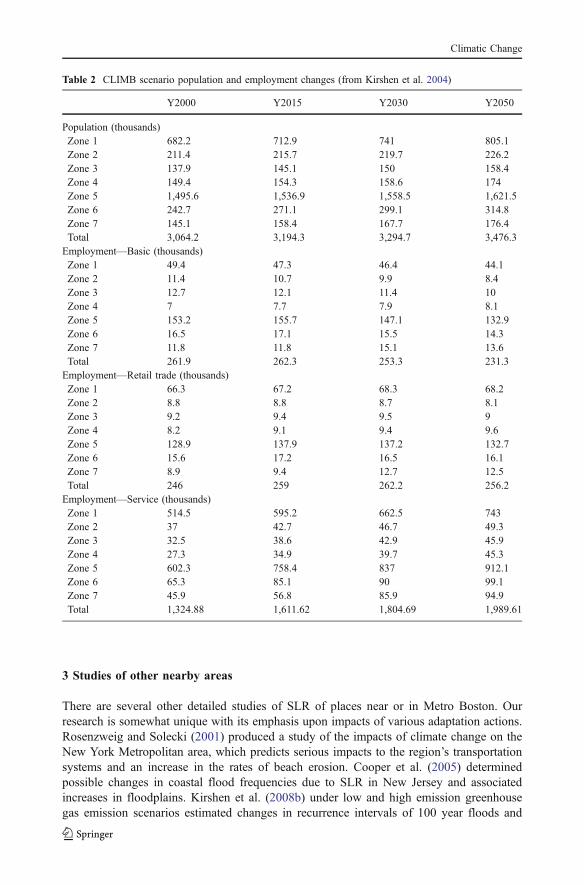
Table 2 shows expected population and employment changes in the 7 CLIMB zones.Population and employment projections were developed from municipal populationprojections to 2025 from the Metropolitan Area Planning Council (2000) and county levelprojections to 2050 from NPA Data Services, Inc. (1999, 2001]. MAPC expects buildoutconditions to be reached by 2050 when the population of the entire region will beapproximately 3.5 million people; 1.4 million will be in the coastal towns. MAPC expectsthe employment in the commercial sector (retail and service) to increase while that in the
Fig. 2 Present land use in the coastal portion of Metro Boston
Climatic Change
industrial and manufacturing sector to decline. Assuming changes in land use proportionalto changes in local population and employment, by 2050, residential area in the present500 year floodplain is expected to be 1780 hectares containing 26,000 structures,commercial area will increase to 350 ha, and industrial area will decline to 290 ha.
In the Boston area, relative sea level rise, which is a combination of land subsidence andeustatic sea level rise, has caused an increase in sea level elevation of approximately 0.3 mover the last century (Nucci Vine Associates, Inc. 1992). Two scenarios of sea level risewere examined. One used an eustatic SLR of 0.45 m in Boston over the next century. If thehistorical rate of subsidence of 1.5 mm/year is added to this, the total relative SLR between2000 and 2100 is 0.6 m. We also did the analyses for a relative SLR of 1.0 m by 2100,which is an estimate based upon 0.85 m of eustatic SLR added to local subsidence of0.15 m over that period. 0.45 m is approximately midpoint of the SLRs of several SRESscenarios (IPCC 2007). Rahmstorf (2007)shows that some of higher emission SRESscenarios could actually result in eustatic SLRs of 0.85 m or more even without consideringmajor melting of continental ice.
IPCC (2007) reports that in the future it is likely there will be increases in intensities oftropical storms and projects continued poleward movement of extra-tropical storm tracks.For Boston, Flick et al. (1999, 2003) show a trend of 13.7 mm/100 years in the differencebetween monthly mean high water and monthly mean low water indicating a slight increasein mean tidal range. Flick et al. (1999) also show a greater upper trend in highest reportedmonthly elevations (361 mm/100 years) than in mean sea level (268 mm/100 years, pgB12). None of these trends were included in our analysis.
Even ignoring the above trends, both these scenario increases in relative SLR by 2100will lead to significant decreases in the average recurrence interval of design floods inmetro Boston by adding to the base elevation of any storm surge. An US Army Corps ofEngineers study (Weiner 1993) found the 10-year surge elevation in Boston Harbor is 2.8 mabove National Geodetic Vertical Datum (NGVD), the 100-year surge elevation is 3.16 mand the 500-year surge elevation is 3.41 m. The relationship between the 10-year, 100-year,and 500-year storm surges is significant as each differs by approximately 0.3 m. Therefore,assuming the entire frequency distribution of water levels rises by the same as mean sealevel, a linear increase in SLR each year and a total SLR increase of 0.6 m by 2100, by2050 the increase would be 0.3 m and the 10-year storm elevation then would beapproximately equivalent to the current 100-year storm and the 100-year storm thenapproximately equivalent to the present 500-year storm.
Table 1 2000 land use in 500 year flood plain in Metro Boston (see Fig. 1 for location of zones)
CLIMB zone Development in the floodplain (ha) Total floodplain area (ha)
Residential Commercial Industrial
South Coastal Urban 230 90 200 1,370North Coastal Urban 350 70 50 1,330North Coastal Suburban 215 40 80 4,490South Coastal Suburban 710 50 10 3,960Developed Suburbs 55 15 15 790Total 1,560 265 355 11,940
Source: MassGIS (2003)
Climatic Change
3 Studies of other nearby areas
There are several other detailed studies of SLR of places near or in Metro Boston. Ourresearch is somewhat unique with its emphasis upon impacts of various adaptation actions.Rosenzweig and Solecki (2001) produced a study of the impacts of climate change on theNew York Metropolitan area, which predicts serious impacts to the region’s transportationsystems and an increase in the rates of beach erosion. Cooper et al. (2005) determinedpossible changes in coastal flood frequencies due to SLR in New Jersey and associatedincreases in floodplains. Kirshen et al. (2008b) under low and high emission greenhousegas emission scenarios estimated changes in recurrence intervals of 100 year floods and
Table 2 CLIMB scenario population and employment changes (from Kirshen et al. 2004)
Y2000 Y2015 Y2030 Y2050
Population (thousands)Zone 1 682.2 712.9 741 805.1Zone 2 211.4 215.7 219.7 226.2Zone 3 137.9 145.1 150 158.4Zone 4 149.4 154.3 158.6 174Zone 5 1,495.6 1,536.9 1,558.5 1,621.5Zone 6 242.7 271.1 299.1 314.8Zone 7 145.1 158.4 167.7 176.4Total 3,064.2 3,194.3 3,294.7 3,476.3Employment—Basic (thousands)Zone 1 49.4 47.3 46.4 44.1Zone 2 11.4 10.7 9.9 8.4Zone 3 12.7 12.1 11.4 10Zone 4 7 7.7 7.9 8.1Zone 5 153.2 155.7 147.1 132.9Zone 6 16.5 17.1 15.5 14.3Zone 7 11.8 11.8 15.1 13.6Total 261.9 262.3 253.3 231.3Employment—Retail trade (thousands)Zone 1 66.3 67.2 68.3 68.2Zone 2 8.8 8.8 8.7 8.1Zone 3 9.2 9.4 9.5 9Zone 4 8.2 9.1 9.4 9.6Zone 5 128.9 137.9 137.2 132.7Zone 6 15.6 17.2 16.5 16.1Zone 7 8.9 9.4 12.7 12.5Total 246 259 262.2 256.2Employment—Service (thousands)Zone 1 514.5 595.2 662.5 743Zone 2 37 42.7 46.7 49.3Zone 3 32.5 38.6 42.9 45.9Zone 4 27.3 34.9 39.7 45.3Zone 5 602.3 758.4 837 912.1Zone 6 65.3 85.1 90 99.1Zone 7 45.9 56.8 85.9 94.9Total 1,324.88 1,611.62 1,804.69 1,989.61
Climatic Change
extents of new 100 year floodplains in 2100 in Boston, Woods Hole, New London, NewYork City, and Atlantic City. The methodology was different from that in this paper butfound similar results in recurrence interval changes. No damage assessments were done.The New England Regional Assessment Group (NERA) performed an analysis of climatechange for all of New England and New York and concluded that both low-lyinginfrastructure and wetlands would be at-risk (NERA 2001). The impacts of sea level rise forinner Boston Harbor have also been studied, and many port facilities such as containerareas will be at-risk (Nucci Vine Associates, Inc. 1992). Few damage estimates are given inall these studies. The US Army Corps of Engineers (1990) estimated that the additionalannual flood losses arising from one foot of SLR in the next 100 years to the heavilydeveloped and industrialized Saugus River estuary area directly north of Boston with acoastline 8 km of would be $1.4 million. While not directly examining the impacts ofclimate change, Clark et al. (1998) mapped the vulnerability of residents of Revere MA bydetermining areas at risk to various amounts of coastal flooding and residents’socioeconomic characteristics.
4 Methodology
As described above, we examined impacts under two relative SLR scenarios for 2100:0.6 m and 1.0 m. We examined the annual impacts for the period 2000 to 2100 in light offour possible adaptations to climate change that could be taken in the region and which willbe discussed subsequently: Ride It Out (RIO); nonstructural, environmentally benign orgreen accommodation (GREEN); Build Your Way Out (BYWO), and Retreat (RETREAT).Details on these are given subsequently. We examined the impacts assuming that SLRoccurs gradually at a constant amount each year even though there are strong possibilitiesof abrupt climate change causing major changes over decades instead of a century. We donot include any possible impacts of changes in the frequency or intensity of storms becausethey are not well known at this time or possible shoreline changes due to increased erosionunder SLR. We also did not examine impacts occurring beyond 2100 even though impactswould still be occurring then; the magnitudes would depend upon mitigation actions whichthe world and in particular the USA and industrially expanding countries take to curbemissions of greenhouse gases. We did not discount any of the future costs of propertydamage or flood protection; we assumed that property values appreciated at the discountrate and, since flood protection costs are very closely related to property costs (such asfloodproofing), that discounting was also unnecessary for these costs. We do, however,present graphical time series of damages over the period 2000 to 2100 so a discount factorcan be applied if desired by readers. Damage costs were estimated as accurately as possiblebut if judgment was required, the lesser value was always chosen. Tables of the values areavailable to those interested.
Since no significant developed land would be permanently inundated because of SLRand we ignored possible shoreline changes, we did not have to be concerned with losingdeveloped land because of permanent flooding. Therefore the first step in the analysis wasto determine for each CLIMB zone the relationship between flood elevations and the areaflooded. As an example of the method, the flood elevation versus flooded area curve forCLIMB zone 3, the North Coastal Suburban zone, is shown in Fig. 3. It was derived bylinearly interpolating between the elevations of the present 100 year (that is, the elevationthat has a probability of being equaled or exceeded in any year of 1/100 or 1%) and500 year floodplains whose locations have been mapped by the Federal Emergency
Climatic Change
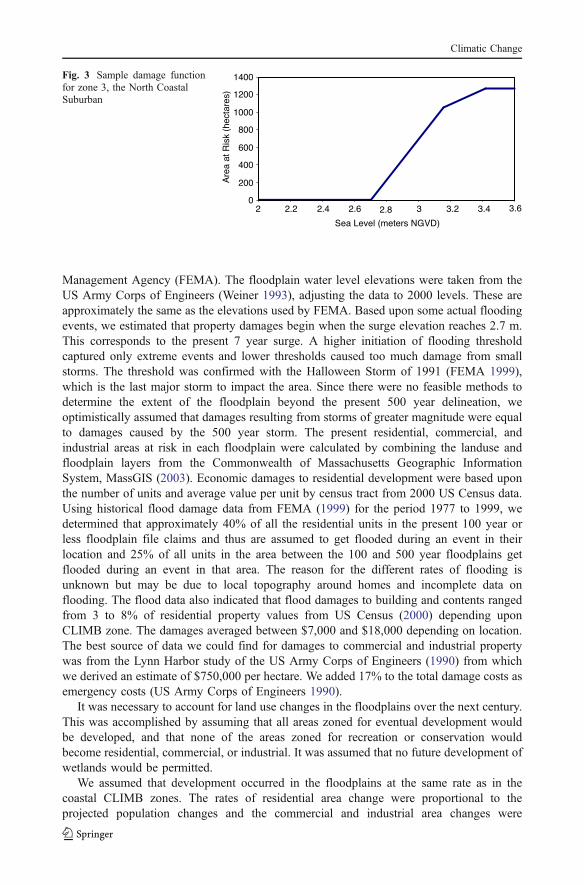
Management Agency (FEMA). The floodplain water level elevations were taken from theUS Army Corps of Engineers (Weiner 1993), adjusting the data to 2000 levels. These areapproximately the same as the elevations used by FEMA. Based upon some actual floodingevents, we estimated that property damages begin when the surge elevation reaches 2.7 m.This corresponds to the present 7 year surge. A higher initiation of flooding thresholdcaptured only extreme events and lower thresholds caused too much damage from smallstorms. The threshold was confirmed with the Halloween Storm of 1991 (FEMA 1999),which is the last major storm to impact the area. Since there were no feasible methods todetermine the extent of the floodplain beyond the present 500 year delineation, weoptimistically assumed that damages resulting from storms of greater magnitude were equalto damages caused by the 500 year storm. The present residential, commercial, andindustrial areas at risk in each floodplain were calculated by combining the landuse andfloodplain layers from the Commonwealth of Massachusetts Geographic InformationSystem, MassGIS (2003). Economic damages to residential development were based uponthe number of units and average value per unit by census tract from 2000 US Census data.Using historical flood damage data from FEMA (1999) for the period 1977 to 1999, wedetermined that approximately 40% of all the residential units in the present 100 year orless floodplain file claims and thus are assumed to get flooded during an event in theirlocation and 25% of all units in the area between the 100 and 500 year floodplains getflooded during an event in that area. The reason for the different rates of flooding isunknown but may be due to local topography around homes and incomplete data onflooding. The flood data also indicated that flood damages to building and contents rangedfrom 3 to 8% of residential property values from US Census (2000) depending uponCLIMB zone. The damages averaged between $7,000 and $18,000 depending on location.The best source of data we could find for damages to commercial and industrial propertywas from the Lynn Harbor study of the US Army Corps of Engineers (1990) from whichwe derived an estimate of $750,000 per hectare. We added 17% to the total damage costs asemergency costs (US Army Corps of Engineers 1990).
It was necessary to account for land use changes in the floodplains over the next century.This was accomplished by assuming that all areas zoned for eventual development wouldbe developed, and that none of the areas zoned for recreation or conservation wouldbecome residential, commercial, or industrial. It was assumed that no future development ofwetlands would be permitted.
We assumed that development occurred in the floodplains at the same rate as in thecoastal CLIMB zones. The rates of residential area change were proportional to theprojected population changes and the commercial and industrial area changes were
0
200
400
600
800
1000
1200
1400
2 2.2 2.4 2.6 3 3.2 3.4
Are
a at
Ris
k (h
ecta
res)
Sea Level (meters NGVD)
2.8 3.6
Fig. 3 Sample damage functionfor zone 3, the North CoastalSuburban
Climatic Change
proportional to the changes in their employment. The population and employment data arereported in Table 2.
As explained in more detail below, bootstrapping of historic sea level data and MonteCarlo simulation were used to project sea levels and impacts for the next century. Historicalsea level data from 1920 to 2000 from the National Oceanographic Survey (NOS) for BostonHarbor were utilized. Since sea level rise has been occurring over this time period, the datarequired adjustment to 2000 levels before it could be included in the analysis. The adjustmentwas made by assuming a 0.3 m increase in sea level over the last 100 years (Nucci VineAssociates, Inc. 1992) and then linearly interpolating the total relative SLR that had occurredin each year since 1920 and adding this interpolated value to the elevations for that year.
To develop possible time series of the three highest future sea levels that might occur inany year in the period 2000 to 2100, the following was done. An historical year from 1920to 2000 was randomly assigned to each year in the study period from 2000 to 2100 and thethree highest SLR elevations that had occurred in that historic year were extracted. Thisprocess was repeated 100 times to develop 100 possible time series of future annualmaximum sea levels (i.e. bootstrapping, Vogel and Shallcross 1996). Then the coastalimpacts were determined for each of the 100 time series of elevations (Monte Carlosimulation) and the resulting damages were averaged to obtain the expected value ofdamages. Because the process accounts for 100 possible patterns in the timing of futurestorm surges, uncertainty in the timing of future storm surges is inherently included. In theclimate change scenarios, the cumulative increase in sea level was added to the threemaximum sea levels corresponding to the year in the bootstrapped time series.
Monte Carlo simulation of the impacts under various adaptation options was performedusing STELLA simulation software from High Performance Systems Inc (1997). For eachyear in period 2000 to 2100, the simulation model used the annual maximum sea levels, theflood area function in Fig. 3 described above, and the areas of development in thefloodplain to calculate the annual damages. The output included residential, commercial,and industrial areas flooded and economic damages. Variables such as the types ofadaptation strategy (described below), the development scenario, the rate of sea level rise,and the number of damage events per year considered were varied for each set of runs. Alisting of the simulations is in Table 4.
5 Adaptation scenarios
The baseline or no climate change analysis determines expected future damages for growthand no growth conditions considering only local subsidence rates (increasing relative sealevel by 0.15 m by 2100). It was included to explore adaptation co-benefits for the case ofno climate change. Analyses were performed for both the cases of: (1) only damage fromthe largest event each year, (in effect assuming that it takes one year to rebuild); and (2) thepossibility of damages from all three events in a year (assuming rapid reconstruction).
The ‘Ride-It-Out’ adaptation (RIO) assumes that existing buildings will be repaired tocurrent conditions after each flood over the 100 year period with no additionalfloodproofing. All growth in the present 100-year floodplain is floodproofed 100%effectively so there are no damages to this property if flooded by any event. It is assumedthat increased cost of floodproofing new structures is insignificant compared to the totalcost of new construction. There are no requirements for floodproofing in the present500 year floodplain. This scenario most closely mimics current FEMA policy.Environmental costs for this option are low since it does not prevent the natural migration
Climatic Change
of the shoreline as the sea rises with the exception of existing barriers. Since over the next100 years there will be little permanent inundation of existing and developable land, therewill not have to be abandonment of the coastal area. The streets, however, will befrequently flooded; these damages were not considered in this scenario.
Under ‘Build Your Way Out’ (BYWO), unregulated growth is allowed in all floodplainsbecause all current and future development is protected with retrofit or new coastalprotection structures, which are all built following the second flood that occurs in the period2000 to 2100 with a magnitude greater than or equal to the present 100 year flood. Damageis incurred until that event occurs, and as with RIO, damaged structures are repaired to theirprevious state, allowing repetitive damages. Coastal flooding protection in this optionconsists of seawalls (Woodroffe 2003). This is similar to the “Protection” SLR adaptationresponse. AGIS coverage developed from a coastline survey of Knee (2002) of existing coastalprotection structures including seawalls to manage flooding and shoreline protectionstructures such as revetments was used to determine the amount of retrofitting needed toprotect existing development from flooding. Segments along the coastline and in majorestuaries where there were no seawalls were determined from the GIS coverage as a means toestimate where additional seawalls would be needed to protect current or potentialdevelopment. Unfortunately, seawalls also interrupt the natural movement and replenishmentof sand (Massachusetts Office of Coastal Zone Management 1989) and contributes to the lossof beachfront areas. Another negative environmental impact is that the structures can preventthe natural migration inland of wetlands as SLR occurs.
It is assumed that the coastal protection structures are built to withstand the 500 yearstorm as the incremental cost of protecting the coast from the 500-year surge level ratherthan just the 100-year surge level is small compared with the total cost of the retrofit or newstructure. The cost of retrofitting existing structures is approximately $1,000 per linearmeter of protection structure (US Army Corps of Engineers 2000), while building newstructures costs about $7,200 per linear meter (US Army Corps of Engineers 2000).
These costs do not include maintenance, beach nourishment projects to preventforeshore erosion and undercutting (which can be high and necessary every 5 to 10 years),drainage of any areas behind seawalls flooded during storms, any environmentalconsequences associated with seawalls such as impeding the natural flows of coastalfreshwaters, and aesthetic consequences.
In a stricter version of current FEMA regulations, the ‘Green’ scenario requires that allgrowth in the current 100 and 500 year floodplains be totally floodproofed at the time ofconstruction and we again assume that floodproofing new residential, commercial, andindustrial structures only nominally adds to the cost of construction. It also requires thatcurrent residential development in the present and 100 and 500 year floodplains befloodproofed upon sale of the structure assuming a 15-year turnover rate. The retrofitting ofthose structures already present in the floodplain is assumed to be 80% effective; that is,when a retrofitted building is flooded, damages to buildings and contents are reduced to20% of the damages without floodproofing. In the 100-year floodplain homes are retrofittedby elevating them at approximately $17,000 per home. In the area outside the 100-yearfloodplain, wet floodproofing is used at a cost of $3,500 per home. Both costs were fromtables in FEMA (1998) for a home with a 90 m2 footprint and frame construction set on abasement/crawlspace. Elevation prevents flooding of the living spaces of the home; wetfloodproofing allows floodwaters to enter the home, but prevents damage to the structureand its contents. The cost of commercial and industrial floodproofing was assumed to be10% of the commercial and industrial damages that would otherwise be incurred; this is theapproximate ratio between the cost of residential floodproofing and residential damages
Climatic Change
incurred. Floodproofing of industrial and commercial properties is implemented after theyare flooded. This is an “Accommodation” SLR response. As in the case of the RIOscenario, streets will be frequently flooded in the future; these damages were not consideredin this scenario.
As with the ‘Ride-It-Out’ scenarios, the ‘Green’ scenario has low environmental impacts.As is shown in the results, however, it is much more economically effective because thefloodproofing procedures reduce repetitive damages.
The ‘Retreat’ scenario assumes that no more residential, commercial, or industrialdevelopment is allowed in floodplains and that no rebuilding after flooded is permitted; thereis no damage threshold below which an owner can repair instead of abandon. This scenario isdistinctly different from the other scenarios because in this scenario property owners areforced to vacate the floodplain or not build in it. It is assumed that when a property is flooded,the owner loses the value of the building, contents, and the land. Yohe et al. (1999), however,argue that the value of abandoned coastal land is really equal to the value of a far inland lot.This is because coastal land values are transferred inland as coastal land is abandoned; lotsthat were previously inland now become more coastal. They also argue that the values ofcoastal building depreciate once the market knows they might be flooded. Therefore in theretreat scenario if we assume that the value of inland land is 50% of coastal land and thatcoastal buildings depreciate to 50% of their values, then the aggregate loss to society of notbeing able to rebuild on the floodplain is 50% of the market value of the building and theland, demolition costs, and removal expenses. For undeveloped land that is now prohibitedto be developed it is assumed the owner losses its land value, but since it makes land inlandmore valuable, only 50% of its value is lost to society.
Demolition costs are $20,000 per household [from costs in a nearby coastal town,Byefield (Bennett Contracting, Personal Communication, November 2004)] and thus,assuming that commercial and industrial developed land is equivalent to eight householdson a hectare of land, $160,000/ha for commercial and industrial properties. Discussionswith local realtors (Macdonald and Wood Real Estate, November 2004, personalcommunication) indicate that the value of land right on the water are 70% greater thanresidential building values and that inland, but still a walk to water, land values are 55%more than building values. Therefore, based upon this information, it is assumed that thevalues of residential, commercial and industrial land in all the coastal area are 50% greaterthan building values. As in the cases of the RIO and Green scenarios, streets on whichbuildings remain will be frequently flooded in the future; these damages are not consideredin this scenario.
6 Results
Table 3 shows changes in the recurrence intervals of the 100 and 500 year events for the0.6 m scenario of relative SLR. Because the data used for the bootstrapping procedureencompassed only 80 years, but contained a 100-year flood, the 100 year flood elevationunder a scenario of no SLR occurs approximately every 80 years in the Monte Carlosimulation. If this was the only assumption, this would have the effect of increasing thedamages because this extreme event would occur more frequently than in reality. The effectof this assumption, however, is probably offset by assumptions that lower the value ofdamages such as the flood damages remaining the same after the present 500 year stormelevation has been exceeded, neglecting impacts of increased erosion, and likely increasesin the intensities of hurricanes. Figure 4 shows some possible time series of the maximum
Climatic Change
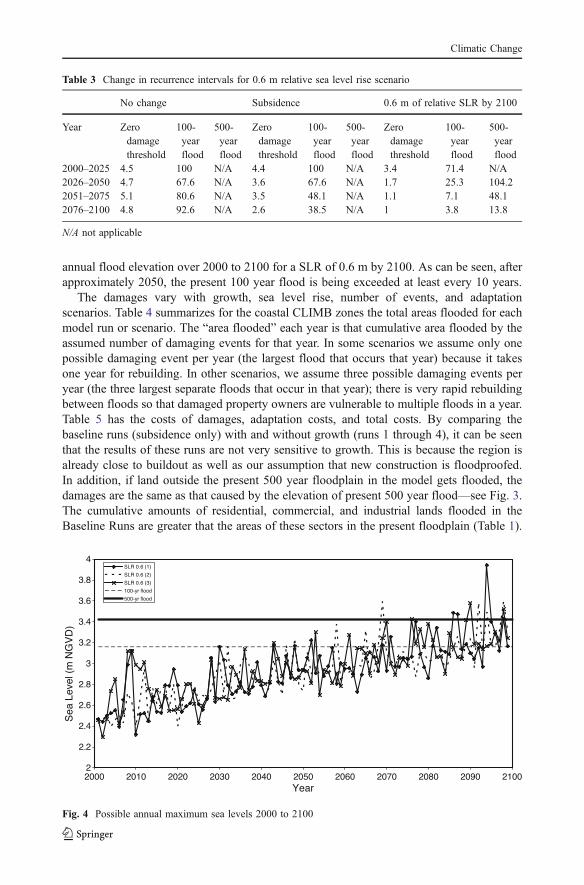
annual flood elevation over 2000 to 2100 for a SLR of 0.6 m by 2100. As can be seen, afterapproximately 2050, the present 100 year flood is being exceeded at least every 10 years.
The damages vary with growth, sea level rise, number of events, and adaptationscenarios. Table 4 summarizes for the coastal CLIMB zones the total areas flooded for eachmodel run or scenario. The “area flooded” each year is that cumulative area flooded by theassumed number of damaging events for that year. In some scenarios we assume only onepossible damaging event per year (the largest flood that occurs that year) because it takesone year for rebuilding. In other scenarios, we assume three possible damaging events peryear (the three largest separate floods that occur in that year); there is very rapid rebuildingbetween floods so that damaged property owners are vulnerable to multiple floods in a year.Table 5 has the costs of damages, adaptation costs, and total costs. By comparing thebaseline runs (subsidence only) with and without growth (runs 1 through 4), it can be seenthat the results of these runs are not very sensitive to growth. This is because the region isalready close to buildout as well as our assumption that new construction is floodproofed.In addition, if land outside the present 500 year floodplain in the model gets flooded, thedamages are the same as that caused by the elevation of present 500 year flood—see Fig. 3.The cumulative amounts of residential, commercial, and industrial lands flooded in theBaseline Runs are greater that the areas of these sectors in the present floodplain (Table 1).
Table 3 Change in recurrence intervals for 0.6 m relative sea level rise scenario
No change Subsidence 0.6 m of relative SLR by 2100
Year Zerodamagethreshold
100-yearflood
500-yearflood
Zerodamagethreshold
100-yearflood
500-yearflood
Zerodamagethreshold
100-yearflood
500-yearflood
2000–2025 4.5 100 N/A 4.4 100 N/A 3.4 71.4 N/A2026–2050 4.7 67.6 N/A 3.6 67.6 N/A 1.7 25.3 104.22051–2075 5.1 80.6 N/A 3.5 48.1 N/A 1.1 7.1 48.12076–2100 4.8 92.6 N/A 2.6 38.5 N/A 1 3.8 13.8
N/A not applicable
2
2.2
2.4
2.6
2.8
3
3.2
3.4
3.6
3.8
4
2000 2010 2020 2030 2040 2050 2060 2070 2080 2090 2100Year
SLR 0.6 (1)
SLR 0.6 (2)
SLR 0.6 (3)
100-yr flood
500-yr flood
Sea
Lev
el (
m N
GV
D)
Fig. 4 Possible annual maximum sea levels 2000 to 2100
Climatic Change
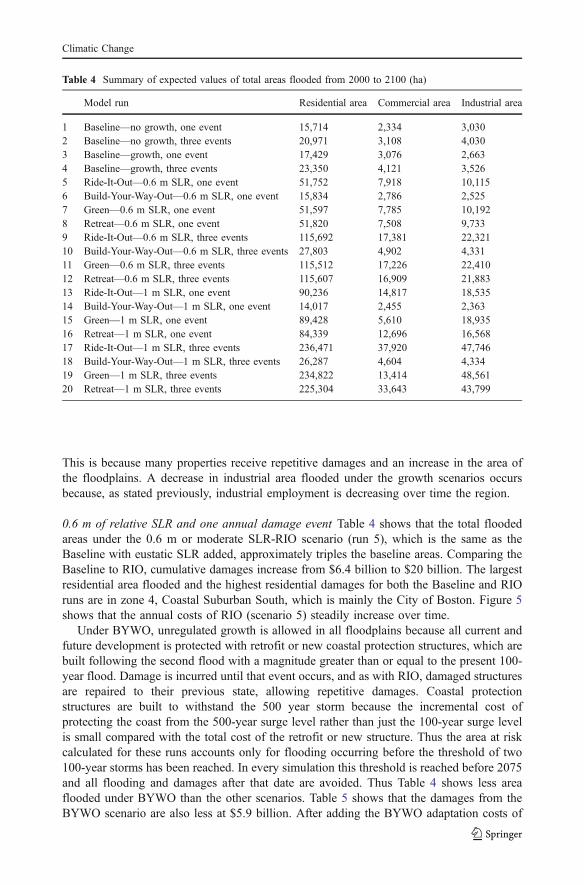
This is because many properties receive repetitive damages and an increase in the area ofthe floodplains. A decrease in industrial area flooded under the growth scenarios occursbecause, as stated previously, industrial employment is decreasing over time the region.
0.6 m of relative SLR and one annual damage event Table 4 shows that the total floodedareas under the 0.6 m or moderate SLR-RIO scenario (run 5), which is the same as theBaseline with eustatic SLR added, approximately triples the baseline areas. Comparing theBaseline to RIO, cumulative damages increase from $6.4 billion to $20 billion. The largestresidential area flooded and the highest residential damages for both the Baseline and RIOruns are in zone 4, Coastal Suburban South, which is mainly the City of Boston. Figure 5shows that the annual costs of RIO (scenario 5) steadily increase over time.
Under BYWO, unregulated growth is allowed in all floodplains because all current andfuture development is protected with retrofit or new coastal protection structures, which arebuilt following the second flood with a magnitude greater than or equal to the present 100-year flood. Damage is incurred until that event occurs, and as with RIO, damaged structuresare repaired to their previous state, allowing repetitive damages. Coastal protectionstructures are built to withstand the 500 year storm because the incremental cost ofprotecting the coast from the 500-year surge level rather than just the 100-year surge levelis small compared with the total cost of the retrofit or new structure. Thus the area at riskcalculated for these runs accounts only for flooding occurring before the threshold of two100-year storms has been reached. In every simulation this threshold is reached before 2075and all flooding and damages after that date are avoided. Thus Table 4 shows less areaflooded under BYWO than the other scenarios. Table 5 shows that the damages from theBYWO scenario are also less at $5.9 billion. After adding the BYWO adaptation costs of
Table 4 Summary of expected values of total areas flooded from 2000 to 2100 (ha)
Model run Residential area Commercial area Industrial area
1 Baseline—no growth, one event 15,714 2,334 3,0302 Baseline—no growth, three events 20,971 3,108 4,0303 Baseline—growth, one event 17,429 3,076 2,6634 Baseline—growth, three events 23,350 4,121 3,5265 Ride-It-Out—0.6 m SLR, one event 51,752 7,918 10,1156 Build-Your-Way-Out—0.6 m SLR, one event 15,834 2,786 2,5257 Green—0.6 m SLR, one event 51,597 7,785 10,1928 Retreat—0.6 m SLR, one event 51,820 7,508 9,7339 Ride-It-Out—0.6 m SLR, three events 115,692 17,381 22,32110 Build-Your-Way-Out—0.6 m SLR, three events 27,803 4,902 4,33111 Green—0.6 m SLR, three events 115,512 17,226 22,41012 Retreat—0.6 m SLR, three events 115,607 16,909 21,88313 Ride-It-Out—1 m SLR, one event 90,236 14,817 18,53514 Build-Your-Way-Out—1 m SLR, one event 14,017 2,455 2,36315 Green—1 m SLR, one event 89,428 5,610 18,93516 Retreat—1 m SLR, one event 84,339 12,696 16,56817 Ride-It-Out—1 m SLR, three events 236,471 37,920 47,74618 Build-Your-Way-Out—1 m SLR, three events 26,287 4,604 4,33419 Green—1 m SLR, three events 234,822 13,414 48,56120 Retreat—1 m SLR, three events 225,304 33,643 43,799
Climatic Change
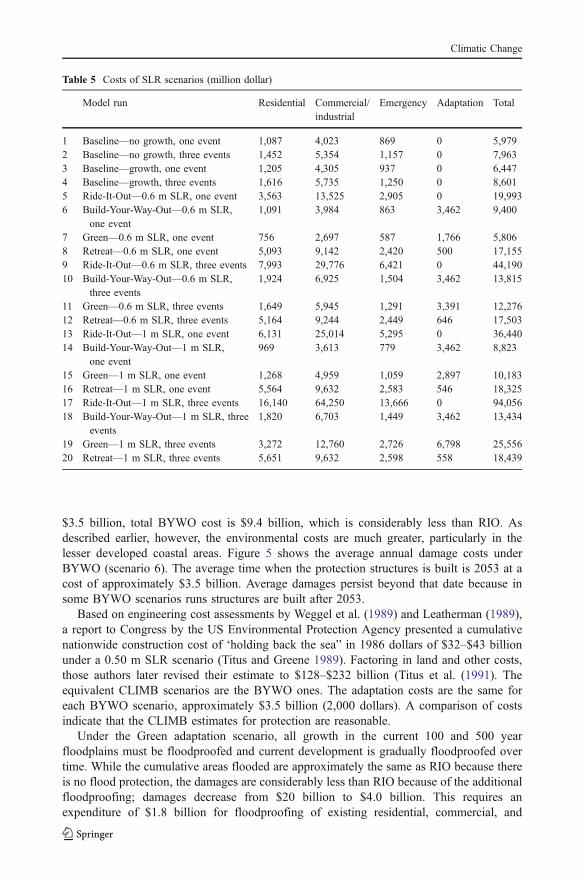
$3.5 billion, total BYWO cost is $9.4 billion, which is considerably less than RIO. Asdescribed earlier, however, the environmental costs are much greater, particularly in thelesser developed coastal areas. Figure 5 shows the average annual damage costs underBYWO (scenario 6). The average time when the protection structures is built is 2053 at acost of approximately $3.5 billion. Average damages persist beyond that date because insome BYWO scenarios runs structures are built after 2053.
Based on engineering cost assessments by Weggel et al. (1989) and Leatherman (1989),a report to Congress by the US Environmental Protection Agency presented a cumulativenationwide construction cost of ‘holding back the sea” in 1986 dollars of $32–$43 billionunder a 0.50 m SLR scenario (Titus and Greene 1989). Factoring in land and other costs,those authors later revised their estimate to $128–$232 billion (Titus et al. (1991). Theequivalent CLIMB scenarios are the BYWO ones. The adaptation costs are the same foreach BYWO scenario, approximately $3.5 billion (2,000 dollars). A comparison of costsindicate that the CLIMB estimates for protection are reasonable.
Under the Green adaptation scenario, all growth in the current 100 and 500 yearfloodplains must be floodproofed and current development is gradually floodproofed overtime. While the cumulative areas flooded are approximately the same as RIO because thereis no flood protection, the damages are considerably less than RIO because of the additionalfloodproofing; damages decrease from $20 billion to $4.0 billion. This requires anexpenditure of $1.8 billion for floodproofing of existing residential, commercial, and
Table 5 Costs of SLR scenarios (million dollar)
Model run Residential Commercial/industrial
Emergency Adaptation Total
1 Baseline—no growth, one event 1,087 4,023 869 0 5,9792 Baseline—no growth, three events 1,452 5,354 1,157 0 7,9633 Baseline—growth, one event 1,205 4,305 937 0 6,4474 Baseline—growth, three events 1,616 5,735 1,250 0 8,6015 Ride-It-Out—0.6 m SLR, one event 3,563 13,525 2,905 0 19,9936 Build-Your-Way-Out—0.6 m SLR,
one event1,091 3,984 863 3,462 9,400
7 Green—0.6 m SLR, one event 756 2,697 587 1,766 5,8068 Retreat—0.6 m SLR, one event 5,093 9,142 2,420 500 17,1559 Ride-It-Out—0.6 m SLR, three events 7,993 29,776 6,421 0 44,19010 Build-Your-Way-Out—0.6 m SLR,
three events1,924 6,925 1,504 3,462 13,815
11 Green—0.6 m SLR, three events 1,649 5,945 1,291 3,391 12,27612 Retreat—0.6 m SLR, three events 5,164 9,244 2,449 646 17,50313 Ride-It-Out—1 m SLR, one event 6,131 25,014 5,295 0 36,44014 Build-Your-Way-Out—1 m SLR,
one event969 3,613 779 3,462 8,823
15 Green—1 m SLR, one event 1,268 4,959 1,059 2,897 10,18316 Retreat—1 m SLR, one event 5,564 9,632 2,583 546 18,32517 Ride-It-Out—1 m SLR, three events 16,140 64,250 13,666 0 94,05618 Build-Your-Way-Out—1 m SLR, three
events1,820 6,703 1,449 3,462 13,434
19 Green—1 m SLR, three events 3,272 12,760 2,726 6,798 25,55620 Retreat—1 m SLR, three events 5,651 9,632 2,598 558 18,439
Climatic Change
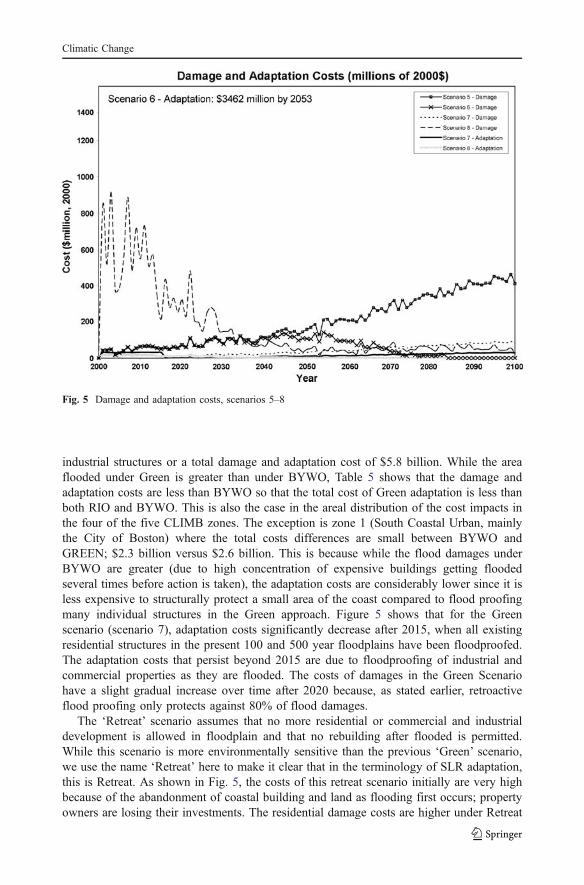
industrial structures or a total damage and adaptation cost of $5.8 billion. While the areaflooded under Green is greater than under BYWO, Table 5 shows that the damage andadaptation costs are less than BYWO so that the total cost of Green adaptation is less thanboth RIO and BYWO. This is also the case in the areal distribution of the cost impacts inthe four of the five CLIMB zones. The exception is zone 1 (South Coastal Urban, mainlythe City of Boston) where the total costs differences are small between BYWO andGREEN; $2.3 billion versus $2.6 billion. This is because while the flood damages underBYWO are greater (due to high concentration of expensive buildings getting floodedseveral times before action is taken), the adaptation costs are considerably lower since it isless expensive to structurally protect a small area of the coast compared to flood proofingmany individual structures in the Green approach. Figure 5 shows that for the Greenscenario (scenario 7), adaptation costs significantly decrease after 2015, when all existingresidential structures in the present 100 and 500 year floodplains have been floodproofed.The adaptation costs that persist beyond 2015 are due to floodproofing of industrial andcommercial properties as they are flooded. The costs of damages in the Green Scenariohave a slight gradual increase over time after 2020 because, as stated earlier, retroactiveflood proofing only protects against 80% of flood damages.
The ‘Retreat’ scenario assumes that no more residential or commercial and industrialdevelopment is allowed in floodplain and that no rebuilding after flooded is permitted.While this scenario is more environmentally sensitive than the previous ‘Green’ scenario,we use the name ‘Retreat’ here to make it clear that in the terminology of SLR adaptation,this is Retreat. As shown in Fig. 5, the costs of this retreat scenario initially are very highbecause of the abandonment of coastal building and land as flooding first occurs; propertyowners are losing their investments. The residential damage costs are higher under Retreat
Fig. 5 Damage and adaptation costs, scenarios 5–8
Climatic Change
than other scenarios because society losses 50% of the building and land value, not just thepartial value of the building and contents due to flooding. Therefore, for example, evenwith repetitive damages under RIO, the aggregate damages remain slightly less under RIOcompared to Retreat. Adaptation costs for this scenario are the costs of demolition andremoval and are low compared to the abandonment costs. As shown in Table 4, the totalarea flooded over 2000 to 2100 is approximately equal to the RIO and Green scenarios. Thetotal costs are very high (Table 5, $17.1 billion) because of the high value of the abandonedland and buildings in the coastal region. This scenario does, however, have the leastenvironmental impacts of other scenarios, and as land is abandoned it may revert back tosuch natural systems as wetlands and beaches.
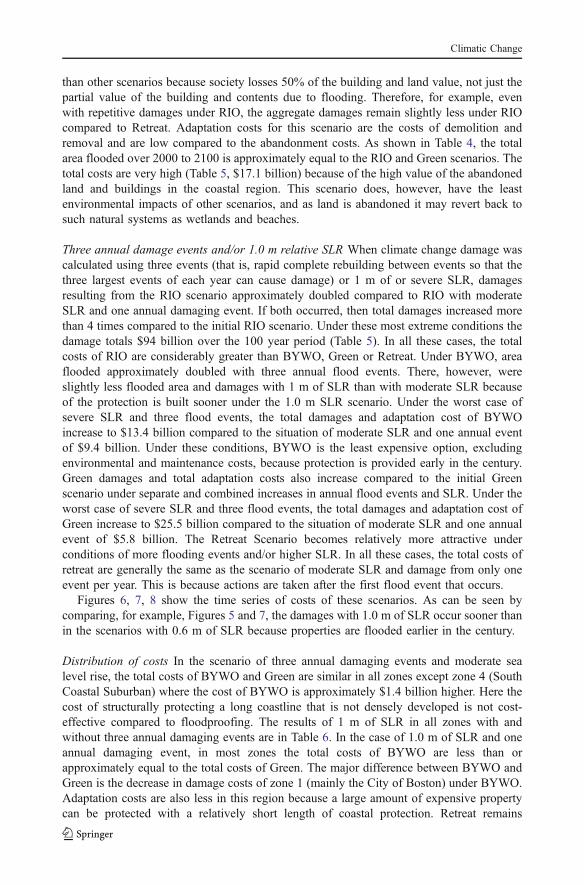
Three annual damage events and/or 1.0 m relative SLR When climate change damage wascalculated using three events (that is, rapid complete rebuilding between events so that thethree largest events of each year can cause damage) or 1 m of or severe SLR, damagesresulting from the RIO scenario approximately doubled compared to RIO with moderateSLR and one annual damaging event. If both occurred, then total damages increased morethan 4 times compared to the initial RIO scenario. Under these most extreme conditions thedamage totals $94 billion over the 100 year period (Table 5). In all these cases, the totalcosts of RIO are considerably greater than BYWO, Green or Retreat. Under BYWO, areaflooded approximately doubled with three annual flood events. There, however, wereslightly less flooded area and damages with 1 m of SLR than with moderate SLR becauseof the protection is built sooner under the 1.0 m SLR scenario. Under the worst case ofsevere SLR and three flood events, the total damages and adaptation cost of BYWOincrease to $13.4 billion compared to the situation of moderate SLR and one annual eventof $9.4 billion. Under these conditions, BYWO is the least expensive option, excludingenvironmental and maintenance costs, because protection is provided early in the century.Green damages and total adaptation costs also increase compared to the initial Greenscenario under separate and combined increases in annual flood events and SLR. Under theworst case of severe SLR and three flood events, the total damages and adaptation cost ofGreen increase to $25.5 billion compared to the situation of moderate SLR and one annualevent of $5.8 billion. The Retreat Scenario becomes relatively more attractive underconditions of more flooding events and/or higher SLR. In all these cases, the total costs ofretreat are generally the same as the scenario of moderate SLR and damage from only oneevent per year. This is because actions are taken after the first flood event that occurs.
Figures 6, 7, 8 show the time series of costs of these scenarios. As can be seen bycomparing, for example, Figures 5 and 7, the damages with 1.0 m of SLR occur sooner thanin the scenarios with 0.6 m of SLR because properties are flooded earlier in the century.
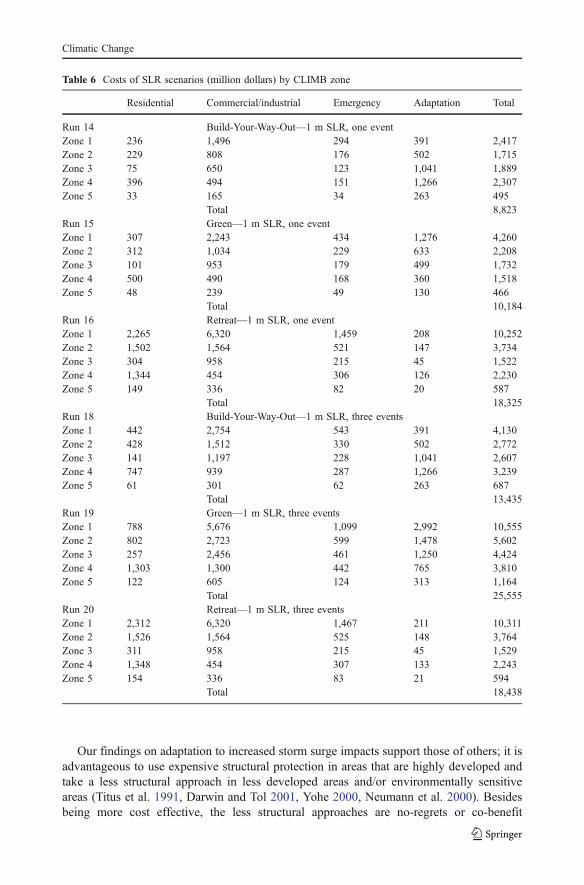
Distribution of costs In the scenario of three annual damaging events and moderate sealevel rise, the total costs of BYWO and Green are similar in all zones except zone 4 (SouthCoastal Suburban) where the cost of BYWO is approximately $1.4 billion higher. Here thecost of structurally protecting a long coastline that is not densely developed is not cost-effective compared to floodproofing. The results of 1 m of SLR in all zones with andwithout three annual damaging events are in Table 6. In the case of 1.0 m of SLR and oneannual damaging event, in most zones the total costs of BYWO are less than orapproximately equal to the total costs of Green. The major difference between BYWO andGreen is the decrease in damage costs of zone 1 (mainly the City of Boston) under BYWO.Adaptation costs are also less in this region because a large amount of expensive propertycan be protected with a relatively short length of coastal protection. Retreat remains
Climatic Change
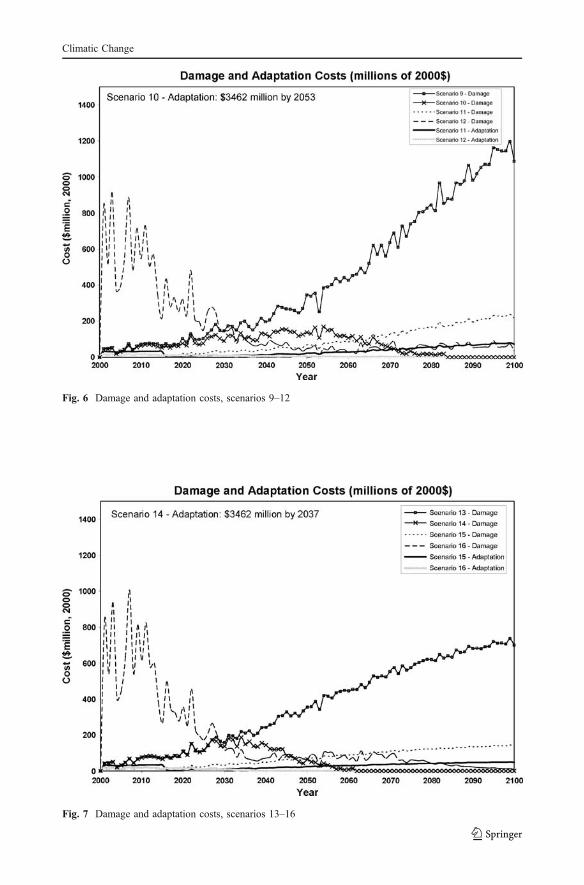
Fig. 6 Damage and adaptation costs, scenarios 9–12
Fig. 7 Damage and adaptation costs, scenarios 13–16
Climatic Change
expensive in all zones but particularly in zone 1 because of the high value of property.BYWO costs in zone 4 (South Coastal Suburban) remain higher than Green because, as inthe case of moderate SLR and three damaging events, the cost of structurally protecting along coastline that is not densely developed is not cost-effective compared to floodproofing.In the most extreme case of 1.0 m of SLR and three annual damaging events, Table 6 showsthat in all zones the total costs of BYWO are less than or approximately equal to the totalcosts of Green Adaptation.
These findings are, of course, based upon the assumptions of the scenarios. Two majorassumptions that may particularly influence the results are the neglect of the maintenancecosts of seawalls and their environmental impacts and the estimate of values of land andbuildings lost under the Retreat scenario.
7 Conclusions
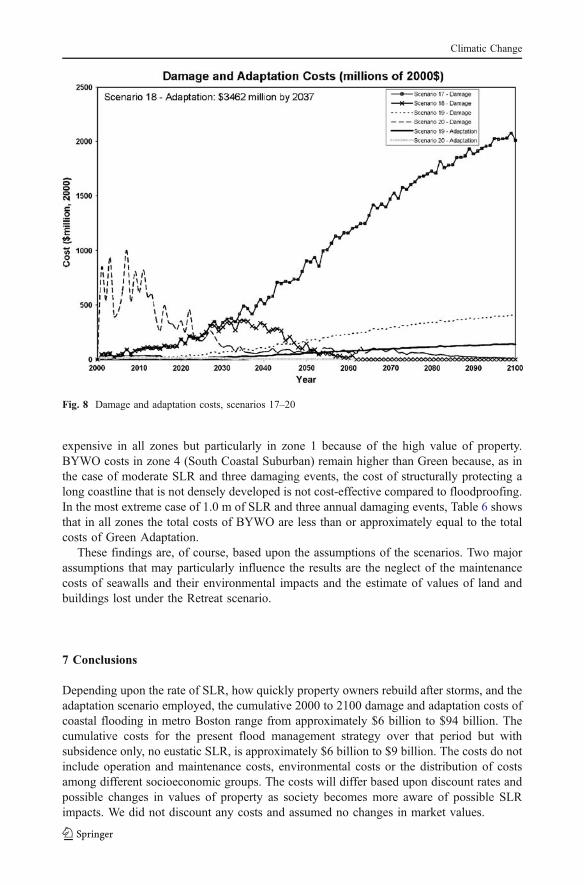
Depending upon the rate of SLR, how quickly property owners rebuild after storms, and theadaptation scenario employed, the cumulative 2000 to 2100 damage and adaptation costs ofcoastal flooding in metro Boston range from approximately $6 billion to $94 billion. Thecumulative costs for the present flood management strategy over that period but withsubsidence only, no eustatic SLR, is approximately $6 billion to $9 billion. The costs do notinclude operation and maintenance costs, environmental costs or the distribution of costsamong different socioeconomic groups. The costs will differ based upon discount rates andpossible changes in values of property as society becomes more aware of possible SLRimpacts. We did not discount any costs and assumed no changes in market values.
Fig. 8 Damage and adaptation costs, scenarios 17–20
Climatic Change
Our findings on adaptation to increased storm surge impacts support those of others; it isadvantageous to use expensive structural protection in areas that are highly developed andtake a less structural approach in less developed areas and/or environmentally sensitiveareas (Titus et al. 1991, Darwin and Tol 2001, Yohe 2000, Neumann et al. 2000). Besidesbeing more cost effective, the less structural approaches are no-regrets or co-benefit
Table 6 Costs of SLR scenarios (million dollars) by CLIMB zone
Residential Commercial/industrial Emergency Adaptation Total
Run 14 Build-Your-Way-Out—1 m SLR, one eventZone 1 236 1,496 294 391 2,417Zone 2 229 808 176 502 1,715Zone 3 75 650 123 1,041 1,889Zone 4 396 494 151 1,266 2,307Zone 5 33 165 34 263 495
Total 8,823Run 15 Green—1 m SLR, one eventZone 1 307 2,243 434 1,276 4,260Zone 2 312 1,034 229 633 2,208Zone 3 101 953 179 499 1,732Zone 4 500 490 168 360 1,518Zone 5 48 239 49 130 466
Total 10,184Run 16 Retreat—1 m SLR, one eventZone 1 2,265 6,320 1,459 208 10,252Zone 2 1,502 1,564 521 147 3,734Zone 3 304 958 215 45 1,522Zone 4 1,344 454 306 126 2,230Zone 5 149 336 82 20 587
Total 18,325Run 18 Build-Your-Way-Out—1 m SLR, three eventsZone 1 442 2,754 543 391 4,130Zone 2 428 1,512 330 502 2,772Zone 3 141 1,197 228 1,041 2,607Zone 4 747 939 287 1,266 3,239Zone 5 61 301 62 263 687
Total 13,435Run 19 Green—1 m SLR, three eventsZone 1 788 5,676 1,099 2,992 10,555Zone 2 802 2,723 599 1,478 5,602Zone 3 257 2,456 461 1,250 4,424Zone 4 1,303 1,300 442 765 3,810Zone 5 122 605 124 313 1,164
Total 25,555Run 20 Retreat—1 m SLR, three eventsZone 1 2,312 6,320 1,467 211 10,311Zone 2 1,526 1,564 525 148 3,764Zone 3 311 958 215 45 1,529Zone 4 1,348 454 307 133 2,243Zone 5 154 336 83 21 594
Total 18,438
Climatic Change
policies, are environmentally benign, and allow more flexibility to respond to futureuncertain changes. While uncertainty in the expected rate of SLR and damages makesplanning difficult, the results also show that no matter what the climate change scenario orthe location, not taking action is the worst response as in our Ride It Out scenario.
Acknowledgements This research benefited from fruitful discussions with our research partners at BostonUniversity, William Anderson and T.L Lakshmanan. Pablo Suarez is acknowledged for his programming ofparts of the flood analysis model. The data analysis by James Horwitz of Binary Systems, Inc. wasinvaluable. We also appreciate the helpful comments of Richard Vogel of Tufts University, Martin Pillsburyand Judy Alland of the Metropolitan Area Planning Council, Joe Pelaczarski of Massachusetts Coastal ZoneManagement, Richard Zingarelli of the Massachusetts Department of Environmental Management, JimO’Connell of Woods Hole Oceanographic Institute, and David Vine of Nucci Vine Associates, Inc. We alsoappreciate the cooperation of the New England District of the US Army Corps of Engineers, and the FederalEmergency Management Agency. The comments of two anonymous reviewers and Jim Titus were veryhelpful. Communications with James Neumann and Gary Yohe are appreciated.
Although the research described in this paper has been funded wholly or in part by the US EnvironmentalProtection Agency through Grant Number R827450-01-0 to Tufts University, it has not been subjected to theAgency’s required peer and policy review and therefore does not necessarily reflect the views of the Agencyand no official endorsement should be inferred.
References
Clark G, Moser S, Ratick S, Dow K, Meyer W, Emani S, Jin W, Kasperson J, Kasperson R, Schwarz H(1998) assessing the vulnerability of coastal communities to extreme storms: the case of Revere, MA,USA. Mitig Adapt Strategies Glob Chang 3:59–82
Cooper M, Beevers M, Oppenheimer M (2005) Future sea level rise and the New Jersey Coast. Assessingpotential impacts and opportunities. Woodrow Wilson School of Public and International Affairs,Princeton University, Princeton, NJ
Darwin RF, Tol RSJ (2001) Estimate of the economic effects of sea level rise. Environ Resour Econ 19:113–129Emanuel KA (2005) Increasing destructiveness of tropical cyclones over the past 30 years. Nature 436:686–688Federal Emergency Management Agency (FEMA) (1998) Homeowner’s guide to retrofitting: six ways to
protect your house from flooding. FEMA doc. 312Federal Emergency Management Agency (FEMA) (1999) Database of historic damages to residential
buildings and contents. Region 1, Boston, MAFlick R, Murray J, Ewing L (1999) Trends in United States tidal datum statistics and tide range. A Data Atlas
Report, Scripps Institute of Oceanography Reference Series Number 99–20, DecemberFlick R, Murray J, Ewing L (2003) Trends in United States. Tidal datum statistics and tide range. J
Waterway, Port, Coastal and Ocean Engineering, July/AugustHigh Performance Systems, Inc (1997) STELLA Software, technical documentation. Hanover, NHIntergovernmental Panel on Climate Change (IPCC) (1990) Strategies for adaption to sea level rise. Report of
the Coastal Zone Management Subgroup of the Response Strategies Working Group (3)IPCC (2001) Climate Change 2001: Working Group 2. Impacts, adaptation, and vulnerability. Third
Assessment Report. Cambridge University Press, CambridgeIPCC (2007) Climate Change 2007: The physical science basis, summary for policy makers. Fourth
Assessment Report, GenevaKirshen P, Ruth M, Anderson W (2008a) Interdependencies of urban climate change impacts and adaptation
strategies: a case study of metropolitan Boston USA. Clim Change 86:105–122Kirshen P, Watson C, Douglas E, Gontz A, Lee J, Tian Y (2008b) Coastal flooding in the Northeastern USA
under climate change. Mitig Adapt Strategies Glob Chang (in press), DOI 10.1007/s11027-007-9130-5Kirshen P, Ruth M, Anderson W, Lakshmanan TR (2004) Infrastructure systems, services and climate
change: integrated impacts and response strategies for the Boston Metropolitan Area. Final Report to USEPA ORD, EPA Grant Number: R.827450-01
Knee K (2002) Integrated impacts of climate change in the coastal zone of Metro Boston, Thesis submitted inpartial fulfillment of the requirements for the degree of master of science in water resources engineering.Tufts University, Medford, MA
Climatic Change
Leatherman S (1989) The potential effects of global climate change on the United States. Report to congress.Appendix B: Sea Level Rise, Washington, DC, US Environmental Protection Agency, EPA 230-05-89-052. Online at www.epa.gov/globalwarming/sealevelrise
Massachusetts Office of Coastal Zone Management (1989) Massachusetts shoreline change project. Boston MAMassGIS (2003) www.state.ma/massgisMetropolitan Area Planning Council (MAPC) (2000) Long-term demographic and employment forecasts,
2025, Boston MANatural Resources Canada (2002) Coastal zone, climate change impacts and adaptation. Government of
Canada, OttawaNeumann JE, Yohe G, Nichols R, Manion M (2000) Sea level rise and global climate change: a review of
impacts to US coasts. Pew Center on Global Climate Change, Washington, DCNew England Regional Assessment Group (2001) Preparing for a changing climate: the potential
consequences of climate variability and change. New England Regional Overview. US Global ChangeResearch Program, University of New Hampshire, p 96
NPA Data Services, Inc. (1999) Regional economic projections series, demographic/household databases.Economic Databases
NPA Data Services, Inc. (2001) Regional economic projections series, economic/household databases.Demographic/Household Databases
Nucci Vine Associates, Inc. (1992) Potential effects of sea level rise in Boston Inner Harbor. Boston,Newburyport, MA, p 36
Pugh D (2004) Changing sea levels: Effects of tides, weather and climate. Cambridge University Press, UKRahmstorf S (2007) A semi-empirical approach to projecting future sea-level rise. Science 315:368–370
(January 19)Rosenzweig C, Solecki W (editors) (2001) Climate change and a global city: The potential consequences of
climate variability and change-metro east coast, report for the US national assessment of the potentialconsequences of climate variability and change. Columbia Earth Institute, New York
Ruth M, Kirshen P (2001) Integrated impacts of climate change upon infrastructure systems and services inthe Boston Metropolitan Area. World Resour Rev 13(1):106–122
Titus JG, Greene MS (1989) An overview of the nationwide impacts of sea level rise in the potential effectsof global climate change on the United States. Report to Congress, Appendix B: Sea Level Rise,Washington, DC, US Environmental Protection Agency EPA 230-05-89-052. Online at www.epa.gov/globalwarming/sealevelrise
Titus JG, Park R, Leatherman S, Weggel J, Greene M, Brown S, Gaunt C, Trehan M, Yohe G (1991)Greenhouse effect and sea level rise: the cost of holding back the sea. Coast Manage 19:171–204
US Army Corps of Engineers (1990) Flood damage reduction, main report, Saugus river and tributaries. NewEngland Division, Concord, MA
US Army Corps of Engineers (2000) Assess costs of higher and lower design crest elevations on future shoreprotection. Detroit District
United States Census Bureau (2000) United States Census 2000, http://www.census.gov/main/www/cen2000.html
Vogel RM, Shallcross AL (1996) The moving blocks bootstrap versus parametric time series models. WaterResour Res 32(6):1875–1882
Weggel JR, Scott Brown, Juan Carlos Escajadillo, Patrick Breen, Edward L. Doheny (1989) The cost ofdefending developed shorelines along sheltered water of the United States from a two meter rise in meansea level. The potential effects of global climate change on the United States. Report to Congress.Appendix B: Sea Level Rise, Washington, DC, US Environmental Protection Agency, EPA 230-05-89-052, Online at www.epa.gov/globalwarming/sealevelrise
Weiner C (1993) Frequency of tidal flooding at Boston Harbor, U.S. Army Corps of Engineers. New EnglandDivision, Concord MA
Woodroffe C (2003) Coasts: form, process, and evolution. Cambridge University Press, CambridgeYohe G (2000) Assessing the role of adaptation in evaluating vulnerability to climate change. Clim Change
46:371–390Yohe G, Neumann J, Marshall P (1999) The economic damage induced by sea level rise in the United States.
In: Mendelsohn R, Neumann J (eds) The impact of climate change on the United States economy.Cambridge University Press, Cambridge
Climatic Change