climate change and human health in search of magic numbers… ncar summer colloquium 28 july 2004 r...
TRANSCRIPT

Climate change and human health
in search of magic numbers…NCAR Summer colloquium
28 July 2004
R Sari KovatsCentre on Global Change and Health
Dept of Public Health and PolicyLondon School of Hygiene and Tropical Medicine
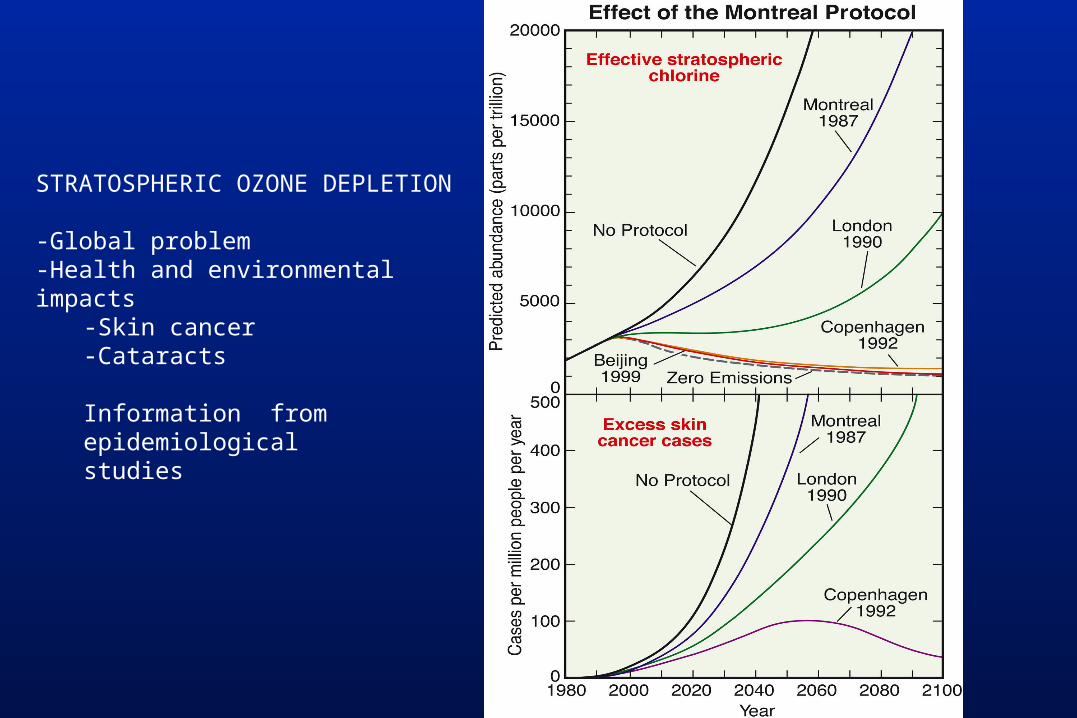
STRATOSPHERIC OZONE DEPLETION
-Global problem-Health and environmental impacts
-Skin cancer-Cataracts
Information from epidemiologicalstudies

Impact models
Estimates of populations at risk or attributable burden of disease
Greenhouse gas emissions scenarios Defined by IPCC
Global climate scenarios: Generates series of maps of predicted future distribution of climate variables30 year averages
Modelling impacts of climate change
2020s
2050s
2080s
Time
2050 2100
2020s 2050s 2080s

High child,high adult
High child,very high
adult
M F Both M F M F
(000) (000) (000) (000) (000) (000) (000)
Addictive substances
Tobacco 3 893 1 014 4 907 43 7 84 26
Alcohol 1 638 166 1 804 53 15 125 30
Illicit drugs 163 41 204 5 1 1 0
Environmental risks
Unsafe water, sanitation hygiene 895 835 1 730 129 103 207 169
Urban air pollution 411 388 799 11 11 5 5
Indoor smoke from solid fuels 658 961 1 619 93 80 118 101
Lead exposure 155 79 234 5 4 4 3
Climate change 76 78 154 9 9 18 18
Occupational risks
Risk factors for injury 291 19 310 14 1 18 1
Carcinogens 118 28 146 1 0 1 1
Airborne particulates 217 26 243 3 0 3 0
Ergonomic stressors 0 0 0 0 0 0 0
Noise 0 0 0 0 0 0 0
WorldWorld AfricaAfricaDeaths, 2000Deaths, 2000

Deaths (thousands) DALYs (millions)
2000 2020
Estimated death and DALYs attributable to climate change.Selected conditions in developing countries
Floods
Malaria
Diarrhoea
Malnutrition
020406080100120 0 2 4 6 8 10
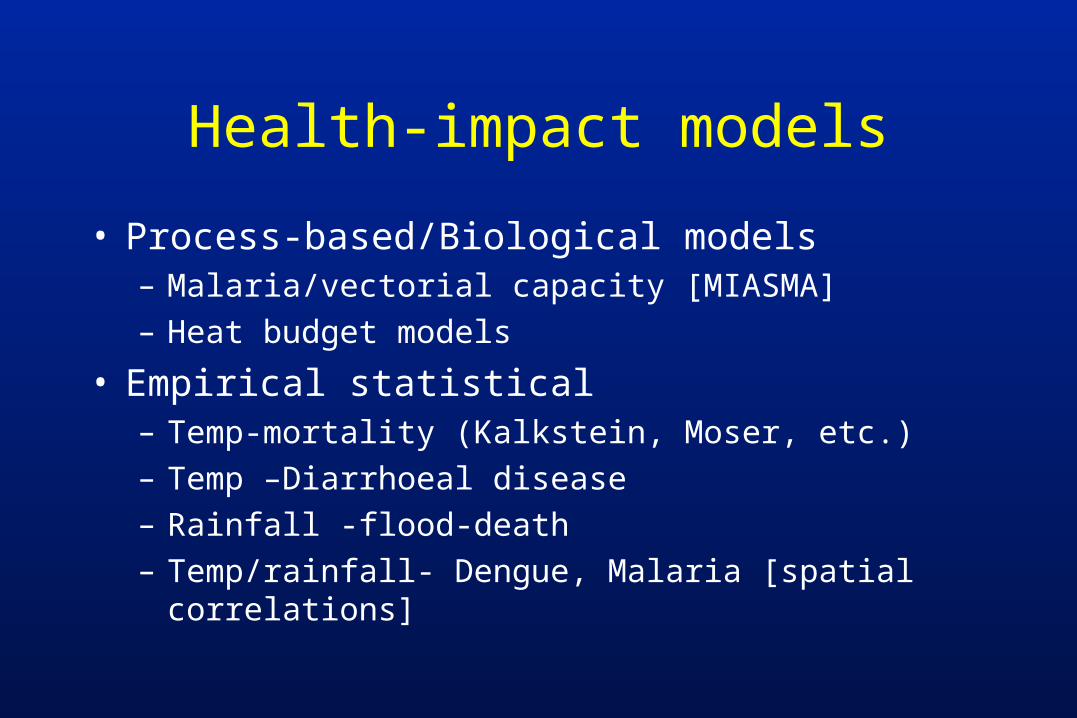
Health-impact models
• Process-based/Biological models – Malaria/vectorial capacity [MIASMA]– Heat budget models
• Empirical statistical– Temp-mortality (Kalkstein, Moser, etc.)– Temp –Diarrhoeal disease– Rainfall -flood-death– Temp/rainfall- Dengue, Malaria [spatial
correlations]

TRANSMISSION POTENTIAL
0
0.2
0.4
0.6
0.8
1
14 17 20 23 26 29 32 35 38 41
Temperature (°C)
Incubation period
0
10
20
30
40
50
15 20 25 30 35 40
(day
s)Biting frequency
0
0.05
0.1
0.15
0.2
0.25
0.3
0.35
10 15 20 25 30 35 40
Temp (°C)
(per
day
)
Survival probability
0
0.2
0.4
0.6
0.8
1
10 15 20 25 30 35 40
(per
day
)
Temp (°C) Temp (°C)
Martens et al. 1999, van Lieshout et al. 2004

Can global models reveal regional vulnerability?
• Increase: East Africa, central Asia, Russian Federation• Decrease: central America, Amazon[within current vector limits]
C hange o f consecutive m onths
> +2
+2
-2
< -2
A1
B2
A2
B1
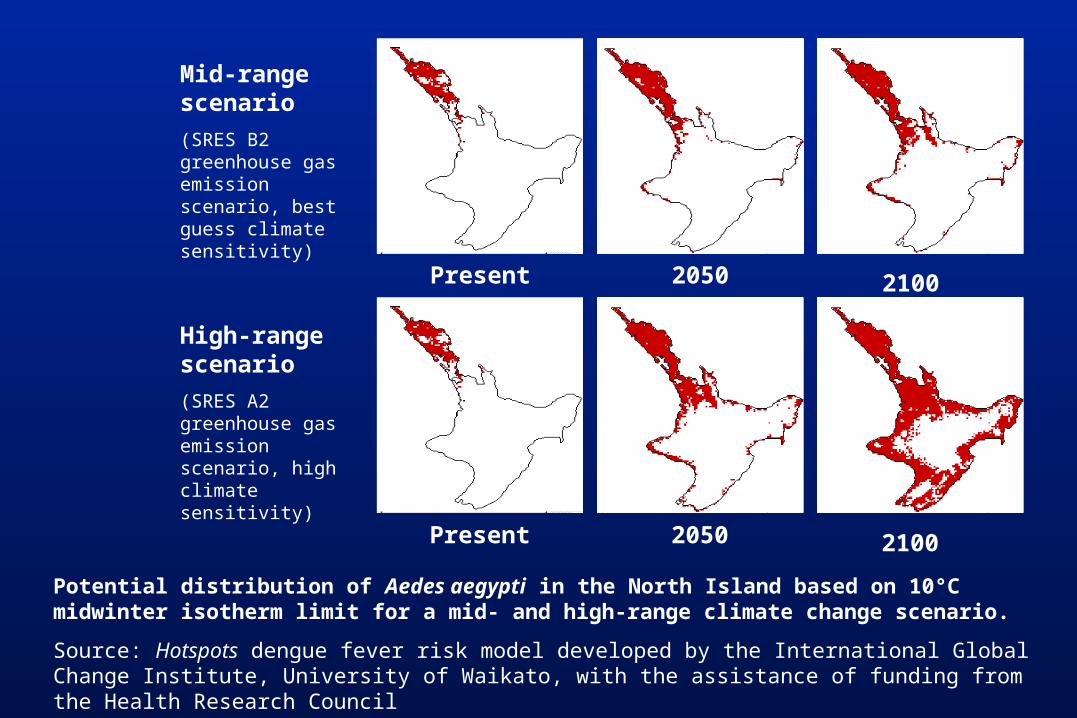
Potential distribution of Aedes aegypti in the North Island based on 10°C midwinter isotherm limit for a mid- and high-range climate change scenario.
Source: Hotspots dengue fever risk model developed by the International Global Change Institute, University of Waikato, with the assistance of funding from the Health Research Council
Present 2050 2100
Present 2050 2100
Mid-range scenario
(SRES B2 greenhouse gas emission scenario, best guess climate sensitivity)
High-range scenario
(SRES A2 greenhouse gas emission scenario, high climate sensitivity)

Empirical-stats models
• EXTRAPOLATION– Can you extrapolate the exposure-response relationship
beyond the bounds of the observed temperature range?
• VARIATION– Can you extrapolate the exposure-response relationship
derived from a different population.
• ADAPTATION – Responses to climate change - acclimatization
• MODIFICATION– What is likely?– – changes to exposure response relationship

Predicted distribution of the malaria vector (mosquito Anopheles atroparvus)
in present day Europe, and in the 2080s with SRES A2 climate scenario. [Kuhn, LSHTM, 2002]
Current climate 2080s
Average 2 month temperature
lcl rr ucl
0 5 10 15 20
0
500
1000
1500
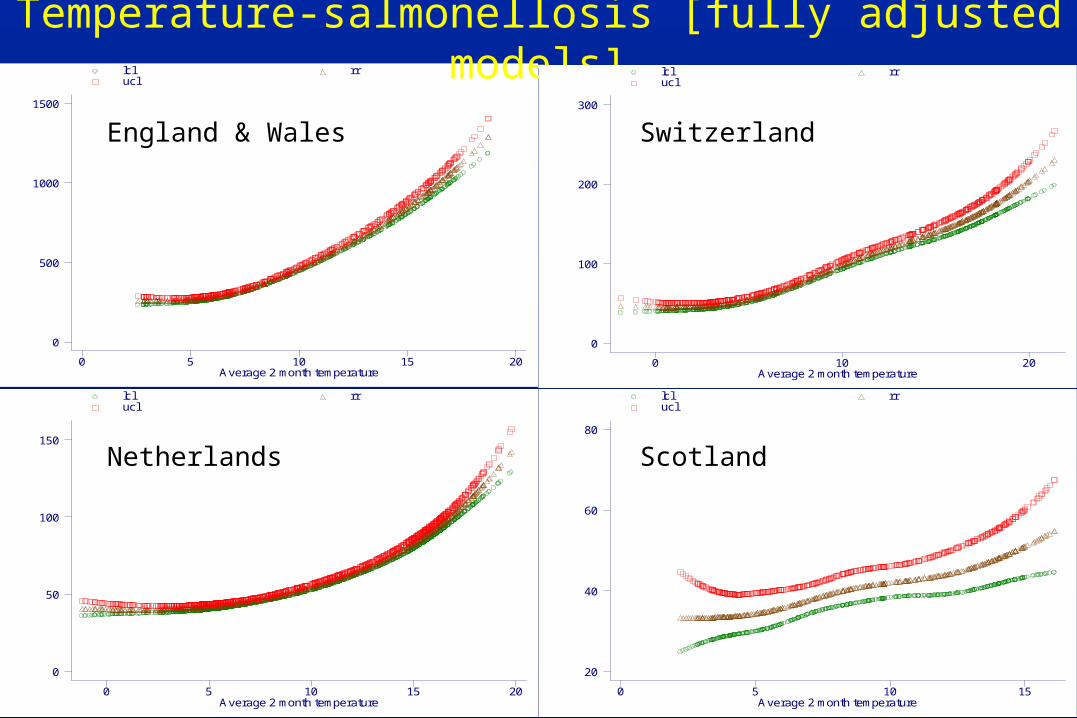
Temperature-salmonellosis [fully adjusted models]
England & Wales
Average 2 month temperature
lcl rr ucl
0 5 10 15 20
0
50
100
150
Average 2 month temperature
lcl rr ucl
0 5 10 15
20
40
60
80
Scotland
Average 2 month temperature
lcl rr ucl
0 10 20
0
100
200
300
Switzerland
Netherlands
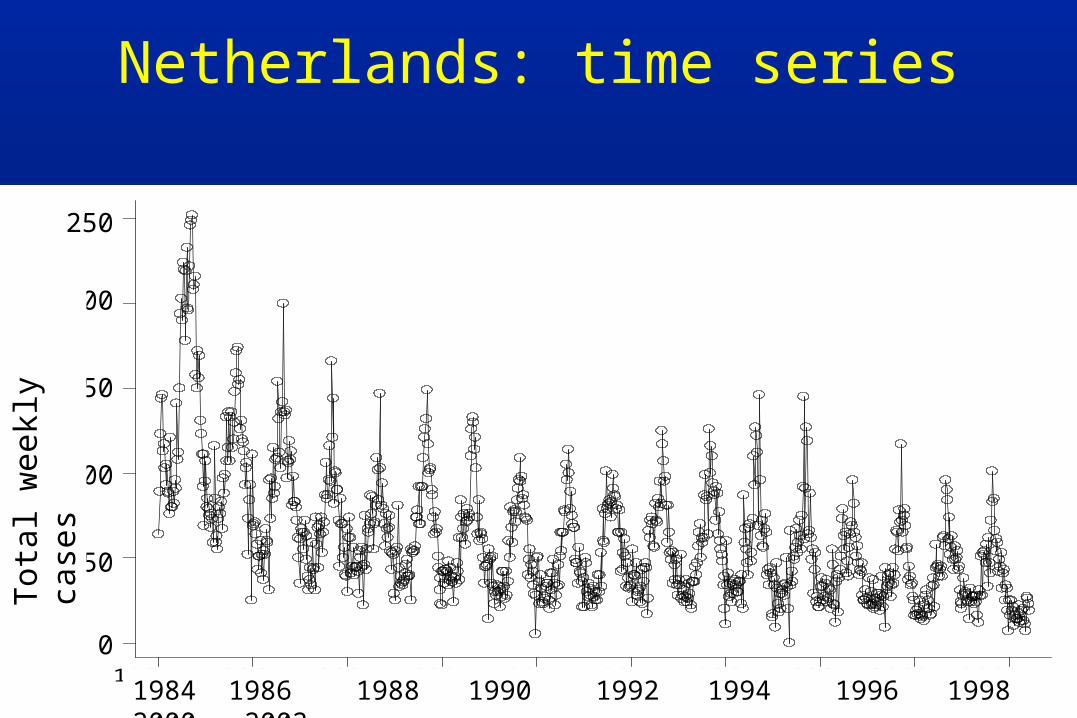
sa
lm
yearwk1984w1 1986w1 1988w1 1990w1 1992w1 1994w1 1996w1 1998w1 2000w12002w1
0
50
100
150
200
250
Netherlands: time series
1984 1986 1988 1990 1992 1994 1996 1998 2000 2002
250
200
150
100
50
0
Tot
al w
eekl
y ca
ses

Climate change and air pollution,
UK Health Assessment 2002Pollutant 2020s 2050s 2080s
Particles Large decrease Large decrease Large decrease
Ozone (assuming no threshold)
Large increase (by about 10%)
Large increase (by about 20%)
Large increase (by about 40%)
Ozone (assuming a threshold)
Small increase Small increase Small increase
Nitrogen dioxide Small decrease Small decrease Small decrease
Sulphur dioxide Large decrease Large decrease Large decrease

Outcomes...
• Shift in “climate envelope”• Additional population at risk
– Definitions of risk
• Relative risk• Absolute risk
– additional/excess cases/deaths– Disability-adjusted life-year [DALY]
COSTS

P Pa O
Distal Socio-Economic Causes
Proximal CausesPhysiological and
PathophysiologicalCauses
Outcomes
P Pa O
P Pa
1
2
3
1
2
3
1
2
D
D
D
1
2
3
Simplified causal web linking exposures and outcomes
WHO model
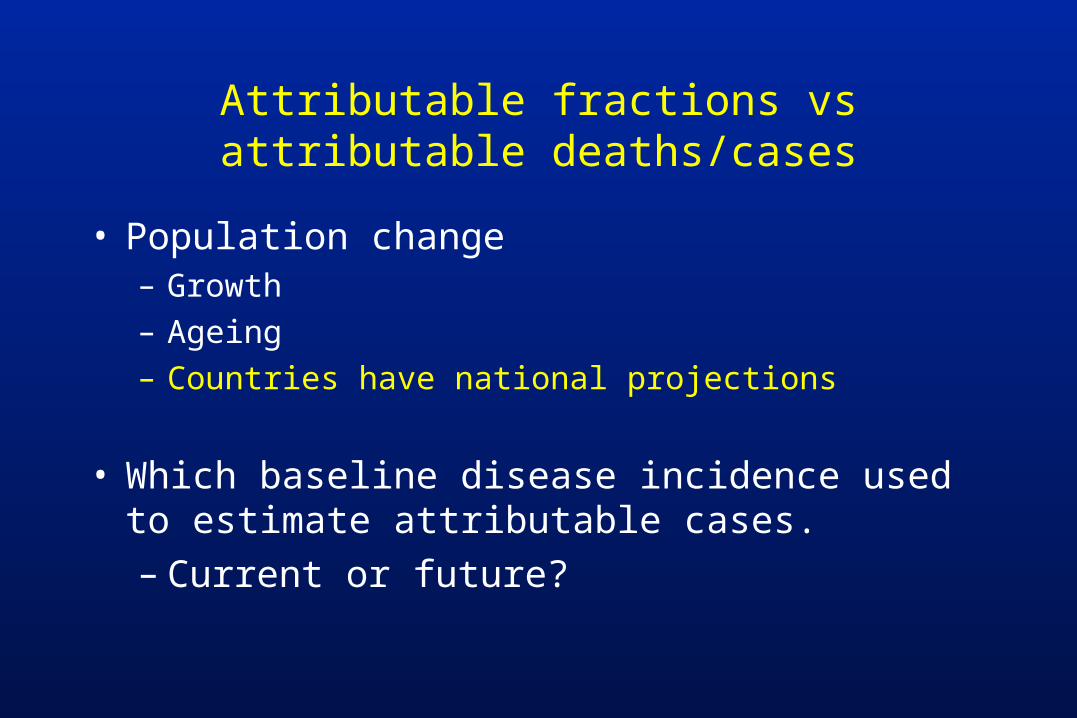
Attributable fractions vs attributable deaths/cases
• Population change– Growth– Ageing– Countries have national projections
• Which baseline disease incidence used to estimate attributable cases.– Current or future?

Scenarios
• Climate– Averages, extremes
• Population– Population growth ✔✔– Population ageing ✔– Urbanisation, coastal migration
• “socio-economic”

Non climate scenarios
• Vector presence/abundance
• Baseline disease prevalence– Cardiovascular disease– HIV/AIDS
• Millennium Development Goals• Population• Income/GDP per capita/PPP per capita• Technology
– Malaria vaccine
• Qualitative “Knowledge is King, Big is Beautiful”

Relevance of attributable vs avoidable burden
•Avoidable burden more policy-relevant
•Why calculate attributable burden?

WHO Definitions…
• A health impact assessment is a combination of procedures or methods by which a proposed policy, programme or project may be judged as to the effects it may have on the health of a population.
• The basic principles underlying such an assessment are democracy, equity, sustainable development and evidence-based advice.
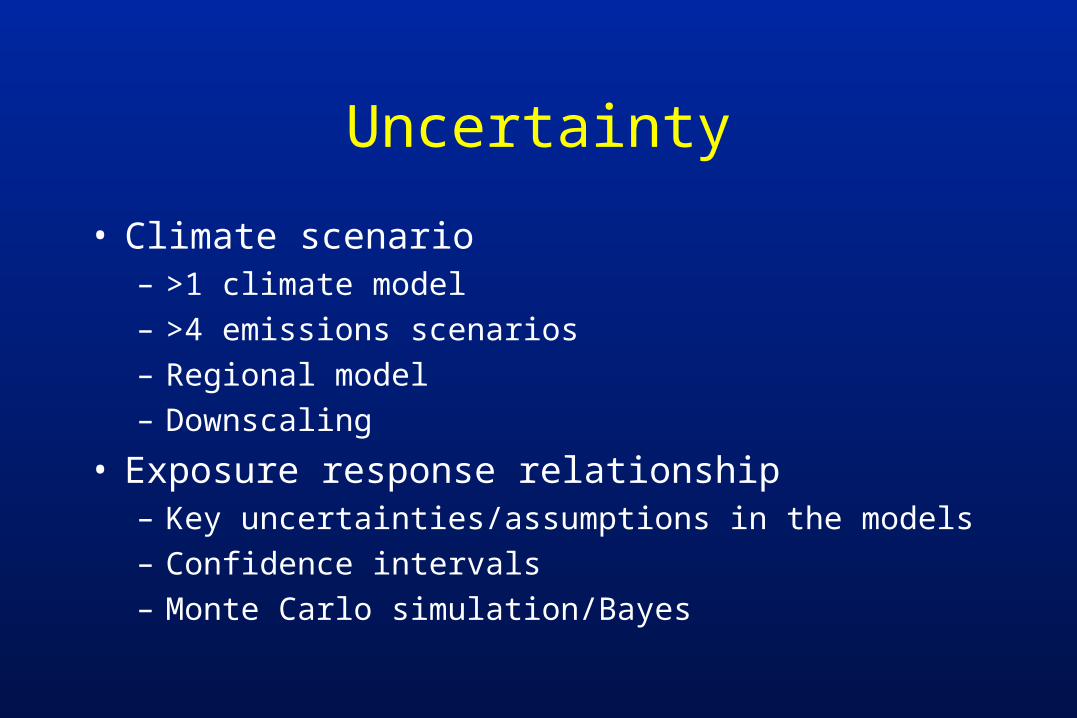
Uncertainty
• Climate scenario– >1 climate model– >4 emissions scenarios– Regional model– Downscaling
• Exposure response relationship– Key uncertainties/assumptions in the models– Confidence intervals– Monte Carlo simulation/Bayes
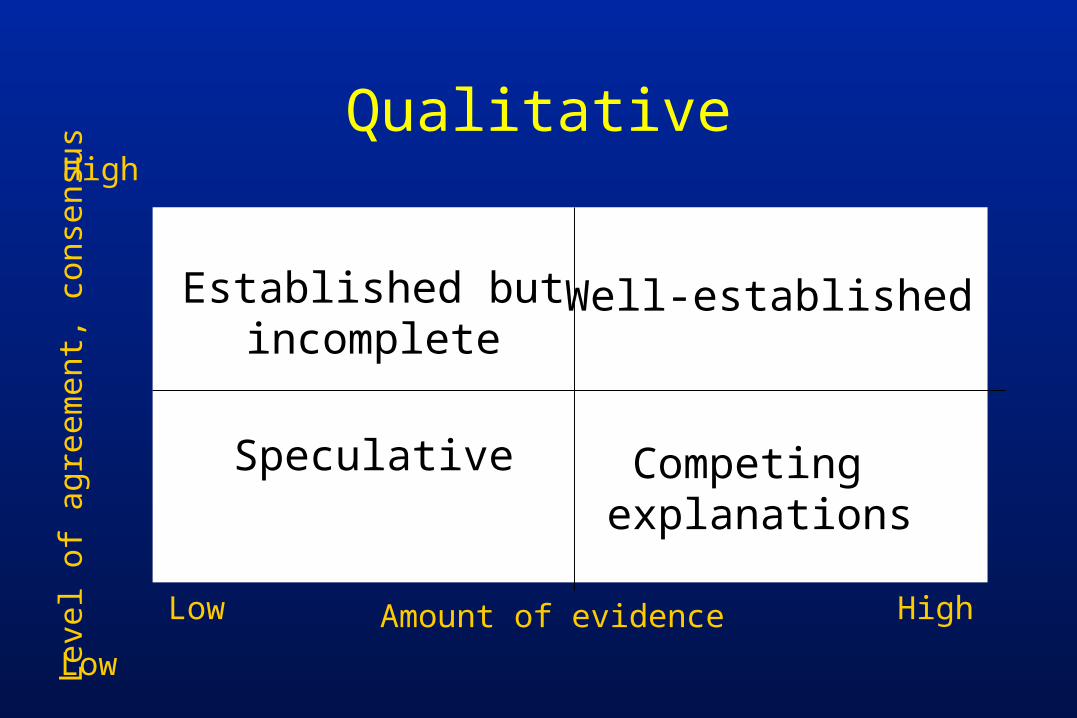
Qualitative
Low
Low
High
High
Established butincomplete
Speculative Competing explanations
Well-established
Amount of evidence
Lev
el o
f ag
reem
ent,
cons
ensu
s

PastPast[climate/weather-health[climate/weather-health
relationships]relationships]
FutureFuture[map malaria][map malaria]
PresentPresent[highland malaria][highland malaria]
learnlearn?analogues?analoguesmechanismsmechanisms
detectiondetectionattributionattribution
predictive predictive modellingmodelling
three research tasksthree research tasks
Empirical studiesEmpirical studies[epidemiology][epidemiology]
2004 2010 2080

Country Reference
Antigua and Barbuda O'Marde and Michael, 2000 – UNEP Country Study
Australia McMichael et al, 2002
Cameroon UNEP/ Ministry of Environment and Forestry, Cameroon, 1998
Canada Duncan et al., 1997
Fiji de Wet and Hales, 2000
Japan Ando et al, 1998
Kiribati Taeuea, de Wet and Hales, 2000
New Zealand Woodward et al. 2001
Panama Sempris E and Lopez R, eds. 2001 - ANAM/UNDP
Portugal Casimiro and Calheiros, 2002
South Africa UNEP Country study 2000
Sri Lanka Ratnasari 1998
St Lucia St Lucia National Communication, chapter 4.
United Kingdom Dept of Health, 2002
United States Patz et al., 2000 + various documents
Zambia Phiri amd Msiska, 1998