cloning and expression of plasmids · pdf filecloning and expression of plasmids encoding...
TRANSCRIPT
CLONING AND EXPRESSION OF PLASMIDS ENCODING MULTIMERS OF
ANTIMICROBIAL PEPTIDES INDOLICIDIN AND PGQ
A Thesis
Submitted to the faculty of
WORCESTER POLYTECHNIC INSTITUTE
In partial fulfillment of the requirements for the
Degree of Master of Science
In
Biology
By
_____________________________
Kimberly M. Morin
04/30/2003
APPROVED:
__________________ __________________ __________________
Charlene Mello, Ph.D. David S Adams, Ph.D. Samuel Politz, Ph.D. Major Advisor Committee Member Committee Member Natick Soldier Systems Center
2
ABSTRACT
Antimicrobial peptides are active against bacteria, fungi and viruses as part of the
innate immune system in animals and insects. Such peptides are currently produced by
extracting them from the host organism or by solid phase peptide synthesis; both
techniques are expensive and produce low yields. Recombinant DNA technology opens
a window to produce these peptides inexpensively and in large quantities utilizing E. coli
expression systems. Two antimicrobial peptides, indolicidin and PGQ, were the focus of
this work. They are short amphipathic alpha helical antimicrobial peptides that target a
broad range of microorganisms. Genes encoding multimers of indolicidin, PGQ and a
hybrid of indolicidin:PGQ were placed into protein expression vectors pET32a+ and
pET43.1a+, for peptide production in E. coli. A combination of multimerization and the
use of a fusion protein were utilized to mask the toxicity of these peptides in E. coli. The
multimerized peptide fusion construct was purified using Ni/NTA affinity
chromatography. Methionine residues flanking each monomeric unit were utilized to
enable cleavage of the multimerized protein and liberating a biologically active peptide.
A Trx:indolicidin trimer fusion was produced in the greatest yield of all constructs
investigated. Upon cyanogen bromide cleavage, a band corresponding to the theoretical
molecular weight of an indolicidin monomer was observed with SDS-PAGE.
Antimicrobial activity of monomeric recombinant indolicidin was tested resulting in
zones of clearing. Overall the results indicate that multimerizing antimicrobial peptide
genes can potentially produce a larger quantity of peptide per bacterial cell. These
studies suggest that multimerization of antimicrobial peptide genes represents a means to

3
control in vivo toxicity of the recombinant peptides and increase production relative to
single gene fusions.
4
TABLE OF CONTENTS
ABSTRACT........................................................................................................................ 2
LIST OF FIGURES AND TABLES................................................................................... 5
BACKGROUND ................................................................................................................ 8
MATERIALS AND METHODS...................................................................................... 25
RESULTS ......................................................................................................................... 41
DISCUSSION................................................................................................................... 61
BIBLIOGRAPHY............................................................................................................. 66
APPENDIX 1 VECTOR MAP OF PET28A+.................................................................. 69
APPENDIX 2 VECTOR MAP OF PET32A+.................................................................. 70
APPENDIX 3 VECTOR MAP OF PET43.1A+............................................................... 71
APPENDIX 4 VECTOR MAP OF PQE-30 ..................................................................... 72
APPENDIX 5 VECTOR MAP OF PGEX-4T-2 .............................................................. 73
APPENDIX 6 VECTOR MAP OF PUC18 ...................................................................... 74
APPENDIX 7 SEQUENCING RESULTS OF IND3 IN PUC-LINK.............................. 75
APPENDIX 8 SEQUENCING RESULTS OF IND6 IN PUC-LINK.............................. 76
APPENDIX 9 SEQUENCING RESULTS OF IP IN PUC-LINK ................................... 77
APPENDIX 10 SEQUENCING RESULTS OF (IP)2 IN PUC-LINK ............................. 78
APPENDIX 11 SEQUENCING RESULTS OF IPP IN PUC-LINK ............................... 79
APPENDIX 12 SEQUENCING RESULTS OF PGQ3 IN PUC-LINK........................... 80
APPENDIX 13 SEQUENCING RESULTS OF PGQ6 IN PUC-LINK........................... 81

5
LIST OF FIGURES AND TABLES
Figure 1 Classification of Antimicrobial Peptides.............................................................. 9
Table 1 Antimicrobial Activity of Indolicidin .................................................................. 11
Figure 2 Gram-Negative Bacterial Cell Wall ................................................................... 13
Figure 3 Gram-Positive Bacterial Cell Membrane ........................................................... 14
Figure 4 Proposed Membrane Permeability Mechanism for α-helical Peptides .............. 15
Table 2 Antimicrobial Peptide Expression Systems used in the Literature..................... 19
Figure 5 Multimerization using Nhe I and Spe I Restriction Sites ................................... 22
Figure 6 DNA and Amino Acid Sequence of Indolicidin and PGQ................................. 23
Figure 7 DNA Sequence of Synthetic Adapter Inserted into pUC18 to Create pUC-link 25
Table 3 Expression Vectors Used in this Project.............................................................. 27
Table 4 E. coli Host Strains .............................................................................................. 28
Figure 8 Multimerization of Antimicrobial Peptide Genes .............................................. 41
Figure 9 Determination of Correct Insertion of Multimerized DNA Insert...................... 42
Figure 10 Cloning and Expression of Multimerized Antimicrobial Peptide Genes in E.
coli............................................................................................................................. 44
Figure 11 SDS-PAGE Analysis of Cell Lysates............................................................... 45
Figure 12 SDS-PAGE Analysis of Nickel Purified Protein.............................................. 46
Table 5 Vectors and Inserts used for In Vitro Transciption/Translation .......................... 47
Figure 13 In Vitro Transcription/Translation Results....................................................... 48
Figure 14 Expression of Trx:PGQ6 in Various Host Strains............................................ 50
Figure 15 Expression of NusA:PGQ6 in Various Host Strains ........................................ 51
Figure 16 Expression of Trx:Ind3 in Various Host Strains .............................................. 52
6
Figure 17 Expression of Trx:hyb(IP)2 in Various Host Strains ........................................ 53
Figure 18 SDS-PAGE of NusA:PGQ6, Trx:Ind3, Trx:hyb(IP)2 Cell Lysates and Nickel
Purified...................................................................................................................... 54
Figure 19 Cyanogen Bromide Cleavage Site in Multimerized Peptide............................ 55
Figure 20 CNBr Cleavage of Trx:Ind3 ............................................................................. 55
Table 6 Amino Acid Analysis Trx:Ind3 Purified Sample ................................................ 57
Table 7 Quantitation of Indolicidin Monomer.................................................................. 58
Figure 21 Plate Overlay of Cyanogen Bromide Digested Trx:Ind3 ................................. 59
Figure 22 Plate Overlay of Cyanogen Bromide Digested Trx fusion protein .................. 60

7
ACKNOWLEDGEMENTS
I would like to thank Dr. Charlene Mello for assistance with designing and
executing this project at the Soldier Systems Center. I would also like to thank Steve
Arcidiacono for working closely with me, and helping me with day-to-day experiments.
I would also like to thank Prof. Richard Beckwitt for all the previous work he did on this
project and for teaching me recombinant DNA techniques. Lastly I would like to thank
Prof. David Adams and Prof. Samuel Politz for their helpful suggestions and guidance.
8
BACKGROUND
Antimicrobial Peptides
History of Antimicrobial Peptides
Small peptides that fight microbial infection are natural antibiotics that function
as part of the innate immune system of vertebrates and invertebrates (Sitaram and
Nagaraj, 1999). This system, present since birth, attempts to continually keep microbial
infection under control. Antimicrobial peptides have been classified based on their
tertiary structures into categories such as linear peptides, alpha helical peptides, beta
sheet peptides, and single amino acid rich sequence peptides (Figure 1) (Epand and
Vogel, 1999). The action of these peptides ranges from physical barriers to cell mediated
immune responses to microrganisms (Nicolas and Mor, 1995). Thus far over 100
different antimicrobial peptides have been discovered in vertebrates. These discoveries
may help medicine, as many organisms have become resistant to antibiotics currently in
use. Many of these peptides are structurally similar to each other and typically range in
molecular weight from 1,000-5,000 Da, are polycationic, and span the bacterial
membrane.
Classification
There are five main groups of antimicrobial peptides, delineated by structural
characteristics (Figure 1). The amphipathic helical peptides were first identified in
amphibians and are secreted through the skin. Most consist of linear peptides ranging
from 20-36 residues long, which are cationic and have varying numbers of lysine
9
residues. Their activity is stimulated by cationic binding to membranes as a result of α-
helical formation in an anisotropic environment (Spencer, 1992). There are also α-helical
peptides, which are hydrophobic and slightly anionic (Epand and Vogel, 1999).
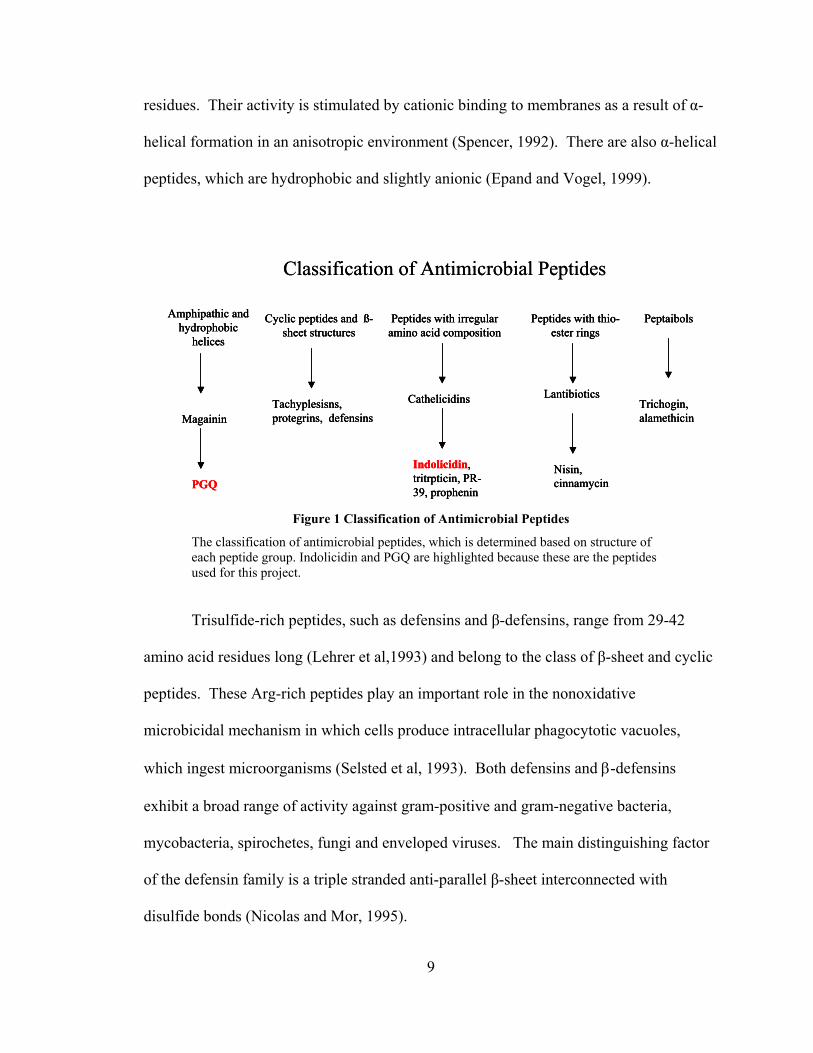
Figure 1 Classification of Antimicrobial Peptides
The classification of antimicrobial peptides, which is determined based on structure of each peptide group. Indolicidin and PGQ are highlighted because these are the peptides used for this project.
Trisulfide-rich peptides, such as defensins and β-defensins, range from 29-42
amino acid residues long (Lehrer et al,1993) and belong to the class of β-sheet and cyclic
peptides. These Arg-rich peptides play an important role in the nonoxidative
microbicidal mechanism in which cells produce intracellular phagocytotic vacuoles,
which ingest microorganisms (Selsted et al, 1993). Both defensins and β-defensins
exhibit a broad range of activity against gram-positive and gram-negative bacteria,
mycobacteria, spirochetes, fungi and enveloped viruses. The main distinguishing factor
of the defensin family is a triple stranded anti-parallel β-sheet interconnected with
disulfide bonds (Nicolas and Mor, 1995).
Classification of Antimicrobial Peptides
Amphipathic and hydrophobic
helices
Magainin
PGQ
Cyclic peptides and ß-sheet structures
Tachyplesisns, protegrins, defensins
Peptides with irregular amino acid composition
Cathelicidins
Indolicidin,tritrpticin, PR-39, prophenin
Peptides with thio-ester rings
Lantibiotics
Nisin, cinnamycin
Peptaibols
Trichogin, alamethicin
Classification of Antimicrobial Peptides
Amphipathic and hydrophobic
helices
Magainin
PGQ
Amphipathic and hydrophobic
helices
Magainin
PGQ
Cyclic peptides and ß-sheet structures
Tachyplesisns, protegrins, defensins
Cyclic peptides and ß-sheet structures
Tachyplesisns, protegrins, defensins
Peptides with irregular amino acid composition
Cathelicidins
Indolicidin,tritrpticin, PR-39, prophenin
Peptides with irregular amino acid composition
Cathelicidins
Indolicidin,tritrpticin, PR-39, prophenin
Peptides with thio-ester rings
Lantibiotics
Nisin, cinnamycin
Peptides with thio-ester rings
Lantibiotics
Nisin, cinnamycin
Peptaibols
Trichogin, alamethicin
Peptaibols
Trichogin, alamethicin
10
Some antimicrobial peptides are characterized by an unusually high abundance of
one or two amino acids. Indolicidin and tritrpticin contain large numbers of tryptophan
residues; tryptophan is generally not an abundant amino acid in peptides or proteins
(Epand and Vogel, 1999). The proline and arginine-rich antimicrobial peptides are
composed of more than 60% pro and arg collectively. They have highly repetitive
sequences (eg. Arg-Pro-Pro or Pro-Arg-Pro), and are mainly active against gram-negative
bacteria (Agerberth et al, 1991).
Peptides with thio-ester rings, also referred to as lantibiotics, are produced by
bacteria and contain small ring structures enclosed by a thio-ester bond (Epand and
Vogel, 1999). Finally, peptailbols contain a high number of α-amino-isobutyric acid
residues. This enables the peptides to form a α-helical structure in a particular
conformation. These peptides are also acylated at the N-terminus, which favors their
insertion into membranes (Epand and Vogel, 1999).
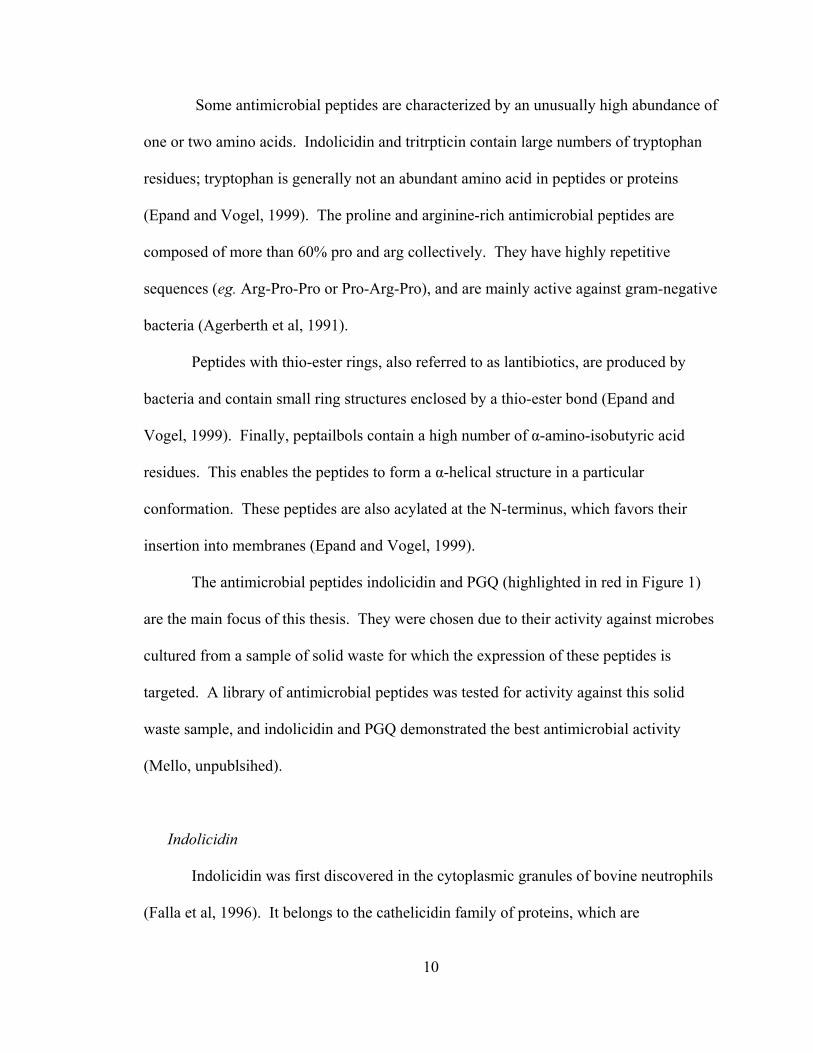
The antimicrobial peptides indolicidin and PGQ (highlighted in red in Figure 1)
are the main focus of this thesis. They were chosen due to their activity against microbes
cultured from a sample of solid waste for which the expression of these peptides is
targeted. A library of antimicrobial peptides was tested for activity against this solid
waste sample, and indolicidin and PGQ demonstrated the best antimicrobial activity
(Mello, unpublsihed).
Indolicidin
Indolicidin was first discovered in the cytoplasmic granules of bovine neutrophils
(Falla et al, 1996). It belongs to the cathelicidin family of proteins, which are
11
distinguished by variable C-termini and common amino acid structure (Sitaram and
Nagaraj, 1999).
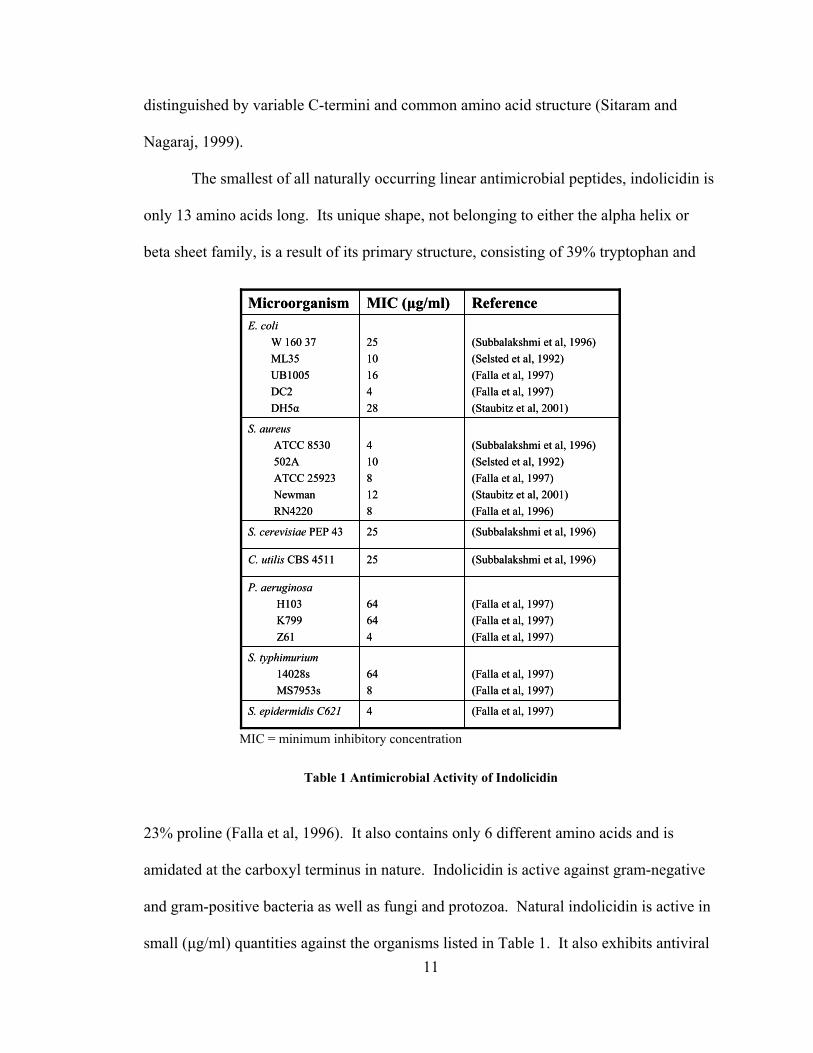
The smallest of all naturally occurring linear antimicrobial peptides, indolicidin is
only 13 amino acids long. Its unique shape, not belonging to either the alpha helix or
beta sheet family, is a result of its primary structure, consisting of 39% tryptophan and
MIC = minimum inhibitory concentration
Table 1 Antimicrobial Activity of Indolicidin
23% proline (Falla et al, 1996). It also contains only 6 different amino acids and is
amidated at the carboxyl terminus in nature. Indolicidin is active against gram-negative
and gram-positive bacteria as well as fungi and protozoa. Natural indolicidin is active in
small (µg/ml) quantities against the organisms listed in Table 1. It also exhibits antiviral
(Subbalakshmi et al, 1996)(Selsted et al, 1992)(Falla et al, 1997)(Staubitz et al, 2001)(Falla et al, 1996)
4108128
S. aureus ATCC 8530502AATCC 25923NewmanRN4220
(Falla et al, 1997)4S. epidermidis C621
(Falla et al, 1997)(Falla et al, 1997)
648
S. typhimurium14028sMS7953s
(Falla et al, 1997)(Falla et al, 1997)(Falla et al, 1997)
64644
P. aeruginosaH103K799Z61
(Subbalakshmi et al, 1996)25C. utilis CBS 4511
(Subbalakshmi et al, 1996)25S. cerevisiae PEP 43
(Subbalakshmi et al, 1996)(Selsted et al, 1992)(Falla et al, 1997)(Falla et al, 1997)(Staubitz et al, 2001)
251016428
E. coliW 160 37ML35UB1005DC2DH5α
ReferenceMIC (µg/ml)Microorganism
12
activity against HIV-1 (Sitaram and Nagaraj, 1999). Unfortunately, it is cytotoxic to rat
and human T lymphocytes, and lyses red blood cells (Falla et al, 1996), but may have
practical applications in textiles for biological agent decontamination. Indolicidin has
been shown to inhibit DNA synthesis through penetration into the cytoplasmic membrane
(Subbalakshmi and Sitaram, 1998). Lysis of the bacteria does not occur, but rather
filamentation of the cells and blockage of replication occurs due to the blockage of
thymidine incorporation.
PGQ
PGQ stands for peptide with an amino-terminal glycine and carboxyl-terminal
glutamine and comes from the African clawed frog Xenopus laevis (Moore et al, 1991).
It is in the group of antimicrobial peptides called magainins, a sub-class of amphipathic
α-helical peptides, which are secreted from the skin of Xenopus laevis. All peptides in
the magainin family range from 21-26 amino acids long and are lysine rich basic proteins
(Moore et al, 1991). They are released from the frog upon injury or adrenergic
stimulation to battle against gram-negative and gram-positive bacteria, fungi and
protozoa. These and other peptides are stored in the skin in large granules. The stomach
of Xenopus laevis also contains many antimicrobial peptides, including PGQ. Within the
stomach, PGQ is stored in the granular multinucleated cells in the gastric mucosa.
13
Mechanism of Action
Many mechanisms of action have been proposed for antimicrobial peptides. One
mechanism of α-helical and β-sheet peptides is targeted towards the lipid bilayer of the
bacteria by use of self-promoted uptake where the peptide embeds itself within the lipid
bilayer forming a channel (Falla et al, 1996). This increases the rate of leakage of the
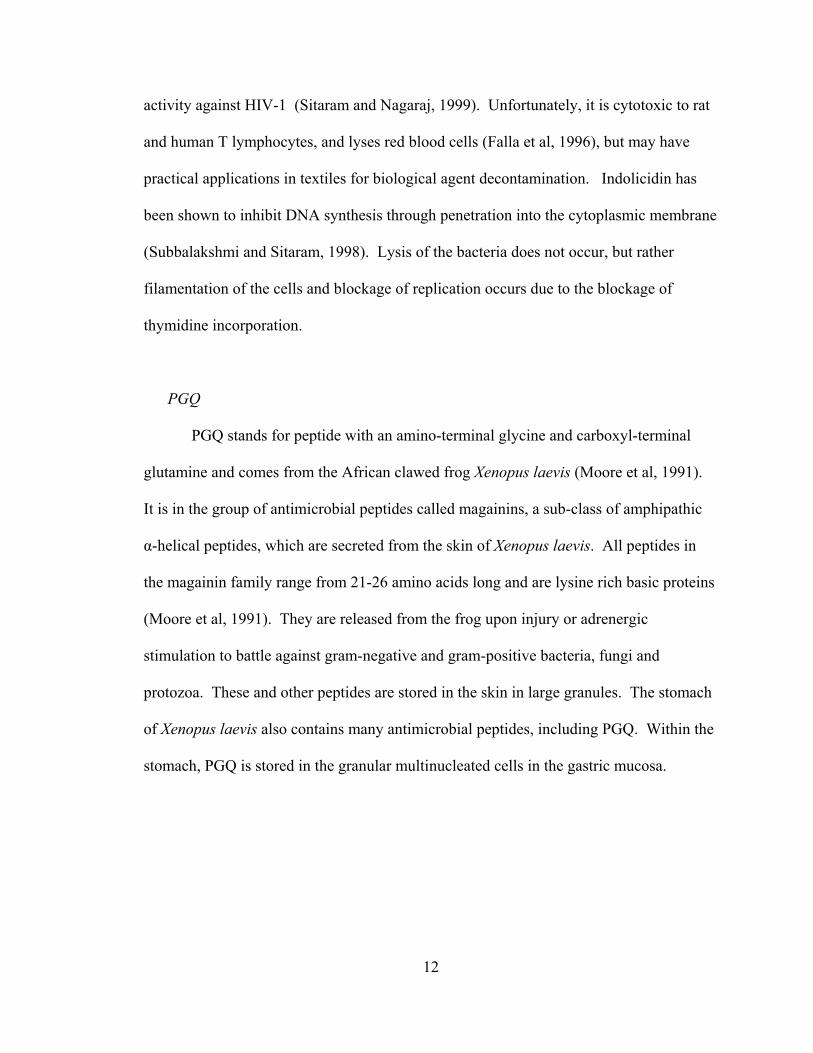
cytoplasmic membrane of gram-negative and gram-positive cells (Figures 2 and 3)
through cationic binding to the negatively charged lipid membrane (Figure 4) (Epand and
Vogel, 1999). This binding is achieved during tertiary folding of the peptides upon
association with the bacterial cell membrane (Hancock and Rozek, 2002). For many
peptides, excluding indolicidin, this inhibits their toxicity to eukaryotic neutrally
Figure 2 Gram-Negative Bacterial Cell Wall
This represents the composition of a gram-negative bacteria cell wall including the cell membrane. This differentiates from the gram-positive cell membrane, because it contains a cell wall (shown in green). http://www.bact.wisc.edu/microtextbook/bacterialstructure/CellWall.html
Cell Wall
14
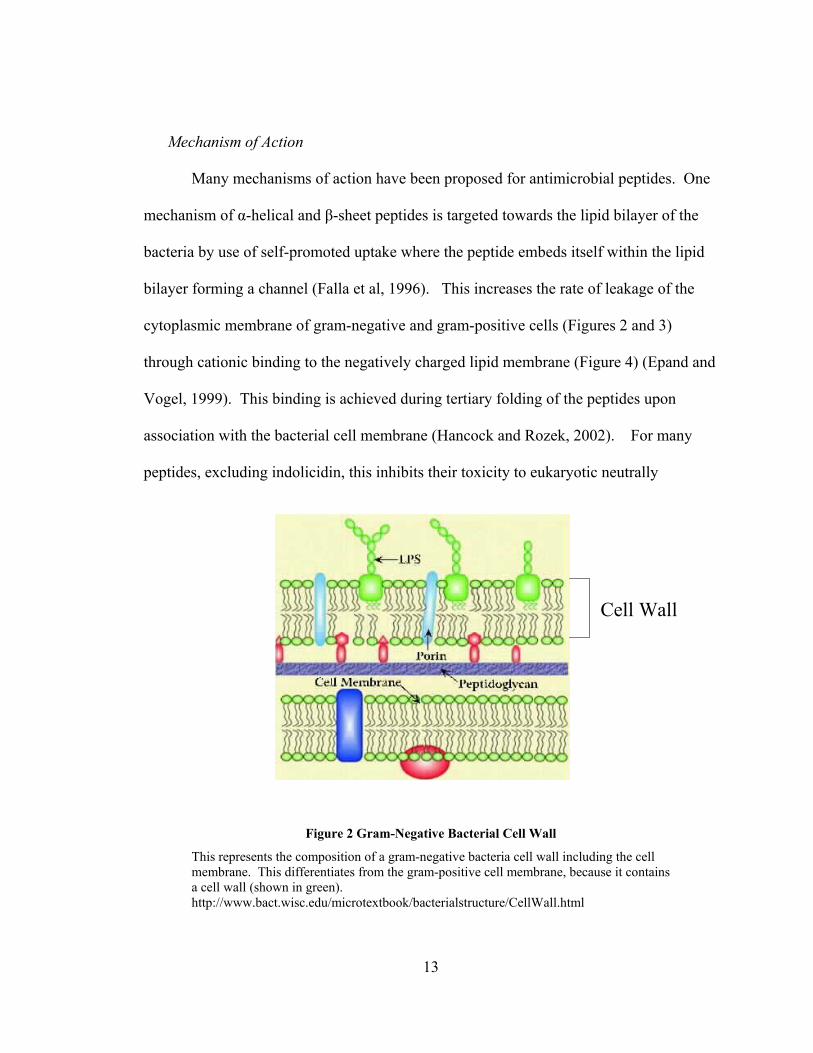
Figure 3 Gram-Positive Bacterial Cell Membrane
This represents the gram-positive cell membrane, which includes the peptidoglycan layer. This differs from the gram-negative cell because it lacks the cell wall. http://www.bact.wisc.edu/microtextbook/bacterialstructure/CellWall.html
charged cell membranes (Huang et al, 2000). Indolicidin has the ability to break through
the lipid bilayer by cationic binding, but exerts its activity by inhibition of DNA synthesis
(Subbalakshmi and Sitaram, 1998). Direct interaction with the lipid bilayer was
hypothesized after replacing L-amino acids with all D enantiomers. This did not inhibit
membrane binding due to stereospecific protein receptors as previously thought (Huang
et al, 2000). Several peptides can influence molecular synthesis at concentrations that do
not cause the breakdown of the membrane potential, suggesting that other mechanisms
are important in addition to effects on membrane permeability. Activity of the proline-
arginine rich peptide PR-39 leads to inhibition of protein synthesis and induction of
degradation of proteins required for DNA replication (Ramanthan et al, 2002). Other
peptides have clearly been shown to permeabilize the membrane and cause cytoplasmic
leakage (Hancock and Rozek, 2002). Several cathelicidins have been shown to decrease
15
bacterial respiration, caused by deterioration of the inner membrane (Ramanathan et al,
2002).
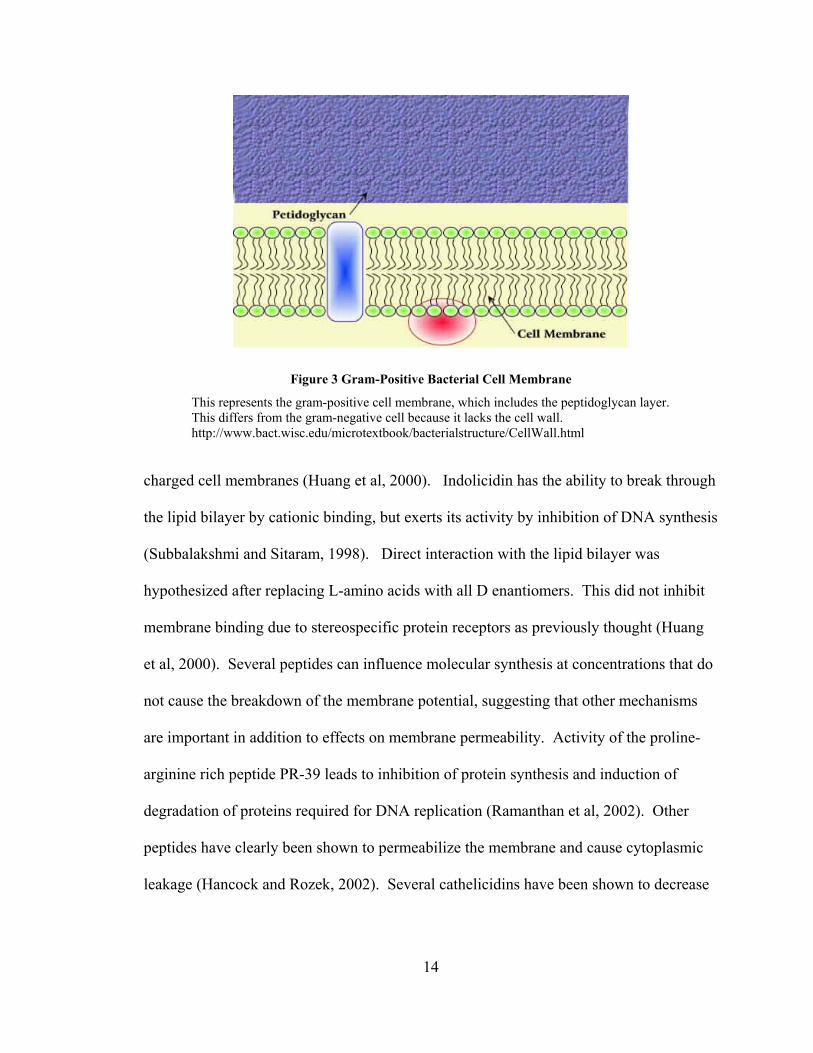
Figure 4 Proposed Membrane Permeability Mechanism for α-helical Peptides
This mechanism of action of antimicrobial peptides involves the permeation of the lipid bilayer. This is achieved when the cationic peptide interacts with the anionic phosolipid bilayer. The peptide then forms a pore with multiple peptides and thus enters the cell (Epand and Vogel, 1999).
Potential Applications
Antimicrobial peptides are now being investigated by many pharmaceutical
companies for their wide range of activity against many bacteria and fungi. Due to an
increase in bacterial resistance to many antibiotics, antimicrobial peptides are a promising
approach in the development of new drugs (Hancock and Rozek, 2002). A potentially
important feature is their low probability of selecting for resistance in target microbes
because they have evolved as part of innate immune responses. Antimicrobial peptides
bind and kill bacteria, fungi and viruses; this may be useful in biological decontamination
and preservation of food products. A major challenge is production of these small
peptides in commercial quantities. For production of these peptides to be valuable in
industry, they must be produced in an environmentally safe and cost effective manor.
16
Current Methods of Production
As mentioned above, these peptides were discovered in invertebrates and
vertebrates as part of the innate immune system. For years they have been extracted from
eukaryotic tissue to test their mechanism of action and classify the peptides. This
requires tissue extraction or eukaryotic cell expression, which produces low yields of
protein. Solid phase peptide synthesis is currently used to produce natural peptide
sequences, as well as variations, to create novel antimicrobial peptides. This procedure
requires hazardous chemicals and costly reagents. In contrast, recombinant DNA
technology has been used to clone natural or synthetic genes in bacteria, fungi, plants, or
yeast cells for increased production of many eukaryotic and prokaryotic proteins.
Many different host/vector systems have been used to produce antimicrobial
peptides through recombinant DNA technology. E. coli has been utilized most often due
to the low cost of fermentation compared to mammalian cells, and its ability to produce
inclusion bodies, which aid in the purification process (Haught et al, 1998). The main
source of success in E. coli expression of antimicrobial peptides has been through the use
of fusion proteins, which are large proteins composed of an unrelated protein fused to the
protein of interest (Hara and Yamakawa, 1996). This aids expression by alleviating the
toxicity and proteolytic degradation of the expressed antimicrobial peptide.
Review of Published Expression Studies
As mentioned previously, antimicrobial peptides are now being looked at to
combat antibiotic resistant strains of bacteria. Since this is very important in the medical
17
field, many scientists are trying to produce these short peptides using bacterial systems.
Antimicrobial peptides have been successfully expressed using several different methods,
including commercially available fusion proteins (Piers et al, 1993), N-terminal inclusion
body forming proteins (Haught et al, 1998; Lee et al, 2000), an N-terminal anionic pre-
pro region (Zhang et al, 1998), and tandem repeats of an anionic complement and
antimicrobial peptide (Lee et al, 1998).
These different methods of gene arrangement of the antimicrobial peptides were
resorted to because of the expression problems that arose during experimentation.
Fusion proteins were chosen based on natural proteins or portions of natural proteins that
enhance the formation of inclusion bodies to aid in purification as well as result in the
reduction of proteolytic degradation (Piers et al, 1993; Taguchi et al, 1994; Lee et al,
1998). Piers et al. (1993) used OprF, an outer membrane protein in P. aeruginosa, along
with pre-pro defensin to inhibit proteolytic degradation and induce formation of inclusion
bodies. Lee et al. (1998) fused buforin II to an acidic positively charged peptide to
mimic the natural precursor of buforin II. The gene encoding this anionic/cationic
peptide complex was then multimerized and expressed at a yield of 107 mg/L active
peptide. Ponti et al. (1999) used a C-terminal fusion of GABA-transaminase to produce
inclusion bodies and decrease proteolytic degradation. Haught et al. (1998) utilized
bovine prochymosin to decrease toxicity of the antimicrobial peptide and induce
inclusion bodies. Zhang et al. (1998) experimented with different combinations of an
anionic stabilizing fragment and an anionic pre-pro sequence (HNP-1) to successfully
express several antimicrobial peptides including indolicidin.
18
There are hundreds of different antimicrobial peptides and each one may be active
in different ways against different microorganisms. Only a few peptides have been
produced using recombinant DNA techniques (Table 2) including cecropin A (Andersons
et al, 1991; Hellers et al, 1991); defensin A (Reichhart et al, 1992); CEME, a cecropin-
melittin hybrid (Piers et al, 1993); apidaecin (Taguchi et al, 1994); moricin (Hara et al,
1996); magainin P2 (Haught et al, 1998); buforin II (Lee et al, 1998); bactenecin and
indolicidin (Zhang et al, 1998); esculentin-1 (Ponti et al, 1999); MiAMP1 (Harrison et al,
1999); and MSI-344 (Lee et al, 2000). PGQ has not been produced recombinantly, and
as mentioned above, shows activity in a wide range of microorganisms.
Although it has been proven that antimicrobial peptides can be produced in vivo,
it is unclear if they can be produced in large quantities due to their toxicity to the host
organism. Yield of active protein produced by various expression systems varies due to
the variety of methods for protein expression and purification. The purified active
peptide concentration of esculentin-GABA-T (Ponti et al, 1999) and MetP2 (Haught et al,
1998) was 0.5-1 mg/L. This fusion protein was produced in a 1 L shake flask culture and
inclusion bodies purified by RP-HPLC. MSI-344 (Hwang et al, 2001) expressed 310
mg/L of active purified peptide using a 1 L fermentor grown to a high cell density before
induction, followed by 12 hours of growth after induction. MMIS-Buforin II (Lee et al,
1998) was expressed at 107 mg/L of purified buforin II using a 30 L fermentor and a high
cell density and long induction time. These variations in peptide expression and
purification make methods direct comparisons of expression systems impossible.
19
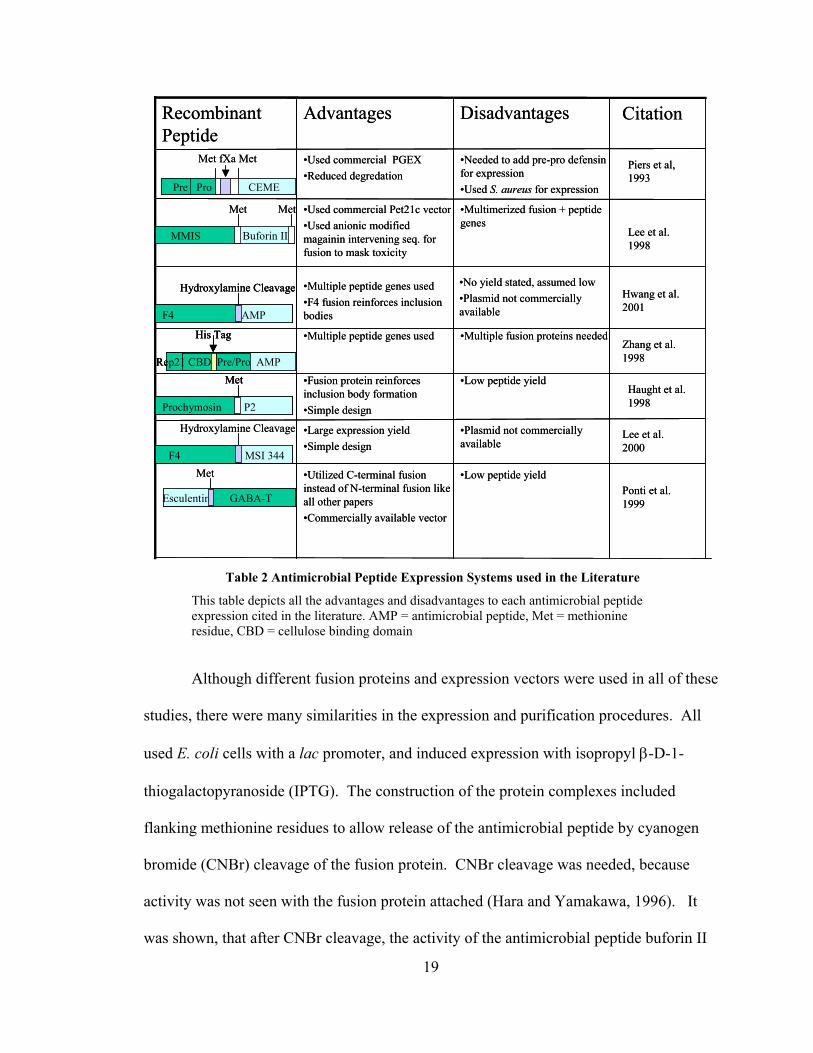
Table 2 Antimicrobial Peptide Expression Systems used in the Literature
This table depicts all the advantages and disadvantages to each antimicrobial peptide expression cited in the literature. AMP = antimicrobial peptide, Met = methionine residue, CBD = cellulose binding domain
Although different fusion proteins and expression vectors were used in all of these
studies, there were many similarities in the expression and purification procedures. All
used E. coli cells with a lac promoter, and induced expression with isopropyl β-D-1-
thiogalactopyranoside (IPTG). The construction of the protein complexes included
flanking methionine residues to allow release of the antimicrobial peptide by cyanogen
bromide (CNBr) cleavage of the fusion protein. CNBr cleavage was needed, because
activity was not seen with the fusion protein attached (Hara and Yamakawa, 1996). It
was shown, that after CNBr cleavage, the activity of the antimicrobial peptide buforin II
•Low peptide yield•Utilized C-terminal fusion instead of N-terminal fusion like all other papers•Commercially available vector
•Plasmid not commercially available
•Large expression yield•Simple design
•Low peptide yield•Fusion protein reinforces inclusion body formation•Simple design
•Multiple fusion proteins needed•Multiple peptide genes used
•No yield stated, assumed low•Plasmid not commercially available
•Multiple peptide genes used•F4 fusion reinforces inclusion bodies
•Multimerized fusion + peptide genes
•Used commercial Pet21c vector•Used anionic modified magainin intervening seq. for fusion to mask toxicity
•Needed to add pre-pro defensin for expression•Used S. aureus for expression
•Used commercial PGEX•Reduced degredation
DisadvantagesAdvantagesRecombinant Peptide
Met fXa Met
Pre Pro CEME
Met Met
MMIS Buforin II
Hydroxylamine Cleavage
F4 AMP
Met
Prochymosin P2
Hydroxylamine Cleavage
F4 MSI 344 Met
Esculentin GABA-T
Citation
Piers et al, 1993
Lee et al. 1998
Hwang et al. 2001
Zhang et al. 1998
Lee et al. 2000
Haught et al. 1998
Ponti et al. 1999
His Tag
Rep21 CBD Pre/Pro AMP
•Low peptide yield•Utilized C-terminal fusion instead of N-terminal fusion like all other papers•Commercially available vector
•Plasmid not commercially available
•Large expression yield•Simple design
•Low peptide yield•Fusion protein reinforces inclusion body formation•Simple design
•Multiple fusion proteins needed•Multiple peptide genes used
•No yield stated, assumed low•Plasmid not commercially available
•Multiple peptide genes used•F4 fusion reinforces inclusion bodies
•Multimerized fusion + peptide genes
•Used commercial Pet21c vector•Used anionic modified magainin intervening seq. for fusion to mask toxicity
•Needed to add pre-pro defensin for expression•Used S. aureus for expression
•Used commercial PGEX•Reduced degredation
DisadvantagesAdvantagesRecombinant Peptide
Met fXa Met
Pre Pro CEME
Met Met
MMIS Buforin II
Hydroxylamine Cleavage
F4 AMP
Hydroxylamine Cleavage
F4 AMP
Met
Prochymosin P2
Met
Prochymosin P2
Hydroxylamine Cleavage
F4 MSI 344 Met
Esculentin GABA-T
Citation
Piers et al, 1993
Lee et al. 1998
Hwang et al. 2001
Zhang et al. 1998
Lee et al. 2000
Haught et al. 1998
Ponti et al. 1999
His Tag
Rep21 CBD Pre/Pro AMP
His Tag
Rep21 CBD Pre/Pro AMP
20
was not inhibited by the homoserine residue derived from the Met residue (Lee et al,
1998). Hydroxylamine cleavage was also used (Lee et al, 2000; Hwang et al, 2001) to
cleave the Asn-Gly peptide bond engineered between the fusion protein and peptide.
Our Approach
As shown above, there are many different variables to review in order to
successfully design a system for expressing an antimicrobial peptide. One of the
characteristics that make our project unique is the multimerization of the antimicrobial
peptide itself. As stated above, the multimerization of an anionic/cationic fusion
increased expression levels greatly (Lee et al, 1998). It is hypothesized that, through
multimerization of the antimicrobial peptide itself, toxicity of the peptide to the host
organism will be decreased by inducing non-native folding without sacrificing expression
yields. Utilizing multimerization to reduce toxicity to the host organism will also allow
for a greater yield due to the expression of multiple peptides simultaneously. This feature
is especially important for the production of indolicidin. As stated above, a proposed
mechanism of action of indolicidin involves disrupting DNA synthesis after penetrating
the cell membrane. Production of indolicidin in E. coli occurs intracellularly and the
peptide must therefore remain inactive with respect to DNA synthesis to ensure adequate
expression levels. A methionine residue will be utilized to separate the monomers to
allow cleavage to produce an active antimicrobial monomer from the multimer by
cyanogen bromide cleavage.
Indolidicin and PGQ were chosen for E. coli expression because they
demonstrated activity against a culture grown from a Navy solid waste puck. These

21
pucks harbor many microbes and cause a foul odor aboard Navy ships. When a library of
antimicrobial peptides was tested against the microbes cultured from the Navy puck
(Mello, unpublished), 5 µg of indolicidin and PGQ generated a substantial zone of
clearing on an agar plate overlay, while other peptides were less effective or had no
activity at all.
Using multimerization techniques, a PGQ-indolicidin hybrid is also being created
utilizing a methionine cleavage site to express and purify active PGQ and indolicidin
together. This active hybrid can be achieved because indolicidin and PGQ have different
amino acid compositions (Figure 6) and different molecular weights. This allows for
production of a peptide cocktail. To our knowledge, previously this has not been shown
in the literature, nor have multimers of this PGQ-indolicidin hybrid been described.
Multimerization of Peptides
Previous Work
For the past decade, scientists have been working to produce synthetic spider silk
to mimic the properties of natural silk. One group of scientists from the Natick Soldier
Systems Center has produced synthetic proteins that form recombinant spider silk fibers
(Prince et al, 1995). Their methods included multimerizing the DNA sequence for the
silk protein repeats in order to obtain the expression of larger proteins. This
multimerization process is the approach taken in this thesis for the production of
antimicrobial peptides. Multimers of indolicidin, PGQ and indolicidin + PGQ hybrids
(hybIP) will be produced using the methods developed with spider silk sequences.
22
Previous Natick Projects on Indolicidin and PGQ
Richard Beckwitt and Kevin McGrath produced the preliminary work on this
project. Beckwitt produced the synthetic genes for Indolicidin and PGQ, and McGrath
produced the pUC-link vector. Their work has allowed the multimerization of indolicidin
and PGQ for expression studies described in the present project. Beckwitt produced
indolicidin monomer, dimer, and trimer genes, and PGQ monomer and trimer genes in
the pUC-link cloning vector.
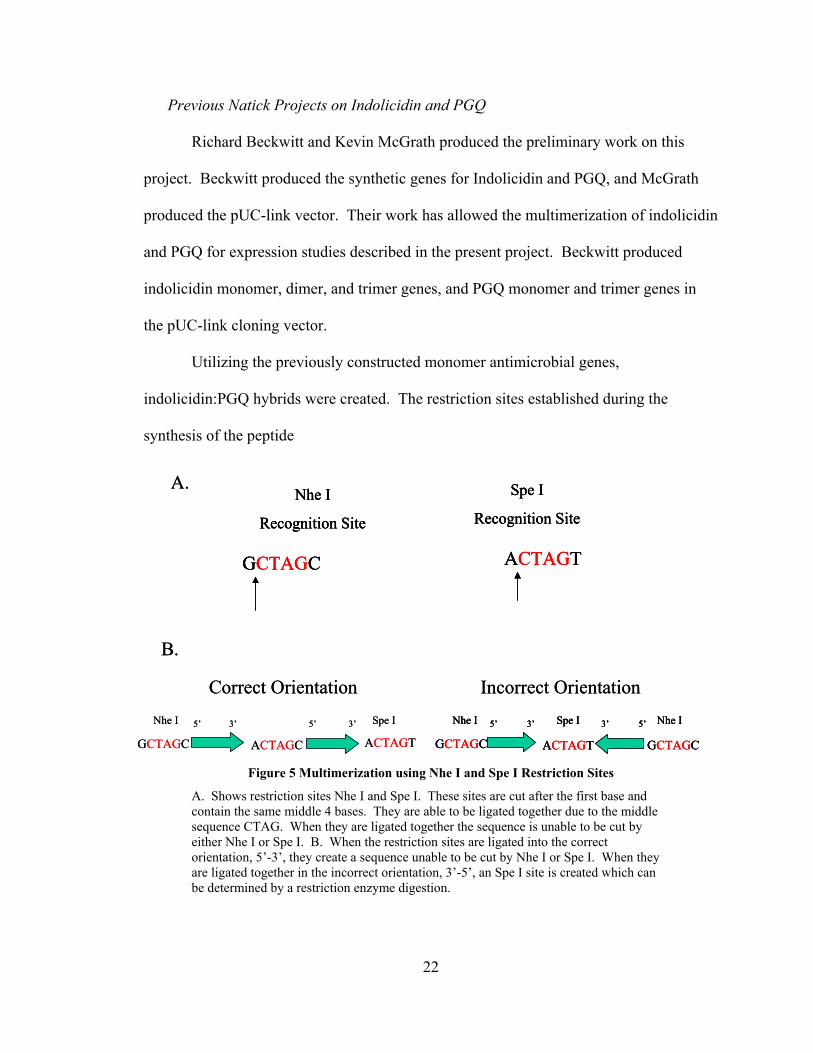
Utilizing the previously constructed monomer antimicrobial genes,
indolicidin:PGQ hybrids were created. The restriction sites established during the
synthesis of the peptide
Figure 5 Multimerization using Nhe I and Spe I Restriction Sites
A. Shows restriction sites Nhe I and Spe I. These sites are cut after the first base and contain the same middle 4 bases. They are able to be ligated together due to the middle sequence CTAG. When they are ligated together the sequence is unable to be cut by either Nhe I or Spe I. B. When the restriction sites are ligated into the correct orientation, 5’-3’, they create a sequence unable to be cut by Nhe I or Spe I. When they are ligated together in the incorrect orientation, 3’-5’, an Spe I site is created which can be determined by a restriction enzyme digestion.
Nhe I
Recognition Site
GCTAGC
Spe I
Recognition Site
ACTAGT
Correct Orientation
GCTAGC ACTAGC ACTAGT
Nhe I Spe I5’ 5’3’ 3’
GCTAGC ACTAGT GCTAGC
Nhe I Nhe ISpe I5’ 5’3’ 3’
Incorrect Orientation
A.
B.
Nhe I
Recognition Site
GCTAGC
Nhe I
Recognition Site
GCTAGC
Spe I
Recognition Site
ACTAGT
Spe I
Recognition Site
ACTAGT
Correct Orientation
GCTAGC ACTAGC ACTAGT
Nhe I Spe I5’ 5’3’ 3’
GCTAGC ACTAGT GCTAGC
Nhe I Nhe ISpe I5’ 5’3’ 3’
GCTAGC ACTAGT GCTAGC
Nhe I Nhe ISpe I5’ 5’3’ 3’
Incorrect Orientation
A.
B.
23
gene include a 5’ Nhe I site and a 3’ Spe I site (Figures 5 and 6). If the two sites are
ligated together in the 5’ - 3’ orientation, they can no longer be cut in the middle by either
of these restriction enzymes. This allows for identification of clones with the correct
sequence for multiple peptides.
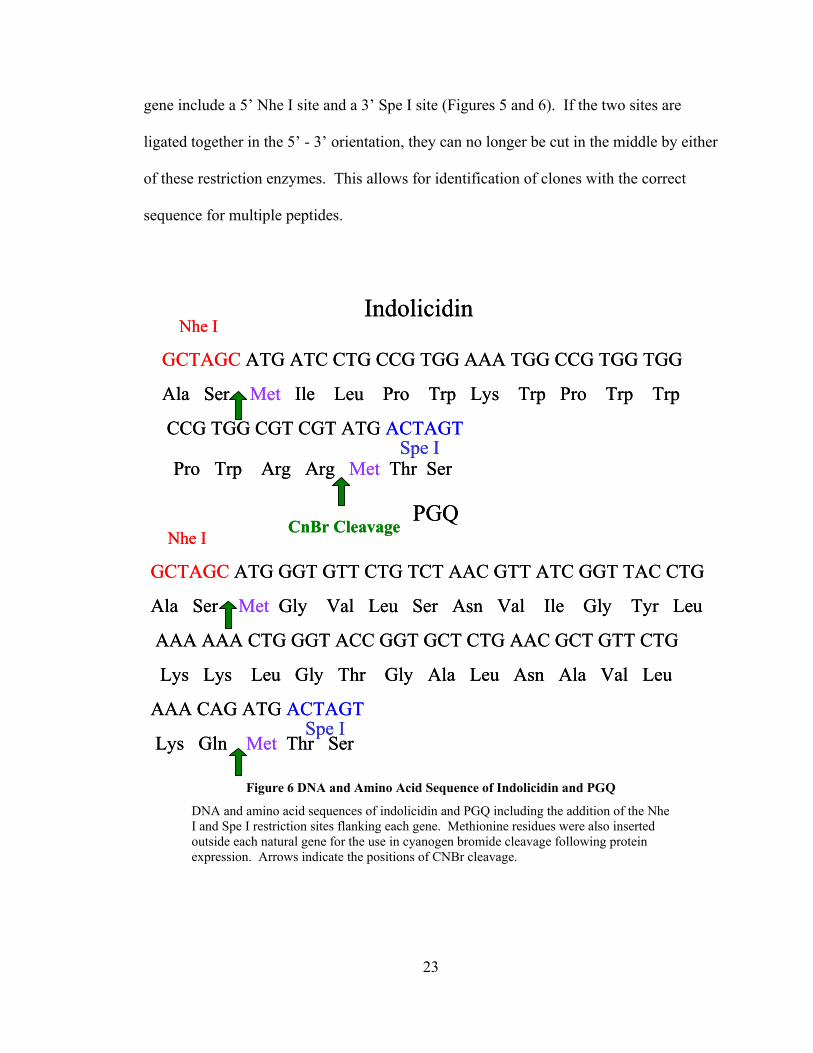
Figure 6 DNA and Amino Acid Sequence of Indolicidin and PGQ
DNA and amino acid sequences of indolicidin and PGQ including the addition of the Nhe I and Spe I restriction sites flanking each gene. Methionine residues were also inserted outside each natural gene for the use in cyanogen bromide cleavage following protein expression. Arrows indicate the positions of CNBr cleavage.
Nhe I
GCTAGC ATG ATC CTG CCG TGG AAA TGG CCG TGG TGG
Ala Ser Met Ile Leu Pro Trp Lys Trp Pro Trp Trp
CCG TGG CGT CGT ATG ACTAGT
Pro Trp Arg Arg Met Thr Ser
Indolicidin
PGQNhe I
GCTAGC ATG GGT GTT CTG TCT AAC GTT ATC GGT TAC CTG
Ala Ser Met Gly Val Leu Ser Asn Val Ile Gly Tyr Leu
AAA AAA CTG GGT ACC GGT GCT CTG AAC GCT GTT CTG
Lys Lys Leu Gly Thr Gly Ala Leu Asn Ala Val Leu
AAA CAG ATG ACTAGT
Lys Gln Met Thr Ser
CnBr Cleavage
Spe I
Spe I
24
Project Goal
The goal of this project was to successfully clone and express two active
antimicrobial peptides, indolicidin and PGQ, in E. coli for mass production at low cost.
Currently antimicrobial peptides are expensive to produce and are only available in small
quantities by extraction from the host organism or by organic peptide synthesis.
Recombinant production should produce peptides in larger quantities at a cheaper cost.
Peptides indolicidin and PGQ were chosen due to their previously shown activities
against Navy solid waste pucks. These pucks harbor microbe growth and cause a foul
odor among Navy ships. A long range goal, outside the scope of this project, is to use
these peptides in food preparation surfaces, antimicrobial textiles for biological agent
decontamination, and extended wear textiles.
25
MATERIALS AND METHODS
Vectors Used
pUC-link
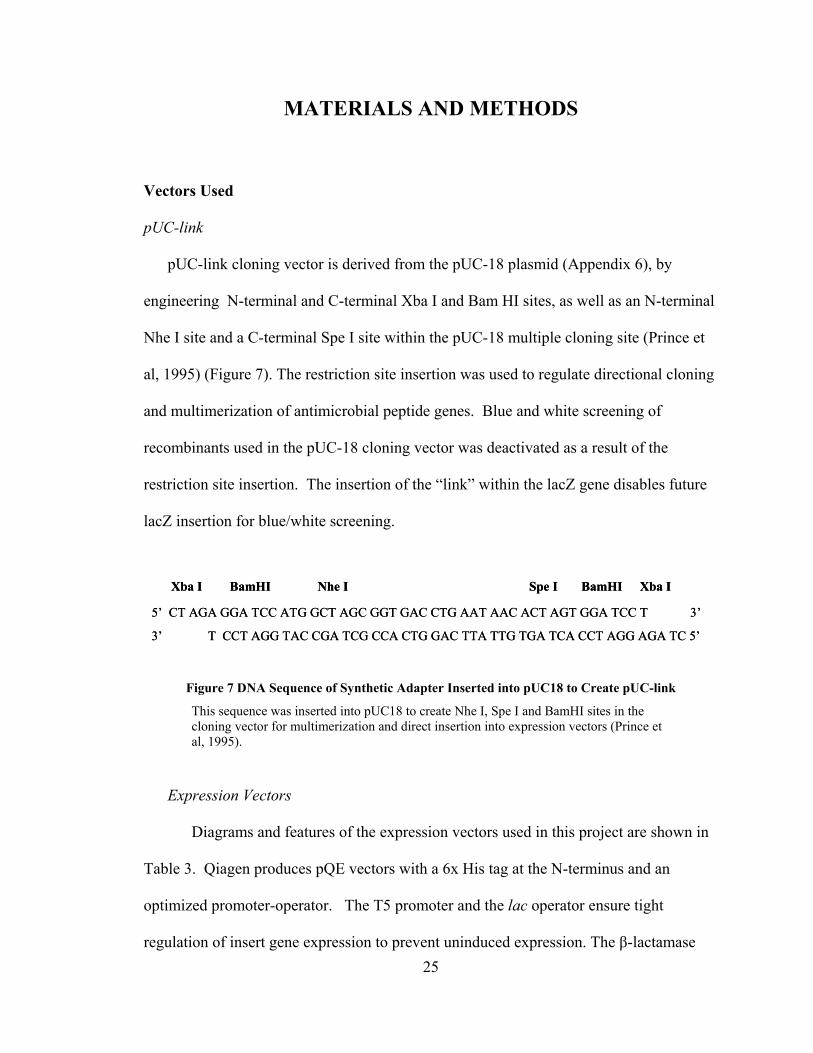
pUC-link cloning vector is derived from the pUC-18 plasmid (Appendix 6), by
engineering N-terminal and C-terminal Xba I and Bam HI sites, as well as an N-terminal
Nhe I site and a C-terminal Spe I site within the pUC-18 multiple cloning site (Prince et
al, 1995) (Figure 7). The restriction site insertion was used to regulate directional cloning
and multimerization of antimicrobial peptide genes. Blue and white screening of
recombinants used in the pUC-18 cloning vector was deactivated as a result of the
restriction site insertion. The insertion of the “link” within the lacZ gene disables future
lacZ insertion for blue/white screening.
Figure 7 DNA Sequence of Synthetic Adapter Inserted into pUC18 to Create pUC-link
This sequence was inserted into pUC18 to create Nhe I, Spe I and BamHI sites in the cloning vector for multimerization and direct insertion into expression vectors (Prince et al, 1995).
Expression Vectors
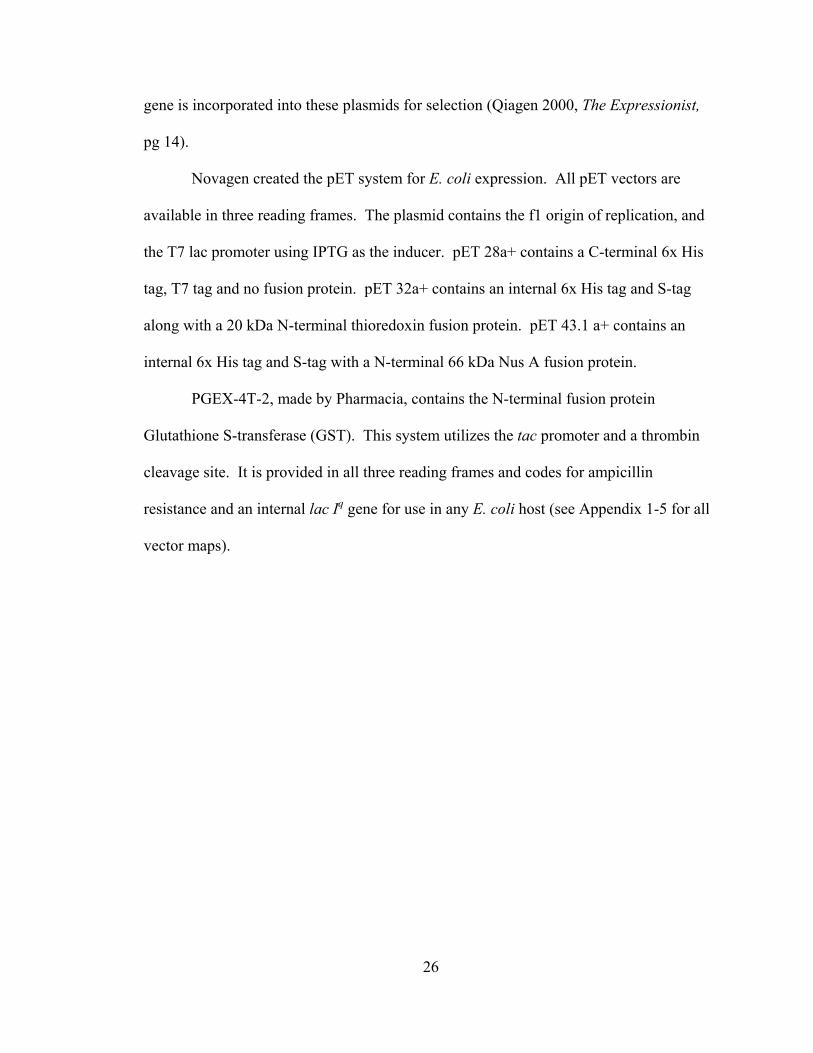
Diagrams and features of the expression vectors used in this project are shown in
Table 3. Qiagen produces pQE vectors with a 6x His tag at the N-terminus and an
optimized promoter-operator. The T5 promoter and the lac operator ensure tight
regulation of insert gene expression to prevent uninduced expression. The β-lactamase
5’ CT AGA GGA TCC ATG GCT AGC GGT GAC CTG AAT AAC ACT AGT GGA TCC T 3’
3’ T CCT AGG TAC CGA TCG CCA CTG GAC TTA TTG TGA TCA CCT AGG AGA TC 5’
Xba I BamHI Nhe I Spe I BamHI Xba I
5’ CT AGA GGA TCC ATG GCT AGC GGT GAC CTG AAT AAC ACT AGT GGA TCC T 3’
3’ T CCT AGG TAC CGA TCG CCA CTG GAC TTA TTG TGA TCA CCT AGG AGA TC 5’
Xba I BamHI Nhe I Spe I BamHI Xba I
26
gene is incorporated into these plasmids for selection (Qiagen 2000, The Expressionist,
pg 14).
Novagen created the pET system for E. coli expression. All pET vectors are
available in three reading frames. The plasmid contains the f1 origin of replication, and
the T7 lac promoter using IPTG as the inducer. pET 28a+ contains a C-terminal 6x His
tag, T7 tag and no fusion protein. pET 32a+ contains an internal 6x His tag and S-tag
along with a 20 kDa N-terminal thioredoxin fusion protein. pET 43.1 a+ contains an
internal 6x His tag and S-tag with a N-terminal 66 kDa Nus A fusion protein.
PGEX-4T-2, made by Pharmacia, contains the N-terminal fusion protein
Glutathione S-transferase (GST). This system utilizes the tac promoter and a thrombin
cleavage site. It is provided in all three reading frames and codes for ampicillin
resistance and an internal lac Iq gene for use in any E. coli host (see Appendix 1-5 for all
vector maps).
27
Table 3 Expression Vectors Used in this Project
E. coli Host Strains Used
Cloning Host Strains
The XL1-Blue cloning host strain contains genomic tetracycline resistance, which
allows selection of only this E. coli strain. This general-purpose propagation host strain
enables reproduction of plasmids containing an ampicillin resistance gene (Table 4).
•No fusion protein•Bam HI site in MCS•No Nhe I or Spe I in vector
•No fusion protein•Contains Nhe I site in vector
•Bam HI site in MCS•No Spe I site in vector•C-terminal and N-terminal 6x his tag
•Lacks T7lac promoter for toxic proteins
•Contains GST fusion protein•BamHI site in MCS•No Nhe I and Spe I sites
•Contains Spe I site in vector•Contains Nus A fusion protein•BamHI site in MCS•No Nhe I sites
•Contains Thioredoxin fusion protein•BamHI site in MCS•No Nhe I or Spe I sites
DisadvantagesAdvantagesVector
6x His Tag
Trx S-tag EK MCS
pET32 a+
Thrombin
GST MCS
pGEX-4T-2
Thrombin
His Tag
NusA S-tag EK MCS
pET43.1 a+
Thrombin
His Tag
pET28 a+
ThrombinHis Tag
T7 tag MCS
6x His Tag MCS
pQE-30
•No fusion protein•Bam HI site in MCS•No Nhe I or Spe I in vector
•No fusion protein•Contains Nhe I site in vector
•Bam HI site in MCS•No Spe I site in vector•C-terminal and N-terminal 6x his tag
•Lacks T7lac promoter for toxic proteins
•Contains GST fusion protein•BamHI site in MCS•No Nhe I and Spe I sites
•Contains Spe I site in vector•Contains Nus A fusion protein•BamHI site in MCS•No Nhe I sites
•Contains Thioredoxin fusion protein•BamHI site in MCS•No Nhe I or Spe I sites
DisadvantagesAdvantagesVector
6x His Tag
Trx S-tag EK MCS
pET32 a+
Thrombin
GST MCS
pGEX-4T-2
Thrombin
His Tag
NusA S-tag EK MCS
pET43.1 a+
ThrombinHis Tag
NusA S-tag EK MCS
pET43.1 a+
Thrombin
His Tag
pET28 a+
ThrombinHis Tag
T7 tag MCS
His Tag
pET28 a+
ThrombinHis Tag
T7 tag MCS
6x His Tag MCS
pQE-30
6x His Tag MCS
pQE-30

28
Host Strains for Expression
Several expression host strains were chosen (Table 4) based on antibiotic
resistance, presence of λDE3 prophage (necessary for expression of T7 RNA polymerase)
and demonstrated expression of antimicrobial peptides (Hwang et al, 2001).
Table 4 E. coli Host Strains
Host Strain Genotype Properties Company
XL1-Blue recA1, endA1, gyrA96, thi-1, hsdR17, supE44, relA1, lac[F’ proAB laclq ∆ZM15 Tn10 (Tetr)]
General purpose cloning host strain
Stratagene
JM109DE3 recA1, endA1, gyrA96, thi, hsdR17, (rk- mk+), supE44, ∆(lac-pproAB), relA1, [F' traD36, proAB+, lacIqZ, ∆M15] DE3
N/A Promega
BL21DE3 Derived from : B-strain, F-, ompT, hsdSb(rb- mb-), gal, dcm (DE3)
General purpose expression host proteolytically deficient
Novagen
HMS174DE3 Derived from: K-12, F-, recA, hsdR(rk12- mk12+), Rifr (DE3)
recA-, K-12 expression host
Novagen
AD494DE3 Derived from: k-12, ∆ara-leu7697, ∆lacX74, ∆phoAPvuII, phoR ∆malF3 F' [lacI+(lacIq)pro] trxB::kan (DE3)
trxB- expression host, allows disulfide bond formation in E. coli cytoplasm
Novagen
NovablueDE3 Derived from: K-12, recA-, endA-, lacIq, gyrA96, relA1, lac [F' proA+B+, lacIqZ∆M15::Tn10(Tcr)trxB::kan (DE3)
recA-, endA-, K-12, lacIq expression host
Novagen
M15[pREP4] and SG13009[pREP4]
Derived from K-12, Nals, Strs, Rifs, Thi-, Lac-, Ara+, Gal+, Mtl-, F-, RecA+, Uvr+, Lon+
Expresses toxic proteins and pQE plasmid proteins
Qiagen
29
Multimerization of Antimicrobial Peptides
For multimerization, the peptide genes were cut out of the cloning vector by
restriction enzyme digestion, ligated to each other and the cloning vector, and
transformed into an appropriate E. coli host for production and analysis.
The subcloning vector, pUC-link, was digested with Nhe I and Spe I by
combining 1 µl of a solution containing 50 mM NaCl, 10 mM Tris-HCl, 10 mM MgCl2, 1
mM dithiothreitol, pH 7.9, 10 µg of pUC-link, 1 µl NheI + Spe I (2:1) and 8 µl of water.
Digestion reactions were incubated at 37 ˚C for 1 hour. Digested DNA was analyzed by
agarose gel containing 0.045 M Tris-borate, 0.001 M EDTA, pH 8.3, and 1.5% agarose at
85 volts for 1 hour. The inserts were multimerized by combining 20 µg of digested
indolicidin or PGQ monomer, 1 µl of T4 DNA ligase (6 units), 1 µl of 50 mM Tris-HCl
pH 7.5, 10 mM MgCl2, 10 mM dithiothreitol, 1 mM ATP, 25 µg/ml bovine serum
albumin, and 8 µl of water and incubating the reaction at 16˚ C for 16 hours. The ligation
was analyzed by 1.5% agarose gel electrophoresis.
Multimerized indolicidin and PGQ inserts and linear vector bands were extracted
from the agarose gel and purified using a Qiagen Gel Extraction Kit. DNA was
quantified in a 1.5% agarose gel compared to phi-X174 DNA marker.
Linear vector was dephosphorylated by combining 10 µg of vector, 1 µl of calf
intestinal alkaline phosphate, 1 µl of 100 mM NaCl, 50 mM Tris-HCl, 10 mM MgCl2, 1
mM dithiothreitol, pH 7.9, 7 µl of water and incubating the reaction mixture at 37˚C for 1
hour, followed by heating at 75ºC for 10 minutes to denature the enzyme. Ethanol
precipitation was then performed to purify the vector for ligation to the insert.

30
The multimerized inserts were ligated to the dephosphorylated cloning vector in
reactions containing 10:1 (insert to vector), 2:1, or no insert control, 1 µl of T4 DNA
ligase, 1 µl of a solution containing 50 mM Tris-HCl pH 7.5, 10 mM MgCl2, 10 mM
dithiothreitol, 1 mM ATP, 25 µg/ml bovine serum albumin, and 8 µl of water. Reactions
were incubated at 16˚ C for 16 hours. Ligated DNA was transformed into XL1-Blue cells
(Stratagene) by adding 50 µl of chemically competent XL1-Blue cells and 2 µl of ligation
reactions 10:1 (insert to vector), 2:1 or no insert control mixture. The cell/plasmid
mixture was held on ice for 30 minutes, 42°C for 90 sec, then on ice for two minutes. An
800 µl aliquot of SOC (20 g tryptone, 5 g yeast extract, 0.5 g NaCl per liter, autoclave,
add 10 µl MgCl2/MgSO4 and 20 µl 20% glucose per ml) was added; the cells were then
placed at 37°C for five minutes, and then incubated in a 37°C shaker at 250 rpm for one
hour. Cells (100 µl) were plated on LB (5 g yeast extract, 10 g NaCl, 10 g peptone, 15 g
agar, per liter water) plates supplemented with 50 µg/ml of carbenicillin and 15 µg/ml of
tetracycline. Plates were incubated at 37°C overnight.
Plasmid Analysis
Several colonies were chosen and innoculated into 4 ml of LB with appropriate
antibiotics. Minicultures were grown overnight in a 37ºC shaker at 250 rpm. The cells
were pelleted at 10,000 x g for 10 minutes at 20˚C, and a Qiagen Mini Prep kit was used
to purify the plasmid. Plasmid DNA was cut with Bam HI to determine if an insert was
present. The restriction digestion was done using 1 µl Bam HI (2 units), 5 µl DNA, 1 µl
Bam HI Buffer (150 mM NaCl, 10 mM Tris-HCl, 10 mM MgCl2, 1 mM dithiothreitol,
pH 7.9, 100 µg/ml BSA), and 3 µl water. The reaction was incubated at 37°C for one
31
hour. The digestion mixture was run on a 4-12% polyacrylamide gel (Novex) in TBE
(10.8 g Tris base, 5.5 g Boric acid, 0.58 g EDTA, add water to 1 L and pH to 8.3) buffer
at 200V for 30 minutes, placed in 10 µg/ml ethidium bromide for 10 minutes and
photographed on a UV light box.
The colonies that contained insert were digested to determine if the correct
orientation for transcription of the multimerized insert was produced. This was done by
digesting the recombinant vector with both Nhe I and Spe I. If an insert is in the correct
orientation, then a band would be observed on the gel at the same size as the insert found
previously with Bam HI digestion. If the insert was not in the correct orientation, then
the band on an agarose gel would run corresponding to the size of the monomeric gene
size.
All clones with the correct orientation were then sent to the Cornell DNA
Sequencing Facility where they were sequenced using an Applied Biosystems Automated
3700 DNA Analyzer with Big Dye Terminator chemistry and AmpliTaq-FS DNA
Polymerase. Sequences were analyzed with DNA Star software.
Transfer of Insert from pUC-link into Expression Vector
After the insert in pUC-link was determined to be correct by DNA sequencing, it
was then subcloned in the expression vector. pUC-link was designed to have a Bam HI
site outside the Nhe I and Spe I restriction sites (Figure 7). The pUC-Amp clone and the
expression vector were separately digested with Bam HI. The expression vector was
subsequently dephosphorylated to prevent self-ligation. The insert and dephosphorylated
vector were then ligated using T4 DNA ligase (New England Biolabs) and transformed
32
into XL1-Blue cells for propagation. After performing a mini-prep isolation of plasmid
DNA, restriction digestion with Bam HI, Nhe I, and Spe I, and agarose gel
electrophoresis confirmed the presence of an insert.
In vitro Transcription/Translation
In order to test each expression vector/multimerized insert combination for
expression, an in vitro transcription/translation method was initially used (Promega). The
reactions contained 4 µg of purified expression plasmid containing the AMP insert, 5 µl
of minus methionine and minus leucine amino acid mixture to obtain all amino acids, 20
µl of S30 Premix without amino acids, and 15 µl of T7 S30 circular DNA extract in a
total volume of 50 µl. The tubes were vortexed and centrifuged for 10 sec at 12,000 x g
at 20˚C to settle reagents. 1 µl of Transcend biotinylated lysine tRNA (Promega) was
added and samples were incubated at 37°C for 1 hour. Samples were then placed on ice
for 5 minutes to stop the reaction. An aliquot containing 1/10 of the total volume was
removed from the reaction and added to 20 µl acetone and incubated on ice for 15
minutes to precipitate the protein. The samples were spun at 12,000 x g at 20˚C in a
microcentrifuge for 5 minutes and the supernatant was removed and discarded. To
remove the remaining acetone, the samples were lyophilized for 5 minutes. 20 µl 2X
SDS sample buffer was added to the lyophilized protein and run on a 10%
polyacrylamide gel with 12.1 g/L Tris Base, 17.9 g/L Tricine, 1 g/L SDS running buffer.
Proteins were transferred electrophoretically to a PVDF membrane at 2 mA/cm2 for 1.5
hours using 25 mM Tris base, 150 mM glycine, 10% methanol, pH 8.3 transfer buffer
and detected using streptavidin-alkaline phosphatase conjugate that detects the
33
biotinylated lysine residues. The membrane was washed for 1 minute in 10 ml of TBS
(20 mM Tris-HCL pH 7.5, 150 mM NaCl) at room temperature, then blocked in 25 ml of
TBS + 0.5% Tween 20 for 1 hour. The membrane was incubated for 1 hour in 10 ml of
TBS + 0.5% Tween 20 and 2 µl streptavidin–alkaline phosphatase (2 mg/ml) to detect the
biotinylated lysine incorporated into the protein. The membrane was washed 4X with 25
ml of TBS + 0.5% Tween 20 and color developed using alkaline phosphatase
development. 60 µl of 5% nitro blue tetrazolium chloride in 70% dimethylformamide,
and 60 µl of 5% 5-bromo-4 chloro-3-indolyl phosphate in 100% dimethylformamide
were added to 15 ml of 100 mM Tris-Cl, pH 9.5, mM NaCl, 5 mM MgCl2. They were
incubated with membrane at room temperature for 5 minutes until color developed. To
stop the reaction, the membrane was washed in 10 ml of water and dried.
In vivo Expression of Peptide
Small Scale Expression
Using those constructs that showed expression of the peptide after in vitro
transcription/translation, a small-scale expression was performed based on The
Expressionist method (Qiagen). The expression vector and insert were transformed into
M15, SG13009, BL21DE3, BL21DE3pLysS, AD494DE3, HMS174DE3, NovablueDE3,
or JM109DE3 cells and plated with appropriate antibiotics. 3 ml of LB with appropriate
antibiotics was inoculated with colonies selected from transformation plates. These were
grown at 37°C in a shaker at 250 rpm until reading an OD600 of 0.6 was reached. A 60 ml
culture of LB with antibiotics was inoculated with an aliquot of the overnight culture and
grown at 37°C in a shaker at 250 rpm until the OD600 read 0.5-0.7. Also, 500 µl of the
34
starter culture was added to 500 µl of 50% glycerol and placed at -80°C for storage.
When the culture reached mid log phase, 20 ml was removed as uninduced control and
the OD600 was taken. This uninduced control sample was spun at 10,000 x g for 10 min
at 4˚C in a centrifuge to pellet the cells. The supernatant was removed by aspiration, and
the pellet placed at -20°C for storage. The remaining culture was induced to a 1 mM
final concentration (40 µl) of IPTG and placed back in 37°C shaker at 250 rpm for 3
hours. 20 ml samples were taken out at 1.5 hrs and 3 hrs and the OD600 was taken. They
were pelleted at 10,000 x g for 10 min at 4˚C and the supernatant was aspirated off. The
pellet was placed in -20°C until the samples were ready for lysis.
The uninduced control and induced samples were removed from the -20°C
freezer. An amount of Buffer A (6 M Guanidine, 100 mM NaH2SO4, 10 mM Tris pH 8)
determined by 0.7 mls/OD600 was added to the pellet to normalize the sample protein
concentrations. They were vortexed until the entire cell pellet was in solution. All
samples were centrifuged at 15,000 x g for 20 minutes at 4˚C to pellet cell debris, and
supernatant was removed to a fresh tube.
Each construct and host strain lysate was analysed by western blot to determine
which host strain had the largest yield. The samples were run on 4-12 % SDS-PAGE and
blotted electrophoretically using semi-dry transfer in 25 mM Bicine, 25 mM Bis-Tris,
1.025 mM EDTA, and 0.05 mM Chlorobutanol onto PVDF membrane at 2 mA/cm2 for
1.5 hours. The membrane was removed from the apparatus and placed into 25 ml of 10
mM Tris-Cl pH 8, 150 mM NaCl (TBS), 0.1% Tween 20, and 1% Gelatin for 15 minutes
at room temperature. The buffer was removed and incubated in antibody for the S-tag
conjugated with alkaline phosphatase (Novagen). 10 mls of TBS + 0.1% Tween 20 and
35
1/10,000 antibody was incubated with the membrane at room temperature for 15 minutes.
The membrane was washed four times with 25 ml of TBS + 0.1% Tween 20. Alkaline
phosphatase detection was performed as stated above.
The samples with the greatest yield were nickel purified to extract only the
product of interest from the cell lysis. This was done by adding 100 µl of 50 % Ni/NTA
resin equilibrated in Buffer B (8 M Urea, 100 mM NaH2PO4, 10 mM Tris pH 8) to 400 µl
sample and placing it on a rocker for 1 hr at room temperature. The nickel resin was then
added to a 10 cm tall column with a diameter of 1 cm. The flow through was collected in
a 1.5 ml microfuge tube. The nickel was then washed with 25 x resin bed volume (1250
µl) Buffer C (8 M Urea, 100 mM NaH2SO4, 10 mM Tris pH 6.3). The wash samples
were collected in 1.5 ml microfuge tubes, and A280 was taken in a spectrophotometer until
the fraction reached A280 ~0.01. The protein of interest was eluted with 3 column
volumes of Buffer E (8 M Urea, 100 mM NaH2SO4, 10 mM Tris pH 4.5) in a 1.5 ml
microfuge tube. The eluted sample was then analyzed by SDS-PAGE.
Large Scale Expression and Purification
Once the construct and host strain with the highest expression yield were chosen,
a larger scale expression culture was performed. A 3 ml starter culture of LB with
appropriate antibiotics was inoculated with the glycerol stock of the bacteria with
construct. This was grown for 8 hrs in 37°C until the OD600 reached 0.6. One liter of LB
with appropriate antibiotics was then inoculated with the 3 ml starter culture and grown
to an OD600 of 0.6. A 20 ml sample was removed for the uninduced control and pelleted
at 10,000 x g for 10 minutes at 4˚C. The culture was induced with IPTG at a final 1 mM
36
concentration. This was grown for 3 hours at 37°C in a shaking incubator at 250 rpm.
The cells were harvested in 250 ml Oakridge tubes and centrifuged for 10 min at 10,000
x g at 4˚C. The supernatant was removed and the pellet was placed at -20°C.
The cell pellet was thawed and lysed at a volume 1/50 of culture volume with a
solution containing 6 M guanidine chloride (GuCl), 100 mM sodium phosphate
(NaH2PO4), 10 mM Tris pH 8.0. The pellet was resuspended by vortexing, and pelleted
at 15,000 x g for 20 minutes at 4˚C. The supernatant was removed and placed into a new
tube.
The lysate was purified using a 12.5 cm high x 1.5 cm diameter nickel resin
column. The 16 ml of lysate was bound to 4 ml of a 50% slurry of nickel resin
equilibrated in 8 M urea, 100 mM NaH2PO4, 10 mM Tris base, pH 8.0. This optimum
lysate:resin ratio was determined by testing volume ratios of 1:1 lysate to resin, 2:1, 4:1
and 10:1. A ratio of 4:1 was able to bind all available protein and elute the most purified
sample. The bound resin/lysate mixture was added to the column after mixing for 1 hour
at room temperature. 2 x 16 ml of wash buffer (8 M urea, 100 mM NaH2PO4, 10 mM
Tris base pH 6.3) was placed over the packed column and collected in 1.5 ml tubes. The
absorbance at 280 nm was monitored to determine when all of the unbound protein was
washed off. To elute, 6 ml 8 M urea, 100 mM NaH2PO4, 10 mM Tris pH 4.5 was placed
over the column and collected. Two more elutions were performed using 2 ml elution
buffer. The lysate, flow through, final wash sample, and all the elution samples were
then analyzed by SDS-PAGE.
37
BCA Protein Assay
Following purification, a BCA protein assay was performed to determine the
concentration of the purified protein. 2 ml cuvettes were filled with 100 µl of sample and
2 ml of a 1:50 ratio of reagent A (4% cupric sulfate) and reagent B (sodium carbonate,
sodium bicarbonate, bicinchoninic acid, sodium tartrate in 0.1 M sodium hydroxide) from
Pierce were added. Bovine serum albumin was used as a standard. 50 µl of purified
protein was placed in a cuvette with 50 µl water and mixed. Then 2 ml BCA solution
was added and incubated at 37°C for 30 minutes. Absorbance at 562 nm was read and
the results of the standards were plotted using Excel.
Densitometry was performed following the BCA using SDS-PAGE to determine the
percentage of each band within a given sample. Total Lab software was used for these
calculations. The amount in each band was calculated based on the total protein amount
loaded per lane and the percentage of each band run on SDS-PAGE.
Cyanogen Bromide Cleavage of Purified Product
Once nickel purification was completed and the concentration of the products was
determined, cyanogen bromide (CNBr) cleavage was performed. The purified sample
was first dialyzed to remove urea from the elution buffer. The sample was placed in
12,000-14,000 MW dialysis tubing 1.6 mm in diameter, and dialyzed against 50 volumes
of 100 mM NaH2PO4 + 10 mM Tris pH 7.4 for 1 hr, and then the buffer was changed.
This was repeated twice and the final buffer exchange equilibrated overnight. The sample
in the dialysis tubing was removed and placed in a 1.5 ml tube. The tube was centrifuged
at 12,000 x g for 10 minutes at 20˚C and the supernatant removed. An aliquot of the
38
supernatant was run on a 4-12% Bis-Tris NuPAGE Gel for analysis. The insoluble pellet
was dissolved in 50 µl of 50 mg/ml CNBr + 70% formic acid. The sample tube was
wrapped in aluminum foil and placed on a rocker for 24 hours. To halt cleavage, the
sample was placed in a speed-vac to remove CNBr and formic acid for 30 minutes.
The CNBr treated sample pellet was solubilized in 400 µl of 10% acetonitrile and
clarified by centrifugation at 12,000 x g for 10 minutes at 20˚C and the supernate
removed. Both the supernatant and insoluble pellet was run on SDS-PAGE for analysis.
Densitometry was performed on the soluble fraction using Total Lab software. The
percentage of monomeric peptide in the sample was calculated based on the number and
intensity of bands. A BCA was performed to determine the concentration of total protein
produced upon CNBr cleavage.
Amino Acid Analysis
Multimerized and CNBr cleaved Ind3 was sent to Commonwealth
Biotechnologies for Amino Acid Analysis. 10 µg of peptide was run on an 4-12 % SDS-
PAGE gel and blotted onto 0.45 µm PVDF membrane using a semi-dry blotting
apparatus and 1X NuPAGE transfer buffer (20 mM Bicine, 25 mM Bis-Tris, 4.1 mM
EDTA, 0.2 mM Chlorobutanol pH 7.2) for 1.5 hours at 2 mA/cm2. The membrane was
stained with 40% Methanol, 0.2% Coomassie Brilliant blue R-250 for 20 minutes and
destained in 100% Methanol. The bands were excised and placed in a 1.5 ml tube and
100 µl 100% Methanol was added to completely destain the bands. The membranes were
placed in the speed vacuum for 5 minutes to dry. They were sent to Commonwealth
Biotechnologies where the membrane pieces were weighed, cut into small pieces and
39
transferred into pyrolyzed tubes. The samples were hydrolyzed in gas phase 6 N HCl for
90 minutes at 150ºC. Following hydrolysis the samples were taken to dryness, and the
amino acids present were extracted in 100 µl of 40% Methanol, 0.1 N HCl in HPLC
water overnight with occasional vortexing. The extract was combined with a 50 µl rinse
of the tube containing the hydrolyzed sample. The extract was taken to dryness,
dissolved in 75 µl of sample loading buffer, and 5 µl of the undiluted sample was
subjected to analysis.
The pmol amount of each amino acid determined by Commonwealth
Biotechnologies was compared to the expected composition of the peptide based on the
amino acid sequence. This was performed on an Excel spreadsheet.
Antimicrobial Activity
E. coli 0157, E. coli 45827, S. aureus, S. typhimurium, S. epidermidis, and
bacteria cultured from Navy food pucks, were all tested for antimicrobial growth
inhibition by indolicidin and PGQ purchased from Sigma. A plate overlay was
performed using MH agar plates (8.75 g acid hydrolysate of casein, 1 g beef extract, 0.75
g starch, 10 g NaCl, 7 g Noble agar, H2O to 500 ml and autoclave) and M9 agar plates
(M9 salts 10X = 15 g Na2HPO4, 7.5 g KH2PO4, 1.2 g NaCl, 2.5 g NH4Cl, H2O to 250 ml.
Add 20 ml M9 salts, 3g Bacto agar and 175 ml of H2O and autoclave). Media was cooled
to 55-60ºC and 0.2 ml of 1 M MgSO4, 2 ml of 10 mM CaCl2, 2 ml of 20% glucose, 0.2
ml of 10 mg/ml thiamine and sterile H2O were added to 200 ml) and poured into plates.
Sigma peptide dissolved to a concentration of 0.5 mg/ml in water was spotted onto a plate
in amounts of 5, 10, and 25 µg for each bacterium. 7 ml of top agar (same recipe as
40
plates with ½ the amount of agar) was autoclaved for 1 minute to melt the agar and
cooled to 60ºC. 70 µl of an overnight culture of each strain was placed in the top agar,
vortexed and poured over the plate. The agar was allowed to dry and plates were placed
in 37ºC incubator overnight.
The CNBr cleaved sample was tested for activity after determination of monomer
concentration by BCA and densitometry. The cleaved sample was placed in the speed
vac to concentrate it in order to load 25 µg of peptide monomer on the test plate. 20 µl of
peptide solution was spotted onto an MH agar plate along with 20 µl of 10% acetonitrile
and 20 µl containing 10 µg of indolicidin from Sigma. 70 µl of an overnight culture of
Navy puck bacteria was placed in 7 ml of MH top agar after cooling to 60ºC. The top
agar was poured over the plate and allowed to cool. The plate was placed at 37ºC
overnight to form a lawn of bacteria and analyzed for zones of clearing.
41
RESULTS
The goal of this project was to successfully clone and express two antimicrobial
peptides, indolicidin and PGQ in E. coli for mass production at low cost. These peptides
will then be used in food preparation surfaces, antimicrobial textiles for biological agent
decontamination, and extended wear textiles.
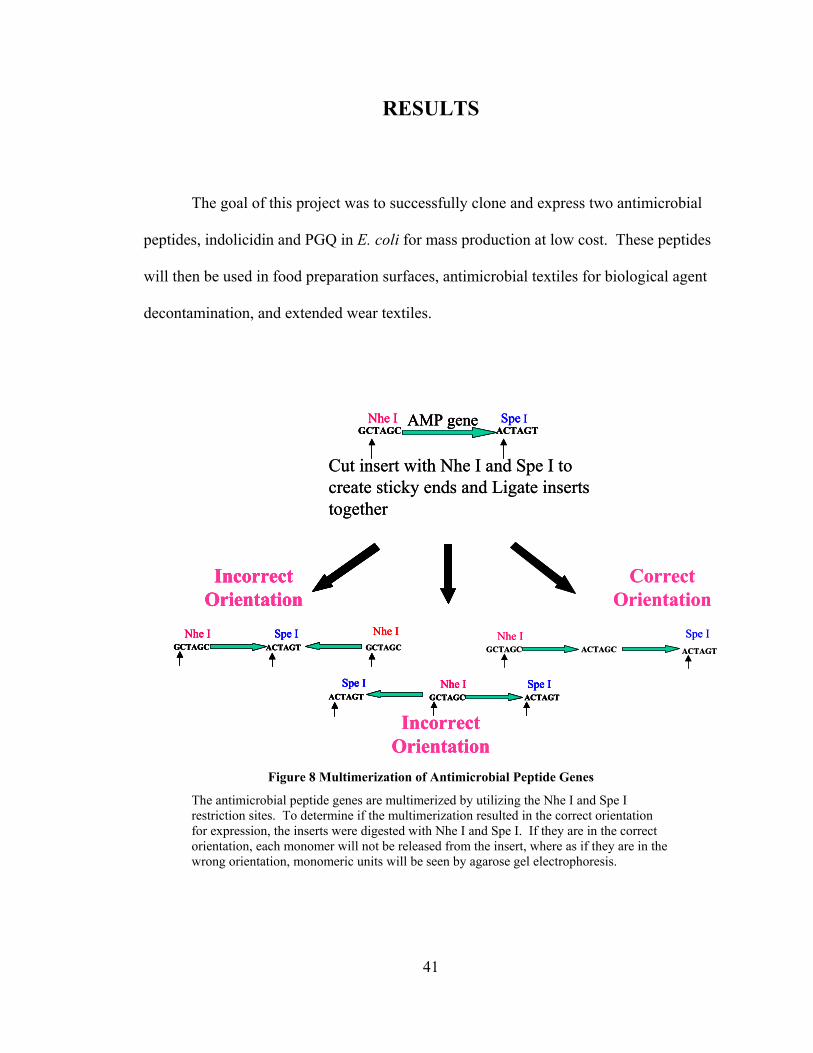
Figure 8 Multimerization of Antimicrobial Peptide Genes
The antimicrobial peptide genes are multimerized by utilizing the Nhe I and Spe I restriction sites. To determine if the multimerization resulted in the correct orientation for expression, the inserts were digested with Nhe I and Spe I. If they are in the correct orientation, each monomer will not be released from the insert, where as if they are in the wrong orientation, monomeric units will be seen by agarose gel electrophoresis.
GCTAGC ACTAGTNhe I Spe IAMP gene
Cut insert with Nhe I and Spe I to create sticky ends and Ligate inserts together
GCTAGC ACTAGCNhe I
ACTAGT
Spe I
Correct Orientation
GCTAGC
Nhe IGCTAGC
Nhe IACTAGT
Spe I
Incorrect Orientation
GCTAGC ACTAGTNhe I Spe I
ACTAGTSpe I
Incorrect Orientation
GCTAGC ACTAGTNhe I Spe IAMP gene
GCTAGC ACTAGTNhe I Spe IAMP gene
Cut insert with Nhe I and Spe I to create sticky ends and Ligate inserts together
GCTAGC ACTAGCNhe I
ACTAGT
Spe I
Correct Orientation
GCTAGC
Nhe IGCTAGC
Nhe IACTAGT
Spe I
Incorrect Orientation
GCTAGC
Nhe IGCTAGC
Nhe IACTAGT
Spe I
Incorrect Orientation
GCTAGCNhe I
ACTAGTSpe I
Incorrect Orientation
GCTAGC ACTAGTNhe I Spe I
ACTAGTSpe I
Incorrect Orientation
GCTAGC ACTAGTNhe I Spe I
ACTAGTSpe I
GCTAGC ACTAGTNhe I Spe I
ACTAGTSpe I
Incorrect Orientation
42
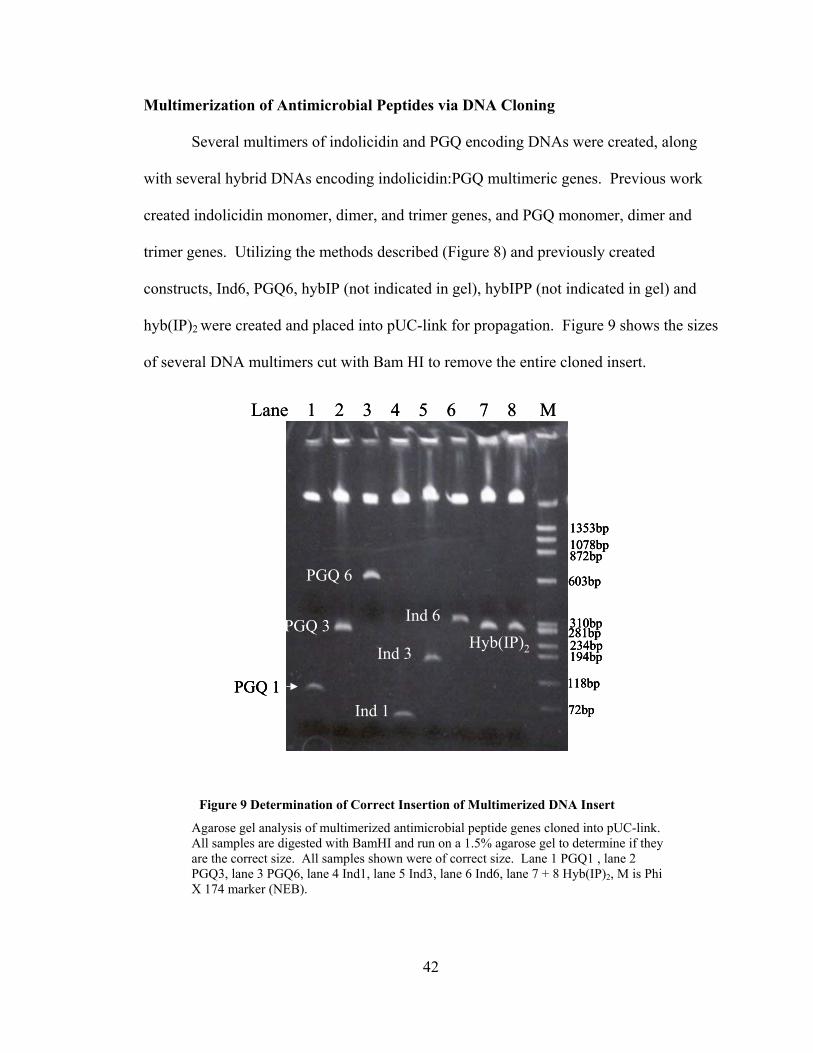
Multimerization of Antimicrobial Peptides via DNA Cloning
Several multimers of indolicidin and PGQ encoding DNAs were created, along
with several hybrid DNAs encoding indolicidin:PGQ multimeric genes. Previous work
created indolicidin monomer, dimer, and trimer genes, and PGQ monomer, dimer and
trimer genes. Utilizing the methods described (Figure 8) and previously created
constructs, Ind6, PGQ6, hybIP (not indicated in gel), hybIPP (not indicated in gel) and
hyb(IP)2 were created and placed into pUC-link for propagation. Figure 9 shows the sizes
of several DNA multimers cut with Bam HI to remove the entire cloned insert.
Figure 9 Determination of Correct Insertion of Multimerized DNA Insert
Agarose gel analysis of multimerized antimicrobial peptide genes cloned into pUC-link. All samples are digested with BamHI and run on a 1.5% agarose gel to determine if they are the correct size. All samples shown were of correct size. Lane 1 PGQ1 , lane 2 PGQ3, lane 3 PGQ6, lane 4 Ind1, lane 5 Ind3, lane 6 Ind6, lane 7 + 8 Hyb(IP)2, M is Phi X 174 marker (NEB).
PGQ 1
PGQ 3
PGQ 6
Ind 1
Ind 3
Ind 6Hyb(IP)2
1078bp
310bp
234bp
118bp
72bp
872bp
194bp
1353bp
603bp
281bp
Lane 1 2 3 4 5 6 7 8 M
PGQ 1
PGQ 3
PGQ 6
Ind 1
Ind 3
Ind 6Hyb(IP)2
1078bp
310bp
234bp
118bp
72bp
872bp
194bp
1353bp
603bp
281bp
PGQ 1
PGQ 3
PGQ 6
Ind 1
Ind 3
Ind 6Hyb(IP)2
1078bp
310bp
234bp
118bp
72bp
872bp
194bp
1353bp
603bp
281bp
Lane 1 2 3 4 5 6 7 8 M
43
Cornell DNA Sequencing Results
Following insert size verification of each plasmid construct (Figure 9),
sequencing was performed to determine if the gene contained any mutations. The inserts
were also sequenced again after placement of the peptide-coding insert into the
expression vector (Figure 10) to verify that the DNA was in the correct reading frame.
The results were analyzed with DNA Star software. All sequences conformed to the
expected outcome (See Appendix 7-13).
Expression in pQE-30
Small-scale in vivo expression (inducing a small culture of cells using IPTG) (Figure 10)
was used to determine if the plasmids encoding multimerized antimicrobial peptides were
expressed in both M15 and SG13009 cells. Expression was tested with pQE-30:PGQ3
(trimer), which should produce a 12 kDa protein. The plasmid pQE-40 containing a
dihydrofolate reductase gene (DHFR 26 kDa) was used as a positive expression control.
Figure 11 represents an SDS-PAGE depicting the expression levels of DHFR and PQE-
30:PGQ3. Under induction conditions, even in the complex mixture, DHFR can be seen
above all other background proteins (lanes 3,8,9). However, no evidence of 12 kDa
PGQ3 expression was obtained in this expression system (lanes 6, 7, 11, 12). Expression
was tested with pQE-This small-scale expression of pQE-30:PGQ3 was performed
multiple times with the same negative result (Figures 11 + 12). Both cell lysate (Figure
11) and nickel purified samples (Figure 12) were run on SDS-page gels to determine if
PGQ3 was expressed. Only the induced positive control showed a band around 26 kDa.
44
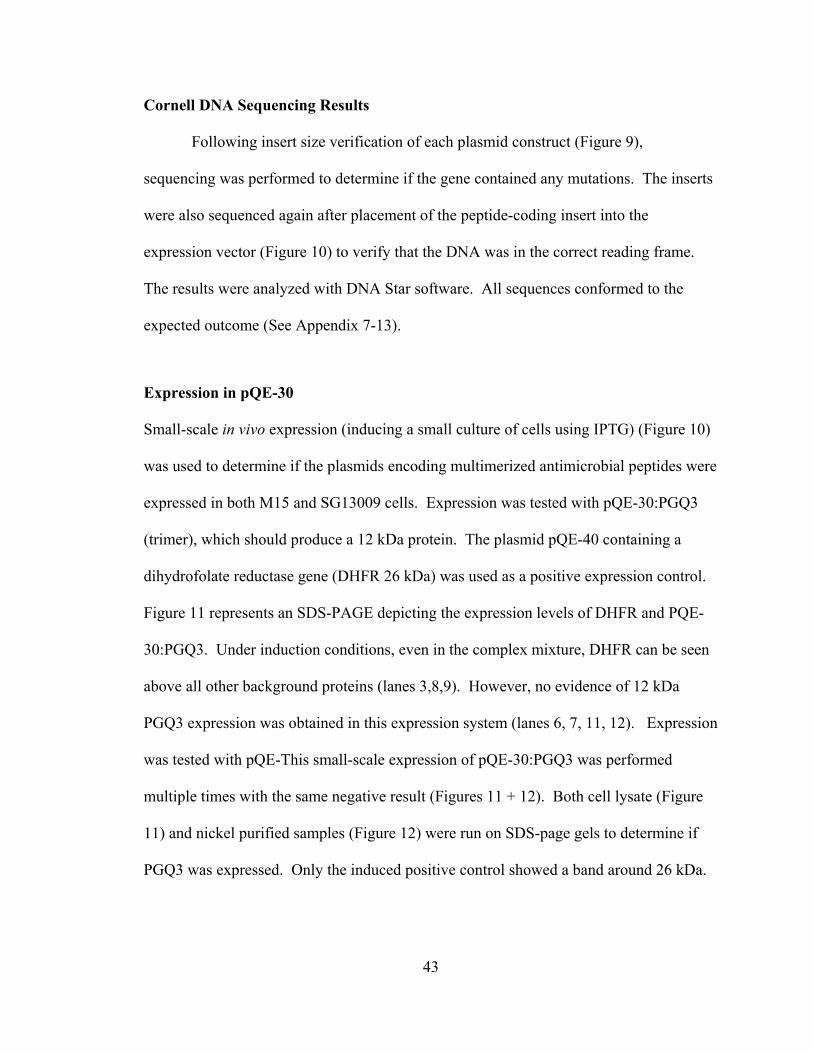
Figure 10 Cloning and Expression of Multimerized Antimicrobial Peptide Genes in E. coli
After creation of AMP multimer gene, it was inserted into pUC-link and propagated. Inserts found to be in the correct orientation were extracted by BamHI digestion and inserted into an expression vector. It was then transformed into an expression host strain and expression was induced with IPTG to produce the recombinant multimerized peptide. The multimeric peptide was cleaved with cyanogen bromide to created monomeric peptide.
BamHI
pUC-LINK2728 bp
NheI
SpeI
BamHI +AMP Multimer
BamHI
BamHIpUC-AMP
Digest withBamHI
Expression Vector
Amp
r
Ori
3-Frame STOP
ATGBamHI
BamHIExpression Vector + AMPAm
pr
Ori
3-Frame STOP
ATG
1) Transform E. coli
2) Induce expression with IPTG
Recombinant AMP Active AMP
CNBr Cleavage
BamHI
pUC-LINK2728 bp
NheI
SpeI
BamHIpUC-LINK2728 bp
NheI
SpeI
BamHI +AMP Multimer
BamHI
BamHIpUC-AMP
Digest withBamHI
BamHI
BamHIpUC-AMP
Digest withBamHI
Expression Vector
Amp
r
Ori
3-Frame STOP
ATGBamHI
BamHIExpression Vector + AMPAm
pr
Ori
3-Frame STOP
ATG
1) Transform E. coli
2) Induce expression with IPTG
Recombinant AMP Active AMP
CNBr Cleavage
45
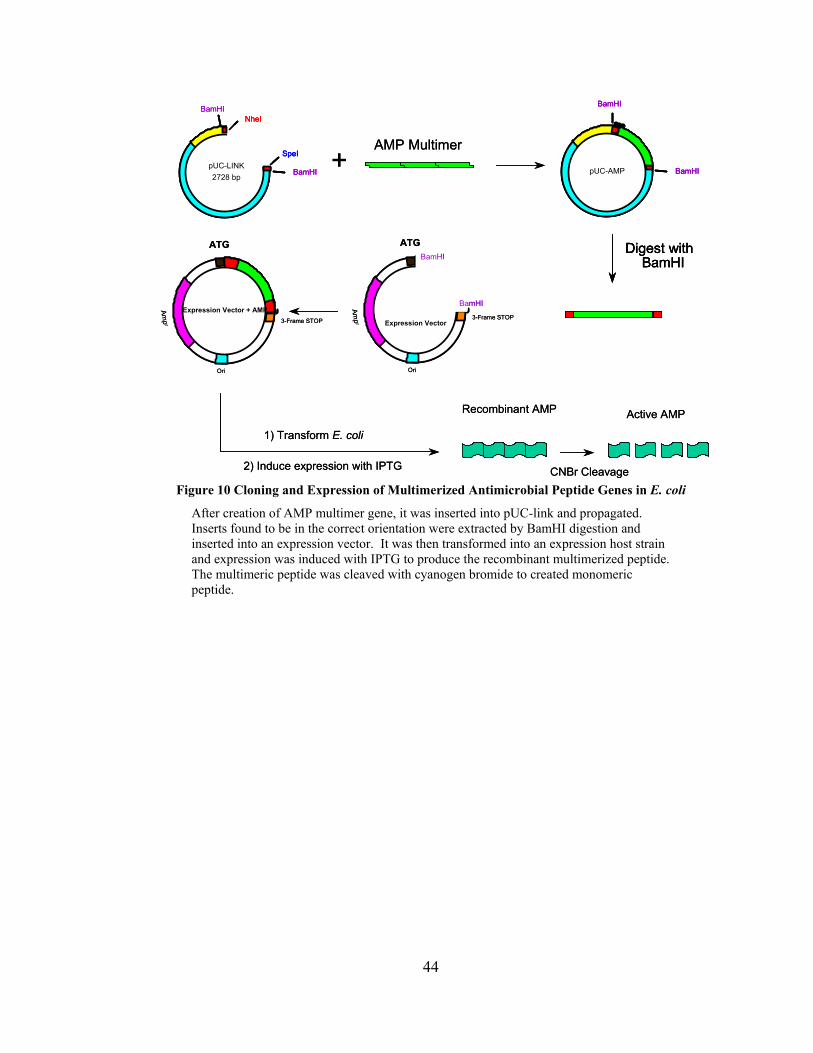
Figure 11 SDS-PAGE Analysis of Cell Lysates
Cell lysates of small-scale expression of pQE-30 with PGQ 3 insert in host strains SG13009 and M15 induced and uninduced samples. Only expression of the positive control pQE-40 with DHFR protein was observed. No expression of PGQ 3 was seen. M = mark-12 molecular weight marker; lane 2 uninduced SG13009 pQE-40; lane 3 induced SG13009 pQE-40; lane 4 uninduced SG 13009 pQE-40; lane 5 uninduced SG13009 pQE-30:PGQ3; lane 6 induced SG13009 pQE-30:PGQ3; lane 7 induced SG13009 pQE-30:PGQ3; lane 8 induced M15 pQE-40; lane 9 induced M15 pQE-40; lane 10 uninduced M15 pQE-30:PGQ3; lane 11 induced M15 pQE-30;PGQ3; lane 12 induced M15 pQE-30:PGQ3.
DHFR (26 kDa)
PGQ3+ control + control PGQ3
SG13009 M15
Lane M 2 3 4 5 6 7 8 9 10 11 12
31 kDa36.5 kDa
21kDa
14 kDa
6 kDa
3.5 kDa
66.3 kDa55.4 kDa
0 + 0 0 + + + + 0 + + Induction
DHFR (26 kDa)
PGQ3+ control + control PGQ3
SG13009 M15
PGQ3+ control + control PGQ3
SG13009 M15
Lane M 2 3 4 5 6 7 8 9 10 11 12
31 kDa36.5 kDa
21kDa
14 kDa
6 kDa
3.5 kDa
66.3 kDa55.4 kDa
0 + 0 0 + + + + 0 + + Induction
46
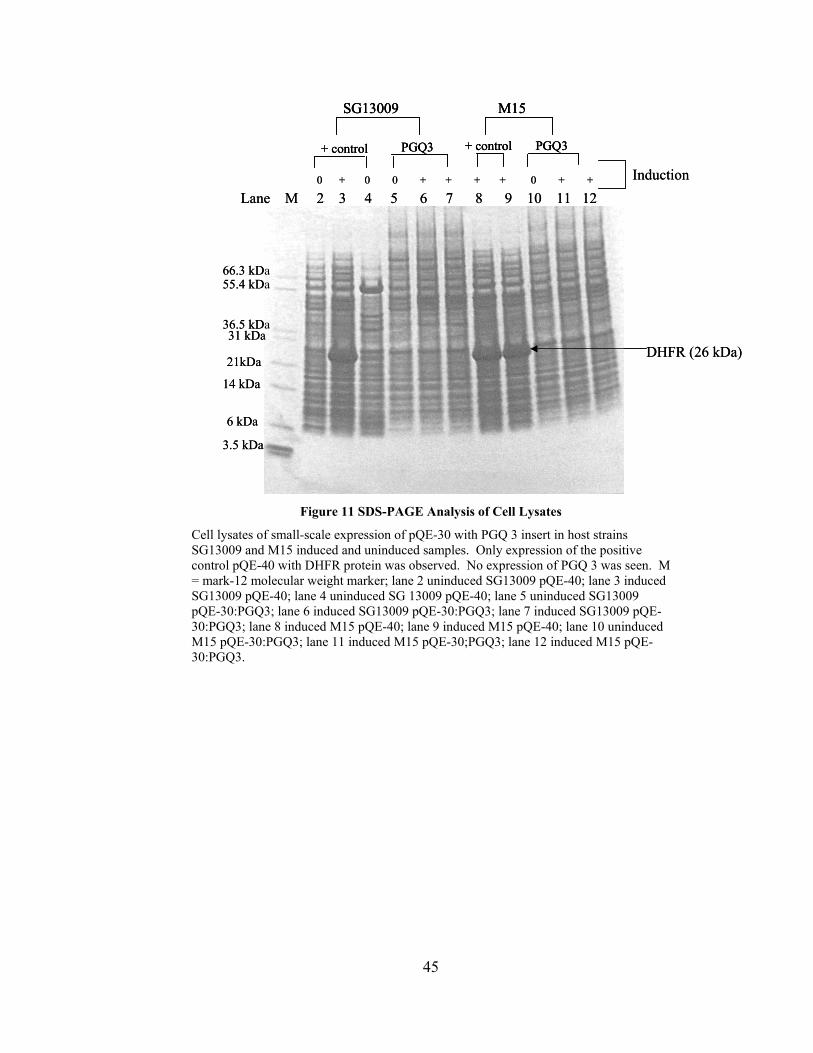
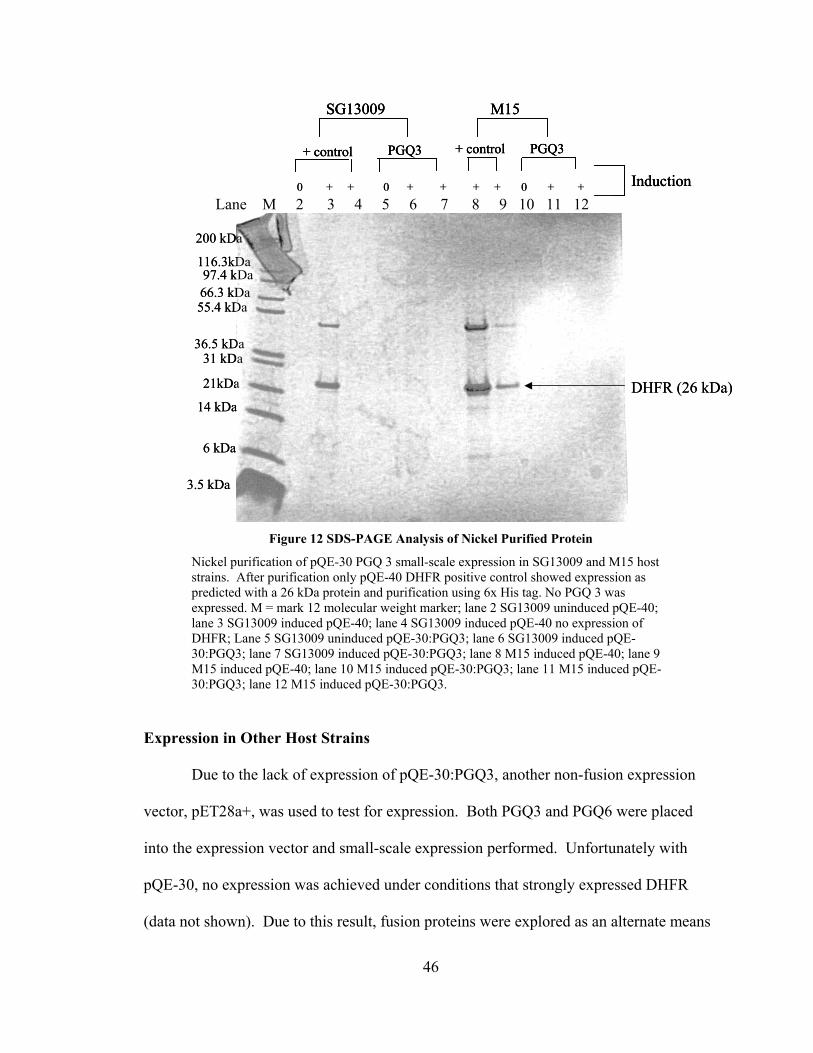
Figure 12 SDS-PAGE Analysis of Nickel Purified Protein
Nickel purification of pQE-30 PGQ 3 small-scale expression in SG13009 and M15 host strains. After purification only pQE-40 DHFR positive control showed expression as predicted with a 26 kDa protein and purification using 6x His tag. No PGQ 3 was expressed. M = mark 12 molecular weight marker; lane 2 SG13009 uninduced pQE-40; lane 3 SG13009 induced pQE-40; lane 4 SG13009 induced pQE-40 no expression of DHFR; Lane 5 SG13009 uninduced pQE-30:PGQ3; lane 6 SG13009 induced pQE-30:PGQ3; lane 7 SG13009 induced pQE-30:PGQ3; lane 8 M15 induced pQE-40; lane 9 M15 induced pQE-40; lane 10 M15 induced pQE-30:PGQ3; lane 11 M15 induced pQE-30:PGQ3; lane 12 M15 induced pQE-30:PGQ3.
Expression in Other Host Strains
Due to the lack of expression of pQE-30:PGQ3, another non-fusion expression
vector, pET28a+, was used to test for expression. Both PGQ3 and PGQ6 were placed
into the expression vector and small-scale expression performed. Unfortunately with
pQE-30, no expression was achieved under conditions that strongly expressed DHFR
(data not shown). Due to this result, fusion proteins were explored as an alternate means
Lane M 2 3 4 5 6 7 8 9 10 11 12
DHFR (26 kDa)
PGQ3+ control + control PGQ3
SG13009 M15
200 kDa
31 kDa36.5 kDa
21kDa
14 kDa
6 kDa
3.5 kDa
116.3kDa97.4 kDa66.3 kDa55.4 kDa
0 + + 0 + + + + 0 + + InductionLane M 2 3 4 5 6 7 8 9 10 11 12
DHFR (26 kDa)
PGQ3+ control + control PGQ3
SG13009 M15
PGQ3+ control + control PGQ3
SG13009 M15
200 kDa
31 kDa36.5 kDa
21kDa
14 kDa
6 kDa
3.5 kDa
116.3kDa97.4 kDa66.3 kDa55.4 kDa
0 + + 0 + + + + 0 + + InductionInduction
47
of expression based on data from peer-reviewed journals. Several fusion protein
expression vectors were available that should produce peptide in the correct reading
frame. These vectors included pET32a+ with a thioredoxin fusion, pET43.1a+ with a
NusA fusion, and pGEX-4T-2 containing a GST fusion. Due to the large number of
multimerized inserts created and the variety of vectors available, it was decided to
perform in vitro transcription/translation to quickly determine which expression vectors
produce the recombinant peptide.
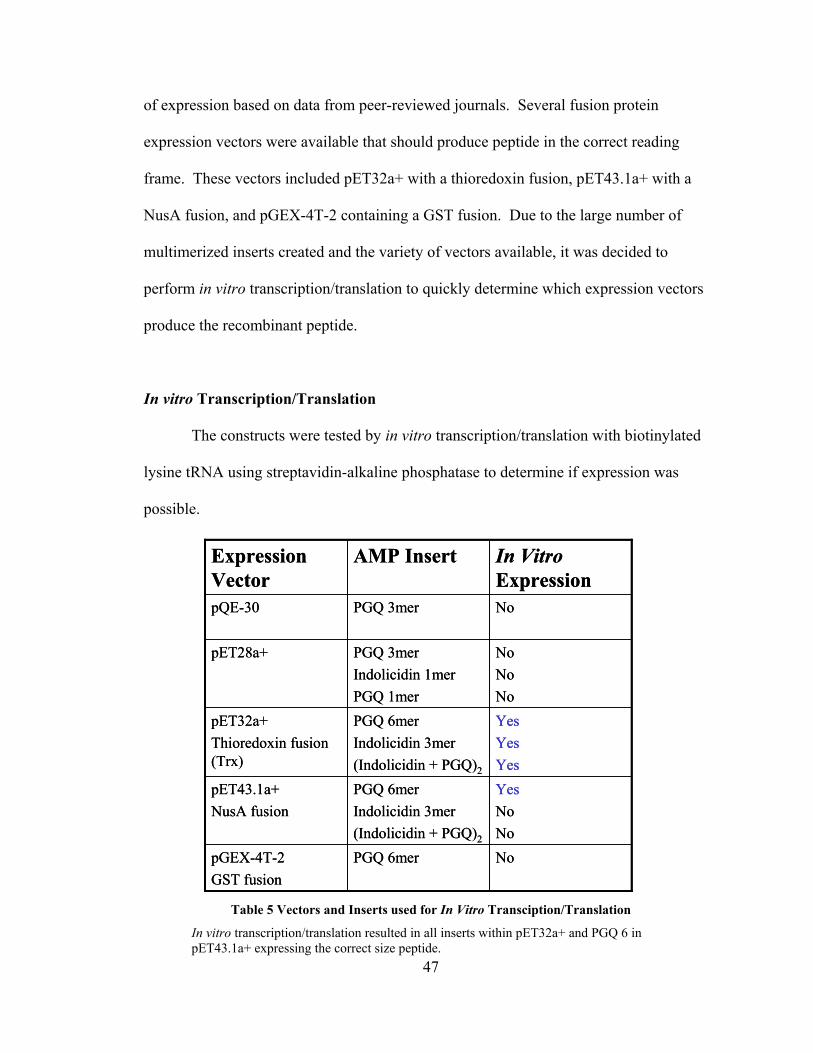
In vitro Transcription/Translation
The constructs were tested by in vitro transcription/translation with biotinylated
lysine tRNA using streptavidin-alkaline phosphatase to determine if expression was
possible.
Table 5 Vectors and Inserts used for In Vitro Transciption/Translation
In vitro transcription/translation resulted in all inserts within pET32a+ and PGQ 6 in pET43.1a+ expressing the correct size peptide.
NoPGQ 6merpGEX-4T-2GST fusion
YesNoNo
PGQ 6merIndolicidin 3mer(Indolicidin + PGQ)2
pET43.1a+NusA fusion
YesYesYes
PGQ 6merIndolicidin 3mer(Indolicidin + PGQ)2
pET32a+Thioredoxin fusion (Trx)
NoNoNo
PGQ 3merIndolicidin 1merPGQ 1mer
pET28a+
NoPGQ 3merpQE-30
In VitroExpression
AMP InsertExpression Vector
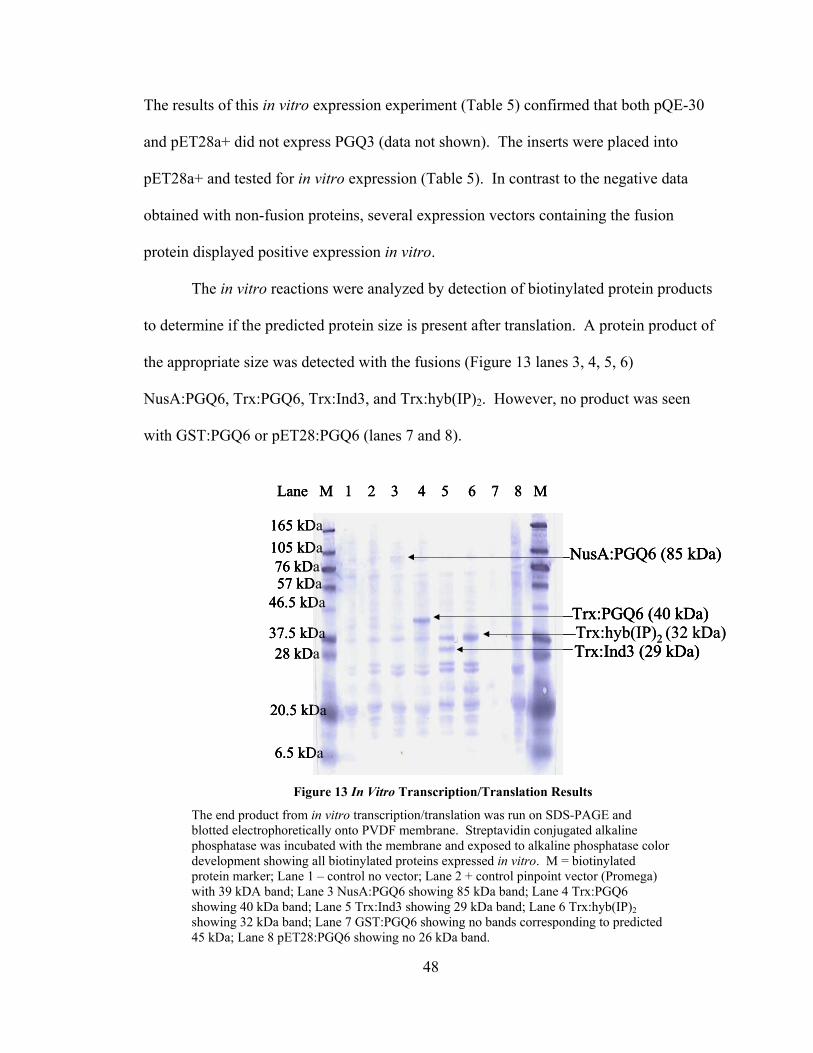
48
The results of this in vitro expression experiment (Table 5) confirmed that both pQE-30
and pET28a+ did not express PGQ3 (data not shown). The inserts were placed into
pET28a+ and tested for in vitro expression (Table 5). In contrast to the negative data
obtained with non-fusion proteins, several expression vectors containing the fusion
protein displayed positive expression in vitro.
The in vitro reactions were analyzed by detection of biotinylated protein products
to determine if the predicted protein size is present after translation. A protein product of
the appropriate size was detected with the fusions (Figure 13 lanes 3, 4, 5, 6)
NusA:PGQ6, Trx:PGQ6, Trx:Ind3, and Trx:hyb(IP)2. However, no product was seen
with GST:PGQ6 or pET28:PGQ6 (lanes 7 and 8).
Figure 13 In Vitro Transcription/Translation Results
The end product from in vitro transcription/translation was run on SDS-PAGE and blotted electrophoretically onto PVDF membrane. Streptavidin conjugated alkaline phosphatase was incubated with the membrane and exposed to alkaline phosphatase color development showing all biotinylated proteins expressed in vitro. M = biotinylated protein marker; Lane 1 – control no vector; Lane 2 + control pinpoint vector (Promega) with 39 kDA band; Lane 3 NusA:PGQ6 showing 85 kDa band; Lane 4 Trx:PGQ6 showing 40 kDa band; Lane 5 Trx:Ind3 showing 29 kDa band; Lane 6 Trx:hyb(IP)2 showing 32 kDa band; Lane 7 GST:PGQ6 showing no bands corresponding to predicted 45 kDa; Lane 8 pET28:PGQ6 showing no 26 kDa band.
Trx:hyb(IP)2 (32 kDa)Trx:Ind3 (29 kDa)
Lane M 1 2 3 4 5 6 7 8 M
105 kDa
37.5 kDa
46.5 kDa
NusA:PGQ6 (85 kDa)
Trx:PGQ6 (40 kDa)
28 kDa
20.5 kDa
6.5 kDa
57 kDa76 kDa
165 kDa
Trx:hyb(IP)2 (32 kDa)Trx:Ind3 (29 kDa)
Lane M 1 2 3 4 5 6 7 8 M
105 kDa
37.5 kDa
46.5 kDa
NusA:PGQ6 (85 kDa)
Trx:PGQ6 (40 kDa)
28 kDa
20.5 kDa
6.5 kDa
57 kDa76 kDa
165 kDa
Trx:Ind3 (29 kDa)
Lane M 1 2 3 4 5 6 7 8 M
105 kDa
37.5 kDa
46.5 kDa
NusA:PGQ6 (85 kDa)
Trx:PGQ6 (40 kDa)
28 kDa
20.5 kDa
6.5 kDa
57 kDa76 kDa
165 kDa
49
In vivo Expression in Different Host Strains
The vectors demonstrating positive in vitro expression were transformed into
several E. coli host strains to evaluate in vivo expression levels. The host strains were
chosen based on vector compatibility, proteolytic deficiency, and citations in peer-
reviewed journals. Five host strains were chosen and compared by small-scale
expression and western blots. For comparison, (Figures 14-17) the amount of lysate
loaded on SDS-PAGE were normalized based on optical density at each sample
collection. All constructs contained an S-tag for antibody and alkaline phosphatase
detection. The results in Figures 14-17 show that BL21DE3 (lanes 2 & 3) and
AD494DE3 (lane 4 & 5) show the greatest expression yield. All host strains expressed
the antimicrobial gene, but some weren’t as efficient as others. Ultimately BL21DE3 and
AD494DE3 were chosen to carry on further experiments with purification of the protein
based on the intensity of the western blot bands including NusA:PGQ6, Trx:Ind3, and
Trx:(IP)2.
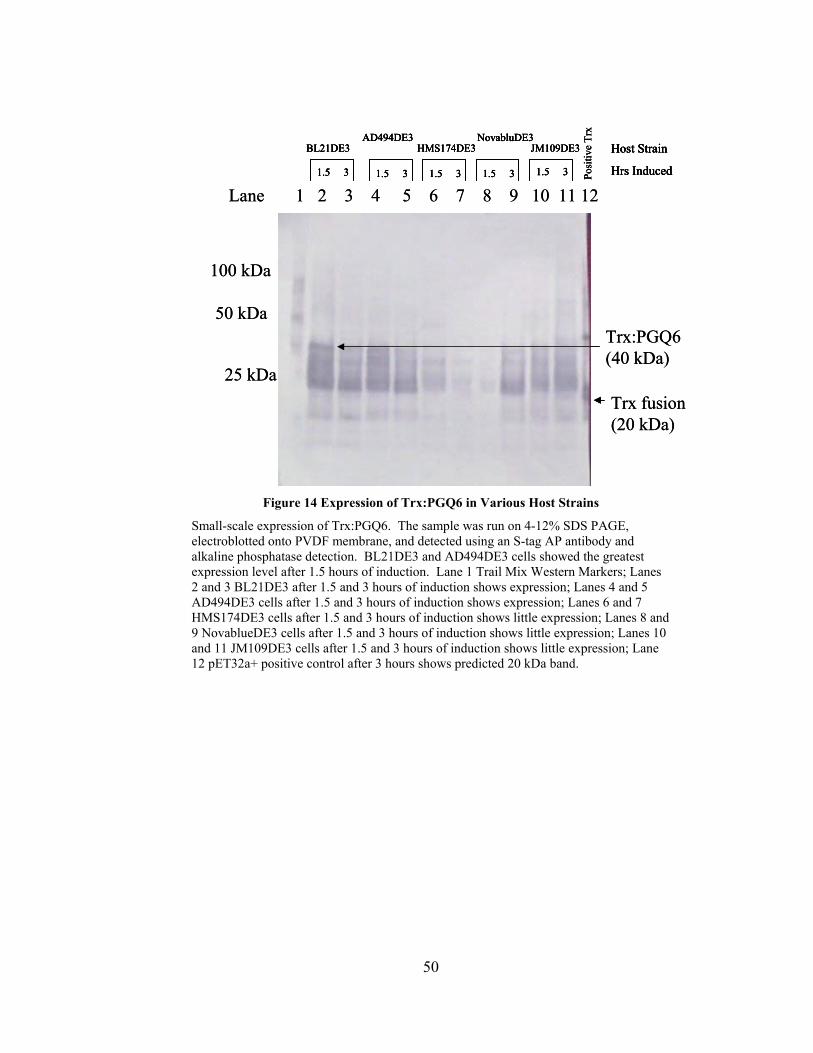
50
Figure 14 Expression of Trx:PGQ6 in Various Host Strains
Small-scale expression of Trx:PGQ6. The sample was run on 4-12% SDS PAGE, electroblotted onto PVDF membrane, and detected using an S-tag AP antibody and alkaline phosphatase detection. BL21DE3 and AD494DE3 cells showed the greatest expression level after 1.5 hours of induction. Lane 1 Trail Mix Western Markers; Lanes 2 and 3 BL21DE3 after 1.5 and 3 hours of induction shows expression; Lanes 4 and 5 AD494DE3 cells after 1.5 and 3 hours of induction shows expression; Lanes 6 and 7 HMS174DE3 cells after 1.5 and 3 hours of induction shows little expression; Lanes 8 and 9 NovablueDE3 cells after 1.5 and 3 hours of induction shows little expression; Lanes 10 and 11 JM109DE3 cells after 1.5 and 3 hours of induction shows little expression; Lane 12 pET32a+ positive control after 3 hours shows predicted 20 kDa band.
Lane 1 2 3 4 5 6 7 8 9 10 11 12
100 kDa
50 kDa
25 kDaTrx fusion (20 kDa)
Trx:PGQ6 (40 kDa)
Posi
tive
Trx
BL21DE3AD494DE3
HMS174DE3NovabluDE3
JM109DE3
1.5 3 1.5 3 1.5 3 1.5 31.5 3
Host Strain
Hrs Induced
Lane 1 2 3 4 5 6 7 8 9 10 11 12
100 kDa
50 kDa
25 kDaTrx fusion (20 kDa)
Trx:PGQ6 (40 kDa)
Posi
tive
Trx
BL21DE3AD494DE3
HMS174DE3NovabluDE3
JM109DE3
1.5 3 1.5 3 1.5 3 1.5 31.5 3
Host Strain
Hrs InducedPosi
tive
Trx
BL21DE3AD494DE3
HMS174DE3NovabluDE3
JM109DE3
1.5 3 1.5 3 1.5 3 1.5 31.5 3
Host Strain
Hrs Induced
BL21DE3AD494DE3
HMS174DE3NovabluDE3
JM109DE3
1.5 3 1.5 3 1.5 3 1.5 31.5 3
Host Strain
Hrs Induced
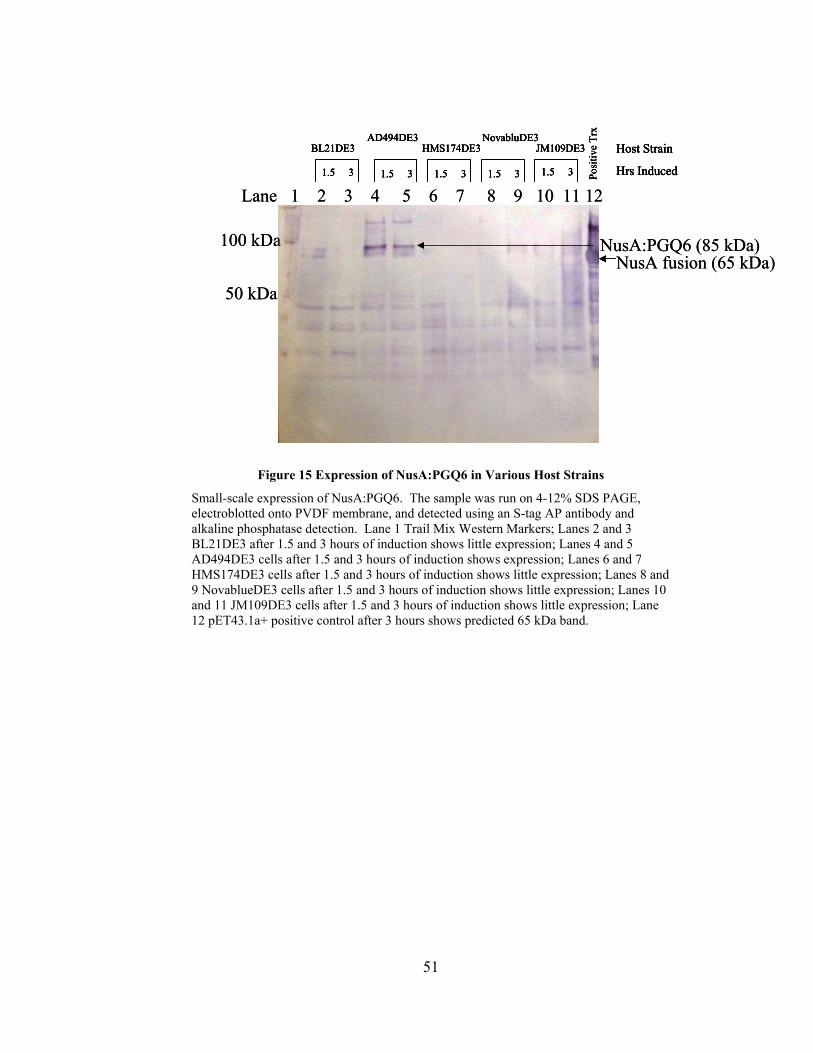
51
Figure 15 Expression of NusA:PGQ6 in Various Host Strains
Small-scale expression of NusA:PGQ6. The sample was run on 4-12% SDS PAGE, electroblotted onto PVDF membrane, and detected using an S-tag AP antibody and alkaline phosphatase detection. Lane 1 Trail Mix Western Markers; Lanes 2 and 3 BL21DE3 after 1.5 and 3 hours of induction shows little expression; Lanes 4 and 5 AD494DE3 cells after 1.5 and 3 hours of induction shows expression; Lanes 6 and 7 HMS174DE3 cells after 1.5 and 3 hours of induction shows little expression; Lanes 8 and 9 NovablueDE3 cells after 1.5 and 3 hours of induction shows little expression; Lanes 10 and 11 JM109DE3 cells after 1.5 and 3 hours of induction shows little expression; Lane 12 pET43.1a+ positive control after 3 hours shows predicted 65 kDa band.
100 kDa
50 kDa
NusA:PGQ6 (85 kDa)NusA fusion (65 kDa)
Lane 1 2 3 4 5 6 7 8 9 10 11 12
Posi
tive
Trx
BL21DE3AD494DE3
HMS174DE3NovabluDE3
JM109DE3
1.5 3 1.5 3 1.5 3 1.5 31.5 3
Host Strain
Hrs Induced
100 kDa
50 kDa
NusA:PGQ6 (85 kDa)NusA fusion (65 kDa)
Lane 1 2 3 4 5 6 7 8 9 10 11 12
Posi
tive
Trx
BL21DE3AD494DE3
HMS174DE3NovabluDE3
JM109DE3
1.5 3 1.5 3 1.5 3 1.5 31.5 3
Host Strain
Hrs InducedPosi
tive
Trx
BL21DE3AD494DE3
HMS174DE3NovabluDE3
JM109DE3
1.5 3 1.5 3 1.5 3 1.5 31.5 3
Host Strain
Hrs Induced
BL21DE3AD494DE3
HMS174DE3NovabluDE3
JM109DE3
1.5 3 1.5 3 1.5 3 1.5 31.5 3
Host Strain
Hrs Induced
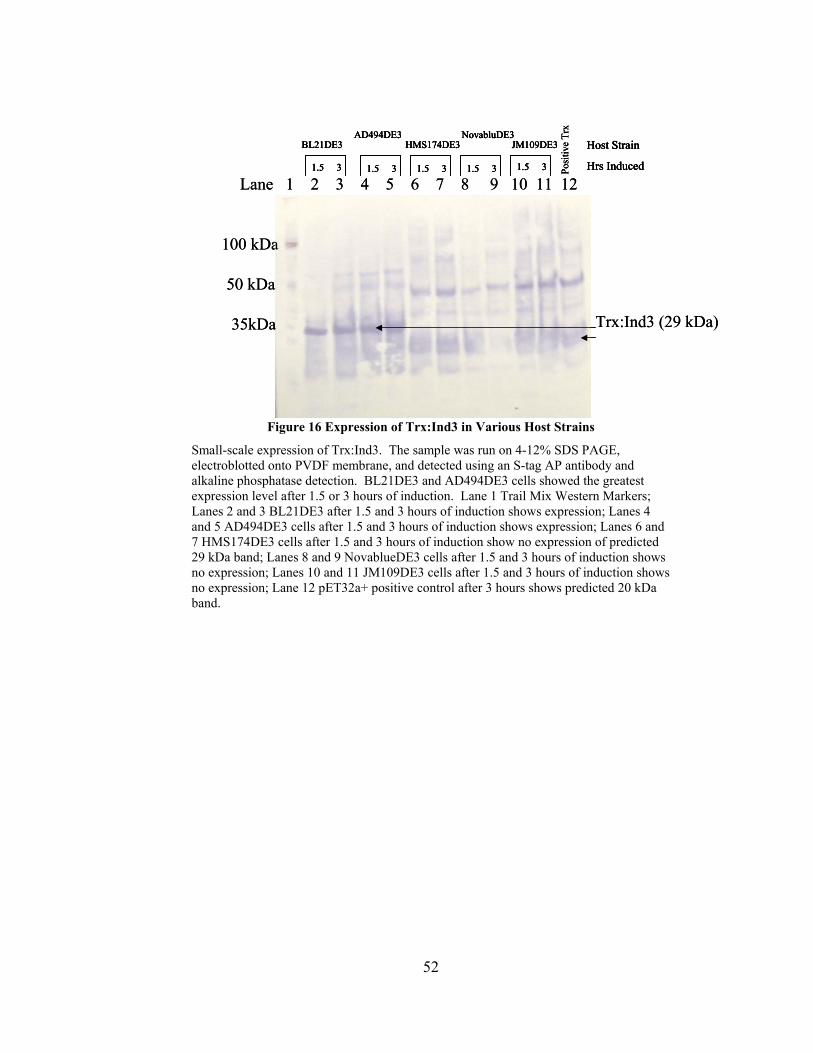
52
Figure 16 Expression of Trx:Ind3 in Various Host Strains
Small-scale expression of Trx:Ind3. The sample was run on 4-12% SDS PAGE, electroblotted onto PVDF membrane, and detected using an S-tag AP antibody and alkaline phosphatase detection. BL21DE3 and AD494DE3 cells showed the greatest expression level after 1.5 or 3 hours of induction. Lane 1 Trail Mix Western Markers; Lanes 2 and 3 BL21DE3 after 1.5 and 3 hours of induction shows expression; Lanes 4 and 5 AD494DE3 cells after 1.5 and 3 hours of induction shows expression; Lanes 6 and 7 HMS174DE3 cells after 1.5 and 3 hours of induction show no expression of predicted 29 kDa band; Lanes 8 and 9 NovablueDE3 cells after 1.5 and 3 hours of induction shows no expression; Lanes 10 and 11 JM109DE3 cells after 1.5 and 3 hours of induction shows no expression; Lane 12 pET32a+ positive control after 3 hours shows predicted 20 kDa band.
100 kDa
50 kDa
35kDa Trx:Ind3 (29 kDa)
Lane 1 2 3 4 5 6 7 8 9 10 11 12
Posi
tive
Trx
BL21DE3AD494DE3
HMS174DE3NovabluDE3
JM109DE3
1.5 3 1.5 3 1.5 3 1.5 31.5 3
Host Strain
Hrs Induced
100 kDa
50 kDa
35kDa Trx:Ind3 (29 kDa)
Lane 1 2 3 4 5 6 7 8 9 10 11 12
Posi
tive
Trx
BL21DE3AD494DE3
HMS174DE3NovabluDE3
JM109DE3
1.5 3 1.5 3 1.5 3 1.5 31.5 3
Host Strain
Hrs InducedPosi
tive
Trx
BL21DE3AD494DE3
HMS174DE3NovabluDE3
JM109DE3
1.5 3 1.5 3 1.5 3 1.5 31.5 3
Host Strain
Hrs Induced
BL21DE3AD494DE3
HMS174DE3NovabluDE3
JM109DE3
1.5 3 1.5 3 1.5 3 1.5 31.5 3
Host Strain
Hrs Induced
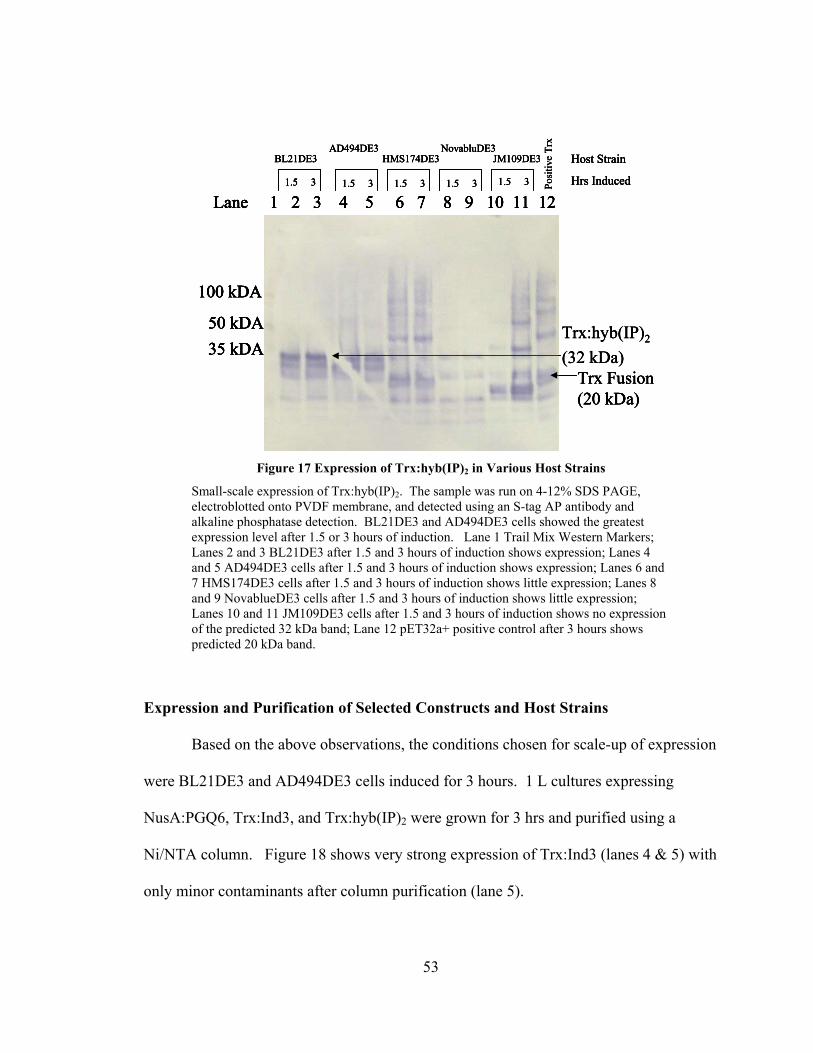
53
Figure 17 Expression of Trx:hyb(IP)2 in Various Host Strains
Small-scale expression of Trx:hyb(IP)2. The sample was run on 4-12% SDS PAGE, electroblotted onto PVDF membrane, and detected using an S-tag AP antibody and alkaline phosphatase detection. BL21DE3 and AD494DE3 cells showed the greatest expression level after 1.5 or 3 hours of induction. Lane 1 Trail Mix Western Markers; Lanes 2 and 3 BL21DE3 after 1.5 and 3 hours of induction shows expression; Lanes 4 and 5 AD494DE3 cells after 1.5 and 3 hours of induction shows expression; Lanes 6 and 7 HMS174DE3 cells after 1.5 and 3 hours of induction shows little expression; Lanes 8 and 9 NovablueDE3 cells after 1.5 and 3 hours of induction shows little expression; Lanes 10 and 11 JM109DE3 cells after 1.5 and 3 hours of induction shows no expression of the predicted 32 kDa band; Lane 12 pET32a+ positive control after 3 hours shows predicted 20 kDa band.
Expression and Purification of Selected Constructs and Host Strains
Based on the above observations, the conditions chosen for scale-up of expression
were BL21DE3 and AD494DE3 cells induced for 3 hours. 1 L cultures expressing
NusA:PGQ6, Trx:Ind3, and Trx:hyb(IP)2 were grown for 3 hrs and purified using a
Ni/NTA column. Figure 18 shows very strong expression of Trx:Ind3 (lanes 4 & 5) with
only minor contaminants after column purification (lane 5).
Trx:hyb(IP)2
(32 kDa)
Lane 1 2 3 4 5 6 7 8 9 10 11 12
100 kDA
50 kDA35 kDA
Trx Fusion (20 kDa)
Posi
tive
Trx
BL21DE3AD494DE3
HMS174DE3NovabluDE3
JM109DE3
1.5 3 1.5 3 1.5 3 1.5 31.5 3
Host Strain
Hrs Induced
Trx:hyb(IP)2
(32 kDa)
Lane 1 2 3 4 5 6 7 8 9 10 11 12
100 kDA
50 kDA35 kDA
Trx Fusion (20 kDa)
Trx:hyb(IP)2
(32 kDa)
Lane 1 2 3 4 5 6 7 8 9 10 11 12
100 kDA
50 kDA35 kDA
Trx Fusion (20 kDa)
Lane 1 2 3 4 5 6 7 8 9 10 11 12
100 kDA
50 kDA35 kDA
Lane 1 2 3 4 5 6 7 8 9 10 11 12
100 kDA
50 kDA35 kDA
Trx Fusion (20 kDa)
Posi
tive
Trx
BL21DE3AD494DE3
HMS174DE3NovabluDE3
JM109DE3
1.5 3 1.5 3 1.5 3 1.5 31.5 3
Host Strain
Hrs InducedPosi
tive
Trx
BL21DE3AD494DE3
HMS174DE3NovabluDE3
JM109DE3
1.5 3 1.5 3 1.5 3 1.5 31.5 3
Host Strain
Hrs Induced
BL21DE3AD494DE3
HMS174DE3NovabluDE3
JM109DE3
1.5 3 1.5 3 1.5 3 1.5 31.5 3
Host Strain
Hrs Induced
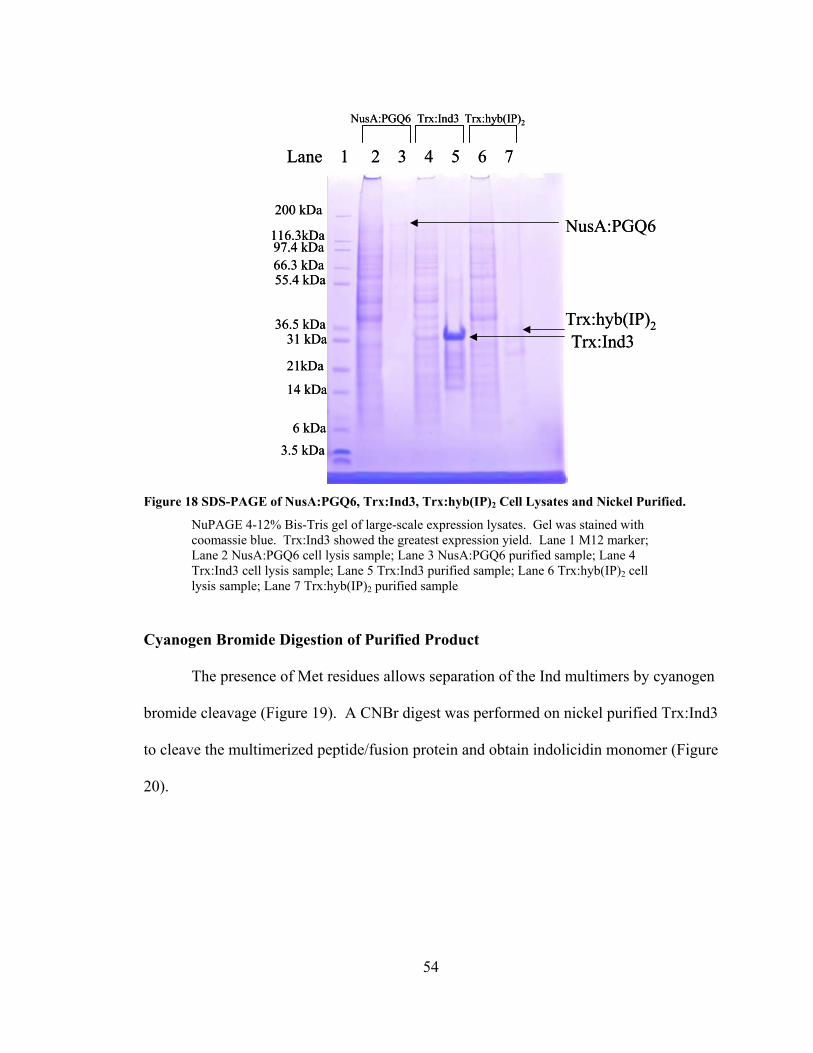
54
Figure 18 SDS-PAGE of NusA:PGQ6, Trx:Ind3, Trx:hyb(IP)2 Cell Lysates and Nickel Purified.
NuPAGE 4-12% Bis-Tris gel of large-scale expression lysates. Gel was stained with coomassie blue. Trx:Ind3 showed the greatest expression yield. Lane 1 M12 marker; Lane 2 NusA:PGQ6 cell lysis sample; Lane 3 NusA:PGQ6 purified sample; Lane 4 Trx:Ind3 cell lysis sample; Lane 5 Trx:Ind3 purified sample; Lane 6 Trx:hyb(IP)2 cell lysis sample; Lane 7 Trx:hyb(IP)2 purified sample
Cyanogen Bromide Digestion of Purified Product
The presence of Met residues allows separation of the Ind multimers by cyanogen
bromide cleavage (Figure 19). A CNBr digest was performed on nickel purified Trx:Ind3
to cleave the multimerized peptide/fusion protein and obtain indolicidin monomer (Figure
20).
Trx:Ind3Trx:hyb(IP)2
NusA:PGQ6
Lane 1 2 3 4 5 6 7
200 kDa
31 kDa36.5 kDa
21kDa
14 kDa
6 kDa3.5 kDa
116.3kDa97.4 kDa66.3 kDa55.4 kDa
NusA:PGQ6 Trx:Ind3 Trx:hyb(IP)2
Trx:Ind3Trx:hyb(IP)2
NusA:PGQ6
Lane 1 2 3 4 5 6 7
200 kDa
31 kDa36.5 kDa
21kDa
14 kDa
6 kDa3.5 kDa
116.3kDa97.4 kDa66.3 kDa55.4 kDa
NusA:PGQ6 Trx:Ind3 Trx:hyb(IP)2
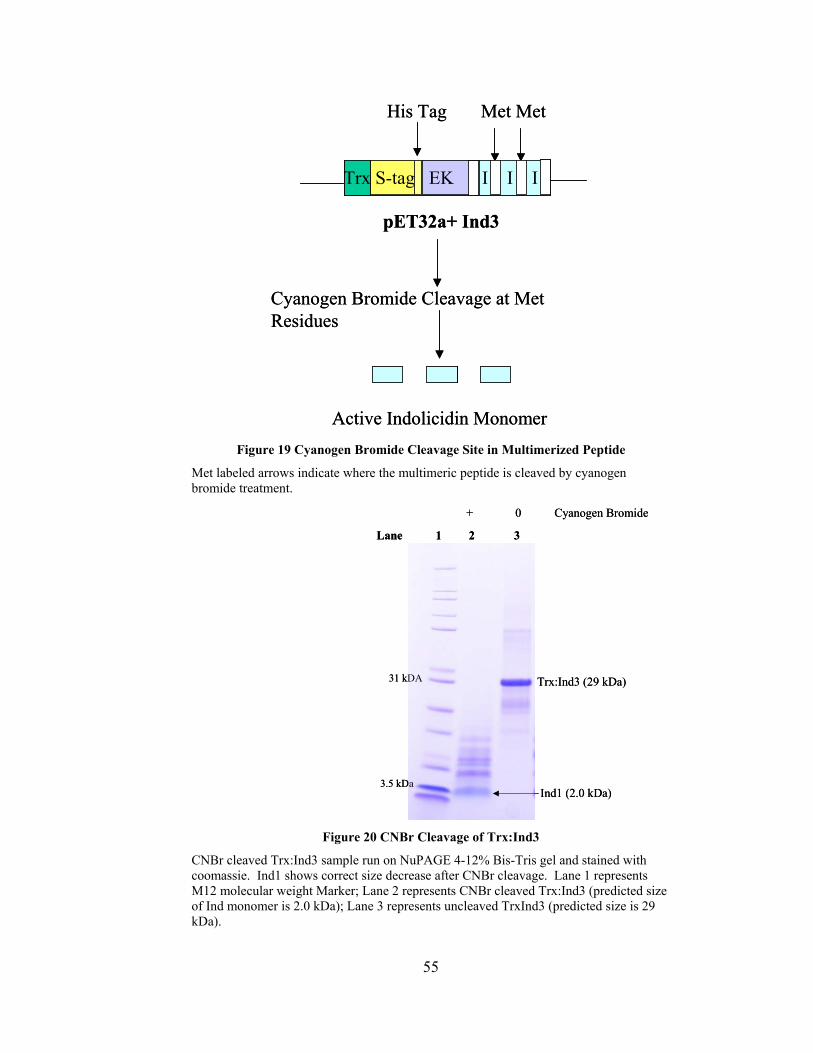
55
Figure 19 Cyanogen Bromide Cleavage Site in Multimerized Peptide
Met labeled arrows indicate where the multimeric peptide is cleaved by cyanogen bromide treatment.
Figure 20 CNBr Cleavage of Trx:Ind3
CNBr cleaved Trx:Ind3 sample run on NuPAGE 4-12% Bis-Tris gel and stained with coomassie. Ind1 shows correct size decrease after CNBr cleavage. Lane 1 represents M12 molecular weight Marker; Lane 2 represents CNBr cleaved Trx:Ind3 (predicted size of Ind monomer is 2.0 kDa); Lane 3 represents uncleaved TrxInd3 (predicted size is 29 kDa).
Cyanogen Bromide Cleavage at Met ResiduesCyanogen Bromide Cleavage at Met Residues
Active Indolicidin MonomerActive Indolicidin Monomer
His Tag
pET32a+ Ind3
Met Met
Trx S-tag EK I I I
His Tag
pET32a+ Ind3
Met Met
Trx S-tag EK I I I
Ind1 (2.0 kDa)
Trx:Ind3 (29 kDa)
3.5 kDa
31 kDA
Lane 1 2 3
+ 0 Cyanogen Bromide
Ind1 (2.0 kDa)
Trx:Ind3 (29 kDa)
3.5 kDa
31 kDA
Lane 1 2 3
+ 0 Cyanogen Bromide
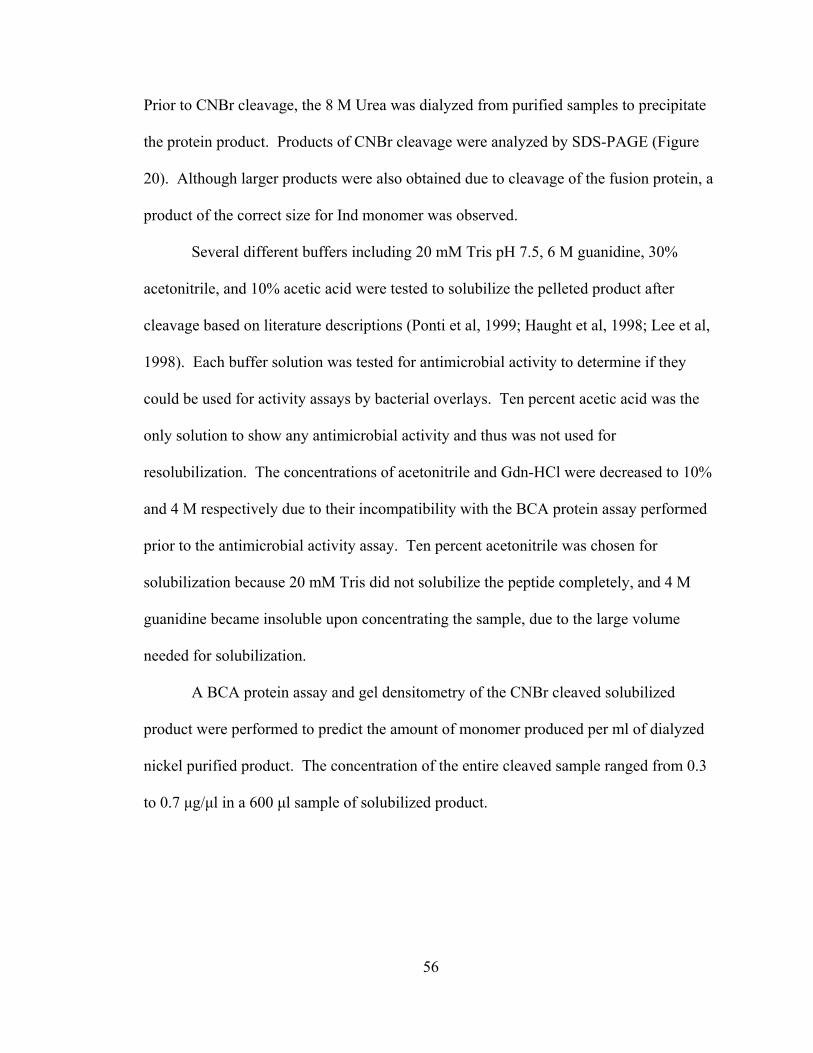
56
Prior to CNBr cleavage, the 8 M Urea was dialyzed from purified samples to precipitate
the protein product. Products of CNBr cleavage were analyzed by SDS-PAGE (Figure
20). Although larger products were also obtained due to cleavage of the fusion protein, a
product of the correct size for Ind monomer was observed.
Several different buffers including 20 mM Tris pH 7.5, 6 M guanidine, 30%
acetonitrile, and 10% acetic acid were tested to solubilize the pelleted product after
cleavage based on literature descriptions (Ponti et al, 1999; Haught et al, 1998; Lee et al,
1998). Each buffer solution was tested for antimicrobial activity to determine if they
could be used for activity assays by bacterial overlays. Ten percent acetic acid was the
only solution to show any antimicrobial activity and thus was not used for
resolubilization. The concentrations of acetonitrile and Gdn-HCl were decreased to 10%
and 4 M respectively due to their incompatibility with the BCA protein assay performed
prior to the antimicrobial activity assay. Ten percent acetonitrile was chosen for
solubilization because 20 mM Tris did not solubilize the peptide completely, and 4 M
guanidine became insoluble upon concentrating the sample, due to the large volume
needed for solubilization.
A BCA protein assay and gel densitometry of the CNBr cleaved solubilized
product were performed to predict the amount of monomer produced per ml of dialyzed
nickel purified product. The concentration of the entire cleaved sample ranged from 0.3
to 0.7 µg/µl in a 600 µl sample of solubilized product.
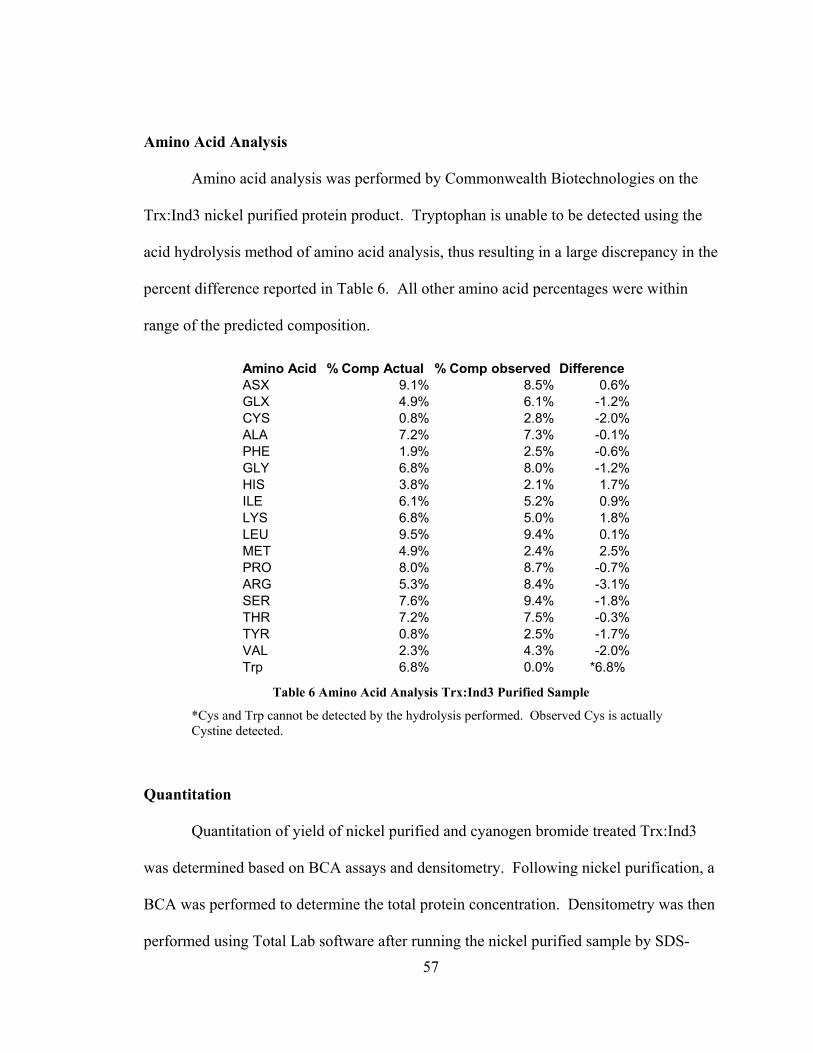
57
Amino Acid Analysis
Amino acid analysis was performed by Commonwealth Biotechnologies on the
Trx:Ind3 nickel purified protein product. Tryptophan is unable to be detected using the
acid hydrolysis method of amino acid analysis, thus resulting in a large discrepancy in the
percent difference reported in Table 6. All other amino acid percentages were within
range of the predicted composition.
Table 6 Amino Acid Analysis Trx:Ind3 Purified Sample
*Cys and Trp cannot be detected by the hydrolysis performed. Observed Cys is actually Cystine detected.
Quantitation
Quantitation of yield of nickel purified and cyanogen bromide treated Trx:Ind3
was determined based on BCA assays and densitometry. Following nickel purification, a
BCA was performed to determine the total protein concentration. Densitometry was then
performed using Total Lab software after running the nickel purified sample by SDS-
Amino Acid % Comp Actual % Comp observed DifferenceASX 9.1% 8.5% 0.6%GLX 4.9% 6.1% -1.2%CYS 0.8% 2.8% -2.0%ALA 7.2% 7.3% -0.1%PHE 1.9% 2.5% -0.6%GLY 6.8% 8.0% -1.2%HIS 3.8% 2.1% 1.7%ILE 6.1% 5.2% 0.9%LYS 6.8% 5.0% 1.8%LEU 9.5% 9.4% 0.1%MET 4.9% 2.4% 2.5%PRO 8.0% 8.7% -0.7%ARG 5.3% 8.4% -3.1%SER 7.6% 9.4% -1.8%THR 7.2% 7.5% -0.3%TYR 0.8% 2.5% -1.7%VAL 2.3% 4.3% -2.0%Trp 6.8% 0.0% *6.8%

58
PAGE and coomassie staining (Table 7). The calculated molecular weight of Trx:Ind3 is
28.951 kDa. The percentage of Ind1 within this protein by mass is 21%. After cyanogen
bromide cleavage, the sample was run by SDS-PAGE and coomassie staining to
determine the actual yield of Ind1. Upon densitometry, the Ind1 band was determined to
be from 24-46% of the CNBr cleaved sample compared to the predicted 21% of sample.
This predicts that there is more than 1 protein corresponding to the 2 kDa band
comigrating with the indolicidin monomer (see Figure 20).
µg in 1 L cultured
Total nickel purified protein (BCA assay) 2541.743
% Trx:Ind3 after densitometry 90.60%
Final amount of Trx:Ind3 2302.819
% Ind1 of Trx:Ind3 after densitometry 21%
Final yield of Ind1 483.5919
Table 7 Quantitation of Indolicidin Monomer
Quantitation is calculated based on a BCA of total protein after nickel purified sample of a 1 L culture followed by densitometry of sample on polyacrylamide gel. The percent of Ind1 within nickel purified product is calculated based on the 2 kDa size of Ind1 as compared to the 29 kDa size of Trx:Ind3.
Antimicrobial Activity Assay
Several bacterial strains and Navy solid waste puck microbes were tested to
determine whether commercial samples of indolicidin and PGQ were active. Only the
Navy puck bacteria (unpublished) on MH agar exhibited a zone of clearing with less than
25 µg of peptide; the puck bacteria required only 5 µg of commercially available
indolicidin or PGQ for a 1 cm zone of clearing (data not shown). E. coli 0157, E. coli
45827, S. aureus, S. typhimurium, and S. epidermidis all required more than 25 µg of
peptide, or did not show any zones of clearing with 50 µg of peptide (data not shown).
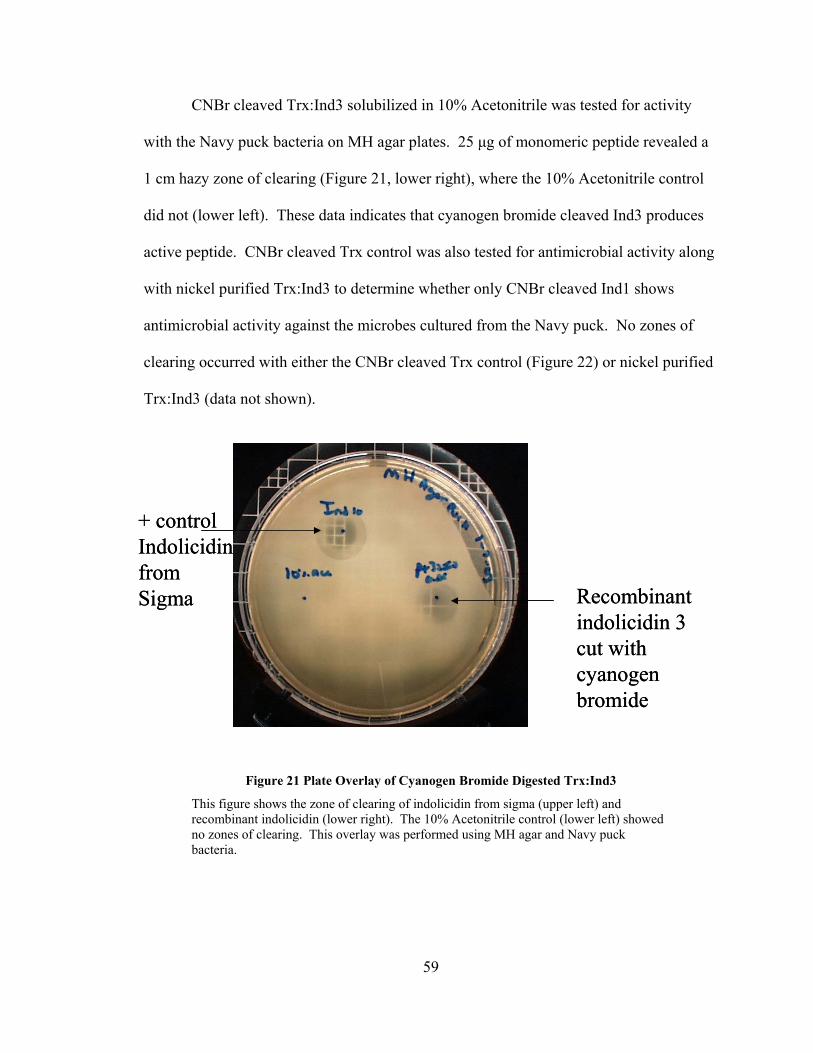
59
CNBr cleaved Trx:Ind3 solubilized in 10% Acetonitrile was tested for activity
with the Navy puck bacteria on MH agar plates. 25 µg of monomeric peptide revealed a
1 cm hazy zone of clearing (Figure 21, lower right), where the 10% Acetonitrile control
did not (lower left). These data indicates that cyanogen bromide cleaved Ind3 produces
active peptide. CNBr cleaved Trx control was also tested for antimicrobial activity along
with nickel purified Trx:Ind3 to determine whether only CNBr cleaved Ind1 shows
antimicrobial activity against the microbes cultured from the Navy puck. No zones of
clearing occurred with either the CNBr cleaved Trx control (Figure 22) or nickel purified
Trx:Ind3 (data not shown).
Figure 21 Plate Overlay of Cyanogen Bromide Digested Trx:Ind3
This figure shows the zone of clearing of indolicidin from sigma (upper left) and recombinant indolicidin (lower right). The 10% Acetonitrile control (lower left) showed no zones of clearing. This overlay was performed using MH agar and Navy puck bacteria.
Recombinant indolicidin 3 cut with cyanogen bromide
+ control Indolicidin from Sigma Recombinant
indolicidin 3 cut with cyanogen bromide
+ control Indolicidin from Sigma
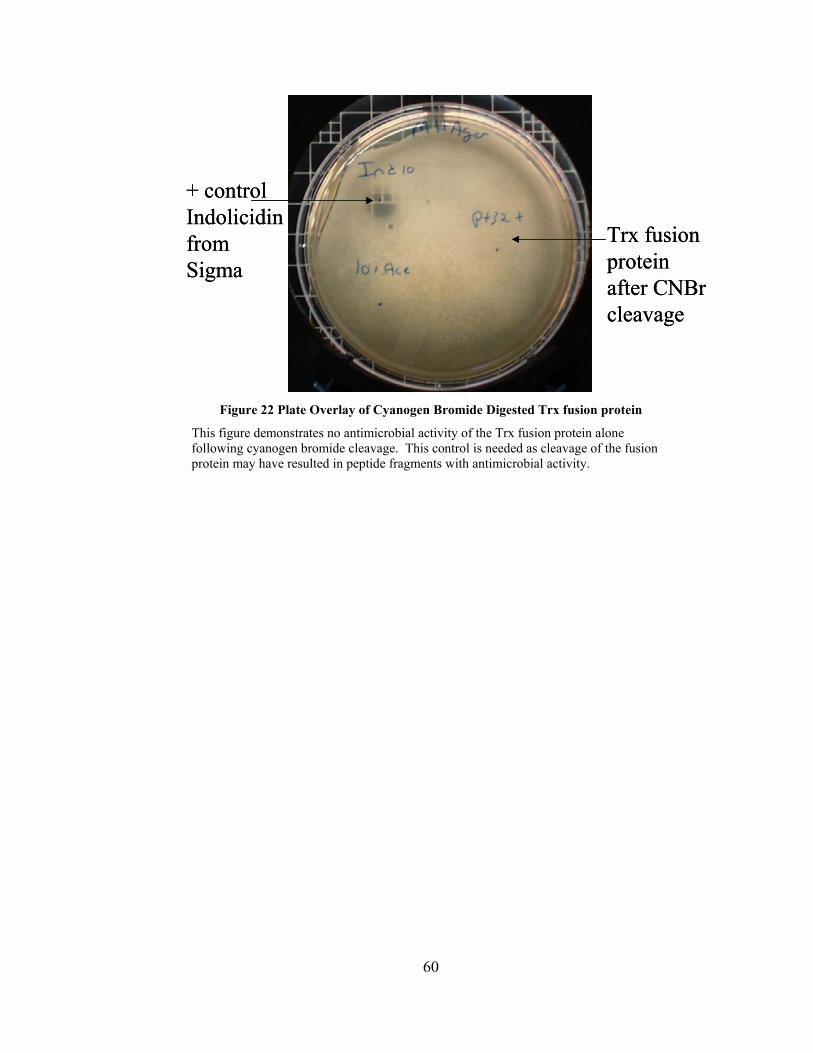
60
Figure 22 Plate Overlay of Cyanogen Bromide Digested Trx fusion protein
This figure demonstrates no antimicrobial activity of the Trx fusion protein alone following cyanogen bromide cleavage. This control is needed as cleavage of the fusion protein may have resulted in peptide fragments with antimicrobial activity.
+ control Indolicidin from Sigma
Trx fusion protein after CNBr cleavage
+ control Indolicidin from Sigma
Trx fusion protein after CNBr cleavage
61
DISCUSSION
Natural Indolicidin vs. Recombinant Indolicidin
Natural indolicidin is a 13 amino acid peptide, which is aminated at the carboxyl
terminus (Falla et al, 1996). The recombinant indolicidin produced by E. coli does not
contain an aminated carboxyl terminus and contains a methionine residue at the N-
terminus. This is a product of the cyanogen bromide cleavage utilized in the
multimerization technique to produce indolicidin. This methionine residue is also
contained in the constructs of recombinant peptides described in published studies (Lee et
al, 1998. Zhang et al, 1998. Lee et al, 2000. Ponti et al, 1999), in which it was determined
not to affect the antimicrobial activity of the peptides produced. Antimicrobial activity of
recombinant indolicidin versus natural indolicidin has not been investigated prior to this
study. Recombinant Ind1 shows similar size zones of clearing following cyanogen
bromide cleavage, although purification must be done in order to attribute these results to
recombinant Ind1.
Vectors and Host Strains
Initially only pQE-30 and pET28a+ were chosen as expression vectors for the
multimerized peptides due to their ability to express toxic proteins fused to a 6x His tag.
When neither of these constructs produced any recombinant protein, other expression
systems were found by searching the literature for features of successful antimicrobial
peptide expression systems. Vectors expressing a fusion protein were chosen based on
multiple articles stating that low peptide, or no peptide, was produced without a fusion
protein (Ponti et al, 1999; Zhang et al, 1998; Harrison et al, 1999). While previous studies
62
created their own fusion proteins, the fusions we used were chosen from commercial
vectors containing BamHI restriction sites and possessing the ability to express the
peptides in the correct reading frame. This resulted in choosing pET43.1a+ (Nus A
fusion), pET32a+ (thioredoxin fusion), and pGEX-4T-2 (GST fusion).
After selection of expression vectors, several different host strains were chosen
from those described in the literature that produced the highest expression levels. This
literature search resulted in the choice of Bl21DE3 (Lee et al, 1998 and Ponti et al, 1999),
HS174DE3 (Lee et al, 2000), and JM109 (Taguchi et al, 1994). These host strains
differed not only in antimicrobial peptide expression, but also in properties such as
proteolytic deficiencies, solubilization of recombinant proteins, or derivation from
different cell strains.
In vitro Transcription/Translation
In vitro transcription/translation was deemed necessary following the inability to
successfully express the peptide genes in pQE-30 or pET28a+. Although the literature
led us to expect that low yields of peptide would be expressed even without a fusion
protein (Zhang et al, 1998) no expression was seen. These experiments determined that
the only constructs expressed in vitro were those in fusion protein vectors.
The lack of in vitro expression of the non-fusion protein vectors may be due to
truncated expression of the peptides, or incorrect transcription or translation from the
expression vectors. This in vitro transcription/translation system is designed to express
plasmids with both E. coli promoters and T7 promoters. This was chosen because all
pET vectors contain T7 promoters.
63
Expression and Purification of Selected Constructs
Once the constructs were chosen for in vivo expression and purification, the
optical density (OD) of each induced culture was monitored to determine whether cell
growth halted or decreased following induction as seen in expression of pQE-30 and
pET28a+ constructs. Trx:Ind3 showed a large increase in OD during induction as
expected of a productive culture in log phase growth. Both Trx:hyb(IP)2 and
NusA:PGQ6 showed a leveling off of cell growth following induction (data not shown).
This may have resulted in the lower expression levels of those constructs.
Cyanogen bromide cleavage originally posed a problem because the purified
expression protein was in a solution containing 8 M urea; this affected the antimicrobial
activity of the sample following cyanogen bromide cleavage due to formic acid
remaining in the sample. This was resolved by dialyzing the urea away into a non-
denaturing buffer, thus making the protein insoluble. The cyanogen bromide digestion
itself allowed the purified protein to become soluble in the formic acid, and all formic
acid was removed during lyophilization.
Another hurdle before activity could be tested included the re-solubilization of the
cyanogen bromide cleaved peptide product. Several solvents were tested for
antimicrobial activity, resulting in the use of 10% acetonitrile.
Quantitation
Comparing expression yields with those described in the literature was not
straightforward. Each article reviewed utilizes a slightly different method of production,
64
purification and quantitation of the peptide produced, making it difficult to directly
compare the yield. Quantitation of yield for the recombinant Ind1 was only theoretically
calculated and not determined directly. This calculation was based on BCA and
densitometry of the nickel purified Trx:Ind3 sample of a 1L shake flask culture. Lee et
al. (1998), calculated a final concentration of 107 mg/L of purified antimicrobial peptide
produced in a 30 L high cell density fermentation, based on BCA. Haught et al. (1997)
calculated 0.37 mg/L of purified peptide product from 1 L shake flask fermentation based
on BCA and densitometry after solubilization of inclusion bodies, similar to the method
used here. This suggests that the 1 L shake flask culture yields in the literature ranging
from 0.37-1 mg/L purified active peptide, may be directly compared to the yield of 0.5
mg/L we obtained with Trx:Ind3. It is hypothesized that after high cell density
expression large yields such as those obtained by Lee et al. (1998) may be achieved with
Trx:Ind3.
Summary
Multimerization proved to be successful for expression of recombinant
indolicidin. While this type of multimerization is novel for antimicrobial peptide
production, many factors of protein expression remained similar to other studies. As
observed by others, the use of a fusion protein was necessary to express the peptide
multimer. Fusion proteins are used to hide the peptide from proteolytic cleavage as well
as hide the toxicity of the antimicrobial peptide. It was thought that multimerization of
the peptide itself would be sufficient to mask the toxicity to the producing E. coli cells,
but this was found to be untrue. Lee et al. (1998), Ponti et al. (1999), Haught et al.
65
(1998), and Piers et al. (1993), inserted a methionine to cleave their peptide away from
the fusion protein during purification. Methionine residues flanking the peptide gene
were used to cleave the multimers during purification.
Several differences between published literature and the multimerized peptide
expression described here include the determination of antimicrobial activity and
purification method. While most peptides were purified as inclusion bodies, indolicidin
was solubilized and passed over a Ni/NTA resin for purification via the 6x His tag. For
determination of antimicrobial activity, bacterial agar overlays were used by spotting
CNBr cleaved peptide on agar plates, overlaying an agar suspension of growing bacteria,
and looking for zones of clearing. Only Piers et al. (1993) used a similar overlay method.
All other published studies used liquid micro-titer plate cultures. The main difference
between other studies and ours was the purity of the peptide used in activity testing. In
our study, indolicidin monomer was not purified, while purified peptides were used in all
other sutdies. Purification of the CNBr cleaved sample needs to be performed to
compare the actual concentration of recombinant indolicidin to that of natural indolicidin.

66
BIBLIOGRAPHY
Agerberth B, Lee JY, Bergman T, Carlquist M, Boman HG. (1991) Amino Acid Sequence of PR-39, Isolation from Pig Intestine of a New Member of the Family of Pro, Arg-rich Antibacterial Peptides. European Journal of Biochemistry. 202: 849-54.
Andersons D, Engstrom A, Josephson S, Hansson L, Steiner H. (1991) Biologically
Active and Amidated Cecropin Produced in a Baclovirus Expression System from a Fusion Construct Containing the Antibody-binding Part of Protein A. Biochemical Journal. 280: 219-224.
Epand R and Vogel H. (1999) Diversity of Antimicrobial Peptides and their Mechanisms
of Action. Biochimica et Biophysica Acta. 1462: 11-28. Falla T and Hancock R. (1997) Improved Activity of a Synthetic Indolicidin Analog.
Antimicrobial Agents and Chemotherapy. 41: 771-775. Falla T, Karunaratne N, Hancock R. (1996) Mode of Action of the Antimicrobial Peptide
Indolicidin. Journal of Biological Chemistry. 271: 19298-303. Hancock R and Rozek A. (2002) Role of Membranes in the Activities of Antimicrobial
Cationic Peptides. FEMS Microbiology Letters. 206: 143-149. Hara S and Yamakawa M. (1996) Production in Escherichia coli of Moricin, a Novel
Type Antibacterial Peptide from the Silkworm, Bombyx mori. Biochemical and Biophysical Research Communications. 220: 664-669.
Haught C, Davis G, Subramanian R, Jackson K, Harrison R. (1998) Recombinant
Production and Purification of Novel Antisense Antimicrobial Peptide in Escherichia coli. Biotechnology and Bioengineering. 57: 55-61.
Hellers M, Gunne H, Steiner H. (1991) Expression of Post-Translational Processing of
Preprocecropin A using a Baculovirus Vector. European Journal of Biochemistry. 199: 435-439.
Huang H. (2000) Action of Antimicrobial Peptides: Two-State Model.Biochemistry. 39:
8347-8352. Hwang SW, Lee JH, Park HB, Pyo SH, So JE, Lee HS, Hong SS, Kim JH. (2001) A
Simple Method for the Purification of an Antimicrobial Peptide in Recombinant Escherichia coli. Molecular Biotechnology. 18: 193-198.
Lee JH, Kim JH, Hwang SW, Lee WJ, Yoon HK, Lee HS, Hong SS. (2000) High-Level
Expression of Antimicrobial Peptide Mediated by a Fusion Partner Reinforcing
67
Formation of Inclusion Bodies. Biochemical and Biophysical Research Communications. 277: 575-580.
Lee JH, Minn I, Park CB, Kim SC. (1998) Acidic Peptide-Mediated Expression of the
Antimicrobial Peptide Buforin II as Tandem Repeats in Escherichia coli. Protein Expression and Purification. 12: 53-60.
Lehrer RI, Lichtenstein AL, Ganz T. (1993) Defensins: Antimicrobial and Cytotoxic
Peptides of Mammalian Cells. Annual Review of Immunology. 11: 105-28. Moore K, Bevins C, Brasseur M, Tomassini N, Turner K, Eck H, Zasloff M. (1991)
Antimicrobial Peptides in the Stomach of Xenopus laevis. The Journal of Biological Chemistry. 266: 19851-857.
Nicolas P and Mor A. (1995) Peptides as Weapons Against Microorganisms in the
Chemical Defense System of Vertebrates. Annual Review of Microbiology. 49: 277-304.
Piers KL, Brown MH, Hancock REW. (1993) Recombinant DNA Procedures for
Producing Small Antimicrobial Cationic Peptides in Bacteria. Gene. 134: 7-13. Ponti D, Mignoga G, Magoni M, Biase D, Simmaco M, Barra D. (1999) Expression and
Activity of Cyclic and Linear Analogues of Esculentin-1 an Anti-microbial Peptide from Amphibian Skin. European Journal of Biochemistry. 263: 921-927.
Prince J, McGrath K, DiGirolamo C, Kaplan D. (1995) Construction, Cloning, and
Expression of Synthetic Genes Encoding Spider Dragline Silk. Biochemistry. 34: 10879-10885
Qiagen, Inc. (2000) The QiaExpressionist: A Handbook for High-level Expression and
Purification of 6x His-tagged Proteins. Reichhart JM, Petit I, Legrain M, Dimarcq JL, Keppi E, Lecocq JP, Hoffmann JA,
Achstetter T. (1992) Expression and Secretion in Yeast of Active Insect Defensin, an Inducible Antibacterial Peptide from the Fleshfly Phormia terranovae. Invertebrate Reproductive Development. 21: 15-24.
Selsted ME, Tang YQ, Morris WL, McGuire PA, Novotny MJ. (1993) Purification,
Primary Structures, and Antibacterial Activites of β-defensins, a New Family of Antimicrobial Peptides from Bovine Neutrophils. Journal of Biological Chemistry. 268: 6641-48.
Sitaram N and Nagaraj R. (1999) Interaction of Antimicrobial Peptides with Biological
and Model Membranes: Structural and Change Requirements for Activity. Biochimica et Biophysica Acta. 1462: 29-54.
68
Spencer JH. (1992) Antimicrobial Peptides of Frog Skin. Advanced Enzyme Regulation. 32: 117-29.
Staubitz P, Peschel A, Nieuwenhuizen W, Otto M, Gotz F, Jung G, Jack R. (2001)
Structure-Function Relationships in the Tryptophan-rich Antimicrobial Peptide Indolicidin. Journal of Peptide Science. 7: 552-564.
Subbalakshmi C, Krishnakumari V, Nagaraj R, Sitaram N. (1996) Requirements for
Antibacterial and Hemolytic Activities in the Bovine Neutrophil Derived 13-residue Peptide Indolicidin. FEBS Letters. 395: 48-52.
Subbalakshmi C and Sitaram N. (1998) Mechanism of Antimicrobial Action of
Indolicidin. FEMS Microbiology Letters. 160: 91-96. Taguchi S, Nakagawa K, Maeno M, Momose H. (1994) In Vivo Monitoring System for
Structure-Function Relationship Analysis of the Antimicrobial Peptide Apidaecin. Applied and Environmental Microbiology. 60: 3566-3572.
Zhang L, Falla T, Wu M, Fidai S, Burian J, Kay W, Hancock REW. (1998) Determinants
of Recombinant Production of Antimicrobial Cationic Peptides and Creation of Peptide Variants in Bacteria. Biochemical and Biophysical Research Communications. 247: 674-680.
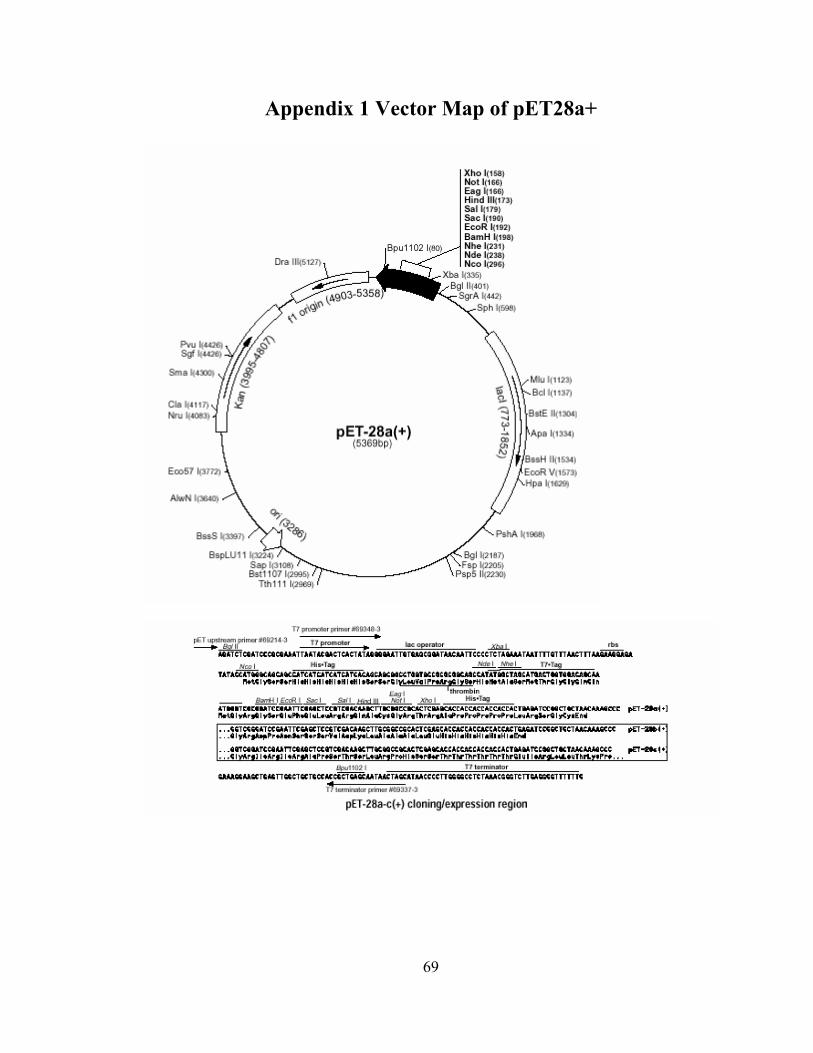
69
Appendix 1 Vector Map of pET28a+
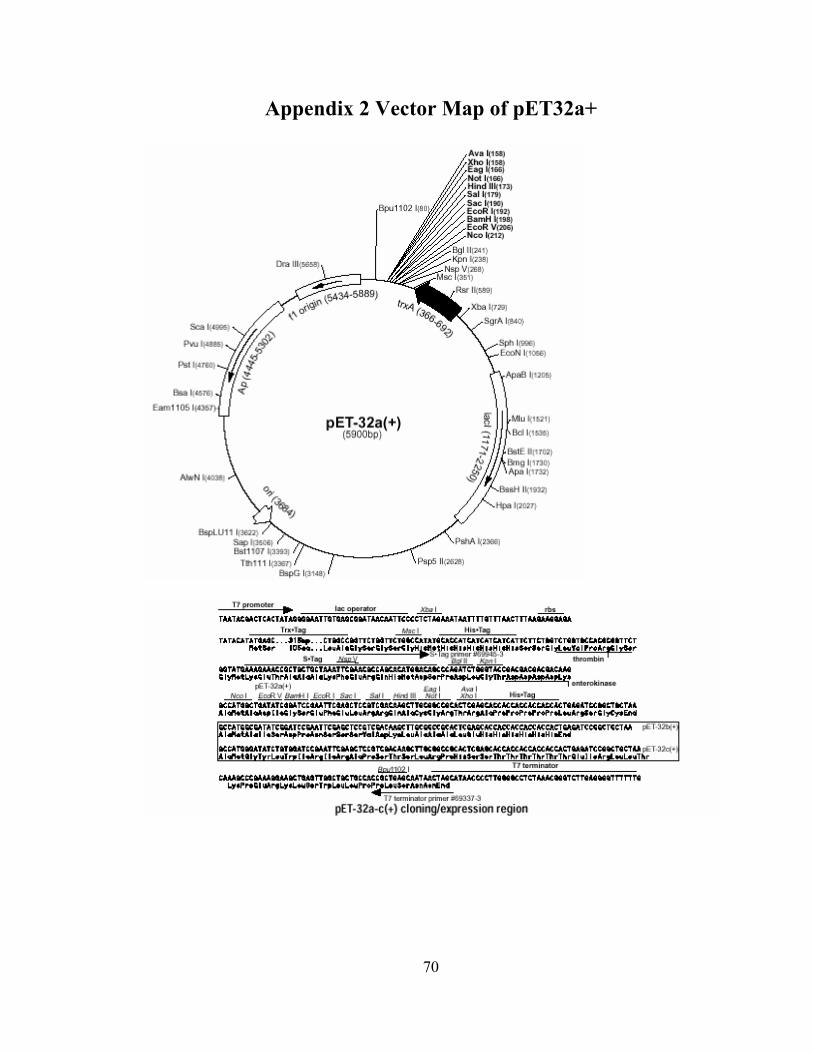
70
Appendix 2 Vector Map of pET32a+

71
Appendix 3 Vector Map of pET43.1a+
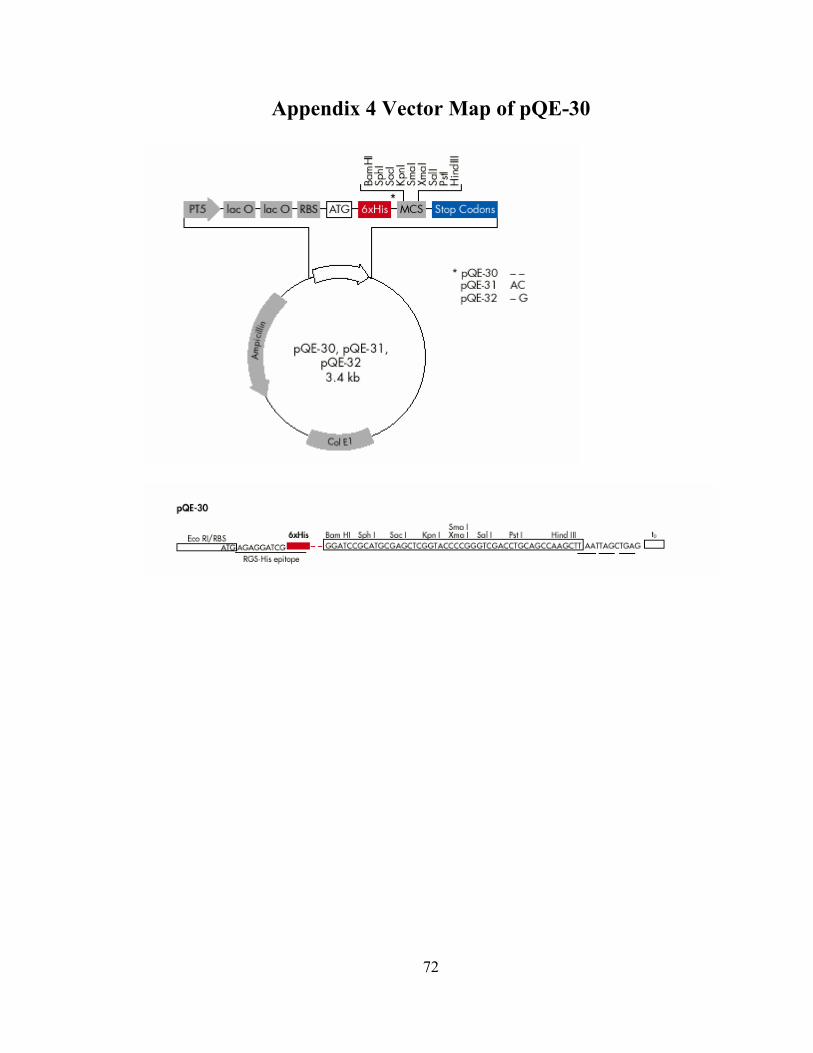
72
Appendix 4 Vector Map of pQE-30
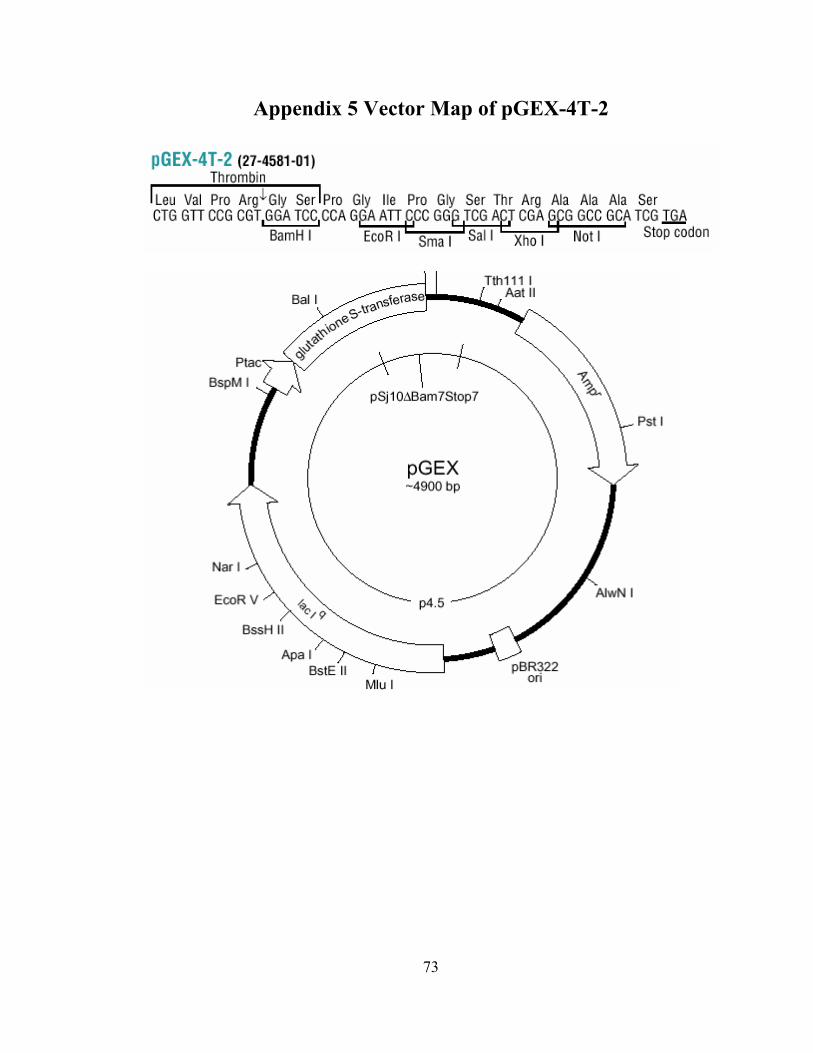
73
Appendix 5 Vector Map of pGEX-4T-2
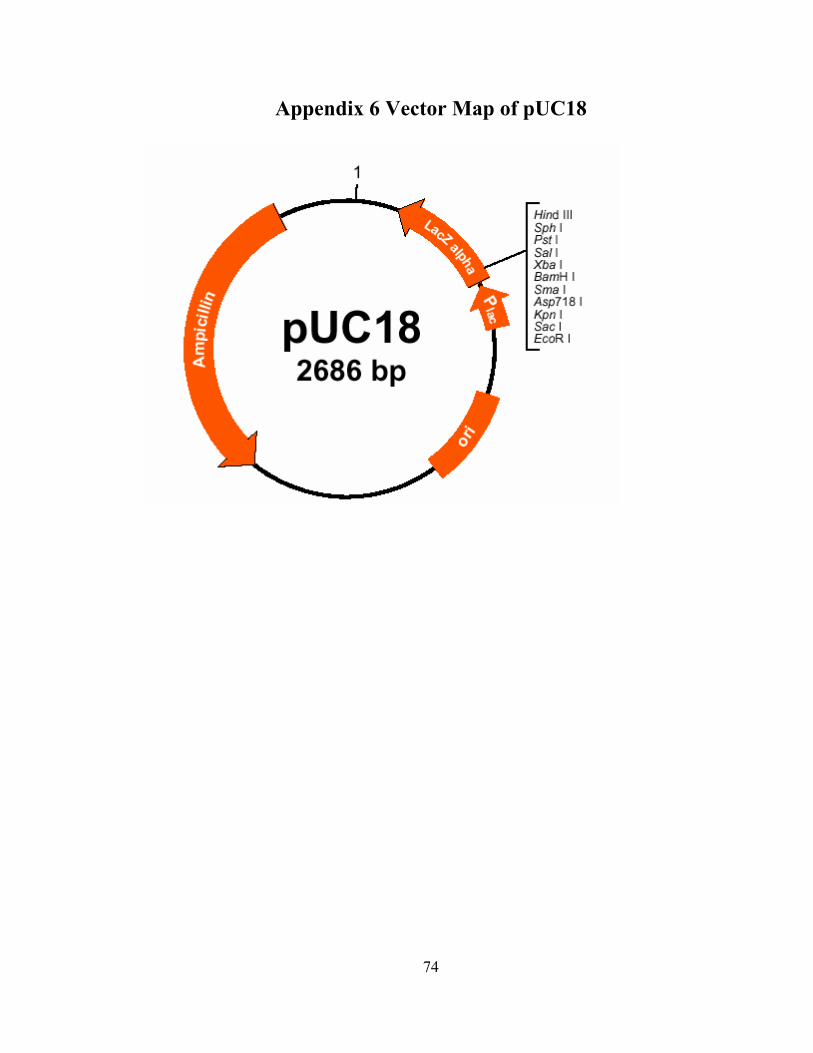
74
Appendix 6 Vector Map of pUC18
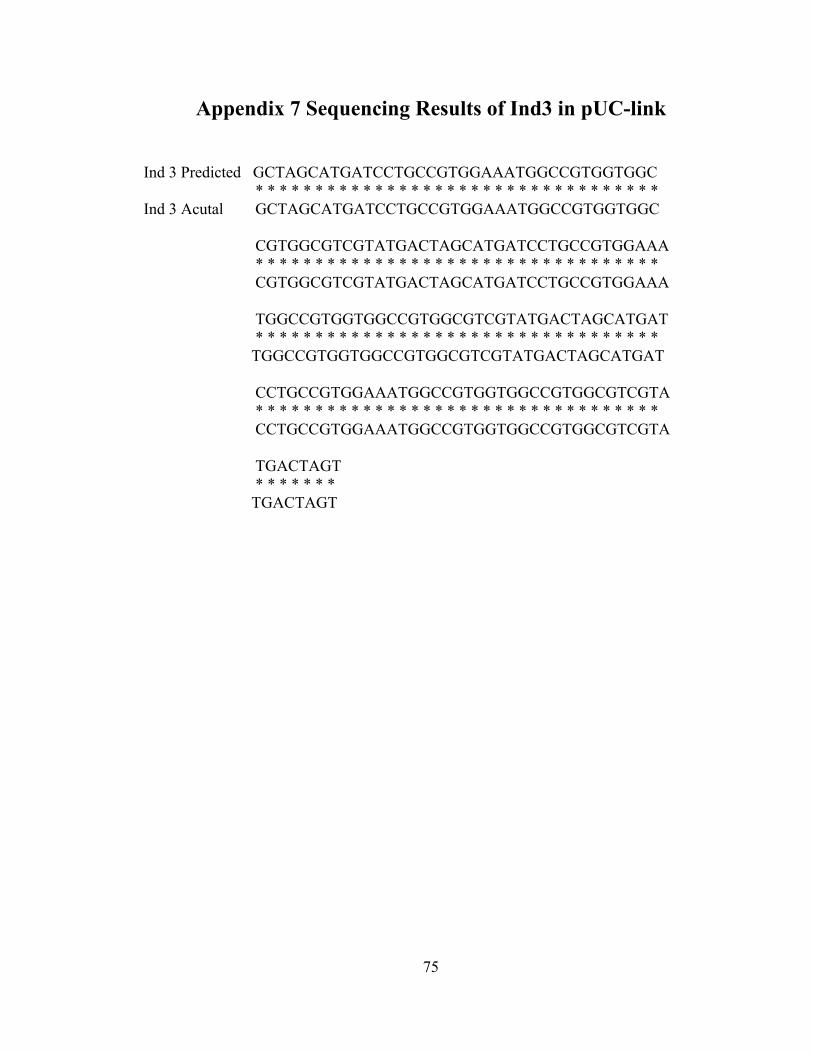
75
Appendix 7 Sequencing Results of Ind3 in pUC-link
Ind 3 Predicted GCTAGCATGATCCTGCCGTGGAAATGGCCGTGGTGGC
* * * * * * * * * * * * * * * * * * * * * * * * * * * * * * * * * * Ind 3 Acutal GCTAGCATGATCCTGCCGTGGAAATGGCCGTGGTGGC
CGTGGCGTCGTATGACTAGCATGATCCTGCCGTGGAAA * * * * * * * * * * * * * * * * * * * * * * * * * * * * * * * * * * CGTGGCGTCGTATGACTAGCATGATCCTGCCGTGGAAA
TGGCCGTGGTGGCCGTGGCGTCGTATGACTAGCATGAT * * * * * * * * * * * * * * * * * * * * * * * * * * * * * * * * * *
TGGCCGTGGTGGCCGTGGCGTCGTATGACTAGCATGAT
CCTGCCGTGGAAATGGCCGTGGTGGCCGTGGCGTCGTA * * * * * * * * * * * * * * * * * * * * * * * * * * * * * * * * * * CCTGCCGTGGAAATGGCCGTGGTGGCCGTGGCGTCGTA
TGACTAGT * * * * * * *
TGACTAGT
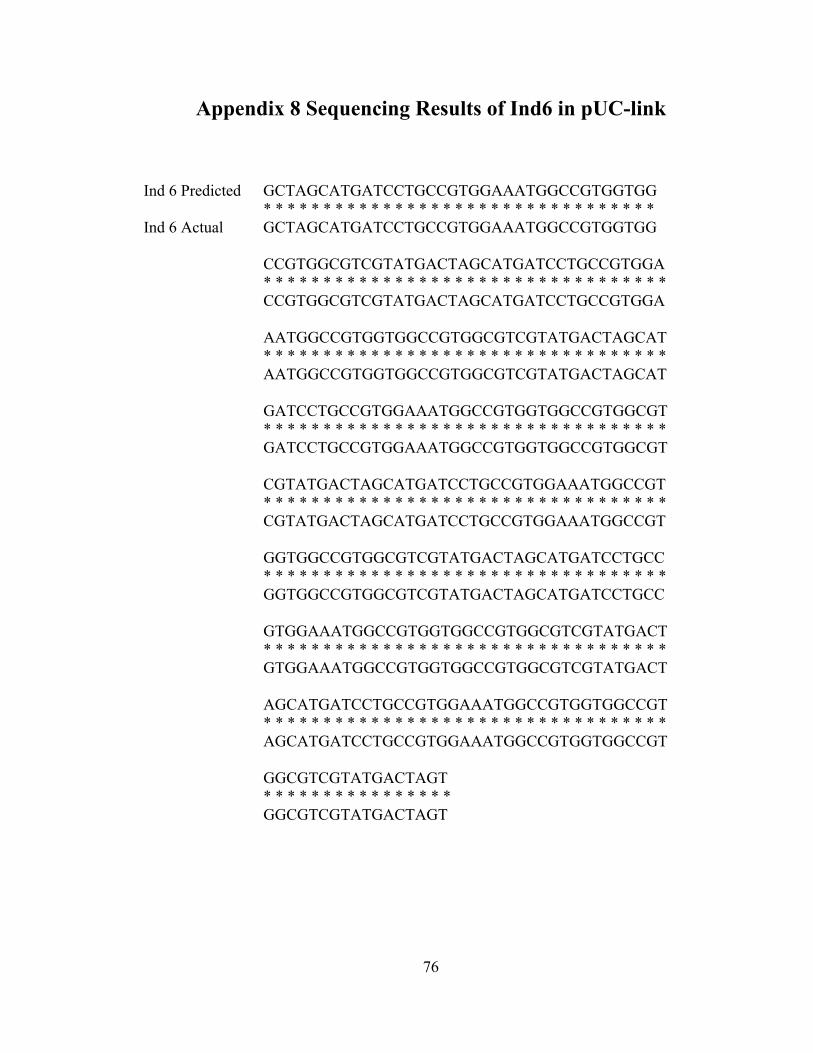
76
Appendix 8 Sequencing Results of Ind6 in pUC-link
Ind 6 Predicted GCTAGCATGATCCTGCCGTGGAAATGGCCGTGGTGG * * * * * * * * * * * * * * * * * * * * * * * * * * * * * * * * * Ind 6 Actual GCTAGCATGATCCTGCCGTGGAAATGGCCGTGGTGG
CCGTGGCGTCGTATGACTAGCATGATCCTGCCGTGGA * * * * * * * * * * * * * * * * * * * * * * * * * * * * * * * * * * CCGTGGCGTCGTATGACTAGCATGATCCTGCCGTGGA AATGGCCGTGGTGGCCGTGGCGTCGTATGACTAGCAT * * * * * * * * * * * * * * * * * * * * * * * * * * * * * * * * * * AATGGCCGTGGTGGCCGTGGCGTCGTATGACTAGCAT GATCCTGCCGTGGAAATGGCCGTGGTGGCCGTGGCGT * * * * * * * * * * * * * * * * * * * * * * * * * * * * * * * * * * GATCCTGCCGTGGAAATGGCCGTGGTGGCCGTGGCGT CGTATGACTAGCATGATCCTGCCGTGGAAATGGCCGT * * * * * * * * * * * * * * * * * * * * * * * * * * * * * * * * * * CGTATGACTAGCATGATCCTGCCGTGGAAATGGCCGT GGTGGCCGTGGCGTCGTATGACTAGCATGATCCTGCC * * * * * * * * * * * * * * * * * * * * * * * * * * * * * * * * * * GGTGGCCGTGGCGTCGTATGACTAGCATGATCCTGCC GTGGAAATGGCCGTGGTGGCCGTGGCGTCGTATGACT * * * * * * * * * * * * * * * * * * * * * * * * * * * * * * * * * * GTGGAAATGGCCGTGGTGGCCGTGGCGTCGTATGACT AGCATGATCCTGCCGTGGAAATGGCCGTGGTGGCCGT * * * * * * * * * * * * * * * * * * * * * * * * * * * * * * * * * * AGCATGATCCTGCCGTGGAAATGGCCGTGGTGGCCGT GGCGTCGTATGACTAGT * * * * * * * * * * * * * * * * GGCGTCGTATGACTAGT
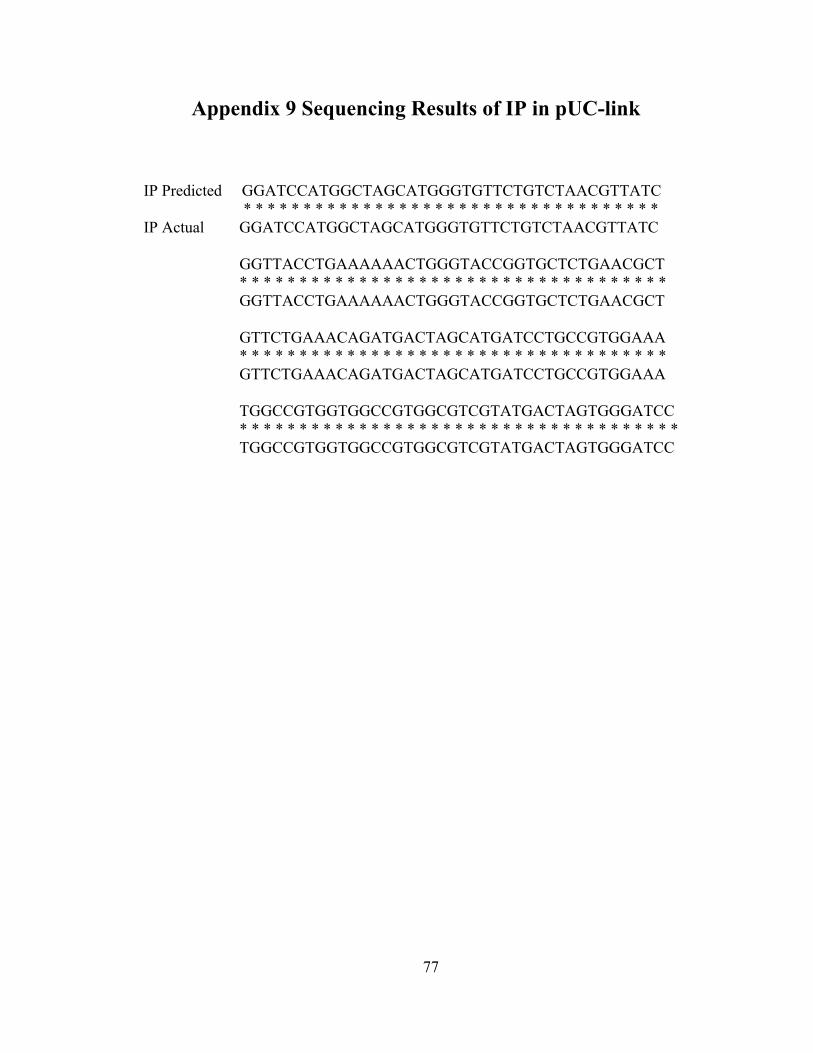
77
Appendix 9 Sequencing Results of IP in pUC-link
IP Predicted GGATCCATGGCTAGCATGGGTGTTCTGTCTAACGTTATC
* * * * * * * * * * * * * * * * * * * * * * * * * * * * * * * * * * * IP Actual GGATCCATGGCTAGCATGGGTGTTCTGTCTAACGTTATC
GGTTACCTGAAAAAACTGGGTACCGGTGCTCTGAACGCT * * * * * * * * * * * * * * * * * * * * * * * * * * * * * * * * * * * * GGTTACCTGAAAAAACTGGGTACCGGTGCTCTGAACGCT GTTCTGAAACAGATGACTAGCATGATCCTGCCGTGGAAA * * * * * * * * * * * * * * * * * * * * * * * * * * * * * * * * * * * * GTTCTGAAACAGATGACTAGCATGATCCTGCCGTGGAAA TGGCCGTGGTGGCCGTGGCGTCGTATGACTAGTGGGATCC
* * * * * * * * * * * * * * * * * * * * * * * * * * * * * * * * * * * * * TGGCCGTGGTGGCCGTGGCGTCGTATGACTAGTGGGATCC
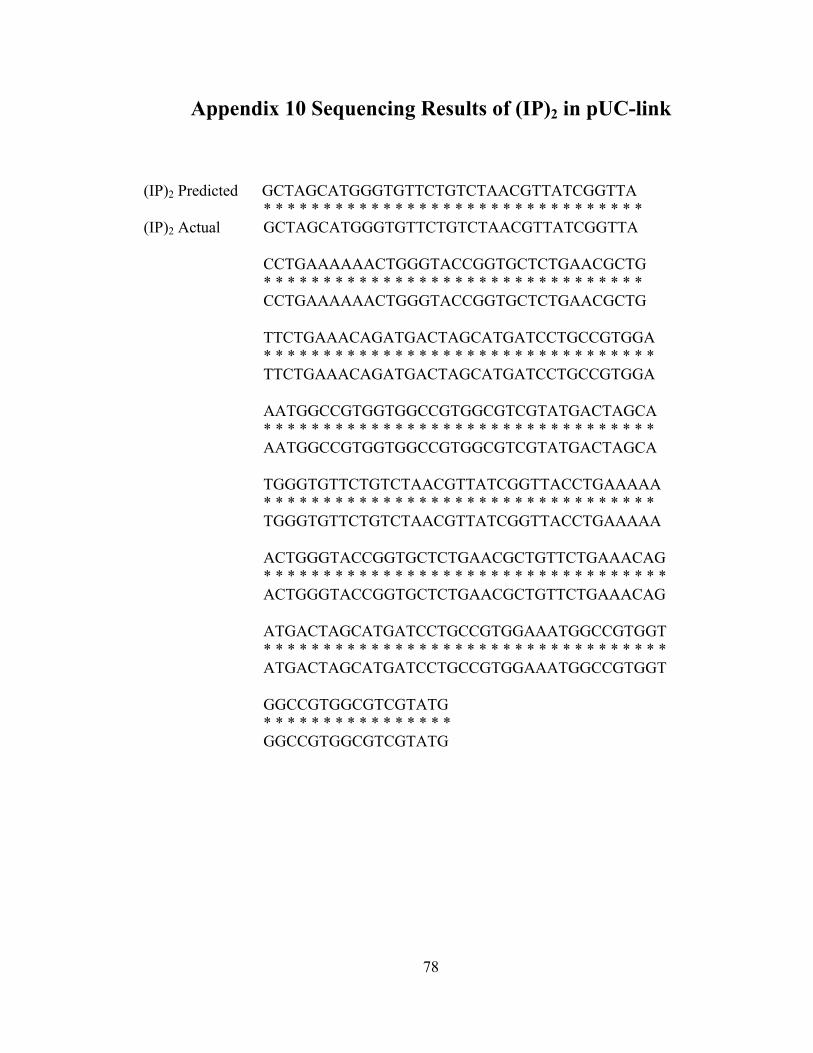
78
Appendix 10 Sequencing Results of (IP)2 in pUC-link
(IP)2 Predicted GCTAGCATGGGTGTTCTGTCTAACGTTATCGGTTA * * * * * * * * * * * * * * * * * * * * * * * * * * * * * * * * (IP)2 Actual GCTAGCATGGGTGTTCTGTCTAACGTTATCGGTTA
CCTGAAAAAACTGGGTACCGGTGCTCTGAACGCTG * * * * * * * * * * * * * * * * * * * * * * * * * * * * * * * * CCTGAAAAAACTGGGTACCGGTGCTCTGAACGCTG TTCTGAAACAGATGACTAGCATGATCCTGCCGTGGA * * * * * * * * * * * * * * * * * * * * * * * * * * * * * * * * * TTCTGAAACAGATGACTAGCATGATCCTGCCGTGGA AATGGCCGTGGTGGCCGTGGCGTCGTATGACTAGCA * * * * * * * * * * * * * * * * * * * * * * * * * * * * * * * * * AATGGCCGTGGTGGCCGTGGCGTCGTATGACTAGCA
TGGGTGTTCTGTCTAACGTTATCGGTTACCTGAAAAA * * * * * * * * * * * * * * * * * * * * * * * * * * * * * * * * * TGGGTGTTCTGTCTAACGTTATCGGTTACCTGAAAAA ACTGGGTACCGGTGCTCTGAACGCTGTTCTGAAACAG * * * * * * * * * * * * * * * * * * * * * * * * * * * * * * * * * * ACTGGGTACCGGTGCTCTGAACGCTGTTCTGAAACAG ATGACTAGCATGATCCTGCCGTGGAAATGGCCGTGGT * * * * * * * * * * * * * * * * * * * * * * * * * * * * * * * * * * ATGACTAGCATGATCCTGCCGTGGAAATGGCCGTGGT GGCCGTGGCGTCGTATG
* * * * * * * * * * * * * * * * GGCCGTGGCGTCGTATG
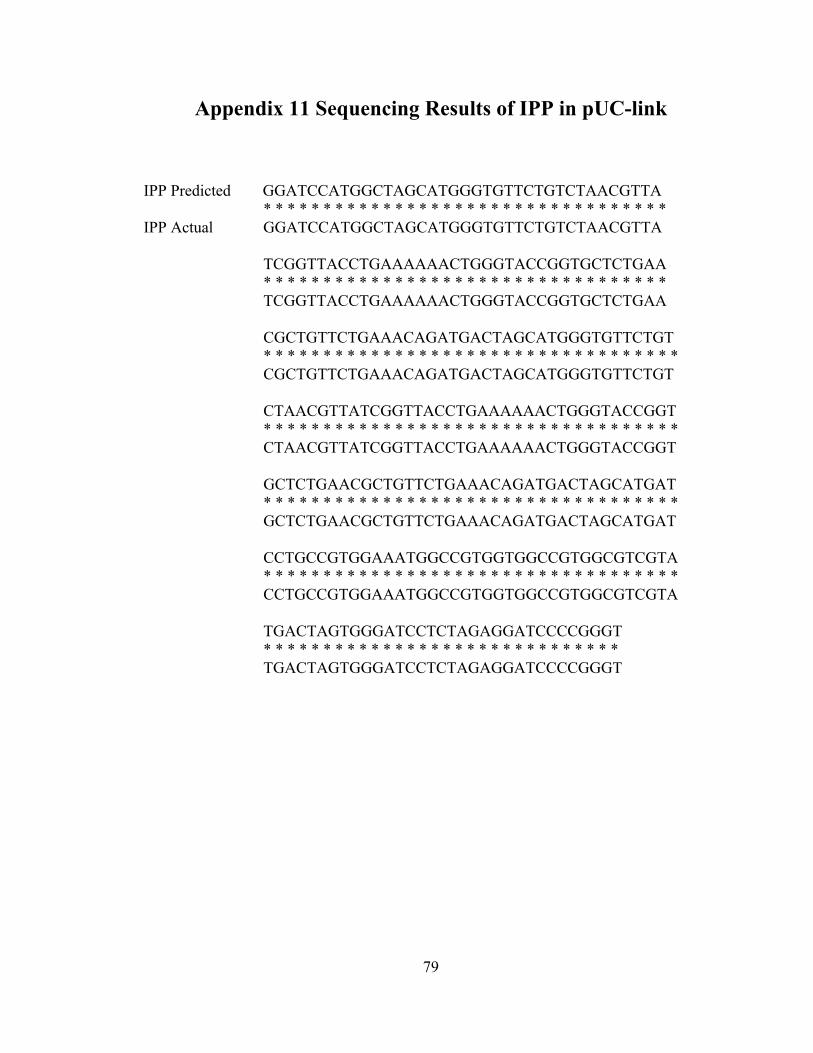
79
Appendix 11 Sequencing Results of IPP in pUC-link
IPP Predicted GGATCCATGGCTAGCATGGGTGTTCTGTCTAACGTTA * * * * * * * * * * * * * * * * * * * * * * * * * * * * * * * * * * IPP Actual GGATCCATGGCTAGCATGGGTGTTCTGTCTAACGTTA
TCGGTTACCTGAAAAAACTGGGTACCGGTGCTCTGAA * * * * * * * * * * * * * * * * * * * * * * * * * * * * * * * * * * TCGGTTACCTGAAAAAACTGGGTACCGGTGCTCTGAA CGCTGTTCTGAAACAGATGACTAGCATGGGTGTTCTGT * * * * * * * * * * * * * * * * * * * * * * * * * * * * * * * * * * * CGCTGTTCTGAAACAGATGACTAGCATGGGTGTTCTGT CTAACGTTATCGGTTACCTGAAAAAACTGGGTACCGGT * * * * * * * * * * * * * * * * * * * * * * * * * * * * * * * * * * * CTAACGTTATCGGTTACCTGAAAAAACTGGGTACCGGT GCTCTGAACGCTGTTCTGAAACAGATGACTAGCATGAT * * * * * * * * * * * * * * * * * * * * * * * * * * * * * * * * * * * GCTCTGAACGCTGTTCTGAAACAGATGACTAGCATGAT CCTGCCGTGGAAATGGCCGTGGTGGCCGTGGCGTCGTA * * * * * * * * * * * * * * * * * * * * * * * * * * * * * * * * * * * CCTGCCGTGGAAATGGCCGTGGTGGCCGTGGCGTCGTA TGACTAGTGGGATCCTCTAGAGGATCCCCGGGT * * * * * * * * * * * * * * * * * * * * * * * * * * * * * * TGACTAGTGGGATCCTCTAGAGGATCCCCGGGT
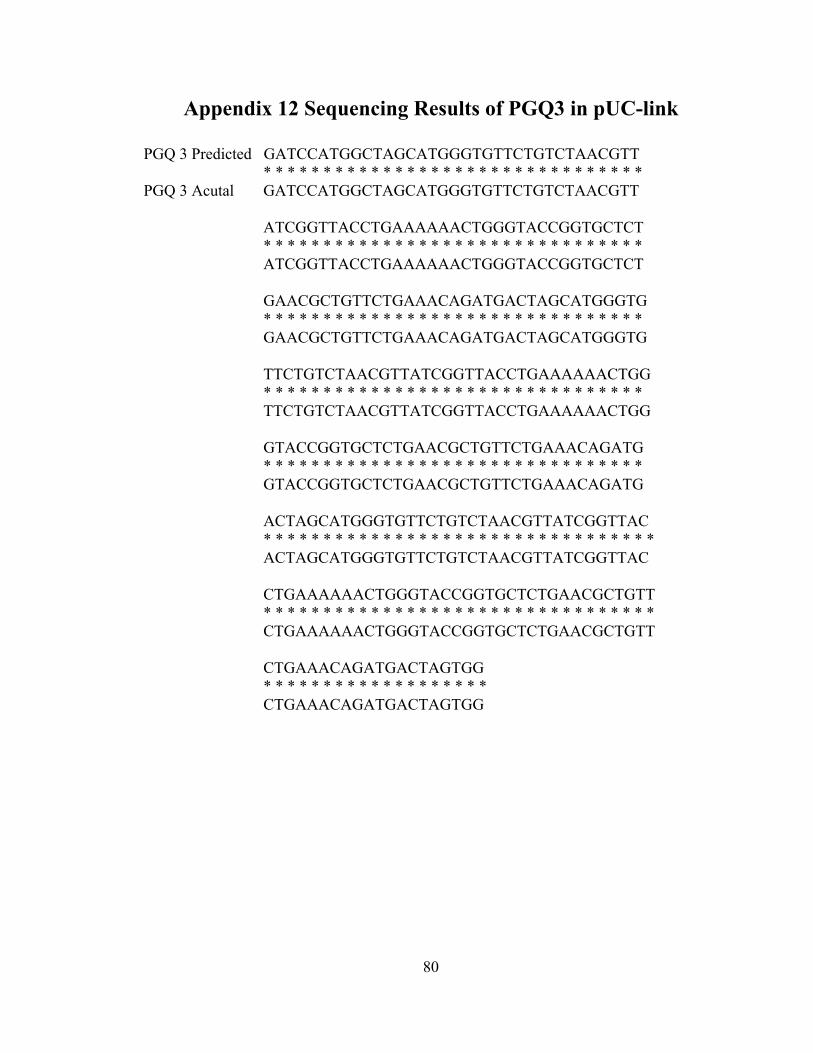
80
Appendix 12 Sequencing Results of PGQ3 in pUC-link
PGQ 3 Predicted GATCCATGGCTAGCATGGGTGTTCTGTCTAACGTT * * * * * * * * * * * * * * * * * * * * * * * * * * * * * * * * PGQ 3 Acutal GATCCATGGCTAGCATGGGTGTTCTGTCTAACGTT
ATCGGTTACCTGAAAAAACTGGGTACCGGTGCTCT * * * * * * * * * * * * * * * * * * * * * * * * * * * * * * * * ATCGGTTACCTGAAAAAACTGGGTACCGGTGCTCT
GAACGCTGTTCTGAAACAGATGACTAGCATGGGTG * * * * * * * * * * * * * * * * * * * * * * * * * * * * * * * * GAACGCTGTTCTGAAACAGATGACTAGCATGGGTG
TTCTGTCTAACGTTATCGGTTACCTGAAAAAACTGG * * * * * * * * * * * * * * * * * * * * * * * * * * * * * * * * TTCTGTCTAACGTTATCGGTTACCTGAAAAAACTGG GTACCGGTGCTCTGAACGCTGTTCTGAAACAGATG * * * * * * * * * * * * * * * * * * * * * * * * * * * * * * * * GTACCGGTGCTCTGAACGCTGTTCTGAAACAGATG ACTAGCATGGGTGTTCTGTCTAACGTTATCGGTTAC * * * * * * * * * * * * * * * * * * * * * * * * * * * * * * * * * ACTAGCATGGGTGTTCTGTCTAACGTTATCGGTTAC CTGAAAAAACTGGGTACCGGTGCTCTGAACGCTGTT * * * * * * * * * * * * * * * * * * * * * * * * * * * * * * * * * CTGAAAAAACTGGGTACCGGTGCTCTGAACGCTGTT CTGAAACAGATGACTAGTGG
* * * * * * * * * * * * * * * * * * * CTGAAACAGATGACTAGTGG
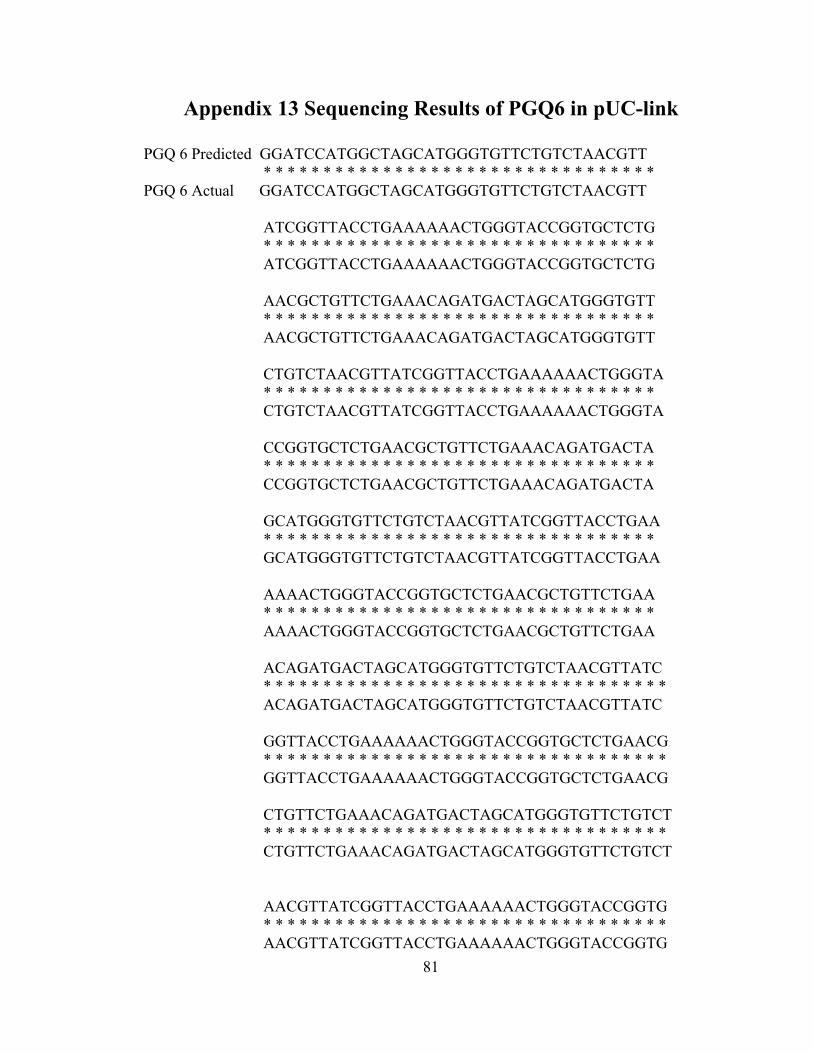
81
Appendix 13 Sequencing Results of PGQ6 in pUC-link
PGQ 6 Predicted GGATCCATGGCTAGCATGGGTGTTCTGTCTAACGTT * * * * * * * * * * * * * * * * * * * * * * * * * * * * * * * * *
PGQ 6 Actual GGATCCATGGCTAGCATGGGTGTTCTGTCTAACGTT
ATCGGTTACCTGAAAAAACTGGGTACCGGTGCTCTG * * * * * * * * * * * * * * * * * * * * * * * * * * * * * * * * *
ATCGGTTACCTGAAAAAACTGGGTACCGGTGCTCTG
AACGCTGTTCTGAAACAGATGACTAGCATGGGTGTT * * * * * * * * * * * * * * * * * * * * * * * * * * * * * * * * *
AACGCTGTTCTGAAACAGATGACTAGCATGGGTGTT
CTGTCTAACGTTATCGGTTACCTGAAAAAACTGGGTA * * * * * * * * * * * * * * * * * * * * * * * * * * * * * * * * * CTGTCTAACGTTATCGGTTACCTGAAAAAACTGGGTA
CCGGTGCTCTGAACGCTGTTCTGAAACAGATGACTA * * * * * * * * * * * * * * * * * * * * * * * * * * * * * * * * * CCGGTGCTCTGAACGCTGTTCTGAAACAGATGACTA
GCATGGGTGTTCTGTCTAACGTTATCGGTTACCTGAA * * * * * * * * * * * * * * * * * * * * * * * * * * * * * * * * * GCATGGGTGTTCTGTCTAACGTTATCGGTTACCTGAA
AAAACTGGGTACCGGTGCTCTGAACGCTGTTCTGAA * * * * * * * * * * * * * * * * * * * * * * * * * * * * * * * * * AAAACTGGGTACCGGTGCTCTGAACGCTGTTCTGAA
ACAGATGACTAGCATGGGTGTTCTGTCTAACGTTATC * * * * * * * * * * * * * * * * * * * * * * * * * * * * * * * * * * ACAGATGACTAGCATGGGTGTTCTGTCTAACGTTATC
GGTTACCTGAAAAAACTGGGTACCGGTGCTCTGAACG * * * * * * * * * * * * * * * * * * * * * * * * * * * * * * * * * * GGTTACCTGAAAAAACTGGGTACCGGTGCTCTGAACG
CTGTTCTGAAACAGATGACTAGCATGGGTGTTCTGTCT * * * * * * * * * * * * * * * * * * * * * * * * * * * * * * * * * * CTGTTCTGAAACAGATGACTAGCATGGGTGTTCTGTCT AACGTTATCGGTTACCTGAAAAAACTGGGTACCGGTG * * * * * * * * * * * * * * * * * * * * * * * * * * * * * * * * * * AACGTTATCGGTTACCTGAAAAAACTGGGTACCGGTG
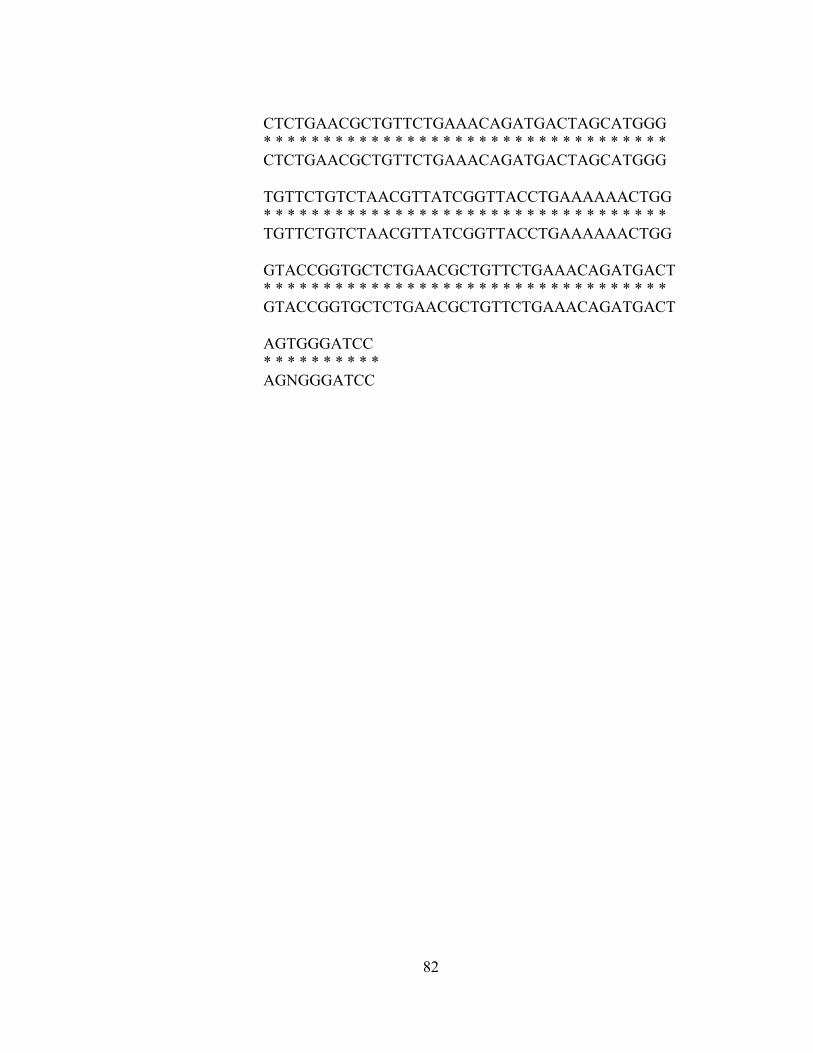
82
CTCTGAACGCTGTTCTGAAACAGATGACTAGCATGGG * * * * * * * * * * * * * * * * * * * * * * * * * * * * * * * * * * CTCTGAACGCTGTTCTGAAACAGATGACTAGCATGGG
TGTTCTGTCTAACGTTATCGGTTACCTGAAAAAACTGG * * * * * * * * * * * * * * * * * * * * * * * * * * * * * * * * * * TGTTCTGTCTAACGTTATCGGTTACCTGAAAAAACTGG
GTACCGGTGCTCTGAACGCTGTTCTGAAACAGATGACT * * * * * * * * * * * * * * * * * * * * * * * * * * * * * * * * * * GTACCGGTGCTCTGAACGCTGTTCTGAAACAGATGACT AGTGGGATCC
* * * * * * * * * * AGNGGGATCC