closing the education gender gap: estimating the … · public middle and high schools were ......
TRANSCRIPT

Closing the Education Gender Gap: Estimating the Impact of Girls’ Scholarship Program in The Gambia
Ousman Gajigo
No 164 - December 2012

Correct citation: Gajigo, Ousman, (2012), Closing the Education Gender Gap: Estimating the Impact of Girls’
Scholarship Program in The Gambia, Working Paper Series N° 164 African Development Bank, Tunis, Tunisia.
Steve Kayizzi-Mugerwa (Chair) Anyanwu, John C. Faye, Issa Ngaruko, Floribert Shimeles, Abebe Salami, Adeleke Verdier-Chouchane, Audrey
Coordinator
Working Papers are available online at
http:/www.afdb.org/
Copyright © 2012
African Development Bank
Angle de l’avenue du Ghana et des rues
Pierre de Coubertin et Hédi Nouira
BP 323 -1002 TUNIS Belvédère (Tunisia)
Tel: +216 71 333 511
Fax: +216 71 351 933
E-mail: [email protected]
Salami, Adeleke
Editorial Committee Rights and Permissions
All rights reserved.
The text and data in this publication may be
reproduced as long as the source is cited.
Reproduction for commercial purposes is
forbidden.
The Working Paper Series (WPS) is produced
by the Development Research Department
of the African Development Bank. The WPS
disseminates the findings of work in progress,
preliminary research results, and development
experience and lessons, to encourage the
exchange of ideas and innovative thinking
among researchers, development
practitioners, policy makers, and donors. The
findings, interpretations, and conclusions
expressed in the Bank’s WPS are entirely
those of the author(s) and do not necessarily
represent the view of the African Development
Bank, its Board of Directors, or the countries
they represent.

Closing the Education Gender Gap: Estimating the Impact of Girls’
Scholarship Program in The Gambia
Ousman Gajigo1
1 Research Department at the African Development Bank ([email protected] ). The author is grateful to the Gambian
Bureau of Statistics for access to the household survey data, and to the Ministry of Education for sharing information about
the scholarship program. The author is also thankful to the participants at the 2012 Northeast Universities Development
Consortium (NEUDC) conference at Dartmouth, as well as colleagues at the African Development Bank for insightful
comments.
AFRICAN DEVELOPMENT BANK GROUP
Working Paper No. 164 December 2012
Office of the Chief Economist

Abstract
This paper estimates the enrollment
impact of a nation-wide scholarship
program for female secondary students
in The Gambia implemented to reduce
gender disparity in education. In the
regions where the scholarship program
was implemented, all girls attending
public middle and high schools were
exempted from paying school fees,
which used to be mandatory. The
gradual implementation of the project
provided a unique opportunity to
rigorously assess the enrollment impact
of the scholarship program. We use two
nationally representative household
surveys carried out in 1998 and 2002/03.
By 2002/03, about half of the districts in
the country had benefited from the
project. We found that the program
increased enrollment for middle and
high school female students by 9
percentage points, and increased the
years of schooling attained by 0.3 to 0.4.
The program had no significant impact
on enrollment or years of schooling
attained for male students at any level.
Key Words: Gender; Education; Enrollment; School fees; Scholarship.
JEL classification: I20, I22, O12.

5
I. Introduction
Universal primary education and the elimination of gender gap in enrollment rates are two of the
targets in the Millennium Development Goals (MDGs). Achieving these goals has been a high
development priority for sub-Saharan African countries over the past decade. The challenges in this
sector remain significant. Approximately 32% of primary school age children do not attend school and
34% of all youths do not attend secondary school in sub-Saharan Africa (UNESCO 2012). In addition,
the adult literacy rate in Africa is 62%, which is far lower than the global average (84%). The ratio of
female to male enrollment at secondary level is 79%.
The reality in The Gambia is a microcosm of situation in the region as a whole. While enrollment rates
have risen recently in The Gambia, they have been historically low. Average net enrollment rates in the
country between 1999 and 2007 for primary, middle and high school levels were 61%, 30% and 16%
respectively. These low enrollment rates have persisted despite the high rate of returns to education in
the country (Foltz and Gajigo 2012). The reason for this low enrollment in the face of high returns is
the significant direct and indirect cost of schooling. The direct costs to school attendance such as
schools in The Gambia fees are significant. Schools fees are mandatory at middle and high school
levels. For private schools, fee payments start naturally at primary school. While the payments of these
fees are essential to help meet the funding requirements for running schools, they disadvantage poor
families that are cash or liquidity constrained. Opportunity cost of sending children to school also
feature as a significant indirect cost since many poor families depend on the children’s labor supply
either at home or outside.
A major feature of the education landscape in The Gambia is gender disparity in educational
attainment. For instance, the literacy rate of male youth is 17% higher than that of female youth. The
country has, however, made significant progress in lessening the gender gap by closing the enrollment
differential in recent years. The country achieved gender parity in primary school enrollment in 2004 –
the current ratio of female to male enrollment at primary school level is 102%. A decade earlier, the
ratio of female to male enrollment had been 87%. At secondary school level, the female to male ratio is
currently 95%, and had been 74% a decade before in 2001.
This paper estimates the schooling impact of a nation-wide scholarship program for female secondary
students. The program is funded jointly by the Gambian government, UNICEF, World Bank and the
IMF (though the HIPC program) to help the country reach the MDG targets in reducing gender
disparity in secondary school enrollment. In the regions where the scholarship program was
implemented, all girls attending public (government-run) middle and high schools were exempted from
paying school fees, which used to be mandatory. The program started in 2000 in few districts of the
country, and expanded across the country geographically (from east to west). This gradual expansion of
the program in the initial implementation phases provides a unique opportunity to rigorously assess the
causal impact of the scholarship program on educational outcomes. We use two nationally
representative household surveys that were carried out in 1998 and 2002/03. In 1998, the program had
not been implemented while in 2002, about half of the districts in the country had benefited from the
project. This makes it possible to analyze the schooling impact of the program using difference-in-
difference strategy – an impact evaluation strategy that is almost ideal to this setting.
I analyze the program’s impact for female students of different student age cohorts. The results show
that the program had a significant enrollment effect for female students of all student-age groups.

6
Specifically, the program led to approximately 8 to 9 percentage point enrollment increase for middle
and high school female students. In addition, the enrollment effect of the program for girls at primary
level is significantly positive (about 9 percentage points), suggesting that the removal of school fees
caused households to further increase female primary school enrollment in anticipation of lower future
costs. And years of schooling attained increased by 0.3 to 0.4 for female students. We found no
significant schooling effect (enrollment and years of schooling attained) of the program on male
students at any level (primary, middle or high school). The estimated results are robust to controlling
for other policy changes that occurred in the country during the period of the scholarship program
implementation that could have affected student enrollment. For example, there was a significant
expansion in school construction in parts of the country. This possibly confounding effect is addressed
by controlling for the number of schools at the district level. The results also show that student-teacher
ratio increased at the same time as the program increased enrollment suggesting that the program was
accompanied by decline in school quality. However, data limitation prevents this latter effect from
being rigorously assessed.
The rest of the paper is structured as follows. The next section (II) briefly examines the experience of
other African countries in abolishing school fees, and analyses of their effects on schooling outcomes.
Section III describes the scholarship program in The Gambia and its implementation. Section IV
provides a description of the data. The estimation strategy and results of the program’s impact on
enrollment are presented in section V. Section VI concludes the paper.
II. Literature on Abolishing School Fees in Africa and Scholarship Programs
Abolishing school fees to increase enrollment is not a new policy initiative in Africa. Nigeria
implemented a universal primary education initiative in 1976, where all fees payments were removed
for primary school students. The program was ended in 1981 because it was not financially sustainable
(Osili and Long 2008). Other African countries that implemented similar short-lived universal primary
education programs characterized by the abolition of school fees are Ghana, Kenya and Tanzania
(World Bank and UNICEF 2009; Oketch and Rolleston 2007). With the setting of the MDG targets,
more African countries have started to abolish school fees to increase their chances of meeting the
various education targets. Sub-Saharan African countries that have recently abolished school fees at the
primary school level are Ethiopia, Ghana, Kenya, Malawi, Mozambique and Tanzania.
While the fee reduction initiatives may produce the intended outcomes, it is not clear how many of the
countries that have implemented them have rigorously assessed their impact. Al-Samarrai and Zaman
(2007) found a positive effect of school fees removal on enrollment in Malawi. While there is little
doubt that the abolition of the school fees increased enrollment, it is difficult to attribute the estimated
effect to that specific policy since the paper essentially carries out a before-and-after comparison of
enrollment rates. In Ghana and Mozambique, enrollments increase of 14% and 12% respectively have
been attributed to the abolishing of school fees (World Bank 2009). In these latter cases as well, the
estimated effects were derived from before-and-after comparison. The main problem with this type of
analysis is that it does not control for exiting trends in enrollment and the effects of other policy
changes. If trends in enrollments are significantly positive, a before-and-after comparison will overstate
the impact of the school fees removal.
Recently, more rigorously assessments of policy changes on enrollment have been carried out on
implemented programs, though mostly in other regions of the world. Behrman and Todd (2009)

7
estimated the impact of the conditional cash transfer program in Mexico on schooling attained to be
significant. The authors were able to estimate the causal impact of the program due to the random
assignment of households to control and treatment groups. Barrera-Osorio et al. 2007) found that a fee-
reduction program in Bogota, Colombia increased enrollment by 3% to 6%. The authors use regression
discontinuity strategy, taking advantage of program eligibility requirements to isolate the causal impact
of the project on enrollment. Deininger (2003) evaluates the impact of the universal primary education
(UPE) program implemented in Uganda in 1997 where the government removes all school fees at the
primary school level. By using two repeated cross-sectional households surveys collection in 1992 and
1999, he found that the program increased enrollment, reduced enrollment inequality, but led to a fall
in school quality. In addition, the program did not have an enrollment effect at the secondary school
level. However, the attribution of a precise causal impact of the program is complicated by the fact that
the UPE program took effect nationwide at the same point in time (January 1, 1997).
The estimation strategy used in Deininger (2003) essentially assumes that differential enrollment by
income, gender and regions between 1992 and 1999 can be attributed to the UPE program effects. In
other words, without the program, there should not have been any differences in growth trends by
gender, region or income. While this assumption is not unreasonable, the nature of the implementation
does not allow for the existence of a control region to assess whether in the absence of the UPE, pre-
program trends would continue.
Not all school fee reductions or removals have worked as intended. The initial increase in enrollments
rates following Kenya’s removal of schools fees at primary school level in 2003 did not last (Bold et al.
2010). There appeared to have been a significant flight towards private schools, possibly in response to
declining fall in public school quality. This outcome seems hardly surprising given that the program in
Kenya was announced in the middle of the fiscal year, with neither preparation nor budgetary
allocation to fund it (World Bank and UNICEF 2009).
There are few rigorous studies of scholarship program, especially those designed specifically for
female students. One of the few is Filmer and Schady (2008) that evaluated the impact of a scholarship
program for girls in Cambodia. The scholarship program was given to girls starting grade 7, which is
the first year of secondary school in that country. The authors used both propensity score matching and
regression discontinuity to estimate the causal impact on enrollment and attendance, which they found
to be highly positive. Furthermore, the program had a positive distributional impact in that the
enrollment impact was higher for girls from poorer households.
This paper contributes to the literature on the impact of abolishing school fees on enrollment and
schooling attainment in Africa. The scholarship program in The Gambia removed school fees for
female students attending public secondary schools in the regions it was implemented (unlike many
African countries, the Gambia does not have school fees for public schools at the primary level). By
taking advantage of the phase roll-out of the program over time, the impact of the program on
enrollment and schooling attainment was rigorously estimated using difference-in-difference strategy.
To my knowledge, this is the first impact evaluation of enrollment of an almost nation-wide female
scholarship program in Africa. More precise estimate of the impact of reducing schools is importance
since it will enable governments to better assess the trade-offs involved with implementing similar
policies.

8
III. Education in The Gambia and Girls’ Scholarship Program
The net enrollment rate at the primary2 school level is currently 65% in The Gambia. This has been
growing at the rate of 1% per annum over the past two decades. At this rate, country will not meet the
MDG target of at least 95% net enrollment rate by 2015. Secondary school level net enrollment rates,
which usually lags behind primary school rate, are currently at 40% for middle school and 25% for
high school. On the other hand, the country has made a great deal of progress towards gender equality
in education. Currently, the ratio of female to male enrollment at primary school level is 102% - the
100% parity level had been reached since 2004. In 1990, this ratio had been only 63%. For the
secondary school level, the ratio of female to male enrollment is currently at 95%, and had been 47% in
1990 (World Bank 2012). The closing of the gender gap in school enrollment naturally leads to the
question of what policies were implemented to achieve this development target.
Figure 1: Map of The Gambia and its regions.
The scholarship program for female middle and high school students started as an initiative funded jointly by
UNICEF, the World Bank, the IMF through the Highly Indebted Poor Countries (HIPC) and the Gambian
government. The goal of the program is to increase the overall student enrollment but with a specific focus on
reducing the gender gap in education. The program planned to achieve this goal by paying for the mandatory
schools fees for all girls in the regions (figure 1) in which it is implemented. The program covers students
attending only public schools. This latter condition is not too restrictive since most schools outside of the major
urban areas are public schools.
The scholarship program was implemented geographically from east to west over time to cover most of the
country. It was first implemented in regions 5 and 6 (figure 2) in the 2000/01 academic year. In 2000, these two
regions represented 28% of Gambia’s population and cover 14 of the 39 districts in the country. In 2001/02, the
program was extended to regions 3 and 4. These latter regions comprise about 19% of the country’s population,
and additional 12 districts. The program was further extended to region 2 in 2003/04. This latter region accounts
2 The current formal school system in The Gambia is based on the following: 6 years of primary school, 3 years of middle
school, known locally as upper basic and 3 years of high school, known locally as senior secondary school. Primary school
is intended for students between the ages of 7-12, middle school for students between 13-15, and high school for students
between the ages of 16-18. Due to the presence of repeaters, there are students at levels that are below their age-appropriate
level.

9
for about 27% of the Gambian population and 9 districts. The scholarship program has not been extended to
Region 1, which is the urban area of the Gambia. Region 1, which covers 4 districts and comprises about 26% of
the country’s population, is the most developed and urbanized part of the country3.
The program is administered by directly remitting the value of the school fees from the program’s account into
the regional offices of the Ministry of Education. A Fund Administrator was set-up at the Ministry of Education
that controlled the disbursement between the program and schools. The regional education offices verify the
enrollment figures provided by the individual schools. In other words, students or households were not given the
scholarship amount of the money. It was in effect a voucher system that was redeemed by the schools rather than
households. The average cost of the program per student was US$ 48, US$ 43, US$ 42 and US$ 43 in 2000/01,
2001/02, 2002/03 and 2003/04 respectively4 (Ministry of Education 2004). The program was widely publicized
on the local media, as well as through several workshops in various regions of the country.
It should be pointed out that various school-related interventions of many kinds are continually implemented
through several local community initiatives, charitable and non-government organizations. Some of these
include limited support to particular villages or individual schools, as well as direct student support. However,
none of these effects are close to the scale of the scholarship program being assessed. Furthermore, the
implementations of these programs are independent undertakings, and are uncoordinated among themselves or
with the central government. Therefore, it is unlikely that these smaller programs would be large enough or
correlated enough with the scholarship program to bias the estimation strategy employed in this paper.
3 There is no decentralization in the Gambia. So the central government chose the order in which the program was rolled
out, not the regions themselves. 4 These differences overtime reflect not only varying exchange rates (exchange rate (the average US dollar per Gambian
Dalasi was approximately 13, 15, 20, 27 between 2000 and 2003) but also different composition of middle and secondary
school students over time as different regions are covered.

10
Figure 2: The roll-out of the scholarship program for middle and high school female students. The light green
areas represent the scholarship regions.
Panel A: Scholarship Coverage between 1998 and 2000.
Panel B: Scholarship Coverage in 2000/01
Panel C: Scholarship Coverage in 2001/02
Panel D: Scholarship Coverage in 2003/04
11
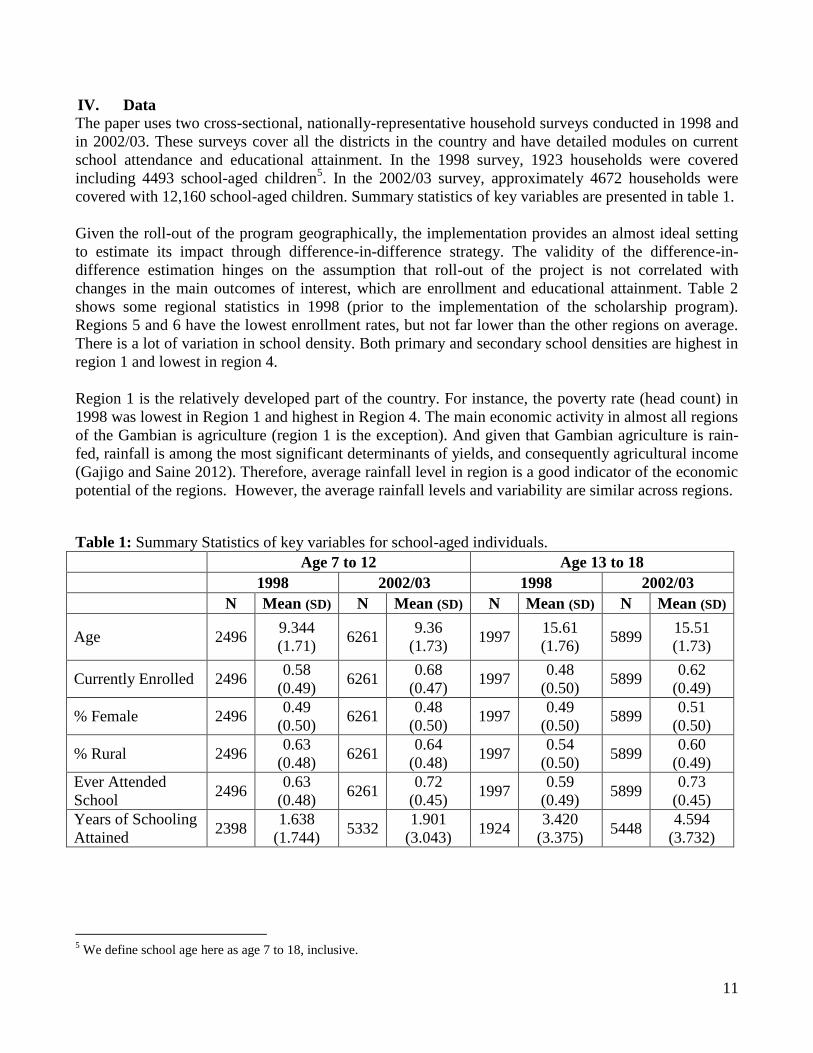
IV. Data
The paper uses two cross-sectional, nationally-representative household surveys conducted in 1998 and
in 2002/03. These surveys cover all the districts in the country and have detailed modules on current
school attendance and educational attainment. In the 1998 survey, 1923 households were covered
including 4493 school-aged children5. In the 2002/03 survey, approximately 4672 households were
covered with 12,160 school-aged children. Summary statistics of key variables are presented in table 1.
Given the roll-out of the program geographically, the implementation provides an almost ideal setting
to estimate its impact through difference-in-difference strategy. The validity of the difference-in-
difference estimation hinges on the assumption that roll-out of the project is not correlated with
changes in the main outcomes of interest, which are enrollment and educational attainment. Table 2
shows some regional statistics in 1998 (prior to the implementation of the scholarship program).
Regions 5 and 6 have the lowest enrollment rates, but not far lower than the other regions on average.
There is a lot of variation in school density. Both primary and secondary school densities are highest in
region 1 and lowest in region 4.
Region 1 is the relatively developed part of the country. For instance, the poverty rate (head count) in
1998 was lowest in Region 1 and highest in Region 4. The main economic activity in almost all regions
of the Gambian is agriculture (region 1 is the exception). And given that Gambian agriculture is rain-
fed, rainfall is among the most significant determinants of yields, and consequently agricultural income
(Gajigo and Saine 2012). Therefore, average rainfall level in region is a good indicator of the economic
potential of the regions. However, the average rainfall levels and variability are similar across regions.
Table 1: Summary Statistics of key variables for school-aged individuals.
Age 7 to 12 Age 13 to 18
1998 2002/03 1998 2002/03
N Mean (SD) N Mean (SD) N Mean (SD) N Mean (SD)
Age 2496 9.344
(1.71) 6261
9.36
(1.73) 1997
15.61
(1.76) 5899
15.51
(1.73)
Currently Enrolled 2496 0.58
(0.49) 6261
0.68
(0.47) 1997
0.48
(0.50) 5899
0.62
(0.49)
% Female 2496 0.49
(0.50) 6261
0.48
(0.50) 1997
0.49
(0.50) 5899
0.51
(0.50)
% Rural 2496 0.63
(0.48) 6261
0.64
(0.48) 1997
0.54
(0.50) 5899
0.60
(0.49)
Ever Attended
School 2496
0.63
(0.48) 6261
0.72
(0.45) 1997
0.59
(0.49) 5899
0.73
(0.45)
Years of Schooling
Attained 2398
1.638
(1.744) 5332
1.901
(3.043) 1924
3.420
(3.375) 5448
4.594
(3.732)
5 We define school age here as age 7 to 18, inclusive.

12
Table 2: The comparison of regions prior to the implementation of the project. The household level data is from
only 1998.
Age 7 to 12 Age 13 to 18
1998 2002/03 1998 2002/03
N Mean (SD) N Mean (SD) N Mean (SD) N Mean (SD)
Age 2496 9.344
(1.71) 6261
9.36
(1.73) 1997
15.61
(1.76) 5899
15.51
(1.73)
Currently Enrolled 2496 0.58
(0.49) 6261
0.68
(0.47) 1997
0.48
(0.50) 5899
0.62
(0.49)
% Female 2496 0.49
(0.50) 6261
0.48
(0.50) 1997
0.49
(0.50) 5899
0.51
(0.50)
% Rural 2496 0.63
(0.48) 6261
0.64
(0.48) 1997
0.54
(0.50) 5899
0.60
(0.49)
Ever Attended
School 2496
0.63
(0.48) 6261
0.72
(0.45) 1997
0.59
(0.49) 5899
0.73
(0.45)
Years of Schooling
Attained 2398
1.638
(1.744) 5332
1.901
(3.043) 1924
3.420
(3.375) 5448
4.594
(3.732)
V. Estimation and Results
a. Main Results Due to the manner of its implementation, the scholarship program lends itself quite well to the use of
difference-in-difference6 (DD) strategy to estimate its impact on its main outcome, which is female
student enrollment. Two repeated cross-sectional household surveys conducted in 1998 and 2002/03
were used to estimate the following equation:
( ) (1)
Where represents schooling outcome (enrollment or educational attainment) of individual i in
region r at year t, is the constant term, is the dummy for year 2002/03 (post treatment year),
is a dummy variable for regions where the scholarship program was implemented,
is the interaction of the program placement and year 2002/03, while is the
error term. The parameter captures the average permanent difference between program and non-
program regions, represents the trend effects in schooling outcomes common to all regions. The key
parameter of interest is .
Let:
( ) [ ] (2)
( ) [ ] (3)
( ) [ ] (4)
( ) [ ] (5)
6 Also known as double difference.

13
The difference-in-difference estimate of the program impact is:
{ ( ) ( )} { ( ) ( )} (6)
In other words, captures the average impact of the scholarship program on student outcomes such as
enrollment and educational attainment. By 2002/2003 (the implementation of the second round survey),
regions 3, 4, 5 and 6 had been part of the scholarship program while regions 1 and 2 were not. In effect,
the control regions are regions 1 and 2, against which the impact of the scholarship program in regions
3, 4, 5 and 6 are being compared. The unbiased estimation of in equation (1) also assumes the
absence of other policy changes that occurred in the same time period and could have affected student
enrollment one way or another. It also assumes the presence of a common trend in all the regions in the
absence of the program. The possibility that these assumptions may not hold are examined later.
The estimation of equation 1 is presented in Table 3. The results are broken by different school-age
group (all school age, primary school age and secondary school age). We include the primary age
group to examine if the benefits of the program extend beyond the targeted population through the
program’s effect on household budget constraints. The first panel (columns 1 to 3), uses current
enrollment as the dependent variable. For all school age groups, the enrollment effect of the scholarship
program is significant. It led to 8 to 9 percentage point increase in enrollment. The second panel of
table 3 (columns 4 and 6) uses years of schooling attained as the dependent variable. It also shows that
the program has a significant impact on schooling. The magnitude of this effect is similar for all female
age cohorts. Similarly, the program led to an increase in years of schooling of 0.3 to 0.4 for secondary
as well as primary school age girls. In this outcome variable as well, the estimated impact is similar
(difference is not statistically significant) for all female school age groups.
It is worth recalling that the scholarship is targeted at female student attending secondary school (from
age 13 to 18) since fee payments start at middle school level in The Gambia for public schools.
Therefore, the fact that the scholarship program has an effect on younger girls at primary school level is
note-worthy. This particular result is consistent with Lavy (1996) who also found some elasticity
between school outcomes at the primary level and cost at the secondary school level.
The negative sign on the coefficients of the female dummy in table 3 is expected since it captures the
existing average difference in schooling outcomes between male and female students when the
household surveys were implemented. A similar argument applies to the negative coefficient for the
rural dummy.

14
Table 3: Female Students Only. The results from estimating equation (1). The dependent variable for
columns 1 to 3 is current enrollment, while the dependent variable for column 4 to 6 is years of
schooling attained. Clustered standard errors are in parentheses.
Female School-aged Sample Only
Current enrollment (Marginal Probit) Years of schooling attained (OLS)
All school
age
(Aged 7 to
18)
Primary
School
Age (Aged
7 to 12)
Secondary
School Age
(Aged 13 to
18)
All school
age
(Aged 7 to
18)
Primary
School Age
(Aged 7 to
12)
Secondary
School
Age (Aged
13 to 18)
1 2 3 4 5 6
Year 2003 Dummy 0.120***
(0.019)
0.094***
(0.017)
0.158***
(0.032)
0.810***
(0.149)
0.274**
(0.101)
0.921***
(0.289)
Program dummy -0.246***
(0.025)
-0.229***
(0.019)
-0.290***
(0.045)
-1.690***
(0.474)
-0.793***
(0.190)
-2.739**
(0.702)
Program*Year 2003
Dummy
0.090***
(0.029)
0.079**
(0.038)
0.124**
(0.043)
0.411*
(0.217)
0.327**
(0.187)
1.001**
(0.352)
Constant
2.949***
(0.426)
1.937***
(0.106)
4.147***
(0.645)
Observation 8193 4220 3973 7430 3728 3702
R squared
0.06 0.02 0.1 ***significant at 1%; **significant 5%; *significant at 10%.
b. Controlling for other variables
The information in Table 2 shows that the regions are not identical in the level of development or
educational outcomes at the time the scholarship program was introduced. For instance, the average
years of schooling attained in Region 1 is significantly higher over that of Regions 5 and 6. While the
difference in levels is not a problem in and of itself, it could suggest difference in trends. For instance,
the geographical phasing of the program is correlated with the average educational attainment in
regions. To attempt to control for some of these pre-existing regional differences, equation (1) is
augmented. Furthermore, equation (7) is now a triple difference-in-difference (DDD):
( ) ( ) (7)
Where is a vector of variables such as age, rural residence, household size, mean years of
schooling of adults in households, age of household head, the number of primary schools in district and
the number of secondary schools in district7. Pre-existing differences in the distributions of individual
and household level variables between program and non-program area could lead to biased results if
not controlled for. For instance, rural and urban differences can help control for pre-existing differences
in income or types of livelihood activities, which could lead to different trends. The validity of the
7 Ideally, the inclusion of a variable on household assets (to estimate wealth) would be nice to include. Unfortunately, that
was not available for the 1998 household survey. However, poverty is highly correlated with household size and adult
education (Gambia Bureau of Statistics 2008), and these latter variables are included.

15
program impact from equation (1) also rests on the assumption that other policies or programs were not
put in place in regions 3, 4, 5 and 6 between 1998 and 2003 at the time that could result in different
enrollment rates. This is a non-trivial possibility in The Gambia. The country has witnessed a
significant number of school constructions. Specifically, the number of primary and secondary schools
increased at annual rates of 4% and 10% respectively between 1998 and 20038. So the inclusion of the
number schools at the district levels can help to control for the possible bias that could be introduced
through enrollment increase caused by school construction as opposed to the scholarship program. So
in equation (7), the parameter, captures the effect of the scholarship program on female students,
while captures the program impact on male students.
The estimation results of equation (7) are presented in Table 4. Columns 1 to 3 present the results for
enrollment, while columns 4 to 6 show the results for years of education attained. The enrollment
impact of the program is still 8 to 9 percentage points for female students relative to males. And the
years of schooling impact of the scholarship program for school-age female students is still 0.3 to 0.4.
Furthermore, estimates of the program impact on enrollment and years of schooling in tables 3 and 4
are not significantly different from the estimates in tables 5 and 6.
The coefficients on the other variables have mostly intuitive signs and interpretations. For instance, the
coefficient on the female dummy is negative, showing that lower educational outcome for females at
the time of the survey. For similar reasons, the rural dummy sign is negative (but not significant).
Household size is negative and consistent, which is consistent with the findings in other reports about
this variable being a major signifier of household wealth (Gambia Bureau of Statistics 2008).
Surprisingly, the coefficients for the number of primary and secondary schools are not significant.
There are potentially several explanations for such a result. It could be that the number of primary and
secondary school in district are highly correlated. It could also imply that expansion in schools has led
to some drop in quality, thereby counteracting enrollment.
8 In 1998, the number of primary and secondary schools in the country were 324 and 85 respectively. In 2003, primary and
secondary schools are 387 and 134 respectively.

16
Table 4: DDD Results. The results from estimating equation (7). The dependent variable for columns 1
to 3 is current enrollment, while the dependent variable for column 4 to 6 is years of schooling attained.
Clustered standard errors are in parentheses.
Using both Male and Female Age Sample
Current enrollment (Marginal Probit) Years of schooling attained (OLS)
All school
age
(Aged 7 to
18)
Primary
School Age
(Aged 7 to
12)
Secondary
School
Age (Aged
13 to 18)
All school
age
(Aged 7 to
18)
Primary
School Age
(Aged 7 to
12)
Secondary
School Age
(Aged 13
to 18)
1 2 3 4 5 6
Age -0.015***
(0.002)
0.036***
(0.004)
-0.065***
(0.004)
0.342***
(0.060)
0.399***
(0.051)
0.149***
(0.065)
Household Size -0.006***
(0.002)
-0.005***
(0.002)
-0.006***
(0.002)
-0.037***
(0.007)
-0.025***
(0.007)
-0.047***
(0.011)
Years of education of
Adults in Household
0.044***
(0.008)
0.041***
(0.007)
0.050***
(0.010)
0.322***
(0.026)
0.164***
(0.022)
0.469***
(0.049)
Age of Household Head 0.001***
(0.0004)
0.001
(0.001)
0.002***
(0.0004)
0.013**
(0.004)
0.008
(0.005)
0.017***
(0.004)
Rural Dummy -0.035
(0.063)
-0.030
(0.055)
-0.042
(0.075)
-0.442
(0.359)
-0.096
(0.182)
-0.799
(0.515)
Number of Primary
School in District
-0.0002
(0.001)
0.0002
(0.002)
-0.0004
(0.001)
0.004
(0.004)
0.003
(0.008)
0.002
(0.003)
Number of Secondary
School in District
-0.004*
(0.002)
-0.004*
(0.002)
-0.004
(0.002)
-0.010
(0.009)
-0.0005
(0.006)
-0.018
(0.012)
Year 2003 Dummy 0.130***
(0.027)
0.115***
(0.024)
0.152***
(0.034)
0.592***
(0.138)
0.140
(0.103)
0.974***
(0.191)
Female Dummy -0.097***
(0.010)
-0.062***
(0.009)
-0.135***
(0.023)
-0.552***
(0.054)
-0.170***
(0.043)
-0.914***
(0.077)
Program*Year 2003
Dummy*Female
Dummy
0.090***
(0.018)
0.091**
(0.030)
0.083***
(0.022)
0.356***
(0.115)
0.312***
(0.097)
0.384**
(0.153)
Program*Year 2003
Dummy
-0.041
(0.035)
-0.053
(0.046)
-0.022
(0.053)
-0.082
(0.222)
-0.053
(0.212)
0.115
(0.299)
Program dummy -0.180***
(0.023)
-0.170***
(0.016)
-0.192***
(0.035)
-0.672***
(0.184)
-0.289
(0.193)
-1.230***
(0.270)
Constant
-1.770*
(0.963)
-2.320***
(0.646)
1.217
(1.299)
Observations 16400 8625 7775 14930 7638 7292
R squared
0.29 0.12 0.29
***significant at 1%; **significant 5%; *significant at 10%.
The results in table 4 show that the estimates of the time trend in education outcomes are positive. In
fact, the magnitude of the time trend is significantly higher than the estimated program effect most of
the time. This positive significant coefficient suggests that even in the absence of the scholarship
program, there exists a secular rise in enrollment rates and schooling attainment over time for both
program and non-program regions. Therefore, the use of a simple before-and-after difference would
have led to biased claims about the impact of the scholarship on enrollment and schooling attainment in
an upward direction.

17
c. Program Effect on Male Students
Even though the program was targeted at only female students, we also examine its effect on male
students. It is possible for the program to increase male student enrollment since lower cost for female
student can help relax household budget constraints. The estimation of equation (1) for male students
only is presented in Table 5. These results show that the program had no significant impact on males of
any school age group.
It is worth pointing out that if the estimated positive effect of the program on educational outcomes for
female students is due to some possible differences in pre-existing trends by region, this bias should
occur for male students as well. It is not obvious why there should be significant pre-existing
differences among regions in educational outcomes for female students but not for male students.
Therefore, this differential gender outcome for enrollment and schooling attainment, and given the fact
that the scholarship program funds only female students, is a strong suggestion that the estimated
gendered impact is real and attributable to the program.
Table 5: Male Students Only. The results from estimating equation (1). The dependent variable for columns 1
to 3 is current enrollment, while the dependent variable for column 4 to 6 is years of schooling attained.
Clustered standard errors are in parentheses.
Male School Age Sample Only
Current enrollment (Marginal Probit) Years of schooling attained (OLS)
All school
age
(Aged 7 to
18)
Primary
School Age
(Aged 7 to
12)
Secondary
School
Age (Aged
13 to 18)
All school
age
(Aged 7 to
18)
Primary
School Age
(Aged 7 to
12)
Secondary
School Age
(Aged 13 to
18)
1 2 3 4 5 6
Year 2003 Dummy 0.040
(0.026)
0.040**
(0.019)
0.040
(0.035)
0.411
(0.283)
0.097***
(0.032)
0.451
(0.399)
Program*Year 2003
Dummy
0.038
(0.027)
0.020
(0.030)
0.067
(0.046)
0.305
(0.324)
0.013
(0.133)
0.841*
(0.497)
Program dummy -0.245***
(0.022)
-0.237***
(0.017)
-0.265***
(0.032)
-1.809***
(0.540)
-0.772***
(0.228)
-2.763***
(0.759)
Constant
3.696
(0.498)
2.170
(0.161)
5.353
(0.701)
Observations 8460 4537 3923 7672 4002 3670
R squared
0.07 0.03 0.11
***significant at 1%; **significant 5%; *significant at 10%.
d. Robustness Check It is still possible that the various regions in The Gambia have differing time trends in educational
outcomes even after controlling for school availability, rural residence, age, adult education and other

18
household variables. In fact, this is evident in figures 3 and 4. The relatively high enrollment rate and
average years of schooling attained in Region 1 tends to results in lower time trends in those variables
compared to the other regions. Conversely, the relatively lower educational outcome variables in
Region 6 result in a higher trends compared to the other regions. This suggests that the pre-existing
trends in educational outcomes could be significantly different across regions. This could be a source of
bias.
Since both program (regions 3, 4, 5 and 6) and non-program areas (regions 1 and 2) have multiple
regions, it is possible to vary the control or treatment regions to examine if the estimated program
impact remains robust to the exclusion of some regions. Changes in the significance of the impact of
the program by varying the composition of control or treatment region would provide strong indication
that there are significant differences in trends in educational outcomes, possibly caused by differences
among regions. In the analysis that followed, regions 1 and 6 (as well as other regions) are removed so
as to reduce the variance in time trends across regions.
19
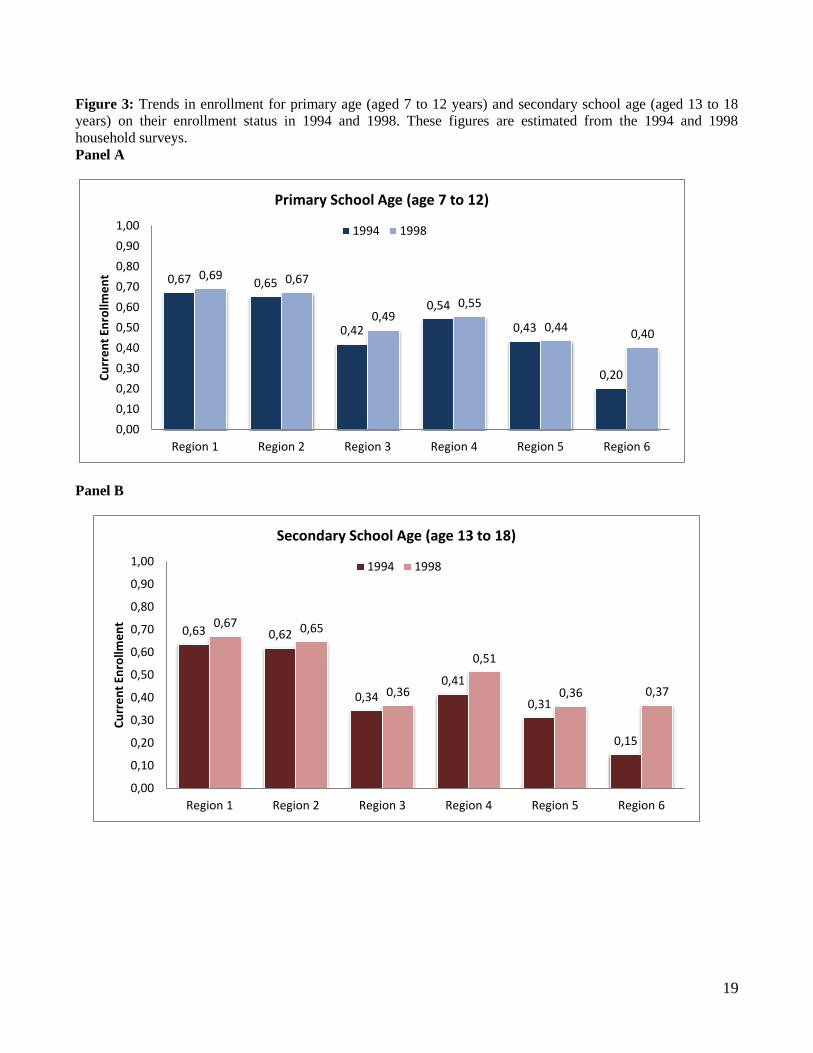
Figure 3: Trends in enrollment for primary age (aged 7 to 12 years) and secondary school age (aged 13 to 18
years) on their enrollment status in 1994 and 1998. These figures are estimated from the 1994 and 1998
household surveys.
Panel A
Panel B
0,67 0,65
0,42
0,54
0,43
0,20
0,69 0,67
0,49 0,55
0,44 0,40
0,00
0,10
0,20
0,30
0,40
0,50
0,60
0,70
0,80
0,90
1,00
Region 1 Region 2 Region 3 Region 4 Region 5 Region 6
Cu
rre
nt
Enro
llme
nt
Primary School Age (age 7 to 12)
1994 1998
0,63 0,62
0,34 0,41
0,31
0,15
0,67 0,65
0,36
0,51
0,36 0,37
0,00
0,10
0,20
0,30
0,40
0,50
0,60
0,70
0,80
0,90
1,00
Region 1 Region 2 Region 3 Region 4 Region 5 Region 6
Cu
rre
nt
Enro
llme
nt
Secondary School Age (age 13 to 18)
1994 1998

20
Figure 4: Trends in enrollment for primary age (aged 7 to 12 years) and secondary school age (aged 13 to 18
years) on their enrollment status in 1994 and 1998. These figures are estimated from the 1994 and 1998
household surveys.
Panel A
Panel B
2,14 2,06
1,38 1,41
1,04
0,37
2,26 2,18
1,59 1,45
1,08 1,01
0,00
0,50
1,00
1,50
2,00
2,50
Region 1 Region 2 Region 3 Region 4 Region 5 Region 6
Year
s o
s sc
ho
olin
g at
tain
d
Primary School Age (7 to 12)
1994 1998
5,40
4,44
2,03
2,69
2,13
1,03
5,64
4,54
2,42 2,70 2,53
1,53
0,00
1,00
2,00
3,00
4,00
5,00
6,00
Region 1 Region 2 Region 3 Region 4 Region 5 Region 6
Year
s o
f sc
ho
olin
g at
tain
ed
Secondary School Age (13 to 18)
1994 1998
21
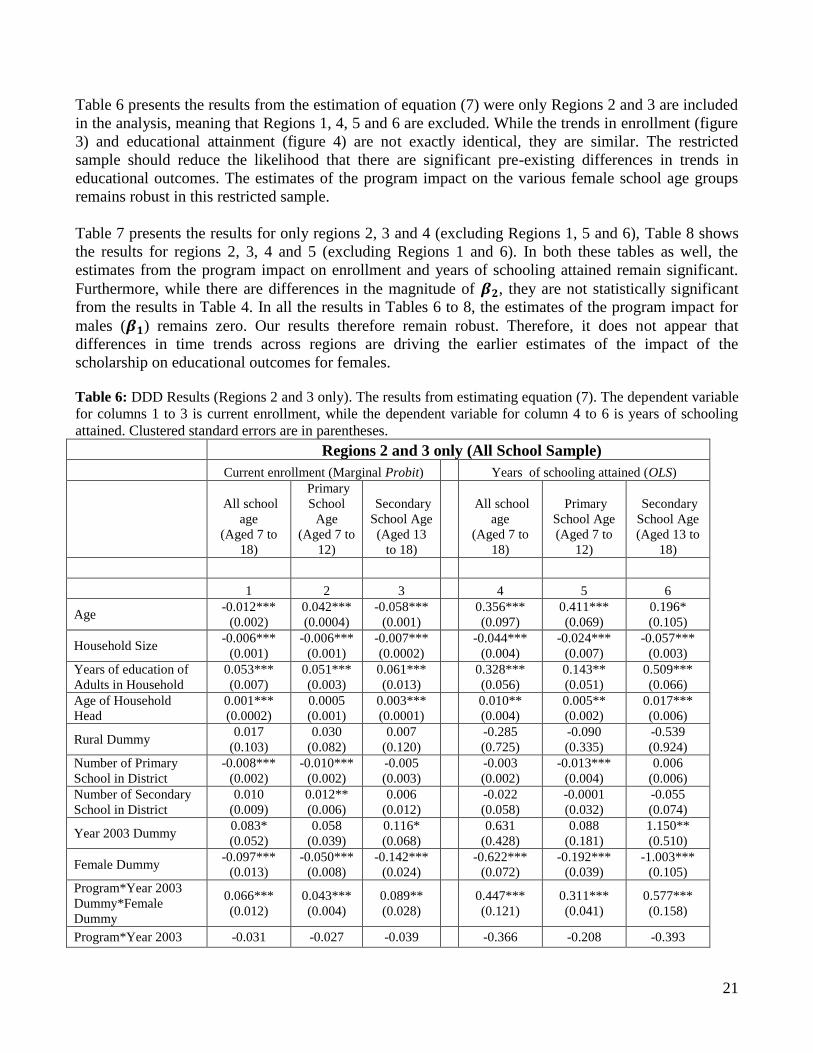
Table 6 presents the results from the estimation of equation (7) were only Regions 2 and 3 are included
in the analysis, meaning that Regions 1, 4, 5 and 6 are excluded. While the trends in enrollment (figure
3) and educational attainment (figure 4) are not exactly identical, they are similar. The restricted
sample should reduce the likelihood that there are significant pre-existing differences in trends in
educational outcomes. The estimates of the program impact on the various female school age groups
remains robust in this restricted sample.
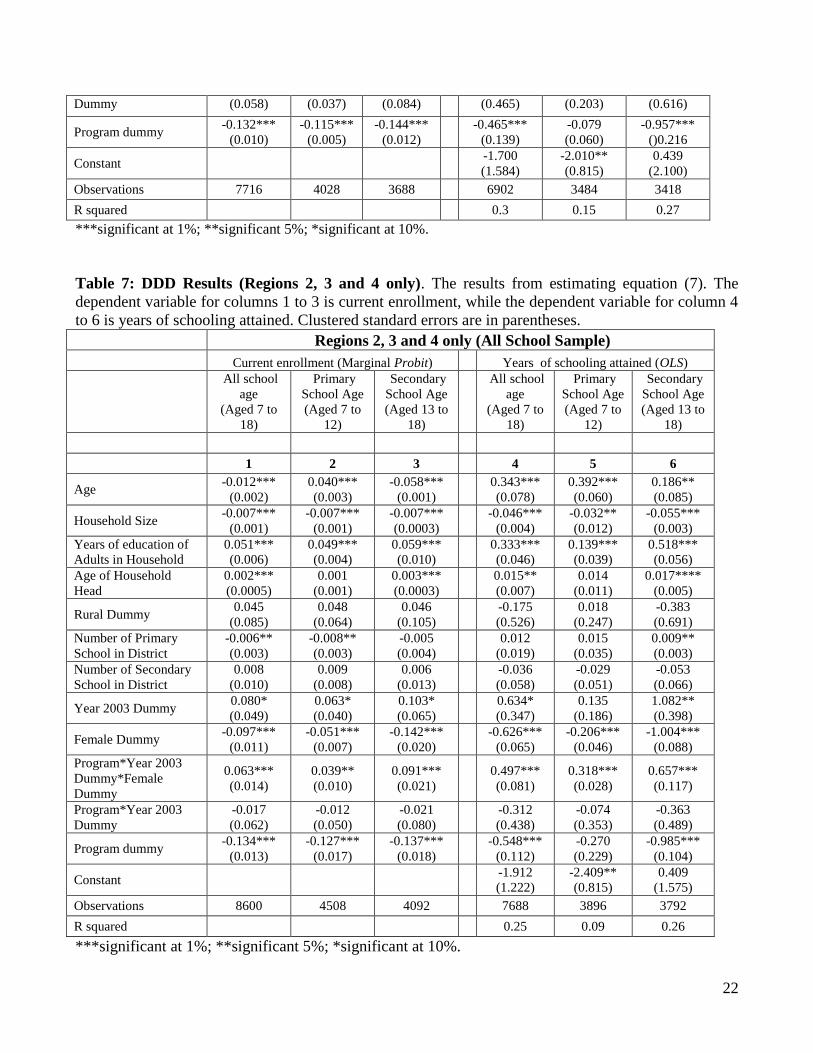
Table 7 presents the results for only regions 2, 3 and 4 (excluding Regions 1, 5 and 6), Table 8 shows
the results for regions 2, 3, 4 and 5 (excluding Regions 1 and 6). In both these tables as well, the
estimates from the program impact on enrollment and years of schooling attained remain significant.
Furthermore, while there are differences in the magnitude of , they are not statistically significant
from the results in Table 4. In all the results in Tables 6 to 8, the estimates of the program impact for
males ( ) remains zero. Our results therefore remain robust. Therefore, it does not appear that
differences in time trends across regions are driving the earlier estimates of the impact of the
scholarship on educational outcomes for females.
Table 6: DDD Results (Regions 2 and 3 only). The results from estimating equation (7). The dependent variable
for columns 1 to 3 is current enrollment, while the dependent variable for column 4 to 6 is years of schooling
attained. Clustered standard errors are in parentheses.
Regions 2 and 3 only (All School Sample)
Current enrollment (Marginal Probit) Years of schooling attained (OLS)
All school
age
(Aged 7 to
18)
Primary
School
Age
(Aged 7 to
12)
Secondary
School Age
(Aged 13
to 18)
All school
age
(Aged 7 to
18)
Primary
School Age
(Aged 7 to
12)
Secondary
School Age
(Aged 13 to
18)
1 2 3 4 5 6
Age -0.012***
(0.002)
0.042***
(0.0004)
-0.058***
(0.001)
0.356***
(0.097)
0.411***
(0.069)
0.196*
(0.105)
Household Size -0.006***
(0.001)
-0.006***
(0.001)
-0.007***
(0.0002)
-0.044***
(0.004)
-0.024***
(0.007)
-0.057***
(0.003)
Years of education of
Adults in Household
0.053***
(0.007)
0.051***
(0.003)
0.061***
(0.013)
0.328***
(0.056)
0.143**
(0.051)
0.509***
(0.066)
Age of Household
Head
0.001***
(0.0002)
0.0005
(0.001)
0.003***
(0.0001)
0.010**
(0.004)
0.005**
(0.002)
0.017***
(0.006)
Rural Dummy 0.017
(0.103)
0.030
(0.082)
0.007
(0.120)
-0.285
(0.725)
-0.090
(0.335)
-0.539
(0.924)
Number of Primary
School in District
-0.008***
(0.002)
-0.010***
(0.002)
-0.005
(0.003)
-0.003
(0.002)
-0.013***
(0.004)
0.006
(0.006)
Number of Secondary
School in District
0.010
(0.009)
0.012**
(0.006)
0.006
(0.012)
-0.022
(0.058)
-0.0001
(0.032)
-0.055
(0.074)
Year 2003 Dummy 0.083*
(0.052)
0.058
(0.039)
0.116*
(0.068)
0.631
(0.428)
0.088
(0.181)
1.150**
(0.510)
Female Dummy -0.097***
(0.013)
-0.050***
(0.008)
-0.142***
(0.024)
-0.622***
(0.072)
-0.192***
(0.039)
-1.003***
(0.105)
Program*Year 2003
Dummy*Female
Dummy
0.066***
(0.012)
0.043***
(0.004)
0.089**
(0.028)
0.447***
(0.121)
0.311***
(0.041)
0.577***
(0.158)
Program*Year 2003 -0.031 -0.027 -0.039 -0.366 -0.208 -0.393
22
Dummy (0.058) (0.037) (0.084) (0.465) (0.203) (0.616)
Program dummy -0.132***
(0.010)
-0.115***
(0.005)
-0.144***
(0.012)
-0.465***
(0.139)
-0.079
(0.060)
-0.957***
()0.216
Constant
-1.700
(1.584)
-2.010**
(0.815)
0.439
(2.100)
Observations 7716 4028 3688 6902 3484 3418
R squared
0.3 0.15 0.27
***significant at 1%; **significant 5%; *significant at 10%.
Table 7: DDD Results (Regions 2, 3 and 4 only). The results from estimating equation (7). The
dependent variable for columns 1 to 3 is current enrollment, while the dependent variable for column 4
to 6 is years of schooling attained. Clustered standard errors are in parentheses.
Regions 2, 3 and 4 only (All School Sample) Current enrollment (Marginal Probit) Years of schooling attained (OLS)
All school
age
(Aged 7 to
18)
Primary
School Age
(Aged 7 to
12)
Secondary
School Age
(Aged 13 to
18)
All school
age
(Aged 7 to
18)
Primary
School Age
(Aged 7 to
12)
Secondary
School Age
(Aged 13 to
18)
1 2 3 4 5 6
Age -0.012***
(0.002)
0.040***
(0.003)
-0.058***
(0.001)
0.343***
(0.078)
0.392***
(0.060)
0.186**
(0.085)
Household Size -0.007***
(0.001)
-0.007***
(0.001)
-0.007***
(0.0003)
-0.046***
(0.004)
-0.032**
(0.012)
-0.055***
(0.003)
Years of education of
Adults in Household
0.051***
(0.006)
0.049***
(0.004)
0.059***
(0.010)
0.333***
(0.046)
0.139***
(0.039)
0.518***
(0.056)
Age of Household
Head
0.002***
(0.0005)
0.001
(0.001)
0.003***
(0.0003)
0.015**
(0.007)
0.014
(0.011)
0.017****
(0.005)
Rural Dummy 0.045
(0.085)
0.048
(0.064)
0.046
(0.105)
-0.175
(0.526)
0.018
(0.247)
-0.383
(0.691)
Number of Primary
School in District
-0.006**
(0.003)
-0.008**
(0.003)
-0.005
(0.004)
0.012
(0.019)
0.015
(0.035)
0.009**
(0.003)
Number of Secondary
School in District
0.008
(0.010)
0.009
(0.008)
0.006
(0.013)
-0.036
(0.058)
-0.029
(0.051)
-0.053
(0.066)
Year 2003 Dummy 0.080*
(0.049)
0.063*
(0.040)
0.103*
(0.065)
0.634*
(0.347)
0.135
(0.186)
1.082**
(0.398)
Female Dummy -0.097***
(0.011)
-0.051***
(0.007)
-0.142***
(0.020)
-0.626***
(0.065)
-0.206***
(0.046)
-1.004***
(0.088)
Program*Year 2003
Dummy*Female
Dummy
0.063***
(0.014)
0.039**
(0.010)
0.091***
(0.021)
0.497***
(0.081)
0.318***
(0.028)
0.657***
(0.117)
Program*Year 2003
Dummy
-0.017
(0.062)
-0.012
(0.050)
-0.021
(0.080)
-0.312
(0.438)
-0.074
(0.353)
-0.363
(0.489)
Program dummy -0.134***
(0.013)
-0.127***
(0.017)
-0.137***
(0.018)
-0.548***
(0.112)
-0.270
(0.229)
-0.985***
(0.104)
Constant
-1.912
(1.222)
-2.409**
(0.815)
0.409
(1.575)
Observations 8600 4508 4092 7688 3896 3792
R squared
0.25 0.09 0.26
***significant at 1%; **significant 5%; *significant at 10%.

23
Table 8: DDD Results (Regions 2, 3, 4 and 5 only). The results from estimating equation (7). The dependent
variable for columns 1 to 3 is current enrollment, while the dependent variable for column 4 to 6 is years of
schooling attained. Clustered standard errors are in parentheses.
Regions 2, 3, 4 and 5 only (All School Sample)
Current enrollment (Marginal Probit) Years of schooling attained (OLS)
All school
age
(Aged 7 to
18)
Primary
School Age
(Aged 7 to
12)
Secondary
School Age
(Aged 13
to 18)
All school
age
(Aged 7 to
18)
Primary
School
Age
(Aged 7 to
12)
Secondary
School Age
(Aged 13 to
18)
1 2 3 4 5 6
Age -0.013***
(0.002)
0.037***
(0.006)
-0.059***
(0.001)
0.321***
(0.066)
0.367***
(0.054)
0.148*
(0.082)
Household Size -0.008***
(0.001)
-0.008***
(0.001)
-0.009***
(0.002)
-0.046***
(0.004)
-0.027**
(0.010)
-0.062***
(0.008)
Years of education of
Adults in Household
0.055***
(0.005)
0.053***
(0.002)
0.062***
(0.007)
0.334***
()0.035
0.141***
(0.032)
0.520**
(0.041)
Age of Household Head 0.001**
(0.001)
0.001
(0.001)
0.002***
(0.001)
0.012**
(0.005)
0.010
(0.008)
0.016**
(0.003)
Rural Dummy -0.015
(0.086)
-0.008
(0.075)
-0.023
(0.103)
-0.464
(0.486)
-0.134
(0.220)
-0.808
(0.669)
Number of Primary
School in District
-0.003
(0.004)
-0.004
(0.005)
-0.002
(0.004)
0.017
(0.015)
0.021
(0.024)
0.012
()0.009
Number of Secondary
School in District
0.003
(0.008)
0.006
(0.007)
0.0005
(0.011)
-0.053
(0.047)
-0.038
(0.042)
-0.079
(0.053)
Year 2003 Dummy 0.109**
(0.044)
0.086**
(0.034)
0.141**
(0.059)
0.768**
(0.291)
0.175
(0.151)
1.296***
(0.354)
Female Dummy -0.103***
(0.011)
-0.057***
(0.008)
-0.155***
(0.024)
-0.607***
(0.048)
-0.222***
(0.049)
-0.986***
(0.063)
Program*Year 2003
Dummy*Female
Dummy
0.095***
(0.024)
0.090**
(0.039)
0.098***
(0.023)
0.517***
(0.038)
0.418***
(0.084)
0.603***
(0.094)
Program*Year 2003
Dummy
-0.033
(0.049)
-0.049
(0.042)
-0.013
(0.076)
-0.322
(0.358)
-0.153
(0.217)
-0.294
(0.464)
Program dummy -0.160***
(0.022)
-0.144***
(0.017)
-0.178***
(0.037)
-0.668***
(0.172)
-0.405*
(0.216)
-1.125***
(0.232)
Constant
-1.352
(1.084)
-1.972**
(0.686)
1.429
(1.675)
Observations 10957 5859 5098 9902 5158 4744
R squared
0.25 0.09 0.27
***significant at 1%; **significant 5%; *significant at 10%.

24
Even after controlling for potential endogeneity in program placement and other policies that could
account for changes in the outcome of interest, difference-in-differences estimates can be invalidated
by serial correlation in the error term (Bertrand et al. 2004). This serial correlation in the error terms
can bias standard errors downwards leading to significant effects where none exist. This auto-
correlation usually results from multiple observations per unit overtime. This problem is, fortunately,
not an issue in this paper. Only two rounds of surveys are used, which precludes the biasing effects of
serial correlation. Furthermore, the standard errors are clustered at the region level to account for
possible intra-regional correlation.
Due to data limitation, the impact of the scholarship program on school quality is not addressed in this
paper. A significant increase in enrollment as captured in this paper is likely to affect quality if a
proportionate investment in school quality is not made. This is an area of interesting future research
that should be addressed.
VI. Conclusion
Both private and public returns to education are high. And education is important not only for those
instrumental reasons but for individual empowerment as well. There is global recognition of this
importance in the prominence of education-related targets in the Millennium Development Goals. To
reach these targets, many African countries have recently implemented policies in the form of
abolishing school fees to both increase student enrollment and help reduce the gender gap in education.
This paper assesses the schooling impact of a scholarship program for girls implemented in Gambian
regions, beginning in 2000. The program was funded by government of The Gambia, UNICEF, the
World Bank and the HIPC program. The scholarship program pays for the school fees of female
students attending public schools in all the areas where it is implemented (there are no school fees for
public primary schools in The Gambia). It was phased in the country over time from the east to the
west, enabling an assessment of its impact on enrollment rates and years of schooling attained. We took
advantage of the phased implementation by using a difference in difference estimation strategy. We
found that the program led to 9 percentage point increase in enrollment rates, and 0.3 to 0.4 increase in
years of schooling attained for female school-aged students. No significant effects in enrollment rates
and schooling attained, positive or negative were found for school-aged male students. The estimated
impact remains after several robustness checks.
The success of the scholarship program suggests that barriers to education in the form of direct costs
are still significant in The Gambia. While school fees do bring in needed funds to finance current
expenditures, both the individual and societal returns to education later in life significantly outweigh
the current direct cost of education (Bruns et al. 2003). Consequently, programs that reduce the barriers
to enrollment are worthwhile investments.

25
References
African Development Bank, African Union, UNECA and UNDP. 2010. “Assessing Progress in Africa toward
the Millennium Development Goals”.
Al‐Samarraia, S. and H. Zaman. 2007. "Abolishing School Fees in Malawi: The Impact on Education Access
and Equity", Education Economics, 15 (3): 359-375.
Barrera-Osorio, F., L. Linden and M. Urquiola. 2007. “The Effects of User Fee Reductions on Enrollment:
Evidence from a Quasi-Experiment”, Working Paper, Columbia University.
Behrman, J. and P. Todd. 2009. “Schooling Impacts of Conditional Cash Transfers on Young Children:
Evidence from Mexico”, Economic Development and Cultural Change, 57(3): 439-477.
Bertrand, M. and E. Duflo and S. Mullainathan. 2004. “How Much Should We Trust Difference-in-Differences
Estimates? Quarterly Journal of Economics, 119(1): 249-275.
Blimpo, M. and D. Evans. 2011. “School-Based Management, Local Capacity, and Educational Outcomes:
Lessons from a Randomized Field Experiment”, Working Paper.
Bold, T., M. Kimenyi, G. Mwabu and J. Sandefur. 2010. “Does Abolishing School Fees Reduce Quality?
Evidence from Kenya”, Working Paper, Centre for Study of African Economies, Oxford, UK.
Bruns, B., A. Mingat, R. Rakatomalala. 2003. "Achieving Universal Primary Education by 2015: A Chance for
Every Child", Washington, DC.
Deininger, K. 2003. “Does the cost of schooling affect enrollment by the poor? Universal primary education in
Uganda”, Economics of Education Review, 22(3):291-305.
Filmer, D., A. Hassan and L. Pritchett. 2006. “A Millennium Learning Goal: Measuring Real Progress in
Education”, Working Paper, Center for Global Development, Washington, DC.
Filmer, D. and N. Schady. 2008. “Getting Girls into School: Evidence from a Scholarship Program in
Cambodia”, Economic Development and Cultural Change, 56(3): 581-617.
Foltz, J. and O. Gajigo. 2012. “Assessing Returns to Education in The Gambia”, Journal of African Economies,
21(4): 580-608.
Gajigo, O. and A. Saine. 2012. “Effect of Government Policies on Cereal Consumption Pattern Change in The
Gambia”, Review of African Political Economy, 38(130): 517-536.
Gambia Bureau of Statistics. 1998. Integrated Household Survey, Banjul, The Gambia.
Gambia Bureau of Statistics. 2003. Integrated Household Survey, Banjul, The Gambia.
Gertler, P. and P. Glewwe. 1990. “The Willingness to Pay for Education in Developing
Countries: Evidence from Rural Peru”, Journal of Public Economics, 42(3): 251-275.
Isili, U.O. and B.T. Long. 2008. “Does female schooling reduce fertility? Evidence from Nigeria”, Journal of
Development Economics, 87: 57-75.
26
Lavy, V. 1996. "School supply constraints and children's educational outcomes in rural Ghana", Journal of
Development Economics, 51(2): 291–314.
Ministry of Education. 2004. “Review of the Scholarship Trust Fund for Girls”, Banjul, The Gambia.
Ministry of Education. 2011. “School Enrollment Data”, Banjul, The Gambia.
Oketch, M. and C. Rolleston. 2007. "Policies on Free Primary and Secondary Education in East Africa:
Retrospect and Prospect", Review of Research in Education, 31: 131-158.
UNESCO. 2012. “Education for all”, Global Monitoring Report.
World Bank and UNICEF 2009. “Abolishing School Fees in Africa: Lessons from Ethiopia, Ghana, Kenya,
Malawi, and Mozambique”, Washington, DC.
World Bank. 2012. World Development Indicators. Washington, DC.

27
Recent Publications in the Series
nº Year Author(s) Title
163 2012
Christopher Adam, David Kwimbere,
Wilfred Mbowe and Stephen O’Connell
Food Prices and Inflation in Tanzania
162 2012
Evans Osabuohien, Uchenna R. Efobi and
Adeleke Salami
Planning to Fail or Failing to Plan:
Institutional Response to Nigeria’s Development
Question
161 2012 Mthuli Ncube , Eliphas Ndou and
Nombulelo Gumata
The Impact of Euro Area Monetary and Bond Yield
Shocks on the South African Economy: Structural
Vector Autoregression Model Evidence
160 2012 Wolassa L. Kumo
Infrastructure Investment and Economic Growth in
South Africa: A Granger Causality Analysis
159 2012 Ousman Gajigo and Mary Hallward-
Driemeier
Why do some Firms abandon Formality for
Informality?
Evidence from African Countries
158 2012 Stijn Broecke
Tackling Graduate Unemployment through
Employment Subsidies: An Assessment of the SIVP
Programme in Tunisia
157 2012 Mthuli Ncube, Eliphas Ndou and
Nombulelo Gumata
How are the US financial shocks transmitted into South
Africa? Structural VAR evidence
156 2012 Albert Mafusire and Zuzana Brixiova Macroeconomic Shock Synchronization In The East
African Community
155 2012 John Page Youth, Jobs, and Structural Change:
Confronting Africa’s “Employment Problem”
154 2012 Thouraya Triki and Ousman Gajigo Credit Bureaus and Registries and Access to Finance:
New Evidence from 42 African Countries
