clothespins - usitc u.s. firms now p~oduce clothespins: diamond international corp., ... and title v...
TRANSCRIPT

CLOTHESPINS
Report to the President on Investigation No. TA-201_-36 Under Section 201 of the Trade Act of 1974
USITC PUBLICATION 933
DECEMBER 1978
United States International Trade Commission I Washington, D.C. 20438
UNITED STATES INTERNATIONAL TRADE COMMISSION
COMMISSIONERS
Joseph 0. Parker, Chairman Bill Alberger, Vice Chairman
George M. Moore Catherine Bedell Paula Stern
Kenneth R. Mason, Secretary to the Commission
This report was prepared principally by
William.I. Schechter, Investigator
John M. MacHatton, Supervisory Investigator
Address all communications to Office of the Secretary
United St.ates International Trade Commission
Washington, D.C. 20436
FOR RELEASE December 12, 1978
CONTACT: Hal Sundstrom (202) 523-0161
USITC 78-136
USITC FINDS CLOTHESPIN IMPORTS ARE INJURING DOMESTIC INDUSTRY AND RECOMMENDS A 5-YEAR QUOTA
The United States International Trade Commission today reported
to the P~esident its determination, by a 4-to-O vote, that increased
imports of clothespins are a substantial cause of serious injury to
the domestic industry.
Concurring in the determination were Chairman Joseph 0. Parker,
Vice Chairman Bill Alberger, and Commissioners George M. Moore and
Catherine Bedell. Commissioner Paula Stern, not having participated
in the case, abstained.
In order to remedy the serious injury to the domestic industry,
the Commission recommended to the President the imposition of a 5-
year quota of 3.2 million gross on U.S. imports of wood and plastic
spring clothespins. The proposed quota, effective January l, 1979,
would be administered annually on a global basis and allocated by
import value brackets. Wood and plastic spring clothespins accounted
for 90 percent of U.S. imports of all types of clothespins in 1977.
The investigation·was instituted by the Commission on its own
motion on July 27, 1978, on the basis of information collected in
connection with USITC investigations conducted under section 406(a)
of the Trade Act of 1974, to determine whether increased imports of
clothespins produced in certain Communist countries were causing
more
USITC FINDS CLOTHESPIN JMPORTS ARE INJURING DOMESTIC INDUSTRY AND RECOMMENDS A 5-YEAR QUOTA
2
market disruption with. respect to such articles produced by a domestic
industry. The Commission reported to the President on August 3, 1978,
that market disruption existed with respect to imports of clothespins
from China but not with respect to imports of clothespins from Poland
or Romania; in the case of clothesp{ns from China, the Commission re-
commerrded an annual import quota as a remedy to the market disruption
(USITC Publication 902; investigations Nos. TA-406-2, TA-406-3, and
TA--406-4). The President, on October 2, 1978, rejected the Commis-
sion's quota recommendation.
There are four major types of clothespins: spring type of wood,
spring type of plastic, round or squarehead nonspring type of wood,
and roundhead nonspring type of wood that is iron. bound. Clothespins
are interchangable as to functions, but v~ry substantially in price
from type to type.
Five U.S. firms now p~oduce clothespins: Diamond International
Corp., with a plant in Peru, Maine; Forster Manufacturing Co. of
Wilton and Mattawamkeg, Maine; Penley Corp. of West Paris, Maine; and
National Clothespin Co. an~ Vermont Plastic, Inc., of Montpelier, Vt.
The domestic industry has experienced a substantial decline in
the rate of capacity utilization since 1973, as production has dropped
sharply. The average number of production and related workers manu-
facturing clothespins declined irregularly from 429 workers in. 1973
to 387 workers in 1977. The aggregate net operating profit for all
domestic clothespin prod~cers fell to less than l percent of the
f i r m s ' n e t s a l e s i n _l 9 7 6 a n i:1 l 9 7 .? , a n d t h e i r l o s s e s e x p e r i e n c e d i n
January-June 1978 were substantially laGger than those experienced
during the corresponding period in 1977.
more
USITC FINDS CLOTHESPIN IMPORTS ARE INJURING DOMESTIC INDUSTRY AND RECOMMENDS A 5-YEAR QUOTA
3
Imports from the major foreign suppliers--China, Taiwan, Poland,
West Germany, Romania, and the Netherlands--are generally priced
substantially below those of the three largest domestic producers.
China, Taiwan, and West Germany were the major sources of U.S. im-
ports for consumption during 1977.
U.S. producers' shipments generally declined during 1973-77,
falling from 5.4 million gross in 1973 to 4.1 million gross in 1977,
in contrast to the trend in U.S. imports, which increased from 2.1
million gross, or 28 percent of consumption, in 1973 to 3.5 million
gross, or 46 percent of consumption, in 1977.
The Commission's public report, Clothespins (USITC Publication
933), contains the views of the Commissioners in investigation No.
TA-201-36. Copies may be obtained by calling (202) 523-5178 or
from the Office of the Secretary, 701 E Street NW., Washington, D.C.
20436.
oOo

C 0 N T. E N T S
Report to the President-------------------------------------------------- 1 Determination, findings and recommendations:
Determination-------------------------------~------------------------ 3 Findings and recommendations--------~-------------------------------- 3
Views of Chairman Joseph O. Parker,_ Vice Chairman Bill Alberger, arid Commissioners George M. Moore and Catherine Bedell-------------------- 4
Additional views of Chairman Joseph·o. Parker, Vice Chairman Bill Alberger, and Commissioners George M. Moore and Catherine Bedell with respect to recommendations of remedy------------------------------ 11
Information obtained in the investigation: Summary-------------------------------------------------------------- A-1 Introduction--------------------------------------------------------- A-6 Description _and uses------------------------------------------------- A-7 U.S. tariff treatment------------------------------------------------ A-8 U.S. producers------------------------------------------------------- A-9 U.S. importers------------------------------------------------------- A-10 U.S. market---------------------------------------------------------- A-11 The question of increased imports------------------------------------ A-11 The question of serious injury to the domestic industry:
U.S. capacity, production, and capacity utilization-------------- A-24 U.S. apparent consumption, producers' shipments, and foreign
trade--------------------------------------------------------- A-24 U.S. inventories--------------------------------~---------------- A-31 Employment------------------~------------------------------------ A-35 Profit-and-loss experience of domestic producers----------------- A-36 Prices of wood spring clothespins:
Domestic producers---------------------~--------------------- A-44 Representative imports--------------------------------------- A-46
Prices of wood roundhead clothespins: Domestic producers-~----------------------------------------- A-47 West Germany------------------------------------------------- A-49
Prices of plastic spring clothespins----------------------------- A-49 Prices and unit costs for wood spring clothespins---------------- A-49
The question of substantial cause: Market penetration by imports------------------------------------ A-52 Lost sales-------------------~----------------------------------- A-58 Efforts to compete with imports---------------------------------- A-62
Appendix A. U.S. International Trade Commission notice of investigation and hearing---------------------------------------------- A-65
Appendix B. Text of October 2, 1978, message of the President to the Congress on clothespins from the Peoples' Republic of China------------ A-69
Appendix C. Probable economic effects of tariff changes under title I and title V of the Trade Act of 1974 for Trade Agreement Digest No. 70236, July 1975-------------------------------------------------------- A-73
ii
CONTENTS
Figures
1. Wood and plastic spring clothespins: U.S. imports for consumption, 1973-77------------------------------------------------------------ A-13
2. Wood and plastic spring clothespins: U.S. imports for consumption from China, 1973-77------------------------------------------------ A-21
3. Wood and plastic spring clothespins: U.S. imports for consumption from Taiwan, 1973-77------~------------------------------------·---- A-22
4. Wood and plastic spring clothespins: U.S. produ~ers' shipments and U.S. imports fQr consumption, 197 3-77--:-----------·--------·--------- A-59
5. Wood and plastic spring clothespins: U.S. production and U.S. imports for consumption--------------·----...:----------------·---------- A-60
Tables
1. Wood and plastic spring clothespins (TSUS item 790.05): u.s. imports for consumption, by major sources, 1973-77, January-June 1977, and January-June 1978------~--------------------------- A-12
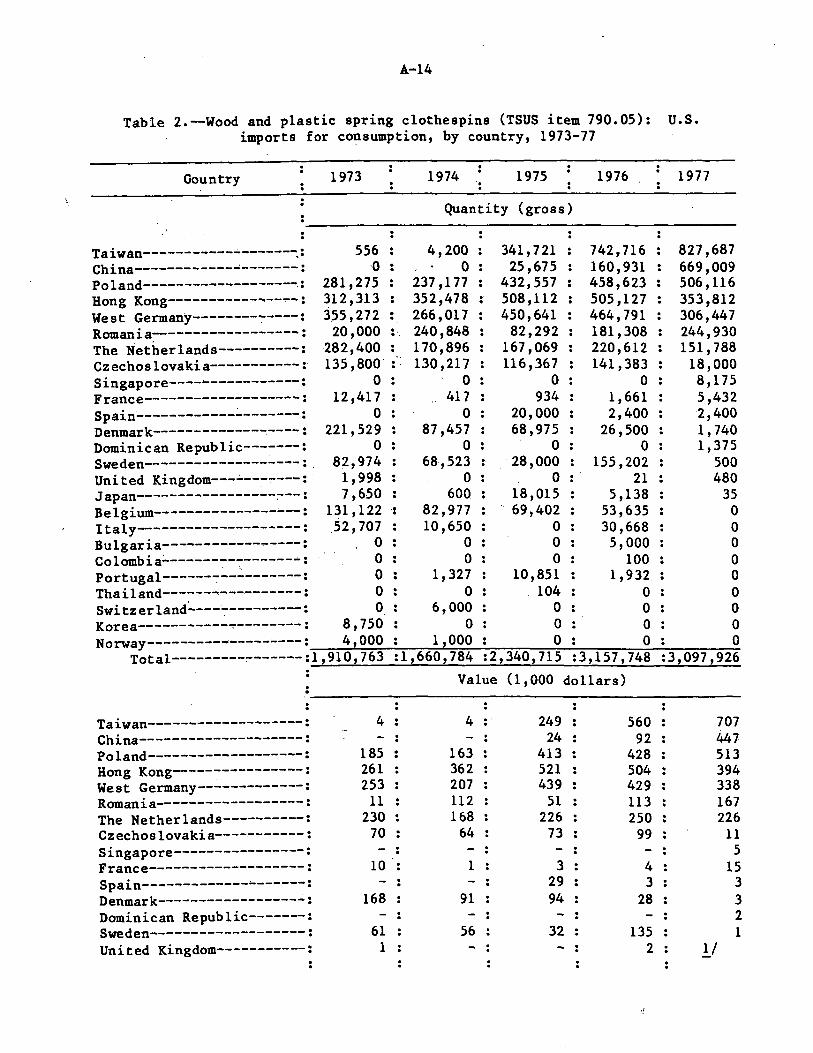
2. Wood and plastic spring clothespins (TSUS item 790.05): U.S. imports for consumption, by country, 1973-77----------------~----- A-14
3. Wood and plastic spring clo~hespins (TSUS item 790.05): U.S. imports for consumption, by type and by country, January-June 1977 and January-June 1978---------------------------------------- A-16
4. Nonspring clothespins of wood (TSUS item 790.08): U.S. imports for consumption, by country, 1973-77, January-June 1977, and January-June 1978--------------------------------------------------------- A-18
5. Nonspring clothespins of plastic (TSUS item 790.07): U.S. imports for consumption, by country, 1973-77, January-June 1977, and January-June 1978-------------------------------~----------------- A-20
6. Clothespins: U.S. capacity, production, and capacity utilization, by firms, 1973-77, January-June 1977, and January-June 1978------- A-25
7. Clothespins: U.S. maximum production capacity, and capacity utilization, by firms, 1973-77, January-June 1977, and January-June 1978--------------------------------------------------------- A-27
8. Clothespins: U.S. producers' shipments, imports for consumption and apparent consumption, 1973-77, January-June 1977, and January-June 1978------------------------------------------------- A-29
9. Clothespins: U.S. producers' shipments, by companies and by types, 1973-77, January-June 1977, and January-June 1978----------------- A-30
10. Clothespins: U.S. producers' yearend inventories, by firms, as of Dec. 31 of 1973-77, June 30, 1977, and June 30, 1978----------- A-32
11. Ratios of inventories at period end to U.S. producers' shipments during the preceding 12-month or 6-month period, by firm, 1973-77, January-June 1977, and January-June 1978----------------- A-34
12. Clothespins: Average number of employees in U.S. establishments producing clothespins, and total number of production and related workers engaged in the manufacture of all products and of clothespins, 1973-77, January-June 1977, and January-June 1978----------- A-36
iii
CONTENTS
13. Person-hours worked in establishments producing clothespins, 1973-77, January-June 1977, and January-June 1978----------------- A-37
14. Aggregate profit-and-loss experience of the CVPA companies on all their clothespin operations, 1973-77, January-June 1977, and January-June 1978------------------------------------------------- A-38
15. Aggregate profit-and-loss experience of the CVPA companies on their wood spring clothespin operations, 1973-77, January-June 1977, and January-June 1978---------------------------------------- A-39
16. Aggregate profit-and-loss experience of CVPA companies for all products manufactured at their reporting establishments, 1973-77., January-June 1977, and January-June 1978-------------------------- A-41
17. Profit-an~ loss experience of 2 CVPA companies on all their clothespin operations and on all operations of the reporting establishments, 1973-77, January-June 1977, and January-June 1978-------------------------------------------------------------- A-42
18. Other factory costs for CVPA companies, total and as a share of net sales, 1973-77, January-June 1977, and January-June 1978------ A-43
19. Selected financial ratios of the CVPA companies, 1977--------------- A-44 20. Wood spring clothespins: F.o.b. prices of U.S. producers on their
largest volume sales to their U.S. customers and weighted average f.o.b. prices of imported clothespins, by quarters, January 1973-June 1978--------------------------------------------------------- A-45
21. Wood spring clothespins: Delivered prices of U.S. producers on their largest volume sales to their U.S. customers, by quarters, January 1973-June 1978~------------------------------------------- A-47
22. Wood roundhead clothespins: Prices of U.S. producers on their largest volume sales to their U.S. customers and weighted average prices of imported clothespins, by quarters, January 1973-June 1978-------------------------------------------------------------- A-48
23. Plastic spring clothespins: Prices of U.S. producers on their largest volume sales to their U.S. customers and weighted average prices of imported clothespins, by quarters, January 1973-June 1978-------------------------------------------------------------- A-50
24. Aggregate average unit cost incurred in manufacturing wood spring clothespins, by CVPA companies, 1973-77, January-June 1977, and January-June 1978-------------------------------------------------- A-51
25. Clothespins: U.S. apparent consumption, U.S. production, and U.S. imports, by type, 1973-77, January-June 1977, and January-June 1978-------------------------------------------------------------- A-53
26. Wood and plastic spring clothespins: U.S. consumption, U.S. production, and U.S. imports from China, Taiwan, Poland, West Germany, Romania, the Netherlands, and all countries, 1973-77, January-June 1977, and "January-June 1978---------------------------------------- A-54
l. v
CONTENTS
27. Wood and plastic nonspring clothespins: U.S. consumption, U.S. production, and U.S. imports from West Germany, Taiwan, the Netherlands, China, and all countries, 1973-77, January-June 1977, and January-June 1978---------------------------------------- A-56
28. All clothespins: U.S. consumption, U.S. production, and U.S. imports from Taiwan, China, West Germany, Poland, Romania, the Netherlands, and all countries, 1973~77, January-June 1977, and January-June 1978--------------------------------------------------------------- A-57
29. Wood spring clothespins: Production, capacity, shipments, inventories, and the profit-and-loss situation of Forster, by types, 1977, January-June 1977, and January-June 1978--------------------- A-63
REPORT TO THE PRESIDENT
To the President:
United States International Trade Commission December 12, 1978
In accordance with section 20l(d)(l) of the Trade Act of 1974 (88 Stat.
1978), the United States International Trade Commiasion herein reports the results
of an investigation relating to clothespins. The investigation (No. TA-201-36)
was undertaken to determine whether clothespins, provided for in items 790.05,
790.07, and 790.08 of the Tariff Schedules of the United States (TSUS), are being
imported into the United States in such increased quantities as to be a substantial
cause of serious injury, or the threat thereof, to the domestic industry producing
articles like or directly competitive with the imported articles.
The Commission instituted the investigation on its own motion on July 27,
1978, under the authority of section 20l(b)(l) of the Trade Act, on the basis of
information collected in connection with Commission investigations Nos. TA-406-2,
TA-406-3, and TA-406-4. These investigations were conducted under section 406(a)
of the Trade Act of 1974 and concerned clothespins from the People's Republic. of
China, the Polish People's Republic, and the Socialist Republic of Romania.
Notice of the investigation and hearing was duly given by publishing the
original notice in the Federal Register of August 3, 1978 (43 F.R. 34218). A
public hearing in connection with the investigation was conducted on October 5,
1978, in Portland, Maine. All interested persons were afforded an opportunity
to be present, to submi~ information, and to be heard. A transcript of the
hearing and copies of briefs submitted by interested parties in connection with
the investigation are attached. l/
1./ Attached to the original report sent to the President, and available for inspection at the U.S. International Trade Commission, except for material submitted in confidence.

2
The information._contained in this report was obtained from fieldwork, from
questionnaires sent to domestic manufacturers and importers, and from the
Commission's files, other Government agencies, and information presented at the
hearing and in briefs filed by interested parties.
3
DETERMINATION, FINDINGS, AND RECOMMENDATIONS OF THE COMMISSION
Determination
On the basis of evidence developed during the course of investigation
No. TA-201-36--
the Commission unanimously !/ determines that clothespins provided for in item 790.05, 790.07, and 790.08 of the Tariff Schedules of the United States (TSUS), are being imported in such increased quantities as to be a substantial cause of serious injury to the domestic industry producing articles like or directly competitive with the imported articles.
Findings and Recommendations
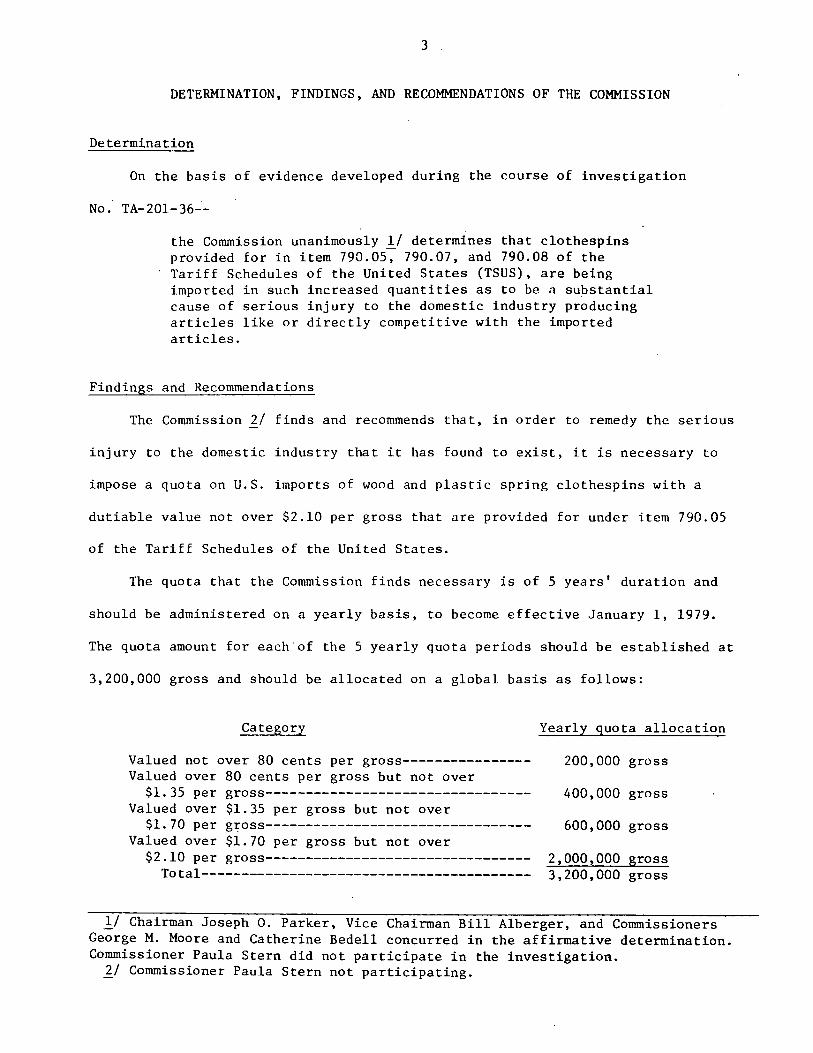
The Commission 2/ finds and recommends that, in order to remedy the serious
injury to the domestic industry that it has found to exist, it is necessary to
impose a quota on U.S. imports of wood and plastic spring clothespins with a
dutiable value not over $2.10 per gross that are provided for under item 790.05
of the Tariff Schedules of the United States.
The quota that the Commission finds necessary is of 5 years' duration and
should be administered on a yearly basis, to become effective January 1, 1979.
The quota amount for each.of the 5 yearly quota periods should be established at
3,200,000 gross and should be allocated on a global basis as follows:
Category
Valued not over 80 cents per gross---------------Valued over 80 cents per gross but not over
$1.35 per gross--------------------------------Valued over $1.35 per gross but not over
$1. 70 per gross--------------------------------Valued over $1.70 per gross but not over
$2.10 per gross---------------------------------Total-----------------------------------------
Yearly quota allocation
200,000 gross
400,000 gross
600,000 gross
2,000,000 gross 3,200,000 gross
!/ Chairman Joseph 0. Parker, Vice Chairman Bill Alberger, and Commissioners George M. Moore and Catherine Bedell concurred in the affirmative determination. Commissioner Paula Stern did not participate in the investigation.
]:_/ Commissioner Paula Stern not participating.
4
Views of Chairman Joseph o. Parker, Vice Chairman Bill Alberger, and Commissioners George M. Moore and Catherine Bedell
This investigation under section 201 of the Trade Act of 1974 was
instituted by the Counnission on its own motion on the basis of information
developed in investigations Nos. TA-406-2, TA-406-3, and TA-406-4, conducted
und~r section 406(a) of the Trade Act of 1974, concerning clothespins from
the People's Republic of China, the Polish People's Republic, and the
Socialist Republic of Romania. !/ Section 20l(b) of the Trade Act requires
that each of_ the following criteria be met if the Commission is to make
an affirmative determination and find a domestic industry eligible for
import relief:
(1) Imports of the article concerned are entering the United States in increased quantities (either actual or relative to domestic production);
(2) The domestic industry producing an article like or directly competitive with the imported article is being seriously injured or threatened with serious injury; and
(3)· Increased imports are a substantial cause of serious injury, or the threat thereof, to the domestic industry producing an article like or directly competitive with the imported article concerned.
Determination
On the basis of the evidence developed during this investigation, we have
determined that clothespins, provided for in items 790.05, 790.07, and
790.08 of the Tariff Schedules of the United States (TSUS), are being imported
!/ Commissioner Alberger believes it is unfortunate that the section 406 petition was filed. This industry would have been spared both expenses and time if the case had been brought under section 201 of the Trade Act of 1974 in the first instance. Where rapidly increasing imports are evenly split between nonmarket economy countries and market economy countries, it is clearly more appropriate to seek relief under section 201.
5
into the United States in such increased quantities as to be a substantial
cause of serious injury to the domestic industry producing articles like
or directly competitive with the imported articles.
The Product and the Domestic Industry
There are four major types of clothespins produced by the domestic
industry: spring-type clothespins of wood; spring-type clothespins of
plastic; round or square head nonspring-type clothespins of wood that are not
ironbound; and round or square head nonspring-type clothespins of wood that are
ironbound. · While the various types of clothespins are generally interchangeable
as to function, prices vary substantially from type to type. The higher
priced domestic wood ironbound clothespins and plastic spring clothespins
enjoy a substantially smaller market share than the lower priced wood spring
clothespins. Of the four major types of domestic clothespins, in 1977 the
wood spring variety accounted for 69 percent of U.S. capacity and approximately
83 percent of total U.S. production. In the absence of country-of-origin
marking requirements, it is quite unlikely that the average consumer could
distinguish between the domestic and the imported product.
Approximately 75 percent of all clothespins imported into the United
States are of the wood spring variety. In 1977 and 1978, the People's
Republic of China and the Republic of China (Taiwan) accounted for nearly
50 percent of total U.S. imports of clothespins. Other major exporters of
clothespins to the United States are West Germany, Poland, and Romania.
The wood spring clothespins from the People's Republic of China, Taiwan, and
Hong Kong are generally smaller, and reportedly less durable, than their
domestic and imported European counterparts, but nevertheless do compete
because they are lower in price and serve identical functions.
6
In addition, the investigation revealed that the domestic industry,
composed of three clothespin manufacturers in Maine and two in Vermont '
is separately identifiable and subject to possible injury from clothespins
imported from all .sources. The imported products like and directly
competitive with the output of this industry enter the United States under
items 790.05, 790.07, and 790.08 of the TSUS, and these items define the
scope of the investigation.
Increased imports
The first of the three criteria requires a finding that there are
increased imports. The Trade Act provides, in section 20l(b)(2){C), that
an increase in imports has occurred when the increase is "either actual or
relative to domestic production." Thus, the requirement is satisfied
when the increase is in actual or absolute terms or when the level of
imports is increasing relative to domestic production. even if it is declining
in ar:!tual terms.
U.S. imports of clothespins increased in actual terms from 2.1 million
gross in 1973 to 3.5 million gross in 1977, or by more than 60 percent.
The ratio of imports to production increased from 40 percent in 1973 to
80 percent in 1977. The first criterion is clearly satisfied.
Serious injury
The second criterion concerns the question of whether the domestic
industry is suffering "serious injury or the threat thereof." The Trade Act
does not define the term "serious injury," but instead provides guidelines
in the form of economic factors which the Commission is to take into account.
Section 20l(b)(2) of the Trade Act provides that the Commission, in determining
7
whether there is serious injury, is to take into account, "all economic
factors which it considers relevant, including (but not limited to).
the significant idling of productive facilities in the industry, the inability
of a significant number of firms to operate at a reasonable level of profit,
and significant unemployment or underemployment within the industry.
We have also considered the following economic factors: production and
shipments, prices, and lost sales.
The information before us demonstrates that the economic health of
the domestic industry has deteriorated in the past 5 years and that the
industry is being seriously injured.
II
Capacity utilization.--The domestic industry experienced an extremely
low rate of capacity utilization throughout the period of the investigation.
The level of utilization of ma~imum production capacity fell from 43 percent
in 1973 to 31 percent in 1977; during January-June 1978, the level of
capacity utilization remained at 35 percent. Furthermore, capacity utilization
for wood spring clothespins, the staple of the industry, declined from 54
percent in 1973 to 38 percent in 1977, and remained at 41 percent during
January-June 1978.
Profit-and-loss experience.--In 1973, the domestic industry suffered an
aggregate net loss of $339,000, and in 1974 experienced a net profit of only
$7,000. This performance was primarily related to the wage and price controls
then in effect. In 1975, the industry experienced a paradoxical year,
as production and shipments decreased sharply, imports increased sharply,
and the industry's profits of $651,000 increased to their highest level
of the 1973-77 period. However, this profit was the result of the after
effects of the sale of relatively inexpensive inventory built up in the
period of wage and price controls. By 1977, aggregate net operating profit
8
for all clothespin operations of the four domestic producers of wood
spring clothespins fell sharply to $47,000, or by 93 percent compared with the
profit in 1975. The ratio of net operating profit to net sales dropped
from 8.7 percent in 1975 to 0.6 percent in 1977. Furthermore, in
January-June 1978, the industry reported a net loss of $330,000, or
4 times more than the aggregate net loss reported during January-June 1977.
In addition, during January-June 1978, only two of the four reporting firms
reported any profit, and the profit reported by one of the two profitable
firms was marginal.
Employment.--The average number of production and related workers
engaged solely in the production of clothespins declined irregularly from
429 employees in 1973 to 387 employees in 1977. The total number of
person-hours worked in the production of clothespins followed a similar
pattern, falling from 820,000 hours in 1973 to 728,000 hours in 1977. There
has been some increase in employment in 1978 because of the attempted
inventory buildup at Forster for its new small wood spring clothespins.
Workers in the areas where plants are located are heavily dependent on
clothespin production for employment.
Production and shipments.--u.s. production of all clothespins dropped
sharply from 5.3 million gross in 1973 to 4.3 million gross in 1977, or by
19 percent. U.S. producers' shipments also declined rapidly, falling from
5.4 million gross in 1973 to 4.1 million gross in 1977, or by 23 percent.
Price suppression.--The People's Republic of China and Taiwan accounted
for nearly 50 percent of all clothespins imported in 1977. The weighted
average price of clothespins from both sources has declined sharply in the
last several years, and they ·now are priced 50 to 70 cents per gross less
than the clothespins produced by the three largest domestic producers.
9
Imports from the other major foreign suppliers have also consistantly
undersold domestic clothespins, although the margin of undersell-ing has
not been as great. Because of this severe price competition from imports,
U.S. producer's prices have been relatively stagnant since 1975 despite
rising unit costs of production.
Lost sales.--Since price is a significant factor in the sale of
clothespins, partic~larly to mass merchandisers, the severe underselling
of the domestically produced clothespins by imported clothespins has resulted
in lost sales to the domestic industry. The Commission's investigation
revealed 21 instances of lost sales directly attributable to imports.
Considering all these factors, we find that serious injury exists within
the meaning of the Trade Act. While employment is basically steady, all firms
in the industry are operating well below capacity, and all but one are
failing to make a reasonable level of profit. (The unique aspects of this
one firm which is profitable c~nnot be discussed because of limits of
confidentiality).
Substantial Cause
Section 20l(b)(4) of the Trade Act defines the term "substantial cause"
to mean "a cause which is important and not less than any other cause."
Thus, increased imports must be both an "important" cause of injury and
"not less than any other cause." Section 20l(b)(2) further provides that
in determining "substantial cause" the Commis.sion "shall take into account.
all economic factors which it considers relevant, including (but not limited
to) •.. an increase in imports (either actual or relative to domestic production)
and a decline in the proportion of the domestic market supplied by domestic
producers."
10
As. noted above, imports have increased both actually and relative to
domestic production. Furthermore, the proportion of the domestic market
supplied by imports increased from 28 percent in 1973 to 46 percent in 1977,
while the U.S. producers' share of the market fell from 72 percent to 54 percent.
The ability of imported clothespins to be sold for 50 to 70 cents less per
gross than their domestic counterparts has not only enabled the foreign
clothespins to increase their share of the domestic market, but has also been
a major factor in causing price suppression among the U.S. producers in a period
when the cost of producing clothespins was soaring. During this period,
domestic producers' costs of manufacturing clothespins increased in such
important categories as wood,. spring wire, labor, and energy •. The inability of the
U.S. producers to raise their prices has contributed significantly to their
declining profits.
We have examined other factors alleged to be substantial causes of
serious injury to the domestic industry. In the earlier cases, under section
406 of the Trade Act, imports other than those from the People's Republic of
China were clearly another cause, but those are encompassed here as part of all
increased imports. Some concern was expressed about management problems and
other nonimport-related losses. We have examined these matters but have
found no other causation factors which even approach low-priced imports and
their capture of one-half of the American market as a cause of serious injury.
11
Views of Chairman Joseph 0. Parker~ Vice Chairman Bill Alberger, and Commissioners George M. Moore and Catherine Bedell
With Respect to Remedy
The remedy recommended herein is designed to bring about a better
competitive balance between imported clothespins and those produced
domestically. The sizeable competitive imbalance that currently exists
arises primarily because of price disparity. The prices of imported
clothespins from the two principal exporting countries are currently
lower than they were at the time of their introduction in 1975 and 1976.
During this same period, with increased import competition at lower prices,
domestic producers have been confronted with increasing inflation and higher
costs of production and have not been able to operate at a reasonable level
of profit.
Consistent with this objective, an adequate remedy should aim to be more
restrictive with respect to particularly low valued imports that have
increased substantially in recent years, and which have been sold at prices
in the U.S. market that have resulted in severe price suppression for domestic
producers, thereby adversely affecting their very financial viability. This
remedy will severely restrict lower priced imports and will be considerably
less restrictive on imports in higher value brackets, thereby bringing
import prices, on the average, up to levels competitive with those of U.S.
producers. This should encourage the U.S. producers to invest in more
efficient production equipment and to develop clothespins--such as the new
downsized clothespins recently introduced by a major producer--that wili be
less costly to produce and may provide a competitive edge for U.S. producers
after the temporary period of quota protection expires. Under the
recommended remedy herein, .domestic producers will have the opportunity
during the 5-year period to make these changes so that at the end of the
12 .
5-year period it will have made the adjustments necessary to compete with
imports on a fully competitive bas.is.
The remedy recommended applies only to wood and plastic spring
clothespins valued not over $2.10 per gross. All of the information available
to the Commission indicates that imported wood and plastic spring clothespins
valued over $2.10 per gross have accounted for an insignificant share of U.S.
imports and consumption. In addition, the Commission has found that the
long-term trend away from nonspring clothespins by U.S. producers and the
consuming public would be unlikely to be reversed in the future, even if
the remedy were to be made applicable to those clothespins. The remedy
recommended, therefore, does not restrict imports of either wood or plastic
spring clothespins valued over $2.10 per gross or imports of nonspring
clothespins regardless of value.
A-1
INFORMATION OBTAINED IN THE INVESTIGATION
Summary
On July 27, 1978, the United States International Trade Commission instituted investigation No. TA-201-36 under section 201 of the Trade Act of 1974, to determine whether clothespins, provided for under items 790.05, 790.07, and 790.08 of the Tariff Schedules of the United States (TSUS), are being imported into the United States in such increased quantities as to be a substantial cause of serious injury, or the threat thereof, to the domestic industry producing articles like or directly competitive with the imported articles. The public hearing in investigation No. TA-201-36 was held on October 5, 1978, in Portland, Maine. The administrative deadline for reporting to the President is Tuesday, November 21, 1978; l/ the statutory deadline for reporting to the President is January 27, 1979.
The investigation was instituted by the Commission on its own motion on the basis of information collected in connection with Commission investigations Nos. TA-406-2, TA-406-3, and TA-406-4, conducted under section 406(a) of the Trade Act of 1974, concerning clothespins from the People's Republic of China, ~/ the Polish People's Republic, and the Socialist Republic of Romania.
The investigations under section 406 were undertaken by the Commission pursuant to a petition filed on behalf of the Clothespin & Veneer Products Association (CVPA), to determine, with respect to clothespins that are the products of certain Communist countries, whether market disruption exists with respect to such articles produced by a domestic industry. On August 3, 1978, the investigations under section 406 were concluded. At that time the Commission reported to the President that market disruption existed with respect to imports from China, but not with respect to imports from Poland or Romania. The Commission recommended an annual quota on imports of clothespins from China as a remedy to the market disruption. 3/ The President, on October 2, 1978, rejected the Commission's quota recommendation.
There are four major types of clothespins: wood spring clothespins, plastic spring clothespins, roundhead or squarehead nonspring clothespins of wood, and nonspring ironbound clothespins of wood.
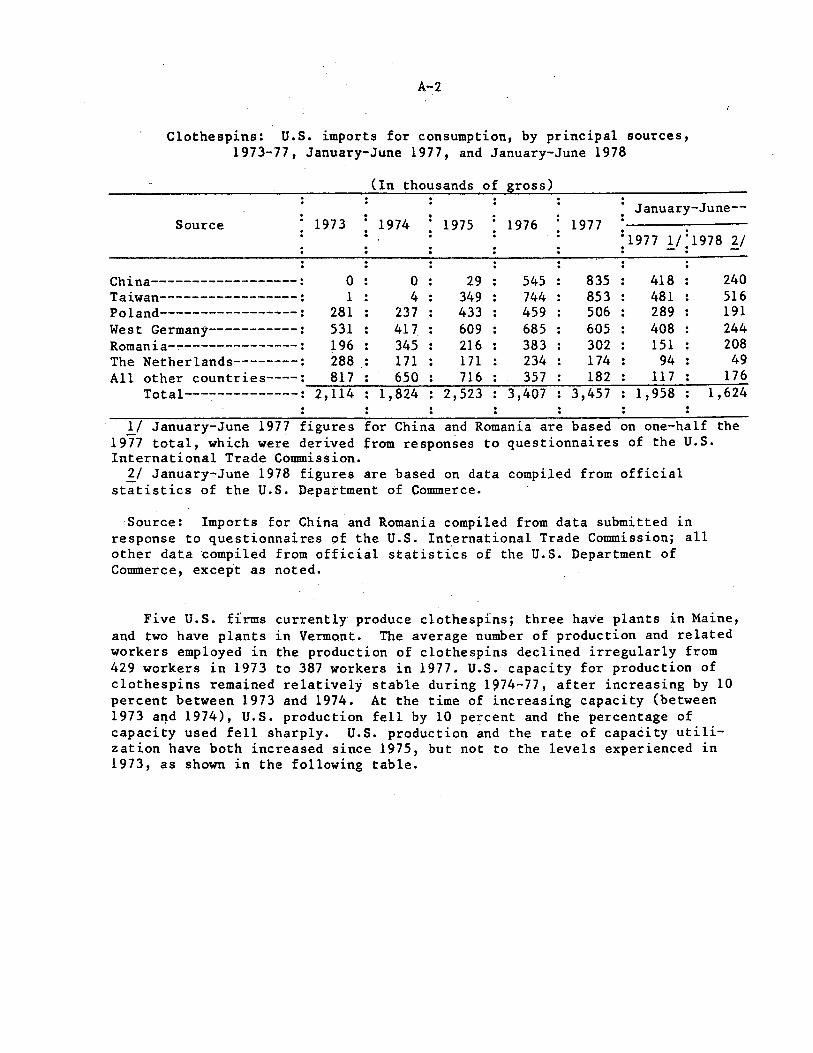
Clothespins are provided for in items 790.05, 790.07, and 790.08 of the TSUS. The column 1 (most-favored-nation) rate of duty for wood and plastic spring clothespins (TSUS item 790.05) is 10 cents per gross; the column 2 rate is 20 cents per gross. U.S. imports of clothespins by principal sources are shown in the following table.
~/ On November 16, 1978, the Commission voted to postpone its consideration of remedy in this investigation until November 28, 1978, thereby postponing its transmittal of its determination to the President until early December 1978.
2/ The People's Republic of China is hereafter referred to in this report as China; the Republic of China is referred ·to as Taiwan.
~/ For a description of the Commission's quota recommendations, see page A-7 of the report.
A-2
Clothespins: U.S. imports for consumption, by principal sources, 1973-77, January-June 1977, and January-June 1978
(In thousands of ~ross)
January-June--1973 Source 1974 1975 1976 1977
=1977 1/1978 2/ : -: -
China------------------: 0 0 29 545 835 418 240 Taiwan-----------------: 1 4 349 744 853 481 516 Poland-----------------: 281 237 433 459 506 289 191 West Germany-----------: 531 417 609 685 605 408 244 Romania----------------: 196 345 216 .383 302 151 208 The Netherlands--------: 288 171 171 234 174 94 49 All other countries----: 817 650 716 357 182 117 176
Total---~----------: 2, 114 1,824 2,523 3,407 3,457 1,958 1,624
1/ January-June 1977 figures for China and Romania are based on one-half the 19J7 total, which were derived from responses to questionnaires of the U.S. International Trade Commission.
2/ January-June 1978 figures are based on data compiled from official st;tistics of the U.S. Department of Commerce.
Source: Imports for China and Romania compiled from data submitted in response to questionnaires of the U.S. International Trade Commission; all other data compiled from official statist{cs of the U.S. Department of Counnerce, except as noted.
Five U.S. firms currently produce clothespins; three have plants in Maine, and two have plants in Vermo.nt. The average number of production and related workers employed in the production of clothespins declined irregularly from 429 workers in 1973 to 387 workers in 1977. U.S. capacity for production of clothespins remai,.ned relatively stable during 1974-77, after increasing by 10 percent between 1973 and 1974. At the time of increasing capacity (between 1973 a~d 1974), U.S. production fell by 10 percent and the percentage of capacity used fell sharply. U.S. production and the rate of capacity utilization have both increased since 1975, but not to the levels experienced in 1973, as shown in the fo!lowing table.
A-3
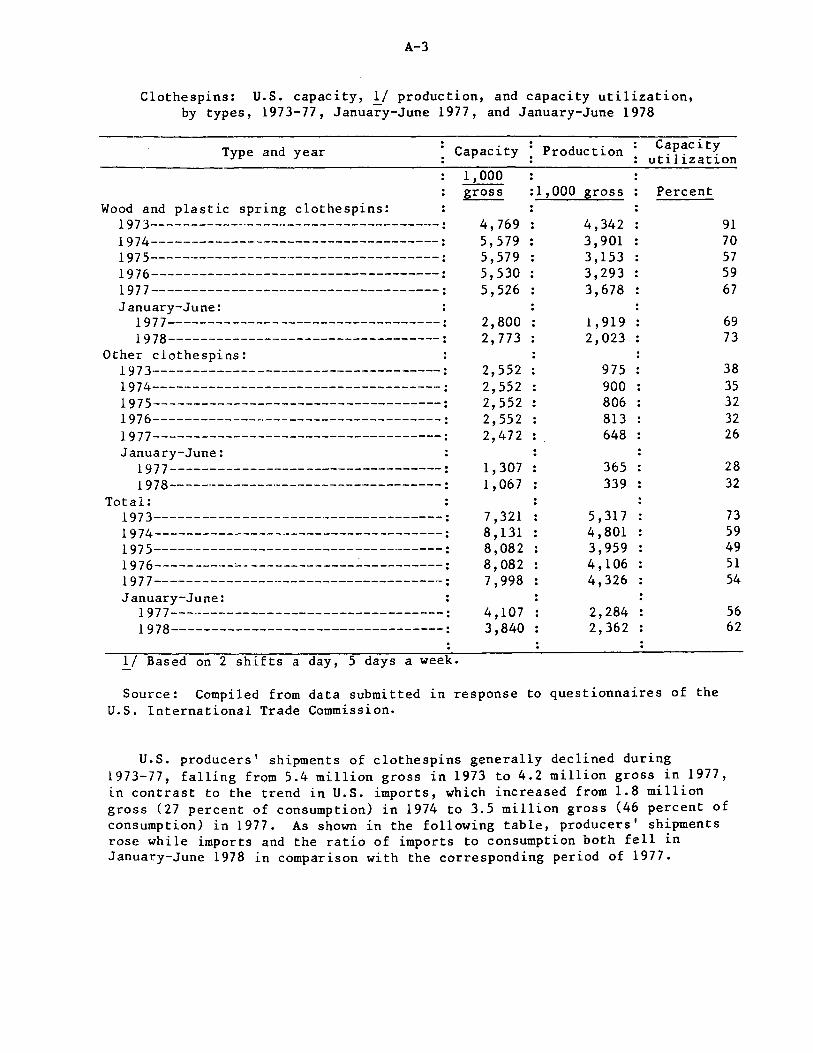
Clothespins: U.S. capacity, ~/ production, and capacity utilization, by types, 1973-77, January-June 1977, and January-iune 1978
. Capacity Type and year Capacity : Production utilization
Wood and plastic spring clothespins: 197 3-----------------------------------------: 1974------------------------------------: 1975------------------------------------: 1976------------------------------------: 1977------------------------------------: January-June:
1977----------------------------------: 1978----------------------------------:
Other clothespins: 1973------------------------------------: 1974------------------------------------: 1975------------------------------------: 1976------------------------------------: 1977------------------------------------: January-June:
1977----------------------------------: 1978-----·-----------------------------:
Total: 1973------------------------------------: 1974------------------------------------: 1975------------------------------------: 1976----------~--------------~----------: 1977------------------------------------: January-June:
1977----------------------------------: 1978----------------------------------:
l/ Based on 2 shifts a day, 5 days a week.
1,000 gross
4, 769 5,579 5,579 5,530 5,526
2,800 2, 773
2,552 2,552 2,552 2,552 2,472
1,307 1,067
7,321 8' 131 8,082 8, 082 7,998
4,107 3,840
:1,000 gross Percent
4,342 3,901 3, 153 3,293 3,678
1,919 2,023
975 900 806 813 648
365 339
5,317 4,801 3,959 4' 106 4,326
2,284 2,362
Source: Compiled from data submitted in response to questionnaires of the U.S. International Trade Commission.
91 70 57 59 67
69 73
38 35 32 32 26
28 32
73 59 49 51 54
56 62
U.S. producers' shipments of clothespins generally declined during 1973-77, falling from 5.4 million gross in 1973 to 4.2 million gross in 1977, in contrast to the trend in U.S. imports, which increased from 1.8 million gross (27 percent of consumption) in 1974 to 3.5 million gross (46 percent of consumption) in 1977. As shown in the following table, producers' shipments rose while imports and the ratio of imports to consumption both fell in January-June 1978 in comparison with the corresponding period of 1977.
A-4
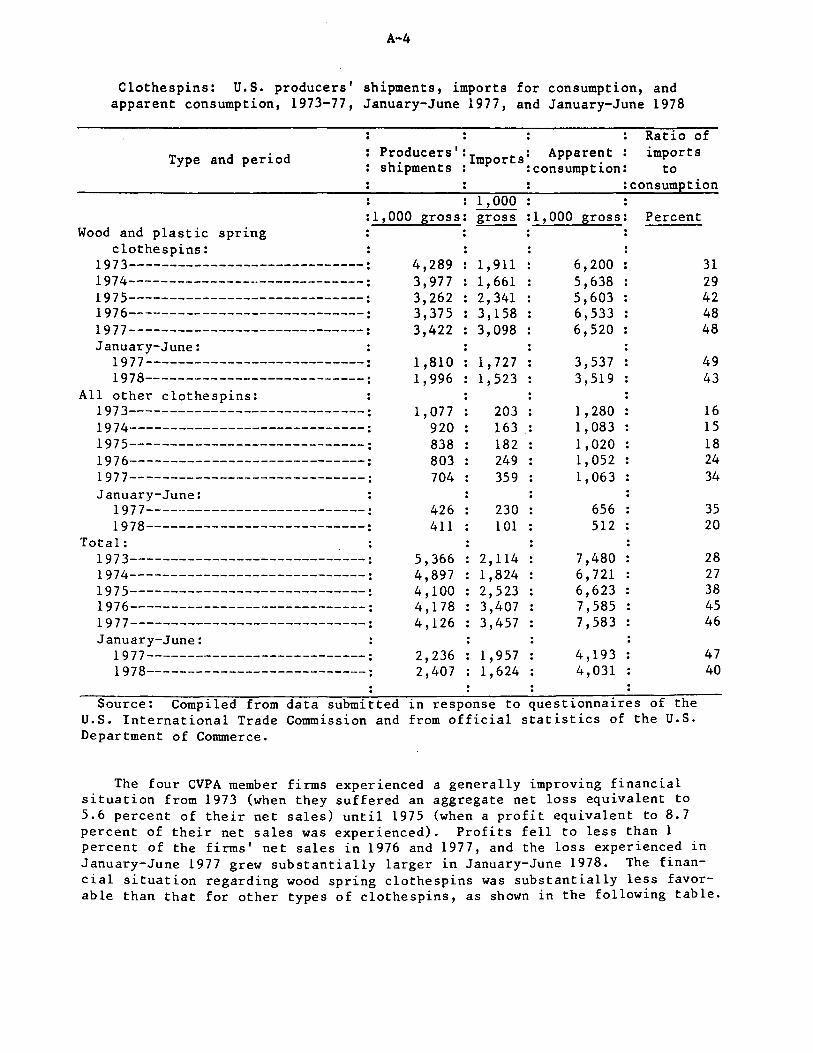
Clothespins: U.S. producers' shipments, imports for consumption, and apparent consumption, 1973-77, January-June 1977, and January-June 1978
Ratio of
Type and period Producers': 1 t: Apparent imports h . mpor s .
s i.pments : : consumption: to :consumption
1,000 :1,000 gross: gross : 1'000 gross: Percent
Wood and plastic spring clothespins:
1973-----------------------------: 4,289 1, 911 6,200 1974-----------------------------: 3,977 1,661 5,638 1975-----------------------------: 3,262 2,341 5,603 1976-----------------------------: 3,375 3,158 6,533 1977-----------------------------: 3,422 3,098 6,520 January-June:
1977---------------------------: 1,810 1, 727 3,537 1978---------------------------: 1,996 1,523 3,519
All other clothespins: 1973-----------------------------: 1,077 203 1,280 1974-----------------------------: 920 163 : 1,083 1975-----------------------------: 838 182 1,020 1976-----------------------------: 803 249 1,052 1977-----------------------------: 704 359 1,063 January-June:
1977---------------------------: 426 230 656 1978---------------------------: 411 l 01 512
Total: 1973-----------------------------: 5,366 2, 114 7,480 1974-----------------------------: 4,897 1,824 6' 721 1975----------------------~------: 4, 100 2,523 6,623 1976-----------------------------: 4,178 3,407 7,585 1977-----------------------------: 4' 126 3,457 7,583 January-June:
1977---------------------------: 2,236 1, 957 4,193 1978---------------------------: 2,407 1, 624 4,031
Source: Compiled from data submitted in response to questionnaires of the U.S. International Trade Commission and from official statistics of the U.S. Department of Conunerce.
31 29 42 48 48
49 43
16 15 18 24 34
35 20
28 27 38 45 46
47 40
The four CVPA member firms experienced a generally improving financial situation from 1973 (when they suffered an aggregate net loss equivalent to 5.6 percent of their net sales) until 1975 (when a profit equivalent to 8.7 percent of their net sales was experienced). Profits fell to less than 1 percent of the firms' net sales in 1976 and 1977, and the loss experienced in January-June 1977 grew substantially larger in January-June 1978. The financial situation regarding wood spring clothespins was substantially less favorable than that for other types of clothespins, as shown in the following table.
A-5
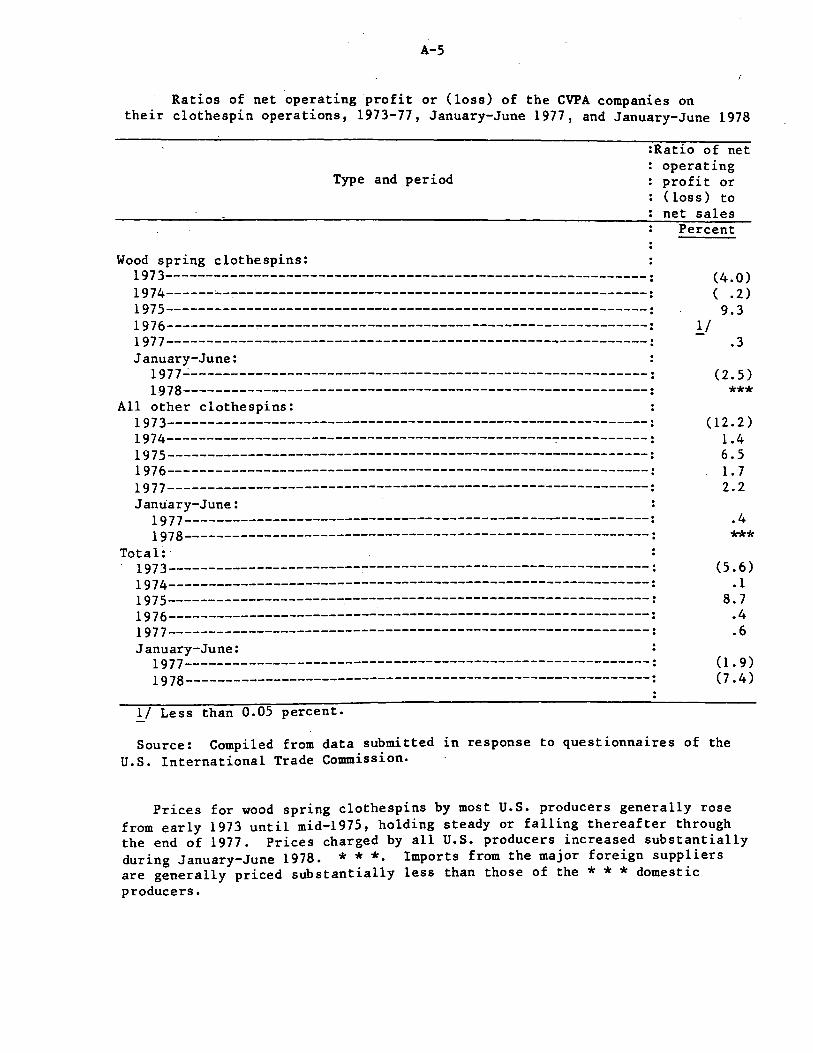
Ratios of net operating profit or (loss) of the CVPA companies on their clothespin operations, 1973-77, January-June 1977, and January-June 1978
Type and period
:Ratio of net operating profit or (loss) to net sales
Wood spring clothespins: : 1973------------------------------------------------------------: 1974------~-~---------------------------------------------------:
1975------------------------------------------------------------: 1976------------------------------------------------------------: 1977------------------------------------------------~-----------:
January-June: : 1977~---------------------------------------------------------:
1978----------------------------------------------------------: All other clothespins: :
1973------------------------------------------------------------: 1974------------------------------------------------7-----------: 1975------------------------------------------------------------: 1976------------------------------------------------------------: 1977------------------------------------------------------------: January-June:
1977----------------------------------------------------------: 1978----------------------------------------------------------:
Total:· 1973------------------~-----------------------------------------: 1974---------------------------------------------------------~--:
197 5----------------------.--------------------------------------: 1976------------------------------------------------------------: 1977------------------------------------------------------------: January-June:
1977----------------------------------------------------------: 1978----------------------------------------------------------:
1/ Less than 0.05 percent.
Percent
(4.0) ( . 2) 9.3
~j .3
(2.5)
*** (12.2)
1.4 6.5 1. 7 2.2
.4
*** (5.6)
.1 8.7
.4
.6
(1. 9) (7 .4)
Source: Compiled from data submitted in response to questionnaires of the U.S. International Trade Commission.
Prices for wood spring clothespins by most U.S. producers generally rose from early 1973 until mid-1975, holding steady or falling thereafter through the end of 1977. Prices charged by all U.S. producers increased substantially during January-June 1978. * * *· Imports from the major foreign suppliers are generally priced substantially less than those of the * * * domestic producers.
A-6
Introduction
On July 27, 1978, the United States International Trade Commission instituted investigation No. TA-201-36, under section 201 of the Trade Act of 1974, to determine whether clothespins provided for under items 790.05, 790.07, and 790.08 of the Tariff Schedules of the United States (TSUS), are being imported into the United States in such increased quantities as to be a substantial cause of serious injury, or the threat thereof, to the domestic industry producing articles like or directly competitive with the imported articles.
The Commission instituted this investigation on its own motion, on the basis of information collected in connection with Commission investigations Nos. TA-406-2, TA-406-3, and TA-406-4, conducted under section 406(a) of the Trade Act of 1974, concerning clothespins from the People's Republic of China,~/ the Polish People's Republic, and the Socialist Republic of Romania.
Notice of the institution of the Commission's investigation and of a public hearing to be held in connection therewith was duly given by posting copies of the notice in the Office of the Secretary, United States International Trade Commission, Washington, D.C., and in the Commission's New York Office, and by publishing the notice in the Federal Register of August 3, 1978 (43 F.R. 34218). 2/ In accordance with the notice, a public hearing was held on October 5, 197~, in Portland, Maine.
The Trade Act of 1974 directs the Commission to complete its investigations under section 201 at the earliest practical time, but no later than 6 months after the date the Commission institutes an investigation on its own motion. In this investigation, the statutory deadline for the completion of the investigation is January 27, 1979. The Commission has decided to expedite this investigation, however, and is currently scheduled to report its determination to the President on November 21, 1978. ll
The investigations under section 406 were undertaken by the Commission pursuant to a petition filed on behalf of the Clothespin & Veneer Products Association (CVPA), to determine, with respect to clothespins that are the products of certain Communist countries, whether market disruption existed with respect to such articles produced by a domestic industry. On August 3, 1978, the Commission reported to the President that market disruption existed regarding imports of clothespins from China but did not exist with respect to imports of clothespins from Poland or Romania.
1/ The People's Republic of China is hereafter referred to in this report as China; the Republic of China is referred to as Taiwan.
2/ A copy of the Commission's notice of investigation and hearing is presented in app. A.
3/ On November 16, 1978, the Commission voted to postpone its consideration of-remedy in this investigation until November 28, 1978, thereby postponing its transmittal of its determination to the President until early December 1978.
A-7
The Commission unanimously recommended to the President quotas on U.S. imports of clothespins from China. Chairman Joseph O. Parker and Commissioners George M. Moore and Catherine Bedell recommended a 5-year quota on such imports. The quota would be administered on a yearly basis, with each year established ~t 431,000 gross, on the basis of the average of the imports of such clothespins from China for the years 1975, 1976, and 1977.· Commissioner Italo H. Ablondi agreed with this remedy, but only for a 3-year period. Vice Chairman Bill Alberger and Commissioner Daniel Minchew recommended a 5-year quota to be administered on a quarterly basis, with the first year established at 431,000 gross, on the basis of the average quantity of imports for the years 1975-77, with the quota amount to be increased by 5 percent each year.
On October 2, 1978, the President announced his decision to deny relief under t~e "market disruption" provisions of· section 406 of the Trade Act of 1974. The President noted, in denying the relief, that the Commission had instituted an ·escape clause investigation under section 201 of the Trade Act of 1974 to determine whether clothespins from all foreign suppliers are being imported into the United States in such increased quantities as to be a substantial cause of serious injury, or the threat thereof, to the domestic industry. The President said the problems facing the domestic clothespin industry will be considered further within the context of the pending escape clause case. 1 I
Description and Uses
There are four major types of clothespins: spring-type clothespins of wood, spring-type clothespins of plastic, roundhead or squarehead nonspringtype clothespins of wood, and roundhead or squarehead nonspring-type clothespins of wood that are iron bound. While the various types of clothespins are generally interchangable as to function, prices vary substantially from type to type. The higher priced wood ironbound clothespins and plastic spring clothespins enjoy a substantially smaller market share than the lower priced w.ood spring clothespins. Other key consumer factors are size, strength, and durability. Besides being used on clotheslines, clothespins may be used in certain agricultural applications and in film developing.
U.S.-produced clothespins of wood are manufactured primarily from beech; maple is often substituted if beech is unavailable. Polish and West German clothespins of wood are manufactured from hornbeam or beech, and clothespins from Taiwan, Hong Kong, and China are made of jelutong or ramin. All these woods are hardwood, but the types of wood used to manufacture clothespins in the United States and in Europe are generally considered superior to the types used in the Far East.
In the domestic manufacturing pr.ocess for wood spring clothespins, the wood is sawed to the length of the prospective clothespins and then grooved. The wood is then sawed or sliced to the required widths. The unassembled clothespin parts are then tumble dried for 8 to 10 hours in large dryers, with small amounts of paraffin wax added. This drying process provides the
1/ The text of the President's Oct. 2, 1978, message to the Congress is presented in app. B.
A-8
clothespin parts with a smo()th, "finished" appearance. Finished unassembled clothespin parts are then fed into an assembly machine, where small galvanized steel wire springs are attached to complete the wood spring clothespins. The galvanized steel wire from which the springs are made is usually imported from Belgium.
In late 1977, Forster Manufacturing Co. started production of a "down sized" wood spring clothespin. This smaller clothespin is 2-7/8 inches in length compared with the normal 3-1/4 inches in length; the smaller clothespin uses a smaller 16-gage wire, as opposed t,o the regular 15-gage wire. The smaller clothespin was developed in order to reduce costs and to compete head-on with small wood spring clothespins from China, Taiwan, and Hong Kong, that had captured over one-half of totd U.S. imports of clothespins by 1977.
Unassembled plastic spring clothespin parts are made by the injectionmolding process and then assembled on the same assembly machines as the wood spring clothespins. However, since the· cost of producing plastic spring-type clothespins has been rapidly increasing because of rising petroleum prices, their production in recent years has been small. In this connection, plastic spring-type clothespins accounted for only 2 percent of U.S. producers' shipments of clothespins during January-June 1978.
Domestic roundhead nonspring clothespins of wood are manufactured from the same hardwoods as wood spring clothespins. In the manufacturing process, the wood is sawed and shaped into thin poles, which are then cut to clothespin size. The round head of the clothespin is formed on a wood-molding machine, and the slit is made by a grooving process. Like the unassembled wood spring clothespin parts, the roundhead clothespins are put in large dryers with paraffin wax added to give the clothespins a smooth, finished appearance.
Ironbound wooden clothespins are actually roundhead clothespins with a wrapping of steel .wire, which prevents the clothespins from splitting. Currently, only Forster Manufacturing Co., Wilton, Maine, manufactures ironbound clothespins; they are higher in price per gross than any other type of clothespin. ·
U.S. Tariff Treatment
Clothespins are provided for eo nomine in items 790.05, 790.07, and 790.08 of the Tariff Schedules of the United States. The column 1 (mostfavored-nation) rate of duty for wood and plastic spring clothespins (TSUS item 790.05) is 10 cents per gross; the column 2 rate is 20 cents per gross. All nonspring clothespins of plastic (TSUS item 790.07) are dutiable at the column 1 rate of 8.5 percent ad valorem and the column 2 rate of 80 percent ad valorem. All wood roundhead. (i.e., nonspring) clothespins (TSUS item 790.08) are dutiable at the column 1 rate of 7.5 percent ad valorem and the column 2 rate of 35 percent ad valorem. Prior to January 1978, TSUS item 790.05 did not have a separate statistical breakdown for wood spring clothespins and plastic spring clothespins. The only clothespins that are subject to dutyfree treatment when imported from beneficiary developing countries under the Generalized System of Preferences are the nonspring plastic ones imported under TSUS item 790.07.
A-9
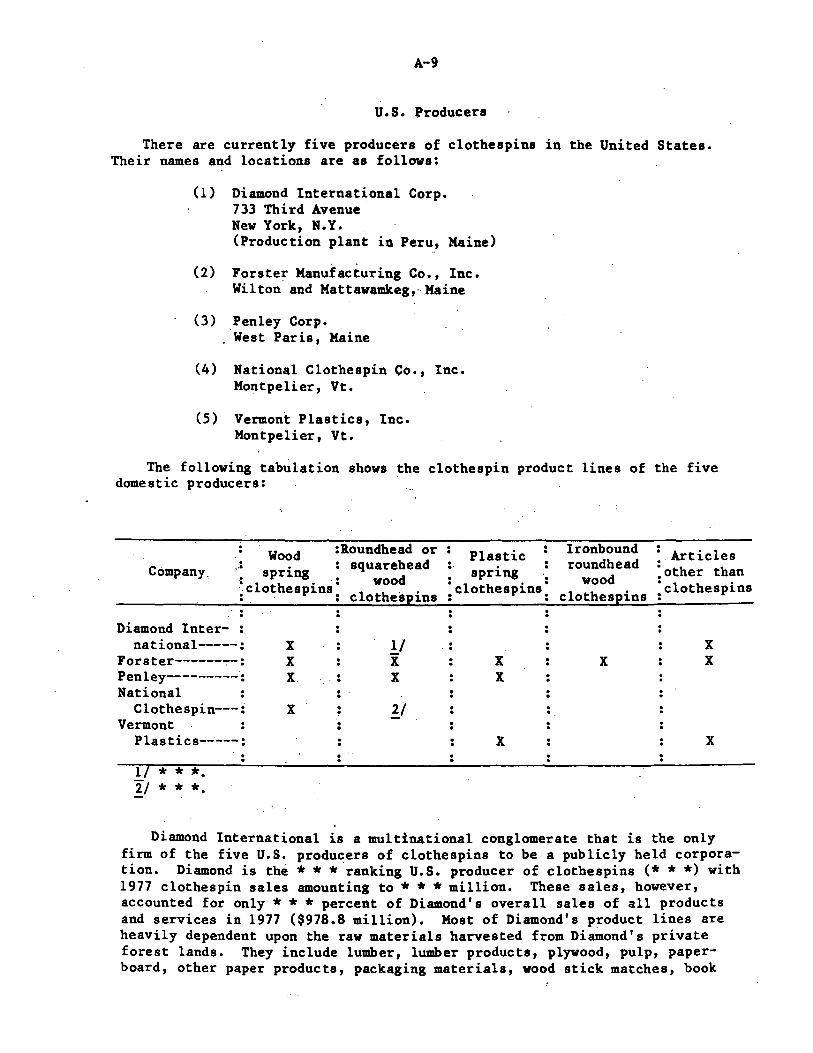
U.S. Producers
There are currently five producers of clothespins in the United States. Their names and locations are as follows:
(1) Diamond International Corp. 733 Third Avenue New York, N.Y. (Production plant in Peru, Maine)
(2) Forste~ Manufacturing Co., Inc. Wilton and Mattawamkeg,-· Maine
(3) Penley Corp. West Paris, Maine
(4) National Clothespin Co., Inc. Montpelier, Vt.
(5) Vermont Plastics, Inc. Montpelier, Vt.
The following tabulation shows the clothespin product lines of the five domestic producers:
Wood . Company, -·: spring •
:Roundhead or squarehead
wood clothespins :clothespins: . .
Diamond Inter-.. .
national-----:· Forster------"':"-: Penley---------~ National
Clothespin---: Vermont
Plastics-----:
1 * * *· 2./ * * *·
x x X.
x
. :
1/ i x
'!:.l
Plastic lronbound :.. spring • roundhead
wood :clothespins: • • clothespins
. . . x x x
x
•. Articles :other than ;clothespins
x x
x
Diamond International is a multinational conglomerate that is the only firm of the five U.S. producers of clothespins to be a publicly held corporation. Diamond is the * * * ranking U.S. producer of clothespins (* * *) with 1977 clothespin sales amounting to * * * million. These sales, however, accounted for only * * * percent of Diamond's overall sales of all products and services in 1977 ($978.8 million). Most of Diamond's product lines are heavily dependent upon the raw materials harvested from Diamond's private forest lands. They include lumber, lumber products, plywood, pulp, paperboard, other paper products, packaging materials, wood stick matches, book
A-10
matches, and toothpicks, as· well as clothespins. Other product lines include the manufacture and sale of machinery for packaging, egg handling, and paper and paperboard manufacture. In addition, Diamond operates numerous retail outlets specializing in lumber and other home improvement materials. ·
Forster is a privately held corporation with annual sales of all products amounting .to*** in 1977. Forster's sales of clothespins were valued at * * * million·in 1977 (or*** percent of its total sales of all products), making the firm the * * * u.s. producer of clothespins. The firm has attempted to diversify its product line in recent years. However, virtually all of its product lines are de.rived from forest products. Among the other products pro.duced and ·sold by Forster .are rolling pins, tongue depressors, ice cream sticks, wooden dowels, wooden eating and cooking utensils, croquet sets, toboggans and other wooden articles. In addition, Forster has also developed a line of related plastics products such as ·clothespins and plastic eating utensils.
Penley, the * • * U.S. producer of clothespins, with 1977 sales of clothespins amounting to * * * is also a privately held corporation. Wood and plastic clothespins account for virtually the entire product line of the firm. National, with 1977 sales of clothespins valued at * * * is the * * * U.S. producer. It, too, is a privately held corporation with clothespins accounting for virtually all of its annual sales. * * *·
Vermont Plastics,. a privately owried firm, with annual sales of its plastic clothespins valued at*** in 1977, is the*** of .the five domestic clothespin producers. Clothespins.accpunted for only a small proportion of its total output· o.f industrial plastics products and plastics housewares, however. * * *·
U.S. Importers
Approximately 150 firms currently import clothespins. A number of large importers are general housewares importers; clothespins account for only a very small part of their Operations. A few discount department store chains such as * * *, * * *, and ~ *. *, have become importers of the product. * * *· Many of the other· importers are primarily small entrepreneurs, usually having only a few employees.
In most cases, importers switch their import sourcing from country to country in order to secure the lowest prices. They also import clothespins from several countries in order to assure themselves a steady supply of the product.· * * *·
* * * * * * *
A-11
* * * * * * *
U.S. Market
Clothespins are generally sold in supermarkets, hardware stores, and discount, chain and variety stores. Sales of clothespins are more concentrated in less affluent areas, where gas and electric clothes dryers are luxuries, and in areas where the climate is favorable for the use of outdoor househol.d clotheslines year round.
According ·to industry sources, clothespins are considered to be an "impulse product." In other words, consumers do not go to the supermarket or discount chainstore specifically to buy clothespins, but rather they buy them on impulse after seeing them on a clothespin display. Furthermore, clothespins are usually bought by consumers only once or twice a year. Supermarket or department store managers reportedly decide to place an order for clothespins primarily on the basis of price and availability, with price being the key factor. Thus, according to U.S. producers, a rapid influx of low-priced imports can cause severe problems to the domestic industry in a very short period of time.
The Question of Increased Imports
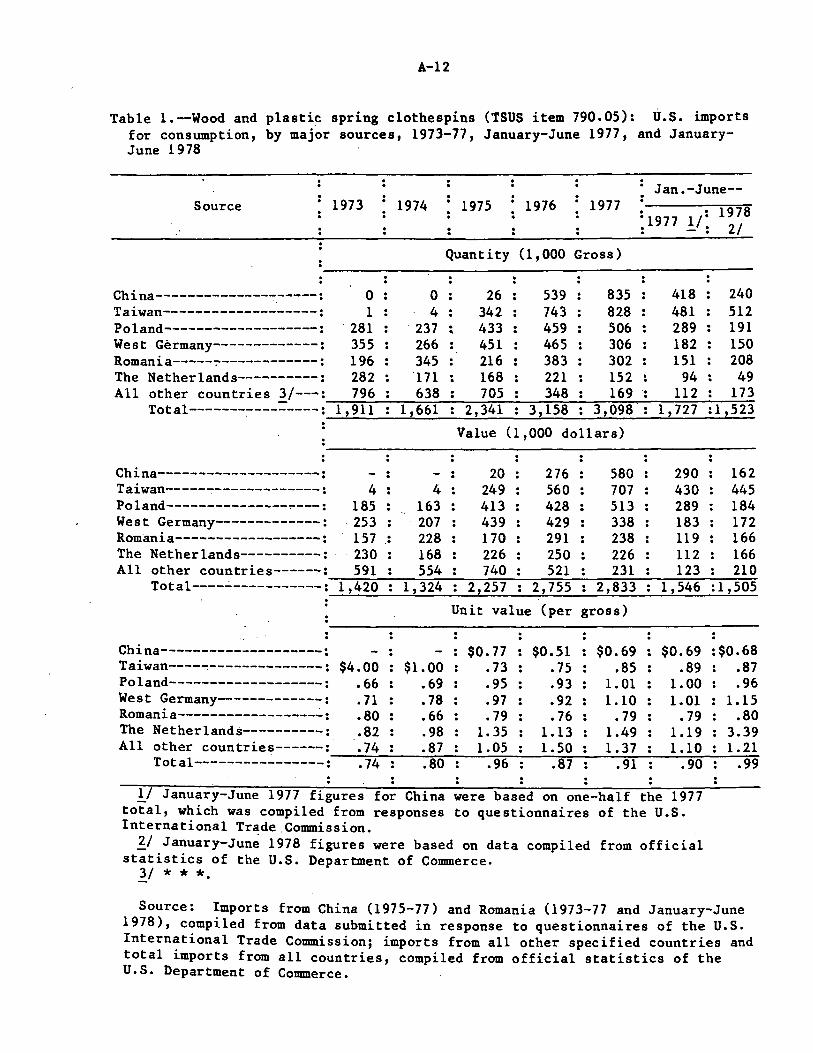
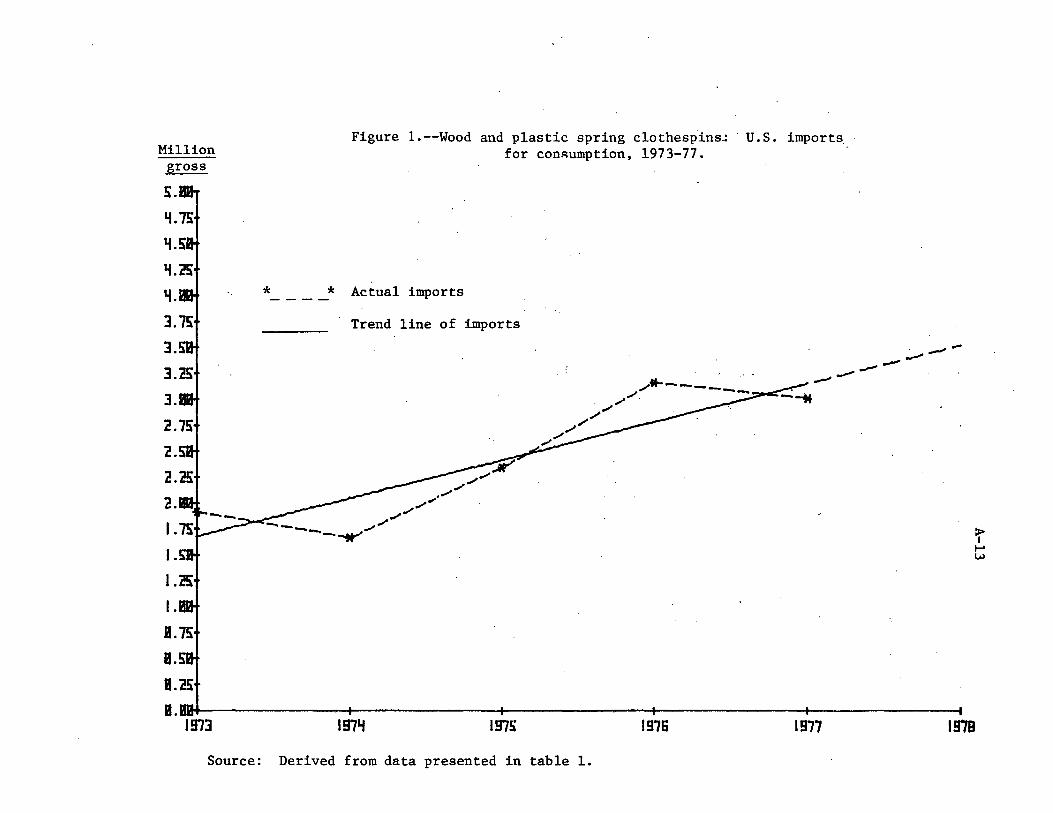
U.S. i~ports of wood and plastic spring clothespins declined from 1.9 million gross in 1973 to 1.7 million gross in 1974 (table 1 and fig. 1) and then increased over the next 2 years to 3.2 million gross in 1976. In 1977, however, imports declined slightly to 3.1 million gross and in the first half of 1978 imports were down by 12 percent from the corresponding period of 1977. China and Taiwan supplied the largest quantities of U.S. imports of wood and plastic spring clothespins in 1977 (27 percent each), while Poland accounted for 16 percent in the same year. In January-June 1978, Taiwan accounted for 34 percent of total imports, China accounted for 16 percent, and Romania and Poland accounted for 14 and 13 percent, respectively. 1/
1/ The data on imports obtained from responses to the Commission's questionnaires differ considerably from import data published by the U.S. Department of Commerce. While the questionnaire data are believed to be more reliable in identifying the major sources of U.S. imports of clothespins, the data published by the Department of Commerce are presented in tables 2 and 3 in order to identify the minor sources of U.S. imports.
A-12
Table 1.--Wood and plastic spring clothespins (TSUS item 790.05): U.S. imports for consumption, by major sources, 1973-77, January-June 1977' and January-June 1978
Jan.-June--Source 1973 1974 1975 1976 1977
~1977 1/: 1978
- . 2/
Quantity (1, 000 Gross)
China---------------.-----: 0 0 26 539 835 418 240 Taiwan-------------------: 1 4 342 743 828 481 512 Poland-------------------: '281 '237 . 433 459 506 289 191 ' West Germany-------------: 355 266 451 465 306 182 150 Romania-----~------------: 196 345 216 383 302 151 208 The Netherlands----------: 282 ·111 168 221 152 94 49 All other countries 3/---: 796 638 705 348 169 .. 112 173 .
Total-------~---=----: 1,911 1,661 2,341 3,158 3,098' 1,727 :1,523
Value o ,ooo dollars)
China--------------------: - . 20 276 580 290 . Taiwan-----~--------~----: 4 4 249 560 707 430 Poland---------------~---: 185 163 413 428 513 289 West Germany-------------: 253 207 439 429 338 183 Romania------------------: 157 . 228 170 291 238 119 . • The Netherlands----------: · '230 168 226 250 226 112 All other countries------: 591 554 740 521 231 123
Total----~-----------: 1,420 1,324 2,257 2,755 2,833 1,546
Unit value (per gross)
China--------------------: $0.77 $0.51 $0.69 $0.69 Taiwan----~--------------: $4.00 $1.00 • 73 .15 .85 .89 Poland-------------------: • 66 • 69 .95 .93 1.01 1.00 West Germany~-----------: • 71 .78 .97 .92 1.10 1.01 Romania-----------------~: .80 • 66 .79 .76 .79 • 79 The Netherlands----------: .82 .98 1. 35 1.13 1.49 1.19 All other countries------: .74 .87 1.05 1.50 1.37 1.10
Total----------------: .74 .80 .96 .87 .91 .90
~/ January-June 1977 figures for China were based on one-half the 1977 total, which was compiled from responses to questionnaires of the U.S. International Trade.Co11DDission. ~/ January-Jun~ 1978 figures were based on data compiled from official
statistics of the U.S. Department of Commerce. ll * * *·
162 445 184 172 166 166 210
:1,505
:$0.68 .87 .96
1.15 .80
3.39 1.21
.99
Source: Imports from China (1975-77) and Romania (1973-77 and January-June 1978), compiled from data submitted in response to questionnaires of the U.S. International Trade Co11DDission; imports from all other specified countries and total imports from all countries, compiled from official statistics of the U.S. Department of Commerce.
Million gross
3.
3.
2.
Figure 1.--Wood and plastic spring clothespins! · U.S. imports for consumption, 1973-77.
*- ___ * Actual imports
Trend line of imports
1971.f 1975
.,, ./
././ .,, ·-------.-.. ./
/. ./ .,,
1976
--- -- -- ---
1977
Source: Derived from data presented in table 1.
-- ----
~ ...... w
1!178
A-14
Table 2.--Wood and plastic spring clothespins (TSUS item 790.05): U.S. imports for consumption, by country, 1973-77
Country 1973 1974 1975 1976 1977
Quantity (gross)
Taiwan------------------~: 556 4,200 341,721 742, 716 827,687 China------------~-------: ·0 0 25,675 160,931 669,009 Po land--------------..;. _____ : 281,275 237,177 432,557 458,623 506' 116 Hong Kong--------------~-: 312,313 352,478 .. 508,112 505,127 353,812 . West Germany--------~----: 3.55 ,212 266,017 450,641 464,791 306,447 Romania------------------: 20,000 240,848 82,292 181,308 244,930 The Netherlands----------: 282,400 17-0,896 167,069 220,612 151,788 Czechoslovakia-----------: 135,800':. 130,217 116,367 141,383 18,000 Singapore----------------: 0 0 0 0 8,175 France-------------------: 12,417 . 417 934 1,661 5,432 .. Spain..;.-----------~-------: 0 0 20,000 2,400 2,400 Denmark-------------~----: 221,529 87,457 68,975 26,500 1,740 Dominican Republic-------: 0 0 0 0 1,375 Sweden---------------~---:. 82,974 68-,523 .. ·28,000 155,202 500 . United Kingdom---~--~~---: 1,998 0 0 . 21 480 . Japan-----------------~--: 7 ,650 600 18,015 5,138 35 Belgium------------------: 131,122 ·: 82' 977
.. 69,402 53,635 0 Italy-----------~--------: .52' 707 . 10,650 0 30,668 0 .. Bulgaria-----------------: 0 0 0 5,000 0 Colombia~------~-7-------: 0 0 0 100 0 Portugal------~--~-------: 0 1,327 10,851 1, 932 0 Thailand-----------------: 0 0 104 0 0 Switzerland~---~---------: 0 6,000 0 0 0 Korea-----------~--------: 8,750 0 0 0 0 Norway------------·-------: 4,000 1,000 0 0 0
Total---------~------:1,910,763 :1,660,784 : 2, 340, 715 :3,157,748 :3,097,926
Value (1,000 dollars)
Taiwan-------------------: 4 4 .. 249 560 707 . China--------------------: - . 24 92 447 . Poland-------------------: 185 163 413 428 513 Hong Kong----------------: 261 362 521 504 394 West Germany-------------: 253 207 439 429 338 Romania------------------: 11 112 51 113 167 The Netherlands----------: 230 . 168 226 250 226 . Czechoslovakia-----------: 70 64 73 99 11 Singapore----------------: - . - . - . - . 5 . . . . France-------------------: 10 1 3 4 15 Spain--------------------: - . 29 3 3 . Denmark------------------: 168 91 94 28 3 Dominican Republic-------: - . - . - . - . 2 . . . . Sweden-------------------: 61 56 32 135 1 United Kingdom-----------: 1 - . - . 2 !/ . .
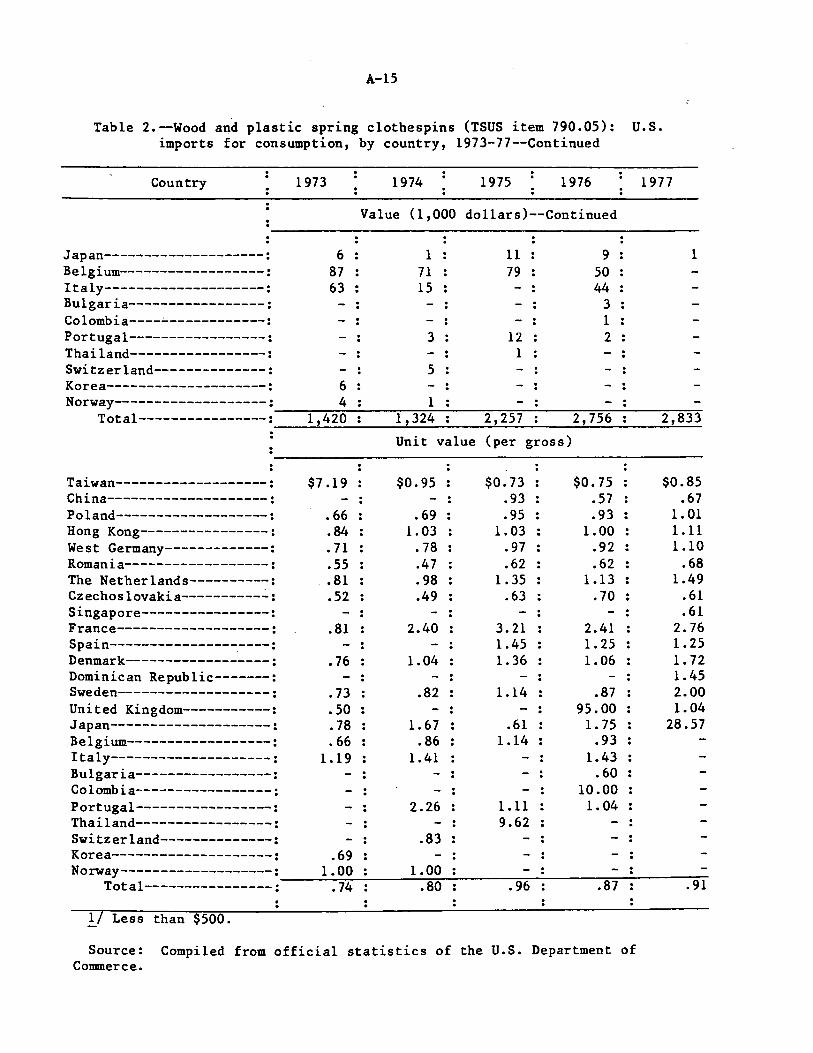
A-15
Table 2.--Wood and plastic spring clothespins (TSUS item 790.05): U.S. imports for consumption, by country, 1973-77--Continued
Country 1973 1974 1975 1976 1977
Value (1,000 dollars)--Continued
Japan--------------------: 6 1 11 9 1 Belgium------------------: 87 71 79 50 Italy--------------------: 63 15 44 Bulgaria-----------------: - . - . 3 . . Colombia----~------------: - . - : 1 . Portugal-----------------: - . 3 12 2 . Thailand-----------------: - . 1 . Switzerland--------------: - . 5 . Korea--------------------: 6 - . . Norway-------------------: 4 1 - . .
Total----------------: 1,420 1,324 2,257 2,756 2,833
Unit value (per gross)
Taiwan-------------------: $7.19 $0.95 $0.73 $0.75 $0.85 China--------------------: .93 .57 .67 Poland-------------------: • 66 • 69 .95 .93 1.01 Hong Kong----------------: .84 1.03 1.03 1.00 1.11 West Germany-------------: • 71 .78 .97 • 92 1.10 Romania------------------: .55 .47 .62 .62 .68 The Netherlands----------: .81 • 98 1.35 1.13 1.49 Czechoslovakia----------~: .52 .49 .63 .70 .61 Singapore----------------: - . - . .61 . . France-------------------: .81 2.40 3.21 2.41 2.76 Spain----------------.----: - . 1.45 1. 25 1.25 . Denmark------------------: .76 1.04 1.36 1.06 1. 72 Dominican Re pub lie-------: - . - . - . 1.45 . . . Sweden-------------------: .73 .82 1.14 .87 2.00 United Kingdom-----------: • 50 - . - . 95.00 1.04 . . Japan--------------------: .78 1. 67 .61 1. 75 28.57 Belgium------------------: • 66 .86 1.14 .93 Italy--------------------: 1.19 1.41 1.43 Bulgaria-----------------: .60 Colombia-----------------: 10.00 Portugal-----------------: - . 2.26 1.11 1. 04 . Thailand-----------------: 9.62 Switzerland--------------: - . .83 . Korea--------------------: .69 Norway-------------------: 1.00 1.00 - . .
Total----------------: .74 .80 . 96 .87 .91
1/ Less than $500.
Source: Compiled from official statistics of the U.S. Department of Connnerce.
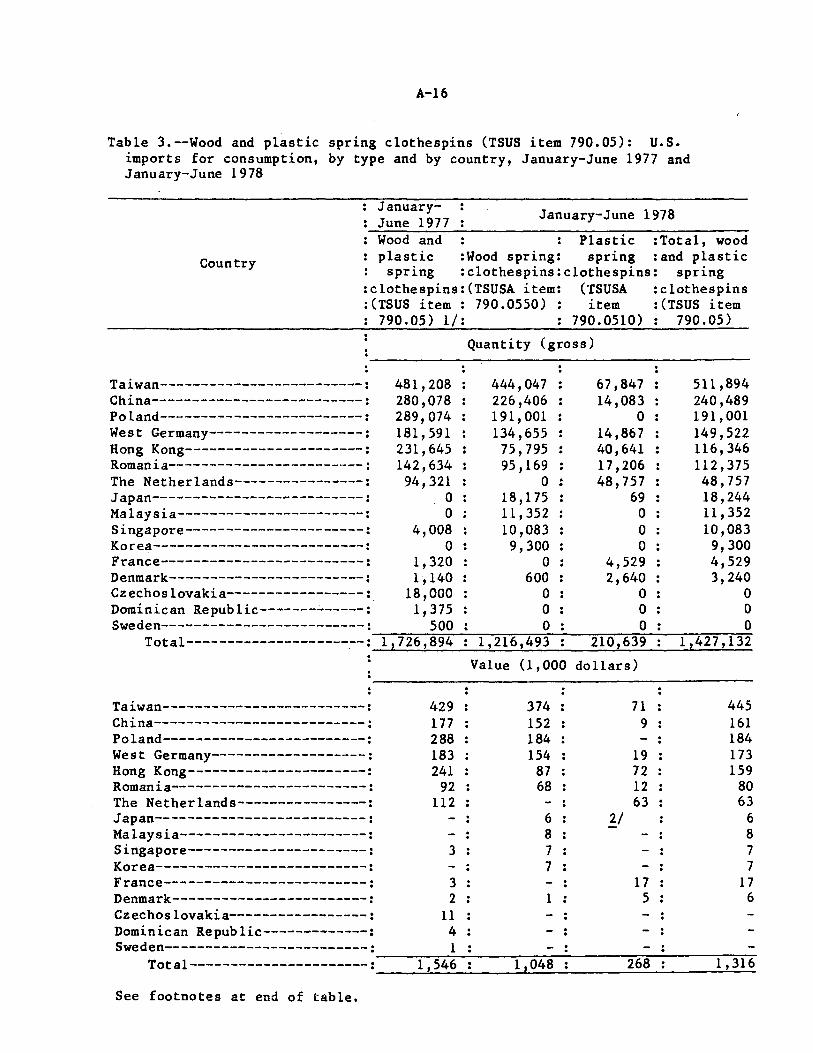
A-16
Table 3.--Wood and plastic spring clothespins (TSUS item 790.05): u.s. imports for consumption, by type and by country, January-June 1977 and January-June 1978
JanuaryJune 1977 January-June 1978
Country
Wood and Plastic :Total, wood plastic :Wood spring: spring :and plastic
spring :clothespins:clothespins: spring :clothespins:(TSUSA item: (TSUSA :clothespins :(TSUS item : 790.0550) : item :(TSUS item
790.05) 1/: 790.0510) 790.05)
Taiwan-------------------------: China--------------------------: Poland-------------------------: West Germany-------------------: Hong Kong----------------------: Romania------------------------: The Netherlands----------------: Japan--------------------------: Malaysia-----------------------: Singapore----------------------: Korea--------------------------:
429 177 2~
183 241
92 112
3
France-------------------------: 3 Denmark------------------------: 2 Czechoslovakia-----------------: 11 Dominican Republic-------------: 4 Sweden-------------------------: 1
Quantity (gross)
444,047 67,847 226,406 14,083 191,001 0 134,655 14,867
75,795 40,641 95,169 17,206
0 . 48,757 . 18,175 69 11,352 0 10,083 0
9,300 0 0 4,529
600 2,640 0 0 0 0 0 0
1,216,493 210,639
Value (1,000 dollars)
445 161 184 173 159
80 63
6 8 7 7
17 6
~~~~~~~~~~~~~~~~~~~----:----:~
Total----------------------: 1,546 1,316 ~~~!.-~~~~-L.~~~~~~~~~~~----~
See footnotes at end of table.
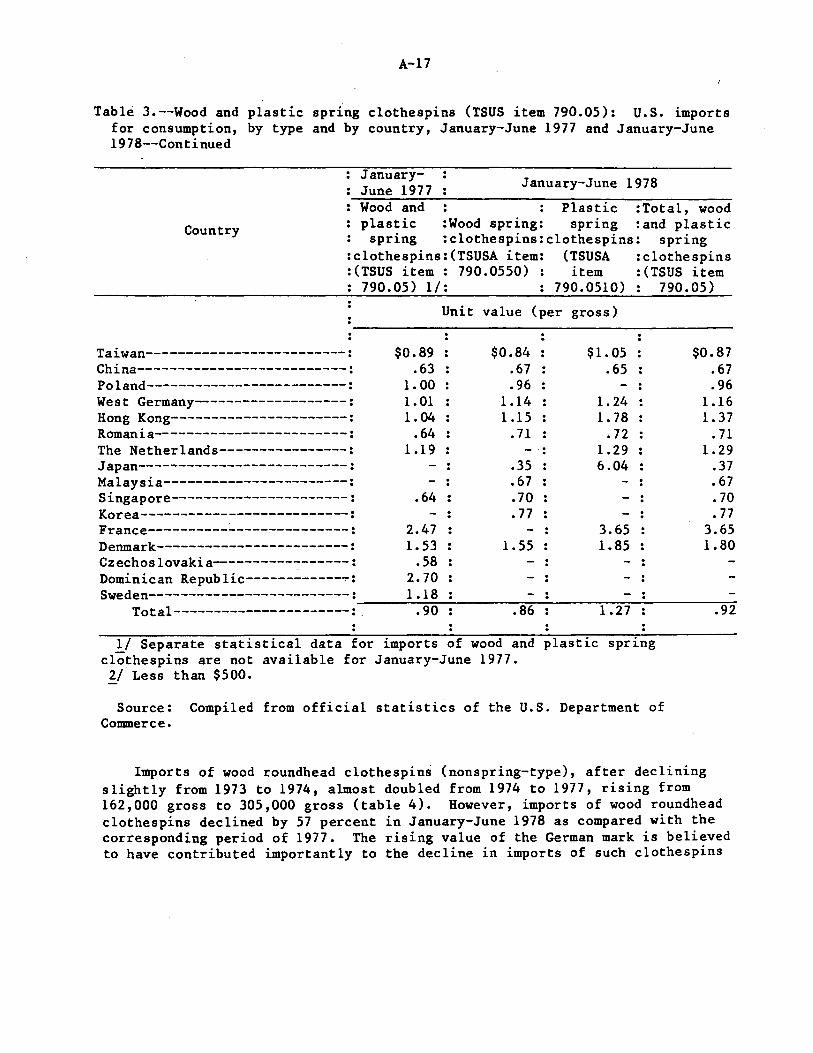
A-17
Table 3.--Wood and plastic spring clothespins (TSUS item 790.05): U.S. imports for consumption, by type and by country, January-June 1977 and January-June 1978--Continued
JanuaryJune 1977 January-June 1978
Country
Wood and Plastic :Total, wood plastic :Wood spring: spring :and plastic
spring :clothespins:clothespins: spring :clothespins:(TSUSA item: (TSUSA :clothespins :(TSUS item : 790.0550) : item :(TSUS item
790.05) 1/: 790.0510) 790.05)
Unit value (per gross)
Taiwan-------------------------: China--------------------------: Poland-------------------------: West Germany-------------------: Hong Kong----------------------: Romania------------------------: The Netherlands----------------: Japan--------------------------: Malaysia-----------------------: Singapore----------------------: Korea--------------------------:
$0.89 .63
1.00 1.01 1.04
.64 1.19
- : - :
.64 - :
France----------~--------------: 2.47 Denmark------------------------: 1.53 Czechoslovakia-----------------: .58 Dominican Republic------------~: 2.70 Sweden-------------------------: 1.18
$0.84 $1.05 .67 .65 .96 -
1.14 1.24 1.15 1.78
.71 .72 .. 1.29 . • 35 6.04 .67 -.70 .77
- . 3.65 . 1.55 1.85
- :
$0.87 .67 . .96 .
1.16 1.37
.71 1.29
.37 . .67 .
.70
.77 3.65 1.80
~~~~...,,...,,~~~~~-.,,....,~~~~-,---~~~~~--,,.....,...
Total----------------------:. .90 .86 1.27 .92
1/ Separate statistical data for imports of wood and plastic spring clothespins are not available for January-June 1977. ~/ Less than $500.
Source: Compiled from official statistics of the U.S. Department of Commerce.
Imports of wood roundhead clothespins (nonspring-type), after declining slightly from 1973 to 1974, almost doubled from 1974 to 1977, rising from 162,000 gross to 305,000 gross (table 4). However, imports of wood roundhead clothespins declined by 57 percent in January-June 1978 as compared with the corresponding period of 1977. The rising value of the German mark is believed to have contributed importantly to the decline in imports of such clothespins
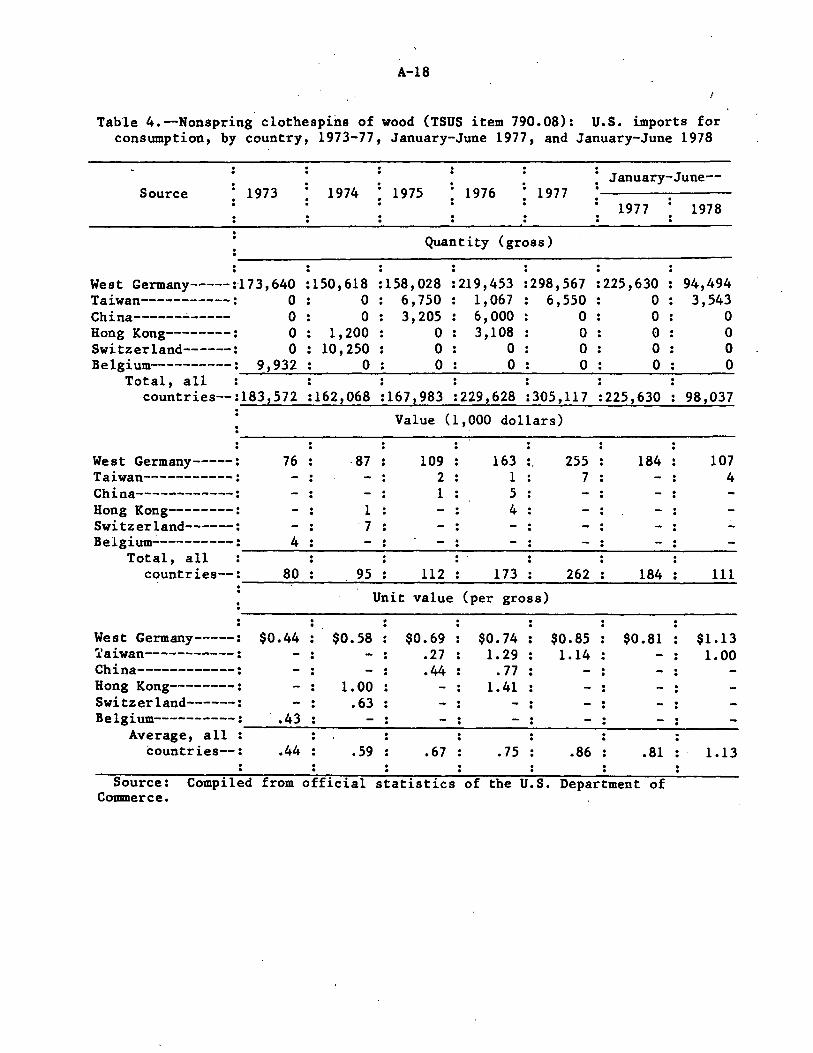
A-18
Table 4.--Nonspring clothespins of wood (TSUS item 790.08): U.S. imports for consumption, by country, 1973-77, January-June 1977, and January-June 1978
West Germany-----: 76 -87 109 163 . 255 184 107 .. Taiwan-----------: - . - . 2 1 7 - . 4 . . . China------------: - . 1 5 - . - . . . . Hong Kong--------: - . 1 - . 4 - . . . . Switzerland------: - . 7 - . - . - . . . . . Belgium----------: 4 - : - . - . - . - . . . . .
Total, all countries--: 80 95 112 173 262 184 111
Unit value (per gross)
West Germany-----: $0.44 $0.58 $0.69 $0.74 $0.85 $0.81 $1.13 ~aiwan-----------: - . - . .27 1. 29 1.14 - . LOO . . . China------------: - . - : .44 • 77 - . - . . . . Hong Kong--------: - . 1.00 1.41 - . . . Switzerland------: - . .63 - . - . - . - . . . . . . Belgium----------: .43 - . - . - . - . - . . . . . .
Average, all . . countries--: .44 .59 .67 .75 .86 .81 1.13
Source: Compiled from official statistics of the U.S. Department of Commerce.
A-19
from West Germany, which accounted for 98 percent of the imports in 1977. Although plastic nonspring clothespins are imported in very small amounts, such imports nevertheless almost tripled from 1976 to 1977 (table 5). January-June 1978 showed very little import activity in plastic nonspring clothespins.
Imports of wood and plastic spring clothespins from China rose sharply from 26,000 gross in 1975 to 539,000 gross in 1976 and increased sharply again to 835,000 gross in 1977 (fig. 2). China increased its share of the imports of spring clothespins from just over 1 percent in 1975 to 27 percent in 1977. However, imports from China fell sharply during January-June 1978 from the level reached during January-June 1977, when its share of the import market slipped to 16 percent. China has by far the lowest unit value per gross of imported spring clothespins of any of the large exporting countries (table 1).
Information developed during the course of the investigation indicates that most clothespin imports from China are first exported from China to independent trading companies in Hong Kong and then exported to the United States. One of the Hong Kong clothespin trading firms is China Buying Services, which contracts for the Chinese clothespins at the Canton Fair, and then resells them to the United States. * * *·
Import sources have indicated that China raised its world clothespin prices by more than 60 percent in 1977, to levels higher than the prices of most other supplying countries. The prices that China Buying Services charges its U.S. purchasers, however, do not reflect these price increases. Purchases from China Buying Services account for the greatest quantity of U.S. imports from China. * * *·
Imports of wood and plastic spring clothespins from Taiwan increased from 4,000 gross in 1974 to 342,000 gross in 1975 and then increased over the next 2 years to 828,000 gross inl977 (fig. 3). Taiwan and China together account for over 50 percent of all U.S. imports of wood and plastic spring clothespins. While imports from China declined in January-June 1978, imports from Taiwan increased by 6 percent.
As previously stated, West Germany accounted for 98 percent of U.S. imports of wood roundhead clothespins in 1977. West Germany has also been a large exporter of wood and plastic spring clothespins to the United States. When all West German exports of clothespins to the United States are totaled, West Germany is the third largest source of U.S. imports of clothespins, after China and Taiwan.
U.S. imports of wood and plastic spring clothespins from Poland declined slightly from 1973 to 1974, but then more than doubled, rising from 237,000 gross in 1974 to 506,000 gross in 1977. A.M.P.A.G. Furniture & Wooden Products Corp., New York, N.Y., has advised the Commission that it is the exclusive U.S. sales agent for P.A.G.E.D., the corporation designated by the Polish People's Republic as the sole exporter of Polish clothespins, and that, since January 1, 1972, Metropolitan Housewares Corp., by contractual rights, has been the only authorized importer of Polish clothespins (for A.M.P.A.G.), although there are other importers of record. It has come to the attention of A.M.P.A.G. and Metropolitan, however, that Polish clothespins are being exported to West
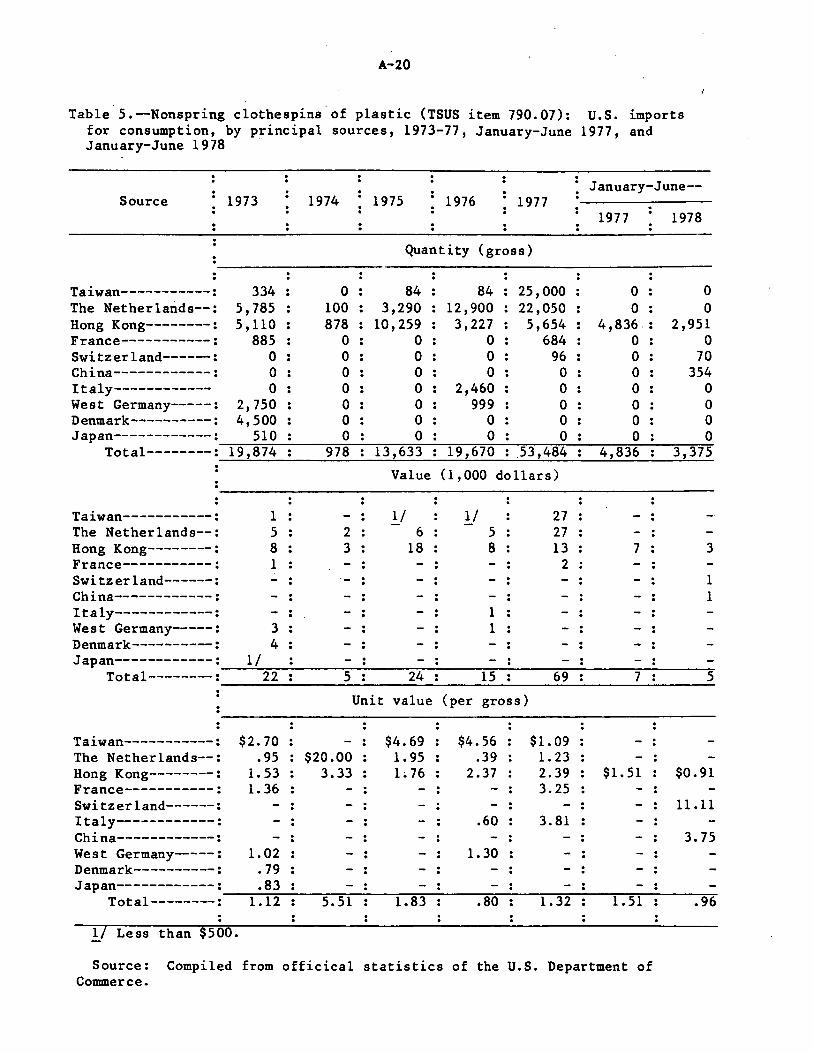
A-20
Table 5.--Nonspring clothespins.of plastic (TSUS item 790.07): U.S. imports for consumption, by principal sources, 1973-77, January-June 1977, and January-June 1978 ·
January-June--Source 1973
Taiwan-----------: 334 The Netherlands--: 5,785 Hong Kong--------: 5,110 France-----------: 885 Switzerland------: 0 China------------: 0 Italy------------ 0 West Germany-----: 2,750 Denmark----------: 4,500 Japan------------: 510
1974
0 100 878
0 0 0 0 0 0 0
1975 1976 1977
Quantity (gross)
84 84 25,000 3,290 12,900 22,050
10,259 3,227 5,654 0 0 684 0 0 96 0 0 0 0 2~460 0 0 999 0 0 0 0 0 0 0
1977 1978
0 0 0 0
4,836 2,951 0 0 0 70 0 354 0 0 0 0 0 0 0 0
978 13,633 19,670 .53,484 4,836 3,375 -=--=--==~~~-=-:::-=-~-:-=---=-=-=-~~:---:-=-=~-=-=-~,.--~~-=-=--=-~--=--==-=-Tot al - - - - - - - - : 19,874
Value (1, 000 dollars)
Taiwan-----------: 1 !_/ y 27 The Netherlands--: 5 2 6 5 27 - . . Hong Kong--------: 8 3 18 8 13 7 France-----------: 1 - . 2 . Switzerland------: - . - . - . . . . China------------: - . - . - . . . . Italy------------: - . - . - . 1 . . . West Germany-----: 3 - . - . 1 - . . . . Denmark----------: 4 - . - . - . - . . . . . Japan------------: 1/ - . - . - . - . - . . . . . .
Total--------: 22 5 24 15 69 7
Unit value (per gross)
Taiwan-----------: $2.70 - . $4.69 $4.56 $1.09 . The Netherlands--: .95 $20.00 1.95 .39 1. 23 - . . Hong Kong--------: 1. 53 3.33 L76 2.37 2.39 $1. 51 France-----------: 1. 36 - : 3.25 Switzerland------: - . - . - . - . . . . . Italy------------: - . .60 3.81 - . . . China------------: - . - . - . - . - . - . . . . . . . West Germany-----: 1.02 - . 1.30 - . . . Denmark----------: . 79 - . - . - . . . . Japan------------: • 83 - . - : - . - . . . .
Total--------: 1.12 5.51 1.83 .80 1.32 1.51
1/ Less than $500.
Source: Compiled from officical statistics of the U.S. Department of Commerce.
3
1 1
5
$0.91
11.11
3.75
.96
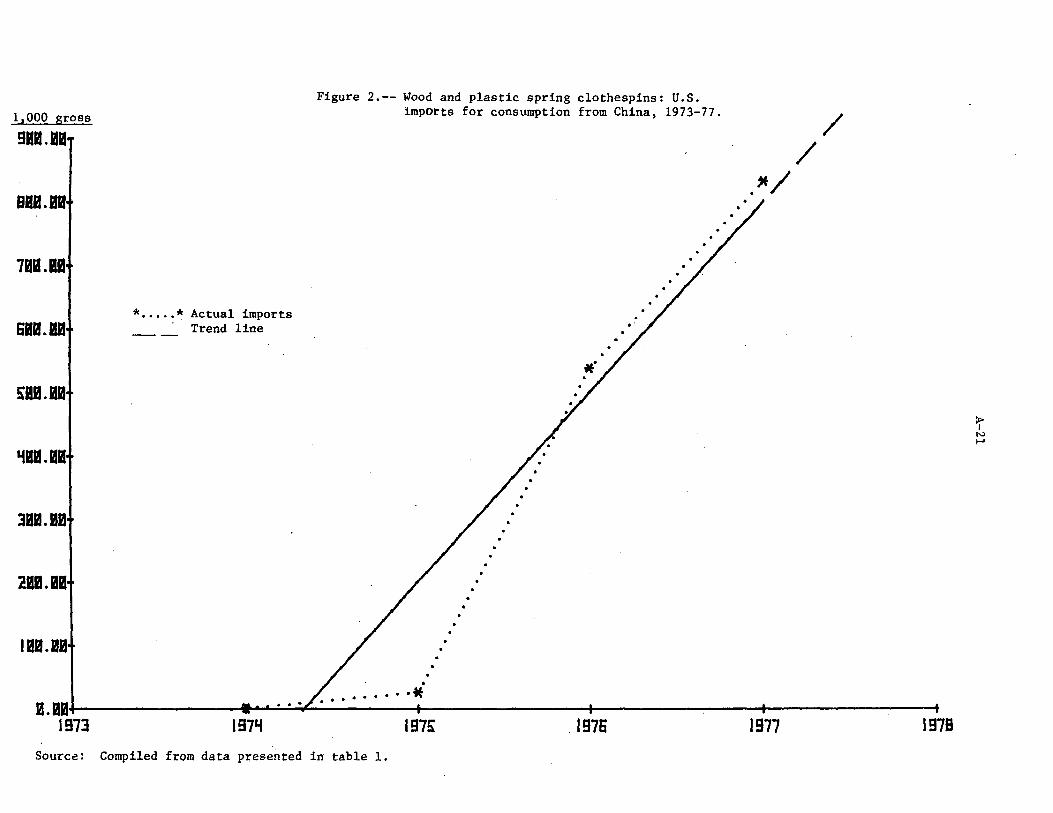
1,000 gross
911.11
eaa.a
711.IB
618.&
i&.&
'Ill.II
3111.18
218.18
Ill.II
*·····*Actual imports Trend line
Figure 2.-- Wood and plastic spring clothespins: U.S. imports for consumption from China, 1973-77.
. "'/
/ /
a.1~~13~~~~~~~~·:··~·~·:·~-~-·~·~·~·*~~~~~~-ii97!;-~~~-..,.-;-;t:~~~~~~ 197'i
Source: Compiled from data presented in table 1.
197!\ .1976 1977 1978
> I
N I-'
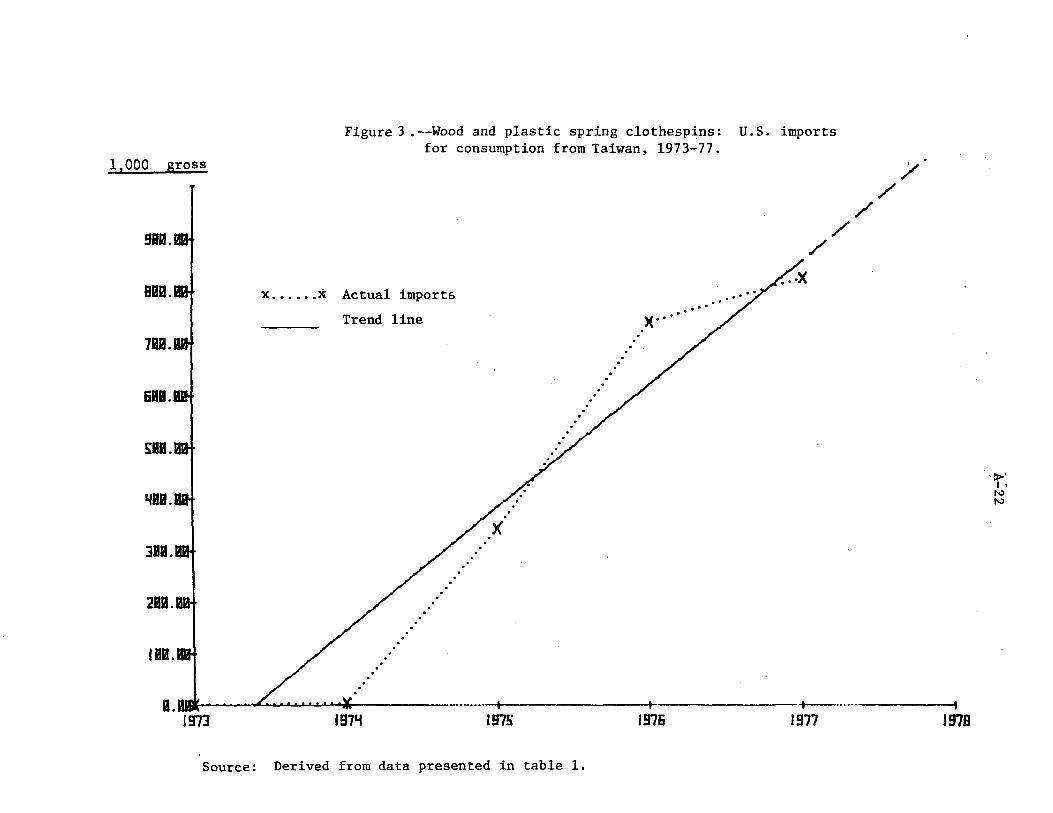
1,000 gross
989.
BBB.
7&.
681.
~BB.
'fBH.
381.
2BB.BB
llB.
Figure) .--Wood and plastic spring clothespins: for consumption from Taiwan, 1973-77.
x .•.... x Actual import&
Trend line
.· .·
. · . .
)( ......... .
. . ..
..
U.S. imports
/ /
/ /
/
1.11111: '· ......... "*' -------~-------+---······-----
1973 197'i 1!175 1976 1977 1978
Source: Derived from data presented in table 1.
'll>' I,
N N
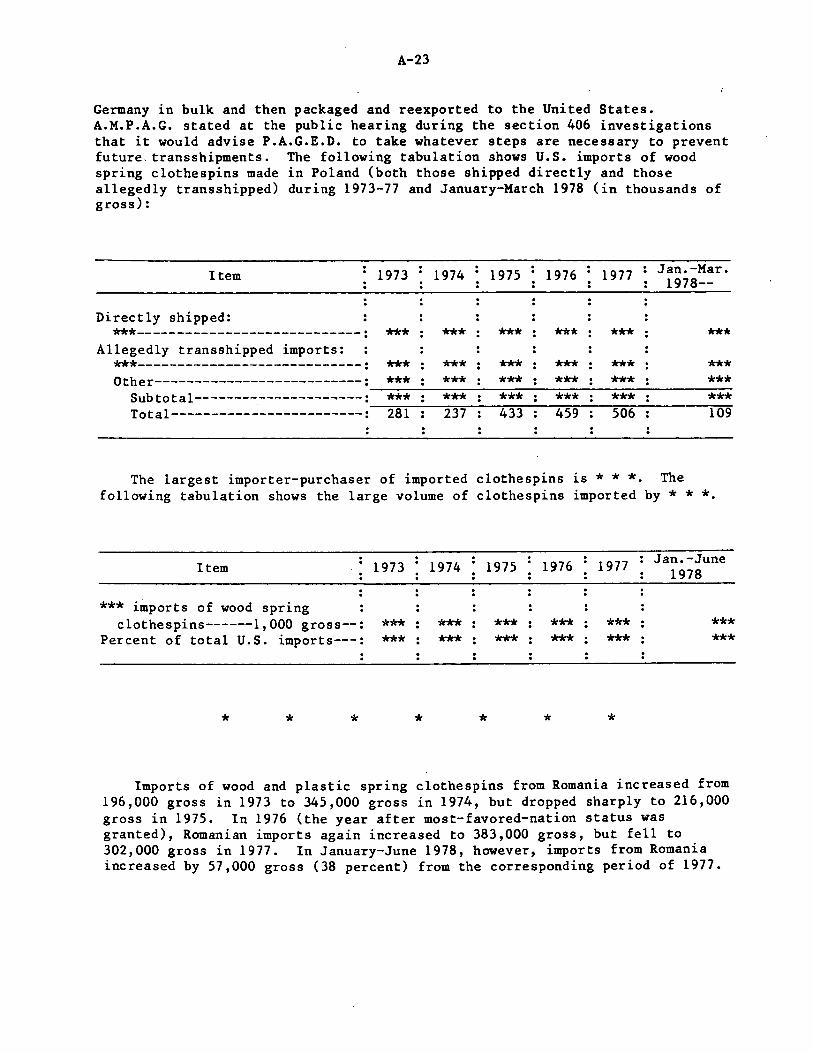
A-23
Germany in bulk and then packaged and reexported to the United States. A.M.P.A.G. stated at the public hearing during the section 406 investigations that it would advise P.A.G.E.D. to take whatever steps are necessary to prevent future. transshipments. The following tabulation shows U.S. imports of wood spring clothespins made in Poland (both those shipped directly and those allegedly transshipped) during 1973-77 and January-March 1978 (in thousands of gross):
Item 1973 1974 1975 1976 1977 Jan.-Mar. 1978--
Directly shipped: ***----------------------------: *** *** *** *** *** ***
Allegedly transshipped imports: ***----------------------------: *** *** *** *** *** *** Other--------------------------: *** *** *** *** *** ***
Subtotal---------------------: *** *** *** *** *** *** Total------------------------: 281 237 433 459 506 109
The largest importer-purchaser of imported clothespins is * * *· The following tabulation shows the large volume of clothespins imported by * * *·
Item 1973 1974 1975 1976 1977 Jan.-June 1978
*** imports of wood spring clothespins------1,000 gro~s--: *** *** *** *** *** ***
Percent of total U.S. imports---: *** *** *** *** *** ***
* * * * * * *
Imports of wood and plastic spring clothespins from Romania increased from 196,000 gross in 1973 to 345,000 gross in 1974, but dropped sharply to 216,000 gross in 1975. In 1976 (the year after most-favored-nation status was granted), Romanian imports again increased to 383,000 gross, but fell to 302,000 gross in 1977. In January-June 1978, however, imports from Romania increased by 57,000 gross (38 percent) from the corresponding period of 1977.
A-24
The Question of Serious Injury to the Domestic Industry
U.S. capacity, production, and capacity utilization
U.S. capacity to produce all types of clothespins, assuming a two-shiftsa-day, 5-days-a-week basis, increased irregularly from 7.3 million gross in 1973 to 8.0 million gross in 1977 (table 6). Production dropped sharply, however, from 5.3 million gross in 1973 to 4.3 million gross in 1977, or by 19 percent. As a consequence, capacity utilization plummeted from 73 percent in 1973 to 54.percent in 1977. * * *·
Of the four types of clothespins, the wood spring variety in 1977 accounted for 66 percent of U.S. capacity and approximately 83 percent of total U.S. production. The nonspring wood clothespins accounted for * * * percent of U.S. capacity, but only * * * percent of U.S. clothespin production. The remaining * * * percent of U.S. capacity and * * * percent of U.S. production are divided between plastic spring and wood ironbound clothespins. In general, wood spring clothespins have accounted for a gradually increasing share of U.S. production, while the other categories of clothespins have declined in importance.
* * * * * * *
The capacity data shown in table 6 are not precise estimates because of significant difference among the various firms in their operating procedures. The figures presented in the table were based on two shifts a day, 5 days a week. * * * Maximum U.S. capacity figures, reflecting these modifications are presented in table 7.
* * * * * * *
U.S. apparent consumption, producers' shipments, and foreign trade
U.S. apparent consumption of wood and plastic spring clothespins (table 8) fell from 6.2 million gross in 1973 to 5.6 million gross in 1974 and 1975, or by 10 percent. However, consumption rebounded to 6.5 million gross in 1976 and 1977. In January-June 1978 consumption fell 18,000 gross (0.5 percent) from the corresponding period of 1977.
U.S. producers' shipments of wood spring clothespins declined irregularly from 4.1 million gross in 1973 to 3.3 million gross in 1976 and 1977 (table 9). U.S. producers' shipments of nonspring wood clothespins declined from 1.1 million gross in 1973 to 704,000 gross in 1977. Plastic spring clothespin shipment"s also dee lined during 197 3-77.
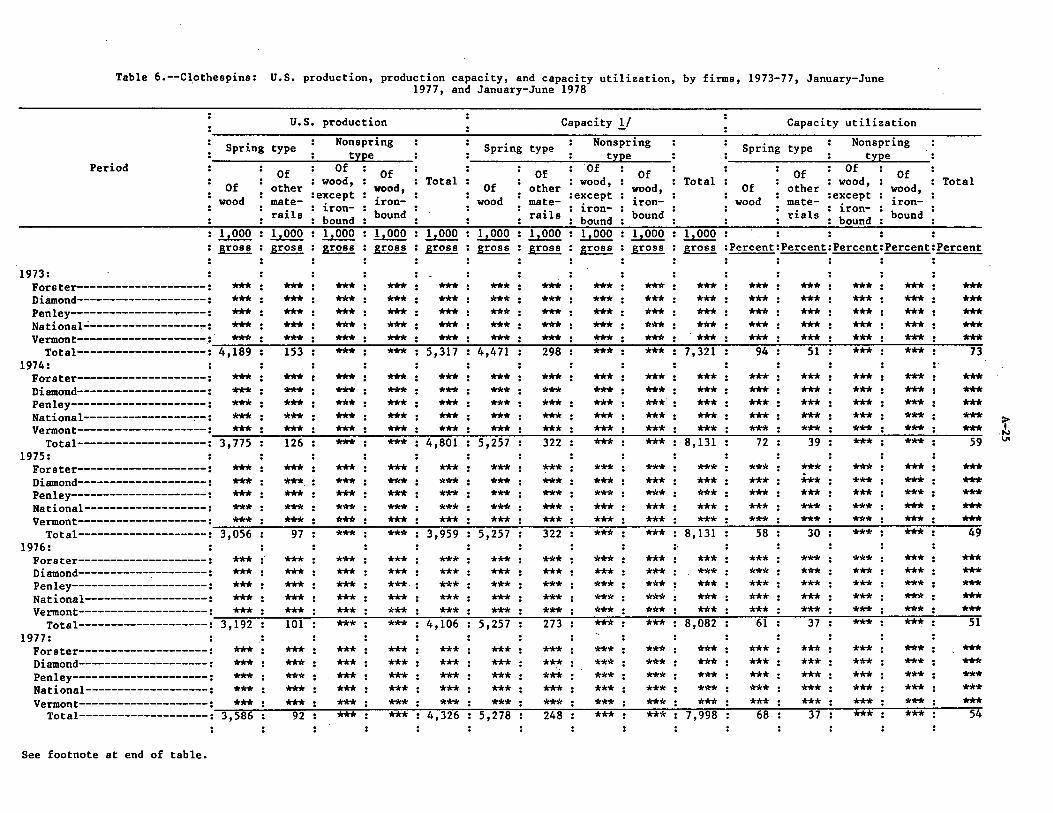
Table 6.--Clothespins: U.S. production, production capacity, and capacity utilization, by firms, 1973-77, January-June 1977, and January-June 1978
Period
1973:
U.S. production
Spring type Nonspring type
Of wood
1,000 gross
Of : wood, other :except mate- iron-
Of
rails bound 1,000 1,000 gross : gross
Of wood, ironbound
1,000 gross
Total
1,000 gross
Capacity !/
Spring type Nonspring type
Of wood
1,000 gross
Of Of : wood,
other :except mate- ironrails bound
1,000
Of wood, ironbound
1,000 1,000 gross gross : gross
Total
1,000
Capacity utilization
Spring type Nonspring type
Of wood
Of Of : wood,
other :except mate- • ironrials : bound
Of w.ood, ironbound
Total
gross :Percent:Percent:Percent:Percent:Percent
Forster--------------------: *** : *** : *** : *** : *** : *** : *** : *** : *** : *** : *** : *** : *** : *** : *** Diamond--------------------: *** : *** : *** : *** : *** : *** : *** : *** : *** : *** : *** : *** : *** : *** : *** Penley---------------------: *** : *** : *** : *** : *** : *** : *** : *** : *** : *** : *** : *** : *** : *** : *** National~------------------: *** : *** : *** : *** : *** : *** : *** : *** : *** : *** : *** : *** : *** : *** : *** Vermont--------------------.:· *** : *** : *** : *** : *** : *** : *** : *** : *** : *** : *** : *** : *** : *** : ***
Total--------------------: 4,189 : 153 : *** : *** : 5,317 : 4,471 : 298 : *** : *** : 7,321 : 94 : 51 : *** : *** : 73 1974:
Forster--------------------: *** : *** c *** : *** : *** : *** : *** : *** : *** : *** : *** : *** : *** : *** : *** Diamond--------------------: *** : *** : *** : *** : *** : *** : *** *** : *** : *** : *** : *** : *** : *** : *** Penley---------------------: *** : *** : *** : *** : *** : *** : *** : *** : ***' : *** : *** : *** : *** : *** : *** National-----------------,...-: *** : *** : *** : *** : *** : *** : *** : *** : *** : *** : *** : *** : *** : *** : *** Vermont--------------------: *** : *** : *** : *** : *** : *** : *** : *** : *** : *** : *** : *** : *** : *** : ***
Total--------------------: 3,775 : 126 : *** : *** : 4,801 : 5,257 : 322 : *** : *** : 8,131 : 72 : 39 : *** : *** : 59 1975:
Forster--------------------: Diamond--------------------: Penley---------------------:
*** ***
*** : *** : *** : *** : *** : *** : *** : *** : *** : *** : *** : *** : *** : *** ***· : *** : *** : *** : *** : *** : *** : *** : *** : *** : *** : *** : *** : *** *** : *** : *** : *** : *** : *** : *** : *** : *** : *** : *** : *** : *** : *** *** : *** : *** : *** : *** : *** : *** : *** : *** : *** : *** : *** : *** : ***
Vermont--------------------: *** : *** : *** : *** : *** : *** : *** : *** : *** : *** : *** : *** : *** : *** : *** National-------------------:
*** ***
Total--------------------: 3,056 : 97 : *** : *** : 3,959 : 5,257 : 322 : *** : *** : 8,131 : 58 : 30 : *** : *** : 49 1976: :·
Forster--------------------: *** :· *** : *** : *** : *** : *** : *** : *** : *** : *** : *** : *** : *** : *** : *** Diamond-----------~--------: *** : *** : *** : *** : *** : *** : *** : *** : *** : *** : *** : *** : *** : *** : *** Penley---------------------: *** : *** : *** : *** : *** : *** : *** : *** : *** : *** : *** : *** : *** : *** : *** National-------------------: *** : *** : *** : *** : *** : *** : *** : *** : *** ; *** : *** : *** : *** : *** : *** Vermont--------------------: *** : *** : *** : *** : *** : *** : *** : *** : *** : *** : *** : *** : *** : *** : ***
Total--------------------: 3,192 : 101 : *** : *** : 4,106 : 5,257 : 273 : *** : *** : 8,082 : 61 : 37 : *** : *** : 51 1977: .
. • Forster--------------------: *** : *** : *** : *** : *** : *** : *** : *** : *** : *** : *** : *** : *** : *** : *** Diamond--------------------: *** : *** : *** : *** : *** : *** : *** : *** : *** : *** : *** : *** : *** : *** : *** Penley---------------------: *** : *** : *** : *** : *** : *** : *** : *** : *** : *** : *** : *** : *** : *** : *** National-------------------: *** : *** : *** : *** : *** : *** : *** : *** : *** : *** : *** : *** : *** : *** : *** Vermont--------------------· *** · *** • *** • *** · *** · *** • *** · *** • *** · *** · *** · *** · *** • *** • ***
Total--------------------; 3,586 ; 92 ; *** ; *** ; 4,326 ; 5,278 ; 248 ; *** ; *** ; 7,998 ; 68 ; 37 ; *** ; *** ; 54
See footnote at end of table.
1" .N V1
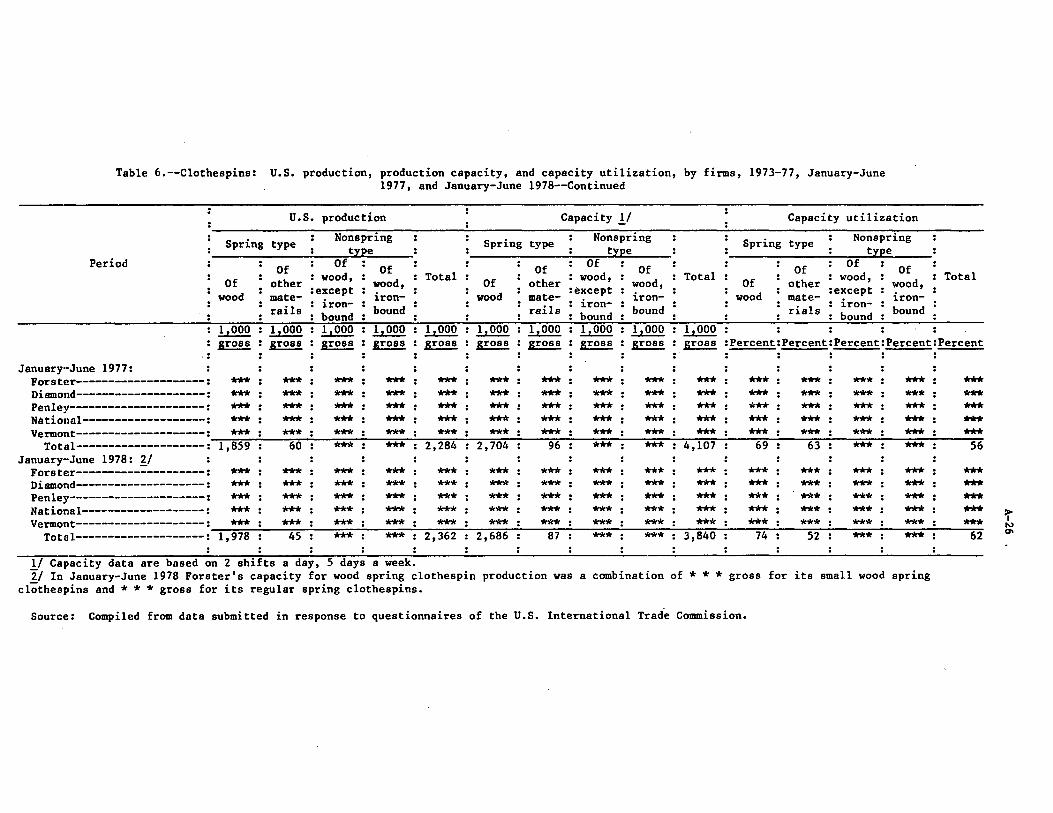
Table 6.--Clothespins: U.S. production, production capacity, and capacity utilization, by firms, 1973-77, January-June 1977, and January-June 1978--Continued
Period
U.S. production
Spring type Nonspring type
Of wood
Of Of : wood,
other :except mate- : ironrai ls - bound
Of wood, ironbound
Total
Capacity lJ Spring type Nonspring
type
Of wood
1,000
Of Of : wood,
other :except mate- ironrails bound 1,000 : 1,000
Of wood, ironbound
1,000
Total
1,000
Capacity utilization
Spring type Nonspring type
Of wood
Of Of : wood,
other :except mate- • ironrials ; bound
Of wood, ironbound
Total
1,000 gross
1,000 : 1,000 gross : gross
1,000 gross
1,000 gross gross : gross : gross : gross gross :Percent:Percent:Percent:Percent:Percent
:· January··June 1977:
Forstt?r--------------------: *** : *** : *** : *** : *** : *** : *** : *** : *** : *** : *** : *** : *** : *** : *** Diamond--------------------: *** : *** : *** : *** : *** : *** : *** : *** : *** : *** : *** : *** : *** : *** : *** Penley--------------------: *** : *** : *** : *** : *** : *** : *** : *** : *** : *** : *** : *** : *** : *** : *** National------------------: *** : *** : *** : *** : *** : *** : *** : *** : *** : *** : *** : *** : *** : *** : *** Vermont--------------------: *** : *** : *** : *** : *** : *** : *** : *** : *** : *** : *** : *** : *** : *** : ***
Total--------------------: 1,859 : 60 : *** : *** : 2,284 : 2,704 : 96 : *** : *** : 4,107 : 69 : 63 : *** : *** : 56 January··June 1978: '!:./
Forster--------------------: Diamond--------------------: Penley---------------------: National-------------------:
*** *** *** ***
*** : *** : *** : *** : *** : *** : *** : *** : *** : *** : *** : *** : *** : *** *** : *** : *** : *** : *** : *** : *** : *** : *** : *** : *** : *** : *** : *** *** : *** : *** : *** : *** : *** : *** : *** : *** : *** : *** : *** : *** : *** *** : *** : *** : *** : *** : *** : *** : *** : *** : *** : *** : *** : *** : ***
Vermont--------------------: *** : *** : *** : *** : *** : *** : *** : *** : *** : *** : *** : *** : *** : *** : *** Total--------------------: 1,978 : 45 : *** : *** : 2,362 : 2,686 : 87 : *** : *** : 3,840 : 74 : 52 : *** : *** : 62
1/ Capacity data are based on 2 shifts a day, 5 days a week. !I In January-June 1978 Forster's capacity for wood spring clothespin production was a combination of * * * gross for its small wood spring
clothespins and * * * gross for its regular spring clothespins.
Source: Compiled from data submitted in response to questionnaires of the U.S. International Trade Commission.
:r N (J\
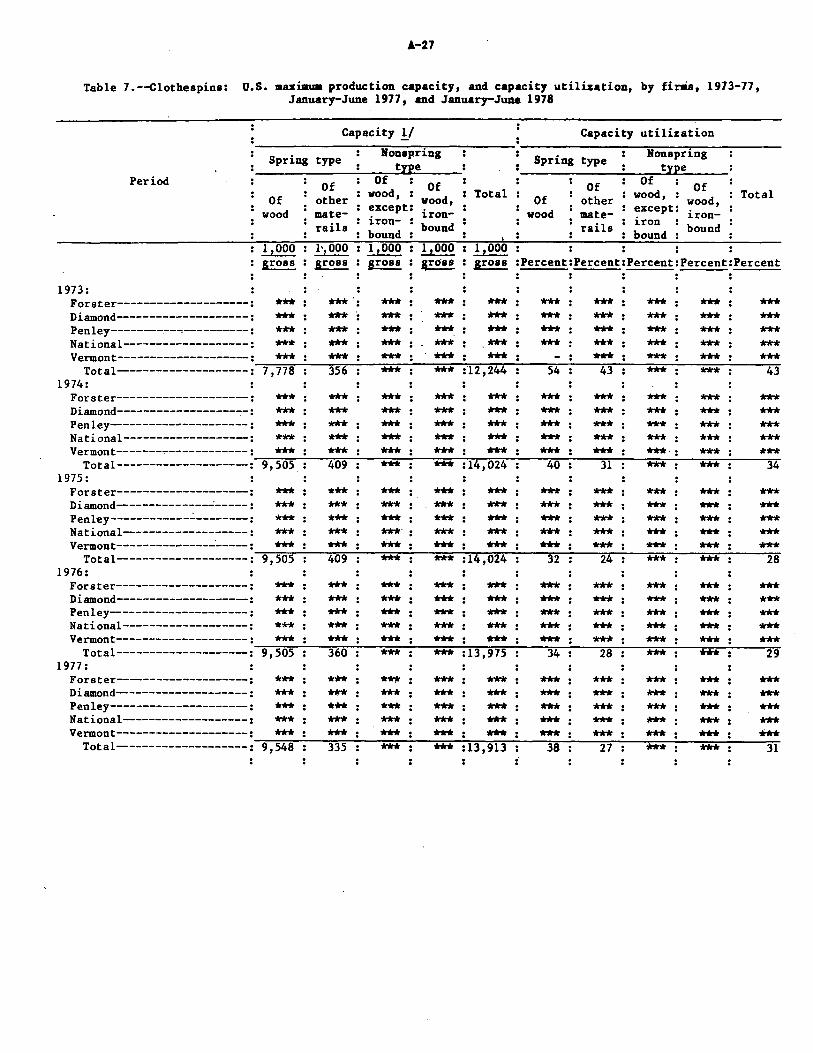
A-27
Table 7.--Clothespins: U.S. maximum production capacity, and capacity utilization, by firms, 1973-77,January-June 1977, and January-June 1978
Capacity 1/ : Capacity utilization
Spring type Nonpring Spring type . Nonpringtype . * . type
Period : Of Of0f . f Of :0Of other : wood, : wood, : Total Of other . wood, . wood, Totalwood :except: . xept:
wood mate- : ext- iron- wood mate- icpt iron-rails bound:bound rail bound bound
.1,000: :0 :1,000 1,000 :1,000:: gross : gross : gross : gross : gross :Percent:Percent:Percent:Percent:Percent
1 073 : . : : : . *
Forster--------------------Diamond--------------------Penley---------------------National------------------Vermont-------------------
Total-------------------1974:
Forster--------------------Diamond--------------------:Penley--------------------National------------------:Vermont--------------------:
Total-------------------:1975:
Forster--------------------Diamond------------------Penley---------------------National-------------------Vermont-------------------
Total-------------------1976:
Forater--------------------Diamond--------------------Penley--------------------National------------------Vermont--------------------
Total-------------------1977:
Forster-------------------:Diamond-------------------Penley---------------------National------------------Vermont--------------------
Total-------------------
437,778
9,505
9,505
9,505
9,548
:12, 244
:14,024
:14,024
:13,975
:13,913
*** :
*** :
*** :
*** :
*** :
*** :
:
*** :
*** :
*** *
*** :
*** :
*** :
:
*** :
*** :
*** :
*** :
*** :
*** :
:
*** :
*** :
*** :
*** :
*** :
*** :
:
**W :
*** :
*** :
*** :
*** :
*** : 27
'^'^
*** :
*** :
*** :
*** :
*** :
*** :
:
*** :
*** :
*** *
*** :
*** :
*** :
:
*** :
*** :
*** :
*** :
*** :
*** :
:
*** :
*** :
*** :
*** :
*** :
*** :
*** :
*** :
*** :
*** :
*** :
*** :
29
409
^^
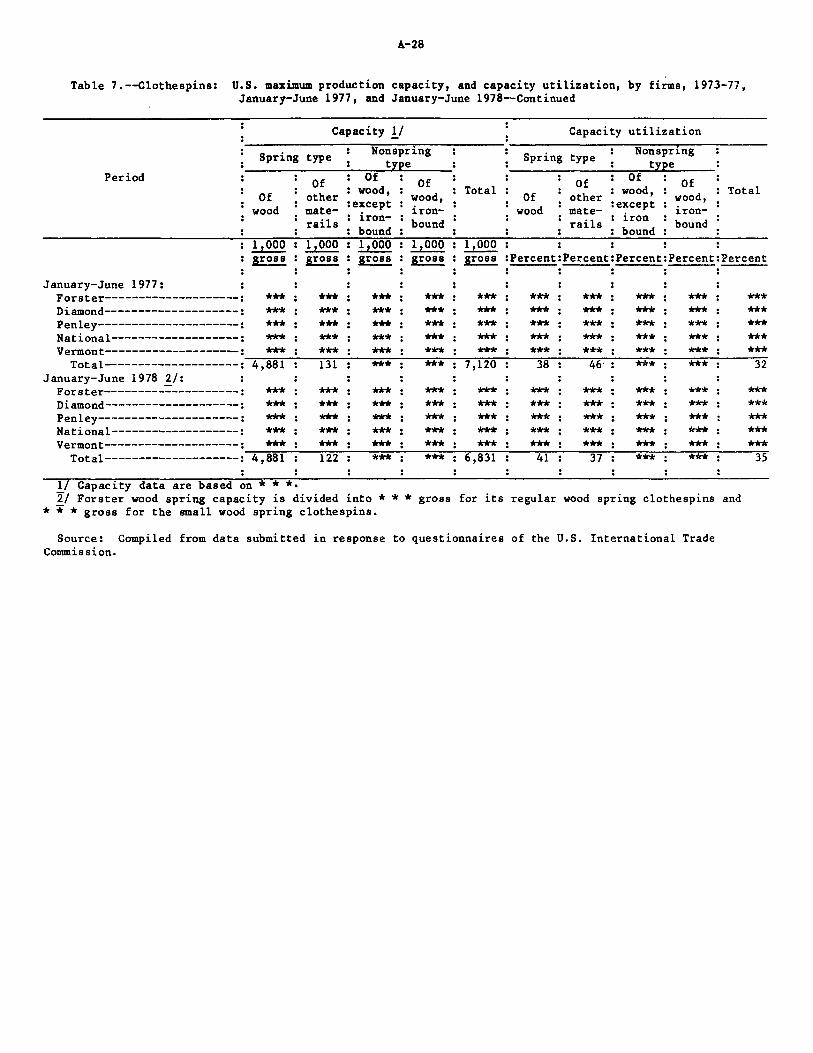
A-28
Table 7.--Clothespins: U.S. maximum production capacity, and capacity utilization, by firms, 1973-77, January-June 1977, and January-June 1978~Continued
Spring type
Period
Capacity !/ Nonsprl.ng
type Of
Capacity utilization
Spring type Nonsprl.ng type
Of
Of wood
Of other materail s
wood, :except
ironbound
Of wood, ironbound
Total Of wood
Of other wood, mate- :except
iron rails
Of wood, ironbound
Total
: bound 1,000 gross :Percent:Percent:Percent:Percent:Percent
January-June 1977: Forster--------------------: *** *** *** *** *** *** *** *** *** Diamond--------------------: *** *** *** *** *** *** *** *** *** Penley---------------------: *** *** *** *** *** *** *** *** *** National-------------------: *** *** *** *** *** *** *** *** ***
*** *** *** *** *** Vermont--------------------: *** *** *** *** *** *** *** *** ***
Total~------------------:--;-4-,~8~871~~~1~3~1,.-~---,...,,..,.....,.*~~-..,,-:-:-*:-----::7~,71~2~0~~--,3~8=--~__,~4~6-·~__,**.,...,....*----,:...___,**~*__,~----,-3:-:-2
January-June 1978 2/: Forster---------~----------: Diamond--------------------: Penley---------------------: National-------------------:
*** *** *** ***
*** *** *** *** *** *** *** *** *** *** *** *** *** *** *** *** *** *** *** *** *** *** *** *** *** *** *** *** *** *** *** *** *** *** *** ***
Vermont--------------------: *** *** *** *** *** *** *** *** *** *** Total--------------------:--:-4-,~8~871~__,~1~2~2=--~---,.*~**...,.--~__,*~**.,...,-~~6~,~8~371__,__,__,4~1:--~__,~3~7-.:..__,-*~**.,..__:_----,~*~**..,_...:___,__,3,,...,,.5
1/ Capacity data are based on * * *• 2/ Forster wood spring capacity is divided into * * * gross for its regular wood spring clothespins and
* * * gross for the small wood spring clothespins.
Source: Compiled from data submitted in response to questionnaires of the U.S. International Trade Commission.
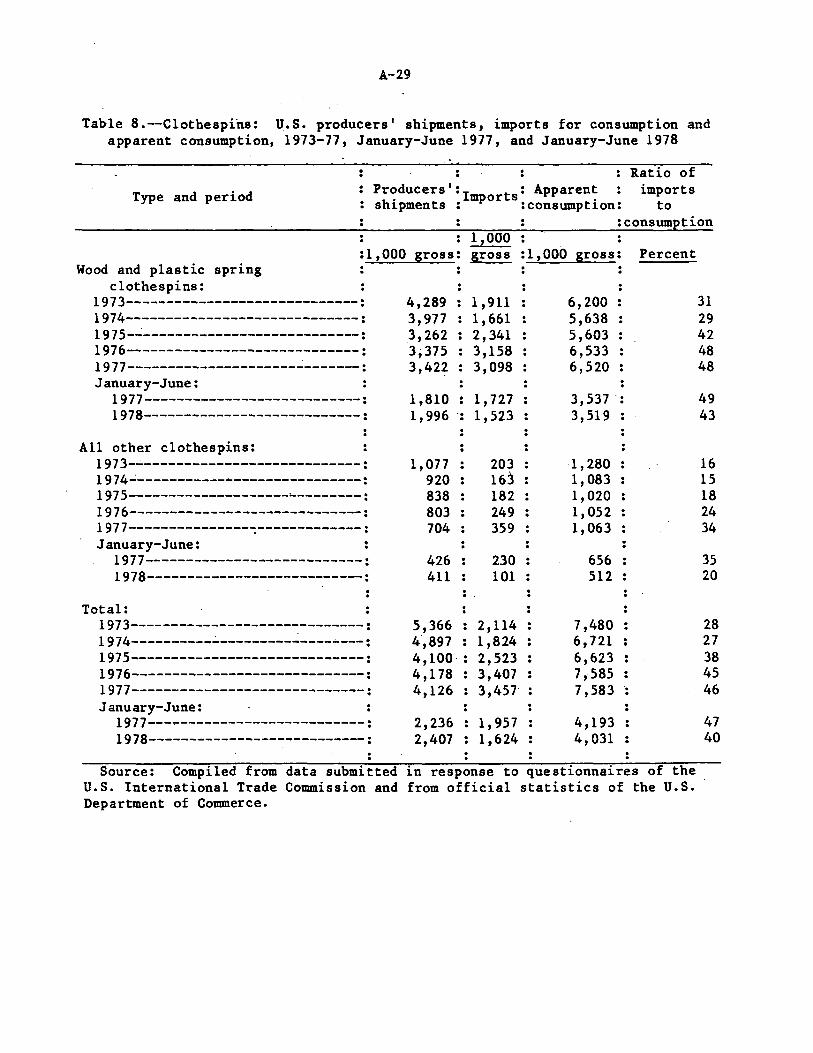
A-29
Table 8.--Clotbespins: U.S. producers' shipments, imports for consumption and apparent consumption, 1973-77, January-June 1977, and January-June 1978
Ratio of
Type and period Producers': 1 t : Apparent imports h . mpor s . s 1pments : :consumption: to
:consumption
:1,000 Wood and plastic spring
clothespins: 1973-----------------------------: 1974-----------------------------: 1975-~---------------------------: 1976-----------------------------: 1977---------------------~-------: January-June:
1977---------------------------: 1978---------------------------:
All other clothespins: 1973-----------------------------: 1974~----------------------------: 1975--------------------~--------:
1976-----------------------------: 1977---------------~-------------: January-June:
1977---------------------------: 1978---------------------------:
Total: 1973-----------------------------: 1974----------~------------------: 1975-----------------------------: 1976-----------------------------: 1977-----------------------------: January-June:
1977---------------------------: 1978---------------------------:
Source: Compiled from data submitted U.S. International Trade Commission and Department of Commerce.
1,000 gross: gross :1,000 gross: Percent
4,289 1,911 6,200 31 3,977 1,661 5,638 29 3,262 2,341 5,603 42 3;375 3,158 6,533 48 3,422 3,098 6,520 48
1,810 1, 727 3,537 . 49 . 1,996 .. 1,523 3, 519 43 .
1,077 203 1,280 16 920 163 1, 083 15 838 182 1,020 18 803 249 1,052 24 704 359 1,063 34
426 230 656 35 411 101 512 20 . . .
5,366 2,114 7,480 28 4,897 1,824 6 '721 27 4,100 2,523 6,623 38 4,178 3,407 7,585 45 4,126 3,457' 7,583 . 46 . 2,236 1,957 4,193 47 2,407 1,624 4,031 40
in response to questionnaires of the from official statistics of the U.S.
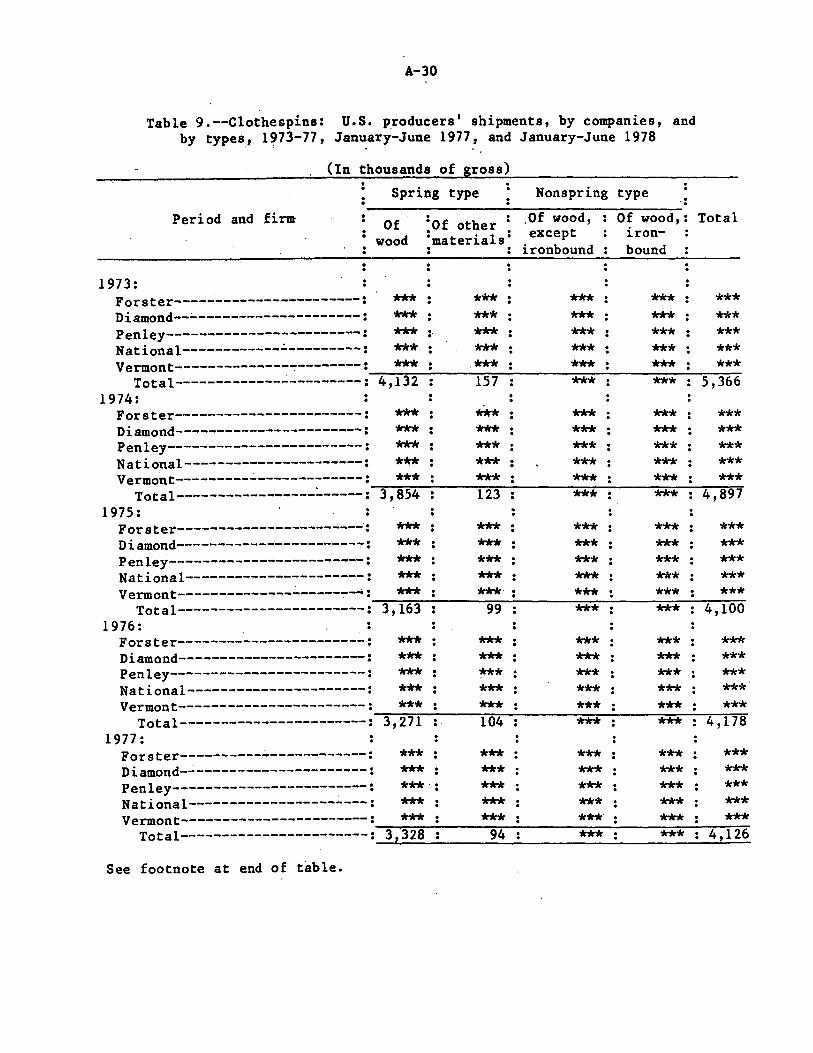
A-30
Table 9.--Clothespins: U.S. p_roducers' shipments, by companies, and by types_, 1?73-77, January-June 1977, and January-June 1978
(In thousands of gross)
Spring type Nonspring type ~~~~~~~~~~~~~~~~~~~~~~-·=
Period and firm Of wood
:of other • .Of wood, :materials" except
Of wood,: Total iron-
• ironbound bound
1973: Forster-----------------------: *** *** *** *** *** Diamond--~--------------------: *** *** *** *** *** Penley------------------------: *** : *** *** *** *** National------------~---------: *** *** *** *** *** Vermont--------------~-~------: *** ·*** *** *** ***
Total-------------~---------: 4,132 157 *** *** 5,366 1974:
Forater-----------------------: *** *** *** *** *** Diamond-----------------------: *** *** *** *** *** Penley------------------------: *** *** *** *** *** National----------------------: *** *** *** *** *** Vermont---------~-------------: *** *** *** *** ***
Total-----------------~-----: 3,854 123 *** *** 4,897 1975:
Forster-----------------------·: *** *** *** *** *** Diamond----------------------~: *** *** *** *** *** Penley-----~------------------: *** *** *** *** *** National--------------------~-: *** *** *** *** *** Vermont--------------~-------•: *** ***" *** *** ***
Total-----------------------: 3,163 99 *** *** 4,100 1976:
Forster-----------------------: *** *** *** *** *** Diamond-----------------------: *** *** *** *** *** Penley------------------------: *** ~· *** *** *** National----------------------: *** *** *** *** *** Vermont-----------------------: *** *** *** *** ***
Total-----------------------: 3,271 104 *** *** 4,178 1977:
Forster----------~------------: *** *** *** *** *** Diamond-~---------------------: *** *** *** *** *** Penley------------------------: ***.: *** *** *** *** National------------------~---: *** *** *** *** *** Vermont-----------------------: *** *** ***" *** ***
Total-----------------------: 32328 94 *** *** 4,126
See footnote at end of table.
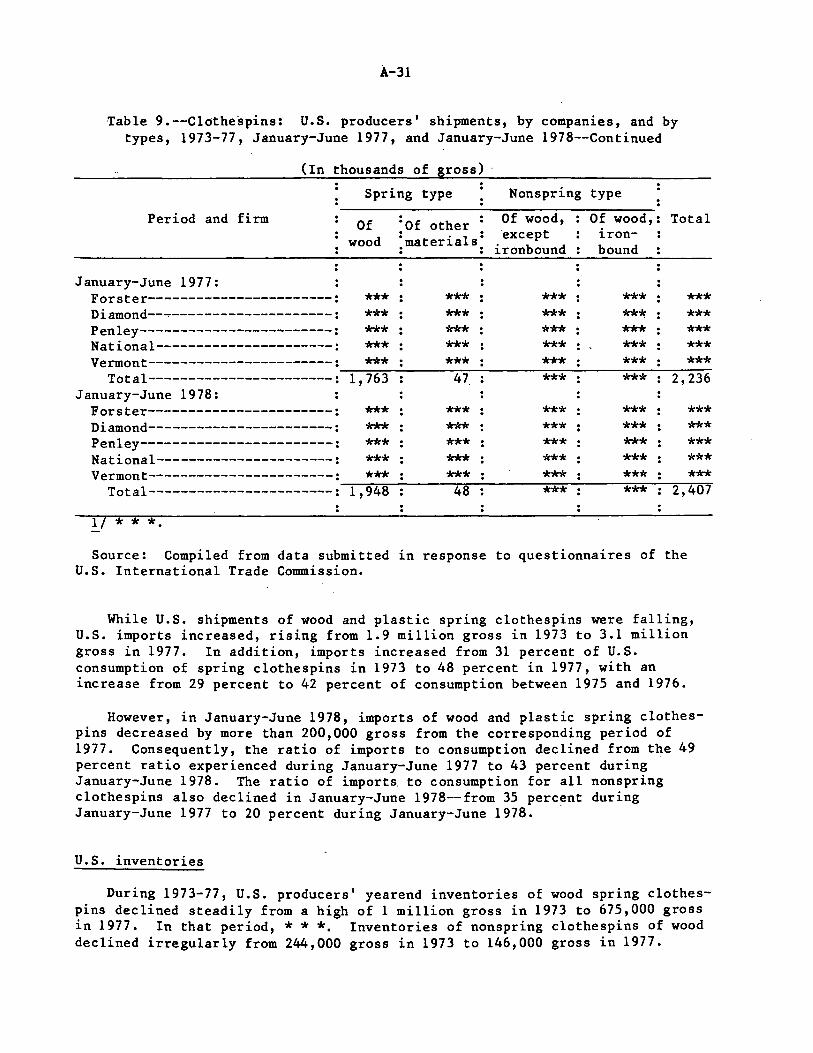
.A-31
Table 9.--Cldthespins: U.S. producers' shipments, by companies, and by types, 1973-77, January-June 1977, and January-June 1978--Continued
(In thousands of gross)
Period and firm
January-June 1977: Forster-----------------------: Diamond-----------------------: Penley------------------------: National----------------------: Vermont-----------------------:
Total-----------------------: January-June 1978:
Forster-----------------------: Diamond-----------------------: Penley------------------------: National----------------------: Vermont-----------------------:
Total-----------------------:
1 * * *·
Spring type
Of wood
*** *** *** *** ***
1,763
*** *** *** *** ***
1,948
. "Of other ~materials~
*** *** *** *** ***
47
*** *** *** *** ***
48
Nonspring type
Of wood, ·except
ironbound
*** *** *** *** *** ***
*** *** *** *** *** ***
Of wood,: Total i.ron-bound
*** *** **~ *** *** *** *** *** *** *** *** 2,236
*** *** *** *** *** *** *** *** *** *** *** 2,407
Source: Compiled from data submitted in response to questionnaires of the U.S. International Trade Commission.
While U.S. shipments of wood and plastic spring clothespins were falling, U.S. imports increased, rising from 1.9 million gross in 1973 to 3.1 million gross in 1977. In addition, imports increased from 31 percent of U.S. consumption of spring clothespins in 1973 to 48 percent in 1977, with an increase from 29 percent to 42 percent of consumption between 1975 and 1976.
However, in January-June 1978, imports of wood and plastic spring clothespins decreased by more than 200,000 gross from the corresponding period of 1977. Consequently, the ratio of imports to consumption declined from the 49 percent ratio experienced during January-June 1977 to 43 percent during January-June 1978. The ratio of imports to consumption for all nonspring clothespins also declined in January-June 1978--from 35 percent during January-June 1977 to 20 percent during January-June 1978. ·
U.S. inventories
During 1973-77, U.S. producers' yearend inventories of wood spring clothespins declined steadily from a high of 1 million gross in 1973 to 675,000 gross in 1977. In that period, * * *· Inventories of nonspring clothespins of wood declined irregularly from 244,000 gross in 1973 to 146,000 gross in 1977.
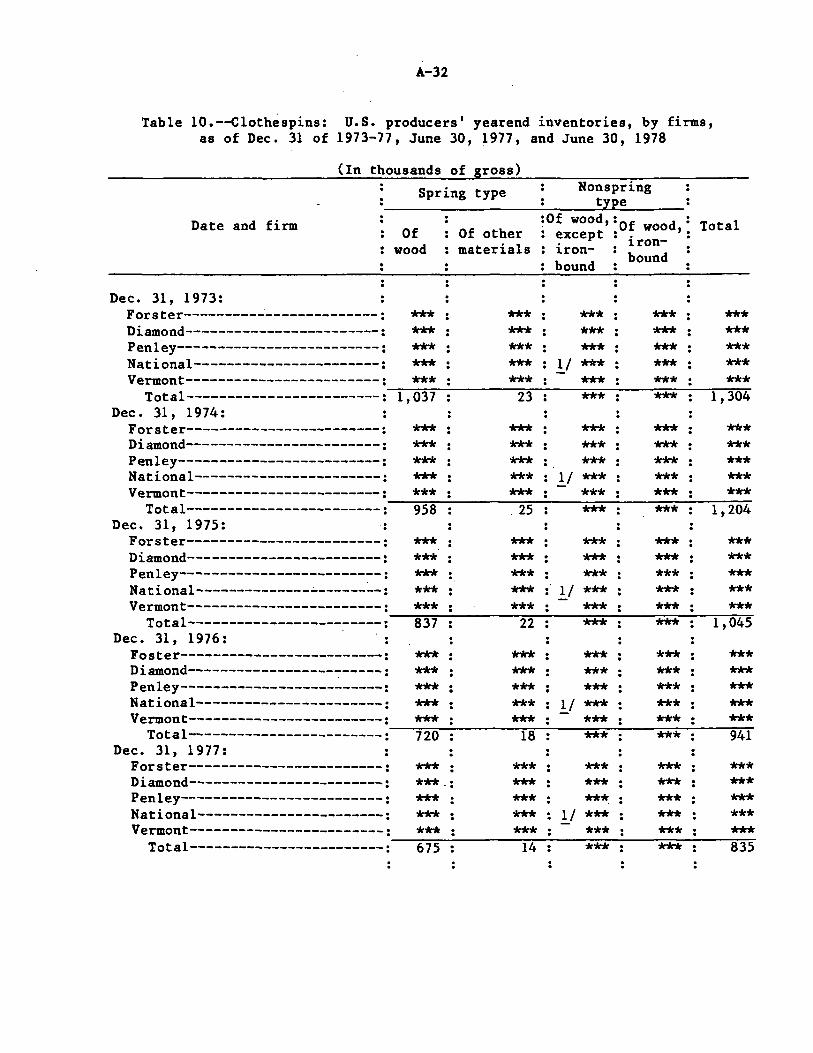
A-32
Table 10.--Clothespins: U.S. producers' yearend inventories, by firms, as of Dec. 31 of 1973-77, June JO, 1977, and June 30, 1978
(In thousands of gross)
Date and firm
Dec. 31, 1973: Forster------------------------: Diamond------------------------: Penley-------------------------: National-----------------------: Vermont------------------------:
Total------------------------: Dec. 31, 1974:
Forster------------------------: Diamond------------------------: Penley-------------------------: National-----------------------: Vermont------------------------:
Total------------------------: Dec. 31, 1975:
Forster------------------------: Diamond------------------------: Penley-------------------------: National--------------~------~-: Vermont------------------------:
Total------------------------: Dec. 31, 1976:
Foster-------------------------: Diamond------------------~-----: Penley-------------------------: National-----------------------: Vermont------------------------:
Total------------------------: Dec. 31, 1977:
Forster------------------------: Diamond------------------------: Penley-------------------------: National-----------------------: Vermont------------------------:
Total------------------------:
Spring type
Of wood
*** *** *** *** ***
1,037
*** *** *** *** *** 958
*** *** *** *** *** 837
*** *** *** *** *** 720
***
. .
***.: *** *** *** 675
Of other materials
*** *** *** *** ***
23
*** *** *** *** ***
25
*** *** *** *** ***
22
*** *** *** *** ***
18
*** *** *** *** ***
14
Nonspring type
:Of wood,:Of wood: except: . '· ironbound
*** *** ***
!/ *** *** ***
*** *** ***
!/ *** *** ***
*** *** ***
1/ *** *** *** *** *** ***
1/ *** *** ***
*** *** ***
l/ *** *** ***
i.ron-bound
*** *** *** *** *** ***
*** *** *** *** *** ***
*** *** *** *** *** *** *** *** *** *** *** ***
*** *** *** *** *** ***
Total
*** *** *** *** ***
1,304
*** *** *** *** ***
1,204
*** *** *** *** ***
1,045
*** *** *** *** *** 941
*** *** *** *** *** 835
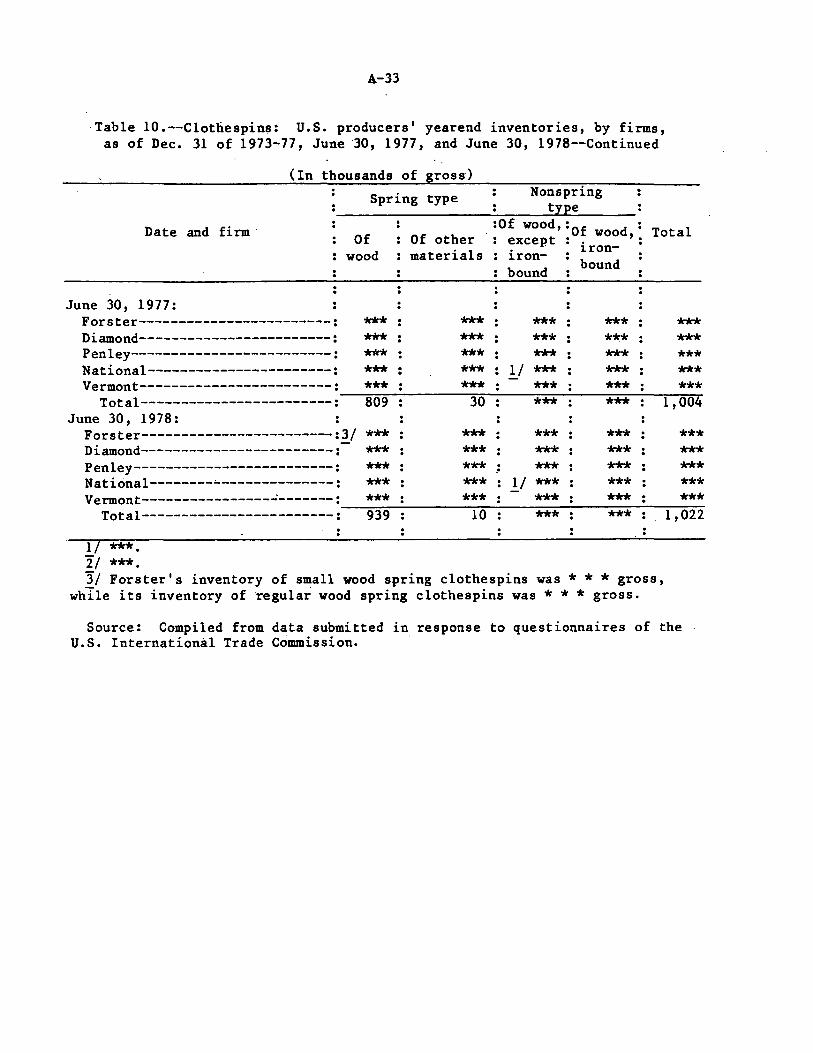
A-33
·Table 10.--Clothespins: U.S. producers' yearend inventories, by firms, as of Dec. 31 of 1973-77, June ·30, 1977, and June 30, 1978--Continued
(In thousands of gross)
Spring type Nonspring type
Date and firm· Of wood
Of other materials
:Of wood,:Of wood: except: ': Total
June 30, 1977: Forster-~---------------------:
Diamond------------------------: Penley-------------------------: National-----------------------: Vermont------------------------:
Total------------------------: June 30, 1978:
Forster------------------------:~/ Diamond------------------------: Penley-------------------------: National--------~--------------:
Vermont----------------~-------:
Total------------------------:
1 ***· 2/ ***·
***
*** *** *** *** 809
***
*** *** *** *** 939
*** *** *** *** ***
30
*** *** *** . ,• *** ***
10
ironbound
*** *** ***
l/ *** *** ***
*** ***
*** l/ ***
*** ***
iron-bound
*** *** ***
*** *** ***
*** *** *** *** *** ***
3/ Forster's inventory of small wood spring clothespins was*** gross, while its inventory of regular· wood spring clothespins was * * * gross.
*** *** *** *** ***
1,004
*** *** *** *** ***
1,022
Source: Compiled from data submitted in response to questionnaires of the U.S. International Trade Commission.
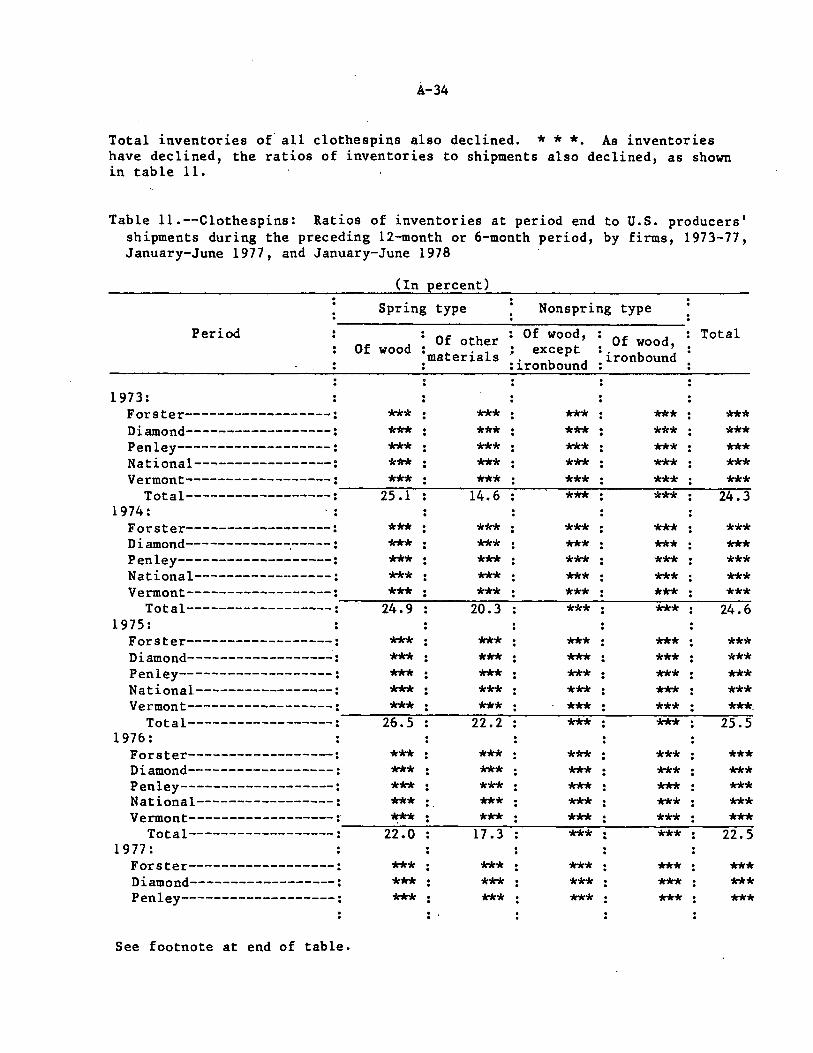
A-34
Total inventories of· all clothespins also declined. * * *· As inventories have declined, the ratios of inventories to shipments also declined, as shown in table 11.
Table 11.--Clothespins: Ratios of inventories at period end to U.S. producers' shipments during the preceding 12-month or 6-month period, by firms, 1973-77, January-June 1977, and January-June 1978
(In percent)
Spring type Nonspring type
Period Of other Of wood, : Of wood, Of wood : except •
:materials iron bound :ironbound :
Total
1973: Forster------------------: *** *** *** *** *** Diamond------------------: *** *** *** *** *** Penley-------------------: *** *** *** *** *** National-----------------: *** *** *** *** *** Vermont------------------: *** *** *** *** ***
Total------------------: 25 .1 14.6 *** *** 24.3 1974: :
Forster------------------: *** *** *** *** *** Diamond------------~-----: *** *** *** *** *** Penley-------------------: *** *** *** *** *** National-----------------: *** *** *** *** *** Vermont------------------: *** *** *** *** ***
Total------------------: 24. 9 20.3 *** *** 24.6 1975:
Forster------------------: *** *** *** *** *** Diamond------------------: *** *** *** *** *** Penley-------------------: *** *** *** *** *** National-----------------: *** *** *** *** *** Vermont------------------: *** *** *** *** ***·
Total------------------: 26.5 22.2 *** *** 25.5 1976:
Forster------------------: *** *** *** *** *** Diamond------------------: *** *** *** *** *** Penley-------------------: *** *** *** *** *** National-----------------: *** . . . *** *** *** *** Vermont------------------: *** *** *** *** ***
Total------------------: 22.0 17.3 *** *** 22.s 1977:
Forster------------------: *** *** *** *** *** Diamond------------------: *** *** *** *** *** Penley-------------------: *** *** *** *** ***
See footnote at end of table.
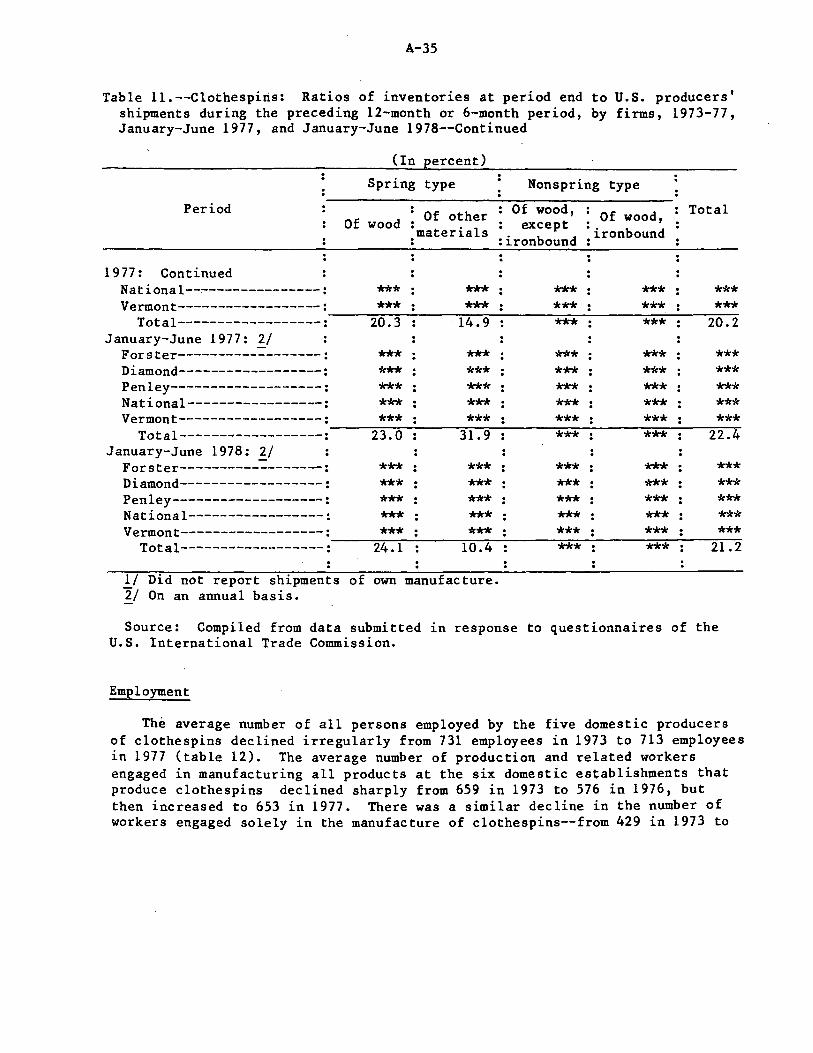
A-35
Table 11.--Clothespiris: Ratios of inventories at period end to U.S. producers' shipments during the preceding 12-month or 6-month period, by firms, 1973-77, January-June 1977, and January-June 1978--Continued
(In percent)
Spring type Nonspring type
Period Of other Of wood, : Of wood, Of wood .=materials except • · b d
• :ironbound :iron oun
Total
1977: Continued National--~--------------: *** *** *** *** *** Vermont------------------: *** *** *** *** ***
~~--:-=--=-~~-.,....--,,-.,.--~~_,....~~,..-~~~~--,..~~~--:-=-~
Total------------------: 20.3 14.9 *** *** 20.2 January-June 1977: 2/
Forster----------~-------: *** *** *** *** *** Diamond------------------: *** *** *** *** *** Penley-------------------: *** *** *** *** *** National-----------------: *** *** *** *** *** Vermont------------------: *** *** *** *** ***
Total------------------:~~~2~3-.0~~~----,3~1-.~9,__~~~-*-**~~~~-*-**~~~-2~2~ . ....,....4 January-June 1978: ~/
Forster------------------: *** *** *** *** *** Diamond------------------: *** *** *** *** *** Penley-------------------: *** *** *** *** *** National-----------------: *** *** *** *** *** Vermont------------------: *** *** *** *** ***
~-.,....~-.,....-.,....~-.,....-.,....~~...,.._~~~~.,....,..-~~_,....~-.,........,....,.~-.,....--::-=--=-
Tot al - - - - - - - - - - - - - - - - - - : 24.1 10.4 *** *** 21.2
l/ Did not report shipments of own manufacture. '!:_! On an annual basis.
Source: Compiled from data submitted in response to questionnaires of the U.S. International Trade Commission.
Employment
The average number of all persons employed by the five domestic producers of clothespins declined irregularly from 731 employees in 1973 to 713 employees in 1977 (table 12). The average number of production and related workers engaged in manufacturing all products at the six domestic establishments that produce clothespins declined sharply from 659 in 1973 to 576 in 1976, but then increased to 653 in 1977. There was a similar decline in the number of workers engaged solely in the manufacture of clothespins--from 429 in 1973 to
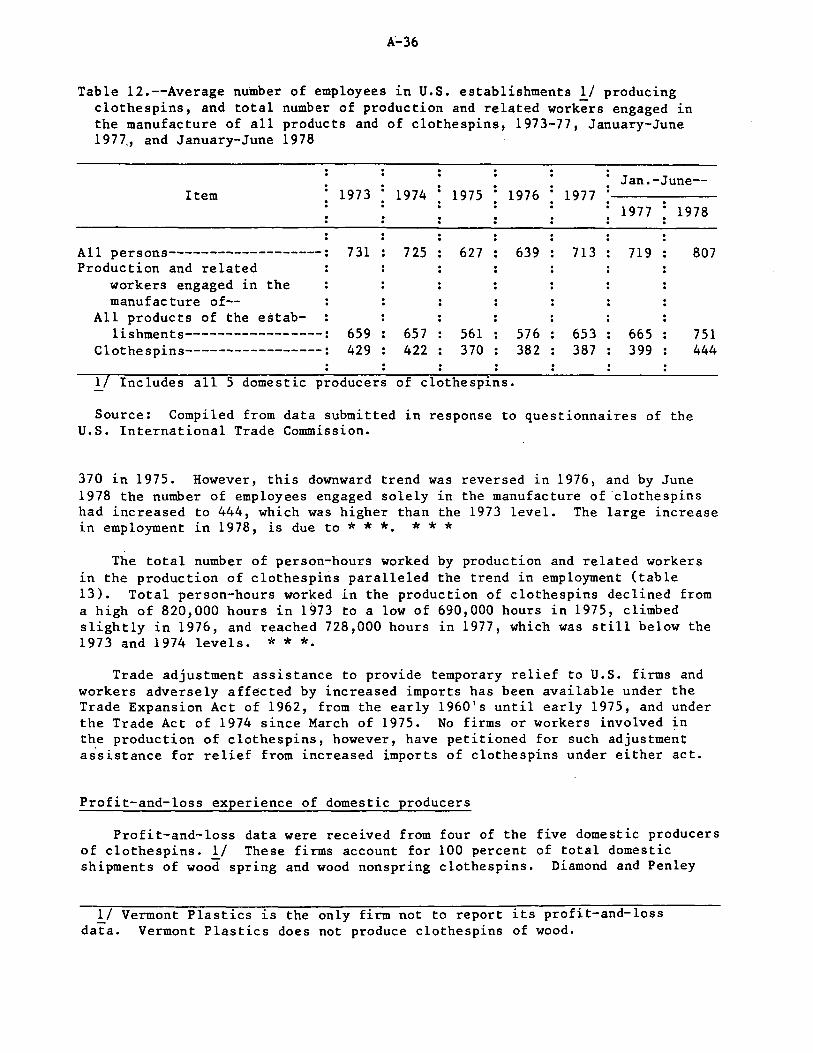
A-36
Table 12.--Average number of employees in U.S. establishments 1/ producing clothespins, and total number of production and related workers engaged in the manufacture of all products and of clothespins, 1973-77, January-June 1977 .. , and January-June 1978
Jan.-June--Item 1973 1974 1975 1976 1977
1977 1978
All persons-------------------: 7 31 725 627 639 713 719 Production and related
workers engaged in the manufacture of--
All products of the es tab-lishments-----------------: 659 657 561 576 653 665
Clothespins-----------------: 429 422 370 382 387 399
1/ Includes all 5 domestic producers of clothespins.
Source: Compiled from data submitted in response to questionnaires of the U.S. International Trade Commission.
807
751 444
370 in 1975. However, this downward trend was reversed in 1976, and by June 1978 the number of employees engaged solely in the manufacture of clothespins had increased to 444, which was higher than the 1973 level. The large increase in employment in 1978, is due to * * * * * *
The total number of person-hours worked by production and related workers in the production of clothespins paralleled the trend in employment (table 13). Total person-hours worked in the production of clothespins declined from a high of 820,000 hours in 1973 to a low of 690,000 hours in 1975, climbed slightly in 1976, and reached 728,000 hours in 1977, which was still below the 1973 and 1974 levels. * * *·
Trade adjustment assistance to provide temporary relief to U.S. firms and workers adversely affected by increased imports has been available under the Trade Expansion Act of 1962, from the early 1960's until early 1975, and under the Trade Act of 1974 since March of 1975. No firms or workers involved in the production of clothespins, however, have petitioned for such adjustment as.sistance for relief from increased imports of clothespins under either act.
Profit-and-loss experience of domestic producers
Profit-and-loss data were received from four of the five domestic producers of clothespins. 1/ These firms account for 100 percent of total domestic shipments of wood spring and wood nonspring clothespins. Diamond and Penley
1/ Vermont Plastics is the only firm not to report its profit-and-loss data. Vermont Plastics does not produce clothespins of wood.
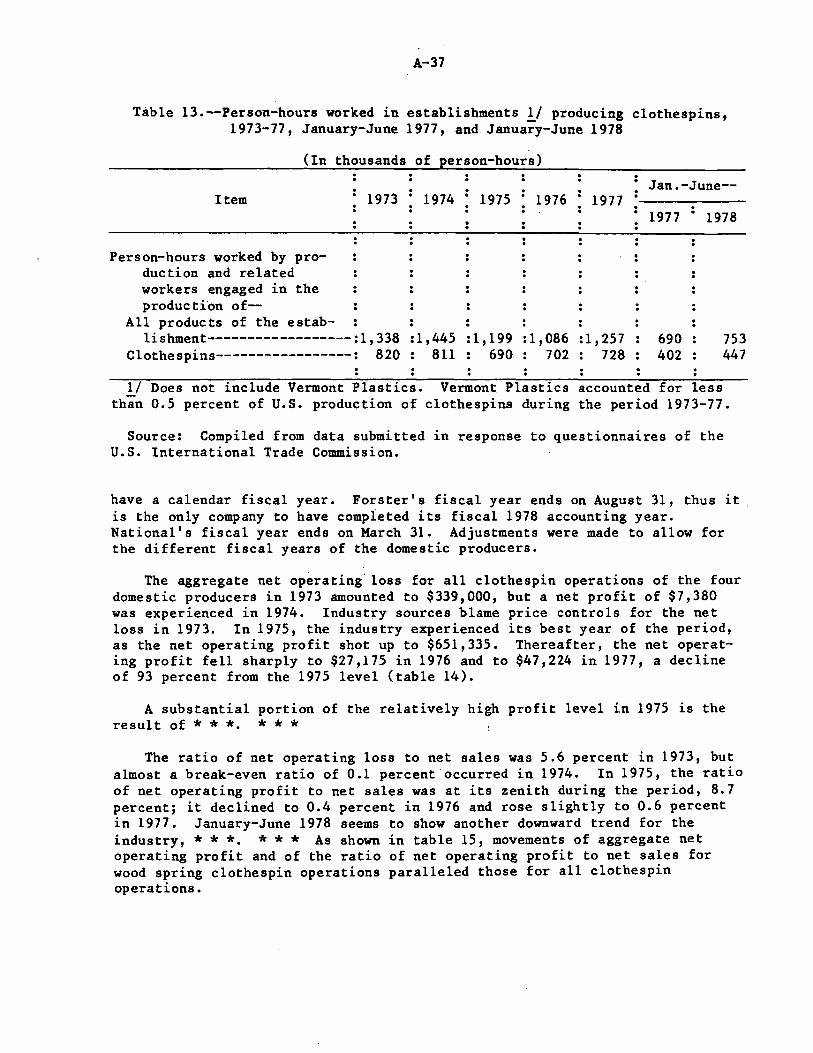
A-37
Table 13.--Person-hours worked in establishments 1/ producing clothespins, 1973-77, January-June 1977, and.January-June 1978
(In thousands of person-hours)
Item
Person-hours worked by production and related workers engaged in the produc tfon of--
1973
All products of the establishment------------------:1, 338
Clothespins-----------------: 820
1974 1975 1976 1977
: 1, 445 : 1, 199 : 1 '086 : 1' 25 7 811 690 702 728
Jan.-June--
1977 1978
690 402
753 447
1/ Does not include Vermont Plastics. Vermont. Plastics accounted for less than 0.5 percent of U.S. production of clothespins during the period 1973-77.
Source: Compiled from data submitted in response to questionnaires of the U.S. International Trade Commission.
have a calendar fiscal year. Forster's fiscal year ends on August 31, thus it. is the only company to have completed its fiscal 1978 accounting year. National's fiscal year ends on March 31. Adjustments were made to allow for the different fiscal years of the domestic producers.
The aggregate net operating· loss for all clothespin operations of the four domestic producers in 1973 amounted to $339,000, but a net profit of $7,380 was experienced in 1974. Industry sources blame price controls for the net loss in 1973. In 1975, the industry experienced its best year of the period, as the net operating profit shot up to $651,335. Thereafter, the net operating profit fell sharply to $27,175 in 1976 and to $47,224 in 1977, a decline of 93 percent from the 1975 level (table 14).
A substantial portion of the relatively high profit level in 1975 is the result of * * *· * * *
The ratio of net operating loss to net sales was 5.6 percent in 1973, but almost a break-even ratio of 0.1 percent occurred in 1974. In 1975, the ratio of net operating profit to net sales was at its zenith during the period, 8.7 percent; it declined to 0.4 percent in 1976 and rose slightly to 0.6 percent in 1977. January-June 1978 seems to show another downward trend for the industry, * * *· * * * As shown in table 15, movements of aggregate net operating profit and of the ratio of net operating profit to net sales for wood spring clothespin operations paralleled those for all clothespin operations.
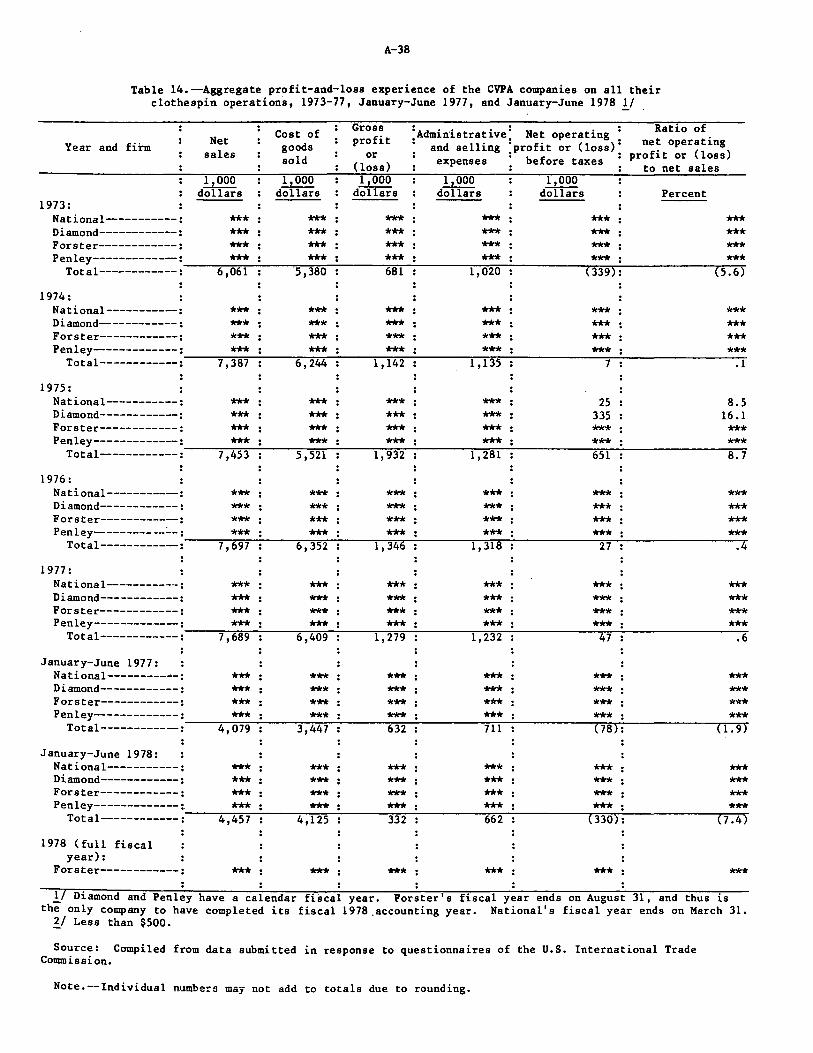
A-38
Table 14.--Aggregate profit-and-loss experience of the CVPA companies on all their clothespin operations, 1973-77, January-June 1977, and January-June 1978 !/
Year and firm
1973:
Net sales
1,000 dollars
Cost of goods sold
1,000 dollars
Gross profit
or Closs) 1,000
dollars
'.Administrative'. Net operating : • and selling "profit or (loss)"
expenses : before taxes :
1,000 dollars
1,000 d0Ti'8r's
Ratio of net operating
profit or (loss) to net sales
Percent
National-----------: *** *** *** *** *** *** Diamond------------: *** *** *** *** *** *** Forster------------: *** *** *** *** *** *** Penley-------------=~~--,,...,,*~**-=-~~~-=-~***:-=:--~~~~*~*~*,...-~~~~--=--*~**~~~~~~~._,.***.,...,,."=""'"~:~~~~~~~...,..,,-*~*..-*
Total------------: 6,061 5,380 681 1,020 (339): (5.6)
1974: National-----------: *** *** *** *** *** *** Diamond------------: *** *** *** *** *** *** Forster------------: *** *** *** *** *** *** Penley-------------: *** *** *** *** *** *** Total------------:~~~7~,~3~8~7~~~76-,~244-:-:-~~--,l~,~1~4~2~~~~--,-l~,1~3~5,.--~~~~~~~7,--:..~~~~~~~--.,-.l
1975: National----------: *** *** *** *** 25 Diamond------------: *** *** *** *** 335 Forster------------: *** *** *** *** *** Penley------------: *** *** *** *** ***
8.5 16.1
*** ***
Total-----------:~~-1=-,4~5~3,....-~~-5=-,5~2~1~~~_,...1-,9~3~2,__~~~~l~,-2~8~1~~=-=-=-=-=-6~5-l=-=-~=-=-=-=-=--8-.-7
1976: National-----------: *** *** *** *** *** *** Diamond------------: *** *** *** *** *** *** Forster------------: *** *** *** *** *** *** Penley----------=--: *** *** *** *** *** ***
Total-----------==-=--1~,-6~9~7:--=-=-.....,-6-,3~5~2..-=-=---=-1-,3~4~6.---=-=-=-=-1~,~3~1~8:--~=-=-=-~~=2=7=-=-~=-=-=-=-=-~ ....... 4
1977: National-----------: *** *** *** *** *** Diamond------------: *** *** *** *** *** Forster------------: *** *** *** *** *** Penley-------------: *** *** *** *** ***
*** ***
*** ***
Total------------:=-=--1=-,6~8~9,--=-=-.....,..6-,4~0~9,....-=-=-_,..l-,2~7~9,.....-=-=-=-=-1~,-2~3~2,....-=-=-=-=-=-=-~4~7=-=-=-=-=-=-=-=-=-• ....,.6
January-June 1977: National-----------: *** *** *** *** *** *** Diamond------------: *** *** *** *** *** *** Forster------------: *** *** *** *** *** *** Penley-------------: *** *** *** *** *** *** Total-----------:=-~-4~,~0~7=9~~~~3-,~4~4~7~~~~6~3~2,..-~~~~-7~1~1,..-~~~~~-(r.7~8~)-:~~~~~~~(~l-.=9~)
January-June 1978: National-----------: *** *** *** *** *** *** Diamond------------: *** *** *** *** *** *** Forster------------: *** *** *** *** *** *** Penley-------------: *** *** *** *** *** ***
Total------------:=-~~4-,~4=5~7~~~4~,~1~2=5~~~--,3=3=2~~~~~~6~62=-~~~~---..,(~3=3=0~)-:~~~~~___,(~7-.~4)
1978 (full fiscal year):
Forster------------: *** *** *** *** *** *** !f Diamond and Penl~y have a calendar fiscal year. Forster's fiscal year ends on August 31, and thus is
the only company to have completed its fiscal 1978.accounting year. National's fiscal year ends on March 31. ~/ Less than $500.
Source: Compiled from data submitted in response to questionnaires of the U.S. International Trade Commission.
Note.--Individual numbers may not add to totals due to rounding.
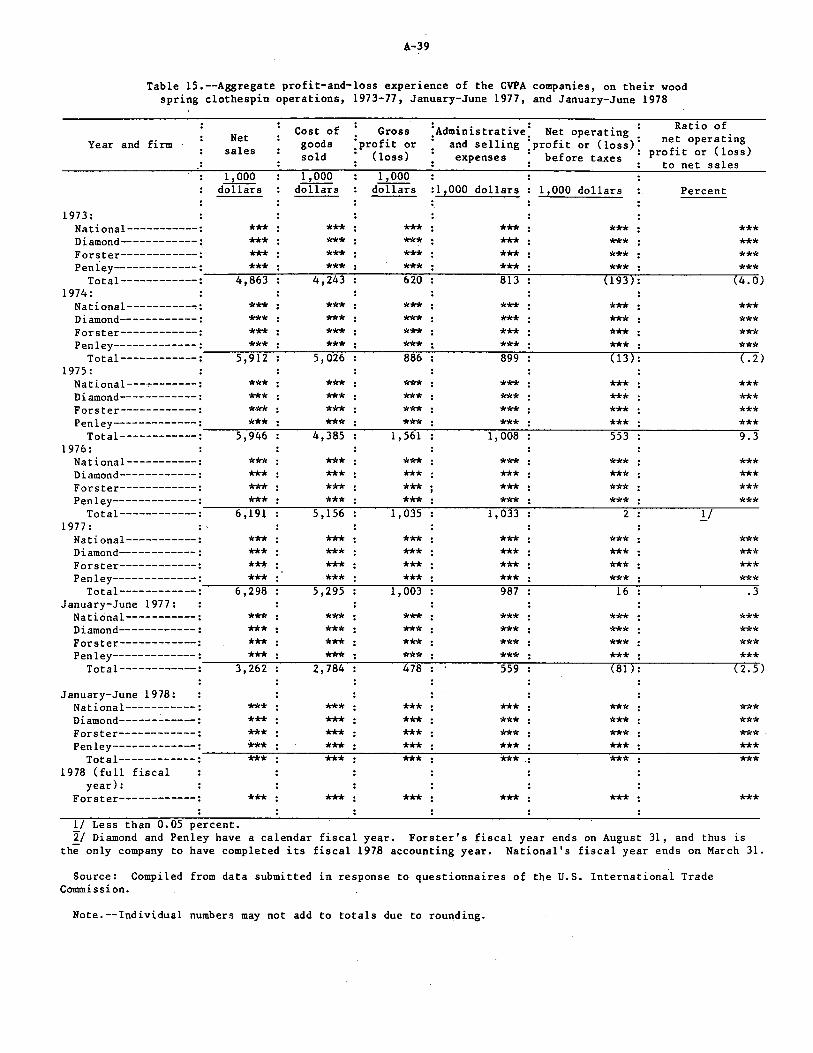
A-39
Table 15.--Aggregate profit-and-loss experience of the CVPA companies, on their wood spring clothespin operations, 1973-77, January-June 1977, and January-June 1978
Ratio of
Year and firm · Net sales
Cost of goods sold
• Gross :profit or • Closs)
:Administrative: Net operating : • and selling :profit or (loss)'.
expenses • before taxes •
net operating profit or (loss)
to net sales
1973:
1,000 dOiTSrs
1,000 dOlTilrs
1,000 dOlTilrs :1,000 dollars 1 1 000 dollars Percent
National-----------: *** *** *** *** *** *** Diamond------------; *** *** *** *** *** *** Forster------------: *** *** *** *** *** *** Penley~-----------:~~-.,...-*~*~*=--~~--:--=*~*~*~~~~-*6~*2~*0=---.,...~-.,...~~~*8~*1~*3~~~~~~-(~*l-*9-*3~)-:~~~~~~~~(*4-*-.*0-)
Total------------: 4 1 863 4,243 1974:
National-----------: *** *** *** *** *** *** Diamond------------: *** *** *** *** *** *** Forster------------: *** *** *** *** *** *** Penley-------------:~~-=-=*~*~*~~~-=--=**...,,..,,*~~~~--=**8~8~*6,...-~-.,...~~-.,...-*8-*9-*9,---~~~~~~-*(~*l-*3~)~:~~~~~~~-*~*-*
Total------------: 5,912 5,026 (.2) 1975: National---~-------: *** *** *** *** *** *** Diamond------------: *** *** *** *** *** *** Forster------------: *"'* *** *** *** *** *** Penley-------------:~,...---,,......*~*~*-=--,...-,...-,...-...,..-~*-*~*=--,...-,...-,...-..,-~*~*~*,...-,...-,...-,...-,...--..,.......,,*~*~*,...-,...-,...-,...-,...-,...-,...----,,*5-*5-*3,---,...-,...-,...-,...-,...-,...-,...-,...--*-*_*~ Total------------: 5,946 4,385 1,561 11 008 9.3
1976: National-----------: *** *** *** *** *** *** Diamond------------: *** *** *** *** *** *** Forster------------: *** *** *** *** *** ***
Pe~~~~~============:~~---,,6-,~;-*~9~;~~~-=5-,~;~;-:,...-~-=---=1-,-~~;~;,---~~~~-1-,-;*~3~;=-~~~~~~-*-*-*~2~~~~~~1-;~~-*-*_* 1977: : -
National-----------: *** *** *** *** Diamond------------: *** *** *** *** Forster------------: *** *** *** *** Penley-------------: *** *** *** ***
*** *** *** ***
*** *** *** ***
Total------------:~-.,...-6~,-2~9~8---.,...-.,...-5~,-2~9~5---.,...-.,...-1~,-0~0~3---.,...-.,...-.,...-.,...--=9~8=1:---.,.......--.,...-.,...-.,...-.,...~1~6-.,...-.,...-.,...-.,...-.,...-.,...-.,...-.,...-.~3
January-June 1977: National-----------: *** *** *** *** *** *** Diamond------------: *** *** *** *** *** *** Forster------------: *** *** *** *** *** *** Penley-------------:~,...---,,.-*-*-*--,..-,...-,...-,...--*-*-*,---,...-,...-,..-,...--*-*-*,...-,...-,...-,...-,...-,...-,---*-*-*,...-,...-,...-,...-,...-,...-,...-~*-*_*~,...-,...-,...-,...-,...-,...-,...-,...-~*-*_*~
Total------------: 3,262 2,784 478 559 (81): (2.5)
January-June 1978: National-----------: *** *** *** *** *** *** Diamond------.:_ _____ : *** *** *** *** *** *** Forster------------: *** *** *** *** *** *** Penley-------------: __ :--:--,...-****:--**:--:--:--:--:--_*_*_* __ ,...-____ ,...-_*_*_* ____ :--:--:--:--,...-***_*_**--.. --:--:--,...-,...-,...-,---*-*_*,...---,...---,...-,...-,...-:--:---***_*_**-
Total------------: *** *** *** 1978 (full fiscal
year): Forster------------: *** *** *** *** *** ***
1/ Less than 0.05 percent. 21 Diamond and Penley have a calendar fiscal year. Forster's fiscal year ends on August 31, and thus is
the only company to have completed its fiscal 197.8 accounting year. National's fiscal year ends on March 31.
Source: Compiled from data submitted in response to questionnaires of the U.S. International Trade Commission.
Note.--Individual numbers may not add to totals due to rounding.
A-40
In contrast to their experience on clothespin operations, the aggregate net operating profit for all operations at the reporting establishments of the domestic producers increased from $1.2 million in 1973 to $2.l million in 1974 and then increased again to $2.2 million in 1975 (table 16). Net operating profit tumbled to $1.4 million in 1976, but then rebounded to $2.1 million in 1977. The aggregate ratio of net operating profit to net sales increased from 8.9 percent in 1973 to 14.5 percent in 1975, fell to 8.1 percent in 1976, and then recovered to 11.4 percent in 1977.
The profit-and-loss experiences of National and Penley are the same for all clothespin operations and for all operations of the reporting establishments, since both manufacture only clothespins. Diamond (plant in Peru, Maine) and Forster (plants in Wilton and Mattawamkeg, Maine) manufacture other products at their clothespin plants; * * * (table 17).
* * * * * * *
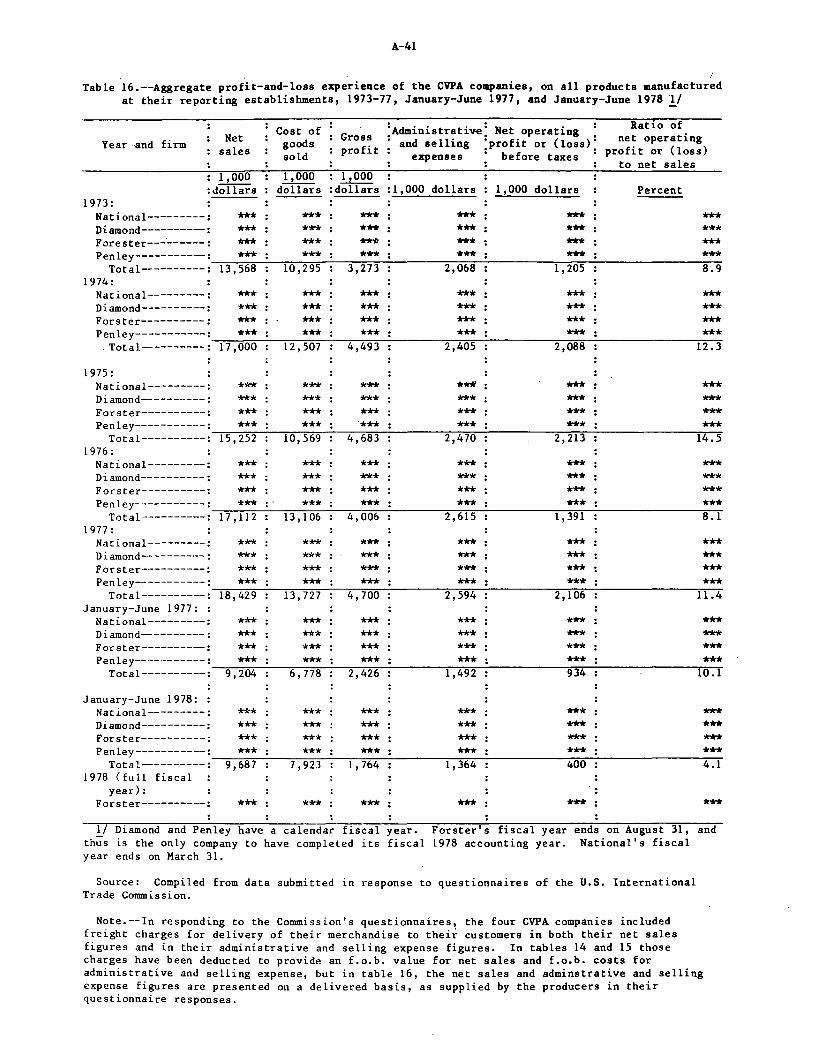
A-41
Table 16.--Aggregate profit-and-loss experience of the CVPA companies, on all products manufactured at their reporting establishments, 1973-77, January-June 1977, and January-June 1978 !/
Year ··and firm Net sales
Cost of goods sold
Gross profit
:Administrative: Net operating • · and selling "profit or (loss)"
expenses : before taxes :
Ratio of net operating
profit or (loss) to net sales
1973:
1,000 :dOITars
1,000 1,000 dOTiars :dOTiars :1,000 dollars 1,000 dollars Percent
National---------: *** *** *** *** *** *** Diamond----------: *** *** *** *** *** *** Forester---·------: *** *** *** *** *** *** Penley----------:_,-=---*~**~~~-:-:c--::***-:::--,:,--~-:-~*~**==-~~~~~-:-~*~**~~~~~~~-,--***~=-~~~~~~~~~~***~
Total---------: 13,568 10,295 3,273 2,068 1,205 8.9 1974:
National---------: *** *** *** *** *** *** Diamond---------: *** *** *** *** *** *** Forster----------: *** *** *** *** *** *** Penley-----------:__,...,,....._*~*~*=--~--=--=-~*~*~*,_..~-,--*~*~*=-..:......~~~---,,...-*~**-=--'-~~~~~~-***-=-=-..:......~~~~~~~~-**~*
. Total---------: 17,000 12,507 4,493 2,405 2,088 12.3
1975: National---------: *** *** *** **"* *** *** Diamond----------: *** *** *** *** *** *** Forster----------: *** *** *** *** *** *** Penley-----------:__,-=--*~*~*=--~---=--=-~*~*~*,--~-,--·*~**,,..,,.-'-~~~~-=--**,...,,.*=-~~~~~-..,,,...-***~=-..:......~~~--~~~~-*-**=
Total----------: 15 1 252 10,569 4,683 2,470 2,213 14.5 1976:
National----------: *** *** *** *** *** *** Diamond----------: *** *** *** *** *** *** Forster----------: *** *** *** *** *** *** Penley-----------=-~-*-**,...-~~-,,-~*-*-*~~-,--**~*=-~~~~-..,,...-*-*-*=-~~~~~~~*-*-*~~~~~~~~~~-*-*~*
Total----------: 17,112 13,106 4,006 2,615 1,391 8.1 1977:
National---------: *** *** *** *** *** *** Diamond----------: *** *** *** *** *** *** Forster----------: *** *** *** *** *** *** Penley-----------:---=--=-~*~*~*,--~-=-=-*=--=-**=-~--,--,*~**=-=-~~~~~...,,.....~**~*,..-.:..-~~~~--:,..-,***-=-=--"-~~~~~~~=-*=-**~
Total----------: 18,429 13,727 4,700 2,594 21 106 11.4 January-June 1977: :
National---------: *** *** *** *** *** *** Diamond----------: *** *** *** *** *** *** Focster----------: *** *** *** *** *** *** Penley----·-------=--=--*-*~*,..-~~-=-~*~*~*,._...:......_,..-*~*~*..,........:......~~~~=--**.,..,,.*-=-..:......~~~~~~***,,....,,..,..-..:......~~~~~~~=-~*-*~*
Total----------: 9,204 6,778 2,426 1,492 934 10.l
January-June 1978: : National---------: *** *** *** *** *** *** Diamond----------: *** *** *** *** *** *** Forster----------: *** *** *** *** *** *** Penley-----------=-~-*-*-*=-~~~-*-*-*~~~-**~-*~~~=-~~-*-*-*~~~~~~~~***~~~~~~~~~~=--*-*_*
Total---------: 9,687 7 1 923 1,764 11 364 400 4.1 1978 (full fiscal
year): . :
Forster----------: *** *** *** *** *** *** 1/ Diamond and Penley have a calendar fiscal year. Forster's fiscal year ends on August 31, and
thus is the only company to have completed its fiscal 1978 accounting year. National's fiscal year ends on March 31.
Source: Compiled from data submitted in response to questionnaires of the U.S. International Trade Commission.
Note.--In responding to the Commission's questionnaires, the four CVPA companies included freight charges for delivery of their merchandise to their customers in both their net sales figures and in their administrative and selling expense figures. In tables 14 and 15 those charges have been deducted to provide an f.o.b. value for net sales and f.o.b. costs for administrative and selling expense, but in table 16 1 the net sales and adminstrative and selling expense figures are presented on a delivered basis, as supplied by the producers in their questionnaire responses.
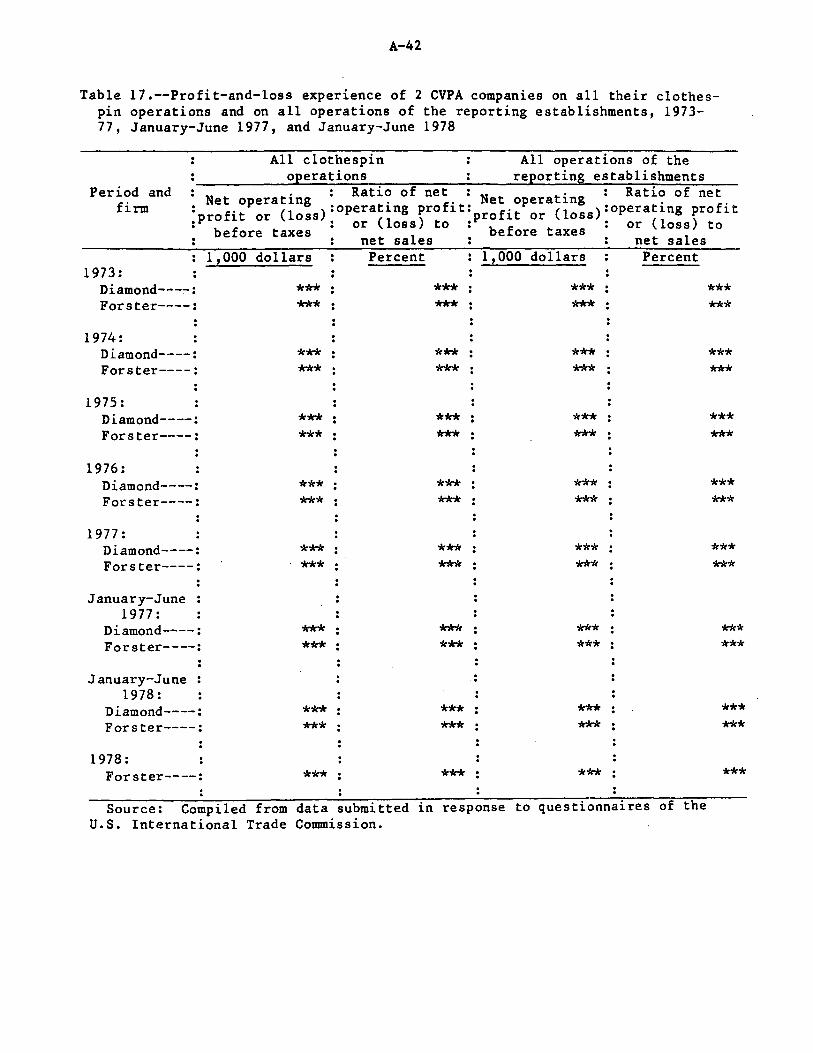
A-42
Table 17.--Profit-and-loss experience of 2 CVPA companies on all their clothespin operations and on all operations of the reporting establishments, 1973-77, January-June 1977, and January-June 1978
All clothespin All operations of the operations reporting establishments
Period and firm
N t operating : Rati~ of net. Net operating : Ratio of net • •• preofit or (l ):operating profit: f"t (l ):operating profit
oss or (loss) to :prbo if ort oss : or (loss) to • before taxes e ore axes net sales net sales
1973: Diamond---:-: Forster----:
1974: Diamond----: Forster----:
1975: Diamond----: Forster----:
1976: Diamond----: Forster----:
1977: Diamond----: Forster----:
January-June 1977:
Diamond----: Forster----:
January-June : 1978:
Diamond----: Forster----:
1978: Forster----:
1, 000 dollars
*** ***
*** ***
*** ***
*** ***
*** ***
*** ***
*** ***
***
Percent
*** ***
*** ***
*** ***
*** ***
*** ***
*** ***
*** ***
***
1, 000 dollars
*** ***
*** ***
*** ***
*** ***
*** ***
*** ***
*** ***
***
Percent
Source: Compiled from data submitted in response to questionnaires of the U.S. International Trade Commission.
*** ***
*** ***
*** ***
*** ***
*** ***
*** ***
*** ***
***
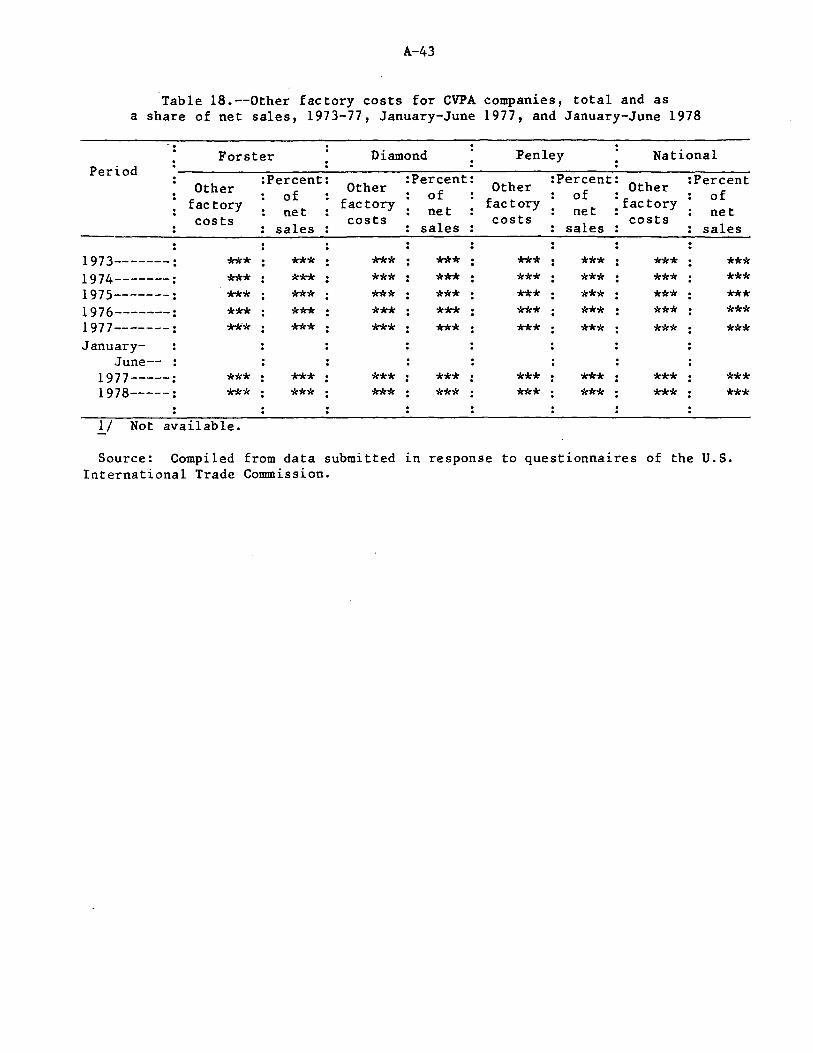
A-43
Table 18.--0ther factory costs for CVPA companies, total and as a share of net sales, 1973-77, January-June 1977, and January-June 1978
.. : Forster Diamond Penley National
Period Other
:Percent: Other :Percent: Other :Percent: Other :Percent
of of of . of factory net factory net factory net : factory net costs sales
costs sales costs
sales costs
sales
1973-------: *** *** *** *** *** *** *** *** 1974-------: *** *** *** *** *** *** *** *** 1975-------: *** *** *** *** *** *** *** *** 1976-------: *** *** *** *** *** *** *** *** 1977-------: *** *** *** *** *** *** *** *** January-
June-- . . 1977-----: *** *** *** *** *** *** *** *** 1978-----: *** *** *** *** *** *** *** ***
1/ Not available.
Source: Compiled from data submitted in response to questionnaires of the U.S. International Trade Commission.
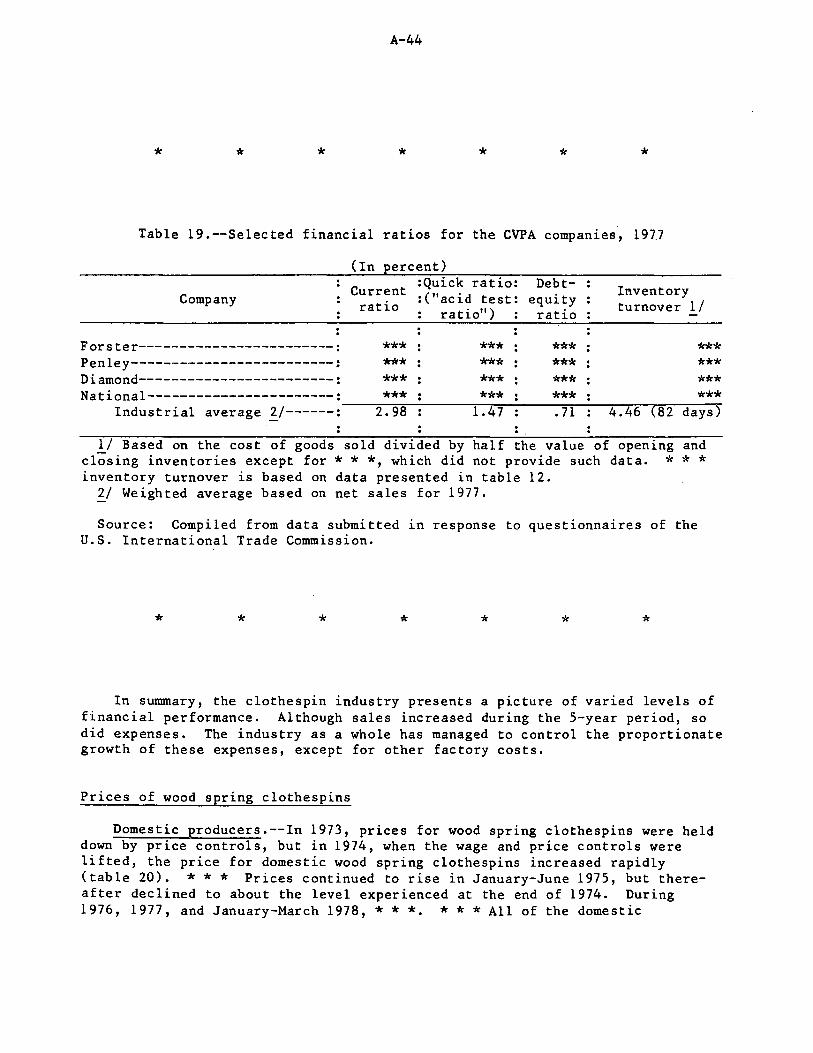
A-44
* * * * * * *
Table 19 .--Selected financial ratios for the CVPA companies, 197.7
(In percent)
Current :Quick ratio: Debt- Inventory
Company ratio : ("acid test: equity turnover 1/ ratio") ratio
Forster------------------------: *** *** *** *** Penley-------------------------: *** *** *** *** Diamond-------------------------: *** *** *** *** National-----------------------: *** *** *** ***
Industrial average 2/------: 2.98 1.47 .71 4.46 (82 days) . . 1/ Based on the cost of goods sold divided by half the value of opening and
closing inventories except for * * *, which did not provide such data. * * * inventory turnover is based on data presented in table 12. ~/ Weighted average based on net sales for 1977.
Source: Compiled from data submitted in response to questionnaires of the U.S. International Trade Commission.
* * * * * * *
In summary, the clothespin industry presents a picture of varied levels of financial performance. Although sales increased during the 5-year period, so did expenses. The industry as a whole has managed to control the proportionate growth of these expenses, except for other factory costs.
Prices of wood spring clothespins
Domestic producers.--In 1973, prices for wood spring clothespins were held down by price controls, but in 1974, when the wage and price controls were lifted, the price for domestic wood spring clothespins increased rapidly (table 20). * * * Prices continued to rise in January-June 1975, but thereafter declined to about the level experienced at the end of 1974. During 1976, 1977, and January-March 1978, * * * ***All of the domestic
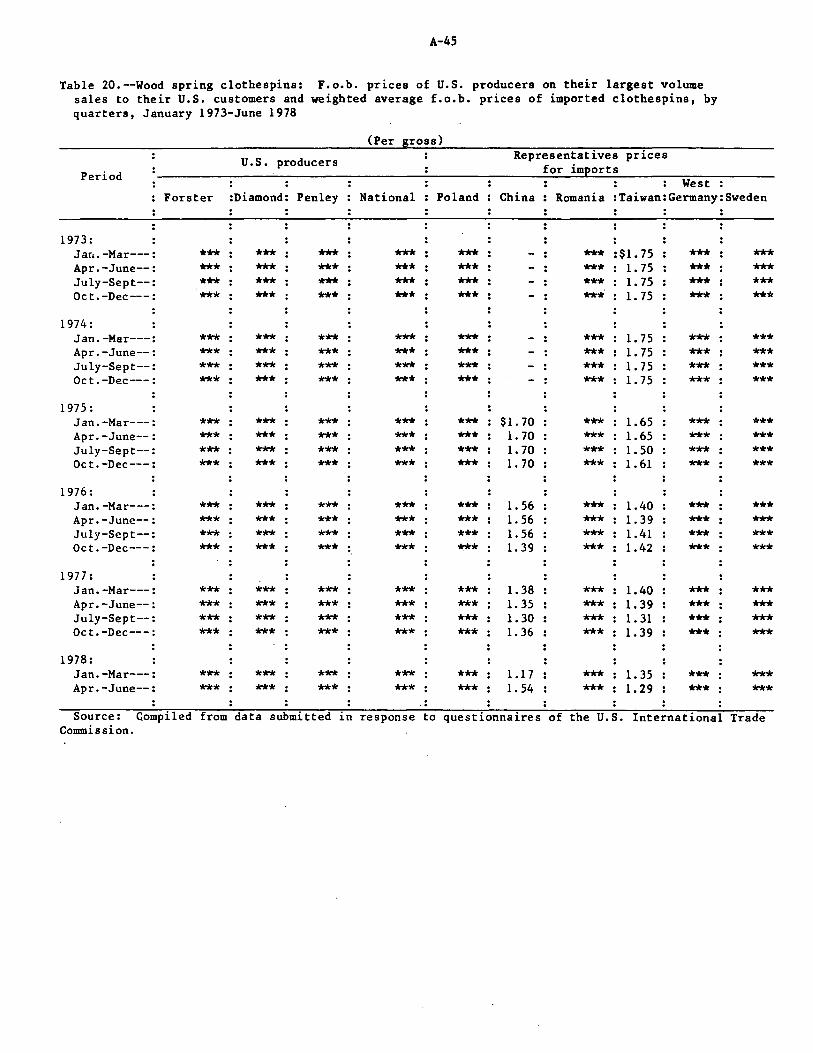
A-45
Table 20.--Wood spring clothespins: F.o.b. prices of U.S. producers on their largest volume sales to their U.S. customers and weighted average f.o.b. prices of imported clothespins, by quarters, January 1973-June 1978
(Per ross)
U.S. producers Representatives prices
Period for imeorts West :
Forster :Diamond: Penley National Poland China Romania :Taiwan:Germany:Sweden
1973: Jar,. -Mar---: *** *** *** *** *** - : *** :$1. 75 *** *** Apr.-June--: *** *** *** *** *** - : *** 1. 75 *** *** July-Sept--: *** *** *** *** *** - : *** 1. 75 *** *** Oct.-Dec--: *** *** *** *** *** - : *** 1. 75 *** ***
1974: Jan.-Mar---: *** *** *** *** *** - : *** 1. 75 *** *** Apr.-June--: *** *** *** *** *** - : *** 1. 75 *** *** July-Sept--: *** *** *** *** *** - : *** 1. 75 *** *** Oct. -Dec---: *** *** *** *** *** - : *** 1. 75 *** ***
1975: Jan.-Mar---: *** *** *** *** *** $1.70 *** 1.65 *** *** Apr.-June--: *** *** *** *** *** 1. 70 *** 1. 65 *** *** July-Sept--: *** *** *** *** *** 1. 70 *** 1. 50 *** *** Oct.-Dec---: *** *** *** *** *** 1. 70 *** 1.61 *** ***
1976: Jan.-Mar---: *** *** *** *** *** 1. 56 *** 1.40 *** *** Apr.-June--: *** *** *** *** *** 1. 56 *** 1. 39 *** *** July-Sept--: *** *** *** *** *** 1. 56 *** 1.41 *** *** Oct.-Dec---: *** *** *** : *** *** 1. 39 *** 1.42 *** ***
1977: Jan.-Mar---: *** *** *** *** *** 1. 38 *** 1.40 *** *** Apr.-June--: *** *** *** *** *** 1. 35 *** 1. 39 *** *** July-Sept--: *** *** *** *** *** 1. 30 *** 1. 31 *** *** Oct.-Dec---: *** *** *** *** *** 1. 36 *** 1. 39 *** ***
1978: Jan.-Mar---: *** *** *** *** *** 1.17 *** l. 35 *** *** Apr.-June--: *** *** *** *** *** 1. 54 *** l. 29 *** ***
Source: Compiled from data submitted in response to questionnaires of the U.S. International Trade Commission.
A-46
producers raised their prices significantly in April-June 1978. * * * According to industry sources, the price increase by the domestic producers was due to the increasing cost of Belgian steel wire, which is used to make the spring f9r all spring clothespins. The Belgian steel wire prices have been affected by the revaluation of the Belgian franc vis-a-vis the U.S. dollar and may have been affected by the steel import trigger pricing system. General inflation in the economy was also blamed for the price increases. * * *·
All of the domestic producers include the cost of freight in their prices for clothespins. According to·industry sources, the shipping charges are 8 to 10 percent of the final price of the clothespins. Table 21 sets forth the delivered prices of U.S. producers for their largest volume sales of wood spring ~lothespins, including the shipping 'charges.
Representative imports.--
* * * * * * *
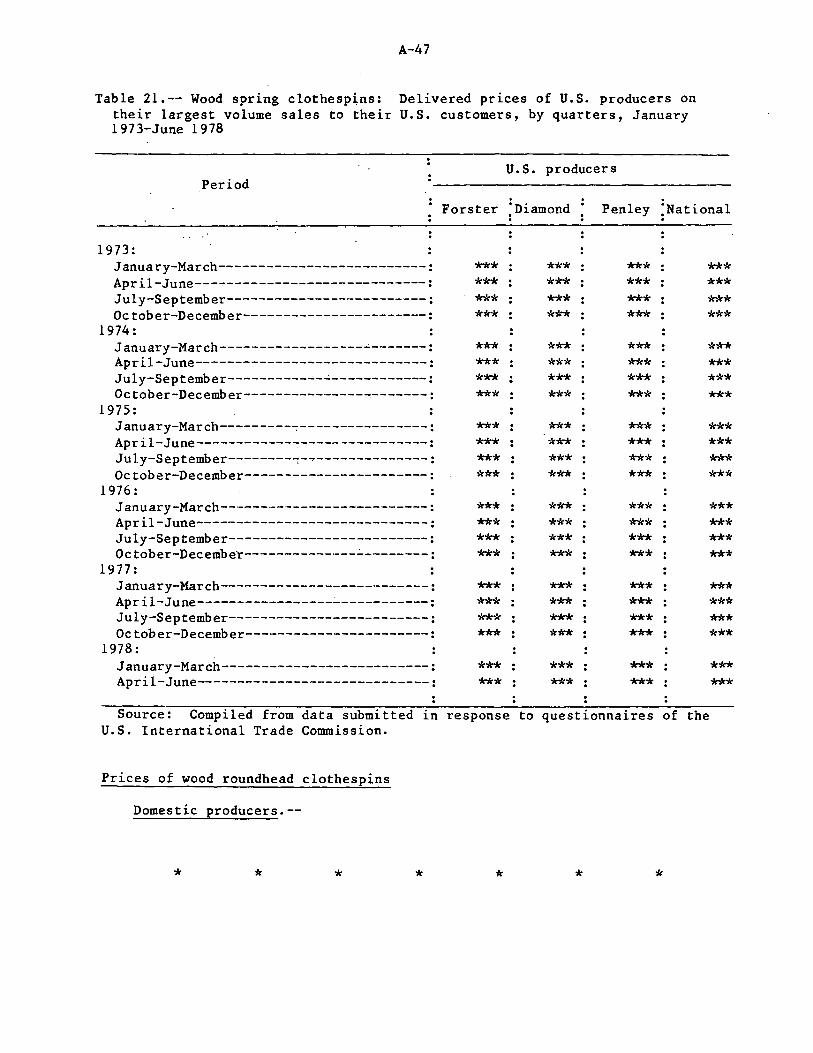
A-47
Table 21.-- Wood spring clothespins: Delivered prices of U.S. producers on their largest volume sales to their U.S. customers, by quarters, January 1973-June 1978
U.S. producers Period
Forster :Diamond Penley :National
1973: January-March--------------------------: April-June-----------------------------: July-September-------------------------: October-December-----------------------:
1974: January-March------------------~-------:
April-June-----------------------------: July-September----------~-~------------:
October-December-----------------------: 1975:
January-March---------~----------------:
April-June-----------------------------: July-September--------~----------------:
October-December-----------------------: 1976:
January-March--------------------------: April-June-----------------------------: July-September-------------------------: Oc tober-Decembe·r-----------·---.:..--------:
1977: January-March--------------------------: April-June-----------------------------: July-September-------------------------: October-December-----------------------:
1978: January-March--------------------------: April-June-----------------------------:
*** *** *** ***
*** *** *** ***
*** *** *** ***
*** *** *** ***
*** *** *** ***
*** ***
.
*** *** *** *** *** *** *** *** *** *** *** ***
*** *** *** *** *** *** *** *** *** *** *** ***
*** *** *** *** *** *** *** *** *** *** *** ***
*** *** *** *** *** *** *** *** *** *** *** ***
*** *** *** *** *** *** *** *** *** *** *** ***
*** *** *** *** *** ***
Source: Compiled from data submitted in response to questionnaires of the U.S. International Trade Commission.
Prices of wood roundhead clothespins
Domestic producers.--
* * * * * * *
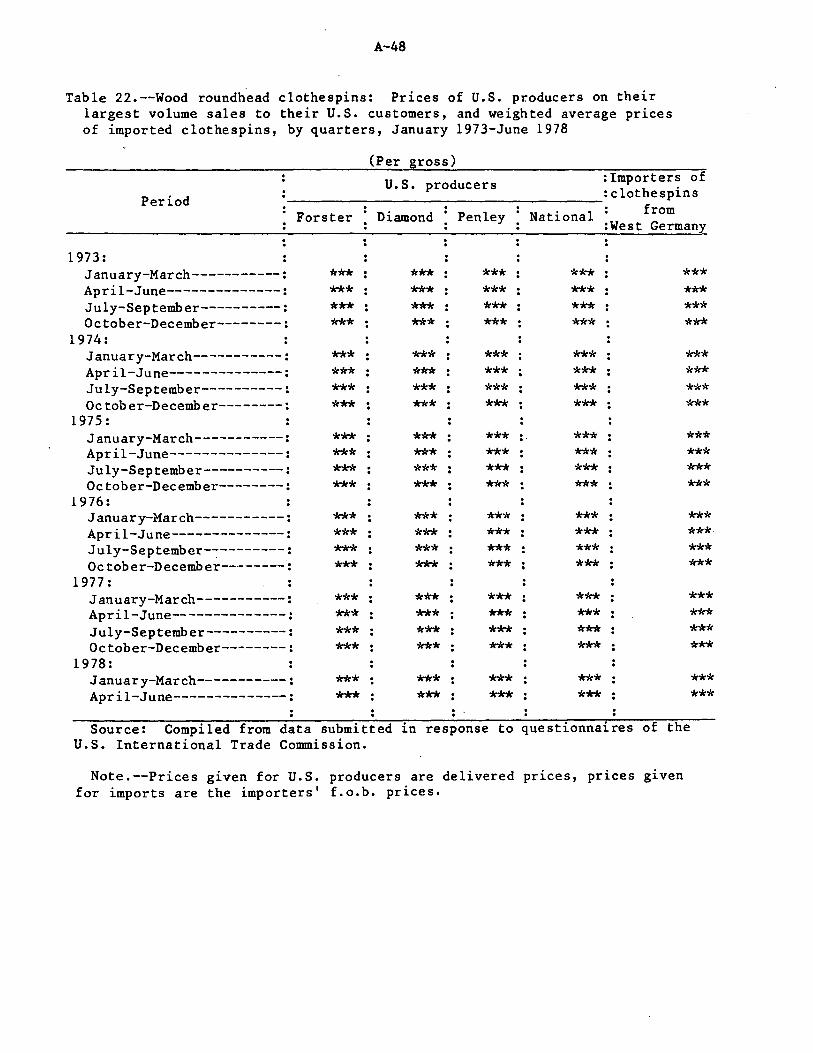
A-48
Table 22.--Wood roundhead clothespins: Prices of U.S. producers on their largest volume sales to their U.S. customers, and weighted average prices of imported clothespins, by quarters, January 1973-June 1978
(Per gross) U.S. producers :Importers of
~~~~~~~~~~~~~~~~~~~~~:clothespins Period
1973: January-March-----------: April-June--------------: July-September----------: October-December--------:
1974: January-March-----------: April-June--------------: July-September----------: October-December--------:
1975: January-March-----------: April-June--------------: July-September----------: October-December--------:
1976: January-March-----------: April-June--------------: July-September-~--------:
October-December--------: 1977:
January-March-----------: April-June--------------: July-September----------: October-December--------:
1978: January-March-----------: April-June--------------:
Forster
*** *** *** ***
*** *** *** ***
*** *** *** ***
*** *** *** ***
*** *** *** ***
*** ***
Diamond
*** *** *** ***
*** *** *** ***
*** *** *** ***
*** *** *** ***
*** *** *** ***
*** ***
Penley
*** *** *** ***
*** *** *** ***
*** .. *** *** ***
*** *** *** ***
*** *** *** ***
*** ***
National
*** *** *** ***
*** *** *** ***
*** *** *** ***
*** *** *** ***
*** *** *** ***
*** ***
from :West Germany
*** *** *** ***
*** *** *** ***
*** *** *** ***
*** *** *** ***
*** *** *** ***
*** ***
Source: Compiled from data submitted in response to questionnaires of the U.S. International Trade Commission.
Note.--Prices given for U.S. producers are delivered prices, prices given for imports are the importers' f.o.b. prices.
A-49
West Germany.--
* * * * * * *
Prices of plastic spring clothespins
* * * * * * *
Prices and unit costs for wood spring clothespins
As shown in table 24, the aggregate unit costs of the CVPA companies for producing wood spring clothespins increased rapidly from $1.23 in 1973 to $1.76 in 1976 and 1977. Thereafter, the unit costs continued to shoot upward to $2.04 in January-June 1978. Because of the large increases in the costs of production, all of the domestic producers increased their prices significantly in April-June 1978 (table 20).
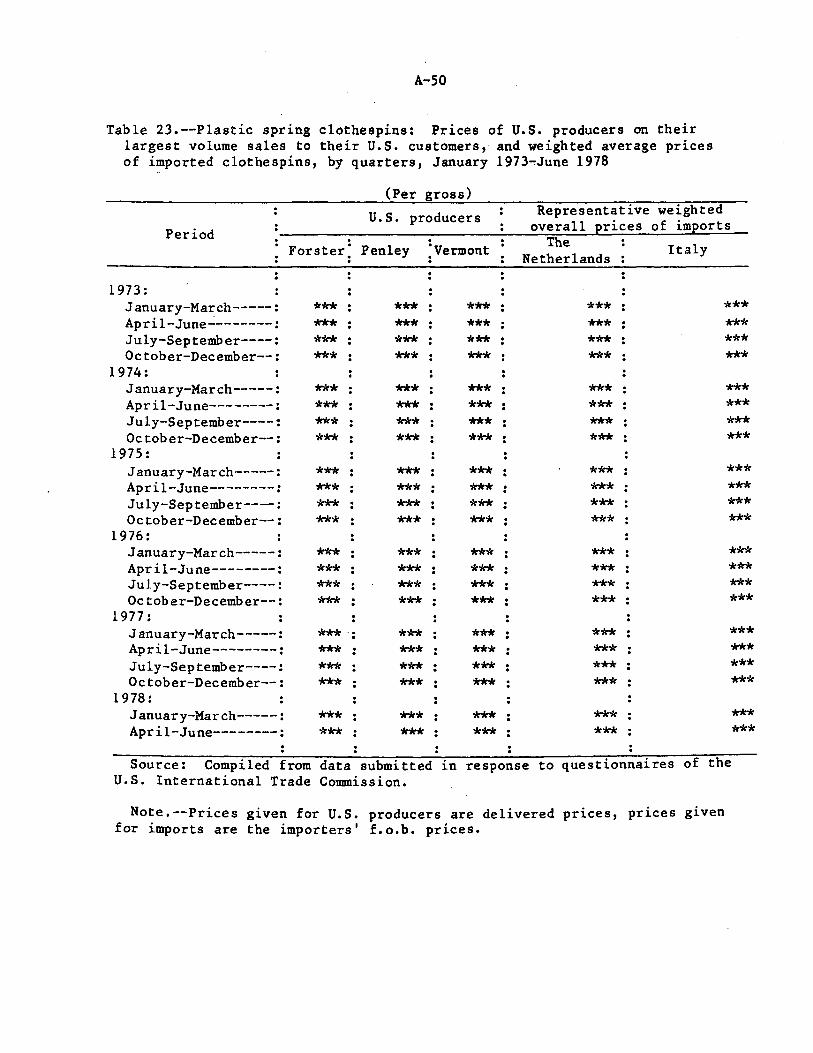
A-50
Table 23.--Plastic spring clothespins: Prices of U.S. producers on their largest volume sales to their U.S. customers, and weighted average prices of imported clothespins, by quarters, January 1973~June 1978
(Per gross)
U.S. producers Period
Representative weighted overall prices of imports
1973: January-March-----: April-June~-------: July-September----: October-December--:
1974: January-March-----: April-June--------: July-September----: October-December--:
1975: January-March-----: April-June--------: July-September----: October-December--:
1976: January-March-----: April-June--------: July-September----: October-December--:
1977: January-March-----: April-June--------: July-September----: October-December--:
1978: January-March-----: April-June--------:
. . Forster; Penley ;vermont
*** *** *** ***
*** *** *** ***
*** *** *** ***
*** *** *** *** *** . *** : *** ***
*** ***
*** *** : *** ***
*** *** *** ***
*** *** *** ***
*** *** *** *** *** *** *** ***
*** ***
*** *** *** *** *** *** *** ***
*** *** *** ***
*** *** *** ***
*** *** *** ***
*** ***
The Netherlands
*** *** *** ***
*** *** *** ***
*** *** *** ***
*** *** *** ***
*** *** *** ***
*** ***
Italy
*** *** *** ***
*** *** *** ***
*** *** *** ***
*** *** *** ***
*** *** *** ***
*** ***
Source: Compiled from data submitted in response to questionnaires of the U.S. International Trade Commission.
Note.--Prices given for U.S. producers are delivered prices, prices given for imports are the importers' f.o.b. prices.
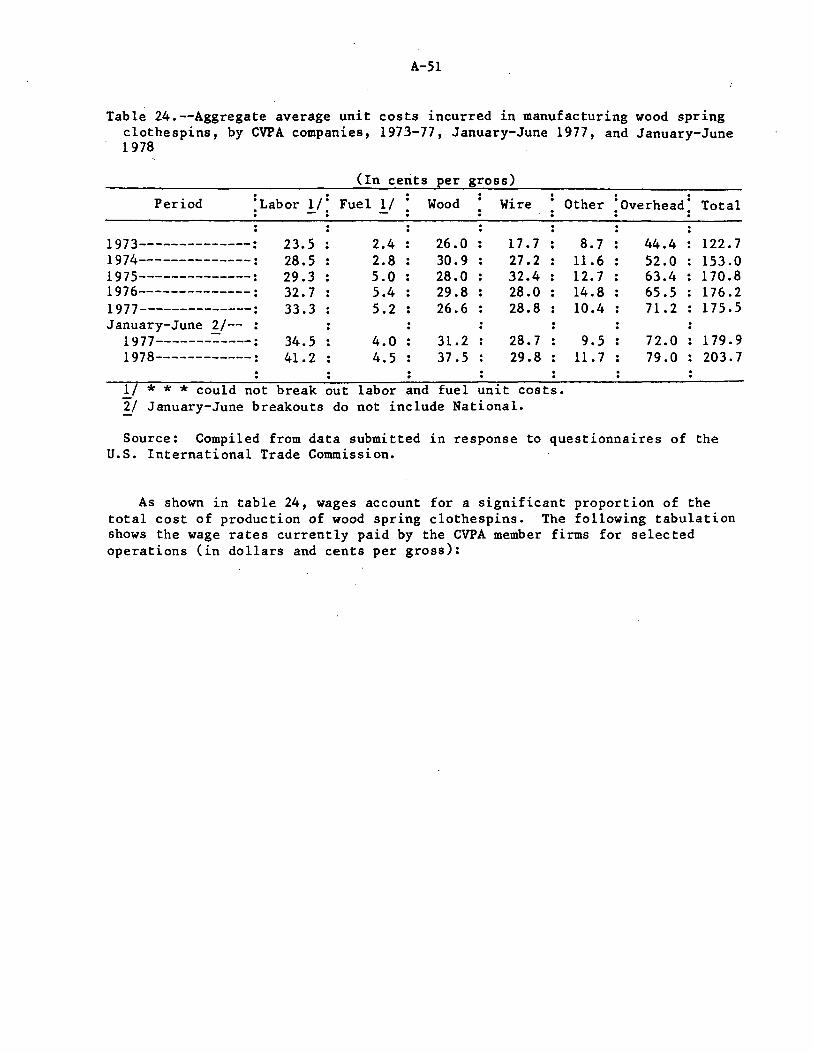
A-51
Table 24.--Aggregate average unit costs incurred in manufacturing wood spring clothespins, by CVPA companies, 1973-77, January-June 1977, and January-June 1978
(In cents per gross)
:Labor 1/: Period Fuel 1/ Wood Wire : - :
1973--------------: 23.5 2.4 26.0 17.7 1974--------------: 28.5 2.8 30.9 27.2 1975--------------: 29.3 5.0 28.0 32.4 1976--------------: 32.7 5.4 29.8 28.0 1977--------~-----: 33.3 5.2 26.6 28.8 January-June 2/-- :
1977-------~----: 34.5 4.0 31.2 28.7 1978------------: 41.2 4.5 37.5 29.8
1/ * * * could not break out labor and fuel unit costs. Z/ January-June breakouts do not include National.
. . Other ;overhead; Total
8.7 44.4 122.7 11.6 52.0 153.0 12.7 63.4 170.8 14.8 65.5 176.2 10.4 71.2 175.5
9.5 72.0 179.9 11. 7 79.0 203.7
Source: Compiled from data submitted in response to questionnaires of the U.S. International Trade Commission.
As shown in table 24, wages account for a significant proportion of the total cost of production of wood spring clothespins. The following tabulation shows the wage rates currently paid by the CVPA member firms for selected operations (in dollars and cents per gross):
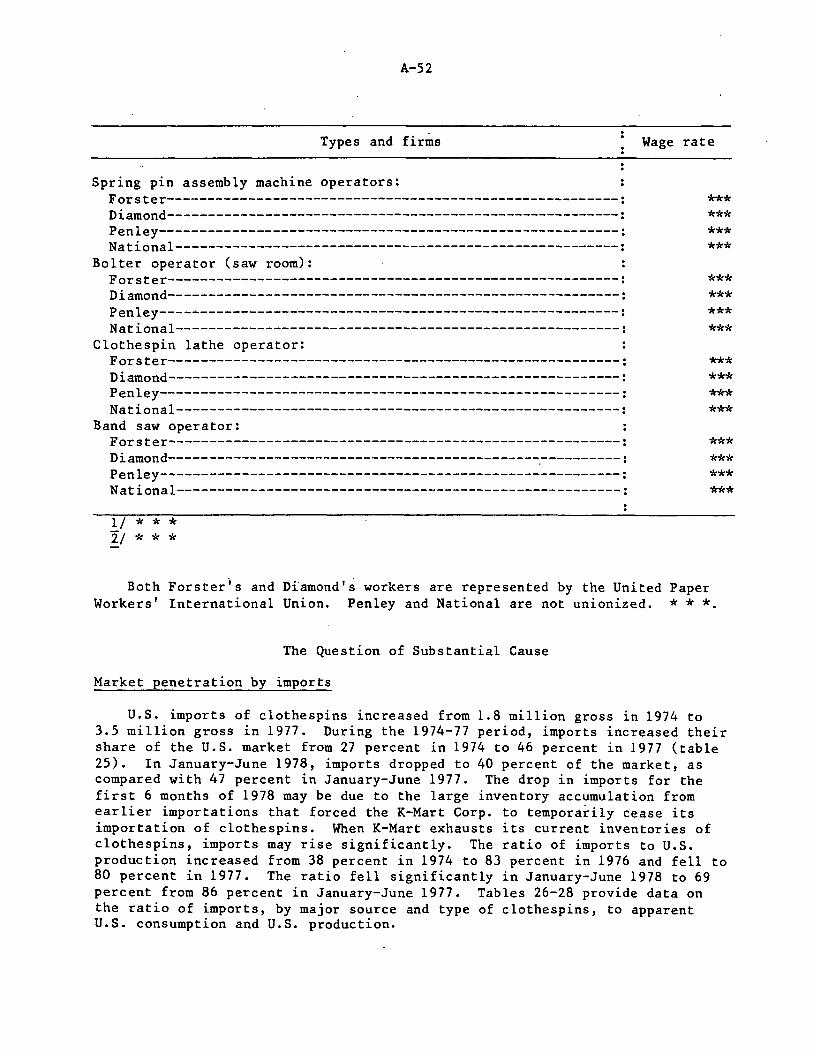
A-52
Types and firms
Spring pin assembly machine operators: Forster--------------------------------------------------------: Diamond--------------------------------------------------------: Penley---------------------------------------------------------: National---------------------~---------------------------------:
Bolter operator (saw room): Forster--------------------------------------------------------: Diamond--------------------------------------------------------: Penley---------------------------------------------------------: National-------------------------------------------------------:
Clothespin lathe operator: Forster--------------------------------------------------------: Diamond--------------------------------------------------------: Penley---------------------------------------------------------: National-------------------------------------------------------:
Band saw operator: Forster--------------------------------------------------------: Diamond----------------------------------------------.----------: Penley---------------------------------------------------------: National-------------------------------------------------------:
1/ * * * 2./ * * *
Wage rate
*** *** *** ***
*** *** *** ***
*** *** *** ***
*** *** *** ***
Both Forsteris and Diamond's workers are represented by the United Paper Workers' International Union. Penley and National are not unionized. * * *
The Question of Substantial Cause
Market penetration by imports
U.S. imports of clothespins increased from 1.8 million gross in 1974 to 3.5 million gross in 1977. During the 1974-77 period, imports increased their share of the U.S. market from 27 percent in 1974 to 46 percent in 1977 (table 25). In January-June 1978, imports dropped to 40 percent of the market, as compared with 47 percent in January-June 1977. The drop in imports for the first 6 months of 1978 may be due to the large inventory accumulation from earlier importations that forced the K-Mart Corp. to temporarily cease its importation of clothespins. When K-Mart exhausts its current inventories of clothespins, imports may rise significantly. The ratio of imports to U.S. production increased from 38 percent in 1974 to 83 percent in 1976 and fell to 80 percent in 1977. The ratio fell significantly in January-June 1978 to 69 percent from 86 percent in January-June 1977. Tables 26-28 provide data on the ratio of imports, by major source and type of clothespins, to apparent U.S. consumption and U.S. production.
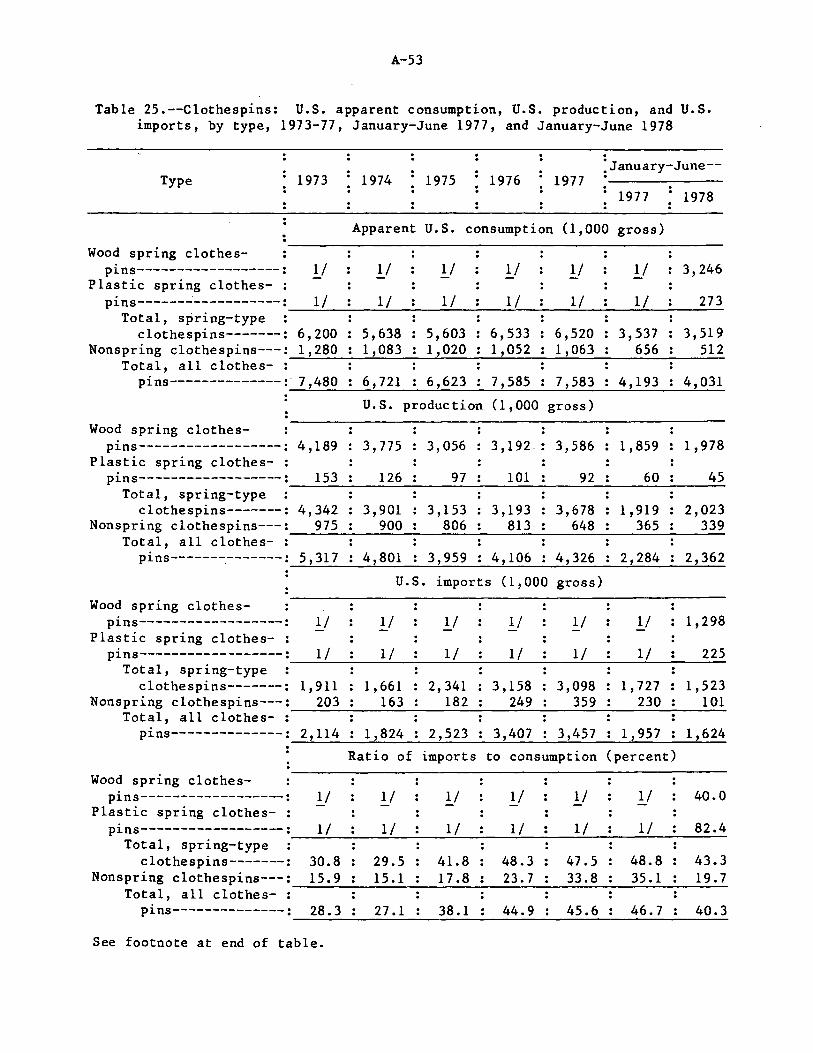
A-53
Table 25.--Clothespins: U.S. apparent consumption, U.S. production, and U.S. imports, by type, 1973-77, January-June 1977, and January-June 1978
. :January-June--. Type 1973 1974 1975 1976 1977 -------
1977 1978
Apparent U.S. consumption (1,000 gross)
Wood spring clothes-pins------------------: 1/ 1/ 1/ 1/ 1/ 1/ 3,246
Plastic spring clothes- : 273 pins------------------: 1/ l/ 1/ 1/ 1/ l/
--'--------''----------'----_;_----'-----~ Total, spring-type 3,537
656 3,519
512 clothespins-------: 6,200 5,638 5,603 6,533 6,520
Nonspring clothespins---: 1,280 1,083 1,020 1,052 1,063 --'-----'-------''--------""-----'---------~ Total, all clothes- :
pins--------------: 7,480 6,721 6,623 7,585 7,583 4,193 4,031 --'-----'-------''--------""-----'----__._---_._~
Wood spring clothespins------------------: 4,189
Plastic spring clothes- :
U.S. production (1,000 gross)
3, 775 3,056 3,192.: 3,586 1,859 1,978
pins------------------: -------------------------~
153 126 97 101 92 60 45 Total, spring-type
clothespins-------: Nonspring clothespins---:
4,342 975
3,901 900
3'153 806
3,193 813
3,678 648
1,919 365
2,023 339
-------------------------~ Total, all clothes- : pins------~-------: 5,317 • 4,801 3,959 4,106 4,326 2,284 2,362
U.S. imports (1,000 gross)
Wood spring clothes-pins------------------: 1/ 1/ 1/ 1/ 1/ l/ 1,298
Plastic spring clothes- : 225 pins------------------: 1/ 1/ 1/ 1/ 1/ 1/
--'-----'-----------'----__;_-------~ Total, spring-type clothespins-------:
Nonspring clothespins---: Total, all clothes- :
1, 911 203
1,661 163
2,341 182
3'158 249
3,098 359
1, 727 230
1,523 101
-------------------------~
pins--------------: 2,114 1,824 2,523 3,407 3,457 1,957 1,624 --'-----'-------''-----~--------~---~~
Ratio of imports to consumption (percent)
Wood spring clothes-pins------------------: 1/ 1/ 1/ 1/ 1/ 1/
1/
40.0 Plastic spring clothes- :
pins------------------: 1/ 1/ 1/ 1/ 1/ --'--------''-------'------'------------~
82.4 Total, spring-type
clothespins-------: Nonspring clothespins---:
Total, all clothes- : pins--------------:
30.8 15.9
29.5 15.1
41.8 17.8
48.3 23.7
47.5 33.8
48.8 35.1
43.3 19.7
-------------------------~
28.3 27.1 38.1 44.9 45.6 46.7 40.3 -------------------------~
See footnote at end of table.
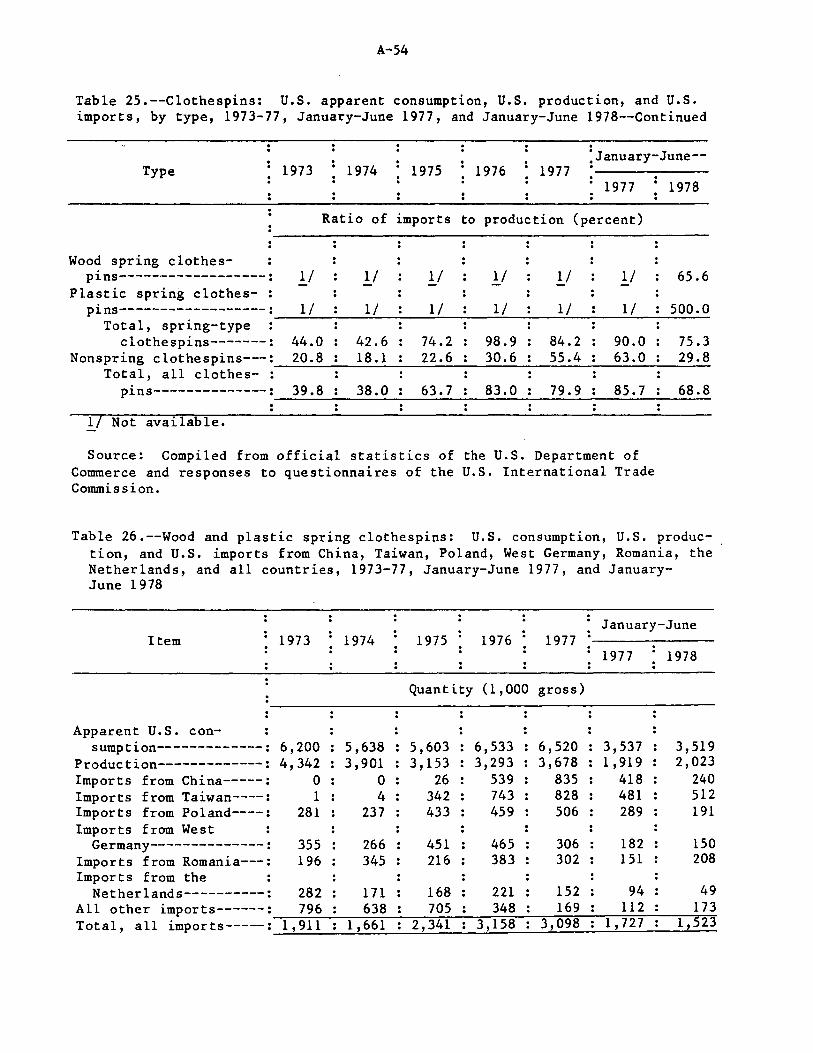
A-54
Table 25.--Clothespins: U.S. apparent consumption, U.S. production, and U.S. imports, by type, 1973-77, January-June 1977, and January-June 1978--Continued
. Type 1973 1974 1975 1976 1977
;January-June--. . 1977 1978 :
Ratio of imports to production (percent)
Wood spring clothes-pins------------------: 1/ 1/ 1/ 1/ l/ 1/ 65.6
Plastic spring clothes- . . pins------------------: 1/ 1/ 1/ 1/ 1/ 1/ 500.0
Total, spring-type clothespins-------: 44.0 42.6 74. 2 98.9 84.2 90.0 75.3
Nonspring clothespins---: 20.8 18.1 22.6 30.6 55.4 63.0 29.8 Total, all clothes- . .
pins--------------: 39.8 38.0 63.7 83.0 79.9 85.7 68.8
1/ Not available.
Source: Compiled from official statistics of the U.S. Department of Commerce and responses to questionnaires of the U.S. International Trade Commission.
Table 26.--Wood and plastic spring clothespins: U.S. consumption, U.S. production, and U.S. imports from China, Taiwan, Poland, West Germany, Romania, the Netherlands, and all countries, 1973-77, January-June 1977, and January-June 1978
January-June Item 1973 1974 1975 1976 1977
1977 1978
Quantity (1,000 gross)
Apparent U.S. con-sumption-------------: 6,200 5,638 5,603 6,533 6,520 3,537 3,519
Production-------------: 4,342 3 ,901 3,153 3,293 3,678 1, 919 2,023 Imports from China-----: 0 0 26 539 835 418 240 Imports from Taiwan----: 1 4 342 743 828 481 512 Imports from Poland----: 281 237 433 459 506 289 191 Imports from West
Germany--------------: 355 266 451 465 306 182 150 Imports from Romania---: 196 345 216 383 302 151 208 Imports from the
Netherlands----------: 282 171 168 221 152 94 49 All other imports------: 796 638 705 348 169 112 173 Total, all imports-----: 1, 911 1,661 2,341 3,158 3,098 1,727 1,523
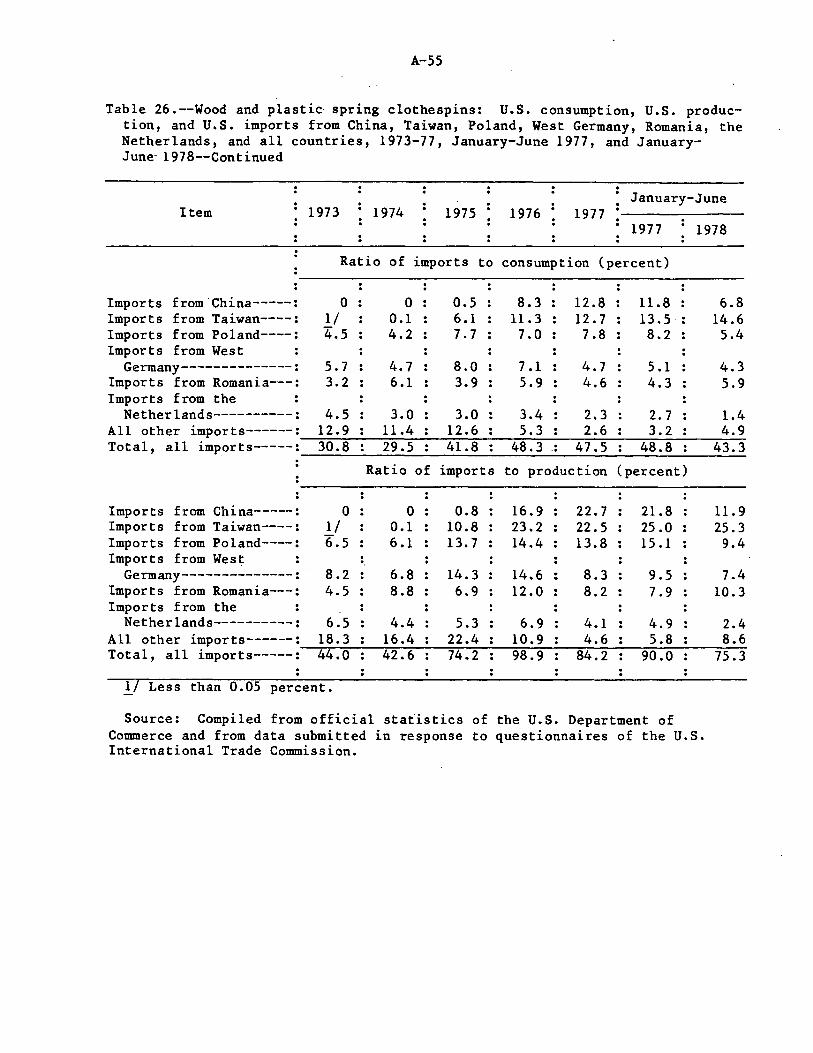
A-55
Table 26.--Wood and plastic spring clothespins: U.S. consumption, U.S. production, and U.S. imports from China, Taiwan, Poland, West Germany, Romania, the Netherlands, and all countries, 1973-77, January-June 1977, and JanuaryJune- 1978--Continued
January-June Item 1973 1974 1975 1976 1977
1977 1978
Imports from.China-----: Imports from Taiwan----: Imports from Poland----: Imports from West
Germany--------------: Imports from Romania---: Imports from the
Ratio of imports to consumption (percent)
0 l/ 4.5
5.7 3.2
0 0.1 4.2
4.7 6 .1
0.5 6 .1 1.1
8.0 3.9
8.3 11.3 7. 0
7.1 5.9
12.8 12.7 7.8
4. 7 4.6
11.8 13.5 8.2
5.1 4.3
6.8 14.6 5.4
4.3 5.9
Netherlands----------: 4.5 3.0 3.0 3.4 2.3 2.7 1.4 All other imports------=~~1_2_.9;;._~_l_l_._4~~-1_2_.6~~~5_._3~~~2-.6~~~3_._2~~~4~.9 Total, all imports-----: 30.8 29.5 41.8 48.3 .: 47.5 48.8 43.3
~~~~~~~~~~~~~~~~~~~~~~~~~~~
Imports from China-----: Imports from Taiwan----: Imports from Poland----: Imports from West
Germany--------------: Imports from Romania---: Imports from the
0 1/ 6.5
8.2 4.5
Ratio of imports to production (percent)
0 0.1 6 .1
6.8 8.8
0.8 10.8 13.7
14.3 6.9
16.9 23.2 14.4
14.6 12.0
22.7 22.5 13.8
8.3 8.2
21.8 25 .o 15.1
9.5 7.9
11. 9 25.3 9.4
7.4 10.3
Netherlands----------: 6.5 4.4 5.3 6.9 4.1 4.9 2.4 All other imports------=~~1~8_.~3~~1~6~·~4=--~~2~2-.4-=--~~1~0~·~9~~..,,...,...4_._6~~~5~·~8~~~~8~.6 Total, all imports-----: 44.0 42.6 74.2 98.9 84.2 90.0 75.3
1/ Less than 0.05 percent.
Source: Compiled from official statistics of the U.S. Department of Couunerce and from data submitted in response to questionnaires of the U.S. International Trade Couunission.
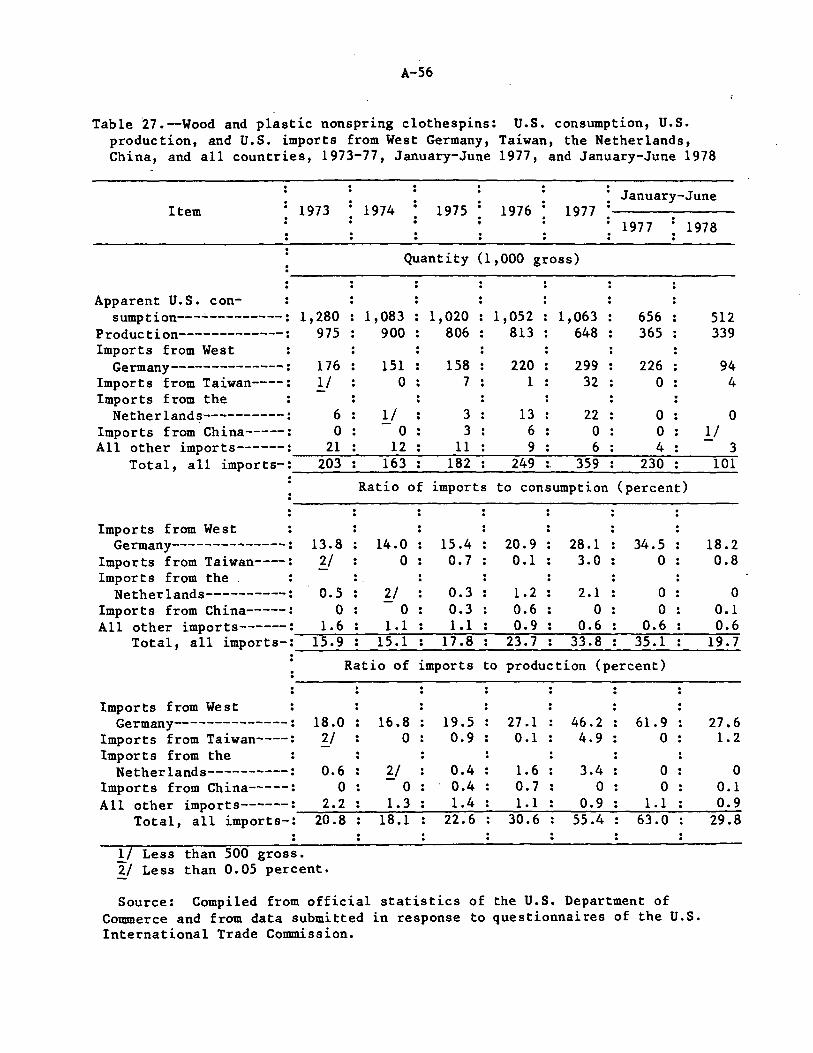
A-56
Table 27.--Wood and plastic nonspring clothespins: U.S. consumption, U.S. production, and U.S. imports from West Germany, Taiwan, the Netherlands, China, and all countries, 1973-77, January-June 1977, and January-June 1978
January-June Item 1973 1974 1975 1976 1977
1977 1978
Apparent U.S. consumption---~---------:
Production-------------: Imports from West
Germany--------------: Imports from Taiwan----: Imports from the
1,280 975
176 1/
Quantity (1,000 gross)
1,083 900
151 0
1,020 806
158 7
1,052 813
220 1
1,063 648
299 32
656 365
226 0
Netherlands----------: 6 1/ 3 13 22 O Imports from China-----: 0 0 3 6 0 0
512 339
1/
94 4
0
All other imports------: 21 12 11 9 6 4 3 ---::--=-::-~---:--:-=------:-::~-----,_-,-=------=-=-=-----~.;...-~----:-~
Total, all imports-: ___ 2_0_3 ______ 1_63 ______ 1_8_2 _____ 2_4_9 __ :. ___ 3_5~9--~ __ 23~0;;_;;__ __ ~1..:..;;.01
Imports from West Germany--------------: 13.8
Imports from Taiwan----: ~/ Imports from the .
Ratio of imports to consumption (percent)
. . . 14.0
0 15.4 0.7
20.9 0.1
28.1 3.0
34.5 0
18.2 0.8
Netherlands----------: 0.5 2/ 0.3 1.2 2.1 0 0 Imports from China-----: 0 0 0.3 0.6 0 0 0.1 All other imports------=--~l_.6,,__ __ .....,._,l~·~l~--~l_.~l--__,~0~·~9,__--.,,....,,..o_.6,,__---,....,o-._6 ______ 0~.6
Total, all imports-: 15.9 15.1 17.8 23.7 33.8 35.1 19.7 ----------------------~------------------------------
Imports from West Germany--------------:
Imports from Taiwan----: Imports from the
18.0 2/
Ratio of imports to production (percent)
16.8 0
19.5 0.9
27.1 0.1
46.2 4.9
61.9 0
27.6 1.2
Netherlands----------: 0.6 2/ 0.4 1.6 3.4 0 0 Imports from China-----: 0 0 0.4 0.7 0 0 0.1 All other imports------: ____ 2_._2 _____ 1~._3 ____ ___,...1_.4~---,....1-·_1------0-.9 ____ --1_._1------0~.9
Total, all imports-: 20.8 18.1 22.6 30.6 55.4 63.0 29.8
1/ Less than 500 gross. 2/ Less than 0.05 percent.
Source: Compiled from official statistics of the U.S. Department of Commerce and from data submitted in response to questionnaires of the U.S. International Trade Commission.
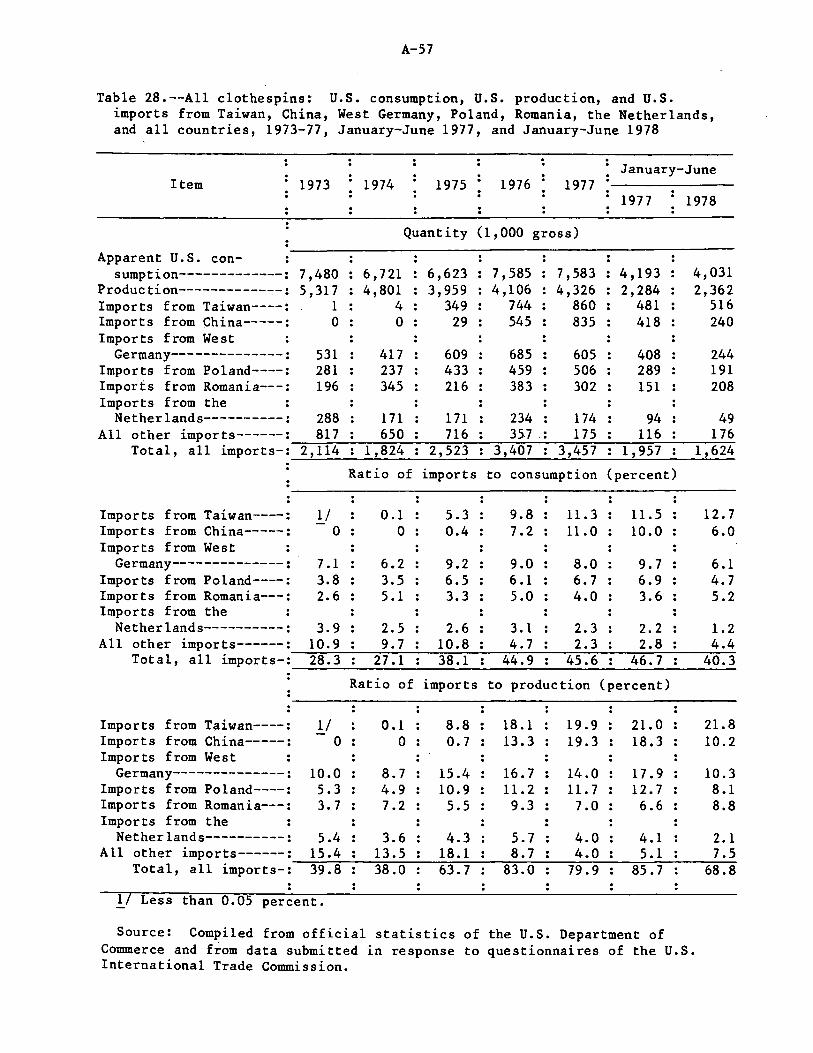
A-57
Table 28.--All clothespins: U.S. consumption, U.S. production, and U.S. imports from Taiwan, China, West Germany, Poland, Romania, the Netherlands, and all countries, 1973-77, January-June 1977, and January-June 1978
Item
Apparent U.S. con-sumption-------------:
Production-------------: Imports from Taiwan----: Imports from China-----: Imports from West
Germany--------------: Imports from Poland----: Imports from Romania---: Imports from the
1973
7 ,480 5,317
1 0
531 281 196
1974
6 '721 4,801
4 0
417 237 345
1975 1976 1977
Quantity (1,000 gross)
6,623 3,959
349 29
609 433 216
7,585 4,106
744 545
685 459 383
7,583 4,326
860 835
605 506 302
January-June
1977 1978
4' 193 2,284
481 418
408 289 151
4,031 2,362
516 240
244 191 208
Netherlands----------: 288 171 171 234 174 94 49 All other imports------: 817 650 716 357 .: 175 116 176
-.,..---.,.-~~-:---=-,,..-:-~-:-"""'::'""".~~~~-=-~=----=-~,.--~=-~--:--:-,....,...
Total, all imports-: 2,114 1,824 2,523 3,407 : 3,457 1,957 1,624 ~-'-~~~'--~~---''--~~----'-~~~-'-~~~-'-~~~---''--~
Imports from Taiwan----: Imports from China-----: Imports from West
Germany--------------: Imports from Poland----: Imports from Romania---: Imports from the
1/ 0
7.1 3.8 2.6
Ratio of imports to consumption (percent)
0.1 0
6.2 3.5 5.1
5.3 0.4
9.2 6.5 3.3
9.8 7.2
9.0 6.1 5.0
11. 3 11.0
8.0 6.7 4.0
11.5 10.0
9.7 6.9 3.6
12.7 6.0
6 .1 4. 7 5.2
Netherlands----------: 3.9 2.5 2.6 3.1 2.3 2.2 1.2 All other imports------: 10.9 9.7 10.8 4.7 2.3 2.8 4.4
~--.,,-=-~~---~~~-..,....~~--,,...,---:-~-..,.--~~~~=-~~.,--~
Total, all imports-: 28.3 27.1 38.1 44.9 45.6 46.7 40.3 -..,....~~~~~~~~~~~~~~~~~~~~-..,....-..,....~~-..,....~
Imports from Taiwan----: Imports from China-----: Imports from West
Germany--------------: Imports from Poland----: Imports from Romania---: Imports from the
1/ 0
10.0 5.3 3.7
Ratio of imports to production (percent)
0 .1 0
8.7 4.9 7.2
8.8 0.7
15.4 10.9 5.5
18.1 13.3
16.7 11.2 9.3
19.9 19.3
14.0 11. 7 7.0
21.0 18.3
17.9 12.7 6.6
21.8 10.2
10.3 8 .1 8.8
Netherlands----------: 5.4 3.6 4.3 5.7 4.0 4.1 2.1 All other imports------: 15.4 13.5 18.1 8.7 4.0 5.1 7.5
~~---o-~~---~~~-.,.-~~--,'"'-=-"~~~~~~~-..,....~-..,....~~~
Total, all imports-: 39.8 38.0 63.7 83.0 79.9 85.7 68.8
1/ Less than 0.05 percent.
Source: Compiled from official statistics of the U.S. Department of Commerce and from data submitted in response to questionnaires of the U.S. International Trade Commission.
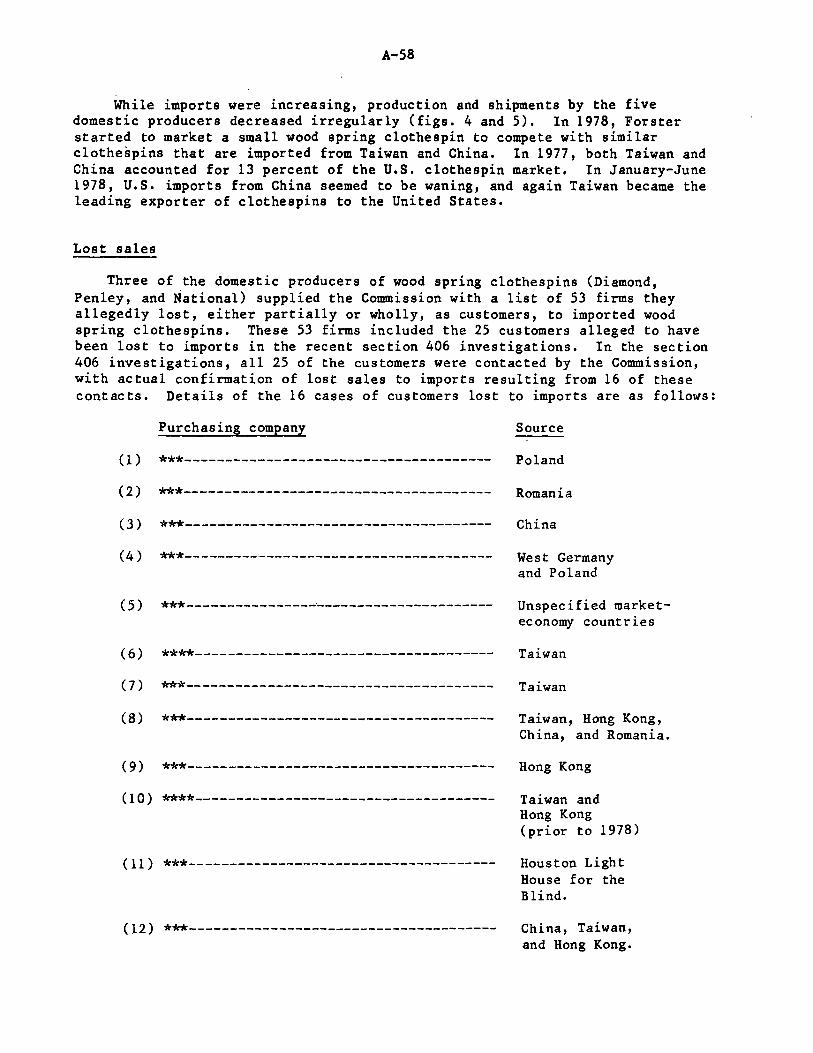
A-58
While imports were increasing, production and shipments by the five domestic producers decreased irregularly (figs. 4 and 5). In 1978, Forster started to market a small wood spring clothespin to compete with similar clothespins that are imported from Taiwan and China. In 1977, both Taiwan and China accounted for 13 percent of the U.S. clothespin market. In January-June 1978, U.S. imports from China seemed to be waning, and again Taiwan became the leading exporter of clothespins to the United States.
Lost sales
Three of the domestic producers of wood spring clothespins (Diamond, Penley, and National) supplied the Commission with a list of 53 firms they allegedly lost, either partially or wholly, as customers, to imported wood spring clothespins. These 53 firms included the 25 customers alleged to have been lost to imports in the recent section 406 investigations. In the section 406 investigations, all 25 of the customers were contacted by the Commission, with actual confirmation of lost sales to imports resulting from 16 of these contacts. Details of the 16 cases of customers lost to imports are as follows:
Purchasing company Source
(1) ***-------------------------------------- Poland
(2) ***-------------------------------------- Romania
(3) ***-------------------------------------- China
(4) ***-------------------------------------- West Germany and Poland
(5) ***----------------~--------------------- Unspecified marketeconomy countries
(6) ****-------------------------------------(7) ***--------------------------------------(8) ***--------------------------------------
(9) ***--------------------------------------(10) ****-------------------------------------
(11) ***--------------------------------------
(12) ***--------------------------------------
Taiwan
Taiwan
Taiwan, Hong Kong, China, and Romania.
Hong Kong
Taiwan and Hong Kong (prior to 1978)
Houston Light House for the Blind.
China, Taiwan, and Hong Kong.
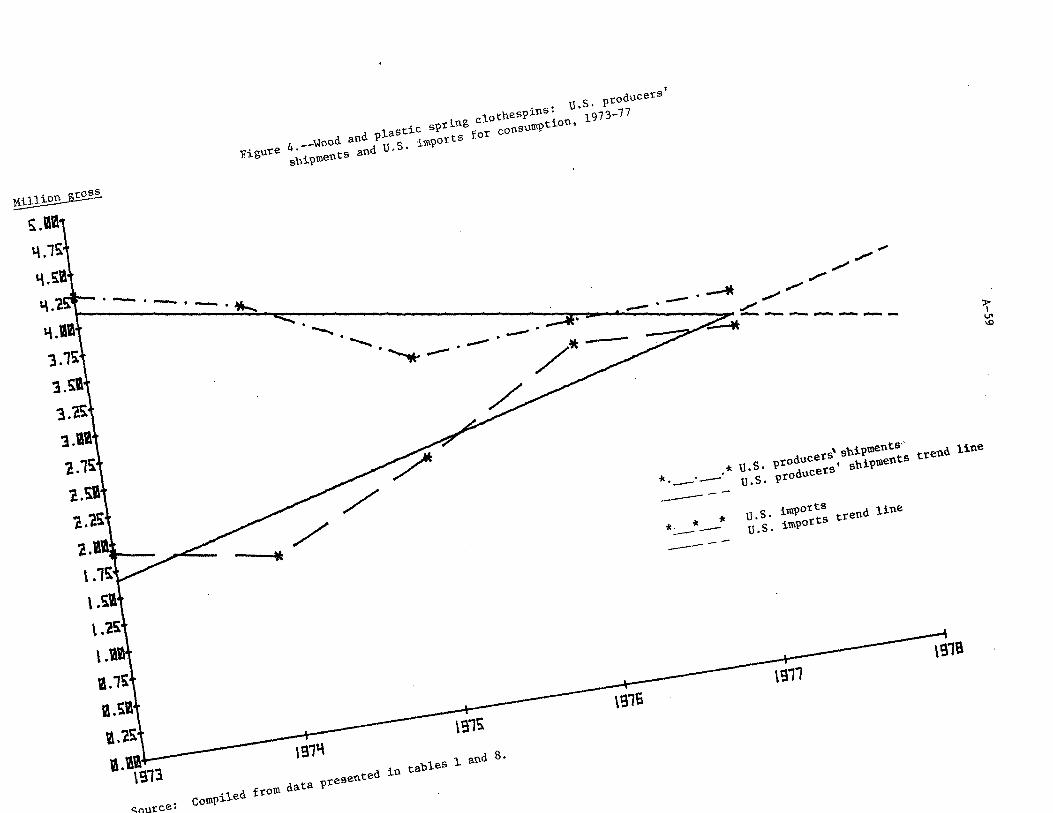
~~ s.I~·
"\ .1'i
~.S:I ... · ·-
;igu<• 4.--~ood and plastic sp<\ng clothespins; u.s. p<oduce<•' sl,iP""" cs and U. S . impo<' s fo< co••""" t io•, 19 73-71
·----·~ . 1.1'i ...._ .
-...... . d • --·--· :i.s.. .........,.-- . *- ----
:i.?S /
ti;" V'
'°
].ii·
2.1'i·
2.SI· 1.l'i·
? • • • • • U. S • p<oduce<•' shipments" ~ ~ u.s. p<oduce<•' shiP"""ts t<end tin• ----/ ic. "' .,. ----
u.s. imports u.s. imports trend line ----t.&5:
Lili i.1'i
1.'il ~·~i-------------1r--------------:~----------~-::---------~~----------~ 1l.l\S13 \91'1 \915. \916 \9Tl \9111
sou<c•' compiled f<om dat• p<eaented i• table• 1 •"" s.
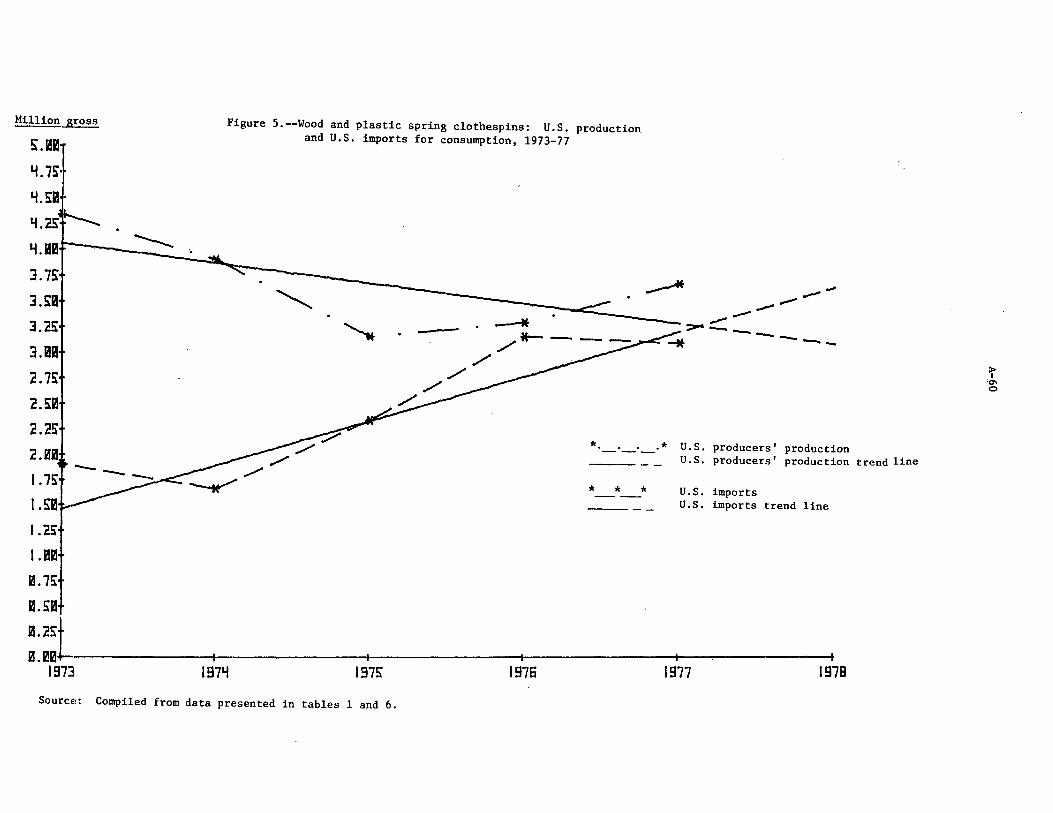
Figure 5.--Wood and plastic spring clothespins: U.S. production and U.S. imports for consumption, 1973-77
"--.. -
* . . .* U.S. producers' production ~ ~~ U.S. producers' production trend line
* * * U.S. imports U.S. imports trend line
.----------- - r---------- -- --------. ~- --- '
1971i 197~ 1976 1977 1978
Source!: Compiled from data presented in tables 1 and 6.
7" '"' 0
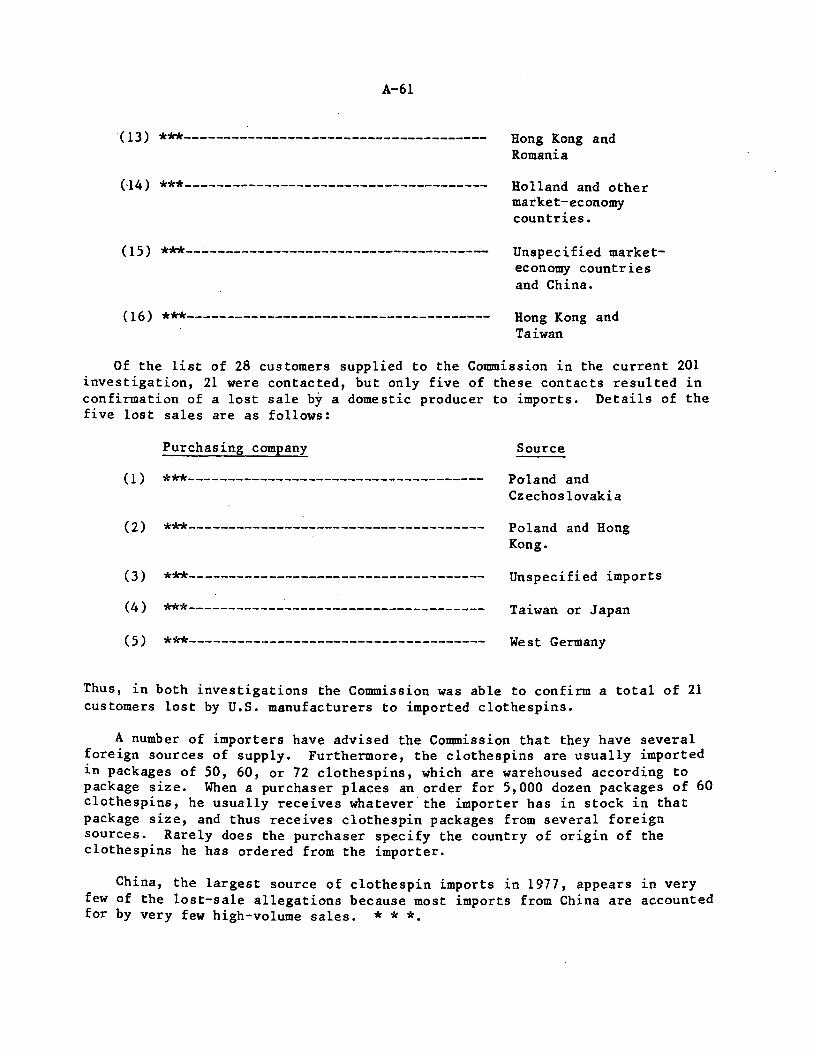
A-61
(13) ***-------------------------------------- Hong Kong and Romania
(-14) ***-------------------------------------- Holland and other market-economy countries.
(15) ***--~----------------------------------- Unspecified marketeconomy countries
(16) ***--------------------------------------
and China.
Hong Kong and Taiwan
Of the list of 28 customers supplied to the Commission in the current 201 investigation, 21 were contacted, but only five of these contacts resulted in confirmation of a lost sale by a domestic producer to imports. Details of the five lost sales are as follows:
Purchasing company
(1) ***-------------------------------------
(2) ***-------------------------------------
(3) ***-------------------------------------(4) ***-------------------------------------(5) ***-------------------------------------
Source
Paland and Czechoslovakia
Poland and Hong Kong.
Unspecified imports
Taiwan or Japan
West Germany
Thus, in both investigations the Commission was able to confirm a total of 21 customers lost by U.S. manufacturers to imported clothespins.
A number of importers have advised the Commission that they have several foreign sources of supply. Furthermore, the clothespins are usually imported in packages of 50, 60, or 72 clothespins, which are warehoused according to package size. When a purchaser places an order for 5,000 dozen packages of 60 clothespins, he usually receives whatever the importer has in stock in that package size, and thus receives clothespin packages from several foreign sources. Rarely does the purchaser specify the country of origin of the clothespins he has ordered from the importer.
China, the largest source of clothespin imports in 1977, appears in very few of the lost-sale allegations because most imports from China are accounted for by very few high-volume sales. * * *

A-62
Efforts to compete with imports
In late 1977, Forster Manufacturing Co. started production of a "down sized" wood spring clothespin. This smaller clothespin was expected to accomplish two objectives. First, the smaller clothespin would compete head-on with the small wood spring clothespins from China, Taiwan, and Hong Kong, which had captured over one-half of total U.S. imports of clothespins in 1977 and January-June 1978. Second, the anticipated increase in production and sales of the smaller clothespin would help Forster to run extra shifts at its plants, thus lowering fixed overhead costs per unit of output for all clothespin operations. The following chart shows the physical differences between Forster's two clothespin types:
Full sized wood spring clothespins
Length-----------Width------------Number of
spring coil----Gage of the wire--
3 1/4 inches 3/8 of an inch
4 coil 15 gage wire
Small wood spring clothespins
2 7/8 inches 11/32 of an inch
4 coil 16 gage wire
Since the small clothespin uses less wood and wire then the regular clothespin, it is less expensive to produce than a full sized clothespin. As a result, it can be offered for sale at a lower price than the full sized clothespin. The results of Forster's entry into the small clothespin market have been mixed. The small clothespins have been offered for sale at delivered prices which are*** to*** cents less per gross than Forster's regular sized clothespins; * * *r
* * * * * * *
Table 29 compares Forster's production, capacity, shipments, inventories, and financial situation with respect to the two types of wood spring clothespins.
It is possible that some of Forster's sales of small wood spring clothespins have been made at the expense of Forster's regular size clothespins or the clothespins manufactured by other U.S. producers. * * *, however, which formerly purchased * * * imported clothespins, made a purchase of * * * of small Forster clothespins early in 1978. The * * * purchase was valued at * * *·
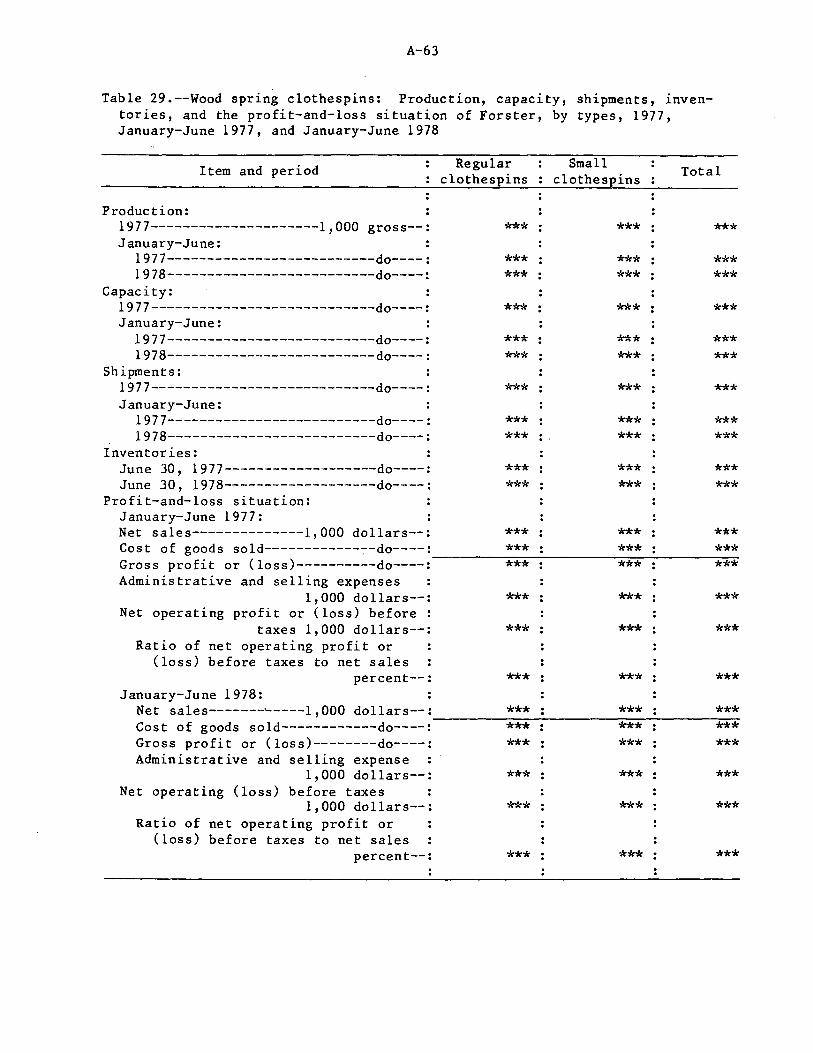
A-63
Table 29.--Wood spring clothespins: Production, capacity, shipments, inventories, and the profit-and-loss situation of Forster, by types, 1977, January-June 1977, and January-June 1978
Item and period Regular Small Total clothespins clothespins
Production: 1977---------------------1,000 gross--: January-June:
1977--------------------------do----: 1978--------------------------do----:
Capacity: 1977----------------------------do----: January-June:
1977--------------------------do----: 1978--------------------------do----:
Shipments: 1977----------------------------do----: January-June:
1977--------------------------do----: 1978--------------------------do----:
Inventories: June 30, 1977-------------------do----: June 30, 1978-------------------do----:
Profit-and-loss situation: January-June 1977: Net sales--------------1,000 dollars--: Cost of goods sold------------~-do----: Gross profit or (loss)----------do----: Administrative and selling expenses
1, 000 dollars--: Net operating profit or (loss) before :
taxes 1,000 dollars--: Ratio of net operating profit or
(loss) before taxes to net sales percent--:
January-June 1978:
***
*** ***
***
*** ***
***
*** ***
*** ***
*** *** ***
***
***
***
*** ***
*** *** *** ***
*** ***
*** *** *** ***
*** ***
*** *** . *** ***
*** *** *** ***
*** *** *** *** *** ***
*** ***
*** ***
*** ***
Net sales-------~----1,000 dollars--: *** *** *** ~~~~~~~~~~~~~~~~~~~~~
Cost of goods sold------------do----: *** *** *** Gross profit or (loss)--------do----: *** *** *** Administrative and selling expense
1, 000 dollars--: Net operating (loss) before taxes
1, 000 dollars--: Ratio of net operating profit or
(loss) before taxes to net sales percent--:
*** *** ***
*** *** ***
*** *** ***

A-64
A-65
APPENDIX A
U.S. INTERNATIONAL ThADE COMMISSION NOTICE OF INVESTIGATION AND ~ING
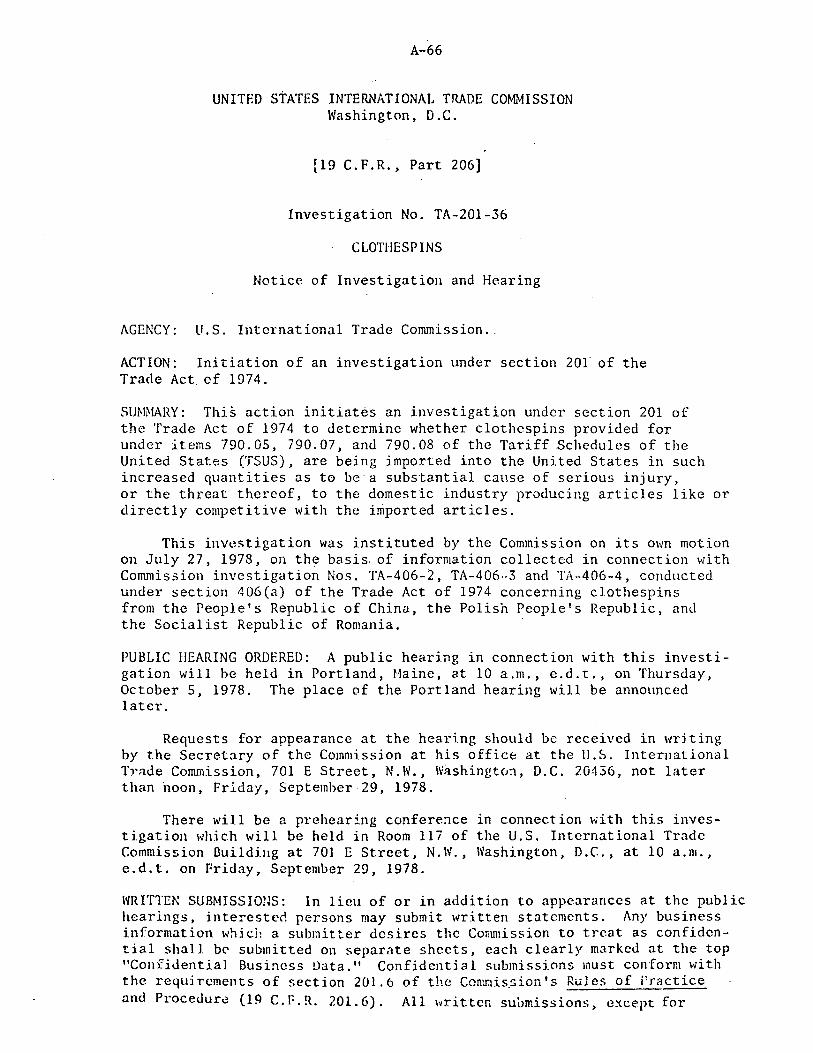
A-66
UNITED STATES INTERNATIONAL TRADE COMMISSION Washington, D.C.
[19 C.F.R., Part 206)
Investigation No. TA-201-36
CLOTHESPINS
Notice of Investigation and Hearing
AGENCY: ll.S. International Trade Commission ..
ACTION: Initiation of an investigation under section 20f of the Trade Act of 1974.
SUMMARY: This action initiates an investigation under section 201 of the Trade Act of 1974 to determine whether clothespins provided for under items 790.05, 790.07, and 790.08 of the Tariff Schedules of the United States (TSUS), are being imported into the United States in such increased quantities as to be a substantial cause of serious injury, or the threat thereof, to the domestic industry producing articles like or directly competitive with the imported articles.
This investigation was instituted by the Commission on its own motion on July 27, 1978, on the basis. of information collected in connection with Commission investigation Nos. TA-406-2, TA-406·-3 and TA-406-4, conducted under section 406(a) of the Trade Act of 1974 concerning clothespins from the People's Republic of China, the Polish People's Republic, and the Socialist Republic of Romania. ·
PUBLIC HEARING ORDERED: A public hearing in connection with this investigation will be held in Portland, Maine, at 10 a.m., e.d.t., on Thursday, October 5, 1978. The place of the Portland hearing will be announced later.
Requests for appearance at the hearing should be received in wrJt1ng by the Secretary of the Commission at his office at the U.S. International Trade Commission, 701 E Street, N.W., Wilshington, D.C. 20436, not later than noon, Friday, September 29, 1978.
There will be a prehearing confere~ce in connection with this investigation which will be held in Room 117 of the U.S. International Trade Commission Building at 701 E Street, N.W., Washington, D.C., at 10 a.m., e.d.t. on Friday, September 29, 1978.
WRITTEN SUBMISSIOtJS: In 1 ieu of or in addition to appearances at the public l1earlngs, intercstcrl persons may submit written statements. Any business information which a sub1:iitter desires the Commission to treat as confidential shall b~ submitted on separate sheets, each clearly marked at the top "Confidential Business Data." Confidential submissions must conform with the requi rcments of section 201, 6 of the C0Ir.r.1is_sion 's Rules of Practice and Procedure (19 C.F.R. 201.6). All hrittcn su~missions, except for
A-67
confidcmtial business data, will be made available for inspection by interested persons. To be assured of consideration by the O:>mmission, written statements should be submitted at the earliest practicable date, but no later than October 16, 1978. All submissions should be addressed to the Secretary at the Commission's office in Washington, D.C.
EFFECTIVE DATE: This investigation will be instituted on the date ordered by the Commission.
FOR FURTHER INFORMATION CONTACT: Mr. William Schechter, Office of Investigations, U.S. International Trade Conunission (202-523-0300).
By order of the Commission: // d · J . ~/ 'f./7- -· ---·· -
-- --~~NE'f~-; .MASON Secretary
Issued: July 31 , l 9 7 8

A-68
A-69
APPENDIX B
TEXT OF OCTOBER 2, 1978, MESSAGE OF THE PRESIDENT TO THE CONGRESS ON CLOTHESPINS FROM THE PEOPLES REPUBLIC OF CHINA
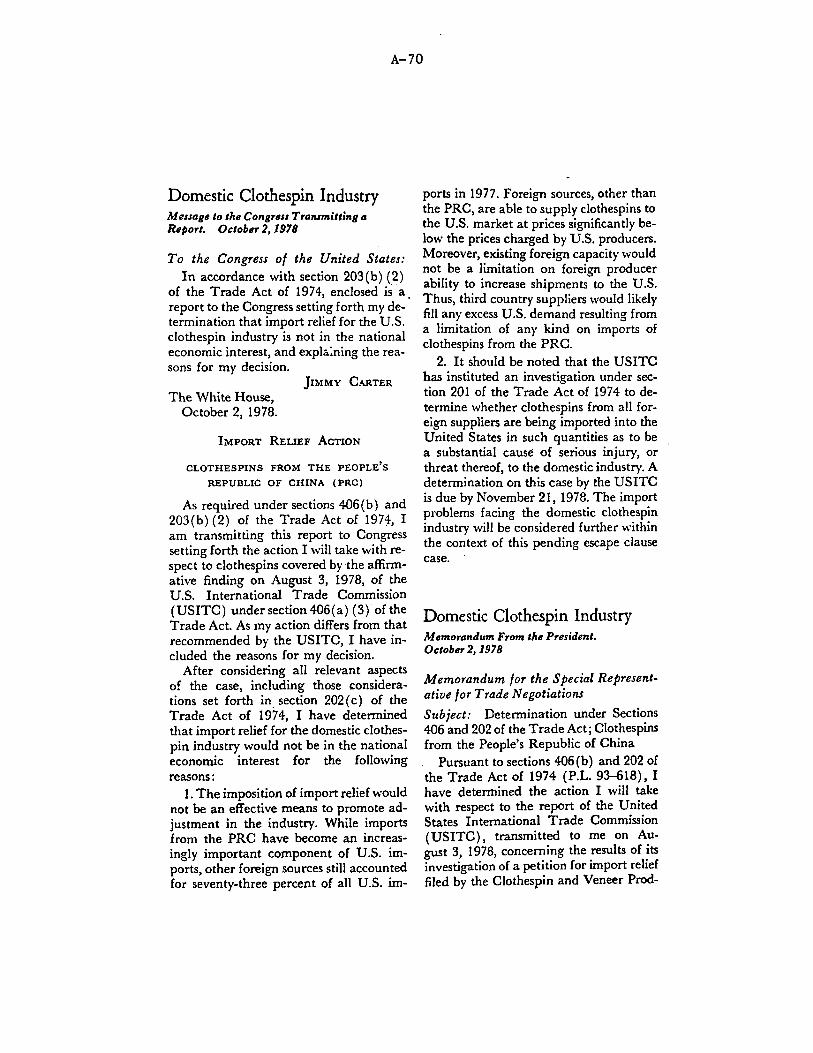
A-70
Domestic Clothespin Industry Message to the Congress Transmitting a Report. October 2, 1978
To the Congress of the United States: In accordance with section 203(b) (2)
of the Trade Act of 1974, enclosed is ·a report to the Congress setting forth my de-· termination that import relief for the U.S. clothespin industry is not in the national economic interest, and expla:ning the reasons for my decision.
The White House, October 2, 1978.
JIMMY CARTER
IMPORT RELIEF ACTION
CLOTHESPINS FROM THE PEOPLE'S
REPUBLIC OF CHINA (PRC)
As required under sections 406(b) and 203 (b) (2) of the Trade Act of 197'.I-, I am transmitting this report to Congress setting forth the action I will take with respect to clothespins covered by ·the affirmative finding on August 3, 1978, of the U.S. International Trade Commission (USITC) under section 406(a) (3) of the Trade Act. As my action differs from that recommended by the USITC, I have included the reasons for my decision.
After considering all relevant aspects of the case, including those considerations set forth in, section 202 ( c) of the Trade Act of 1974, I have determined that import relief for the domestic clothespin industry would not be in the national economic interest for the following reasons:
1. The imposition of import relief would not be an effective means to promote adjustment in the industry. While imports from the PRC have become an increasingly important component of U.S. imports, other foreign sources still accounted for seventy-three percent of all U.S. im-
ports in 1977. Foreign sources, other than the PRC, are able to supply clothespins to the U.S. market at prices significantly below the prices charged by U.S. producers. Moreover, existing foreign capacity would not be a limitation on foreign producer ability to increase shipments to the U.S. Thus, third country suppliers would likely fill any excess U.S. demand resulting from a limitation of any kind on imports of clothespins from the PRC.
2. It should be noted that the USITC has instituted an investigation under section 201 of the Trade Act of 1974 to determine whether clothespins from all foreign suppliers are being imported into the United States in such quantities as to be a substantial cause of serious injury, or threat thereof, to the domestic industry. A determination on this case by the USITC is due by November 21, 1978. The import problems facing the domestic clothespin industry will be considered further within the context of this pending escape clause case.
Domestic Clothespin Industry Memorandum From the President. October 2, 1978
Memorandum for the Special Representative for Trade Negotiations
Subject: Determination under Sections 406 and 202 of the Trade Act; Clothespins from the People's Republic of China
Pursuant to sections 406(b) and 202 of the Trade Act of 1974 (P.L. 9~18), I have determined the action I will take with respect to the report of the United States International Trade Commission (USITC), transmitted to me on August 3, 1978, concerning the results of its investigation of a petition for import relief filed by the Clothespin and Veneer Prod-
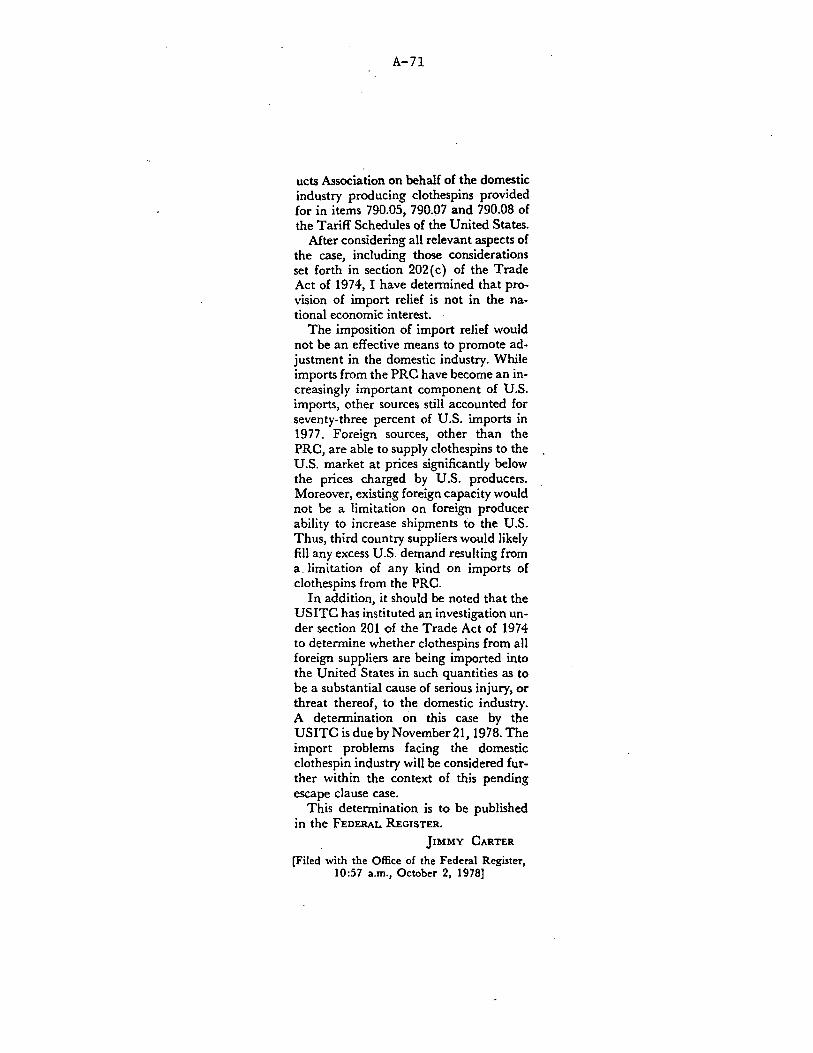
A-71
ucts Association on behalf of the domestic industry producing clothespins provided for in items 790.05, 790.07 and 790.08 of the Tariff Schedules of the United States.
After considering all relevant aspects of the case, including those considerations set forth in section 202 ( c) of the Trade Act of 1974, I have determined that provision of import relief is not in the national economic interest.
The imposition of import relief would not be an effective means to promote adjustment in the domestic industry. While imports from the PRC have become an increasingly important component of U.S. imports, other sources still accounted for seventy-three percent of U.S. imports in 1977. Foreign sources, other than the PRC, are able to supply clothespins to the U.S. market at prices significantly below the prices charged by U.S. producers. Moreover, existing foreign capacity would not be a limitation on foreign producer ability to increase shipments to the U.S. Thus, third country suppliers would likely fill any excess U.S. demand resulting from a limitation of any kind on imports of clothespins from the PRC.
In addition, it should be noted that the USITC has instituted an investigation under section 201 of the Trade Act of 1974 to determine whether clothespins from all foreign suppliers are being imported into the United States in such quantities as to be a substantial cause of serious injury, or threat thereof, to the domestic industry. A determination on this case by the USITC is due by November21, 1978. The import problems facing the domestic clothespin industry will be considered further within the context of this pending escape clause case.
This determination is to be published in the FEDERAL REGISTER.
JIMMY CARTER
[Filed with the Office of the Federal Register, 10:57 a.m., October 2, 1978)

A-72
A-73
APPENDIX C
PROBABLE ECONOMIC EFFECTS OF TARIFF CHANGES UNDER TITLE I AND TITLE V OF THE TRADE ACT OF 1974 FOR TRADE AGREEMENT DIGEST NO. 70236, JULY 1975

A-74
* * * * * * *
Library Cataloging Data
U.S. International Trade Commission. Clothespins. Report to the President
on investigation no. TA-201-36 under section 201 of the Trade act of 1974. Washington, 1978.
11, A 73 p. illus. 28 cm. (USITC Publication 933)
1. Clothespins.
UNITED STATES
INTERNATIONAL TRADE COMMISSION WASHINGTON. D.C. 20436
OFFICIAL BUSINESS
ADDRESS CORRECTION 'REQUESTED
ADDRESS CHANGE O Remove from List O Change as Shown
Please detach address label and mail to address shown above.
Postage And Fees Paid U.S. International Trade Commission
~ ......