coastal hazards technical report
TRANSCRIPT

Department of Premier and Cabinet
Mitigating Natural Hazards
through Land Use Planning and Building
Control
Coastal Hazards Technical Report
1 December 2016


Contents
Glossary of terms and acronyms..................................................................................................................................................................... 1
Executive Summary ............................................................................................................................................................................................... 5
Access to the coastal inundation and erosion mapping ..................................................................................................... 5
1 Introduction .................................................................................................................................................................................................... 7
1.1 Background ............................................................................................................................................................ 7
1.2 Purpose and scope ................................................................................................................................................ 7
1.3 Report structure .................................................................................................................................................... 8
2 Coastal hazards in Tasmania .................................................................................................................................................................. 9
2.1 What are coastal hazards? .................................................................................................................................... 9 2.1.1 What is coastal erosion? ................................................................................................................................... 9 2.1.2 What is coastal inundation? ............................................................................................................................ 10 2.1.3 Sea level rise planning allowance .................................................................................................................... 10 2.1.4 Coastal hazard exposure in Tasmania ............................................................................................................. 11
3 Regulatory and policy context ............................................................................................................................................................ 12
3.1 Resource management and planning system ...................................................................................................... 12
3.2 State Coastal Policy 1996 ..................................................................................................................................... 12
3.3 Regional strategies and planning ......................................................................................................................... 13
3.4 Local government planning ................................................................................................................................. 14 3.4.1 Pre interim planning schemes ......................................................................................................................... 14 3.4.2 Interim planning schemes ............................................................................................................................... 15 3.4.3 Tasmanian Planning Scheme ........................................................................................................................... 16
3.5 Building Act 2000 ................................................................................................................................................. 16
3.6 How other states have responded to coastal hazards ........................................................................................ 18
4 Methodology ............................................................................................................................................................................................... 20
4.1 The MNHLUP Framework .................................................................................................................................... 20
4.2 Hazard treatment approach ................................................................................................................................ 23
5 Assessment of public risk and coastal hazards ............................................................................................................................ 24
5.1 Nature of public risk ............................................................................................................................................ 24
5.2 Public risk: development types ............................................................................................................................ 26
5.3 Assessment of public risk..................................................................................................................................... 27
6 Coastal erosion hazard assessment ................................................................................................................................................. 31
6.1 Understanding coastal erosion planning bands evidence: identifying the hazard .............................................. 31

6.1.1 Soft sediment category ................................................................................................................................... 32 6.1.2 Soft-rock category ........................................................................................................................................... 33 6.1.3 Hard-rock shoreline category .......................................................................................................................... 33 6.1.4 Defining the Coastal Erosion Mapping Components ...................................................................................... 34
6.2 Defining coastal erosion hazard planning bands: analysing the hazard .............................................................. 36 6.2.1 Pairwise assessment........................................................................................................................................ 36 6.2.2 Coastal Erosion Hazard Bands ......................................................................................................................... 39 6.2.3 Coastal erosion investigation area .................................................................................................................. 42 6.2.4 Analysis of the coastal erosion planning boundaries ...................................................................................... 43
6.3 Coastal erosion hazard planning matrix – evaluation and treatment of hazard ................................................. 45 6.3.1 Coastal erosion – high hazard band ................................................................................................................ 46 6.3.2 Coastal erosion – medium hazard band .......................................................................................................... 49 6.3.3 Coastal erosion – low hazard band ................................................................................................................. 50 6.3.4 Coastal erosion – acceptable hazard band ...................................................................................................... 52 6.3.5 Coastal erosion - investigation area ................................................................................................................ 52
7 Coastal Inundation Hazard Assessment ........................................................................................................................................ 54
7.1 Understanding coastal inundation planning bands evidence: identifying the hazard ........................................ 54 7.1.1 Storm surge and tides ..................................................................................................................................... 54 7.1.2 Sea level rise planning allowance .................................................................................................................... 56 7.1.3 Contributing factors not considered in this study ........................................................................................... 56 7.1.4 Digital Elevation Model ................................................................................................................................... 57
7.2 Defining coastal inundation hazard planning bands: analysing the hazard ........................................................ 58 7.2.1 Coastal Inundation Hazard Bands ................................................................................................................... 59 7.2.2 Analysis of the coastal inundation planning boundaries ................................................................................ 61
7.3 Coastal inundation hazard planning matrix – evaluation and treatment of hazard ............................................ 63 7.3.1 Coastal Inundation High hazard Band ............................................................................................................. 64 7.3.2 Coastal Inundation Medium Hazard Band ...................................................................................................... 66 7.3.3 Coastal Inundation Low Hazard Band ............................................................................................................. 68 6.3.6 Coastal inundation – acceptable hazard band ................................................................................................ 70 6.3.7 Coastal inundation - investigation area .......................................................................................................... 70
8 List of Appendices .................................................................................................................................................................................... 73
Appendix 1: Summary of workshops and consultations .................................................................................................................. 74
Appendix 2: Australian Hydrological Office port summaries ......................................................................................................... 83
Appendix 3: Summary of pre-reform planning controls .................................................................................................................. 87
Appendix 4: Coastal erosion pairwise assessment .............................................................................................................................. 90
Appendix 5: Method to calculate indicator values .............................................................................................................................. 91
Appendix 6: State & LGA indicators – coastal erosion .................................................................................................................... 97
Appendix 7: State & LGA indicators – coastal inundation ........................................................................................................... 104
Appendix 8: High hazard hotspots – inundation & erosion ........................................................................................................ 111
Appendix 9: Coastal inundation hazard band levels* ..................................................................................................................... 115
References ........................................................................................................................................................................................................... 123

Tables
TABLE 1 COASTAL HAZARDS OUTCOMES (STATE COASTAL POLICY, 1996) 13 TABLE 2 MINIMUM FLOOR LEVELS – BUILDING REGULATIONS 2014 17 TABLE 3 ASSESSMENT CRITERIA (BASED ON NERAG) 28 TABLE 4 COASTAL EROSION MAPPING COMPONENTS (ADAPTED FROM SHARPLES ET AL 2013) 35 TABLE 5 COASTAL EROSION COMPONENTS WITH A NATURAL ORDER 37 TABLE 6 EXTRACT OF THE PAIRWISE ASSESSMENT 37 TABLE 7 RESULTS OF THE PAIRWISE ASSESSMENT 38 TABLE 8 COASTAL EROSION COMPONENTS AND HAZARD BANDS 41 TABLE 9 DEFINITION OF COASTAL EROSION HAZARD BANDS 42 TABLE 10 NOTES FOR VULNERABLE, HAZARDOUS OR CRITICAL USES, COASTAL DEFENCES 53 TABLE 11 COMPARISON OF BUILDING REGULATION FLOOR LEVELS AND PROPOSED FLOOR LEVELS 61 TABLE 12 NOTES FOR VULNERABLE, HAZARDOUS OR CRITICAL USES, COASTAL DEFENCES 72
Figures
FIGURE 1 PRE INTERIM PLANNING SCHEME RESPONSE TO COASTAL HAZARDS 15 FIGURE 2 STATE FRAMEWORK FOR THE MITIGATION OF THE IMPACTS OF NATURAL HAZARDS THROUGH LAND USE PLANNING 22 FIGURE 3 THE RISK MANAGEMENT PROCESS (ADAPTED FROM EMERGENCY MANAGEMENT AUSTRALIA 2004) 23 FIGURE 4 PUBLIC POLICY INSTRUMENTS TO MANAGE RISK FROM NATURAL HAZARDS 25 FIGURE 5 SOFT SEDIMENT BODIES ON THE TASMANIAN COAST 32 FIGURE 6 MODEL TO CALCULATE ERODIBLE ENVELOPES IN SOFT SEDIMENTS (FROM SHARPLES ET AL 2013) 32 FIGURE 7 COASTAL ‘SOFT-ROCK’ BODIES ON THE TASMANIAN COAST 33 FIGURE 8 HARD-ROCK SHORELINES DEFINED 33 FIGURE 9 ARTIFICIAL SHORELINES INCORPORATED 33 FIGURE 10 IDEALISED SCHEMATIC OF A DUNE PROFILE DEPICTING THE HIGH HAZARD AREA, 2050 COASTAL HAZARD AREA AND 2100 COASTAL
HAZARD AREA (AFTER NIELSON ET AL (1992) AND USED BY MARIANI ET AL (2012) AND SHARPLES ET AL (2013)) 34 FIGURE 11 COASTAL EROSION RANKINGS AND HAZARD BANDS 40 FIGURE 12 INDICATIVE COASTAL EROSION HAZARD BAND MAPPING (RALPHS BAY – LAUDERDALE AREA) 42 FIGURE 13 COASTAL EROSION HAZARD BAND AREA ( AREA HECTARES, AND PROPORTION OF AREA WITHIN A HAZARD AREA) 43 FIGURE 14 CALCULATING THE NUMBER OF HOUSES IMPACTED 44 FIGURE 15 SUMMARY PLOT OF COASTAL EROSION IMPACTS: BUILDINGS, CAPITAL VALUE, AND DEVELOPABLE LAND 45 FIGURE 16 OCEANIC PHENOMENA THAT CONTRIBUTE TO THE TOTAL WATER LEVELS AT THE COAST DURING AN EXTREME SEA-LEVEL EVENT, THEIR
CAUSES AND THE TIME AND SPACE SCALES OVER WHICH THEY OPERATE (MCINNES ET AL 2016) 55 FIGURE 17 DEM DATA USED TO MAP COASTAL INUNDATION (LIDAR–10M CONTOUR) 58 FIGURE 18 COASTAL HAZARD BANDS (ADAPTED FROM ‘PLANNING FOR SEA LEVEL RISE, MELBOURNE WATER, JUNE 2012’) 60 FIGURE 19 COASTAL INUNDATION AREA (HA) STATE 62 FIGURE 20 CALCULATING THE NUMBER OF HOUSES IMPACTED 62 FIGURE 21 SUMMARY OF COASTAL INUNDATION IMPACTS: BUILDINGS, CAPITAL VALUE AND DEVELOPABLE LAND 63
Page 1
Glossary of terms and acronyms
ABCB Australian Building Codes Board
Actively Mobile
Landform
Means as defined in the State Coastal Policy 1996.
AEP Annual Exceedance Probability is the likelihood of a natural hazard event occurring in
a calendar year, generally expressed as a percentage. For example, a 1% AEP event has a one per cent chance of occurring in a year, or once in every 100 years.
AHD Australian Height Datum
AHO Australian Hydrographic Office
ANTT Australian National Tide Tables
AR Assessment Report
ARI Average recurrence interval
AS Australian Standard
CFT Climate Futures for Tasmania
COAG Council of Australian Governments
Coastally-dependent
use
Are uses which rely on a coastal location to fulfil its purpose.
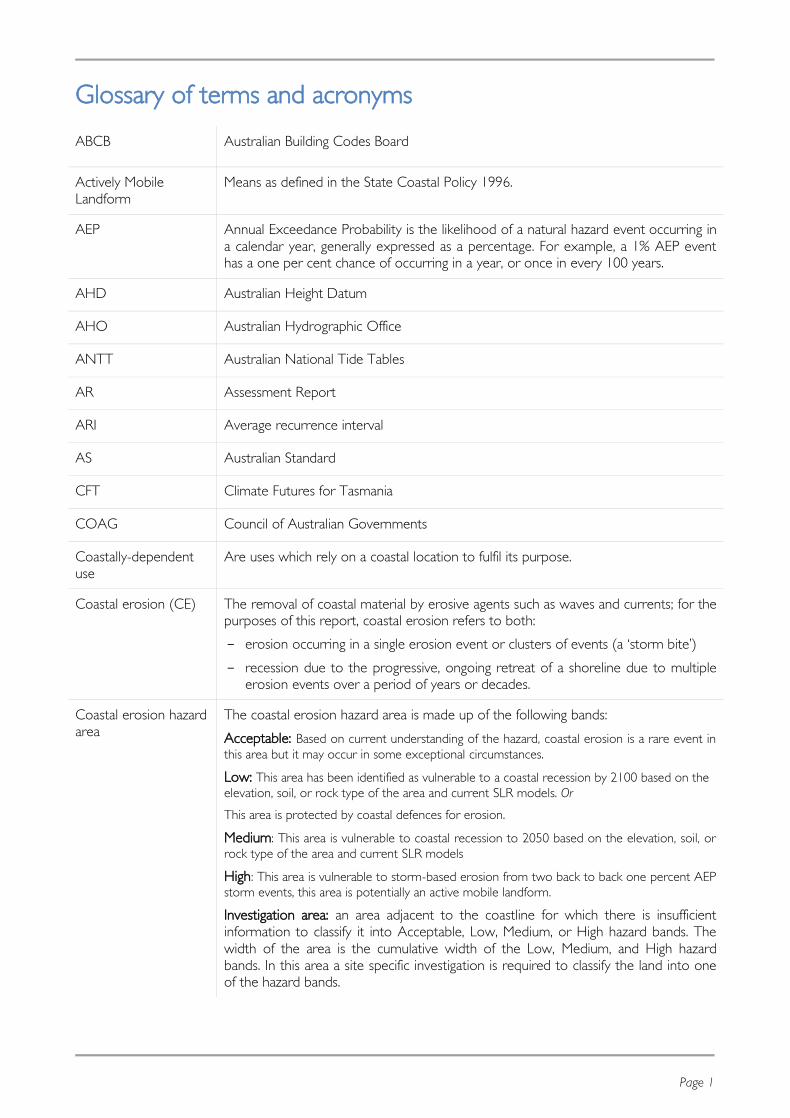
Coastal erosion (CE) The removal of coastal material by erosive agents such as waves and currents; for the purposes of this report, coastal erosion refers to both:
- erosion occurring in a single erosion event or clusters of events (a ‘storm bite’)
- recession due to the progressive, ongoing retreat of a shoreline due to multiple erosion events over a period of years or decades.
Coastal erosion hazard
area
The coastal erosion hazard area is made up of the following bands:
Acceptable: Based on current understanding of the hazard, coastal erosion is a rare event in
this area but it may occur in some exceptional circumstances.
Low: This area has been identified as vulnerable to a coastal recession by 2100 based on the
elevation, soil, or rock type of the area and current SLR models. Or
This area is protected by coastal defences for erosion.
Medium: This area is vulnerable to coastal recession to 2050 based on the elevation, soil, or
rock type of the area and current SLR models
High: This area is vulnerable to storm-based erosion from two back to back one percent AEP
storm events, this area is potentially an active mobile landform.
Investigation area: an area adjacent to the coastline for which there is insufficient
information to classify it into Acceptable, Low, Medium, or High hazard bands. The
width of the area is the cumulative width of the Low, Medium, and High hazard
bands. In this area a site specific investigation is required to classify the land into one of the hazard bands.

Page 2
Coastal inundation (CI) The temporary or permanent flooding of an area of land within the coastal zone,
temporary inundation being a storm tide event influenced by regional storm surge,
tides and the effects of climate change (including SLRPA and changes in the likelihood of storm events).
Coastal inundation
hazard area
The coastal inundation hazard area is made up of the following bands:
Low: areas vulnerable to a 1 % AEP storm event in 2100; these areas have a
medium-term flooding issue
Medium: areas vulnerable to a 1% AEP storm event in 2050; the medium band also
contains all of the land that will be impacted by a 0.8 m SLR by 2100
High: areas that will be within a 0.2 m SLR from the mean high tide line by 2050;
these areas are currently impacted by the Highest Astronomical Tide
Coastal Investigation: areas that are not covered by LiDAR and are below the 10 m
contour and within the coastal zone. In this area a site specific survey is required to
identify the coastal inundation hazard band level for the locality.
Coastal zone As defined by the SCP the coastal zone is all land within 1 km of the mean high tide
line.
Critical use Uses required to support a community in disaster response and recovery including
hospital and emergency services.
DED Department of Economic Development (now the Department of State Growth)
DEM Digital Elevation Model
Development Means as defined in the LUPAA.
DIER Department of Infrastructure, Energy and Resources (now the Department of State
Growth)
DPAC Department of Premier and Cabinet
DPEM Department of Police and Emergency Management (now the Department of Police,
Fire and Emergency Management)
DPIW Department of Primary Industries and Water (now DPIPWE)
DPIPWE Department of Primary Industries, Parks, Water and Environment
Existing use or
development
Established use or development within existing urban growth boundary, including
buildings or dwellings located outside established communities. Over time, the
redevelopment of existing developments may be considered, which maintains stability
in the at-risk population while increasing the capital value of the site. Typically existing use or development can be considered as occurring on urban zoned land.
Fetch The horizontal distance over which wind blows in generating waves
Greenfield use or
development
Greenfield sites are typically located outside of the existing urban growth boundary
and may involve the intensification of use. The implication is that greenfield sites may
be developed in a way that minimises exposure to known hazards without
unreasonable increase in public risk. Typically greenfield use or development can be considered as occurring on non- urban zoned land.
ha hectare

Page 3
Hazardous use Uses involving management of hazardous substances of manifest quality as defined
under the Work Health and Safety Regulations 2012.
HWM High Water Mark, being the mean high tide line as defined by Land Information
Tasmania.
ICSM Intergovernmental Committee on Surveying and Mapping
Infill use or
development
Development or redevelopment of a vacant or underutilised site situated within the
urban growth boundary, with a focus on zone-compliant uses, including new builds,
significant redevelopments or renovations and change of use. As with existing use or
development, complexities may arise regarding the need to balance private rights
with the responsibilities of state and local government. Typically infill use or development can be considered as occurring on urban zoned land.
IPCC International Panel on Climate Change
km kilometre
LGA Local Government Authority
LiDAR Light Detection and Ranging, a form of remotely sensed imagery and data acquisition
that involves the use of laser reflections off the ground and other surfaces to enhance high resolution topographic mapping
LPS Local Provision Schedule
LUPAA Land Use Planning and Approvals Act 1993
m metre
mm millimetre
MHT Mean High Tide
MHHW Mean High High Water
MHW Mean High Water
MHWS Mean High Water Springs
MNHLUP Mitigating Natural Hazards through Land Use Planning
Natural hazards Naturally-occurring hazards include bushfire, flood, earthquake and tsunami, landslide,
coastal inundation and erosion. Worldwide, natural hazards are commonly
associated with extreme weather and climatic phenomena, with some regions more
vulnerable than others to specific hazards. Natural hazards become natural disasters when people’s lives and livelihoods are threatened and/or destroyed.
NCC National Construction Code
NERAG National Emergency Risk Assessment Guidelines
NSW New South Wales
NT Northern Territory
OSEM Office of Security and Emergency Management, DPAC

Page 4
Progradation Seaward growth of the shoreline, resulting from prolonged accretion of sediment.
PWS Parks and Wildlife Service, DPIPWE
Qld Queensland
RCP Representative Concentration Pathway
RMPS Resource Management and Planning System
SCP State Coastal Policy 1996
SD Strategic Direction
SHT Spring High Tide
SLR sea level rise
SLRPA Sea Level Rise Planning Allowance
SPIDC State Planning Interdepartmental Committee
SPP Act State Policies and Projects Act 1993
STCA Southern Tasmanian Councils Authority
Storm bite The area of sand ‘cut’ from a beach and dunes in a storm event.
Storm surge The temporary piling-up of water at the coast due to onshore wind and/or low
barometric pressure.
TCCO Tasmanian Climate Change Office, DPAC
TEMP Tasmanian Emergency Management Plan
TP Tidal Port
TPS Tasmanian Planning Scheme
TSNDRA Tasmanian State Natural Disaster Risk Assessment
Wave runup The vertical distance above mean water level reached by the uprush of water from
waves across a beach or up a structure
Wave setup The increase in water level within the surf zone above mean still water level caused
by the breaking action of waves
Works Means as defined in the LUPAA.
Urban Growth
Boundary
Means the area identified for urban development in the regional land use strategies as
required by the LUPPA.
Vulnerable use A vulnerable use involves people who require additional assistance during an
emergency including prisons, education centres, respite care, retirement or aged care and visitor accommodation.
WA Western Australia

Page 5
Executive Summary
Tasmania’s coastal zone is particularly important to the Tasmanian community and the economy, with the
majority of Tasmania’s population centres and major industries located on or near the coast (ABS 2013).
While the majority of these areas are not vulnerable to coastal hazards, those closest to the coast have a
heightened vulnerability. This report outlines the assessment of the vulnerability.
Coastal hazards, including erosion and inundation, are the result of natural processes that have the potential to
cause considerable damage to communities, industries and infrastructure. These hazards are expected to be
magnified by climate change and sea level rise, presenting significant risk to Tasmanian communities and the
economy if they are not appropriately managed.
In response to the risks presented by coastal inundation and erosion, the Department of Premier and Cabinet
(DPAC) established the Mitigating Natural Hazards through Land Use Planning (MNHLUP) project in 2011. The
project’s objective is to provide a comprehensive framework to mitigate the risks to Tasmanian communities
from natural hazards, by implementing a suite of recommended land use planning and building controls.
The MNHLUP framework comprises:
a set of principles that describes the Tasmanian Government’s role in managing natural hazards through
land use planning and building controls
a guide that outlines the method used to mitigate the risks presented by natural hazards through the
land use planning system
specific hazard reports that describes:
o the approach used to define hazard risk bands
o the proposed planning and building controls applicable to each of the hazard bands.
This report is the Coastal Hazards Technical Report. It defines hazard bands for erosion and inundation and
provides guidance on appropriate mechanisms to mitigate the risks from erosion and inundation through land
use planning and building controls.
Through the MNHLUP project, indicative mapping has been undertaken to assist in understanding Tasmania’s
vulnerability to erosion and inundation. This mapping was used to define four distinct hazard bands in order to
establish the threshold of risk that coastal hazards present to the Tasmanian Government. The associated
hazard matrices provide guidance on the appropriate level of structural intervention required for new
developments (through land use planning and building controls), applicable to each hazard band. The mapping
discussed in this report is indicative only and subject to a review of Tasmania’s sea level rise planning
allowances.
This report is available for download from the Department of Premier and Cabinet’s Office of Security and
Emergency Management at http://www.dpac.tas.gov.au/divisions/osem/coastal_hazards_in_tasmania
Access to the coastal inundation and erosion mapping
The inundation and erosion maps have been prepared through the MNHLUP project and are available through
the LIST: www.thelist.tas.gov.au. or through the following bookmark http://bit.do/coastal_tasmania
Coastal hazard layers:
Coastal Erosion Hazard Bands 20161201
Coastal Inundation Hazard Bands 20161201

Page 6
Instructions to add the coastal hazard layers to LISTmap:
Click on the LISTmap icon in the
centre of the LIST home page
www.thelist.tas.gov.au
On the top RHS of the screen,
click on ‘Layers’
Click on ‘Add Layer’
Search for the coastal hazard
layers
Add each layer to the map by
clicking on the green button
Zoom into the area of interest

Page 7
1 Introduction
1.1 Background
In 2009, the Council of Australian Governments (COAG) agreed to adopt a nationwide resilience-based
approach to disaster management to mitigate the risks that natural hazards present to Australian communities,
businesses, infrastructure, economy and the environment. As part of this approach, the Tasmanian
Government established the Mitigating Natural Hazards through Land Use Planning (MNHLUP) project in 2011.
Managed by the Office of Security and Emergency Management (OSEM) in the Department of Premier and
Cabinet (DPAC), MNHLUP provides a comprehensive framework to mitigate the risks that natural hazards
present to Tasmanian communities – including landslip, riverine flooding, storm events, and coastal erosion and
inundation – through a range of land use planning and building control measures.
Through MNHLUP, indicative mapping has been developed to facilitate increased understanding of Tasmania’s
vulnerability to the abovementioned natural hazards. From this mapping, four hazard bands were defined to
establish the Tasmanian Government’s risk threshold to natural hazards and to guide appropriate land use
planning and building controls that consider both present-day and projected future conditions.
The MNHLUP framework comprises:
a set of principles that describes the Tasmanian Government’s role in managing natural hazards through
land use planning and building controls
a guide that outlines the method used to mitigate the risks presented by natural hazards through land
use planning and building controls
reports for each of the abovementioned hazards that describe the methodology used to define hazard
bands, and propose planning and building controls for managing development within those hazard bands.
This Coastal Hazards Technical Report is the final output of the coastal hazards component of the MNHLUP
framework. More information about the framework and associated methodology is provided in Section 4.
1.2 Purpose and scope
The purpose of this Coastal Hazards Technical Report is to guide the development of Tasmanian land use
planning codes and building regulations that will mitigate the risks to new development associated with coastal
hazards, specifically inundation and erosion. While potentially impacted by coastal hazards, natural, social and
historical values are out of scope for this work, however, they are addressed in the planning system through
other codes, such as natural values or heritage codes.
This report outlines the methodology used, evidence collected and assumptions made through the project to
support a position on Tasmania’s risk tolerance to coastal hazards. This risk tolerance is expressed through the
four hazard bands (acceptable, low, medium and high) and the hazard matrices, which provide guidance on the
level of intervention for new developments (land use planning and building controls) that are appropriate to
each hazard band.
This report will provide Tasmanian Government agencies and local government with greater confidence in the
appropriate management of coastally located infrastructure and assets, and support coastal communities in
appropriately responding to coastal hazards. It will also help environmentally focused agencies and emergency
service providers to gain a greater understanding of the evolving threat that coastal hazards present in
Tasmania, projected out until 2100.
Page 8
The report includes:
a statewide vulnerability assessment of communities1 at risk from coastal hazards;
an analysis of the management of public risk; and
recommended controls to mitigate the risks of coastal hazards.
For the purposes of this report, coastal zone is defined as all land to a distance of 1 km inland from the high-
water mark (HWM). This is consistent with the definition provided in the State Coastal Policy 1996 (SCP).
This report is not intended as a review or commentary on existing policies, codes, regulations or legislation that
relate to the management of the Tasmanian coastline.
The land use planning and building controls outlined in this report are proposed for new developments and, as
such, should not be viewed as guidance for adaptation planning for existing settlements in coastal areas.
1.3 Report structure
This Coastal Hazards Technical Report is structured as follows:
Section 1 provides a summary of MNHLUP project background and the associated framework for the
mitigation of natural hazards. It also outlines the purpose and scope of this report.
Section 2 defines coastal hazards for the purposes of this report and provides an overview of
Tasmania’s vulnerability to those hazards.
Section 3 reviews how coastal hazards are managed in Tasmania through land use planning and building
controls and provides an overview of how coastal hazards are managed in other Australian
jurisdictions.
Section 4 sets out the methodology of the framework for the mitigation of natural hazards through
land use planning and building controls.
Section 5 outlines the approach to the management of public risk in the context of coastal hazards.
Section 6 applies the framework to coastal erosion, including the technical research that forms the
basis of the indicative coastal erosion maps now available through the LIST. It explains the method
used to define the Coastal Erosion Hazard Bands (Hazard Bands) that represent the levels of coastal
erosion vulnerability (acceptable, low, medium, high) in different areas of Tasmania. The final part of the
section provides guidance on how the impact of coastal erosion can be managed through the
application of planning and development systems to new developments.
Section 7 applies the framework to coastal inundation, including the indicative mapping of inundation
areas based on storm tide and the endorsed Sea Level Rise Planning Allowances (SLRPAs) for 2050
and 2100. Indicative maps of the Bands are available on the LIST. The Hazard Bands represent the
levels of coastal inundation risk (acceptable, low, medium, high) in different areas. The final part of the
section provides guidance on how the impact of coastal inundation can be managed through the
planning and development systems to new development.
1 Assessed through the number of residential buildings or private landholdings impacted

Page 9
2 Coastal hazards in Tasmania
2.1 What are coastal hazards?
The coast is a dynamic system, shaped by wave, wind and tidal movements. Influenced by weather patterns,
seasonal variations and climate change, these processes can have a temporary or permanent influence on the
coastline. When natural processes lead to erosion and inundation that threaten to cause harm or damage to
public and private assets, environmental and/or social values, the processes are described as hazards. Human
modification to coastlines can also influence the way in which natural processes play out along the coast, adding
to or reducing hazards within an area. This report considers the hazards of coastal erosion and inundation2.
The relationship between coastal erosion and coastal inundation is complex and difficult to assess without a
localised technical investigation. For this reason, the hazard assessments in this report address coastal erosion
and coastal inundation separately. However, as the outcomes (treatments) of the hazard assessments are
implemented through land use planning and building controls, the controls are integrated.
The hazard assessments and treatments are developed by assessing the public risk associated with the
vulnerability of land to coastal hazards. Vulnerability is assessed by quantifying the potential frequency of an
event or by defining areas that are susceptible to coastal hazards and assessing the potential consequences of
the event. Once the vulnerability is understood, governments should only intervene to ensure that private
investment minimises unacceptable public risk. Public risk is closely associated with the economic concept of
‘externalities’, which are the costs or benefits of a development that are experienced by the broader
community.
2.1.1 What is coastal erosion?
Coastal erosion is the removal of coastal land by water, wind and general weather conditions. There are
three aspects of coastal erosion: hazardous erosion, recession and landslide (Page and Thorp 2010).
Hazardous coastal erosion is short-term (typically single-storm) erosion of sandy and other soft
shorelines causing immediate hazards for people and infrastructure or other hazards. This are may
contain the land can be considered the “Actively Mobile Landform” for the purpose of Clause 1.4.2 of
the SCP.
Coastal recession is the long-term retreat of a shoreline due to multiple erosion events in sandy or
other soft shores. Coastal recession may occur for a variety of reasons, but is expected to become
more prevalent in response to ongoing sea level rise (SLR).
Landslide is the downslope movement of land. On the coast landslide is typically caused by the
removal of material at the toe of the landslide due to wave or storm activity. Landslide within the
coastal zone is addressed as part of the MNHLUP landslide hazard planning report (DPAC 2013).
Coastal erosion has many drivers and factors including tides, currents, sediment budgets, storm intensity
and frequency, wave energy, fetch, SLR, land erodability, and human intervention. There is considerable
variation in wave climates across the Tasmanian coastline, and rising sea levels can trigger a non-linear
change to the sediment budget of beaches. Although the loss of sand naturally occurs on shores due to
erosion, it may accelerate with changes in sea levels (Sharples 2006).
Due to the complexity of understanding and modelling all of the drivers and factors that contribute to
coastal erosion, an assessment has been made based on the relative susceptibility of land to erosion and
the likely rate of erosion. In some areas this assessment has not been able to be made, these areas have
been identified as investigation areas and require site specific consideration.
2 Oil or chemical spills that impact the coastline are managed by Tasmania’s Environment Protection Authority (EPA 2015)

Page 10
2.1.2 What is coastal inundation?
Coastal inundation is the natural process of flooding of land by the sea. Coastal Inundation can be caused
by storm surge, extreme storm events, floods, tides, tsunamis and changes in sea level.
For the purpose of this report, coastal inundation is classified as either temporary or permanent:
temporary inundation is flooding due to storm surge, extreme storm events, floods or tides, typically
measured as Annual Exceedance Probability (AEP)3
Permanent inundation is usually the result of SLR, and is measured from the Mean High Tide (MHT)
mark.
While riverine flooding and tsunami are significant contributors to coastal inundation, these phenomena are
the focus of other work, including riverine flood assessments and emergency management plans for
tsunami. It is important to note that the indicative coastal hazard mapping delivered through MNHLUP
does not address the relationship between coastal inundation and riverine flooding in estuaries. This work,
while critical to our understanding of flooding, is beyond the scope of the project. In some areas sufficiently
accurate elevation data is not available to map the heights, these areas have been identified as investigation
areas. In the investigation areas a site specific survey is required to define the hazard bands.
2.1.3 Sea level rise planning allowance
Climate change projections indicate that SLR is likely to increase the frequency and severity of coastal
inundation in Tasmania. To allow for SLR in planning decisions, the Tasmanian Government implemented
statewide SLRPAs in August 2012 to promote consistent decision-making concerning future land use and
development, and reduce the level of uncertainty around the management of future SLR for coastal areas.
The rationale for the 2012 SLRPAs is described in the Derivation of the Tasmanian Sea Level Rise
Planning Allowance – Technical paper, released by the Department of Premier and Cabinet (DPAC)’s
Tasmanian Climate Change Office (TCCO) in August 2012.
In March 2016, the Tasmanian Government engaged the Commonwealth Scientific and Industrial research
Organisation (CSIRO) to develop SLRPAs Tasmania’s coastal councils based on the International Panel on
Climate Change (IPCC)’s Fifth Assessment Report (AR5). This has provided regional appropriate change
to the SLRPAs from the previous level of 0.8 m by 2100 for all of Tasmania to between 0.92 m by 2100
in the North East of Tasmania to 0.82 m by 2100 in the Central North Coast. These projections are
based on the IPCC AR5’s high emissions, ‘business-as-usual’ scenario, known as Representative
Concentration Pathway 8.5, or RCP 8.5 (McInnes et al 2016). Appendix 9 provides the LGA specific
figures.
The SLRPA promotes consistent decision-making in future land use and development and strategic
settlement planning by reducing the level of uncertainty around the management of future SLRs in coastal
areas.
SLR and climate change are likely to increase the frequency and severity of coastal inundation (McInnes et
al 2011). As such, the SLRPAs are applied at the level to which climate change is incorporated into
adaption planning (for example, the height to which coastal defences are constructed). In addition, the
SLRPAs have been incorporated into inundation and erosion modelling through the calculation of
recession rates for erosion, the uplift in storm surge heights and the MHT level for inundation.
3 See Glossary of terms and acronyms

Page 11
2.1.4 Coastal hazard exposure in Tasmania
Tasmania has 6 400 kms of coastline4, emphasising the importance on coastal regions for their
economic, social and environmental contributions to the State. No place in Tasmania is more than
115 km from the sea. The majority of the state’s population centres and major industries are located
on or near the coast (ABS 2013), which means there is significant exposure to risks from coastal
hazards.
Of Tasmania’s approximately 185 000 residential houses, almost half (~91000) are within 1 km of the
mean HWM considered the ‘coastal zone’ under the SCP. The cost of losses due to coastal hazards is
largely unknown, as most of it is borne by private landowners or built into the maintenance budget for
state infrastructure, including roads, rail and utilities.
Projections on extreme tide and sea level events undertaken as part of the Climate Futures for
Tasmania project show that SLR means that a 1% AEP event will occur between 15 and 100 times
more often by the year 2100 (McInnes et al 2011).
The indicative mapping completed as part of the coastal hazards component of MNHLUP uses
residential houses as an indicator of human settlement vulnerability to coastal erosion and inundation,
both at present-day and to 2100. Impacts on other infrastructure, such as roads, have not been
assessed as part of this work.
The coastal erosion mapping indicates that:
In 2010, 734 houses were potentially vulnerable to storm bite (the area of land removed due to
storm-based erosion), represented by the High hazard area.
By 2050, an additional 1 334 houses (2 068 houses in total) are projected to be vulnerable to
coastal recession, represented by the Medium hazard area.
By 2100, an additional 1 720 houses (3 788 in total) are projected to be vulnerable to coastal
recession, represented by the Low hazard area.
A further 814 houses are within the investigation areas where there is insufficient information for a
full classification.
The coastal inundation mapping indicates that inundation issues will worsen as this century progresses.
In 2010, 85 houses were potentially vulnerable to a SLR to 2050 from the 2010 MHT represented
by the High hazard area.
By 2050, an additional 1 288 houses (1 373 houses in total) are projected to be vulnerable to a 1%
AEP storm surge event or a 0.8 m SLR from the 2010 MHT, represented by the Medium hazard
area.
By 2100, an additional 1 779 houses (3 152 houses in total) are projected to be vulnerable to a
1% AEP storm surge event, represented by the Low hazard area.
A further 357 houses are within the investigation areas where there is insufficient information for a
full classification.
Based on the indicative mapping, the High hazard bands for inundation and erosion identify 779 houses as
potentially vulnerable. Of those, 40 houses are identified as being in the High hazard bands for both
erosion and inundation. Half of these houses are located in Ansons Bay (Break O’Day Council), with the
remainder spread throughout the South.
4 Based on 1:25000 scale shoreline mapping including the Bass Strait islands

Page 12
3 Regulatory and policy context
3.1 Resource management and planning system
Land use planning in Tasmania is guided by the Resource Management and Planning System (RMPS), which
was established in 1993. The promotion of sustainable development is one of the key objectives of RMPS,
which are included as schedules in each of the three pieces of legislation that comprise RMPS, namely:
the Land Use Planning and Approvals Act 1993 (LUPAA)
the State Policies and Projects Act 1993 (SPP Act)
the Tasmanian Planning Commission Act 1997.
For the purpose of RMPS, ‘sustainable’ is defined as:
… managing the use, development and protection of natural and physical resources in a way, or at a
rate, which enables people and communities to provide for their social, economic and cultural wellbeing,
and for their health and safety, while:
- sustaining the potential of natural and physical resources to meet the reasonable foreseeable needs
of future generations;
- safeguarding the life-supporting capacity of air, water, soil and ecosystems; and
- avoiding, remedying or mitigating any adverse effects of activities on the environment.
RMPS objectives inform land use planning instruments at the state, regional and local levels through state
polices, regional land use strategies and planning schemes. The planning schemes include special area plans,
local provisions (including zones and planning code overlays), regional provisions and state-based planning
codes or zone requirements. The zoning of the land should ensure that the strategic capacity of the land is
considered so that new use and development that is consistent with the zone requirements with minima
3.2 State Coastal Policy 1996
State policies are prepared in accordance with the SPP Act and represent the Tasmanian Government's
policy position on sustainable development. They may contain matters relating to: sustainable development
of natural and physical resources; land use planning; land management; environmental management;
environment protection; or any other matter that may be prescribed.
The primary instrument guiding coastal planning in Tasmania is the SCP. The SCP is a statutory document,
sitting between the provisions of legislation and the provisions of planning schemes and other mechanisms
identified in the legislation that comprises the RMPS. The SCP applies to the whole of Tasmania and
includes all islands except Macquarie Island, which is subject to a special management regime. The State
Policy on Water Quality Management 1997 also applies to the coastal zone, providing a framework for the
development of ambient water quality objectives and the management and regulation of point and diffuse
sources of emissions to surface waters (including coastal waters) and groundwater5.
The SCP is guided by three principles:
1. The natural and cultural values of the coast shall be protected.
2. The coast shall be used and developed in a sustainable manner.
3. Integrated management and protection of the coastal zone is a shared responsibility.
5 http://epa.tas.gov.au/policy/water-quality-policy

Page 13
While the SCP addresses both management and statutory planning issues, it was developed before the
implications of climate change and SLR were fully understood. Current SCP natural hazards provisions are
detailed in Table 1.
Table 1 Coastal hazards outcomes (State Coastal Policy, 1996)
1.4.1 Areas subject to significant risk from natural coastal process and hazards such as flooding, storms,
erosion, landslip, littoral drift, dune mobility, and sea level rise will be identified and managed to
minimise the need for engineering or remediation works to protect land, property and human life.
1.4.2 Development on actively mobile landforms such as frontal dunes will not be permitted except for
works consistent with Outcome 1.4.1.
1.4.3 Policies will be developed to respond to the potential effects of climate change (including sea level
rise) on use and development in the coastal zone.
Application of SCP 1996 in the Coastal Hazards Report
In relation to the SCP’s outcome 1.4.1 and 1.4.2, this Report applies a risk management methodology
(Section 4) to identify the areas at significant risk from coastal processes and hazards. The Macquarie
Dictionary definition of ‘significant’ as ‘important or of consequence’ has been applied. The concept of risk is
discussed extensively in Sections 4 and 5. The identification of areas subject to significant risk is outlined in
Sections 6 and 7 for coastal erosion and inundation respectively.
In relation to SCP’s outcome 1.4.3, this Report spatially defines the high, medium and low hazard bands
using projections in relation to SLR, regional storm surge and erosion.
The Coastal Erosion High Hazard band identifies areas that are ‘actively mobile landforms’ for the purpose
of SCP clause 1.4.2.
This Report proposes controls to meet the outcomes of SCP clauses 1.4.1 by applying a risk methodology
to define areas at a significant enough risk from natural coastal processes (Low, Medium and High hazard
bands) to require treatment.
This Report also proposes outcomes in the Coastal Erosion High band that are not completely consistent
with SCP Clause 1.4.2. The authors of the report have been advised that while the coastal erosion high
hazard band could be considered to contain the ‘actively mobile landforms’ noting that this open to be
tested as the SCP does not define what an actively mobile landform is. Furthermore, where the outcomes
in this Report are not consistent with SCP clause 1.4.2 then the statutory instrument (such as a Coastal
Erosion Hazard Code) must comply with the SCP over the outcomes of this Report. For example, in the
coastal erosion high hazard band if a development is on a Actively Mobile Landforms it is not permitted
unless it is for engineering or remediation works to protect land, property and human life.
More detail is provided in Sections 4 to 7 of this Report.
3.3 Regional strategies and planning
The Regional Planning Initiative, a collaboration partnership between the Tasmanian Government and Local
Government Authorities (LGA), is a significant element of the Tasmanian planning system. Since 2008, the
Initiative has introduced regional strategic planning as the foundation of new planning schemes across the
State.
The Initiative consists of three regional land use planning strategies, established through agreements
between the Tasmanian Government, the three regional council authorities and the respective LGAs:
Cradle Coast Framework sets out the principles that guide the development of the regional strategies
and plans that include or are consistent with RMPS objectives, planning directives, state policies and

Page 14
projects of state significance. Under the framework, the strategies and regional plans seek to “direct
places where people live and work from areas where there is an unacceptable level of risk for the health
and safety of people, property, and the environment from natural or man-made hazards.”
Northern Regional Land Use Planning Framework sets out the principles that underpin policy
development and focus on the desired outcomes of the Framework, including to “provide outcomes
which collectively reflect … [and] … ensure investors and decision-makers have a clearly defined
framework within which to make decisions.” Principles are articulated into strategies and policies
specifying that “land designated for housing, industry, community and infrastructure services must not be
located within or adjacent to areas which that are vulnerable to an unacceptable level of risk including
coastal inundation, landslip, flooding or contaminated land.” Strategies to be promoted for the
reduction of risk from natural hazards include:
o ensuring that new areas zoned for residential, commercial and community purposes are not
within areas identified as high risk
o identifying hazard areas to include the likely impacts of climate change, such as SLR, storm
surge, increased temperatures and intense/extreme rainfall events
o reducing the risk of loss of life and property by avoiding development on land that has been
identified as subject to a high risk of landslide, bushfire, sea inundation and flooding
o where avoidance of hazards is not possible, or the level of risk is deemed acceptable, ensuring
best practice construction and design techniques and management practices are implemented.
If required, plan for retreat in vulnerable areas.
Southern Tasmanian Regional Land Use Strategy sets strategic directions that are implemented
through more detailed regional policies. As an example, the strategic directions (SD) that form
part of the response to natural hazards include:
o adopting a more integrated approach to planning and infrastructure (SD1)
o holistically managing residential growth (SD2)
o increasing responsiveness to our natural environment, including a risk approach to natural
hazards, recognising that future developments and use will not be able to avoid hazards, and
that spatial information is critical when developing settlement strategies (SD6)
o creating liveable communities (SD10).
The regional land use strategies are statutory instruments, declared by Tasmania’s then Minister for Planning
on 27 October 2011. All new planning schemes, planning scheme amendments or projects of regional
significance must accord with the initiatives and recommendations contained in the strategies.
3.4 Local government planning
Local government management of coastal hazards prior to implementation of the Regional Planning Initiative
demonstrates a range of responses to coastal hazards: the planning schemes were developed and updated
from 1979 to 2007. Since 2012, three regional model schemes and interim planning schemes have been
progressively declared by the Minister responsible for planning.
3.4.1 Pre interim planning schemes
In the period prior to the development of interim planning schemes, planning schemes considered flooding
(as applied to the coast) or erosion to different extents. The extents to which coastal hazards were
considered were reflective of development pressures associated with the coastal zone and the level of
concern that coastal hazards presented to each LGA. A review of each LGA’s controls is provided at
Appendix 3.

Page 15
There are three types of triggers for assessment: the first is an arbitrary distance from the high-water mark
or the spring high tides (SHTs); the second method uses a 1% AEP level; and the third does not provide
guidance on where flooding can occur. The triggers act in two ways:
to cause a development to become discretionary so that the impact of coastal hazard is assessed
to define the minimum floor height in the areas vulnerable to coastal hazards.
The provisions and standards show two different approaches to coastal hazards. The first uses an arbitrary
floor height as proxy for an acceptable standard to manage coastal hazards. The second approach uses a
risk-based methodology that asks the proponent to demonstrate where a high, medium or low risk is
located, and how an acceptable or tolerable risk can be achieved. In doing so, the application must
demonstrate (typically through expert reports) how the development will be safe, be able to resist or
recover from an event, and not have an unreasonable impact on neighbouring properties through increasing
flooding or erosion.
The combination of the triggers, provisions and standards produces some overlap with the controls in the
building regulations, with different minimum floor heights and requiring the developer to demonstrate that
the development will not increase the risk of flood or erosion to neighbouring properties.
Figure 1 provides a summary of triggers, provisions and standards, and shows the duplication with building
controls.
Figure 1 Pre interim planning scheme response to coastal hazards
3.4.2 Interim planning schemes
The interim planning schemes take three different approaches to the management of coastal hazards.
All of the schemes were required to translate the pre interim planning scheme zones into the interim
planning schemes. As a result, limited consideration has been given to whether the zones reflect the
capacity of the land in the context of coastal hazards.
Provisions and standards include
defining minimum floor heights
requiring a risk assessment, without guidance on
risk tolerance or minimisation
requirement for expert reports
requirement for avoidance/mitigation measures
to defend against the impact of flooding
requirement to demonstrate how development
will not impact on neighbouring properties
Trigger type 1
30m of HWM or < 3m above spring high tide
40m of HWM or < 3m above spring high tide
< 3m Australian Height Datum
within 500m of HWM
within 90m of the 2.64m contour
within 100m of HWM
Trigger type 2
1% AEP and erosion mapping for
current day-2050-2100
Trigger type 3
No definition
Duplication with
building controls
floor heights
defined as 1% in
2100 while
building controls
use clause 15C
definition of
minimum floor
heights as 3m
definition of
minimum floor
heights as
300mm above
1% AEP
demonstration
of a building
solution at the
planning stage
Triggers for
assessment
Provisions and standards
Duplication with building
controls

Page 16
The schemes apply a risk-based approach, seeking acceptable or tolerable risk as an outcome, noting
that:
Cradle Coast Interim Planning Schemes have a ‘Hazard Management Code’ to address all hazards
other than bushfire. This applies to all land identified on a map within the planning scheme as
vulnerable to coastal erosion or coastal inundation. The Code requires a hazard management
report (including risk assessment) to define the level of risk for the use or development and
demonstrate how that risk will be mitigated.
Northern Interim Planning Schemes have a ‘Coastal Code’ that responds to coastal inundation and
the management of the coastal environment. The Code is activated through a spatial overlay,
primarily seeking to regulate sensitive uses or modify the form of development for other
development types if affected by inundation. Most development in this area is discretionary, unless
it is a boatshed or for recreational purposes, and must demonstrate how impact on the coastal
environment will be minimised, having regard for a range of factors.
Southern Interim Planning Schemes have an ‘Inundation Prone Areas Code’ and a ‘Coastal Erosion
Hazard Code’. Codes are activated by coastal inundation and erosion mapping that define high,
medium and low inundation areas.
o The Inundation Prone Areas Code is provided to manage areas at risk from inundation.
Typical controls require habitable floors to have a level above the 1% AEP in 2100, or a floor
area of less than 40 m2. New subdivisions can only be created if the access, building area and
services are outside the high and medium hazard areas.
o The Coastal Erosion Hazard Code is intended to reduce the risk to people, infrastructure or
the environment in areas vulnerable to coastal erosion. Changes in use are required to
demonstrate that such use can occur safely. Development controls address building and
works, coastal-dependent development and subdivision. The controls seek a tolerable level of
risk, no interference with coastal process, and no over-reliance on coastal defences.
3.4.3 Tasmanian Planning Scheme
The Tasmanian Planning Scheme (TPS) will replace the interim planning schemes outlined in Section 3.4.2.
In addition to the 29 planning zones, the TPS has 15 codes that include coastal inundation and coastal
erosion. the TPS is applied through the Local Provision Schedules (LPS). The TPS provides a consistent
approach to coastal inundation and erosion across the State, while still providing the necessary flexibility to
address local issues through the LPS.
Local planning authorities must use, at a minimum, the coastal inundation and erosion hazard mapping
developed in this report as the statewide codes spatially in the overlay maps. The LPS provides Local
Planning Authorities to seek amendment to the coastal inundation or erosion mapping by making an
application for amendment to the Tasmanian Planning Commission. An amendment to the State mapping
in the LPS should demonstrate amendment meets the intent and standards of the State mapping, while
using locally specific information or an improved modelling method, and has been peer reviewed.
The development of the TPS codes has been coordinated with the development of new Building
Regulations for Coastal Inundation and Erosion.
3.5 Building Act 2000
The Building Act 2000 and Building Regulations 2014 incorporate coastal inundation in provisions relating to
land subject to flooding. Under the Regulations, the floor height of habitable rooms must be 300 mm
above the designated flood level.

Page 17
Under Regulation 15 of the Building Regulations 2014, the following is defined as the designated flood level:
(a) 600 mm above ground level or the highest known flood level, whichever is the highest, for land
known to be subject to flooding other than as provided in paragraph (b), (c) or (d);
(b) the level which has a one per cent probability of being exceeded in any year for 10 stipulated
floodplains;
(c) 600 mm above the ordinary high-water mark of the spring tide for land on which flooding is
affected by the rise and fall of the tide; and
(d) in respect of a watercourse floodplain not mentioned in paragraph (b), a level that, according to a
report adopted by the relevant council, has a one per cent probability of being exceeded in any year.
Clause C of the Regulations defines the designated flood area for the coast, noting that the “ordinary high-
water mark of the spring tide” does not appear to have a legal or technical definition. In 2003, however, a
working group of the Intergovernmental Committee on Surveying and Mapping (ICSM) compiled a
compendium of tidal terms (ICSM 2003). When interpreted in conjunction with the Australian Tides
Manual Special Publication 9 Version 4.3, ICSM (2003) suggests that the “ordinary high-water mark of the spring
tide” is equivalent to the “Mean High Water Springs” (MHWS) or “Mean High High Water” (MHHW) (ICSM
2003: 31). The MHWS or MHHW are dependent upon location, due to variations in sea surface
topography.
The Australian Hydrographic Office (AHO) maintains a series of summaries for Standard Ports and
Secondary Ports6 in the Australian National Tide Tables (ANTT). These summarise the relationship
between chart datum, mean sea level, the Australian Height Datum (AHD) or applicable local height
datum, and MHWS/MHHW. This information is subject to amendment as new measurements are
performed.
Table 2 summarises the MHWS/MHHW derived from Tasmanian ANTT port records provided by the
AHO (see Appendix 3). The Table shows the way in which final minimum floor levels are calculated to
meet the requirements of Section 15(c) of the Building Regulations 2014. This calculation (including a
review of the ANTT) must be undertaken for each development.
Table 2 Minimum floor levels – Building Regulations 2014
Building Regulations 2014 – Clause 15(c)
(heights in m AHD83-TAS*)
Port
ANTT
Tidal Port (TP)
Number
Tidal Port
Version
MHWS (MHHW)
(rounded up to
nearest 0.1m)
Designated
Flood Height
(+600mm)
Minimum
Floor Level
(+300mm)
Stanley 60900 28/11/2006 1.3 1.9 2.2
Burnie 60910 11/06/2009 1.3 1.9 2.2
Mersey River (Devonport) 60930 01/09/2006 1.3 1.9 2.2
Low Head 60948 04/04/2008 1.3 1.9 2.2
Spring Bay (Triabunna) 61170 12/06/2009 0.6 1.2 1.5
Hobart 61220 29/07/2009 0.7 1.3 1.6
Currie7 60827 22/09/2008 0.9 1.5 1.8
6 http://www.bom.gov.au/oceanography/projects/ntc/NTC_glossary.pdf 7AHD is not available on the Bass Strait Islands: local height datums apply:
http://dpipwe.tas.gov.au/land-tasmania/geospatial-infrastructure-surveying/geodetic-survey/coordinate-height-and-tide-datums-tasmania

Page 18
3.6 How other states responded to coastal hazards have
Management of coastal hazards cuts across all Australian jurisdictions, with the exception of the Australian
Capital Territory. A summary of jurisdictional coastal hazard responses is provided below.
Australian Government
The Australian Government has no direct legislative power over the coastal zone: this has traditionally
resided with the states. The Australian Government does, however, have some influence over coastal
management through funding, national plans and policies, and in the provision of supporting information,
data and tools. Data and mapping initiatives delivered by the Australian Government include SLR mapping,
the National Elevation Data Framework, Smartline Geomorphic mapping, and investment in climate change
projections and information. The Australian Government has funded a Coastal Adaptation Pathways
program and recently provided funding to the National Climate Change Adaptation Research Facility to
develop a coastal climate risk decision support tool, which is due for release in 2017.
New South Wales
The New South Wales (NSW) Government is conducting a two-stage reform of its coastal legislation and
policy. As part of this process, the Coastal Protection Act 1979 (NSW) has been amended to allow
landowners to undertake temporary coastal protection works and lodge development applications for
other protection works to reduce erosion impacts. NSW no longer has SLR planning benchmarks, but the
Government does provide relevant data on climate projections that include SLR. The benchmarks were
removed to allow councils greater flexibility around planning for coastal hazards. The NSW Government is
preparing guidelines to assist local government to disclose SLR information on planning certificates. The
second stage of the reform process will include the development of a simpler, more integrated legal and
policy framework for coastal management. This will also identify potential funding options, particularly to
implement coastal asset management strategies8.
Northern Territory
The Northern Territory (NT) has a statewide planning scheme that restricts development in areas
considered vulnerable to storm surge. Vulnerability is determined based on hazard mapping undertaken by
the NT Government. The planning scheme notes two types of storm surge areas: primary areas, which are
vulnerable to a 1% AEP event; and secondary areas, which are vulnerable to a 0.1% AEP event. In primary
areas, development consent is required and is limited to open space, recreation, non-essential public works
and short-stay tourist camping/caravan areas. In secondary areas, the scheme expands to include industrial
and commercial uses. Avoiding residential uses, strategic and community services in both zones is
recommended9.
Queensland
The Queensland (Qld) Government is undertaking work to reintroduce coastal planning laws and hazard
mapping that includes SLR projections. In 2014, a single State Planning Policy came into effect as the
predominant policy under the Sustainable Planning Act 2009 (Qld). The Policy requires local councils to
identify coastal hazard areas and avoid or mitigate coastal hazard risks to communities. Under the Coastal
Protection and Management Act 1995 (Qld), areas subject to coastal hazards may be declared coastal
management districts if the Minister considers there is a need for special protection or management. Areas
within a coastal management district may be triggered for development assessment under the Sustainable
Planning Act 2009 (Qld)10.
8NSW Office of Environment and Heritage http://www.environment.nsw.gov.au/coasts/stage1CoastRefQaA.htm 9NT Dept Lands Planning & the Environment http://lands.nt.gov.au/planning/system 10QLD Dept Infrastructure, Local Gov & Planning http://www.dsdip.qld.gov.au/about-planning/state-planning-policy.html

Page 19
South Australia
South Australia’s Policy on Coast Protection and New Coastal Development, developed in 1991, adopts an
SLRA of 0.3 m by 2050 and 1.0 m by 2100. The Policy requires building sites for new development to be
0.3 m above the 1% AEP interval with a local adjustment, where appropriate, for land subsidence or uplift
to the year 2050. For commercial or habitable buildings, floor levels should be at least 0.25 m above that
minimum site level. In addition, development should not be approved unless it is capable of, by reasonably
practical means, being protected or raised to withstand a further 0.7 m SLR.11
Victoria
The Victorian State Planning Policy Framework (SPPF) highlights the need to coordinate land use and planning
with the requirements of the Coastal Management Act 1995 (Vic) and the Victorian Coastal Strategy. The
SPPF includes a SLR planning allowance of 0.8 m by 2100. It also specifies that in planning for possible SLR,
an increase of 0.2 m over current 1% AEP flood levels by 2040 may be used for new development in close
proximity to existing development (urban infill). This policy applies to development proposals in existing
settlements and urban-zoned areas. Planning Practice Note 53: Managing Coastal Hazards and the Coastal
Impacts of Climate Change provides local government with guidance for the management of coastal hazards,
the decision-making process for assessing coastal hazard risk, and planning for development in coastal
areas.12
Western Australia
Western Australia (WA) has a SLR planning benchmark of 0.9 m by 2110, which is contained in the State
Coastal Planning Policy. The WA Government of Western Australia developed Coastal Hazard Risk
Management and Adaptation Planning Guidelines in September 2014 to assist statutory decision-makers to
evaluate the risks from coastal hazards and identify pragmatic adaptation responses.13
11SA Department of Planning, Transport & Infrastructure, http://www.dpti.sa.gov.au/planning/home 12 Victorian Government Department of Transport, Planning and Local Infrastructure, http://www.dtpli.vic.gov.au/planning/about-
planning 13 Western Australian Government Department of Planning, http://www.planning.wa.gov.au/publications/1168.asp

Page 20
4 Methodology
The National Strategy for Disaster Resilience (2011) identifies the need for collective responsibility in the
management of natural hazards:
Australian Governments have recognised that a national, coordinated and cooperative effort is required to enhance
Australia’s capacity to withstand and recover from emergencies and disasters. A disaster-resilient community is one
that works together to understand and manage the risks that it confronts. Disaster resilience is the collective
responsibility of all sectors of society, including all levels of government, business, the non-government sector and
individuals. If all these sectors work together with a united focus and a shared sense of responsibility to improve
disaster resilience, they will be far more effective than the individual efforts of any one sector.
The Strategy outlines the role of government as:
developing and implementing effective, risk-based land management and planning arrangements and
other mitigation activities
having effective arrangements in place to inform people about how to assess risks and reduce their
exposure and vulnerability to hazards
having clear and effective education systems so people understand what options are available and
what the best course of action is in responding to a hazard as it approaches
supporting individuals and communities to prepare for extreme events
ensuring the most effective, well-coordinated response from our emergency services and volunteers
when disaster hits
working in a swift, compassionate and pragmatic way to help communities recover from devastation
and to learn, innovate and adapt in the aftermath of disastrous events.
In setting out the risk assessment process for planning and building controls in Tasmania, MNHLUP applies
the Strategy in a Tasmanian context, and is consistent with AS/NZS ISO 31000:2009 Risk Management -
Principles and guidelines, and the National Emergency Risk Assessment Guidelines (2014).
4.1 The MNHLUP Framework
The Framework includes:
a set of Principles for the mitigation of natural hazards through land use planning and building
controls (the Principles), and
a Guide for the mitigation of natural hazards through planning and building controls (the Guide),
which outlines how the Tasmanian Government translates RMPS objectives with the SCP in defining
areas of significant risk.
The Principles establish the context for risk treatment representing an ideal outcome and are as follows:
Private risks associated with natural hazards are the responsibility of individuals and businesses.
Governments should encourage public and private risks to be factored into investment
decisions.
Governments can support individuals and businesses to understand and manage private risks
through the collection of evidence, provision of information, and facilitation of collective action.
Governments should ensure that private investment minimises unacceptable public risk.
Governments should avoid investment, regulation or policy that gives rise to unacceptable
public or private risks.
Governments should have regard to, and support individuals and businesses to consider, how
natural hazards may change in the future, including through climate change.

Page 21
The Guide builds on the Principles by setting out a risk assessment process for translating evidence and
policy on natural hazards into strategic land use planning decisions and building controls for defined hazard
bands. It:
Establishes a reasonable balance between the productive and sustainable use of land and the
protection of the community from the costs associated with natural hazards
Promotes the ownership of private risks by an individual or business
Ensures that the potential impact of a hazard is identified early in the decision process when
considering a development (and potentially in the transfer of land)
Assists government at all levels to inform/educate the community, industry and officials about
the nature of hazards
Clarifies the approach to managing both public and private risks
Assists the prioritisation of investment in research and mitigation of natural hazards by
individuals, businesses and governments
Facilitates collective action by landowners
Enables governments to identify and avoid actions that give rise to unacceptable public and
private risks to the community
Assumes that the hazard will occur at any point in time in the landscape, with the process
describing its relative likelihood
Considers the treatment of the risk based on the new use or development, with the treatment
being the level of intervention to reduce the potential consequence to tolerable levels.
The Guide outlines the hazard treatment approach to undertaking coastal hazard assessment. The hazard
treatment approach is one of four methods of managing risks from natural hazards that arise from the
development and use of land (see Box 1).

Page 22
Box 1 Approaches to mitigating natural hazards (Guide 2012)
Risk-based
Government defines risk tolerance
Development considered on the basis of government risk assessments at regional or local levels
Emergency Management
Based on Planning, Preparation, Response and Recovery (PPRR) to help individuals and communities
recover from an event
Precautionary
Government presumes that all properties within defined areas are at risk from a hazard
Assessment of development in defined areas is required to include an assessment of the risks at the cost of
the developer
Hazard treatment approach
Draws on elements of the risk approach, precautionary approach and emergency response
Development controls based on agreed ‘banding’ of hazard likelihood based on best available knowledge
Process involves consultation and multi-agency participation in developing policy
Graduated imposition of assessment and control requirements
Figure 2 demonstrates the relationship between the Principles, the Guide and this Report in the Framework.
Figure 2 State Framework for the mitigation of the impacts of natural hazards through land use planning
Principles
•Principles for the Consideration of Natural Hazards in the Planning System 2012
•Clear guidance on why governments intervene in the use of land when mitigating the potential impacts of natural hazards
Guide to risk
•The Guide to the Consideration of Natural Hazards in the Planning System 2012 sets out: - Rationale and tools to implement the principles - A transparent process for translating evidence and policies on natural hazards into strategic land use decisions and planning controls
Hazard-specific Statement
•Coastal erosion and coastal inundation hazard statements: - Provide context for coastal hazards including governance, evidence and risk - Coastal erosion and inundation technical report on the hazard data
•Coastal Erosion Planning Matrix and Coastal Inundation Planning Matrix and supporting report (this document)
Implementation
•The outcomes of the hazard statement will support: - Development of a planning directive and statewide code for coastal hazards - A State Special Plan for Coastal Hazards and emergency management - Development or revision of community-level mitigation and planning - Community education - A process to update evidence

Page 23
4.2 Hazard treatment approach
The hazard treatment approach follows the same methodology as a risk management process (see Figure
3), where the regulatory and public risk context establish the context, is underpinned by a series of
workshops held with hazard experts, land use
planners, building surveyors and industry stakeholders
as part of the adaptive process to the development
and implementation of the risk assessment, in order
to:
define the hazard [Risk identification];
consider available evidence and identify
options for mapping areas that may be
exposed to hazards throughout the State [Risk
analysis];
define the boundaries of the hazard bands
[Risk evaluation]; and
develop planning outcomes and controls to
apply within each band of the hazard matrix
[risk treatment].
Figure 3 The risk management process (adapted from Emergency Management Australia 2004)

Page 24
Acceptable: It is presumed that the risk in the
area is acceptable, as either the natural
hazard does not apply at all to the area, or
occurs with such low frequency that it is not
considered a matter that needs to be
addressed. Normal building controls and
emergency management responses are
considered adequate to address any residual
risk.
Low: The hazard occurs in the area but the
frequency is low enough, or the magnitude
when it does occur is low enough, that it
might be experienced by a significant
portion of the community without concern,
or where there is reasonable expectation
that a natural hazard may be present based
on the characteristics of the land and our
understanding of the hazard. Precautionary
controls that are proportional to the
importance of the use and development
may be appropriate, including requirements
for further site assessment or building
standards.
Medium: Our knowledge of the hazard
demonstrates that the likelihood is such that
when it does occur the impact could be
regarded as significant. Mitigation measures
should be required to discourage vulnerable
and hazardous uses from being located in
these areas, or impose discretionary
planning control on the form of a use or
development through assessment against
performance standards.
High: The hazard is frequent or severe, in that
it creates conditions not normally
considered manageable or tolerable without
exceptional measures to respond to the
natural hazard. It is to be presumed that
most use and development is unacceptable
in this area and any exceptional
development needs to be considered on a
case-by-case basis against rigorous tests and
by demonstrating a need and community
benefit for locating in the area.
5 Assessment of public risk and coastal hazards
The coastal hazard assessment is:
An assessment of the vulnerability of land to coastal hazards by assessing the potential frequency of
an event occurring or by defining areas that are susceptible to coastal hazards.
An assessment of the consequences of the occurrence of an event to development types.
A proposal of treatments to mitigate the
consequence (Hazard matrix).
Private risks associated with natural hazards are the
responsibility of individuals and businesses. Governments
should only intervene to ensure that private investment
minimises unacceptable public risk.
Public risk is closely associated with the economic concept
of ‘externalities’, being the costs/benefits of a development
that are experienced by the broader community. This issue
is addressed in more detail in Section 5.3.
5.1 Nature of public risk
Individuals, developers, communities and governments need
to balance costs associated with managing the impacts of
natural hazards with the benefits arising from development.
Communities with low tolerance for risk will place
significant controls in areas where communities with high
tolerance for risk would impose few (if any) controls on
development.
The proposed controls for coastal hazards are based on
two premises. First, the premise that high-magnitude
events have a very low frequency (such as a tsunami in
Tasmania) and low-magnitude events have a high frequency
(such as a daily high tide). This reflects the National
Emergency Risk Assessment Guidelines (NERAG) (2009).
Second, the premise that a hazard will affect all land
susceptible to that hazard at some point in time (the
‘precautionary principle’).
The options for managing the impacts of natural hazards
include:
Emergency management: The Emergency Management
Act 2006 controls emergency management
responses in Tasmania. Roles and responsibilities for
emergency management are outlined in the
Tasmanian Emergency Management Plan (TEMP).
The TEMP sets out the management arrangements
for each hazard, across Prevention, Preparedness,
Response and Recovery.
Building control: This provides the minimum standards
required for safety and amenity of buildings for the

Page 25
occupants. This is achieved through the requirement to meet an Australian Standard (eg. building in
bushfire prone areas), providing design guidance, or by requiring specialised investigations in sites
identified as being susceptible to a hazard.
Land use planning: including strategic planning, use and development controls: Strategic planning includes
placement of defences (such as flood barriers) and avoidance of the hazard (such as not building on
active landslides). Use controls include guidance on the zoning of land to highlight areas that are
unsuitable for vulnerable, hazardous or critical development. Development controls focus on the
form of the development (such as identifying a residential house envelope on a new parcel of land)
or requiring a minimum level of services (such as access to water, sewage and stormwater services).
The relationship between emergency management, building control and land use planning (strategic
settlement and statutory controls) is represented in Figure 4. The vertical axis represents the benefit
represented by each type of control, while the horizontal axis represents the intervention as composite of
the controls. The colouring on the graph represents the hazard changing from low likelihood-high
magnitude events to high likelihood-low magnitude events.
In the context of the SCP the lower likelihood higher magnitude events while consequence for existing
communities is potential significant the appropriate treatment is to restrict to through strategic planning for
existing community and a reliance on the emergency management process. At the other end of the scale
with high likelihood and low magnitude events the treatment is to avoid new development so as to
minimise the potential to require defensive works to protect the new developments. The difficulty arises in
locations, which are already developed; in these situations the preference is to develop adaption strategies
so that the minimum level of intervention to achieve the most appropriate outcomes for the community.
Figure 4 Public policy instruments to manage risk from natural hazards

Page 26
The hazard treatment approach (see Section 4.2) provides the framework to evaluate the threat posed by a
natural hazard and make judgements on the appropriate balance of controls. Hazard bands have been
mapped according to exposure to the hazard. The composition of the land use planning and building
controls in each hazard band defines the risk tolerance to the hazard and the responsible action to manage
the hazard for human settlements (Bell 2014). In defining this balance through the hazard treatment
approach, Tasmania provides a clear statement of tolerance to risk in any given location.
5.2 Public risk: development types
The assessment of tolerable risk considers whether risks can be (or should be) managed through planning
controls (eg. siting and use controls), building controls (eg. floor heights and engineering works), emergency
management related controls (eg. warnings and evacuations) or a combination thereof for each
development type. The development types primarily inform strategic planning or zoning as they initially
inform the assessment of public risk (see Section 5.3), then provide guidance on strategic and statutory
planning of land (see Sections 6 and 7):
Outside the Urban Growth Boundary relates to land that is outside the urban growth boundary defined
in the regional land use strategies. New use or development will typically be located on the fringes
of existing settlements and involve the intensification of agricultural land to urban or industrial uses.
The implication is that this may be able to be developed in a way that minimises exposure to known
hazards without an unreasonable increase in public risk.
Inside the Urban Growth Boundary relates to land that has been identified for urban development
that may include industrial, commercial or residential uses.
o Existing developments are areas within existing [coastal] settlements but may also include
buildings or dwellings located outside established communities. Existing developments are
those already developed and may, over time, be considered for redevelopment, which
keeps the at-risk population stable but increases the capital value of the location. In the
context of existing development within a settlement, adaptation involves mitigation of the
impact of the hazard balanced with the protection of public and private values. Mitigation
can be more complex, especially where decisions made in relation to the protection,
maintenance or ongoing depreciation of public land, infrastructure or services may affect
the integrity of private property.
A significant private right is afforded under LUPAA, in that existing development has the
right to not only continue to be used for original purpose in perpetuity, but it also has the
right to be rebuilt in the same location when destroyed due to a natural hazard, noting that
such rebuilding would be in accordance with current building standards. Further
intensification of use, or the change of use, should be in line with the strategic plan that
considers coastal hazards and fulfils the responsibilities of both state and local governments
to the coastal communities.
o Infill development are areas within existing (coastal) settlements that involves the
development or redevelopment of an unused or underused [coastal] site situated among
other existing developed sites. The focus is on developing vacant parcels of land to uses
that are compliant with the zoning. As with existing development, infill presents a complex
issue with the requirement to balance private rights with the responsibilities of state and
local governments. This can include new builds and significant redevelopments, renovations
and change of uses.

Page 27
5.3 Assessment of public risk
NERAG identifies six impact categories of consequence:
1. People: impacts on physical health, deaths and injuries
describes the potential consequence from deaths or injuries as a result of the emergency event
2. Environment: impacts on the ecosystem
relates to the destruction and degradation of critical environmental assets (and their processes and
structures) and/or species extinction and habitat range reduction
3. Economy: impacts economic activity
includes financial and economic losses resulting from damage due to the emergency event
4. Public administration: impacts on the governing body’s ability to govern
relates to the impact of the emergency event on the delivery of core functions (including infrastructure
service delivery) of the governing bodies for the community
5. Social Setting: impacts on society and its social fabric
relates to the impact to communities from the emergency event, as distinct from the individual impacts
assessed in the people criteria
6. Infrastructure: impacts on infrastructure
relates to the impact on critical services and infrastructure as a result of the emergency event; this
element is addressed as part of public administration.
Table 3 assesses public risk for these six impact categories against new, infill and existing development types.
The assessment considers the increase in public risks associated with the hazard bands. It is a qualitative
assessment to inform policy judgements. The assessment does not characterise the potential risk from
flooding or erosion as the relative level of vulnerability in the area rises. The table assesses each category
against each development type (greenfield, infill, existing) as it informs the hazard matrices for erosion (see
Section 6.3) and inundation (see Section 7.3).
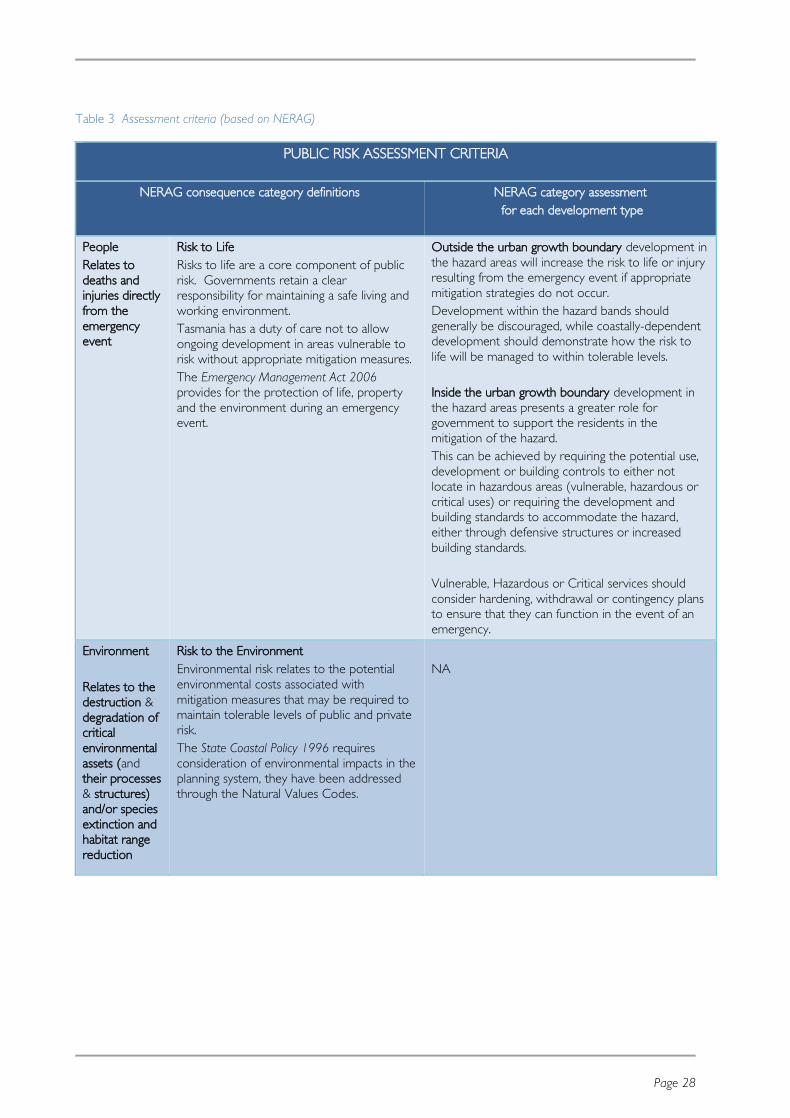
Page 28
Table 3 Assessment criteria (based on NERAG)
PUBLIC RISK ASSESSMENT CRITERIA
NERAG consequence category definitions
NERAG category assessment
for each development type
People
Relates to
deaths and
injuries directly
from the
emergency
event
Risk to Life
Risks to life are a core component of public
risk. Governments retain a clear
responsibility for maintaining a safe living and
working environment.
Tasmania has a duty of care not to allow
ongoing development in areas vulnerable to
risk without appropriate mitigation measures.
The Emergency Management Act 2006
provides for the protection of life, property
and the environment during an emergency
event.
Outside the urban growth boundary development in
the hazard areas will increase the risk to life or injury
resulting from the emergency event if appropriate
mitigation strategies do not occur.
Development within the hazard bands should
generally be discouraged, while coastally-dependent
development should demonstrate how the risk to
life will be managed to within tolerable levels.
Inside the urban growth boundary development in
the hazard areas presents a greater role for
government to support the residents in the
mitigation of the hazard.
This can be achieved by requiring the potential use,
development or building controls to either not
locate in hazardous areas (vulnerable, hazardous or
critical uses) or requiring the development and
building standards to accommodate the hazard,
either through defensive structures or increased
building standards.
Vulnerable, Hazardous or Critical services should
consider hardening, withdrawal or contingency plans
to ensure that they can function in the event of an
emergency.
Environment
Relates to the
destruction &
degradation of
critical
environmental
assets (and
their processes
& structures)
and/or species
extinction and
habitat range
reduction
Risk to the Environment
Environmental risk relates to the potential
environmental costs associated with
mitigation measures that may be required to
maintain tolerable levels of public and private
risk.
The State Coastal Policy 1996 requires
consideration of environmental impacts in the
planning system, they have been addressed
through the Natural Values Codes.
NA

Page 29
PUBLIC RISK ASSESSMENT CRITERIA
NERAG consequence category definitions
NERAG category assessment
for each development type
Economy
Relates to
reduced
economic
activity and
asset losses as
a result of the
emergency
event
Risk to the Economy
Risk to the economic activity of the region or
State associated with the loss of production
or value due to the impacts of a natural
disaster.
The statutory valuation of residential
properties and unimproved land value are
considered when they fall within a hazard
area to indicate the scale of vulnerability to
natural hazards.
Further consideration of potential loss due to
individual events, the cost of response and
recovery are not a factor in this work.
Outside the urban growth boundary use,
development or building works should consider the
increase in hazard from erosion and inundation.
The increase in hazard represents a progressive
change from private risk to public risk as the
importance of the use, development or building
increases.
Further development in these areas should be
minimised unless there is an increased public benefit
such as a coastally-dependent development for
which appropriate mitigation measures can be
undertaken.
Inside the urban growth boundary use, development
or building works should not unreasonably increase
the economic risk without with consideration of
mitigation strategies to reduce the economic burden
when the erosion or inundation event occurs.
Coastal defences in these areas, designed to protect
life, property and the environment, should be
economically sustainable for the life of the structure
and the assets they are protecting.
Vulnerable, Hazardous or Critical services should
consider hardening, withdrawal or contingency plans
to ensure that they can function in the event of an
emergency.
Public
administration
Concerned
with the
impact of the
emergency
event on the
delivery of
core functions
(including
infrastructure
service
delivery) of the
governing
bodies for the
community
Risk to Emergency Management Operations
and other critical services
Risk associated with the burden on
emergency services to act to protect lives, as
well as infrastructure, public and private
property during an emergency.
Risk to access to Critical Services and
Infrastructure
Risk to critical services and infrastructure
(public or private) is a public risk due to the
role critical services or infrastructure have in
maintaining communities, and the role they
play in assisting authorities to respond to an
emergency.
Outside the urban growth boundary use,
development or building works should consider the
ability of the emergency’s services to assist in the
relief and recovery.
Inside the urban growth boundary use, development
or building works must consider the level of hazard
on the proposal so as to not increase the burden on
emergency and critical services.
Vulnerable, Hazardous or Critical services should
consider hardening, withdrawal or contingency plans
to ensure that they can function in the event of an
emergency.

Page 30
PUBLIC RISK ASSESSMENT CRITERIA
NERAG consequence category definitions
NERAG category assessment
for each development type
Social setting
Concerned
with the
impact to
communities
from the
emergency
event, as
distinct from
the individual
impacts
assessed in the
people criteria
Moral Hazard
In the context of natural hazards, moral
hazard is the difference between the
resources that individuals and families have to
support their recovery, and the resources
required to support recovery to a moderate
standard of living.
These costs are borne by governments and
charitable donations to public appeals and
can reasonably be characterised as public
risks.
Risk to Ongoing Ownership
Public risk increases over time when risk
information, including an understanding of the
obligations to the landowner to maintain risk
mitigation measures or the accepted risk-
related costs are not clearly passed on to a
new owner on the sale of the property.
The result can be that individuals may be
unprepared to accept the consequences of
natural hazards and, therefore, there is
increased reliance on public assistance to
support mitigation or recovery-related costs.
In considering the potential impacts of coastal
hazards on a coastal community, the
Government has a clear responsibility to
ensure that the community is aware of the
hazards and the Government takes a
reasonable level of intervention as the
vulnerability to the hazard increases.
Outside the urban growth boundary use,
development or building works represent a new
moral hazard to government if they occur in a
known hazardous area without appropriate
consideration of the hazard.
Inside the urban growth boundary government
should support communities in the mitigation of
coastal hazards.
This will help the community to continue as a whole,
either in the aftermath of an event or as the hazard
slowly becomes apparent, noting that the
consideration of the hazard may cause some of the
values in the community to be compromised and a
transfer of private risk to the public.
Mitigation activities (including but not limited to
defensive works) should consider if the activity is
sustainable (socially and financially) for the
foreseeable future.

Page 31
6 Coastal erosion hazard assessment
6.1 Understanding coastal erosion planning bands evidence: identifying the hazard
MNHLUP indicative coastal erosion mapping is the result of a hazard assessment of the Tasmanian coastline
for coastal landform behaviour. The scientific background to this report is set out in Coastal erosion
susceptibility zone mapping for hazard band definition in Tasmania14 (Sharples et al 2013). The policy
decisions incorporated in the report and indicative mapping are outlined below.
Coastal landform behaviour includes storm erosion and longer-term shoreline recession in some
circumstances, and shoreline accretion (growth) or progradation in others. It is driven by a complex range
of processes and factors that may vary considerably from one coastal location to another. Factors include:
the inherent resilience or mobility of the physical landforms (geology and geomorphology); local wave
climate exposure; storm frequencies and magnitudes; local sediment sources and sinks; tidal and river
discharge currents; and the effects of artificial changes to the coast. The interaction between many of these
factors in driving coastal changes is complex to model due to the variation of the factors over short sections
of the coast.
This means that statewide assessments must be based on generic assessments of susceptibility and be
indicative, with the uncertainty built in to the response to each of the hazard areas. Tasmanian shorelines
include not only swell-exposed, open coast beaches, but also sheltered (eg. estuarine) sandy shores, soft-
rock (cohesive clay) shore, and hard rocky shores (including cliffs). Classifying shorelines in this way allows
all shores to be considered in the context of their erodability and their potential hazard bands, ranging from
Acceptable hazard (negligible) sloping hard-rock shores, through a range of Low and Medium hazard shores
to High hazard exposed soft sediment shores (Sharples et al 2013).
Using these data, the composition of Tasmanian coastal landforms has been divided into three broad
categories that reflect their fundamental differences in susceptibility to coastal erosion.
The three coastal substrate categories for susceptibility to coastal erosion will now be outlined.
14 Mapping projects include: Tasmanian first–pass coastal vulnerability assessment (Sharples 2006); several coastal landform
mapping projects for the three Tasmanian Natural Resource Management (NRM) zones (Sharples & Mowling 2006); a first pass
national coastal vulnerability assessment (DCC 2009) (Sharples, Mount & Pedersen, 2009) and a Coastal Hazards Assessment for
Kingborough LGA (Sharples & Donaldson 2013). These datasets have been variously checked and edited or extended to the full
Tasmanian coast. However, the use of these datasets to create ranked erosion susceptibility zone maps has not previously been
undertaken for Tasmania (or Australia): this is a new contribution from this project.
Data Analysis
The purpose is to translate the science into a format that can support policy
development
Hazard banding
Hazard matrix

Page 32
6.1.1 Soft sediment category
This category includes typically muddy or sandy types,
most readily eroded but also very mobile and capable
of accretion (growth) as well as erosion.
The distribution of soft sediments at the coast around
Tasmania is shown in Figure 5.
An assessment of the natural recession limit for the
SLRPA of 0.8 m AHD has been undertaken for coastal
soft sediment mapping. The natural recession limit is an
assessment of where the underlying bedrock rises
above the potential SLR and forms a physical barrier to
further recession.
Figure 5 Soft sediment bodies on the Tasmanian coast
Figure 6 illustrates how generic erosion hazard bands are defined for soft sediment coasts, showing
the storm bite, recession to 2050 and 2100, and the relationship to the natural recession limits.
Figure 6 Model to calculate erodible envelopes in soft sediments (from Sharples et al 2013)
The Mariani et al (2012) method to calculate storm bite and recession is detailed in Sharples et al
(2013). Of note, the (S1 + S5) and (S3 2050) and (S3 2100) susceptibility zones are described in
Sharples et al (2013) following Mariani et al (2012). With (S1 + S5) representing storm bite from two
back-to-back 1% AEP storms and associated slumping in soft sediments, this is, in effect, the immediate
erosion hazard.

Page 33
6.1.2 Soft-rock category
In Tasmania, soft rock bodies generally comprise cohesive clayey
materials that are more resistant to erosion than soft sediment,
but not as resistant as well-lithified rock.
These may erode slowly but significantly over time, and do not
rebuild as soft sandy shores may.
The distribution of soft rocks on the Tasmanian coast is shown in
Figure 7.
Figure 7 Coastal ‘soft-rock’ bodies on the Tasmanian coast
6.1.3 Hard-rock shoreline category
Hard-rock shoreline is mostly resistant to noticeable erosion on human timescales, although steeper
hard-rock shores may be notably unstable with occasional landslides and rock-falls occurring. Artificial
shorelines are also generally intended to resist erosion, although not all are designed with sufficient
structural integrity as to achieve this.
Figures 8 and 9 show the distribution of hard-rock and artificial shorelines found on the Tasmanian
coastline.
Figure 8 Hard-rock shorelines defined
for this coastal hazard assessment
Figure 9 Artificial shorelines incorporated
into this coastal hazard assessment
Each of the categories has been further subdivided according to key characteristics, which also play
important roles in determining susceptibility to coastal erosion on a regional scale. These include: broad
landform distinctions between (more stable) sloping rocky shores and (less stable) hard or soft-rock cliffs;
exposure to or sheltering from open coast swell wave climates; and whether the area of coast has been
armoured by artificial shorelines to resist erosion.

Page 34
Several methods have been used to define potential erosion susceptibility zones (or ‘setbacks’) behind
shores of each category as described in Sharples et al (2013). For open coast sandy beaches, a well-
established and widely used erosion and recession hazard modelling technique described by Mariani et al
(2012) was used, based on approaches previously used in NSW and Qld. However, similarly well-
established and widely used modelling approaches for swell-sheltered soft sediment shores or soft-rock
shores are not available. For these, empirical data was employed, taken from historic aerial photography
and shoreline profiling surveys, in order to define erosion and recession setbacks based on actual measured
erosion cuts and shoreline recession rates for Tasmanian shores. A precautionary factor was applied to
allow for the limited scope of the available empirical data.
For hard-rock cliffs, an appropriate setback modelling technique was identified, but this cannot be employed
until high-resolution topographic mapping is available for more of the Tasmanian coast. In lieu of this, a
precautionary setback was defined, which is adequate to cover the scales of cliff instability considered likely
for Tasmanian coasts. Moderately sloping hard-rock shores are considered to have Acceptable (negligible)
erosion hazard based on the lack of significant historically-observed instability in this shoreline type.
Resilient artificial shores are also considered to have negligible erosion hazard, while artificial shorelines
judged to not be resilient are treated as if no artificial works were present.
6.1.4 Defining the Coastal Erosion Mapping Components
Using these approaches, coastal erosion and recession susceptibility zones were defined as shoreline buffers
or setbacks of differing widths for each shoreline category. For each category, setbacks of four different
types were generally defined, as depicted in Figure 10:
1. Storm bite erosion hazard: the amount of erosion and consequent head scarp instability that could
potentially occur at any time in response to two back-to-back 1% AEP storm events.
2. Shoreline recession to 2050: the amount of shoreline recession that could potentially occur in
response to projected SLR to 2050, in addition to the storm bite erosion hazard.
3. Shoreline recession to 2100: the amount of shoreline recession that could potentially occur in
response to projected SLR to 2100, in addition to the storm bite erosion hazard.
4. Shorelines beyond the limit of potential erosion or recession by 2100.
Figure 10 Idealised schematic of a dune profile depicting the high hazard area, 2050 coastal hazard area and 2100 coastal
hazard area (after Nielson et al (1992) and used by Mariani et al (2012) and Sharples et al (2013))
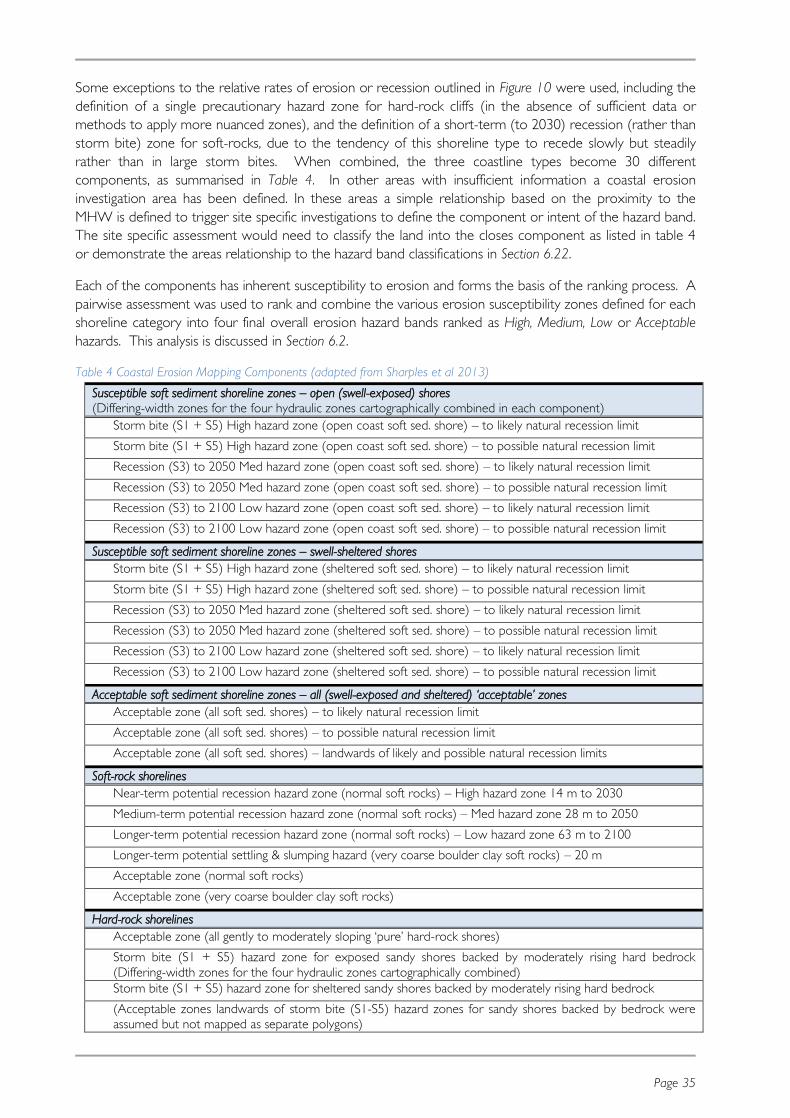
Page 35
Some exceptions to the relative rates of erosion or recession outlined in Figure 10 were used, including the
definition of a single precautionary hazard zone for hard-rock cliffs (in the absence of sufficient data or
methods to apply more nuanced zones), and the definition of a short-term (to 2030) recession (rather than
storm bite) zone for soft-rocks, due to the tendency of this shoreline type to recede slowly but steadily
rather than in large storm bites. When combined, the three coastline types become 30 different
components, as summarised in Table 4. In other areas with insufficient information a coastal erosion
investigation area has been defined. In these areas a simple relationship based on the proximity to the
MHW is defined to trigger site specific investigations to define the component or intent of the hazard band.
The site specific assessment would need to classify the land into the closes component as listed in table 4
or demonstrate the areas relationship to the hazard band classifications in Section 6.22.
Each of the components has inherent susceptibility to erosion and forms the basis of the ranking process. A
pairwise assessment was used to rank and combine the various erosion susceptibility zones defined for each
shoreline category into four final overall erosion hazard bands ranked as High, Medium, Low or Acceptable
hazards. This analysis is discussed in Section 6.2.
Table 4 Coastal Erosion Mapping Components (adapted from Sharples et al 2013)
Susceptible soft sediment shoreline zones – open (swell-exposed) shores
(Differing-width zones for the four hydraulic zones cartographically combined in each component)
Storm bite (S1 + S5) High hazard zone (open coast soft sed. shore) – to likely natural recession limit
Storm bite (S1 + S5) High hazard zone (open coast soft sed. shore) – to possible natural recession limit
Recession (S3) to 2050 Med hazard zone (open coast soft sed. shore) – to likely natural recession limit
Recession (S3) to 2050 Med hazard zone (open coast soft sed. shore) – to possible natural recession limit
Recession (S3) to 2100 Low hazard zone (open coast soft sed. shore) – to likely natural recession limit
Recession (S3) to 2100 Low hazard zone (open coast soft sed. shore) – to possible natural recession limit
Susceptible soft sediment shoreline zones – swell-sheltered shores
Storm bite (S1 + S5) High hazard zone (sheltered soft sed. shore) – to likely natural recession limit
Storm bite (S1 + S5) High hazard zone (sheltered soft sed. shore) – to possible natural recession limit
Recession (S3) to 2050 Med hazard zone (sheltered soft sed. shore) – to likely natural recession limit
Recession (S3) to 2050 Med hazard zone (sheltered soft sed. shore) – to possible natural recession limit
Recession (S3) to 2100 Low hazard zone (sheltered soft sed. shore) – to likely natural recession limit
Recession (S3) to 2100 Low hazard zone (sheltered soft sed. shore) – to possible natural recession limit
Acceptable soft sediment shoreline zones – all (swell-exposed and sheltered) ‘acceptable’ zones
Acceptable zone (all soft sed. shores) – to likely natural recession limit
Acceptable zone (all soft sed. shores) – to possible natural recession limit
Acceptable zone (all soft sed. shores) – landwards of likely and possible natural recession limits
Soft-rock shorelines
Near-term potential recession hazard zone (normal soft rocks) – High hazard zone 14 m to 2030
Medium-term potential recession hazard zone (normal soft rocks) – Med hazard zone 28 m to 2050
Longer-term potential recession hazard zone (normal soft rocks) – Low hazard zone 63 m to 2100
Longer-term potential settling & slumping hazard (very coarse boulder clay soft rocks) – 20 m
Acceptable zone (normal soft rocks)
Acceptable zone (very coarse boulder clay soft rocks)
Hard-rock shorelines
Acceptable zone (all gently to moderately sloping ‘pure’ hard-rock shores)
Storm bite (S1 + S5) hazard zone for exposed sandy shores backed by moderately rising hard bedrock
(Differing-width zones for the four hydraulic zones cartographically combined)
Storm bite (S1 + S5) hazard zone for sheltered sandy shores backed by moderately rising hard bedrock
(Acceptable zones landwards of storm bite (S1-S5) hazard zones for sandy shores backed by bedrock were
assumed but not mapped as separate polygons)

Page 36
Regression & slump hazard zone (steep to cliffed hard-rock shores) (standard precautionary 50 m buffer used
in all cases)
(Acceptable zones landwards of hazard zone for steep to cliffed hard-rock shores were assumed but not
mapped as separate polygons)
Artificial shorelines
Acceptable zone landwards of resilient artificial shores (defined as acceptable hazard to the landwards extent
that any (non-acceptable) hazard zones would be defined for the shoreline type present in the absence of
resilient artificial protection)
(Non-resilient artificial shores ignored; zoned according to the natural shoreline type in the absence of artificial
protection)
Coastal Erosion Investigation Area(not included in the pairwise ranking)
Coastal Erosion Investigation Area: Coastal areas for which insufficient information is available to categorise
their susceptibility to coastal erosion and recession.
6.2 Defining coastal erosion hazard planning bands: analysing the hazard
The previous section of this Report describes the erosion hazard zones adopted for the three broadly-
defined coastal substrate categories (soft sediment, soft-rock and hard-rock), as well as artificial shorelines.
To develop an indicative, integrated coastal erosion susceptibility map, each of the zoning schemes need to
be merged into a single hazard susceptibility scheme, which incorporates an assessment of the relative
hazards posed by the various hazard zones within each substrate type. This has been achieved by using a
pairwise assessment.
6.2.1 Pairwise assessment
A pairwise assessment is a tool to support decision-making by helping non-technical experts to
understand the relative susceptibility of each coastal erosion hazard component (Hansen & Ombler, 2009). The pairwise assessment delivers two outcomes:
It translates the expert knowledge on coastal hazards for policymakers. The expert knowledge
includes an understanding of the components that make up coastal erosion on the Tasmanian
coastline, confidence in the spatial and attribute accuracy, and the expert opinion on the ‘likelihood’ that the erosion may occur in this area and its scale/magnitude.
It provides an order of importance for merging the components into a single planning layer,
ensuring that a less important component does not overwrite a more important feature.
Data Analysis
The purpose is to apply policy judgements on the evidence and
understand the impact of the bands
Hazard banding
Hazard matrix

Page 37
During the data analysis stage (Section 6.1), the coastal erosion components were broadly divided into
two groups: the first ranked based on a natural order15, the second being un-dominated components
for which there is no natural order of importance. The components with a natural order are identified
in Table 5; the un-dominated components make up the remaining elements in Table 6.
Table 5 Coastal erosion components with a natural order
Storm bite (S1 + S5) High hazard zone (open coast soft sed. shore) – to likely natural recession limit
Recession (S3) to 2050 Med hazard zone (open coast soft sed. shore) – to likely natural recession limit
Recession (S3) to 2100 Low hazard zone (open coast soft sed. shore) – to likely natural recession limit
Acceptable hazard zone (All gently to moderately sloping ‘pure’ hard-rock shores)
Resilient artificial shores (Low hazard storm bite zone landwards of resilient artificial shores)
Storm bite (S1 + S5) High hazard zone (sheltered soft sed. shore) – to likely natural recession limit
A pairwise assessment completed by the authors of the technical report (Sharples et al 2013) ranked
the components from must susceptible to least susceptible to coastal erosion. An extract of the
assessment is provided in Table 6, with the full pairwise assessment in the technical report. Each
component is listed on both the horizontal and vertical axes of the table.
Considering each column versus each row in turn, the following question was asked: ‘Which (of each
column vs row pair) is more susceptible to coastal erosion?’ Depending on the answer agreed, the
intersecting column vs row cell was scored as follows: a value of (1000) was given to the component
that was ‘more susceptible’, and a value of (1) was given to the component that was ‘less susceptible’.
A value of 100 was given to both components if they were considered equally susceptible.
Table 6 Extract of the pairwise assessment
15 Components that can be ranked with a natural order are those in which there is a clear order of importance. For example, in
the case of soft sediments shores, areas with a soft sediments swell-exposed storm bite classification have a ‘natural order’ that is
higher than areas classified as soft sediment swell-sheltered coast recession areas to 2050.

Page 38
Table 7 provides the relative rankings of the components by the consultant. Of note is the relationship
between the components with a natural order (bold) and the un-dominated components, indicating the
spread of values within the components.
Table 7 Results of the pairwise assessment
Coastal erosion hazard zone component Pairwise
assessment
score
Acceptable hazard zone (all gently to moderately sloping ‘pure’ hard-rock shores) 24
Acceptable hazard zone (very coarse boulder clay soft rocks) 1023
Acceptable hazard zone (normal soft rocks) 2022
Acceptable hazard zone (all soft sed. shores) – landwards of likely and possible natural
recession limits
3021
Acceptable hazard zone (all soft sed. shores) – to possible natural recession limit 4020
Acceptable hazard zone (all soft sed. shores) – to likely natural recession limit 5217
Resilient artificial shores (Acceptable recession zones landwards of resilient artificial
shores)
5316
Resilient artificial shores (Low hazard storm bite zone landwards of resilient artificial
shores)
5316
Longer-term potential settling & slumping hazard (very coarse boulder clay soft rocks) –
20 m
5514
Recession (S3) to 2100 Low hazard zone (sheltered soft sed. shore) – to possible natural
recession limit
7215
Regression & slump hazard zone (steep to cliffed hard rocks) 7413
Longer-term potential recession hazard zone (normal soft rocks) – Low hazard zone 63 m
to 2100
7512
Recession (S3) to 2100 Low hazard zone (open coast soft sed. shore) – to possible
natural recession limit
9312
Recession (S3) to 2100 Low hazard zone (sheltered soft sed. shore) – to likely natural
recession limit
10311
Recession (S3) to 2050 Med hazard zone (sheltered soft sed. shore) – to possible natural
recession limit
12309
Recession (S3) to 2100 Low hazard zone (open coast soft sed. shore) – to likely natural
recession limit
13110
Medium-term potential recession hazard zone (normal soft rocks) – Med hazard zone 28
m to 2050
14307
Recession (S3) to 2050 Med hazard zone (open coast soft sed. shore) – to possible
natural recession limit
15207
Recession (S3) to 2050 Med hazard zone (sheltered soft sed. shore) – to likely natural
recession limit
15306
Recession (S3) to 2050 Med hazard zone (open coast soft sed. shore) – to likely natural
recession limit
17205
Near-term potential recession hazard zone (normal soft rocks) – High hazard zone 14 m
to 2030
18105
Storm bite (S1 + S5) hazard zone for sheltered shores (sandy shores backed by
moderately rising hard bedrock)
20202
Storm bite (S1 + S5) High hazard zone (sheltered soft sed. shore) – to possible natural
recession limit
21003
Storm bite (S1 + S5) High hazard zone (open coast soft sed. shore) – to possible natural
recession limit
21102

Page 39
Storm bite (S1 + S5) High hazard zone (sheltered soft sed. shore) – to likely natural
recession limit
22101
Storm bite (S1 + S5) hazard zone for exposed shores (sandy shores backed by
moderately rising hard bedrock)
24000
Storm bite (S1 + S5) High hazard zone (open coast soft sed. shore) – to likely natural
recession limit
24100
6.2.2 Coastal Erosion Hazard Bands
The boundaries represent both the areas vulnerable to coastal erosion and the relative risk within that
vulnerability. The area vulnerable to erosion is defined as the land between the MHT and the landward
edge of the area susceptible to coastal erosion, as discussed in the previous section. The relative risk is the
area that will be managed to mitigate the impact of coastal erosion through emergency management,
planning, development and building controls.
The boundaries are defined based on the ranking of the components, consultation with regulators, industry
and policymakers (see Appendix 1), current regulatory practice, and consultation on the draft matrix and
indicative mapping.
The principles that were agreed during the workshop process provided the following guidance to the
development of the hazard bands:
The High hazard band should be the most vulnerable to a hazardous erosion event that may occur at
any time. It represents the area in which the State has the greatest duty of care to manage the risk to
life and property, furthermore the High hazard band contains the area which may be considered to be
actively mobile landforms, on which the SCP does not permit development unless for engineering or remediation works to protect land, property and human life .
The Medium and Low bands should consider recession to 2050 and 2100 respectively. These represent
the areas in which the State’s duty of care is realised through a moral hazard created in part due to historic development patterns.
The Acceptable band should be the area vulnerable to recession beyond 2100. It represents the area in
which the State’s duty of care is not in place as the level of impact is beyond what is able to be reasonably predicted or responded to at this point in time.
The coastal erosion Investigation band will identify areas in which the underlying data is poorly
understood and is within 1 km of the coast 16and requires further investigation.
The proposed thresholds recognise that while the indicative coastal erosion mapping is based on relative
susceptibility, its operation is different to hazards such as landslide as it is a highly dynamic hazard.
Boundary between Acceptable and Low hazards
The workshops agreed that the boundary between Acceptable and Low should include components that
have been valued as more than the ‘Resilient artificial shores (Low hazard storm bite zone landwards of resilient
artificial shores)’: one of the natural order components. The implication of this is that areas that would
normally be vulnerable to a storm bite event but are defended by artificial shore have a Low hazard banding
instead of a High hazard banding.
If the defence is overwhelmed during a storm, the land behind it has a recognised vulnerability. However,
other resilient shorelines with an underlying recession classification are recognised as presenting a
vulnerability that does not require management.
16 The SCP defines the coastal zone as within 1 km of HWM, this ensures that the investigation area is consistent with
the SCP.

Page 40
The implication of this threshold is that the Low band will be required to manage the long-term recession
risk to 2100.
Other coastal erosion components such as slump hazards (steep to cliffed hard-rock) are included in the
Low band due to both the potential impact of a failure in this area and the unpredictability of potential
failures.
Boundary between Low and Medium hazards
The intention of the Medium band is to address medium-term recession to 2050. The workshops identified
‘Recession (S3) to 2050 Medium hazard zone (sheltered soft sediment shore) – to possible natural recession
limit’ as the appropriate threshold between the Low and Medium hazard bands.
Boundary between Medium and High hazards The workshops agreed that the boundary between Medium and High is set at components most vulnerable
to hazardous erosion events in 2010. This is limited to soft sandy shorelines, either in sheltered or open
coast, which can be reasonably considered as potentially actively mobile landforms.
Composition of the coastal erosion hazard bands
Figure 11 and Table 8 illustrate the outcomes of assessment of the relative importance of components in
the indicative coastal erosion hazard maps, while Figure 12 provides an example of the hazard banding at
Lauderdale. The indicative coastal erosion hazard maps were endorsed by the Tasmanian Government in
January 2014 to support the planning, development and building controls.
Figure 11 Coastal erosion rankings and hazard bands

Page 41
Table 8 Coastal erosion components and hazard bands
Coastal erosion hazard zone component
Pairwise
assessment
score
Acceptable hazard zone (all gently to moderately sloping ‘pure’ hard-rock shores) 24
Acceptable hazard zone (very coarse boulder clay soft rocks) 1023
Acceptable hazard zone (normal soft rocks) 2022
Acceptable hazard zone (all soft sed. shores) – landwards of likely and possible natural recession limits
3021
Acceptable hazard zone (all soft sed. shores) – to possible natural recession limit 4020
Acceptable hazard zone (all soft sed. shores) – to likely natural recession limit 5217
Resilient artificial shores (Acceptable recession zones landwards of resilient artificial shores) 5316
Resilient artificial shores (Low hazard storm bite zone landwards of resilient artificial shores) 5316
Longer-term potential settling & slumping hazard (very coarse boulder clay soft rocks) – 20 m 5514
Recession (S3) to 2100 Low hazard zone (sheltered soft sed. shore) – to possible natural recession limit
7215
Regression & slump hazard zone (steep to cliffed hard rocks) 7413
Longer-term potential recession hazard zone (normal soft rocks) – Low hazard zone 63 m to 2100 7512
Recession (S3) to 2100 Low hazard zone (open coast soft sed. shore) – to possible natural recession limit
9312
Recession (S3) to 2100 Low hazard zone (sheltered soft sed. shore) – to likely natural recession limit
10311
Recession (S3) to 2050 Med hazard zone (sheltered soft sed. shore) – to possible natural recession limit
12309
Recession (S3) to 2100 Low hazard zone (open coast soft sed. shore) – to likely natural recession limit
13110
Medium-term potential recession hazard zone (normal soft rocks) – Med hazard zone 28 m to 2050 14307
Recession (S3) to 2050 Med hazard zone (open coast soft sed. shore) – to possible natural recession limit
15207
Recession (S3) to 2050 Med hazard zone (sheltered soft sed. shore) – to likely natural recession limit
15306
Recession (S3) to 2050 Med hazard zone (open coast soft sed. shore) – to likely natural recession limit
17205
Near-term potential recession hazard zone (normal soft rocks) – High hazard zone 14 m to 2030 18105
Storm bite (S1 + S5) hazard zone for sheltered shores (sandy shores backed by moderately rising hard bedrock)
20202
Storm bite (S1 + S5) High hazard zone (sheltered soft sed. shore) – to possible natural recession limit
21003
Storm bite (S1 + S5) High hazard zone (open coast soft sed. shore) – to possible natural recession limit
21102
Storm bite (S1 + S5) High hazard zone (sheltered soft sed. shore) – to likely natural recession limit 22101
Storm bite (S1 + S5) hazard zone for exposed shores (sandy shores backed by moderately rising hard bedrock)
24000
Storm bite (S1 + S5) High hazard zone (open coast soft sed. shore) – to likely natural recession limit
24100

Page 42
Figure 12 Indicative coastal erosion hazard band mapping (Ralphs Bay – Lauderdale area)
Considering the above the coastal erosion hazard bands are outlined in Table 9.
Table 9 Definition of coastal erosion hazard bands
Acceptable This area is resilient to coastal erosion (hard rock shore), or is beyond the predicted recession
of the coast to 2100.
Low This area is vulnerable to coastal recession to 2100, or is protected by coastal defences that are
considered resilient for planning purposes.
Medium This area is vulnerable to coastal recession to 2050
High This area is vulnerable to two back to back 1% AEP erosion events that result in a storm bite
and associated slumping.
Coastal
Erosion
Investigation
Area
This area does not have adequate information to judge if it is in a hazard band and requires a
site specific assessment.
6.2.3 Coastal erosion investigation area
The coastal erosion investigation areas represent areas of the State which have insufficient information to
classify into a hazard band. While the coastal erosion investigation areas represent identifiable errors within
the underlying data, including incomplete data to classify into a component or has a logical inconsistency
within the data set. However, such areas do not include areas with inaccurate underlying data that could
only be identified with extensive fieldwork or local knowledge.

Page 43
As a basis for the creation of the coastal erosion investigation area the following assumptions were used to
testing the coastal erosion hazard areas for errors and inconsistencies:
All parts of the coast have been classified into a hazard component and coastal erosion hazard
band (hazard band) including high, medium, low, coastal erosion investigation area, or
acceptable. The hazard bands have been supplied by DPAC as an output of the Coastal
Hazards Planning Report (in draft).
Not all hazard components will intersect with the coast line (some are present only landwards
of the coast line).
The coastline for the purposes of this hazard banding is the cartographic LIST HWM line, which
is based on cartographic interpretation of air photos and may not be correct in all locations.
Temporal and some spatial / attribute errors cannot be validated through this process and
should be reviewed in a local context.
Coastal erosion hazard banding is based on the project data set
tascoasterosionhazardbands_v1_2013_MGA.shp.
Higher hazard bands should not occur landwards of lower hazard bands (such situations may
be validly based on accurate base data, for example where soft Tertiary clays overlie a hard
rock shoreline just landwards of the shore; however in such cases the Tertiary clays are
effectively protected from marine erosion and thus are not actually at higher risk of erosion
than the hard shore).
6.2.4 Analysis of the coastal erosion planning boundaries
Understanding the impact of the coastal inundation planning boundaries is important when gauging the
effect of policy on the Tasmanian community. The assessment focuses on the total area of private and
public land, the number of residential properties, and the number of vacant parcels. The analysis is
provided at both the State level (body of the report) and for each local government area (see
Appendix 6) and includes:
The area (hectares) of land in each band.
The low-medium-high and coastal erosion investigation area contains approximately 0.49% of
Tasmania’s land mass. Figure 13 shows the proportion of the land and the area in hectares within
each band. Of note is the coastal erosion investigation area. The majority of this area is located
on the southern and western coasts of Tasmania and the Furneaux Islands. Appendix 6 provides a
table of areas (ha) for each LGA.
Figure 13 Coastal erosion hazard band area (area hectares, and proportion of area within a hazard area)
14518, 26%
13313, 23% 18494, 33%
10040, 18%
CE High
CE Medium
CE Low
CE Investigation

Page 44
The number of residential dwellings is based on a 10 m building envelope around the centre
point of the building supplied by LIST data services and is correct at the time of publication for
each 1:25 000 topographic map series.
Calculation of the number of residential buildings is based on a simple intersect between the
hazard band and the envelope of the building. In which the highest hazard band the envelope
intersects is the hazard value assigned to it17.
This is shown in Figure 14, where adjacent houses may be in or out depending on the location of
the centre point for the house.
Figure 14 Calculating the number of houses impacted
Approximately 2.8% of residential building envelopes are within the Investigation Area Low-Medium-
High coastal erosion hazard bands. Figure 15 provides an overview of the number of residential
buildings in each band, their capital value and the area of developable land. Based on the modelling it
is expected that:
The number of residential building envelopes vulnerable to coastal erosion will grow from
769 present-day to between 4 001 and 5 188 by 2100, or with a 0.8 m SLR. That is a five-fold
increase in vulnerability.
The value of the residential building vulnerable to coastal erosion will grow from $307 million at
present-day to between $1 526 and $2 002 million by 2100, or with a 0.8 m SLR.
17 Previous versions of this calculation were based on the house centroid: this was found to underestimate the potential impact.
House
envelope
in the
hazard
band
House
envelope
not in the
hazard
band

Page 45
Figure 15 Summary plot of coastal erosion impacts: buildings and capital value
6.3 Coastal erosion hazard planning matrix – evaluation and treatment of hazard
Based on the evidence and analysis of Tasmania’s coastal erosion hazard risk described in the previous
sections, and the outcomes of the workshop process, the recommended response to each coastal erosion
hazard band for the development types Greenfield, Infill or Existing is outlined below. A summary of
outcomes of the workshops is provided in Appendix 1.
The Coastal Erosion Hazard Matrix is divided into two sections: the first for strategic elements, while the
second addresses the statutory guidance for the development of planning and building controls.
The planning matrix (Sections 6.3.1 to 6.3.5) includes the hazard banding, control levels, strategic planning
level, and use and development controls. Table 10 provides detail on vulnerable, hazardous, critical and
coastal defences.
Planning bands (likelihood): regions where it is presumed that the erosion hazard will exist at a
relatively high, medium, low, or acceptable level
Investigation Low Medium High
Residential Building 814 1720 1334 734
Captial Valuation ($m 2013) 253 686 481 296
0
200
400
600
800
1000
1200
1400
1600
1800
2000
Data Analysis
The purpose is to apply risk controls to manage the impact
of the bands
Hazard banding
Hazard matrix
Page 46
Balance of controls: generalised statements regarding the presumed consequences associated with
erosion hazard planning bands
Strategic planning level: agreed measures that should be employed through strategic planning to
determine if the benefits to the community of requiring consideration of whether development in
certain areas is subject (or likely to be subject) to a natural hazard outweigh the costs to the
community and individuals
Planning and development controls: agreed measures that should be imposed on use to reduce risks
from erosion. The measures consider rezoning, greenfield, infill, and existing use or development. Use
and development controls are defined as:
o Use controls: agreed measures that should be imposed on use to reduce risks from coastal
hazards. LUPAA defines use as “in relation to land, includes the manner of utilising land but does
not include the undertaking of development”. For the purpose of coastal hazards, use types will
be considered as Greenfield, Infill, Existing – and critical, vulnerable or hazardous.
o Development controls: agreed measures that should be imposed on development to reduce
risks in each hazard band. LUPAA defines development as:
- the construction, exterior alteration or exterior decoration of a building
- the demolition or removal of a building or works
- the construction or carrying out of works
- the subdivision or consolidation of land, including buildings or airspace
- the placing or relocation of a building or works on land
- the construction of, or putting up for display, signs or hoardings.
Building controls: agreed measures that should be imposed on building to reduce risks in each hazard
band to tolerable levels. The Building Act 2000 provides for the control of the construction and
maintenance of buildings and building or plumbing matters. Building work includes a proposed building,
part of a building, a structure or a part of a structure. For the purpose of the hazard matrix it also
includes works associated with the construction of the building.
6.3.1 Coastal erosion – high hazard band
Hazard
Exposure
The High hazard band is vulnerable to erosion from two back-to-back 1% AEP storm
events.
Description
of area
The high hazard band represents the active coastal landforms areas extending from the
mean high tide to between 22 m (East Coast) and 73 m (West and South West Coasts)
inland depending on the coastal region and if the coast is, open or sheltered.

Page 47
Example
map of
exposure
Balance of
controls
Planning and building controls are necessary for all use and development to ensure that risks
are managed. If the area is an actively mobile landform then development is not permitted
except for engineering or remediation works to protect land, property and human life.
If the area is not an actively mobile landform then:
New use or development is not permitted unless it is coastally dependent or a
development to an existing building;
Building controls apply for work to new and existing buildings and associated works
requiring a building permit. The site should be considered problem site for coastal
erosion.
Work must not increase the erosion or inundation risk to neighbouring properties.
Planning objectives
Strategic
Objectives
This area should be zoned for non-residential or industrial use, and ensure new use or
development on actively mobile landforms is not permitted with exception of works that
minimise the areas need for engineering or remediation works to protect land property, and
human life.
Coastal defences, critical, hazardous, or vulnerable use and development are not permitted
on actively mobile landforms unless they are part of works that minimise the area need for
engineering or remediation works to protect land property, and human life.
High Hazard band open
coast – up to 35 m in land
from MHT line
Bruny Island Neck
Coastal region: Storm Bay
Open and sheltered coast
High Hazard band sheltered
coast – up to 22 m in land
from MHT line

Page 48
Outside
the Urban
Growth
Boundary
If the area is an actively mobile landform then development is not permitted except for
engineering or remediation works to protect land, property and human life.
If the area is not a actively mobile landform then:
Strategies should not permit zonings that allow new development. The exception being
for utilities that cannot be reasonably located elsewhere or coastal-dependent uses that
meet the objectives in Table 10 and minimise the need for engineering or remediation
works.
Coastally-dependent or temporary use and development are allowed subject to
demonstrating that they will meet the objectives in Table 10 and minimise the need for
engineering or remediation works.
Other use or development, including and vulnerable, hazardous, critical uses or coastal
defences not associated with an existing dwelling or a coastally-dependent use or
development is not permitted.
Inside
urban
growth
boundary
Infill use or development
If the area is an actively mobile landform then development is not permitted except for
engineering or remediation works to protect land, property and human life.
If the area is not a actively mobile landform then:
New use or development, including and vulnerable, hazardous, critical uses not
associated with a coastally-dependent use or development is prohibited.
Utilities that cannot be reasonably located elsewhere meet the objectives in Table 10 and minimise the need for engineering or remediation works.
Coastally-dependent (including coastal defences) or temporary use and
development are allowed subject to demonstrating that they meet the objectives in
Table 10 and minimise the need for engineering or remediation works.
Existing use or development
If the area is an actively mobile landform then development is not permitted except for
engineering or remediation works to protect land, property and human life.
If the area is not a actively mobile landform then:
Work to existing buildings will be managed through building control measures.
The substantial intensification of vulnerable, hazardous, critical uses or coastal
defences are discretionary, subject to demonstrating that they achieve the relevant
objectives in Table 10.
Building objectives
Building
and
associated
works.
Building design and associated works should consider the land as part of a coastal erosion
area. In this area:
The design of the Building and Associated works should consider potential erosion
through either hardening of the structures or by simplifying the relocation of the
building to unaffected areas as the risk from erosion is realised.
A ‘P’ classification under AS2870 residential footing and foundations for erosion
should be considered for the site classification.
Building and associated works must not increase the erosion or inundation risk to
neighbouring properties and minimise the need for engineering or remediation
works.

Page 49
6.3.1 Coastal erosion – medium hazard band
Hazard
Exposure
The medium hazard band is the area vulnerable to coastal recession by 2050.
Description of
area
The medium hazard band includes soft rock and soft sediment (sand) areas. This area
extending from the MHT to between 28 m and 113 m inland depending on if the coast is
made of soft rocks or sediments, the coastal region, and if the coast is, open or sheltered.
While this area is vulnerable to coastal recession to 2050 due to SLR it is not an actively
mobile land form system in the same vain as a frontal dune.
Example map of
exposure
Balance of
controls
Planning and building controls are necessary for all use and development to ensure that
risks are managed. Vulnerable, hazardous, or critical uses may be allowed if associated
with a coastally dependent use.
Building controls apply for all buildings and associated works requiring building permit. The
site should be considered problem site for coastal erosion. Works must not increase the
erosion risk for neighbouring properties.
Planning objectives
Strategic
Objectives
When broader planning considerations support the development of the area, the low and
medium hazard band classification should not challenge the existing zoning in existing
communities.
However, if an area is to be rezoned to a more intensive use consideration of the hazard
is required so that future development minimises the impact of the hazard.
Medium Hazard band open
coast –up to 113 m in land from
MHT line
Bruny Island Neck
Coastal region: Storm Bay
Open and sheltered coast
Medium Hazard band sheltered
coast – up to 49 m in land from
MHT line

Page 50
Outside the
Urban Growth
Boundary
New use or development not requiring a building permit is allowed subject to
demonstrating a tolerable risk to coastal erosion can be achieved while minimising the
increase in risk to public asset or reliance on defensive structures.
Vulnerable, hazardous, critical uses or coastal defences associated with an exisitng dwelling
or a coastally-dependent use are allowed subject to demonstrating that they achieve the
relevant objectives in Table 10.
Inside urban
growth
boundary
Infill use or development
Infill use or development will be managed through building control measures.
Vulnerable, hazardous, critical uses or coastal defences are discretionary, subject to
demonstrating that they achieve the relevant objectives in Table 10.
Existing use or development
Work to existing buildings will be managed through building control measures.
The substantial intensification of vulnerable, hazardous, critical uses or coastal defences are
discretionary, subject to demonstrating that they achieve the relevant objectives in Table
10.
Building objectives
Building and
associated
works.
Building design and associated works should consider the land as part of a coastal erosion
area. In this area:
The design of the Building and Associated works should consider potential erosion
through either hardening of the structures or by simplifying the relocation of the
building to unaffected areas as the risk from erosion is realised.
A ‘P’ classification under AS2870 residential footing and foundations for erosion
should be considered for the site classification.
Building and associated works must not increase the erosion or inundation risk to
neighbouring properties and minimise the need for engineering or remediation
works.
6.3.2 Coastal erosion – low hazard band
Hazard
Exposure
This area has been identified as vulnerable to a coastal recession by 2100 based on the
elevation, soil, or rock type of the area and current SLR models.
Or
This area is protected by a resilient defence for erosion.
Description of
area
The low hazard band represents the coastal landforms that face long-term recession to
2100, including soft rocks and soft sediment areas. This area extending from the MHT to
between 50 m and 83 m inland depending on if the coast is made up of soft rocks or
sediments, the coastal region, and if the coast is, open or sheltered.

Page 51
Example map of
exposure
Balance of
controls
While non-construction requirements are unnecessary for most use and development, the
capacity for the use and development to adapt should be encouraged. Controls may be
necessary to reduce the risks associated with vulnerable, hazardous or critical uses to
ensure that residual tolerable risk is achieved.
Building controls apply for all buildings and associated works requiring a building permit.
The site should be considered problem site for coastal erosion. Works must not increase
the erosion or inundation risk for neighbouring properties.
Planning objectives
Strategic
Objectives
When broader planning considerations support the development of the area, the low and
medium hazard band classification should not challenge the existing zoning.
However, if an area is to be rezoned to a more intensive use consideration of the hazard
is required so that future development minimises the impact of the hazard.
Outside the
Urban Growth
Boundary
New use or development not requiring a building permit is allowed subject to
demonstrating a tolerable risk to coastal erosion can be achieved while minimising the
increase in risk to public asset or reliance on defensive structures.
Vulnerable, hazardous, critical uses or coastal defences associated with an existing dwelling
or a coastally-dependent use are allowed subject to demonstrating that they achieve the
relevant objectives in Table 10.
Low Hazard band sheltered
coast with an artificial shoreline–
22 m in land from MHT line
Bruny Island Neck
Coastal region: Storm Bay
Open and sheltered coast
Low Hazard band sheltered
coast – 83 m in land from MHT
line

Page 52
Inside urban
growth
boundary
Infill use or development
Infill use or development will be managed through building control measures. Vulnerable, hazardous, critical uses or coastal defences are discretionary, subject to
demonstrating that they achieve the relevant objectives in Table 10.
Existing use or development
Work to existing buildings will be managed through building control measures.
The substantial intensification of vulnerable, hazardous, critical uses or coastal defences are
discretionary, subject to demonstrating that they achieve the relevant objectives in Table
10.
Building objectives
Building and
associated
works.
Building design and associated works should consider the land as part of a coastal erosion
area. In this area:
The design of the Building and Associated works should consider potential erosion
through either hardening of the structures or by simplifying the relocation of the
building to unaffected areas as the risk from erosion is realised.
A ‘P’ classification under AS2870 residential footing and foundations for erosion
should be considered for the site classification.
Building and associated works must not increase the erosion or inundation risk to
neighbouring properties and minimise the need for engineering or remediation
works.
6.3.3 Coastal erosion – acceptable hazard band
The acceptable hazard band is located outside of the high, medium, or low hazard bands and is within 1 km
of the MHT mark. While this area may become vulnerable to erosion and recession beyond 2100 as the
coastline and sea levels change or if a very rare or significant event does occur. Based on our current
knowledge no planning, or building controls are considered necessary now.
6.3.2 Coastal erosion - investigation area
The classification of the coastal erosion investigation areas into a hazard band must be completed prior to
the represent the areas the State does not have enough information to classify into a hazard band.
Consequently a localised technical investigation, that either applies the method used to compile the
statewide coastal erosion hazard bands outlined in Sharples et al (2013)18, can be used. Alternatively other
methodologies may be used apply the definition associated with each of the Hazard Bands outlined in Table
9.
All methods should be applied at the site specific level and should be both peer reviewed and be
completed by a suitably qualified person with appropriate skills, experience and qualifications in coastal
engineering, geomorphology or geology.
The result of the assessment should be to map the land into the high, medium, low, or acceptable hazard
banding for so as allow the appropriate application planning and building controls.
18
http://www.dpac.tas.gov.au/divisions/climatechange/climate_change_in_tasmania/impacts_of_climate_change/coastal_im
pacts

Page 53
Table 10 Notes for vulnerable, hazardous or critical uses, coastal defences
Coastal Erosion – notes for vulnerable, hazardous or critical uses, including coastal defences
When allowed Use or development should demonstrate that they can meet the following objectives:
a) the use or development is consistent with the State Coastal Policy 1996, a strategic plan for the community or a council policy relating to coastal defenses, or
b) there is an insufficient increase in the level of risk to warrant any specific hazard reduction or protection measures, or
c) a tolerable level of risk can be achieved and maintained for the type, form and duration of the use, and
d) the appropriate clause(s) below:
Critical use A critical use must demonstrate that a coastal inundation event of 1% AEP in 2100 or coastal erosion to 2100 will not: a) impact on the ability of the use to function and maintain service during the event and recovery period b) interrupt business continuity in locations external to the immediate impact of the inundation event, and
c) create a risk to the health or safety of a community from damage or disruption to a water supply or for the drainage and treatment of
wastewater.
Hazardous use
A hazardous use must demonstrate that the release of a dangerous substance as a consequence of coastal inundation event of 1% AEP in
2100 or coastal erosion to 2100 will not impact on the health and safety of people, property, or the environment.
Vulnerable use
A hazardous use must demonstrate that a coastal inundation event of 1% AEP in 2100 or coastal erosion to 2100 that: a) the people who may live, work, or visit on the site have the capability to:
i. protect themselves ii. evacuate in an emergency, and
iii. understand and respond to instruction in the event of an emergency, and
b) the level of risk to emergency personnel involved in evacuation and rescue is reasonable.
Coastal
defences
When coastal defences are allowed, or part of a coastally-dependent industry, a report that considers the following must be ratified by the
planning authority. The works:
a) will not increase the risk of flooding or erosion to neighbouring properties b) will be both paid for by the proponent and have provision for the ongoing maintenance arrangements
c) have the agreement of landowners
d) mitigate the impacts of the hazard to 2100 (low hazard band), with the hazard band classification being changed from high or medium
to low e) are able to be improved upon, and
f) are designed by a suitably qualified person.

Page 54
7 Coastal Inundation Hazard Assessment
7.1 Understanding coastal inundation planning bands evidence: identifying the hazard
MNHLUP indicative coastal inundation mapping is the result of a hazard assessment of the Tasmanian
coastline for coastal flooding. The scientific background to this report is set out in Coastal Inundation
Mapping for Tasmania – Stage 219 (Lacey et al 2012). The policy decisions incorporated in the report and
indicative mapping are outlined below.
Coastal inundation is the natural process of land being flooded by the sea. Coastal inundation is driven by a
complex range of processes and factors, including storm surge, tides, floods, tsunamis, changes in sea level,
and the topography of the coastline. The influence of these processes and factors varies considerably across
different coastal locations.
Work undertaken through the MNHLUP project focused on the relationship between storm surge, tides
and changes in sea level. Other contributing factors, including floods (riverine and estuary) and tsunamis
have not been considered.
7.1.1 Storm surge and tides
The assessment of storm surge and tide levels used the results and methods described in Coastal
Inundation Mapping for Tasmania – Stage 2, work that built on the Climate Futures for Tasmania (CFT)
Extreme Tide and Sea Level Events Technical Report (McInnes et al 2011). The assessment of storm
surge was updated in May 2016 with a review of the methodology by McInnes and O’Grady (16 May
2016). The 2016 improved the sampling period to calculate the contributing factors to storm surge.
Figure 16 provides an overview of the contributing factors to storm surge and time that the CFT report
summarises as:
Coastal sea levels vary on different timescales due to different physical forcing. Astronomical tides cause
sea level variations on a range of time scales ranging from the (high and low tides), through fortnightly
(spring and neap tides) to annual and longer timescales. Low pressure and strong winds associated with
severe weather events can cause fluctuations in coastal sea levels, which are commonly called storm surge.
Associated with storm surges are wind-driven waves, which can also contribute to elevated sea levels
through wave set up. (McInnes et al 2011 p10).
19 The Coastal inundation stage 2 report was preceded by Mount et al 2010, Tasmanian Coastal Inundation Mapping Project Report
version 1.2, Tasmanian Planning Commission (Consultant’s Report); and Mount et al 2011, Tasmanian Coastal Inundation Mapping
Project Report version 2, Tasmanian Planning Commission (Consultant’s Report). A supplementary report is also available: Lacey et al
2015 Coastal Inundation Mapping for Tasmania – Stage 3. This report incorporates updated Light inferred Detection and Ranging
elevation data for Tasmanian Coastal Communities.
Data Analysis
The purpose is to translate the science into a format that can support policy
development
Hazard banding
Hazard matrix

Page 55
Figure 16 Oceanic phenomena that contribute to the total water levels at the coast during an extreme sea-
level event, their causes and the time and space scales over which they operate (McInnes et al 2016)
Coastal Inundation Mapping for Tasmania – Stage 2 outlines the predictability of tides, based on current
knowledge of past tides and the movement of the sun and moon, noting that this predictability cannot
address changes in tidal level due to climate change. Conversely, storm surges and waves are only able
to be described, in a statistical sense, as the average time between storm tide events (eg. AEP)).
As a result of the MNHLUP modelling work, 24 indicative flood maps were developed, which show the
impact of inundation events between 0.005% AEP to 5% AEP for the years 2010, 2050 and 207520. A
height reference layer complements the indicative maps and provides the inundation levels around the
Tasmanian coast in 1 km by 1 km grid squares. Section 7.2 of this Report outlines the process used to
refine the maps into the coastal inundation hazard bands.
20 The maps show the impact of the following AEPs: 0.005%, 0.05%, 0.5%, 1.0%, 2.0% and 5.0%.
Page 56
7.1.2 Sea level rise planning allowance
Tasmania’s SLRPAs were implemented by the Tasmanian Government in August 2012 to promote
consistent decision-making concerning future land use and development, and reduce the level of
uncertainty around the management of future SLR for coastal areas. The rationale for the 2012
SLRPA21 is described set out in the Derivation of the Tasmanian Sea Level Rise Planning Allowance –
Technical paper, released by DPAC’s TCCO in August 2012. The 2012 SLRPA is calculated using:
the statistical distribution (95th percentile) of the IPCC’s Fourth Assessment Report sea level
projections for the 21st century under the A1F1 emission scenario22; and
the variability of present local tides, as outlined in Hunter (2011).
In May 2016 the Tasmanian Government engaged the CSIRO to develop SLRPAs for Tasmania based
on IPCC AR5.
McInnes et al (2016) explains that RCP 8.5 most closely resembles the IPCC AR4 A1FI emissions
scenario, which was adopted to derive the 2012 SLR PAs. McInnes et al (2016) derives SLR PAs for
Tasmania based on the methodology outlined in Hunter (2012), using the statistical distribution of the
95 percentile for RCP 8.5 and the variability of present local tides.
This result is a regional appropriate change to the SLRPA from the previous level of 0.8 m by 2100 for
all of Tasmania to between 0.92 m by 2100 in the North East of Tasmania to 0.82 m by 2100 in the
Central North Coast.
7.1.3 Contributing factors not considered in this study
Work undertaken in this project focused on the relationship between storm surge, tides and changes in
sea level. Other contributing factors, including wave set up and run up, riverine flooding and tsunamis,
have not been included in this assessment.
Local wave set up and run up
The impact of local wave set up and run up were not included in the modelling undertaken by McInnes
et al (2011) due to the complexity associated with modelling these impacts at the local level. Typically
this work is only able to be undertaken at the local level, however future updates to the work may
explore how wave set up and run up could be incorporated into the inundation models. In
consideration of the current inability to account for this, minimum floor levels will consider the 1% AEP
event in 2100. The rationale for this is discussed in Section 7.2.1.
Riverine flooding
In coastal areas, riverine flooding contributes to an increase in flood levels when combined with coastal
inundation in the estuaries. Land use planning, building controls and emergency management
processes are used to reduce Tasmania’s vulnerability to riverine flooding. However, the current flood
information base is insufficient time to produce flood levels for the estuaries, both in inundation models
21 The August 2012 SLRPA included:
Tasmania’s SLRPA for 2050 - 0.2 m SLR above the 2010 MHT benchmark
Tasmania’s SLRPA for 2110 - 0.8 m SLR above the 2010 MHT benchmark
Mapping utilising the August 2012 SLRPA was released by the Government in in January 2014, and again in January
2016.
22 The A1F1 emissions scenario is characterised by rapid economic growth, population growth and continued reliance
on fossil fuels.

Page 57
for the rivers and in understanding the statistical likelihood of tides, storm surge and riverine floods
occurring at the same time. While studies have been undertaken in specific locations23, this information
has not been integrated into a statewide model due to differences in modelling parameters, the varying
ages of the studies and methodologies used. The studies may be incorporated into the flood model on
a case-by-case basis at LGA request.
To address this knowledge gap for flooding, the MNHLUP project is developing a methodology, in
collaboration with the University of Tasmania and Entura, to inform consistent flood modelling for
rivers and the cumulative impact of flooding in estuaries.
Tsunami
Tsunami is the generation of a wave by the sudden movement of the sea floor, typically earthquake.
Tsunami differs from storm surges or tides as the wave extends from the sea floor to the surface. The
Tasmanian State Natural Disaster Risk Assessment 2012 (TSNDRA) outlines the way in which parts of
Tasmania (typically South-East Tasmania) have potentially been impacted by up to 16 events since
1852, with coastal water levels raised between 0.15 m and 2.4 m24..
The TSNDRA risk assessment considered the risk of tsunami in the low to medium range and
recommended further research to better understand potential impacts in vulnerable areas, the
preparation and release of tsunami mapping, evacuation planning and the preparation of a ‘State Special
Plan for Tsunami’.
7.1.4 Digital Elevation Model
A Digital Elevation Model (DEM) is a digital representation of the land surface. For the purposes of
this project, the DEM used a ‘bare earth model’, which means that no buildings or vegetation were
included.
As coastal inundation has been mapped statewide, a combination of best-available information was
used, including LiDAR and 10m contour data. The LiDAR dataset was supplied by Land Tasmania
(DPIPWE) as a single DEM, with vertical accuracies of +/ 25 cm. LiDAR data was compiled from
Climate Futures for Tasmania LiDAR25 collected in 2010, GeoScience Australia data (collected 2014),
Greater Hobart (2012), Launceston (2011), and DPAC/Local Government Coastal Communities (2014).
In areas where LiDAR data was not available, the area between the 10 m contour and the mean
HWM was identified as the ‘Coastal Inundation Investigation Area’. In this area, the height
corresponding to the High, Medium and Low hazard bands is supplied in metres AHD.
Figure 17 shows the distribution of the DEMs used.
23 Studies undertaken in Huonville, Douglas River, Greens Beach, Launceston–Tamar River, Browns Rivulet and Georges River. 24 Of the 16 events, only one has been above 0.9m. The 2.4 m ‘freak wave’ occurred on the Brid River in 1953 and resulted in the
drowning of one child on a beach and damage to a jetty. The wave has no known trigger. 25 Collected by Digital Mapping Australia (DiMAP) for the Antarctic Climate & Ecosystems Cooperative Research Centre (ACE
CRC).

Page 58
Figure 17 DEM data used to map coastal inundation (LiDAR–10m contour)
7.2 Defining coastal inundation hazard planning bands: analysing the hazard
To develop the coastal inundation planning bands, six options were developed, based on current inundation
standards and indicative mapping options. The six options were mapped and then assessed during a
workshop with state and local government officers and industry groups. The six options are:
Inundation policy map options Rationale
Option 1
Vulnerable to a:
High = 1% AEP by 2100
Medium = 1% AEP 2050 and SLR 2050
Low = 1% AEP 2100 and SLR 2100
Incremental increase in likelihood
Exposure increases over time
Includes storm tide hazard
SLR as it becomes an issue
Data Analysis
The purpose is to apply policy judgements on the evidence and
understand the impact of the bands
Hazard banding
Hazard matrix

Page 59
Option 2
Vulnerable to a:
High = 5% AEP events
Medium = 1 % AEP events
Low = 0.5% AEP events
High, medium and low applies to each period
(2010, 2050 and 2100) as a set of hazard bands
Incremental increase in likelihood
Allows the full hazard to be understood
Option 3
Vulnerable to a:
High = 5% AEP 2010
Medium = 1% AEP and SLR 2050
Low = 1% AEP and SLR 2100
Incremental increase in likelihood
Identifies areas with an immediate hazard
SLR and storm tide as they become an issue
Option 4
Vulnerable to a:
High = 5% AEP 2100
Medium = 1% 2100 AEP and SLR
Low = 0.5% AEP 2100
Focuses on the end of period
Incremental likelihood
Highly precautionary
Option 5
Vulnerable to a one % AEP in 2100 Focuses on the end of the period
Equivalent to the 1% AEP river flood areas
Very simple
Option 6
Vulnerable to a:
High = SLR 2050 (0.2 m)
Medium = SLR 2100 (0.8 m)
Low = 1% AEP 2100
Identifies areas that will be lost due to SLR
without defence
Incremental increase in risk
Differentiates between permanent
inundation and temporary inundation
Most closely aligned to Clarence LGA
A workshop summary is included at Appendix 1. Each option was assessed for strengths and weaknesses by
the workshop attendees. The preferred options from the workshops were Options 3 and 6.
7.2.1 Coastal Inundation Hazard Bands
Based on the preferred options identified at the workshops, a hybrid of Options 3 and 6 was used to
progress development of the coastal inundation hazard bands. This hybrid allows for the progressive
increase in vulnerability and separates the difference between permanent SLR inundation and
temporary, storm-based inundation.
During subsequent consultation, the following coastal inundation hazard bands were agreed:
Low This area is vulnerable to a 1% AEP storm surge event in 2100.
The elevation values used are provided in Appendix 9 – Coastal inundation hazard band levels in
metres AHD by LGA and Suburb.
This level will be considered the minimum floor level for the Low, Medium and High hazard
bands. A 300 mm freeboard allowance for wave setup and runup has been added to the
modelled storm surge elevations.
Medium This area is vulnerable to a 1% AEP storm surge event in 2050.
This area also contains all of the land that is vulnerable to a 0.8 m SLR by 2100 from the MHT
in 2010.
The elevation values used are provided in Appendix 9 – Coastal inundation hazard band levels in
metres AHD by LGA and Suburb.

Page 60
High This area is vulnerable to a 0.2 m SLR by 2050 from the mean high tide in 2010.
This area is currently vulnerable to the Highest Astronomical Tide.
The elevation values used are provided in Appendix 9 – Coastal inundation hazard band levels in
metres AHD by LGA and Suburb.
A 300 mm freeboard allowance for wave setup and runup has been added to the modelled
storm surge elevations.
Coastal
Inundation
Investigation
Area
This area is not covered by LiDAR and is both below the 10 m contour26 and within 1 km of
the HWM27.
In this area, elevations equivalent to the High, Medium and Low values are provided in Appendix
9 – Coastal inundation hazard band levels in metres AHD by LGA and Suburb.
The following additions to the hazard bands were also agreed during the consultation process:
All elevations would be rounded up to the nearest highest 100 mm to allow for errors in the
LiDAR-derived surface models.
Inundation areas not contiguous with the coast would not be included in the hazard mapping.
While these areas are artefacts in the data resulting from bathtub modelling undertaken, they may
represent an area that is vulnerable to a rise in ground water as the sea level rises, requiring further
investigation beyond this study.
Figure 18 describes the relationship between the High-Medium-Low bands with the tide ranges and
storm surge events. Table 11 shows the relationship between the current building regulations (which
require a 300 mm increase from the designated flood height of MHWS, plus 600 mm) and the
proposed minimum floor level of 300 mm above the 1% AEP in 2100.
This level will provide a precautionary level of protection for habitable rooms within the hazard bands
until more methods are developed to model local wave set up and run up factors at regional or State
levels. This level is consistent with the position applied by the Clarence City Council over and above
the regulations in its planning scheme.
Coastal hazard bands
26 The 10m contour was used in non-LiDAR areas as it is the only suitable, known elevation in these areas without further survey
work. 27 The SCP 1996 defines the coastal zone as being with 1km of the high water mark.
Figure 18 Coastal hazard bands (adapted from ‘Planning for sea level rise,
Melbourne Water, June 2012’)

Page 61
Table 11 Comparison of building regulation floor levels and proposed floor levels
Building Regulations 2014, clause 15(c)
(heights in m AHD83-TAS*)
Proposed
coastal flood levels
Port ANTT
Tidal Port
(TP) Number
Tidal Port
Version
MHWS (MHHW)
(rounded up to
nearest 0.1 m)
Designated
Flood Level
(+600 mm)
Minimum
Floor Level
(+300 mm)
1% AEP 2100
flood level
rounded up to
nearest 0.1 m
Minimum
Floor Level
(+300 mm)
Stanley 60900 28/11/2006 1.3 1.9 2.2 2.9 3.2
Burnie 60910 11/06/2009 1.3 1.9 2.2 3 3.3
Mersey River (Devonport)
60930 01/09/2006 1.3 1.9 2.2 3 3.3
Low Head 60948 04/04/2008 1.3 1.9 2.2 2.9 3.2
Spring Bay (Triabunna)
61170 12/06/2009 0.6 1.2 1.5 2.1 2.4
Hobart 61220 29/07/2009 0.7 1.3 1.6 2.2 2.5
Currie28 60827 22/09/2008 0.9 1.5 1.8 2.1 2.4
7.2.2 Analysis of the coastal inundation planning boundaries
Understanding the impact of the coastal inundation planning boundaries is important when gauging the
effect of the hazard bands on the Tasmanian community. The indicators detailed in this Section
provide the total area of private and public land, the number of residential properties and the number
of vacant parcels. The methodology used to calculate values associated with each indicator value is
provided at Appendix 5.
The analysis is provided at both state and LGA levels. State values are provided in the main body of
the report and local government values are provided at Appendix 7. The assessment includes:
area (hectares) of land in each band, of note is the investigation area with the majority being
outside of the urban growth boundary and located on the South and West Coasts. Figure 19
provides the proportions each hazard band at the State level while Appendix 7 provides the
breakdown for each LGA.
The majority of the investigation area is outside current settlements, both in terms of proportion
and area. Appendix 7 provides a summary of the coastal investigation area for each LGA.
28AHD is not available on the Bass Strait Islands: local height datums apply:
http://dpipwe.tas.gov.au/land-tasmania/geospatial-infrastructure-surveying/geodetic-survey/coordinate-height-and-tide-datums-tasmania

Page 62
the number of residential dwellings is based on a 10 m building envelope around the centre of the
building supplied by LIST data services and is correct at the time of publication for each of the
1:25 000 topographic map series.
Calculation of the number of residential buildings is based on a simple intersect between the
hazard band and the envelope of the building. The highest hazard band the envelope intersects is
the hazard value assigned to it.29 This is shown in Figure 20, where near adjacent houses may be
‘in’ or ‘out’ depending on the location of the centre point for the house.
Figure 20 Calculating the number of houses impacted
29 Previous versions of this calculation were based on the house centroid, this was found to underestimate the potential impact.
13520, 7% 17190, 9%
10989, 6%
144100, 78%
High
Medium
Low
Investigation
House
envelope
in the
hazard
band
House
envelope
not in the
hazard
band
Figure 19 Coastal inundation area (ha) state

Page 63
Approximately 1.2% of residential buildings will be vulnerable to coastal inundation by 2100. Figure 21
provides a summary of the actual number of residential buildings, the associated capital value based on
statutory valuations, and the amount of developable land in each of the hazard bands. Appendix 7 breaks
the graph into LGA and suburb for each of the hazard bands.
7.3 Coastal inundation hazard planning matrix – evaluation and treatment of hazard
Based on the evidence and analysis of Tasmania’s coastal inundation hazard risk and the outcomes of the
consultation process, the recommended responses to each coastal erosion hazard band for the
development types Greenfield, Infill and Existing are outlined below.
The Coastal Inundation Hazard Matrix is divided into two sections: the first is for strategic elements, and the
second addresses the statutory guidance required to inform the development of planning and building
controls.
Investigation Low Medium High
Residential Buildings 357 1779 1288 85
Capital Valuation ($m/2013) 176 571 446 19
0
200
400
600
800
1000
1200
1400
1600
1800
2000
Data Analysis
The purpose is to apply risk controls to manage the impact
of the bands
Hazard banding
Hazard matrix
Figure 21 Summary of coastal inundation impacts: buildings and capital value

Page 64
The planning matrix (refer to Section 7.3.1 to 7.3.5) includes the hazard banding, control levels, strategic
planning level, and use and development controls, while Table 13 provides further detail on vulnerable,
hazardous, critical and coastal defences.
Planning bands (likelihood): regions in which it is presumed that an inundation hazard will exist at a
relatively high, medium, low or acceptable level
Balance of controls: generalised statements regarding the presumed consequences associated with
inundation planning bands
Strategic planning level: agreed measures that should be employed through strategic planning to
determine if the benefits to the community of requiring consideration of whether development in
certain areas is subject (or likely to be subject) to a natural hazard outweigh the costs to the community
and individuals
Planning and development controls: agreed measures that should be imposed on use to reduce risks
from inundation. The measures consider rezoning, greenfield, infill, and existing use or development.
Use and development controls are defined as:
o Use controls: agreed measures that should be imposed on use to reduce risks from inundation.
LUPAA defines use as “in relation to land, includes the manner of utilising land but does not include
the undertaking of development”. For the purpose of coastal hazards, use types will be
considered as Greenfield, Infill, Existing – and critical, vulnerable or hazardous.
o Development controls: agreed measures that should be imposed on development to reduce
risks in each hazard band. LUPAA defines development as:
- the construction, exterior alteration or exterior decoration of a building
- the demolition or removal of a building or works
- the construction or carrying out of works
- the subdivision or consolidation of land, including buildings or airspace
- the placing or relocation of a building or works on land
- the construction of, or putting up for display, signs or hoardings.
Building controls: agreed measures that should be imposed on building to reduce risks in each hazard
band to tolerable levels. The Building Act 2000 provides for the control of the construction and
maintenance of buildings and building or plumbing matters. Building work includes a proposed building,
part of a building, a structure or a part of a structure. For the purpose of the hazard matrix it also
includes works associated with the construction of the building.
7.3.1 Coastal Inundation High hazard Band
Hazard
Exposure
The High hazard band is vulnerable to SLR of by 2050 (Table 1) from the MHT.
Note this area is also vulnerable to the Highest Astronomical Tide now.
Description of
area
The area impacted is within the 20 year tide cycle, typically the North Coast of
Tasmania has values around 1.8 m AHD while the East Coast has values around 0.9 m
AHD.

Page 65
Example map of
exposure
Balance of
controls
New use or development is strongly discouraged unless it is coastally dependent as it
would require significant mitigation measures to achieve, and maintain a tolerable level
of risk.
Mitigation measures may never achieve adequate levels of security and safety.
Planning objectives
Strategic
Objectives
Strategies should indicate appropriate zoning outside the urban growth boundary
includes open space, rural, agricultural or environmental purposes.
The exception is for vital community infrastructure that cannot be reasonably located
elsewhere or coastal-dependent developments.
Existing use and development may be retained, maintained or redeveloped, but the
opportunity to intensify development for infill develop these areas must be minimised
so as not to increase public risk.
Critical, hazardous, vulnerable or defensive works not associated with a coastal
dependent use are prohibited.
Orford
High = 0.9m AHD

Page 66
Outside the
Urban Growth
Boundary
Coastally-dependent or temporary use and development are allowed. They must
demonstrate a tolerable risk to coastal inundation is achievable for the duration of the
proposed use and development.
Other use or development, including and vulnerable, hazardous , critical uses or coastal
defences not associated with an existing dwelling or coastally-dependent use or
development are prohibited.
The uses associated with coastal- dependent uses must demonstrate that they achieve
the relevant objectives in Table 12.
Inside urban
growth
boundary
Infill use or development
Coastally-dependent (including associated defensive works) or temporary use and
development are allowed, subject to demonstrating that they achieve the relevant
objectives in Table 12.
Infill use or development is prohibited.
Coastal defences are discretionary, subject to demonstrating that they achieve the
relevant objectives in Table 12.
Existing use or development
Changes to existing use and development are allowed and will be managed through
building control measures.
Vulnerable, hazardous or critical use, including coastal defences, are discretionary
subject to demonstrating that they achieve the relevant objectives in Table 12.
Building objectives
Building and
associated
works.
Building and associated works should consider this area as part of the coastal
inundation area. In this area:
Designs should consider how buildings may be relocated as inundation
becomes a regular occurrence towards 2100.
Floor heights for habitable rooms should be 300 mm above the 1% AEP in
2100 (see Appendix 9).
Building and associated works must not increase flood or erosion risk to
neighbouring properties or public infrastructure.
Minor extensions or internal modifications are not subject to control.
7.3.2 Coastal Inundation Medium Hazard Band
Hazard
Exposure
The Medium hazard band is vulnerable to a 1% AEP storm tide event in 2050.
Description of
area
This area is up to 35cm higher than the 1% AEP storm tide even now, with East and
West Coasts having levels around 1.7 m, and North Coast around 2.7 m AHD.
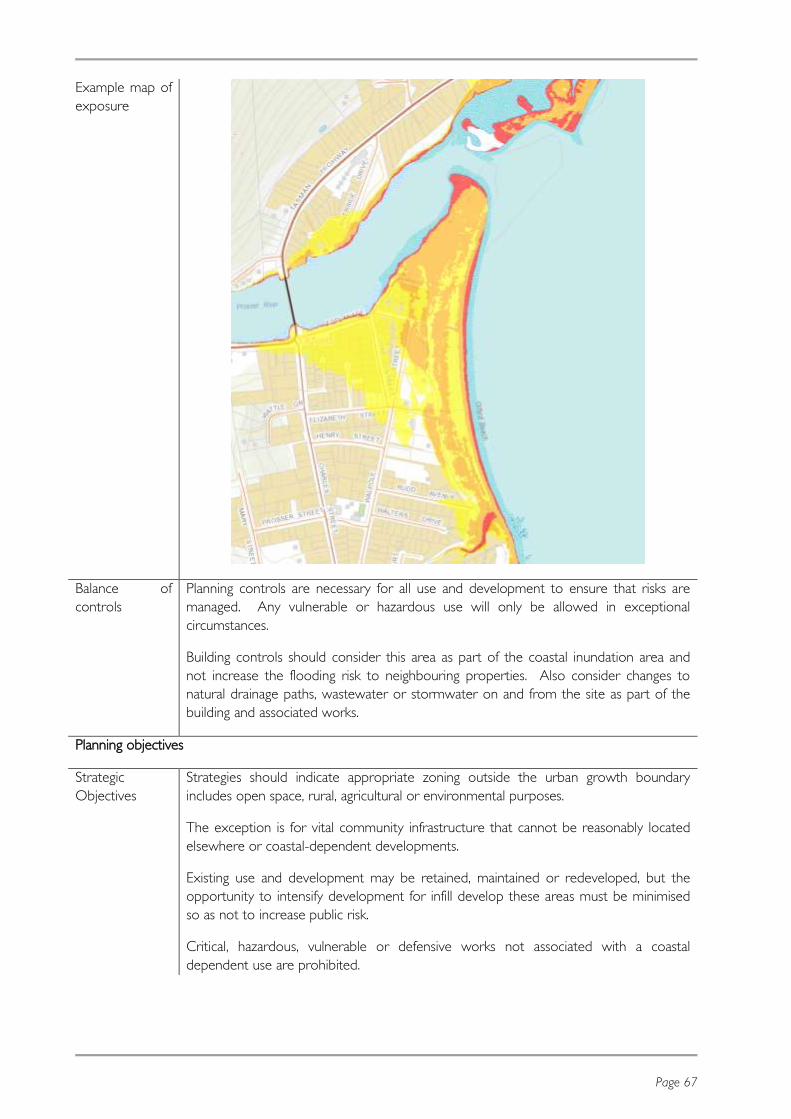
Page 67
Example map of
exposure
Balance of
controls
Planning controls are necessary for all use and development to ensure that risks are
managed. Any vulnerable or hazardous use will only be allowed in exceptional
circumstances.
Building controls should consider this area as part of the coastal inundation area and
not increase the flooding risk to neighbouring properties. Also consider changes to
natural drainage paths, wastewater or stormwater on and from the site as part of the
building and associated works.
Planning objectives
Strategic
Objectives
Strategies should indicate appropriate zoning outside the urban growth boundary
includes open space, rural, agricultural or environmental purposes.
The exception is for vital community infrastructure that cannot be reasonably located
elsewhere or coastal-dependent developments.
Existing use and development may be retained, maintained or redeveloped, but the
opportunity to intensify development for infill develop these areas must be minimised
so as not to increase public risk.
Critical, hazardous, vulnerable or defensive works not associated with a coastal
dependent use are prohibited.

Page 68
Outside the
Urban Growth
Boundary
Coastally-dependent or temporary use and development are allowed. They must
demonstrate a tolerable risk to coastal inundation is achievable for the duration of the
proposed use and development.
Other use or development, including and vulnerable, hazardous, critical uses or coastal
defences not associated with an existing dwelling or a coastally-dependent use or
development are prohibited.
The uses associated with coastal-dependent uses must demonstrate that they achieve
the relevant objectives in Table 12.
Inside urban
growth
boundary
Infill use or development
Infill use or development requiring a building permit will be managed through building
control measures.
Coastally-dependent or temporary use and development, including associated coastal
defences are allowed. They must demonstrate a tolerable risk to coastal inundation is
achievable for the duration of the proposed use and development.
Vulnerable, hazardous, critical uses or coastal defences are discretionary subject to
demonstrating that they achieve the relevant objectives in Table 12.
Existing use or development
Changes to existing use and development are allowed and will be managed through
building control measures.
Vulnerable, hazardous or critical use, including coastal defences, are discretionary
subject to demonstrating that they achieve the relevant objectives in Table 12.
Building objectives
Building and
associated
works.
Building and associated works should consider this area as part of the coastal
inundation area. In this area:
Designs should consider how buildings may be relocated as inundation
becomes a regular occurrence towards 2100.
Floor heights for habitable rooms should be 300 mm above the 1% AEP in
2100 (see Appendix 9).
Building and associated works must not increase flood or erosion risk to
neighbouring properties or public infrastructure.
Minor extensions or internal modifications are not subject to control.
7.3.3 Coastal Inundation Low Hazard Band
Hazard
Exposure
This area is vulnerable to a 1% AEP storm tide event in 2100. .
Description of
area
The area ranges in height from 3.3 m AHD in Base Strait to 2.4 m AHD on the South
East Coast.

Page 69
Example map of
exposure
Balance of
controls
Non-construction requirements are not necessary for most uses. Controls may be
necessary to reduce risks associated with vulnerable, hazardous or critical uses to
ensure the residual risk is tolerable.
Building controls should consider this area as part of the coastal inundation area and
not increase the flooding risk to neighbouring properties. Also, consider changes to
natural drainage paths, wastewater or stormwater on and from the site as part of the
building and associated works.
Planning objectives
Strategic
Objectives
When broader planning considerations support the development of the area, the low
band should not change existing zoning.
However, if an area is outside the urban growth boundary and is to be rezoned to a
more intensive use, or is within a urban growth boundary undergo substantial infill
development through intensification or redevelopment, consideration of the hazard is
required so that future development minimises the impact of the hazard.
Critical, hazardous, vulnerable or defensive works are allowed (ie. permitted or
discretionary)

Page 70
Outside the
Urban Growth
Boundary
New use or development not requiring a building permit is allowed subject to
demonstrating a tolerable risk to coastal inundation can be achieved while minimising
the increase in risk to public asset or reliance on defensive structures.
Vulnerable, hazardous, critical uses or coastal defences not associated with a coastally-
dependent use or development are prohibited.
Vulnerable, hazardous, critical uses or coastal defences associated with an existing
dwelling or a coastally-dependent use are allowed subject to demonstrating that they
achieve the relevant objectives in Table 12.
Inside urban
growth
boundary
Infill use or development
Infill use or development requiring a building permit will be managed through building
control measures.
Coastally-dependent or temporary use and development, including associated coastal
defences are allowed. They must demonstrate a tolerable risk to coastal inundation is
achievable for the duration of the proposed use and development.
Vulnerable, hazardous, critical uses or coastal defences are discretionary subject to
demonstrating that they achieve the relevant objectives in Table 12.
Existing use or development
Changes to existing use and development are allowed and will be managed through
building control measures.
Vulnerable, hazardous or critical use, including coastal defences, are discretionary
subject to demonstrating that they achieve the relevant objectives in Table 12.
Building objectives
Building and
associated
works.
Building and associated works should consider this area as part of the coastal
inundation area. In this area:
Designs should consider how buildings may be relocated as inundation
becomes a regular occurrence towards 2100.
Floor heights for habitable rooms should be 300 mm above the 1%AEP in
2100 (see Appendix 9).
Building and associated works must not increase flood or erosion risk to
neighbouring properties or public infrastructure.
Minor extensions or internal modifications are not subject to control.
7.3.4 Coastal inundation – acceptable hazard band
The acceptable hazard band is located outside of the high, medium, or low hazard bands and is within 1km
of the mean HWM. While this area may become vulnerable to erosion and recession beyond 2100 as the
coastline and sea levels change or if a very rare or significant event does occur. Based on our current
knowledge no planning, or building controls are considered necessary at this point in time.
7.3.5 Coastal inundation - investigation area
The classification of the coastal erosion investigation areas into a hazard band must be completed prior to
the represent the areas the State does not have enough information to classify into a hazard band.
Page 71
Consequently a localised technical investigation, that either applies the method used to compile the
statewide coastal erosion hazard bands outlined in Sharples et at 2013 30, can be used. Alternatively
another methodologies may be used apply the definition associated with each of the Hazard Bands outlined
in Table 9.
All methods should be applied at the site specific level and should be both peer reviewed and be
completed by a suitably qualified person with appropriate skills, experience and qualifications in coastal
engineering, geomorphology, or geology.
The result of the assessment should be to map the land into the high, medium, low, or acceptable hazard
banding so as to apply appropriate planning and building controls.
30
http://www.dpac.tas.gov.au/divisions/climatechange/climate_change_in_tasmania/impacts_of_climate_change/coastal_im
pacts

Page 72
Table 12 Notes for vulnerable, hazardous or critical uses, coastal defences
Coastal Inundation – notes for vulnerable, hazardous or critical uses, including coastal defences
When allowed Use or development should demonstrate that they can meet the following objectives:
a) the use or development is consistent with the State Coastal Policy 1996, a strategic plan for the community or a council policy relating to coastal defenses, or
b) there is an insufficient increase in the level of risk to warrant any specific hazard reduction or protection measures, or
c) a tolerable level of risk can be achieved and maintained for the type, form and duration of the use, and
d) the appropriate clause(s) below:
Critical use A critical use must demonstrate that a coastal inundation event of 1% AEP in 2100 or coastal erosion to 2100 will not:
a) impact on the ability of the use to function and maintain service during the event and recovery period
b) interrupt business continuity in locations external to the immediate impact of the inundation event, and
c) create a risk to the health or safety of a community from damage or disruption to a water supply or for the drainage and treatment of waste water.
Hazardous
use
A hazardous use must demonstrate that the release of a dangerous substances as a consequence of coastal inundation event of 1% AEP in 2100 or coastal erosion to 2100 will not
impact on the health and safety of people, property or the environment.
Vulnerable
use
A vulnerable use must demonstrate that a coastal inundation event of 1% AEP in 2100 or coastal erosion to 2100 that: a) the people who may live, work, or visit on the site have the capability to:
i. protect themselves
ii. evacuate in an emergency, and
iii. understand and respond to instruction in the event of an emergency, and
b) the level of risk to emergency personnel involved in evacuation and rescue is reasonable.
Coastal
defences
When coastal defences are allowed, or part of a coastally-dependent industry, a report that considers the following must be ratified by the planning authority. The works:
a) will not increase the risk of flooding or erosion to neighbouring properties
b) will be paid for by the proponent and ongoing maintenance arrangements
c) have the agreement of landowners
d) mitigate the impacts of the hazard to 2100 (low hazard band), with the hazard band classification being changed from high or medium to low
e) are able to be improved upon, and f) are designed by a suitably qualified person.

Page 73
8 List of Appendices
Appendix 1: Summary of workshops and consultations
Appendix 2: Australian Hydrological Office port summaries
Appendix 3: Summary of pre-reform planning controls
Appendix 4: Coastal erosion pairwise assessment
Appendix 5: Method to calculate indicator values
Appendix 6: State & LGA indicators – coastal erosion
Appendix 7: State & LGA indicators – coastal inundation
Appendix 8: High hazard hotspots – inundation & erosion
Appendix 9: Coastal inundation hazard band levels
Appendix 10: Summary of Consultation

Page 74
Appendix 1: Summary of workshops and consultations
The coastal hazards planning report was developed through a series of workshops held with local
government, industry groups and state agencies. The process involved three sets of workshops, including:
Workshop Series One
The purpose of Workshop Series One was to review and agree on a definition for the hazard, including the
scope of application for the definition, and an approach to mapping the hazard and draft consequence
statements. Three workshops were held for landslip in Burnie, Launceston and Hobart during March 2013.
Participants
Name Position Organisation
Devonport Entertainment & Convention Centre – 13 March 2013
Barry Magnus Executive Manager Development Services Waratah-Wynyard Council
Brian Edwards SNR Engineer Cradle Mountain Water
David Atkins Manager Asset Strategy Cradle Mountain Water
George Walker Planning Officer Circular Head Council
Sharon Holland Strategic Planning Officer Latrobe Council
Ian Newman Consultant Planner to West Coast Council West Coast Council
Patrick Earle Regional Planner/Manager Planning Services Burnie Council
Samantha Seaton Planning Officer Burnie Council
Carolyn Harris Planning Officer Burnie Council
Hobart Baha’i Centre – 22 March 2013
Peter Meloy Senior Statutory Planner Glenorchy City Council
Stewart Johnson Director, Strategy, Policy & Business Services Tasmanian Planning Commission
Rowan Moore Environmental Developmental Planner Hobart City Council
Helen Ayers Planner Clarence City Council
Benj Krom Planner Clarence City Council
Dan Ford Planner Clarence City Council
Jon Doole Manager Environmental Services Kingborough Council
Workshop 1
• three regional workshops – March 2013
• define hazard
• agree on mapping approach
• draft strategic planning for each band
Workshop 2 • one central workshop – August 2013
Call for comment on the report
and information sessions
• send report to all councils and industry bodies
• three regional question and answer workshops
• collate comments

Page 75
Participants
Name Position Organisation
Bridget Dwyer Project Officer, Environmental Strategy Glenorchy City Council
Hannah Sadler Environmental Officer Glenorchy City Council
Amanda Beyer Planning Officer Huon Valley Council
Shane Wells Huon Valley Council
Grietje van Randen Glenorchy City Council
Michael Comfort Sectional Leader, Geoconservation Section DPIPWE
Tony McMullan Manager - City Strategy Glenorchy City Council
Graham Green STCA
Tim Turner Manager Operations, Leases, Licences &
Sales
Crown Land Services
Jess Feehely Principal Lawyer Environmental Defenders Office (Tas) Inc
Glen Wooley TASPOL
Damian Mackey STCA
Lance Stapleton Southern Water Tasmania
Brett Chandler Glenorchy City Council
Launceston Clarion Hotel City Park Grand – 20 March 2013
Justine Brooks Municipal Planner George Town Council
Rohan Willis Town Planner Dorset Council
Jo Oliver Flinders Council
Michael Purves Municipal Planner West Tamar Council
Karin van Straten West Tamar Council
Michael Johnston Inspector DPEM
Maria Chledowska Council Planning Officer Launceston City Council
Peter Voller DPIPWE
Kathy Noble Coastal Planning Officer, Land Conservation DPIPWE
Chris Colley Regional Manager, Northern Region Parks & Wildlife
Jos Phillips
Outcomes
The following outcomes relate to the application of hazard treatment to coastal inundation:
1. Strength and weakness assessment of the six approaches to coastal inundation mapping as outlined in
the presentation:
Inundation policy map
options (attachment 10
provides the analysis for
each option)
Strengths Weaknesses Rationale
Option 1
High = 1% AEP 2100
Medium = 1% AEP 2050 and
SLR 2050
Low = 1% AEP 2100 and SLR
2100
Allows incremental controls.
Sets a risk tolerance to
flooding.
Confuses SLR with storm
tide.
Difficult to communicate
the risk tolerance.
•Incremental increase in
likelihood.
•Exposure increases over
time.
•Includes storm tide
hazard.
•SLR as it becomes an
issue.

Page 76
Inundation policy map
options (attachment 10
provides the analysis for
each option)
Strengths Weaknesses Rationale
Option 2
For each period 2010, 2050
and 2100 have a set of hazard
bands that:
High = 5% AEP events
Medium = 1% AEP events
Low = 0.5% AEP events
SLR
Allows for a range of
responses depending on the
likelihood.
Comprehensive.
Separates SLR from storm tide
events.
Allows a response to
inundation hazard based on
the project life of the use.
Complex.
Hard to manage in a
planning scheme.
Difficult to communicate.
•Incremental increase in
likelihood.
•Allows the full hazard to
be understood Initial
reactions.
•Too complex for land use
planning or building.
•This option has not been
progressed.
Option 3
High = 5% AEP 2010
Medium = 1% AEP and SLR
2050
Low = 1% AEP and SLR 2100
Shows incremental risk.
Allows incremental controls.
Clear focus on what is at risk
from coastal inundation.
Becoming complex.
Difficult to communicate
the risk tolerance in 2050
and 2100.
Does not separate SLR
from storm events.
•Incremental increase in
likelihood.
•Identifies areas with an
immediate hazard.
• SLR and storm tide as it
becomes an issue.
Option 4
High = 5% AEP 2100
Medium = 1% 2100 AEP
Low = 0.5% AEP 2100
Based on the asset life of a
house.
Focus on the end of period.
Establishes the use in that
period.
Talk about the presumed use
life.
Don’t focus on development –
focus on the purpose of the
use.
Only considers storm events.
Focus on the end of
period.
Conservative option.
0.5% is outside of normal
planning ranges for
temporary inundation.
Does not identify what is at
risk from SLR.
Only considers storm
events.
•Focuses on the end of
period.
•Incremental likelihood.
•Highly precautionary.
Option 5
1% AEP in 2100
Simple binary control.
Triggers an intervention.
Equivalent to what is used in
river flooding.
Conservative.
Does not identify the risk
from SLR.
•End of period.
•Equivalent to the 1% AEP
river flood areas.
•Very simple.
Option 6
High = SLR 2050 (0.2 m)
Medium = SLR 2100 (0.8 m)
Low = 1% AEP 2100
Separates recession and storm-
based events.
Storm tide is considered at the
end of the period.
The low band the equivalent
flooding.
Directly implements the
SLRPAs in planning controls.
Allows the treatment of
permanent inundation in a
different way to flooding.
Does not consider the
incremental increase in
storm events.
The high and medium
bands are still water
•Identifies areas that will
be lost due to SLR without
defence.
•Incremental increase in
risk.
•Differentiates between
permanent inundation and
temporary inundation.
2. Based on the workshops there is a preference to further Options 3 and 6.
3. In progressing the coastal inundation mapping into a planning scheme overlay the following changes are
to be considered:
In non-LiDAR areas, use the 10 m contours as the basis for a coastal inundation investigation area.
The investigation would look at a proposed use or development relationship to height in metres
AHD.
o It was noted that while the 25 m DEM areas identified areas that were vulnerable, it was not a

Page 77
good tool for regulation.
o Concern was raised that the 10 m contour will bring too great an area and an alternate level
such as 5m contours should be considered.
Round all values up to the nearest 100 mm, eg 1.62 m will be rounded to 1.7 m.
Add 300 mm to the final values in order to translate the inundation areas to hazard areas that are
equivalent to river flooding.
Questions were raised for further investigation as to whether this should apply to both SLR and
storm tide.
4. The strategic planning levels for high, medium, low and acceptable were considered appropriate to
continue development of the matrix.
5. Concern was raised during the workshops that the current method to update the mapping for overlays
in the planning system.
The following outcomes relate to the application of hazard treatment to coastal erosion:
1. During the presentation on coastal erosion by Chris Sharples the following matters were discussed:
Hazard buffers on sea cliffs have three options for mapping susceptibility:
o Modelled cliff recession based on a 45-degree regression angle from the MHT mark.
- It was discussed that the weakness of this is that the full cliff height from the seabed is
poorly understood.
- Further weakness was also noted that the 25m DEM does not identify cliffs or cliff
heights very well.
o Identify all land over 45-degree steepness that is adjacent to the sea, noting that:
- It is a simple measure.
- There is potential for overlap with landslide hazard.
- It relies on the smartline to identify the location of sea cliffs.
o Apply a simple buffer from MHT mark to signify that a cliff is present.
- This relies on the smartline to identify the location of sea cliffs.
- The draft erosion susceptible mapping used a 50m buffer from the base of the cliff.
Artificial shores will be identified through the smartline and set out basic criteria to assess the
longevity of the erosion defence and a process to update the mapping.
2. The draft hazard banding for erosion susceptibility outlined during the workshops was broadly endorsed
as a good starting point to continue the development of the hazard matrix for coastal erosion.
The pairwise assessment will be repeated once the layers are refined based on the outcomes of the
workshops.

Page 78
Workshop Two
The second workshop, held in Launceston (October 2013) was a more focused consultation that applied
the boundaries for the hazard bands, reviewed the consequence statements and considered the controls.
Participants
Graeme Hunt (Workplace Standards – Building Control), Kathy Noble (DPIPWE), Patrick Earle (BCC),
Michael Purves (WTC), Leigh Stevens (BOD), Damian Mackey (STCA), Mathew Clark (PIA), Jessica Feehely
(EDO), Dan Ford (CCC), Ross Lovell (CCC), Rowan Moore (HCC), Luke Roberts (DPAC-OSEM),
Mat Healey (DPAC-OSEM), Jo Oliver (NMC), Phillip (DPIPWE), Gary (DPIPWE), Ashley (WWC).
Outcomes
Participants discussed the indicative mapping of coastal inundation and coastal erosion, along with the
development of the policy. The following items reflect the key points from the workshop:
The hazard banding for coastal hazards (erosion and inundation) reflect our current understanding
of coastal processes and Government policy on climate change (SLR, change in storm frequency).
The broad definitions of each hazard band are:
o The high hazard band is the area most at risk from permanent inundation or a hazardous
erosion event.
o The medium hazard band is temporary inundation and coastal recession in 2050.
o The low hazard band is temporary inundation and coastal recession in 2100.
Application of the hazard banding is slightly different from other hazard areas (landslide) in that the hazard is
dynamic. The low band, in effect, covers the combined low-medium-high area. Figure 1 below shows the
relationship between the different hazard bands and MHT (blue line), land surface (brown) and each hazard
band.
This overlap recognises that by 2050, the area affected by the high band will have either been submerged
(inundation) or moved to impact further inland. The extent of this change is unknown beyond our current
modelling. Figure 2 bellow illustrates how the hazard bands for erosion and inundation may change by
2050.
Mean High Tide
Figure 1 Coastal Hazards Banding

Page 79
Figure 3 illustrates how the hazard bands for erosion and inundation may change by 2100:
Given the change in how the hazard bands will be considered for inundation and erosion, the proposed
hazard banding is outlined below:
Hazard banding – coastal inundation
The coastal inundation hazard bands are:
Storm Surge in 2100 (1% AEP) is the low hazard area (spatial extent and height AHD)
Storm Surge in 2050 (1% AEP) is the medium hazard area (spatial extent and height AHD)
SLR in 2050 (0.2 m from 2010 MHT) is the high hazard area (spatial extent and height AHD)
Coastal inundation investigation area is the area without a suitably accurate digital elevation model
that requires further investigation on elevation (spatial extent and height AHD).
Each hazard band has three components including a spatial extent, a vertical elevation in metres AHD, and
the hazard matrix.
The discussion noted that in areas with more detailed studies (typically estuaries) this work can be adopted
over the state modelling. Some examples include:
tidal – river flow models, such as the Upper Tamar river or Georges River, or
coastal inundation modelling.
This modelling should take precedence over the state modelling in these areas.
Inundation - 2050 Erosion - 2050
Low: per cent 2100 Low
Medium 1 per cent
2050 Medium
High 0.2m SLR
High
Mean High Tide
Inundation - 2100 Erosion - 2100
Low
Medium
High
Mean High Tide
High 0.2m SLR
Medium 1 per cent 2050
Low: 1 per cent 2100
Figure 2 Change in coastal hazard banding by 2050
Figure 3 Change in coastal hazard banding by 2100

Page 80
Hazard banding – coastal erosion
The coastal erosion hazard bands are:
Acceptable = the area beyond coastal recession by 2100 and not subject to controls.
Low = the area vulnerable to coastal recession by 2100.
Medium = the area vulnerable to recession to 2050.
High = the area vulnerable to hazardous erosion in 2010.
Coastal erosion investigation area = the area in which the underlying base data is poorly understood
and requires further investigation.
Each hazard band is made up of the spatial extent and a geomorphic description for each component.
Outcomes for the hazard banding
Support for a change in the way hazard bands for inundation and erosion are discussed
Support for the revised coastal inundation hazard banding
Support to use the 10 m contour and elevations in non-LiDAR areas
Noted that estuaries such as Georges or Tamar River to use more detailed river flooding mapping
where it exists
Change the names of the hazard bands to reflect the temporal nature of the hazard, eg. the high
band will become the SLR from MHT to 2050 (0.2 m AHD)
Support the coastal erosion hazard banding
Support the general investigation areas as a way to identify areas where the underlying data is not
adequate
Note that in the general investigation areas the development proponent would be required to
demonstrate the erosion potential for storm or recession to 2050 and 2100
Broad outcomes relating to the hazard matrix
The need for a better definition/explanation of compelling reasons
In general, avoid the hazard unless there are compelling reasons
The balancing of environmental (values and hazards), economic and social values with coastal hazard
mitigation is part of the planning system as a whole through the coastal framework and coastal policy
Comment on the draft report (March 2016)
This is the summary of consultation undertaken on the draft report released March 2016.
Coastal hazards, including inundation and erosion, are the result of natural processes that have the
potential to cause considerable damage to communities, industries and infrastructure. These hazards
are expected to be magnified by climate change and SLR, presenting significant risk to Tasmanian
communities and the economy if they are not appropriately managed.

Page 81
In response to the risks presented by coastal inundation and erosion a Draft Coastal Hazards
Package (the Draft Package) has been prepared. The Draft Package provides guidance for managing
coastal hazards in the land use planning system. It adopts a
risk-based approach based on the best available evidence to inform appropriate planning and
building controls, including the coastal inundation and erosion codes in the draft State Planning
Provisions.
The Draft Package comprises the draft Coastal Hazards Summary Report, the draft Coastal Hazards
Technical Report and draft coastal inundation and erosion mapping.
On the 18 March 2016 the Minster of Planning and Local Government, Peter Gutwein MP,
forwarded the Draft Package to industry bodies and the Local Government Association of
Tasmania (LGAT) for comment. He also provided the Draft Package to the Tasmanian Planning
Commission (TPC) for information. The Draft Package was also available on the Department of
DPAC’s website. The consultation period closed on 22 April 2016.
LGAT ran information secessions for local government.
DPAC’s Office of Security and Emergency Management (OSEM) provided briefings to the West
Tamar Council, the Launceston City Council, the Glenorchy City Council, TasNetworks, the Master
Builders Association (Tas) and the Property Council of Australia (Tas).
Submissions were received from the Property Council, the Housing Industry Association,
Tas Water, Engineers Australia, Climate Tasmania, the Tasmanian Coastal Association
(Environmental Defenders Office and BirdLife Tasmania), LGAT, the Kingborough Council, and the
Hobart City Council.
Purpose of the consultation
The consultation sought feedback on:
whether the Draft Package achieves the right balance between planning, building control
and emergency management;
how the risk assessment and mapping could be improved;
information and resources that may assist organisations implementing the Package into their
core business, including asset management, emergency management, and community or
member awareness, as we planning and building controls; and
any other matters that may be considered relevant to the Package.
Consultation Outcomes and responses
The comments universally supported the Draft Package highlighting it as a ‘comprehensive
response’, ‘pragmatic’ and ‘practical and sensible’. No negative comments on the broad subject
matter or intent of the package were received.
The current SLRPA based on the Intergovernmental Panel on Climate Change – Fourth Assessment
Report: Climate Change (IPCC - AR4) was raised as an issue requiring further consideration.
Response / recommended action: A review of the current SLRPA has been undertaken by DPAC’s
TCCO and the CSIRO. OSEM will update the Draft Package based on the outcomes of the review.
The finalisation of the Package will be coordinated with the review of the SLRPA, expected to be
completed in July 2016.
The relevance of continuing to use Actively Mobile Landforms, as defined by the SCP, was
questioned in light of the risk assessment methodology and improved coastal science that the
Package presents.
Page 82
Response / recommended action: A separate Minute will be prepared for the Minister for Planning
and Local Government, in consultation with the Department of Justice, outlining a proposed
response to this issue.
The absence of a coincident flooding model in the estuaries was raised as potentially
underestimating the inundation hazard in estuaries.
Response / recommended action: This is significant scientific challenge for Tasmania. It requires a
riverine flood model for all estuaries, a better understanding of the level of dependence between
coastal inundation and riverine flooding, and a hazard assessment that takes into account how
riverine flooding models interface with the coastal inundation hazard model.
OSEM will, in the short term, amend the terminology in the mapping to highlight that coincident
flooding has not been assessed. OSEM will develop a policy on how to include assessments of
coincident flooding in to statutory tools.
OSEM is developing a methodology to undertake a riverine flood assessment for Tasmania. The
pre-feasibility assessment completed in May 2016 indicates that the proposed methodology is
considered mature enough to undertake a feasibility assessment as a precursor to the development
of a flood model. A funding application for the feasibility assessment under the National Partnership
Agreement for the National Disaster and Resilience Grants Program is being developed with local
government and the Department of Police, Fire, and Emergency Management. This application, if
successful, will enable the project to be run across several phases - the first phase is a feasibility
study, the second phase is refining the outputs and the third phase is undertaking a hazard
assessment.
Feedback was received that planning and building professionals and the community will need
support to implement the Draft Package.
Response/ recommended action: OSEM will write a project plan to support the development of
appropriate support and guidance materials planning and building professionals and the public in
consultation with key stakeholders.
A number of editorial comments have been made.
Response / recommended action: Editorial comments will be applied to the Package.
Comments from the Building industry have raised the need to track the effectiveness of the
reporting requirements and to adjust as appropriate.
Response / recommended action: OSEM will liaise regularly with stakeholders to monitor how the
changes are progressing.
State Planning Provisions
No changes to the State Planning Provisions are required as a result of the consultation feedback on
the Draft Package although, in the longer-term, resolving issues surrounding Actively Mobile
Landforms and coincident flooding may mean some changes are necessary to the Coastal Erosion
and Inundation Codes.
Response / recommended action: The Minister for Planning and Local Government refers the
consultation feedback to the State Planning Interdepartmental Committee (SPIDC).
Draft Building Regulations
The consultation feedback on the Draft Package will inform the preparation of the Draft Building
Regulations.
Response / recommended action: OSEM to refer the consultation feedback to the Director of
Building Control.

Page 83
Appendix 2: Australian Hydrological Office port summaries
Port ANTT Tidal Port (TP) Number Tidal Port Version
Stanley 60900 28/11/2006
Burnie 60910 11/6/2009
Mersey River (Devonport) 60930 1/9/2006
Low Head 60948 4/4/2008
Spring Bay (Triabunna) 61170 12/6/2009
Hobart 61220 29/7/2009
Currie31 60827 22/9/2008
BM connections to datum
Station – Curry Height (m)
BM “NW CNR Marine Board Building” 3.978
BM “170/2” 2.516
BM “Concrete deck level of jetty” 2.243 ± 0.005
BM “3.5 m mark of old tide board” 2.068
HAT 1.10
MHHW 0.94
HWM 0.793
MLHW 0.61
MSL 0.51
MHLW 0.42
AHD (King Island topographic datum) 0.118
MLLW 0.09
LAT (3d mm data, 2007) 0.00
ISLW -0.02
170/2 summary Tide Board zero -0.148
Adopted 3DMM LAT -0.148
LWM -0.307
SD (AHS Pty Ltd 1969/1970) - 0.307
SD (1999) -0.682
CD AUS 178 (NC 2002) -0.707
Zero of old tide board (Cleeland 1999) -1.432
TP Zero 3DMM long term gauge -1.970
(Data levels are based on calculation of 3DMM dataset collected from 09 March 2007 to 10 July 2007.)
Other benchmarks in area but connection to LAT is unknown: nil
Station – Grassy Harbour Height (m)
BM “F488” 4.156
BM “Station A Stern Ramp” 2.925
BM “F489” (1.426 +/-0.001m above F494 in 1998) 2.809 ± 0.001
HAT 1.90
MHHW 1.64
BM “F494 = Station B” 1.383
MLHW 0.98
MSL 0.92
31 AHD is not available on the Bass Strait Islands – local height datums apply. See http://dpipwe.tas.gov.au/land-tasmania/geospatial-
infrastructure-surveying/geodetic-survey/coordinate-height-and-tide-datums-tasmania

Page 84
MHLW 0.86
MLLW 0.21
ISLW 0.07
LAT 0.00
Zero tide board PLA -0.422
TGZ 3DMM long term gauge -1.190
(Data levels are based on analysis results from 3DMM dataset collected from 08 March 2007 to 31 May 2007.)
CD (plans on AUS 178 NC June 2002) Not yet assessed
CD (AUS 789 NC May 2003) Not yet assessed
Other Benchmarks and sounding datum in area but connection to LAT is unknown:
SD (HI 271 Flinders 1998) to LAT: requires further consideration because of problems experienced and poor results
that came out of tide gauges and pole versus gauge comparisons.
BM coping on south side of eastward end of old jetty at southern end of bay: do not use BM is 3.525m above MSL
unless source documents (other than handwritten notes headed “Grassy Bay–King I Aus 789” and Mark Rayner email)
can be located.
STN No 1 SH Nail in concrete at rear of ramp structure (not for use after 1999).
TBM (Temp BM) top of old bolt head on wooden wharf adjacent to temporary tide board (accuracy of any level +/-
0.01 – refer Cleeland letter dated 19 Feb 1999).
Station – Stanley Height (m)
BM SPM 6235 RM 1 (being 4.917 m above AHD) 6.980
BM SPM 6235 5.493
PWD BM “seaward side concrete footing Fisherman’s Co-op Preparation and Storage Building” 5.485
BM No 1 5.232
HAT 3.66
MHWS 3.28
MHWN 2.99
AHD 2.063
MSL 1.99
MLWN 0.99
MLWS 0.71
ISLW 0.44
LAT and ANTT Pred Datum 2007 – onward 0.00
CD (plan on AUS 178 NC June 2002) ~0.00
TG Zero 7 March 1966 to unknown and ANTT Pred Datum 1997 to 2006 -0.20
TG Zero prior to 7 March 1966
(Data levels are based on calculation from NTC constituents for ANTT 2007.)
Other benchmarks in area but connection to LAT is unknown: nil
Station – Burnie Height (m)
There are numerous other benchmarks in the area and relationship to LAT is shown on the following page.
SPM 9089 Note 2 16.603
SPM 9336 (5.802m above AHD) Note 2 7.76
ST 1164 (5.361m above AHD) Note 2 7.319
SPM 9337 Note 2 6.567
SPM 9338 Note 2 5.733
SPM 6554 Damaged 5.733
SPM 11090 (3.317 m above AHD) Note 2 5.275
SPM 9087 (3.062 m above AHD) Note 2 5.02
HAT 3.60
MHWS 3.24
MHWN 2.95
MSL 1.95
AHD Note 2 1.958
MLWN 0.94
MLWS 0.65
Ellipsoid separation [SPM 9089 above Ellipsoid = 13.145 ITRF92 1994.0] 0.442
ISLW 0.38
TGZero 1 Jan 1985 – onward = ANTT Pred Datum 2001 (at least) – onward 0.02

Page 85
LAT 0.00
CD (AUS 163 NE 1993) +0.05 to -0.14
(Data levels are based on calculation from ANTT 2007 harmonic constituents.)
OTHER BENCHMARKS
SPM 6556 Note 1 10.944 +/-0.002
SPM 9076 Note 1 8.812 +/-0.002
SPM 6555 Destroyed Note 1 7.153 +/-0.002
SPM 9075 Note 1 6.864 +/-0.001
BM 3 = ANTT BM 1968 to 1989
(destroyed 1987) Note 2 6.520
BM at gates to McGaw Pier (1946 – 1951) Note 3 6.063m
SPM 8857 Note 1 5.511 +/-0.005
LAT 0.00
Note 1: Based on levels calculated to SPM 6554 from past Tide Gauge Details reports between 1973 and 1989.
Accuracy associated with SPM 6554 included plus any difference observed in levels between benchmarks and SPM
6554.
Note 2: Connection to AHD. AHD value used by NTC and DPIPWE, Tasmania.
Note 3: Based on 1955 connection to AHD (TAS) supplied by DPIPWE, Tasmania.
Other benchmarks in area but connection to LAT is unknown: nil
Station – Devonport Height (m)
BM SPM 6553 6.144
BM SPM 6552 6.013
BM L38A 5.784
BM SPM 6551 5.558
BM MB1 (cut on concrete wall) 4.115
HAT 3.66
MHWS 3.25
MHWN 2.97
MSL 1.95
MLWN 0.93
MLWS 0.65
ISLW 0.36
SD (Year 1950 &1951) 0.302
LAT 0.00
CD (AUS 164 NE 1999) unknown
(Data levels are based on NTC LAT from 1994-2004 HC.)
CD is unknown due to different shifts applied for the same datum.
Other Benchmarks in area but connection to LAT is unknown: nil
Station – Low Head Height (m)
BM SPM 9214 RM1 (2.287m above AHD) Note 1 4.302
BM SPM 9214 RM2 (2.245m above AHD) Note 1 4.260
BM SPM 9214 (1.863m above AHD) Note 1 3.878
HAT 3.63
MHWS 3.26
MHWN 2.98
AHD 2.015
MSL 1.985
MLWN 0.99
MLWS 0.71
ISLW 0.42
TG Zero (Dec 2004 – 01 Jan 2005) = Pred Datum (ANTT 2007 – onward) 0.163
SD (HMAS Moresby Oct 1988) 0.163
TG Zero (intension to lower gauge by 0.1 m, 2008) 0.063
CD (AUS 167 NC 1997) – assumed 1.998 m below AHD Note 1 0.017
LAT 0.00
(Data levels are based on calculation by NTC for ANTT 2007.)

Page 86
NOTE 1 USE WITH CAUTION: Levels determined via AHD. Heights of mark above AHD obtain from TASPORTS
supplied Station Marks details and cross checked with TAS Survey Marks website (31 Mar 2006).
Other Benchmarks in area but connection to LAT is unknown:
BM “concrete step of disused lighthouse at Low Head”
Station – Spring Bay Height (m)
BM SPM 8521 (7.236 m above AHD) 7.999
BM SPM 8522 7.682
BM MBH BM (orange day glow BM on conveyor foundation) 7.596
BM SPM 5758 (Destroyed) CAUTION connected by MSL only 6.655
BM SPM 9257 (5.844 m above AHD) Note 1 6.607
BM AU 074 (4.567 m above AHD) Note 1 5.330
BM 1968 (Destroyed) ~5.2
BM 362.1 4.362
BM SPM 9404 (2.522 m above AHD) 3.285
BM SPM 8523 2.967
HAT 1.45
MHHW 1.27
MLHW 0.81
AHD 0.763
MSL 0.74
MHLW 0.67
MLLW 0.20
ISLW 0.17
CD (AUS 175 NC 28 March 2008) 0.00
CD (AUS 170 NC October 2006) 0.00
CD (AUS 797 NC 6 June 2008) 0.00
CD (AUS 766 NC 27 April 2007 0.00
LAT 0.00
TGZ Seaframe Gauge (1991-) -0.39
= Quasi Standard Seafarer 1993 – onward (local time zone) -0.39 (Data levels are based on NTC Seaframe Data 1991-2004.)
Note 1: Connection to LAT via AHD
Other Benchmarks in area but connection to LAT is unknown:
BM Installed in rock by Gutteridge, Haskins and Davey April 1970 5.049 CAUTION
Station – Hobart Height (m)
BM SPM 9217 7.670
BM SPM 1371 4.454
SPM 7444 (2.543m above AHD) Note 1 3.373
BM SPM 9163 (2.153m above AHD) Note 1 2.983
BM SPM 192 (2.039 m above AHD) Note 1 2.869
BM SPM 193 2.857
BM SPM 194 (MBH No. 17) (1.859m above AHD) Note 1 2.689
HAT 1.69
MHHW 1.51
MLHW 1.00
MSL 0.88
AHD 1983 (MSL 1972) 0.83
MHLW 0.76
Tas State datum (MSL determined 20 years to 1905) 0.665
MLLW 0.26
ISLW 0.25
CD (AUS 172 NC Sept 2005) 0.03
CD (AUS 796 NC 29 Aug 2008) ~0.0
LAT and ANTT Pred Datum 2006 – onward 0.00
ANTT Pred Datum 2000 – 2005 -0.37 (Data levels are based on calculation from NTC constituents for ANTT 2006.)
Note 1: Connections to LAT via AHD (DRMS AA409156)
Other Benchmarks in area but connection to LAT is unknown: SPM 195
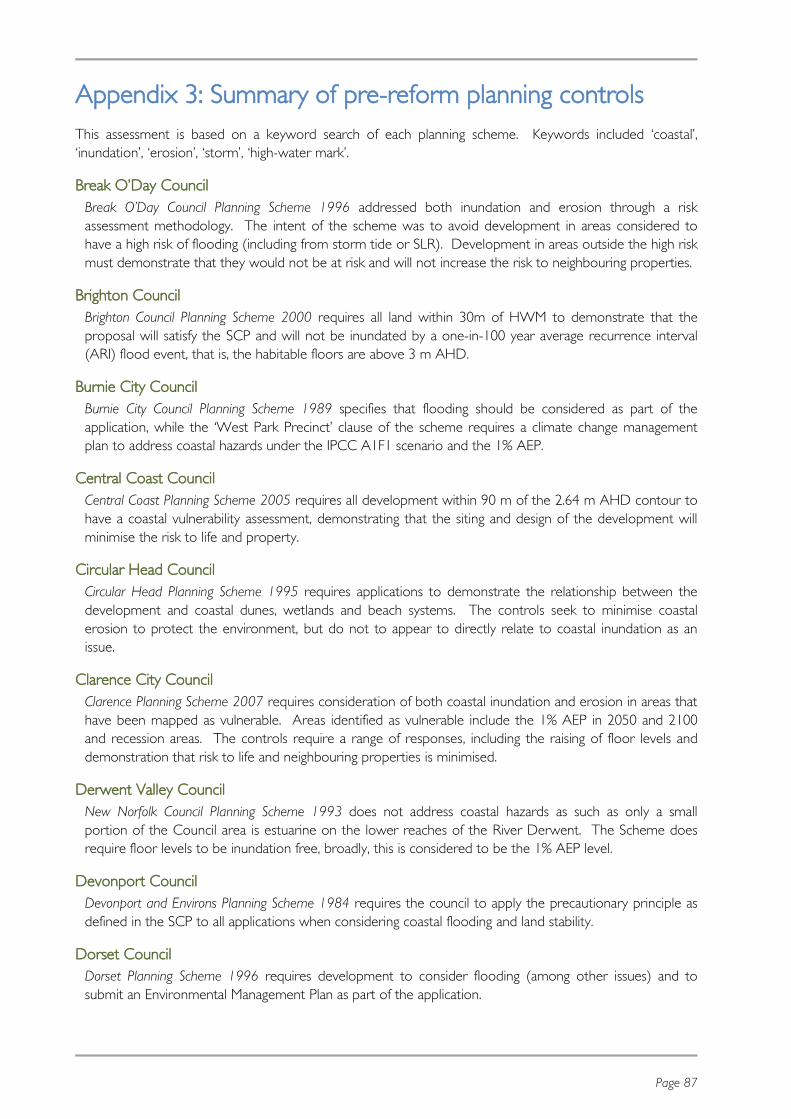
Page 87
Appendix 3: Summary of pre-reform planning controls
This assessment is based on a keyword search of each planning scheme. Keywords included ‘coastal’,
‘inundation’, ‘erosion’, ‘storm’, ‘high-water mark’.
Break O’Day Council
Break O’Day Council Planning Scheme 1996 addressed both inundation and erosion through a risk
assessment methodology. The intent of the scheme was to avoid development in areas considered to
have a high risk of flooding (including from storm tide or SLR). Development in areas outside the high risk
must demonstrate that they would not be at risk and will not increase the risk to neighbouring properties.
Brighton Council
Brighton Council Planning Scheme 2000 requires all land within 30m of HWM to demonstrate that the
proposal will satisfy the SCP and will not be inundated by a one-in-100 year average recurrence interval
(ARI) flood event, that is, the habitable floors are above 3 m AHD.
Burnie City Council
Burnie City Council Planning Scheme 1989 specifies that flooding should be considered as part of the
application, while the ‘West Park Precinct’ clause of the scheme requires a climate change management
plan to address coastal hazards under the IPCC A1F1 scenario and the 1% AEP.
Central Coast Council
Central Coast Planning Scheme 2005 requires all development within 90 m of the 2.64 m AHD contour to
have a coastal vulnerability assessment, demonstrating that the siting and design of the development will
minimise the risk to life and property.
Circular Head Council
Circular Head Planning Scheme 1995 requires applications to demonstrate the relationship between the
development and coastal dunes, wetlands and beach systems. The controls seek to minimise coastal
erosion to protect the environment, but do not to appear to directly relate to coastal inundation as an
issue.
Clarence City Council
Clarence Planning Scheme 2007 requires consideration of both coastal inundation and erosion in areas that
have been mapped as vulnerable. Areas identified as vulnerable include the 1% AEP in 2050 and 2100
and recession areas. The controls require a range of responses, including the raising of floor levels and
demonstration that risk to life and neighbouring properties is minimised.
Derwent Valley Council
New Norfolk Council Planning Scheme 1993 does not address coastal hazards as such as only a small
portion of the Council area is estuarine on the lower reaches of the River Derwent. The Scheme does
require floor levels to be inundation free, broadly, this is considered to be the 1% AEP level.
Devonport Council
Devonport and Environs Planning Scheme 1984 requires the council to apply the precautionary principle as
defined in the SCP to all applications when considering coastal flooding and land stability.
Dorset Council
Dorset Planning Scheme 1996 requires development to consider flooding (among other issues) and to
submit an Environmental Management Plan as part of the application.

Page 88
Flinders Council
Flinders Planning Scheme 1994 provides for areas affected by coastal waters defined as within 100 m of the
coast. The controls seek to restrict subdivision and require a setback from the coast of 100 m from
HWM unless council is satisfied that it is reasonable to do so.
George Town Council
Municipality of George Town Planning Scheme 1991 requires council to assess the capability of the land
regarding flood and land stability when considering a planning permit. The level to which it is considered
and the outcomes of the consideration are not defined as part of the scheme.
Glenmorgan Spring Bay Council
Glenmorgan Spring Bay Planning Scheme 1994 requires setbacks from HWM.
Glenorchy City Council
Glenorchy Planning Scheme 1992 considers coastal inundation and erosion. It requires that all buildings
(unless marine in purpose) are set back 10m from HWM. All development potentially impacted by SLR
or storm surge must demonstrate ways to minimise structural damage, risk to life, reduction of the need
for engineered solutions, and how they will not unreasonably impact on neighbouring properties.
Hobart City Council
Hobart City Council had three planning schemes (1979, 1992, 1997) prior to the release of the Interim
Planning Scheme in 2015. City of Hobart Planning Scheme 1982 and Battery Point Planning Scheme 1979
identify land below 3m AHD as being vulnerable to coastal inundation from a 1% AEP storm surge.
Applications must be designed and constructed to resist the hydrostatic and hydrodynamic forces,
minimise the hazard to neighbouring properties and have a finished floor level of 300mm above the 1%
AEP storm surge. Sullivan’s Cove Planning Scheme 1997 does not directly address coastal inundation.
Huon Valley Council
Until the release of the interim planning schemes, the Huon Valley Council had three schemes (1979,
1988, 1989) which address coastal hazards as follows:
Huon Valley Planning Scheme 1979 applies to the estuary area of the Huon River and primarily
addresses the issue of riverine flooding (including coastal inundation) in an “area designated as flood
prone”, in which an engineer’s report is required to demonstrate that the building will not be at risk of
movement or instability and will not significantly impact on the downstream flows for a one-in-100-
year flood event.
Port Cygnet Planning Scheme 1988 identifies all land under 3 m AHD to be discretionary development
subject to conditions including a minimum floor height of 3 m AHD, and that the council is satisfied
that it can be sited to minimise the risk, that waste water can be treated and the works will not
increase the risk elsewhere.
Esperance Coast Planning Scheme 1989 requires that all development vulnerable to coastal inundation
or erosion must be designed to provide reasonable protections from storm surge (including wave
action and SLR from climate change) and have habitable rooms at 3.0 m AHD.
King Island Council
King Island Planning Scheme 1995 considers coastal hazards through a requirement for development
potentially impacted by coastal hazards to consider them through the siting, design and construction of the
development.

Page 89
Kingborough Council
Kingborough Planning Scheme 2000 considers coastal areas to be all land within 500 m of HWM that has
not been modified by roads or buildings. Within this area, council seeks to mitigate the impact of coastal
hazards for all land with a moderate or higher risk. The mitigations must demonstrate how the risk will be
mitigated through design and protection measures that are certified by a suitably qualified person.
Latrobe Council
Latrobe Planning Scheme 1994 requires consideration of flooding as part of the assessment of an
application. The application is discretionary and must consider the 1% AEP flood level as part of the
design response.
Launceston City Council
Launceston Planning Scheme 1994 primarily considers riverine flooding, with the tidal influence in the
estuary considered in the flood modelling for the Tamar River. Of relevance to coastal inundation is the
consideration of the 1% AEP flood level for floor heights. It is not known if SLR is considered as part of
the modelling undertaken by council.
Sorell Council
Sorell Planning Scheme 1993 identifies all land below 3 m AHD as being vulnerable to a 1% AEP flood
event. In these areas, a suitably qualified person must demonstrate that habitable floors will be free of
flood and that the building can withstand a 1% AEP flood event.
Tasman Council
Tasman Planning Scheme 1979 requires consideration of if any part of the land is subject to flooding for
the purpose of subdivision.
Waratah Wynyard Council
Waratah Wynyard Planning Scheme 2000 defines the coastal flood area as within 30 m of HWM, or less
than 3 m above the ordinary HWM of the spring high tide in areas subject to storm surge. If the
development is within these areas then it must demonstrate how the hazard can be mitigated, that it will
not increase the risk to life, it will not unreasonably impact on neighbouring properties, that there is not
another available site and that the development will not interfere with natural coastal processes or pollute
the environment.
West Coast Council
West Coast Planning Scheme 2000 considers all natural hazards as a single issue. The scheme requires
development that may be impacted by erosion, coastal inundation or SLR to demonstrate (using a suitably
qualified person) that the development will avoid being impacted or demonstrate how the impact will be
minimised and prevent the impact of the hazard being increased.
West Tamar Council
West Tamar Planning Scheme 2006 considers flood hazard and storm surge as a single issue. Land is
considered vulnerable to storm surge if it is within 40 m landwards of HWM or less than 3 m AHD. In
these areas, the development must demonstrate that it can avoid or lessen the impact, and does not
interfere with the natural coastal processes.

Page 90
Appendix 4: Coastal erosion pairwise assessment
Coastal erosion hazard components are ordered from most acceptable (lowest susceptibility, lowest
pairwise scores) to most susceptible to erosion (highest pairwise scores). Note resilient artificial shores
(score 5316) fall into the low hazard band for storm bite erosion and the acceptable band for all other
recession.
Coastal erosion hazard zone component
Pairwise
assessment
score
Acceptable hazard zone (all gently to moderately sloping ‘pure’ hard-rock shores) 24
Acceptable hazard zone (very coarse boulder clay soft rocks) 1023
Acceptable hazard zone (normal soft rocks) 2022
Acceptable hazard zone (all soft sed. shores) – landwards of likely and possible natural recession limits 3021
Acceptable hazard zone (all soft sed. shores) – to possible natural recession limit 4020
Acceptable hazard zone (all soft sed. shores) – to likely natural recession limit 5217
Resilient artificial shores (acceptable recession zones landwards of resilient artificial shores) 5316
Resilient artificial shores (Low hazard storm bite zone landwards of resilient artificial shores) 5316
Longer-term potential settling & slumping hazard (very coarse boulder clay soft rocks) – 20 m 5514
Recession (S3) to 2100 Low hazard zone (sheltered soft sed. shore) – to possible natural recession limit 7215
Regression & slump hazard zone (steep to cliffed hard rocks) 7413
Longer-term potential recession hazard zone (normal soft rocks) – Low hazard zone 63 m to 2100 7512
Recession (S3) to 2100 Low hazard zone (open coast soft sed. shore) – to possible natural recession
limit 9312
Recession (S3) to 2100 Low hazard zone (sheltered soft sed. shore) – to likely natural recession limit 10311
Recession (S3) to 2050 Med hazard zone (sheltered soft sed. shore) – to possible natural recession limit 12309
Recession (S3) to 2100 Low hazard zone (open coast soft sed. shore) – to likely natural recession limit 13110
Medium-term potential recession hazard zone (normal soft rocks) – Med hazard zone 28 m to 2050 14307
Recession (S3) to 2050 Med hazard zone (open coast soft sed. shore) – to possible natural recession
limit 15207
Recession (S3) to 2050 Med hazard zone (sheltered soft sed. shore) – to likely natural recession limit 15306
Recession (S3) to 2050 Med hazard zone (open coast soft sed. shore) – to likely natural recession limit 17205
Near-term potential recession hazard zone (normal soft rocks) – High hazard zone 14 m to 2030 18105
Storm bite (S1 + S5) hazard zone for sheltered shores (sandy shores backed by moderately rising hard
bedrock) 20202
Storm bite (S1 + S5) High hazard zone (sheltered soft sed. shore) – to possible natural recession limit 21003
Storm bite (S1 + S5) High hazard zone (open coast soft sed. shore) – to possible natural recession limit 21102
Storm bite (S1 + S5) High hazard zone (sheltered soft sed. shore) – to likely natural recession limit 22101
Storm bite (S1 + S5) hazard zone for exposed shores (sandy shores backed by moderately rising hard
bedrock) 24000
Storm bite (S1 + S5) High hazard zone (open coast soft sed. shore) – to likely natural recession limit 24100
Non-resilient artificial shores (ignored)
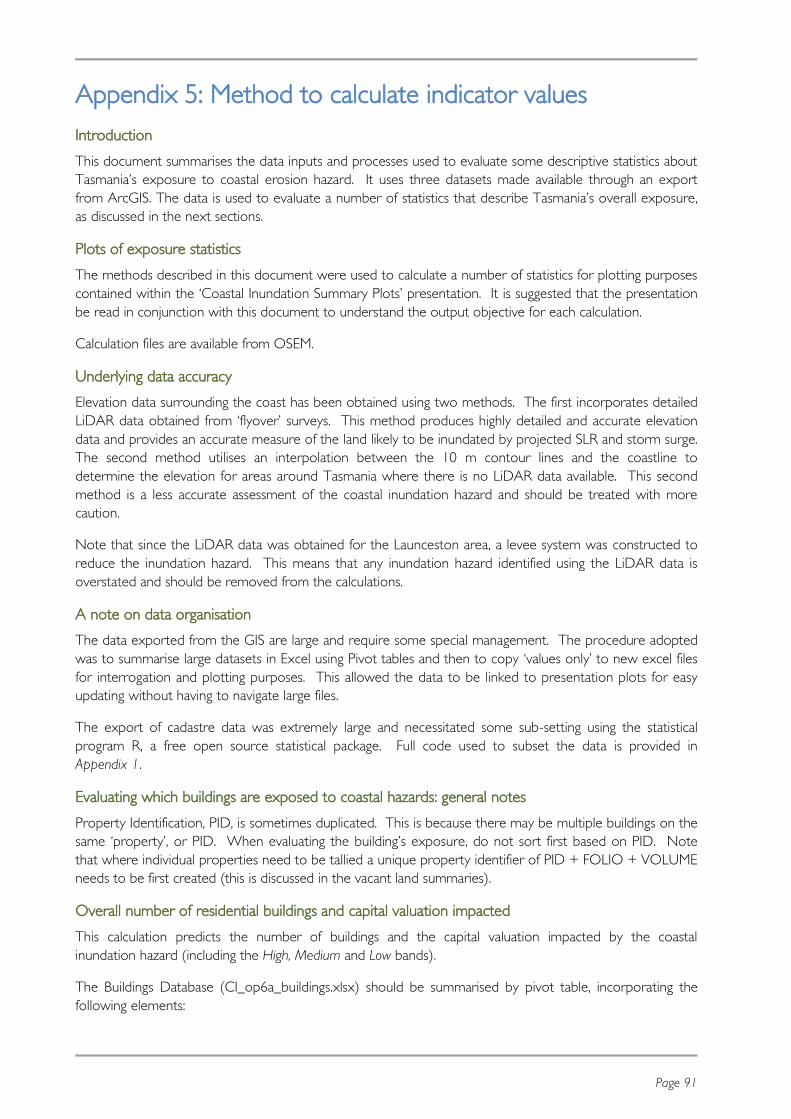
Page 91
Appendix 5: Method to calculate indicator values
Introduction
This document summarises the data inputs and processes used to evaluate some descriptive statistics about
Tasmania’s exposure to coastal erosion hazard. It uses three datasets made available through an export
from ArcGIS. The data is used to evaluate a number of statistics that describe Tasmania’s overall exposure,
as discussed in the next sections.
Plots of exposure statistics
The methods described in this document were used to calculate a number of statistics for plotting purposes
contained within the ‘Coastal Inundation Summary Plots’ presentation. It is suggested that the presentation
be read in conjunction with this document to understand the output objective for each calculation.
Calculation files are available from OSEM.
Underlying data accuracy
Elevation data surrounding the coast has been obtained using two methods. The first incorporates detailed
LiDAR data obtained from ‘flyover’ surveys. This method produces highly detailed and accurate elevation
data and provides an accurate measure of the land likely to be inundated by projected SLR and storm surge.
The second method utilises an interpolation between the 10 m contour lines and the coastline to
determine the elevation for areas around Tasmania where there is no LiDAR data available. This second
method is a less accurate assessment of the coastal inundation hazard and should be treated with more
caution.
Note that since the LiDAR data was obtained for the Launceston area, a levee system was constructed to
reduce the inundation hazard. This means that any inundation hazard identified using the LiDAR data is
overstated and should be removed from the calculations.
A note on data organisation
The data exported from the GIS are large and require some special management. The procedure adopted
was to summarise large datasets in Excel using Pivot tables and then to copy ‘values only’ to new excel files
for interrogation and plotting purposes. This allowed the data to be linked to presentation plots for easy
updating without having to navigate large files.
The export of cadastre data was extremely large and necessitated some sub-setting using the statistical
program R, a free open source statistical package. Full code used to subset the data is provided in
Appendix 1.
Evaluating which buildings are exposed to coastal hazards: general notes
Property Identification, PID, is sometimes duplicated. This is because there may be multiple buildings on the
same ‘property’, or PID. When evaluating the building’s exposure, do not sort first based on PID. Note
that where individual properties need to be tallied a unique property identifier of PID + FOLIO + VOLUME
needs to be first created (this is discussed in the vacant land summaries).
Overall number of residential buildings and capital valuation impacted
This calculation predicts the number of buildings and the capital valuation impacted by the coastal
inundation hazard (including the High, Medium and Low bands).
The Buildings Database (CI_op6a_buildings.xlsx) should be summarised by pivot table, incorporating the
following elements:

Page 92
Database: CI_op6a_buildings.xlsx (28 MB)
Descriptor GIS attribute Summarised in Pivot table by
Local Government Area Name Filter, and remove Launceston
Property Identification PID Filter, ensure 0’s and Blanks are kept.
Residential Buildings Build_type Filter for “Residence”
Elevation data: LiDAR or non-LiDAR Type Rows: Type
Hazard bands HB_V6a Values: Count of HB_V6a
Column: HB_V6a
To calculate the capital valuation impacted by coastal inundation, include the Current Capital Valuation as
shown below.
Descriptor GIS field name Summarised in Pivot table by
Current Capital Valuation Current CV Sum of Current CV
Number of residential buildings impacted by LGA and suburb
The calculation for the number of residential buildings impacted in each LGA and suburb involves the
creation of two more pivot tables summarising the above, with the inclusion of LGA and suburb as
additional data fields:
Database: CI_op6a_buildings.xlsx (28 MB)
Descriptor GIS field name Summarised in Pivot table by
Local Government Area Name Filter and remove Launceston
Row: Name
Suburbs SUBURB_LOC Filter and remove Launceston
Row: SUBURBED_LOC
Evaluating what land is exposed to coastal hazards
Area of vacant land less than 2 000 m2 impacted
Vacant land sized less than 2 000 m2 is used as an approximate descriptor for land that could be readily
developed. Hence vacant land less than 2 000 m2 and subject to coastal inundation hazards describes
potential future exposure if this land was developed, or land that may be prevented from development
due to coastal hazards.
Area data is sourced from a collection of cadastre or land boundary data. Because the cadastre export
from GIS is so large (2GB) GIS was used to isolate all vacant land under 2 000 m2.

Page 93
The GIS fields used to subset the data into the file ‘CI_Cad_vg_address_V_lt2k_v6a_7_lt10m.xlsx’
included:
GIS Descriptor GIS field name Attributes to select
Landuse status: Vacant? LANDUSECODE V1-V9
Landuse status: Privately owned? Cadtype1 Private Parcel
Size of land parcel COMP_AREA Less than 2 000 m2
Elevation data source Type LiDAR and Non-LiDAR
The area of vacant land less than 2000m2 impacted by coastal hazards can be summarised by pivot table
and incorporating the following elements.
Database: CI_Cad_vg_address_V_lt2k_v6a_7_lt10m.xlsx
Descriptor GIS attribute Summarised in pivot table by
Local Government Area MUNICIPALITYCODE Filter for all but Launceston (Code
120)
Elevation data source Type Row Labels: LiDAR and non-LiDAR
Hazard band HB_V6a Row labels: High, Medium and Low
Area of land in each hazard band Shape_Area Value: Sum Shape_Area
The summary then allows the land area within each hazard band, identified by elevation data type
(LiDAR or non-LiDAR to be identified).
Proportion of vacant land less than 2 000m2 impacted
The above calculation determines the absolute area of land impacted by each of the hazard bands (High,
Medium and Low). The proportion of vacant properties affected, from the total, rather than an absolute
figure should also be calculated. Additionally, properties will also be affected to varying degrees. For
instance, the number of properties impacted by more than 10% or 50% for a particular hazard band
would also be of interest.
The first step is to identify each unique property. This involves a combination of the attributes PID,
FOLIO and VOLUME. A simple ‘concatenate’ function in Excel can be used to combine these attributes
to create a unique property identifier that can then be later interrogated. Note that a simple
comparison using PID cannot be utilised, as there can be multiple properties with the same PID, for
instance where properties have been subdivided.
The second step is to sum the area of land impacted by each hazard band for each unique property
(PID + FOLIO + VOLUME). This is because the GIS database assigns properties impacted by multiple
hazard bands into a new row with the same PID, FOLIO and VOLUME. For example, a single property
impacted by all three hazard bands High, Medium and Low, would be triple counted and the total
number of properties would be overstated. (The true proportion under such a scenario would be
understated.)
In order to calculate the proportion of vacant land less than 2 000 m2 impacted for each property and,
subsequently, the proportion of all vacant properties impacted, the database should again be summarised
by pivot table incorporating the following elements:
Database: CI_Cad_vg_address_V_lt2k_v6a_7_lt10m.xlsx
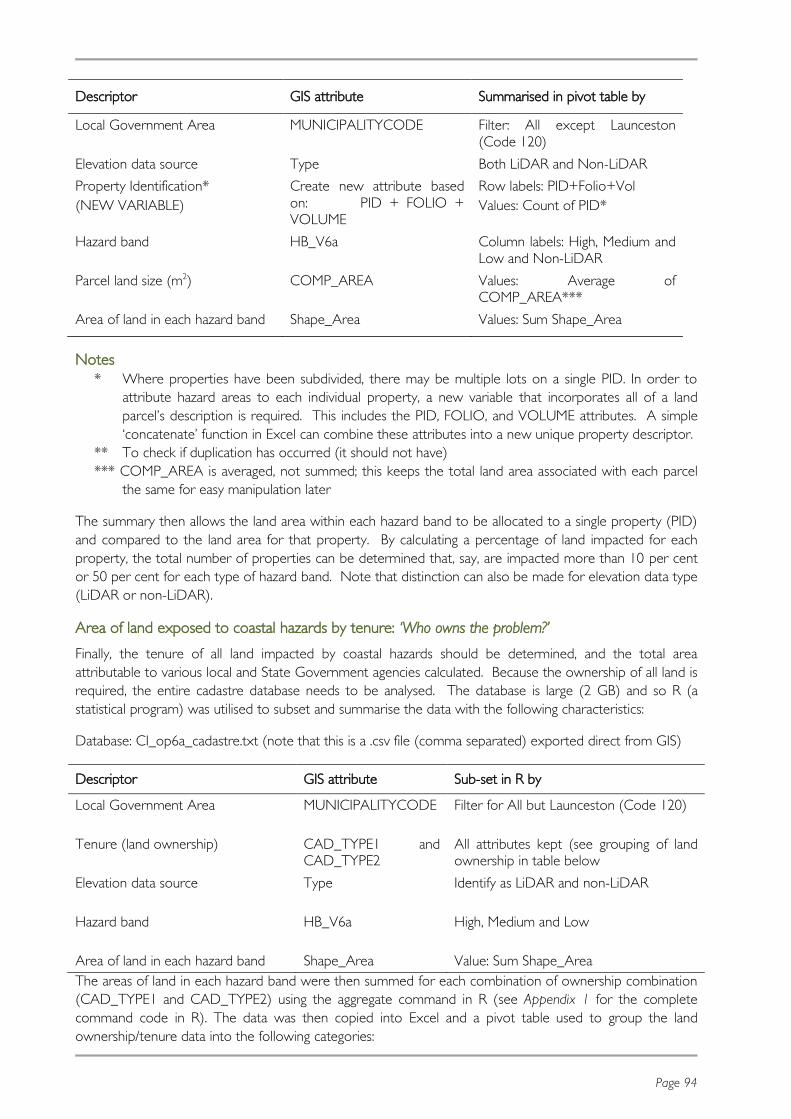
Page 94
Descriptor GIS attribute Summarised in pivot table by
Local Government Area MUNICIPALITYCODE Filter: All except Launceston
(Code 120)
Elevation data source Type Both LiDAR and Non-LiDAR
Property Identification*
(NEW VARIABLE)
Create new attribute based
on: PID + FOLIO + VOLUME
Row labels: PID+Folio+Vol
Values: Count of PID*
Hazard band HB_V6a Column labels: High, Medium and
Low and Non-LiDAR
Parcel land size (m2) COMP_AREA Values: Average of COMP_AREA***
Area of land in each hazard band Shape_Area Values: Sum Shape_Area
Notes
* Where properties have been subdivided, there may be multiple lots on a single PID. In order to
attribute hazard areas to each individual property, a new variable that incorporates all of a land
parcel’s description is required. This includes the PID, FOLIO, and VOLUME attributes. A simple
‘concatenate’ function in Excel can combine these attributes into a new unique property descriptor.
** To check if duplication has occurred (it should not have)
*** COMP_AREA is averaged, not summed; this keeps the total land area associated with each parcel
the same for easy manipulation later
The summary then allows the land area within each hazard band to be allocated to a single property (PID)
and compared to the land area for that property. By calculating a percentage of land impacted for each
property, the total number of properties can be determined that, say, are impacted more than 10 per cent
or 50 per cent for each type of hazard band. Note that distinction can also be made for elevation data type
(LiDAR or non-LiDAR).
Area of land exposed to coastal hazards by tenure: ‘Who owns the problem?’
Finally, the tenure of all land impacted by coastal hazards should be determined, and the total area
attributable to various local and State Government agencies calculated. Because the ownership of all land is
required, the entire cadastre database needs to be analysed. The database is large (2 GB) and so R (a
statistical program) was utilised to subset and summarise the data with the following characteristics:
Database: CI_op6a_cadastre.txt (note that this is a .csv file (comma separated) exported direct from GIS)
Descriptor GIS attribute Sub-set in R by
Local Government Area MUNICIPALITYCODE Filter for All but Launceston (Code 120)
Tenure (land ownership) CAD_TYPE1 and CAD_TYPE2
All attributes kept (see grouping of land ownership in table below
Elevation data source Type Identify as LiDAR and non-LiDAR
Hazard band HB_V6a High, Medium and Low
Area of land in each hazard band Shape_Area Value: Sum Shape_Area
The areas of land in each hazard band were then summed for each combination of ownership combination
(CAD_TYPE1 and CAD_TYPE2) using the aggregate command in R (see Appendix 1 for the complete
command code in R). The data was then copied into Excel and a pivot table used to group the land
ownership/tenure data into the following categories:

Page 95
Ownership groups and their makeup
Ownership Group CAD_TYPE1 CAD_TYPE2 attributes
State Authority Land Aboriginal Land, Department of Education, Department of
State Growth, Department of Health and Human Services,
Department of Police, Fire and Emergency Management
(DPFEM), Department of Primary Industries, Parks, Water
and Environment (DPIPWE), Housing Tasmania, Marine and
Safety Tasmania, PWS, State Fire Commission, University of Tasmania
Private Private Parcel Private Parcel
Local Government Authority Land LGA
Casement Casement All, including: Reserved Road, Road (type unknown),
Subdivision Road, User Road, Acquired Road, Casement
Unknown, LGA Subdivision Road, Footway, Forestry Road, Walkway, Tramway.
Government Business Authority Land ABT Railway Corp, Aurora Energy Pty Ltd, Cradle Mountain
Water, Forestry Tasmania, Hydro Electric Corporation, Port
Arthur Historic Site Management Authority, Southern Water, Tasmanian Ports Corporation Pty Ltd.
Commonwealth of
Australia
Authority Land Commonwealth of Australia
Not included ‘Other Category’ Marine Nature Reserve, Survey Inconsistency, Onshore
Water Body
Excel was utilised to plot the information in a consistent manner and to further attribute land impacted to
various departments for information.
Watch-its
A number of watch-its for revision of, and calculation of, new hazard banding statistics are included below:
The GIS attribute ‘name’ with attribute values of ‘Less than 10 m AHD’ is meaningless for the purposes
described in this document.
PID is not a unique property identifier. PID plus FOLIO plus VOLUME is unique for each property.
R Code
% Read the 2GB file into R for subsequent analysis
CI_Cad_op6a <- read.table("CI_op6a_cadastre.txt", header = TRUE, sep = ",")
% Isolate LiDAR obtained data into a separate dataframe in R for later query
CI_Cad_op6a_exclLaun_LiDAR <- subset(CI_Cad_op6a, Type == "LiDAR < 10m" &
MUNICIPALITYCODE %in%
c(0,101,102,103,104,105,106,107,108,109,110,111,112,113,114,115,116,117,118,119,121,122,123,124,1
25,126,127,128,129),
select = c(MUNICIPALITYCODE, Type, CAD_TYPE1, CAD_TYPE2, TENURE_TY, HB_V6A,
Shape_Area))
% Summarise LiDAR data with respect to tenure, hazard band and land area in each hazard band, copy
output to Excel
aggregate(Shape_Area ~ CAD_TYPE1 + CAD_TYPE2 + HB_V6A,
data=CI_Cad_op6a_exclLaun_LiDAR, FUN=sum)

Page 96
% Isolate Non LiDAR obtained data into a separate dataframe in R for later query
CI_Cad_op6a_exclLaun_NonLiDAR <- subset(CI_Cad_op6a, Type == "Non LiDAR < 10m" &
MUNICIPALITYCODE %in%
c(0,101,102,103,104,105,106,107,108,109,110,111,112,113,114,115,116,117,118,119,121,122,123,124,1
25,126,127,128,129),
select = c(MUNICIPALITYCODE, Type, CAD_TYPE1, CAD_TYPE2, TENURE_TY, HB_V6A,
Shape_Area))
% Summarise Non-LiDAR data with respect to tenure, hazard band and land area in each hazard band,
copy output to Excel
aggregate(Shape_Area ~ CAD_TYPE1 + CAD_TYPE2 + HB_V6A,
data=CI_Cad_op6a_exclLaun_NonLiDAR, FUN=sum)

Page 97
Appendix 6: State & LGA indicators – coastal erosion

Page 98
Number of residential building envelopes by coastal erosion hazard band, LGA and locality
Coastal Erosion Hazard Band
LGA Suburb Investigation Low Medium High Total
Break O'Day Council
AKAROA 15 9 2 26
ANSONS BAY 6 24 34 35 99
BINALONG BAY 14 4 18
SCAMANDER 15 1 16
ST HELENS 18 30 20 7 75
STIEGLITZ 47 12 59
(blank) 1 4 3 12 20
Break O'Day Council Total
86 100 71 56 313
Brighton Council BRIDGEWATER 7 18 25
OLD BEACH 45 3 48
(blank) 1 1
Brighton Council Total
1 52 21 74
Burnie City Council
CAMDALE 3 2 5
COOEE 10 9 19
OCEAN VISTA 7 7
Burnie City Council Total
13 18 31
Central Coast Council
GAWLER 3 3
HEYBRIDGE 18 18
LEITH 4 4 8
PENGUIN 2 1 2 5
PRESERVATION BAY 18 18
SULPHUR CREEK 30 30
TURNERS BEACH 6 34 1 41
ULVERSTONE 39 13 2 54
WEST ULVERSTONE 25 32 59 6 122
(blank) 2 4 4 10
Central Coast Council Total
121 48 111 29 309
Circular Head Council
HELLYER 6 38 2 46
SMITHTON 2 1 3
STANLEY 19 3 1 2 25
(blank) 2 1 3
Circular Head Council Total
21 11 39 6 77

Page 99
Clarence City Council
BELLERIVE 5 5 10
CAMBRIDGE 1 1 2
CLIFTON BEACH 6 15 21
CREMORNE 34 47 51 132
GEILSTON BAY 3 3
HOWRAH 9 1 1 11
LAUDERDALE 1 23 125 22 171
LINDISFARNE 20 1 18 39
OPOSSUM BAY 33 71 104
OTAGO 14 14
ROCHES BEACH 3 3
ROKEBY 2 1 3
ROSE BAY 2 7 4 13
SANDFORD 6 5 11
SEVEN MILE BEACH 10 1 11
SOUTH ARM 20 21 22 63
TRANMERE 9 9
(blank) 4 6 10
Clarence City Council Total
1 191 247 191 630
Derwent Valley Council
BOYER 1 1
GRANTON 4 4
NEW NORFOLK 29 1 4 1 35
SORELL CREEK 1 1 3 5
(blank) 4 4
Derwent Valley Council Total
38 3 7 1 49
Devonport City Council
DEVONPORT 1 1
DON 1 1
EAST DEVONPORT 8 2 12 2 24
QUOIBA 20 20
(blank) 13 2 2 17
Devonport City Council Total
42 5 14 2 63
Dorset Council BRIDPORT 7 15 5 27
TOMAHAWK 13 13
Dorset Council Total
7 15 18 40
Flinders Council BASS STRAIT ISLANDS 7 7
BLUE ROCKS 2 2
CAPE BARREN ISLAND 1 1
KILLIECRANKIE 1 1

Page 100
LADY BARRON 11 1 12
LEEKA 1 1
WHITEMARK 2 3 8 13
(blank) 8 3 3 14
Flinders Council Total
23 3 14 11 51
George Town Council
BELLINGHAM 10 1 11
GEORGE TOWN 2 94 7 12 115
HILLWOOD 6 6
LOW HEAD 13 13 13 39
LULWORTH 6 1 7 14
WEYMOUTH 2 1 3
(blank) 1 2 3 6
George Town Council Total
33 115 17 29 194
Glamorgan-Spring Bay Council
BICHENO 1 1 2
COLES BAY 11 29 23 63
DOLPHIN SANDS 5 8 13
DOUGLAS RIVER 2 1 3
ORFORD 39 10 22 56 127
RHEBAN 7 7
SPRING BEACH 5 6 11
SWANSEA 14 1 3 18
TRIABUNNA 4 2 1 7
(blank) 5 3 8
Glamorgan-Spring Bay Council Total 62 43 62 92 259
Glenorchy City Council
BERRIEDALE 13 2 15
CLAREMONT 39 2 41
GLENORCHY 6 6
GRANTON 10 2 2 14
(blank) 3 1 4
Glenorchy City Council Total
16 57 7 80
Hobart City Council
BATTERY POINT 1 4 5
SANDY BAY 63 22 20 105
(blank) 5 4 5 14
Hobart City Council Total
69 26 29 124
Huon Valley Council
ABELS BAY 4 2 6
BROOKS BAY 2 2

Page 101
CASTLE FORBES BAY 1 1
CRADOC 1 1
CYGNET 13 1 1 15
DEEP BAY 1 10 11
DOVER 1 15 44 17 77
EGGS AND BACON BAY 2 8 1 11
FRANKLIN 7 1 2 10
GARDEN ISLAND CREEK 27 2 29
GARDNERS BAY 1 1
HUONVILLE 8 1 12 21
LYMINGTON 1 1 2
NICHOLLS RIVULET 2 2
POLICE POINT 1 2 3
RAMINEA 1 1
RANDALLS BAY 1 4 5
RECHERCHE 4 1 4 9
SOUTHPORT 1 10 30 15 56
SURGES BAY 2 3 5
SURVEYORS BAY 19 14 33
VERONA SANDS 64 3 1 68
WATERLOO 1 1
WATTLE GROVE 3 3
WOODSTOCK 2 2
(blank) 1 1 3 35 40
Huon Valley Council Total
154 54 102 105 415
King Island Council
CURRIE 1 1 2
NARACOOPA 2 2
King Island Council Total
3 1 4
Kingborough Council
ADVENTURE BAY 13 49 7 69
ALONNAH 1 5 1 7
BARRETTA 3 5 8
BIRCHS BAY 1 1
BLACKMANS BAY 29 3 32
CONINGHAM 9 9
DENNES POINT 3 6 7 22 38
ELECTRONA 1 1 2
FLOWERPOT 1 1
GORDON 3 3 6
GREAT BAY 6 3 9
HOWDEN 18 2 20
KILLORA 3 3
KINGSTON 2 2

Page 102
KINGSTON BEACH 34 17 3 54
LOWER SNUG 4 4
LUNAWANNA 3 3
MARGATE 3 34 12 49
MIDDLETON 4 4
NORTH BRUNY 1 1 1 3
OYSTER COVE 3 2 1 6
SNUG 14 8 22
SOUTH BRUNY 4 1 5
TAROONA 36 6 42
TINDERBOX 10 10
WOODBRIDGE 5 2 7
(blank) 1 2 3
Kingborough Council Total
16 246 116 41 419
Latrobe Council BAKERS BEACH 4 18 2 24
HAWLEY BEACH 11 11
PORT SORELL 12 41 16 4 73
SHEARWATER 37 37
SQUEAKING POINT 22 22
TARLETON 1 1 2
(blank) 1 1
Latrobe Council Total
39 71 56 4 170
Launceston City Council
DILSTON 7 7 14
TREVALLYN 5 5
WINDERMERE 9 3 12
Launceston City Council Total
7 21 3 31
Sorell Council BOOMER BAY 3 3
BREAM CREEK 1 1
CARLTON 28 28
CARLTON RIVER 1 1
CONNELLYS MARSH 17 8 25
DODGES FERRY 46 21 3 9 79
DUNALLEY 29 8 1 38
LEWISHAM 17 3 7 27
MARION BAY 3 7 1 11
MIDWAY POINT 1 45 12 58
PENNA 18 3 21
PRIMROSE SANDS 46 9 14 69
(blank) 3 2 2 7
Sorell Council Total
52 186 89 41 368

Page 103
Tasman Council EAGLEHAWK NECK 1 3 7 11
KOONYA 1 1
MURDUNNA 8 1 3 12
NUBEENA 3 3 6
PORT ARTHUR 3 11 20 1 35
PREMAYDENA 2 2
WHITE BEACH 1 19 9 29
(blank) 3 1 1 5
Tasman Council Total
17 16 44 24 101
Waratah-Wynyard Council
BOAT HARBOUR 1 1
BOAT HARBOUR BEACH 4 27 31
DOCTORS ROCKS 9 9
SISTERS BEACH 3 61 3 67
SOMERSET 10 16 26
WYNYARD 23 39 74 10 146
(blank) 1 1 3 1 6
Waratah-Wynyard Council Total 24 58 163 41 286
West Coast Council
STRAHAN 36 9 45
(blank) 4 2 6
West Coast Council Total
40 11 51
West Tamar Council
BAKERS BEACH 1 1
BEAUTY POINT 1 34 20 55
BLACKWALL 35 35
CLARENCE POINT 4 3 1 8
DEVIOT 5 24 16 45
EXETER 1 1
GRAVELLY BEACH 27 4 31
GREENS BEACH 62 4 66
KAYENA 16 2 18
KELSO 8 26 19 30 83
LEGANA 20 4 24
ROBIGANA 3 3
ROSEVEARS 34 2 36
SWAN POINT 49 2 51
(blank) 1 3 2 6
West Tamar Council Total
51 303 78 31 463
Grand Total 814 1720 1334 734 4602

Page 104
Appendix 7: State & LGA indicators – coastal inundation

Page 105
Number of residential buildings by hazard band, LGA and suburb/town
LGA Suburb Investigation Low Medium High Grand Total
Break O'Day Council AKAROA 8 6 14
ANSONS BAY 2 18 15 21 56
CHAIN OF LAGOONS
10 10
DOUGLAS RIVER
2 2
SCAMANDER 3 7 2 12
SEYMOUR 7 7
ST HELENS 17 8 1 26
STIEGLITZ 4 4 8
(blank) 1 2 4 5 12
Break O'Day Council Total 25 56 39 27 147
Brighton Council BRIDGEWATER 4 6 10
OLD BEACH 44 12 56
(blank) 1 1
Brighton Council Total 49 18 67
Burnie City Council CHASM CREEK 1 1
HEYBRIDGE 1 1
WIVENHOE 5 2 7
Burnie City Council Total 5 3 1 9
Central Coast Council FORTH 2 1 3
HEYBRIDGE 15 3 3 21
PENGUIN 2 2 4
TURNERS BEACH
65 5 70
ULVERSTONE 6 2 8
WEST ULVERSTONE
209 75 284
(blank) 12 10 1 23
Central Coast Council Total 311 98 4 413
Circular Head Council DETENTION 1 1
HELLYER 10 10
SMITHTON 21 10 2 33
STANLEY 7 1 8
(blank) 1 1 1 3
Circular Head Council Total 1 40 12 2 55
Clarence City Council BELLERIVE 49 49
CAMBRIDGE 1 1 1 3
CLIFTON BEACH 12 16 1 29
CREMORNE 14 130 144

Page 106
HOWRAH 9 4 1 14
LAUDERDALE 159 166 1 326
LINDISFARNE 2 4 5 11
OPOSSUM BAY 1 13 2 16
ROCHES BEACH 1 1
ROKEBY 2 2 4
ROSE BAY 2 2
SANDFORD 3 14 17
SEVEN MILE BEACH
23 6 29
SOUTH ARM 13 13
(blank) 2 26 1 1 30
Clarence City Council Total 4 317 358 9 688
Derwent Valley Council NEW NORFOLK 4 10 14
SORELL CREEK 1 2 3
(blank) 2 1 3
Derwent Valley Council Total 7 12 1 20
Devonport City Council DON 1 1
EAST DEVONPORT
49 49
(blank) 3 3
Devonport City Council Total 53 53
Dorset Council BRIDPORT 3 1 4
TOMAHAWK 1 1
Dorset Council Total 1 3 1 5
Flinders Council BASS STRAIT ISLANDS
19 19
BLUE ROCKS 5 5
CAPE BARREN ISLAND
5 5
EMITA 1 1
KILLIECRANKIE 9 9
LADY BARRON 13 1 14
LEEKA 6 6
LOCCOTA 2 2
LUGHRATA 3 3
MEMANA 1 1
PALANA 7 7
WHITEMARK 4 11 6 21
(blank) 21 21
Flinders Council Total 96 11 6 1 114
George Town Council BELLINGHAM 11 2 13
GEORGE TOWN 15 7 22

Page 107
LOW HEAD 28 7 35
WEYMOUTH 7 4 11
(blank) 3 2 5
George Town Council Total 61 23 2 86
Glamorgan-Spring Bay Council
BICHENO 1 1
COLES BAY 31 28 59
DOLPHIN SANDS
3 5 8
DOUGLAS RIVER
14 14
ORFORD 53 29 82
RHEBAN 18 18
SWANSEA 10 10
TRIABUNNA 1 5 6
(blank) 1 17 1 19
Glamorgan-Spring Bay Council Total 34 115 67 1 217
Glenorchy City Council BERRIEDALE 7 2 9
CLAREMONT 5 5 10
DERWENT PARK 2 2
GLENORCHY 48 48
GOODWOOD 1 1 2
GRANTON 1 1
LUTANA 5 5
MONTROSE 8 8
(blank) 6 6
Glenorchy City Council Total 83 8 91
Hobart City Council BATTERY POINT 1 2 1 4
SANDY BAY 29 30 1 60
(blank) 20 2 22
Hobart City Council Total 50 34 2 86
Huon Valley Council CRADOC 1 1
CYGNET 3 6 9
DEEP BAY 1 1
DOVER 4 18 17 1 40
EGGS AND BACON BAY
2 3 2 7
FRANKLIN 2 11 13
GARDEN ISLAND CREEK
22 18 2 42
HASTINGS 11 11
HUONVILLE 6 2 8
LUNE RIVER 10 10
POLICE POINT 2 2 4
PORT HUON 1 1 2

Page 108
RAMINEA 5 5
RANDALLS BAY 5 5
RECHERCHE 36 36
SOUTHPORT 7 10 2 19
STRATHBLANE 6 6
SURVEYORS BAY
6 9 15
VERONA SANDS 26 16 1 43
(blank) 5 6 22 6 39
Huon Valley Council Total 77 99 123 17 316
King Island Council NARACOOPA 32 32
SURPRISE BAY 1 1
YAMBACOONA 2 2
King Island Council Total 35 35
Kingborough Council ADVENTURE BAY
20 21 41
ALONNAH 12 12
BARNES BAY 1 1 2
BARRETTA 1 1
BIRCHS BAY 2 2
DENNES POINT 2 1 3
FLOWERPOT 1 1
GORDON 9 9
GREAT BAY 1 1
KETTERING 1 1
KINGSTON 3 2 5
KINGSTON BEACH
55 20 1 76
MARGATE 2 2 1 5
MIDDLETON 9 9
NORTH BRUNY 1 1
SNUG 6 27 33
SOUTH BRUNY 25 1 26
WOODBRIDGE 1 1
(blank) 1 9 2 12
Kingborough Council Total 59 100 80 2 241
Latrobe Council LATROBE 2 2
PORT SORELL 92 98 1 191
SHEARWATER 95 20 115
SQUEAKING POINT
1 1 2
TARLETON 1 1
(blank) 5 5 10
Latrobe Council Total 195 125 1 321

Page 109
Launceston City Council MOWBRAY 3 3
TREVALLYN 1 1
(blank) 1 1
Launceston City Council Total 4 1 5
Sorell Council CARLTON 11 9 20
CARLTON RIVER 1 1 2
CONNELLYS MARSH
6 5 11
DODGES FERRY 1 11 12
DUNALLEY 1 8 9
LEWISHAM 1 3 4
MARION BAY 7 11 18
PENNA 5 5
PRIMROSE SANDS
1 1
(blank) 1 2 3
Sorell Council Total 32 50 3 85
Tasman Council KOONYA 1 1
MURDUNNA 2 2
NUBEENA 2 2
PORT ARTHUR 14 4 18
PREMAYDENA 2 2
TARANNA 3 3
WHITE BEACH 1 5 7 13
(blank) 2 3 5
Tasman Council Total 5 22 16 3 46
Waratah-Wynyard Council
BOAT HARBOUR BEACH
7 7 14
DOCTORS ROCKS
1 1
SISTERS BEACH 16 4 20
SOMERSET 15 15
WYNYARD 1 1
Waratah-Wynyard Council Total 39 12 51
West Coast Council STRAHAN 36 114 3 153
WEST COAST 11 11
(blank) 9 1 6 1 17
West Coast Council Total 20 37 120 4 181
West Tamar Council BADGER HEAD 1 1
BEAUTY POINT 5 4 1 10
BLACKWALL 2 3 5
CLARENCE POINT
2 2
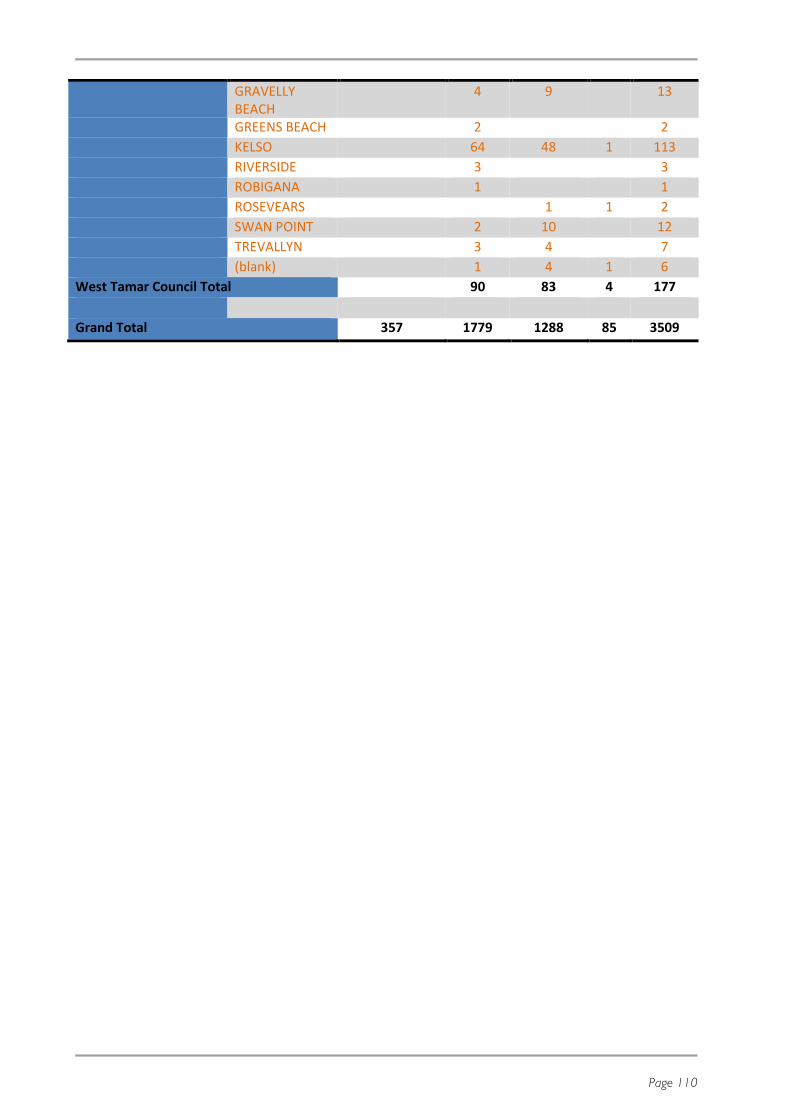
Page 110
GRAVELLY BEACH
4 9 13
GREENS BEACH 2 2
KELSO 64 48 1 113
RIVERSIDE 3 3
ROBIGANA 1 1
ROSEVEARS 1 1 2
SWAN POINT 2 10 12
TREVALLYN 3 4 7
(blank) 1 4 1 6
West Tamar Council Total 90 83 4 177
Grand Total 357 1779 1288 85 3509

Page 111
Appendix 8: High hazard hotspots – inundation & erosion
Coastal inundation and erosion high hazard hotspots are comprised of the number of residential
houses that are vulnerable to at least a High hazard area for either coastal inundation (CI) or coastal erosions
(CE) and another hazard band (Low, Medium, Investigation Area).
NAME Suburb
CE=
/CI=
Hig
h
CE=
Acc
epta
ble
/CI=
Hig
h
CE=
Hig
h/C
I=
CE=
Hig
h/C
I=H
igh
CE=
Hig
h/C
I=In
vest
igat
ion
CE=
Hig
h/C
I=Lo
w
CE=
Hig
h/C
I=M
ediu
m
CE=
Inve
stig
atio
n/C
I=H
igh
CE=
Low
/CI=
Hig
h
CE=
Med
ium
/CI=
Hig
h
Gra
nd
To
tal
Break O'Day Council AKAROA 2 2
ANSONS BAY 6 17 3 9 3 1 39
ST HELENS 4 1 2 1 8
(blank) 5 5 1 1 12
Break O'Day Council Total 17 22 5 12 3 2 61
Burnie City Council HEYBRIDGE 1 1
Burnie City Council Total 1 1
Central Coast Council HEYBRIDGE 3 7 11 21
PENGUIN 2 2
TURNERS BEACH 1 1
ULVERSTONE 1 1 2
WEST ULVERSTONE
2 4 6
(blank) 1 1
Central Coast Council Total 4 13 16 33
Circular Head Council HELLYER 2 2
SMITHTON 1 1 2
STANLEY 2 2
(blank) 1 1
Circular Head Council Total 1 2 1 2 1 7
Clarence City Council CAMBRIDGE 1 1
CLIFTON BEACH 1 1
CREMORNE 39 1 11 51
HOWRAH 1 1 2
LAUDERDALE 1 13 6 3 23
LINDISFARNE 16 2 18
OPOSSUM BAY 55 2 1 13 71
ROKEBY 2 1 3
ROSE BAY 3 1 4

Page 112
SEVEN MILE BEACH
1 1
SOUTH ARM 18 4 22
(blank) 1 1
Clarence City Council Total 5 146 2 16 27 1 1 198
Derwent Valley Council
NEW NORFOLK 1 1
(blank) 1 1
Derwent Valley Council Total 1 1 2
Devonport City Council
EAST DEVONPORT
2 2
Devonport City Council Total 2 2
Flinders Council BASS STRAIT ISLANDS
7 7
LADY BARRON 1 1
LEEKA 1 1
(blank) 3 3
Flinders Council Total 1 11 12
George Town Council GEORGE TOWN 3 8 1 12
LOW HEAD 9 4 13
WEYMOUTH 1 1
(blank) 1 3 1 5
George Town Council Total 1 13 12 4 1 31
Glamorgan-Spring Bay Council
BICHENO 1 1
COLES BAY 23 23
ORFORD 51 1 4 56
SPRING BEACH 6 6
SWANSEA 3 3
(blank) 2 1 3
Glamorgan-Spring Bay Council Total 86 1 1 4 92
Hobart City Council BATTERY POINT 2 1 1 4
SANDY BAY 16 4 1 21
(blank) 3 2 5
Hobart City Council Total 21 1 6 1 1 30
Huon Valley Council ABELS BAY 2 2
CYGNET 1 1
DEEP BAY 10 10
DOVER 9 2 6 1 18
EGGS AND BACON BAY
1 1 1 3
GARDEN ISLAND 2 2

Page 113
CREEK
LYMINGTON 1 1
POLICE POINT 1 1 1 3
PORT HUON 1 1
RECHERCHE 4 4
SOUTHPORT 1 10 1 4 16
SURVEYORS BAY 2 4 8 14
VERONA SANDS 1 1 2
(blank) 5 6 2 3 19 35
Huon Valley Council Total 4 41 10 6 9 39 2 1 112
King Island Council CURRIE 1 1
King Island Council Total 1 1
Kingborough Council ADVENTURE BAY 3 2 2 7
BLACKMANS BAY 3 3
DENNES POINT 21 1 22
HOWDEN 2 2
KINGSTON 1 1 2
KINGSTON BEACH
1 1 2 4
MARGATE 1 1
NORTH BRUNY 1 1
OYSTER COVE 1 1
Kingborough Council Total 1 31 3 7 1 43
Latrobe Council PORT SORELL 1 1 2 1 5
Latrobe Council Total 1 1 2 1 5
Launceston City Council
TREVALLYN 1 1
Launceston City Council Total 1 1
Sorell Council CARLTON RIVER 1 1
CONNELLYS MARSH
5 1 2 8
DODGES FERRY 7 2 9
DUNALLEY 1 1
LEWISHAM 6 1 7
PRIMROSE SANDS
14 14
(blank) 2 2
Sorell Council Total 1 33 2 1 5 42
Tasman Council EAGLEHAWK NECK
7 7
MURDUNNA 3 3
NUBEENA 3 3
PORT ARTHUR 1 1

Page 114
WHITE BEACH 9 9
(blank) 1 2 3
Tasman Council Total 23 1 2 26
Waratah-Wynyard Council
BOAT HARBOUR BEACH
13 7 7 27
SISTERS BEACH 2 1 3
WYNYARD 10 10
(blank) 1 1
Waratah-Wynyard Council Total 26 7 8 41
West Coast Council STRAHAN 1 2 3
(blank) 1 1
West Coast Council Total 1 3 4
West Tamar Council BEAUTY POINT 1 1
CLARENCE POINT 1 1
KELSO 3 27 1 31
ROSEVEARS 1 1
(blank) 1 1
West Tamar Council Total 1 3 27 4 35
Grand Total 6 13 455 40 17 84 138 5 7 14 779

Page 115
Appendix 9: Coastal inundation hazard band levels*
(*In metres AHD by LGA and suburb)
Notes and modelled scenarios
RU Rounded up to the nearest highest 100 mm to reflect a reasonable survey accuracy.
FB Freeboard of 300 mm to quantify the acceptable floor height for a development in a
flood-prone area.
Base Ht
Base MHT as supplied by the National Tidal Centre except for Macquarie Harbour and
Tamar region, where published mean high tide data was used (as noted in the Stage 2 and
Stage 3 reports)
AEP1pct_2050 Modelled 1% AEP for the year 2050 this is between 0.22 m and 0.24 m higher than the
current day 1% AEP storm surge event.
AEP1pct_2100 Modelled 1% AEP for the year 2100
The results include the effects of tides, storm surges and SLR only. They do not account
for other factors such as wave sets or run up.
To account for this, 300 mm FB has been added to the data.
1 % AEP 2100 (Designated Flood Level) - is the modelled flood level with out the
freeboard for building control purposes.
High, Medium, Low The acceptable floor height in metres from the 0 m AHD.
The actual inundation heights are shown in the ‘DPAC Projected Sea Level Rise Ref Grid’ available through the
LIST for viewing or download.
The heights in estuaries do not consider coincident flooding in estuaries, councils may have other
requirements in estuaries.
Sea Level Rise Planning Allowance for 2050 and 2100 for each council
LGA 2050 2100
Break O'day 0.24 0.92
Brighton 0.23 0.85
Burnie 0.22 0.82
Central Coast 0.22 0.82
Circular Head 0.22 0.84
Clarence 0.23 0.85
Derwent Valley 0.24 0.86
Devonport 0.22 0.81
Dorset 0.22 0.84
Flinders 0.23 0.92
George Town 0.22 0.82
Glamorgan Spring Bay 0.24 0.92
Glenorchy 0.23 0.85
Hobart 0.23 0.85
Huon Valley 0.23 0.86
King Island 0.22 0.86
Kingborough 0.24 0.87
Latrobe 0.22 0.82
Launceston 0.22 0.83
Sorell 0.23 0.84
Tasman 0.24 0.86
Waratah-Wynyard 0.22 0.83
West Coast 0.23 0.85
West Tamar 0.22 0.82
Average Of All Councils 0.23 0.85

Page 116
Local
Government
Area
Suburb
High Medium
Low
Sea Level Rise 2050 1 % AEP 2050
with Freeboard
1 % AEP
2100
(Designated
Flood Level)
1 % AEP 2100
with
Freeboard
RU RU and 300mm
FB RU
RU and
300mm FB
Break O'Day Ansons Bay 1 1.8 2.2 2.5
Beaumaris 1 1.8 2.2 2.5
Binalong Bay 1 1.8 2.2 2.5
Douglas River 0.9 1.8 2.2 2.5
Falmouth 1 1.8 2.2 2.5
Four Mile Creek 0.9 1.8 2.2 2.5
Scamander 1 1.8 2.2 2.5
Seymour 1 1.8 2.2 2.5
St Helens 1 1.8 2.2 2.5
Stieglitz 1 1.8 2.2 2.5
The Gardens 1 1.8 2.2 2.5
Upper Scamander 1 1.8 2.2 2.5
Break O'Day
Average 1 1.8 2.2 2.5
Brighton Bridgewater 0.9 2 2.3 2.6
Dromedary 0.9 1.9 2.3 2.6
Gagebrook 0.9 2 2.3 2.6
Old Beach 0.9 2 2.3 2.6
Brighton
Average 0.9 2 2.3 2.6
Burnie Burnie 1.8 2.7 3 3.3
Chasm Creek 1.8 2.7 2.9 3.2
Cooee 1.8 2.7 3 3.3
Park Grove 1.8 2.7 3 3.3
Round Hill 1.8 2.7 2.9 3.2
South Burnie 1.8 2.7 3 3.3
Wivenhoe 1.8 2.7 3 3.3
Burnie Average
1.8 2.7 3 3.3
Central Coast Forth 1.8 2.7 2.9 3.2
Gawler 1.8 2.7 3 3.3
Heybridge 1.8 2.7 3 3.3
Leith 1.8 2.7 2.9 3.2
Penguin 1.8 2.7 3 3.3
Sulphur Creek 1.8 2.7 3 3.3

Page 117
Turners Beach 1.8 2.7 3 3.3
Ulverstone 1.8 2.7 3 3.3
West Ulverstone 1.8 2.7 3 3.3
Central Coast
Average 1.8 2.7 3 3.3
Circular Head Arthur River 0.8 1.8 2.1 2.4
Cowrie Point 1.8 2.6 2.9 3.2
Edgcumbe Beach 1.8 2.6 2.9 3.2
Hellyer 1.8 2.6 2.9 3.2
Marrawah 0.8 1.8 2.1 2.4
Nelson Bay 0.8 1.8 2.1 2.4
Rocky Cape 1.8 2.6 2.9 3.2
Smithton 1.8 2.6 2.9 3.2
Stanley 1.8 2.6 2.9 3.2
Temma 0.8 1.8 2.1 2.4
Circular Head
Average 1.8 2.6 2.9 3.2
Clarence Acton Park 0.9 2 2.3 2.6
Bellerive 0.9 2 2.3 2.6
Cambridge 0.9 2 2.3 2.6
Clifton Beach 0.9 1.9 2.2 2.5
Cremorne 0.9 1.9 2.2 2.5
Geilston Bay 0.9 2 2.3 2.6
Howrah 0.9 2 2.3 2.6
Lauderdale 0.9 2 2.3 2.6
Lindisfarne 0.9 2 2.3 2.6
Montagu Bay 0.9 2 2.3 2.6
Opossum Bay 0.9 1.9 2.2 2.5
Otago 0.9 2 2.3 2.6
Richmond 0.9 2 2.3 2.6
Risdon 0.9 2 2.3 2.6
Roches Beach 0.9 2 2.3 2.6
Rokeby 0.9 2 2.3 2.6
Sandford 0.9 2 2.3 2.6
Seven Mile Beach 0.9 2 2.3 2.6
South Arm 0.9 1.9 2.2 2.5
Tranmere 0.9 2 2.3 2.6
Clarence
Average 0.9 2 2.3 2.6
Derwent Valley Boyer 0.9 1.9 2.3 2.6
Lawitta 0.9 1.9 2.3 2.6
Molesworth 0.9 1.9 2.3 2.6
New Norfolk 0.9 1.9 2.3 2.6
Derwent Valley
Average 0.9 1.9 2.3 2.6

Page 118
Devonport Ambleside 1.8 2.7 2.9 3.2
Devonport 1.8 2.7 3 3.3
Don 1.8 2.7 2.9 3.2
East Devonport 1.8 2.7 2.9 3.2
Miandetta 1.8 2.7 2.9 3.2
Quoiba 1.8 2.7 2.9 3.2
Spreyton 1.8 2.7 2.9 3.2
Stony Rise 1.8 2.7 2.9 3.2
Devonport
Average 1.8 2.7 3 3.3
Dorset Bridport 1.8 2.5 2.8 3.1
Musselroe Bay 1 1.9 2.3 2.6
Tomahawk 1.7 2.4 2.7 3
Dorset
Average 1.8 2.5 2.8 3.1
Flinders Cape Barren Island 1.8 2.4 2.7 3
Emita 1.7 2.4 2.7 3
Killiecrankie 1.5 2.4 2.7 3
Lady Barron 1.3 1.8 2.2 2.5
Palana 1.4 2.4 2.7 3
Whitemark 1.8 2.4 2.7 3
Flinders
Average 1.8 2.4 2.7 3
George Town Beechford 1.9 2.6 2.9 3.2
Bell Bay 1.5 2.6 2.9 3.2
Bellingham 1.8 2.5 2.8 3.1
George Town 1.8 2.6 2.9 3.2
Hillwood 1.4 2.6 2.9 3.2
Long Reach 1.5 2.6 2.9 3.2
Low Head 1.8 2.6 2.9 3.2
Lulworth 1.8 2.5 2.8 3.1
Weymouth 1.8 2.5 2.8 3.1
George Town
Average 1.9 2.6 2.9 3.2
Glamorgan-
Spring Bay Bicheno 0.9 1.8 2.2 2.5
Coles Bay 0.9 1.8 2.2 2.5
Dolphin Sands 0.9 1.8 2.2 2.5
Douglas River 0.9 1.8 2.2 2.5
Freycinet 0.9 1.8 2.2 2.5
Friendly Beaches 0.9 1.8 2.2 2.5
Little Swanport 0.9 1.7 2.1 2.4
Orford 0.9 1.7 2.1 2.4

Page 119
Pontypool 0.9 1.7 2.1 2.4
Rheban 0.9 1.7 2.1 2.4
Spring Beach 0.9 1.7 2.1 2.4
Swansea 0.9 1.8 2.1 2.4
Triabunna 0.9 1.8 2.1 2.4
Glamorgan-
Spring Bay
Average
0.9 1.8 2.2 2.5
Glenorchy Austins Ferry 0.9 2 2.3 2.6
Berriedale 0.9 1.9 2.3 2.6
Claremont 0.9 2 2.3 2.6
Derwent Park 0.9 1.9 2.3 2.6
Glenorchy 0.9 1.9 2.3 2.6
Granton 0.9 2 2.3 2.6
Lutana 0.9 2 2.3 2.6
Montrose 0.9 1.9 2.3 2.6
Moonah 0.9 1.9 2.3 2.6
Rosetta 0.9 1.9 2.3 2.6
Glenorchy
Average 0.9 2 2.3 2.6
Hobart Hobart 0.9 1.9 2.2 2.5
New Town 0.9 1.9 2.3 2.6
Queens Domain 0.9 1.9 2.2 2.5
Sandy Bay 0.9 1.9 2.2 2.5
Hobart
Average 0.9 1.9 2.3 2.6
Huon Valley Abels Bay 0.9 1.8 2.2 2.5
Cairns Bay 0.9 1.8 2.2 2.5
Castle Forbes Bay 0.9 1.8 2.2 2.5
Charlotte Cove 0.9 1.8 2.2 2.5
Cradoc 0.9 1.8 2.2 2.5
Cygnet 0.9 1.8 2.2 2.5
Deep Bay 0.9 1.8 2.2 2.5
Dover 0.9 1.8 2.2 2.5
Eggs and Bacon Bay 0.9 1.8 2.2 2.5
Franklin 0.9 1.8 2.2 2.5
Garden Island Creek 0.9 1.8 2.2 2.5
Gardners Bay 0.9 1.8 2.2 2.5
Geeveston 0.9 1.8 2.2 2.5
Glaziers Bay 0.9 1.8 2.2 2.5
Glen Huon 0.9 1.8 2.2 2.5
Hastings 0.9 1.8 2.1 2.4
Huonville 0.9 1.8 2.2 2.5
Lune River 0.9 1.8 2.1 2.4
Lymington 0.9 1.8 2.2 2.5

Page 120
Police Point 0.9 1.8 2.2 2.5
Port Huon 0.9 1.8 2.2 2.5
Randalls Bay 0.9 1.8 2.2 2.5
Ranelagh 0.9 1.8 2.1 2.4
Recherche 0.9 1.8 2.1 2.4
Southport 0.9 1.8 2.1 2.4
Strathblane 0.9 1.8 2.2 2.5
Surges Bay 0.9 1.8 2.2 2.5
Surveyors Bay 0.9 1.8 2.2 2.5
Waterloo 0.9 1.8 2.2 2.5
Wattle Grove 0.9 1.8 2.2 2.5
Huon Valley
Average 0.9 1.8 2.2 2.5
King Island Currie 0.8 1.8 2.1 2.4
Grassy 1.2 2.2 2.6 2.9
Loorana 0.8 1.8 2.1 2.4
Naracoopa 1.3 2.2 2.5 2.8
King Island
Average 1.3 2.2 2.6 2.9
Kingborough Adventure Bay 0.9 1.8 2.2 2.5
Alonnah 0.9 1.8 2.2 2.5
Apollo Bay 0.9 1.8 2.1 2.4
Barnes Bay 0.9 1.8 2.1 2.4
Blackmans Bay 0.9 1.9 2.2 2.5
Bonnet Hill 0.9 1.9 2.2 2.5
Coningham 0.9 1.8 2.1 2.4
Dennes Point 0.9 1.8 2.1 2.4
Electrona 0.9 1.8 2.1 2.4
Gordon 0.9 1.8 2.2 2.5
Great Bay 0.9 1.8 2.1 2.4
Howden 0.9 1.8 2.1 2.4
Kettering 0.9 1.8 2.1 2.4
Killora 0.9 1.8 2.1 2.4
Kingston 0.9 1.9 2.2 2.5
Kingston Beach 0.9 1.9 2.2 2.5
Lower Snug 0.9 1.8 2.1 2.4
Lunawanna 0.9 1.8 2.2 2.5
Margate 0.9 1.8 2.1 2.4
Middleton 0.9 1.8 2.1 2.4
North Bruny 0.9 1.8 2.1 2.4
Oyster Cove 0.9 1.8 2.1 2.4
Simpsons Bay 0.9 1.8 2.1 2.4
Snug 0.9 1.8 2.1 2.4
Taroona 0.9 1.9 2.2 2.5
Tinderbox 0.9 1.8 2.2 2.5

Page 121
Woodbridge 0.9 1.8 2.1 2.4
Kingborough
Average 0.9 1.9 2.2 2.5
Latrobe Bakers Beach 1.8 2.6 2.9 3.2
Hawley Beach 1.8 2.6 2.9 3.2
Latrobe 1.8 2.7 2.9 3.2
Port Sorell 1.8 2.6 2.9 3.2
Shearwater 1.8 2.6 2.9 3.2
Squeaking Point 1.8 2.6 2.9 3.2
Tarleton 1.8 2.7 2.9 3.2
Latrobe
Average 1.8 2.7 2.9 3.2
Launceston Dilston 1.7 2.6 2.9 3.2
Invermay 1.8 2.6 2.9 3.2
Launceston 1.8 2.6 2.9 3.2
Mowbray 1.8 2.6 2.9 3.2
Newnham 1.8 2.6 2.9 3.2
Newstead 1.8 2.6 2.9 3.2
Norwood 1.8 2.6 2.9 3.2
Ravenswood 1.8 2.6 2.9 3.2
St Leonards 1.8 2.6 2.9 3.2
Swan Bay 1.4 2.6 2.9 3.2
West Launceston 1.8 2.6 2.9 3.2
Windermere 1.6 2.6 2.9 3.2
Launceston
Average 1.8 2.6 2.9 3.2
Sorell Boomer Bay 0.9 2.2 2.5 2.8
Carlton 0.9 2.1 2.4 2.7
Carlton River 1 2.1 2.4 2.7
Dodges Ferry 0.9 2.1 2.4 2.7
Dunalley 0.9 2.2 2.5 2.8
Forcett 0.9 2 2.3 2.6
Lewisham 0.9 2 2.3 2.6
Marion Bay 0.9 1.7 2.1 2.4
Midway Point 0.9 2 2.3 2.6
Penna 0.9 2 2.3 2.6
Primrose Sands 0.9 2.1 2.4 2.7
Sorell 0.9 2 2.3 2.6
Sorell Average
1 2.2 2.5 2.8
Tasman Dunalley 0.9 1.7 2.1 2.4
Eaglehawk Neck 1 2.4 2.7 3
Koonya 1 2.4 2.7 3
Murdunna 1 2.4 2.6 2.9

Page 122
Nubeena 0.9 1.9 2.2 2.5
Port Arthur 0.9 1.7 2 2.3
Premaydena 1 2.4 2.6 2.9
Saltwater River 1 2.3 2.6 2.9
Sloping Main 0.9 2 2.3 2.6
Taranna 1 2.4 2.7 3
White Beach 0.9 1.9 2.2 2.5
Tasman
Average 1 2.4 2.7 3
Waratah-
Wynyard Boat Harbour 1.8 2.6 2.9 3.2
Doctors Rocks 1.8 2.6 2.9 3.2
Flowerdale 1.8 2.6 2.9 3.2
Sisters Beach 1.8 2.6 2.9 3.2
Somerset 1.8 2.6 2.9 3.2
Wynyard 1.8 2.6 2.9 3.2
Waratah-
Wynyard
Average
1.8 2.6 2.9 3.2
West Coast Granville Harbour 0.8 1.8 2.1 2.4
Strahan 0.7 1.9 2.2 2.5
Trial Harbour 0.8 1.8 2.1 2.4
West Coast 0.8 1.8 2.1 2.4
West Coast
Average 0.8 1.9 2.2 2.5
West Tamar Badger Head 1.8 2.6 2.9 3.2
Beauty Point 1.5 2.6 2.9 3.2
Clarence Point 1.7 2.6 2.9 3.2
Deviot 1.4 2.6 2.9 3.2
Exeter 1.5 2.6 2.9 3.2
Gravelly Beach 1.5 2.6 2.9 3.2
Greens Beach 1.8 2.6 2.9 3.2
Kayena 1.4 2.6 2.9 3.2
Kelso 1.8 2.6 2.9 3.2
Lanena 1.5 2.6 2.9 3.2
Legana 1.8 2.6 2.9 3.2
Riverside 1.8 2.6 2.9 3.2
Robigana 1.4 2.6 2.9 3.2
Rosevears 1.6 2.6 2.9 3.2
Rowella 1.5 2.6 2.9 3.2
Sidmouth 1.4 2.6 2.9 3.2
Swan Point 1.4 2.6 2.9 3.2
Trevallyn 1.8 2.6 2.9 3.2
West Tamar
Average 1.8 2.6 2.9 3.2

Page 123
References
ABS [Australian Bureau of Statistics], 2013, 3218.0 – Regional Population Growth Australia 2012-13 http://www.abs.gov.au/ausstats/[email protected]/Products/3218.0~2012-13~Main+Features~Main+Features?OpenDocument
AS/NZS ISO 31000:2009, Risk Management – principles and guidelines.
Australian Building Codes Board, 2006, Guideline Document, Landslip Hazards. Commonwealth, State and Territory Governments of Australia.
Australian Emergency Management Committee, 2009, National Emergency Risk Assessment Guidelines (NERAG), Tasmania State Emergency Service, Hobart.
Australian Emergency Management Committee, 2014, Draft National Emergency Risk Assessment Guidelines 2nd
Edition (NERAG), Tasmania State Emergency Service, Hobart.
Australian National Tide Tables (ANTT).
Bell, J. (2014). Climate change and coastal development law in Australia. Federation Press.
Building Act 2000, Tasmania, Australia.
Building Regulations 2004, Tasmania, Australia.
Coastal Management Act 2005, Victoria, Australia.
Coastal Management Plan, March 2014, Queensland, Coastal Planning, Department of Environment and Heritage Protection <https://www.ehp.qld.gov.au/coastalplan/pdf/coastal-management-plan.pdf>.
Coastal Protection and Management Act 2014, Queensland, Australia.
Coastal Protection and Management Act 1995, Queensland, Australia.
Cradle Coast Regional Land Use Planning Framework 2010-2030, December 2010, Cradle Coast Regional Planning Project.
DPAC, 2012a, Guide for the Consideration of Natural Hazards in the Planning System, Department of Premier and Cabinet, Tasmania.
DPAC, 2012b, Principles for the Consideration of Natural Hazards in the Planning System, Department of Premier and Cabinet, Tasmania.
DPAC, 2012c, Derivation of the Tasmanian Sea Level Rise Allowances – Technical Paper, Department of Premier and Cabinet, Tasmania.
DPAC, 2013, Landslide Hazard Planning Report, Tasmania.
Emergency Management Australia, 2004, Emergency management in Australia: Concepts and principles, Manual
number 1, Australian Government, Canberra.
EPA [Environment Protection Authority, Tasmania], 2015, <http://epa.tas.gov.au/epa/marine-oil-and-chemical-spills>
Hansen, P, and Ombler, F, 2009, ‘A new method for scoring multi-attribute value models using pairwise rankings of alternatives’, Journal of Multi-Criteria Decision Analysis, 15: 87-107.
Hunter, J. 2011, ‘A simple technique for estimating an allowance for uncertain sea-level rise’, Climatic Change,
doi: 10.1007/s105854-011-0332-1.
ICSM [Intergovernmental Committee on Surveying and Mapping, Tidal Interface Working Group], Compendium
of Tidal Terms, Australia.
ICSM, 2011, [Intergovernmental Committee on Surveying and Mapping, Tidal Interface Working Group],
Australian Tides Manual Special Pub 9 V4.3 <http://www.icsm.gov.au/tides/SP9_Australian_Tides_Manual_V4.1.pdf>
Lacey, M J, Hunter, J R and Mount, R E, 2012 Coastal Inundation Mapping for Tasmania – Stage 2, report to
DPAC by the Blue Wren Group, School of Geography and Environmental Studies, University of Tasmania and the Antarctic Climate and Ecosystems Cooperative Research Centre.
Lacey, M J, Hunter, J R, and Mount, R E, 2015 Coastal Inundation Mapping for Tasmania – Stage 3, report to DPAC by University of Tasmania and the Antarctic Climate and Ecosystems Cooperative Research Centre.

Page 124
Mariani, A, Shand, T D, Carley, J T, Goodwin, I D, Splinter, K, Davey, E K, Flocard, F and Turner, I L, 2012,
Generic Design Coastal Erosion Volumes and Setbacks for Australia, Technical Report for ACE-CRC by Water Research Laboratory, University of New South Wales, Sydney, p.99.
McInnes, K L, O’Grady, J G, Hemer, M, Macadam, I, Abbs, D J, White, C J, Corney, S P, Grose, M R, Holz, G K,
Gaynor, S M and Bindoff, N L, 2011 Climate Futures for Tasmania: extreme tide and sea-level events technical
report, Antarctic Climate and Ecosystems Cooperative Research Centre, Hobart.
McInnes Kl, Monselesan D, O’Grady JG, Church JA and Xhang, X, 2016: sea-Level Rise and Allowances for Tasmania based on the IPCC AR5, CSIRO Report 33pp.
McInnes and O’Grady, 2016: Tasmanian Extreme Sea Level Modelling Assessment, CSIRO Report 20 pp.
Mount, R, Lacey, M and Hunter, J, 2010: Tasmanian Coastal Inundation Mapping, Project report version 1.2 for the Tasmanian Planning Commission, University of Tasmania: p. 50.
National Strategy for Disaster Resilience, 2009.
NERAG, 2014, National Emergency Assessment Guidelines, Australian Emergency Management Handbook Series, Commonwealth of Australia.
Nielsen A F, Lord D B and Poulos H G, 1992, Dune stability considerations for building foundations, Civil Engineering Transactions of the Institute of Engineers Australia, CE34(2) June: 167–74.
Northern Regional Land Use Planning Framework, Draft for Consultation, May 2011, Northern Tasmania Development.
NSW, 2015, Coastal erosion management in NSW, Office of Environment and Heritage,
<http://www.environment.nsw.gov.au/coasts/coastalerosionmgmt.htm>, viewed 15/6/2015.
NSW Coastal Policy 1997, New South Wales, Australia.
NSW Coastal Protection Act 1979, New South Wales, Australia.
NSW Coastal Protection Regulations 1979, New South Wales, Australia.
NSW Coastal Risk Management Guide, Incorporating sea level rise benchmarks in coastal risk assessments, August 2010, Department of Environment, Climate Change and Water, New South Wales, Australia.
NTC, 2010, National Tide Centre Glossary of Tidal Terminology, Bureau of Metrology, Australia.
Page, L and Thorp, V, 2010, Tasmanian Coastal Works Manual: A best practice management guide for changing
coastlines, DPIPWE, Tasmania..
Planning and Environment Act 1987, s12(2)(a) Direction No.13, (Victoria, Australia).
Planning Schemes:
Huon Valley Planning Scheme 1979.
Port Cygnet Planning Scheme 1988.
Esperance Coast Planning Scheme 1989.
City of Hobart Planning Scheme 1982.
Battery Point Planning Scheme 1979.
Sullivan’s Cove Planning Scheme 1997.
Break O’Day Council Planning Scheme 1996.
Brighton Council Planning Scheme 2000.
Burnie City Council Planning Scheme 1989.
Central Coast Planning Scheme 2005.
Circular Head Planning Scheme 1995.
Clarence Planning Scheme 2007.
New Norfolk Council Planning Scheme 1993.
Devonport and Environs Planning Scheme 1984.

Page 125
Flinders Planning Scheme 1994.
Dorset Planning Scheme 1996.
Municipality of George Town Planning Scheme 1991.
Glenmorgan Spring Bay Planning Scheme 1994.
King Island Planning Scheme 1995.
Kingborough Planning Scheme 2000.
Latrobe Planning Scheme 1994.
Launceston Planning Scheme 1994.
Sorell Planning Scheme 1993.
Tasman Planning Scheme 1979.
Waratah Wynyard Planning Scheme 2000.
West Coast Planning Scheme 2000.
West Tamar Planning Scheme 2006.
Saunders, W, and Glassey, P, 2009, ‘Taking a risk-based approach for landslip planning: An outline of the New Zealand landslip guidelines’, The Australian Journal of Emergency Management 24(1):11.
Sharples C, 2006, Indicative Mapping of Tasmanian Coastal Vulnerability to Climate Change and Sea-Level Rise:
Explanatory Report (Second Edition), Department of Primary Industries and Water, Tasmania.
Sharples, C, Walford, H and Roberts, L, 2013, Coastal erosion susceptibility zone mapping for hazard band
definition in Tasmania, Department of Premier and Cabinet, Tasmania.
Southern Tasmania Regional Land Use Strategy 2010-2035, June 2011, Southern Tasmanian Regional Planning Project.
State Development Assessment Provisions, Version 1.2, April 2014, Queensland. <http://statedevelopment.qld.gov.au/resources/policy/sdap/state-development-assessment-provisions-v1-2.pdf>
Sustainable Planning Act 2009, Queensland, Australia.
Tasmanian State Natural Disaster Risk Assessment, 2012.
Victorian Coastal Strategy 2008, Victoria.