coastal vulnerability assessment towards sustainable ...ijesd.org/papers/540-g0006.pdf ·...
TRANSCRIPT
Abstract—The main objective of the present study is to
develop a coastal vulnerability index (CVI) for the Peninsular
Malaysia coastline. This study incorporated six variables to
assess the CVI for the study area. These six variables consist of
geomorphology, shoreline change rate, maximum current
speed, maximum tidal range, significant wave height and sea
level rise. The ranking is on a linear scale from 1 to 5 in order of
increasing vulnerability; value 1 represents the lowest risk
ranking assigned to the coastline whereas value 5 ranks the
coastline with the highest risk. A total of 1963 km of coastline
was evaluated and of this, 3.3% of the mapped shoreline is
classified as being extreme vulnerability, 11% of Peninsular
Malaysia shoreline is classified as very high vulnerability and 40
% as high vulnerability. The implementation of the
Management Plan would dependent on the co-operations of the
government departments and agencies, private sector and the
public.
Index Terms—Coastal vulnerability index, wave height,
beach materials, current speed, back shore.
I. INTRODUCTION
The primary causes of erosion along the shoreline can be
driven by natural processes or human activities. Inadequate
sediment supply to beaches and coastal inundation are among
the factors contributing to coastal erosion [1]. River
modifications (dams or levees), coastal structures (revetment,
groynes, seawalls and jetties) and coastal minerals extraction
(sand, gas, water and oil) are some agents that deplete the
sediment supply to the adjacent shoreline and causing coastal
erosion. Coastal inundation due to storm waves, tsunamis and
sea level rise (SLR) may cause a permanent inundation to the
coastal areas that will have a serious impact to the natural
environment and social economic conditions in the coastal
zone [2]. Over time, extensive coastal inundation will change
the water quality, groundwater characteristics, increase loss
of properties, potential loss of life, impact on agricultures,
loss of tourism recreation and others [3].
Coastal vulnerability assessment on the existing coastline
condition to withstand the natural processes and human
activities was carried out to interpret the possible responses
of the coastline to the boundary conditions such as SLR,
human interference and inundation [4]. Thieler (1999) has
completed extensive assessment of coastal vulnerability
along various coastlines [5]. The researcher’s assessments
Manuscript received March 10, 2014; revised May 15, 2014.
The authors are with the National Hydraulic Research Institute of
Malaysia (NAHRIM), Malaysia (e-mail: [email protected],
[email protected], [email protected]).
have incorporated six physical coastal variables such as
geomorphology, shoreline change rate, coastal slope, mean
tide range, mean significant wave height and SLR [2]. Table I
indicates the summary of coastal vulnerability variables used
by the researchers in their studies.
TABLE I: SUMMARY OF COASTAL VULNERABILITY VARIABLES USED BY
THE RESEARCHERS IN THEIR STUDIES
Index Geographical
application
Variables
consideration Reference
Coastal
vulnerability
index (CVI)
USA
Relief, rock type,
landform, relative
sea-level change,
shoreline
displacement, tidal
range and maximum
wave height
Gornitz and
Kanciruk
(1989),
Gornitz
(1991),
Gornitz et
ala (1991)
Coastal
vulnerability
index (CVI)
USA
Geomorphology,
shoreline erosion and
accretion, coastal
slope, relative
sea-level change,
mean wave height and
mean tidal range
Thieler and
Hammer-Kl
ose (1999)
and
numerous
other USGS
reports
Social
vulnerability
index (SoVI)
USA
Principal components
analysis of
Census-derived social
data
Boruff et al
(2005)
Coastal social
vulnerability
score (CS0VI)
USA Combination of CVI
and S0VI
Boruff et al
(2005)
Sensitivity index
(SI) Canada
Relief, rock type,
landform, sea-level
change, shoreline
displacement, tidal
range and maximum
wave height
Shaw et al
(1998)
Erosion hazard
index Canada
As SI, plus exposure,
storm surge water
level, slope
Forebes et
al (2003)
Risk matrix South Africa
Location,
infrastructure
(economic
value),hazards
Hughes and
Brundrit
(1992)
Sustainable
capacity index
(SCI)
South Africa
Vulnerability and
resilience of natural,
cultural, institutional,
infrastructural,
economic and human
factors
Yamada et
al (1995)
Sensitivity index Ireland
Shore face slope,
coastal features,
coastal structures,
access, land use
Carter
(1990)
Vulnerability
index UK
Distribution event
frequency, relaxation
(recovery) time
Pethik and
Croocks
(2000)
Coastal Vulnerability Assessment towards Sustainable
Management of Peninsular Malaysia Coastline
Mohd Fauzi Mohamad, Lee Hin Lee, and Mohd Kamarul Huda Samion
International Journal of Environmental Science and Development, Vol. 5, No. 6, December 2014
533DOI: 10.7763/IJESD.2014.V5.540

II. METHODOLOGY
This study has incorporated five variables to assess the
coastal vulnerability Index (CVI) for the study area. These
five variables consist of a) geomorphology, b) shoreline
change rate, c) maximum current speed, d) tidal range, e)
significant wave height and f) sea level rise. The ranking is
on a linear scale from 1 to 5 in order of increasing
vulnerability as shown in Table II; value 1 represents the
lowest risk ranking assigned to the coastline whereas value 5
ranks the coastline with the highest risk.
TABLE II: VULNERABILITY RANKINGS FOR THE STUDY AREA
No Variable
Ranking of coastal vulnerability
Very
low Low Moderate High
Very
high
1 2 3 4 5
1 Geomorphology Rocky
Coast
Composite
of sand and
rocks
Sand
Composite of
clay and rock
or sand
Mud
flats
2
Shoreline
change rate
(m/yr)
> +8 +3 to +7 -1 to +3 -5 to -1 < -5
3
Maximum
current speed
(m/s)
0 - 0.2 0.2 > 0.4 0.4 - 0.6 0.6 - 0.8 0.8 - 1
4 Maximum tidal
range (m) > 3.5 3 - 3.5 2.5 - 3 2 - 2.5 0
5 Significant wave
height (m) < 0.5 0.7 -1.4 1.4 - 2.1 2.1 - 2.8 >5
6 Sea level rise
(mm/yr) < 1.8 1.8 -2.5 2.5 - 3 3 - 3.4 >3.4
A. Geomorphology
The geomorphology variable expresses the relative
erodibility of different landform types. Coastal vulnerable
rank of 1 represents the lowest risk for erodibility such as a
rocky coastline, whereas a ranking of 5 represents the highest
risk of erodibilty to the coastline. Labuan Island shorelines
consist of six main beach materials; those beach materials can
be categorized as muddy, muddy and rocky, muddy and
sandy, sandy, sandy and rocky and rocky.
B. Shoreline Change Rate (m/year)
The approach involves comparing the trend of shoreline
changes observed in two sets of images. Comparison of
images from aerial photographs from year 2008 and
topography maps from year 1975 were used in this study. The
difference in shoreline changes measured in metres, from
these two images was divided by 34 to calculate the eroding
or accreting rate occurring at a particular shoreline. Higher
erosion rates at a specified shoreline location indicate a more
vulnerable coastline at the location and this location is
assigned a higher ranking.
C. Maximum Current Speed (m/s)
Numerical model analysis on the tidal induced current
along the Peninsular Malaysia shoreline was simulated with
respect to determining the maximum current speed for
correlating with the potential rate of shoreline retreat and
tidal fluctuation elevations as an input in the boundaries
conditions. Shorelines with current speeds lesser than
approximately 0.2 m/s can be categorized as having a low
risk to shoreline vulnerability (JPBD, PP 2001), hence was
ranked 1 and current speeds greater than 0.8 m/s was ranked
5.
D. Tidal Range (m)
Tidal range is the differential tidal elevations between the
highest and lowest tidal elevations which occur at a particular
point in the ocean. Peninsular Malaysia consists of three
types of tides namely, diurnal, semi-diurnal and mixed tide.
Some studies have reported that shoreline with bigger tidal
range was less vulnerable to sudden storm surges, putting the
shoreline in a less vulnerable position. Consequently a tidal
range greater than 3.5 m was classified as having a low
vulnerability and was ranked 1.
E. Significant Wave Height (m)
Spectral wave simulation was developed to determine the
significant wave heights along the study areas. The higher the
significant wave height is deemed to make the shoreline more
vulnerable to erosion, so the ranking was higher compared to
lower wave heights propagation at a shoreline.
F. Sea Level Rise (mm/year)
Tidal fluctuations analysis for 22 tidal stations with up to
24 years tidal duration records from Department of Survey
and Mapping Malaysia (JUPEM) was performed and the
findings from the analysis shows that Malaysia is affected by
global warming with varying degrees of sea level rise. The
higher sea level rise induced the more vulnerable a particular
shoreline will be and thus was assigned with a higher ranking
value.
G. The Coastal Vulnerability Index (CVI)
Once each section of the coastline has been assigned a
vulnerability value for the specific assessment variable, the
CVI can be calculated as the square root of the product of the
ranked variables divided by the total number of variables.
CVI = √(a1×a2×a3×a4×a5×a6)/6 (1)
where a1=geomorphology, a2=shoreline change rate (m/yr),
a3= maximum current speed (m/s), a4= maximum tidal range
(m), a5=significant wave height (m) and a6=sea level rise in
Peninsular Malaysia (mm/yr).
III. RESULT
A. Geomorphology
As mentioned in paragraph 2.1 earlier, Malaysia’s
shoreline consists of 6 major beach materials; the Straits of
Malacca shoreline is mostly muddy material, however
patches of sandy beaches is to be found from the Negeri
Sembilan shoreline to parts of the Malacca shoreline. Most of
the islands along the Straits of Malacca consist of sandy
beaches. The east coast of Peninsular Malaysia comprised of
sandy beaches at the northern stretches and at the southern
reaches, the shorelines composed of sandy and rocky beach
materials. Fig. 1 illustrates the distribution of the beach
materials along the shoreline.
International Journal of Environmental Science and Development, Vol. 5, No. 6, December 2014
534

Fig. 1. Illustrates the distribution of beach material types along the shoreline.
Coastal geomorphology variables were evaluated to
categorize the seriousness of the beach material in causing a
vulnerable situation to occur at the shoreline. Fig. 2 shows
the geomorphology ranking for the entire peninsular
shoreline, with high risk shorelines located at the Straits of
Malacca.
Fig. 2. Coastal geomorphology vulnerable ranking.
B. Shoreline Change Rate (m/year)
Shoreline changes assessment was carried out by
comparing the shoreline position in the years 1975 and 2008.
Fig. 3 on the left, shows the shoreline conditions for both
years (red represents 2008 while black represents 1975),
whereas shoreline erosion/deposition ranking vulnerability is
displayed at Fig. 4. Stretches from Tg. Piadang to Port Klang
at the north, the Senggarang beaches to Tg. Piai at the south
and Pekan, Pahang were identified as having badly eroded
shoreline with erosion rates ranging from -3m/year to
-5m/year and for some places it was more than 5m/year.
Fig. 3. Comparison of Penang Island shoreline condition for year 1975
(black) and 2008 (red).
Fig. 4. shoreline changes vulnerability ranking.
C. Maximum Current Speed (m/s)
The east coast of Peninsular Malaysia is exposed to higher
current speeds compared to the west coast. In the Straits of
Malacca the southern stretches are more vulnerable
compared to northern stretches. Fig. 5 presents the maximum
current speed condition, whereas Fig. 6 displays the current
speed vulnerability ranking for the study areas.
Fig. 5. Comparison of maximum current speeds on the west and east coasts of
Peninsular Malaysia.
Fig. 6. Maximum current speed vulnerability ranking.
D. Maximum Tidal Range (m)
Port Klang in Selangor and Pekan in Pahang have a greater
tidal range for the west coast and east coast of Peninsular
Malaysia, respectively. Thus these two places are categorized
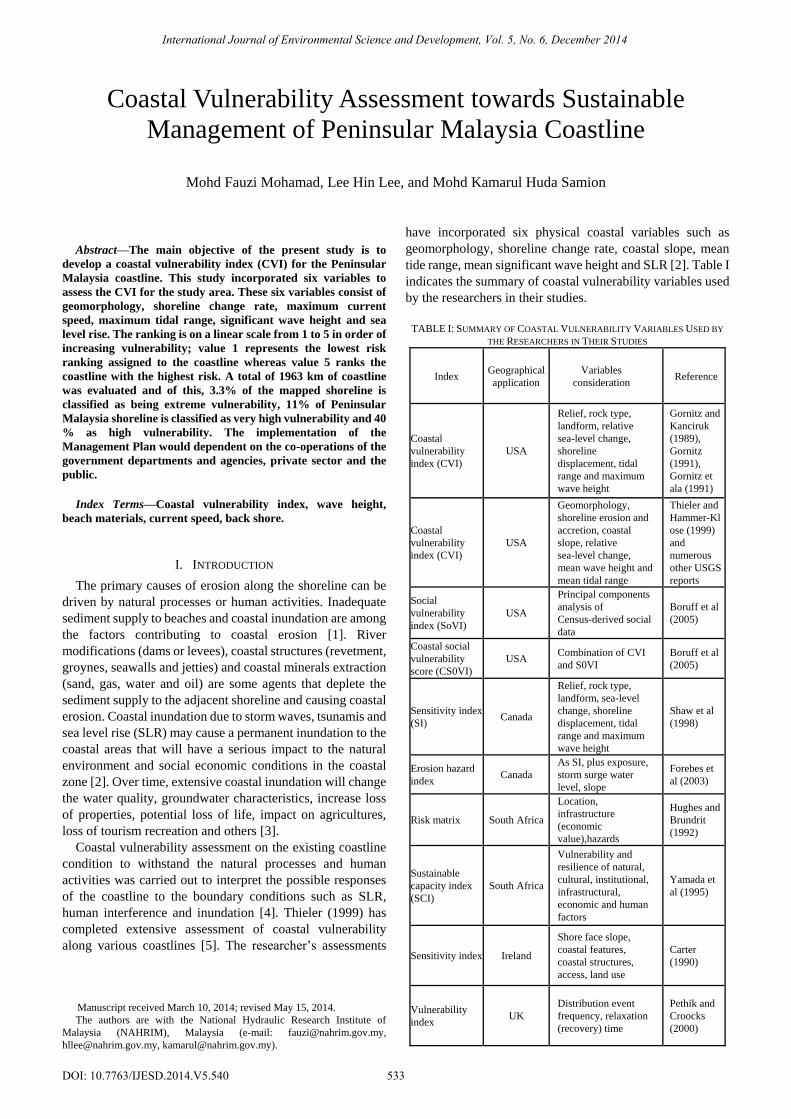
as less vulnerable in the ranking. Fig. 7 compares the
maximum tidal range for the west coast and east coast of
Peninsular Malaysia, whereas Fig. 8 illustrates the tidal range
vulnerability rankings.
E. Significant Wave Height (m)
The east cost of Peninsular Malaysia is exposed to higher
waves generated from the South China Sea, whereas the
Straits of Malacca is sheltered by Sumatra Island on the west,
thus the wave heights at the west coast of Peninsula Malaysia
is lower. The width of the Straits of Malacca is narrower at
the southern stretches the waves from the wake effects from
moving sea-going vessels play an important role, however
International Journal of Environmental Science and Development, Vol. 5, No. 6, December 2014
535
this study has not considered this effect in its hydrodynamic
wave modelling. Fig. 8 presents the maximum significant
wave heights at the study areas and Fig. 9 and Fig. 10 show
the wave height vulnerability rankings.
Fig. 7. Maximum tidal range on the west coast (top) and east coast (bottom)
of Peninsular Malaysia.
Fig. 8. Tidal range vulnerability rankings.
Fig. 9. Maximum wave heights along Peninsular Malaysia’s shoreline.
Fig. 10. Wave vulnerability rankings.
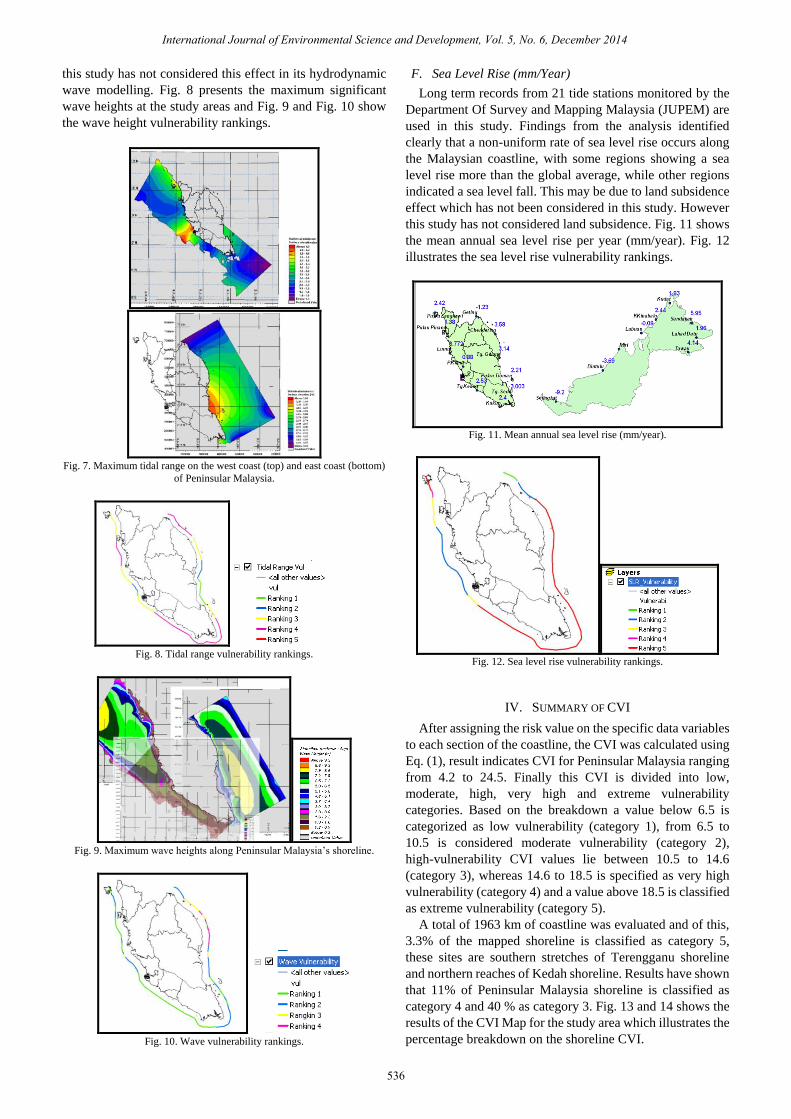
F. Sea Level Rise (mm/Year)
Long term records from 21 tide stations monitored by the
Department Of Survey and Mapping Malaysia (JUPEM) are
used in this study. Findings from the analysis identified
clearly that a non-uniform rate of sea level rise occurs along
the Malaysian coastline, with some regions showing a sea
level rise more than the global average, while other regions
indicated a sea level fall. This may be due to land subsidence
effect which has not been considered in this study. However
this study has not considered land subsidence. Fig. 11 shows
the mean annual sea level rise per year (mm/year). Fig. 12
illustrates the sea level rise vulnerability rankings.
Fig. 11. Mean annual sea level rise (mm/year).
Fig. 12. Sea level rise vulnerability rankings.
IV. SUMMARY OF CVI
After assigning the risk value on the specific data variables
to each section of the coastline, the CVI was calculated using
Eq. (1), result indicates CVI for Peninsular Malaysia ranging
from 4.2 to 24.5. Finally this CVI is divided into low,
moderate, high, very high and extreme vulnerability
categories. Based on the breakdown a value below 6.5 is
categorized as low vulnerability (category 1), from 6.5 to
10.5 is considered moderate vulnerability (category 2),
high-vulnerability CVI values lie between 10.5 to 14.6
(category 3), whereas 14.6 to 18.5 is specified as very high
vulnerability (category 4) and a value above 18.5 is classified
as extreme vulnerability (category 5).
A total of 1963 km of coastline was evaluated and of this,
3.3% of the mapped shoreline is classified as category 5,
these sites are southern stretches of Terengganu shoreline
and northern reaches of Kedah shoreline. Results have shown
that 11% of Peninsular Malaysia shoreline is classified as
category 4 and 40 % as category 3. Fig. 13 and 14 shows the
results of the CVI Map for the study area which illustrates the
percentage breakdown on the shoreline CVI.
International Journal of Environmental Science and Development, Vol. 5, No. 6, December 2014
536
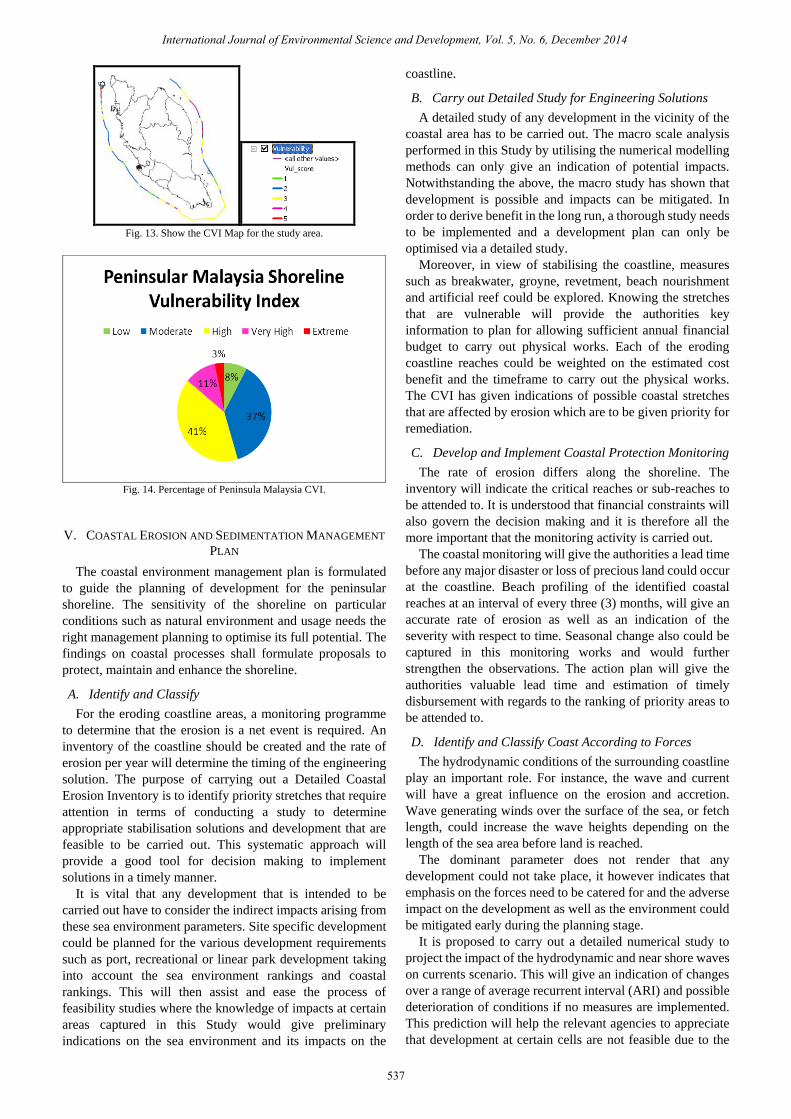
Fig. 13. Show the CVI Map for the study area.
Fig. 14. Percentage of Peninsula Malaysia CVI.
V. COASTAL EROSION AND SEDIMENTATION MANAGEMENT
PLAN
The coastal environment management plan is formulated
to guide the planning of development for the peninsular
shoreline. The sensitivity of the shoreline on particular
conditions such as natural environment and usage needs the
right management planning to optimise its full potential. The
findings on coastal processes shall formulate proposals to
protect, maintain and enhance the shoreline.
A. Identify and Classify
For the eroding coastline areas, a monitoring programme
to determine that the erosion is a net event is required. An
inventory of the coastline should be created and the rate of
erosion per year will determine the timing of the engineering
solution. The purpose of carrying out a Detailed Coastal
Erosion Inventory is to identify priority stretches that require
attention in terms of conducting a study to determine
appropriate stabilisation solutions and development that are
feasible to be carried out. This systematic approach will
provide a good tool for decision making to implement
solutions in a timely manner.
It is vital that any development that is intended to be
carried out have to consider the indirect impacts arising from
these sea environment parameters. Site specific development
could be planned for the various development requirements
such as port, recreational or linear park development taking
into account the sea environment rankings and coastal
rankings. This will then assist and ease the process of
feasibility studies where the knowledge of impacts at certain
areas captured in this Study would give preliminary
indications on the sea environment and its impacts on the
coastline.
B. Carry out Detailed Study for Engineering Solutions
A detailed study of any development in the vicinity of the
coastal area has to be carried out. The macro scale analysis
performed in this Study by utilising the numerical modelling
methods can only give an indication of potential impacts.
Notwithstanding the above, the macro study has shown that
development is possible and impacts can be mitigated. In
order to derive benefit in the long run, a thorough study needs
to be implemented and a development plan can only be
optimised via a detailed study.
Moreover, in view of stabilising the coastline, measures
such as breakwater, groyne, revetment, beach nourishment
and artificial reef could be explored. Knowing the stretches
that are vulnerable will provide the authorities key
information to plan for allowing sufficient annual financial
budget to carry out physical works. Each of the eroding
coastline reaches could be weighted on the estimated cost
benefit and the timeframe to carry out the physical works.
The CVI has given indications of possible coastal stretches
that are affected by erosion which are to be given priority for
remediation.
C. Develop and Implement Coastal Protection Monitoring
The rate of erosion differs along the shoreline. The
inventory will indicate the critical reaches or sub-reaches to
be attended to. It is understood that financial constraints will
also govern the decision making and it is therefore all the
more important that the monitoring activity is carried out.
The coastal monitoring will give the authorities a lead time
before any major disaster or loss of precious land could occur
at the coastline. Beach profiling of the identified coastal
reaches at an interval of every three (3) months, will give an
accurate rate of erosion as well as an indication of the
severity with respect to time. Seasonal change also could be
captured in this monitoring works and would further
strengthen the observations. The action plan will give the
authorities valuable lead time and estimation of timely
disbursement with regards to the ranking of priority areas to
be attended to.
D. Identify and Classify Coast According to Forces
The hydrodynamic conditions of the surrounding coastline
play an important role. For instance, the wave and current
will have a great influence on the erosion and accretion.
Wave generating winds over the surface of the sea, or fetch
length, could increase the wave heights depending on the
length of the sea area before land is reached.
The dominant parameter does not render that any
development could not take place, it however indicates that
emphasis on the forces need to be catered for and the adverse
impact on the development as well as the environment could
be mitigated early during the planning stage.
It is proposed to carry out a detailed numerical study to
project the impact of the hydrodynamic and near shore waves
on currents scenario. This will give an indication of changes
over a range of average recurrent interval (ARI) and possible
deterioration of conditions if no measures are implemented.
This prediction will help the relevant agencies to appreciate
that development at certain cells are not feasible due to the
International Journal of Environmental Science and Development, Vol. 5, No. 6, December 2014
537

high cost of mitigation.
E. Rehabilitation Measures
Rehabilitation of coastal erosion should also be integrated
in engineering study. It is common scenario that development
protruding out of the existing shoreline will experience
accretion and also erosion adjacent to the development.
The engineering study should also be looking at the
maintenance phase of the development. Periodic tasks that
are required based on the design of the development should
be incorporated. For example, a development for public
beach and facilities may require periodic task of recharging it
with beach materials, beach combing, waste collection and
other tasks to ensure that pollutions and sustainability of the
development are thoroughly taken care of.
The crucial thing for design is to appreciate the
fundamental characteristics of the site. Any development
must suit the environment of the area proposed. Thus, prior
understanding of the projected waves, currents and winds at
the coastal area is crucial in coastal areas. Any mitigation
proposed should ensure that proper steps are taken to
minimise the impact of development.
The next step would be to implement the mitigation
measures corresponding to it. It should also be possible to
explore other mitigation actions that could be implemented
such as maintaining coastal vegetation during the
construction phase as a natural barrier or rehabilitate the
vegetation at buffer zones to prevent degradation.
However, it should be noted that the mitigation measures
will correspond to the impact that will be experienced by the
coastal cell. Improvement in mitigation measure should be
explored once the development is identified and further study
has been carried out to assess the interaction between the
environmental forces and the proposed development.
Implementing mitigation measures without proper refining
may incur cost overruns. This is true if for instance, the
length of breakwater arms was too short that it does not block
the wave that might pose danger to the development. Or, the
breakwater arms are too long that it is has no significant
benefit to the development. Thus, the mitigation measure
would need proper refining to suit the final scheme of
development.
VI. SUMMARY
Peninsular Malaysia shoreline is vulnerable to the natural
processes such as wind induces wave, tidal current, global
sea level rise and others. Analysis on the six variables namely
geomorphology, shoreline change rate, maximum current
speed, maximum tidal range, significant wave height and sea
level rise, indicated that southern stretches and eastern
reaches of the Peninsular Malaysia shoreline is in vulnerable
position. The implementation of the Management Plan would
dependent on the co-operations of the government
departments and agencies, private sector and the public.
REFERENCES
[1] R. A. Morton, “An overview of coastal land loss: with emphasis on the
south eastern United States,” U.S. Geological Survey, Open File
Report 03-337, 2003.
[2] G. S. Dwarakish, S. A. Vinary, U. Natesan et al., “Coastal vulnerability
assessment of the future sea level rise in Udapi coastal zone of
Karnataka State, west coast of India,” Ocean and Coastal Management,
vol. 52, pp. 467-478, 2009.
[3] D. J. Doong, T. W. Hsu, L. Ch. Wu, and C. C. Kao, “Sea level rise at
East Asia coasts based on tide gauge analysis,” in Proc. the Nineteenth
International Offshore and Polar Engineering Conference, 2009.
[4] M. L. Capobiancoo, H. D. Vriend, R. Nicholas et al., “Coastal area
impact and vulnerability assessment: The point of view of a
morpholodynamic modeller,” Journal of Coastal Research, vol. 15, no.
3, pp. 701-16, 1999.
[5] E. R. Thieler and E. S. Hammar-Klose, “National assessment of coastal
vulnerability to future sea-level rise: Preliminary results for the U.S.
Atlantic Coast,” U.S. Geological Survey, Open File Report 99-593,
1999.
Mohd Fauzi M. was born in 1959. He holds a diploma
degree in civil engineering from Institut Teknologi
Mara, Malaysia in 1981, a bachelor degree of science
(Hons) from civil engineering at University of
Strathclyde, United Kingdom in 1983 and a master
degree in hydrology and water resources at Universiti
Teknologi Malaysia in 2009.
He had served at Jabatan Kerja Raya (JKR) from
1983 to 2001, before serving National Hydraulic Research Institute of
Malaysia (NAHRIM) from 2001 to present. At JKR, he held positions of
senior executive engineer before serving at NAHRIM as a senior researcher
on coastal engineering division on 2001 to 2003 and Director of Hydraulic
and Instrumentation Laboratory from 2003 until now.
Ir. Mohd Fauzi have vast experience in project management and structural
design with major in coastal structures during his tenure in JKR and has
produces several research technical papers. He is a professional engineer,
member of board of Engineer Malaysia (BEM); and corporate member of
Institution of Engineer Malaysia (IEM).
Lee Hin Lee was born in 1964. She holds a bachelor
degree of Eng (Hons) in civil engineering at
University Hanyang, Korea in 1988, and a master
degree in coastal processes at Universiti Kebangsaan
Malaysia in 2010.
She had served at Jabatan Pengairan dan Saliran
(JPS) from 1989 to 2003, before serving National
Hydraulic Research Institute of Malaysia (NAHRIM)
from 2003 to present. At JPS, she held positions of
senior executive engineer before serving at NAHRIM as a senior researcher
on coastal engineering division on 2003 until now.
Lee Hin Lee is a senior researcher in coastal engineering and coastal
numerical modelling, particularly in hydrodynamic and sediment coastal
processes. Her experiences and capabilities are demonstrated by her
involvement as adviser to federal and Malaysia state government agencies
related to coastal engineering processes, coastal reclamation works, coastal
development strategies and morphology processes in mangrove replanting
works. She is a professional engineer, member of board of Engineer
Malaysia (BEM); and corporate member of Institution of Engineer Malaysia
(IEM).
Mohd Kamarul Huda S. was born in 1980 and holds a
bachelor degree of Eng. (Hons) in civil engineering at
UTM, Mal in 2003, and a master degree of science in
Hydraulic & Hydrology at University Technology
Malaysia in 2006.
He had serving National Hydraulic Research
Institute of Malaysia (NAHRIM) from 2007 to present.
At NAHRIM, he held positions of senior research
officer on laboratory of hydraulic and instrumentation until now.
He is currently a researcher in charge of hydraulic and hydrological model
testing project particularly in flood mitigation study and hydraulic structure.
He had carried out numerous physical modelling for many rivers, dam and
coastal in Malaysia.
International Journal of Environmental Science and Development, Vol. 5, No. 6, December 2014
538