cobweb diagram as a tool for assessing · pdf file · 2015-07-17cobweb diagram as a...
TRANSCRIPT
COBWEB DIAGRAM AS A TOOL FOR ASSESSING CHANGES IN THE MOST IMPORTANT FINANCIAL STABILITY RISKS 1 ● 2015
2
CONTENTS
EXECUTIVE SUMMARY 3
INTRODUCTION 4
1. USE OF RISK DIAGRAMS: INTERNATIONAL EXPERIENCE 5
2. METHODOLOGY FOR THE DEVELOPMENT OF THE FINANCIAL STABILITY RISK DIAGRAM FOR LATVIA 7 2.1 Selection of risk categories and indicators 8 2.2 Assessment and interpretation of indicators and risk categories 9
3. RISK DIAGRAM FOR THE ASSESSMENT OF CHANGES OF FINANCIAL STABILITY RISKS IN LATVIA: RESULTS 12
CONCLUSIONS 18
APPENDIX 19
ABBREVIATIONS AND SYMBOLS
CDS – credit default swap CISS – ECB composite indicator of systemic stress CPI – Consumer Price Index ECB – European Central Bank EU – European Union ESI – economic sentiment indicator EURIBOR – Euro Interbank Offered Rate FCMC – Financial and Capital Market Commission FSI – financial stress index GDP – gross domestic product IMF – International Monetary Fund RIGIBOR – Riga Interbank Offered Rate ROE – return on equity 1* – positive relationship with the risk –1* – inverse relationship with the risk
COBWEB DIAGRAM AS A TOOL FOR ASSESSING CHANGES IN THE MOST IMPORTANT FINANCIAL STABILITY RISKS 1 ● 2015
3
EXECUTIVE SUMMARY
The Discussion Paper analyses a risk cobweb diagram employed as an additional analytical tool for monitoring and assessing financial stability risks in Latvia. The aim of the risk cobweb diagram is to depict the most important financial stability risks across specified risk categories and the direction of their changes in a single chart. The risk cobweb diagram and the dynamics of the index corresponding to each risk category and its components make it possible to visualise and analyse development of external and domestic macrofinancial risks and vulnerability changes of the banking sector in Latvia by assessing the credit risk of non-financial corporations and households, profitability and solvency risks of credit institutions, as well as funding and liquidity risks.
The Discussion Paper gives the overview of the use of the risk cobweb diagram and its methodology in other countries. It also outlines the process of the development of such a diagram in Latvia and describes selected risk categories and indicators. The Discussion Paper concludes that the results of the back-testing of the risk cobweb diagram have been adequate. In 2008 and 2009, the risk category assessments of the risk cobweb diagram signalled threats to financial stability, while risk category indices and their components allowed the identification of the areas where accumulation and materialisation of financial stability risks occurred.
Keywords: financial stability, risk cobweb diagram, risk categories, monitoring of financial system stability, assessment of financial system stability
JEL codes: E32, E44, E58, G10
The views expressed in this publication are those of the authors, who are employees of the Financial Stability Department of Latvijas Banka. The authors assume responsibility for any errors and omissions.
COBWEB DIAGRAM AS A TOOL FOR ASSESSING CHANGES IN THE MOST IMPORTANT FINANCIAL STABILITY RISKS 1 ● 2015
4
INTRODUCTION
The global financial crisis of 2008 and 2009 highlighted the importance of financial stability assessment and monitoring, as well as the necessity of analysing the interconnectedness between economic and financial developments. A systemic approach to the assessment of development of financial system risks has become particularly important.
One of the key methods used for the financial stability analysis was and remains monitoring and analysis of a set of financial stability indicators. Largely known sets of financial stability indicators are the financial soundness indicators developed by the IMF (IMF (e-Library data)) and the set of macro-prudential indicators developed by the ECB (Mörttinen, Poloni, Sandars et al. (2005)). The IMF financial soundness indicators include 40 indicators describing financial institutions, non-financial corporations, households, market liquidity and the real estate market. The ECB macro-prudential indicators comprise a very broad range of indicators describing internal, external and contagion factors. Although the set of financial stability indicators is monitored by central banks of many countries, the large number of indicators, the lack of thresholds describing the risk level, as well as various and often contradictory signals given by dynamics of a large number of indicators do not allow for a comprehensive assessment of the financial system stability.
Therefore, a number of methods for incorporating indicators into one system or into one indicator were developed and widely used over the past years to carry out comprehensive financial stability monitoring and assessment. A distinctive feature of such methods is also a possibility to reflect changes of the condition of financial stability or of the most important financial stability risks, thus employing it as a communication tool. Basically, these methods can be divided into three groups: stability or stress indices, heat maps and risk cobweb diagrams (hereinafter, the risk diagram).
The financial stress or financial stability index ranks among the most common quantitative tools characterising the stability of the financial system. These indices are constructed based on financial market indicators, as well as on those of banks' balance sheets and activity. For instance, Illing and Liu (2003) have developed the financial stress index for Canada. It encompasses indicators of the banking sector, foreign exchange, stock and bond markets. Hanschel and Monnin (2005) have created the stress index for the Swiss banking system. It is based on balance sheet indicators of credit institutions, interbank market data and supervisory information. Van den End (2006) from De Nederlandsche Bank has produced the financial stability conditions index, which contains not only balance sheet and market indicators but also macroeconomic indicators. The ECB composite indicator of systemic stress (CISS), which assesses the stress situation in money, bond, stock and foreign exchange markets, as well as in the financial sector has been broadly employed in the euro area (Holló, Kremer and Lo Duca (2012)). Since 2009, Latvijas Banka has also been using the financial stress index for Latvia as one of the elements of the financial stability monitoring system (Siņenko, Titarenko and Āriņš (2012)). The FSI for Latvia is based on balance sheet indicators of credit institutions and market data. Although the FSI is a useful tool for carrying out a quick overall assessment of the financial system, the notion of financial stability is too multifaceted to be described by one indicator. Moreover, the FSI does not often

COBWEB DIAGRAM AS A TOOL FOR ASSESSING CHANGES IN THE MOST IMPORTANT FINANCIAL STABILITY RISKS 1 ● 2015
5
make it possible to identify the component of the financial system being the source of stress.
Heat maps reflecting the degree of vulnerability of risk categories or risk-specific indicators on the basis of the predefined thresholds are still rarely used. This method requires the selection of thresholds for assessing the risk level of all indicators included in the heat map. Thus, the use of the method is restricted by an extended heat map development process, which is largely based on the expert judgment and which often lacks empirical justification. Heat maps are often used to carry out an internal analysis. With macro-prudential analysis developing, heat maps are supposed to be used more frequently as it is a convenient tool for reflecting the degree of systemic risks and changes of this degree.
The risk diagram provides an opportunity to analyse several risk dimensions (e.g. various risk categories and conditions) simultaneously, at the same time retaining a comprehensive approach to the assessment of financial stability risks. Following the publication of the IMF risk diagram, the Global Financial Stability Map (IMF (2007)), risk diagrams were developed in the central banks of many countries. It is important to note that risk diagrams are also used as a communication tool, since they present the most important financial stability risks in a single chart. In 2013, Latvijas Banka also developed a risk diagram for the assessment and monitoring of financial stability in Latvia. A brief description of the diagram was published in the "Financial Stability Report 2013/2014" (Latvijas Banka (2014)).
The objective of the Discussion Paper is to describe the risk diagram methodology in Latvia, focusing both on international practice regarding the use of such diagrams and specificities of the methodology employed for the development of the risk diagram for Latvia.
Chapter 1 of the Discussion Paper examines the risk diagrams produced by the central banks and institutions of other countries, their development methodology and the aim of their use. Chapter 2 describes the methodology for the development of the financial stability risk diagram and risk category indices for Latvia, justifies the selection of risk categories and indicators, explores the approaches employed for assessing indicators and categories, as well as addresses interpretation of the risk diagram assessment. Chapter 3 provides the results of the risk diagram and a brief description of dynamics in the risk category indices. The conclusion contains the authors' findings on the usefulness of the risk diagram for the assessment and monitoring of the financial system stability in Latvia.
1. USE OF RISK DIAGRAMS: INTERNATIONAL EXPERIENCE
After the introduction of the Global Financial Stability Map in 2007 (IMF (2007)) and its regular publication in the Global Financial Stability Report to provide a graphical presentation of risks and conditions affecting financial stability for communication purposes, risk diagrams become a more popular tool for monitoring and assessing financial stability and for communication. The risk diagrams have been developed not only by the IMF (Dattels, McCaugrin, Miyajima et al. (2010)) but also by Norges Bank (Dahl, Birkeland Kloster, Larsen et al. (2011)), Sveriges Riksbank (Jönsson and Leung (2012)), Suomen Pankki – Finlands Bank (Bank of Finland Bulletin (2010)), Kaukoranta (2010)), the Reserve Bank of New Zealand (Bedford and Bloor (2009)) and other national central banks.
COBWEB DIAGRAM AS A TOOL FOR ASSESSING CHANGES IN THE MOST IMPORTANT FINANCIAL STABILITY RISKS 1 ● 2015
6
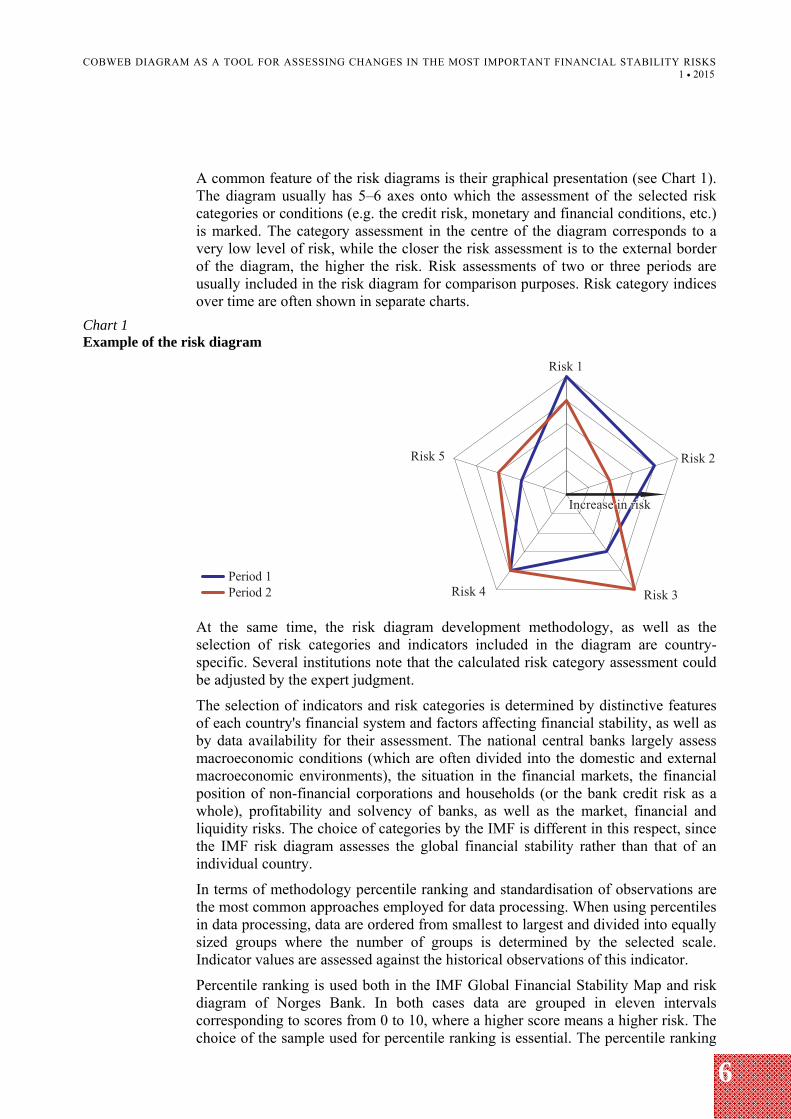
A common feature of the risk diagrams is their graphical presentation (see Chart 1). The diagram usually has 5–6 axes onto which the assessment of the selected risk categories or conditions (e.g. the credit risk, monetary and financial conditions, etc.) is marked. The category assessment in the centre of the diagram corresponds to a very low level of risk, while the closer the risk assessment is to the external border of the diagram, the higher the risk. Risk assessments of two or three periods are usually included in the risk diagram for comparison purposes. Risk category indices over time are often shown in separate charts.
Chart 1 Example of the risk diagram
At the same time, the risk diagram development methodology, as well as the selection of risk categories and indicators included in the diagram are country-specific. Several institutions note that the calculated risk category assessment could be adjusted by the expert judgment.
The selection of indicators and risk categories is determined by distinctive features of each country's financial system and factors affecting financial stability, as well as by data availability for their assessment. The national central banks largely assess macroeconomic conditions (which are often divided into the domestic and external macroeconomic environments), the situation in the financial markets, the financial position of non-financial corporations and households (or the bank credit risk as a whole), profitability and solvency of banks, as well as the market, financial and liquidity risks. The choice of categories by the IMF is different in this respect, since the IMF risk diagram assesses the global financial stability rather than that of an individual country.
In terms of methodology percentile ranking and standardisation of observations are the most common approaches employed for data processing. When using percentiles in data processing, data are ordered from smallest to largest and divided into equally sized groups where the number of groups is determined by the selected scale. Indicator values are assessed against the historical observations of this indicator.
Percentile ranking is used both in the IMF Global Financial Stability Map and risk diagram of Norges Bank. In both cases data are grouped in eleven intervals corresponding to scores from 0 to 10, where a higher score means a higher risk. The choice of the sample used for percentile ranking is essential. The percentile ranking
COBWEB DIAGRAM AS A TOOL FOR ASSESSING CHANGES IN THE MOST IMPORTANT FINANCIAL STABILITY RISKS 1 ● 2015
7
in the risk diagram of Norges Bank is performed on a full sample, including the latest observations. The indicator score may change in this approach both due to an increase in risk and changes in the median of the underlying data due to the new extreme observations. On the contrary, IMF uses fixed samples for the percentile ranking without extending them with new observations, thus ensuring comparability with the risk diagrams of earlier periods. However, shortcomings of the latter approach become apparent when the new values of the indicator significantly exceed the historical range. First, a score of 5 no longer corresponds to the historical norm, thus making it difficult to interpret the score. Second, the percentile score remains unchanged at a time when the situation deteriorates which might be crucial during a period of a deepening crisis.
The Reserve Bank of New Zealand uses standardisation of indicators (the difference between the indicator value and the sample mean of this indicator is divided by the standard deviation of the indicator) in developing its risk diagram. The standardised indicator values are aggregated using expert judgment-based weights. To convert the aggregated indicator values into percentiles, it is assumed that data are distributed according to the Student's t-distribution. When assigning scores from 1 to 9, intervals of different length are used so that a score of 4 corresponds to the median, while 1, 8 and 9 correspond to rare observations.
When developing the Country Financial Stability Map and thus complementing the Global Financial Stability Map, the IMF (Cervantes, Jeasakul, Maloney et al. (2014)) employed the standardisation method for scoring indicators. While the selection of indicators and the methodology used for the assessment of indicators has not explicitly taken into account financial stability features of a specific country, it is essential that the Country Financial Stability Map allows achieving comparable results for various countries.
Suomen Pankki – Finlands Bank uses just one indicator for the assessment of each risk category when developing the risk diagram, justifying the choice by the fact that the assessment based on a small number of variables is more transparent. Standardisation of variables allows avoiding the unwanted property of cumulative distribution function transformation to amplify the amplitude of small fluctuations in the variables. At the same time, a disadvantage of this approach in comparison with percentile ranking is sensitivity to new observations exceeding the historical range.
In the risk diagram produced by Sveriges Riksbank, assessments of the selected indicators are aggregated with equal weights in the assessments of risk categories (the scale from 0 to 8). The assessment of a large number of indicators is based on deviations from their long-term mean value. The maximum, minimum and long-term mean values of indicators are often based on the expert judgment.
2. METHODOLOGY FOR THE DEVELOPMENT OF THE FINANCIAL STABILITY RISK DIAGRAM FOR LATVIA
In 2013, based on the experience of the IMF and the central banks of other countries, Latvijas Banka developed the risk diagram as an additional analytical tool for financial stability risk monitoring and assessment in Latvia. The aim of this risk diagram is to present the most important financial stability risks and the direction of their changes in a single chart.
COBWEB DIAGRAM AS A TOOL FOR ASSESSING CHANGES IN THE MOST IMPORTANT FINANCIAL STABILITY RISKS 1 ● 2015
8
2.1 Selection of risk categories and indicators
Six risk categories were defined:
external macrofinancial risks; domestic macroeconomic risks; non-financial corporation credit risk; household credit risk; liquidity and funding risks of credit institutions; solvency and profitability risks of credit institutions.
Each risk category comprises 7–9 indicators that best describe trends and changes of the specific risk.
Risks of the external macrofinancial environment are linked to external shocks (e.g. the slowdown of economic growth in the main trade partner countries, turmoil in foreign financial markets, deterioration of the fiscal situation in the EU countries), which might have a negative impact on the domestic macroeconomic environment and thus also on the quality of credit institutions' assets and profitability. Changes in foreign demand are characterised by imports in the main trade partners. In the light of the strong impact of the EU economic growth on economic processes in Latvia, several aggregate indicators describing the economic and fiscal situation in the EU countries have been included in the category of external macrofinancial risks. The composite indicator of systemic stress (CISS) developed by the ECB is used for assessing the financial market situation.
Changes in the domestic macroeconomic environment affect the condition of financial stability in different ways, mainly causing changes in borrowers' solvency, thus affecting the quality of the credit institutions' loan portfolio and their profitability indicators. Economic activity indicators, the job seekers' ratio, consumer price inflation and current account balance of Latvia are employed for the assessment of the domestic macroeconomic situation. Taking account of the fact that the effect of the macroeconomic situation on the financial stability is stronger in an unfavourable fiscal situation and in conditions of a high private sector debt burden, indicators of the debt level of the public and private sectors are also used for the assessment of the risk category changes (for the list of indicators see the Appendix).
The assessment of the credit institutions' credit risk is one of the most important steps of financial stability monitoring and assessment, since assets of Latvia's credit institutions are dominated by loans to residents. Taking account of the role of household and non-financial corporations' credit risk, as well as differences in development of lending to households and non-financial corporations in Latvia, credit risks of households and non-financial corporations are assessed in separate risk categories. Profitability and interest coverage ratio of non-financial corporations are included in the credit risk category of non-financial corporations for the assessment of borrowers' creditworthiness, while indicators of the quality of the loan portfolio are incorporated therein for the analysis of the effect of changes in borrowers' creditworthiness on balance sheets of credit institutions. Several indicators, e.g. the debt-to-equity ratio, credit-to-GDP ratio and credit-to-GDP gap have been employed for the assessment of the burden of liabilities incurred by non-financial corporations. To measure the possible risk concentration in a particular industry (e.g. the real estate market), the Herfindahl–Hirschman Index is calculated for non-financial corporations. The real net wage, job seekers' ratio and the ratio of

COBWEB DIAGRAM AS A TOOL FOR ASSESSING CHANGES IN THE MOST IMPORTANT FINANCIAL STABILITY RISKS 1 ● 2015
9
interest payments to disposable income are employed for the assessment of household creditworthiness. The ratio of household debt to disposable income and its gap are used for the assessment of the household debt burden. The housing affordability index is included in the household credit risk category. Indicators of the loan portfolio quality are also analysed in the household credit risk category to assess the impact of changes of borrowers' creditworthiness on credit institutions' balance sheets.
The category of liquidity and funding risks assesses the effect of the availability of funding provided by credit institutions and changes in funding costs on financial stability. In addition to the traditional liquidity and funding risk assessment indicators, e.g. the FCMC liquidity ratio, deposit growth and the credit-to-deposit ratio, some specific indicators for assessing risks of Latvian credit institutions are used. Considering the large share of subsidiaries and branches of Nordic banks in the total assets of Latvian credit institutions, the category contains not only Latvia's CDS spreads but also the weighted average of Nordic banks' CDS spreads, which can indirectly indicate changes in funding costs of some Latvian credit institutions. Until 2014, the spread between RIGIBOR and EURIBOR was employed for assessing the situation in the interbank market. From 2014, this indicator has been replaced by the historical volatility1 of the interest rate on overnight loans granted in euro. Considering the significance of non-residents' deposits in funding of some Latvian credit institutions and the related potential risks to Latvia's economy and the credit institution sector (e.g. an increase in short-term external debt, the reputation risk), this category also includes an indicator reflecting a share of residents' assets financed by other financial resources (residents' deposits and other liabilities to residents, gross funding of parent banks and capital).
The assessment of credit institutions' solvency and profitability risks reflects the ability of credit institutions to absorb shocks and raise adequate capital for absorbing losses when necessary. The return on equity (ROE), overall interest rate margin and net provision expenditure are used to assess credit institutions' profitability in the risk diagram for Latvia. The indicators describing the Latvian credit institutions' capitalisation level, the provisioning ratio and the ratio of net loans past due to capital are employed for solvency risk analysis.
2.2 Assessment and interpretation of indicators and risk categories
Quarterly data, starting with 2002 (or from the moment data become available) are used in calculations. The choice of the above period is determined by the significant structural changes in Latvia's economy and the financial sector in the 1990s, stabilisation of development following essential and frequent fluctuations and increased availability of the number of indicators.
Each indicator is assessed by using one of the three methods depending on the statistical distribution of the indicator time series and its economic interpretation. If data are not very asymmetric and their empirical distribution has no heavy tails2, a standard method is used, i.e. the indicator values sorted in an ascending order are
1 With Latvia having joined the euro area, the lats interbank interest rate does not exist anymore. 2 The distribution of a random variable is said to have heavy tails if probabilities that the random variable will take extremely high or low values considerably exceed similar probabilities of a normal distribution, which could be indicated by, e.g. the kurtosis.

COBWEB DIAGRAM AS A TOOL FOR ASSESSING CHANGES IN THE MOST IMPORTANT FINANCIAL STABILITY RISKS 1 ● 2015
10
divided into 11 intervals with an equal number of observations (percentiles). Each percentile group corresponds to one of the risk scores ranging from 0 to 10, the middle interval contains the median of the series and corresponds to the score of 5.
If the distribution of an indicator is very asymmetric or has heavy tails, an alternative method based on the median is used. The middle interval contains the median and corresponds to the score of 5, other observations are divided into 10 intervals so that the length of intervals starting from the minimum value of the indicator and spreading to the beginning of the middle interval differs from the length of intervals starting from the end of the middle interval and spreading to the maximum value of the indicator.
The expert judgment supplements the assessment of many indicators.
If a decrease in the value of an indicator results in a higher risk score, the values used in calculations are multiplied by (–1). Taking account of the fact that relationship between some indicators and financial stability risks is non-linear (e.g. both a very rapid GDP growth and its sharp drop suggest threats to financial stability), deviations of these indicators from the predefined level are used.
Before obtaining an overall assessment of the risk category, each indicator is scored in the range from 0 to 10 (a higher score means a higher risk). A score of 5 shows the historical benchmark of observations, and does not automatically correspond to a "normal" risk or vulnerability level. In certain cases indicator scoring could be adjusted by the expert judgment.
The overall score of the category is the arithmetic mean of indicator scores included in the category (all indicators of the category have an equal weight). The assigning of different weights would require the assessment of the importance of indicators and degree of their impact on financial stability, thus reinforcing subjectivity. Furthermore, the significance of each indicator changes with time; therefore, risk category evaluation would not be fully comparable over time. It is only the CISS developed by the ECB that has more weight than other indicators in the external macrofinancial risk category in the risk diagram for Latvia, since this indicator assesses the stress situation not in one but in several important segments of the financial system of the euro area: money, bonds, equity and currency markets, as well as in the financial sector.
Chart 2 shows a summary of Latvia's financial stability risk assessments. Proper interpretation of the assessments depicted in the risk diagram is important. A category score of 0 is in the centre of the diagram, but a score of 10 is on the outer border (a higher category score means a higher risk). A score of 5 shows the historical benchmark of observations. It cannot be automatically considered a "normal" assessment of the risk or vulnerability level, and it cannot be interpreted as a long-term equilibrium level either. The risk diagram does not assess the absolute degree of risk in the specific period. Risk categories are assessed in comparison with retrospective historical values. Thus, risk levels are assessed only in relation to their historical benchmark or compared to the selected period (the previous quarter, the respective period of the previous year, etc.). This means that the risk diagram does not determine the absolute level of financial stability but the direction of its change. When the latest indicator observations are released, category assessments (including their historical benchmarks) are recalculated.

COBWEB DIAGRAM AS A TOOL FOR ASSESSING CHANGES IN THE MOST IMPORTANT FINANCIAL STABILITY RISKS 1 ● 2015
11
Chart 2 Financial stability risk diagram for Latvia
It is important to note that category assessments are not directly comparable, e.g. a score of 6 regarding household credit risk and a score of 6 in relation to non-financial corporations' credit risk do not mean that the level of these risks is equal over the specified period.
Chart 3 presents the process of the risk diagram development for Latvia. It shows that the risk diagram is not quite a technical tool, since the expert judgment plays an important role in scoring each indicator (by choosing the way of transformation of indicator data and by determining the division into intervals) and far less frequently in scoring risk categories (if factors, which are difficult to assess by using quantitative methods, substantially affect the risk category assessment during the period considered).
Chart 3 Risk diagram development process
Choice of categories
Selection of indicators
Indicator scoring
Category scoring
Development and interpretation of
the diagram
6 risk categories 7–8 indicators in each category (see the Appendix)
Indicator transformation
Division of the time series of the indicator into intervals
Scores from 0 to 10 are assigned to the indicator depending on its location in the specific interval
The arithmetic mean of indicator scores included in the category
Adjustment of the category score by applying the expert judgment
Direction of an increase in risks ranges from 0 to 10 (a higher score means a higher risk).
Category scores are not directly comparable.
Interpretation of the average score of 5 – the historical benchmark
Expert judgment

COBWEB DIAGRAM AS A TOOL FOR ASSESSING CHANGES IN THE MOST IMPORTANT FINANCIAL STABILITY RISKS 1 ● 2015
12
3. RISK DIAGRAM FOR THE ASSESSMENT OF CHANGES OF FINANCIAL STABILITY RISKS IN LATVIA: RESULTS
To expand the applicability of the risk diagram, the assessment of each risk category is depicted also as an individual index (see Charts 4–9). The depiction of the contribution made by individual indicators in the overall category score helps to understand the key factors explaining the main changes in the risk assessment.
The analysis of the external macrofinancial risks suggests that they gradually decreased in 2002–2006 against the background of improving growth in the main trade partners of Latvia and the improvement of the EU labour market situation (see Chart 4). At the same time, private debt was high and continued to increase during this period. The level of the accumulated government debt was also high in the EU countries. In 2007 and 2008, an increase in external risks was facilitated by tensions in financial markets, with the economic situation of the euro area and the main trade partners of Latvia also gradually deteriorating. At the end of 2008, the global financial crisis developed. Government debts of the EU countries grew rapidly since the end of 2008, marking a significant deterioration of the fiscal situation and creating preconditions for the escalation of the sovereign debt crisis in the second half of 2011. In 2013, external macrofinancial risks decreased considerably. This was facilitated by the receding EU sovereign debt crisis, financial market stabilisation and the improvement of economic activity in the euro area. However, the external risk assessment still exceeds the historical benchmark and points to a relatively high risk level. Although lending remained weak and the process of deleveraging continued over the past years, the private sector debt level in many EU countries is still very high. The euro area sovereign debt crisis has receded; however, the fiscal position remains tense in some EU countries. The situation in the EU labour market has significantly deteriorated since 2009, and it is still not improving substantially.
Chart 4 Assessment of changes in external macrofinancial risks (dynamics of the index and its components)
Dynamics of internal macroeconomic risks suggest that the financial crisis, which started in 2008, and a pronounced fall in the economic growth represent the consequences of imbalances rapidly accumulated over the previous years (see Chart 5). Latvia's economy was imbalanced and fragile when facing the global
COBWEB DIAGRAM AS A TOOL FOR ASSESSING CHANGES IN THE MOST IMPORTANT FINANCIAL STABILITY RISKS 1 ● 2015
13
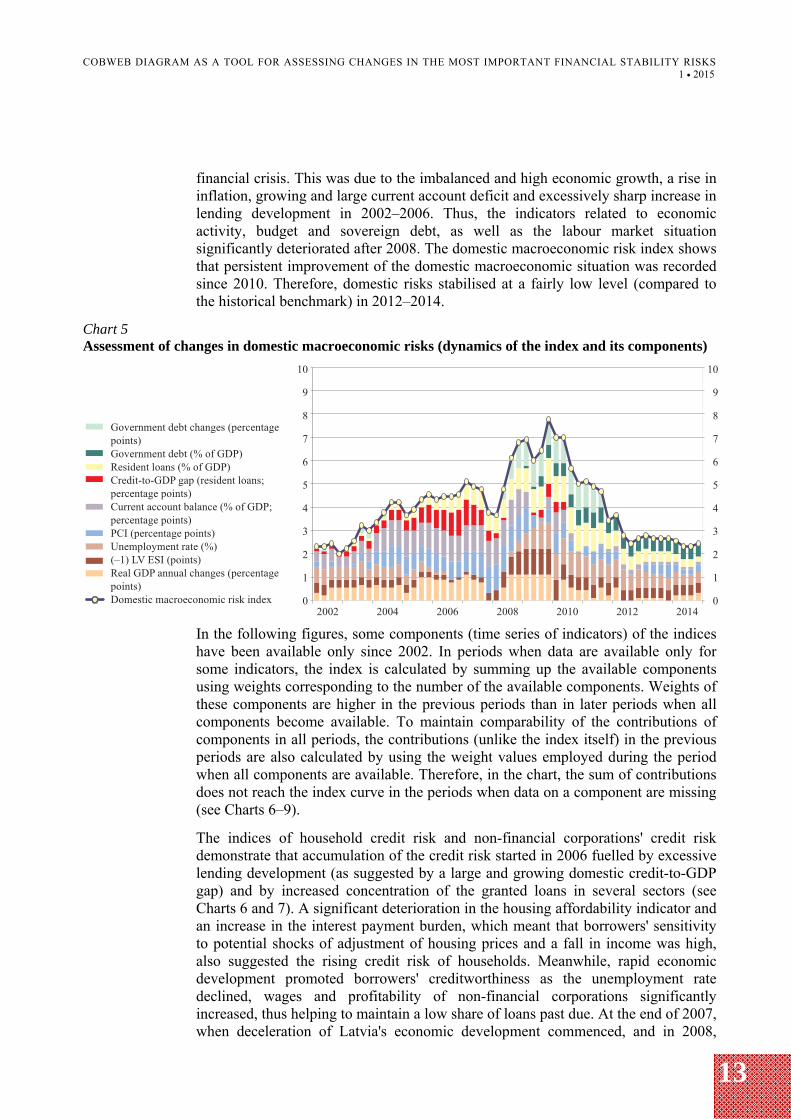
financial crisis. This was due to the imbalanced and high economic growth, a rise in inflation, growing and large current account deficit and excessively sharp increase in lending development in 2002–2006. Thus, the indicators related to economic activity, budget and sovereign debt, as well as the labour market situation significantly deteriorated after 2008. The domestic macroeconomic risk index shows that persistent improvement of the domestic macroeconomic situation was recorded since 2010. Therefore, domestic risks stabilised at a fairly low level (compared to the historical benchmark) in 2012–2014.
Chart 5 Assessment of changes in domestic macroeconomic risks (dynamics of the index and its components)
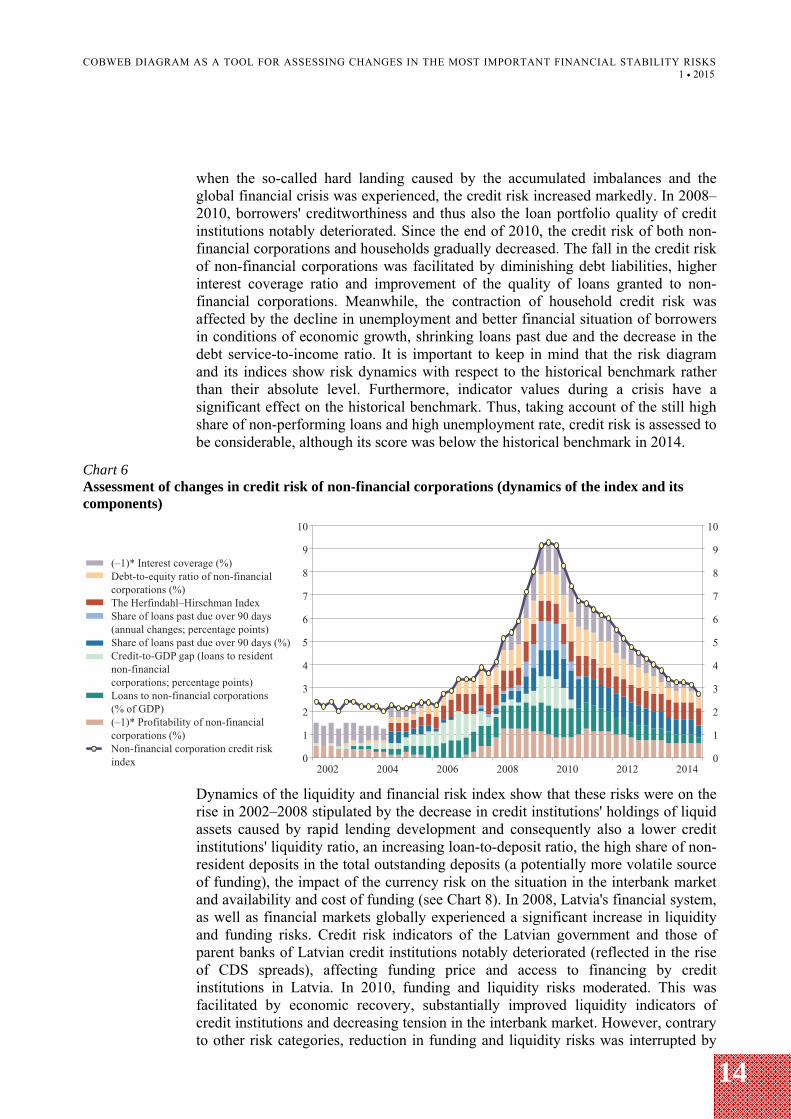
In the following figures, some components (time series of indicators) of the indices have been available only since 2002. In periods when data are available only for some indicators, the index is calculated by summing up the available components using weights corresponding to the number of the available components. Weights of these components are higher in the previous periods than in later periods when all components become available. To maintain comparability of the contributions of components in all periods, the contributions (unlike the index itself) in the previous periods are also calculated by using the weight values employed during the period when all components are available. Therefore, in the chart, the sum of contributions does not reach the index curve in the periods when data on a component are missing (see Charts 6–9).
The indices of household credit risk and non-financial corporations' credit risk demonstrate that accumulation of the credit risk started in 2006 fuelled by excessive lending development (as suggested by a large and growing domestic credit-to-GDP gap) and by increased concentration of the granted loans in several sectors (see Charts 6 and 7). A significant deterioration in the housing affordability indicator and an increase in the interest payment burden, which meant that borrowers' sensitivity to potential shocks of adjustment of housing prices and a fall in income was high, also suggested the rising credit risk of households. Meanwhile, rapid economic development promoted borrowers' creditworthiness as the unemployment rate declined, wages and profitability of non-financial corporations significantly increased, thus helping to maintain a low share of loans past due. At the end of 2007, when deceleration of Latvia's economic development commenced, and in 2008,
COBWEB DIAGRAM AS A TOOL FOR ASSESSING CHANGES IN THE MOST IMPORTANT FINANCIAL STABILITY RISKS 1 ● 2015
14
when the so-called hard landing caused by the accumulated imbalances and the global financial crisis was experienced, the credit risk increased markedly. In 2008–2010, borrowers' creditworthiness and thus also the loan portfolio quality of credit institutions notably deteriorated. Since the end of 2010, the credit risk of both non-financial corporations and households gradually decreased. The fall in the credit risk of non-financial corporations was facilitated by diminishing debt liabilities, higher interest coverage ratio and improvement of the quality of loans granted to non-financial corporations. Meanwhile, the contraction of household credit risk was affected by the decline in unemployment and better financial situation of borrowers in conditions of economic growth, shrinking loans past due and the decrease in the debt service-to-income ratio. It is important to keep in mind that the risk diagram and its indices show risk dynamics with respect to the historical benchmark rather than their absolute level. Furthermore, indicator values during a crisis have a significant effect on the historical benchmark. Thus, taking account of the still high share of non-performing loans and high unemployment rate, credit risk is assessed to be considerable, although its score was below the historical benchmark in 2014.
Chart 6 Assessment of changes in credit risk of non-financial corporations (dynamics of the index and its components)
Dynamics of the liquidity and financial risk index show that these risks were on the rise in 2002–2008 stipulated by the decrease in credit institutions' holdings of liquid assets caused by rapid lending development and consequently also a lower credit institutions' liquidity ratio, an increasing loan-to-deposit ratio, the high share of non-resident deposits in the total outstanding deposits (a potentially more volatile source of funding), the impact of the currency risk on the situation in the interbank market and availability and cost of funding (see Chart 8). In 2008, Latvia's financial system, as well as financial markets globally experienced a significant increase in liquidity and funding risks. Credit risk indicators of the Latvian government and those of parent banks of Latvian credit institutions notably deteriorated (reflected in the rise of CDS spreads), affecting funding price and access to financing by credit institutions in Latvia. In 2010, funding and liquidity risks moderated. This was facilitated by economic recovery, substantially improved liquidity indicators of credit institutions and decreasing tension in the interbank market. However, contrary to other risk categories, reduction in funding and liquidity risks was interrupted by

COBWEB DIAGRAM AS A TOOL FOR ASSESSING CHANGES IN THE MOST IMPORTANT FINANCIAL STABILITY RISKS 1 ● 2015
15
development of the sovereign debt crisis in the euro area in 2011. An increase in risks in Latvia was related to a rise in tension in European financial markets; however, the euro area sovereign debt crisis had a very limited direct impact on Latvian credit institutions. As Latvia's economy started a more assertive recovery, some banks reverted to lower liquidity indicators. CDS spreads of Nordic countries and Latvia shrank considerably, liquidity and funding risks started to go down already in 2012. The introduction of the euro also had a positive effect. First, it reduced the impact of the currency risk and, second, caused a substantial increase in resident deposits at the end of 2013.
Chart 7 Assessment of changes in household credit risk (dynamics of the index and its components)
Chart 8 Assessment of changes in liquidity and funding risk (dynamics of the index and its components)
At the end of 2007, the profitability and solvency risks started to pick up (see Chart 9). A decrease in profit was facilitated by both the narrowing spread between interest rates on loans and deposits and an increase in loan loss provisions due to deteriorating financial situation of borrowers and consequently also the impairing

COBWEB DIAGRAM AS A TOOL FOR ASSESSING CHANGES IN THE MOST IMPORTANT FINANCIAL STABILITY RISKS 1 ● 2015
16
quality of the loan portfolio. Performance indicators significantly worsened. The solvency and profitability risks of Latvian credit institutions gradually declined since 2010 as a result of the deceleration in the credit risk. On the positive side, credit institutions overcame the crisis by fundamentally strengthening their capital positions (with the capital adequacy ratios reaching their historical highs), thus improving the shock-absorption capacity.
Chart 9 Assessment of changes in solvency and profitability risk (dynamics of the index and its components)
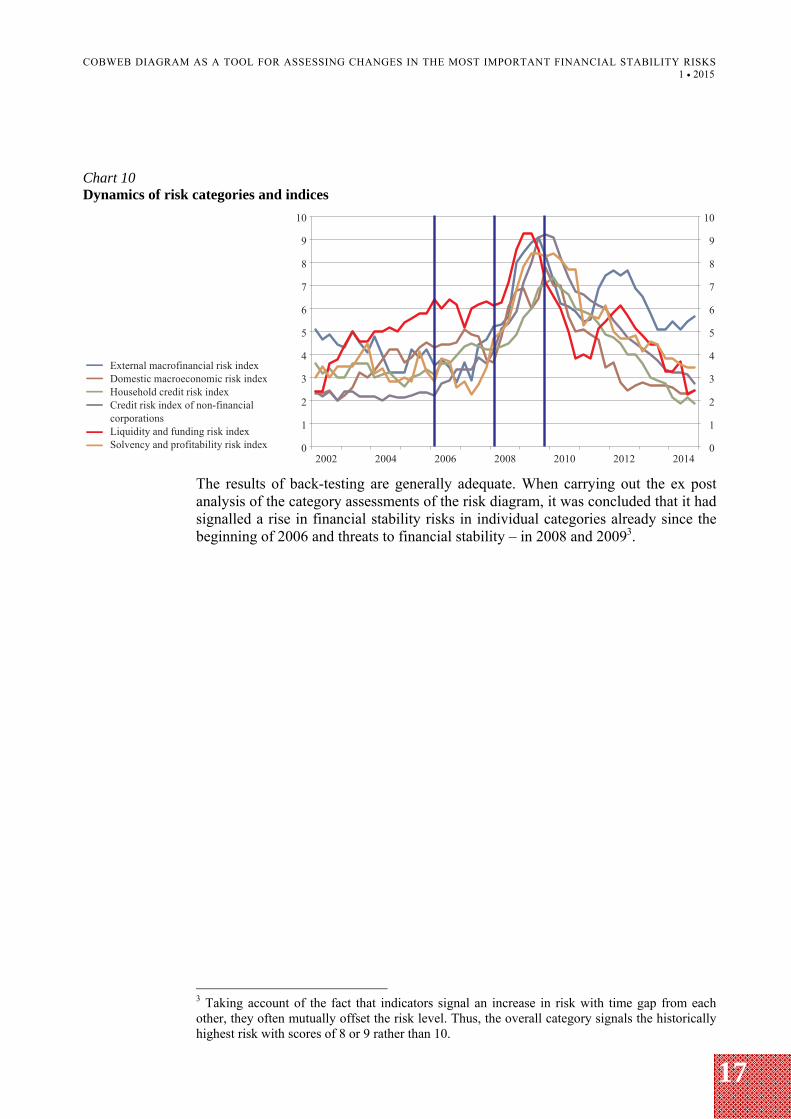
Four financial stability risk development periods could be separated as a result of the analysis of the dynamics of risk category indices since 2002 (see Chart 10). Risk development varied in the pre-crisis period. From 2002 to 2005 or 2006, some categories (e.g. the domestic macroeconomic risk and liquidity and funding risks) experienced accumulation of risks, the external macrofinancial risk category recorded a slight decline, while the risk level of other risk categories remained broadly unchanged. In 2006 and 2007, the dynamics of several risk categories (external risks, the household credit risk and the credit risk of non-financial corporations) showed a rise in risks, while an overall increase in financial stability risks occurred since 2008. The financial stability risks peaked in 2009 and 2010, and subsequently they gradually decreased. In 2014, the risk score in almost all risk categories, except the external macrofinancial risks, was below the historical benchmarks. However, it should be taken into account that indicator values have a significant effect on the historical benchmark during a crisis. At the same time, improvements in individual risk categories slowed down in 2014. This could be partially attributed to heightening uncertainty caused by external geopolitical tensions.
COBWEB DIAGRAM AS A TOOL FOR ASSESSING CHANGES IN THE MOST IMPORTANT FINANCIAL STABILITY RISKS 1 ● 2015
17
Chart 10 Dynamics of risk categories and indices
The results of back-testing are generally adequate. When carrying out the ex post analysis of the category assessments of the risk diagram, it was concluded that it had signalled a rise in financial stability risks in individual categories already since the beginning of 2006 and threats to financial stability – in 2008 and 20093.
3 Taking account of the fact that indicators signal an increase in risk with time gap from each other, they often mutually offset the risk level. Thus, the overall category signals the historically highest risk with scores of 8 or 9 rather than 10.
COBWEB DIAGRAM AS A TOOL FOR ASSESSING CHANGES IN THE MOST IMPORTANT FINANCIAL STABILITY RISKS 1 ● 2015
18
CONCLUSIONS
The present Discussion Paper describes the methodology for the development of the financial stability risk diagram in Latvia that was based on the analysis of financial stability risk diagrams of other countries.
The risk diagram has been one of the tools used for financial system stability monitoring and assessment in Latvijas Banka since 2013. It is employed to graphically represent the most important financial stability risks and the direction of their changes in a single chart.
The results of back-testing are adequate. In 2008 and 2009, risk category assessments signalled threats to financial stability. At the same time, results of the risk diagram point to certain restrictions regarding the use of this instrument for financial stability assessment. This is mainly due to the fact that the risk diagram shows the direction of risk changes, i.e. it assesses the degree of risk only in comparison with the historical benchmark or the risk level in the previous periods. It cannot be used for assessing the absolute risk degree which means that assessments of various risk categories are not directly comparable.
To complement the analytical framework of Latvia's financial stability risk assessment, it would be recommendable to identify thresholds for the individual indicators used in the risk diagram. These thresholds would help to assess the level of risk for a specific risk category or pre-defined systemic risk.
COBWEB DIAGRAM AS A TOOL FOR ASSESSING CHANGES IN THE MOST IMPORTANT FINANCIAL STABILITY RISKS 1 ● 2015
19
APPENDIX
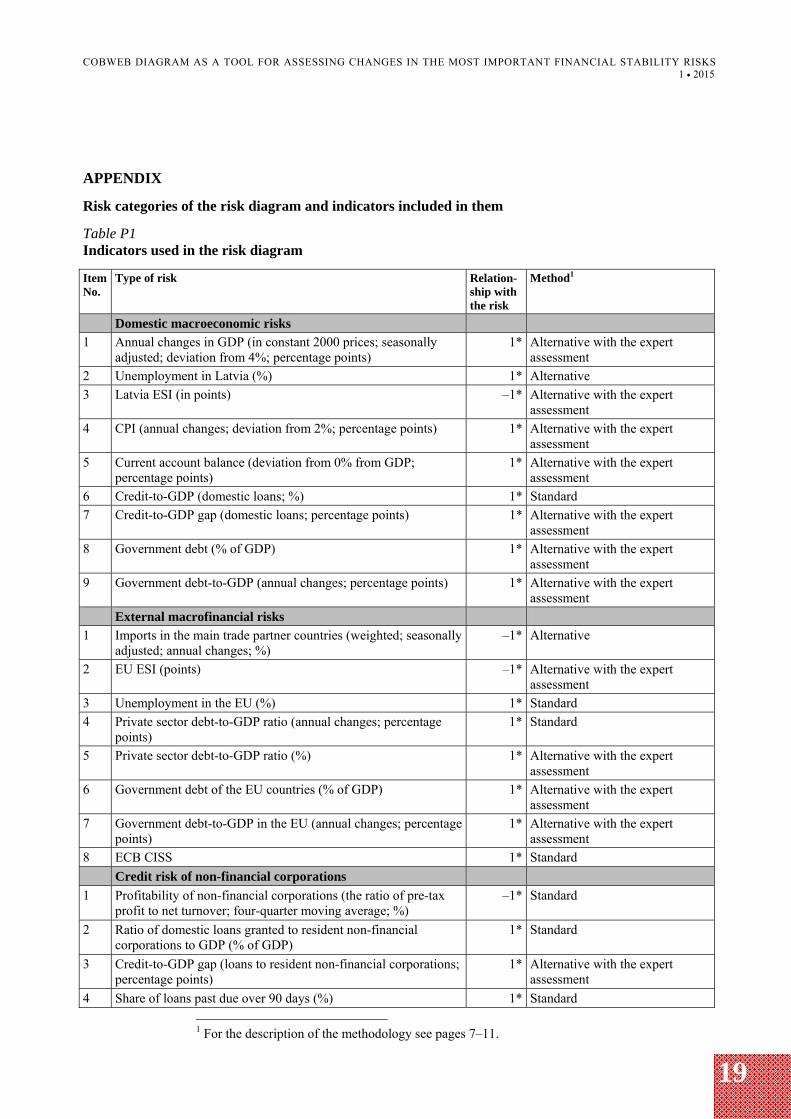
Risk categories of the risk diagram and indicators included in them
Table P1 Indicators used in the risk diagram
Item No.
Type of risk Relation-ship with the risk
Method1
Domestic macroeconomic risks
1 Annual changes in GDP (in constant 2000 prices; seasonally adjusted; deviation from 4%; percentage points)
1* Alternative with the expert assessment
2 Unemployment in Latvia (%) 1* Alternative
3 Latvia ESI (in points) –1* Alternative with the expert assessment
4 CPI (annual changes; deviation from 2%; percentage points) 1* Alternative with the expert assessment
5 Current account balance (deviation from 0% from GDP; percentage points)
1* Alternative with the expert assessment
6 Credit-to-GDP (domestic loans; %) 1* Standard
7 Credit-to-GDP gap (domestic loans; percentage points) 1* Alternative with the expert assessment
8 Government debt (% of GDP) 1* Alternative with the expert assessment
9 Government debt-to-GDP (annual changes; percentage points) 1* Alternative with the expert assessment
External macrofinancial risks 1 Imports in the main trade partner countries (weighted; seasonally
adjusted; annual changes; %) –1* Alternative
2 EU ESI (points) –1* Alternative with the expert assessment
3 Unemployment in the EU (%) 1* Standard
4 Private sector debt-to-GDP ratio (annual changes; percentage points)
1* Standard
5 Private sector debt-to-GDP ratio (%) 1* Alternative with the expert assessment
6 Government debt of the EU countries (% of GDP) 1* Alternative with the expert assessment
7 Government debt-to-GDP in the EU (annual changes; percentage points)
1* Alternative with the expert assessment
8 ECB CISS 1* Standard
Credit risk of non-financial corporations
1 Profitability of non-financial corporations (the ratio of pre-tax profit to net turnover; four-quarter moving average; %)
–1* Standard
2 Ratio of domestic loans granted to resident non-financial corporations to GDP (% of GDP)
1* Standard
3 Credit-to-GDP gap (loans to resident non-financial corporations; percentage points)
1* Alternative with the expert assessment
4 Share of loans past due over 90 days (%) 1* Standard
1 For the description of the methodology see pages 7–11.

COBWEB DIAGRAM AS A TOOL FOR ASSESSING CHANGES IN THE MOST IMPORTANT FINANCIAL STABILITY RISKS 1 ● 2015
20
Item No.
Type of risk Relation-ship with the risk
Method1
5 Share of loans past due over 90 days (annual changes; percentage points)
1* Alternative with the expert assessment
6 The Herfindahl–Hirschman Index (sectoral concentration in the loan portfolio)
1* Alternative with the expert assessment
7 Debt-to-equity ratio of non-financial corporations (%) 1* Standard
8 Interest coverage (interest payments to profit; four-quarter moving average; %)
–1* Standard
Household credit risk
1 Real net wage (annual changes; seasonally adjusted; %) –1* Standard
2 Rate of jobseekers in Latvia 1* Standard
3 Housing affordability indicator (the ratio of the average price of a standard apartment in Riga to the average net wage in Riga; %)
1* Alternative
4 Ratio of household debt to disposable income (%) 1* Alternative
5 Household debt-to-disposable income gap (percentage points) 1* Alternative with the expert assessment
6 Ratio of the estimated household interest payable to credit institutions to disposable income (four-quarter moving average; %)
1* Standard
7 Share of loans past due over 90 days (%) 1* Alternative
8 Share of loans past due over 90 days (annual changes; percentage points)
1* Alternative with the expert assessment
Liquidity and funding risk of credit institutions
1 FCMC liquidity indicator –1* Standard
2 Resident deposits (annual changes; %) –1* Standard
3 Resident loan-to-deposit ratio (%) 1* Alternative with the expert assessment
4 Ratio of resident assets to the total amount of resident claims, gross funding of the parent bank and capital (%)
1* Alternative with the expert assessment
5 5-year CDS spread of Swedish and Norwegian parent banks 1* Standard
6 Spread between 3-month RIGIBOR and 3-month EURIBOR (until 2014; percentage points)
–1* Alternative with the expert assessment
7 Historical volatility of the interest rate on overnight loans granted in euro
1* Alternative
8 5-year CDS spread of Latvia (basis points) 1* Standard
Solvency and profitability risk of credit institutions
1 Common Equity Tier 1 ratio (%) –1* Alternative
2 Ratio of capital and reserves to assets (%) –1* Alternative with the expert assessment
3 Provisioning ratio (the ratio of loan loss provisions to loans past due over 90 days; %)
–1* Standard
4 Ratio of net loans past due over 90 days to capital (%) 1* Standard
5 ROE (%) –1* Standard
6 Spread of the overall interest rates on outstanding amounts (the spread between the weighted average rates on loans and deposits; %)
–1* Alternative
7 Ratio of net expenditure on provisions to operating income (%) 1* Alternative
COBWEB DIAGRAM AS A TOOL FOR ASSESSING CHANGES IN THE MOST IMPORTANT FINANCIAL STABILITY RISKS 1 ● 2015
21
BIBLIOGRAPHY
Bank of Finland Bulletin. Financial Stability, 2010. Suomen Pankki – Finlands Bank. 59 p.
BEDFORD, Paul, BLOOR, Chris (2009) – A Cobweb Model of Financial Stability in New Zealand. Reserve Bank of New Zealand Discussion Paper Series, No. DP2009/11, November. 22 p.
CERVANTES, Ricardo, JEASAKUL, Phakawa, MALONEY, Joseph, ONG, Li Lian (2014) – Ms. Muffet, the Spider(gram) and the Web of Macro-Financial Linkages. IMF Working Paper, No. WP/14/99, June. 43 p.
DAHL, Geir Arne, BIRKELAND KLOSTER, Thea, LARSEN, Unni, RAKKESTAD, Ketil Johan, REISVAAG, Rebekka, SYVERSTEN, Bjørne Dyre, TRÆE, Cathrine Bolstad (2011) – A Cobweb Model of Financial Stability in Norway. Norges Bank Staff Memo, No. 15. 43 p.
DATTELS, Peter, McCAUGHRIN, Rebecca, MIYAJIMA, Ken, PUIG, Jaume (2010) – Can You Map Global Financial Stability? IMF Working Paper, No. WP/10/145, June. 43 p.
HANSCHEL, Elke, MONNIN, Pierre (2005) – Measuring and Forecasting Stress in the Banking Sector: Evidence from Switzerland. BIS Papers, No. 22, April, pp. 431–449.
HOLLÓ, Dániel, KREMER, Manfred, LO DUCA, Marco (2012) – CISS – A Composite Indicator of Systemic Stress in the Financial System. ECB Working Paper Series, No. 1426, March. 51 p.
ILLING, Mark, LIU, Ying (2003) – An Index of Financial Stress for Canada. Bank of Canada Working Paper, No. 2003-14, June. 63 p.
IMF (2007) – Global Financial Stability Report. April, p. 2.
IMF (e-Library Data) – Financial Soundness Indicators [viewed on 22 January 2015]. Available at: http://fsi.imf.org.
JÖNSSON, Kristian, LEUNG, Caroline (2012) – Cobweb Charts as a Tool for Summarising the Stability Assessment. Sveriges Riksbank Economic Commentaries, No. 5, 28 November. 11 p.
KAUKORANTA, Ilkka (2010) – Rahoitusmarkkinoiden vakauden visualisointi. Suomen Pankki – Finlands Bank. BoF online, No. 8/2010. 28 p.
Latvijas Banka (2014) – Financial Stability Report 2013/2014. Riga: Latvijas Banka. 79 p.
MÖRTTINEN, Leena, POLONI, Paolo, SANDARS, Patrick, VESALA, Jukka (2005) – Analysing Banking Sector Conditions: How to Use Macro-Prudential Indicators. ECB Occasional Paper Series, No. 26, April. 70 p.
SIŅENKO, Nadežda, TITARENKO, Deniss, ĀRIŅŠ, Mikus (2012) – Latvian Financial Stress Index. Riga: Latvijas Banka. Discussion Paper, 1/2012. 27 p.
Van den END, Jan Willem (2006) – Indicator and Boundaries of Financial Stability. De Nederlandsche Bank Working Paper, No. 97, March. 24 p.