cohort comparison of halogenated hydrocarbons and …mediatum.ub.tum.de/doc/603624/603624.pdf · -...
TRANSCRIPT
- i -
Wissenschaftszentrum Weihenstephan
für Ernährung, Landnutzung und Umwelt
Lehrstuhl für Ökologische Chemie und Umweltanalytik
der Technische Universität München
Cohort Comparison of Halogenated Hydrocarbons and Chiral Persistent
Bioaccumulating Endocrine Disrupting Chemicals in Mother Samples After
Delivery
Heqing Shen
Vollständiger Abdruck der von der Fakultät Wissenschaftszentrum Weihenstephan für
Ernährung, Landnutzung und Umwelt der Technische Universität München zur
Erlangung des akademischen Grades eines
Doktors der Naturwissenschaften
genehmigten Dissertation.
Vorsitzender: Univ.-Prof. Dr. rer. nat. habil. W. Huber
Prüfer der Dissertation:
1. Univ.-Prof. Dr. rer. nat., Dr. h. c. (RO) A. Kettrup
2. Univ.-Prof. Dr. rer. nat., Dr. agr. habil. (Zonguldak
University / Türkei), Dr. h. c. H. Parlar
3. Priv.-Doz. Dr. rer. nat., Dr. agr. habil. K.-W. Schramm
Die Dissertation wurde am 17.02.2005 bei der Technische Universität München
eingereicht und durch die Fakultät Wissenschaftszentrum Weihenstephan für
Ernährung, Landnutzung und Umwelt am 11.06. 2005 angenommen.

- ii -
Curriculum Vitae:
Mr. Heqing Shen Birth of Date: 1968, 08, 27 Birth of Place: Shanxi, PR China GSF-National Research Center for Environment and Health Institute for Ecological Chemistry Ingolstädter Landstr. 1, D-85764 Neuherberg Tel.: 00498931873033; Fax: 00498931873371 Email: [email protected]; [email protected] 9,1981-7,1987 Studied in Lucheng No. 1 Middle School, Changzi Distract of Shanxi province in P. R.China; 9,1987-6,1991 Studied in the Department of Applied Chemistry, Taiyuan University of Technology. The major is analytical chemistry and the bachelor thesis is about the synthesis of Al-P-Zeolite sieves by vaporific amine templates; 7,1991-8,1994 Employed by Coke and Gas Mill of Changzi. Analyzed water and environmental pollutant; 9,1994-7,1995 Master course study in the Graduate School, University of Science and Technology of China (the Graduate School, Chinese Academy of Sciences in Beijing) as a student of Dalian Institute of Chemical Physics, Chinese Academy of Sciences; 7,1995-7,1997 Research works for master dissertation in Dalian Institute of Chemical Physics, Chinese Academy of Sciences. The major is analytical chemistry and the research field was the cyclodextrin derivatives’ synthesis and application on enantiomeric separation and the chiral recognition mechanism (computational chemistry method) in chromatography; 7,1997-9,2001 Employed by the Department of Chemical Engineering, Dalian University for National Minorities, Was in charge of instrumental analysis from 7,1997-10,1998, including HPLC, GC-MS, FTIR, UV and RF. Apart from the teaching work of Analytical Chemistry and Scientific English (for biochemical engineering major) class, the research field is concentrated in synthesis and application of chiral molecular imprinting polymers; 12, 2001-now Institute for Ecological Chemistry, GSF-National Research Center for Environment and Health; PhD study focus on ‘Cohort Comparison of Halogenated Hydrocarbons and Chiral Persistent Bioaccumulating Endocrine Disrupting Chemicals in Mother Samples after Delivery’.
- iii -
List of Publications relevant to this work:
Heqing Shen, Qinghai Wang, Daoqing Zhu, Liangmo Zhou, Molecular modeling method and its applications in chiral recognition mechanism, Chinese J. Anal. Chem., 1997, 25, 110-114 (Ch.) Heqing Shen, Qinghai Wang, Daoqing Zhu, Liangmo Zhou, Study on 2,6-Dipentyl- β-cyclodextrin as a stationary phase in capillary gas chromatographic separation of enantiomers, J. Instrumental Anal. , 1998, 17, 45-46 (Ch.) Heqing Shen, Qinghai Wang, Daoqing Zhu, Liangmo Zhou, Study of four pentylatedα-,β-cyclodextrin chiral stationary phases on capillary gas chromatography, Chinese J. Anal. Chem., 1998, 26, 211-214 (Ch.) Duan Zhang, Zhanguo lu, Heqing Shen, Liangmo Zhou, Wenshen Guo, The asymmetrical reduction of 1-4’-hydroxyphenyl-1-butanone complexed with solid l-cedrol, Chinese J. Synthetic Chem., Appendage of Vol. 5, p 559 (Ch.), The 1th Organic Chemistry Symposium of Chinese Chemical Society, Chengdu, 1997 Heqing Shen, Qinghai Wang, Daoqing Zhu, Liangmo Zhou, A study of a molecular mechanics field used in simulating enantiorecognition, Chinese Chem. Letters, 1999, 10, 415-418 (Eng.) Liangmo Zhou, Mengyan Nie, Qinghai Wang, Daoqian Zhu, Heqing Shen, Enthalpy-entropy compensation effect in gas chromatographic enantiomeric separation, Chinese J. Chem. 1999, 17(4), 363-376 (Eng.) Heqing Shen, Katharina M. Main, Marko Kaleva, Helena Virtanen, Anne-Maarit Haavisto, Niels E Skakkebaek, Jorma Toppari, Karl-Werner Schramm, Prenatal organochlorine pesticides in placentas from Finland: exposure of male infants born 1997-2001, Placenta 2005, 26 (6) 512-514 Heqing Shen, H.E. Virtanen, Katharina M. Main, M. Kaleva, A.M. Andersson, Niels E. Skakkebæk, Jorma Toppari and Karl-Werner Schramm, Enantiomeric ratios as an indicator of exposure processes for persistent pollutants in human placentas, In Press, Corrected Proof, Available online 6 July 2005 H Shen, M Kaleva, H Virtanen, A-M Haavisto, KM Main, NE Skakkebaek, J Toppari, K-W Schramm, Comparison of hexachlorobenzene residues in placentas from Finland and Denmark (1997-2001), Dioxin 2004, Berlin (poster) H Shen, M Kaleva, H Virtanen, A-M Haavisto, KM Main, NE Skakkebaek, J Toppari, K-W Schramm, The relationship between enantiomeric fraction and concentration of α-hexachlorocyclohexane in human placentas, Dioxin 2004, Berlin (poster) H Shen, A Kettrup, K-W Schramm, Chlorinated Hydrocarbons and Chiral Persistent

- iv -
Bio-accumulating Toxicants (c-PBT) in Human Samples, SECOTOX 2004, Thailand (oral) Heqing Shen, Marko Kaleva, Helena Virtanen, Anne-Maarit Haavisto, Katharina M. Main, Niels E Skakkebaek, Jorma Toppari, Karl-Werner Schramm, From mothers to children, transfer potential of hexachlorobenzene before and after birth in Finland male cohort (1997-2001), The International Conference on Environmental and Public Health Management: Persistent Toxic Substances 2004, Hong Kong (oral) Heqing Shen, Niels E Skakkebaek, Jorma Toppari, Karl-Werner Schramm, The relationship between enantiomeric ratio and concentration of cis-heptachloroepoxide (c-HE) in placenta and milk samples, 3rd Copenhagen Workshop on Environment, Reproductive Health and Fertility, 2005 Copenhagen (poster) H-Q Shen, KM Main, M Kaleva, IM Schmidt, KA Boisen, M Chellakooty, IN Damgaard, H Virtanen, A-M Suomi, NE Skakkebaek, J Toppari, K-W Schramm, Comparison of organochlorine compound residues in placenta and breast milk samples from Finland and Denmark, 3rd Copenhagen Workshop on Environment, Reproductive Health and Fertility, 2005 (poster) Heqing Shen, Niels E Skakkebaek, Jorma Toppari, Karl-Werner Schramm, Comparison of Biodegradation of Chiral cis-Heptachloroepoxide and Oxychlordane in Different Human Samples, The First International Conference on Environmental Science and Technology, 2005, New Orleans, USA (oral) Heqing Shen, Katharina M Main, Helena E Virtanen, Ida N Damggard, Anne-Maarit Haavisto, Kaleva M, Boisen KA, Ida M Schmidt, Marla Chellakooty, Niels E Skakkebaek, Jorma Toppari, Karl-Werner Schramm, From mother to child: investigation of prenatal and postnatal exposure to persistent bioaccumulating toxicants using breast milk and placenta biomonitoring, Chemosphere (submitted)

- v -
Acknowledgement:
Firstly, I wish to thank sincerely my supervisor Prof. Dr. Dr. Antonius Kettrup (Technische
Universität München) for accepting me as his PhD student, for his competent direction, valuable
insights and continuous support both within and beyond this dissertation work. His kindly
personality and excellent academic guidance have made my work possible.
Specially and sincerely thanks go to PD Dr. Dr. Karl-Werner Schramm, my supervisor in the
Institut für Ökologische Chemie, GSF, for his insightful and careful comments and discussions
throughout my PhD study, his kindly help beyond the academic work.
My acknowledgements also go to Mr. Bernhard Henkelmann for his professional support with his
excellent knowledge in instrumental analysis; go to Ms. Silke Bernhöft for her good work on
sample preparation and go to Ms. Jarmila Kotalik for her kind help within and beyond technical
work.
I would also wish to thank the other colleagues Mr. Norbert Fisher, Dr. Gerd Pfister and Dr.
Marchela Pandelova for their support in science (and society).
European Commission under the Quality of Life and Management of Living Resources
Programme, Key Action 4 (contract number QLK4-CT-2001-00269) supported this work. I am
grateful for the help of Prof. Terttu Vartiainen and Dr. Hannu Kiviranta (National Public Health
Institute, Kuopio, Finland) for organizing the homogenization of the placenta and milk samples. I
would like also thanks Prof. Niels E Skakkebaek and Prof. Jorma Toppari for comments to
publications, discussion, visit to beautiful Copenhagen and their excellent courses.
Finally, I would like to take this opportunity to thank my families back home for all the support,
especially my wife. It would be impossible for me to finish this work without their support,
encouragement and tolerance.

- vi -
List of Abbreviation:
c,t-CHL: cis-, trans-chlordane; OXC: oxychlordane; HC: heptachlor; c, t-HE: cis-, trans-heptachloroepoxide; END-1: endosulfan-I (endosulfan-α); END-2: endosulfan-II (endosulfan-β); p, p´-DDT: 1,1,1-trichloro-2,2-bis(4-chlorophenyl)ethane; o, p´-DDT: 1,1,1-trichloro-2-(2-chlorophenyl)-2-(4-chlorophenyl)ethane; p, p´-DDD: 1,1-dichloro-2,2-bis(4-chlorophenyl)ethane; o, p´-DDD: 1,1-dichloro-2-(2-chlorophenyl)-2-(4-chlorophenyl)ethane; p, p´-DDE: 1,1-dichloro-2,2-bis(4-chlorophenyl)ethane; o, p´-DDE: 1,1-dichloro-2-(2-chlorophenyl)-2-(4-chlorophenyl)ethane); 3-MeSO2-DDE: 3-methyl sulfonyl-p, p’-DDE; 2-MeSO2-DDE: 2-methyl sulfonyl-p, p’-DDE; MOC: methoxychlor (1,1,1-trichloro-2, 2-bis(4-methoxyphenyl)ethane); mono-OH-MOC: 2-(p-hydroxyphenyl)-2-(p-methoxyphenyl)-1,1,1-trichloroethane; HPTE: 2,2-bis(p-hydroxyphenyl)-1,1,1-trichloroethane; tris-OH-MOC: 1,1,1-trichloro-2-(4-hydroxyphenyl)-2-(3, 4-dihydroxyphenyl)ethane; HCH: 1,2,3,4,5,6-Hexachlorocyclohexane; PeCB: pentachlorobenzene; HeCB: hexachlorobenzene; OCS: octachlorostyrene; PCA: pentachloroanisole; PCP: pentachlorophenol; PCN: pentachloronitrobenzene; 2,3,7,8- TCDD: 2,3,7,8-tetrachlorodibenzo-p-dioxin; PCB: polychloronated biphenyl PBT: persistent bio-accumulated toxicant; EDC: Endocrine disrupting chemical; DHT: dihydrotestosterone; E2: estradiol; DHT: dihydrotestosterone; ERα, ERβ: estrogen receptor α, β; ER: enantiomeric ratio(in the disscussion of enantiomeric biotransformation); FP: Finland placenta; DP: Denmark placenta; DM: Denmark milk; FM: Finland milk; PC: principal component.

- vii -
Content
1-1: introduction………………………………………………………………………………….....1
1-1-1: Research background……… ………………………………………………...…………..1
1-1-2: EXPORED project and the present study……………………………………...…………….2
1-2: Prenatal and postnatal exposure to PBTs from mother…………………………………...……5
1-2-1: General trends and some factors affect the levels of PBTs in mother samples………...……5
1-2-2: PBTs incorporate with fetus (infants) from mother via placenta and milk…………….……6
1-3: PBT exposure, EDCs and human reproductive health…………………………………….…12
1-3-1: PBT exposure and human reproductive health……………………………………….……12
1-3-2: Debate on risk assessment of PBTs as EDCs…………………………………………...…14
1-3-3: Human exposure characters to EDCs………………………………………………….…..16
1-4: Enantiomeric ratio information of c-PBT residuals in biota…………………………………21
1-4-1: Chiral PBTs in biota samples………………………………………………………………21
1-4-2: Chiral and prochiral PBTs and endocrine disruption activity……………………………...23
2-1: Sampling and analysis………………………………………………………………………..25
2-1-1: Sample collection information……………………………………………………………..25
2-1-2: Sample preparation method………………………………………………………………..26
2-1-3: HRGC-HRMS analysis and data collection………………………………………………..30
2-2: Statistical analysis…………………………………………………………………………….34
2-3: Repeatability of the analytical procedure…………………………………………………….36
2-4: Intra- and inter-laboratory comparison of the lipid data……………………………………...40
3-1: Lipid comparison between Denmark and Finland cohorts…………………………….…..…42
3-1-1: Lipid contents of placenta and milk samples in the two cohorts…………………….…..…42
3-1-2 Distributions of the lipid data………………………………………………………….……44
3-2: Exposure patterns and levels of the investigated compounds………………………………...47
3-2-1: Overview of the investigated compounds…………………………………………….……47
3-2-2: Distribution types of the investigated compounds…………………………………………49
3-3: Compounds correlations of the abundant pollutants………………………….………………58

- viii -
3-4:What the PC analysis tell…………………………………………………………………...…61
3-4-1: PC analysis for DM, DP, FM and FP………………………………………………………61
3-4-2: Sample type and cohort characters…………………………………………………………67
3-5: Paired milk and placenta samples from Finland cohort………………………………………72
3-6: Enantioselective residuals of the c-PBTs in mother samples………………………...………77
3-6-1: Information from ERs………………………………………………………………………77
3-6-2: Model interpreting human exposure to c-PBTs……………………………………….……81
3-7: PBBs in Finnish placenta samples……………………………………………………………85
3-8: The investigated compound perspectives……………………………….……………………88
3-8-1: DDT and the metabolites with MOC……………………….………………………………88
3-8-2: HCHs with emphasis the β-isomer………………………………………..………………91
3-8-3: HeCB, PeCB and PCA…………………………………………………………..…………92
3-8-4: Dieldrin also reflected the exposure of aldrin…………………………………………...…94
3-8-5: END……………………………………………………………………………………...…95
3-8-6: Biotransformed technical chlordane residuals…………………...…………………………96
3-8-7: Other detectable PBT residuals………………………………………………….…………97
4: Summary………………………………………………………………………………..………99
5: Outlook……………………………………………………………………………………...…102
6: Reference………………………………………………………………………………………104
Figure
Fig. 1-2-2 (1): Distribution of PBTs among body through blood circuit……………………….…..9
Fig. 1-3-2 (1): Most of the known environmental chemicals with hormonal activity derive that
activity through interaction with one or more of steroid / thyroid / retinoid gene family of nuclear
receptors…………………………………………………………………………………………...16
Fig. 1-3-2 (2): Multiple pathways of EDCs……………………………………………………….16
Fig 2-1-3 (1): Chromatography of enantiomeric separated α-HCH and other four isomers………32
Fig 2-1-3 (2): Chromatography of enantiomeric separated OXC isomers…………………...……32
Fig 2-1-3 (3): Chromatography of enantiomeric separated c-HE…………………………………32
- ix -
Fig 2-1-3 (4): Chromatography of enantiomeric separated o, p’-DDD………………...…………32
Fig 2-1-3 (5): Chromatography of enantiomeric separated o, p’-DDT and p, p’-DDT…….…..…33
Fig 2-1-3 (6): Chromatography of enantiomeric separated o, p’-DDT…………………….……...33
Fig. 2-3 (1): The trend of STD versus the average value (Mean)………………………….….…..36
Fig. 2-4 (1): The inter-laboratory lipid data comparison between paired sub-samples of Finland
and Denmark breast milk samples…………………………………………………………….…..41
Fig. 2-4 (2): The intra-laboratory lipid data comparison between paired sub-samples of Finland
and Denmark breast placenta samples……………………………………………………………41
Fig. 3-1-1 (1): Comparing the distribution of placenta lipid data of the two cohorts…………….43
Fig. 3-1-1 (2): Comparing the distribution of breast milk lipid data of the two cohorts…………43
Fig. 3-1-2 (1): Histograms of the lipid data grouped by different laboratories, sample types and
cohorts…………………………………………………………………………………………….45
Fig 3-2-1 (1): The profile of the investigated compounds in placenta and breast milk samples….50
Fig. 3-2-2 (1): Histograms of the 8 most abounding compound data grouped by different sample
types and cohorts………………………………………………………………………….…...52-57
Fig. 3-3 (1): Overview of the compound-compound relationship in DM…………………………59
Fig. 3-3 (2): Overview of the compound-compound relationship in FM………………………….59
Fig. 3-3 (3): Overview of the compound-compound relationship in DP…………………….……60
Fig. 3-3 (4): Overview of the compound-compound relationship in FP…………….…………….60
Fig. 3-4-1 (1): 48 DP samples with less variance of 2nd, 3rd and 4th PC sample scores showed
linear correlation for each two of 8 compounds…………………………………………………..62
Fig. 3-4-1 (2): The proposed common exposure patterns…………………………………………62
Fig. 3-4-1 (3): Compound patterns changing with 2nd PC, especially for c-HE and dieldrin contrary
to the rest…………………………………………………………………….…………………….63
Fig. 3-4-1 (4): Compound and sample score plots of DM, DF, FM and FP………………...…64-66
Fig 3-4-2 (1): 1st PC sample score interpreted the most part of the total variance and the other part
variance mainly involved the higher contaminated Denmark samples……………………………68
Fig 3-4-2 (2): The summary of OXC and END-1 increase with 3rd PC and 2nd PC sample scores
for Finland milk and placenta samples…………………………………………………………….68
Fig. 3-4-2 (3): Compound and sample score plots (1 to 12) of the pooled placenta (168 DP and 112

- x -
FP) and milk (56 for each cohort) samples…………………………….………………………69-70
Fig. 3-5 (1): Compound score and sample score plots for paired samples………………………..75
Fig. 3-5 (2): Sample score on lipid base & w. w. base referring the same factor behind 1st PC.….75
Fig. 3-5 (3): 2nd PC sample score on w. w. base referred variance introduced by lipid…………...75
Fig. 3-5 (4): 2nd PC sample score calculated on lipid base referring the pattern variance, esp. to
c-HE, dieldrin and mirex…………………………………………………………………………..76
Fig. 3-6-1 (1): ER of the paired Finland and Denmark milk and placenta samples………….…....79
Fig. 3-6-1 (2): (-)-α-HCH is usually the isomer enantioselective enriched in the investigated
mother samples…………………………………………………………………………………….79
Fig. 3-6-1 (3): (+)-c-HE is the enantioselective enrichment isomer in the investigated mother
samples…………………………………………………………………………………………….79
Fig. 3-6-1 (4): (+)-OXC, usually, is the enantioselective enrichment isomer in the investigated
mother samples…………………………………………………………………………….………80
Fig. 3-6-1 (5): o,p’-DDD (II) is the enantioselective enrichment isomer in the investigated mother
samples…………………………………………………………………………………….………80
Fig. 3-6-1 (6): (+)-o,p’- DDT is the enantioselective enrichment isomer in the investigated mother
samples…………………………………………………………………………………….………80
Fig. 3-6-1 (7): Chromatography of enantiomeric separated α-HCH (ER>1) and the other four
isomers……………………………………………………………………………….……………81
Fig. 3-6-1 (8): Chromatography of enantiomeric separated HC…………………..………………81
Fig. 3-6-1 (9): Chromatography of enantiomeric separated OXC (ER<1)………………………..81
Fig. 3-6-2 (1): Upper border line and lower border……………………………………...………..84
Fig 3-8-6 (1): Major chlordane-related compounds……………………………….………………96
Table
Table 2-1-1 (1): Methodological information of milk and placenta in case-control study………..25
Table 2-1-2 (1): The listed isotope internal and native standards with method recovery…………27
Table 2-1-2 (2): Native standards of purity enantiomers………………………………………….28
Table 2-1-3 (1): The masses used to identify and calculate the investigated compounds………....30

- xi -
Table 2-3 (1): Repeated 7 sub-samples of the homogenized reference placenta………………….37
Table 2-3 (2): Repeated 3 times of the breast milk sub-sample coded 0202030………………….38
Table 2-3 (3): Repeated 3 times of the breast milk sub-sample coded 0202026………………….38
Table 2-3 (4): Repeated 3 times of the breast milk sub-sample coded 0202029………………….39
Table 3-1-1 (1): Some reference data of mother samples…………………………………………42
Table 3-1-2 (1): The estimated distribution types and parameters of the fat content of breast milk
and placenta samples of the two cohorts………………………………………………………….46
Table 3-2-1 (1): Relative contents (fractions) of 8 main components in the two cohorts…………48
Table 3-2-1 (2): Comparison of PBT contents of the present data of the two cohorts with reported
Finland milk samples data…………………………………………………………………………49
Table 3-2-1 (3): Ratio of PBT distribution between tissue compartments on lipid basis…………49
Table 3-2-2 (1): Normal-fitting probability of the 8 compounds in the two cohorts samples…….50
Table 3-2-2 (2): Normal-fitting probability of the lipid data of the two cohorts………………….50
Table 3-2-2 (3): The Gamma distribution fitting parameters of the 8 abundant compounds in breast
milk and placenta samples of the two cohorts…………………………………………………….51
Table 3-3 (1): Correlations of OXC vs. END-1 in the two cohort samples……………………….58
Table 3-4-2 (1): Principal components interpreted more than 82% of the total variance of pooled
milk (PM) and pooled placenta (PP) samples……………………………………………………..71
Table 3-5 (1): Linear regression results of Finland milk samples versus placenta samples………74
Table 3-5 (2): The structure of 1st PC and 2nd PC on wet weight and lipid calibrations…………..74
Table 3-6-1 (1): Data of ER and (+)-, (-)- α-HCH concentrations not included in Fig. 3-6-1 (2)...78
Table3-6-2 (1): OCs in human milk (pool) adapted to a first order decrease……………………..82
Table 3-7 (1): PBB congeners in Finland placenta samples……………………………………….86
Table 3-7 (2): Other congeners can be detected in 10 samples…………………………………....86
Table 7-3 (3): Reference data environmental samples from Europe and USA………………...….87
Table 3-8-2 (1): β-HCH was the persistent residuals of HCH isomers in human body…………...92
Appended Table 1: Content of selected pesticides in Finnish human placentas…………………121
Appended Table 2: Content of selected pesticides in Denmark human placentas…………….…122
Appended Table 3: Content of selected pesticides in Denmark human milk………………….…123
Appended Table 4: Content of selected pesticides in Finland human milk…………………...…124

- xii -
Summary
Persistent organochlorine pesticides are accumulated over time in human fat tissue and can be
transferred to the fetus during pregnancy by crossing the placenta. In the present study, levels of
PeCB, HeCB, HCHs, DDT and the metabolites, OCS, PCA, aldrin, dieldrin, c-, t-CHL, HC, OXC,
c-, t-HE, MOC, END-1, –2 and mirex were determined in the lipid phase of homogenized placenta
and breast milk samples (placenta 112 and milk 65 from Turku, Finland, placenta 168 and milk 65
from Copenhagen, Denmark). Anti-androgenic p, p’-DDE was a dominant pollutant in all samples;
other major pollutants were β-HCH, HeCB, END-1, dieldrin, OXC, c-HE and p, p’-DDT, which
were all weak EDCs. No sample was negative for the 8 abounding compounds and they counted
89%, 95%, 98%, and 98% of the all investigated compounds in FP, DP, FM, DM, respectively. The
total amount of the 8 compounds changed from 9.76 to 293.9ng/g in placenta and from 42.93 to
524.49ng/g in milk samples. PC analysis showed a general simultaneously increase for the 8
compounds. Comparing the two cohorts, Denmark samples, which have lower levels of lipid in
placenta and milk, contained higher level of the investigated pollutants in placenta (1.73 times)
and milk (1.82 times) than the corresponding Finland samples, with emphasizing the more higher
contaminated samples in Denmark cohort than in Finland ones. The concentration correlations for
the 10 compounds (p, p’-DDE, β-HCH, HeCB, dieldrin, END-1, OXC, c-HE, p, p’-DDT, mirex
and OCS) between 42 paired Finland milk and placenta samples confirmed the transplancental
contamination. The contents of these lipophilic pollutants in milk were 1.5 to 3.0 times higher than
in placenta. PC analysis also suggested that there might be common exposure patterns for the two
cohorts, respectively. The two common patterns, which might imply common exposure sources or
paths for the two cohorts, are similar but with small differences in the content of END-1 and OXC.
Interestingly, the END-1 and OXC contents were linearly correlated in DM, DP, FM, FP and
pooled milk and placenta samples, respectively, which might reflect a source correlation of the
two pollutants for most investigated samples. Two Finland samples have abnormally high levels of
HCH with isomers ratios near to the technical mixture (one sample combined high levels of PeCB
and δ-HCH) but the other investigated compounds were in the normal ranges, which might
suggest a strong HCH contact of the mothers. The chiral exposure information expressed by c-HE

- xiii -
and α-HCH might suggest a different recent uptake level for the related pollutants. Additionally,
the less estrogenic active (+)-o, p’-DDT were the dominant residual compared to its counterpart.
The residual levels for most investigated compounds were much lower than the in vitro test levels
(usually from several to hundreds nano-mole per liter, which might be equal to the contaminated
levels of 10, 20 or even 30 years ago in these two countries) to introduce endocrine disrupting
function. However, the data will be used in the following case-control studies as a whole.
Considering the combined effects even at low levels, the metabolisms and the other unpredictable
factors in vivo, these pollutants should raise concern for the reproductive organogenesis and
function, especially for the contaminated heavily mothers.

- xiv -
Heqing Shen Introduction
- 1 -
1-1: Introduction
1-1-1: Research background
Environmental factors such as smoking, diet, and pollutants play a role in most human diseases.
New molecular evidence indicates that specific people, who are characterized by predisposing
genetic traits, children, or females, may have elevated risk from certain exposures (Perera, 1997).
Therefore, there has been an increasing focus on environmental risk assessment of children
(defined to include humans from conception through organ maturation, i.e. in adolescence) as a
potentially susceptible population (Daston et al., 2004) in recent years. The possibility of these
environmental factors expressed as diseases for boys and girls, such as testicular dysgenesis
syndrome (Skakkebaek et al., 2001) and polycystic ovarian syndrome (Battaglia et al., 2002), have
being concerned. The particular concern of environmental factors is human exposure to the
persistent organic pollutants (POPs), the synthetic chemicals with unique and harmful
characteristics. These long-lived compounds, because of their affinity for body fat, can build up to
very high levels in human body along the food chains. In summary, they are PBTs, the "worst of
the worst" in toxic substances. PBTs are ubiquitous toxicants and everyone has a body burden that
their ancestors never had. Some of them have (had) been widely and extensively used as pesticides
in worldwide with little or no regulatory control, while others are industrial chemicals or
unintended by-products of industrial processes and incineration (Smith et al., 2002).
The exposure to PBTs is a global problem. Firstly, when released into the environment, PBTs can
be transported on air currents to places far from the points of their origin by three stages:
evaporation, transport in the atmosphere and condensation at lower temperatures (Blais et al.,
1998). This phenomenon is so called the "grasshopper effect." Because evaporation is minimal in
colder regions, they tend to build up in arctic and mountain ecosystems. Secondly, ocean currents
and rivers which funnel agricultural runoff and industrial discharges to the ocean are also
important transport pathways. Thirdly, long distance transfer is also possible through animals,
which act as bulk-transfer vectors when they migrate. One of the examples is spawning salmon
Heqing Shen Introduction
- 2 -
dump toxic industrial compounds in Alaskan lakes on their return from the ocean and the amount
of PCBs transported by sockeye salmon to these lakes is greater than the traditional assignment
from atmospheric pathways (Krümmel et al., 2003).
The levels of PBTs tend to be the highest in species at the top of the food chain, such as eagles,
polar bears and killer whales. This is so called biomagnification (Beek, 2000). For example, in
marine ecosystem, contaminant can move from phytoplankton (single-cell micro-organism) to
zooplankton (multicellular organisms), to small fish, to crustaceans and shellfish, and to larger fish
and sea mammals (Smith et al., 2002). Also PBTs can bioaccumulate in human body by
agricultural food chain represented by grass, milk cows, and beef cattle and aquatic food chain
represented by zooplankton, planktivorous fish, and piscivorous fish (Czub et al., 2004) because of
their lipophlic prosperities. The accumulated level of persistent trace chemicals in fish or other
animals can pose a significant ecological risk, also to human health.
Many PBTs are confirmed as EDCs, chemicals that can lead to an increase in birth defects, sexual
abnormalities and reproductive failure, which are suspected to associate with a wide range of
biological effects in the environment on wildlife and human including carcinogenic effects,
reproductive effects, neurological effects and immunological effects (Kavlock et al., 1996).
Sometimes, they are called xenooestrogens because of the oestrogenic activity. Endocrine
disruption refers to the interference of endocrine system function, which transporting information
through the circulation from on tissue to another via chemical messengers or hormones (Witorsch,
2002b). Epidemiological data suggested an increase of disorder of the male reproductive tract in
the last decades and clinical and experimental studies show the exposure of excess of oestrogens
may cause such disorders (Hosie et al., 2000). Although they express only weak oestrogenic
effects, these EDCs can accumulate in human body up to a high level and then pose a risk to
normal hormones’ function.
1-1-2: EXPORED project and the present study
The linking of specific exposures to specific effects in environment would often be difficult

Heqing Shen Introduction
- 3 -
because of the complexities of exposure, the latency of the effects, and the subtle nature of the
outcomes. The confirmation of endocrine disrupting hypothesis will heavily depend on application
of Hill criteria (strength of the association, presence of a dose-response relationship, specificity of
the association, consistency across studies, biological plausibility, and coherence of the evidence)
(Kavlock et al, 1996). Additionally, the potential adverse effects at low-dose or inverted U effects,
the combination effects of mixture EDCs (Payne et al., 2001; Witorsch, 2002ab, Silva et al., 2002)
and the extrapolation of dose in animals to exposure in human ask us pay attention to treat the
exposure outcome relationships in human exposure risk assessment.
As one part of the research project EXPORED, which is concerning of the exposure-outcome
relationships in male urogenital malformation with special reference of EDCs, we investigated
some important organochlorine hydrocarbons and pesticides in mother samples after the delivery
used for the further case-control study. The earlier cohort studies in Denmark and Finland showed
the two countries with different incidences of male urogenital disorders, such as cryptorchidism
and hypospadias (Toppari et al., 1996). The boys with malformations had been diagnosed at birth
and followed up to 18 months together with matched controls. Biological samples had been
systematically collected during these studies for exposure assessment. Comprehensive endocrine
evaluation of the children had also been performed and a large database had been created on the
basis of questionnaires. The aim is to combine these databases with the exposure data of endocrine
disrupters to assess their roles in the formation of male urogenital malformations. The mother
exposure data to PBTs, such as PCDD/Fs, PBDEs, PCBs, phthalates, alkylphenols, bisphenol A
and halogenated hydrocarbons and selected pesticides, will be used to make a risk analysis
combining the other database. It is expected to answer the crucial question: whether any of the
exposures to endocrine disrupters is associated with altered incidence of urogenital malformations.
Our work focus on halogenated hydrocarbons and selected pesticides, some of them have been
identified as potential or might be EDCs (Lyons, 2000), for examples, p, p‘-DDE is a potent
antiandrogen and HeCB induce enzyme that hydroxylate testosterone (Toppari et al., 1996). DDT,
CHL, HC, aldrin, dieldrin, mirex, and HeCB (it is both a pesticide and an industrial byproduct) are
the 7 of the ‘dirty dozen’, which are the first time to seek the worldwide elimination in July 1998
by a negotiating committee of the United Nations Environmental Programme. β-HCH, CHL, DDT,
Heqing Shen Introduction
- 4 -
dieldrin, END, HeCB, lindane, MOC have been identified as potential endocrine disruptors in the
list produced under the auspices of the Oslo and Paris Commissions. Similarly, aldrin, CHL, DDT
(DDE, DDD), MOC, dieldrin, α-HCH, γ-HCH, OXC, HC, HE and mirex are also part of
insecticides listed by World Wide Fund for Nature in the environment reported to have
reproductive an /or endocrine disrupting effects. Some of the pesticides are chiral compounds.
Their paired enantiomers have the same physical and chemical properties. When released, the
transport processes (leaching, volatilization, and atmospheric deposition) and abiotic reactions
(hydrolysis and photolysis) do not affect enantiomeric ratios (ERs). However, their
bioaccumulating, biodegradation processes are usually chiral related processes. Especially, biotic
reactions lead to nonracemic residues and an alteration of the original ERs. Our interest also refers
to enantioselective degradation and accumulation processes of these chiral PBTs in human body
by the detection of their ERs. α-HCH, o, p’-DDT, c-HE are some examples (Bidleman et al. 1999).
This technique could provide a sensitive indicator for biodegradation, bioconcentration, and
transport cross cell membrane, and also might be the clues about the origins of pesticides found in
the samples.

Heqing Shen Prenatal and postnatal exposure to PBTs from mother
- 5 -
1-2: Prenatal and postnatal exposure to PBTs from mother
1-2-1: General trends and some factors affect the levels of PBTs in mother samples
One of the widely used biomarkers for evaluation of human body burden to PBTs is breast milk
since it’s easy collecting, enriching of lipophilic compounds and exposure to suckling infant
(Smith, 1999). The first evolution of human milk for PBTs contamination occur in 1951 when 32
non-occupationally exposed black women were surveyed in Washington, DC, 30 of whom had
detectable levels of DDT with a mean value of 0.13 ppm (Laug et al., 1951). After more than a
decade, many reports have been published on the levels of PBTs in breast milk. DDT
concentrations in human milk have declined in most area of the world, from 5000-10 000 μg
DDT/kg milk fat to around 1000 in 1999 in many areas. Nevertheless, levels can be high in areas
still using DDT, ever higher than the WHO’s recommended limit for infants (Smith, 1999). Also
there is a declined trend for other PBTs such as HCH, dieldrin, CHL and relative compounds, and
PCBs because of the ban or regulating throughout many global areas (Smith, 1999; Waliszewski et
al., 1998; Noren et al., 2000; Solomon et al., 2002). Comparing the change of p, p’-DDE by
reduced consumption of local fish and elevations of mirex from 1986-1992, HeCB showed no
difference at any point due to the ban in Mohawk women milk (Fitzgerald et al. 2001), which
might confirm its continuous release as industry by-products (van Birgelen, 1998). Although a
decline of the time trend of PBTs in human samples, the exposure levels still can be detected
easily because of their persistence.
Two processes, bioaccumulation in adipose tissue and excretion to breast milk, are the result of
PBT levels in milk (Czaja et al. 1997). However, many factors like age of mother, parity, length of
previous lactation and sampling method might affect the investigated levels (Harris et al. 2001).
For example, the predictors of plasma concentrations of DDE and PCBs investigated in a group of
240 USA women showed the most reliable predictors of DDE were age and serum cholesterol, and
the most important predictors of PCBs were age, serum cholesterol, and residence in the Midwest

Heqing Shen Prenatal and postnatal exposure to PBTs from mother
- 6 -
or Northeast (Laden et al., 1999). For general people, diet should be one of the major factors that
influence the exposure levels of PBTs, with patterns in fish consumption playing a particularly
significant role (Solomon et al., 2002). Despite of some negative results (Rauhamaa-Mussalo et al.,
1988), mothers with contaminated fish consumption exhibited a higher level of PBTs (Kostyniak
et al., 1999; Stewart et al., 1999; Laden et al., 1999; Harris et al., 2001). For example, Mohawk
mothers (Fitzgerald et al., 2001), with the greatest estimated local fish consumption, had a
significantly higher geometric mean of p, p’-DDE level in milk than that of the control women,
but no differences in mirex or HCB concentrations. Following the recommendation against the
consumption of local fish by pregnant and nursing Mohawk women, the reduction of p, p'-DDE
levels from 1986 to 1990 in Mohawk women breast milk was found. Great Lakes fish
consumption was also associated with increased blood plasma PCB levels in men and mirex levels
in both men and women. Waterfowl consumption was associated with higher plasma PCB (men
and women), DDE (men only), and mirex levels (men and Cornwall women) (Kearney et al.,
1999). The age of the mothers positively correlated with the PBTs levels (Covaci et al., 2002;
Rauhamaa-Mussalo et al., 1988; Brunetto et al., 1996; Czaja et al., 1997) because of the longer
exposure time and the possible higher daily uptake for the older mothers. Some reports showed
that PCBs and DDE were significantly negatively related to both parity (Nair et al., 1996) and
duration of lactation (Nasir et al., 1998; Kostyniak et al., 1999) and some showed no correlations
(Czaja et al., 1997). It might be due to the correlation studies attributed to the simultaneous
operation of many factors, such as age, number of deliveries, body weight, dietary habits, and
sample collection time (Czaja et al., 1997; Harris et al., 2001). For example, p, p’-DDE in
maternal adipose tissue was positively correlated with p, p’-DDE in cord blood (P = 0.0001) and
breast milk (P<0.0001) and marginally correlated with change in body mass index (BMI) (r =
-0.03088; P = 0.06) (Dorea et al., 2001). Historical and current local use patterns might be another
reason for of the differences.
1-2-2: PBTs incorporate with fetus (infants) from mother via placenta and milk
The very high fasting triglyceride levels (Haggarty, 2002) suggest that maternal body fat has
higher turnover during pregnancy than in the non-pregnant state, with the total lipid increasing in

Heqing Shen Prenatal and postnatal exposure to PBTs from mother
- 7 -
maternal blood from 6.17 to 9.0 g/l (DeKoning et al., 2000). Except the instant nutrition supply to
fetus, the relatively high ratio of milk energy preparation also demands a cycle of energy storage
during pregnancy. In situations of low-energy supply, the stored lipid can be critical for the
establishment of lactation and maintenance of maternal health (McNamara, 1999). All these may
lead to the release of lipophilic contaminants from the adipose tissues into maternal blood in
similar situation with their release into plasma in response to subcutaneous adipocyte basal
lipolysis (Chevrier et al., 2000; Imbeault et al., 2001; Charlier et al., 2002). The release of β-HCH
in response lipolysis of fasting can be in quantities sufficient to stimulate estrogen target uteri of
ovariectomized mice (Bigsby, 1997). Although placenta is a predominantly non-fatty tissue, the
difference of total lipids between cord blood (3.47 g/l serum) and maternal blood (9.0 g/l serum)
(DeKoning et al., 2000) forms a gradient between the two sides of the placenta membrane
resulting in PBT diffusion. For the production of milk, the human body employs approximately
75% of endogenous fats during pregnancy (Waliszewski et al., 1999), which might also result in
the release of PBTs from the adipose tissue stores.
The common materials used to investigate the prenatal exposure to PBTs are maternal blood, cord
blood, placenta, and even amniotic fluid (Foster et al., 2001; 2002). Although not quite clear for
the mechanism, all researches confirmed the transplacental transfer of PBTs. It was suggested
these xenobiotics travel with the lipid components of blood, such as very low density lipoprotein
(VLDL), low density lipoprotein (LDL), high density lipoprotein (HDL), and chylomicron
remnants, and likely gains access the many tissue compartments of the human body by utilizing
the lipoprotein lipase mechanism (Dekoning et al., 2000). For examples, Aroclor 1254 increased
hepatic lipid synthesis, but decreased hepatic production of albumin and apolipoproteins in pigeon
(Borlakoglu et al., 1990a). Mice or Sprague-Dawley rat’s administration and Ah receptor and 4S
protein in vitro incubation suggested 2,3,7,8-TCDD was bound to lipoproteins, which
subsequently underwent rapid and pronounced degradation processing, possibly catalyzed by
lipoprotein lipase, to heavier entities. At the highest doses of xenobiotic administered, an almost
complete disappearance of lipoprotein particles was observed (Souès et al., 1989).
It used to be thought that the placenta created a perfect bulwark against toxic exposure and thus

Heqing Shen Prenatal and postnatal exposure to PBTs from mother
- 8 -
came the term ‘placental barrier’. In fact, the placenta sorts out chemicals primarily on the basis of
molecular weight, electrical charge, and lipid solubility. Small, neutrally charged molecules that
readily dissolve in fat are afforded free passage regardless of their capacity for harm. Although the
early suggestion that placenta restricts the transformation of PBTs to some extent (Eckenhausen et
al., 1981), the followed researches (Saxena et al., 1981; Rosival et al., 1983; Cariati et al., 1983;
Ando et al., 1985) all suggested the transfer of PBTs to fetus through placenta. Most of the results
come from the comparison of PBT levels between maternal substance and placenta or cord blood,
some data involved fetal tissues (Bosse et al., 1996; Waliszewski et al., 2000).
Paired sample analysis, especially using maternal blood vs. cord blood, is in principal a direct
method to test potential transfer of persistent pollutants through the placenta. Many investigations
found the significant correlation of PBTs, such as PCBs, PBBs, HeCB, HCHs and DDT with
related compounds, between paired blood samples (Jacobson et al., 1984; Waliszewski et al., 2000;
Covaci et al., 2002; Dallaire et al., 2004). For example, p, p’-DDE concentrations of the mean
venous blood (7.12 μg /g) and cord blood (6.39 μg /g) were not significantly different, but were
significantly correlated (Dorea et al., 2001). A more recent work showed not only lipophilic PCBs,
but also their more polar metabolites OH-PCBs, can be transfered across the placenta to the fetus
(Soechitram et al., 2004). A more broad list of compounds, from β-HCH, p, p’-DDE, p, p’-DDT,
HeCB, mirex, OXC, trans-nonachlor, PCB 99, 118, 138, 153, 156, 170, 180, 187 and Aroclor 1260
to Parlar 26, 50 and total toxaphene, had been shown to correlate between maternal blood vs. cord
blood samples (Walker et al., 2003). Generally, maternal serum levels were higher than cord serum
levels for PBTs mightily because of higher lipid content (DeKoning et al., 2000) in maternal than
in cord serum.
Apart from maternal blood vs. cord blood, a broad type of maternal-fetus paired samples, such as
placenta vs. serum (Schlebusch et al., 1994), placenta vs. cord blood (Ando et al., 1985) and cord
blood vs. milk (Jacobson et al., 1984; Stewart et al., 1999) had been used to test the PBTs
incorporation to fetus. For example, both cord serum and maternal milk levels of PCBs and PBBs
were examined in relation to maternal serum levels (Jacobson et al., 1984). A significant linear
correlation had been found between the HeCB concentration in placenta and that in cord blood

Heqing Shen Prenatal and postnatal exposure to PBTs from mother
- 9 -
(Ando et al., 1985).
However, the
linear correlations
did not always
exist for all
investigated
compounds. Cord
blood vs. milk
analysis show that
blood PCB
homologues of
light (Cl 1-3) or
moderate (Cl 4-6) chlorination did not correlate with their breast milk homologues, the most
persistent and heavily chlorinated PCB homologues (Cl 7-9) were significantly and positively
correlated with breast milk levels (Stewart et al., 1999). Although no significant correlation
between maternal serum and placental concentrations was observed, the placenta / serum ratios of
HCH isomers, HeCB, total DDT, total PCB with 0.48, 0.99, 0.45, 0.32 show the incorporation of
these PBTs into fetus (Schlebusch et al., 1994). 6 types of tissues (adipose tissue, predelivery
blood, cord blood, placenta, postpartum blood and breast milk of 1 or 2 months after delivery) had
been analyzed to investigate the partitioning of dioxins, dibenzofurans and the dioxin-like
coplanar PCBs. No correlation was found probably because only 5 samples had been included.
However, the mean measured values, PCDD, PCDF and coplanar PCB with 352, 526, 182, 165,
352, 220 pg/g lipid for adipose, pre-blood, placenta, cord blood, post-blood and breast milk, show
after the delivery, the burden levels of blood for all pollutants (or TEQs) are descending (Schecter
et al., 1998). All these findings suggest the existence of a dynamic equilibrium of PBT among
human tissues through blood circuit (Fig.1-2-2 (1)).
Despite of the dynamic equilibrium potential, there might be many factors that affect the
correlation of PBTs between the paired samples. Firstly, PBT distribution might be lipid type
related. Comparing the lean charr (the most tissues and organs had a substantially lower
Fig. 1-2-2 (1): Distribution of PBTs among body through blood circuit (Toxicology: principles and applications, CRC Press)
Heqing Shen Prenatal and postnatal exposure to PBTs from mother
- 10 -
triacylglycerols but only a slightly lower phospholipids and cholesterol) with the fat charr
(Jorgensen, et al., 1997), the tissue concentration of OCS was positively correlated with the
concentration of triacylglycerols and negatively correlated with phospholipids and cholesterol.
The proportion of the total body burden of OCS deposited in extra-adipose tissues was higher in
the lean charr (28%) than in fat charr (4 times higher in brain of the lean charr than in fat charr).
Also the partitioning of PBT pesticides between adipose tissues and serum might relate to the
variation of lipid content in serum due to the association of PBTs with the lipid (lipoproteins)
(Waliszewski et al. 1999). The congener specific distribution of PCBs in plasma fractions is more
complex than can be explained solely by their solubility in the lipid components of plasma
fractions (LDL, HDL and the lipoprotein-poor (predominantly albumin) fractions), and may
suggest a complex association with apolipoproteins and plasma proteins that are important in
transporting PCB to tissues (Borlakoglu et al. 1990b). Also DDT and HCH showed a positive
correlation between paired breast milk and maternal serum while no correlation could be
established either between breast milk and cord serum or maternal serum and cord serum (Nair et
al., 1996). The fasting effect suggested there was different mobility for β-HCH and o, p'-DDT
from fat depots by lipolysis in animals (Bigsby et al., 1997). An altered hormonal status, a
different degree of metabolic activity and an increased deposition of fat in the breast during
pregnancy perhaps favored degradation and selective partitioning of a few metabolites from the
blood serum to the breast. It might explain that the light (Cl 1-3) or moderate (Cl 4-6) chlorinated
PCBs in cord blood did not correlate with their breast milk homologues, the most persistent and
heavily chlorinated PCB homologues (Cl 7-9) were significantly and positively correlated with
breast milk levels (Stewart et al., 1999). The detected α-HCH in the similar level with p, p’-DDE
but could not detected β-HCH in the non-fatty amniotic fluid (Foster et al., 2001; 2002) suggested
the sample status responded to the variation of PBT patterns. The variation of reliability in the
measurement of compound levels (Jacobson et al., 1984) and some other unpredictable factors
might also cause the deviation from the dynamic equilibrium hypothesis.
The children serum levels of PBB, PCB and DDE increasing with months of breast-feeding
(Anderson et al. 2000) indicated breast milk as the main source of these pollutants after the
delivery. The paired analyses of adipose tissue vs. mature milk (colostrums vs. mature milk)

Heqing Shen Prenatal and postnatal exposure to PBTs from mother
- 11 -
indicate a high degree of coherence, principally of total DDT; suggest lactation as a more effective
decontamination means than through placenta (Waliszewski et al., 2001), especially, for
primigravidae mothers (Nair et al., 1996). Other study also reported that breast milk was the main
source of pesticide contamination to the newborn because the levels of maternal serum and cord
serum are nearly equal but much lower than breast milk (Nair et al., 1996). Factually, the lipid
content of the fetal tissue was 0.65% (8-14 week) much less than the amount of usually present in
adults, which is generally from 15 to 30% of the body weight. That means the fetus has low
potential to store PBTs. The estimated body burden of mother (from milk), placenta (lipid content
0.85%) to fetal tissue are 16.7, 10.1 to 5.3 TEQ (ng/kg lipid) for each (Schecter et al., 1996).
Although a lower burden, transplacental exposure might be more relevant with regard to physical
development and cognitive functioning of the child than postnatal exposure via breast milk
(Przyrembel, et al., 2000).
Heqing Shen PBT exposure, EDCs and human reproductive health
- 12 -
1-3: PBT exposure, EDCs and human reproductive health
1-3-1: PBT exposure and human reproductive health
Human health and human disease result from three interactive elements: environmental factors,
individual susceptibility, and age (Perera, 1997). Children’s responses to environmental toxicants
will be affected by toxicokinetic factors (such as their systems absorb, distribute, metabolize, and
excrete chemicals) and toxicodynamic factors (inferred toxic mechanisms and mode of action).
These vary during development, in utero where maternal and placental processes play a major role,
to the neonate in which emerging metabolism and clearance pathways are key determinants
(Ginsberg et al., 2003; Daston et al., 2004).
Scientifically sound documents underpin that environmental chemicals are capable of acting as
endocrine disrupters in laboratory. However, clinical data linking the environmental exposure
levels and the present human adverse reproductive outcomes, such as early pregnancy loss, birth
defects, reduced birth weight, and altered functional development is limited (Feldman, 1997;
Johnson et al., 2000). The scientific community awaits further epidemiological assessment.
However, one of the major limitations in environmental studies is the use of crude exposure
quantification. Surrogate exposure measures, such as time living in a contaminated area (Dolk et
al., 1998), do not adequately reflect the true nature and / or degree of real exposure to the chemical
substance(s) of interest. Also, as they are no quantitative measures of absorbed dose, the data
cannot supply numerical measures of a dose response relationship, limiting their use in
quantitative risk assessment (Sim, 2002). On the other hand, people exposed to many pollutants,
which have been documented to be EDCs, and surrogated measure might not reflect the real
xenoentrogenic exposure personally. Additional testing systems are therefore required to screen
for estrogenicity and to identify appropriate biomarkers of human exposure (Rivas et al., 2001).
The time of sample collection is also important because of the possible transient chemical
exposure and the sensitive period of reproduction organ development (Kelce et al., 1997; Sultan et
al., 2001). For example, by evaluating the incidence rates of acute infections with prenatal

Heqing Shen PBT exposure, EDCs and human reproductive health
13
exposure to PCBs and DDE, the researchers suggested that there is a possible association between
prenatal exposure and not postnatal exposure to these compounds and the acute infections in early
life in the investigated Inuit population (Dallaire et al., 2004). The association between PBTs and
the higher levels of total IgE in newborns (with higher allergic sensitization) supported the higher
incidence rate of atopic eczema cases in the industrial region (Reichrtová et al., 1999).
Two large outbreaks of PCB poisoning occurred in Asia showed that women pregnant at or after
the exposures had children who were developmentally impaired (Tilson et al., 1990). Women’s
occupational exposure can affect hormone level and might suggest the direct reproductive
endocrine disrupting action to fetus during pregnancy, for instance exposure to aliphatic
hydrocarbon correlated with lower preovulatory luteinizing (Reutman et al., 2002). The lifetime
exposure to PCBs of maternal but not paternal by consumption of contaminated fish may reduce
fecundability among couples attempting pregnancy (Buck et al., 2000). However, TCDD is
unlikely to increase the risk of low birth weight or preterm delivery through a paternal mechanism
(Lawson et al., 2004). These might suggest maternal exposure is more crucial to children health.
But the recent report referred paternal exposures as potential factor of cryptorchidism (Pierik et al.,
2004). Also based on self-reported parental pesticide application, an increased risk of cancer was
supported among children whose fathers did not use chemically resistant gloves compared with
children whose fathers used gloves (Flower et al., 2004).
Many paediatric diseases have been suspected with the environmental factors. Children exposed
transplacentally to PCBs’ levels considered to be background have hypotonia and hyporeflexia at
birth, delay in psychomotor development at 6 and 12 months, and poorer visual recognition
memory at 7 months in the USA (Tilson et al., 1990). The general PCB exposure, measured by
both contaminated fish consumption and cord serum PCB levels examined during the immediate
postpartum period, had been shown to predicate lower birth weight and smaller head
circumference (Fein et al., 1984). However, another report (Gladen et al., 2004) showed that the
exposure to p, p'-DDE is correlated with the increase of height and weight in adolescent boys. The
recent epidemiological risks based on biological measures (chemical analysis combined with
bioassay) showed that the moderate exposure of polychlorinated aromatic hydrocarbons (PCB 138,

Heqing Shen PBT exposure, EDCs and human reproductive health
- 14 -
153, and 180 level in serum and dioxin-like compounds by chemically activated luciferase
expression assay) might interfere with sexual maturation and in the long run adversely affect
human reproduction (Den Hond et al., 2002). Case-control investigation of 117 male
schoolchildren (10–19 years of age) lived in a more than 20 years END aerially sprayed region
found that sexual maturity rating (scoring for development of pubic hair, testes, penis, and serum
testosterone level) was negatively related to aerial exposure to END (using serum END levels) and
serum luteinizing hormone levels were significantly positively related to serum END levels after
controlling for age. Further they suggested that the prevalence of congenital abnormalities related
to testicular descent among study and controls subjects was 5.1% and 1.1%, respectively, might
(not significantly) correlate the long-term END exposure (Saiyed et al., 2003). Although only the
concentration on lipid basis of cis-nonachlordane was significantly increased in testicular cancer
cases, the case mothers showed significantly increased concentrations of the sum of 38 PCB
congeners, HeCB, trans- and cis-nonachlordane, and the sum of CHLs (61 cases 58 age-matched
controls) (Hardell et al., 2003). Recent case-control study based on the interview information
(pregnancy aspects and personal characteristics, lifestyle, occupation, and dietary phyto-oestrogen
intake of both parents) showed, apart from small-for-gestational age for hypospadias, and preterm
birth for cryptorchidism, paternal pesticide exposure was significantly associated with
cryptorchidism and paternal smoking was associated with hypospadias in male offspring (Pierik et
al., 2004). However, to reach the dose-outcome relation of EDCs exposure with adverse effects
like in lab (Ulrich et al., 2000) might need more detailed information including multiple routes of
exposure; the timing, frequency, and duration of exposure; need for qualitative and quantitative
data; sample collection and storage protocols; and the selection and documentation of analytic
methods (Rice et al., 2003).
1-3-2: Debate on risk assessment of PBTs as EDCs:
PBTs acting as endocrine disruptors is harmful to human health is still hypothetical since no data
yet proving a causal relationship. The critical argument is that humans are exposed to relatively
higher levels of natural EDCs than xeno-EDCs (Safe 1995). Species-specific estrogenic action is
another concern (Spearow et al., 1999; Witorsch, 2002b) of the extrapolation of animal data to
Heqing Shen PBT exposure, EDCs and human reproductive health
15
human. However, research need progress and deepen because the environmental mixed EDCs
might interact additively, antagonistically, or synergistically; very little information of the effects
of their metabolism, serum and intracellular protein binding and uptake by target cell is known
(Safe et al., 1997); there are more than one agonists/antagonists endocrine response pathway
(McLachlan, 2001; Cooper et al., 1997; Bulayeva et al., 2004, Fig. 1-3-2 (1), (2)); the other gene
toxicity of PBTs might produce ‘cross-talk’ to the estrogenic receptor activity (for example,
Ah-AhR-ARNT complex (aryl hydrocarbons, Ah receptor and AhR nuclear locator) bound to
dioxin-response element, which locate close to EREs) (Witorsch, 2002b); small molecular
structural difference, such as different PCB congeners (Tabb et al., 2004), even enantiomeric
difference can appear to be the factors in hormonal activity.
Feldman (1997) have colleted the further attentions to PBTs: species-specific effects (Spearow et
al., 1999) have raised the concern to the genetic susceptibility of subpopulations and
tissue-specific effects (Ishihara et al., 2003) resulted the question of calculation of estrogenic
potency based on breast or uterus models, which may not be quantitatively predictive of effects in
other tissues such as the liver, bone, or brain or in the developing fetus that may be more sensitive
to hormonal influences; pharmacokinetic or other in vivo factors, such as the inadequate
metabolism of PBTs to more active analogs and their accumulation and storage in fat causing an
increased or prolonged exposure, may cause the estrogenic effect to be greater than expected based
solely on extrapolations from in vitro data. Additionally, compared to E2 with a higher affinity
with serum protein, certain xeno-EDCs, namely diethylstilbestrol, o, p’-DDT, and octylphenol,
may be more potent estrogen in vivo because of their bioavailability (Chen et al., 1997).

Heqing Shen PBT exposure, EDCs and human reproductive health
- 16 -
Fig. 1-3-2(1): Most of the known environmental chemicals with hormonal activity derive that activity through interaction with one or more of steroid / thyroid / retinoid gene family of nuclear receptors. Abbreviations used are: TR, thyroid hormone receptor; RAR, retinoid receptor; VDR, vitamin D receptor; SXR, steroid xenobiotic receptor; ER, estrogen receptor; ERR, estrogen-related receptor; GR, glucocorticoid receptor; MR, mineralocorticoid receptor; PR, progesterone receptor; AR, androgen receptor; RXR, retinoid orphan receptor; ERγ (recently been reported) (McLachlan JA, 2001).
PH
PH
PK
PK
prote in mRNA
DNA SHR SH SH
SRE
storage granule
stero idogenesis
release
Ca++
2
5
3
4
1
Fig. 1-3-2(2): Multiple pathways of EDCs: (1) The better-studied steroid hormone receptor-mediated gene pathway changes in protein synthesis and /or mitosis (e.g. weak estrogen methoxychlor or anti-androgen DDE). Some of the other include (2) compounds that interfere with membrane receptor binding (e.g. chlordimeform, an α-noradrenergic receptor blocker), (3) steroidogenesis (i.e. certain imidazole compounds) or (4) compounds that interfere with the synthesis of other hormones (e.g. dithiocarbamates disrupt adrenalin synthesis) and (5) compounds that alter the flux of ions across the membrane (e.g. pyrethroid insecticides alter sodium and chloride ion flux and metals compete for normal calcium ion flux) within certain types of hormone-secreting cells. SH = steroid hormone in blood or cytoplasm, PH = peptide hormone, R = steroid hormone receptor, SRE = steroid response element, PK = protein kinase (Cooper RL et al. 1997).
1-3-3: Human exposure characters to EDCs
Ambient endocrine disrupters: The endocrine disrupting action mode of PBTs has been

Heqing Shen PBT exposure, EDCs and human reproductive health
17
suspected to associate with the wide range of human health effects (Kavlock et al., 1996).
Factually, EDCs range from natural plant oestrogens (e.g. genistein, coumesterol) and
mycoestrogens (e.g. aflatoxins, zearalenone) to growth promoting pharmaceuticals (e.g.
trenbolone acetate, melengastrol acetate) to chemicals spread in water, sewage sludge or the
atmosphere such as detergents and surfactants (e.g. octylphenol, nonylphenol), plastics (e.g.
bisphenol A (BPA), phthalates), pesticides (e.g. methoxychlor, dieldrin, DDT) and industrial
chemicals (e.g. PCB, TCDD) (Torres, 2002). The various environmental chemicals are capable of
acting as endocrine disrupters as either hormone agonists or antagonists, which can potentially
alter the hormonal balance in animals and people. However, controversy of the adverse effects on
human health still remains (Feldman, 1997).
Low-dose effects: Beyond the traditional threshold model (assumes the threshold dose as no
observed adverse effect level) and linear non-threshold model (extrapolates risks to very low doses
of adverse effect), especially the later, as the dose below the standard threshold, the response
becomes more likely to exceed the control value, so called hormetic-like. Hormesis (Calabrese et
al., 2003ab) has been defined as a dose-response relationship in which there is a stimulatory
response at low doses, but an inhibitory response at high doses, resulting in a U- or inverted
U-shaped dose response, which is also called low-dose effect (Kaiser, 2000). Sex differentiation
period is sensitive to low-dose chemical effects and the exposure might be transient, the effects are
irreversible and not easy discovered until after puberty (Kelce et al., 1997). For example, utero
exposure of mice shown the low-dose stimulating responses to diethylstilbestrol and estradiol
(vom Saal et al., 1997), and the effects are organ and strain specific, transient and not sustained
into adulthood for natural estrogens (Putz et al., 2001). In vitro research has shown that EDCs, like
coumestrol, endosulfan, dieldrin, DDE and p-nonylphenol produced rapid (3–30 min after
application), concentration (10–14–10–8 M)-dependent ERK-1/2 phosphorylation but with distinctly
different activation patterns. But BPA does not exhibit phosphorylation. These actions may help to
explain the distinct abilities of EDCs to disrupt reproductive functions at low concentrations via
multiple membrane-initiated signaling pathways (Bulayeva et al., 2004). Although the low-dose
effects was argued to appear unlikely during human pregnancy because of the species differences
(particularly higher estrogen levels attained in human pregnancy compared to the mouse)

Heqing Shen PBT exposure, EDCs and human reproductive health
- 18 -
(Witorsch, 2002), low levels of POPs exposure have raise concerns for future generations. For
example, levels of PCBs now shown to affect human brain development are nearly one
million-fold lower than levels previously believed safe (Solomon et al., 2002).
Combined effects: As Daughton (EPA in Las Vegas) said: no organism is ever exposed to a single
chemical in isolation; the individual compounds are just part of the story and the biggest unknown
right now is interactions. It is necessary to consider the impact of combined effects, which are
commonly assessed in terms of synergism, additivity, or antagonism by comparing of the observed
response with the usually expected one (Payne, 2001). Many reports have focus on the mixture
EDC activities. For examples, pig immature cumulus-oocyte complex exposed to EDC mixture,
which mimic contaminants of the Arctic marine food chain and the highly exposed populations of
women, supported the concerns that such pollutants harm reproductive health in human and other
mammalian species (Campagna et al., 2001). The extracts of air, subsurface soil, and superficial
dust from a landfill, was used to examine multiple biological responses by a 2-day prepubertal
female rat bioassay, where soil, dust, and air extracts effectively reduced serum total thyroxine (T4)
with similar dose-response relationships, despite the significantly different TCDD toxic equivalent
(TEQ) values of these three extracts (Li et al., 1996).
Additivity: Many reports support that mixtures of EDCs at doses that are individually inactive can
give active response. For example, the mixtures has been reported at doses that are individually
inactive in the immature rat uterotrophic assay, can give an uterotrophic response (Tinwell et al.,
2004). The additive effect of o, p’-DDT, p, p’-DDE, β-HCH, and p, p’-DDT acted together on
MCF-7 cells could be predicted on the basis of data about single agent concentration–response
relationships (Payne et al., 2001). Similar results have been reported on hydroxylated PCBs,
benzophenones, parabenes, BPA, and genistein mixture using a recombinant yeast estrogen screen
(Silva et al., 2002) and on estradiol-17β and ethynylestradiol-17α mixture (equi-potent fixed-ratio)
using vitellogenin induction in a 14-day in vivo juvenile rainbow trout screening assay (Thorpe et
al., 2003). Based on the pharmacologically well-founded models of concentration addition and
independent action, the contribution of BPA or o, p'-DDT to the overall mixture effect combined
with 17ß-estradiol (E2) was tested using yeast estrogen screen (Rajapakse et al., 2001). At molar

Heqing Shen PBT exposure, EDCs and human reproductive health
19
mixture ratios proportional to the levels normally found in human tissues (i.e., below 1:5000 of E2:
BPA or o, p'-DDT), the effects of individual xenoestrogens are too weak to create an impact on the
actions of steroidal hormones; however, at mixture ratios more in favor of the xenoestrogens
(1:20,000 and 1:100,000 for E2: BPA or o, p'-DDT), a significant contribution to the overall
mixture effect was predicted and the predictions were tested experimentally. The researchers
suggest that the assumption that weak xenoestrogens are generally unable to create an impact upon
the already strong effects of endogenous steroidal estrogens (Safe, 1995) is not supported.
Synergism: When screened in a simple yeast estrogen system (YES) containing human estrogen
receptor (hER), combinations of two weak environmental estrogens, such as dieldrin, endosulfan,
or toxaphene, were 1000 times as potent in hER-mediated transactivation as any chemical alone.
Hydroxylated PCBs shown previously to synergistically alter sexual development in turtles also
synergized in the YES (Arnold et al., 1996). After this report, at least five teams using the same
chemicals in 10 standard endocrine test systems to look for the synergy and only additive in every
case (Kaiser, 1997), for instances, estrogenic activity of a dieldrin / toxaphene mixture in the
mouse uterus, MCF-7 human breast cancer cells, and yeast-based estrogen receptor assays
(Ramamoorthy et al., 1997). Other kinds of EDCs, from the representative alkylphenols and
phthalates, the pesticides dieldrin and toxaphene, to the mycoestrogen zearalenone and the
phytoestrogen genistein, interacted with three major teleost steroid-binding sites (estradiol
receptor (ER), testosterone receptor (TR) and cortisol receptor (CR)) was evaluated. These
compounds are exclusively estrogenic in rainbow trout, albeit weakly so, and do not display any
synergistic effects (Knudsen et al., 1999). However, curcumin and genistein, which inhibit the
growth of estrogen-positive human breast MCF-7 cells induced individually or by a mixture of the
pesticides END, DDT and chlorease or 17-beta estradiol when present at micromolar
concentrations, can synergistically inhibit the induction was noted (Verma et al., 1997). Although
most of the negative results in endocrine disruption toxicity, synergism can be found in other toxic
tests or exposure reports, such as induced EROD activities (Borlakoglu et al., 1992; Basu et al.,
2001). Further reports might refer the synergistic effects by testing manufactured gas plant-PAHs
mixture in vitro test (Chaloupka et al., 1993) and by epidemiological investigating of combined
exposure of high environmental tobacco smoke (plasma cotinine) and PAHs (using BaP-DNA

Heqing Shen PBT exposure, EDCs and human reproductive health
- 20 -
adducts as a molecular dosimeter) (Perera et al., 2004).
Antagonism: A recent report (Rajapakse et al., 2004) on combined effect of 17 β-estradiol,
17α-ethinylestradiol, genistein, BPA, 4-nonylphenol, and 4-tert-octylphenol using MCF-7 human
breast cancer cells by E-SCREEN fell short of the additivity expectations because of the weak
antagonism when the presence of 4-nonylphenol and 4- tertoctylphenol in mixture. It implies that,
in sometimes, some interactions might compromise the predictability of estrogenic combination
effects. Due to the inappropriate of the simple addition activities, methodology, it is suggested that
isobole analysis is only suitable for 2- or 3-component mixtures, and concentration addition
requires access to dose response data and EC50 values for the individual components of the
mixture (Tinwell et al. 2004).

Heqing Shen Enantiomeric ratio information of c-PBT residuals in biota
- 21 -
1-4: Enantiomeric ratio information of c-PBT residuals in biota
1-4-1: Chiral PBTs in biota samples
When racemic chiral PBTs (c-PBTs) entered the environment, enantioselective biodegradation
might occur in water, soil (sediment) (Falconer et al., 1995; Pakdeesusuk et al., 2003; Robson et
al., 2004) and their enantiomeric ratios (ERs), which have been widely used as tracers of air-soil
transportation process (Bidleman et al., 1998; Hühnerfuss, 2000; Robson et al., 2004), could tell
the processes information. Following review would focus on chiral transformation in biota,
especially, in animals.
Enantioselective Residuals: The enantioselective biotransformations of c-PBTs have been well
documented in aquatic biota. Early studies showed the ER and the correlation between the ERs
and the concentrations of α-HCH and γ-HCH, respectively, could characterize the different
microbiological degradation pathways in the North Sea (Faller et al., 1991). Different enzymatic
characters were also revealed in different marine animals from the liver of Common eider ducks,
the liver of flounders, blue mussels, and even the North Sea water in German Bight by ERs
(Pfaffenberger et al., 1992). Additionally, enzyme activity might be affected by health status
(Mössner et al., 1992). The other c-PBTs, such as OXC, c-HE in Baltic herring, Baltic salmon,
Baltic seal even in human adipose tissue (Buser et al., 1992), c, t-CHL, o, p’-DDT, o, p’-DDD in
cod liver oils and fish oils (Koske et al., 1999) had been observed. Except 2 brain samples, all
organs showed that (-)-α-HCH was enantioenriched in pork (Covaci et al., 2004). In human
samples (Chu et al., 2003), the racemic α-HCH was found in three liver samples, while chiral
PCB95, 149, and 132 showed racemic or nearly racemic in muscle, kidney, and brain and the
higher ERs for the three chiral PCBs were found in liver samples. Recent researches have paid
more attention on the metabolites of PBTs, including some chiral metabolites, which formed from
chiral of prochiral parental compounds. For example, the methyl sulfonyl (MeSO2-) substituted of
PCBs and DDE, they are also persistent and bioaccumulation like their parents and might be more

Heqing Shen Enantiomeric ratio information of c-PBT residuals in biota
- 22 -
toxic. The preferential formation one atropisomer of certain chiral MeSO2-PCB have been
observed in animals, such as arctic ringed seal and polar bear (Wiberg et al., 1998), harbor
porpoises (Chu et al., 2003) and grey seal (Larsson et al., 2004). In grey seals, all of the
investigated metabolites found in significantly higher concentrations in the liver than in lung and
blubber and the equal enantiomeric specificity for chiral metabolites in all tissues (Larsson et al.,
2004) might suggest their formation in liver and redistribution among the other tissues.
ER as tracer of biotransformation in biota: The investigations in the polar bear food chain
(arctic cod-ringed seal-polar bear) (Wiberg et al., 2000) and Lake Superior aquatic food web
(Wong et al., 2004) suggested ERs might be magnified through predator-prey relationships with
the increasing enzyme activity along the trophic levels. In the Lake Superior aquatic food web,
chiral PCBs (91, 95, 136, 149, 174, 176, and 183) showed no biotransformation potential in
phytoplankton and zooplankton (low trophic level organisms); macrozooplankton (diporeia and
mysids) might stereoselectively metabolize them or, alternatively, obtained their nonracemic
residues from feeding on organic-rich suspended particles and sediments; forage fish (lake herring,
rainbow smelt, and slimy sculpin) and lake trout suggested a combination of both in vivo
biotransformation and uptake of nonracemic residues from prey because of the widely nonracemic
PCB residues (Wong et al., 2004). In polar bear food chain, cod showed near-racemic mixtures for
α-HCH and CHL related compounds and, in contrast, ringed seal and polar bear were frequently
nonracemic. Along the food chain, (+)-α-HCH became more abundant relative to (-)-α-HCH
(Wiberg et al., 2000). The first order kinetic depuration rate models have been used to calculate
the relative half-life time (Walter et al., 2001) and minimum biotransformation rates (Wong et al.,
2002; 2004). The metabolic elimination rates calculation suggested that at least 58% of the t-CHL
and the entire PCB-136 depuration rate could be attributed to metabolism in Rainbow Trout
(Wong et al., 2002) and minimum biotransformation rates (calculated from enantiomer mass
balances between predators and prey) suggested that significant biotransformation might occur for
PCB congeners over the lifespan of trout and sculpins (Wong et al., 2004). Chiral
biomagnification factor (relative to CB-153) analysis in polar bear food chain indicated that OXC
might be formed by ringed seal and metabolised by polar bears and the linear relationships of ERs
of some highly recalcitrant CHLs in polar bear adipose with the bears’ age (Wiberg et al., 2000)

Heqing Shen Enantiomeric ratio information of c-PBT residuals in biota
- 23 -
might suggest a continuous feeding and enantioselective depuration mode. Relationships between
ER of PCB95 with 1/ER of PCB132 and ER of PCB149 with of 1/ER 132 suggest that the
bioselective metabolism of chiral PCBs has the same trend in human, although the ratio is
different (Chu et al., 2003). Additionally, multivariate statistical methods revealed the ERs were
good indexes of sample groupings in response of the enzyme activity (Wiberg et al., 2000).
1-4-2: Chiral and prochiral PBTs and endocrine disruption activity
A pair of enantiomer molecules, with the same chemical composition, is asymmetrical in the
arrangement of their carbon atoms or in energy barrier to ring rotation like in some PCBs or
metabolite (Nezel et al., 1997) and would be different to them in terms of the orientation of
elements in space. It has been shown that this kind of difference can definitely cause different
endocrine activity. Binding and transactivation tests on the mutational ligand-binding domain of
ER (estrogen receptor) (Kohno et al., 1996) and on the different receptors such as ERα, ERβ or
AR (Gaido et al., 2000) showed the ligand-receptor binding and transactivation were
stereochemically specific. For example, yeast-based assay assess the isomer-specific
transcriptional activity of o, p'-DDT with the human estrogen receptor (hER) showed (similar in
rat), the (-)-isomer was the active estrogen mimic whereas hER activity of (+)-o, p'-DDT was
negligible (Hoekstra et al., 2001). The other aspect of the bioaccumulation EDCs is that most of
them exhibit very week EDC but their metabolites, sometimes, have stronger transactivation, such
as the in vivo estrogenic activity of methoxychlor is mainly caused by metabolism to phenolic
estrogenic metabolites (Gaido et al., 2000). Some of the metabolites are chiral compounds, such as
mono-OH-MOC. (S)-mono-OH-MOC showed 3-fold higher binding activity than that of the
(R)-isomer. The result also pointed out the estrogenic activity of MOC after metabolic activation
in vivo, which predominantly produced the (S)-mono-OH-MOC, might be higher than estimated
from the in vitro activity of racemic mixtures (Miyashita et al., 2004).
Compounds like MOC are referred to prochiral compounds because they can be usually
metabolized enantiomeric selectivity in biota (Hu et al., 2002). Dieldrin can also be mainly (86%)
metabolized to one of the two 6,7-trans-hydroxy-dihydro-aldrin enantiomers in rabbits (Korte et

Heqing Shen Enantiomeric ratio information of c-PBT residuals in biota
- 24 -
al., 1965). Also styrene, an industrial solvent, is mainly oxidized by cytochrome P450 to an
electrophilic, chiral epoxide metabolite styrene-7,8-oxide and the R- and S-isomers with different
cytotoxic and genotoxic properties (Wenker et al., 2000). Then, the additional endocrine disrupting
effect is complex for the PBTs because they store in fat tissue and can be metabolized slowly and
continuously in vivo to produce more or less bioactive compounds usually with apparent different
effects than the parent compounds tested in vitro. Enantioselective residual or formation analysis
for c-PBTs could be helpful in exposure-health risk assessment. However, it is little knowledge
about the level and toxicity of the PBT metabolites in vivo.

Heqing Shen Sampling and analysis
- 25 -
2-1: Sampling and analysis
2-1-1: Sample collection information:
The study was approved by the local ethics committee and conducted according to the Helsinki II
declaration. Mothers gave a written informed consent and allowed placentas and milk to be used
for chemical analyses. 112 placenta samples were collected at Turku University Central Hospital
in Turku, Finland, during the years 1997-01 and 168 placenta samples at University Department of
Growth and Reproduction, Rigshospitalet, Copenhagen, Denmark. Only male children of Finnish
families (both parents had to be born and raised in Finland, with a maximum stay abroad of three
years for the mother and 10 years for the father and grandparents) were included in the study.
Case-control information was listed in Table 2-1-1 (1).
Table 2-1-1 (1): Methodological information of breast milk and placenta used for case-control
study Index cases Matched controls Additional reference
Placenta 43 79 265 DenmarkMilk 57
87 117
165117
Placenta 104 169 Finland Milk 54
12890
215
Midwives collected placentas at birth and froze them in LD-polythene bags in –20 oC. The
protocol of placenta and breast milk preparation was from Dr. Hannu, Kuopio, Finland.
Homogenization and samples analysis for controls and cases from both countries were run in
random order and during approximately the same time periods to avoid systematic errors from
technical changes. When defrosted, every placenta was mechanically homogenized, shared in
small glass bottles (Neolab scintillation tubes 20 ml, code: 9-0621) and stored in –20 oC until
analyses.
Collected milk samples (FM weeks 4-6 and DM 4-12 weeks post partum) with more than 150 mL
were primarily to select (65 samples from Denmark and 65 from Finland). But in order to get
enough case samples it can be necessary to choose few samples around 125 mL. The protocol of

Heqing Shen Sampling and analysis
- 26 -
milk preparation was following: 1. Open the cork/cap/stopper of the frozen bottle. 2. Place the
bottle in a "minigrip" pack or suchlike (other glass) in order to avoid possible loss of sample if
bottle will break during defrosting. 3. Defrost the bottle in a fridge. 4. Temperate the bottle to
room temperature after thawing. 5. Shake/mix the sample at 38-40 oC for 1 hour 6. Close the
cork/cap/stopper of the bottle and shake vigorously. 7. Aliquot the sample 8. Freeze the aliquots as
soon as possible and send them to other laboratories on dry ice.
2 × 10 g placenta and 2 × 10 mL milk sub-samples, sealed in scintillation glass with aluminium
padded cap, was accepted by IÖC, GSF in München for analysis. When starting analysis, a pooled
control sample of placenta and milk (1-2 L) have been provided by Copenhagen to establish the
sample preparation procedure.
2-1-2: Sample preparation method:
The standard operation procedure was modified to suit the placenta and breast milk. The modified
procedure is based on a cold-extraction method including gel permeation chromatography (GPC)
and small sandwich column or cartridge cleanup to remove the lipids from the wet placenta
samples for HRGC-HRMS analysis of selected halogenated hydrocarbons by isotope dilution
method (Körner, 1996).
Materials: A whole deep frozen placenta (laboratory code 0202027) was frosted in a refrigerator
and homogenized using automatic mill. The homogenized sub-sample are packed in sealed glass
bottles and stored under –190 oC. These are the samples used to modify SOP for sample
preparation. Solid materials are anhydrous sodium sulfate (Water corporation), sea sand
(Riedel-de Haen), basic alumina (ICN Biomedical GmbH), silica gel and florisil (Promochem).
Anhydrous sodium sulfate, sea sand, silica gel and florisil are heated at 650°C at least 6 hours for
removing the possible pesticide residues and / or activation. Heating alumina B at high
temperature is also important for the recovery of endosulfan and dieldrin at our experimental
conditions. Solvents are acetone, n-hexane, toluene and benzene, which are all from Promochem
with picograde quality. The standard compounds, including isotope labeled standard and native

Heqing Shen Sampling and analysis
- 27 -
compounds, are listed in Table 2-1-2 (1), special chiral standard compounds listed in Table 2-1-2
(2).
Table 2-1-2 (1): The listed isotope internal standards and native standards with method recovery
No. Native Compounds 13C Internal Standard Recovery (%) Other Information
1 α-HCH α-HCH 69 Cambridge isotope lab, Inc.
2 γ-HCH γ-HCH 71
3 β-HCH β-HCH 66
4 δ-HCH δ-HCH 81 Cambridge isotope lab, Inc.
5 ε-HCH - - No label standard
6 Endosulfan-I Endosulfan-I 68 Cambridge isotope lab, Inc.
7 Endosulfan-II Endosulfan-II 75 Cambridge isotope lab, Inc.
8 Methoxychlor Methoxychlor 119 Cambridge isotope lab, Inc.
9 o, p'-DDE o, p'-DDE 68 Cambridge isotope lab, Inc.
10 o, p'-DDT o, p'-DDT 93 Dr. Ehrenstorfer GmbH
11 o, p'-DDD -
12 p, p'-DDD p, p'-DDD 70 Cambridge isotope lab, Inc.
13 p, p'-DDE p, p'-DDE 66
14 p, p'-DDT p ,p'-DDT 73
15 Pentachlorbenzene Pentachlorbenzene 51
16 Hexachlorbenzene Hexachlorbenzene 61
17 Pentachloroanisole Pentachloroanisole 63 Dr. Ehrenstorfer GmbH
18 Aldrin Aldrin 64 Cambridge isotope lab, Inc.
19 Dieldrin Dieldrin 71 Cambridge isotope lab, Inc.
20 Oxychlordane Oxychlordane 65 Cambridge isotope lab, Inc.
21 trans- Chlordane trans- Chlordane 56 Cambridge isotope lab, Inc.
22 cis-Chlordane - - No label standard
23 cis-Heptachloroepoxide cis-Heptachloroepoxide 72 Cambridge isotope lab, Inc.
24 trans-Heptachloroepoxide -
25 Heptachlor Heptachlor 79 Cambridge isotope lab, Inc.
26 Mirex Mirex 71 Cambridge isotope lab, Inc.
27 Octachlorstyrene Octachlorstyrene Cambridge isotope lab, Inc.
28 PBB-1 13C-PCB Mixture* No label standard
29 PBB-3 13C-PCB Mixture* No label standard
30 PBB-4 13C-PCB Mixture* No label standard
31 PBB-15 13C-PCB Mixture* No label standard
32 PBB-18 13C-PCB Mixture* No label standard
33 PBB-31 13C-PCB Mixture* 88 of 13C-PCB-28 No label standard
34 PBB-37 13C-PCB Mixture* No label standard
35 PBB-49 13C-PCB Mixture* No label standard
36 PBB-52 13C-PCB Mixture* No label standard

Heqing Shen Sampling and analysis
- 28 -
37 PBB-77 13C-PCB Mixture* No label standard
38 PBB-80 13C-PCB Mixture* No label standard
39 PBB-101 13C-PCB Mixture* No label standard
40 PBB-103 13C-PCB Mixture* No label standard
41 PBB-153 13C-PCB Mixture* 78 of 13C-PCB-153 No label standard
42 PBB-155 13C-PCB Mixture* No label standard
43 PBB-169 13C-PCB Mixture* No label standard
44 PBB-209 13C-PCB Mixture* No label standard
45 Hexabromobenzene hexa-Chlorbenzene* No label standard
Table 2-1-2 (2): Native standards of purity enantiomers (from Dr. Ehrenstorfer GmbH)
Compound Purity (+)-Impurity Org. Con. (mg/l)
(-)-α-HCH 99% 1% 1 (-)-oxychlordane 71.4% 28.6% 1
(-)-cis-heptachlorepoxide 99.4% 0.6% 1 (-)-trans-heptachlorepoxide 91.6% 8.4% 1
(-)-cis-chlordane 85.8% 15.3% 1 (-)-trans-chlordane 99.2% 0.99% 1
(-)-heptachlor 82.6% 17.4% 1 Compound Purity (-)-Impurity Org. Con. (mg/l)
(+)-α-HCH 99% 1% 1 (+)-oxychlordane 71.4% 28.6% 1
(+)-cis-heptachlorepoxide 97.3% 2.7% 1 (+)-trans-heptachlorepoxide 80.5% 19.5% 1
(+)-cis-chlordane 75.2% 24.8% 1 (+)-trans-chlordane 92.6% 1
(+)-heptachlor 75.6% 24.4% 1 (±)-o, p’-DDT(13C) 91.0% 100
Extraction: The extract glass column (25 × 2 cm) is packed with 10 g placenta, which is
homogenized with about 30 g anhydrous sodium sulfate and 15 g sea sand. The packed column is
spiked on its top with 10 μl internal standard 13C-CKW (Cambridge isotope lab, Inc. and Dr.
Ehrenstorfer GmbH, there are no labeled standards for ε-HCH, o, p'-DDD, cis-chlordane,
trans-heptachlor epoxide and octachlorostyrene). The extracting solvent is a mixture acetone and
n-hexane (2:1 v/v) of 250 ml. The elute flow was controlled in mediate drops but not in flow (~2
drops/min) and collected in a carefully weighted (using analysis-grade balance) 250 mL round
bottom flask. This extraction process may be arranged overnight.

Heqing Shen Sampling and analysis
- 29 -
Lipid determination: Evaporate the solvent by rotary vacuum evaporator with a water-bath
temperature up to 45ºC and a mediate rotary rate; the vacuum was controlled around 600 mbar.
When the extract was condensed to about 0.5 ml, removed the round bottom flask from the
evaporator and then evaporated it to hemi-dry with very mediate stream of nitrogen. After that, the
flask was placed for 6 hours into a desiccator until stable weight was achieved (i.e. error of two
separate weight measurements over at least two hours ±0.0005g). The lipid content was calculated
on the base of wet weight sample. Like the organic solvent, dry lipids also can keep the
chlorinated organic compounds. So the lipid residue could be used for further compound analysis
and the results show that the recovery is sound (Table 2-1-2 (1)). The use of lipid residue after
lipid determination can save the extraction step for analysis of the chlorinated organic compounds.
After recording of the lipid data, the lipid residue was redissolved using 2 mL toluene and sealed
and kept at –28 oC for cleanup.
Cleanup procedure: The first cleanup step was done on a GPC column. It is a 1.27 × 95 cm
column packed with Bio-Beads S-8, spherical porous styrene-divinylbenzene copolymer with 8%
crosslinkage, a constant-volume pump, an autosampler and an automatic fraction collector (Gilson)
worked together with the column to perform the automatic chromatographic processes. The
collected fraction is from around 32 min to 42 min for toluene eluent at a flow rate of 2ml/min (the
result was checked and adjusted in the whole procedure of the two cohorts sample preparation).
Most part of lipids can be removed after GPC. However, the additional cleanup was needed to
reach good analytical conditions for HRGC-HRMS. Further cleanup was performed on a sandwich
glass cartridge (75×12 mm, Merck), which was packed with alumina B 0.8g, anhydrous sodium
sulfate 0.3g, florisil 0.5g, silica gel 1g, and anhydrous sodium sulfate 0.5g from bottom to top.
Here, 25 ml toluene was used to elute the pesticide residues from the cartridge.
Condense the cleaned elute by Turbo Vap 500 (with the operation parameters: 5 min after sensor
detection, temperature of water-bath 45 °C and fan speed level C). The eluent was evaporated to
about 200 μl, and then, the sample was transferred to a 200μl micro-vial and was condensed by a
gentle stream of nitrogen to a final volume about 10 μl in a fume hood. Add 10ul 1,2,3,4-TCDD

Heqing Shen Sampling and analysis
- 30 -
standard as the recovery standard to the final volume. Finally, the about 20 μl samples was sealed
and stored at -28 °C for analysis.
2-1-3: HRGC-HRMS analysis and data collection:
HRGC is a HP5890 (series II) device equipped with a capillary column DB-XLB (length 60m,
internal diameter 0.25mm and thin film 0.25 μm). A 30m the same column was used to analyze
PBBs including HeBB. A capillary chiral column BGB-172 (two columns with 30m length and
0.25 and 0.18μm film thickness) was used for the enantiomers separation (Fig. 2-1-3 (1), (2), (3),
(4), (5), (6)). (+) and (-)-isomers for o, p’-DDT were determined according literature (Falconer
et al., 1997). Because the stationary phases were bleeding slowly in the processes, the GC
programs were changed to suit the enantiomeric separation. Carrier gas was helium. HRMS is a
MAT95 (Finnigan) engine using electron impact ion source mode. Multiple ion detection modes,
combined with retention control, were used to identify the investigated compounds. The selected
masses for compound identification and calibration and listed in Table 2-1-3 (1). The reference
compound for mass detection was FC43 (MasCom GmbH).
Limit of detection (LOD) was set as signal/noise (S/N) = 3. The deviation of the ion ratios of the
calibration mass to the reference mass for the 12C-investigation compounds from the counterpart
ratios of 13C-internal standard compounds were controlled in range ±15%; the retention time
differences were controlled ±3s. To some compounds without the labeled standard, the native
standards were run at the same chromatographic condition of the real samples, and the mass
information and retention time were used to screening these compound in the samples. Only the
data supported the upper conditions were considered for collection. Two blank samples and one
reference (placenta or milk) sample were applied in each 30 real samples treating procedure. The
data higher that 3 time mean blank values are used as quantified data and, on the contrary, the
lower ones were taken as unquantifiable data.
Table 2-1-3 (1): The masses used to identify and calculate the investigated compounds
No. Native Compounds Mass 13C Internal Standard Mass 1 α-HCH 216.9145, 220.9087 α-HCH 222.9347, 226.92882 γ-HCH 216.9145, 220.9087 γ-HCH 222.9347, 226.9288

Heqing Shen Sampling and analysis
- 31 -
3 β-HCH 216.9145, 220.9087 β-HCH 222.9347, 226.92884 δ-HCH 216.9145, 220.9087 δ-HCH 222.9347, 226.92885 ε-HCH 216.9145, 220.9087 - 6 Endosulfan-I 236.8413, 238.8384
338.8553 Endosulfan-I 241.8581, 243.8551
347.8854 7 Endosulfan-II 236.8413, 238.8384
338.8553 Endosulfan-II 241.8581, 243.8551
347.8854 8 Methoxychlor 227.1072 Methoxychlor 239.1475 9 o, p'-DDE 246.0003, 247.9975 o, p'-DDE 258.0406, 260.0376
10 o, p'-DDT 235.0081, 237.0053 o, p'-DDT 247.0484, 249.045411 o, p'-DDD 235.0081, 237.0053 - 243.0583, 245.055512 p, p'-DDD 235.0081, 237.0053 p, p'-DDD 243.0583, 245.055513 p, p'-DDE 246.0003, 247.9975 p, p'-DDE 258.0406, 260.037614 p, p'-DDT 235.0081, 237.0053 p, p'-DDT 247.0484, 249.045415 Pentachlorbenzene 249.8492, 251.8462 Pentachlorbenzene 255.8693, 257.866316 Hexachlorbenzene 283.8102, 285.8072 Hexachlorbenzene 289.8303, 291.827317 Pentachloroanisole 264.8363, 266.8333 Pentachloroanisole 270.8564, 272.853418 Aldrin 262.8570, 264.8541 Aldrin 269.8805, 271.877519 Dieldrin 262.8570, 264.8541 Dieldrin 269.8805, 271.877520 Oxychlordane 386.8053, 388.8024 Oxychlordane 396.8388, 398.835921 trans- Chlordane 236.8413, 238.8384
372.8260 trans- Chlordane 241.8581, 243.8551
382.8595 22 cis-Chlordane 236.8413, 238.8384 - 241.8581, 243.855123 cis-Heptachloroepoxide 352.8442, 354.8413 cis-Heptachloroepoxide 362.8778, 364.874824 trans-Heptachloroepoxide 352.8442, 354.8413 362.8778, 364.874825
Heptachlor 336.8493, 338.8464271.8102, 273.8072 Heptachlor
346.8828, 348.8799276.8269, 278.8240
26 Mirex 271.8102, 273.8072 Mirex 276.8269, 278.824027 Octachlorstyrene 342.7790, 344.7761 Octachlorstyrene 350.8059, 352.802928 PBB-1 231.9887, 233.9867 13C-PCB Mixture* 29 PBB-3 13C-PCB Mixture* 30 PBB-4 311.8972, 309.8992 13C-PCB Mixture* 31 PBB-15 13C-PCB Mixture* 32 PBB-18 389.8077, 391.8057 13C-PCB Mixture* 33 PBB-31 13C-PCB Mixture* 34 PBB-37 13C-PCB Mixture* 35 PBB-49 469.7162, 467.7182 13C-PCB Mixture* 36 PBB-52 13C-PCB Mixture* 37 PBB-77 13C-PCB Mixture* 38 PBB-80 13C-PCB Mixture* 39 PBB-101 547.6266, 549.6246 13C-PCB Mixture* 40 PBB-103 13C-PCB Mixture*
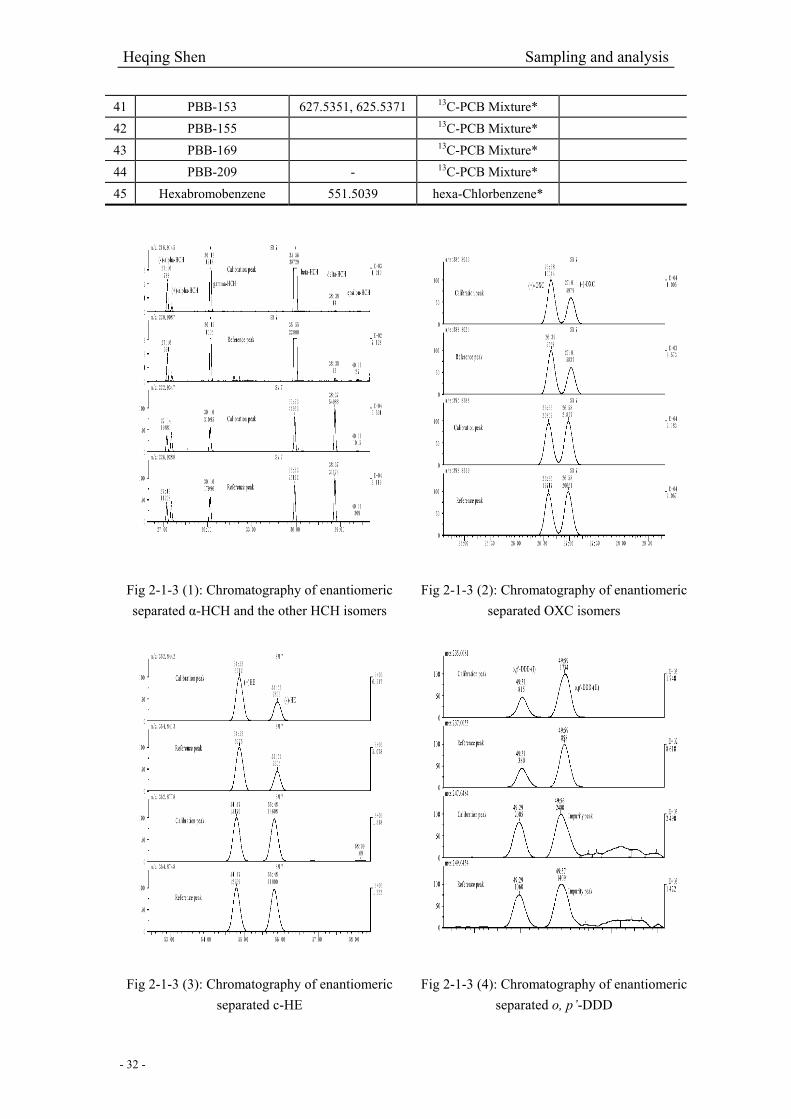
Heqing Shen Sampling and analysis
- 32 -
41 PBB-153 627.5351, 625.5371 13C-PCB Mixture* 42 PBB-155 13C-PCB Mixture* 43 PBB-169 13C-PCB Mixture* 44 PBB-209 - 13C-PCB Mixture* 45 Hexabromobenzene 551.5039 hexa-Chlorbenzene*
Fig 2-1-3 (1): Chromatography of enantiomeric separated α-HCH and the other HCH isomers
Fig 2-1-3 (2): Chromatography of enantiomeric separated OXC isomers
Fig 2-1-3 (3): Chromatography of enantiomeric separated c-HE
Fig 2-1-3 (4): Chromatography of enantiomeric separated o, p’-DDD

Heqing Shen Sampling and analysis
- 33 -
Fig 2-1-3 (5): Chromatography of enantiomeric separated o, p’-DDT and p, p’-DDT
Fig 2-1-3 (6): Chromatography of enantiomeric separated o, p’-DDT (other temperature program)

Heqing Shen Statistical analysis
- 34 -
2-2: Statistical analysis
Excel program was used to do the simple statistic, such as calculation of average value, geometric
mean, standard deviation (STD) and a few linear regressions. Most of the linear fittings are
applied with Origin 6.0 software. Further statistic analysis, such as data distribution testing,
principal component analysis were done by the programmable Matlab 6.5 (MathWorks Inc.) using
its statistic tools.
Principal component (PC) analysis: The basic idea of PC analysis is to find the components 1st
PC, 2nd PC, 3rd PC, … nth PC, which are the linearly combined component of the original variables
(Jolliffe, 1986; Kendall, 1975). These transformed components can explain the total amount of
variance using the fewer variables. In other words, the few combined variables just refer to the
common factors in factor analysis, which focus on the finding of common factors that affect the
variance of set of data among multi-variables. All the PCs are orthogonalized and then are
independent. 1st PC, interpreting the maximum percent of the total variance, is applied firstly. And
then the 2nd PC, interpreting the second maximum percent variance, is determined in orthogonality
with 1st PC. The other PCs are searched one by one in the same way. Each PC would refer a
common factor, which is described separately by the original variables at different extent. To this
point, there is no essential difference between PC analysis and factor analysis method. Before PC
analysis treatment, the original data usually need undergo transformation, such as normalization;
the most used transformation is so called standardization by formulae 1, 2, 3.
Methodologically, standardization results in the fact that every variable looks like similar in their
variance ranges. However, the relative position for each observation in each variable is
unchangeable. And then, it is unchangeable of the relationship of each observation to the
remaining ones in the whole set of population. Additionally, the exact value of compound PC
score and sample PC score are not as important as it’s sign (i.e. positive and negative) when
comparing the compounds (variables) and samples (observations) by their PC scores; and also it is
important for the relative value of these PC scores.

Heqing Shen Statistical analysis
- 35 -
)3(
)2()(1
1
)1(1
.,,,
21
1
2.,,.
1,.,
j
jjiji
m
ijij
m
ijij
sxx
stdx
xxm
s
xm
x
−=
⎟⎠
⎞⎜⎝
⎛−
−=
=
∑
∑
=
=
Data (xi,j) are expressed as a matrix (m × n)
with m rows and n columns. m is the
number of observation (sample) and n is
variable (compound). Formula (1) shows
the mean of jth variable along the m times
observation; (2) shows the standard
deviation (sj) of jth variable; (3) the final
result of xi,j after the transformation.
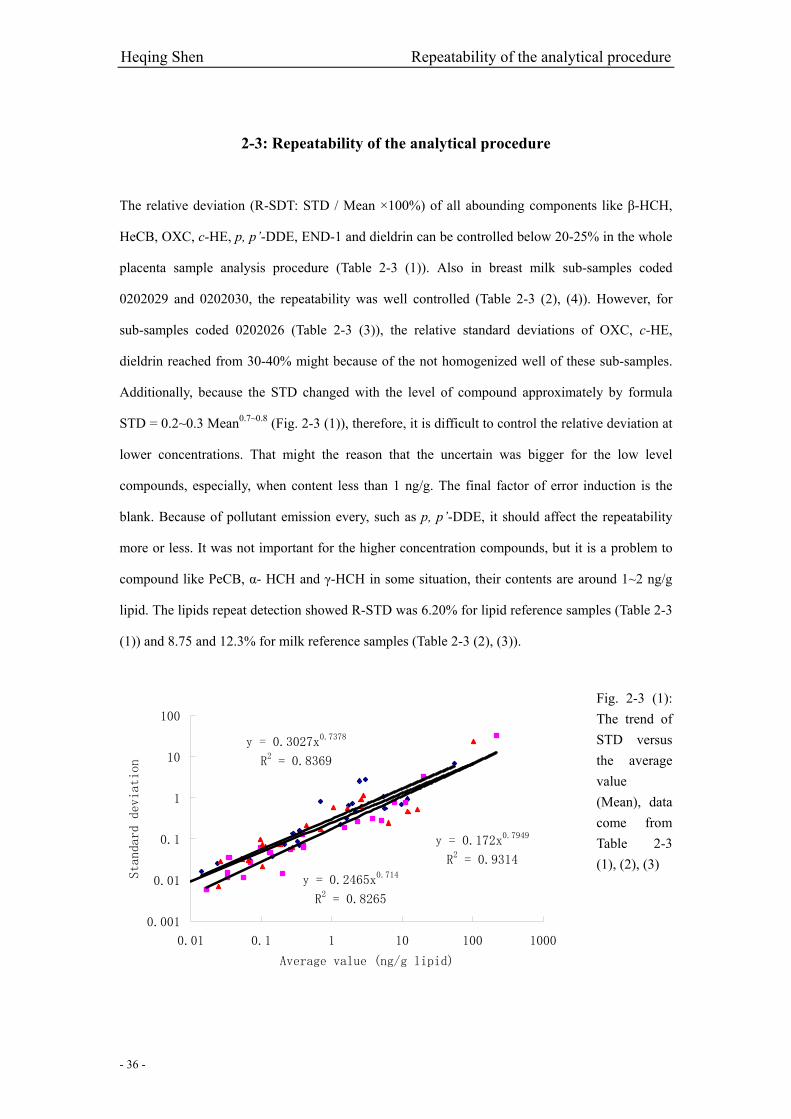
Heqing Shen Repeatability of the analytical procedure
- 36 -
2-3: Repeatability of the analytical procedure
The relative deviation (R-SDT: STD / Mean ×100%) of all abounding components like β-HCH,
HeCB, OXC, c-HE, p, p’-DDE, END-1 and dieldrin can be controlled below 20-25% in the whole
placenta sample analysis procedure (Table 2-3 (1)). Also in breast milk sub-samples coded
0202029 and 0202030, the repeatability was well controlled (Table 2-3 (2), (4)). However, for
sub-samples coded 0202026 (Table 2-3 (3)), the relative standard deviations of OXC, c-HE,
dieldrin reached from 30-40% might because of the not homogenized well of these sub-samples.
Additionally, because the STD changed with the level of compound approximately by formula
STD = 0.2~0.3 Mean0.7~0.8 (Fig. 2-3 (1)), therefore, it is difficult to control the relative deviation at
lower concentrations. That might the reason that the uncertain was bigger for the low level
compounds, especially, when content less than 1 ng/g. The final factor of error induction is the
blank. Because of pollutant emission every, such as p, p’-DDE, it should affect the repeatability
more or less. It was not important for the higher concentration compounds, but it is a problem to
compound like PeCB, α- HCH and γ-HCH in some situation, their contents are around 1~2 ng/g
lipid. The lipids repeat detection showed R-STD was 6.20% for lipid reference samples (Table 2-3
(1)) and 8.75 and 12.3% for milk reference samples (Table 2-3 (2), (3)).
y = 0.3027x0.7378
R2 = 0.8369
y = 0.172x0.7949
R2 = 0.9314
y = 0.2465x0.714
R2 = 0.8265
0.001
0.01
0.1
1
10
100
0.01 0.1 1 10 100 1000
Average value (ng/g lipid)
Standard deviation
Fig. 2-3 (1): The trend of STD versus the average value (Mean), data come from Table 2-3 (1), (2), (3)
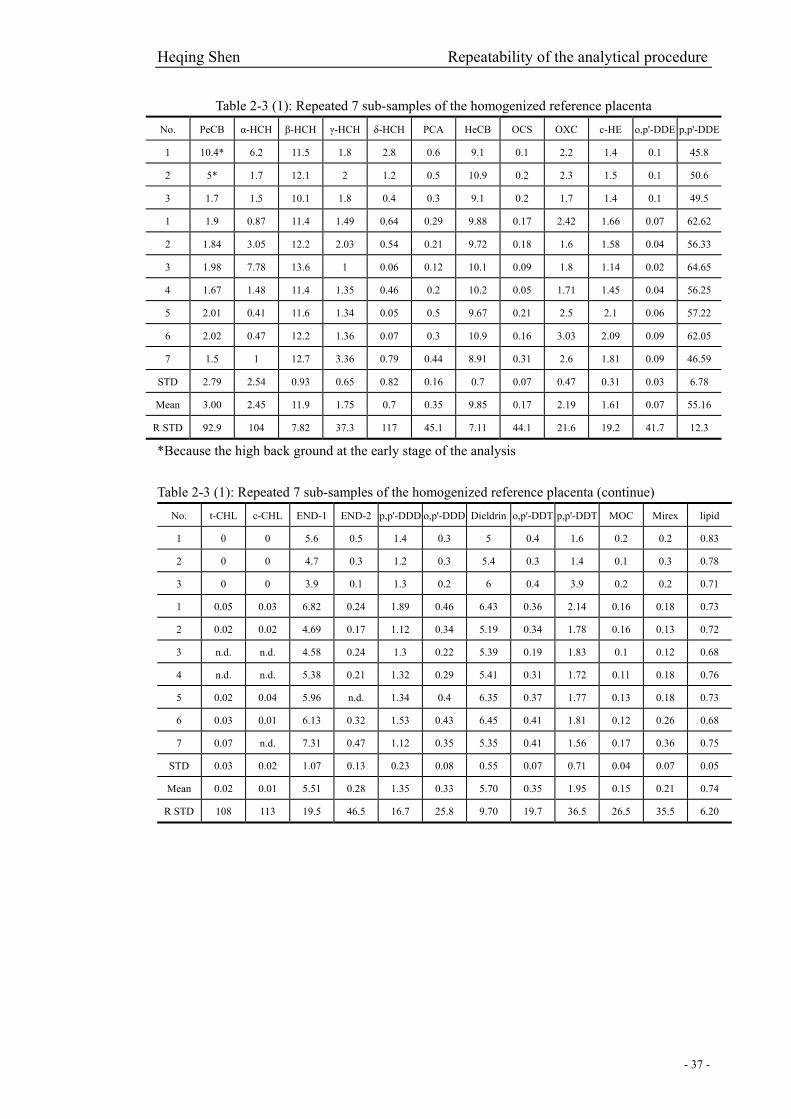
Heqing Shen Repeatability of the analytical procedure
- 37 -
Table 2-3 (1): Repeated 7 sub-samples of the homogenized reference placenta No. PeCB α-HCH β-HCH γ-HCH δ-HCH PCA HeCB OCS OXC c-HE o,p'-DDE p,p'-DDE
1 10.4* 6.2 11.5 1.8 2.8 0.6 9.1 0.1 2.2 1.4 0.1 45.8
2 5* 1.7 12.1 2 1.2 0.5 10.9 0.2 2.3 1.5 0.1 50.6
3 1.7 1.5 10.1 1.8 0.4 0.3 9.1 0.2 1.7 1.4 0.1 49.5
1 1.9 0.87 11.4 1.49 0.64 0.29 9.88 0.17 2.42 1.66 0.07 62.62
2 1.84 3.05 12.2 2.03 0.54 0.21 9.72 0.18 1.6 1.58 0.04 56.33
3 1.98 7.78 13.6 1 0.06 0.12 10.1 0.09 1.8 1.14 0.02 64.65
4 1.67 1.48 11.4 1.35 0.46 0.2 10.2 0.05 1.71 1.45 0.04 56.25
5 2.01 0.41 11.6 1.34 0.05 0.5 9.67 0.21 2.5 2.1 0.06 57.22
6 2.02 0.47 12.2 1.36 0.07 0.3 10.9 0.16 3.03 2.09 0.09 62.05
7 1.5 1 12.7 3.36 0.79 0.44 8.91 0.31 2.6 1.81 0.09 46.59
STD 2.79 2.54 0.93 0.65 0.82 0.16 0.7 0.07 0.47 0.31 0.03 6.78
Mean 3.00 2.45 11.9 1.75 0.7 0.35 9.85 0.17 2.19 1.61 0.07 55.16
R STD 92.9 104 7.82 37.3 117 45.1 7.11 44.1 21.6 19.2 41.7 12.3
*Because the high back ground at the early stage of the analysis Table 2-3 (1): Repeated 7 sub-samples of the homogenized reference placenta (continue)
No. t-CHL c-CHL END-1 END-2 p,p'-DDD o,p'-DDD Dieldrin o,p'-DDT p,p'-DDT MOC Mirex lipid
1 0 0 5.6 0.5 1.4 0.3 5 0.4 1.6 0.2 0.2 0.83
2 0 0 4.7 0.3 1.2 0.3 5.4 0.3 1.4 0.1 0.3 0.78
3 0 0 3.9 0.1 1.3 0.2 6 0.4 3.9 0.2 0.2 0.71
1 0.05 0.03 6.82 0.24 1.89 0.46 6.43 0.36 2.14 0.16 0.18 0.73
2 0.02 0.02 4.69 0.17 1.12 0.34 5.19 0.34 1.78 0.16 0.13 0.72
3 n.d. n.d. 4.58 0.24 1.3 0.22 5.39 0.19 1.83 0.1 0.12 0.68
4 n.d. n.d. 5.38 0.21 1.32 0.29 5.41 0.31 1.72 0.11 0.18 0.76
5 0.02 0.04 5.96 n.d. 1.34 0.4 6.35 0.37 1.77 0.13 0.18 0.73
6 0.03 0.01 6.13 0.32 1.53 0.43 6.45 0.41 1.81 0.12 0.26 0.68
7 0.07 n.d. 7.31 0.47 1.12 0.35 5.35 0.41 1.56 0.17 0.36 0.75
STD 0.03 0.02 1.07 0.13 0.23 0.08 0.55 0.07 0.71 0.04 0.07 0.05
Mean 0.02 0.01 5.51 0.28 1.35 0.33 5.70 0.35 1.95 0.15 0.21 0.74
R STD 108 113 19.5 46.5 16.7 25.8 9.70 19.7 36.5 26.5 35.5 6.20

Heqing Shen Repeatability of the analytical procedure
- 38 -
Table 2-3 (2): Repeated 3 times of the breast milk sub-sample coded 0202030 No. PeCB α-HCH β-HCH γ-HCH δ-HCH PCA HeCB OCS OXC c-HE o,p'-DDE
1 0.19 0.1 16.5 0.37 0.06 0.16 11.1 0.17 5.07 1.46 0.05
2 * 0.05 20.1 0.27 0.01 0.04 10.3 0.08 4.89 1.33 0.05
3 0.21 0.06 22.9 0.53 n.d. 0.09 11.8 0.15 5.45 1.7 0.07
STD 0.01 0.03 3.23 0.13 0.04 0.06 0.78 0.05 0.29 0.19 0.01
Mean 0.2 0.07 19.8 0.39 0.04 0.1 11.1 0.13 5.14 1.50 0.06
R STD 7.07 37.8 16.3 33.6 101 62.4 7 35.4 5.57 12.5 20.4
Table 2-3 (2): Repeated 3 times of the breast milk sub-sample coded 0202030 (continue) No. p,p'-DDE t-CHL c-CHL END-1 p,p'-DDD o,p'-DDD Dieldrin o,p'-DDT p,p'-DDT MOC Mirex lipid
1 203.45 0.04 0.02 7.12 0.31 0.02 2.32 0.39 3.9 0.02 0.39 5.95
2 191.7 0.02 0.01 7.67 0.27 0.01 2.1 0.34 3.47 0.03 0.33 4.85
3 252.79 0.04 0.02 8.63 0.2 0.02 2.64 0.46 4.07 0.05 0.47 4.85
STD 32.42 0.01 0.01 0.76 0.06 0.01 0.27 0.06 0.31 0.02 0.07 0.64
Mean 215.98 0.03 0.02 7.81 0.26 0.02 2.35 0.40 3.81 0.03 0.40 5.22
R STD 15.0 34.6 34.6 9.79 21.4 34.6 11.5 15.2 8.11 45.8 17.7 12.2
Table 2-3 (3): Repeated 3 times of the breast milk sub-sample coded 0202026
No. PeCB α-HCH β-HCH γ-HCH δ-HCH PCA HeCB OCS OXC c-HE o,p'-DDE
1 0.49 0.12 15.9 1.67 0.21 0.15 12.3 0.16 3.72 1.8 0.04
2 0.21 0.08 16.4 0.56 0.04 0.02 11.6 0.13 1.52 1.09 0.03
3 0.62 0.11 16.9 0.91 0.04 0.14 12.4 0.27 3.17 2.17 0.09
STD 0.21 0.02 0.51 0.57 0.1 0.07 0.45 0.07 1.15 0.55 0.03
Mean 0.44 0.10 16.4 1.05 0.1 0.1 12.1 0.19 2.80 1.69 0.05
R STD 47.6 20.1 3.09 54.2 102 70 3.76 39.5 40.8 32.5 60.3
Table 2-3 (3): Repeated 3 times of the breast milk sub-sample coded 0202026 (continue) No. p,p'-DDE t-CHL c-CHL END-1 p,p'-DDD o,p'-DDD Dieldrin o,p'-DDT p,p'-DDT MOC Mirex lipid
1 103.24 0.02 0.01 2.52 0.22 0.01 2.99 0.7 6.18 0.08 0.06 0.84
2 126.83 n.d. n.d. 2.07 0.27 0.01 1.56 0.54 6.35 0.08 0.04 1
3 79.62 0.03 n.d. 3.26 0.34 0.06 3.26 0.87 6.66 0.19 0.1 0.91
STD 23.60 0.01 0.60 0.06 0.03 0.91 0.17 0.24 0.06 0.03 0.08
Mean 103.23 0.025 0.01 2.62 0.28 0.03 2.60 0.70 6.40 0.12 0.07 0.92
R STD 22.9 28.3 22.9 21.8 108 35.1 23.5 3.80 54.4 45.8 8.75

Heqing Shen Repeatability of the analytical procedure
- 39 -
Table 2-3 (4): Repeated 3 times of the breast milk sub-sample coded 0202029 No. PeCB α-HCH β-HCH γ-HCH δ-HCH PCA HeCB OCS OXC c-HE o,p'-DDE
1 0.21 0.15 9.84 0.51 0.02 0.08 6.92 0.15 2.98 1.85 0.05
2 0.22 0.22 10.6 0.33 n.d. 0.02 7.66 0.08 2.82 2.01 0.08
Mean 0.22 0.19 10.2 0.42 0.02 0.05 7.29 0.12 2.9 1.93 0.07
Table 2-3 (4): Repeated 3 times of the breast milk sub-sample coded 0202029 (continue) No. p,p'-DDE t-CHL c-CHL END-1 p,p'-DDD o,p'-DDD Diel o,p'-DDT p,p'-DDT MOC Mir lipid
1 69.91 0.03 0.03 3.66 0.19 0.02 3.11 0.31 2.37 0.05 0.35 3.08
2 61.95 0.02 0.03 2.19 0.58 0.21 3.19 0.42 3.5 0.37 0.52 3.63
Mean 65.93 0.03 0.03 2.93 0.39 0.12 3.15 0.37 2.94 0.21 0.44 3.36
All compounds are expressed in ng/g lipid and lipid content in g/g 100% in wet weight

Heqing Shen Intra- and inter-laboratory comparison of the lipid data
- 40 -
2-4: Intra- and inter-laboratory comparison of the lipid data
Because the final data used to evaluate the exposure levels of the two cohorts are normalized using
lipid data. Lipid determination has to be decided carefully. The robustness of the method for lipid
determination was checked via intra-laboratory and inter-laboratory studies. The fat contents of
paired placenta sub-samples (N = 2 × 15) and milk sample (N = 9) were applied for
intra-laboratory evaluation. Assumed the paired sub-samples homogenized well, theoretically,
their lipid contents should be having the same values (Y = X). Factually, both homogenized
procedure for sample aliquot and the lipid determination at each time some uncertainties could
have been introduced. When using the ideal model to fit the data, the inter-laboratory residuals of
milk samples (N = 2 × 65) are 0.11 (±0.05) with the average of the relative errors (Y-residual /
Y-prediction) are 12.92% (STD 10.53%), and the intra-laboratory residuals are 0.03 (±0.03) with
the average of the relative errors 5.11% (STD 4.06%). This suggested that, generally, the detection
results could be predicated between two laboratories of Kuopio and Munich (95% confidence),
except some outlier data (Fig 2-4 (1), (2)).

Heqing Shen Intra- and inter-laboratory comparison of the lipid data
- 41 -
0 2 4 6 8 1 0
0
2
4
6
8
1 0
Milk
lipi
d da
ta fr
om M
unic
h (g
/g 1
00%
)
M i l k l ip id d a t a f r o m K u o p io ( g / g 1 0 0 % )
Y = 0 .1 0 9 ( 0 . 0 5 3 ) + XR = 0 .9 4 1 , S D = 0 .6 1 0 , P < 0 .0 0 0 1 , N = 1 3 0
U p p e r 9 5 % C o n f id e n c e L im i t L o w e r 9 5 % C o n f id e n c e L im i t U p p e r 9 5 % P r e d ic t io n L im i t L o w e r 9 5 % P r e d ic t io n L im i t
Fig. 2-4 (1): The inter-laboratory lipid data comparison between paired sub-samples of Finland and Denmark breast milk samples (65 samples for each cohort).
1 2 3 4 5 6 70
1
2
3
4
5
6
7
Pla
cent
a an
d m
ilk li
pid
of 2
nd te
st (g
/g 1
00%
)
P l a c e n t a a n d m i l k l ip id o f 1 s t t e s t ( g / g 1 0 0 % )
Y = 0 . 0 2 8 ( 0 . 0 2 8 ) + XR = 0 . 9 9 4 , S D = 0 . 1 7 6 , P < 0 . 0 0 0 1 , N = 3 9
U p p e r 9 5 % C o n f id e n c e L im i t L o w e r 9 5 % C o n f id e n c e L im i t U p p e r 9 5 % P r e d ic t io n L im i t L o w e r 9 5 % P r e d ic t io n L im i t
Fig. 2-4 (2): The intra-laboratory lipid data comparison between paired sub-samples of Finland and Denmark breast placenta samples (15 placenta samples for each cohort and 9 milk from Finland cohort).

Heqing Shen Lipid comparison between Denmark and Finland cohorts
- 42 -
3-1: Lipid comparison between Denmark and Finland cohorts
3-1-1: Lipid contents of placenta and milk samples in the two cohorts
Comparing the documented data of mother samples (DeKoning et al. 2000), it seems that the lipid
data of Finland cohort for both placenta and breast milk samples are more close to the reference
data (Table 3-1-1 (1)) than Denmark cohort. The calculated results (g/g 100% of lipid / wet weight)
of Finland placenta samples are 1.21 for geometric mean, average value 1.22 with standard
deviation (STD) = 0.13 and range from 0.93 to 1.52; Denmark placenta samples are geometric
mean 1.07, average value 1.09 with STD = 0.17 and changed from 0.55 to 1.50; Finland breast
milk samples are 4.24 of geometric mean, 4.52 average value with STD = 1.56 and range
0.95-10.14; Denmark breast milk samples are only 2.66 of geometric mean, 2.99 of average value
with STD 1.38 and range 0.36-7.33. Fig. 3-1-1 (1) and Fig. 3-1-1 (2) give more detail information
of the distributions of lipid data. It should be concluded that Danish cohort has lower lipid
contents than Finnish cohort.
Table 3-1-1 (1): Some reference data of mother samples (DeKoning et al., 2000)
Specific density Blood = 1.05 Plasma =1.027 Serum = 1.026
Total lipids in blood (g/l serum or plasma)
Cord blood = 3.47
Non-pregnant blood female = 6.17
Pregnant blood female = 9.0
Total lipids in breast milk 45.4 g/l (4.5%) Total lipids in placenta 1-1.5% by weight (wet) Fat content in foetus 12% by weight
Composition of blood 45% cells 55% serum
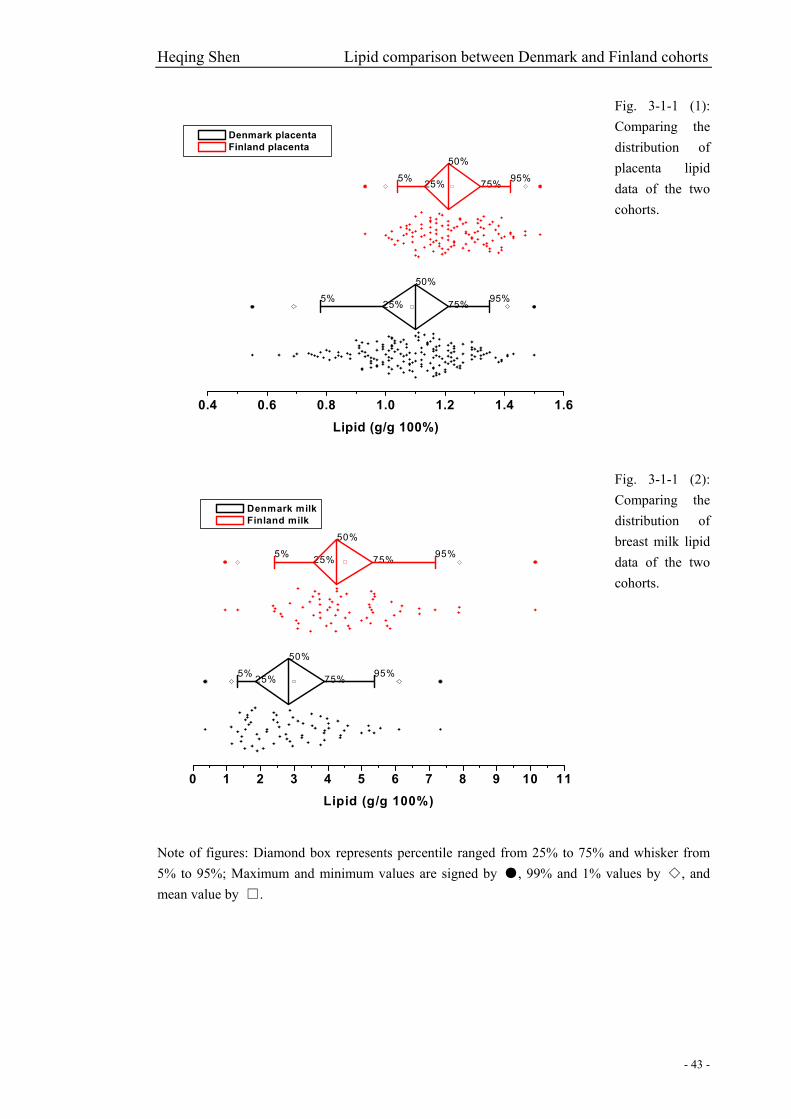
Heqing Shen Lipid comparison between Denmark and Finland cohorts
- 43 -
25% 75%
50%
95%5%
25% 75%
50%
95%5%
0.4 0.6 0.8 1.0 1.2 1.4 1.6Lipid (g/g 100%)
Denmark placenta Finland placenta
Fig. 3-1-1 (1): Comparing the distribution of placenta lipid data of the two cohorts.
25% 75%
50%
95%5%
25% 75%
50%
95%5%
0 1 2 3 4 5 6 7 8 9 10 11Lipid (g/g 100%)
Denmark milk Finland milk
Fig. 3-1-1 (2): Comparing the distribution of breast milk lipid data of the two cohorts.
Note of figures: Diamond box represents percentile ranged from 25% to 75% and whisker from 5% to 95%; Maximum and minimum values are signed by ●, 99% and 1% values by ◇, and mean value by □.
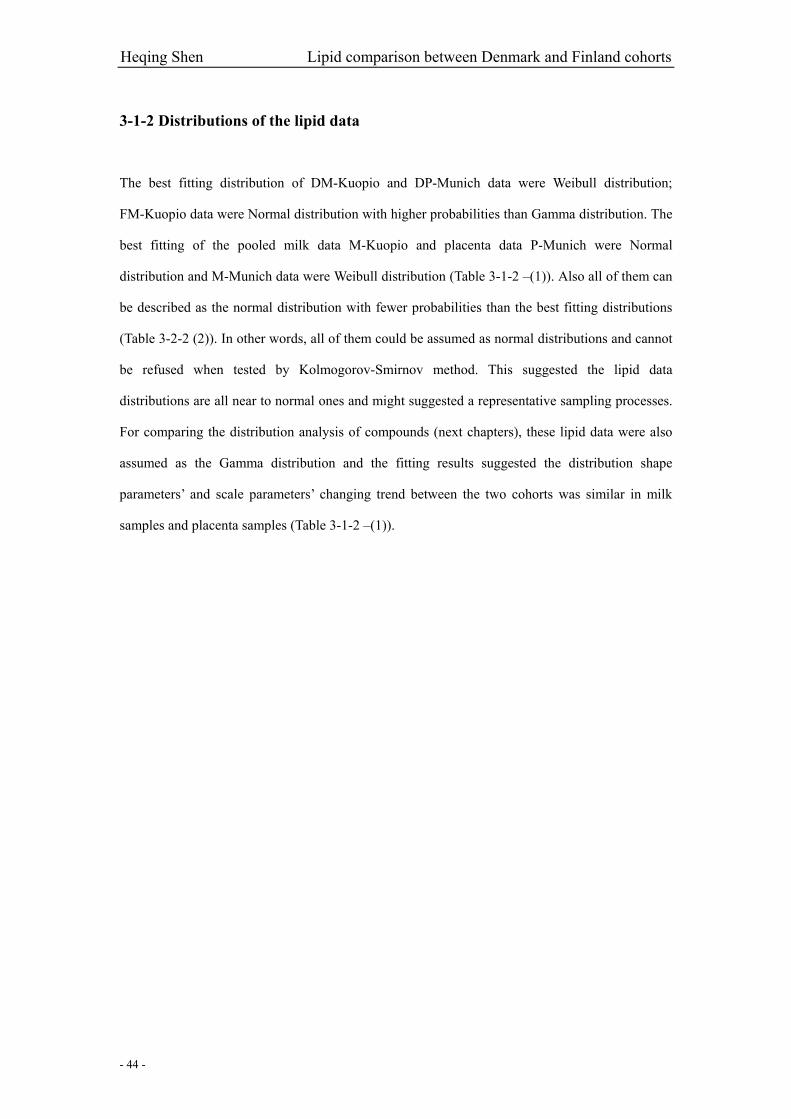
Heqing Shen Lipid comparison between Denmark and Finland cohorts
- 44 -
3-1-2 Distributions of the lipid data
The best fitting distribution of DM-Kuopio and DP-Munich data were Weibull distribution;
FM-Kuopio data were Normal distribution with higher probabilities than Gamma distribution. The
best fitting of the pooled milk data M-Kuopio and placenta data P-Munich were Normal
distribution and M-Munich data were Weibull distribution (Table 3-1-2 –(1)). Also all of them can
be described as the normal distribution with fewer probabilities than the best fitting distributions
(Table 3-2-2 (2)). In other words, all of them could be assumed as normal distributions and cannot
be refused when tested by Kolmogorov-Smirnov method. This suggested the lipid data
distributions are all near to normal ones and might suggested a representative sampling processes.
For comparing the distribution analysis of compounds (next chapters), these lipid data were also
assumed as the Gamma distribution and the fitting results suggested the distribution shape
parameters’ and scale parameters’ changing trend between the two cohorts was similar in milk
samples and placenta samples (Table 3-1-2 –(1)).
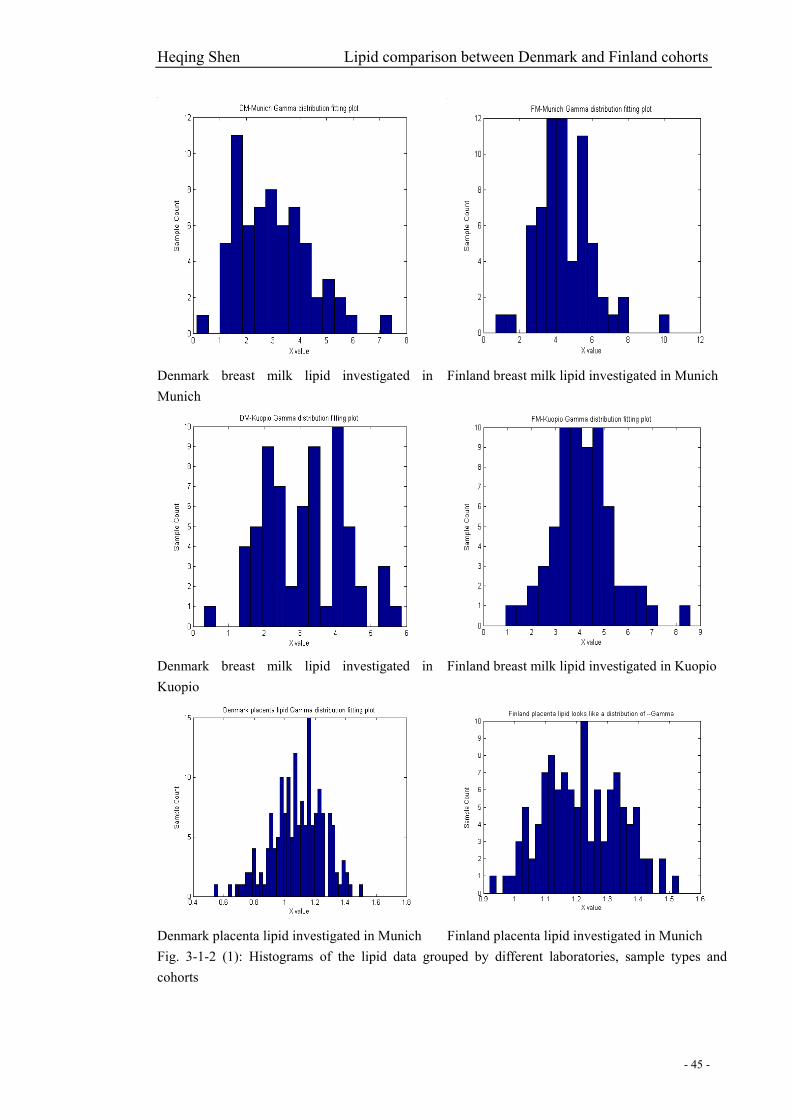
Heqing Shen Lipid comparison between Denmark and Finland cohorts
- 45 -
Denmark breast milk lipid investigated in Munich
Finland breast milk lipid investigated in Munich
Denmark breast milk lipid investigated in Kuopio
Finland breast milk lipid investigated in Kuopio
Denmark placenta lipid investigated in Munich Finland placenta lipid investigated in Munich Fig. 3-1-2 (1): Histograms of the lipid data grouped by different laboratories, sample types and cohorts
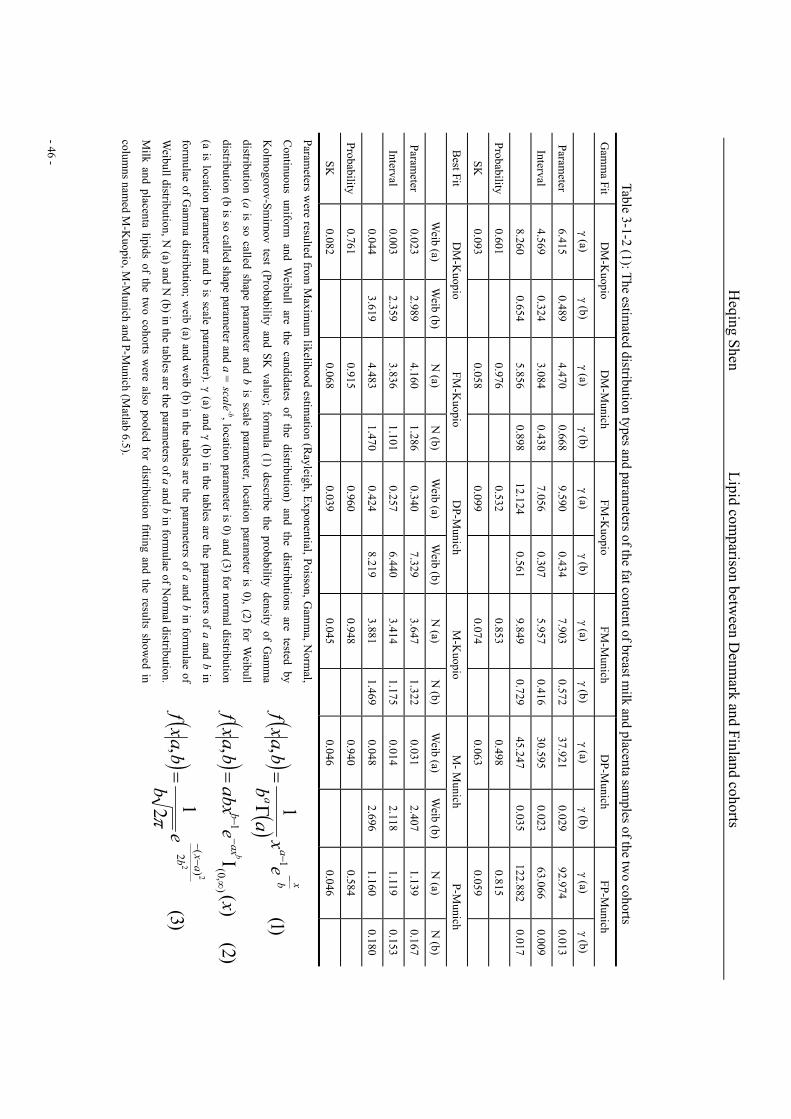
Heqing Shen Lipid com
parison between D
enmark and Finland cohorts
- 46 -
Table 3-1-2 (1): The estimated distribution types and param
eters of the fat content of breast milk and placenta sam
ples of the two cohorts
Gam
ma Fit
DM
-Kuopio
DM
-Munich
FM-K
uopio FM
-Munich
DP-M
unich FP-M
unich
γ (a)
γ (b) γ (a)
γ (b) γ (a)
γ (b) γ (a)
γ (b) γ (a)
γ (b) γ (a)
γ (b)
Parameter
6.415 0.489
4.470 0.668
9.590 0.434
7.903 0.572
37.921 0.029
92.974 0.013
Interval 4.569
0.324 3.084
0.4387.056
0.307 5.957
0.41630.595
0.023 63.066
0.009
8.260
0.654 5.856
0.89812.124
0.561 9.849
0.72945.247
0.035 122.882
0.017
Probability0.601
0.976
0.532
0.853
0.498
0.815
SK
0.093
0.058
0.099
0.074
0.063
0.059
Best Fit
DM
-Kuopio
FM-K
uopio D
P-Munich
M-K
uopio M
- Munich
P-Munich
W
eib (a) W
eib (b)N
(a) N
(b)W
eib (a) W
eib (b)N
(a) N
(b)W
eib (a) W
eib (b)N
(a) N
(b)
Parameter
0.023 2.989
4.160 1.286
0.340 7.329
3.647 1.322
0.031 2.407
1.139 0.167
Interval 0.003
2.359 3.836
1.1010.257
6.440 3.414
1.1750.014
2.118 1.119
0.153
0.044
3.619 4.483
1.4700.424
8.219 3.881
1.4690.048
2.696 1.160
0.180
Probability0.761
0.915
0.960
0.948
0.940
0.584
SK
0.082
0.068
0.039
0.045
0.046
0.046
Parameters w
ere resulted from M
aximum
likelihood estimation (R
ayleigh, Exponential, Poisson, Gam
ma, N
ormal,
Continuous uniform
and Weibull are the candidates of the distribution) and the distributions are tested by
Kolm
ogorov-Smirnov test (Probability and SK
value); formula (1) describe the probability density of G
amm
a
distribution (a is so called shape parameter and b is scale param
eter, location parameter is 0), (2) for W
eibull
distribution (b is so called shape parameter and a =
scale-b, location param
eter is 0) and (3) for normal distribution
(a is location parameter and b is scale param
eter). γ (a) and γ (b) in the tables are the parameters of a and b in
formulae of G
amm
a distribution; weib (a) and w
eib (b) in the tables are the parameters of a and b in form
ulae of
Weibull distribution, N
(a) and N (b) in the tables are the param
eters of a and b in formulae of N
ormal distribution.
Milk and placenta lipids of the tw
o cohorts were also pooled for distribution fitting and the results show
ed in
columns nam
ed M-K
uopio, M-M
unich and P-Munich (M
atlab 6.5).
()
()(
)
()
)3(
2 1,
)2(
)(
,
)1(1
,
2
2
2)
(
),0
(1
1b ax
axb
b xa
a
eb
bax
f
xe
abxb
axf
ex
ab
bax
f
b−−
∞−
−
−−
=
Ι=
Γ=
π

Heqing Shen Exposure patterns and levels of the investigated compounds
- 47 -
3-2: Exposure patterns and levels of the investigated compounds
3-2-1: Overview of the investigated compounds
Usually, geometric mean is less affected by the outlier values of a set of samples, which means it
can show the central tendency better that arithmetic value when some data deviated far from the
central point, for instant, log-normalized data (Walker et al., 2003). The general exposure patterns
are compared using their geometric mean data. Aldrin, t-HE, ε-HCH, and END-2 cannot be
determined in most of the investigated samples of the two cohorts. δ-HCH, c-CHL, t-CHL, o,
p’-DDE, o, p’-DDD, MOC cannot be detected in many samples or usually at the levels too low to
be quantified. These compounds are not being considered in the following comparative analysis.
α-HCH, γ-HCH, δ-HCH and PeCB showed similar pattern with decreasing levels FP > DP > DM
> FM; PCA and p, p’-DDD also showed apparently different patterns, with higher placenta levels
than breast milk levels. These quite different patterns of these compounds might reflect their lower
stability or pronounces different biodegradation among the samples. The other factor might be the
higher but differently distributed background values of these lower determination level
compounds, especially for α-HCH, γ-HCH and PeCB. All of these factors might additionally cause
pattern differences. Mirex levels decreased in order of FM > DM > FP > DP. All other compounds,
especially the 8 most abundant compounds p, p’-DDE, β-HCH, HeCB, dieldrin, END-1, OXC,
c-HE, p, p’-DDT (Fig. 3-2-1 (1) and Table 3-2-1 (1)) and also the low level compounds such as
o, p’-DDT and OCS showed similar pattern (DM > FM > DP > FP). The pattern should be
accepted as the characteristic pattern of the investigated sample type and cohort because almost all
of the abundance of the investigated contaminants appears in this pattern. Except for the placenta
lowest o, p’-DDT, they are all linearly correlated for paired placenta and breast milk samples in
Finland cohort (the same correlation for mirex). The 8 most abundant compounds count 89%, 95%,
98%, and 98% (the geometric mean of each compound dividing the summary of their geometric
means) for FP, DP, FM, DM, respectively, in the total of the investigated compounds. Generally, p,
p’-DDE occupies the around half of the total amount of investigated pesticides and the compound
covers the largesse part of the difference of the two cohort’s exposure to these PBTs. The next
abundant ones are HCH and PeCB. As a result, the geometric means of the investigated

Heqing Shen Exposure patterns and levels of the investigated compounds
- 48 -
compounds are 40.77, 70.68, 105.89 and 192.30 (ng/g lipid) for FP, DP, FM and DM respectively.
In other words, generally, the Denmark cohort exposure level is 1.73 or 1.82 times higher than the
Finland level when calculated from placenta or breast milk. Correlation analysis and principal
component analysis focus mainly on the 8 compounds and the Finland paired compounds. The
final profile of PBT residuals depends on the exposure sources (esp. net uptake from food) and the
resistance to enzyme biodegradation of these compounds in human bodies.
Table 3-2-1 (1): Relative contents (fractions) of the 8 main components in the two cohorts Total * p,p’-DDE β-HCH HeCB OXC c-HE END-1 p,p’-DDT Dieldrin
FP 40.77 0.44 0.12 0.11 0.02 0.02 0.04 0.01 0.03
FM 105.9 0.61 0.1 0.08 0.03 0.02 0.05 0.04 0.02
DP 70.68 0.58 0.12 0.11 0.01 0.01 0.03 0.01 0.03
DM 192.3 0.66 0.09 0.06 0.03 0.01 0.04 0.03 0.03
*Total exposure level (ng/g lipid) was the summary of geometric means of all investigated compounds, which were
detectable in the two cohorts.
The level of total DDT had decreased much from 1570 (N = 49) or 2320 (no sample size) in 1974
(Smith 1999) to 699 (N = 50, recalculated using lipid data 4.5% g/g wet weight) in 1982 (Nasir et
al., 1998), further to 570 (N = 165) in 1985 (Mussalo-Rauhamaa et al, 1988), and to the present
data 84.06 ng/g lipid (N =65). In Denmark milk samples (N = 57), total DDT was 1150, total HCH
80, and dieldrin 40 ng/g lipid in 1982 (Nasir et al., 1998) (Table 3-2-1 (2)). The reported β-HCH,
HeCB, dieldrin, p, p’-DDT, p, p’-DDE and total DDT were 116.43, 282.76, 33.10, 1123.69,
143.02, 1373.78, 1526.30 ng/g (recalculated the mean values of two time measurements) in serum
of samples from 1976-1978 (Hoyer et al. 2000). Considering the possible sample specific
difference (Table 3-2-1 (3)), the body burden of the DDT of Finland people could be lower than
Denmark people at the beginning of the ban and the following clearance periods. Apparently, all
the other investigated PBTs could also decrease with the year because of their ban (Table 3-2-1
(2)). The general levels of these PBTs have decreased in first order rate in human samples (Smith,
1999; Noren et al., 2000; Solomon et al., 2002) after the ban.

Heqing Shen Exposure patterns and levels of the investigated compounds
- 49 -
Table 3-2-1 (2): Comparison of PBT contents of the present data of the two cohorts with reported Finland milk samples data:
Mean
(ng/g lipid)
p, p’-DDE Total
DDT
HCHs HeCB t-CHLa c-CHLa HCa OXC c-HE
Finland
1997-2001
79.04
(±57.81)
84.06
(±60.09)
12.46
(±5.38)
8.51
(±3.17)
0.04
(±0.03)
0.02
(±0.02)
0.23
(±0.34)
3.93
(±1.9)
2.37
(±2.06)
Denmark
1997-2001
148.78
(±84.93)
157.12
(±88.31)
21.86
(±13.06)
12.82
(±4.13)
0.06
(±0.05)
0.04
(±0.02)
- 3.08
(±1.59)
5.2
(±1.89)
Finland
1984-1985b
600
(±600)
660
(±640)
200
(±250)
80
(±60)
200
(±190)
100
(±60)
70
(±60)
230
(±210)
100
(±400)
Declinec 32.6 36 11.7 4.5 12.5 6.2 4.4 14.1 6.1 a Detection positive samples of t-CHL, c-CHL and HC for the present Finland cohort are 82, 46 and 5% and for the
present Denmark cohort are 85, 40 and 0%; b Mussalo-Rauhamaa et al, 1988; The mean data for samples above the
detection level 10 ng/g lipid; c Simply estimated decline rate per year (from 1985 to 2001).
Table 3-2-1 (3): Ratio of PBT distribution between tissue compartments on lipid basis
Milk/
Adipose
ePlacenta/
Milk
Placenta/
Ma serum
Cord plas/
Ma plas
Cord serum/
Milk
Ma serum/
Milk
β-HCH 0.43d 0.51 0.48a 0.70 b 0.061c 0.157c
HeCB 0.43 (0.50)d 0.63 0.99a 0.91 b
p,p’-DDT 0.53 b 0.09 t0.45a 0.41 b 0.165c 0.525c
p,p’-DDE 0.91d 0.33 0.94 b 0.016c 0.042c
c-HE 0.36
END-1 0.46
OXC 0.36 0.74 b
Mirex 0.81 0.19 b aSchlebusch et al., 1994; bWalker et al., 2003; cNair et al., 1996; dWaliszewski et al., 1999; 2001; eParesent data
(slope of regression line); Maternal: Ma; Plasma: Plas
3-2-2: Distribution types of the investigated compounds
The distribution profiles of the 8 compounds are well characterized respectively in placenta
samples and breast milk samples, and interestingly, for all compounds, the profile was quite
similar for placenta and breast milk (Fig. 3-2-2 (2)). This information should also be a reflection of
the similar life habits of the investigated cohort members. Comparing the lipid data, which could
be accepted as normal distributed at higher probabilities, the probabilities of the 8 compounds
distribution as normal types were lower, except END-1 and HeCB in DM samples (Table 3-2-2 (1)
and (2)). The best fitting distributions for the investigated compounds were listed (Table 3-2-2 (3))
and most of them were Gamma distributed. The deviation from the normal distribution depicts
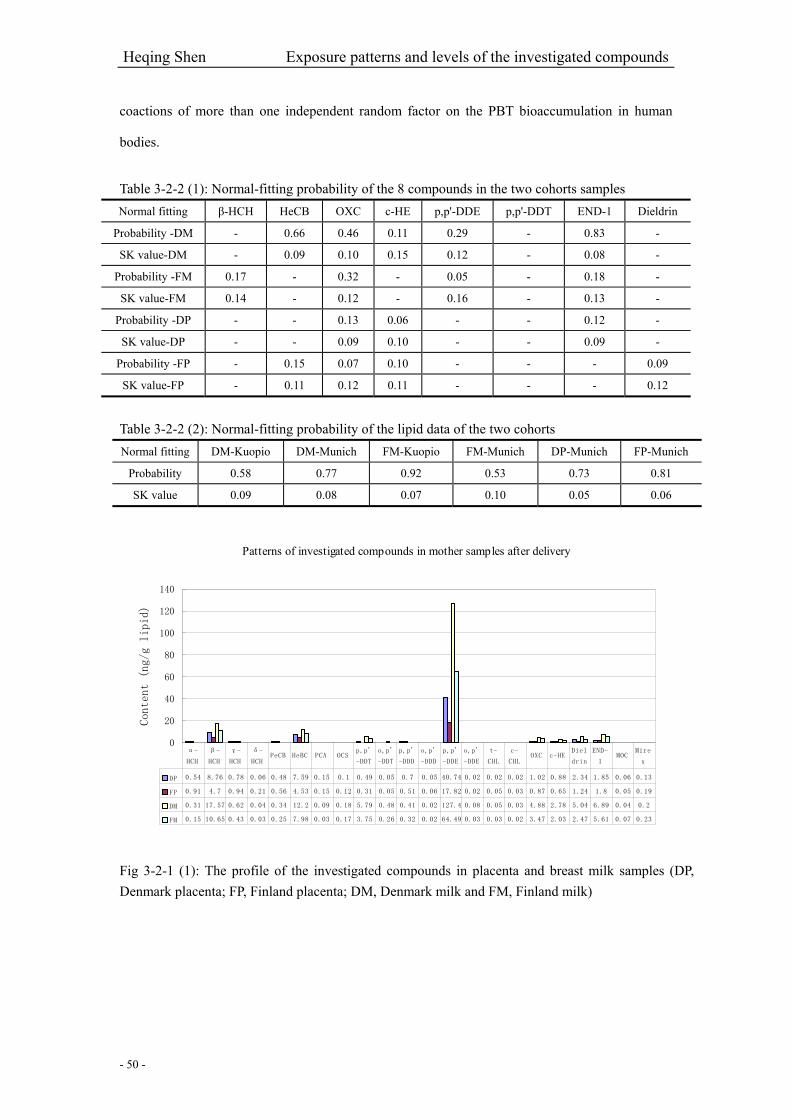
Heqing Shen Exposure patterns and levels of the investigated compounds
- 50 -
coactions of more than one independent random factor on the PBT bioaccumulation in human
bodies.
Table 3-2-2 (1): Normal-fitting probability of the 8 compounds in the two cohorts samples Normal fitting β-HCH HeCB OXC c-HE p,p'-DDE p,p'-DDT END-1 Dieldrin
Probability -DM - 0.66 0.46 0.11 0.29 - 0.83 -
SK value-DM - 0.09 0.10 0.15 0.12 - 0.08 -
Probability -FM 0.17 - 0.32 - 0.05 - 0.18 -
SK value-FM 0.14 - 0.12 - 0.16 - 0.13 -
Probability -DP - - 0.13 0.06 - - 0.12 -
SK value-DP - - 0.09 0.10 - - 0.09 -
Probability -FP - 0.15 0.07 0.10 - - - 0.09
SK value-FP - 0.11 0.12 0.11 - - - 0.12
Table 3-2-2 (2): Normal-fitting probability of the lipid data of the two cohorts Normal fitting DM-Kuopio DM-Munich FM-Kuopio FM-Munich DP-Munich FP-Munich
Probability 0.58 0.77 0.92 0.53 0.73 0.81
SK value 0.09 0.08 0.07 0.10 0.05 0.06
Patterns of investigated compounds in mother samples after delivery
0
20
40
60
80
100
120
140
Content (ng/g lipid)
DP 0.54 8.76 0.78 0.06 0.48 7.59 0.15 0.1 0.49 0.05 0.7 0.05 40.74 0.02 0.02 0.02 1.02 0.88 2.34 1.85 0.06 0.13
FP 0.91 4.7 0.94 0.21 0.56 4.53 0.15 0.12 0.31 0.05 0.51 0.06 17.82 0.02 0.05 0.03 0.87 0.65 1.24 1.8 0.05 0.19
DM 0.31 17.57 0.62 0.04 0.34 12.2 0.09 0.18 5.79 0.48 0.41 0.02 127.4 0.08 0.05 0.03 4.88 2.78 5.04 6.89 0.04 0.2
FM 0.15 10.65 0.43 0.03 0.25 7.98 0.03 0.17 3.75 0.26 0.32 0.02 64.49 0.03 0.03 0.02 3.47 2.03 2.47 5.61 0.07 0.23
α-
HCH
β-
HCH
γ-
HCH
δ-
HCHPeCB HeBC PCA OCS
p,p'
-DDT
o,p'
-DDT
p,p'
-DDD
o,p'
-DDD
p,p'
-DDE
o,p'
-DDE
t-
CHL
c-
CHLOXC c-HE
Diel
drin
END-
1MOC
Mire
x
Fig 3-2-1 (1): The profile of the investigated compounds in placenta and breast milk samples (DP, Denmark placenta; FP, Finland placenta; DM, Denmark milk and FM, Finland milk)

Heqing Shen Exposure patterns and levels of the investigated com
pounds
- 51 -
Table 3-2-2 (3): The Gam
ma distribution fitting param
eters of the 8 abundant compounds in breast m
ilk and placenta samples of the tw
o cohorts
β
-HC
H
H
eCB
O
XC
c-H
E
p, p'-DD
E
p, p'-DD
T
END
-1
Dieldrin
γ (a)
γ (b)γ (a)
γ (b)γ (a)
γ (b)γ (a)
γ (b)γ (a)
γ (b)γ (a)
γ (b)γ (a)
γ (b)γ (a)
γ (b)
DM
Parameter
3.353 6.129
10.2041.256
7.9760.652
4.9820.619
3.391 43.862
2.461 2.921
4.7031.636
3.542 1.649
Interval 2.004
4.0056.140
0.7625.096
0.4173.435
0.4522.178
28.0971.584
2.0822.963
0.9922.575
1.351
4.701
8.25414.268
1.75010.855
0.8876.529
0.7864.604
59.6263.339
3.7616.443
2.2814.509
1.947
Probability 0.505
0.963
0.957
0.637
0.794
0.239
0.980
0.267
SK value
0.101
0.061
0.062
0.091
0.079
0.126
0.057
0.122
FM Param
eter 5.605
2.0837.952
1.0704.182
0.9393.326
0.7142.613
30.2464.082
1.0442.400
2.9214.323
0.644
Interval 3.963
1.4855.616
0.7642.790
0.5992.455
0.6051.586
20.1022.540
0.7011.406
1.6752.628
0.412
7.248
2.68210.287
1.3775.574
1.2804.196
0.8233.641
40.3915.623
1.3883.393
4.1676.018
0.876
Probability 0.797
0.101
0.749
0.065
0.494
0.196
0.720
0.426
SK value
0.079
0.149
0.083
0.160
0.101
0.131
0.085
0.107
DP Param
eter 4.234
2.3409.705
0.8243.400
0.3504.359
0.2283.474
13.638
3.227
0.6753.343
0.819
Interval 3.468
2.0138.265
0.7102.662
0.2713.549
0.1822.844
11.475
2.460
0.4952.784
0.715
5.001
2.66711.146
0.9394.137
0.4295.170
0.2744.104
15.801
3.994
0.8543.902
0.922
Probability 0.142
0.419
0.836
0.964
0.570
0.521
0.221
SK value
0.088
0.067
0.047
0.038
0.060
0.062
0.052
FP Parameter
7.9110.611
3.4430.294
5.9380.119
2.558 8.581
2.3750.951
4.666 0.298
Interval
6.086
0.4792.355
0.1994.453
0.0901.785
6.169
1.691
0.6903.449
0.224
9.735
0.7434.531
0.3887.422
0.1483.331
10.992
3.059
1.2125.883
0.371
Probability
0.767
0.880
0.653
0.769
0.441
0.899
SK value
0.062
0.055
0.069
0.062
0.081
0.053
Note: the best fitting distributions for FM
p, p’-DD
E, END
-1 and DP EN
D-1 are w
eibull distribution with param
eters Weib (a) 0.001, 0.037 and 0.170; W
eib (b) 1.544, 1.600 and
1.967; probability 0.552, 0.737 and 0.738 and SK value 0.097, 0.084 and 0.052
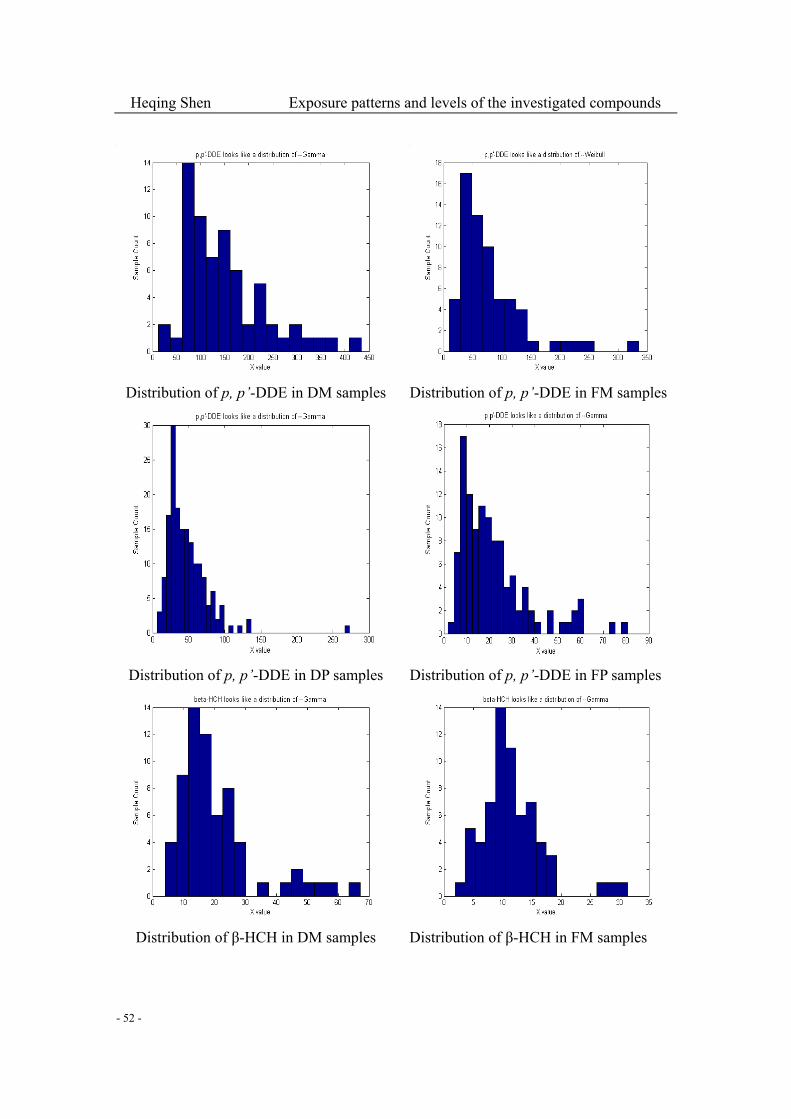
Heqing Shen Exposure patterns and levels of the investigated compounds
- 52 -
Distribution of p, p’-DDE in DM samples Distribution of p, p’-DDE in FM samples
Distribution of p, p’-DDE in DP samples Distribution of p, p’-DDE in FP samples
Distribution of β-HCH in DM samples Distribution of β-HCH in FM samples

Heqing Shen Exposure patterns and levels of the investigated compounds
- 53 -
Distribution of β-HCH in DP samples Distribution of β-HCH in FP samples
Distribution of HeCB in DM samples Distribution of HeCB in FM samples
Distribution of HeCB in DP samples Distribution of HeCB in FP samples

Heqing Shen Exposure patterns and levels of the investigated compounds
- 54 -
Distribution of END-1 in DM samples Distribution of END-1 in FM samples
Distribution of END-1 in DP samples Distribution of END-1 in FP samples
Distribution of dieldrin in DM samples Distribution of dieldrin in FM samples
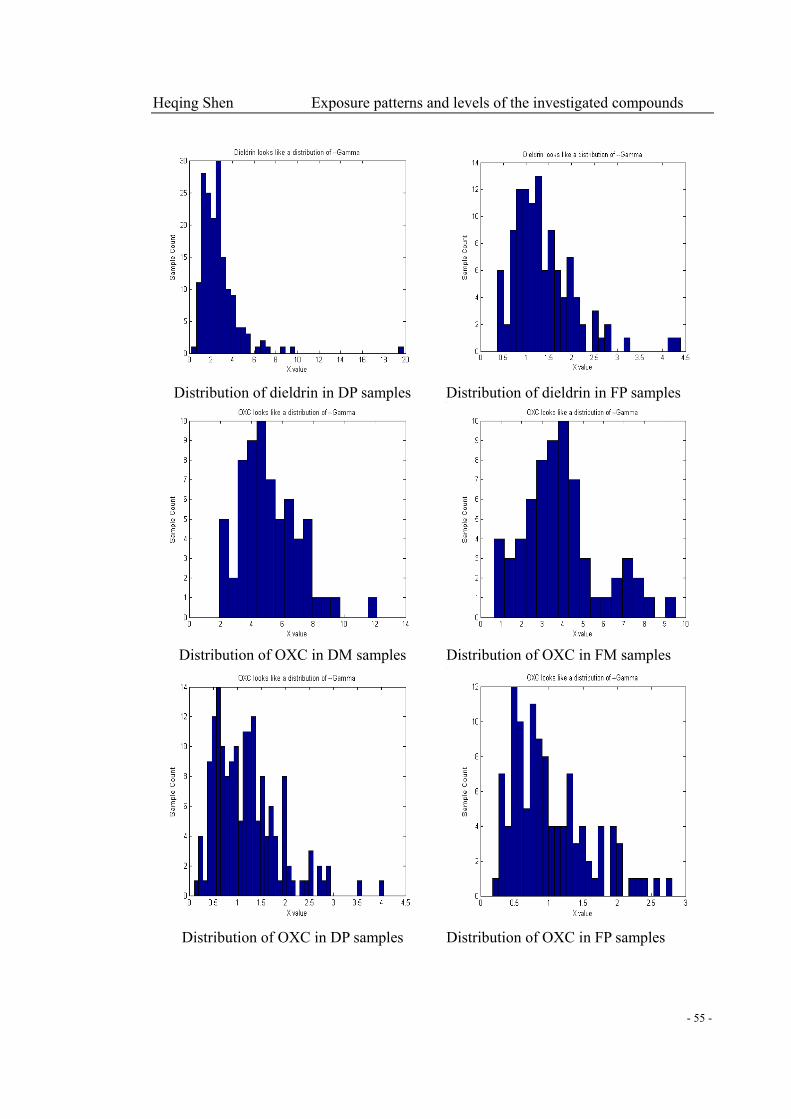
Heqing Shen Exposure patterns and levels of the investigated compounds
- 55 -
Distribution of dieldrin in DP samples Distribution of dieldrin in FP samples
Distribution of OXC in DM samples Distribution of OXC in FM samples
Distribution of OXC in DP samples Distribution of OXC in FP samples
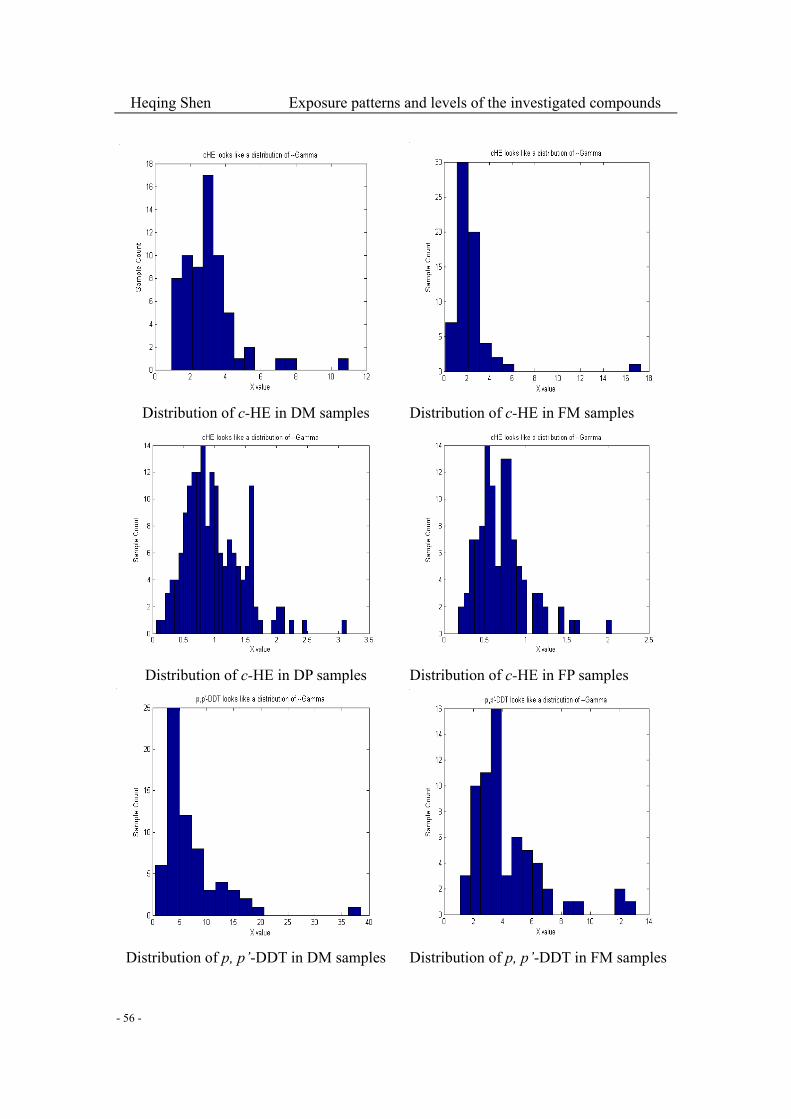
Heqing Shen Exposure patterns and levels of the investigated compounds
- 56 -
Distribution of c-HE in DM samples Distribution of c-HE in FM samples
Distribution of c-HE in DP samples Distribution of c-HE in FP samples
Distribution of p, p’-DDT in DM samples Distribution of p, p’-DDT in FM samples
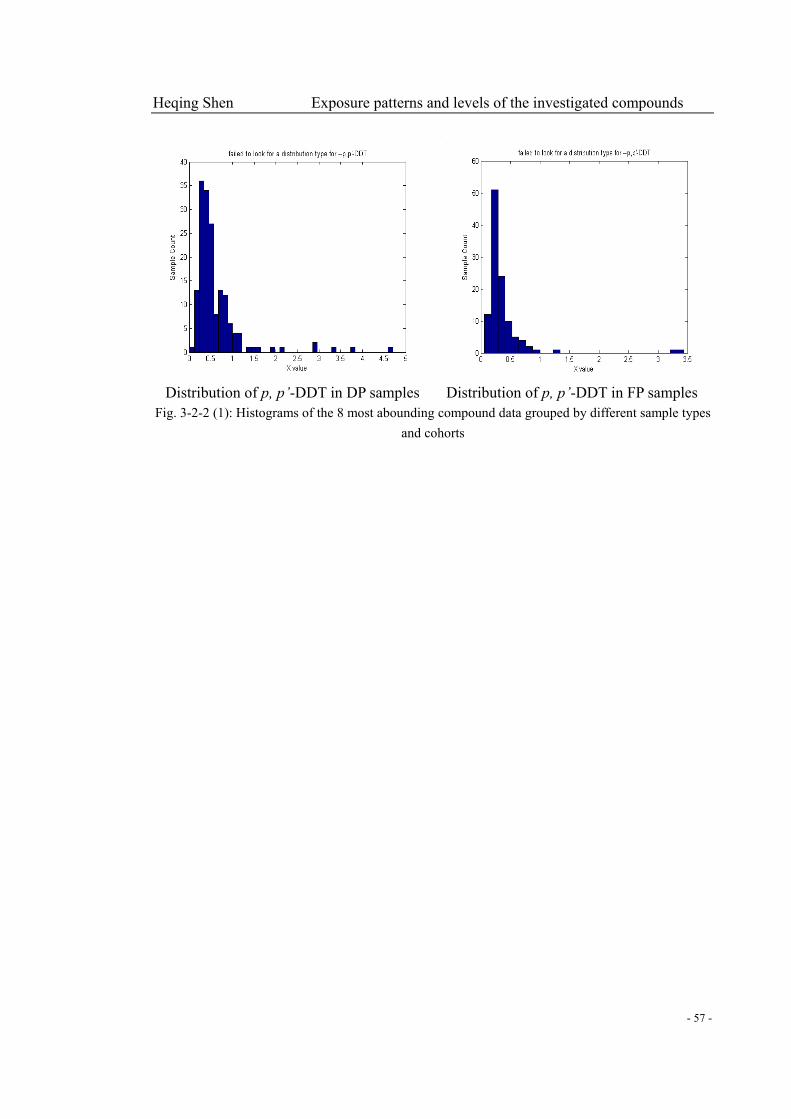
Heqing Shen Exposure patterns and levels of the investigated compounds
- 57 -
Distribution of p, p’-DDT in DP samples Distribution of p, p’-DDT in FP samples Fig. 3-2-2 (1): Histograms of the 8 most abounding compound data grouped by different sample types
and cohorts
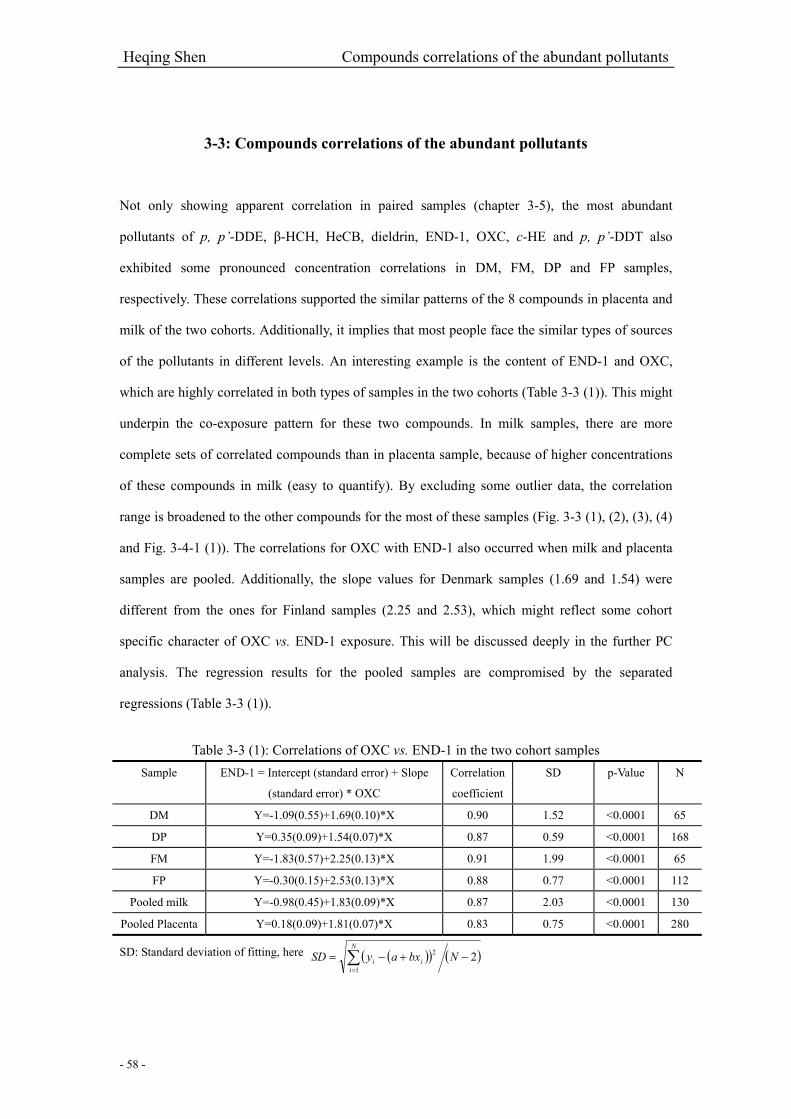
Heqing Shen Compounds correlations of the abundant pollutants
- 58 -
3-3: Compounds correlations of the abundant pollutants
Not only showing apparent correlation in paired samples (chapter 3-5), the most abundant
pollutants of p, p’-DDE, β-HCH, HeCB, dieldrin, END-1, OXC, c-HE and p, p’-DDT also
exhibited some pronounced concentration correlations in DM, FM, DP and FP samples,
respectively. These correlations supported the similar patterns of the 8 compounds in placenta and
milk of the two cohorts. Additionally, it implies that most people face the similar types of sources
of the pollutants in different levels. An interesting example is the content of END-1 and OXC,
which are highly correlated in both types of samples in the two cohorts (Table 3-3 (1)). This might
underpin the co-exposure pattern for these two compounds. In milk samples, there are more
complete sets of correlated compounds than in placenta sample, because of higher concentrations
of these compounds in milk (easy to quantify). By excluding some outlier data, the correlation
range is broadened to the other compounds for the most of these samples (Fig. 3-3 (1), (2), (3), (4)
and Fig. 3-4-1 (1)). The correlations for OXC with END-1 also occurred when milk and placenta
samples are pooled. Additionally, the slope values for Denmark samples (1.69 and 1.54) were
different from the ones for Finland samples (2.25 and 2.53), which might reflect some cohort
specific character of OXC vs. END-1 exposure. This will be discussed deeply in the further PC
analysis. The regression results for the pooled samples are compromised by the separated
regressions (Table 3-3 (1)).
Table 3-3 (1): Correlations of OXC vs. END-1 in the two cohort samples
Sample END-1 = Intercept (standard error) + Slope
(standard error) * OXC
Correlation
coefficient
SD p-Value N
DM Y=-1.09(0.55)+1.69(0.10)*X 0.90 1.52 <0.0001 65
DP Y=0.35(0.09)+1.54(0.07)*X 0.87 0.59 <0.0001 168
FM Y=-1.83(0.57)+2.25(0.13)*X 0.91 1.99 <0.0001 65
FP Y=-0.30(0.15)+2.53(0.13)*X 0.88 0.77 <0.0001 112
Pooled milk Y=-0.98(0.45)+1.83(0.09)*X 0.87 2.03 <0.0001 130
Pooled Placenta Y=0.18(0.09)+1.81(0.07)*X 0.83 0.75 <0.0001 280
SD: Standard deviation of fitting, here ( )( ) ( )21
2 −+−= ∑=
NbxaySDN
iii
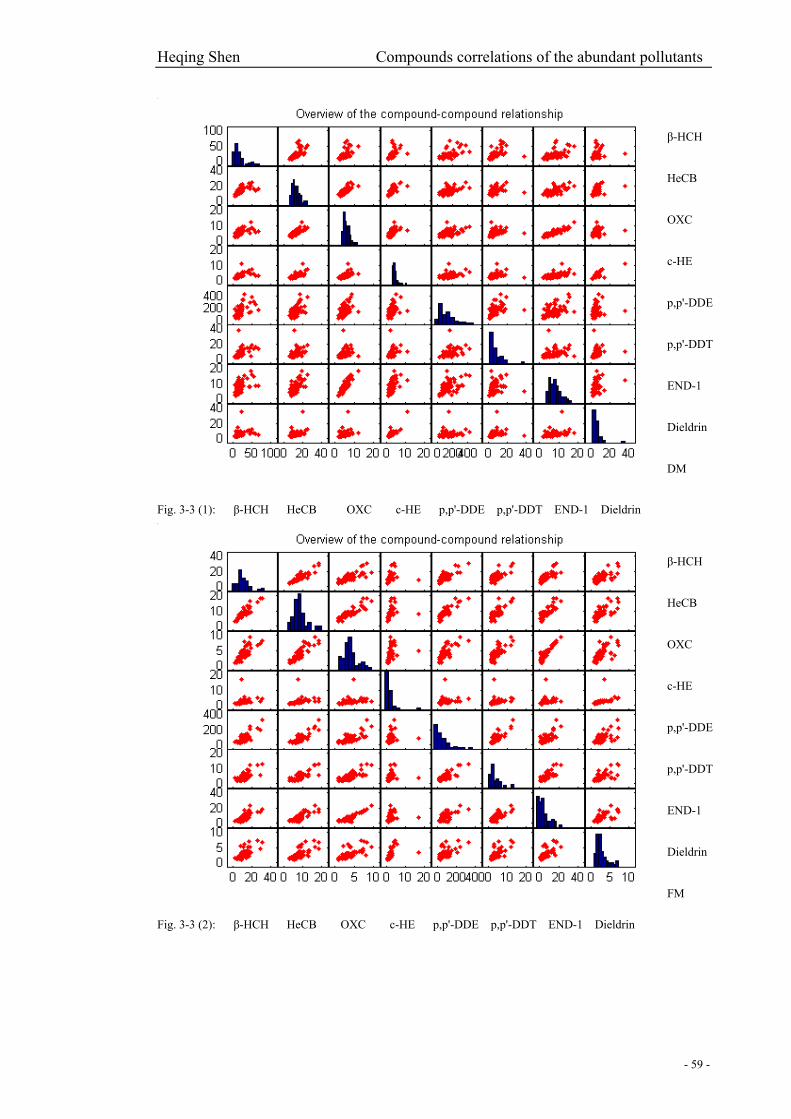
Heqing Shen Compounds correlations of the abundant pollutants
- 59 -
Fig. 3-3 (1): β-HCH HeCB OXC c-HE p,p'-DDE p,p'-DDT END-1 Dieldrin
β-HCH
HeCB
OXC
c-HE
p,p'-DDE
p,p'-DDT
END-1
Dieldrin
DM
β-HCH
HeCB
OXC
c-HE
p,p'-DDE
p,p'-DDT
END-1
Dieldrin
FM
Fig. 3-3 (2): β-HCH HeCB OXC c-HE p,p'-DDE p,p'-DDT END-1 Dieldrin

Heqing Shen Compounds correlations of the abundant pollutants
- 60 -
Fig. 3-3 (3): β-HCH HeCB OXC c-HE p,p'-DDE p,p'-DDT END-1 Dieldrin
β-HCH
HeCB
OXC
c-HE
p,p'-DDE
p,p'-DDT
END-1
Dieldrin
DP
Fig. 3-3 (4): β-HCH HeCB OXC c-HE p,p'-DDE p,p'-DDT END-1 Dieldrin
β-HCH
HeCB
OXC
c-HE
p,p'-DDE
p,p'-DDT
END-1
Dieldrin
DP

Heqing Shen What the PC analysis tell
- 61 -
3-4:What the PC analysis tell
3-4-1: PC analysis for DM, DP, FM and FP
The compound scores characterize the investigated compounds in how far they similarly or
differently contributed to the certain factors behind the variance of the set of samples. For example,
the correlation of OXC with END-1 in DM, DP, FM and FP have been discussed and this
relationship can also be reflected in compound scores for each PC. The apparent character was
OXC and END-1 always occurred closely on the compound score figures, which showed that they
have approximately the same values for 2nd, 3rd PC compound scores. Fig. 3-4-1 (4)-1 to 18 show
the compound score plots and sample score plots of DM, DP, FM and FP samples.
The exposure pattern of every sample might be affected by one or more factors. The 1st PC
interpreted 55.1%, 44.6%, 70.6% and 57.6% of the total variance of DM, DP, FM and FP samples,
respectively. The 1st PC compound scores suggest that all of the 8 abundant compounds positively
contribute to the variance gradient, which were recorded by 1st PC sample scores. That means,
many samples, with the less variance 2nd, 3rd and 4th sample scores (i.e., approximately equal to 0),
could be considered as similarly exposed to pollutant sources. For these samples, the relative
contents for the 8 compounds were similar but at different concentration levels. These mothers
could be expected to have contacted to similar pollutant sources at different extents, such as
similar food feeding habits. These samples could be grouped dictatorially according to their 2nd,
3rd and 4th sample scores and their pollutant source pattern was the most common one, here we
called the most common pollutant pattern. The concentrations of the 8 compounds are nearly
correlated in linear ways, for instance, the 48 DP samples with the rounded 2nd, 3rd and 4th sample
scores of 0 (round the data to integer) (Fig. 3-4-1 (1)). The proposed common exposure patterns
were calculated as the absolute values of 1st PC compound scores multiplied the standard
deviation of the related compound respectively (Fig 3-4-1(2)).

Heqing Shen What the PC analysis tell
- 62 -
β-HCH HeCB OXC c-HE p,p'-DDE p,p'-DDT END-1 Dieldrin
Fig. 3-4-1 (1): 48 DP samples with less variance of 2nd, 3rd and 4th PC sample scores (rounded to 0)
showed linear correlation for each two the 8 compounds (ng/g lipid).
β-HCH
HeCB
OXC
c-HE
p,p'-DDE
p,p'-DDT
END-1
Dieldrin
0
5
10
15
20
25
30
Relative Contnént
DP 2.02 1.13 0.29 0.2 8.42 0.12 0.51 0.49
FP 1.47 0.73 0.23 0.11 5.7 0.08 0.62 0.27
DM 4.75 1.73 0.76 0.61 28.09 1.38 1.37 1.11
FM 1.96 1.25 0.73 0.3 21.56 0.9 1.78 0.5
beta-HCH HeCB OXC cHE p,p'-DDE p,p'-DDT END-1 Dieldrin
Fig. 3-4-1 (2): The proposed common exposure patterns (multiply the absolute value of 1st PC compound score by the standard deviation of certain compound level to special sample).
A different character, comparing the patterns described in geometric means (see the last chapter),
is the relative content of END-1 in the common exposure patterns of Finland cohort was little
higher than in Denmark cohort, and the differences of the relative contents of OXC between the

Heqing Shen What the PC analysis tell
- 63 -
two cohort samples were less than geometric mean patterns. This character did not result from the
lighter exposure of Denmark cohort to END-1 and OXC, but from their different exposure sources.
The further interpreting will be shown in the next chapter by applying PC analysis to the pooled
milk and placenta samples. The other samples might be contaminated by the different pollutant
sources or the sources combined with the most common pollutant pattern. For example, the
relative content of dieldrin and c-HE in sample 25 of DM were apparently higher than that in
sample 44; vice versa, p, p’-DDT in sample 25 was apparently lower (Fig 3-4-1 (3)). The larger
variances for 2nd, 3rd or 4th PC sample scores usually occurred when the samples have higher total
content of the investigated compounds. However, for the samples with the smaller variance of 2nd,
3rd or 4th PC sample scores, their loading of these pollutants covered the whole concentration
changes. It shows that the heavy contamination for these compound might come from various
pollutant sources including the emphasized most common one.
Example of changed compound patterns with varied 2nd PC in DM
0%
20%
40%
60%
80%
100%
beta-HCH HeCB OXC cHE p,p'-DDE p,p'-DDT END-1 Dieldrin
No. 25 No. 44
Score β-HCH HeCB OXC c-HE p,p’-DDE p,p’-DDT END-1 Dieldrin1st PC -0.36 -0.42 -0.40 -0.39 -0.33 -0.24 -0.39 -0.25 2nd PC -0.24 0.01 -0.09 0.44 -0.38 -0.34 -0.04 0.69 Fig. 3-4-1 (3): Compound patterns changing with 2nd PC, especially for c-HE and dieldrin contrary to the rest.

Heqing Shen What the PC analysis tell
- 64 -
1: 1st PC vs.2nd PC compound score in DM 2: 1st PC vs.2nd PC sample score in DM
3: 1st PC vs.3rd PC compound score in DM 4: 1st PC vs.3rd PC sample score in DM
5: 1st PC vs.2nd PC compound score in FM 6: 1st PC vs.2nd PC sample score in FM
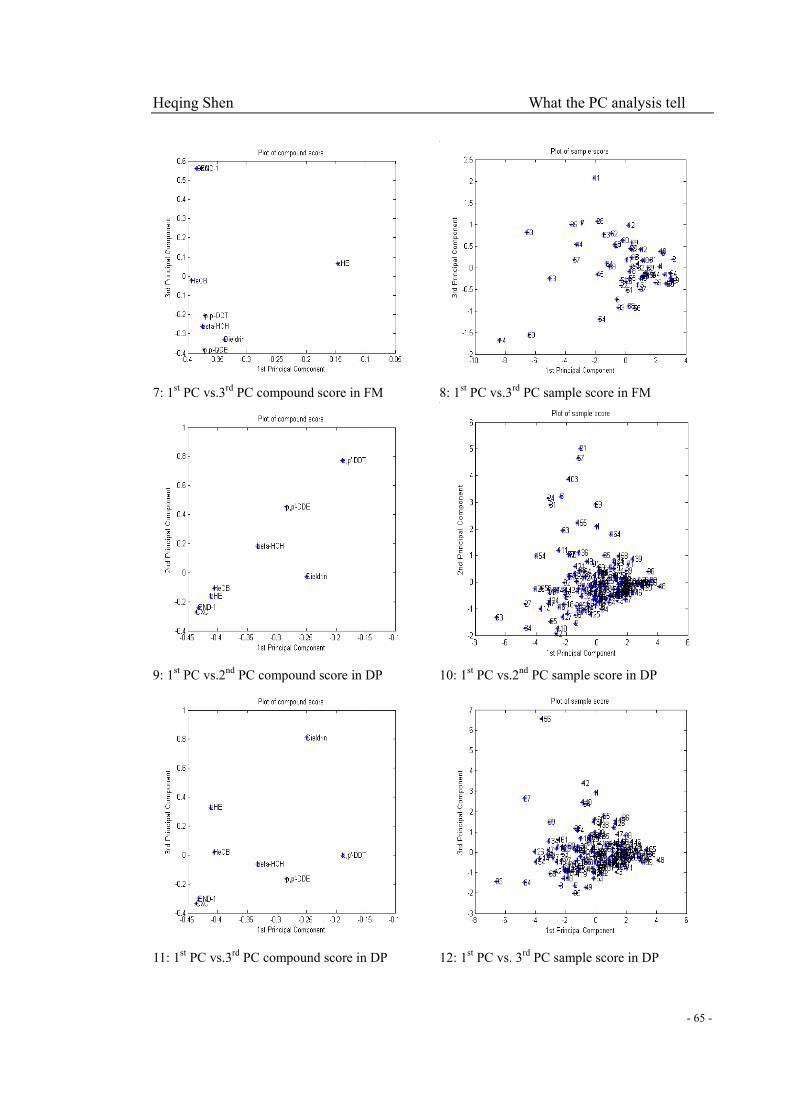
Heqing Shen What the PC analysis tell
- 65 -
7: 1st PC vs.3rd PC compound score in FM 8: 1st PC vs.3rd PC sample score in FM
9: 1st PC vs.2nd PC compound score in DP 10: 1st PC vs.2nd PC sample score in DP
11: 1st PC vs.3rd PC compound score in DP 12: 1st PC vs. 3rd PC sample score in DP

Heqing Shen What the PC analysis tell
- 66 -
13: 1st PC vs. 4th PC compound score in DP 14: 1st PC vs. 4th PC sample score in DP
15: 1st PC vs.2nd PC compound score in FP 16: 1st PC vs.2nd PC sample score in FP
17: 1st PC vs.3rd PC compound score in FP 18: 1st PC vs.3rd PC sample score in FP Fig. 3-4-1 (4): Compound and sample score plots of DM, DF, FM and FP in 1 to 18; larger variance for 2nd and 3rd and 4th PC sample score usually occur in the high concentration side (1st PC samples score interpreted the total concentration variance of the 8 pollutants, also see Fig. 3-4-2 (1)).
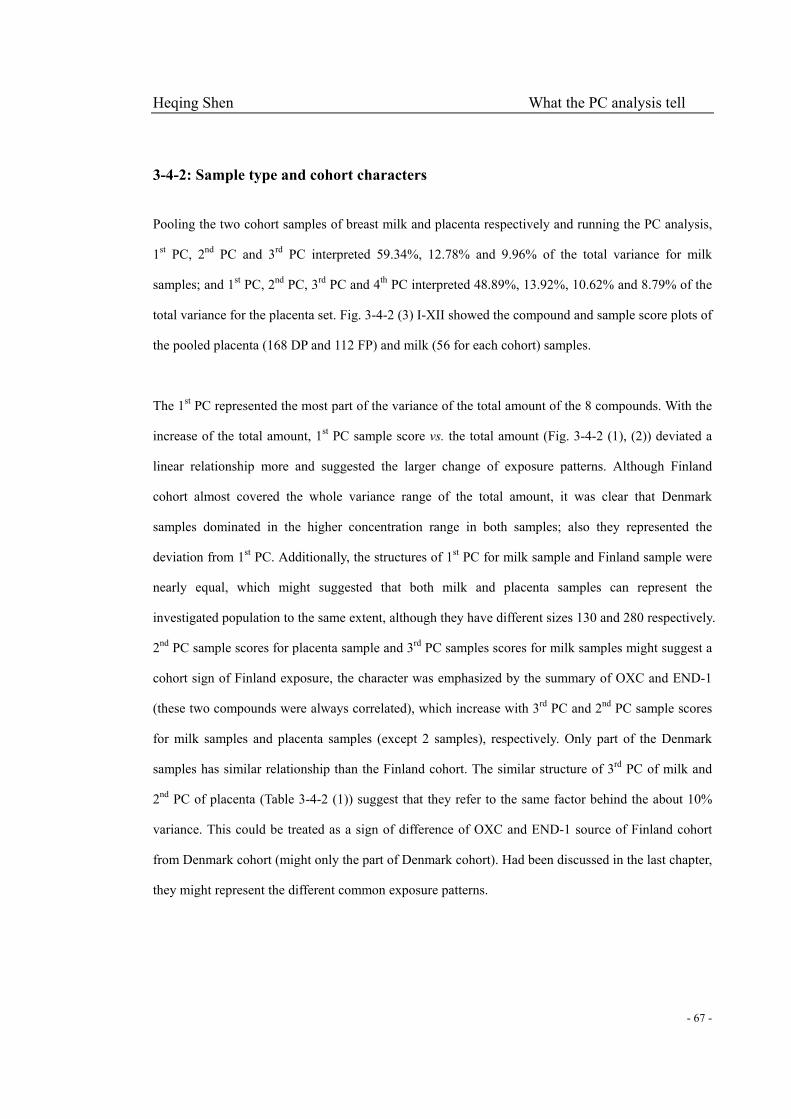
Heqing Shen What the PC analysis tell
- 67 -
3-4-2: Sample type and cohort characters
Pooling the two cohort samples of breast milk and placenta respectively and running the PC analysis,
1st PC, 2nd PC and 3rd PC interpreted 59.34%, 12.78% and 9.96% of the total variance for milk
samples; and 1st PC, 2nd PC, 3rd PC and 4th PC interpreted 48.89%, 13.92%, 10.62% and 8.79% of the
total variance for the placenta set. Fig. 3-4-2 (3) I-XII showed the compound and sample score plots of
the pooled placenta (168 DP and 112 FP) and milk (56 for each cohort) samples.
The 1st PC represented the most part of the variance of the total amount of the 8 compounds. With the
increase of the total amount, 1st PC sample score vs. the total amount (Fig. 3-4-2 (1), (2)) deviated a
linear relationship more and suggested the larger change of exposure patterns. Although Finland
cohort almost covered the whole variance range of the total amount, it was clear that Denmark
samples dominated in the higher concentration range in both samples; also they represented the
deviation from 1st PC. Additionally, the structures of 1st PC for milk sample and Finland sample were
nearly equal, which might suggested that both milk and placenta samples can represent the
investigated population to the same extent, although they have different sizes 130 and 280 respectively.
2nd PC sample scores for placenta sample and 3rd PC samples scores for milk samples might suggest a
cohort sign of Finland exposure, the character was emphasized by the summary of OXC and END-1
(these two compounds were always correlated), which increase with 3rd PC and 2nd PC sample scores
for milk samples and placenta samples (except 2 samples), respectively. Only part of the Denmark
samples has similar relationship than the Finland cohort. The similar structure of 3rd PC of milk and
2nd PC of placenta (Table 3-4-2 (1)) suggest that they refer to the same factor behind the about 10%
variance. This could be treated as a sign of difference of OXC and END-1 source of Finland cohort
from Denmark cohort (might only the part of Denmark cohort). Had been discussed in the last chapter,
they might represent the different common exposure patterns.

Heqing Shen What the PC analysis tell
- 68 -
-8
-6
-4
-2
0
2
4
0 100 200 300 400Total 8 pollutant content (ng/g
lipid)
1st PC sample score
Finlandplacenta
Denmarkplacenta
-8
-6
-4
-2
0
2
4
0 200 400 600Total 8 pollutant content (ng/g
lipid)
1st PC sample score
Finlandmilk
Denmarkmilk
Fig 3-4-2 (1): 1st PC sample score interpreted the most part of the total variance amount of the 8 pollutants in placenta and milk; the other part variance mainly involved the higher contaminated Denmark samples because of the increasing deviation from a line with the increase of the total content.
-5
-4
-3
-2
-1
0
1
2
3
4
5
0 5 10 15
Summary of OXC and END-1 (ng/g lipid)
2nd PC sample score
Finlandplacenta
Denmarkplacenta
-5
-4
-3
-2
-1
0
1
2
3
4
0 10 20 30 40
Summary of OXC and END-1 (ng/g
lipid)
3rd PC sample score
Finlandmilk
Denmarkmilk
Fig 3-4-2 (2): the summary of OXC and END-1 increase with 3rd PC and 2nd PC sample scores for milk samples and placenta samples (except 2 samples) in Finland samples.
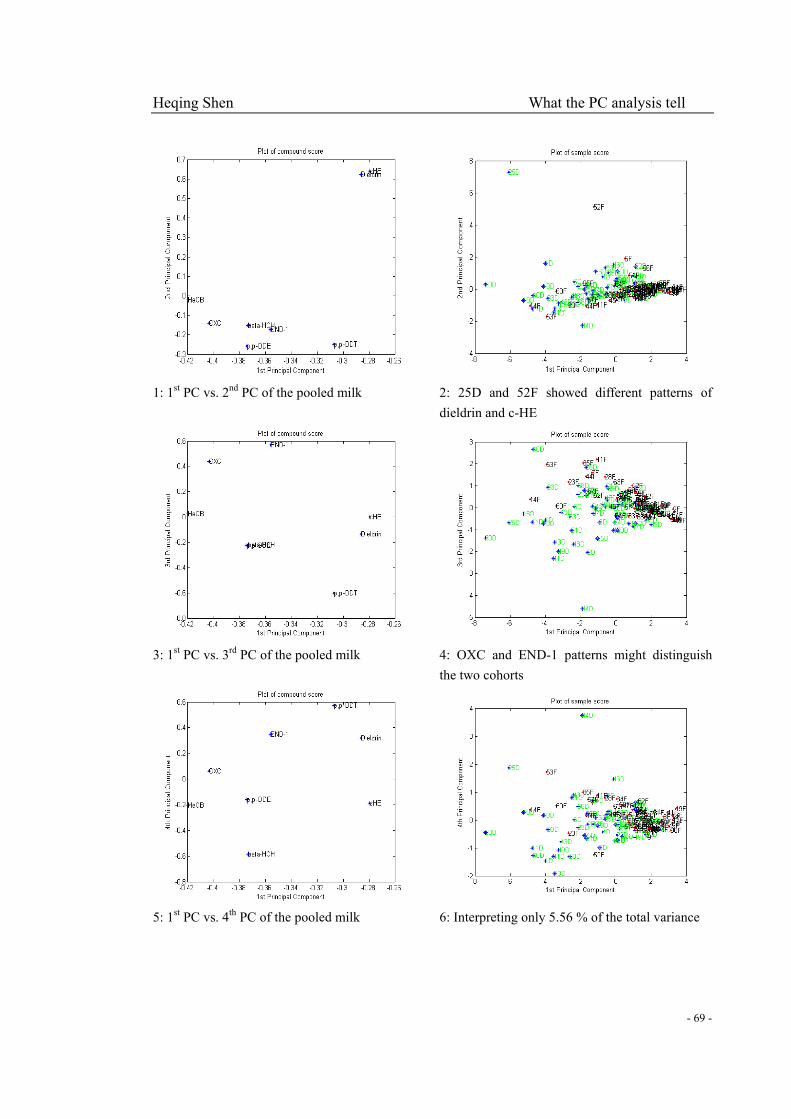
Heqing Shen What the PC analysis tell
- 69 -
1: 1st PC vs. 2nd PC of the pooled milk 2: 25D and 52F showed different patterns of dieldrin and c-HE
3: 1st PC vs. 3rd PC of the pooled milk 4: OXC and END-1 patterns might distinguish the two cohorts
5: 1st PC vs. 4th PC of the pooled milk 6: Interpreting only 5.56 % of the total variance

Heqing Shen What the PC analysis tell
- 70 -
7: 1st PC vs. 2nd PC of the pooled placenta 8: OXC and END-1 patterns might distinguish the two cohorts
9: 1st PC vs. 3rd PC of pooled placenta 10: Interpreting only 10.62% of the total variance
11: 1st PC vs. 4th PC of the pooled placenta 12: Interpreting only 8.79% of the total variance Fig. 3-4-2 (3): Compound and sample score plots (1 to 12) of the pooled placenta (168 DP and 112 FP) and milk (56 for each cohort) samples

Heqing Shen What the PC analysis tell
- 71 -
Table 3-4-2 (1): Principal components interpreted more than 82% of the total variance of pooled milk (PM) and pooled placenta (PP) samples.
β-HCH HeCB OXC c-HE p,p'-DDE p,p'-DDT END-1 Dieldrin
PM-1st PC -0.37 -0.42 -0.40 -0.28 -0.37 -0.31 -0.36 -0.29 PM-2nd PC -0.15 -0.02 -0.14 0.64 -0.26 -0.25 -0.17 0.62
PM-3rd PC -0.22 0.03 0.44 0.00 -0.22 -0.60 0.57 -0.13
PM-4th PC -0.58 -0.21 0.06 -0.19 -0.16 0.57 0.35 0.32
PP-1st PC -0.35 -0.42 -0.40 -0.40 -0.34 -0.21 -0.35 -0.31 PP-2nd PC -0.15 -0.06 0.49 -0.06 -0.24 -0.49 0.56 -0.35
PP-3rd PC 0.01 -0.17 0.14 -0.37 0.23 0.69 0.23 -0.48 PP-4th PC 0.63 0.28 -0.11 -0.14 0.25 -0.35 -0.24 -0.51
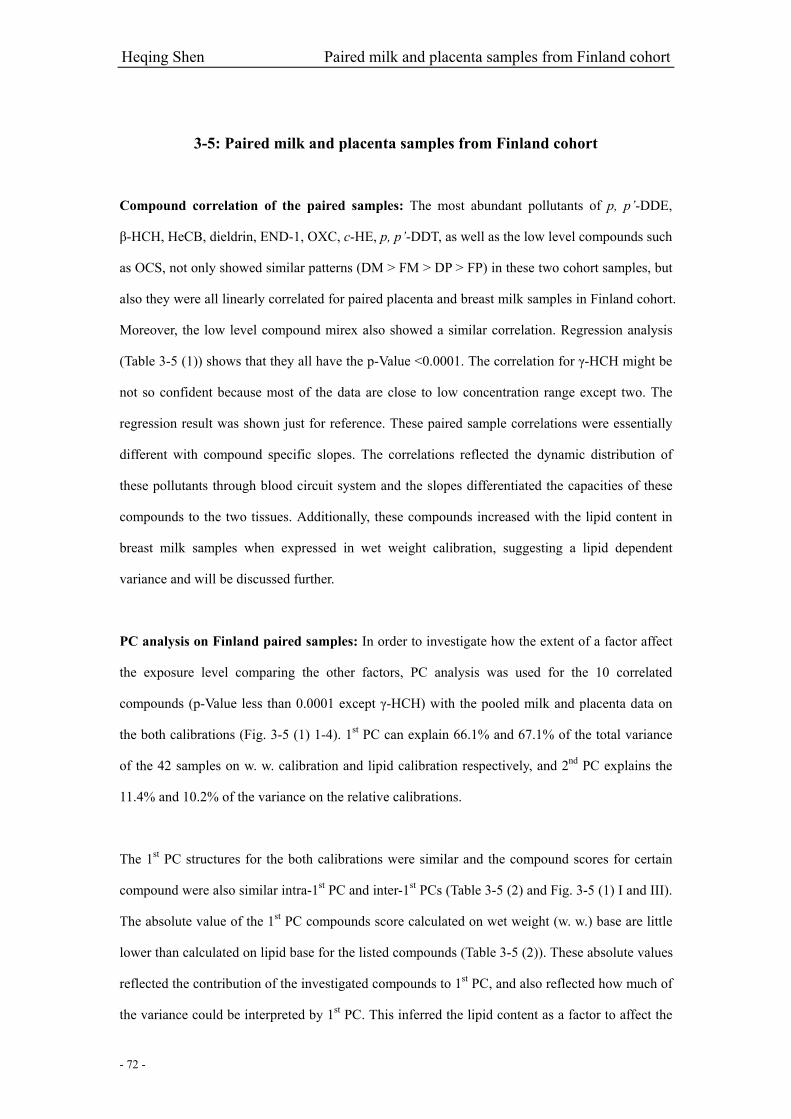
Heqing Shen Paired milk and placenta samples from Finland cohort
- 72 -
3-5: Paired milk and placenta samples from Finland cohort
Compound correlation of the paired samples: The most abundant pollutants of p, p’-DDE,
β-HCH, HeCB, dieldrin, END-1, OXC, c-HE, p, p’-DDT, as well as the low level compounds such
as OCS, not only showed similar patterns (DM > FM > DP > FP) in these two cohort samples, but
also they were all linearly correlated for paired placenta and breast milk samples in Finland cohort.
Moreover, the low level compound mirex also showed a similar correlation. Regression analysis
(Table 3-5 (1)) shows that they all have the p-Value <0.0001. The correlation for γ-HCH might be
not so confident because most of the data are close to low concentration range except two. The
regression result was shown just for reference. These paired sample correlations were essentially
different with compound specific slopes. The correlations reflected the dynamic distribution of
these pollutants through blood circuit system and the slopes differentiated the capacities of these
compounds to the two tissues. Additionally, these compounds increased with the lipid content in
breast milk samples when expressed in wet weight calibration, suggesting a lipid dependent
variance and will be discussed further.
PC analysis on Finland paired samples: In order to investigate how the extent of a factor affect
the exposure level comparing the other factors, PC analysis was used for the 10 correlated
compounds (p-Value less than 0.0001 except γ-HCH) with the pooled milk and placenta data on
the both calibrations (Fig. 3-5 (1) 1-4). 1st PC can explain 66.1% and 67.1% of the total variance
of the 42 samples on w. w. calibration and lipid calibration respectively, and 2nd PC explains the
11.4% and 10.2% of the variance on the relative calibrations.
The 1st PC structures for the both calibrations were similar and the compound scores for certain
compound were also similar intra-1st PC and inter-1st PCs (Table 3-5 (2) and Fig. 3-5 (1) I and III).
The absolute value of the 1st PC compounds score calculated on wet weight (w. w.) base are little
lower than calculated on lipid base for the listed compounds (Table 3-5 (2)). These absolute values
reflected the contribution of the investigated compounds to 1st PC, and also reflected how much of
the variance could be interpreted by 1st PC. This inferred the lipid content as a factor to affect the

Heqing Shen Paired milk and placenta samples from Finland cohort
- 73 -
distribution of these compounds among tissues. 2nd PC compound scores for certain compound are
also similar on the lipid calibration but with opposite signs on w. w. calibration. The similar
structure of the two 1st PCs suggest that the both calibrations could reflect the variance controlled
by the same factor at the same extent (Fig 3-5 (2)); this factor should be the environmental
pollutant level faced by different subjects. In other words, in the two calibration methods were no
difference on that. The 1st PC score similar (including 2nd PC compound scores on lipid calibration;
Fig 3-5 (1) 1 and 3) for certain compounds reflected the correlations of these pollutants between
the paired samples, which had been discussed (Table 3-5 (1)). The sign of the different compound
scores for certain compounds on w. w. calibration (Table 3-5 (2) and Fig 3-5 (1) 1) depicts the
variance introduced by lipid content difference, which mean the variance interpreted by 2nd PC
sample scores was the result of sample specific lipid change (Fig. 3-5 (3)), and the variance were
diminished by lipid calibration, so called lipid normalization. The gained additional information
was that lipid differences introduce about 11.4% of the total variance.
The regression analysis of 2nd PC sample score versus lipid variance (Fig. 3-5 (3)) might
characterize the more fatty, higher lipophilic contaminant level for milk samples, but at only about
1/6 contribution when comparing the personally faced environmental difference of levels. The
lipid contribution to 2nd PC samples score for placenta sample was much lower because of the
lower fat content of placenta tissues.
The 2nd PC sample scores on lipid calibration, referring to the compound pattern variance (Fig.3-5
(1) 3), might be interpreted as different pollutant sources for these compounds (have been
discussed), especially emphasizing on compounds mirex vs. c-HE and dieldrin. An extreme
example is sample No. 11 compared to No. 34. Few samples (No. 42, 15, 38, 14) could be clearly
grouped with No. 11 and only No. 34 with No. 12 (Fig.3-5 (1) 4). Fig 3-5 (4) showed that the
pollutant source of mirex might be different to the source of c-HE and dieldrin for these samples.
However, 2nd PC counts only 10.2% of the total variance, which implies that these pollutants had
been well ‘homogenized’ by the environmental physical or biological processes when they reached
the human body after a long time-space transfer. The other PCs, which totally count the rest of
22.7% variance, should be considered as other compound patterns and each involved lower sample

Heqing Shen Paired milk and placenta samples from Finland cohort
- 74 -
variance than 2nd PC.
Table 3-5 (1): Linear regression results of Finland breast milk samples versus placenta samples
Compound Milk = Intercept (standard error) + Slope (standard error) * Placenta
Correlation coefficient
Standard deviation
p-Value N
β-HCH y = 1.681 (±0.874) + 1.970 (±0.159) x 0.890 2.145 <0.0001 42γ-HCH y = -0.475 (±0.169) + 1.180 (±0.165) x 0.749 0.490 <0.0001 42HeCB y =0.663 (±0.535) + 1.592 (±0.103) x 0.926 1.152 <0.0001 42OCS y = 0.003 (±0.035) + 1.500 (±0.246) x 0.694 0.094 <0.0001 42
Mirex y = 0.019 (±0.033) + 1.229 (±0.116) x 0.860 0.119 <0.0001 42END-1 y = 1.729 (±0.690) + 2.188 (±0.221) x 0.843 2.593 <0.0001 42Dieldrin y = 0.216 (±0.222) + 1.931 (±0.144) x 0.904 0.671 <0.0001 42
c-HE y = 0.209 (±0.143) + 2.741 (±0.181) x 0.923 0.381 <0.0001 42OXC y = 1.012 (±0.301) + 2.743 (±0.240) x 0.875 0.925 <0.0001 42
o, p’-DDE y = 0.007 (±0.009) + 1.541 (±0.366) x 0.559 0.026 0.00014 41p, p’-DDE y = 12.397 (±6.346) + 3.043 (±0.246) x 0.890 24.078 <0.0001 42p, p’-DDT y = 0.984 (±0.657) + 11.20 (±1.948) x 0.673 1.876 <0.0001 42p, p’-DDD y = 0.241 (±0.071) + 0.277 (±0.097) x 0.410 0.265 0.0070 42
Table 3-5 (2): The structure of 1st PC and 2nd PC on wet weight and lipid calibrations
β-HCH HeCB OCS p,p'-DDT p,p'-DDE OXC c-HE dieldrin END-1 mirex1st PC-M (w.w.) -0.23 -0.24 -0.25 -0.24 -0.24 -0.24 -0.21 -0.23 -0.25 -0.192nd PC-M (w.w.) 0.27 0.28 0.13 0.16 0.06 0.24 0.35 0.25 0.15 0.131st PC-P (w.w.) -0.22 -0.24 -0.20 -0.20 -0.22 -0.24 -0.21 -0.22 -0.21 -0.182nd PC-P (w.w.) -0.19 -0.21 -0.31 -0.21 -0.22 -0.27 -0.06 -0.12 -0.32 -0.261st PC-M (lipid) -0.25 -0.25 -0.23 -0.24 -0.23 -0.25 -0.18 -0.21 -0.24 -0.172nd PC-M (lipid) 0.07 -0.03 -0.09 -0.05 -0.12 -0.10 0.47 0.35 -0.10 -0.351st PC-P (lipid) -0.21 -0.25 -0.22 -0.19 -0.23 -0.25 -0.20 -0.22 -0.23 -0.182nd PC-P (lipid) 0.07 -0.05 -0.14 0.03 -0.00 -0.15 0.41 0.35 -0.16 -0.34

Heqing Shen Paired milk and placenta samples from Finland cohort
- 75 -
1: 1st PC-2nd PC compound score on w. w. base 2: 1st PC-2nd PC sample score on w. w. base
3: 1st PC-2nd PC compound score on lipid base 4: 1st PC-2nd PC sample score on lipid base Fig. 3-5 (1): Compound score and sample score plots for paired samples
y = 0.9297x - 6E-06
R2 = 0.8774
-15
-10
-5
0
5
10
-15 -10 -5 0 5 10
1st PC sample score on lipid
calibration
1st PC sample score on wet weght
calibration
y = -0.0214x + 1.2167
R2 = 0.0811
y = 0.8302x + 4.721
R2 = 0.6201
0
2
4
6
8
10
12
-5 0 5 10
2nd PC sample score
Lipid content (g/g w.w.) Placenta Milk
Fig. 3-5 (2): Sample score on lipid base & w. w. base referring the same factor behind the 1st PC.
Fig. 3-5 (3): 2nd PC sample score on w. w. base referred variance introduced by lipid difference
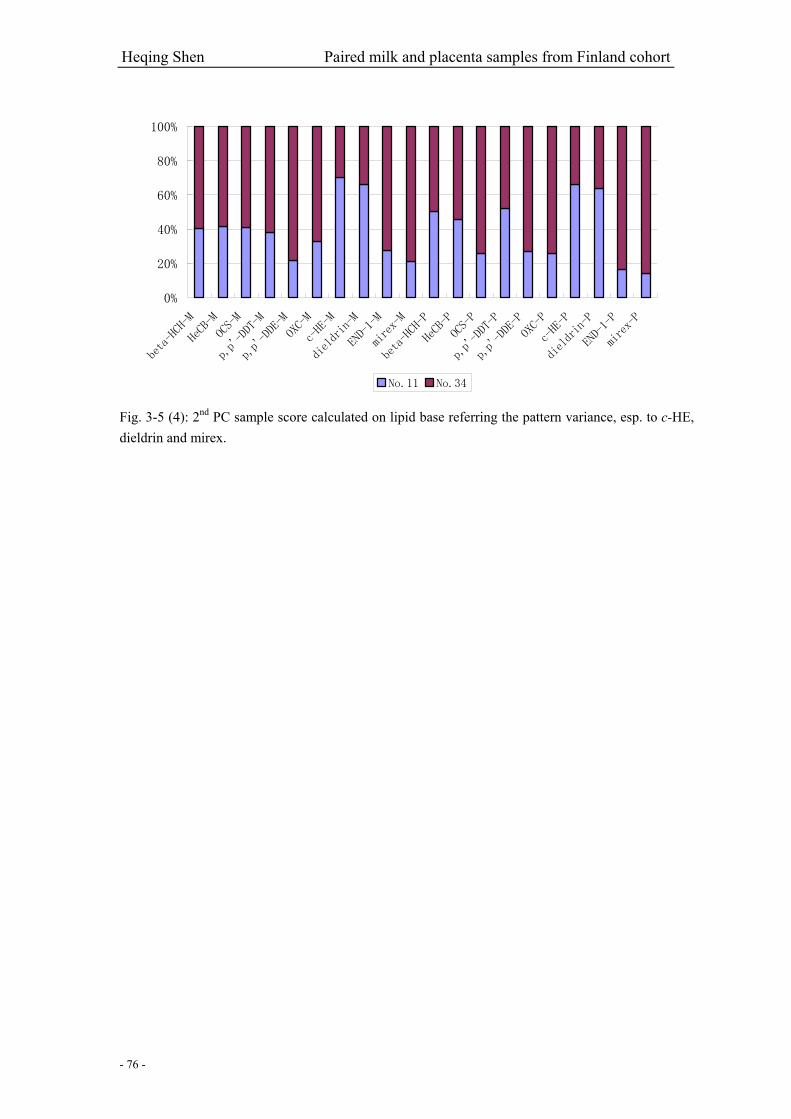
Heqing Shen Paired milk and placenta samples from Finland cohort
- 76 -
0%
20%
40%
60%
80%
100%
beta-HCH-M
HeCB-M
OCS-M
p,p'-DDT-M
p,p'-DDE-M
OXC-M
c-HE-M
dieldrin-M
END-1-M
mirex-M
beta-HCH-P
HeCB-P
OCS-P
p,p'-DDT-P
p,p'-DDE-P
OXC-P
c-HE-P
dieldrin-P
END-1-P
mirex-P
No.11 No.34
Fig. 3-5 (4): 2nd PC sample score calculated on lipid base referring the pattern variance, esp. to c-HE, dieldrin and mirex.

Heqing Shen Enantioselective residuals of the c-PBTs in mother samples
- 77 -
3-6: Enantioselective residuals of the c-PBTs in mother samples
3-6-1: Information from ERs
The physical processes (leaching, volatilization, and atmospheric deposition) and abiotic reactions
(hydrolysis and photolysis) for chiral compounds are unaffected (Bidleman et al. 1999). ERs
exhibit only the information of biotransformation or biodegradation of these pollutants. It is
helpful because we usually not need to consider these factors when we focus on biotic processes
of these compounds. However, ER values were usually difficult to determine at high precision
because of the low concentrations. Although tissue specific ERs for certain c-PBTs had been well
documented, these differences could be the result of different enzyme activities or blood brain
barrier in different tissues, especially for tissue liver, kidney and brain (Kallenborn et al., 2000).
Assuming dynamic equilibrium of c-PBTs among organs and tissues, the ERs of the low enzyme
activity tissues, such as breast and adipose tissue, might mainly depended on the enzyme active
tissues, with emphasizing the liver. However, the metabolic activity of the placenta is almost as
large as that of the fetus itself (Berry et al., 1977; Chao et al., 1980; St-Pierre et al., 2002). ER
analysis between paired milk and placenta samples (Fig. 3-6-1 (1)) showed placenta might
contribute more metabolic activity to c-HE than breast tissues because of the generally larger ER
values and the range in placenta than in milk samples. Enzyme activity for biotransformation
might associate with the more effective detoxification function of placenta than breast tissue. No
apparent correlation was found between the ERs of the invested c-PBTs in the paired samples. For
α-HCH, c-HE (might include o, p’-DDD), ER vs. (+)-or (-)-enantiomer concentration profiles
show the concentration tendency of the ERs (Fig. 3-6-1 (2), (3), (5)). Because of the probable
continuous exposure mode and the possible variation of ER sources, the ER-concentration patterns
could be more complex than the well-documented single dose model (Walter et al., 2001; Wong et
al., 2002; 2004). No structural characters had been found for chiral OXC (Fig. 3-6-1 (4)). The
possible reasons is that OXC is the metabolite of both c-CHL and t-CHL, which have been
reported as apparent different OXC enantioselective sources in mammalians (Buser et al, 1992).

Heqing Shen Enantioselective residuals of the c-PBTs in mother samples
- 78 -
Few samples also showed inverse ERs for α-HCH (Fig. 3-6-1 (7) and Table 3-6-1 (1)). Only one
sample had the detected level of HC, which showed an enantioselective residual (Fig. 3-6-1 (8)).
The abnormal data (ER for c-HE near to 1 and for α-HCH much larger than 1) might result from a
special source or might reflect different enzyme activity of the special mother. The generally
enantioselective enrichment of (-)-α-HCH (Fig. 3-6-1 (2)) might be associated with a lower risk
factor than the accumulation of (+)-α-HCH (Kallenborn et al. 2000). According the in vitro results,
the estrogenic activity of o, p’-DDT residuals might be overestimated because the enantioselective
biodegradation of the (-)-o, p’-DDT (Fig. 3-6-1 (6)), which is the active estrogen whereas hER
activity of (+)-o, p'-DDT was negligible (Hoekstra et al., 2001). Therefore, it could assume that
human evolved removing the more toxic isomer firstly from body than the less toxic one in case of
the possible adverse effect.
Table 3-6-1 (1): Data of ER and (+)-, (-)- α-HCH concentrations not included in Fig. 3-6-1 (2)
Different ER 19DP 7FM 12FM 62FM High level 2FP 13FP 19FP 32FP 71FP 79FP
(-)-α-HCH 0.07 0.21 0.39 0.06 (-)-α-HCH 392.94 12.05 17.82 50.46 6.45 10.64
(+)-α-HCH 0.1 0.58 0.48 0.11 (+)-α-HCH 413.66 12.37 18.12 49.33 6.51 10.16
ER(10%) 1.28 2.8 1.26 1.79 ER(10%) 1.05 1.03 1.02 0.98 1.01 0.95

Heqing Shen Enantioselective residuals of the c-PBTs in mother samples
- 79 -
0
1
2
3
4
0 1 2 3 4
Placenta ER
Milk ER c-HE
alpha-HCH
OXC
Fig. 3-6-1 (1): ER of the paired Finland and Denmark milk and placenta samples
0
0.2
0.4
0.6
0.8
1
1.2
1.4
0 1 2 3 4 5 6
(-)-alpha-HCH (ng/g lipid)
ER of alpha-HCH
DP FP DM FM
Fig. 3-6-1 (2): (-)-α-HCH is usually the isomer enantioselective enriched in the investigated mother samples.
0.5
1.5
2.5
3.5
4.5
0 2 4 6 8 10 12
(+)-c-HE (ng/g lipid)
ER of c-HE
DP FP DM FM
Fig. 3-6-1 (3): (+)-c-HE is the enantioselective enrichment isomer in the investigated mother samples

Heqing Shen Enantioselective residuals of the c-PBTs in mother samples
- 80 -
0
0.5
1
1.5
2
2.5
3
0 1 2 3 4 5 6 7 8
(+)-OXC (ng/g lipid)
ER of OXC
DM FM DP FP
Fig. 3-6-1 (4): (+)-OXC, usually, is the enantioselective enrichment isomer in the investigated mother samples
0
0.2
0.4
0.6
0.8
1
1.2
1.4
0 0.2 0.4 0.6 0.8 1 1.2 1.4
o,p'-DDD(II) concentration (ng/g lipid)
ER of o,p'-DDD
DP FP DM FM
Fig. 3-6-1 (5): o,p’-DDD (II) is the enantioselective enrichment isomer in the investigated mother samples
0
1
2
3
4
5
6
0 0.5 1 1.5 2
(+)-o,p'-DDT concentration (ng/g lipid)
ER of o,p'-DDT
DM FM DP FP
Fig. 3-6-1 (6): (+)-o,p’- DDT is the enantioselective enrichment isomer in the investigated mother samples
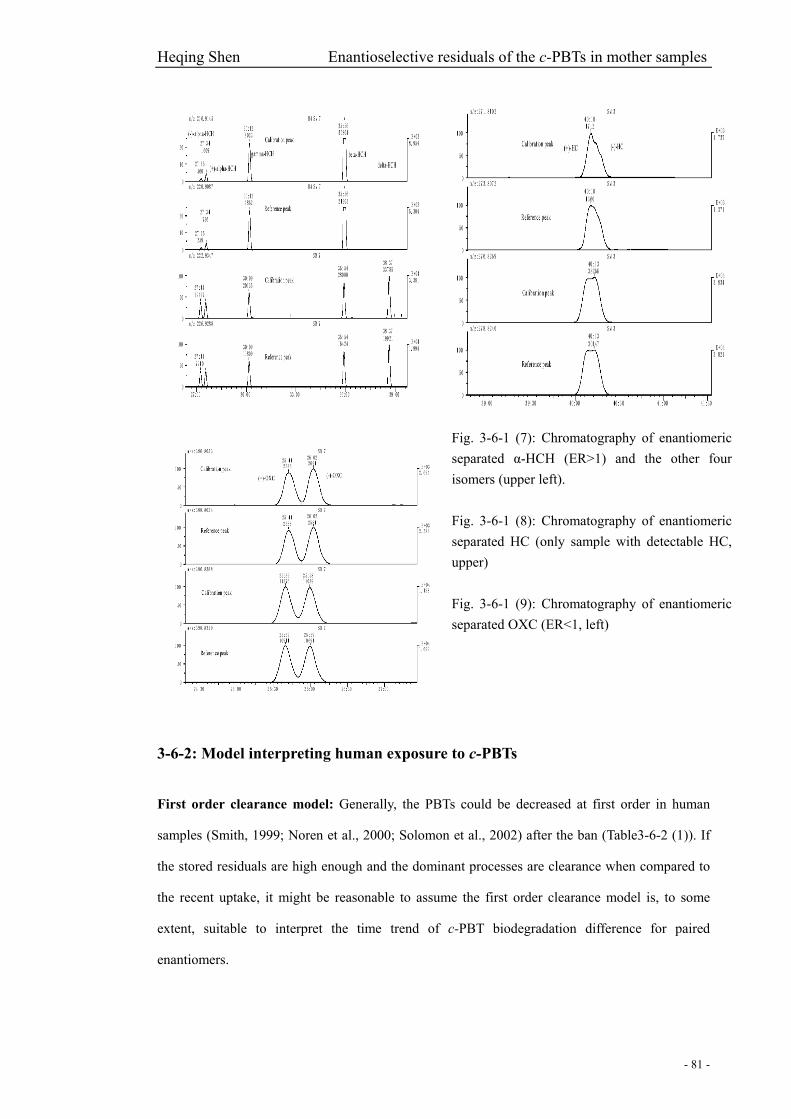
Heqing Shen Enantioselective residuals of the c-PBTs in mother samples
- 81 -
Fig. 3-6-1 (7): Chromatography of enantiomeric separated α-HCH (ER>1) and the other four isomers (upper left). Fig. 3-6-1 (8): Chromatography of enantiomeric separated HC (only sample with detectable HC, upper) Fig. 3-6-1 (9): Chromatography of enantiomeric separated OXC (ER<1, left)
3-6-2: Model interpreting human exposure to c-PBTs
First order clearance model: Generally, the PBTs could be decreased at first order in human
samples (Smith, 1999; Noren et al., 2000; Solomon et al., 2002) after the ban (Table3-6-2 (1)). If
the stored residuals are high enough and the dominant processes are clearance when compared to
the recent uptake, it might be reasonable to assume the first order clearance model is, to some
extent, suitable to interpret the time trend of c-PBT biodegradation difference for paired
enantiomers.

Heqing Shen Enantioselective residuals of the c-PBTs in mother samples
- 82 -
Table3-6-2 (1): OCs in human milk (pool) adapted to a first order decrease in the past 20-30 years*
Compound DDT DDE MeSO2-DDE Dieldrin HeCB
Clearance rate (k, year-1) -0.162 -0.113 -0.121 -0.117 -0.118
*Noren et al, 2000, C = C0e-kt, C0 is the initial concentration when clearance started.
In a cohort, the variance of each sample could be tentatively treated as the sample exited at a
time-specific history point of a clearance processes from certain concentration. For paired
enantiomers, time related enantiomeric residual of (+)-/(-)-isomer could be also simply described
by first-order kinetics of clearance without considering the physical clearance like fecal excretion,
which usually are non-enantioselective processes. Enantiomeric ratios of biota samples ER can be
defined as:
−+= CCER (1)
In one-time single dose exposure to environmental chiral pollutants, the stored residual
concentrations for (+)-, and (-)-isomers are Cs+, Cs-, and ER can be described as equation (2), (3)
and (4) (Walter et al., 2001; Wong et al., 2002; 2004), where C0+ and C0- are the initial respective
concentrations:
tks eCC +−
++ = 0 (2)
tks eCC −−
−− = 0 (3)
tkks eCCER )(
00 )( −+ −−−+= (4)
−+= 00 CCα (5)
−+= kkβ (6)
Here we further define the parameters α, β (equation 5, 6), α describe the ER when exposure is
terminated and β reflects the difference of enantioselective biodegradation. Transforming the
time-function of ER (equation 4) to the concentration-functions and linearising to equation (7) and
(8).
))(11( 0 ++ −−+= sLnCLnCLnLnER βα (7)
))(1( 0 −− −−+= sLnCLnCLnLnER βα (8)

Heqing Shen Enantioselective residuals of the c-PBTs in mother samples
- 83 -
New uptake changing stored ER: However, the observed ER vs. concentration patterns of c-HE
and α-HCH suggested the partly true of the model. The upper border data of c-HE pattern can be
well described by the linear relationship (7) and (8). However, ERs changed much at the low
concentration range; this might be the result of the recent exposure, expressed as Cuptake+ or Cuptake-,
respectively. That means at the higher concentration range, the clearance processes was dominated
because of the relative higher-level of residuals. On the other hand, the uptake rate was dominated
at the lower concentration range for some samples because the historical residuals were relative
low. The ERs of these samples are determined by the recent uptake, which should reflect ER
values of the environment pollutants. Assumption of all people facing a recent uptake, the model
could be modified to equation (9).
)()( −−++−+ ++== suptakesuptake CCCCCCER (9)
Observed data from mother samples: The patterns should basically reflect the combined single
dose of enantioselective biodegradation and recent exposure. However, it is little knowledge about
the environmental ER values (ERen) of the chiral pollutants from person to person. Here it is just
assumed that the recent uptake reflects ERen, which should be equal to α. By the plotted patterns
(Fig. 3-6-1 (2) and (3)), it could be suitable to assume ERen is close to 1 for α-HCH and 1.4 for
c-HE.
The milk data in 1985 showed HC was 70 (±60) and c-HE was 100 (±400) ng/g lipid
(Mussalo-Rauhamaa et al, 1988) and the present determination showed HC are completely
changed. Considering that HC is less stable than c-HE in the human body, the present ER
changes might have resulted mainly from the slowly degradation of c-HE. Equation 2, 3 describe
the first order clearance of the stored (+) or (-)-c-HE from C0+ or C0- at time zero (t =0). When
transforming the time-function of ER to the linearized C+ or C--function by assuming each
observed C+ or C- reflecting the residuals of C0+ or C0- at different time, equation 7 and 8 show the
correlation between LnER and LnCs+ or LnCs-. Assume that in case of upper border data (Fig. 3-6-2
(1)), the recent uptake for c-HE can be neglected (Cs+ and Cs- is dominant). For this tentative
evaluation the few border data could be used in a first order clearance process (Walter et al., 2001)
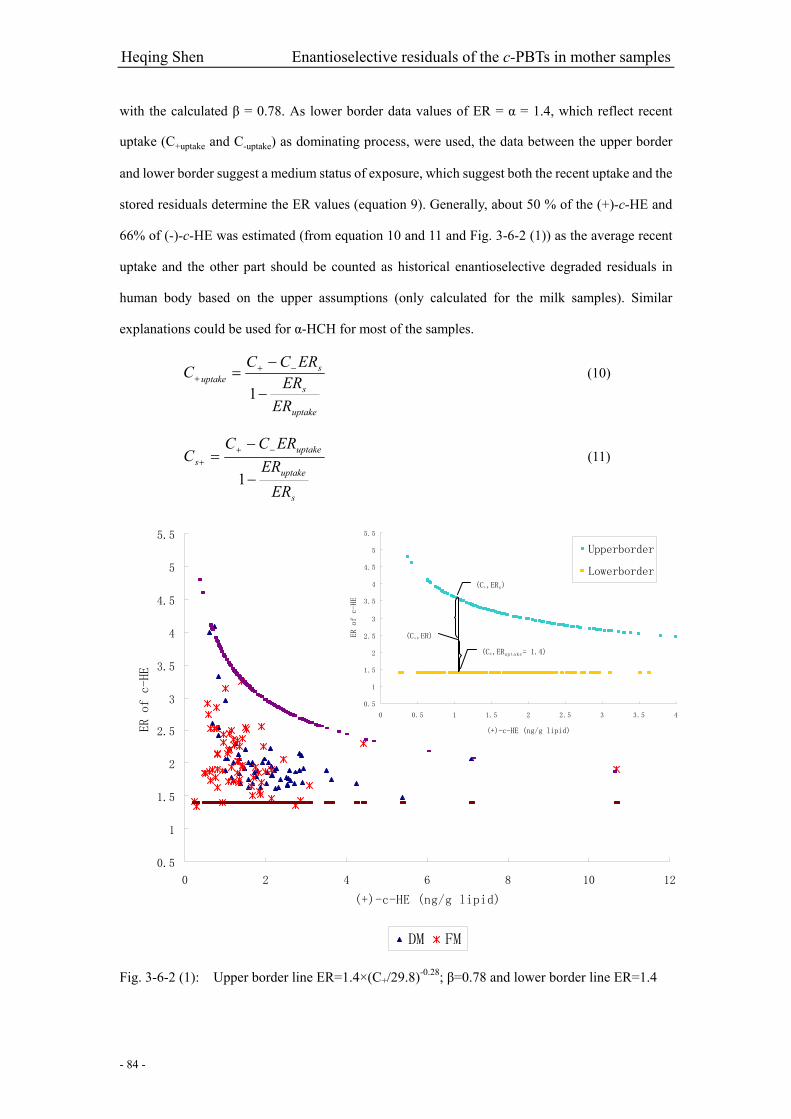
Heqing Shen Enantioselective residuals of the c-PBTs in mother samples
- 84 -
with the calculated β = 0.78. As lower border data values of ER = α = 1.4, which reflect recent
uptake (C+uptake and C-uptake) as dominating process, were used, the data between the upper border
and lower border suggest a medium status of exposure, which suggest both the recent uptake and the
stored residuals determine the ER values (equation 9). Generally, about 50 % of the (+)-c-HE and
66% of (-)-c-HE was estimated (from equation 10 and 11 and Fig. 3-6-2 (1)) as the average recent
uptake and the other part should be counted as historical enantioselective degraded residuals in
human body based on the upper assumptions (only calculated for the milk samples). Similar
explanations could be used for α-HCH for most of the samples.
uptake
s
suptake
ERER
ERCCC
−
−= −+
+
1 (10)
s
uptake
uptakes
ERER
ERCCC
−
−= −+
+
1 (11)
0.5
1
1.5
2
2.5
3
3.5
4
4.5
5
5.5
0 2 4 6 8 10 12
(+)-c-HE (ng/g lipid)
ER of c-HE
DM FM
Fig. 3-6-2 (1): Upper border line ER=1.4×(C+/29.8)-0.28; β=0.78 and lower border line ER=1.4
0.5
1
1.5
2
2.5
3
3.5
4
4.5
5
5.5
0 0.5 1 1.5 2 2.5 3 3.5 4
(+)-c-HE (ng/g lipid)
ER of c-HE
Upperborder
Lowerborder
(C+,ER)
(C+,ERuptake= 1.4)
(C+,ERs)

Heqing Shen PBBs in Finnish placenta samples
- 85 -
3-7: PBBs in Finnish placenta samples
Only three commercial bromobiphenyl (BB) products were manufactured, which were
hexabromobiphenyl (HxBB), octabromobiphenyl (OBB) and decabromobiphenyl (DBB) (Hardy,
2002). HxBB contained Br5- through Br7-congeners (or Br4- through Br10), which were 12-25% Br7,
60-80% Br6, 1-11% Br5; OBB contained Br7 through Br12 congeners (or B6 through Br12), which
were 1-9% Br10, 28-65% Br9, 31-72% Br8 and 1-27% Br7; and DBB contained 70-90% Br10,
2-11% Br9 and less Br8, Br7 and even Br6 (EHC 152, 1994). The commercial production PBBs was
started in the USA in 1970. OBB and DBB were produced in the USA until 1979. A mixture of
highly brominated PBBs called Bromkal 80-9 D was produced in Germany
until mid- 1985. Technical grade DBB (Adine 0102) was produced until 2000
in France (Hardy, 2002). Fish less accumulates more than 4-bromine atom
substituted BBs than the corresponding PCB’s from water. However, the
accumulation of these BBs from food is higher or equal to that of Aroclor
1254 (Zitok, 1977). Additionally, HeBB was not accumulated either from
water or from food by fish (Zitko et al. 1976). It has been suggested that the
congener patterns found in fish could be the result of photochemical debromination of DBB (EHC
152, 1994). Although no congener information, the transfer of PBBs across the human placenta
and into maternal milk had been reported (Jacobson et al., 1984) and the contents in placenta
tissue were ND-370 ng/g (ww) for Michigan specimens (10 years later of the PBB accident) and
the content correlated with maternal serum contents (Eyster et al., 1983). Because of the resistance
of BB-15, BB-155 and BB-153 to biodegradation (Hakk et al, 2003), they can be detected
frequently in Finland placenta samples. However, BB-37, BB-77 and BB-169 cannot be detected
in almost all samples. Few samples contained more BB-155 than BB-153 and the congeners BB-4,
BB-31, BB-80, BB-101 frequently occurred in the samples that exhibit a ratio BB-155/BB-153
more than 0.5 (expect sample 11377). The ratios could not be surprised when comparing the data
from Europe, however, the BB155 were much lower than BB153 in USA data (Table 3). BB-153
(~60%) was the principal component of the widely used commercial HxBB (~87% of the total
PBBs), but PBB-155 only occupied 0.5% in FM BP-6® (EHC 152, 1994; Hardy, 2002). The
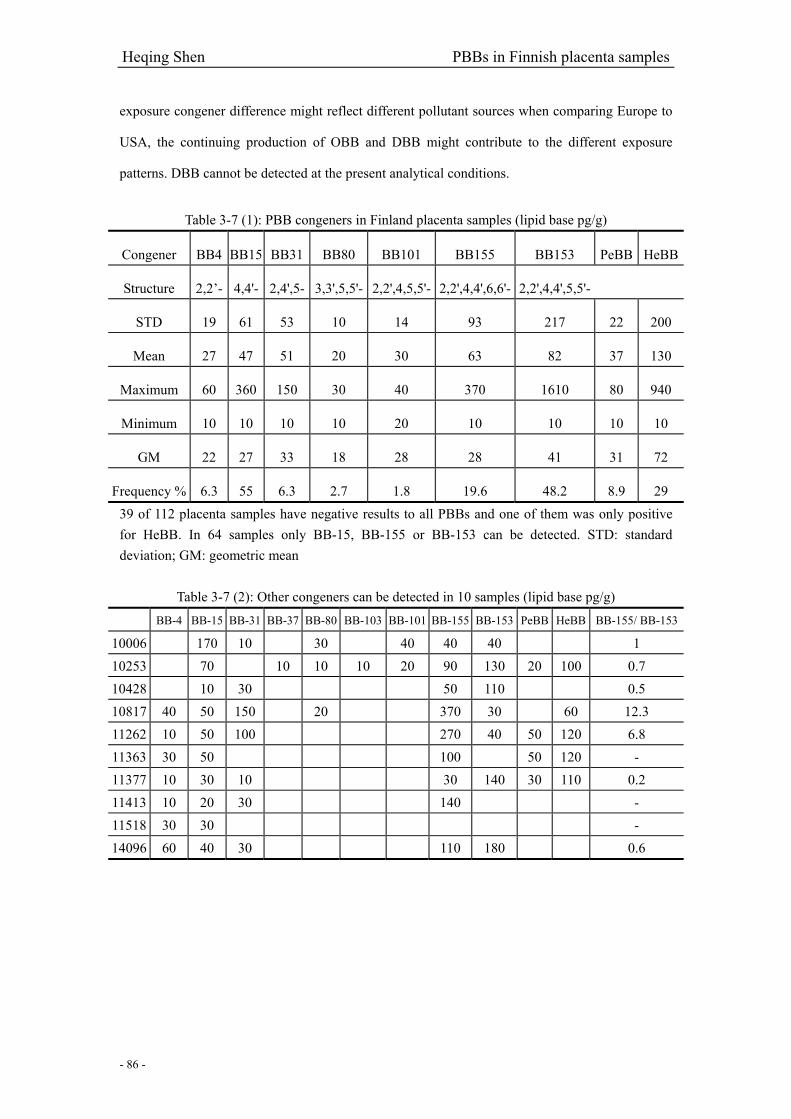
Heqing Shen PBBs in Finnish placenta samples
- 86 -
exposure congener difference might reflect different pollutant sources when comparing Europe to
USA, the continuing production of OBB and DBB might contribute to the different exposure
patterns. DBB cannot be detected at the present analytical conditions.
Table 3-7 (1): PBB congeners in Finland placenta samples (lipid base pg/g)
Congener BB4 BB15 BB31 BB80 BB101 BB155 BB153 PeBB HeBB
Structure 2,2’- 4,4'- 2,4',5- 3,3',5,5'- 2,2',4,5,5'- 2,2',4,4',6,6'- 2,2',4,4',5,5'-
STD 19 61 53 10 14 93 217 22 200
Mean 27 47 51 20 30 63 82 37 130
Maximum 60 360 150 30 40 370 1610 80 940
Minimum 10 10 10 10 20 10 10 10 10
GM 22 27 33 18 28 28 41 31 72
Frequency % 6.3 55 6.3 2.7 1.8 19.6 48.2 8.9 29 39 of 112 placenta samples have negative results to all PBBs and one of them was only positive for HeBB. In 64 samples only BB-15, BB-155 or BB-153 can be detected. STD: standard deviation; GM: geometric mean
Table 3-7 (2): Other congeners can be detected in 10 samples (lipid base pg/g)
BB-4 BB-15 BB-31 BB-37 BB-80 BB-103 BB-101 BB-155 BB-153 PeBB HeBB BB-155/ BB-153
10006 170 10 30 40 40 40 1 10253 70 10 10 10 20 90 130 20 100 0.7 10428 10 30 50 110 0.5 10817 40 50 150 20 370 30 60 12.3 11262 10 50 100 270 40 50 120 6.8 11363 30 50 100 50 120 - 11377 10 30 10 30 140 30 110 0.2 11413 10 20 30 140 - 11518 30 30 - 14096 60 40 30 110 180 0.6

Heqing Shen PBBs in Finnish placenta samples
- 87 -
Table 7-3 (3): Reference data environmental samples from Europe and USA
Species BB15 BB31 BB49 BB52 BB80 BB101 BB103 BB153 BB154 BB155 BB169River fish1 Germany 0.02 0.6 0.22 0.66 <0.01Baltic fish1 0.12 2.39 0.54 2.64 15.16
Fish1 North Sea 0.1 1.31 0.37 1.11 <0.01SS1 < 0.02 0.81 <0.02 0.4 <0.01
Cow's milk1 Germany < 0.02 0.04 <0.02 < 0.03 <0.01Human milk1 Germany - 1.03 0.01 0.05 0.05
SP12 blubber 0.08 0.33 0.55 1.26 2.63 <0.14
SP22 blubber 0.17 0.56 0.9 1.71 3.12 0.21
SP22 liver <0.03 <0.03 <0.03 1.99 56.78 <0.13
SP32 blubber 3.04 8.7 15.65 30.43 47.83 <4.35
WD2 blubber 0.2 7.58 4.14 8.38 13.13 <0.2
WD2 liver <0.37 2.22 1.11 27.41 703.7 <0.74Minke whale2 blubber 0.79 1.93 1.71 3.86 5.86 <0.14
HS12 blubber <0.2 139.34 23.36 38.11 250 49.18
HS22 blubber <0.05 3.22 2.39 1.45 18.69 <0.21
HS32 blubber <0.07 4.16 0.72 1.52 18.01 <0.14
HS22 liver <0.29 2.86 1.43 17.71 42.86 <0.57
HS32 liver <0.2 1.96 0.59 0.78 16.08 <0.2
HS42 liver <0.33 30 4.67 14.67 433.33 <0.67
Mackerel2 muscle 0.07 0.07 0.07 <0.07 0.26 <0.2Trout3,* Superior < 1.8 6.8 8.4 < 3.8 42 < 1.5 189 1.0 Trout3,* Huron 5.2 125 191 < 3.8 633 4.4 2083 5.8 Trout3,* Erie < 1.8 20 24 < 3.8 71 < 1.5 220 < 0.98 Trout3,* Ontario < 1.8 14 11 < 3.8 109 < 1.5 1008 1.1
SS: spitzbergen seal SP: sperm whale; HS: harbour seal; WD: Whiteb. Dolphin 1EHC 152, 1994; 2de Boer et al. 1998; 3Luross et al., 2002; *Data from USA expressed as pg/g w. w. ±S.D. and the rest expressed as ng/g fat

Heqing Shen The investigated compound perspectives
- 88 -
3-8: The investigated compound perspectives
3-8-1: DDT and the metabolites with MOC
DDT and the metabolites: Typical technical DDT mixtures consist of 77.1% p, p’- DDT, and
14.9% chiral o, p’-DDT. Further compounds detected are the p, p’-DDE (4%), o, p’-DDE (0.1%),
p, p’- DDD (0.3%) and chiral o, p’-DDD (0.1%), together with approximately 3.5% unidentified
compounds (Vetter et al., 1997). p, p’-DDE, the major and persistent DDT metabolite, is the most
abundant residue in the present study. Also p, p’-DDT have apparent residuals, especially in the
investigated milk samples. The other residuals such as p, p’-DDD, o, p’-DDT, o, p’-DDD and o,
p’-DDE can be detected in much lower level in most of the investigated samples. The maximum
levels for p, p’-DDE in DM, FM, DP and FP are 427.55, 331.16, 269.83 and 79.21-ng/g lipids; for p,
p’-DDT are 37.88, 12.9, 4.65, and 3.38-ng/g lipid; for p, p’-DDD are 2.2, 1.36, 6.35 and 2.4-ng/g
lipids and for o, p’-DDT are 1.83, 1.21, 0.26 and 0.92-ng/g lipids.
DDT can result in a neurotoxic syndrome in both vertebrate and invertebrate species through the
action on the axonal membrane and neonatal mice showed a more sensitive DDT response than
adult (50 to 200 times) and the action is permanent (Evangelista de Duffard et al., 1996). p,
p’-DDT and o, p’-DDT suppressed the neurite outgrowth dose dependently, and p, p’-DDE
revealed a similar effect but a lesser extent. Apoptotic cell death was induced by p, p’-DDT and o,
p’-DDT but also to lesser extent by p, p’-DDE (Shinomiya, et al. 2003). Several DDT analogs can
mimic phenobarbitone in the mode of induction of hepatic drug-metabolizing enzymes in the
immature male Wistar rat (Campbell et al., 1983). The transplacental toxicity of 3-MeSO2-DDE in
the earliest stage of developing adrenal cortex had been observed in mice (Jönsson et al. 1995).
Following local CYP11B1-catalyzed metabolic activation and irreversible protein binding in the
adrenal cortex, o, p’-DDD and 3-MeSO2-DDE have been tested highly potent adrenal toxicant that
induces mitochondrial degeneration and cell death in the murine and human; additionally, o,
p’-DDD and 3-MeSO2-DDE, have adrenocorticolytic effects in human, rodent, and fish adrenal
tissue but 3-MeSO2-DDE can impair hormone secretion only (Lindhe, et al. 2002). p, p’-DDT and
p, p’-DDE associated with interleukin-4 (IL-4) plasma levels, which could contribute an
Heqing Shen The investigated compound perspectives
- 89 -
immunological abnormalities factors (Volker et al, 2002).
DDT and certain metabolites interact with estrogen, androgen and progesterone receptors by
multiple hormone receptor signaling pathways. p, p’-DDE has little ability to bind the estrogen
receptor (ER), however, it inhibits androgen binding to the androgen receptor (AR),
androgen-induced transcriptional activity, and androgen action in developing, pubertal and adult
male rats (Kelce et al., 1995). It was 36.9-fold less potent as antiagonist of AR than DHT
(equilibrium dissociation constant KB =36.9 ×10⁻⁸M when DHT was 1×10⁻⁸M) (Maness et al.,
1998; Gaido et al., 2000). Epidemiological study showed the overall concentrations of plasma
DDE (median level was 1213 ng/g lipid) and androgens in 137 North Carolina black male farmers
were unrelated but, among those whose DDE level was in the top tenth percentile, compared with
all others, total testosterone and free androgen index were lower by 23% and 22% respectively
(Martin Jr et al., 2002). However, developmental abnormalities cannot be predicted from exposure
levels from adults with their higher tolerance (Kelce et al., 1997). p, p’-DDE can also produce
rapid nongenomic signaling effects via second messenger systems (Bulayeva et al., 2004). Apart
from p, p’-DDE, AR assay on the HepG2 human hepatoma cell line, which transiently transfected
with the human AR and an androgen-responsive reporter, showed all the o, p’-DDT, o, p’-DDE, o,
p’-DDD, p, p’-DDT, p, p’-DDE and p, p’-DDD behaved as antagonists at concentrations above
10-6 M and p, p’-DDE also showed some agonist activity at 10-5 M (Maness et al., 1998).
In contrast with p, p’-DDE, o, p'-DDT acted as EDC mainly by binding and activating the ER
(Maruyama et al., 1999) and stimulated proliferation in a dose-dependent manner in the
ER-positive cell lines MCF-7 and T47D (Steinmetz et al., 1996). The present data suggested the
dominated enantioselective residuals are the less activated (+)-isomer whereas hER activity was
negligible (Hoekstra et al., 2001). ER competitive binding assays showed p, p’-DDT, o, p’-DDD
and o, p’-DDE were all able to bind specifically to the human estrogen receptor (hER) with
approximately 1000-fold weaker affinities for the hER than estradiol (only o, p’-DDT but p,
p’-DDT bound to the rat ER) (Chen et al., 1997). o, p’-DDE, o, p’-DDD can competitively bind to
ER source in uteri from ovariectomized Sprague-Dawley rats (Blair et al., 2000). However, p,
p’-DDT, p, p’-DDD and p, p’-DDE are virtually no evidence of estrogenicity to modulate
Heqing Shen The investigated compound perspectives
- 90 -
transcriptional activation of an estrogen-responsive reporter gene in transfected HeLa cells (Tullya
et al., 2000).
Assays evaluated by yeast expressing human progesterone receptor (hPR) and T47D human breast
cancer cells expressing endogenous hPR (Klotz et al., 1997) suggested o, p’-DDT, p, p’-DDT, o,
p’-DDD, p, p’-DDD, o, p’-DDE, p, p’-DDE, p, p’-DDA and DDOH inhibited
progesterone-induced reporter gene activity in a dose-dependent manner. None of them functioned
as hPR agonists. Whole cell competition binding assays using T47D cells indicated that the
progesterone-dependent inhibitory effects might occur through both hPR-dependent and
hPR-independent pathways. o, p'-DDT and β-HCH as well were found to be potent activators of
protein kinases, which activated c-Neu at extremely low (0.1-1nM) concentrations to elicit
estrogen action by ligand-independent way (Enan et al., 1998). DDE can also produce rapid
nongenomic signaling effects via second messenger systems (Bulayeva et al., 2004) and o,
p’-DDT can modulate steroid hormone homeostasis through induction of heptatic enzymes
(Gladen et al., 2004).
MOC: MOC is a currently used pesticide as the DDT substituted compound (lower toxicity and
shorter half-life compared to DDT). It is metabolized fairly quickly to phenolic derivatives like
mono-OH-MOC (77-87% of S-isomer in human liver microsomes) and di-OH-MOC (Hu et al.,
2002). Because of a weak EDC (Nimrod et al., 1996; Guillette Jr et al., 2002; Maruyama et al.,
1999), the in vivo estrogenic activity of MOC might be caused its phenolic estrogenic metabolites,
which expressed as agonistic or antagonistic for ERα, ERβ or AR (Maness et al., 1998; Gaido et
al., 1999; 2000; Blair RM et al. 2000; Cupp et al., 2001). MOC alter gonadotropin-releasing
hormone (GnRH) biosynthesis by directly regulate GnRH gene expression in hypothalamic cell
line but through ER by consistently mimic estrogen and might have endocrine disrupting effects
on GnRH neurons in vivo (Gore AC et al. 2002). Present data showed MOC level was lower in all
the investigated samples might because of its ready to degradation in environment. The maximum
levels for MOC in DM, FM, DP and FP are 0.43, 1.12, 7.79 and 1.14-ng/g lipids. In conclusion, the
endocrine disrupting action, if possible, might mainly refer the antiandrogenic function of
p,p’-DDE in most samples.

Heqing Shen The investigated compound perspectives
- 91 -
3-8-2: HCHs with emphasis the β-isomer
Five of the eight possible isomers of HCHs are present in technical mixtures, typically containing
60-70% α, 5-12% β, 10-12% γ, 6-10% δ, and 3-4% ε. Technical HCH had been used widely as
commercial pesticide before the use of pure highest
pesticidal active Lindane (γ-HCH isomer to 99.9%). As a
synthetic product, enantiomers of α -HCH are in the
racemic ratio 1:1. Although a smaller component of
technical HCH, β -isomer has much higher
bioconcentration factor than α-, and γ- isomer in human
fat (Willett, et al. 1998). HCHs were used in both human
and veterinary medicine to treat ectoparasites, human
scabies (skin disease caused by mites), pediculosis
(infestation with lice), also had been used as a general
insecticide to control structural pests such as termites. The
present data suggest HCH, especially the β-isomer, are
ranked the second high levels among the investigated
compounds in most samples. The maximum levels for β-HCH in DM, FM, DP and FP are 66.23,
30.89, 47.76 and 45.54-ng/g lipids; for α-HCH are 3.45, 0.77, 8.92 and 692.79 (one of the two
abnormal samples data)-ng/g lipid and for γ-HCH are 3.34, 4.05, 2.04 and 246.87 (one of the two
abnormal samples data)-ng/g lipids. Lindane has been well reviewed as a potent convulsant agent
in humans and other mammals. Other effects included intention tremors, memory impairment,
irritability, and aggression. At the nonconvulsant doses, lindane can interfere with the ability to
acquire and use new information (Evangelista de Duffard et al., 1996). The effects of four HCH
isomers as inducers of hepatic drug-metabolizing enzymes in the immature male Wistar rat all
resembled the mode of induction of phenobarbitone (Campbell, et al. 1983). HCHs might also
affect the human immunological health combining with the other PBTs (Volker et al, 2002).
γ-HCH, α-HCH, β-HCH can cause greater than 50% displacement of estradiol-17β (0.0078 μM)
from the alligator ERα, with IC50 of 37.2, 43.4, 48.3 μM, respectively (Guillette Jr et al., 2002).
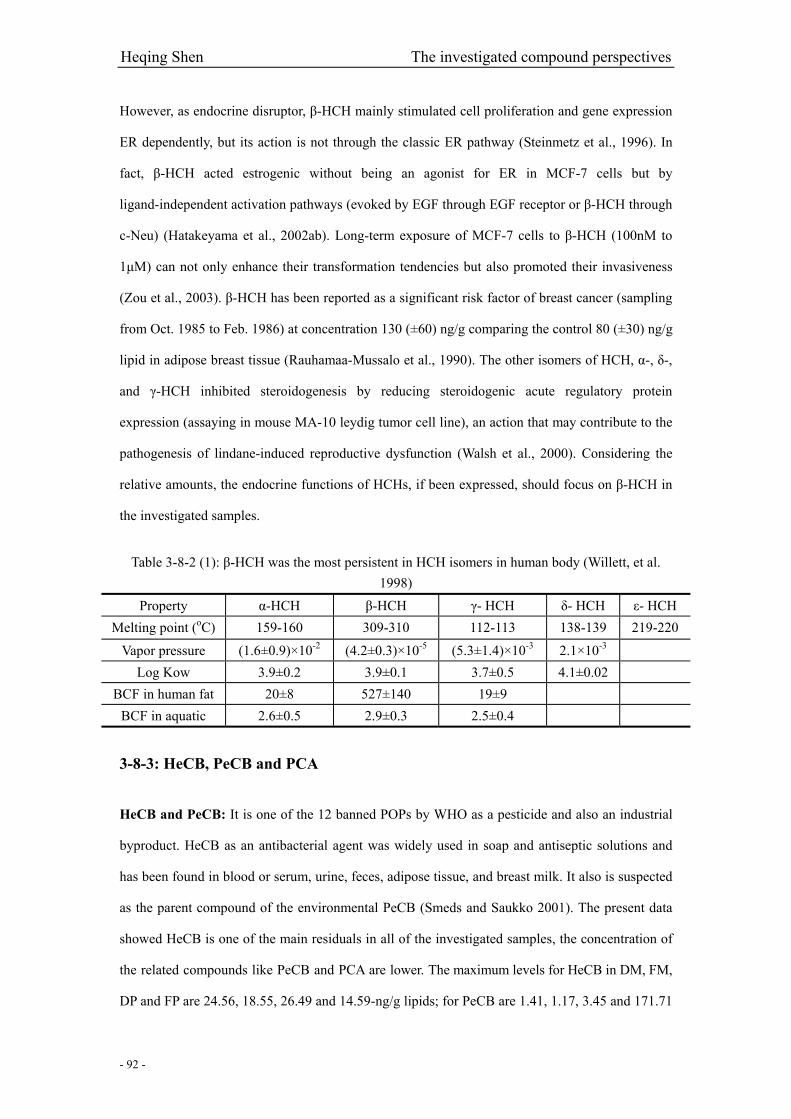
Heqing Shen The investigated compound perspectives
- 92 -
However, as endocrine disruptor, β-HCH mainly stimulated cell proliferation and gene expression
ER dependently, but its action is not through the classic ER pathway (Steinmetz et al., 1996). In
fact, β-HCH acted estrogenic without being an agonist for ER in MCF-7 cells but by
ligand-independent activation pathways (evoked by EGF through EGF receptor or β-HCH through
c-Neu) (Hatakeyama et al., 2002ab). Long-term exposure of MCF-7 cells to β-HCH (100nM to
1μM) can not only enhance their transformation tendencies but also promoted their invasiveness
(Zou et al., 2003). β-HCH has been reported as a significant risk factor of breast cancer (sampling
from Oct. 1985 to Feb. 1986) at concentration 130 (±60) ng/g comparing the control 80 (±30) ng/g
lipid in adipose breast tissue (Rauhamaa-Mussalo et al., 1990). The other isomers of HCH, α-, δ-,
and γ-HCH inhibited steroidogenesis by reducing steroidogenic acute regulatory protein
expression (assaying in mouse MA-10 leydig tumor cell line), an action that may contribute to the
pathogenesis of lindane-induced reproductive dysfunction (Walsh et al., 2000). Considering the
relative amounts, the endocrine functions of HCHs, if been expressed, should focus on β-HCH in
the investigated samples.
Table 3-8-2 (1): β-HCH was the most persistent in HCH isomers in human body (Willett, et al.
1998) Property α-HCH β-HCH γ- HCH δ- HCH ε- HCH
Melting point (oC) 159-160 309-310 112-113 138-139 219-220
Vapor pressure (1.6±0.9)×10-2 (4.2±0.3)×10-5 (5.3±1.4)×10-3 2.1×10⁻³ Log Kow 3.9±0.2 3.9±0.1 3.7±0.5 4.1±0.02
BCF in human fat 20±8 527±140 19±9 BCF in aquatic 2.6±0.5 2.9±0.3 2.5±0.4
3-8-3: HeCB, PeCB and PCA
HeCB and PeCB: It is one of the 12 banned POPs by WHO as a pesticide and also an industrial
byproduct. HeCB as an antibacterial agent was widely used in soap and antiseptic solutions and
has been found in blood or serum, urine, feces, adipose tissue, and breast milk. It also is suspected
as the parent compound of the environmental PeCB (Smeds and Saukko 2001). The present data
showed HeCB is one of the main residuals in all of the investigated samples, the concentration of
the related compounds like PeCB and PCA are lower. The maximum levels for HeCB in DM, FM,
DP and FP are 24.56, 18.55, 26.49 and 14.59-ng/g lipids; for PeCB are 1.41, 1.17, 3.45 and 171.71
Heqing Shen The investigated compound perspectives
- 93 -
(an abnormal data)-ng/g lipid and for PCA are 0.79, 0.11, 2.7 and 1.7-ng/g lipids. The ratios of
PeCB/HeCB were 0.063, 0.124, 0.028 and 0.031 for DP, FP (one sample has abnormal high), DM
and FM respectively; and PCA/HeCB were 0.02, 0.033, 0.007 and 0.004 for DP, FP, DM and FM
respectively. However, no apparent correlation between these related compounds could be found.
The effects of HeCB as a microsomal enzyme inducer resembled those observed after
coadministration of phenobarbitone plus 3-methylcholanthrene (Campbell et al., 1983). As a
neurotoxicant, large doses fed rats suffered from the damage of white matter and peripheral
neuropathy, motor dysfunction in adults, inhibited synthesis of myelin and suffered hyperactive
upon subsequent behavioral evaluation when exposed in utero (Evangelista de Duffard et al.,
1996). HeCB and its main metabolite PCP could induce hypothyroidism by involving of the
different mechanisms in rat (Van Raaij et al., 1993). More general effects include stimulatory
effects on the immune system and induction of enzymes involved in drug metabolism, porphyria,
and the reproductive system in rat and human, such as porphyria turcica. As a result, the toxicant
HeCB inflicts multisystemic damage through initiation of an inflammatory response (Ezendam et
al., 2004; McGovern, 2004). HeCB can activate liver enzymes that hydroxylate androgens and
might induce liver and testis dysfunction (Toppari et al. 1996). Lower level (0.5-5 nM) enhanced
androgen action but higher level (>10 μM) of HeCB interfered in the prostate (Ralph et al., 2003).
HeCB had been reported revealing a highly significant difference between patients from the
control group and those from the undescended testes group (Hosie et al. 2000).
PCA: PCA is an environmental metabolite of structurally related, commercially important,
ubiquitous chlorinated aromatic compounds such as pentachlorophenol (PCP) and
pentachloronitrobenzene (PCN) (Mayring et al. 1984; Ikeda et al. 1995; Rüttimann-Johnson et al.
1997). PCN was introduced into agriculture from 1930 as powerful fungicide and its
biotransformation into PCP, PCA had been investigated in soil, plants and animals (Torres et al.,
1996). PCP has been used extensively as fungicide, insecticide and herbicide and the accidental
spillage and inappropriate disposal at many wood treatment facilities (Chung et al. 1995). They are
all potential teratogenic compounds (Welsh et al., 1987) and have been found in Finnish soil and
earthworms of sawmill environments (Knuutinen et al., 1990; Palm et al., 1991). Animal

Heqing Shen The investigated compound perspectives
- 94 -
administration showed PCA could be metabolized to tetrachlorohydroquinone (TCH), free and
conjugated-PCP in male Sprague-Dawley rats and New Zealand White rabbits (Ikeda et al., 1994)
and was readily demethylated to PCP and conjugated PCP but TCH by beagle dog and miniature
pig (Ikeda et al., 1995). PCP and PCA have been showed apparent reproductive toxicity to male
rats (Welsh et al., 1987). PCP constituted 46% (geometric mean) of the total quantitated
chlorinated phenolic compounds in Inuit blood and the concentrations ranged from 0.558 to 7.77
ng/g on a wet weight basis, which might also interfere thyroid hormone function (Sandau et al.,
2000).
3-8-4: Dieldrin also reflected the exposure of aldrin
In many countries outside the United States, dieldrin is used as a broad-spectrum insecticide to
protect food crops and control disease vectors, locusts, and termites. Levels of dieldrin in the
environment reflect exposure to aldrin or dieldrin because aldrin can be degraded rapidly to dieldrin,
which is more persistent and accumulates in living organisms (ATSDR 2002). The present
investigation showed dieldrin was detectable for each samples and aldrin was almost nothing. The
maximum levels in DM, FM, DP and FP are 35.5, 7.19, 19.5 and 4.32-ng/g lipids respectively.
Dieldrin-induced hepatocarcinogenesis in mice occurs through a nongenotoxic mode of action: the
slow oxidative metabolism of dieldrin, accompanied by an increased production of reactive
oxygen species, can deplete hepatic antioxidant defenses (particularly α-tocopherol), and
peroxidize liver lipids. Dieldrin-induced oxidative stress or its sequelae apparently result in
modulation of gene expression that favors expansion of initiated mouse liver cells (Klaunig, et al.
1998; Stevenson, et al, 1999). Antioxidant supplementation prevented the dieldrin-induced cellular
changes. An early study (Vainio, et al. 1976) in rat liver shown dieldrin was a more potent inducer
than the parent compound itself. Aldrin, dieldrin, mirex act as inducers of hepatic
drug-metabolizing enzymes in the immature male Wistar rat resembled the induction mode of
phenobarbitone (Campbell et al., 1983). After oral administration of dieldrin-14C to rabbits (Korte
et al. 1965), the main metabolite (about 86%) are one of enantiomorphic isomers of
6,7-trans-hydroxy-dihydro-aldrin with a specific rotation of αD20 = -13.7 with lower acute oral

Heqing Shen The investigated compound perspectives
- 95 -
toxicity to mammals than that of dieldrin, however, the metabolite was known as neurotoxicant by
disruption in membrane Ca2+ transport mechanism (Mehrotra, et al. 1989; Khan, 1970; Van Den
Bercken, et al. 1974; Akkermans, et al. 1975 a,b; Evangelista de Duffard et al., 1996). Dieldrin has
estrogenic effects on human estrogen-sensitive cells (Soto et al. 1994). It has been suggested to
affect the risk of developing breast cancer and the survival by assessment of the serum
concentration with relative risk estimation (RR) 2.78 when >57.55ng/g in serum after adjusting for
tumor characters (Hoyer et al., 2000). Consider the sample specific concentration difference,
dieldrin level in DM might involve in the range of higher risk for breast cancer. Like E2, it can also
produce rapid nongenomic signaling effects via second messenger systems (Bulayeva et al., 2004).
3-8-5: END
END in its pure form is a crystalline substance consisting of α-, β-isomers (isomer-I and -II) in
the ratio of approximately 7:3. The environmental residuals are END-1, -2 and the major
metabolites endosulfan ether, endosulfan sulfate, endosulfan lactone, and endosulfan diol (Kaur et
al. 1997, Lentza-Rizos et al. 2001). All of the upper compoumds had been detected in human milk
(Campoy et al. 2001). Like aldrin and dieldirn, it can induce increase in total glutathione
peroxidase activity in hamster ovary cells and alternate the membrane permeability (Bayoumi, et
al. 2001). In aqueous system the half-life of END-1 is much longer that END-2 (Guerin, 2001) and
the isomerization can occur with the reaction favoring formation of END-1 (Schmidt et al, 1997),
which is more toxic than END-1 in mammals (LD50 =9.4-40 mg/kg), a similar toxicity with their
mainly biological oxidation products END sulfate, LD50 =8-76 mg/kg) (Guerin, 2001). In this
study, END-1 was the dominated can be detected in all of the investigated and END-2 was almost
nothing for most samples. Comparing the reported milk data (Campoy et al. 2001), it seems that
the mother’s main exposure result from environmental transformed residuals in seafood. Both
isomer-I and II of END have the similar potential of estrogenic effects on human
estrogen-sensitive cells with similar potency as o, p’-DDT (Soto et al. 1994). Like E2, END can
also produce rapid nongenomic signaling effects via second messenger systems (Bulayeva et al.,
2004). Serum luteinizing hormone levels were significantly positively related to serum END levels
after controlling for age. The researchers (Saiyed et al., 2003) suggested that the prevalence of

Heqing Shen The investigated compound perspectives
- 96 -
congenital abnormalities related to testicular descent among study and controls subjects was 5.1%
and 1.1%, respectively, might (not significantly) correlate to the long-term END exposure. In the
present data, only END-1 should be considered for endocrine disrupting action in most samples.
The maximum levels for END-1 in DM, FM, DP and FP are 18.05, 22.66, 6, and 8.78-ng/g lipids
and for END-2 are 0.1, 0.12, 0.39 and 5.63-ng/g lipids respectively.
3-8-6: Biotransformed technical chlordane residuals
Technical CHL consists of more than 140
compounds, includes many chiral
compounds. The major pesticides c-,
t-CHL and HC, including the minor
Miyazaki compounds and U82 (de Boer,
1999), are chiral compounds. In
environmental samples, the major
residuals are c-, t-CHL, trans-nonachlor,
and two metabolites c-HE and OXC,
sometimes together with cis-nonachlor
and α-, β-chlordene (de Boer, 1999). HC
is rapidly degraded in the environment
and the main metabolic product c-HE is a
persistent chiral toxicant (Vetter et al.,
1997). c- and t-CHL were metabolized
different and enantioselective in the environment (Ulrich et al., 1998). In biological samples the
major residuals are achiral trans-nonachlor and chiral OXC. Technical CHL, c-, t-CHL, OXC,
trans-nonachlor, HC and HE all resembled the mode of induction of phenobarbitone as inducers of
hepatic drug-metabolizing enzymes in the immature male Wistar rat (Campbell et al., 1983). In the
present data, c-HE and OXC are the dominant residual and the other residuals could be omitted for
the most samples. The chiral residual information for c-HE could be useful to investigate the
recent uptake and historical exposure level for this compound. As weak EDCs, c-HE, HC and
Fig 3-8-6 (1): Major chlordane-related compounds(Vetter et al., 1997)
Heqing Shen The investigated compound perspectives
- 97 -
OXC can cause greater than 50% displacement of estradiol-17β (0.0078 μM) from the alligator
ERα, with IC50 of 19.4, 26.7, 34.7μM, respectively (Guillette et al., 2002). Hosie et al. (2000) had
been reported c-HE revealing a highly significant difference between patients from the control
group and those from the undescended testes group. The maximum levels for OXC in DM, FM, DP
and FP are 12.01, 9.4, 3.99 and 2.76-ng/g lipids; for c-HE are 10.82, 17.02, 3.1 and 2.01-ng/g lipids;
for t-CHL are 0.35, 0.11, 0.18 and 0.67-ng/g lipids and for c-CHL are 0.07, 0.05, 0.18 and 0.1-ng/g
lipids. Therefore, only c-HE and OXC might need to be considered when assessing the endocrine
disruption function of these compounds in the two cohorts.
3-8-7: Other detectable PBT residuals
OCS: Chlorostyrene congeners occur from hexa-, hepta- to octa- in biota, and OCS is the
prevalent one (BCFw ≈ 106 for fish and Log Kow ≈ 6.86 - 7.68), which can be traced back to the
by-products of electrolytic processes (Bester et al., 1998). OCS is the most permanent congener
and had been found in livers of various fish from 20-3700 ng/g lipid in the North Sea in 1983 and
no remarkable differences comparing the data of 1972 (Ernst et al., 1983). It was reported that
OCS could be photo-degraded into penta- and tetra- congeners (Hustert et al., 1984) and
metabolised into two isomeric MeSO2-heptachlorostyrenes by blue mussel (Mytilus edulis) (Bauer
et al., 1988) slowly. OCS is an inducer of the phenobarbital (PB)-type in mice; the induction of
acetanilide 4-hydroxylase (AcA hydroxylase) is not regulated by the aryl hydrocarbon (Ah)
hydroxylase locus (Holme et al., 1982). The maximum levels for OCS in DM, FM, DP and FP are
0.4, 0.7, 0.39 and 0.55-ng/g lipids in the present study.
Mirex: Although it has been used for control of insects e.g. ants, in Europe, mirex use as fire
retardants in industrial products is thought to be the major source of mirex in the Baltic Sea
environment and the biological samples are often contaminated with other compounds such as
PCBs (Strandberg, et al., 1998). Photomirex has been measured in adipose by GC-MS (LeBel and
Williams 1986). Elevations from 1986-1992 in the concentrations of mirex in the breast milk of
the Mohawks are consistent with the fact that it is a common contaminant in the region and
throughout the Lake Ontario-St. Lawrence River Basin (Fitzgerald, et al. 2001). Mirex can cause

Heqing Shen The investigated compound perspectives
- 98 -
greater than 50% displacement of estradiol-17β (0.0078 μM) from the alligator ERα, with IC50 of
>50 μM, respectively (Guillette et al., 2002). Except the co-induction of cytochrome P450 2B1
and 2B2 mRNAs and immunoreactive proteins in rat hepatocytes (Kocarek et al. 1994), mirex is a
potent non-phorbol ester tumor promoter in mouse skin and E2 is a major ovarian hormone
regulator for mirex tumor promotion sensitivity in female mice (Porter et al. 2002). The maximum
levels for mirex in DM, FM, DP and FP are 0.66, 1.54, 1.08 and 2.08-ng/g lipids in the present study.
Heqing Shen Conclusion
- 99 -
4: Conclusions
Pollutant level and pattern characteristics for Denmark and Finland cohorts: The lipid data
and the 8 most abundant pollutants have been evaluated of the distribution, the nearly normal
distribution of the lipid data might suggest a representative sample collecting process in the
case-control studies. The apparent deviation from normal distributions for most of the compounds
suggested more than one random factor contributed the bioaccumulation of these pollutants. PC
analysis showed a general simultaneously increase for the 8 compounds even had the much
different levels. For both cohorts, there might be a common exposure pattern. The common
patterns for Denmark cohort and Finland cohort are similar but with small difference in the
content of END-1 and OXC. These patterns showed that most mothers faced nearly the same
pollutant sources, which would suggest the types of food sources. All the general levels (cohort
geometric means for milk and placenta respectively) and sample specific distributions (for the
summary and for each compound) exhibit more samples in Denmark cohort were heavily
contaminated than in Finland cohort. The Denmark cohort, with small fat content in milk and
placenta samples, has a higher level of pollutants in general, with emphasis for some high
contaminated samples, which might be a result of various pollutant sources because they had
different compound patterns comparing the common patterns of the lower contaminated mothers.
Interestingly, the END-1 and OXC contents were linearly correlated in DM, DP, FM, FP and
pooled milk and placenta samples, respectively, which might reflect a source correlation of the
two pollutants for almost all investigated samples. On the other hand, the correlations of END-1
and OXC confirmed that the whole analysis procedure was generally stable. Two Finland samples
have abnormally high levels of HCH with isomers ratios near to technical mixture (one sample
combined with high level of PeCB and δ-HCH) but the other investigated compounds were in
normal ranges, which might suggest a heavy HCH contact of single mothers.
Prenatal and postnatal exposure: Paired analysis for the milk and placenta samples of Finland
cohort suggested placental contamination by chemicals might act as a biological marker for the
exposure of the mother or for the fetus via transplacental transfer. The concentration correlations

Heqing Shen Conclusion
- 100 -
for the 10 compounds (p, p’-DDE, β-HCH, HeCB, dieldrin, END-1, OXC, c-HE, p, p’-DDT, OCS
and mirex) confirmed the transplancental contamination. The slopes of regression lines were
changed from 1.5 to 3.0 (except p, p’-DDT) suggesting that these compound had the similar
transferring potentials from fatty tissue breast to non-fatty placentas. In other words, the contents
of these lipophilic pollutants in milk were 1.5 to 3.0 times higher than in placenta, which might
imply breast-feeding is a more attentive contaminated pathway for babies. However, considering
the reproductive toxicity, placenta-transfer pathway might be more harmful. For the investigated
cohorts, both sample types can be used as biomarker for the risk assessments.
Chiral information: Apart from the first order clearance process, recent uptake might also the
important factor for the detected exposure to the chiral PBTs. The chiral exposure information
expressed by c-HE and α-HCH might conclude about the different recent uptake level for the
related pollutants, considering the general simultaneously exposure of the 8 main pollutants,
which might also supply a general information of the recent total exposure to these pollutants.
Additionally, the chiral residual information could be also used as index for the evolution of
estrogenic activity of chiral pollutants like o, p’-DDT, the most strong xenoestrogen among DDT
and its common metabolites.
Are EDCs harmful to human reproduction? For most of the investigated compounds, their
concentrations in placenta samples are much lower than the active concentrations used in vitro
tests. However, the maximum concentrations of p, p’-DDE in Denmark cohort and Finland cohort
placenta are 0.8 nM and 0.24 nM and Kelce et al. (1997) suggested 0.22 nM in placenta might
inhibit androgen action in vitro. Other information, such as bioavailability and protein binding in
serum, needs to be known in order to evaluate in vivo function of p, p’-DDE and any other EDCs.
Although all of the investigated compounds are weak EDCs, their phenolic metabolites, such as
di-OH-DDE and HPTE, typically modulated multiple endocrine pathways, are only 25- and
17-fold less potent as ERα agonists than E2 (Gaido et al., 2000). The stored PBTs could be
released from fatty tissue and biotransformed by a diverse enzyme system of the cytochrome P450
monooxygenases. Most of the known metabolic pathways involve the initial formation of phenolic
metabolites, which can be excreted unchanged or further conjugated with glucuronic acid or

Heqing Shen Conclusion
- 101 -
sulfate (Sandau et al., 2000). The significant correlation between the parent PCBs and resulting
OH metabolites for all congeners in both maternal plasma and cord plasma samples (Soechitram et
al., 2004) have been reported recently. 3-MeSO2-DDE and 2-MeSO2-DDE had been detected in
human body and the ratios of the sum of MeSO2-DDEs to p, p´-DDE ranged from 1/1000 to 1/142
(mean 1/455) and from 1/200 to 1/30 (mean 1/61) in adipose tissue and liver, respectively
(Weistrand et al., 1997). In addition to the combined effect, the exposure of these PBTs as EDCs
should be considered, especially to their possible metabolites.
In conclusion, PBTs can be transfered from mother to fetus during pregnancy and have potential
harm to human reproductive health. There are definitely exposure differences between Denmark
and Finland cohort, from levels to structure. These data will be employed in to the following
case-control study to try to interpret the different case incidence of cryptorchidism and
hypospadias in the two cohorts.

Heqing Shen Outlook
- 102 -
5: Outlook
Scientifically sound documents from laboratory studies underpin that environmental chemicals are
capable of acting as endocrine disrupters. However, the association of PBT exposure to human
interacting as endocrine disrupting chemicals with human reproductive health is still a complex
problem. The reason is that, for each compound, both of the toxicokinetic factors and
toxicodynamic factors need to be checked carefully and people are exposed to a complex mixture
of compounds.
Considering the fact that prenatal and postnatal exposures take place to complex chemical matrix,
combined effect analysis of complex mixed PBTs should be extended to the non-accumulating
ones (such as plant sourced EDCs). Most PBTs are weak EDCs but their metabolites, such as
phenolic biotransformation products, are usually more active than the parent compounds. PBTs
stored in fatty tissues might just offer a sustainable pool opportunity of endocrine interrupting
activities of their metabolites. Therefore, further studies should pay attention on the association of
the enzyme activities for biotransformation, the metabolite concentrations and their possible
correlations with these PBT-levels in vivo. The chiral information, expressed as ER values, is
associated with the enantioselective biodegradation processes and is a promising tool to be used as
indictor of the enzyme activities for biotransformation. Due to PBTs mimicry in terms of the
functional important small molecules (hormones) in organisms and because the concentrations of
these hormones are of defined homeostasis and programming controlled, it is also important to
monitor the change of these hormones in mother’s when investigating their PBTs exposure.
For an overview, experiments could be designed to evaluate systematically the endocrine
disrupting activity of PBTs or their mixture within or without their metabolites by testing extracts
(such as blood removal of natural hormones) from the administrated animal models, cell cultures
or human samples in molecular assays. However, the compound specific PBT levels, their
metabolite levels (reflected the enzyme activity) and the change of the interrupted hormone levels,
if they are systemic and correlated factors, should be detected carefully and quantitatively for the

Heqing Shen Outlook
- 103 -
confirmed reply of their risk assessment. Therefore, comparable high quality compound specific
data are still waiting for the work from trace analysis. Statistically, levels of PBTs, their
metabolites and natural hormone level change should be considered as multivariate of the
individual health outcome.

Heqing Shen Reference
- 104 -
6: Reference
Akkermans LMA, Van Den Bercken J and Van Der Zalm JM, Effects of Aldrin-transdiol on neuromuscular facilitation and
depression, European Journal of Pharmacology, 31, 1975, 166-175
Akkermans LMA, Van Den BerckenJ and Versluijs-Helder M, Excitatory and depressant effects of dieldrin and aldrin-transdiol
in the spinal cord of the toad (Xenopus laevis), European Journal of Pharmacology, 34, 1975, 133-142
Anderson HA and Wolff MS, Environmental contaminants in human milk, J of Exposure Analysis and Environmental
Epidemiology, 2000 (10), 755-760
Ando M, Hirano S, Itoh Y, Transfer of hexachlorobenzene from mother to newborn baby through placenta and milk. Archives of
Toxicology, 1985 (56), 195-200
Arnold SF, Klotz DM, Collins BM, Vonier PM, Guillette Jr. LJ, McLachlan JA, Synergistic Activation of Estrogen Receptor
with Combinations of Environmental Chemicals, Science, 272, 1996, 1489-1492.
Basu N, Billiard S, Fragoso N, Omoike A, Tabash S, Brown S, Hodson P, Ethoxyresorufin-O-deethylase induction in trout
exposed to mixtures of polycyclic aromatic hydrocarbons, Environmental Toxicology And Chemistry / SETAC, 20, 2001, Pages
1244-1251
Battaglia C, Regnani G, Mancini F, Iughetti L, Flamigni C and Venturoli S, Polycystic ovaries in childhood: a common finding
in daughters of PCOS patients: A pilot study. Human Reproduction 2002; 17:771-776.
Bauer I, Weber K, Ernst W Weigelt V, Metabolism of octachlorostyrene in the blue mussel (Mytilus edulis) Chemosphere, 18,
1989, 1573-1579
Bayoumi AE, Garcia-Fernandez AJ, Ordonez C, Perez-Pertejo Y, Cubria JC, Reguera RM, Balana-Fouce R, Ordonez D,
Cyclodiene organochlorine insecticide-induced alterations in the sulfur-redox cycle in CHO-K1 cells, Comparative Biochemistry
and Physiology Part C 130 (2001) 315-323
Beek B (ed.) The handbook of environmental chemistry, vol. 2 Part J Bioaccumulation, Springer-Verlag Berlin Heidelberg 2000
Berry DL, Slaga TJ, Wilson NM, Zachariah PK, Namkung MJ, Bracken WM & Juchau MR (1977) Transplacental induction of
mixed-function oxygenases in extra-hepatic tissues by 2,3,7,8-tetrachlorodibenzo-p-dioxin. Biochem Pharmacol, 26, 1383-1388.
Bidleman TF & Falconer RL, Using enantiomers to trace pesticide emissions, Environ Sci Technol, 1999, 33, 206A-209A
Bidleman TF, Jantunen LM, Harner T, Wiberg K, Wideman JL, Brice K, Su K, Falconer RL, Aigner EJ, Leone AD, Ridal JJ,
Kerman B, Finizio A, Alegria H, Parkhurst WJ, and Szeto SY, Chiral pesticides as tracers of air-surface exchange. Environ.

Heqing Shen Reference
- 105 -
Pollut. 1998, 102: 43-49
Bigsby RM, Caperell-Grant A & Madhukar BV (1997) Xenobiotics released from fat during fasting produce estrogenic effects in
ovariectomized mice. Cancer Res, 57, 865-869.
Blair RM, Fang H, Branham WS, Hass BS, Dial SL, Moland CL, Tong W, Shi L, Perkins R and Sheehan DM, The Estrogen
Receptor Relative Binding Affinities of 188 Natural and Xenochemicals: Structural Diversity of Ligands, Toxicological
Sciences, 54, 138–153 (2000)
Blais JM, Schindler DW, Muir DCG, Kimpe LE, Donaldk DB & Rosenberg B, Accumulation of persistent organochlorine
compounds in mountains of western Canada, Nature, 395, 1998, 585-588
Borlakoglu JT, Clarke S, Huang SW, Dils RR, HaegeleKD and Gibson GG, Lactational transfer of 3, 3', 4, 4'-tetrachloro-and 2,
2', 4, 4', 5, 5'-hexachlorobiphenyl induces cytochrome P450IVA1 in neonates Evidence for a potential synergistic mechanism
Biochemical Pharmacology, 43, 1992, 153-157
aBorlakoglu JT, Welch VA, Edwards-Webb JD and Dils RR, Transport and cellular uptake of polychlorinated biphenyls
(PCBs)—II, Changes in vivo in plasma lipoproteins and proteins of pigeons in response to PCBs, and a proposed model for the
transport and cellular uptake of PCBs Biochemical Pharmacology, 40, 1990, 273-281
bBorlakoglu JT, Welch VA, Wilkins JPG and Dils RR, Transport and cellular uptake of polychlorinated biphenyls (PCBs)—I,
Association of individual PCB isomers and congeners with plasma lipoproteins and proteins in the pigeon, Biochemical
Pharmacology, 40, 1990, 265-272
Bosse U, Bannert N, Niessen KH, Teufel M, Röse I, Chlorinated carbohydrate content of fetal and pediatric organs and tissues.
International J of Hygiene and Environmental Medicine 1996 (198) 331-339
Brunetto R, Leon A, Burguera JL, Burguera M, Levels of DDT residues in human milk of Venezuelan women from various rural
populations. The science of the total environment 1996 (186) 203-207
Buck GM, Vena JE, Schisterman EF, Dmochowski J, Mendola P, Sever LE, Fitzgerald E, Kostyniak P, Greizerstein H and Olson
J, Parental Consumption of Contaminated Sport Fish From Lake Ontario and Predicted Fecundability, Epidemiology 11(4): 388;
2000
Bulayeva NN and Watson CS, Xenoestrogen-Induced ERK-1 and ERK-2 Activation via Multiple Membrane-Initiated Signaling
Pathways Environ Health Perspect 112:1481–1487 (2004).
Buser H-R & Müller MD, Enantiomer Separation of Chlordane Components and Metabolites Using Chiral High-Resolution Gas
Chromatography and Detection by Mass Spectrometric Techniques, Anal. Chem., 1992, 84, 3160-75
aCalabrese EJ and Baldwin LA, The Hormetic Dose-Response Model Is More Common than the Threshold Model in
Toxicology, Toxicological Sciences, 2003, 71, 246-250; bToxicology rethinks its central belief, Nature 2003, 421, 691 - 692

Heqing Shen Reference
- 106 -
Campagna C, Sirard M-A, Ayotte P and Bailey JL, Impaired Maturation, Fertilization, and Embryonic Development of Porcine
Oocytes, Following Exposure to an Environmentally Relevant Organochlorine Mixture1, Biology of Reproduction 65, 554–560
(2001)
Campbell MA, Gyorkos J, Leece B, Homonko K and Safe S, The effects of twenty-two organochlorine pesticides as inducers of
the hepatic drug-metabolizing enzymes, General Pharmacology: The Vascular System, Volume 14, Issue 4, 1983, 445-454
Campoy C, Jimenez M, Olea-Serrano MF, Frias MM, Canabate F, Olae N, Bayes R, Molina-Font JA, Analysis of organochlorine
pesticides in human milk: preliminary results, Early Human Develpoment, 65, 2001, S183-S190
Cariati E, Acanofora L, Branconi F, Bigazzi-Grasso C, Capei R and Grasso G, p,p’-DDT in perinatal samples: report on maternal
and neonatal measurements. Biological research in pregnancy and perinatology, 1983 (4) 169-171
Chaloupka K, Harper N , Krishnan V, Santostefano M, Rodriguez LV and Safe S, Synergistic activity of polynuclear aromatic
hydrocarbon mixtures as aryl hydrocarbon (Ah) receptor agonists, Chemico-Biological Interactions, 89, 1993, 141-158
Charlier C, Desaive Cl and Plomteux G, Human exposure to endocrine disrupters: consequences of gastroplasty on plasma
concentration of toxic pollutants, International Journal of Obesity (2002) 26, 1465-1468
Chao ST & Juchau MR (1980) Cytochrome P-450 mixed function oxygenases in placental tissue: metabolism of endogenous and
exogenous compounds. Proc West Pharmacol Soc, 23, 3-7.
Chen CW, Hurd C, Vorojeikina DP, Arnold SF, Notides AC, Transcriptional Activation of the Human Estrogen Receptor by
DDT Isomers and Metabolites in Yeast and MCF-7 Cells, Biochemical Pharmacology, 1997, 53, 1161-72
Chevrier J, Dewailly É, Ayotte P, Mauriège P, Després JP and Tremblay A, Body weight loss increases plasma and adipose
tissue concentrations of potentially toxic pollutants in obese individuals, International Journal of Obesity, 2000, 24, 1272-1278
Chu S, Covaci A, Haraguchi K, Voorspoels S, van de Vijver K, Das K, Bouquegneau J-M, de Coen W, Blust R and Schepens P,
Levels and Enantiomeric Signatures of Methyl Sulfonyl PCB and DDE Metabolites in Livers of Harbor Porpoises (Phocoena
phocoena) from the Southern North Sea, Environ. Sci. Technol.2003, 37,4573-4578
Chu S, Covaci A and Schepens P, Levels and chiral signatures of persistent organochlorine pollutants, in human tissues from
Belgium Environmental Research 93 (2003) 167–176
Chung N, Aust SD, Degradation of pentachlorophenol in soil by Phanerochaete Chrysosporium, J of hazardous materials, 41,
1995, 177-183
Covaci A, Gheorghe A, Schepens P, Distribution of organochlorine pesticides, polychlorinated biphenyls and α-HCH
enantiomers in pork tissues, Chemosphere xxx (2004) xxx–xxx
Covaci A, Jorens Ph, Jacquemyn Y, Schepens P (2002) Distribution of PCBs and organochlorine pesticides in umbilical cord and
Heqing Shen Reference
- 107 -
material serum, The science of the total environment, 298, 45-53
Cupp AS, Skinner MK, Actions of the endocrine disruptor methoxychlor and its estrogenic metabolite on in vitro embryonic rat
seminiferous cord formation and perinatal testis growth, Reproductive Toxicology, 2001, 15, 317-326
Czaja K, Ludwicki JK, Goralczyk K, Strucinski P, Effect of age and number of deliveries on mean concentration of
organochlorine compounds in human breast milk in Poland. Bull. Environ. Contam. Toxicol. 1997 (59), 407-413
Czub G, Mclachlan MS (2004) Bioaccumultion potential of persistent organic chemicals in humans. Environ. Sci. Technol. 38,
2406-2412
Dallaire F, Dewailly E, Muckle G, Vezina C, Jacobson SW, Jacobson JL and Ayotte P, Acute infections and environmental
exposure to organochlorines in Inuit infants from Nunavik, Environ Health Perspectives, 2004, 112, 1359-1364
Daston G, Faustman E, Ginsberg G, Fenner-Crisp P, Olin S, Sonawane B, Bruckner J and Breslin W, A framework for assessing
risks to children from exposure to environmental agents. Environmental Health Perspective 112, 238-256
de Boer J, Capillary gas chromatography for the determination of halogenated micro-contaminants, J. Chromatogr. A 843, 1999,
179-198
de Boer J, Wester PG, Klamer HJC, Lewis WE and Boon JP, Do flame retardants threaten ocean life? Nature, 394, 28-29, 1998
Dekoning EP and Karmaus W, PCB exposure in utero and via breast milk, a review, J of Exposure Analysis and Environmental
Epidemiology, 2000 (10), 285-293
Den Hond E, Roels HA, Hoppenbrouwers K, Nawrot T, Thijs L, Vandermeulen C, Winneke G, Vanderschueren D, Staessen JA,
Sexual maturation in relation to polychlorinated aromatic hydrocarbons: Sharpe and Skakkebaek’s hypothesis revisited,
Environmental health perspectives, 2002, 110, 771-776
Dolk H, Vrijheid M, Armstrong B, Abramsky L, Bianchi F, Garne E, Nelen V, Robert E, Scott JES, Stone D, Tenconi R, Risk of
congenital anomalies near hazardous-waste landfill sites in Europe: the EUROHAZCON study, Lancet1998; 352: 423–27
Dorea JG, Cruz-Granja AC, Lacayo-Romero ML, Cuadra-Leal J, Perinatal Metabolism of dichlorodiphenyldichloroethylene in
Nicaraguan mothers. Environmental Research Section A 2001 (86) 229-237
Eckenhausen FW, Bennett D, Beynon KI, Elgar KE, Organochlorine pesticide concentrations in perinatal samples from mothers
and babies. Archives of Environmental Health, 1981, 36, 81-92
Enan E and Matsumura F, Activation of c-Neu tyrosine kinase by o,p'-DDT and beta-HCH in cell-free and intact cell
preparations from MCF-7 human breast cancer cells, Journal Of Biochemical And Molecular Toxicology, Volume 12, Issue 2,
1998, 83-92
Heqing Shen Reference
- 108 -
Environmental health criteria 152, Polybrominated biphenyls, WHO, Geneva, 1994
Ernst W, Weigelt V and Weber K, Octachlorostyrene-a permanent micropollutant in the North Sea, Chemosphere, 13,1984,
161-168
Evangelista de Duffard AM, Duffard R, Behavioral Toxicology, Risk Assessment, and Chlorinated Hydrocarbons, Environ
Health Perspect 104 (Suppl 2): 353-360 (1996)
Ezendam J, Staedtler F, Pennings J, Vandebriel RJ, Pieters R, Harleman JH, Vos JG, Toxicogenomics of subchronic
hexachlorobenzene exposure in brown Norway rats, Environmental health perspectives, 112, 2004, 782-791
Falconer RL, Bidleman TF, Gregor DJ, Semkin R and Teixeira C, Enantioselective Breakdown of α-Hexachlorocyclohexane in a
Small Arctic bike and Its Watershed, Environ. Sci. Technol. 1995, 29, 1297-1302
Falconer RL, Bidleman TF, and Szeto SY, Chiral Pesticides in Soils of the Fraser Valley, British Columbia, J. Agric. Food
Chem. 1997, 45, 1946-1951
Faller J, Hühnerfuss H, König WA and Ludwig P, Gas chromatographic separation of the enantiomers of marine organic
pollutants Distribution of α-HCH enantiomers in the North Sea, Marine Pollution Bulletin, 22, 1991, 82-86
Fein GG, Jacobson JL, Jacobson SW, Schwartz PM, Dowler JK, Prenatal exposure to polychlorinated biphenyls: effects on birth
size and gestational age, The Journal of Pediatrics, 105, 1984, 315-320
Feldman D, Editorial: Estrogens from Plastic—Are We Being Exposed? Endocrinology 1997,138, 1777-1779
Fielden MR, Samy SM, Chou KC, Zacharewski TR, Effect of human dietary exposure levels of genistein during gestation and
lactation on long-term reproductive development and sperm quality in mice, Foof and chemical toxicology, 2003, 41, 447-454
Fitzgerald EF, Hwang S-A, Deres DA, Bush B, Cook K and Worswick P, The association between local fish consumption and
DDE, mirex, and HCB concentrations in the breast milk of Mohawk women at Akwesasne, Journal of Exposure Analysis and
Environmental Epidemiology (2001) 11, 381-388.
Flower KB, Hoppin JA, Lynch CF, Blair A, Knott C, Shore DL and Sandler DP, Cancer Risk and Parental Pesticide Application
in Children of Agricultural Health Study Participants, Environ Health Perspect 112:631–635 (2004).
Foster WG, Hughes CL, Chan S, Platt L (2002) Human developmental exposure to endocrine active compounds, Environmental
toxicology and pharmacology, 12, 75-81
Foster W, Chan S, Platt L, Hughes C, Detection of endocrine disrupting chemicals in samples of second trimester human
amniotic fluid, The Journal of Clinical Endocrinology & Metabolism, 2000, 85, 2954-2957
Gaido KW, Maness SC, McDonnell DP, Dehal SS, Kupfer D and Safe S, Interaction of Methoxychlor and Related Compounds

Heqing Shen Reference
- 109 -
with Estrogen Receptor α and β and Androgen Receptor: Structure-Activity Studies, Mol Pharmacol 58:852–858, 2000
Gaido KW, Leonard LS, Maness SC, Hall JM, McDonnell DP, Saville B and Safe S, Differential Interaction of the Methoxychlor
Metabolite 2,2-Bis- (p-Hydroxyphenyl)- 1,1,1-Trichloroethane with Estrogen Receptors α and β, Endocrinology, 140,
5746-5753, 1999
Ginsberg G, Slikker Jr W, Bruckner J, and Sonawane B, Incorporating Children’s Toxicokinetics into a Risk Framework,
Environ Health Perspect 112:272–283 (2003)
Gladen BC, KlebanoffMA, Hediger ML, Katz SH, Barr DB, Davis MD, Longnecker MP, Prenatal DDT Exposure in Relation to
Anthropometric and Pubertal Measures in Adolescent Males, Environ Health Perspectives, doi:10.1289/ehp.7287 (available at
http://dx.doi.org/) Online 7 September 2004
Gore AC, Organochlorine pesticides directly regulate gonadotropin-releasing hormone gene expression and biosynthesis in
GT1-7 hypothalamic cell line, Molecular and cellular endocrinology, 2002, 192, 157-170
Guerin TF, Abiological loss of endosulfan and related chlorinated organic compounds from aqueous system in the present and
absence of oxygen, Environmental pollution, 115, 2001, 219-230
Guillette Jr LJ, Vonier PM and McLachlan JA, Affinity of the alligator estrogen receptor for serum pesticide contaminants,
Toxicology, Volumes 181-182, 27 December 2002, Pages 151-154
Haggarty P (2002) Placental regulation of fatty acid delivery and its effect on fetal growth-A review. Placenta, 23, S28-S38.
Hakk H and Letcher RJ, Metabolism in the toxicokinetics and fate of brominated falme retardants-a review, Environmental
International, 29, 2003, 801-828
Hardell L, van Bavel B, Lindström G, Carlberg M, Dreifaldt AC, Wijkström H, Starkhammar H, Eriksson M, Hallquist A and
Kolmert T, Increased Concentrations of Polychlorinated Biphenyls, Hexachlorobenzene, and Chlordanes in Mothers of Men with
Testicular Cancer, Environ Health Perspect 111:930–934 (2003).
Hardy ML, A comparison of the properties of the major commercial PBDPO/PBDE product to those of major PBB and PCB
products, Chemosphere, 46, 2002, 717-728
Harris CA, Woolridge MW, Hay AWM, Factors affecting the transfer of prganochlorine pesticide residues to breastmilk,
Chemosphere, 2001 (43) 243-256
aHatakeyama M, Tessier DM, Dunlap DY, Zou E, Matsumura F, Estrogenic action of β-HCH through activation of c-Neu in
MCF-7 breast carcinoma cells, Environmental Toxicology and Pharmacology 11 (2002) 27–38
bHatakeyama M, Zou E, Matsumura F, Comparison of the characteristic of estrogenic action patterns of beta-HCH and heregulin
beta1 in MCF-7 human breast cancer cells, Journal Of Biochemical And Molecular Toxicology, 16, 2002, 209-219

Heqing Shen Reference
- 110 -
Hoekstra PF, Burnison BK, Neheli T, Muir DCG, Enantiomer-specific activity of o,p’-DDT with the human estrogen receptor
Toxicology Letters 125 (2001) 75–81
Holme JA and Dybing E, Induction of liver microsomal cytochrome P-450 and associated monooxygenases by octachlorostyrene
in inbred strains of mice Lack of correlation with the murinE Ah locus, Biochemical Pharmacology, 31, 1982, 2523-2529
Hosie S, Loff S, Witt K, Niessen K, Waag K-L (2000) Is there a correlation between organochlorine compounds and
undescended testes? Eur J Pediatr Surg 10, 304-309
Hoyer AP, Jorgensen T, Brock JW, Grandjean P, Organochlorine exposure and breast cancer survival, J. of Clinical
Epidemiology, 53 (2000), 323-330
Hu Y and Kupffer D, Enantioselective metabolism of the endocrine disrupter pesticide methoxychlor by human cytochromes
P450 (P450s): major differences in selective enantiomer formation by various P450 isoforms, DRUG METABOLISM AND
DISPOSITION, 30:1329–1336, 2002
Hühnerfuss H 2000. Chromatographic enantiomer separation of chiral xenobiotics and their metabolites-A versatile tool for
process studies in marine and terrestrial ecosystems. Chemosphere 40: 913-919.
Hustert K, Kotzias D and Korte F, Beitrag zum verhalten von octachlorstyrol bei uv-bestrahlung, Chemosphere 13, 1984 ,
845-848
Ikeda GJ and Sapienza PP, Distribution, Metabolism and Excretion of Pentachloroanisole in the Beagle Dog and Miniature Pig,
Food and Chemical Toxicology, 33, 1995, 409-421
Ikeda GJ, Sapienza PP and Warr PI, Disposition and metabolism of radiolabelled pentachloroanisole in rats and rabbits, Food and
Chemical Toxicology, 32, 1994, 1137-1146
Imbeault P, Chevrier J, DewaillyÉ, Ayotte P, Després JP, Tremblay A and Mauriège P, Increase in plasma pollutant levels in
response to weight loss in humans is related to in vitro subcutaneous adipocyte basal lipolysis, International Journal of Obesity
(2001) 25, 1585-1591
Ishihara A, Sawatsubashi S, Yamauchi K, Endocrine disrupting chemicals: interference of thyroid hormone binding to
transthyretins and to thyroid hormone receptors, Molecular and cellular endocrinology, 2003, 199, 105-117
Jacobson JL, Fein GG, Jacobson SW, Schwartz PM, Dowler JK, The transfer of polychlorinated biphenyls (PCBs) and
polybrominated biphenyls (PBBs) across the human placenta and into maternal milk, American Journal of Public Health, 74,
1984, 378-379
Johnson RA, Harris RE, Wilke RA, Are pesticides really endocrine disruptors? WMJ: Official Publication of the State Medical
Society of Wisconsin, 99, 2000, 34-38

Heqing Shen Reference
- 111 -
Jolliffe IT, Principal Component Analysis. Springer-Verlag, 1986.
Jönsson J, Rodriguez-Martinez H and Brandt I, Transplacental toxicity of 3-methylsulphonyl-DDE in the developing adrenal
cortex in mice, Reproductive Toxicology 9, 1995, 257-264
Jorgensen EH, Burkow IC, Foshaug H, Killie B, Ingebrigtsen K, Influence of lipid status on tissue distribution of the persistent
organic pollutant octachlorostyrene in Arctic Charr (Salvelinus alpinus). Comp. Biochem. Physiol. 1997 (118C) 311-318
Kaiser J, Endocrine Disrupters: Synergy Paper Questioned at Toxicology Meeting, Science, 275, 1997, 1879-80; Panel
Cautiously Confirms Low-Dose Effects, Science, 2000, 290, 695-697.
Kallenborn R and Hühnerfuss H (2000) Chiral environmental pollutants, trace analysis and ecotoxicology (Eds), Berlin:
Springer.
Kavlock RJ, Daston GP, DeRosa C, Fenner-Crisp P, Gray LE, Kaattari S, Lucier G, Luster M, Mac MJ, Maczka C, Miller R,
Moore J, Rolland R, Scott G, Sheehan DM, Sinks T & Tilson HA Research needs for the risk assessment of health and
environmental effects of endocrine disruptors: a report of the U.S. EPA-sponsored workshop, Environ Health Perspec, 1996,
104, 715-40.
Kearney JP, Cole DC, Ferron LA and Weber J-P, Blood PCB, p, p’-DDE, and Mirex Levels in Great Lakes Fish and Waterfowl
Consumers in Two Ontario Communities, Environmental Research Section A 80, S138–S149 (1999)
Kelce WR, Stone CR, Laws SC, Gray LE, Kemppainen JA and Wilson EM, Persistent DDT metabolite p,p'-DDE is a potent
androgen receptor antagonist, Nature 375, 581 - 585 (1995)
Kelce WR, Wilson EM, Environmental antiandrogens: developmental effects, molecular mechanisms, and clinical implications, J
Mol Med (1997) 75: 198-207
Kendall M, Multivariate Analysis. Charles Griffin&Co., 1975.
Khan MAQ, Genetic and biochemical characteristics of cyclodiene epoxidase in the housefly, Biochemical Pharmacology, 19,
1970, 903-910
Klaunig JE, Xu Y, Isenberg JS, Bachowski S, Kolaja KL, Jiang J, Stevenson DE and Walborg EF Jr, The Role of Oxidative
Stress in Chemical Carcinogenesis Environ Health Perspect 106(Suppl 1): 289-295 (1998)
Klotz DM, Ladlie BL, Vonier PM, McLachlan JA, Arnold SF, o,p’-DDT and its metabolites inhibit progesterone-dependent
responses in yeast and human cells, Molecular and Cellular Endocrinology 129 (1997) 63–71
Knudsen FR, Pottinger TG, Interaction of endocrine disrupting chemicals, singly and in combination, with estrogen-, androgen-,
and corticosteroid-binding sites in rainbow trout (Oncorhynchus mykiss), Aquatic Toxicology 44 (1999) 159–170
Heqing Shen Reference
- 112 -
Kocarek TA, Schuetz EG, Guzelian PS, Regulation of cytochrome P450 2B1/2 mRNAs by Kepone (chlordecone) and potent
estrogens in primary cultures of adult rat hepatocytes on Matrigel, Toxicology Letters, 71, 1994, 183-196
Kohno H, Bocchinfuso WP, Gandini O, Curtis SW and KS Korach, Mutational analysis of the estrogen receptor ligand-binding
domain: influence of ligand structure and stereochemistry on transactivation, Journal of Molecular Endocrinology, 16, 277-285
(1996)
Korte F and Arent H, Metabolism of insecticides, IX(1) isolation and identification of dieldrin metabolites from urine of rabbits
after oral administration of dieldrin-14C, Life Sciences, 4, 1965 , 2017-2026
Koske G, Leupold G, Angerhiifer D and Parlar H, Multidimensional gas chromatographic enantiomer quantification of some
chlorinated xenobiotics in cod liver and fish oils, Chemosphere, 39, 683-688, 1999
Kostyniak PJ, Stinson C, Greizerstein HB, Vena J, Buck G, Mendola P, Relation of Lake Ontario fish consumption, lifetime
lactation, and parity to breast milk polychlorobiphenyl and pesticide concentrations. Environmental Research Section A, 1999
(80), S166-S174
Körner A (1996) Umweltprobenbank des Bundes: Verfahrensrichtlinien für Probenahme, Transport, Lagerung und chemische
Charakterisierung von Umwelt- und Human-Organproben (Eds.). Berlin: Erich Schmidt
Korte F and Arent H, Metabolism of insecticides, IX (1) isolation and identification of dieldrin metabolites from urine of rabbits
after oral administration of dieldrin-14C, Life Sciences, 4, 1965, 2017-2026
Krümmel EM, Macdonald RW, Kimpe LE, Gregory-Eaves I, Demers MJ, Smol JP, Finney B, Blais JM (2003) Delivery of
pollutants by spawning salmon. Nature, 425, 255-256
Laden F, Neas LM, Spiegelman D, Hankinson SE, Willett WC, Ireland K, Wolff MS and Hunter DJ, Predictors of Plasma
Concentrations of DDE and PCBs in a Group of US Women, Environ Health Perspect 107:75-81 (1999)
Larsson C, Norström K, Athanansiadis I, Bignert A, König WA, and Bergman A, Enantiomeric Specificity of
Methylsulfonyl-PCBs and Distribution of Bis(4-chlorophenyl) Sulfone, PCB, and DDE Methyl Sulfones in Grey Seal Tissues,
Environ. Sci. Technol.2004, 38,4950-4955
Laug ER, Kunze FM and Prickett CS (1951) Occurrence of DDT in human fat and milk. Arch Ind Hyg Occup Med, 3, 245-246
Luross JM, Alaee M, Sergeant DB, Cannon CM, Whittle DM, Solomon KR and Muir DCG, Spatial distribution of
polybrominated diphenyls ethers and polybrominated biphenyls in lake trout from the Laurentian Great Lakes, Chemosphere, 46,
2002, 665-672
Lawson CC, Schnorr TM, Whelan EA, Deddens JA, Dankovic DA, Piacitelli LA, Sweeney MH, and Connally LB, Paternal
Occupational Exposure to 2,3,7,8-Tetrachlorodibenzo- p-dioxin and Birth Outcomes of Offspring: Birth Weight, Preterm
Delivery, and Birth Defects, Environ Health Perspect 112:1403–1408 (2004)

Heqing Shen Reference
- 113 -
Lentza-Rizos Ch, Avramides EJ and Visi E, Determination of residues of endosulafan and five pyrethroid insecticides in virgin
olive oil using gas chromatography with electron-capture detectionm J. Chromatogr. A 921, 2001, 297-304.
Li MH, Hansen LG, Enzyme induction and acute endocrine effects in prepubertal female rats receiving environmental
PCB/PCDF/PCDD mixtures, Environ Health Perspect 1996, 104(7), 712-22
Lindhe Ö, 2001, Adrenal bioactivation and toxicity of 3-MeSO2-DDE, o,p’-DDD and DMBA investigated in tissue slice culture.
Acta Universitatis Upsaliensis (Dissertation for the Degree of Doctor of philosophy in environmental toxicology).
Lindhe Ö, Skogseid B and Brandt I, Cytochrome P450-catalyzed binding of 3methylsulfonyl-DDE and o,p’-DDD in human
adrenal Zona Fasciculata/Reticularis, The J. of Clinical Endocrinology & Metabolism, 2000, 87, 1319-1326.
Lyons G (2000), Mixed messages: pesticides that confuse hormones, briefing paper on October, Pesticide Action Network UK.
Maness SC, McDonnell DP and Gaido KW, Inhibition of Androgen Receptor-Dependent Transcriptional Activity by DDT
Isomers and Methoxychlor in HepG2 Human Hepatoma Cells, Toxicology and Applied Pharmacology, 151, 135–142 (1998)
Martin Jr SA, Harlow SD, Sowers MF, Longnecker MP, Garabrant D, Shore DL, Sandler DP, DDT Metabolite and Androgens in
African-American Farmers EPIDEMIOLOGY 2002; 13:454-458
Maruyama S, Fujimoto N, Yin H, Ito A, Growth stimulation of a rat pituitary cell line MtT/E-2 by environmental estrogens in
vitro and in vivo, Endocrine Journal, Volume 46, Issue 4, August 1999, Pages 513-520
Mayring L, Renner G and Prigge H, Sulphur-containing metabolites of the fungicides pentachloronitrobenzene (PCNB) and
hexachlorobenzene (HCB) II. Mass spectra, Chemosphere 13, 1984, 731-737
McGovern V, Hexachlorobenzene exposure widespread toxicant produces pervasive effects, Environmental Health Perspectives,
112, 2004, A416 http://www.ebi.ac.uk/arrayexpress/
McLachlan JA, Environmental Signaling: What Embryos and Evolution Teach Us About Endocrine Disrupting Chemicals,
Endocrine Reviews 22(3): 319–341
McNamara JP, Role and regulation of metabolism in adipose tissue during lactation, The Journal of Nutritional Biochemistry, 6,
1995, 120-129
Mehrotra BD, Moorthy KS, Reddy SR and Desaiah D, Effects of cyclodiene compounds on calcium pump activity in rat brain
and heart, Toxicology, 54, 1989, 17-29
Miyashita M, Shimada T, Nakagami S, Kurihara N, Miyagawa H, Akamatsu M, Enantioselective recognition of
mono-demethylated methoxychlor metabolites by the estrogen receptor, Chemosphere 54 (2004) 1273–1276
Mössner S, Spraker TR, Becker PR and Ballschmiter K, Ratios of enantiomers of alpha-HCH and determination of alpha-, beta-,
and gamma-HCH isomers in brain and other tissues of neonatal Northern fur seals (Callorhinus ursinus), Chemosphere, 24, 1992,
Heqing Shen Reference
- 114 -
1171-1180
Nair A, Mandapati R, Dureja P and Pillai MKK (1996) DDT and HCH load in mothers and their infants in Delhi, India, Bull.
Environ. Contam. Toxicol. 56, 58-64
Nasir K, Bilto YY, Al-Shuraiki Y, Residues of chlorinated hydrocarbon insecticides in human milk of Jordanian women.
Environmental Pollution 1998 (99) 141-148
Nezel T and Müller-Plathe F, Theoretical considerations about chiral PCBs and their methylthio and methylsulfonyl metabolites
being possibly present as stable enantiomers, Chemosphere. 35, 1895-1906, 1997
Nimrod AC and Benson WH, Estrogenic Responses to Xenobiotics in Channel Catfish (Ictaluws punctatus), Marine
Environmental Research, 42, 155-160 (1996)
Noren K and Meironyte D (2000) Certain organochlorine and organobromine contaminants in Swedish human milk in
perspective of past 20-30 years. Chemosphere, 40, 1111-1123
Okoumassoun L-E, Averill-Bates D, Gagne F, Marion M, Denizeau F, Assessing the estrogenic potential of organochlorine
pesticides in primary cultures of male rainbow trout (Oncorhynchus mykiss) hepatocytes using vitellogenin as a biomarker,
Toxicology 178 (2002) 193–207
Pakdeesusuk U, Jones WJ, Lee CM, Garrison AW, O' Niell WL, Freedman DL, Coates JT and Wong CS, Changes in
Enantiomeric Fractions during Microbial Reductive Dechlorination of PCB132, PCB149, and Aroclor 1254 in Lake Hartwell
Sediment Microcosms, Environ. Sci. Technol.2003, 37,1100-1107
Payne J, Scholze M and Kortenkamp Mixtures of four organochlorines enhance human breast cancer cell proliferation. Environ
Health Perspect 109:391–397 (2001)
Perera FP, Environment and Cancer: Who Are Susceptible? Science, 278,1997, 1068-1073
Perera FP, Rauh V, Whyatt RM, Tsai W-Y, Bernert JT, Tu Y-H, Andrews H, Ramirez J, Qu L and Tang D, Molecular Evidence
of an Interaction Between Prenatal Environmental Exposures and Birth Outcomes in a Multiethnic Population, Environ Health
Perspect 112:626–630 (2004)
Pfaffenberger B, Hühnerfuss H, Kallenborn R, Köhler-Günther A, König WA and Krüner G, Chromatographic separation of the
enantiomers of marine pollutants. Part 6: Comparison of the enantioselective degradation of α-hexachlorocyclohexane in marine
biota and water, Chemosphere, 25, 1992, 719-725
Pierik FH, Burdorf A, Deddens JA, Juttmann RE, Weber RFA, Maternal and Paternal Risk Factors for Cryptorchidism and
Hypospadias: A Case-Control Study in Newborn Boys, Environ Health Perspect, doi:10.1289/ehp.7243 (available at
http://dx.doi.org/) Online 3 September 2004

Heqing Shen Reference
- 115 -
Porter KL, Chanda S, Wang HQ, Gaido KW, Smart RC, Robinette CL, 17beta-estradiol is a hormonal regulator of mirex tumor
promotion sensitivity in mice, Toxicological Sciences, 69, 2002, 42-48
Przyrembel H, Heinrich-Hirsch B and Vieth B (2000) Exposition to and health effects of residues in human milk. Advances in
Experimental Medicine and Biology, 478, 307-325
Putz O, Schwartz CB, Kim S, LeBlanc GA, Cooper RL and Prins GS, Neonatal Low- and High-Dose Exposure to Estradiol
Benzoate in the Male Rat: I. Effects on the Prostate Gland, Biology of Reproduction 65, 1496-1505 (2001); II. Effects on Male
Puberty and the Reproductive Tract, Biology of Reproduction 65, (2001)
Rajapakse N, Ong D and Kortenkamp A, Defining the Impact of Weakly Estrogenic Chemicals on the Action of Steroidal
Estrogens, Toxicology science, 60, 296-304 (2001)
Rajapakse N, Silva E, Scholze M and Kortenkamp A, Deviation from Additivity with Estrogenic Mixtures Containing
4-Nonylphenol and 4-tert-Octylphenol Detected in the E-SCREEN Assay, Environ Sci Technol 2004, 38, 6343-6352
Ralph JL, Orgebin-Crist MC, Lareyre JJ, Nelson CC, Disruption of androgen regulation in the prostate by the environmental
contaminant hexachlorobenene, Environ Health Perspect 2003, 111, 461-466
Ramamoorthy K, Wang F, Chen I-C, Norris JD, McDonnell DP, Leonard LS, Gaido KW, Bocchinfuso WP, Korach KS and Safe
S, Estrogenic Activity of a Dieldrin/Toxaphene Mixture in the Mouse Uterus, MCF-7 Human Breast Cancer Cells, and
Yeast-Based Estrogen Receptor Assays: No Apparent Synergism, Endocrinology, 138, 1520-1527 (1997)
Rauhamaa-Mussalo H, Hasanen E, Pyysalo H, Antervo K, Kauppila R and Pantzar P, Occurrence of beta-hexachlorocyclohexane
in breast cancer patients, 1988 (25), 1-19
Rauhamaa-Mussalo H, Pyysalo H and Antervo K, Relation between the content of organochlorine compounds in Finnish human
milk and characteristics of the mothers. Journal of Toxicology and Environmental Health, 1988 (25), 1-19
Reichrtová E, Ciznár P, Prachar V, Palkovicová L and Veningerová M, Cord Serum Immunoglobulin E Related to the
Environmental Contamination of Human Placentas with Organochlorine Compounds, Environ Health Perspect 107:895-899
(1999)
Reutman SR, LeMasters GK, Knecht, EA, Shukla R, Lockey JE, Burroughs, GE, Kesner, JS, Evidence of reproductive endocrine
effects in women with occupational fuel and solvent exposures, Environmental health perspectives, 2002, 110, 805-811
Rice C, Birnbaum LS, Cogliano J, Mahaffey K, Needham L, Rogan WJ, and vom Saal FS, Exposure Assessment for Endocrine
Disruptors: Some Considerations in the Design of Studies, Environ Health Perspect 111:1683–1690 (2003).
Rivas A, Fernandez MF, Cerrillo I, Ibarluzea J, Olea-Serrano MF, Pedraza V and Olea N, Human exposure to endocrine
disrupters: Standardisation of a marker of estrogenic exposure in adipose tissue, Apmis, 109, 185 - , 2001

Heqing Shen Reference
- 116 -
Robson M and Harrad S, Chiral PCB Signatures in Air and Soil: Implications for Atmospheric Source Apportionment, Environ.
Sci. Technol.2004, 38,1662-1666
Rosival L, Szokolay A and Grunt J, Transplacental passage of pesticides into human embryo. Czechoslovak Medicine 1983 (6)
1-7
Rüttimann-Johnson C, Lamar RT, Binding of pentachlorophenyl to humic substances in soil by the action of white rot fungi, Soil
Biol. Biochem., 29, 1997, 1143-1148
Safe SH, Do environmental estrogens play a role in development of breast cancer in women and male reproductive probelms?
Human Ecol. Risk Assess. 1, 17-23 (1995)
Safe S, Connor K, Ramamoorthy K, Gaido K, Maness S, Human exposure to endocrine-active chemicals: hazard assessment
problems, Regulatory toxicology and pharmacology, 1997, 26, 52-58
Saiyed H, Dewan A, Bhatnagar V, Shenoy U, Shenoy R, Rajmohan H, Patel K, Kashyap R, Kulkarni P, Rajan B and Lakkad B,
Effect of Endosulfan on Male Reproductive Development, Environ Health Perspect 111:1958–1962 (2003).
Sandau CD, Ayotte P, Dewailly E, Duffe J, and Norstrom RJ, Analysis of Hydroxylated Metabolites of PCBs (OH-PCBs) and
Other Chlorinated Phenolic Compounds in Whole Blood from Canadian Inuit Environ Health Perspect 108:611-616 (2000).
Saxena MC, Siddiqui MK, Bhargava AK, Murti CR and Kutty D (1981) Placental transfer of pesticides in humans. Archives of
Toxicology, 48, 127-134
Schecter A, Kassis I and Päpke O, partitioning of dioxins, dibenzofurans, and coplanar PCBs in blood, milk, adipose tissue,
placenta and cord blood from five American women. Chemosphere, 1998 (37), 1817-1823
Schlebusch H, Wagner U, Schneider Ch, Paffenholz I, Placental transfer of chlorinated hydrocarbons in humans, Clinical
chemistry, 1994 (40), 1084
Schmidt WF, Hapeman CJ, Fettinger JC, Rice CP and Bilboulian S, Structure and Asymmetry in the Isomeric Conversion of β-
to α-Endosulfan, J. Agric. Food Chem., 45, 1997,1023-1026
Schönfelder G, Wittfoht W, Hopp H, Talsness CE, Paul M & Chahoud I (2002) Parent bisphenol A accumulation in the human
maternal-fetal-placental unit. Environ Health Perspec,110, A703-A707.
Shinomiya N, Shinomiya M, Dichlorodiphenyltrichloroethane suppresses neurite outgrowth and induces apoptosis in PC12
phenochromocytoma cells, Toxicology letters, 2003, 137, 175-183
Silva E, Rajapakse N & Kortenkamp A Something from ''nothing'' - eight weak estrogenic chemicals combined at concentrations
below NOECs produce significant mixture effects. Environ Sci Technol 2002, 36, 1751-1756.

Heqing Shen Reference
- 117 -
Sim M, Case studies in the use of toxicological measures in epidemiological studiesToxicology 181/182 (2002) 405-409
Skakkebaek NE, Rajpert-De Meyts E, Main KM Testicular dysgenesis syndrome: an increasingly common developmental
disorder with environmental aspects. Human Reproduction 2001, 16, 972-978.
Smeds A and Saukko P (2001) Identification and quantification of polychlorinated biphenyls and some endocrine disrupting
pesticides in huamn adipose tissue from Finland. Chemosphere, 44, 1463-1471.
Smith AG and Gangolli SD (2002) Organochlorine chemicals in seafood: occurrence and health concerns, Food and Chemical
Toxicology, 40, 767-779
Smith D (1999) Worldwide trends in DDT levels in human breast milk, International Journal of Epidemiology, 28, 179-188
Soechitram SD, Athanasiadou M, Hovander L, Bergman A and Sauer PJJ, Fetal exposure to PCBs and their hydroxylated
metabolites in a Dutch cohort. Environmental Health Perspectives 2004 (112) 1208-1212
Solomon GM and Weiss PM, Chemical contaminants in breast milk: time trends and regional variability. Environ Health
Perspect 2002 (110) A339-347
Solomon GM and Huddle AM, Low levels of persistent organic pollutants raise concerns for future generations, Journal of
Epidemiology and Community Health 2002; 56:826-827
Soto AM, Chung KL and Sonnenschein C, The Pesticides Endosulfan, Toxaphene, and Dieldrin Have Estrogenic Effects on
Human Estrogen-Sensitive Cells, Environmental Health Perspectives, Volume 102, Number 4, April 1994
Souès S, Fernandez N, Souverain P and Lesca P, Intracellular lipoproteins as carriers for 2,3,7,8-tetrachlorodibenzo-p-dioxin and
benzo(a)pyrene in rat and mouse liver Biochemical Pharmacology, 38,1989, 2841-2847
Spearow JL, Doemeny P, Sera R, Leffler R, Barkley M, Genetic Variation in Susceptibility to Endocrine Disruption by Estrogen
in Mice, Science, 285, Number 5431, 1999, 1259-1261.
Steinmetz R, Young PC, Caperell-Grant A, Gize EA, Madhukar BV, Ben-Jonathan N, Bigsby RM, Novel estrogenic action of
the pesticide residue beta-hexachlorocyclohexane in human breast cancer cells, Cancer Research, 56, 1996, 5403-5409
Stevenson DE, Walborg Jr EF, North DW, Sielken Jr RL, Ross CE, Wright AS, Xu Y, Kamendulis LM and Klaunig JE,
Monograph: Reassessment of human cancer risk of aldrin/dieldrin, Toxicology Letters 109, 1999, 123-186
Stewart P, Darvill T, Lonky E, Reihman J, Pagano J and Bush B, Assessment of prenatal exposure to PCBs from maternal
consumption of Great Lakes fish: an analysis of PCB pattern and concentration. Environmental Research Section A, 1999 (80),
S87-S96
St-Pierre MV, Ugele B, Gambling L & Shiverick KT (2002) Mechanisms of drug transfer across the human placenta-A

Heqing Shen Reference
- 118 -
workshop report. Placenta, 23, S159-S164.
Sultan C, Balaguer P, TerouanneB, Georget V, Paris F, Jeandel C, Lumbroso S, Nicolas J-C, Environmental xenoestrogens,
antiandrogens and disorders of male sexual differentiation, Molecular and Cellular Endocrinology, 2001, 178, 99-105
Tabb MM, Kholodovych V, Grün F, Zhou C, Welsh WJ and Blumberg B, Highly Chlorinated PCBs Inhibit the Human
Xenobiotic Response Mediated by the Steroid and Xenobiotic Receptor (SXR), Environ Health Perspect 112:163–169 (2004).
Thorpe KL, Cummings RI, Hutchinson TH, Scholze M, Brighty G, Sumpter JP and Tyler CR, Relative Potencies and
Combination Effects of Steroidal Estrogens in Fish, Environ. Sci. Technol.2003, 37,1142-1149
Tilson HA, Jacobson JL, Rogan WJ, Polychlorinated biphenyls and the developing nervous system: cross-species comparisons,
Neurotoxicol Teratol 1990, 12: 239-248
Tinwell H and Ashby J, Sensitivity Of The Immature Rat Uterotrophic, Assay To Mixtures Of Estrogens doi:10.1289/ehp.6831
(available at http://dx.doi.org/) Online 8 January 2004, Environ Health Perspect
Toppari J, Larsen JC, Christiansen P, Giwercman A, Grandjean P, Guillette Jr LJ, Jegou B, Jensen TK, Jouannet P, Keiding N,
Leffers H, McLachlan JA, Meyer O, Müller J, Meyts ER, Scheike T, Sharpe R, Sumpter J & Skakkebæk NE (1996) Male
reproductive health and environmental xenoestrogens. Environ Health Perspec, 104, 741-776
Torres S, Is exposure to endocrine disrupting compounds during fetal/post-natal development affecting the reproductive potential
of farm animals? Domestic animal endocrinology, 2002, 23, 203-209
Torres RM, Grosset C, Steiman R, Alary J, Liquid chromatography study of degradation and metabolism of
pentachloronitrobenzene by four soil micromycetes, Chemosphere, 33, 1996, 683-692
Tullya DB, Coxa VT, Mumtazb MM, Davisa VL, Chapina RE, Six high-priority organochlorine pesticides, either singly or in
combination, are nonestrogenic in transfected HeLa cells, Reproductive Toxicology 14 (2000) 95–102
Ulrich EM, Caperell-Grant A, Jung SH, Hites RA, Bigsby RM, Environmentally Relevant Xenoestrogen Tissue Concentrations
Correlated to Biological Responses in Mice, Environ Health Perspect 108:973-977 (2000)
Ulrich EM and Hites RA, Enantiomeric ratios of chlordane-related compounds in air near the Great Lakes, Environ. Sci.
Technol., 1998, 32, 1870-1874
Vainio H and Parkki MG, Enhancement of microsomal monooxygenase, epoxide hydrase and udpglucuronyltransferase by
aldrin, dieldrin and isosafrole administrations in rat liver, Toxicology, 1976, 5, 279-286
van Birgelen APJM (1998) Hexachlorobenzene as a possible major contributor to dioxin activity of human milk. Environ Health
Perspec, 106, 683-688.

Heqing Shen Reference
- 119 -
van Den Bercken J and Narahashi T, Effects of aldrin-transdiol –– A metabolite of the insecticide dieldrin –– On nerve
membrane, European Journal of Pharmacology, 27, 1974, 255-258
van Raaij JAGM, Frijters CMG and van den Berg KJ, Hexachlorobenzene-induced hypothyroidism involvement of different
mechanisms by parent compound and metabolite, Biochemical Pharmacology, 46, 1993, 1385-1391
Verma SP, Salamone E and Goldin B, Curcumin and Genistein, Plant Natural Products, Show Synergistic Inhibitory Effects on
the Growth of Human Breast Cancer MCF-7 Cells Induced by Estrogenic Pesticides, Biochemical and Biophysical Research
Communication, 233, 692–696 (1997)
Vetter W, Schurig V. Enantioselective determination of chiral organochlorine compounds in biota by gas chromatography on
modified cyclodextrins. J Chromatogr A. 1997; 774, 143-175
Volker D, Wolfgang H, KlausdieterB, Caner S, Christian C, Gerhard O, Associations of dichlorodiphenyltrichloroethane (DDT)
4.4 and dichlorodiphenyldichloroethylene (DDE) 4.4 blood levels with plasma IL-4, Archives Of Environmental Health, 57,
2002, 541-547
vom Saal FS, Timms BG., Montano MM, Palanza P, Thayer KA, Nagel SC, Dhar MD, Ganjam VK, Parmigiani S and Welshons
WV, Prostate enlargement in mice due to fetal exposure to low doses of estradiol or diethylstilbestrol and opposite effects at
high doses, Proc. Natl. Acad. Sci. 94, 2056-2061, 1997
Waliszewski SM, Aguirre AA, Infanzon RM and Siliceo J (2000) Carry-over of persistent organochlorine pesticides through
placenta to fetus, salud publica de mexico, 42, 384-390
Waliszewski SM, Aguirre AA, Infanzon RM, Silva CS, Siliceo J, Organochlorine pestivcides levels in maternal adipose tissue,
maternal blood serum, umbilical blood derum, and milk from inhabitants of Veracruz, Mexico, Arch. Environ. Contam. Toxicol.,
2001 (40), 432-438
Waliszewski SM, Aguirre AA, Benitez A, Infanzon RM, Infanzon R and Rivera J, Organochlorine pesticide redisues in human
blood serum of inhabitants of Veracruz, Mexico, Bull. Envion. Contam. Toxicol. 1999 (62), 397-402
Waliszewski SM, Aguirre AA, Infanzon RM, Rivera J, Infanzon R, Time trend of organochlorine pesticide residues in human
adipose tissue in Veracruz, Mexico: 1988-1997 survey, the science of the total environment, 1998 (221), 201-204
Walker JB, Seddon L, McMullen E, Houseman J, Tofflemire K, Corriveau A, Weber J-P, Mills C, Smith S and Oostdam J V
(2003), Organochlorine levels in maternal and umbilical cord blood plasma in Arctic Canada, The science of the total
environment, 302, 27-52
Walsh LP and Stocco DM, Effects of Lindane on Steroidogenesis and Steroidogenic Acute Regulatory, Protein Expression,
Biology of Reproduction, 63, 1024–1033 (2000)
Weistrand C and Norén K, Methylsulfonyl Metabolites of PCBs and DDE in Human Tissues, Environ Health Perspect
105:644-649 (1997)

Heqing Shen Reference
- 120 -
Welsh JJ, Collins TFX, Black TN, Graham SL and O'Donnell Jr MW, Teratogenic potential of purified pentachlorophenol and
pentachloroanisole in subchronically exposed Sprague-Dawley rats, Food and Chemical Toxicology, 25, 1987, 163-172
Wenker MAM, Kezic S, Monster AC and de Wolff FA, Metabolism of Styrene-7,8-oxide in Human Liver in Vitro:
Interindividual Variation and Stereochemistry, Toxicology and Applied Pharmacology 169, 52–58 (2000)
Wiberg K, Letcher R, Sandau C, Duffe J, Norstrom R, Haglund P, and Bidleman T, Enantioselective Gas Chromatography/Mass
Spectrometry of Methylsulfonyl PCBs with Application to Arctic Marine Mammals, Anal. Chem.1998, 70,3845-3852
Wiberg K, Letcher RJ, Sandau CD, Norstrom RJ, Tysklind M and Bidleman TF, The Enantioselective Bioaccumulation of Chiral
Chlordane and α-HCH Contaminants in the Polar Bear Food Chain, Environ. Sci. Technol.2000, 34,2668-2674
Willett KL, Ulrich EM, and Hites RA, Differential toxicity and environmental fates of hexachlorocyclohexane isomers,
Environmental science and technology, 1998, 32, 2197-2207
aWitorsch RJ (2002) Low-dose in utero effects of xenoestrogens in mice and their relevance to humans: an analytical review of
the literature, Food and chemical toxicology: an international journal published for the British industrial biological research
association, 40, 905-912
bWitorsch RJ (2002) Endocrine disruptors: can biological effects and environmental risks be predicted? Regulatory toxicology
and pharmacology, 2002, 36, 118-130
Wong CS, Mabury SA, Whittle DM, Backus SM, Teixeira C, Devault DS, Bronte CR and Muir DCG, Organochlorine
Compounds in Lake Superior: Chiral Polychlorinated Biphenyls and Biotransformation in the Aquatic Food Web, Environ. Sci.
Technol.2004, 38,84-92
Wong CS, Lau F, Clark M, Mabury SA and Muir DCG, Rainbow Trout (Oncorhynchus mykiss) Can Eliminate Chiral
Organochlorine Compounds Enantioselectively, Environ. Sci. Technol.2002, 36,1257-1262
Zitko V and Hutzinger O, Uptake of chloro- and bromobiphenyls, hexachloro- and hexabromobenzene by Fish, Bulletin of
Environmental Contamination & Toxicology, 1976, 16, 665-673
Zitko V, The accumulation of polybromobiphenyls by fish, Bulletin of Environmental Contamination & Toxicology, 1977, 17,
285-291
Zou E, Matsumura F, Long-term exposure to β-hexachlorocyclohexane (β-HCH) promotes transformation and invasiveness of
MCF-7 human breast cancer cells, Biochemical Pharmacology 66 (2003) 831–840
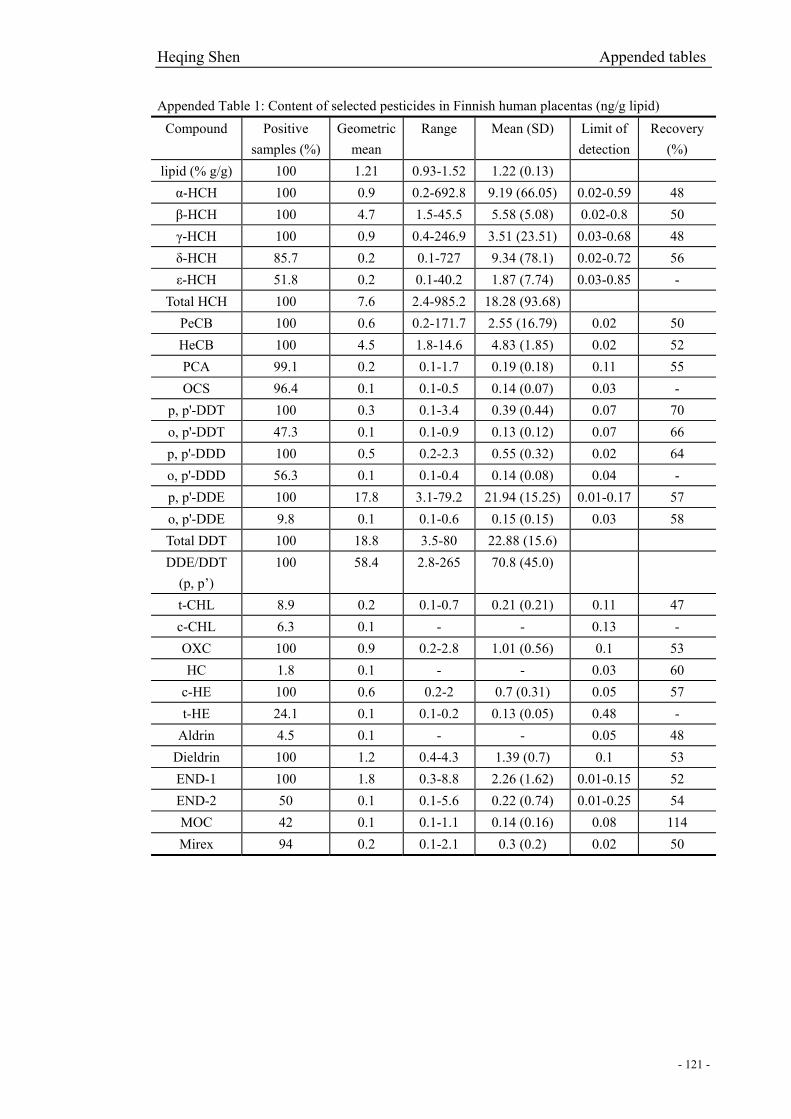
Heqing Shen Appended tables
- 121 -
Appended Table 1: Content of selected pesticides in Finnish human placentas (ng/g lipid) Compound Positive
samples (%) Geometric
mean Range Mean (SD) Limit of
detection Recovery
(%) lipid (% g/g) 100 1.21 0.93-1.52 1.22 (0.13) α-HCH 100 0.9 0.2-692.8 9.19 (66.05) 0.02-0.59 48 β-HCH 100 4.7 1.5-45.5 5.58 (5.08) 0.02-0.8 50 γ-HCH 100 0.9 0.4-246.9 3.51 (23.51) 0.03-0.68 48 δ-HCH 85.7 0.2 0.1-727 9.34 (78.1) 0.02-0.72 56 ε-HCH 51.8 0.2 0.1-40.2 1.87 (7.74) 0.03-0.85 -
Total HCH 100 7.6 2.4-985.2 18.28 (93.68) PeCB 100 0.6 0.2-171.7 2.55 (16.79) 0.02 50 HeCB 100 4.5 1.8-14.6 4.83 (1.85) 0.02 52 PCA 99.1 0.2 0.1-1.7 0.19 (0.18) 0.11 55 OCS 96.4 0.1 0.1-0.5 0.14 (0.07) 0.03 -
p, p'-DDT 100 0.3 0.1-3.4 0.39 (0.44) 0.07 70 o, p'-DDT 47.3 0.1 0.1-0.9 0.13 (0.12) 0.07 66 p, p'-DDD 100 0.5 0.2-2.3 0.55 (0.32) 0.02 64 o, p'-DDD 56.3 0.1 0.1-0.4 0.14 (0.08) 0.04 - p, p'-DDE 100 17.8 3.1-79.2 21.94 (15.25) 0.01-0.17 57 o, p'-DDE 9.8 0.1 0.1-0.6 0.15 (0.15) 0.03 58 Total DDT 100 18.8 3.5-80 22.88 (15.6) DDE/DDT
(p, p’) 100 58.4 2.8-265 70.8 (45.0)
t-CHL 8.9 0.2 0.1-0.7 0.21 (0.21) 0.11 47 c-CHL 6.3 0.1 - - 0.13 - OXC 100 0.9 0.2-2.8 1.01 (0.56) 0.1 53 HC 1.8 0.1 - - 0.03 60
c-HE 100 0.6 0.2-2 0.7 (0.31) 0.05 57 t-HE 24.1 0.1 0.1-0.2 0.13 (0.05) 0.48 -
Aldrin 4.5 0.1 - - 0.05 48 Dieldrin 100 1.2 0.4-4.3 1.39 (0.7) 0.1 53 END-1 100 1.8 0.3-8.8 2.26 (1.62) 0.01-0.15 52 END-2 50 0.1 0.1-5.6 0.22 (0.74) 0.01-0.25 54 MOC 42 0.1 0.1-1.1 0.14 (0.16) 0.08 114 Mirex 94 0.2 0.1-2.1 0.3 (0.2) 0.02 50

Heqing Shen Appended tables
- 122 -
Appended Table 2: Content of selected pesticides in Denmark human placentas (ng/g lipid) Compound Positive
samples (%) Geometric
mean Range Mean (SD) Limit of
detection Recovery
(%) lipid (%g/g) 100 1.07 0.55-1.5 1.09 (0.17) α-HCH 51 1.34 0.46-8.92 1.76 (1.62) 0.00-0.04 70 β-HCH 100 8.77 2.87-47.76 9.92 (6.07) 0.00-0.08 72 γ-HCH 6 1.3 1.06-1.72 1.31 (0.19) 0.00-0.04 68 δ-HCH 20 0.31 0.15-0.7 0.33 (0.14) 0.00-0.04 79 ε-HCH 7 0.03 0.01-0.1 0.04 (0.03) 0.00-0.04 -
Total HCH 100 9.81 3.07-48.52 10.95 (6.61) PeCB 21 0.97 0.48-8.56 1.23 (1.39) 0.00-0.33 55 HeCB 100 7.63 2.17-26.49 8.08 (2.99) 0.00-0.03 59 PCA 37 0.32 0.13-2.7 0.4 (0.39) 0.00-0.03 67 OCS 48 0.15 0.08-0.39 0.16 (0.06) 0.00-0.04 65
p, p'-DDT 59 0.7 0.31-4.65 0.85 (0.72) 0.00-0.06 83 o, p'-DDT 8 0.18 0.14-0.26 0.19 (0.05) 0.00-0.04 80 p, p'-DDD 100 0.68 0.16-6.28 0.85 (0.8) 0.00-0.02 81 o, p'-DDD 89 0.06 0.02-0.35 0.08 (0.06) 0.00-0.02 - p, p'-DDE 100 40.77 9.52-269.83 47.43
(29.69) 0.01-0.1 67
o, p'-DDE 49 0.04 0.02-0.2 0.04 (0.03) 0.00-0.02 68 Total DDT 100 42.04 9.86-273.57 48.88
(30.32)
DDE/DDT (p, p’)
59 71.69 11.51-380.04 84.32 (51.51)
t-CHL 5 0.05 0.03-0.18 0.06 (0.05) 0.00-0.07 67 c-CHL 5 0.05 0.03-0.19 0.06(0.05) 0.00-0.07 67 OXC 100 1.02 0.15-3.99 1.19 (0.66) 0.00-0.17 70 HC - - - - 0.02 75
c-HE 100 0.88 0.1-3.1 0.99 (0.47) 0.00-0.06 75 t-HE - - - - 0.01-0.34 -
Aldrin 11 0.04 0.01-0.73 0.08(0.17) 0.00-0.03 64 Dieldrin 100 2.34 0.42-19.57 2.73 (1.96) 0.00-0.12 64 END-1 83 2.21 0.72-6 2.45 (1.09) 0.01-0.22 65 END-2 8 0.21 0.13-0.39 0.22 (0.08) 0.01-0.16 66 MOC 1 0.59 0.59 0.59(-) 0.00-0.05 98 Mirex 99 0.14 0.02-1.08 0.19 (0.17) 0.00-0.02 61

Heqing Shen Appended tables
- 123 -
Appended Table 3: Content of selected pesticides in Denmark human milk (ng/g lipid) Compound Positive
samples (%) Geometric
mean Range Mean (SD) Limit of
detection Recovery
(%) lipid (% g/g) 100 2.66 0.36-7.33 2.99 (1.38) α-HCH 38 0.63 0.1-3.45 0.93 (0.80) 0.00-0.05 49 β-HCH
100 17.6 5.97-66.23 20.55
(13.02) 0.00-0.09
51 γ-HCH 32 0.89 0.29-2.98 1.08 (0.72) 0.00-0.04 48 δ-HCH 5 0.18 0.14-0.27 0.19 (0.07) 0.00-0.03 57 ε-HCH 0.00-0.04 -
Total HCH 100 18.99 7.02-67.33
21.86 (13.06)
PeCB 83 0.34 0.18-1.41 0.38 (0.23) 0.00-0.02 40 HeCB
100 12.20 6.01-24.56 12.82 (4.13)
0.00-0.04 49
PCA 43 0.17 0.05-0.79 0.24 (0.21) 0.00-0.03 53 OCS 86 0.20 0.07-0.39 0.21 (0.08) 0.00-0.03 58
p, p'-DDT 100 5.79 1.62-37.88 7.19 (5.70) 0.00-0.04 80 o, p'-DDT 100 0.48 0.13-1.83 0.58 (0.38) 0.00-0.04 69 p, p'-DDD 75 0.10 0.01-0.33 0.12 (0.07) 0.00-0.03 65 o, p'-DDD 46 0.03 0.01-1.07 0.08 (0.22) 0.00-0.01 - p, p'-DDE
100 127.42 24.59-427.55148.73 (84.93)
0.00-0.1 52
o, p'-DDE 92 0.09 0.03-0.28 0.09 (0.05) 0.00-0.02 54 Total DDT
100 135.07 26.63-442.7 157.12 (88.31)
DDE/DDT (p, p’) 100 22.01 4.36-106.66
25.12 (15.14)
t-CHL 66 0.05 0.01-0.35 0.07 (0.06) 0.00-0.04 51 c-CHL 37 0.03 0.01-0.07 0.04 (0.02) 0.00-0.04 51 OXC 100 4.88 2.26-12.01 5.20 (1.89) 0.00-0.25 56 HC 0.01 67
c-HE 100 2.78 1.25-10.82 3.08 (1.59) 0.00-0.14 64 t-HE 0.02-0.71 -
Aldrin 0.00-0.03 53 Dieldrin 100 5.04 1.74-35.5 5.84 (4.45) 0.00-0.17 54 END-1 100 6.89 1.92-18.05 7.70 (3.54) 0.01-0.31 48 END-2 0.01-0.34 52 MOC 8 0.16 0.07-0.26 0.18 (0.08) 0.00-0.04 94 Mirex 98 0.20 0.04-0.66 0.23 (0.12) 0.00-0.02 53

Heqing Shen Appended tables
- 124 -
Appended Table 4: Content of selected pesticides in Finland human milk (ng/g lipid) Compound Positive
samples (%) Geometric
mean Range Mean (SD) Limit of
detection Recovery
(%) lipid(% g/g) 100 4.24 0.95-10.14 4.52(1.56) α-HCH 100 0.15 0.04-0.77 0.18(0.14) 0.00-0.02 47 β-HCH 100 10.65 2.74-30.89 11.68(5.23) 0.00-0.27 44 γ-HCH 100 0.43 0.08-4.05 0.59(0.64) 0.00-0.04 47 δ-HCH 38 0.03 0.01-0.16 0.05(0.04) 0.00-0.10 50 ε-HCH 0.00-0.12 -
Total HCH 100 11.45 3.64-31.74 12.46(5.38) PeCB 100 0.25 0.08-1.17 0.27(0.15) 0.00-0.01 39 HeCB 100 7.98 2.94-18.55 8.51(3.17) 0.00-0.08 45 PCA 98 0.03 0.01-0.11 0.04(0.02) 0.00-0.01 52 OCS 100 0.17 0.04-0.70 0.20(0.12) 0.00-0.02 69
p, p'-DDT 100 3.75 1.46-12.9 4.26(2.42) 0.00-1.35 51 o, p'-DDT 98 0.26 0.04-1.21 0.31(0.19) 0.00-0.33 43 p, p'-DDD 100 0.32 0.10-1.36 0.39(0.26) 0.00 44 o, p'-DDD 85 0.02 0.01-0.17 0.03(0.03) 0.00 - p, p'-DDE 100 64.49 18.95-331.16 79.04(57.81) 0.01-0.11 29 o, p'-DDE 100 0.03 0.01-0.14 0.05(0.03) 0.00-0.05 44
Total DDT 100 69.24 20.74-346.12 84.06(60.09) DDE/DDT
(p, p’) 100 17.19 8.10-42.51 18.49(7.69)
t-CHL 82 0.03 0.01-0.11 0.04(0.03) 0.00-0.04 75 c-CHL 46 0.02 0.01-0.05 0.02(0.02) 0.00-0.03 - OXC 100 3.47 0.91-9.40 3.93(1.9) 0.00-0.17 49 HC 0.01 67
c-HE 100 2.03 0.63-17.02 2.37(2.06) 0.00-0.05 57 t-HE 0.01-0.27 -
Aldrin 0.00-0.03 43 Dieldrin 100 2.47 0.77-7.19 2.78(1.48) 0.00-0.12 40 END-1 100 5.61 1.19-22.66 7.01(4.71) 0.01-0.38 27 END-2 11 0.05 0.02-0.12 0.06(0.04) 0.01-0.12 31 MOC 98 0.07 0.02-1.12 0.11(0.15) 0.00-0.17 81 Mirex 98 0.23 0.02-1.54 0.32(0.26) 0.00-0.02 36