collecting and managing traffic data on local roads
TRANSCRIPT

Prepared by CTC & Associates LLC 1
TRS 1207 Published September 2012
Collecting and Managing Traffic Data on Local Roads
The purpose of this TRS is to serve as a synthesis of pertinent completed research to be used for further study and
evaluation by MnDOT. This TRS does not represent the conclusions of either CTC & Associates or MnDOT.
Introduction In Minnesota, most traffic data is collected by
MnDOT district offices. However, some cities
and counties, particularly those in the seven-
county Metro area, gather their own traffic
counts on County State Aid Highways, county
roads and Municipal State Aid Streets.
MnDOT is investigating alternatives to this
primarily centralized approach to gathering
traffic counts. To support this effort, this report
examines traffic counting practices on local
roads from five perspectives:
1. Current MnDOT traffic counting practices
2. Traffic counting technologies appropriate for temporary deployment
3. Literature review of traffic counting practices on local roads
4. Surveys of statewide participants in MnDOT’s traffic data collection program (initial and supplemental
surveys)
5. Survey of state DOTs’ local road traffic data collection practices
Summary In Current MnDOT Traffic Counting Practices, we present a brief overview of MnDOT’s traffic counting
practices as they relate to the types and frequency of traffic counts and the parties responsible for collecting,
analyzing and reporting on traffic data.
Prepared by CTC & Associates LLC 2
An investigation of Traffic Counting Technologies Appropriate for Temporary Deployment identifies
products currently available to complement the permanent and continuous traffic counting sites MnDOT
maintains. A summary table describes the features, functionality and cost of traffic detector technologies that are
promising options for collecting volume, classification and speed data on two-lane roads with a temporary
roadside deployment.
A Literature Review of Traffic Counting Practices on Local Roads examines publications related to state
DOT traffic counting practices and other domestic research. In addition to an update to an FHWA guidebook and
a 2003 FHWA report that highlights exemplary state traffic counting practices, we cite publications from five
states—Alaska, Florida, Kentucky, Pennsylvania and Texas—that describe sampling methods, alternatives for
estimating seasonal factors and site selection related to local road traffic counts.
In Surveys of Statewide Participants in MnDOT’s Traffic Data Collection Program, we describe three
surveys distributed to city and county engineers in Minnesota.
The first survey consisted of 12 questions that sought to gather local agencies’ perspectives on MnDOT’s traffic
data collection program, identify local practices, and assess the agencies’ interest in conducting their own traffic
counts. The survey received 102 responses from a pool of 230 possible respondents (engineers from 143 cities
and 87 counties). Of the 60 responses from city engineers (a 42 percent response rate), 29 responses were from
Greater Minnesota and 31 were from cities in the Metro District. Of the 42 county responses (a 48 percent
response rate), 37 were from Greater Minnesota and five were from the Metro District.
A second and third survey served to clarify some questions in the initial survey that might not have adequately
addressed the differences in counting practices throughout the state. The 25 respondents to a six-question survey
of Greater Minnesota city and county engineers answered questions about:
Additional traffic data needs on local roads.
Concerns regarding MnDOT’s current traffic data collection efforts.
Interest in collecting traffic count and vehicle classification data and sharing it with MnDOT.
Acceptance of an alternate approach to calculating annual average daily traffic values that extrapolates a
limited amount of vehicle classification data to surrounding count locations.
A separate three-question survey of city and county engineers in the Metro area who are currently collecting their
own traffic data received 26 responses (engineers from 20 cities and six of the seven Metro area counties).
Respondents identified additional needs for traffic data on local roads and concerns regarding local road traffic
data collection requirements in the Metro area.
An online Survey of State DOTs’ Local Road Traffic Data Collection Practices examined how state agencies
meet the federally mandated Highway Performance Monitoring System reporting requirements for local roads and
how other local road data is collected. Twenty-two respondents to the 19-question survey provided information in
three topic areas related to traffic monitoring practices on local roadways: State DOT collection, analysis and reporting programs.
Partner agency collection, analysis and reporting programs.
Local road data use, challenges and goals.

Prepared by CTC & Associates LLC 3
1. Current MnDOT Traffic Counting Practices
Traffic volume data plays a key role in helping a state DOT plan, design and manage its roadways. At MnDOT,
the Office of Transportation Data and Analysis administers the traffic volume program, working with partners
within and outside the agency to collect traffic data.
Types of Traffic Data Collected
MnDOT collects traffic data on its trunk highways, County State Aid Highways, county roads and Municipal
State Aid Streets using a variety of methods and technologies:
Portable Installations
Short-duration counts of 48 hours are collected at approximately 33,000 sites, the majority of all traffic
count locations. See below for a breakdown of count locations by roadway type:
o 4,500 on TH
o 13,500 on CSAH
o 6,500 on CR
o 8,500 on MSAS
Vehicle classification data is gathered at more than 1,200 sites that collect traffic volume data and
categorize counts by vehicle type. Currently, staffing constraints limit systematic vehicle classification to
the TH system, though some data has been collected on other types of roadways. MnDOT can provide
classification equipment to local agencies requesting it.
Permanent/Continuous Installations
MnDOT’s approximately 80 automatic traffic recorder sites use loops installed in the pavement to
collect volume and sometimes vehicle classification and/or speed data. Eliminating redundancies has
allowed MnDOT to reduce maintenance costs and lower the number of ATRs from a high of 140 sites.
Seventeen weigh-in-motion sites collect vehicle weight, type, speed and volume data.
More than 240 counting sites maintained by the Regional Traffic Management Center collect volume
data. (Their primary purpose is to manage traffic.)
How the Traffic Data Is Used
MnDOT uses traffic volume data:
In statewide estimation of vehicle miles traveled.
For annual reporting of VMT and annual average daily traffic, or AADT, estimates to FHWA.
As one element of the State Aid Needs System formula that allocates state funding for roadway
maintenance and construction on the CR and MSAS systems.
To identify traffic trends and understand where heavy commercial traffic is expected to increase to inform
pavement design.
In other planning, engineering and traffic forecasting efforts within MnDOT.
For informational purposes for the public.
Forty to 50 percent of the short-duration traffic counts gathered by MnDOT and its partners are needed to submit
mandatory reports to FHWA’s Highway Performance Monitoring System. HPMS is a national repository of data

Prepared by CTC & Associates LLC 4
on the extent, condition, performance, use and operating characteristics of the nation’s highways. TDA submits
monthly and annual reports of state-level traffic volumes to HPMS.
Collecting the Traffic Data
The majority of traffic data collected on the TH system and local system roads is collected by MnDOT district
staff. While district staff collect data in the cities and counties of Greater Minnesota, cities and seven counties in
the eight-county Metro District collect their own traffic data and provide it to MnDOT for analysis and reporting.
This practice dates back to an informal agreement developed in the 1970s between MnDOT and local agencies.
The surveys of participants in MnDOT’s traffic data collection program presented in Section 4 of this report
reflect the distinction between traffic counting practices in Greater Minnesota and the Metro District.
Some Metro District agencies use contractors to complete the required traffic counts, and some cities and counties
in Greater Minnesota collect their own traffic data in addition to the data collected by their respective MnDOT
district offices. All TDA partners responsible for collecting traffic data are required to follow TDA’s field
procedures that specify appropriate equipment and methods for collecting and recording traffic data.
The TH system is counted every two years; local system locations (CSAH, MSAS and CR) are counted every four
years. Starting in 2010, most of the CR system will be counted on a 12-year cycle. MnDOT’s count cycles are
shorter than required by FHWA for HPMS reporting (HPMS requires counts every three years for the TH system
and every six years for the local system). Most of the count locations used to gather traffic data for the HPMS are
on the TH system. Traffic counts are typically completed between April and October, taking into consideration
the construction season, school areas and harvest time to represent typical conditions.
Analyzing and Reporting Traffic Data
While TDA works with partners to collect traffic data, it is solely responsible for analyzing the data and reporting
the results of its analysis.
TDA uses traffic volume data—current and historical—to develop AADT counts. MnDOT defines AADT as “the
theoretical estimate of the total number of vehicles using a specific segment of roadway (in both directions) on
any given day of the year. This estimate represents the total number of cars per year divided by 365 and is
developed using factors to adjust for season, day of the week, and vehicle type.”
Each year, TDA completes AADT estimates in the fall and winter and sends draft AADT data to the appropriate
city or county engineer for comment. This comment period provides an opportunity for TDA and the local
agencies to discuss local land use and roadway changes that could affect traffic levels and patterns, and to alert the
local agencies to the AADT data that will become final when the official AADT data is posted on the MnDOT
website the following spring. See http://www.dot.state.mn.us/traffic/data/tma.html for MnDOT’s Web-based
traffic mapping application that reflects draft and official AADT data.
What’s Next?
To augment the state’s continuous traffic monitoring devices, MnDOT is investigating the use of temporary
installations such as a trailer-deployed nonintrusive traffic detector with solar panels that can be deployed for up
to a month. Section 2 of this report provides information about other promising portable counting technologies
appropriate for temporary deployment.
Implementation of a new data warehousing system—TRADAS—to facilitate sharing and managing traffic data is
expected to be complete by the end of 2012. (See http://chapsys.com/tradas_summary.html for more information
about TRADAS.) The new system will accept raw data file formats coming directly from traffic monitoring
devices and is expected to give analysts the ability to process more data more intensively.

Prepared by CTC & Associates LLC 5
2. Traffic Counting Technologies Appropriate for Temporary Deployment
Note: SRF Consulting Group Inc. provided the information included in this section of the report.
The detector technologies listed in the table below are promising options for collecting volume, classification and
speed data on two-lane roads with a temporary roadside deployment.
Temporarily Deployable Detector Technologies for Collecting Volume, Classification and Speed
Data on Two-Lane Roads
Vendor and Model Description Data Access Base Cost
(estimate)
CEOS
TIRTL (The Infra Red
Traffic Logger)
Infrared axle detector; setup somewhat
more difficult than most detectors because
sensors must be placed on both sides of the
road and be pointed at each other; one of
two products in this list that can do axle-
based detection; MnDOT places them in
traffic barrels when deployed to
hide/protect them.
http://www.ceos.com.au/index.htm
Either local or
network access
with additional
module
$30,000
Image Sensing Systems Inc.
RTMS G4
Side-fire radar; basic functionality;
multiple lanes; probably good performance
for count; classification has not been
evaluated.
http://www.imagesensingca.com/en/RTMS
/RTMSG4/tabid/65/Default.aspx
Either local or
network access
with additional
module
$4,000
Miovision Technologies
Inc.
Video-based system specifically designed
for temporary use; one of the only
temporary sensors that is good at
intersections; records video to internal
storage, user must later upload the video to
Miovision to process for a fee.
http://www.miovision.com/
Records video
locally and then
user uploads files
to Miovision
website;
Miovision
processes data in
24-48 hours and
makes the data
available
$3,000 for the
video
recording unit;
~$30 per hour
to process
video; volume
discounts for
long-term
counts are
negotiable
Nu-Metrics Inc.
Hi-Star
“Road stud” magnetometer that is
temporarily affixed with road tape in the
center of the lane; after 24- to 48-hour data
collection period, user collects sensors and
downloads data from them; one sensor
needed per lane
http://www.ae-
traffic.com/NuMetrics/HiStar_2005.pdf
Records data
locally $400

Prepared by CTC & Associates LLC 6
Temporarily Deployable Detector Technologies for Collecting Volume, Classification and Speed
Data on Two-Lane Roads
Vendor and Model Description Data Access Base Cost
(estimate)
Peek Traffic Corporation
AxleLight
Infrared axle detector; setup very difficult
due to poor interface (need to attach to
guardrail or other roadside infrastructure);
place two detectors about 16-20 feet apart.
http://www.peektraffic.com/datasheets/Axl
eLight.pdf
Records data
locally $30,000
Sensys Networks Inc.*
VSN240
“Puck”-style magnetometer that is epoxied
into the roadway; good count performance
but unknown classification performance;
battery-powered sensor lasts about 10
years.
http://www.sensysnetworks.com/products/
sensor/
Either local or
network access
with additional
module
$400 per
sensor; $2,000
roadside
equipment
Various passive acoustic
and microwave models
Passive acoustic sensor detects sound as
vehicles pass by; expect decent count
accuracy at low-volume sites; poor
performance in congested areas, probably
poor classification.
International Road Dynamics Inc.
http://www.irdinc.com/products/counters_
classifiers/index.php
SmarTek Systems Inc.
http://www.smarteksys.com/
ASIM by Xtralis
http://xtralis.com/p.cfm?s=22&p=381
ELTEC
http://elteccorp.com/
MS Sedco
http://www.mssedco.com/traffic.htm
Varies; many
support either
local or network
access
$2,000-$3,000
Various two-lane radar
detectors
Radar detectors that would be attached to a
roadside pole; each of these detectors
offers comparable features; two-lane;
performance unknown but expected to be
suitable for low-volume roads
Jamar Technologies Inc.
Radar Recorder
http://www.jamartech.com/radarrecorder.ht
ml
Records data
locally $3,000-$4,000

Prepared by CTC & Associates LLC 7
Temporarily Deployable Detector Technologies for Collecting Volume, Classification and Speed
Data on Two-Lane Roads
Vendor and Model Description Data Access Base Cost
(estimate)
Quixote Transportation Technologies Inc.
trans-Q
http://www.ae-
traffic.com/files/Quixote_TransQ_Portable
_Radar_Traffic_Classifier.pdf
International Road Dynamics Inc.
TMS-SA
http://www.irdinc.com/products/sensors_a
ccessories/non-intrusive_sensors/tms-
sa.php
Wavetronix LLC
SmartSensor (Model 105)
Side-fire radar; basic functionality;
multiple lanes; good count as long as it is
not occluded
http://www.signalcontrol.com/products/wa
vetronix/Wavetronix_SmartSensor_105.pd
f
Either local or
network access
with additional
module
$4,000
Wavetronix LLC
SmartSensor HD (Model
125)
Side-fire radar; improved automated setup
with better performance than 105 model;
multiple lanes; good count and length
measurement as long as it is not occluded
http://www.signalcontrol.com/tech_papers/
wavetronix/SS125_HD_User_Guide.pdf
Either local or
network access
with additional
module
$6,000
* The Sensys system requires permanent installation of sensors in the pavement, but they are inexpensive and can
be installed quickly (less than 30 minutes). Technicians would move the access equipment from site to site as
needed for temporary data collection.
Other permanent detector technologies not reflected in the table are widely used to collect data but are not
recommended for temporary deployment. The technologies listed below require a permanent in-roadway
installation or a have a high cost relative to their capabilities for use as a temporarily deployable detector
technology.
Inductive loops
Subpavement magnetometers (Microloops)
Piezoelectric sensors (axle detection only)
Weigh-in-motion sensors
Intersection video detection
Video analytics

Prepared by CTC & Associates LLC 8
3. Literature Review of Traffic Counting Practices on Local Roads
We examined completed and in-process domestic research related to traffic counting practices, with a particular
interest in counts conducted for local roads. The citations below offer details on State Practices and Related
Research and Other Resources.
State Practices
State Practices Used to Report Local Area Travel, FHWA, October 2003.
http://www.fhwa.dot.gov/ohim/statepractices.pdf
This FHWA report summarizes the results of a 2002 survey of FHWA state field offices that examined innovative
state practices used to estimate local area vehicle miles traveled. The first section of the 21-page report describes
noteworthy activities from five states—Georgia, Kansas, Kentucky, New York and Texas. The second section
summarizes practices in the 50 states. From page 7 of the PDF:
F. Do local planning agencies collect traffic data on local area systems that are not used by the State in
preparing the HPMS summaries?
Many local planning agencies collect some traffic monitoring information that is not normally used by the
States in reporting HPMS. Some States have attempted to work with local agencies to set up reporting formats
and rules for traffic factor adjustments; only a few States actively involve the local governments in traffic
monitoring for HPMS purposes.
Alaska “Using GIS to Develop a Sampling Program for Traffic Counts on Local Functional Systems in Small
Urban and Rural Areas,” Ming Lee, Jennifer Eason, TRB 91st Annual Meeting Compendium of Papers DVD,
Paper #12-2660, 2012.
Paper available at http://amonline.trb.org/1sjhoe/1sjhoe/1
Existing sampling methods based on traffic volume stratification were developed for roadways in the higher
functional classes and are not applicable for communities that do not have an adequate collection of existing
traffic counts on the local functional systems. This paper describes an innovative sampling approach developed
with a geographic information system for a small urban community (the Fairbanks North Star Borough in
Alaska). Instead of sampling local roads based on traffic volumes, densities of built tax parcels surrounding the
roads are used as the sampling stratum. The validity of the proposed approach is supported by a statistical analysis
that shows a significant positive relationship between traffic volumes and parcel densities.
Florida Alternatives for Estimating Seasonal Factors on Rural and Urban Roads in Florida, Phase II, Florida
Department of Transportation, Final Report for BD-015-17, February 2008.
http://www.dot.state.fl.us/research-center/Completed_Proj/Summary_PL/FDOT_BD015_17_rpt.pdf
Florida DOT employs seasonal factors in the calculation of annual average daily traffic at portable traffic
monitoring sites. Permanent traffic monitoring sites are manually classified into different groups referred to as
seasonal categories. These groups are based on similarities in the traffic characteristics of roads and on
engineering judgment. Results from a previous study demonstrated the possibility of identifying the link between
land use variables and seasonal factors. This follow-up study employs multiple linear regression analyses to
identify possible factors contributing to the seasonal fluctuations in traffic volumes for urban and rural locations
with a permanent traffic monitoring site in Florida. Based on these factors, researchers developed a methodology
to determine which permanent traffic monitoring sites are most likely to share similar seasonal factors with
portable traffic monitoring sites in urban areas. Researchers note that the methodology may be improved and
expanded for application to rural areas.

Prepared by CTC & Associates LLC 9
Related resource:
“Estimation for Seasonal Factors of Similarity-Based Traffic for Urban Roads in Florida,” Shanshan
Yang, Chenxi Lu, Fang Zhao, Richard Reel, J. Douglas O’Hara, Transportation Research Record, Vol. 2121,
2009: 74-80.
Citation at http://dx.doi.org/10.3141/2121-08
This article summarizes the research project that investigated potentially influential variables that contribute
to seasonal fluctuations in traffic volumes in urban areas in Florida. Test results using the method developed
by researchers to assign seasonal factors to portable traffic monitoring sites show that the errors of the
estimated seasonal factors are on average 5 percent. The authors note that this method is promising for
application in both urban and rural areas to improve accuracy in estimation of annual average daily traffic.
Kentucky Analysis of Traffic Growth Rates, Kentucky Transportation Cabinet, August 2001.
http://www.ktc.uky.edu/files/2012/06/KTC_01_15_SPR213_00_1F.pdf
Results of this study produced a random sampling procedure for traffic counting on local roads that was used as
part of an effort to model traffic growth at the county level in Kentucky. Researchers noted that the procedure
showed promising results in minimizing the level of effort required to estimate traffic volumes on local roads by
developing a relationship between functionally classified collector roads and local roads. County-level growth
rates in traffic volumes were analyzed and linear regression was used to represent changes in annual average daily
traffic to produce county-level growth rates by functional class.
Pennsylvania Stratification of Locally Owned Roads for Traffic Data Collection, Pennsylvania Department of
Transportation, Report No. FHWA-PA-2006-009-050210, August 2006.
ftp://ftp.dot.state.pa.us/public/pdf/BPR_PDF_FILES/Documents/Research/Complete%20Projects/Smart%20Tran
sportation%20Solutions/Stratification%20of%20Locally%20Owned%20Roads.pdf
At the time of publication, there were there were over 72,000 miles of roadways in Pennsylvania owned by 2,565
municipalities that are not on the federal-aid system and are classified as local roads. This research project aimed
to determine a sampling method to collect the data required to produce estimates of vehicle miles traveled on local
roads owned by municipalities. The plan that resulted contained 7,171 count stations spread proportionally over
152 strata, with the expectation that the 7,171 counts will be taken over a period of 10 years. Researchers note that
the plan was not based on a statistical analysis of local road AADT data and can be revised as appropriate once
data become available.
Texas “Random Count Site Selection Process for Statistically Valid Estimations of Local Street Vehicle Miles
Traveled,” William E. Frawley, Transportation Research Record, Vol. 1993, 2007: 43-50.
Citation at http://dx.doi.org/10.3141/1993-07
This paper describes a procedure developed by the Texas Transportation Institute to select traffic count sites
randomly on local streets, resulting in a statistically valid estimation of local street vehicle miles traveled that will
apply to road segments on which no count is taken. FHWA approved this random traffic count site selection
process for use and acknowledged it as a “most noteworthy state activity” related to estimating local street VMT
in its publication State Practices Used to Report Local Area Travel (see page 8 of this report for more information
about this publication).

Prepared by CTC & Associates LLC 10
Related Research and Other Resources
Traffic Monitoring Guide Update, FHWA, in process.
http://fhwatmgupdate.camsys.com/
An update under way for FHWA’s 2001 Traffic Monitoring Guide (see http://www.fhwa.dot.gov/ohim/tmguide/)
will reflect the latest technical, procedural and policy requirements and needs in the area of public road traffic
data collection, processing, sharing/exchange, and reporting. The final version of the updated guide was
scheduled for delivery to FHWA in August 2012.
Related resource:
Chapter 6, HPMS Requirements for Traffic Data, Traffic Monitoring Guide (update), undated.
http://fhwatmgupdate.camsys.com/images/TMG_CH6_v5.pdf
This chapter presents case studies of collection practices on local roads and rural minor collectors in Iowa and
New York.
Iowa
In Iowa, maintenance staff received training, a truck and data collection equipment to be used for
purposes of collecting Highway Performance Monitoring System data. The staff then conducts the
scheduled counts during the year. Beginning in 2004 through 2010, the DOT utilized maintenance crews
that cleared snow in the winter and provided continuity of employment and job diversity for equipment
operators. Staff worked locally in the counties where they lived. Overall program benefits were realized
through decreases in travel time and personal expenses as well as increases in data collection quantity,
quality, and metadata regarding changes in traffic patterns. Using permanent staff from local maintenance
garages allowed for better ownership of the data and conveyance of personal understanding regarding
changing traffic patterns, while at the same time maintaining procedural integrity through a centralized
program.
New York
New York counties, towns and cities assist New York State DOT in collecting local road data for HPMS
purposes. The state purchases and provides the counters and supplies for two qualifying counts per
counter per year for five years (e.g., 10 counts total). (A qualifying count is a count on the National
Highway System.) The number of counts provided is dependent on the number of miles of roadway
within the county. For example, the receiving local agency may be required to perform two counts for a
season and the rest are done when the local agency needs them. The state enters into a Memorandum of
Agreement with the counties in which they collect and provide all the data to the state at select locations,
and, in turn, the county keeps the equipment. If the county does not fulfill their obligation to the state, the
equipment must be returned. After they have completed their obligation to the state, the county can retain
the equipment and continue to take counts for themselves. The state asks that the county continue to
provide data and in turn, the state will assist with equipment repair.
“Modeling and Algorithms of VMT and AADT Estimation for Community Area Traffic Networks,” Sheng-
Guo Wang, Libin Bai, Yuanlu Bao, Preprints of the 18th IFAC World Congress, 2011.
http://www.nt.ntnu.no/users/skoge/prost/proceedings/ifac11-proceedings/data/html/papers/0229.pdf
This paper presents new modeling methods and their algorithms for estimating the VMT and AADT of
community traffic networks that lack monitoring systems. Researchers found that the total traffic count at the
entrances of a community has a strong relationship with its number of households. Three models are proposed to
estimate and predict AADT and VMT in the community based on a statistical evaluation of its household number,
the road network and drivers’ common behavior. Researchers verified the automatic algorithm and software
developed for the new models with field sample measurement data.

Prepared by CTC & Associates LLC 11
4. Surveys of Statewide Participants in MnDOT’s Traffic Data Collection Program
4a. Initial Survey of Statewide Participants in MnDOT’s Traffic Data Collection Program We distributed a brief online survey to the members of Minnesota city and county engineer listservs to gather
local agencies’ perspectives on MnDOT’s traffic data collection program, identify local practices and assess the
agencies’ interest in conducting their own traffic counts. The survey consisted of the following questions:
1. Does MnDOT’s current traffic data collection program meet all of your agency’s needs?
2. Please indicate any unmet needs.
3. Does your agency currently have its own traffic data collection program (outside of the data collection
that MnDOT performs)?
4. Does your agency have plans to establish a traffic data collection program or an interest in doing so?
5. Please describe your agency’s traffic data collection program (data you collect, not MnDOT).
5a. For what purposes are the traffic data gathered?
5b. If the traffic data is being gathered for local purposes, how is the data being used?
5c. What technologies are used to collect the traffic data?
5d. What types of traffic data are collected?
5e. How frequently is the traffic data collected?
5f. Who is responsible for collecting traffic data (personnel/agency)?
5g. What challenges have you encountered in gathering traffic data?
6. Does your agency use data surrogates such as historical count data, land zoning, future land use and road
network layout to supplement traffic count data?
7. How do you adjust your traffic data to establish an AADT (Annual Average Daily Traffic)?
8. Does your agency prefer to have MnDOT continue to collect baseline traffic data for local agencies with
no local funding match?
8a. Instead of having MnDOT conduct baseline traffic counts, would your agency prefer a centralized
State Aid–administered consultant contract to collect baseline traffic data for local agencies with
no required local funding match?
8b. Instead of having MnDOT conduct baseline traffic counts, would you prefer that your agency
collect baseline traffic data and be reimbursed by MnDOT?
9. If your agency collects its own traffic data, what are the next steps for your traffic data collection
program?
10. Would your agency be interested in funding enhanced traffic data collection beyond the baseline
statewide level if MnDOT can accommodate the collection?
11. Please provide contact information for the staff member in your agency responsible for overseeing traffic
data collection.
12. Please provide details on any of your answers or provide additional comments.
We received 102 survey responses from a pool of 230 possible respondents (engineers from 143 cities and 87
counties). Of the 60 responses from city engineers (a 42 percent response rate), 29 responses were from Greater

Prepared by CTC & Associates LLC 12
Minnesota and 31 were from cities in the Metro District. Of the 42 county responses (a 48 percent response rate),
37 were from Greater Minnesota and five were from the Metro District.
See Appendix A for the full text of all survey responses.
Summary of Initial Survey of Statewide Participants in MnDOT’s Traffic Data Collection Program
Below is a brief summary of key findings from the survey, followed by an analysis of survey responses.
The table below lists the cities responding by district.
Responses from City Engineers
District City
1 Cloquet, Grand Rapids
2 Bemidji, Thief River Falls
3 Big Lake, Brainerd, Cambridge, Elk River, Monticello, St. Joseph
4 Alexandria, Detroit Lakes, Moorhead
6 Albert Lea, Austin, Faribault, La Crescent, Owatonna, Red Wing, Rochester, Stewartville, Waseca
7 Fairmont, Mankato, North Mankato, Worthington
8 Hutchinson, Marshall, Redwood Falls
Metro
Blaine, Bloomington, Brooklyn Center, Brooklyn Park, Burnsville, Champlin, Coon Rapids,
Crystal, Eden Prairie, Farmington, Fridley, Golden Valley, Ham Lake, Hastings, Inver Grove
Heights, Maple Grove, Maplewood, Minnetonka, Mound, New Prague, North Branch, Richfield,
Robbinsdale, Rosemount, Roseville, St. Louis Park, Shakopee, Shoreview, Shorewood, Stillwater,
Woodbury
The table below lists the counties responding by district. The counties that did not respond are listed to provide
perspective on the distribution of county responses across districts.
Responses from County Engineers
District Counties Responding Counties Not Responding
1 Carlton, Cook, Koochiching, Lake, St. Louis Aitkin, Itasca, Pine
2 Beltrami, Clearwater, Hubbard, Pennington,
Polk
Kittson, Lake of the Woods, Marshall, Norman,
Red Lake, Roseau
3 Isanti, Sherburne, Stearns, Todd Benton, Cass, Crow Wing, Kanabec, Mille Lacs,
Morrison, Wadena, Wright
4 Becker, Clay, Mahnomen Big Stone, Douglas, Grant, Otter Tail, Pope,
Stevens, Swift, Traverse, Wilkin

Prepared by CTC & Associates LLC 13
Responses from County Engineers
District Counties Responding Counties Not Responding
6 Fillmore, Houston, Mower, Olmsted,
Wabasha, Winona Dodge, Freeborn, Goodhue, Rice, Steele
7 Blue Earth, Cottonwood, Martin, Nicollet,
Nobles, Rock, Sibley, Watonwan Brown, Faribault, Jackson, Le Sueur, Waseca
8 Kandiyohi, Lincoln, Lyon, McLeod,
Pipestone, Renville
Chippewa, Lac qui Parle, Meeker, Murray,
Redwood, Yellow Medicine
Metro Anoka, Carver, Dakota, Hennepin, Ramsey Chisago, Scott, Washington
Note: While Chisago County is part of the Metro District, the county is considered part of Greater Minnesota
from a traffic counting perspective, with MnDOT completing all traffic counts for CSAH, county roads
and MSAS routes in Chisago County.
Assessment of MnDOT’s Current Traffic Data Collection Program
Respondents were almost evenly split on whether MnDOT’s current traffic data collection program met
their needs.
o Cities were more likely to report that the program met their needs (66 percent) than counties were
(26 percent).
Respondents who listed unmet needs or concerns were most interested in obtaining vehicle classification
data, followed by an interest in speed data and more frequent counts and concerns about slow turnaround
time. Only seven respondents expressed a concern with data accuracy.
Local Agencies’ Traffic Data Collection Programs
Slightly less than half of all respondents have their own traffic data collection programs.
Cities were more likely to have their own traffic data collection programs than counties, with 58 percent
of responding cities maintaining their own programs contrasted with 36 percent of county respondents.
Ten cities and 10 counties outside the Metro District reported maintaining their own traffic data collection
programs.
Four cities and five counties reported an interest in establishing their own traffic data collection programs.
Characteristics of Local Agencies’ Traffic Data Collection Programs
Almost all respondents make local use of the traffic data they collect. Only two cities, both in the Metro
District—Bloomington and Stillwater—reported gathering data solely for MnDOT’s use.
Traffic impact studies, transportation planning and new road design were cited most frequently as uses for
locally gathered data.
Tube counters are by far the most commonly used technology for collecting traffic data, cited by all but
two of the 56 cities and counties responding to this question.
Traffic volume is the most common type of traffic data collected, followed by vehicle speed and vehicle
classification by axle spacing. Only one city and one county reported collecting data on vehicle
classification by vehicle length, and no respondents are collecting data on vehicle weight.

Prepared by CTC & Associates LLC 14
Almost half of respondents indicated that counts are taken as needed in response to specific requests and
special projects.
In both cities and counties, local agency staff are most often responsible for collecting traffic data. In
cities, traffic counts are usually completed by the agency’s engineering staff, while counties reported
using staff from a wider range of areas.
The most frequently cited challenges encountered in gathering traffic data were:
o Lack of staff to set up equipment.
o Limited seasons to conduct counts.
o Lack of staff to process data.
Managing Traffic Data
Only 21 percent of all respondents use data surrogates (such as historical count data, land zoning, future
land use and road network layout) to supplement traffic count data. Counties were more likely to apply
surrogate data (30 percent of county respondents) than cities (14 percent of city respondents).
Seasonal factors are the factors most commonly used in adjusting traffic data to establish annual average
daily traffic, or AADT.
Preferences for Future Traffic Data Collection
The vast majority of survey respondents (87 percent) prefer to have MnDOT continue collecting the
traffic counts used for estimating AADT.
Seven cities and four counties expressed interest in participating in a State Aid–administered consultant
contract to collect traffic data with no required local funding match.
Nine cities and two counties are interested in collecting traffic data themselves and being reimbursed by
MnDOT.
Forty-one percent of all respondents expressed interest in funding enhanced MnDOT data collection.
Counties were more interested in funding enhanced data collection than cities, with 60 percent of
responding counties expressing interest contrasted with 27 percent of city respondents.
Analysis of Initial Survey of Statewide Participants in MnDOT’s Traffic Data Collection Program
Question 1. Does MnDOT’s current traffic data collection program meet all of your agency’s
needs?
Respondents were almost evenly split on whether
MnDOT’s current traffic data collection program met
their needs, as the graph to the right indicates.
However, city respondents were more likely to report
that MnDOT’s current traffic count program met their
needs (66 percent) than county respondents were (26
percent).
The tables below list the cities and counties that reported
that their needs are not being met by MnDOT’s current
traffic data collection program.

Prepared by CTC & Associates LLC 15
Current MnDOT Traffic Data Collection
Program Does Not Meet Needs: Cities
District City
1 Grand Rapids
2 Thief River Falls
3 Brainerd, St. Joseph
4 Alexandria, Detroit Lakes
6 Austin, Red Wing, Rochester,
Stewartville, Waseca
7 Mankato
8 Marshall
Metro
Champlin, Eden Prairie, Farmington,
Fridley, Golden Valley, Maple Grove,
Robbinsdale
Current MnDOT Traffic Data Collection
Program Does Not Meet Needs: Counties
District County
1 Carlton, Cook, Lake, St. Louis
2 Beltrami, Hubbard, Polk
3 Isanti, Sherburne, Stearns, Todd
4 Becker, Mahnomen
6 Houston, Olmsted, Wabasha, Winona
7
Blue Earth, Cottonwood, Martin,
Nicollet, Nobles, Rock, Sibley,
Watonwan
8 Lyon, McLeod, Kandiyohi
Metro Carver, Dakota, Hennepin
Question 2. Please indicate any unmet needs.
Respondents were asked to indicate whether they had any of the following requests or concerns regarding
MnDOT’s traffic count program:
Want vehicle classification data
Want speed data
Increase count frequency
Turnaround time is slow
Want additional data
Data accuracy is poor
The graph below shows the survey results.
Respondents were most interested in
obtaining vehicle classification data,
followed by an interest in speed data and
more frequent counts and concerns about
slow turnaround time. Only seven
respondents expressed a concern with data
accuracy.
Some respondents also described other unmet needs, including:
Directional counts.
Peak hour information.
Counting more city streets in addition to those in the Municipal State Aid Streets system.
Truck counts.

Prepared by CTC & Associates LLC 16
On-demand counts.
Counting all local roads in the same manner as County State Aid Highways.
Counts on gravel and other low-volume roads.
Shorter count cycles.
Permanent automatic traffic recorder stations to provide seasonal adjustment factors.
Question 3. Does your agency currently have its own traffic data collection program (outside of
the data collection that MnDOT performs)?
Slightly less than half of all responding agencies have
their own traffic data collection programs. Cities were
more likely to have their own traffic data collection
programs than counties (58 percent of responding cities
contrasted with 36 percent of county respondents).
As noted earlier, cities and counties in the Metro District
currently gather traffic count data to contribute to
MnDOT’s traffic volume program. This traffic data may
also be used for local purposes (see Question 5b). Listed
below are the city and county respondents from outside
the Metro District that are not required to contribute
traffic data to MnDOT’s traffic volume program but have chosen to gather their own traffic data.
Ten responding cities outside the Metro District maintain their own traffic data collection programs:
District 3: Brainerd, Monticello, St. Joseph
District 4: Moorhead
District 6: Albert Lea, Austin, Red Wing, Rochester, Waseca
District 7: Mankato
Ten responding counties outside the Metro District maintain their own traffic data collection programs:
District 1: Lake
District 3: Sherburne, Stearns
District 4: Becker
District 6: Houston, Olmsted
District 7: Blue Earth
District 8: Kandiyohi, McLeod, Pipestone
Question 4. Does your agency have plans to establish a traffic data collection program or an
interest in doing so?
Four cities and five counties expressed an interest in establishing their own traffic data collection programs.
Cities
Grand Rapids (District 1)
Fairmont (District 7)
Marshall (District 8)
Elk River (Metro District)
Counties
Cook, St. Louis (District 1)
Polk (District 2)
Lincoln, Lyon (District 8)

Prepared by CTC & Associates LLC 17
The next seven survey questions asked respondents to describe their agencies’ traffic data
collection program (data they collect, not MnDOT).
Question 5a. For what purposes are the traffic
data gathered?
Almost all respondents make local use of the traffic data
they collect. Cities were almost evenly split on whether
locally gathered data was provided to MnDOT for its
use. Only two cities, both in the Metro District—
Bloomington and Stillwater—reported gathering data
solely for MnDOT use. (Note that at least a portion of
the traffic data collected by Metro District cities and
counties is provided to MnDOT for its traffic volume
program; see Question 3.)
Question 5b. If the traffic data is being
gathered for local purposes, how is the
data being used?
Traffic impact studies, transportation planning
and new road design were cited most frequently
as uses for locally gathered data. Cities made
greatest use of data for traffic impact studies,
while counties cited new road design most
frequently.
Question 5c. What technologies are used to
collect the traffic data?
Tube counters are by far the most commonly used
technology for collecting traffic data, cited by all
but two of the 56 cities and counties responding to
this question.
Respondents reported limited use of loops at traffic
signals, loop count stations and nonintrusive
sensors. Other technologies used by respondents
included turning movement count boards.

Prepared by CTC & Associates LLC 18
Question 5d. What types of traffic data are
collected?
Traffic volume is the most common type of traffic
data collected, followed by vehicle speed and vehicle
classification based on axle spacing.
The city of Albert Lea and McLeod County reported
collecting data on vehicle classification based on
vehicle length. Hennepin and Winona counties, as
well as the cities of Moorhead, Red Wing and
Shakopee, reported collecting data on turning
movements. No respondents are collecting data on
vehicle weight.
Question 5e. How frequently is the traffic data collected?
Thirty-five of the 57 respondents who answered this
question opted to write in their own response rather
than selecting one of the seven provided answer
choices, which were:
Daily
Weekly
Monthly
Yearly
Every 2 years
Every 4 years
Every 6 years
The graph above shows the respondents who selected one of these seven answer choices. Almost three-quarters of
those who wrote in their own responses indicated that counts are taken as needed, with respondents reporting
specific requests, special projects and input for design as reasons for collecting data.
Question 5f. Who is responsible for collecting traffic data (personnel/agency)?
In both cities and counties, local agency staff are most often responsible for collecting traffic data. In cities, traffic
counts are usually completed by engineering staff. County traffic data collection efforts are less likely to be
directed by engineering staff; respondents indicated that staff from engineering, planning, public works, sign and
traffic departments are responsible for collecting traffic data. Though less typical, seasonal staff also collect traffic
data for both cities and counties.
Five cities and one county reported using consultants to collect traffic data:
Cities
Big Lake (District 3)
Burnsville, North Branch, Rosemount,
Shoreview (Metro District)
Counties
Winona (District 6)
Three cities—Moorhead in District 4 and Eden Prairie and Golden Valley in the Metro District—reported
combining the efforts of local staff and consultants.

Prepared by CTC & Associates LLC 19
Question 5g. What challenges have you encountered in gathering traffic data?
The table below shows how the 54 cities and counties answering this question assessed the challenges in
gathering traffic data.
Challenges in Gathering Traffic Data
Challenge Response
Count
Response
Percent
Lack of staff to set up equipment 24 44.4%
Limited seasons to conduct counts 22 40.7%
Lack of staff to process data 21 38.9%
Cost of data collection equipment (initial and maintenance costs) 17 31.5%
Lack of equipment 15 27.8%
Safety concerns for staff setting up equipment 12 22.2%
Damage/vandalism to equipment 9 16.7%
Poor data quality/accuracy 7 13.0%
Equipment is not easy to use 5 9.3%
Lack of power source and/or communication for equipment 1 1.9%
Safety concerns for the general public 1 1.9%
Question 6. Does your agency use data surrogates such as historical count data, land zoning,
future land use and road network layout to supplement traffic count data?
Only 21 percent of respondents used data surrogates
to supplement traffic count data. Counties were more
likely to apply surrogate data (30 percent of county
respondents) than cities (14 percent of city
respondents).
Respondents who described the type of data
surrogates they use mentioned historical counts most
often, followed by future land use and zoning. New
construction, rate of development, potential truck
loads and facility locations were also mentioned.
Question 7. How do you adjust your traffic data to establish AADT (Annual Average Daily
Traffic)?
When asked about adjusting traffic data to establish an AADT value, those respondents selecting one of the
answer choices cited seasonal factors most frequently. Cities tended to be more evenly split between seasonal and
day of week factors, while counties relied much more heavily on seasonal factors. Month factors were used far
less frequently by both cities and counties.

Prepared by CTC & Associates LLC 20
Other respondents noted that they rely on MnDOT’s
standard adjustments. A few respondents provided
alternate approaches to adjusting traffic data, such as:
Use raw data with no adjustments (McLeod and
Pipestone counties, District 8).
Rather than using seasonal factors, the agency
simply averages over a number of days during
appropriate times of the year for a given location
(New Prague, Metro District).
Combination of day and month factors
(Richfield, Metro District).
One city agency reported that adjustments are not typically made because the streets vary greatly based on
location (close to collector or not). A project is in process to gather data throughout the city to determine if the
agency can identify any trends (Golden Valley, Metro District).
Question 8. Does your agency prefer to have MnDOT continue to collect baseline traffic data for
local agencies with no local funding match?
The vast majority of all survey respondents (87
percent) prefer to have MnDOT continue collecting
the traffic counts used for estimating AADT
(“baseline traffic data”). A breakout by city and
county respondents reflects similar percentages, with
85 percent and 90 percent, respectively, preferring to
maintain current practices in collecting traffic data
with no local funding match. A breakout by Metro
and non-Metro respondents indicates that 74 percent
and 93 percent, respectively, prefer to maintain
current collecting practices.
Response Level Alert: While 94 of the 102 survey respondents answered Question 8, fewer than 30 of
the 102 respondents elected to respond to the related questions 8a and 8b.
Question 8a. Instead of having MnDOT conduct baseline traffic counts, would your agency prefer
a centralized State Aid–administered consultant contract to collect baseline traffic data for local
agencies with no required local funding match?
Only 25 respondents responded to Question 8a. Forty-four percent of these respondents—seven cities and four
counties—expressed interest in participating in a State Aid–administered consultant contract to collect traffic data
with no required local funding match. The interested respondents were:
Cities
Bemidji (District 2)
Fairmont (District 7)
Counties
Koochiching (District 1)
Mahnomen (District 4)

Prepared by CTC & Associates LLC 21
Redwood Falls (District 8)
Brooklyn Center, Fridley, Inver Grove
Heights, St. Louis Park (Metro District)
Nobles, Sibley (District 7)
Question 8b. Instead of having MnDOT conduct baseline traffic counts, would you prefer that
your agency collect baseline traffic data and be reimbursed by MnDOT?
Twenty-nine of the 102 survey respondents chose to respond to Question 8b (19 cities and 10 counties). Of those
respondents, nine cities and two counties (38 percent of the 29 respondents) expressed an interest in collecting
traffic data with a MnDOT reimbursement:
Cities
Grand Rapids (District 1)
North Mankato (District 7)
Brooklyn Center, Champlin, Eden Prairie, Fridley,
Maple Grove, North Branch, Woodbury (Metro
District)
Counties
St. Louis (District 1)
Hennepin (Metro District)
All but three of the cities and counties expressing an interest in collecting their own traffic data are located in the
Metro District and are currently gathering their own traffic counts on County State Aid Highways, county roads
and Municipal State Aid Streets.
Question 9. If your agency collects its own traffic data, what are the next steps for your traffic
data collection program?
Below is a summary of the next steps reported by agencies maintaining their own traffic data collection programs.
Greater Minnesota Cities
Planning to purchase own tube counters (Monticello, District 3).
Planning to conduct counts on State Aid route changes (Waseca, District 6).
Interested in baseline traffic data for all city streets (Marshall, District 8).
Metro District Cities
Collecting data for all Municipal State Aid Street locations throughout the city as well as for the local
traffic calming program and any other local traffic studies (Bloomington).
Continuing to contract out services (Champlin).
Increasing count frequency and gathering other traffic information (Eden Prairie).
Continuing project- and safety-based collections as needed (Fridley).
Establishing residential and commercial count locations for use in determining adjustment factors and
other traffic trends (Golden Valley).
Upgrading/maintaining equipment and returning to a two-year count cycle (Maple Grove).
Increasing traffic data collection with the recent purchase of new tube counters and software;
implementing a traffic management program to address traffic concerns in neighborhoods (Roseville).
Looking for tubeless mobile traffic counting device solutions for easier installation (Shakopee).
Updating MnDOT and local counts every four years (Woodbury).

Prepared by CTC & Associates LLC 22
Greater Minnesota Counties
Upgrading tube counters as needed in the near future (Stearns, District 3).
Updating equipment for twin-tube vehicle classification (Blue Earth, District 7).
Counting low-volume roads in 2012 (Kandiyohi, District 8).
Metro District Counties
Trying out nonintrusive technology such as video cameras to see if it is cost-effective relative to
employing multiple summer temps. These alternate methods would mainly be used for turning
movement counts, but they may also be applicable for average daily traffic count locations where
tube counters cannot be set up as safely (Anoka).
Working to make traffic collections more efficient (i.e., less staff time required to obtain good data);
will eventually look into utilizing loop counts at intersections (Carver).
Just purchased all new traffic counting equipment (not turning movement count boards) (Dakota).
Goal is to migrate from the work being completed using counter boards and tube counters to more
technology-based options: video of intersections, nonintrusive vehicle data collection systems, radar,
loops, etc. (Hennepin).
Question 10. Would your agency be interested in
funding enhanced traffic data collection beyond the
baseline statewide level if MnDOT can
accommodate the collection?
Forty-one percent of all respondents expressed interest in
funding enhanced MnDOT data collection.
Counties were more interested in funding enhanced data
collection than cities, with 60 percent of responding
counties expressing interest contrasted with 27 percent of
city respondents.
Question 11. Please provide contact information for the staff member in your agency responsible
for overseeing traffic data collection.
See Appendix A for details.
Question 12. Please provide details on any of your answers or provide additional comments.
Respondents offered the following additional comments:
District 1
County is interested in traffic classification data on select routes (Lake County).
District 3
It would be helpful if local agencies could rent traffic counting equipment from MnDOT as needed
(Monticello).
Prepared by CTC & Associates LLC 23
District 4
County would like more detailed actual counts on the entire system instead of calculated counts for
many gravel roads (Mahnomen County).
District 6
MnDOT provides this counting better and more economically than any consultant ever could. If we
start to rely on the cities, you will miss data for some cities. Recent staff reductions and budget cuts
show this to be true. This is a good example of a government function that the state can provide better
and cheaper than any other unit of government or private industry (Waseca).
District 7
The county is interested in vehicle class counts, even if required to fund the extra data locally (Martin
County).
The county does not prefer to have traffic data gathered by a consultant. Respondent notes that
regardless of the entity collecting the data, it must be accurate and include vehicle classification, and
must factor in realistic numbers for loaded trucks during seasonal hauling operations. Hopefully,
weigh-in-motion studies will determine how many overweight vehicles are using the roads so that this
can be factored into pavement design. Vehicle counts and weights are needed for better design and
pavement longevity (Nobles County).
District 8
The county’s own traffic data collection is limited to only a few locations; the county does not collect
its own data on a systematic schedule (Pipestone County).
Traffic count information formats should be available in ArcGIS, interactive and PDF formats for
digital download (Redwood Falls).
Metro District
The city uses MnDOT data for the county roads in and around the city and would rather not have
responsibility for counting those routes due to the volume and speeds on those roads (Crystal).
4b. Supplemental Surveys of Statewide Participants in MnDOT’s Traffic Data Collection
Program As Section 1 of this report describes, the current local road traffic counting practices in Minnesota differ between
Greater Minnesota and the Metro area, with MnDOT completing counts for Greater Minnesota cities and counties
and city and county engineers in the seven-county Metro area overseeing the counting of their own local roads. In
reviewing responses to the initial survey, it appeared that some of the questions might not have adequately
addressed the differences in counting practices throughout the state.
Supplemental surveys were distributed to city and county engineers throughout Minnesota to clarify some of the
initial survey responses. Respondents in Greater Minnesota and the Metro area completed separate supplemental
surveys.

Prepared by CTC & Associates LLC 24
Greater Minnesota Supplemental Survey We received 58 responses (25 cities; 33 counties) to the six-question supplemental survey of Greater Minnesota
engineers. The survey consisted of the following questions:
1. Please indicate if your agency has additional traffic data needs on local roads that are not being met by
MnDOT’s current count program.
1a. Please describe what the additional data is needed for.
2. Does your agency have any of these concerns regarding the current traffic data collection efforts by
MnDOT in Greater Minnesota?
Counts are taken too frequently
Counts are not frequent enough
There are not enough count locations
There are too many count locations
3. Please indicate your agency’s interest in collecting traffic counts and sharing this information with
MnDOT.
4. Does your agency have any interest in collecting vehicle classification data and sharing this information
with MnDOT for data management, analysis and reporting?
5. Would your agency be open to using AADT data on local roadways developed from alternate
methodologies? For example, currently when MnDOT visits a county or city to do local road counts only
volume data is collected at all locations. In this alternative approach, MnDOT would collect vehicle class
data at ¼ (or more) of the local road locations and extrapolate this information to the surrounding count
locations based on historical relationships or patterns.
6. Please provide details of any other concerns or questions you have regarding any of the original or current
survey questions.
See Appendix B for the full text of all survey responses.
Summary of Greater Minnesota Supplemental Survey
Below is a brief summary of key findings from the survey, followed by an analysis of survey responses.
The table below lists the 25 cities in Greater Minnesota responding to the supplemental survey by district.
Responses from City Engineers in Greater Minnesota
District City
1 Chisholm, Duluth, Grand Rapids, Virginia
2 Bemidji, Crookston, Thief River Falls
3 Big Lake, Buffalo, Delano, Elk River, Isanti, Otsego, Sartell, St. Francis, St. Michael
4 Alexandria, Detroit Lakes, Fergus Falls, Moorhead
6 Waseca

Prepared by CTC & Associates LLC 25
Responses from City Engineers in Greater Minnesota
District City
7 Fairmont
8 Hutchinson, Litchfield, Marshall
The table below lists the 33 counties in Greater Minnesota responding by district. The counties that did not
respond are listed to provide perspective on the distribution of county responses across districts.
Responses from County Engineers in Greater Minnesota
District Counties Responding Counties Not Responding
1 Carlton, Cook, Itasca, Koochiching, Pine, St.
Louis Aitkin, Lake
2 Beltrami, Marshall, Norman, Pennington,
Polk
Clearwater, Hubbard, Kittson, Lake of the Woods,
Red Lake, Roseau
3 Cass, Crow Wing, Kanabec, Sherburne,
Wright
Benton, Isanti, Mille Lacs, Morrison, Stearns,
Todd, Wadena
4 None
Becker, Big Stone, Clay, Douglas, Grant,
Mahnomen, Otter Tail, Pope, Stevens, Swift,
Traverse, Wilkin
6 None Dodge, Fillmore, Freeborn, Goodhue, Houston,
Mower, Olmsted, Rice, Steele, Wabasha, Winona
7 Brown, Cottonwood, Jackson, Le Sueur,
Nobles, Rock, Sibley, Waseca, Watonwan Blue Earth, Faribault, Martin, Nicollet
8 Chippewa, Lac qui Parle, Lyon, McLeod,
Meeker, Murray, Pipestone, Redwood Kandiyohi, Lincoln, Renville, Yellow Medicine
Need for Additional Traffic Data and Its Uses
Only eight cities (one-third of all Greater Minnesota city respondents) indicated an interest in additional
traffic data, contrasted with the 76 percent of Greater Minnesota county respondents who identified unmet
needs.
Counties were most interested in more vehicle class or heavy commercial annual average daily traffic
data, while cities most often cited an interest in speed data.
When asked how the additional data would be used, pavement design and management was cited most
frequently by county respondents.
o Three of the five cities responding to the question about the use of additional data noted that the
data would be used to address safety concerns.

Prepared by CTC & Associates LLC 26
Agencies’ Perspectives on Current Traffic Collection Efforts
Taken together, the responding cities and counties in Greater Minnesota are almost equally concerned that
there are not enough count locations and that counts are not taken frequently enough.
o Counties are more concerned with count frequency than cities.
o No respondents indicated that counts were taken too frequently or that there were too many count
locations.
Respondents expressed other concerns about the current traffic collection efforts, including accuracy-
related concerns, an interest in vehicle classification splits, and a request for fewer count locations with
expanded information.
Interest in Modifications to Current Traffic Counting Practices
Almost half of respondents (11 cities and 14 counties) expressed interest in collecting counts on some
local roads in their jurisdiction without reimbursement.
o More than a third of respondents indicated no interest in collecting traffic counts.
Forty-five percent of all respondents are interested in collecting vehicle classification data and sharing it
with MnDOT.
o County respondents expressed slightly greater interest in collecting and sharing this data (48
percent) than city respondents (40 percent).
More than three-quarters of respondents are willing to consider MnDOT’s use of an alternative approach
to developing AADT data that extrapolates a limited amount of vehicle classification data to surrounding
count locations.
Analysis of Greater Minnesota Supplemental Survey
Question 1. Please indicate if your agency has
additional traffic data needs on local roads that
are not being met by MnDOT’s current count
program.
Only eight cities (one-third of all Greater Minnesota city
respondents) indicated an interest in obtaining additional
traffic data, contrasted with the 76 percent of Greater
Minnesota county respondents who identified unmet
needs. Counties were most interested in more vehicle
class or heavy commercial annual average daily traffic
data, while cities most often cited an interest in speed
data.
Respondents noted these additional data needs or concerns:
More counts are needed on:
o Local streets (Alexandria).
o Heavily used routes on unorganized township roads (Koochiching County).
Seasonal adjustment factors are needed (Sibley and St. Louis counties).
The timing of counts may not reflect the true use of the roadway (Marshall County).
When local roads were switched to a 12-year count cycle, having some roads with counts that are eight
years newer than others is problematic (Crow Wing County).

Prepared by CTC & Associates LLC 27
Question 1a. Please describe what the additional data is needed for.
Pavement design and management was cited most frequently by county respondents when asked how the
additional data would be used. Three of the five cities responding to this question indicated that the data would be
used to address safety concerns. Respondents noted other potential uses of the additional traffic data, including:
Develop better estimates of equivalent single axle loads.
Compare levels of service.
Determine heavy commercial traffic generators with farm-to-market activity.
Education.
Identify trends.
Justify road improvements.
Question 2. Does your agency have any of these
concerns regarding the current traffic data
collection efforts by MnDOT in Greater
Minnesota?
Respondents were asked to indicate whether they had
any of the following concerns regarding MnDOT’s
current traffic data collection efforts in Greater
Minnesota:
Counts are taken too frequently
Counts are not frequent enough
There are not enough count locations
There are too many count locations
The graph above shows the survey results.
While counties were more concerned with count frequency, taken together the cities and counties in Greater
Minnesota are almost equally concerned that there are not enough count locations and that counts are not taken
frequently enough. No respondents indicated that counts were taken too frequently or that there are too many
count locations.
Respondents offered other comments related to MnDOT’s current traffic data collection efforts in Greater
Minnesota:
The city is primarily interested in traffic counts on the city’s collector-arterial street system with little
need for counts on most local streets (Chisholm, District 1).
Accuracy-related concerns:
o General concerns about accuracy (Grand Rapids, District 1).
o At 48 hours, the duration of each count location is very short. There are confidence issues when
counting a road one time every four years for only 48 hours (St. Louis County, District 1).
o Better count consistency is needed on road segments near borders (Kanabec County, District 3).
o Counts are too short to capture the year-round traffic pattern (Sibley County, District 7).
The county would like to see the counts have vehicle classification splits, not just AADT (Jackson
County, District 7).

Prepared by CTC & Associates LLC 28
Consider fewer count locations with better information (vehicle classification and weight information) as
a compromise to obtain the additional information (Nobles County, District 7).
Prefer to have counts taken on low-volume roads every other cycle instead of every 12 years (Chippewa,
Lac qui Parle counties, District 8).
Question 3. Please indicate your agency’s interest in collecting traffic counts and sharing this
information with MnDOT.
MnDOT assumes all costs for current traffic counting activities, regardless of the agency responsible for
conducting the counts. Almost half of respondents expressed interest in collecting counts on some local roads in
their jurisdiction without reimbursement. More than a third of respondents indicated no interest in collecting
traffic counts. The table below summarizes survey responses.
Greater Minnesota Engineers’ Interest in Collecting Traffic Counts
Type of Interest Response
Percent
Response
Count
# of Cities/
Counties
Collect counts on some local roads in my
jurisdiction without reimbursement 43.1% 25
11 cities; 14
counties
No interest in collecting traffic counts 39.7% 23 11 cities; 12
counties
Collect counts on all trunk and local roads in my
jurisdiction and surrounding areas with a
MnDOT reimbursement
8.6% 5 3 cities; 2
counties
Collect counts on all local roads in my
jurisdiction without reimbursement 5.2% 3 3 counties
Collect counts on all trunk and local roads in my
jurisdiction without a MnDOT reimbursement 3.4% 2 2 counties
Below is a breakout of survey responses by type of interest.
Collect counts on some local roads in my jurisdiction without reimbursement
Cities
District 1: Chisholm, Duluth, Grand Rapids,
District 3: Big Lake, Buffalo, Delano, Isanti, St.
Francis, St. Michael
District 4: Detroit Lakes
District 8: Litchfield
Counties
District 1: Carlton, Itasca, St. Louis
District 2: Marshall, Norman, Pennington
District 3: Sherburne, Wright
District 7: Jackson, Le Sueur, Nobles, Waseca
District 8: McLeod, Meeker
Prepared by CTC & Associates LLC 29
No interest in collecting traffic counts
Cities
District 1: Virginia
District 2: Bemidji, Crookston, Thief River Falls
District 3: Elk River, Sartell
District 4: Alexandria, Fergus Falls, Moorhead
District 6: Waseca
District 8: Hutchinson
Counties
District 1: Koochiching, Pine
District 2: Beltrami
District 3: Cass, Kanabec
District 7: Brown, Cottonwood, Sibley, Watonwan
District 8: Murray, Pipestone, Redwood
Collect counts on all trunk and local roads in my jurisdiction and surrounding areas with a MnDOT
reimbursement
Cities: Otsego (District 3), Fairmont (District 7), Marshall (District 8)
Counties: Cook (District 1), Rock (District 7)
Collect counts on all local roads in my jurisdiction without reimbursement
Counties: Polk (District 2), Crow Wing (District 3), Lyon (District 8)
Collect counts on all trunk and local roads in my jurisdiction without a MnDOT reimbursement
Counties: Chippewa, Lac qui Parle (District 8)
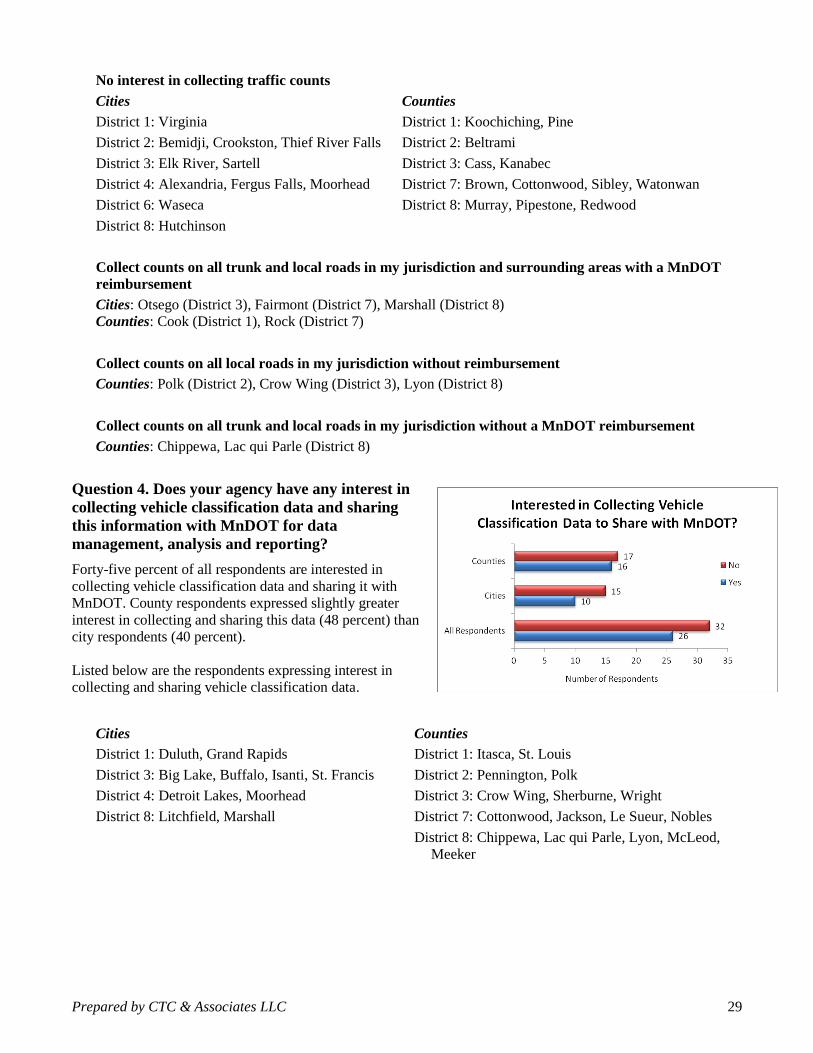
Question 4. Does your agency have any interest in
collecting vehicle classification data and sharing
this information with MnDOT for data
management, analysis and reporting?
Forty-five percent of all respondents are interested in
collecting vehicle classification data and sharing it with
MnDOT. County respondents expressed slightly greater
interest in collecting and sharing this data (48 percent) than
city respondents (40 percent).
Listed below are the respondents expressing interest in
collecting and sharing vehicle classification data.
Cities
District 1: Duluth, Grand Rapids
District 3: Big Lake, Buffalo, Isanti, St. Francis
District 4: Detroit Lakes, Moorhead
District 8: Litchfield, Marshall
Counties
District 1: Itasca, St. Louis
District 2: Pennington, Polk
District 3: Crow Wing, Sherburne, Wright
District 7: Cottonwood, Jackson, Le Sueur, Nobles
District 8: Chippewa, Lac qui Parle, Lyon, McLeod,
Meeker

Prepared by CTC & Associates LLC 30
Question 5. Would your agency be open to using AADT data on local roadways developed from
alternate methodologies? For example, currently when MnDOT visits a county or city to do local
road counts only volume data is collected at all locations. In this alternative approach, MnDOT
would collect vehicle class data at ¼ (or more) of the
local road locations and extrapolate this information
to the surrounding count locations based on
historical relationships or patterns.
More than three-quarters of respondents are willing to
consider MnDOT’s use of alternate methodologies in
developing AADT data for local roadways.
Listed below are the respondents expressing concern about
the use of an alternative approach to calculating AADT that
extrapolates a limited amount of vehicle classification data
to surrounding count locations.
Cities
District 1: Virginia
District 3: Elk River, Sartell, St. Michael
District 6: Waseca
District 7: Fairmont
Counties
District 1: Pine
District 3: Crow Wing, Wright
District 7: Cottonwood, Jackson, Sibley
District 8: McLeod
Question 6. Please provide details of any other concerns or questions you have regarding any of
the original or current survey questions.
Respondents offered the following additional comments:
District 1
Traffic volume or classification data on local residential streets is typically not needed where volumes
are usually less than 1,000 vehicles per day. That data may be needed in commercial/industrial areas
due to truck volumes (Chisholm).
Respondent questions why MnDOT would consider allowing counties to count the trunk highway
system (St. Louis County).
District 3
Respondent questions whether extrapolating to other locations when developing AADT data would
be accurate enough when considering development and industry (Crow Wing County).
District 7
Traffic counts should be conducted in a manner that utilizes current technology (Jackson County).
Vehicle classification is very important. Knowing the number of loaded and overweight loaded trucks
and implements of husbandry using the roadway would be very helpful (Nobles County).

Prepared by CTC & Associates LLC 31
District 8
If an alternative methodology is used to develop AADT data, the counties should have input into the
locations of the counts to make sure any changes in traffic patterns are reflected in the new counts
(Pipestone County).
The county would like to see a traffic count on all roads every four years, even the ones with low
volume (Meeker County).
Metro Area Supplemental Survey
We received 26 responses (20 cities; six counties) to the three-question supplemental survey of Metro area
engineers. The survey consisted of the following questions:
1. Please indicate if your agency has additional traffic data needs on local roads that are not being met by
your current count program.
1a. Please describe what the additional data is needed for.
2. Does your agency have any of these concerns regarding local road traffic data collection requirements in
the Metro area?
Counts are required too frequently
Counts are not required frequently enough
There are not enough count locations
There are too many count locations
3. Please describe any additional data needs or concerns about the current state of traffic data collection in
the Metro area.
See Appendix C for the full text of all survey responses.
Summary of Metro Area Supplemental Survey
Below is a brief summary of key findings from the survey, followed by an analysis of survey responses.
We received responses from the following Metro cities:
Blaine, Bloomington, Brooklyn Center, Brooklyn Park, Burnsville, Coon Rapids, Golden Valley, Ham Lake,
Hastings, Inver Grove Heights, Maple Grove, Maplewood, Minnetonka, Mound, Robbinsdale, Roseville, St.
Louis Park, Shorewood, Stillwater, Woodbury
Six of the seven counties in the Metro area collecting their own traffic count data responded to the supplemental
survey—Anoka, Carver, Dakota, Hennepin, Scott and Washington. Ramsey County is the only Metro-area county
not responding to the supplemental survey.
Need for Additional Traffic Data and Its Uses
Less than one-third of respondents responded to this question about additional traffic data needs. Speed
data was cited most frequently, followed by continuous counters.
Respondents described a variety of ways to use the additional data.

Prepared by CTC & Associates LLC 32
o Five respondents noted that additional speed data would help in dealing with residents’ concerns
about speeding and traffic safety.
o In Robbinsdale, more heavy commercial AADT data would aid in designing road pavement
sections, and Hennepin County would use additional data to confirm larger vehicle class
percentages where biking is becoming popular.
o Continuous counters would allow Maple Grove to identify variations in traffic volumes on odd
days, weekends and holidays.
Agencies’ Perspectives on Current Traffic Collection Efforts
Only three respondents—Dakota County and the cities of Burnsville and Ham Lake—indicated a concern
with the location or frequency of count locations.
Four cities—Brooklyn Park, Coon Rapids, Inver Grove Heights and Shorewood—specifically noted that
the current location and frequency of counts was acceptable.
Analysis of Metro Area Supplemental Survey
Question 1. Please indicate if your agency has additional traffic data needs on local roads that are
not being met by your current count program.
Less than one-third of respondents (five cities and three
counties) responded to this question about additional
traffic data needs. Speed data was cited most frequently,
followed by continuous counters.
Question 1a. Please describe what the additional
data is needed for.
Respondents cited the following uses for the additional
data requested:
More speed data
Additional data would help in dealing with
residents’ concerns about speeding and traffic safety (cities of Robbinsdale, St. Louis Park,
Shorewood; Burnsville and Dakota counties).
Continuous counters
Vehicle classification with portable counters is time-consuming due to inaccuracy and difficult setup.
While not a pressing need, additional continuous counters would be desirable (Anoka County).
Continuous counters would allow the city to identify variations in traffic volumes on odd days,
weekends and holidays (Maple Grove).
More vehicle class or heavy commercial AADT (HCAADT) data
More HCAADT data is needed to better design road pavement sections (Robbinsdale).
Additional data would be used to confirm larger vehicle class percentages where biking is becoming
popular; additional data is also needed for pavement design and incorporation of Complete Streets
(Hennepin County).

Prepared by CTC & Associates LLC 33
Question 2. Does your agency have any of these concerns regarding local road traffic data
collection requirements in the Metro area?
Respondents were asked to indicate whether they had any of the following concerns regarding MnDOT’s current
traffic data collection requirements in the Metro area:
Counts are required too frequently
Counts are not required frequently enough
There are not enough count locations
There are too many count locations
Only three respondents indicated one of these concerns:
Counts are required too frequently (Dakota County)
There are not enough count locations (Burnsville)
There are too many count locations (Ham Lake)
Four cities—Brooklyn Park, Coon Rapids, Inver Grove Heights and Shorewood—specifically noted that the
current location and frequency of counts was acceptable. Maple Grove commented that the variation in required
frequency could become an issue with the new State Aid Needs System, noting that many of the cities on the four-
year cycle may want to go back to a two-year cycle.
Question 3. Please describe any additional data needs or concerns about the current state of traffic
data collection in the Metro area.
Respondents offered the following additional comments:
City is concerned about mandating the counts but not providing any funding (Woodbury).
The city would like to know more about the data source used to establish adjustment factors (day, month,
etc.) for residential streets (Golden Valley).
With the data being fairly steady and the amount of time involved in counting the entire county system,
the frequency of the every-other-year program may not be needed when considering the volume of data
changes (Dakota County).
County recommends taking care to avoid work on adjacent state highways and addressing the impact of
diversion (Hennepin County).
5. Survey of State DOTs’ Local Road Traffic Data Collection Practices
Knowing more about how other states gather and manage traffic data on local roads can inform MnDOT’s
evaluation of its own traffic data collection practices. The results of a 2007 survey conducted by Colorado DOT
(see http://cospl.coalliance.org/fedora/repository/co:5116/tra22m742007internet.pdf) offer insight into general
program management, operations and staffing, examining short-term and permanent/continuous count programs,
year-end processing of traffic data, traffic data collection equipment, and current and future software systems and
tools to manage traffic data.
To gather current and more detailed information from state departments of transportation about their traffic
monitoring practices on local roadways, MnDOT distributed an online survey to state DOTs that examined how

Prepared by CTC & Associates LLC 34
the agencies meet the federally mandated Highway Performance Monitoring System reporting requirements for
local roads and how other local road data is collected. The survey consisted of the following questions:
State DOT Collection, Analysis and Reporting Program
1. How many total centerline miles of local (non-state owned/maintained) roadways are in your state?
2. How many short-term traffic count sites on local roadways does your DOT collect, analyze and report data
on?
3. How often are these short-term (DOT-managed) sites on local roadways counted?
4. How many permanent/continuous traffic monitoring sites does your DOT manage on local roadways?
5. Does your DOT collect, analyze and report traffic data on local roadways that are not required for federally
mandated reporting?
6. Please indicate which factors your DOT uses to estimate annual average daily traffic (AADT) for local roads.
7. Do local road traffic data collection practices differ:
7a. In rural and urban areas?
7b. In areas with low population density versus areas with higher densities?
Partner Agency Collection, Analysis and Reporting Programs
8. Please indicate the other agencies within your state responsible for collecting, analyzing or reporting federally
mandated traffic data on local roads.
8a. Please describe each agency’s role in collecting, analyzing or reporting data.
9. Are other agencies within your state subject to a mandate that requires the collection of federally required
traffic data on local roads? If yes, please describe how this mandated collection of local road traffic data is
funded or the type of cooperative agreement in place to facilitate this process.
10. Do local agencies in your state collect, analyze or report data on local roadways that are not required for
federally mandated reporting? If yes, please describe how this data is used and who it is shared with.
11. Does your agency accept data from other sources or data systems?
12. If you do accept data from other sources or data systems, do you have formal data sharing
procedures/agreements/contracts in place?
13. If local road data is submitted to the DOT for analysis and/or reporting, do you have quality control
procedures in place to validate the incoming data?
Local Road Data Use, Challenges and Goals
14. How is local road data used in your state by the DOT or other agencies?
15. What challenges have been encountered in collecting traffic data on local roads?
16. Are data surrogates such as historical count data, land zoning, future land use and road network layout used
by the DOT or other agencies to supplement local traffic count data?
17. Are there any planned changes in the near future for local road traffic data collection efforts in your state?
18. If your agency is willing to be available for some follow-up questions, please provide contact information for
the staff member in your agency responsible for overseeing traffic data collection (if different than you).
19. Please provide any additional details on any of your answers, or provide additional comments regarding how
local road traffic count requirements and responsibilities are managed in your state.

Prepared by CTC & Associates LLC 35
We received survey responses from 22 state transportation agencies:
Alabama
Arizona
Arkansas
California
Colorado
Connecticut
Florida
Georgia
Hawaii
Idaho
Illinois
Iowa
Kentucky
Louisiana
Nebraska
Nevada
New York
Oregon
Pennsylvania
Rhode Island
South Carolina
Virginia
See Survey Results beginning on page 52 for the full text of all survey responses.
Summary of Survey of State DOTs’ Local Road Traffic Data Collection Practices
Below is a brief summary of key findings from the survey, followed by an analysis of survey responses.
The survey gathered information in three topic areas related to traffic monitoring practices on local roadways: State DOT collection, analysis and reporting program
Partner agency collection, analysis and reporting programs
Local road data use, challenges and goals
State DOT Collection, Analysis and Reporting Program
The size of a state’s local road network varies widely among survey respondents, from 600 miles in
Hawaii to an estimated 167,000 miles in Colorado. Forty-one percent of respondents reported local road
networks that ranged between 50,001 and 100,000 miles.
Types of Traffic Count Sites on Local Roadways
Respondents were asked to describe their portable short-term traffic count sites in the following
categories:
o Volume
o Vehicle classification
o Weigh-in-motion
o Control
Portable volume and vehicle classification sites were the most commonly reported type of short-term
traffic count site, with only Arizona DOT reporting no use of either portable volume or vehicle
classification sites to count traffic on local roads.
Portable weigh-in-motion and control sites on local roadways were reported less frequently by
respondents.
o Georgia and Nebraska maintain the only portable WIM sites reported by respondents.
o Only three states—Colorado, Georgia and Hawaii—employ portable control sites.
o Iowa DOT uses data generated at its permanent traffic count sites as a control.
Ten of the 22 respondents maintain at least one type of permanent or continuous traffic monitoring site on
local roadways. Volume and classification sites are the most common, followed by volume-only sites.

Prepared by CTC & Associates LLC 36
Managing Local Road Traffic Data
Almost half of respondents reported collecting, analyzing and reporting traffic data on local roadways that
are not required for federally mandated reporting.
Axle correction factors were cited most frequently by respondents when asked about factors used to
estimate AADT on local roads, followed closely by month and seasonal factors. Day-of-week factors
were cited by only slightly fewer respondents.
o All but two respondents make use of multiple factors in preparing their estimates—Alabama (axle
correction factors) and Kentucky (seasonal factors).
Almost one-third of respondents employ different traffic data collection practices in rural and urban areas.
Only four respondents apply different counting practices based on population density.
Partner Agency Collection, Analysis and Reporting Programs
Contractors or consultants were most frequently cited as the agency other than the state DOT responsible
for collecting federally mandated traffic data on local roads. Most state DOTs accepting data from other
sources retain responsibility for data analysis.
None of the respondents reported a mandate that requires other agencies to collect federally required
traffic data on local roads.
Two-thirds of respondents indicated that local agencies in their states collected, analyzed or reported data
on local roadways that are not required for federally mandated reporting.
o South Carolina DOT discussed development and testing of a new Web program—Local Agency
Data Collection—that will be used by counties and cities to provide SCDOT with local road
information. Data will go through quality assurance/quality control checks before entry into
various SCDOT databases.
Half of respondents accept data from other sources or data systems.
o Only one respondent accepting data from other sources or data systems described formal data
sharing procedures or contracts, with South Carolina DOT citing its new Web-based Local
Agency Data Collection system as a formal mechanism for counties and cities to share local road
traffic data with the DOT.
Almost two-thirds of respondents reported some type of quality control procedure to validate incoming
local road data submitted by other agencies.
o Validation practices include comparing new data with historical data, employing the same quality
control checks used to validate other traffic counts, and relying on software programs to flag
questionable data.
Local Road Data Use, Challenges and Goals
Respondents reported a wide range of uses for the local road data collected in their states, with use for
transportation planning cited by almost three-quarters of respondents.
o Traffic safety, traffic impact studies and pavement management were cited slightly less
frequently by respondents.
When asked about the challenges that could be encountered in collecting traffic data on local roads, two-
thirds of respondents cited lack of staff to process data.
o Almost half of respondents expressed concern about the cost associated with the purchase and
maintenance of data collection equipment.
o Two response options—equipment is not easy to use and lack of standardized field work
procedures—were not selected by any respondents.
Only two states—Idaho and Iowa—reported the use of data surrogates to supplement local traffic count
data. Both use historical count data to fill in gaps.

Prepared by CTC & Associates LLC 37
Forty-one percent of respondents indicated that changes are on the horizon for their local road data
collection programs. Changes are planned or in process in the following categories:
o Counting practices (Alabama, Iowa, Pennsylvania)
o Data repository (Arizona, Rhode Island, South Carolina)
o Responsibility for data collection (Arizona, New York, South Carolina)
o Sharing data (Georgia, Oregon)
Analysis of Survey of State DOTs’ Local Road Traffic Data Collection Practices
State DOT Collection, Analysis and Reporting Program
Question 1. How many total centerline miles of local (non-state owned/maintained) roadways are
in your state?
The size of the network of local roads not owned or maintained by the state varied widely among respondents.
The table below summarizes the local road networks reported by respondents.
Total Miles of Local (Non-State Owned/Maintained) Roadways
Mile Range State Number of Miles*
10,000 and under
Hawaii 600
Rhode Island 5,234
Virginia 10,000
10,001 to 50,000
Connecticut 17,308
Nevada 22,000
South Carolina 24,549
Idaho 43,570
Louisiana 50,000
50,001 to 100,000
Kentucky 55,750
Arizona 58,340
Alabama 69,145
Pennsylvania 77,699
Nebraska 83,655
Arkansas 83,668
Oregon 85,000
New York 99,495
Georgia 100,000

Prepared by CTC & Associates LLC 38
Total Miles of Local (Non-State Owned/Maintained) Roadways
Mile Range State Number of Miles*
100,001 to 150,000
Iowa 104,746
Florida 107,413
Illinois 124,000
150,001 or more California 156,980
Colorado 167,000 * Mileage may be estimated.
Question 2. How many short-term traffic count sites on local roadways does your DOT collect,
analyze and report data on?
Question 3. How often are these short-term (DOT-managed) sites on local roadways counted?
Respondents were asked to describe their short-term traffic count sites in the following categories:
Portable volume sites
Portable vehicle classification sites
Portable weigh-in-motion sites
Control sites
Only Arizona DOT reports no use of portable volume or vehicle classification sites to count traffic on local roads.
Below is a summary of the number of portable volume and vehicle classification sites and the frequency of counts
reported by respondents.
Portable Volume and Vehicle Classification Traffic Count Sites by State
Portable Volume Sites Portable Vehicle Classification Sites
State Number* Count Frequency Number* Count Frequency
Alabama 50 As needed; project-
specific counts 50
As needed; project-
specific counts
Arkansas 2,950 Annually 1,170 Annually
California 2,000 to 5,000
Every year on a
rotating basis across
the state
1,000 to 4,000
Every year on a
rotating basis across
the state
Colorado 400 Once annually on a
6-year cycle 400
Once annually on a
6-year cycle
Connecticut 55 to 57 Every 3 years (loop
48-hr) None N/A

Prepared by CTC & Associates LLC 39
Portable Volume and Vehicle Classification Traffic Count Sites by State
Portable Volume Sites Portable Vehicle Classification Sites
State Number* Count Frequency Number* Count Frequency
Florida 4,500 6-year cycle 500 3-year cycle
Georgia 22,000 Most on a 3- to 4-
year cycle 6,000 3- to 4- year cycle
Hawaii 800 At least once every
other year 350
At least once every
other year
Idaho 1,300 to 1,400
No regular schedule
other than 3-year
rotation for HPMS
20 to 40
No regular schedule
other than 3-year
rotation for HPMS
Illinois 15,000 Annually, on a 5-year
cycle 400
Annually, on a 3-year
cycle
Iowa 2,600
Functional class
higher than local are
4 or 8 years; local
roads can be 20 years
or more
6,000
Functional class
higher than local are
4 or 8 years; local
roads can be 20 years
or more
Kentucky 1,835 Every 10 years None N/A
Louisiana 50,000 10 years (aperiodic) None N/A
Nebraska 7,000 Approximately every
2 years None N/A
Nevada 2,800 Annually 100 Annually
New York 34,200 Not known 1,048 Not known
Oregon 1,500 Every 3 years 300 Every 3 years
Pennsylvania 4,051** Every 3 or 5 years
depending on HPMS 4,051**
Every 3 or 5 years
depending on HPMS
Rhode Island 250 Every 3 years 250 Every 3 years
South
Carolina 681 Annually 136
On the HPMS 4-year
cycle

Prepared by CTC & Associates LLC 40
Portable Volume and Vehicle Classification Traffic Count Sites by State
Portable Volume Sites Portable Vehicle Classification Sites
State Number* Count Frequency Number* Count Frequency
Virginia 80,000
Every 3 years (city
local and unpaved
roads with a last
count of 45 to 50)
Every 6 years
(county local with
room for
development)
Every 12 years
(subdivision streets
with no development
space)
None routinely
collected; only
special study needs
N/A
* Numbers may be approximate.
** Depending on the year, counts can be taken as portable volume or portable vehicle classification counts.
Respondents reported less frequent use of portable weigh-in-motion and control sites. The table below
summarizes the number of sites and count frequency provided in survey responses.
Portable Weigh-in-Motion and Control Traffic Count Sites by State
WIM Sites
State Number of Sites Count Frequency
Georgia 90 3-year cycle (collect 30 sites per year)
Nebraska 90 One-third every year
Control Sites
State Number of Sites Count Frequency
Georgia 12 Every year
Hawaii 36 4 times a year
Iowa 176 Use permanent sites as control
Colorado 14 4 times a year

Prepared by CTC & Associates LLC 41
Question 4. How many permanent/continuous traffic monitoring sites does your DOT manage on
local roadways?
Ten of the 22 respondents maintain at least one type of permanent or continuous traffic monitoring site on local
roadways. The table below summarizes the type and number of sites provided in survey responses.
Permanent or Continuous Traffic Monitoring Sites on Local Roadways by State
State Volume Only Volume and
Classification WIM
Nonintrusive
Technologies
Traffic
Signal Loops
Connecticut 1 0 0 0 0
Florida 0 1 0 0 0
Georgia 20 220 2 0 0
Idaho 29 6 0 1 (not
described) 2
Illinois 6 4 0 0 0
Iowa 21 19 0 0 0*
Nebraska 6 4 0 0 0
Nevada 7 0 0 0 0
New York 3 1 1 2 (acoustic
sensors) 0
Virginia 0 1 0 0 0
TOTAL SITES 93 256 3 3 2
* Iowa DOT has no traffic signal loops but does have 21 volume sites with a single loop, nine with two loops, and
10 with loops and piezoelectric sensors.
Question 5. Does your DOT collect, analyze and report traffic data on local roadways that are not
required for federally mandated reporting?
Almost half of respondents reported collecting, analyzing and reporting traffic data on local roadways that are not
required for federally mandated reporting. Some respondents described when this data is collected and how it may
be shared.
In Alabama, counties collect project-specific traffic data for their roadway projects using Alabama DOT
guidelines; the DOT does other counts as needed. Oregon DOT also collects data for some project-related
sites.
While Iowa DOT uses its local road traffic data for VMT calculations and shares it with users on the
agency’s website, Georgia DOT notes the counts taken for special requests are not used for VMT
calculations.
Illinois DOT displays local system traffic count data in an interactive GIS Internet application and in GIS
shapefiles available to the public.

Prepared by CTC & Associates LLC 42
Colorado DOT gathers data in response to special requests from local agencies and Colorado DOT
regions.
Several MPOs in Florida have annual traffic counting programs and share the data collected with Florida
DOT. This data is processed along with FDOT-collected data to develop AADT estimates.
PennDOT collects volume data on 7,200 locations throughout the state. Data collection began in 2009 to
create a baseline and continues on a cyclical basis.
Question 6. Please indicate which factors your DOT uses to estimate annual average daily traffic
(AADT) for local roads.
The table below identifies the factors most often used by respondents to estimate annual average daily traffic for
local roads.
Factors Used to Estimate AADT on Local Roads
Factor Response
Percent
Response
Count
Axle correction factors 70.0% 14
Month factors 65.0% 13
Seasonal factors 65.0% 13
Day-of-week factors 60.0% 12
All but two respondents make use of multiple factors in preparing their estimates—Alabama (axle correction
factors) and Kentucky (seasonal factors). Respondents’ comments related to the use of factors include:
Georgia DOT has a local road sampling plan.
Kentucky Transportation Cabinet collects data from a random sampling of sites throughout the state and
uses that data to estimate AADT for other local roads.
Louisiana DOT does not apply factors to low-volume rural local roads. Day of week, month and axle
correction factors are used for high-volume urban arterials and collectors.
Question 7a. Do local road traffic data collection practices differ in rural and urban areas?
Almost one-third of respondents employ different traffic data collection practices in rural and urban areas.
In Arizona, the local agencies in urban areas and/or their MPOs tend to collect more traffic count data
than smaller agencies in rural areas, presumably due to lack of resources.
Georgia DOT samples a portion of each local stratification.
Idaho DOT does not collect class data in urban areas unless scheduling a manual count. Volume counts
are taken closer to the intersection in cities; factors are not applied to counts taken in urban cities.
In Louisiana:
o Urban arterials and collectors are monitored for short-duration (48 hours) traffic volume on a
three-year cycle; day of week, month and axle correction factors are applied.
o Rural and urban locals are monitored for short-duration (48 hours) traffic volume aperiodically on
an approximate 10-year cycle; no factors are applied.

Prepared by CTC & Associates LLC 43
In New York, traffic count contractors are given the option to use nonintrusive count devices on high-
volume/high-speed facilities.
PennDOT uses lower classified urban and rural factors with its urban and rural local counts for its 7,200
local road sites. The local federal-aid routes are assigned functional classes that have factors associated
with them.
In Virginia:
o City-maintained streets are counted once every three years.
o State-maintained streets (urban or rural) may be counted less frequently.
Question 7b. Do local road traffic data collection practices differ in areas with low population
density versus areas with higher densities?
Only four respondents apply different counting practices based on population density.
Arizona repeated its comment that the local agencies in urban areas and/or their MPOs tend to collect
more traffic count data than smaller agencies in rural areas, presumably due to lack of resources.
New York repeated its comment that traffic count contractors are given the option to use nonintrusive
count devices on high-volume/high-speed facilities.
Georgia DOT accounts for different counting practices in its sampling plan.
In Virginia, fully developed local subdivision streets maintained by the state are counted less frequently
than local roadways with development space.
Partner Agency Collection, Analysis and Reporting Programs
Question 8. Please indicate the other agencies within your state responsible for collecting,
analyzing or reporting federally mandated traffic data on local roads.
Contractors or consultants were most frequently cited as the agency other than the state DOT responsible for
collecting federally mandated traffic data on local roads. The table below summarizes survey responses.
Other Agencies Collecting Federally Mandated Traffic Data on Local Roads
Collecting Agency Response
Percent
Response
Count
Contractor/consultant 48% 10
Metropolitan planning organization (MPO) or rural planning
organization (RPO) 29% 6
Counties 24% 5
Municipalities 19% 4

Prepared by CTC & Associates LLC 44
8a. Please describe each agency’s role in collecting, analyzing or reporting data.
The table below describes the collection efforts of other agencies collecting federally mandated traffic data on
local roads for the state DOT.
Details of Other Agencies’ Traffic Data Collection Efforts
State Collecting Agency
Type Details of the Collection Effort
Alabama Counties
Counties do collection only. Alabama DOT processes
and develops the necessary AADT and related data for all
traffic counts.
Arizona
Contractor/consultant;
counties;
municipalities; MPO
or RPO; some tribal
governments
This role varies dramatically by agency and depends on
whether the locality is in an MPO and if they have their
own counting program. Arizona DOT has a Web-based
application most of these agencies use to report their
traffic and other highway attributes for inclusion in the
HPMS.
Arkansas Contractor/consultant The department performs all traffic counts, outsourcing
about 40%.
California Contractor/consultant None provided
Connecticut MPO or RPO
The state is the primary source for collecting, analyzing
or reporting data; an MPO or RPO may submit an
occasional study site.
Georgia Contractor/consultant Georgia DOT pays the contractor for collecting traffic-
related data.
Illinois
Contractor/consultant;
counties;
municipalities
None provided
Kentucky Contractor/consultant Consultant collects data; KYTC analyzes and reports to
FHWA.
Louisiana Contractor/consultant Contractor provides short-duration (48-hour) volume
counts at 50,000 sites over a 10-year period.
Nebraska MPO or RPO None provided
Nevada MPO or RPO The MPO collects very few counts and sends all data to
Nevada DOT for processing.
New York
Contractor/consultant;
counties;
municipalities; MPO
or RPO
MPOs hire contractors to collect traffic data. The MPOs
then conduct their own quality control review of the data,
along with analyzing and reporting the data for their
purposes. The same traffic counts are provided to New
York State DOT for quality control review, analysis and
reporting.
Counties and municipalities also collect traffic data on
local roads (in addition to traffic counts assigned by
NYSDOT to the department’s contractors). The counties
conduct their own quality control review of the data,

Prepared by CTC & Associates LLC 45
Details of Other Agencies’ Traffic Data Collection Efforts
State Collecting Agency
Type Details of the Collection Effort
along with analyzing and reporting the data for their
purposes. The same traffic counts are provided to
NYSDOT for quality control review, analysis and
reporting.
Counties are encouraged to maintain a traffic count
program through NYSDOT’s County Counter Initiative.
Traffic counters and software are lent to the counties in
return for the counts being taken in NYSDOT’s format
and the resulting traffic counts being provided to the
department.
Oregon Counties;
municipalities
Other jurisdictions may collect data but only Oregon
DOT applies factors.
Pennsylvania Contractor/consultant;
MPO or RPO
The only role agencies have is in collecting the data;
PennDOT analyzes and reports the data.
Data may be collected on local federal-aid routes by
MPOs, RPOs, contractors, and PennDOT districts and
field staff.
Virginia Contractor/consultant Virginia DOT collects all federal reporting data with
state forces or contract forces responsible to state.
Question 9. Are other agencies within your state subject to a mandate that requires the collection
of federally required traffic data on local roads? If yes, please describe how this mandated
collection of local road traffic data is funded or the type of cooperative agreement in place to
facilitate this process.
The only affirmative response to this question came from New York State DOT, with a qualification. New York
City DOT’s traffic count program may not be the result of a mandate, but the city and state DOTs have been
working for several years to establish a method for sharing NYCDOT’s off-state system street counts.
Question 10. Do local agencies in your state collect, analyze or report data on local roadways that
are not required for federally mandated reporting? If yes, please describe how this data is used
and who it is shared with.
Two-thirds of respondents indicated that local agencies in their states collected, analyzed or reported data on local
roadways that are not required for federally mandated reporting. Below is a summary of these responses.
Data is gathered for projects or study sites on occasion (Connecticut, Oregon).
An MPO is using data to develop traffic generation models (Louisiana).
Localities are collecting data for a variety of purposes; in most cases, the state DOT does not receive
copies of the data (Alabama, California, Hawaii, Illinois, Iowa, Pennsylvania, Rhode Island).
Some counties have their own data collection programs (Georgia); larger cities and many of the counties
have their own traffic data collection programs, but most simply treat the raw count as if it were an
AADT (Florida).
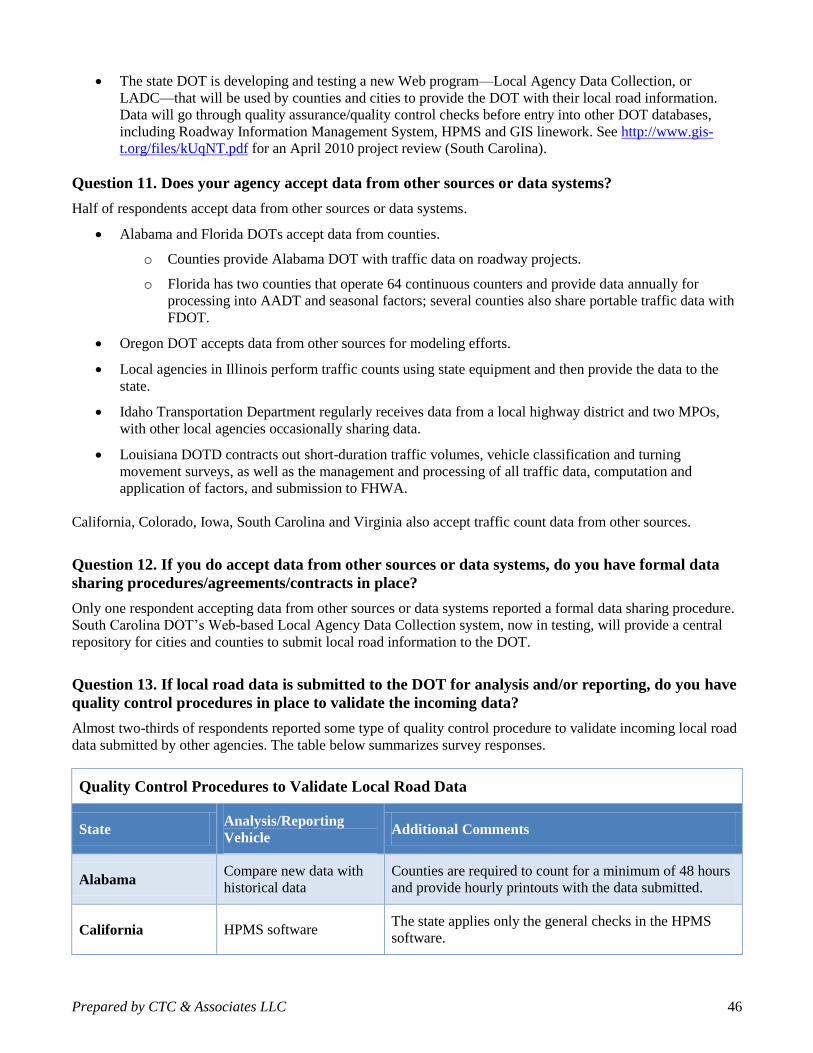
Prepared by CTC & Associates LLC 46
The state DOT is developing and testing a new Web program—Local Agency Data Collection, or
LADC—that will be used by counties and cities to provide the DOT with their local road information.
Data will go through quality assurance/quality control checks before entry into other DOT databases,
including Roadway Information Management System, HPMS and GIS linework. See http://www.gis-
t.org/files/kUqNT.pdf for an April 2010 project review (South Carolina).
Question 11. Does your agency accept data from other sources or data systems?
Half of respondents accept data from other sources or data systems.
Alabama and Florida DOTs accept data from counties.
o Counties provide Alabama DOT with traffic data on roadway projects.
o Florida has two counties that operate 64 continuous counters and provide data annually for
processing into AADT and seasonal factors; several counties also share portable traffic data with
FDOT.
Oregon DOT accepts data from other sources for modeling efforts.
Local agencies in Illinois perform traffic counts using state equipment and then provide the data to the
state.
Idaho Transportation Department regularly receives data from a local highway district and two MPOs,
with other local agencies occasionally sharing data.
Louisiana DOTD contracts out short-duration traffic volumes, vehicle classification and turning
movement surveys, as well as the management and processing of all traffic data, computation and
application of factors, and submission to FHWA.
California, Colorado, Iowa, South Carolina and Virginia also accept traffic count data from other sources.
Question 12. If you do accept data from other sources or data systems, do you have formal data
sharing procedures/agreements/contracts in place?
Only one respondent accepting data from other sources or data systems reported a formal data sharing procedure.
South Carolina DOT’s Web-based Local Agency Data Collection system, now in testing, will provide a central
repository for cities and counties to submit local road information to the DOT.
Question 13. If local road data is submitted to the DOT for analysis and/or reporting, do you have
quality control procedures in place to validate the incoming data?
Almost two-thirds of respondents reported some type of quality control procedure to validate incoming local road
data submitted by other agencies. The table below summarizes survey responses.
Quality Control Procedures to Validate Local Road Data
State Analysis/Reporting
Vehicle Additional Comments
Alabama Compare new data with
historical data
Counties are required to count for a minimum of 48 hours
and provide hourly printouts with the data submitted.
California HPMS software The state applies only the general checks in the HPMS
software.

Prepared by CTC & Associates LLC 47
Quality Control Procedures to Validate Local Road Data
State Analysis/Reporting
Vehicle Additional Comments
Colorado
Quality assurance/quality
control software
(unspecified)
None provided
Florida Variety of quality control
checks
Quality control checks on hourly counts collected by
county-owned and operated continuous counters include
minimum and maximum hourly volumes, consecutive
identical volumes, missing intervals, and minimum and
maximum daily volumes. Portable counts are compared to
prior-year counts for reasonableness.
Georgia
Same quality control
procedures as used with
other traffic counts
Quality control rules are built into the agency’s system to
flag data if it appears to be incorrect; the agency is very
liberal with local data.
Idaho
Same quality control
procedures as used with
own traffic counts
If provided with only a list of counts, the agency tries to
determine whether they are factored and factor them if
necessary.
Illinois Staff review None provided
Iowa Compare new data with
historical data None provided
Louisiana Contract services
software (unspecified) None provided
Nevada TRADAS data
warehousing system
TRADAS is used to process and validate data provided by
other agencies.
New York Traffic Count Editor
Review traffic counts in this application designed
specifically for this purpose; the application applies
FHWA and NYSDOT parameters, along with the
reviewer’s knowledge, to identify acceptable and
unacceptable traffic counts.
Pennsylvania Three error reports
The same error processes are used as those applied to
state-owned routes; error reports validate data or flag it for
manual review by an analyst.
South Carolina Local Agency Data
Collection program
This new Web-based system, now in the testing phase,
will provide quality assurance/quality control data checks
before the data is entered into other agency databases.
Virginia Automated checks For local roads, the collector is relied upon heavily for
quality control of their own data.

Prepared by CTC & Associates LLC 48
Local Road Data Use, Challenges and Goals
Question 14. How is local road data used in your state by the DOT or other agencies?
Respondents reported a wide range of uses for the local road data collected in their states, with use for
transportation planning cited by almost three-quarters of respondents. The table below summarizes survey
responses.
Uses for Local Road Data
Type of Use
Response
Percent
Response
Count
Transportation planning 71.4% 15
Traffic safety 61.9% 13
Traffic impact studies 52.4% 11
Pavement management 52.4% 11
Verify other traffic counts 47.6% 10
New road design 38.1% 8
Allocation of funding 38.1% 8
Respondents reported other uses for local road data, including:
Estimating or reporting VMT (Georgia, Rhode Island)
HPMS reporting (Florida, Oregon)
Preparing statewide travel estimates (Louisiana)
Transportation policy development, air quality purposes, economic research/development (Arizona)
Question 15. What challenges have been encountered in collecting traffic data on local roads?
Respondents were asked to identify challenges that applied to their state’s local road traffic data collection
program. The table below summarizes survey responses.
Challenges in Collecting Local Road Traffic Data
Challenge
Response
Percent
Response
Count
Lack of staff to process data 66.7% 14
Cost of data collection equipment (initial and maintenance costs) 42.9% 9

Prepared by CTC & Associates LLC 49
Challenges in Collecting Local Road Traffic Data
Challenge
Response
Percent
Response
Count
Damage/vandalism to equipment 33.3% 7
Limited seasons to conduct counts 28.6% 6
Safety concerns for staff setting up equipment 28.6% 6
Lack of equipment 23.8% 5
Safety concerns for the general public 19.0% 4
Poor data quality/accuracy 14.3% 3
Data management and integration 9.5% 2
Lack of power source and/or communication equipment 4.8% 1
No respondents selected the response options below:
Equipment is not easy to use
Lack of standardized field work procedures
Other challenges cited by respondents include:
Funding (Colorado, Georgia, Arizona)
Indifference about collecting and sharing information (Arizona)
Lack of staff to collect data (Kentucky, South Carolina)
Other types of roadways are a higher priority (New York, Rhode Island)
Questions about accuracy of the methodology (Kentucky)
Time-consuming review and approval process (Hawaii)
Question 16. Are data surrogates such as historical count data, land zoning, future land use and
road network layout used by the DOT or other agencies to supplement local traffic count data?
Only two states—Idaho and Iowa—reported the use of data surrogates to supplement local traffic count data. Both
use historical counts to fill in gaps.
Question 17. Are there any planned changes in the near future for local road traffic data collection
efforts in your state?
Forty-one percent of respondents indicated that changes are on the horizon for their local road data collection
programs. The table below describes the changes in local road traffic data collection efforts planned by
respondents.

Prepared by CTC & Associates LLC 50
Changes Planned for Local Road Traffic Data Collection Efforts
Type of Change State Details
Counting Practices
Alabama
Planning to set a number of control counts to be counted each
year to help determine the average change in AADT volume for
the previous year.
Iowa Reducing the number of local classification counts and
increasing the volume counts.
Pennsylvania
Another bureau is currently working on linking all of the local
roads; when the project is complete, the agency hopes to have
the ability to expand its local road collection program.
Data Repository
Arizona Migrating to a cloud-based data repository for all agencies to use
to post, archive and report traffic and other highway data.
Rhode Island
Efforts will be made to enter and report any local traffic data into
a RIDOT-maintained GIS-compatible database. Currently, many
traffic counts/reports fulfill their original purpose and fail to be
shared throughout RIDOT.
South Carolina Local Agency Data Collection, a new data repository, will allow
the agency to obtain local road data from counties and cities.
Responsibility for
Data Collection
Arizona Resumption of DOT-led and funded traffic data collection on
local roads and streets to complement their existing programs.
New York Additional contractor(s) will be hired to complete traffic counts
on the local-owned non-federal aid roadways.
South Carolina
Recognizing the agency’s limited resources for collection of
local road data, the Local Agency Data Collection program is
being developed to obtain local road data from the counties and
cities.
Sharing Data
Georgia Aim to do more data sharing, which requires a lot of
coordination with locals.
Oregon Meeting with local MPOs about data sharing.
Question 18. If your agency is willing to be available for some follow-up questions, please provide
contact information for the staff member in your agency responsible for overseeing traffic data
collection (if different than you).
See Survey Results beginning on page 52 for details.

Prepared by CTC & Associates LLC 51
Question 19. Please provide any additional details on any of your answers, or provide additional
comments regarding how local road traffic count requirements and responsibilities are managed
in your state.
Two respondents commented further on the challenges associated with collecting traffic data on local roads.
It’s very hard for a DOT to assemble and submit traffic and other highway data mandated by and for the
FHWA for all public roads and streets that are owned by multiple levels of governments without some kind of
state statute in place that forces them to do it. And it’s also a burden for most of these agencies to develop and
maintain a count program without adequate resources or funding for it in place. Finally, it’s very difficult for
these agencies to embrace data sharing and adopt a macroscopic view of why FHWA or the state DOT want
these data (Arizona DOT).
We’d like to look at intelligent transportation systems as a source for traffic data, but as of now the accuracy
is not good enough. When comparing these sites to our automated traffic recorder sites, we are finding
differences of 25 percent to 50 percent. Hopefully, this will improve in the future. We would also like to
develop more data partnerships with local agencies, but due to the lack of resources on our end, it’s difficult
to find time to coordinate with 159 counties. Some counties collect data for their own special purposes such
as a Friday night rodeo. We are interested in collecting data for “typical conditions” (Georgia DOT).

Prepared by CTC & Associates LLC 52
Survey Results The full text of each survey response is provided below. For reference, we have included an abbreviated version
of each question before the response; for the full question text, please see page 34 of this report.
Alabama Contact: Charles W. Turney, Traffic Engineer, Planning, Alabama Department of Transportation,
[email protected], (334) 242-6393.
1. Total centerline miles of local roadways: 69,145
2. Number of DOT-managed short-term traffic count sites:
Portable volume sites: 50
Portable vehicle classification sites: 50
3. Count frequency of DOT-managed short-term traffic count sites:
Portable volume sites: Currently, as needed; project-specific counts.
Portable vehicle classification sites: Currently, as needed; project-specific counts.
4. Number of DOT-managed permanent/continuous traffic monitoring sites: None.
5. Collect, analyze and report on local roadway traffic data not required for federally mandated
reporting? Yes. Project-specific traffic data used by the county for their roadway projects. The counties
collect most of these counts using our guidelines and we do other counts as needed.
6. Factors used to estimate AADT: Axle correction factors.
7a. Collection practices differ in rural and urban areas? No.
7b. Collection practices differ for low population density versus higher densities? No.
8. Other agencies responsible for federally mandated traffic data: None; we collect or verify all traffic
data reported through the HPMS. We do plan to include counts provided by counties and plan to
outsource some of our counts next year.
8a. Other agency’s role in collecting, analyzing or reporting data: We process and develop the necessary
AADT and related data for all traffic counts. The counties and consultant/contractors only collect the data
and submit it to us.
9. Mandate for other agencies to collect federally required traffic data on local roads? No.
10. Local agencies collecting data not required for federally mandated reporting? Yes. Some of the
urbanized areas collect data for their own purposes. We currently do not receive copies of this data.
11. Accept data from other sources or data systems? Yes. Counties provide traffic data on roadway project
in their counts.
12. Formal data sharing procedures/agreements/contracts? No.
13. Quality control procedures to validate incoming data? Yes. We review the counts and compare them
with any historical data we may have. The counties are required to count for a minimum of 48 hours, by
direction, and provide hourly printouts with the data submitted to our office.
14. Uses for local road data:
Verify other traffic counts
County road projects
15. Challenges in collecting local road traffic data: Lack of staff to process data.
16. Data surrogates used? No.
17. Planned changes for local road traffic data collection efforts? Yes. We plan to set a number of control
counts to be counted each year to help determine the average change in AADT volume for the previous

Prepared by CTC & Associates LLC 53
year.
18. Staff contact information (if different from respondent): Same as respondent.
19. Details or comments: I would like to receive a copy of your final report, if possible. This would help us
to determine the appropriate level of coverage needed to adequately represent the local road summary
data needed for the HPMS.
Arizona Contact: Mark Catchpole, Transportation Planner, Arizona Department of Transportation,
[email protected], (602) 712-8596.
1. Total centerline miles of local roadways: 58,340
2. Number of DOT-managed short-term traffic count sites: None. Currently, Arizona DOT does not
collect traffic data on roads and streets owned by other government agencies.
3. Count frequency of DOT-managed short-term traffic count sites: N/A
4. Number of DOT-managed permanent/continuous traffic monitoring sites: None.
5. Collect, analyze and report on local roadway traffic data not required for federally mandated
reporting? No.
6. Factors used to estimate AADT:
Day of week factors
Month factors
7a. Collection practices differ in rural and urban areas? Yes. Local agencies in urban areas and/or their
MPOs tend to collect more traffic count data than smaller agencies in rural areas, presumably due to lack
of resources.
7b. Collection practices differ for low population density versus higher densities? Yes. Local agencies in
urban areas and/or their MPOs tend to collect more traffic count data than smaller agencies in rural areas,
presumably due to lack of resources.
8. Other agencies responsible for federally mandated traffic data:
Municipal planning organization (MPO) or rural planning organization (RPO)
Outsourced to contractor/consultant
Counties
Municipalities
Some tribal governments collect traffic counts on roads and streets they own.
8a. Other agency’s role in collecting, analyzing or reporting data: This role varies dramatically by
agency—depends on [whether] they are in an MPO or not and if they have their own counting program in
place. Arizona DOT has a Web-based application most of these agencies use to report their traffic and
other highway attributes for inclusion into HPMS.
9. Mandate for other agencies to collect federally required traffic data on local roads? No.
10. Local agencies collecting data not required for federally mandated reporting? Yes. I do not have a
firm answer for this question. There is NO state statute or mandate that requires local agencies to provide
Arizona DOT with any highway data that is mandated by FHWA. They may collect traffic or pavement
data for internal use but are not otherwise forced by law to share it with the state DOT so that it may
better comply with FHWA mandates that are in place with the state highway agency.
11. Accept data from other sources or data systems? No.
12. Formal data sharing procedures/agreements/contracts? N/A
Prepared by CTC & Associates LLC 54
13. Quality control procedures to validate incoming data? No.
14. Uses for local road data:
Traffic safety
Transportation planning
Allocation of funding
Transportation policy development, air quality purposes, economic research/development
15. Challenges in collecting local road traffic data:
Lack of staff to process data
Lack of equipment
Cost of data collection equipment (initial and maintenance costs)
Safety concerns for staff setting up equipment
Lack of financial resources
Government apathy/indifference about collecting and sharing information
16. Data surrogates used? No.
17. Planned changes for local road traffic data collection efforts? Yes. 1. Migration to cloud-based data
repository for all agencies to post, archive and report traffic and other highway data to. 2. Resumption of
DOT-led and funded traffic data collection on local roads and streets to complement their existing
programs.
18. Staff contact information (if different from respondent): [No response.]
19. Details or comments: It's very hard for a DOT to assemble and submit traffic and other highway data
mandated by and for the FHWA for all public roads and streets that are owned by multiple levels of
governments without some kind of state statute in place that forces them to do it. And it's also a burden
for most of these agencies to develop and maintain a count program without adequate resources or
funding for it in place. Finally, it's very difficult for these agencies to embrace data sharing and adopt a
macroscopic view of why FHWA or the state DOT want these data.
Arkansas Contact: Greg Nation, HPMS Coordinator, Arkansas State Highway & Transportation Department,
[email protected], (501) 569-2406.
1. Total centerline miles of local roadways: 83,668
2. Number of DOT-managed short-term traffic count sites:
Portable volume sites: 2,950
Portable vehicle classification sites: 1,170
3. Count frequency of DOT-managed short-term traffic count sites:
Portable volume sites: Annually
Portable vehicle classification sites: Annually
Special counts as needed
4. Number of DOT-managed permanent/continuous traffic monitoring sites: [No response.]
5. Collect, analyze and report on local roadway traffic data not required for federally mandated
reporting? No.
6. Factors used to estimate AADT: [No response.]
7a. Collection practices differ in rural and urban areas? No.
7b. Collection practices differ for low population density versus higher densities? No.

Prepared by CTC & Associates LLC 55
8. Other agencies responsible for federally mandated traffic data: Outsourced to contractor/consultant.
We receive no assistance. The Department performs all traffic counts. We do outsource about 40%.
8a. Other agency’s role in collecting, analyzing or reporting data: [No response.]
9. Mandate for other agencies to collect federally required traffic data on local roads? No.
10. Local agencies collecting data not required for federally mandated reporting? No.
11. Accept data from other sources or data systems? No.
12. Formal data sharing procedures/agreements/contracts? No.
13. Quality control procedures to validate incoming data? N/A
14. Uses for local road data:
Traffic safety
Don’t know
15. Challenges in collecting local road traffic data:
Lack of staff to process data
Cost of data collection equipment (initial and maintenance costs)
Damage/vandalism to equipment
16. Data surrogates used? No.
17. Planned changes for local road traffic data collection efforts? No.
18. Staff contact information (if different from respondent): [No response.]
19. Details or comments: [No response.]
California Contact: Brian Domsic, Division of Transportation System Information, California Department of Transportation,
[email protected], (916) 653-3272.
1. Total centerline miles of local roadways: 156,980
2. Number of DOT-managed short-term traffic count sites:
Portable volume sites: Varies; 2,000 to 5,000 approx.
Portable vehicle classification sites: Varies; 1,000 to 4,000
3. Count frequency of DOT-managed short-term traffic count sites:
Portable volume sites: Every year but on a rotating basis across the state.
Portable vehicle classification sites: Every year but on a rotating basis across the state.
4. Number of DOT-managed permanent/continuous traffic monitoring sites:
Volume only: The state does not manage any of these on the local roads.
Volume and classification: The state does not manage any of these on the local roads.
5. Collect, analyze and report on local roadway traffic data not required for federally mandated
reporting? No.
6. Factors used to estimate AADT:
Day of week factors
Seasonal factors
Axle correction factors
7a. Collection practices differ in rural and urban areas? No.
7b. Collection practices differ for low population density versus higher densities? No.

Prepared by CTC & Associates LLC 56
8. Other agencies responsible for federally mandated traffic data: Outsourced to contractor/consultant.
8a. Other agency’s role in collecting, analyzing or reporting data: [No response.]
9. Mandate for other agencies to collect federally required traffic data on local roads? No.
10. Local agencies collecting data not required for federally mandated reporting? Yes. They have their
own traffic census for their own uses.
11. Accept data from other sources or data systems? Yes. AADT or ADT that the local agencies provide.
12. Formal data sharing procedures/agreements/contracts? No.
13. Quality control procedures to validate incoming data? Yes. Only the general checks in the HPMS
software.
14. Uses for local road data: Don’t know.
15. Challenges in collecting local road traffic data: Lack of staff to process data.
16. Data surrogates used? No.
17. Planned changes for local road traffic data collection efforts? No.
18. Staff contact information (if different from respondent): [No response.]
19. Details or comments: [No response.]
Colorado Contact: Steven Abeyta, Traffic Analysis Unit Manager, Colorado Department of Transportation,
[email protected], (303) 757-9495.
1. Total centerline miles of local roadways: 167,000 lane miles
2. Number of DOT-managed short-term traffic count sites:
Portable volume sites: Around 400
Portable vehicle classification sites: Around 400
Control sites: 14
3. Count frequency of DOT-managed short-term traffic count sites:
Portable volume sites: Once annually on a 6-year cycle.
Portable vehicle classification sites: Once annually on a 6-year cycle.
Control sites: 4 times a year.
4. Number of DOT-managed permanent/continuous traffic monitoring sites: None.
5. Collect, analyze and report on local roadway traffic data not required for federally mandated
reporting? Yes. Special data requests from local agencies and other CDOT regions.
6. Factors used to estimate AADT:
Day of week factors
Month factors
Seasonal factors
Axle correction factors
7a. Collection practices differ in rural and urban areas? No.
7b. Collection practices differ for low population density versus higher densities? No.
8. Other agencies responsible for federally mandated traffic data: Don’t know.
8a. Other agency’s role in collecting, analyzing or reporting data: [No response.]
9. Mandate for other agencies to collect federally required traffic data on local roads? No.

Prepared by CTC & Associates LLC 57
10. Local agencies collecting data not required for federally mandated reporting? Yes. Numerous
analyses related to signal timing, planning, etc.
11. Accept data from other sources or data systems? Yes. From whomever collects it and wants to share
it.
12. Formal data sharing procedures/agreements/contracts? No.
13. Quality control procedures to validate incoming data? Yes. QA/QC [quality assurance/quality control]
software.
14. Uses for local road data:
Traffic impact studies
Traffic safety
Transportation planning
New road design
Pavement management
Verify other traffic counts
Allocation of funding
15. Challenges in collecting local road traffic data:
Damage/vandalism to equipment
Limited seasons to conduct counts
Safety concerns for the general public
Funding
16. Data surrogates used? No.
17. Planned changes for local road traffic data collection efforts? No.
18. Staff contact information (if different from respondent): [No response.]
19. Details or comments: [No response.]
Connecticut Contact: Donna Weaver, Traffic Monitoring Transportation Planner 2, Connecticut Department of Transportation,
[email protected], (860) 594-2334.
1. Total centerline miles of local roadways: 17,308.02 miles
2. Number of DOT-managed short-term traffic count sites:
Portable volume sites: 55 - 57 towns with local roads counted every three years; a few in each town
(local).
3. Count frequency of DOT-managed short-term traffic count sites:
Portable volume sites: Loop 48 hour every 3 years.
4. Number of DOT-managed permanent/continuous traffic monitoring sites:
Volume only: 1 (Whitney Avenue, New Haven)
5. Collect, analyze and report on local roadway traffic data not required for federally mandated
reporting? Yes. Town collecting – public.
6. Factors used to estimate AADT:
Day of week factors
Month factors
Seasonal factors

Prepared by CTC & Associates LLC 58
Axle correction factors
7a. Collection practices differ in rural and urban areas? No.
7b. Collection practices differ for low population density versus higher densities? No.
8. Other agencies responsible for federally mandated traffic data: Municipal planning organization
(MPO) or rural planning organization (RPO).
8a. Other agency’s role in collecting, analyzing or reporting data: The state is the primary source for
traffic monitoring collecting, analyzing or reporting data. MPO or RPO submit one study site once in a
while.
9. Mandate for other agencies to collect federally required traffic data on local roads? No.
10. Local agencies collecting data not required for federally mandated reporting? Yes. MPO or RPO
submit to DOT one study site once in a while.
11. Accept data from other sources or data systems? No.
12. Formal data sharing procedures/agreements/contracts? N/A
13. Quality control procedures to validate incoming data? N/A
14. Uses for local road data:
Traffic impact studies
Traffic safety
Transportation planning
Pavement management
Verify other traffic counts
15. Challenges in collecting local road traffic data:
Lack of staff to process data
Lack of equipment
Cost of data collection equipment (initial and maintenance costs)
Damage/vandalism to equipment
Limited seasons to conduct counts
Safety concerns for staff setting up equipment
16. Data surrogates used? No.
17. Planned changes for local road traffic data collection efforts? No.
18. Staff contact information (if different from respondent): [No response.]
19. Details or comments: [No response.]
Florida Contact: Richard L. Reel Jr., Traffic Data Manager, Florida Department of Transportation,
[email protected], (850) 414-4709.
1. Total centerline miles of local roadways: 10,7412.7
2. Number of DOT-managed short-term traffic count sites:
Portable volume sites: 4,500
Portable vehicle classification sites: 500
3. Count frequency of DOT-managed short-term traffic count sites:
Portable volume sites: 6-year cycle
Portable vehicle classification sites: 3-year cycle

Prepared by CTC & Associates LLC 59
4. Number of DOT-managed permanent/continuous traffic monitoring sites:
Volume and classification: 1
We get continuous volume data from 84 county-operated ATRs [automatic traffic recorders].
5. Collect, analyze and report on local roadway traffic data not required for federally mandated
reporting? Yes. Several metropolitan planning organizations that have annual traffic counting programs
share the data they have collected with FDOT. This data is then processed along with FDOT-collected
data to develop AADT estimates.
6. Factors used to estimate AADT:
Seasonal factors
Axle correction factors
7a. Collection practices differ in rural and urban areas? No.
7b. Collection practices differ for low population density versus higher densities? No.
8. Other agencies responsible for federally mandated traffic data: No other entity is required to collect
traffic data on local roads.
8a. Other agency’s role in collecting, analyzing or reporting data: [No response.]
9. Mandate for other agencies to collect federally required traffic data on local roads? No.
10. Local agencies collecting data not required for federally mandated reporting? Yes. The larger cities
and many of the counties have their own traffic data collection programs, but most simply treat the raw
count as if it were an AADT.
11. Accept data from other sources or data systems? Yes. We currently have 2 counties that operate 64
continuous counters. These counties provide this data to FDOT annually for processing into AADT and
seasonal factors. Several counties share portable traffic data with FDOT.
12. Formal data sharing procedures/agreements/contracts? No.
13. Quality control procedures to validate incoming data? Yes. We have a series of QC checks that are
performed on the hourly counts collected by the county-owned and operated continuous counters.
Examples of these checks are minimum and maximum hourly volumes, consecutive identical volumes,
missing intervals, minimum and maximum daily volumes. Portable counts are compared to prior year
counts to determine if they are reasonable.
14. Uses for local road data:
Transportation planning
Mostly for HPMS
15. Challenges in collecting local road traffic data:
Lack of staff to process data
Poor data quality/accuracy
16. Data surrogates used? No.
17. Planned changes for local road traffic data collection efforts? No.
18. Staff contact information (if different from respondent): [No response.]
19. Details or comments: [No response.]
Georgia Contact: Tim Christian, Georgia Department of Transportation, [email protected], (770) 986-1434.
1. Total centerline miles of local roadways: ~100,000

Prepared by CTC & Associates LLC 60
2. Number of DOT-managed short-term traffic count sites:
Portable volume sites: ~22,000
Portable vehicle classification sites: ~6,000
Portable WIM sites: 90
Control sites: 12
3. Count frequency of DOT-managed short-term traffic count sites:
Portable volume sites: Most of these are on a 3- to 4-year cycle
Portable vehicle classification sites: Most of these are on a 3- to 4-year cycle
Portable WIM sites: 3-year cycle (we collect 30 WIM sites per year)
Control sites: Every year
4. Number of DOT-managed permanent/continuous traffic monitoring sites:
Volume only: 20
Volume and classification: 220
WIM: 2
Traffic signal loops: N/A; not accurate enough
Nonintrusive technologies: N/A; not accurate enough
5. Collect, analyze and report on local roadway traffic data not required for federally mandated
reporting? Yes. Only for special requests. These are not used for VMT calculations.
6. Factors used to estimate AADT:
Day of week factors
Month factors
Seasonal factors
Axle correction factors
We have a local road sampling plan.
7a. Collection practices differ in rural and urban areas? Yes. We just sample part of the local roads.
Since there are about 100,000 miles of local roads, we sample a portion of each local stratification that we
have defined.
7b. Collection practices differ for low population density versus higher densities? Yes, this has been
accounted for in the sampling plan.
8. Other agencies responsible for federally mandated traffic data: Outsourced to contractor/consultant.
8a. Other agency’s role in collecting, analyzing or reporting data: We simply pay the contractor for
collecting traffic-related data.
9. Mandate for other agencies to collect federally required traffic data on local roads? No.
10. Local agencies collecting data not required for federally mandated reporting? Yes. A few counties
have their own collection programs.
11. Accept data from other sources or data systems? No.
12. Formal data sharing procedures/agreements/contracts? No.
13. Quality control procedures to validate incoming data? Yes. Just like other traffic counts, the data is
validated. We have QC rules built into our system to flag data if it appears to be incorrect. We are very
liberal with local data though.
14. Uses for local road data: Mainly used for VMT reporting purposes.
15. Challenges in collecting local road traffic data: Funding is the main issue.
16. Data surrogates used? No.
17. Planned changes for local road traffic data collection efforts? Yes. Depending on funding, the

Prepared by CTC & Associates LLC 61
program is modified a little each year. We'd like to do more data sharing, but that takes a lot of
coordination with locals.
18. Staff contact information (if different from respondent): Scott Knight, Branch Chief,
[email protected], (770) 986-1442.
19. Details or comments: We'd like to look at ITS [intelligent transportation systems] as a source for traffic
data, but as of now, the accuracy is not good enough. When comparing these sites to our ATR sites, we
are finding differences of 25-50%. Hopefully, this will improve in the future. We would also like to
develop more data partnerships with local agencies, but due to the lack of resources on our end, it's
difficult to find time to coordinate with 159 counties. Some counties collect data for their own special
purposes—such as a Friday night rodeo. We are interested in collecting data for "typical conditions."
Hawaii Contact: Richard Akana, Engineer, Hawaii Department of Transportation, [email protected], (808) 587-
6345.
1. Total centerline miles of local roadways: 600
2. Number of DOT-managed short-term traffic count sites:
Portable volume sites: 800
Portable vehicle classification sites: 350
Control sites: 36
3. Count frequency of DOT-managed short-term traffic count sites:
Portable volume sites: At least once every other year.
Portable vehicle classification sites: At least once every other year.
Control sites: 4 times a year. (The station, at least once every other year.)
4. Number of DOT-managed permanent/continuous traffic monitoring sites: [No response.]
5. Collect, analyze and report on local roadway traffic data not required for federally mandated
reporting? No.
6. Factors used to estimate AADT:
Day of week factors
Month factors
Seasonal factors
Axle correction factors
7a. Collection practices differ in rural and urban areas? No.
7b. Collection practices differ for low population density versus higher densities? No.
8. Other agencies responsible for federally mandated traffic data: Don’t know.
8a. Other agency’s role in collecting, analyzing or reporting data: [No response.]
9. Mandate for other agencies to collect federally required traffic data on local roads? No.
10. Local agencies collecting data not required for federally mandated reporting? Yes. I'm sure they do,
but we not sure what they do with it.
11. Accept data from other sources or data systems? No.
12. Formal data sharing procedures/agreements/contracts? N/A
13. Quality control procedures to validate incoming data? N/A
14. Uses for local road data:
Traffic impact studies

Prepared by CTC & Associates LLC 62
Traffic safety
Transportation planning
New road design
Pavement management
Verify other traffic counts
15. Challenges in collecting local road traffic data: We contract this out. Our main issue is the review and
approval process it very time-consuming.
16. Data surrogates used? No.
17. Planned changes for local road traffic data collection efforts? No.
18. Staff contact information (if different from respondent): [No response.]
19. Details or comments: [No response.]
Idaho Contact: Glenda Fuller, Roadway Data Manager, Idaho Transportation Department, [email protected],
(208) 334-8217.
1. Total centerline miles of local roadways: 43,570
2. Number of DOT-managed short-term traffic count sites:
Portable volume sites: 1,300 – 1,400 per year
Portable vehicle classification sites: 20 - 40 per year
Control sites: None off the state system
3. Count frequency of DOT-managed short-term traffic count sites:
Portable volume sites: No regular schedule other than 3-year rotation for HPMS.
Portable vehicle classification sites: No regular schedule other than 3-year rotation for HPMS.
4. Number of DOT-managed permanent/continuous traffic monitoring sites:
Volume only: 29
Volume and classification: 6
Traffic signal loops: 2
Nonintrusive technologies: 1
5. Collect, analyze and report on local roadway traffic data not required for federally mandated
reporting? Yes. The schedule focuses on the HPMS sites. If a field person has extra counters, they will
be scheduled to set other roads in the area.
6. Factors used to estimate AADT:
Month factors
Axle correction factors
7a. Collection practices differ in rural and urban areas? Yes. Generally we do not collect class data in
urban areas unless we schedule a manual count. Volume counts are taken closer to the intersection in
cities. We do not factor counts in urban cities.
7b. Collection practices differ for low population density versus higher densities? No.
8. Other agencies responsible for federally mandated traffic data: Don’t know.
8a. Other agency’s role in collecting, analyzing or reporting data: [No response.]
9. Mandate for other agencies to collect federally required traffic data on local roads? [No response.]
10. Local agencies collecting data not required for federally mandated reporting? [No response.]

Prepared by CTC & Associates LLC 63
11. Accept data from other sources or data systems? Yes. We regularly receive data from a local highway
district and from two MPOs. Other local agencies will occasionally share data with us.
12. Formal data sharing procedures/agreements/contracts? No.
13. Quality control procedures to validate incoming data? Yes. When we receive data files to process, we
use the same procedures as for our data. When we simply get a list of counts, we try to determine whether
they are factored or not and factor them if necessary.
14. Uses for local road data:
Traffic impact studies
Traffic safety
Transportation planning
New road design
Pavement management
15. Challenges in collecting local road traffic data:
Lack of staff to process data
Limited seasons to conduct counts
16. Data surrogates used? Yes. We use our historical counts to fill in gaps.
17. Planned changes for local road traffic data collection efforts? No.
18. Staff contact information (if different from respondent): [No response.]
19. Details or comments: [No response.]
Illinois Contact: Michael A. Miller, Traffic Data Manager, Illinois Department of Transportation,
[email protected], (217) 785-8494.
1. Total centerline miles of local roadways: 124,000
2. Number of DOT-managed short-term traffic count sites:
Portable volume sites: 15,000 annually
Portable vehicle classification sites: 400 annually
3. Count frequency of DOT-managed short-term traffic count sites:
Portable volume sites: Non-state system roads are counted on a 5-year cycle.
Portable vehicle classification sites: Non-state system HPMS counts are counted on a 3-year cycle.
4. Number of DOT-managed permanent/continuous traffic monitoring sites:
Volume only: 6
Volume and classification: 4
5. Collect, analyze and report on local roadway traffic data not required for federally mandated
reporting? Yes. All AADTs collected on the local system are displayed in an interactive GIS Internet
application and in GIS shapefiles available to the public.
6. Factors used to estimate AADT:
Day of week factors
Month factors
By functional class and by geographical area
7a. Collection practices differ in rural and urban areas? No.
7b. Collection practices differ for low population density versus higher densities? No.

Prepared by CTC & Associates LLC 64
8. Other agencies responsible for federally mandated traffic data:
Outsourced to contractor/consultant
Counties
Municipalities
8a. Other agency’s role in collecting, analyzing or reporting data: [No response.]
9. Mandate for other agencies to collect federally required traffic data on local roads? No.
10. Local agencies collecting data not required for federally mandated reporting? Yes. Local agencies
could be collecting data for their own purposes.
11. Accept data from other sources or data systems? Yes. Some local agencies perform traffic counts
using state equipment and then provide the data to the state.
12. Formal data sharing procedures/agreements/contracts? Yes. IDOT staff reviews traffic count data
provided by local agencies.
13. Quality control procedures to validate incoming data? Yes. IDOT staff reviews traffic count data
provided by local agencies.
14. Uses for local road data:
Traffic impact studies
Traffic safety
Transportation planning
New road design
Pavement management
Verify other traffic counts
Allocation of funding
15. Challenges in collecting local road traffic data:
Lack of staff to process data
Lack of equipment
Cost of data collection equipment (initial and maintenance costs)
Safety concerns for staff setting up equipment
Safety concerns for the general public
16. Data surrogates used? No.
17. Planned changes for local road traffic data collection efforts? No.
18. Staff contact information (if different from respondent): Rob Robinson, Planning & Systems Chief,
[email protected], (217) 782-0378.
19. Details or comments: [No response.]
Iowa Contact: Ronald Bunting, Transportation Planner 2, Iowa Department of Transportation,
[email protected], (515) 239-1323.
1. Total centerline miles of local roadways: 104,746.34 (total minus primary minus state park and
institutional)
2. Number of DOT-managed short-term traffic count sites:
Portable volume sites: Approximately 2,600 per year in a quarter of the state per year.
Portable vehicle classification sites: Approximately 6,000 per year in a quarter of the state per year.
Control sites: We use our 176 permanent sites.

Prepared by CTC & Associates LLC 65
3. Count frequency of DOT-managed short-term traffic count sites:
Portable volume sites: Functional class higher than local are 4 or 8 years and then the local roads can be
20 years or more.
Portable vehicle classification sites: Functional class higher than local are 4 or 8 years and then the local
roads can be 20 years or more.
Control sites: We use our 176 permanent sites.
4. Number of DOT-managed permanent/continuous traffic monitoring sites:
Volume only: 21
Volume and classification: 19
Traffic signal loops: Zero traffic signal loops, but we have 21 volume sites with a loop, 9 with two loops
and 10 with loops and piezo.
5. Collect, analyze and report on local roadway traffic data not required for federally mandated
reporting? Yes. Used for Vehicle Miles Traveled (VMT) calculations and shared with users on our
website.
6. Factors used to estimate AADT:
Day of week factors
Month factors
Seasonal factors
Axle correction factors
7a. Collection practices differ in rural and urban areas? No.
7b. Collection practices differ for low population density versus higher densities? No.
8. Other agencies responsible for federally mandated traffic data: [No response.]
8a. Other agency’s role in collecting, analyzing or reporting data: [No response.]
9. Mandate for other agencies to collect federally required traffic data on local roads? [No response.]
10. Local agencies collecting data not required for federally mandated reporting? Yes. Local agencies
may collect traffic data and use it themselves and may also share with others too. It varies by local
agency.
11. Accept data from other sources or data systems? Yes. We will accept data from local agencies.
12. Formal data sharing procedures/agreements/contracts? No.
13. Quality control procedures to validate incoming data? Yes. We use QC procedures in place to
compare new data with historical data.
14. Uses for local road data:
Traffic impact studies
Traffic safety
Transportation planning
New road design
Pavement management
Verify other traffic counts
Allocation of funding
15. Challenges in collecting local road traffic data:
Cost of data collection equipment (initial and maintenance costs)
Damage/vandalism to equipment
Limited seasons to conduct counts
Safety concerns for staff setting up equipment

Prepared by CTC & Associates LLC 66
Safety concerns for the general public
Poor data quality/accuracy
Data management and integration
16. Data surrogates used? Yes. We do use historical count data to supplement local count data.
17. Planned changes for local road traffic data collection efforts? Yes. We are reducing the number of
local classification counts and increasing the volume counts.
18. Staff contact information (if different from respondent): Same as respondent.
19. Details or comments: [No response.]
Kentucky Contact: Jadie Tomlinson, Transportation Engineering Branch Manager, Kentucky Transportation Cabinet,
[email protected], (502) 564-7183.
1. Total centerline miles of local roadways: 55,750
2. Number of DOT-managed short-term traffic count sites:
Portable volume sites: 1,835
3. Count frequency of DOT-managed short-term traffic count sites:
Portable volume sites: Every 10 years
4. Number of DOT-managed permanent/continuous traffic monitoring sites: None.
5. Collect, analyze and report on local roadway traffic data not required for federally mandated
reporting? No.
6. Factors used to estimate AADT:
Seasonal factors
We collect data from a random sampling of sites throughout the state and use that data to estimate the
AADT for other local roads.
7a. Collection practices differ in rural and urban areas? No.
7b. Collection practices differ for low population density versus higher densities? No.
8. Other agencies responsible for federally mandated traffic data: Outsourced to contractor/consultant.
8a. Other agency’s role in collecting, analyzing or reporting data: Consultant collects data. KYTC
analyzes and reports to FHWA.
9. Mandate for other agencies to collect federally required traffic data on local roads? [No response.]
10. Local agencies collecting data not required for federally mandated reporting? [No response.]
11. Accept data from other sources or data systems? No.
12. Formal data sharing procedures/agreements/contracts? N/A
13. Quality control procedures to validate incoming data? N/A
14. Uses for local road data: [No response.]
15. Challenges in collecting local road traffic data: Questions about whether or not the methodology used
produces accurate statewide data; lack of staff to collect data.
16. Data surrogates used? No.
17. Planned changes for local road traffic data collection efforts? No.
18. Staff contact information (if different from respondent): Same as respondent.
19. Details or comments: Here's a link to a report that addresses the development of a procedure for

Prepared by CTC & Associates LLC 67
collecting traffic count data on local roads in Kentucky:
http://www.ktc.uky.edu/files/2012/06/KTC_01_15_SPR213_00_1F.pdf [See page 9 of this report for
additional information about this report.]
Louisiana Contact: James C. Porter, Planning Support Engineer, Louisiana Department of Transportation and Development,
[email protected], (225) 242-4556.
1. Total centerline miles of local roadways: 50,000
2. Number of DOT-managed short-term traffic count sites:
Portable volume sites: 50,000
3. Count frequency of DOT-managed short-term traffic count sites:
Portable volume sites: 10 years (aperiodic)
4. Number of DOT-managed permanent/continuous traffic monitoring sites: None.
5. Collect, analyze and report on local roadway traffic data not required for federally mandated
reporting? No.
6. Factors used to estimate AADT: None for low-volume rural local roads. Day of week, month, axle
correction factors for high-volume urban arterials and collectors. (Local, collector and arterial refer here
to the functional system.)
7a. Collection practices differ in rural and urban areas? Yes. Urban arterials and collectors are monitored
for short-duration (48 hours) traffic volume on a 3-year cycle and day of week, month, and axle
correction factors are applied. Rural and urban locals are monitored for short-duration (48 hours) traffic
volume aperiodically on approximately a 10-year cycle and no factors are applied.
7b. Collection practices differ for low population density versus higher densities? No.
8. Other agencies responsible for federally mandated traffic data: Outsourced to contractor/consultant.
8a. Other agency’s role in collecting, analyzing or reporting data: The Louisiana DOTD collects
continuous traffic volume data, the short-duration (48 hours) volume at 3,700 sites, vehicle classification
at 1,300 sites and WIM at 100 sites over a 3-year period (state highways). A contractor provides short-
duration (48 hours) volume at 50,000 sites over 10-year period (local roads).
9. Mandate for other agencies to collect federally required traffic data on local roads? No.
10. Local agencies collecting data not required for federally mandated reporting? Yes. This data is
collected and used by the metropolitan planning organizations to develop traffic generation models.
11. Accept data from other sources or data systems? Yes. Short-duration traffic volumes, vehicle
classification and turning movement surveys by contract services. Managing and processing all traffic
data, computation and application of factors, and submission to FHWA by contract services.
12. Formal data sharing procedures/agreements/contracts? No.
13. Quality control procedures to validate incoming data? Yes. Provided by contract services software.
14. Uses for local road data: Statewide travel estimate.
15. Challenges in collecting local road traffic data: [No response.]
16. Data surrogates used? No.
17. Planned changes for local road traffic data collection efforts? No.
18. Staff contact information (if different from respondent): [No response.]
19. Details or comments: [No response.]

Prepared by CTC & Associates LLC 68
Nebraska Contact: Rick Ernstmeyer, Traffic Analysis Supervisor, Nebraska Department of Roads,
[email protected], (402) 479-4520.
1. Total centerline miles of local roadways: 83,655
2. Number of DOT-managed short-term traffic count sites:
Portable volume sites: Approximately 7000
Portable WIM sites: 90
3. Count frequency of DOT-managed short-term traffic count sites:
Portable volume sites: Approximately every 2 years
Portable WIM sites: One-third every year
4. Number of DOT-managed permanent/continuous traffic monitoring sites:
Volume only: 6
Volume and classification: 4
5. Collect, analyze and report on local roadway traffic data not required for federally mandated
reporting? No.
6. Factors used to estimate AADT:
Day of week factors
Month factors
Axle correction factors
7a. Collection practices differ in rural and urban areas? No.
7b. Collection practices differ for low population density versus higher densities? No.
8. Other agencies responsible for federally mandated traffic data: Municipal planning organization
(MPO) or rural planning organization (RPO).
8a. Other agency’s role in collecting, analyzing or reporting data: [No response.]
9. Mandate for other agencies to collect federally required traffic data on local roads? No.
10. Local agencies collecting data not required for federally mandated reporting? No.
11. Accept data from other sources or data systems? No.
12. Formal data sharing procedures/agreements/contracts? N/A
13. Quality control procedures to validate incoming data? N/A
14. Uses for local road data:
Traffic impact studies
Traffic safety
Transportation planning
New road design
Pavement management
Verify other traffic counts
Allocation of funding
15. Challenges in collecting local road traffic data:
Lack of staff to process data
Lack of equipment
Cost of data collection equipment (initial and maintenance costs)
Limited seasons to conduct counts

Prepared by CTC & Associates LLC 69
Safety concerns for staff setting up equipment
Safety concerns for the general public
16. Data surrogates used? No.
17. Planned changes for local road traffic data collection efforts? No.
18. Staff contact information (if different from respondent): [No response.]
19. Details or comments: [No response.]
Nevada Contact: Randy Travis, Traffic Information Chief, Nevada Department of Transportation, [email protected],
(775) 888-7158.
1. Total centerline miles of local roadways: 22,000
2. Number of DOT-managed short-term traffic count sites:
Portable volume sites: 2,800
Portable vehicle classification sites: 100
3. Count frequency of DOT-managed short-term traffic count sites:
Portable volume sites: Annually
Portable vehicle classification sites: Annually
4. Number of DOT-managed permanent/continuous traffic monitoring sites:
Volume only: 7
5. Collect, analyze and report on local roadway traffic data not required for federally mandated
reporting? No.
6. Factors used to estimate AADT:
Month factors
Seasonal factors
Axle correction factors
7a. Collection practices differ in rural and urban areas? No.
7b. Collection practices differ for low population density versus higher densities? No.
8. Other agencies responsible for federally mandated traffic data: Municipal planning organization
(MPO) or rural planning organization (RPO).
8a. Other agency’s role in collecting, analyzing or reporting data: The MPO collects very few counts.
They send all the data to us for processing.
9. Mandate for other agencies to collect federally required traffic data on local roads? No.
10. Local agencies collecting data not required for federally mandated reporting? No.
11. Accept data from other sources or data systems? No.
12. Formal data sharing procedures/agreements/contracts? N/A
13. Quality control procedures to validate incoming data? Yes. We process/validate their data for them
through TRADAS.
14. Uses for local road data:
Traffic impact studies
Traffic safety
Transportation planning
New road design

Prepared by CTC & Associates LLC 70
Verify other traffic counts
Allocation of funding
15. Challenges in collecting local road traffic data:
Lack of staff to process data
Lack of equipment
Cost of data collection equipment (initial and maintenance costs)
Damage/vandalism to equipment
Limited seasons to conduct counts
Lack of power source and/or communication equipment
16. Data surrogates used? No.
17. Planned changes for local road traffic data collection efforts? No.
18. Staff contact information (if different from respondent): [No response.]
19. Details or comments: [No response.]
New York Contact: Kurt Matias, Supervisor, Supervisor, Traffic Monitoring Section, New York State Department of
Transportation, [email protected], (518) 457-2815.
1. Total centerline miles of local roadways: 99,495 miles
2. Number of DOT-managed short-term traffic count sites:
Portable volume sites: 34,200
Portable vehicle classification sites: 1,048
3. Count frequency of DOT-managed short-term traffic count sites:
Portable volume sites: From our 2011 Traffic Count Processing Report: 5,680 (volume only)
Portable vehicle classification sites: 1,860 (volume and speed counts produced from class)
4. Number of DOT-managed permanent/continuous traffic monitoring sites:
Volume only: 3 (4 if you include volume and speed)
Volume and classification: 1
WIM: 1
Nonintrusive technologies: 2; both acoustic sensors
Other: 2; also acoustic sensors, counting trails for ATVs and snowmobiles
5. Collect, analyze and report on local roadway traffic data not required for federally mandated
reporting? No.
6. Factors used to estimate AADT:
Seasonal factors
Axle correction factors
We process AADT for local roads the same as we process all other counts.
7a. Collection practices differ in rural and urban areas? Yes. Traffic count contractors are given the
option to use nonintrusive count devices on high-volume/high-speed facilities.
7b. Collection practices differ for low population density versus higher densities? Yes. Traffic count
contractors are given the option to use nonintrusive count devices on high-volume/high-speed facilities.
8. Other agencies responsible for federally mandated traffic data:
Municipal planning organization (MPO) or rural planning organization (RPO)

Prepared by CTC & Associates LLC 71
Outsourced to contractor/consultant
Counties
Municipalities
8a. Other agency’s role in collecting, analyzing or reporting data:
1. MPOs hire contractors to collect traffic data. The MPOs then conduct their own quality control review
of the data, along with analyzing and reporting the data for their purposes. The same traffic counts are
provided to NYSDOT for QC review, analysis and reporting.
2. Contractors are hired by NYSDOT to collect traffic data. NYSDOT completes the data’s QC review,
analysis and reporting.
3. and 4. Counties and municipalities also collect traffic data on local roads (in addition to traffic counts
assigned by NYSDOT to the Department’s contractors). The counties conduct their own quality control
review of the data, along with analyzing and reporting the data for their purposes. The same traffic counts
are provided to NYSDOT for QC review, analysis and reporting. Counties are encouraged to maintain a
traffic count program through NYSDOT’s “County Counter Initiative.” Traffic counters and software is
lent to the counties in return for the counts being taken in NYSDOT’s format and the resulting traffic
counts being provided to the Department.
9. Mandate for other agencies to collect federally required traffic data on local roads? Yes. New York
City DOT has a traffic count program. Federal mandates not known. NYSDOT has been working with
NYCDOT for several years to establish a method for sharing NYCDOT’s off-state system street counts.
10. Local agencies collecting data not required for federally mandated reporting? No.
11. Accept data from other sources or data systems? No.
12. Formal data sharing procedures/agreements/contracts? N/A
13. Quality control procedures to validate incoming data? Yes. The traffic count quality control process is
completed by reviewing the traffic counts using an application designed specially for this purpose. The
application (Traffic Count Editor) contains FHWA and NYSDOT parameters, along with the reviewer’s
knowledge, to identify acceptable vs. unacceptable traffic counts.
14. Uses for local road data:
Traffic impact studies
Traffic safety
Transportation planning
New road design
Pavement management
Verify other traffic counts
Allocation of funding
15. Challenges in collecting local road traffic data:
Lack of staff to process data
The traffic count contractor’s primary assignment is to collect data on state and federal-aid roadways.
16. Data surrogates used? No.
17. Planned changes for local road traffic data collection efforts? Yes. An additional contractor(s) will be
hired for the purpose of completing traffic counts on the local-owned, non-federal aid roadways.
18. Staff contact information(if different from respondent): [No response.]
19. Details or comments: [No response.]

Prepared by CTC & Associates LLC 72
Oregon Contact: Don R. Crownover, Transportation Systems Monitoring Unit Team Leader, Oregon Department of
Transportation, [email protected], (503) 986-4132.
1. Total centerline miles of local roadways: 85,000
2. Number of DOT-managed short-term traffic count sites:
Portable volume sites: 1,500
Portable vehicle classification sites: 300
3. Count frequency of DOT-managed short-term traffic count sites:
Portable volume sites: Every 3 years
Portable vehicle classification sites: Every 3 years
Control sites: Continuous
4. Number of DOT-managed permanent/continuous traffic monitoring sites: None.
5. Collect, analyze and report on local roadway traffic data not required for federally mandated
reporting? Yes. Some project-related sites.
6. Factors used to estimate AADT:
Day of week factors
Month factors
Seasonal factors
Axle correction factors
Growth factors for off-year counts
7a. Collection practices differ in rural and urban areas? No.
7b. Collection practices differ for low population density versus higher densities? No.
8. Other agencies responsible for federally mandated traffic data:
Counties
Municipalities
8a. Other agency’s role in collecting, analyzing or reporting data: Other jurisdictions collect data. Only
ODOT applies factors.
9. Mandate for other agencies to collect federally required traffic data on local roads? No.
10. Local agencies collecting data not required for federally mandated reporting? Yes. Projects.
11. Accept data from other sources or data systems? Yes. Modeling efforts.
12. Formal data sharing procedures/agreements/contracts? No.
13. Quality control procedures to validate incoming data? No.
14. Uses for local road data:
Transportation planning
HPMS reporting
15. Challenges in collecting local road traffic data:
Lack of staff to process data
Poor data quality/accuracy
Data management and integration
16. Data surrogates used? No.
17. Planned changes for local road traffic data collection efforts? Yes. We are meeting with local MPOs
about data sharing.
Prepared by CTC & Associates LLC 73
18. Staff contact information (if different from respondent): Same as respondent.
19. Details or comments: [No response.]
Pennsylvania Contact: Jeremy M. Freeland, Transportation Planning Manager, Bureau of Planning and Research, Pennsylvania
Department of Transportation, [email protected], (717) 787-2939.
1. Total centerline miles of local roadways: 77,699
2. Number of DOT-managed short-term traffic count sites: We have 4,051 sites on local federal-aided
routes. Depending on the year they can be taken as a portable volume or portable vehicle classification
counts.
3. Count frequency of DOT-managed short-term traffic count sites:
Portable volume sites: Every 3 or 5 years depending on HPMS.
Portable vehicle classification sites: Every 3 or 5 years depending on HPMS.
4. Number of DOT-managed permanent/continuous traffic monitoring sites: None.
5. Collect, analyze and report on local roadway traffic data not required for federally mandated
reporting? Yes. We collect volume data on 7,200 locations throughout the state. We started this in 2009
with collecting all of the sites to create a baseline. Ever since then we have had those counts on a cycle.
6. Factors used to estimate AADT:
Day of week factors
Month factors
Seasonal factors
7a. Collection practices differ in rural and urban areas? Yes. We use lower classified urban and rural
factors with our urban and rural local counts (7,200 sites). The local federal-aid routes have their own
functional class that has factors associated with them.
7b. Collection practices differ for low population density versus higher densities? No.
8. Other agencies responsible for federally mandated traffic data:
Municipal planning organization (MPO) or rural planning organization (RPO)
Outsourced to contractor/consultant
Our local fed-aid routes are collected by MPOs, RPOs, contractors, districts and our own field staff.
8a. Other agency’s role in collecting, analyzing or reporting data: The only role agencies have is
collecting the data which is then sent to us. We then analyze and report the data.
9. Mandate for other agencies to collect federally required traffic data on local roads? No.
10. Local agencies collecting data not required for federally mandated reporting? Yes. I'm sure
municipalities collect data for their own purposes but we are not aware of any specific information they
may be collecting.
11. Accept data from other sources or data systems? No.
12. Formal data sharing procedures/agreements/contracts? N/A
13. Quality control procedures to validate incoming data? Yes. Local data goes through the same error
processes that our state-owned routes do. There are 3 error reports than validate the data; if data is
flagged, an analyst will manually review the data to determine if it's acceptable data.
14. Uses for local road data:
Pavement management
Allocation of funding

Prepared by CTC & Associates LLC 74
Note: Pavement management and funding allocation are the two that we know of.
15. Challenges in collecting local road traffic data:
Damage/vandalism to equipment
Safety concerns for staff setting up equipment
16. Data surrogates used? No.
17. Planned changes for local road traffic data collection efforts? Yes. Another bureau is currently
working on linking all of the local roads. When the project is complete we hope to have the ability to
expand our local road collection program.
18. Staff contact information (if different from respondent): [No response.]
19. Details or comments: [No response.]
Rhode Island Contact: Gary Bowen, Senior Civil Engineer, Rhode Island Department of Transportation, [email protected],
(401) 222-2694, ext. 4217.
1. Total centerline miles of local roadways: 5,234
2. Number of DOT-managed short-term traffic count sites:
Portable volume sites: Approximately 250
Portable vehicle classification sites: Approximately 250
3. Count frequency of DOT-managed short-term traffic count sites:
Portable volume sites: Every 3 years
Portable vehicle classification sites: Every 3 years
4. Number of DOT-managed permanent/continuous traffic monitoring sites: None.
5. Collect, analyze and report on local roadway traffic data not required for federally mandated
reporting? No.
6. Factors used to estimate AADT:
Day of week factors
Month factors
7a. Collection practices differ in rural and urban areas? No.
7b. Collection practices differ for low population density versus higher densities? No.
8. Other agencies responsible for federally mandated traffic data: Don’t know
8a. Other agency’s role in collecting, analyzing or reporting data: RIDOT is the only agency that collects
traffic data for federal purposes.
9. Mandate for other agencies to collect federally required traffic data on local roads? No.
10. Local agencies collecting data not required for federally mandated reporting? Yes. Individual cities
and towns may perform traffic volume or speed studies for zoning/planning types of issues. Currently,
this data is not shared with RIDOT.
11. Accept data from other sources or data systems? No.
12. Formal data sharing procedures/agreements/contracts? No.
13. Quality control procedures to validate incoming data? No.
14. Uses for local road data:
Transportation planning
Estimating VMT

Prepared by CTC & Associates LLC 75
15. Challenges in collecting local road traffic data:
Lack of staff to process data
Cost of data collection equipment (initial and maintenance costs)
Damage/vandalism to equipment
State-owned roads are generally higher volume and higher priority
16. Data surrogates used? No.
17. Planned changes for local road traffic data collection efforts? Yes. An effort will be made to enter and
report any local traffic data into a RIDOT-maintained GIS-compatible database. Currently, many traffic
counts/reports just fulfill their original purpose and sit on a shelf without being shared throughout
RIDOT.
18. Staff contact information (if different from respondent): [No response.]
19. Details or comments: [No response.]
South Carolina Contact: Angela Hance, Assistant Chief, Road Data Services, South Carolina Department of Transportation,
[email protected], (803) 737-1466.
1. Total centerline miles of local roadways: 24,549 centerline miles
2. Number of DOT-managed short-term traffic count sites:
Portable volume sites: 681
Portable vehicle classification sites: 136
3. Count frequency of DOT-managed short-term traffic count sites:
Portable volume sites: Annually; coverage counts
Portable vehicle classification sites: On the HPMS 4-year cycle
4. Number of DOT-managed permanent/continuous traffic monitoring sites: None.
5. Collect, analyze and report on local roadway traffic data not required for federally mandated
reporting? No.
6. Factors used to estimate AADT:
Seasonal factors
Axle correction factors
7a. Collection practices differ in rural and urban areas? No.
7b. Collection practices differ for low population density versus higher densities? No.
8. Other agencies responsible for federally mandated traffic data: Don’t know. The SCDOT reports
local road information by way of the HPMS to the FHWA in the yearly submittal.
8a. Other agency’s role in collecting, analyzing or reporting data: [No response.]
9. Mandate for other agencies to collect federally required traffic data on local roads? No.
10. Local agencies collecting data not required for federally mandated reporting? Yes. We are currently
developing and testing a new Web program, LADC, to have counties and cities provide SCDOT with
their local road information. The data will be QA/QC before entry into our databases. This data will be
added to our Roadway Information Management System (RIMS), HPMS, and GIS linework.
11. Accept data from other sources or data systems? Yes. We are currently developing and testing a new
Web program, LADC, to have counties and cities provide SCDOT with their local road information. The
data will be QA/QC before entry into our databases. This data will be added to our Roadway Information
Management System (RIMS), HPMS, and GIS linework.

Prepared by CTC & Associates LLC 76
12. Formal data sharing procedures/agreements/contracts? Yes. We are currently developing and testing
a new Web program, LADC, to have counties and cities provide SCDOT with their local road
information. The data will be QA/QC before entry into our databases. This data will be added to our
Roadway Information Management System (RIMS), HPMS, and GIS linework.
13. Quality control procedures to validate incoming data? Yes. We are currently developing and testing a
new Web program, LADC, to have counties and cities provide SCDOT with their local road information.
The data will be QA/QC before entry into our databases. This data will be added to our Roadway
Information Management System (RIMS), HPMS, and GIS linework.
14. Uses for local road data:
Traffic impact studies
Traffic safety
Transportation planning
Pavement management
May be other uses by the SCDOT that our section is not aware of.
15. Challenges in collecting local road traffic data: SCDOT has limited resources for collection of local
road data. Therefore, we are developing the LADC program to obtain local road data from the counties
and cities.
16. Data surrogates used? No.
17. Planned changes for local road traffic data collection efforts? Yes. SCDOT has limited resources for
collection of local road data. Therefore, we are developing the LADC program to obtain local road data
from the counties and cities.
18. Staff contact information (if different from respondent): [No response.]
19. Details or comments: [No response.]
Virginia Contact: Tom Schinkel, Traffic Monitoring System Program Manager, Virginia Department of Transportation,
[email protected], (804) 225-3123.
1. Total centerline miles of local roadways: About 10,000 non-state maintained locals. There are about
50,000 state-maintained local roads in Virginia. (Only two counties are responsible for local road
maintenance in Virginia.)
2. Number of DOT-managed short-term traffic count sites:
Portable volume sites: About 80,000 on the entire local system
Portable vehicle classification sites: None routinely collected; only special study needs.
3. Count frequency of DOT-managed short-term traffic count sites:
Portable volume sites: City locals and unpaved roads with a last count of 45 to 50 once every 3 years.
County locals with room for development every 6 years. Subdivision streets with no development space
every 12 years.
4. Number of DOT-managed permanent/continuous traffic monitoring sites:
Volume and classification: 1
5. Collect, analyze and report on local roadway traffic data not required for federally mandated
reporting? No.
6. Factors used to estimate AADT: [No response.]
7a. Collection practices differ in rural and urban areas? Yes. City-maintained streets are counted once
every 3 years. State-maintained streets (urban or rural) may be counted less frequently.

Prepared by CTC & Associates LLC 77
7b. Collection practices differ for low population density versus higher densities? Yes. As mentioned in
schedule response, fully developed local subdivision streets (maintained by state) are counted less
frequently than local roadways with development space.
8. Other agencies responsible for federally mandated traffic data: [No response.]
8a. Other agency’s role in collecting, analyzing or reporting data: Agency collects all federal reporting
data either with state forces or contract forces responsible to state.
9. Mandate for other agencies to collect federally required traffic data on local roads? No.
10. Local agencies collecting data not required for federally mandated reporting? No.
11. Accept data from other sources or data systems? Yes. The state collects the data it needs. However, if
other groups collect data and are willing to share (infrequent occurrence), the state will accept the data
into the database.
12. Formal data sharing procedures/agreements/contracts? No.
13. Quality control procedures to validate incoming data? Yes. Automated checks are conducted although
for local roads, the collector is relied upon heavily for quality control of their own data.
14. Uses for local road data:
Traffic impact studies
Traffic safety
Transportation planning
Pavement management
Verify other traffic counts
15. Challenges in collecting local road traffic data:
Lack of staff to process data
Cost of data collection equipment (initial and maintenance costs)
16. Data surrogates used? No.
17. Planned changes for local road traffic data collection efforts? No.
18. Staff contact information (if different from respondent): Same as respondent.
19. Details or comments: [No response.]