color architecture in alert macaque cortex revealed by fmri
TRANSCRIPT
Color Architecture in Alert Macaque CortexRevealed by fMRI
Bevil R. Conway1,2,3,* and Doris Y. Tsao1,3,*
1Department of Neurobiology, Harvard Medical School,
Boston, MA 02115, USA, 2Society of Fellows, Harvard
University, Cambridge, MA 02138, USA and 3Brain Research
Institute, Center for Advanced Imaging, University of Bremen,
D28334 Bremen, Germany
*Both authors contributed equally to this work.
The contribution that different brain areas make to primate colorvision, especially in the macaque, is debated. Here we usedfunctional magnetic resonance imaging in the alert macaque, givinga whole brain perspective of color processing in the healthy brain.We identified color-biased and luminance-biased activity and color-afterimage activity. Color-biased activity was found in V1, V2,and parts of V4 and not in V3a, MT, or other dorsal stream areas,in which a luminance bias predominated. Color-biased activityand color-afterimage activity were also found in a region on theposterior bank of the superior temporal sulcus. We review ana-tomical and physiological studies that describe this region, PITd,and postulate that it is distinct from areas V4 and TEO. When takentogether with single-unit studies and lesion studies, our resultssuggest that color depends on a connected ventral-stream pathwayinvolving at least V1, V2, V4, and PITd.
Introduction
Color vision begins in the retina with 3 classes of cones.
Specialized cone-opponent cells in the retinal ganglion layer
(Dacey 1996), the lateral geniculate nucleus (De Valois and
others 1966; Wiesel and Hubel 1966; Chatterjee and Callaway
2003), and the primary visual cortex (Michael 1978; Livingstone
and Hubel 1984; Conway 2001; Johnson and others 2001;
Wachtler and others 2001; Horwitz and others 2005) are
good candidates for the building blocks of color vision. These
specialized cells, particularly the double-opponent cells in V1,
are sufficient to account for color opponency and local color
contrast (Conway and others 2002; Hurlbert andWolf 2004) but
do not seem sufficient to account for other aspects of color
vision—for example, color categorization and color constancy
across a visual scene. Presumably other, subsequent steps in
color processing are necessary to bring about a rich and
complete color percept. It is unclear which extrastriate areas
are involved in this, particularly in the macaque monkey (Zeki
1996; Tootell and others 2004), a model for human vision. One
question centers on whether or not there is an extrastriate area
uniquely specialized for color processing.
Two extreme possibilities are these: 1) that specialized cells
within the primary and secondary visual cortex partially process
color information and then send these signals to a specialized
extrastriate area that is ultimately responsible for the experi-
ence of color (Zeki 1978b) and 2) that all visual areas carry out
all visual information processing (see Schiller 1997; Gegenfurtner
2003, for a review). Most current views are polarized toward,
though not at, these extremes. A strong piece of evidence
favoring an extrastriate ‘‘color area’’ is the observation that
stroke patients with particular circumscribed lesions acquire
achromatopsia (a deficit of color vision) yet retain motion and
depth perception (Meadows 1974; Damasio and others 1980;
Vaina 1994). Imaging studies of healthy human brains show
localization of extrastriate color responses to a region on the
ventral surface of the brain (Lueck and others 1989; Zeki and
others 1991; Hadjikhani and others 1998; Wade and others
2002).
In macaques, a model for human color vision, the popular
color area candidate is area V4. But despite early single-cell
recordings suggesting that area V4 is specialized for color
(Zeki 1973), subsequent studies found that V4 neurons were
often sensitive to other stimulus dimensions and were not
necessarily more color selective than neurons in other visual
areas (Schein and others 1982; Desimone and others 1985;
Tanaka and others 1986), although most neurons in V4 show
some wavelength sensitivity (Schein and Desimone 1990).
Macaques with V4 lesions do not show profound or specific
losses in color vision (Heywood and others 1992; Schiller
1993; Walsh and others 1993). This has been taken to sup-
port a distributed model of color processing (Schiller 1997;
Gegenfurtner 2003), although the relationship between ma-
caque V4 and the human color center is unclear (Zeki 1996;
Tootell and Hadjikhani 1998).
Alternatively, some have proposed that macaque areas
anterior to V4, on the inferior convexity of the temporal lobe
(IT cortex), are critical for color processing (Komatsu and
others 1992; Takechi and others 1997; Hadjikhani and others
1998; Tootell and others 2004) and may be macaque homologs
of the human color center. But there is no consensus on the
number, function, or boundaries of areas within the IT cortex.
Here we use the anatomical names adopted by Distler and
others (1993), in which the IT cortex includes areas TEO, TE,
and PITd (see Fig. 6). The boundaries of these areas are
provisional because knowledge about the function of this part
of the brain is incomplete.
Some have argued that areas TE/TEO, which are anterior to
V4, are the macaque color areas, based on anatomical homol-
ogies between human and macaque brains (Hadjikhani and
others 1998) and 2-deoxyglucose experiments (Tootell and
others 2004). Lesion studies suggest that these areas are pre-
dominantly concerned with object recognition (Ungerleider
and Mishkin 1982) and are concerned with color if color is em-
ployed in learning paradigms (Gross 1973). Single-unit studies
do not indicate a unique specialization for color in this swath
of cortex (Gross and others 1972; Fuster and Jervey 1982;
Desimone and others 1984), and discrete lesions of TE and TEO
fall short of producing behavioral achromatopsia (Cowey and
others 2001) or produce only a transient deficit of color (Dean
1979, but see Buckley and others 1997). Other studies, in-
cluding single-unit measurements (Fuster and Jervey 1982;
Komatsu and others 1992) and PET imaging (Takechi and
Cerebral Cortex November 2006;16:1604--1613
doi:10.1093/cercor/bhj099
Advance Access publication December 28, 2005
� The Author 2005. Published by Oxford University Press. All rights reserved.
For permissions, please e-mail: [email protected] from https://academic.oup.com/cercor/article-abstract/16/11/1604/319025by gueston 17 March 2018
others 1997) suggest that the IT cortex anterior to V4 but
posterior to TE/TEO, centered on PITd, is involved in color.
Thus, there is a discrepancy between lesion studies in
macaques, which suggest a distributed model of color vision,
and stroke studies in humans, which suggest a more localized
model. Similarly, single-unit studies in macaques, which sample
only a small fraction of neurons in the brain, are often in-
terpreted as support for a distributed model of color vision,
whereas imaging studies in humans, which give coarser re-
solution of the entire brain, support a more localized model
of color vision. Here we attempted to address these gaps by
using functional magnetic resonance imaging (fMRI) in the alert
macaque (Stefanacci and others 1998; Tsao and others 2003),
employing the same technique used to image the human color
area (Hadjikhani and others 1998; Bartels and Zeki 2000; Wade
and others 2002). Our results suggest that there is an anatomical
specialization for color that involves a connected network of
ventral-stream areas, best represented by a blend of the 2
extreme models.
Materials and Methods
Male rhesus macaques (2--3 kg) were trained to fixate a spot in the
center of a computer display and were scanned in a 3-T Allegra
(Siemens, New York, NY) scanner using procedures outlined in Tsao
and others (2003). Eye movements were monitored with a video-based
eye-tracking equipment (ISCAN, Burlington, MA). Data acquired when
the macaques were not fixating were not analyzed. Ultem (General
Electric Plastics) was used to make head posts which were implanted on
the macaques’ skulls; the animals were then trained to sit in a sphinx
position, with their heads fixed, inside a custom-built cylindrical plastic
chair that fit into the bore of the scanner, facing a plastic (Daplex)
screen. Two macaques were used in the first experiment (Figs 1 and 2,
Supplementary Figure 1), and 3 were used in the second experiment
(Figs 3 and 4, Supplementary Figure 2). All procedures conformed to
local and National Institutes of Health guidelines. Surgical details and the
other experimental procedures are described elsewhere (Tsao and
others 2003).
Visual StimuliVisual stimuli were displayed using a Sharp XG-NV6XU LCD pro-
jector (640 3 480 pixels, 60-Hz refresh rate) on a screen that was posi-
tioned 53 cm from the macaque. The stimulus covered the entire
screen, 28 3 21�. All stimuli were presented in block design. For the
colored stimuli, we used only the red and blue dichroic filters of the LCD
monitor to allow comparison with earlier data, obtained using similar
stimuli (Hadjikhani and others 1998; Tootell and others 2004).
Vertically oriented sine wave gratings (0.29 cycles/degree; 1 cycle/s)
that moved back and forth, switching directions every 4 s, were used to
determine the red:blue luminance ratio that elicited a minimum re-
sponse in area MT (see Fig. 1). The stimulus sequence consisted of 16 s
of black--white gratings (99% contrast) followed by 16 s of uniform
neutral gray, matched in mean luminance to the achromatic grating,
then 16 s of red--blue gratings followed by 16 s of neutral gray, and so
on for a total of 8 presentations of black--white and 8 intervening
colored gratings. The red--blue gratings were made by superimposing
a blue--black grating, sin(x), with a red--black grating, (r/b) 3 [1 – sin(x)],
where r = peak luminance of red dichroic filter, b = peak luminance of
blue dichroic filter. The amplitude of the blue grating was constant
throughout the experiment (peak 44 cd/m2), but the amplitude of
the red was systematically increased from a red:blue ratio of 1:1 (peak
44 cd/m2) in the first colored grating of the sequence to a ratio of 3 in
the eighth colored grating.
The peak red and blue of the macaque equiluminant stimulus (ratio
red:blue of 2.3) had L-cone contrast of 34%, M-cone contrast of 9%, and
S-cone contrast of 84%. Cone contrasts were determined by taking the
dot product of the spectral emission (measured with a SpectraScan
PR650, Photo Research, Chatsworth, CA) and the 2� cone fundamentals
(Stockman and Sharpe 2000). For example, Lcone contrast = [(Lr – Lb)/(Lr +
Lb)] 3 100%, where Lr is the L-cone activity elicited by the peak red of
the equiluminant stimulus and Lb is the L-cone activity elicited by the
peak of the blue in the equiluminant stimulus. The achromatic grating
had a high luminance contrast (99%), resulting in a much higher cone
contrast than the colored gratings. We designed the experiment this
way because it made the criteria for a color-biased area stringent
(response to equiluminant color > response to black and white).
Although chromatic aberration might affect our results (Cottaris
2003), it would only obscure the minimum response in MT to moving
equiluminant stimuli (Mullen and others 2003).
To measure the afterimage responses (see Figs 3 and 4), the macaques
were shown a sequence consisting of 4 frames: first, a static display of
equiluminant blue and red squares; second, a static gray during which
most people report a vivid color afterimage; third, a flickering color
display in which the red of each frame was replaced by blue and the blue
was replaced by red (2 Hz); and fourth, another static gray during which
people do not report an afterimage. Each frame was 16 s.
Data ProcessingIn total, we obtained 126,752 functional volumes during 33 scan
sessions in the 3 macaques. Each experiment consisted of 20--60 func-
tional scans, each lasting 4 min 32 s (echo planar imaging, repetition
time (TR) = 2 s, echo time (TE) = 30 ms, 64 3 64 matrix, 1.25-mm3
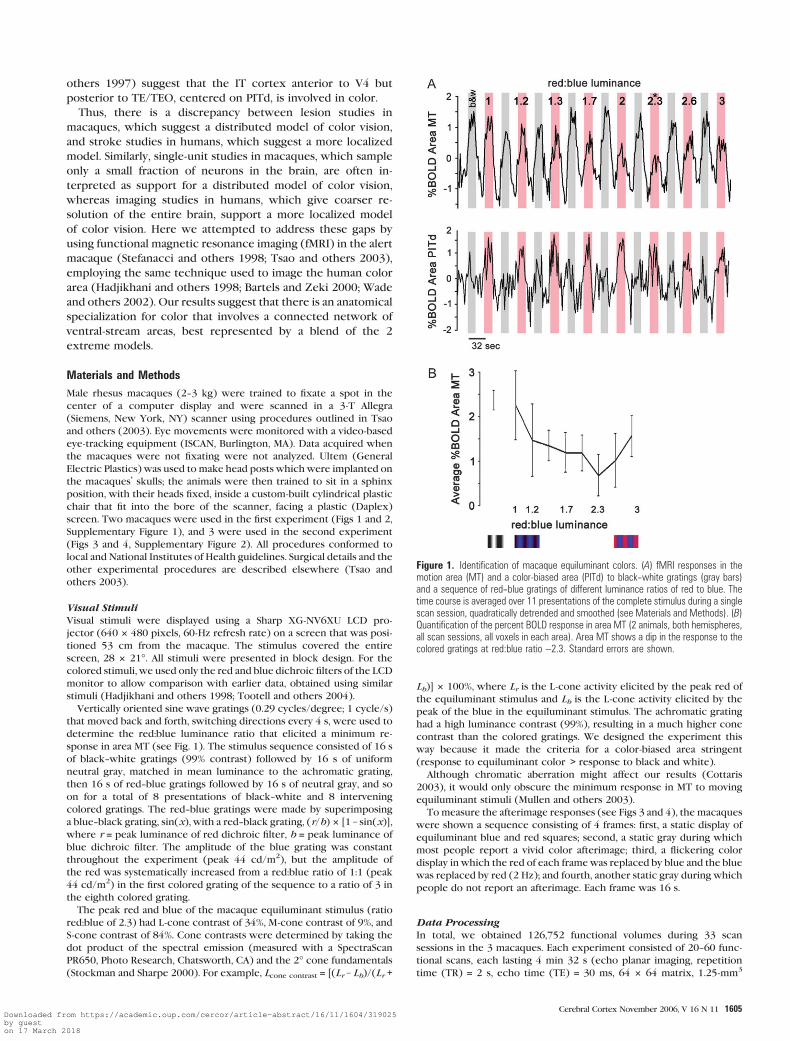
Figure 1. Identification of macaque equiluminant colors. (A) fMRI responses in themotion area (MT) and a color-biased area (PITd) to black--white gratings (gray bars)and a sequence of red--blue gratings of different luminance ratios of red to blue. Thetime course is averaged over 11 presentations of the complete stimulus during a singlescan session, quadratically detrended and smoothed (see Materials and Methods). (B)Quantification of the percent BOLD response in area MT (2 animals, both hemispheres,all scan sessions, all voxels in each area). Area MT shows a dip in the response to thecolored gratings at red:blue ratio ~2.3. Standard errors are shown.
Cerebral Cortex November 2006, V 16 N 11 1605Downloaded from https://academic.oup.com/cercor/article-abstract/16/11/1604/319025by gueston 17 March 2018
voxels, 30 coronal slices). Slices were positioned to cover the occipital
and temporal lobes, between AP coordinates –25 to +12. In an additional
series of scans of the anesthetized animals, high-resolution anatomy was
obtained with 1-mm3 voxels. These anatomical scans were used in
conjunction with macaque atlases (Paxinos and others 2000; Unger-
leider 2000) to define stereotaxic area borders.
Data were analyzed using FS-FAST and Freesurfer (http://surfer.
nmr.mgh.harvard.edu/) as well as custom code written in Matlab.
Data were motion corrected (Cox and Hyde 1997), quadratically
detrended, and smoothed with a Gaussian kernel of 2 mm full width
at half maximum. Data from several scan sessions were averaged to
improve signal to noise, except that shown in Figure 1A, which
is quadratically detrended and smoothed data from a single scan ses-
sion. To generate significance maps, we calculated the mean and
variance of the response in each voxel to each condition across the
entire scan session. Then t-tests for appropriate comparisons were per-
formed. Artifacts within the sagittal sinus and outside the cortex were
masked and time courses were accommodated for hemodynamic delay.
To identify color-biased areas, percent blood oxygen level dependent
(BOLD) responses were determined as a ratio of the responses to the
uniform gray, for all visually active voxels within each area (see Fig. 2).
%BOLD = [(response to stimulus) – (response to gray)]/[mean response
throughout scan session]. A voxel was considered visually responsive if
it showed activation at P < 10–2 to any given stimulus (color or
achromatic grating) compared with the activation during a blank gray
screen. Bar graphs indicate the responses of visually responsive voxels
within a given area.
For the afterimage experiments, the responses were averaged across
10 scan sessions in 3 animals. Responses were normalized to remove
systematic variations between brain areas introduced by placement of
the coil: [(afterimage following static) – (afterimage following flicker)]/
[(response to static) + (response to flicker)]. Time courses shown in
Figure 4 are the average of 492 stimulus repeats (1 stimulus sequence =gray, flicker, gray, static), in 3 animals, 6 hemispheres.
Results
Our goal was to identify brain regions that are involved in color
processing in the alert macaque. Using a strategy similar to that
used to study color in human subjects (Lueck and others 1989;
Hadjikhani and others 1998; Wade and others 2002), we com-
pared the fMRI signals elicited by chromatic stimuli, having high
color contrast, with the signals elicited by achromatic stimuli,
having high luminance contrast. We first had to identify a pure
color stimulus—one that contains color contrast but no lumi-
nance contrast. The relative luminance at which 2 colors appear
‘‘equiluminant’’ is different across individuals (Livingstone and
Hubel 1987) and species (Dobkins and others 2000). In order to
identify equiluminant colors for the animals we used, we made
the assumption that area MT, which is specialized to process
moving stimuli, responds less strongly to moving colors if the
colors are equiluminant (Dobkins and others 2000). We pre-
sented macaques with a series of colored gratings using a range
of luminance ratios of the 2 colors comprising the grating. We
used red--blue gratings (Tootell and others 2004) and examined
the fMRI activity in the motion area, MT, for the red:blue
luminance ratio that produced minimum activity. A total of
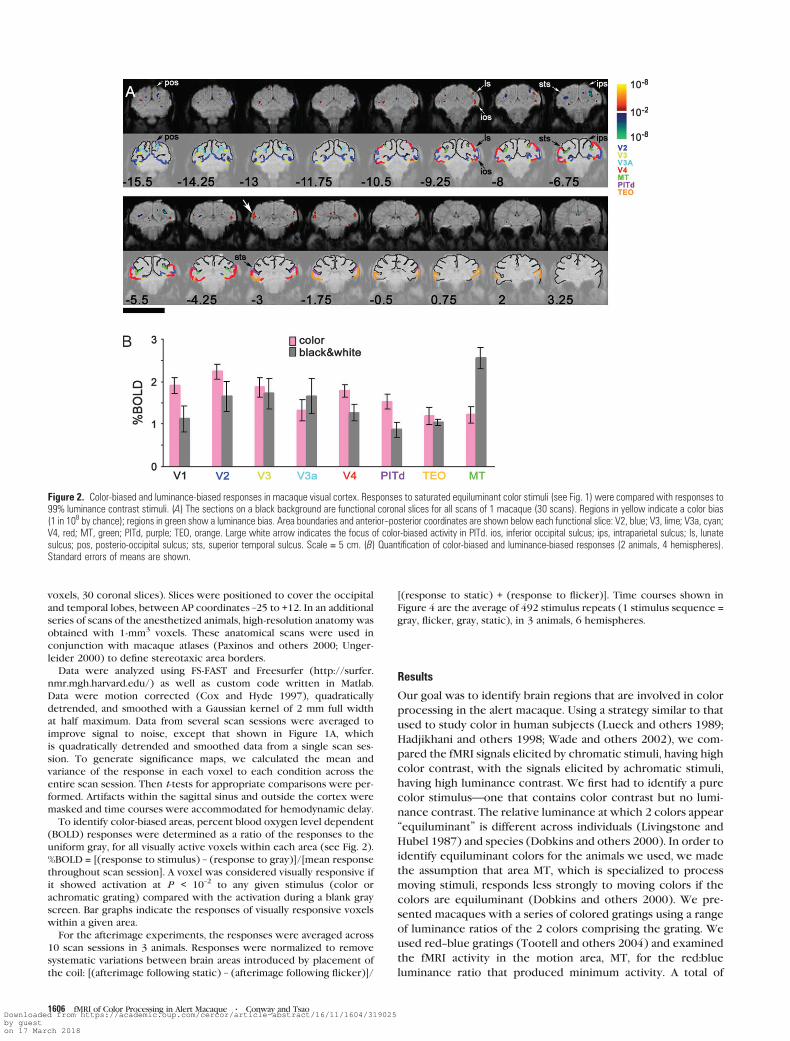
Figure 2. Color-biased and luminance-biased responses in macaque visual cortex. Responses to saturated equiluminant color stimuli (see Fig. 1) were compared with responses to99% luminance contrast stimuli. (A) The sections on a black background are functional coronal slices for all scans of 1 macaque (30 scans). Regions in yellow indicate a color bias(1 in 108 by chance); regions in green show a luminance bias. Area boundaries and anterior--posterior coordinates are shown below each functional slice: V2, blue; V3, lime; V3a, cyan;V4, red; MT, green; PITd, purple; TEO, orange. Large white arrow indicates the focus of color-biased activity in PITd. ios, inferior occipital sulcus; ips, intraparietal sulcus; ls, lunatesulcus; pos, posterio-occipital sulcus; sts, superior temporal sulcus. Scale = 5 cm. (B) Quantification of color-biased and luminance-biased responses (2 animals, 4 hemispheres).Standard errors of means are shown.
1606 fMRI of Color Processing in Alert Macaque d Conway and TsaoDownloaded from https://academic.oup.com/cercor/article-abstract/16/11/1604/319025by gueston 17 March 2018
8 colored stimuli, which varied in red:blue luminance ratios
from 1 to 3 (Fig. 1), were used.
The gray bars in Figure 1A indicate the response (%BOLD
change) during the control stimulus, a moving achromatic
grating. The leftmost pink bar is the response to a moving
red--blue grating; the red was matched in luminance to the blue,
according to human equiluminance criteria (spectrophotome-
ter: PR650 SpectraScan, Photo Research). MT showed a strong
response to this colored stimulus and to the achromatic
stimulus (Fig. 1A, top panel). The response to the colored
gratings got progressively weaker as the ratio of red:blue
increased, until a point around ratio 2.3, where further increases
in red:blue ratio increased the response. Unlike in MT, the
response time course in an extrastriate color-biased area, area
PITd (see below), showed stronger activity to the colored
gratings (Fig. 1A, bottom panel). There was no significant
difference between the 2 macaques tested; a titration curve
obtained by pooling responses in MT across 4 scan sessions from
both macaques (Fig. 1B) shows that the macaques had an
equiluminance ratio of red:blue of ~2.3. This is consistent with
the finding that macaques are less sensitive to red or more
sensitive to blue than the average human (Dobkins and others
2000; Tootell and others 2004).
We next compared the responses with the equiluminant
stimuli with the responses to the achromatic stimuli across
different visual areas. Color-biased responses (P < 10–2), shown
in red--yellow, and luminance-biased responses (P < 10–2),
shown in blue--green, are projected on coronal functional
slices (Fig. 2A); the results from both animals tested were
quantified as bar graphs (Fig. 2B). The activity maps in Figure 2A
were determined by comparing the responses to equiluminant
color with responses to black and white; the quantified maps in
Figure 2B show the responses to these different stimuli as
separate bar graphs. An atlas of area borders is shown alongside
the activity maps. The atlas was derived from Paxinos and others
(2000) and Ungerleider (2000): slices from this atlas were
registered to high-resolution anatomical volumes for each
macaque. The outlines of the area borders and the high-
resolution anatomical slices are shown below the functional
scans (Fig. 2A). Note that each area’s color in the atlas is
arbitrary and is independent of the activation scale bar shown in
the functional slices.
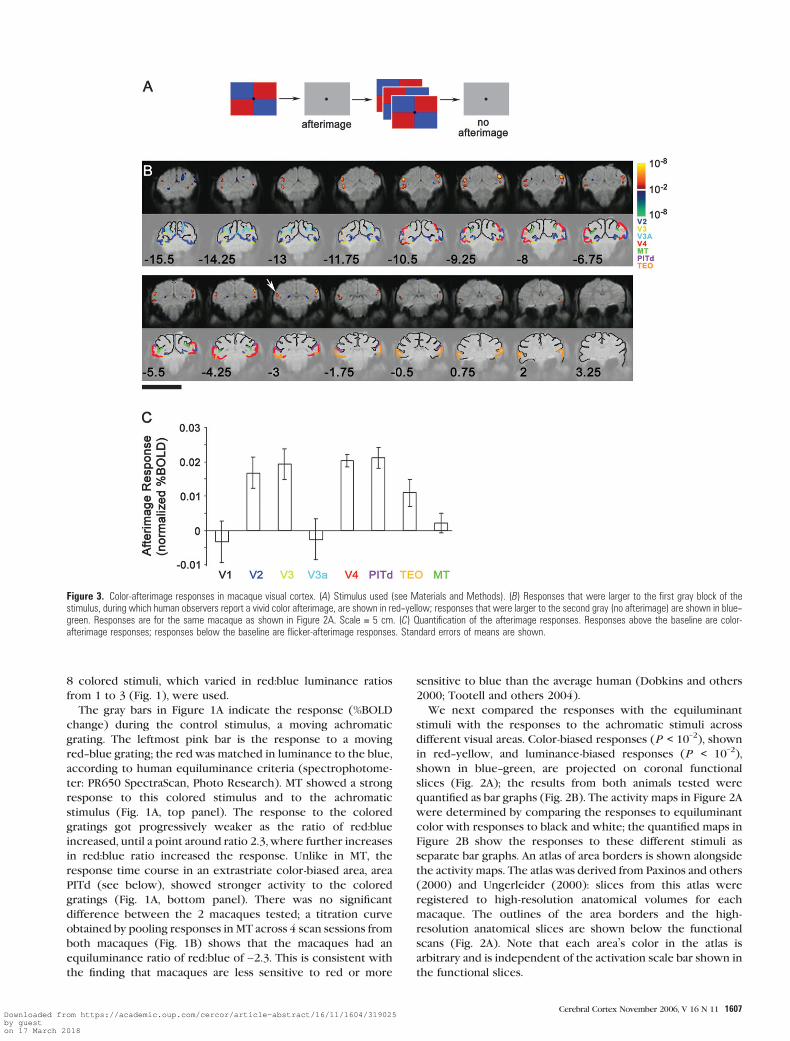
Figure 3. Color-afterimage responses in macaque visual cortex. (A) Stimulus used (see Materials and Methods). (B) Responses that were larger to the first gray block of thestimulus, during which human observers report a vivid color afterimage, are shown in red--yellow; responses that were larger to the second gray (no afterimage) are shown in blue--green. Responses are for the same macaque as shown in Figure 2A. Scale = 5 cm. (C) Quantification of the afterimage responses. Responses above the baseline are color-afterimage responses; responses below the baseline are flicker-afterimage responses. Standard errors of means are shown.
Cerebral Cortex November 2006, V 16 N 11 1607Downloaded from https://academic.oup.com/cercor/article-abstract/16/11/1604/319025by gueston 17 March 2018
We used stereotaxic coordinates to define different brain
regions because many extrastriate areas, such as TEO, TE,
and PITd are not well defined by retinotopic or other (e.g.,
functional) criteria. Indeed, characterizing the functional
activity of this region was one goal of the present paper.
Presenting the data on functional coronal slices using stereo-
taxic coordinates facilitates comparison with electrophysiolog-
ical results and provides a useful guide for future single-cell
recordings.
At a glance, one can see pronounced luminance-biased
activity at the base of the superior temporal sulcus, in area MT
(the prominent blue--green spot in each hemisphere of slices –8
to –5.5, Fig. 2). On closer examination, one can also see
luminance-biased activity in another dorsal area, at the base of
the intraparietal sulcus, area VIP (slice –6.75). The color-biased
activity, on the other hand, was present throughout the early
retinotopic areas V1 and V2 (Fig. 2B) and in 2 discrete patches
of V4, a dorsal patch in the anterior bank of the lunate sulcus
and a ventral patch in the inferior occipital sulcus (slices –9.25
to –6.75, Fig. 2A; see also Supplementary Figure 1).
A patch of color-biased activity was also found in a region on
the posterior bank of the superior temporal sulcus, in sections
just anterior to those containing area MT and V4 (large white
arrow, Fig. 2A). The color bias of this region is reflected in the
time course of the fMRI response (Fig. 1A, bottom panel). This
anterior focus of color activity coincides with area PITd (Van
Essen and others 1990; Felleman and Van Essen 1991; Distler
and others 1993).
Visual aftereffects allow one to measure a perceptual re-
sponse in the absence of a physical stimulus and have been used
to study color responses in the human cortex (Hadjikhani and
others 1998). We took advantage of this to explore color
processing in macaques by measuring responses that coincide
with color afterimages. We used a sequential stimulus consist-
ing of 4 parts—static colored pattern, gray, flickering colored
pattern, and then gray again (Fig. 3A). An afterimage is observed
during the first gray part but not during the physically identical
second gray part. We compared the responses during these 2
gray blocks to determine the response during the afterimage
(Fig. 3B).
We consistently obtained color-afterimage responses distrib-
uted across extrastriate areas V2, V3, V4, and PITd in a manner
consistent with the color-biased regions identified in our first
experiment (compare Fig. 3B with Fig. 2B). We quantified this
percent BOLD fMRI signal across the 3 animals tested (Fig. 3C).
MT and V3a showed no color-induced afterimage response.
Interestingly, V1 also did not show a color-afterimage response
even though it showed a color bias in our first experiment
(Fig. 2B). In contrast, regions within both the upper and lower
divisions of extrastriate areas V2, V3, V4, and PITd showed
significant afterimage responses (Figs 3C and 4), suggesting that
all these areas could be participating in the experience of color
afterimages. TEO also showed a weak color-afterimage response
(slices 0.75 and 2, Fig. 3B), although this was not always seen in
the other animals tested (Supplementary Figure 2).
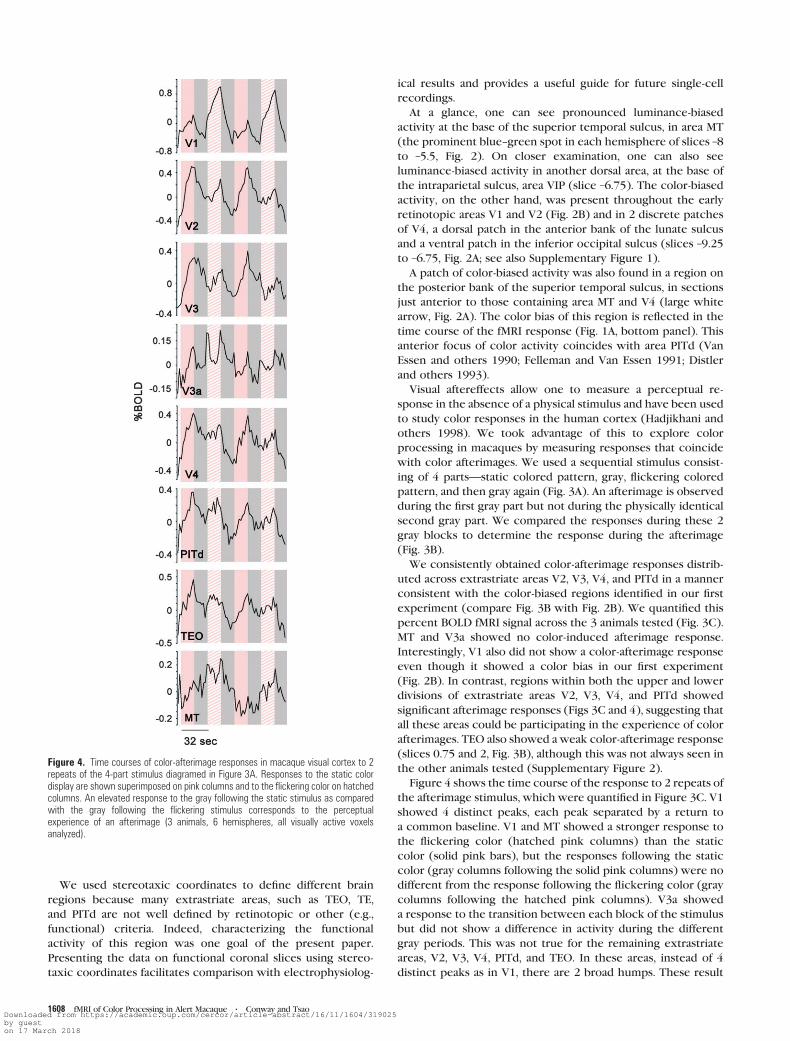
Figure 4 shows the time course of the response to 2 repeats of
the afterimage stimulus, which were quantified in Figure 3C. V1
showed 4 distinct peaks, each peak separated by a return to
a common baseline. V1 and MT showed a stronger response to
the flickering color (hatched pink columns) than the static
color (solid pink bars), but the responses following the static
color (gray columns following the solid pink columns) were no
different from the response following the flickering color (gray
columns following the hatched pink columns). V3a showed
a response to the transition between each block of the stimulus
but did not show a difference in activity during the different
gray periods. This was not true for the remaining extrastriate
areas, V2, V3, V4, PITd, and TEO. In these areas, instead of 4
distinct peaks as in V1, there are 2 broad humps. These result
Figure 4. Time courses of color-afterimage responses in macaque visual cortex to 2repeats of the 4-part stimulus diagramed in Figure 3A. Responses to the static colordisplay are shown superimposed on pink columns and to the flickering color on hatchedcolumns. An elevated response to the gray following the static stimulus as comparedwith the gray following the flickering stimulus corresponds to the perceptualexperience of an afterimage (3 animals, 6 hemispheres, all visually active voxelsanalyzed).
1608 fMRI of Color Processing in Alert Macaque d Conway and TsaoDownloaded from https://academic.oup.com/cercor/article-abstract/16/11/1604/319025by gueston 17 March 2018

because of the elevated activity during the gray following the
static field, which coincides with the perception of color
afterimages.
Discussion
Color Areas
The history of color vision research is rich in passionate debates,
which continue today with the contentious issue of extrastriate
color areas—do they exist? And what, in fact, is meant by a color
area? There is some consensus that early visual areas—primary
visual cortex (Conway 2001; Johnson and others 2001; Wach-
tler and others 2003; Hurlbert and Wolf 2004; Horwitz and
others 2005), V2 (Hubel and Livingstone 1987; Kiper and others
1997; Xiao and others 2003), and perhaps V3 (Burkhalter and
Van Essen 1986; Gegenfurtner and others 1997; but see Zeki
1978a)—contribute to color vision. Our fMRI results support
this. But the existence of a single cortical area wholly special-
ized for color that is responsible for integrating the activity of
early visual areas is controversial. Pioneering single-cell physi-
ology suggested a ‘‘color center’’ in macaque (Zeki 1973, 1977,
1983b). Zeki (1977) advanced the notion of ‘‘a division of labor
within the prestriate visual cortex’’ based on anatomical, con-
nectional, and physiological criteria (Zeki 1978b), declaring V4
a color center primarily because ‘‘in every case [the 77 single
units] in this area have been color coded, responding vigorously
to one wavelength and grudgingly, or not at all, to other
wavelengths or to white light at different intensities’’ (Zeki
1973). But subsequent studies challenged the notion of V4 as
a specialized color area for several reasons. First, other areas also
contain color-responsive cells, perhaps in the same numbers as
are found in V4 (Gegenfurtner and others 1997; Gegenfurtner
2003); second, V4 contains neurons that respond along other
stimulus dimensions (Schein and others 1982; Desimone and
others 1985; Tanaka and others 1986); and third, lesions of V4
do not result in profound deficits of color vision (Heywood and
others 1992; Schiller 1993; Walsh and others 1993; Cowey and
others 2001).
But these studies do not preclude V4 from playing an
important role in color. The high concentrations of color cells
that Zeki (1983b) found in V4 were localized to discrete
columns in the anterior bank of the lunate sulcus. Most studies
of V4 center on the adjacent chunk of cortex, on the surface of
the prelunate gyrus. There is consensus that this more acces-
sible region of V4 contains only ~20% strongly color-specific
cells (Zeki 1983b; Tanaka and others 1986). Thus, instead of V4
being entirely color biased, it seems that V4 contains specialized
subregions of the color cortex (Fig. 5, from Zeki 1983b), an idea
that is supported not only by electrophysiological evidence
(Zeki 1977, 1983b) but also by connectional data (Shipp and
Zeki 1995; Felleman and others 1997), 2-deoxyglucose studies
(Tootell and others 2004), and functional imaging data
shown here.
Is PITd a Color-Biased Area, Distinct from V4 and TEO?
Is there a distinct area anterior to V4 that is important in
processing color? Zeki’s single-unit recordings show a second
clump of color cells in the posterior bank of the superior
temporal sulcus (Fig. 5), a region he described as distinct from
V4 (Zeki 1977), but which he grouped with V4 as the V4
complex of areas. Functional imaging confirmed that this
region is color biased (large white arrow, Fig. 2A); moreover,
electrophysiological studies since Zeki’s show that many
neurons in this region are tuned to specific hues (Komatsu
and others 1992). But whether neurons in this region are
exclusively color tuned or tuned to other stimulus dimensions
as well will have to await targeted single-unit recordings and
adaptation experiments (e.g., Engel 2005). Moreover, establish-
ing a causal role for this region in conscious color perception
will have to await studies of macaques in which this area has
been functionally identified and then selectively stimulated or
removed.
In the meantime, is this region distinct from area V4 and area
TEO? Many terms have been used to describe this region,
including PITd (Distler and others 1993), V4A (Shipp and Zeki
1995; Zeki 1996), and DLr (Stepniewska and others 2005). The
term V4A has also been used to describe the region of V4 on
the surface of the prelunate gyrus that is not overwhelmingly
sensitive to color (Zeki 1983b, 1996; Pigarev and others 2002).
To avoid ambiguity, we use the anatomical term PITd, which is
consistently used to describe the region of the cortex on the
posterior bank of the superior temporal sulcus (Van Essen and
others 1990, 2001; Felleman and Van Essen 1991; Distler and
others 1993).
Figure 5. Area V4 is not homogenous and contains color-rich regions (from figure 8, Zeki 1983b). (A) The positions of electrode penetrations in horizontal sections of macaque brainin which a high percentage (84%) of wavelength-selective cells was found. The posterior cluster is located in the anterior wall of the lunate sulcus, in area V4. The 3 anteriorpenetrations, in the superior temporal sulcus, are located in the region we refer to as PITd. (B) The penetrations in which a low percentage (19%) of wavelength-selective cells wasfound. These penetrations are on the prelunate gyrus portion of V4.
Cerebral Cortex November 2006, V 16 N 11 1609Downloaded from https://academic.oup.com/cercor/article-abstract/16/11/1604/319025by gueston 17 March 2018
Zeki (1978b) described the region encompassing V4 and
PITd as a single complex because he found that both PITd and
portions of V4 were sensitive to color. But he intimated that
these regions could be distinguished as distinct areas; cumula-
tive evidence suggests this is so: topographic mapping reveals
a distinct area coinciding with PITd (Gattass and others 1988;
Pigarev and others 2002; Stepniewska and others 2005), con-
taining its own crude representation of the upper and lower
visual fields (Boussaoud and others 1991; Fize and others 2003)
along with its own callosal projection (Zeki 1977).
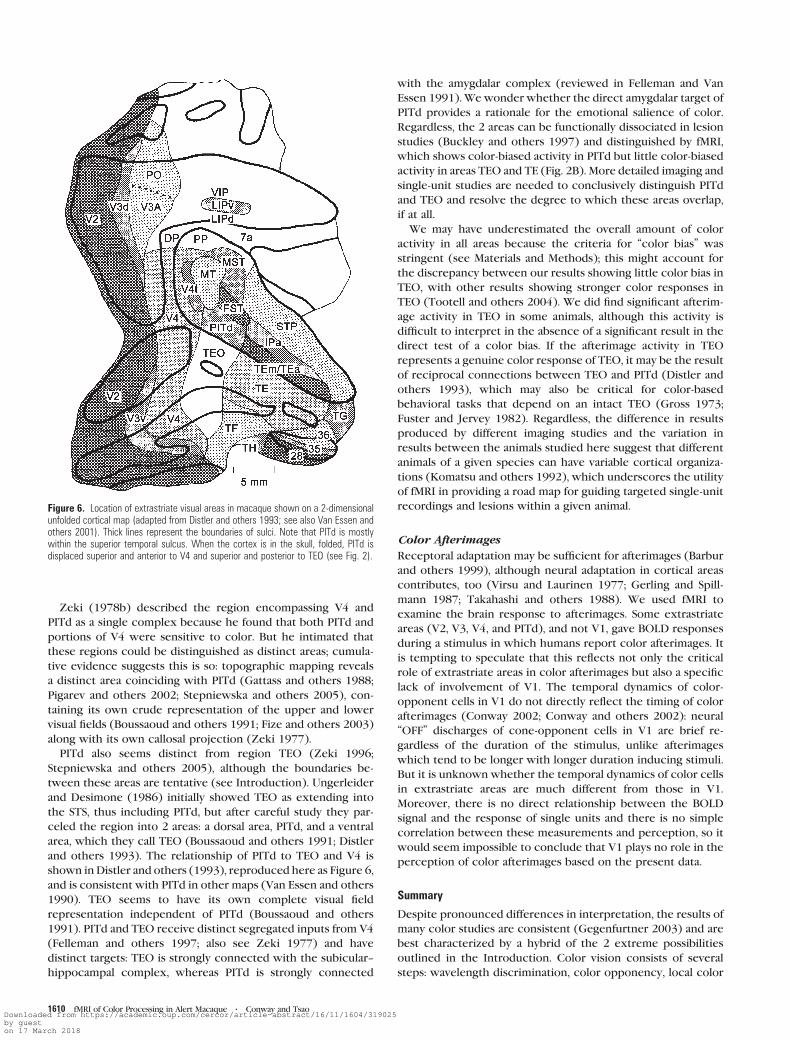
PITd also seems distinct from region TEO (Zeki 1996;
Stepniewska and others 2005), although the boundaries be-
tween these areas are tentative (see Introduction). Ungerleider
and Desimone (1986) initially showed TEO as extending into
the STS, thus including PITd, but after careful study they par-
celed the region into 2 areas: a dorsal area, PITd, and a ventral
area, which they call TEO (Boussaoud and others 1991; Distler
and others 1993). The relationship of PITd to TEO and V4 is
shown in Distler and others (1993), reproduced here as Figure 6,
and is consistent with PITd in other maps (Van Essen and others
1990). TEO seems to have its own complete visual field
representation independent of PITd (Boussaoud and others
1991). PITd and TEO receive distinct segregated inputs from V4
(Felleman and others 1997; also see Zeki 1977) and have
distinct targets: TEO is strongly connected with the subicular--
hippocampal complex, whereas PITd is strongly connected
with the amygdalar complex (reviewed in Felleman and Van
Essen 1991). We wonder whether the direct amygdalar target of
PITd provides a rationale for the emotional salience of color.
Regardless, the 2 areas can be functionally dissociated in lesion
studies (Buckley and others 1997) and distinguished by fMRI,
which shows color-biased activity in PITd but little color-biased
activity in areas TEO and TE (Fig. 2B). More detailed imaging and
single-unit studies are needed to conclusively distinguish PITd
and TEO and resolve the degree to which these areas overlap,
if at all.
We may have underestimated the overall amount of color
activity in all areas because the criteria for ‘‘color bias’’ was
stringent (see Materials and Methods); this might account for
the discrepancy between our results showing little color bias in
TEO, with other results showing stronger color responses in
TEO (Tootell and others 2004). We did find significant afterim-
age activity in TEO in some animals, although this activity is
difficult to interpret in the absence of a significant result in the
direct test of a color bias. If the afterimage activity in TEO
represents a genuine color response of TEO, it may be the result
of reciprocal connections between TEO and PITd (Distler and
others 1993), which may also be critical for color-based
behavioral tasks that depend on an intact TEO (Gross 1973;
Fuster and Jervey 1982). Regardless, the difference in results
produced by different imaging studies and the variation in
results between the animals studied here suggest that different
animals of a given species can have variable cortical organiza-
tions (Komatsu and others 1992), which underscores the utility
of fMRI in providing a road map for guiding targeted single-unit
recordings and lesions within a given animal.
Color Afterimages
Receptoral adaptation may be sufficient for afterimages (Barbur
and others 1999), although neural adaptation in cortical areas
contributes, too (Virsu and Laurinen 1977; Gerling and Spill-
mann 1987; Takahashi and others 1988). We used fMRI to
examine the brain response to afterimages. Some extrastriate
areas (V2, V3, V4, and PITd), and not V1, gave BOLD responses
during a stimulus in which humans report color afterimages. It
is tempting to speculate that this reflects not only the critical
role of extrastriate areas in color afterimages but also a specific
lack of involvement of V1. The temporal dynamics of color-
opponent cells in V1 do not directly reflect the timing of color
afterimages (Conway 2002; Conway and others 2002): neural
‘‘OFF’’ discharges of cone-opponent cells in V1 are brief re-
gardless of the duration of the stimulus, unlike afterimages
which tend to be longer with longer duration inducing stimuli.
But it is unknown whether the temporal dynamics of color cells
in extrastriate areas are much different from those in V1.
Moreover, there is no direct relationship between the BOLD
signal and the response of single units and there is no simple
correlation between these measurements and perception, so it
would seem impossible to conclude that V1 plays no role in the
perception of color afterimages based on the present data.
Summary
Despite pronounced differences in interpretation, the results of
many color studies are consistent (Gegenfurtner 2003) and are
best characterized by a hybrid of the 2 extreme possibilities
outlined in the Introduction. Color vision consists of several
steps: wavelength discrimination, color opponency, local color
Figure 6. Location of extrastriate visual areas in macaque shown on a 2-dimensionalunfolded cortical map (adapted from Distler and others 1993; see also Van Essen andothers 2001). Thick lines represent the boundaries of sulci. Note that PITd is mostlywithin the superior temporal sulcus. When the cortex is in the skull, folded, PITd isdisplaced superior and anterior to V4 and superior and posterior to TEO (see Fig. 2).
1610 fMRI of Color Processing in Alert Macaque d Conway and TsaoDownloaded from https://academic.oup.com/cercor/article-abstract/16/11/1604/319025by gueston 17 March 2018

contrast, hue, global color constancy, and the experience of
color. These different stages are probably accomplished at
different stages of the visual system (Zeki and Marini 1998;
Conway 2003). Wavelength discrimination begins with the 3
classes of cones; cone opponency with specialized retinal
ganglion cells, relayed to parvocellular and koniocellular neu-
rons of the lateral geniculate nucleus (De Valois and others
1958; Wiesel and Hubel 1966; Martin and others 1997); local
color contrast with the double-opponent cells (Conway 2001;
Conway and others 2002) in the blobs of primary visual cortex
(Livingstone and Hubel 1984; Tootell and others 1988; Landisman
and Ts’o 2002; but see Lennie and others 1990; Leventhal and
others 1995); hue with the thin stripes in V2 (DeYoe and Van
Essen 1985; Hubel and Livingstone 1985; Tootell and Hamilton
1989; Roe and Ts’o 1999; Moutoussis and Zeki 2002; Xiao and
others 2003; but see Levitt and others 1994; Kiper and others
1997); and global color constancy with V4 (Zeki 1983a; Walsh
and others 1993). Could PITd be responsible for integrating all
these signals, serving a similar function in macaques as the
human color center does in humans? PITd is the most anterior
brain area that shows a strong color bias. This, together with the
fact that more anterior visual areas tend to represent more
advanced stages of visual processing and that very large lesions
encompassing PITd (Cowey and Heywood 1995) result in
impaired color vision whereas large lesions of IT cortex that
do not include PITd fall short of achromatopsia (Cowey and
others 2001), leads us to suggest that PITd is the most likely
candidate for the macaque color center, if one exists.
In summary, cumulative evidence suggests that color is
processed by a ventral-stream pathway, through a connected
network involving V1, V2 (perhaps V3), V4, and PITd, a pattern
that is remarkably similar to the one found in humans (Wade
and others 2002). The specific contribution of these extrastriate
areas, particularly PITd, will have to await further studies,
including targeted single-unit recordings, perhaps guided
by fMRI.
Supplementary Material
Supplementary material can be found at: http://www.cercor.
oxfordjournals.org/
Supplementary Figure 1. Color-biased and luminance-biased re-
sponses in macaque visual cortex. Figure 2A shows the anterior sections
from 1 macaque; this figure shows all the sections from the same
macaque (top) and results from a second macaque (bottom). Con-
ventions as in Figure 2A.
Supplementary Figure 2. Color-afterimage responses in macaque
visual cortex. Figure 3B shows the results from 1 macaque; this figure
shows the activity from 2 additional macaques. Conventions as in
Figure 3B.
Notes
We thank Bruce Rosen, Roger Tootell, and Wim Vanduffel for assistance
in the early stages of this project. Margaret Livingstone, David Hubel,
Aaron Seitz, and Soumya Chatterjee contributed to useful discussions.
Joe Mandeville wrote the fMRI sequence, and Douglas Greve, Paul
Raines, and Larry Wald provided excellent technical support. This work
was supported by the Harvard Society of Fellows, the Milton Fund of
Harvard University, and the Alexander von Humboldt Foundation.
Address correspondence to email: [email protected].
References
Barbur JL, Weiskrantz L, Harlow JA. 1999. The unseen color aftereffect of
an unseen stimulus: insight from blindsight into mechanisms of color
afterimages. Proc Natl Acad Sci USA 96:11637--11641.
Bartels A, Zeki S. 2000. The architecture of the colour centre in the
human visual brain: new results and a review. Eur J Neurosci
12:172--193.
Boussaoud D, Desimone R, Ungerleider LG. 1991. Visual topography of
area TEO in the macaque. J Comp Neurol 306:554--575.
Buckley MJ, Gaffan D, Murray EA. 1997. Functional double dissociation
between two inferior temporal cortical areas: perirhinal cortex
versus middle temporal gyrus. J Neurophysiol 77:587--598.
Burkhalter A, Van Essen DC. 1986. Processing of color, form and
disparity information in visual areas VP and V2 of ventral extrastriate
cortex in the macaque monkey. J Neurosci 6:2327--2351.
Chatterjee S, Callaway EM. 2003. Parallel colour-opponent pathways to
primary visual cortex. Nature 426:668--671.
Conway BR. 2001. Spatial structure of cone inputs to color cells in
alert macaque primary visual cortex (V-1). J Neurosci 21:
2768--2783.
Conway BR. 2002. Neural mechanisms of color vision. Boston, MA:
Kluwer Academic Publishers.
Conway BR. 2003. Colour vision: a clue to hue in V2. Curr Biol
13:R308--R310.
Conway BR, Hubel DH, Livingstone MS. 2002. Color contrast in macaque
V1. Cereb Cortex 12:915--925.
Cottaris NP. 2003. Artifacts in spatiochromatic stimuli due to varia-
tions in preretinal absorption and axial chromatic aberration:
implications for color physiology. J Opt Soc Am A Opt Image Sci
Vis 20:1694--1713.
Cowey A, Heywood CA. 1995. There’s more to colour than meets the
eye. Behav Brain Res 71:89--100.
Cowey A, Heywood CA, Irving-Bell L. 2001. The regional cortical basis of
achromatopsia: a study on macaque monkeys and an achromatopsic
patient. Eur J Neurosci 14:1555--1566.
Cox RW, Hyde JS. 1997. Software tools for analysis and visualization of
FMRI data. NMR Biomed 10:171--178.
Dacey DM. 1996. Circuitry for color coding in the primate retina. Proc
Natl Acad Sci USA 93:582--588.
Damasio A, Yamada T, Damasio H, Corbett J, McKee J. 1980. Central
achromatopsia: behavioral, anatomic, and physiologic aspects.
Neurology 30:1064--1071.
De Valois RL, Abramov I, Jacobs GH. 1966. Analysis of response patterns
of LGN cells. J Opt Soc Am 56:966--977.
De Valois RL, Smith CJ, Kitai ST, Karoly AJ. 1958. Response of single cells
in monkey lateral geniculate nucleus to monochromatic light.
Science 127:238--239.
Dean P. 1979. Visual cortex ablation and thresholds for succes-
sively presented stimuli in rhesus monkeys: II. Hue. Exp Brain Res
35:69--83.
Desimone R, Albright TD, Gross CG, Bruce C. 1984. Stimulus-selective
properties of inferior temporal neurons in the macaque. J Neurosci
4:2051--2062.
Desimone R, Schein SJ, Moran J, Ungerleider LG. 1985. Contour, color
and shape analysis beyond the striate cortex. Vision Res 25:441--452.
DeYoe EA, Van Essen DC. 1985. Segregation of efferent connections and
receptive field properties in visual area V2 of the macaque. Nature
317:58--61.
Distler C, Boussaoud D, Desimone R, Ungerleider LG. 1993. Cortical
connections of inferior temporal area TEO in macaque monkeys.
J Comp Neurol 334:125--150.
Dobkins KR, Thiele A, Albright TD. 2000. Comparison of red-green
equiluminance points in humans and macaques: evidence for
different L:M cone ratios between species. J Opt Soc Am A Opt
Image Sci Vis 17:545--556.
Engel SA. 2005. Adaptation of oriented and unoriented color-selective
neurons in human visual areas. Neuron 45:613--623.
Felleman DJ, Van Essen DC. 1991. Distributed hierarchical processing in
the primate cerebral cortex. Cereb Cortex 1:1--47.
Felleman DJ, Xiao Y, McClendon E. 1997. Modular organization of
occipito-temporal pathways: cortical connections between visual
area 4 and visual area 2 and posterior inferotemporal ventral area in
macaque monkeys. J Neurosci 17:3185--3200.
Fize D, Vanduffel W, Nelissen K, Denys K, Chef d’Hotel C, Faugeras O,
Orban GA. 2003. The retinotopic organization of primate dorsal V4
Cerebral Cortex November 2006, V 16 N 11 1611Downloaded from https://academic.oup.com/cercor/article-abstract/16/11/1604/319025by gueston 17 March 2018

and surrounding areas: a functional magnetic resonance imaging
study in awake monkeys. J Neurosci 23:7395--7406.
Fuster JM, Jervey JP. 1982. Neuronal firing in the inferotemporal cortex
of the monkey in a visual memory task. J Neurosci 2:361--375.
Gattass R, Sousa AP, Gross CG. 1988. Visuotopic organization and extent
of V3 and V4 of the macaque. J Neurosci 8:1831--1845.
Gegenfurtner KR. 2003. Cortical mechanisms of colour vision. Nat Rev
Neurosci 4:563--572.
Gegenfurtner KR, Kiper DC, Levitt JB. 1997. Functional properties of
neurons in macaque area V3. J Neurophysiol 77:1906--1923.
Gerling J, Spillmann L. 1987. Duration of visual afterimages on
modulated backgrounds: postreceptoral processes. Vision Res
27:521--527.
Gross CG. 1973. Visual functions of inferotemporal cortex. In: Jung R,
editor. Handbook of sensory physiology. Volume 7, Part 3B, central
porcessing of visual information. Berlin: Springer. p 451--482.
Gross CG, Rocha-Miranda CE, Bender DB. 1972. Visual properties of
neurons in inferotemporal cortex of the macaque. J Neurophysiol
35:96--111.
Hadjikhani N, Liu AK, Dale AM, Cavanagh P, Tootell RB. 1998. Retinotopy
and color sensitivity in human visual cortical area V8. Nat Neurosci
1:235--241.
Heywood CA, Gadotti A, Cowey A. 1992. Cortical area V4 and its role in
the perception of color. J Neurosci 12:4056--4065.
Horwitz GD, Chichilnisky EJ, Albright TD. 2005. Blue-yellow signals are
enhanced by spatiotemporal luminance contrast in macaque V1. J
Neurophysiol 93:2263--2278.
Hubel DH, Livingstone MS. 1985. Complex-unoriented cells in a sub-
region of primate area 18. Nature 315:325--327.
Hubel DH, Livingstone MS. 1987. Segregation of form, color, and
stereopsis in primate area 18. J Neurosci 7:3378--3415.
Hurlbert A, Wolf K. 2004. Color contrast: a contributory mechanism to
color constancy. Prog Brain Res 144:147--160.
Johnson EN, Hawken MJ, Shapley R. 2001. The spatial transformation of
color in the primary visual cortex of the macaque monkey. Nat
Neurosci 4:409--416.
Kiper DC, Fenstemaker SB, Gegenfurtner KR. 1997. Chromatic proper-
ties of neurons in macaque area V2. Vis Neurosci 14:1061--1072.
Komatsu H, Ideura Y, Kaji S, Yamane S. 1992. Color selectivity of neurons
in the inferior temporal cortex of the awake macaque monkey.
J Neurosci 12:408--424.
Landisman CE, Ts’o DY. 2002. Color processing in macaque striate
cortex: relationships to ocular dominance, cytochrome oxidase, and
orientation. J Neurophysiol 87:3126--3137.
Lennie P, Krauskopf J, Sclar G. 1990. Chromatic mechanisms in striate
cortex of macaque. J Neurosci 10:649--669.
Leventhal AG, Thompson KG, Liu D, Zhou Y, Ault SJ. 1995. Concomitant
sensitivity to orientation, direction, and color of cells in layers 2, 3,
and 4 of monkey striate cortex. J Neurosci 15:1808--1818.
Levitt JB, Kiper DC, Movshon JA. 1994. Receptive fields and
functional architecture of macaque V2. J Neurophysiol
71:2517--2542.
Livingstone MS, Hubel DH. 1984. Anatomy and physiology of a color
system in the primate visual cortex. J Neurosci 4:309--356.
Livingstone MS, Hubel DH. 1987. Psychophysical evidence for separate
channels for the perception of form, color, movement, and depth.
J Neurosci 7:3416--3468.
Lueck CJ, Zeki S, Friston KJ, Deiber MP, Cope P, Cunningham VJ,
Lammertsma AA, Kennard C, Frackowiak RS. 1989. The colour centre
in the cerebral cortex of man. Nature 340:386--389.
Martin PR, White AJ, Goodchild AK, Wilder HD, Sefton AE. 1997.
Evidence that blue-on cells are part of the third geniculocortical
pathway in primates. Eur J Neurosci 9:1536--1541.
Meadows JC. 1974. Disturbed perception of colours associated with
localized cerebral lesions. Brain 97:615--632.
Michael CR. 1978. Color vision mechanisms in monkey striate cortex:
dual-opponent cells with concentric receptive fields. J Neurophysiol
41:572--588.
Moutoussis K, Zeki S. 2002. Responses of spectrally selective cells in
macaque area V2 to wavelengths and colors. J Neurophysiol
87:2104--2112.
Mullen KT, Yoshizawa T, Baker CL Jr. 2003. Luminance mechanisms
mediate the motion of red-green isoluminant gratings: the role of
‘‘temporal chromatic aberration’’. Vision Res 43:1235--1247.
Paxinos G, Huang, X-F, Toga AW. 2000. The rhesus monkey brain in
stereotaxic coordinates. San Diego, CA: Academic Press.
Pigarev IN, Nothdurft HC, Kastner S. 2002. Neurons with radial receptive
fields in monkey area V4A: evidence of a subdivision of prelunate
gyrus based on neuronal response properties. Exp Brain Res
145:199--206.
Roe AW, Ts’o DY. 1999. Specificity of color connectivity between
primate V1 and V2. J Neurophysiol 82:2719--2730.
Schein SJ, Desimone R. 1990. Spectral properties of V4 neurons in the
macaque. J Neurosci 10:3369--3389.
Schein SJ, Marrocco RT, de Monasterio FM. 1982. Is there a high
concentration of color-selective cells in area V4 of monkey visual
cortex? J Neurophysiol 47:193--213.
Schiller PH. 1993. The effects of V4 and middle temporal (MT) area
lesions on visual performance in the rhesus monkey. Vis Neurosci
10:717--746.
Schiller PH. 1997. Past and present ideas about how the visual scene is
analyzedby thebrain. In: RocklandKS andKass JH, editors. Extrastriate
visual cortex in primates. Vol. 12. New York: Plenum Press. p 59--90.
Shipp S, Zeki S. 1995. Segregation and convergence of specialised
pathways in macaque monkey visual cortex. J Anat 187:547--562.
Stefanacci L, Reber P, Costanza J, Wong E, Buxton R, Zola S, Squire L,
Albright T. 1998. fMRI of monkey visual cortex. Neuron
20:1051--1057.
Stepniewska I, Collins CE, Kaas JH. 2005. Reappraisal of DL/V4
boundaries based on connectivity patterns of dorsolateral visual
cortex in macaques. Cereb Cortex 15:809--822.
Stockman A, Sharpe LT. 2000. Tritanopic color matches and the middle-
and long-wavelength-sensitive cone spectral sensitivities. Vision Res
40:1739--1750.
Takahashi S, Ejima Y, Akita M. 1988. Positive colored afterimages from
the figure-ground configurations of colored lights: effects of chro-
maticity, luminance and a spatial parameter of the adapting stimuli.
Vision Res 28:521--533.
Takechi H, Onoe H, Shizuno H, Yoshikawa E, Sadato N, Tsukada H,
Watanabe Y. 1997. Mapping of cortical areas involved in color vision
in non-human primates. Neurosci Lett 230:17--20.
Tanaka M, Weber H, Creutzfeldt OD. 1986. Visual properties and spatial
distribution of neurones in the visual association area on the
prelunate gyrus of the awake monkey. Exp Brain Res 65:11--37.
Tootell RB, Hadjikhani N. 1998. Reply to ‘‘Has a new color area been
discovered’’. Nat Neurosci 1:335--336.
Tootell RB, Hamilton SL. 1989. Functional anatomy of the second visual
area (V2) in the macaque. J Neurosci 9:2620--2644.
Tootell RB, Nelissen K, Vanduffel W, Orban GA. 2004. Search for color
‘center(s)’ in macaque visual cortex. Cereb Cortex 14:353--363.
Tootell RB, Silverman MS, Hamilton SL, De Valois RL, Switkes E. 1988.
Functional anatomy of macaque striate cortex. III. Color. J Neurosci
8:1569--1593.
Tsao DY, Freiwald WA, Knutsen TA, Mandeville JB, Tootell RBH. 2003.
Faces and objects in macaque cerebral cortex. Nat Neurosci
6:989--995.
Ungerleider L, Mishkin M. 1982. Two cortical visual systems. In: Ingle D,
Goodale MA, Mansfield RJW, editors. Analysis of visual behavior.
Cambridge, MA: MIT Press. p 549--586.
Ungerleider LG, Paxinos G, Xu-Feng H, Toga Aw. 2000. Red’s atlas.
Laboratory of Neuropsychology, NIMH Department of Health and
Human Services. In: Paxinos and others, editors. The rhesus monkey
brain in stereotaxic coordinates. San Diego, CA: Academic Press. p xiv.
Ungerleider LG, Desimone R. 1986. Cortical connections of visual area
MT in the macaque. J Comp Neurol 248:190--222.
Vaina LM. 1994. Functional segregation of color and motion processing
in the human visual cortex: clinical evidence. Cereb Cortex
4:555--572.
Van Essen DC, Felleman DJ, DeYoe EA, Olavarria J, Knierim J. 1990.
Modular and hierarchical organization of extrastriate visual cortex
in the macaque monkey. Cold Spring Harbor Symp Quant Biol
55:679--696.
1612 fMRI of Color Processing in Alert Macaque d Conway and TsaoDownloaded from https://academic.oup.com/cercor/article-abstract/16/11/1604/319025by gueston 17 March 2018
Van Essen DC, Lewis JW, Drury HA, Hadjikhani N, Tootell RB,
Bakircioglu M, Miller MI. 2001. Mapping visual cortex in monkeys
and humans using surface-based atlases. Vision Res 41:1359--1378.
Virsu V, Laurinen P. 1977. Long-lasting afterimages caused by neural
adaptation. Vision Res 17:853--860.
Wachtler T, Albright TD, Sejnowski TJ. 2001. Nonlocal interactions in
color perception: nonlinear processing of chromatic signals from
remote inducers. Vision Res 41:1535--1546.
Wachtler T, Sejnowski TJ, Albright TD. 2003. Representation of color
stimuli in awake macaque primary visual cortex. Neuron 37:681--691.
Wade AR, Brewer AA, Rieger JW, Wandell BA. 2002. Functional measure-
ments of human ventral occipital cortex: retinotopy and colour.
Philos Trans R Soc Lond B Biol Sci 357:963--973.
Walsh V, Carden D, Butler SR, Kulikowski JJ. 1993. The effects of V4
lesions on the visual abilities of macaques: hue discrimination and
colour constancy. Behav Brain Res 53:51--62.
Wiesel TN, Hubel DH. 1966. Spatial and chromatic interactions in the
lateral geniculate body of the rhesus monkey. J Neurophysiol
29:1115--1156.
Xiao Y, Wang Y, Felleman DJ. 2003. A spatially organized representation
of colour in macaque cortical area V2. Nature 421:535--539.
Zeki S. 1978a. Uniformity and diversity of structure and function in
rhesus monkey prestriate visual cortex. J Physiol 277:273--290.
Zeki S. 1983a. Colour coding in the cerebral cortex: the reaction of cells
in monkey visual cortex to wavelengths and colours. Neuroscience
9:741--765.
Zeki S. 1983b. The distribution of wavelength and orientation selective
cells in different areas of monkey visual cortex. Proc R Soc Lond Ser
B Biol Sci 217:449--470.
Zeki S. 1996. Are areas TEO and PIT of monkey visual cortex wholly
distinct from the fourth visual complex (V4 complex)? Proc R Soc
Lond Ser B Biol Sci 263:1539--1544.
Zeki S, Marini L. 1998. Three cortical stages of colour processing in the
human brain. Brain 121:1669--1685.
Zeki S, McKeefry DJ, Bartels A, Frackowiak RS. 1998. Has a new color
area been discovered? Nat Neurosci 1:335--336.
Zeki S, Watson JD, Lueck CJ, Friston KJ, Kennard C, Frackowiak RS.
1991. A direct demonstration of functional specialization in human
visual cortex. J Neurosci 11:641--649.
Zeki SM. 1973. Colour coding in rhesus monkey prestriate cortex. Brain
Res 53:422--427.
Zeki SM. 1977. Colour coding in the superior temporal sulcus of
rhesus monkey visual cortex. Proc R Soc Lond Ser B Biol Sci
197:195--223.
Zeki SM. 1978b. Functional specialisation in the visual cortex of the
rhesus monkey. Nature 274:423--428.
Cerebral Cortex November 2006, V 16 N 11 1613Downloaded from https://academic.oup.com/cercor/article-abstract/16/11/1604/319025by gueston 17 March 2018