color improvement of rubies by ion beam techniqueqd.swu.ac.th/portals/2077/10_4-2-19 color...
TRANSCRIPT
Surface & Coatings Technology 306 (2016) 205–210
Contents lists available at ScienceDirect
Surface & Coatings Technology
j ourna l homepage: www.e lsev ie r .com/ locate /sur fcoat
Color improvement of rubies by ion beam technique
S. Intarasiri a,⁎, D. Bootkul b, U. Tippawan c, P. Songsiriritthigul d
a Science and Technology Research Institute, Chiang Mai University, Chiang Mai 50200, Thailandb Department of General Science (Gems and Jewelry), Faculty of Science, Srinakharinwirot University, Bangkok 10110, Thailandc Department of Physics and Materials Science, Faculty of Science, Chiang Mai University, Chiang Mai 50200, Thailandd School of Physics, Suranaree University of Technology, Nakhon Ratchasima 30000, Thailand
⁎ Corresponding author.E-mail address: [email protected] (S. Intarasiri).
http://dx.doi.org/10.1016/j.surfcoat.2016.05.0830257-8972/© 2016 Elsevier B.V. All rights reserved.
a b s t r a c t
a r t i c l e i n f oArticle history:Received 4 February 2016Revised 27 May 2016Accepted in revised form 30 May 2016Available online 1 June 2016
Ion implantation technique has been used for improving the quality of natural ruby. The implantation was per-formed by using 90 keVN2-ion and 50 keVO-ion beams. Either kind of ion species could eliminate tiny inclusionsin the ruby as observed from an optical microscope. The red color of the rubywas intensified after O-ion implan-tation. N2-ion implantation changed the color of red ruby to be violet-red. UV–vis and X-ray absorption spectro-scopic techniques were employed for investigating the mechanism behind the optical quality improvement ofthe ruby. The results from both measurement techniques are reported and discussed.
© 2016 Elsevier B.V. All rights reserved.
Keywords:RubyIon implantationUV–vis spectroscopyRaman X-ray absorption spectroscopy1. Introduction
A gemstone is the naturally occurring crystalline form of a mineral,which is desirable for its beauty, valuable in its rarity and durableenough to be enjoyed for generations. Corundummineral is a crystallineform of Al2O3. A perfect crystalline Al2O3 is colorless. The color is origi-nated from the traces of impurities existing in corundum. The red vari-ety of corundum is known as ruby, and all other colors of corundum areknown as sapphires. Ruby is generally known as themost valuable of allcolor gemstones that exhibit apparent color from pink to blood-red. Forruby, the red color is caused mainly by the presence of a small percent-age of chromium (Cr). Price of ruby is primarily determined by its color.Although the discoveries of natural gemstones are found from time totime in many parts of the world, only relatively small amount of highquality gem material can typically been produced comparing to amuch larger quantity of low quality gem material recovered from agiven mining locality. Thus, huge efforts have been spent to developmethods to treat this lower-quality material to enhance its appearanceand thereby its marketability for gem purposes.
Heat treatment is the most popular technique and commerciallyused for the improvement of quality of gemstones in suchways tomod-ify color, unify inclusions, increase transmittance and improve luster [1,2,3]. However, the main drawback of the heat treatment is that it in-volves annealing at rather higher temperatures (typically above
1000 °C) for various periods ranging from few hours to few days de-pending on the type of gemstones, and thus different types of gem-stones cannot be treated simultaneously. Alternative treatments areexposure of gemstones to energetic particle beams or laser beams.Among different types of irradiating beams, a heavy-ion beam is apromising candidate as it is able to bring about both local heating effectand to directly introduce defects, impurities that have direct effects onthe modification of the optical properties [4]. Moreover, the ion beamcan be used to treat different gems individually.
In the past, research activities of ion implantation on corundumwere either the improvement of optical and mechanical properties [5,6,7,8,9,10], or the applications in optics, optoelectronics, photonics andtooling [11,12]. Most of the previous works focusedmainly on basic un-derstandings of ion beam modifications of sapphire. Our recent workdemonstrated the potential of ion implantation technique for qualityenhancement of several gems in the corundum family [13]. The presentwork aims not only at the development of a heavy ion beam irradiationprocess for enhancing the quality of rubies but also the understanding ofmechanism behind the optical quality improvement of the rubies. Dif-ferent measurement techniques were employed in this work. ParticleInduced X-rays Emission (PIXE) technique was used for determine theconcentration of the trace elements. Raman spectroscopic techniquewas used for investigating the disorders in ruby related to the formationconditions [14,15]. UV–vis absorption spectroscopy, as a common tech-nique to study themechanisms of coloration caused by transitionmetalin gemstones,was also used [16]. In addition, X-ray absorption spectros-copy [17], which is a powerful technique for chemical analysis, was also
206 S. Intarasiri et al. / Surface & Coatings Technology 306 (2016) 205–210
employed to investigate the information about the oxidation state of thetransition metals in ruby before and after ion implantation.
2. Experimental details
The ruby investigated in the present work is from themining inMo-zambique. The gem specimens were either naturally virgin or well cutand polished, and their sizes varied from a few mm to almost 1 cm inspecific diameters.
The ruby specimens were implanted by N2- and O-ions. N2-ion im-plantations were performed by using a 200-kV Varian ion implanterequipped with a Freeman ion source at Chiang Mai University in Thai-land. While O-ion implantations were carried out by using a Danfysikion implanter equipped with a magnetic multicusp plasma dischargeion source at Uppsala University in Sweden. Both implanters areequipped with a beam scanning system to ensure the uniform distribu-tion beam with an area over 6-in. in diameter. It is noted that the ionspecies and energy were chosen from the optimal performance ofeach ion implanter since rather high ion fluences were required in thiswork. N2-ion implantations were performed with an ion energy of90 keV and a fluence of ~5 × 10¹⁷ ions/cm2. While O-ion implantationswere performed with an ion energy of 50 keV and a fluence of~4 × 10¹⁷ ions/cm2. Each of gemstones was fixed on the carbon tapewhich attached to the sample holder directly in a way to prevent a col-liding of the ion beam to the carbon tape. The target temperature duringion implantation was measured using a pyrometer and found to be sta-bilized below 200 °C. The operating pressures in the target chamberswere ~10−5–10−6 Torr. Surface cleaning by oxygen plasma was subse-quently done after ion implantation.
The ion beam-treated specimens were observed under either gemol-ogist-professional binocular microscopes (Zeiss, Germany) or directly innatural light. The photoswere taken under the dark fieldwith themagni-fication of 3.75 and the inclusions were recorded under the bright fieldwith the magnification of 35. The photo recording systems were kept inthe samemanner, especially variations in lighting conditions, throughoutthe whole experiment without any interruption from other activities.Moreover, before the photos of samples after ion implantation weretaken, the background was set to be the same as before ion implantation.All color changes of implanted samples were described by the authorizedgemologist professionals, i.e. B. Wanthanachaisaeng [18], based on thecolor grading system [19]. The values of the gemstones were judgedbased on overall performance of 20 samples in each group by both autho-rized gemological professionals and specialist frombusiness company, i.e.C. Rookkajinda [20].
The trace elements in the ruby samples were analyzed using PIXEbased on a 2-MeV proton beam produced by a 1.7 MV tandemTandetron accelerator at ChiangMaiUniversity [21]. The optical absorp-tion spectroscopic study was carried out by using a Perkin Elmer Lamb-da 950 UV/vis Spectrometer which recorded over the range from 300 to800 nm. The ordinary ray (o-ray) and extraordinary ray (e-ray) of sam-ples were previously identified by the Polariscope [22]. All absorptionmeasurements in this work were carried out at room temperature. AJobin Yvon spectrometer HORIBA (T64000), equipped with a triplemonochromator, 532 nm solid state excitation laser, and a focusedspot size of about 0.8 μm by a 100× objective (NA = 0.9), was usedfor the Raman measurements. It has been known that corundum is,after all, very chemically heterogeneous and one can expect differentoptical and physical properties on different parts of the stone evenwith-out any sort of treatment [22]. Therefore, we marked the position formeasurements of both UV–vis and Raman spectra to ensure that themeasurement results did not differe only because of non-uniformity innature of the stone.
Measurements of X-ray absorption near edge structure (XANES)spectra of the ruby with and without ion implantations were carriedout at the Synchrotron Light Research Institute of Thailand using theX-ray absorption spectroscopy beamline (BL8) [23]. The measurements
were performed in fluorescence mode using a 13-element Ge detector.The intensity of the incident X-ray beamwasmeasured by an ionizationchamber located in front of the sample. The photon energy scan wascarried out using a Ge(111) double crystal monochromator to coverthe K-edge of Fe and Cr. XANES spectra taken from a metallic Fe foil,FeO and Fe2O3 were used as the references for the +0, +2 and+3 ox-idation states of Fe, respectively. For Cr K-edge, a metallic Cr foil andCr2O3 were used as the references for the+0, and+3 oxidation states,respectively.
3. Results
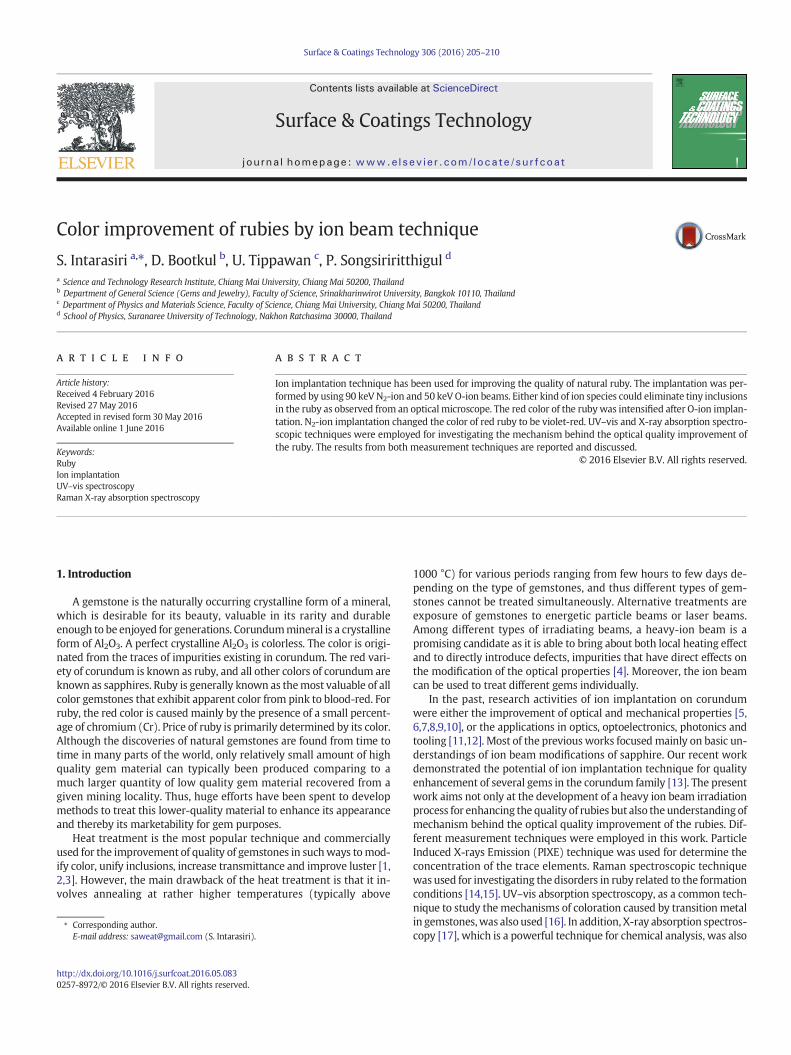
Fig. 1 shows the appearance of ruby for before and after 90 keV N2-ion implantation to a fluence of ~5 × 10¹⁷ ions/cm2. Under dark field, itwas seen that the color tone become darker (Fig. 1a). Moreover, it ob-served, by increasing the optical magnification, that some tiny inclu-sions, marked by oval figure, were removed (Fig. 1b–e). Theseinclusions might be small features near surface which were broken upby ion beams irradiation. Note that the elemental analysis by PIXE re-vealed the quantity of Cr, Fe and Ti in this sample to be 6230, 4010and 72 ppma, respectively. The color grading system indicates that theoverall color of rubies treated by N2-ions implantation changed fromred (R) to strongly purplish red (StpR).
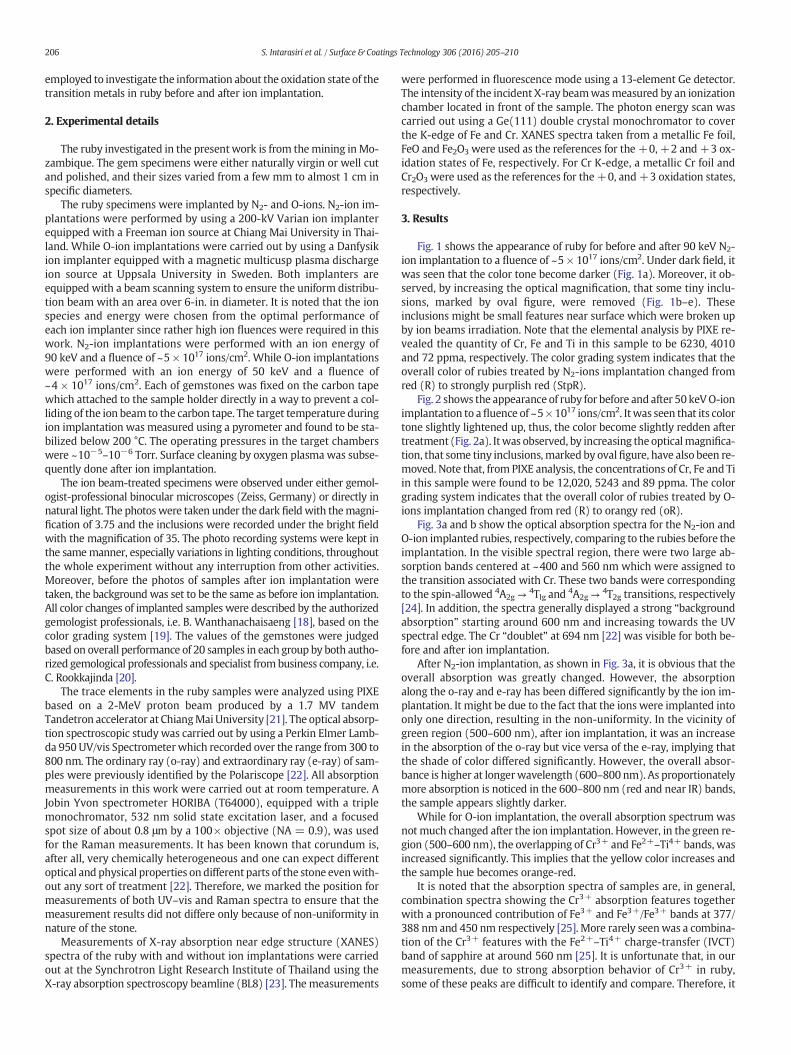
Fig. 2 shows the appearance of ruby for before and after 50 keVO-ionimplantation to afluence of ~5× 10¹⁷ ions/cm2. Itwas seen that its colortone slightly lightened up, thus, the color become slightly redden aftertreatment (Fig. 2a). Itwas observed, by increasing the opticalmagnifica-tion, that some tiny inclusions,marked by ovalfigure, have also been re-moved. Note that, from PIXE analysis, the concentrations of Cr, Fe and Tiin this sample were found to be 12,020, 5243 and 89 ppma. The colorgrading system indicates that the overall color of rubies treated by O-ions implantation changed from red (R) to orangy red (oR).
Fig. 3a and b show the optical absorption spectra for the N2-ion andO-ion implanted rubies, respectively, comparing to the rubies before theimplantation. In the visible spectral region, there were two large ab-sorption bands centered at ~400 and 560 nm which were assigned tothe transition associated with Cr. These two bands were correspondingto the spin-allowed 4A2g →
4Tlg and 4A2g→4T2g transitions, respectively
[24]. In addition, the spectra generally displayed a strong “backgroundabsorption” starting around 600 nm and increasing towards the UVspectral edge. The Cr “doublet” at 694 nm [22] was visible for both be-fore and after ion implantation.
After N2-ion implantation, as shown in Fig. 3a, it is obvious that theoverall absorption was greatly changed. However, the absorptionalong the o-ray and e-ray has been differed significantly by the ion im-plantation. It might be due to the fact that the ions were implanted intoonly one direction, resulting in the non-uniformity. In the vicinity ofgreen region (500–600 nm), after ion implantation, it was an increasein the absorption of the o-ray but vice versa of the e-ray, implying thatthe shade of color differed significantly. However, the overall absor-bance is higher at longerwavelength (600–800 nm). As proportionatelymore absorption is noticed in the 600–800 nm (red and near IR) bands,the sample appears slightly darker.
While for O-ion implantation, the overall absorption spectrum wasnot much changed after the ion implantation. However, in the green re-gion (500–600 nm), the overlapping of Cr3+ and Fe2+–Ti4+ bands, wasincreased significantly. This implies that the yellow color increases andthe sample hue becomes orange-red.
It is noted that the absorption spectra of samples are, in general,combination spectra showing the Cr3+ absorption features togetherwith a pronounced contribution of Fe3+ and Fe3+/Fe3+ bands at 377/388 nm and 450 nm respectively [25]. More rarely seenwas a combina-tion of the Cr3+ features with the Fe2+–Ti4+ charge-transfer (IVCT)band of sapphire at around 560 nm [25]. It is unfortunate that, in ourmeasurements, due to strong absorption behavior of Cr3+ in ruby,some of these peaks are difficult to identify and compare. Therefore, it
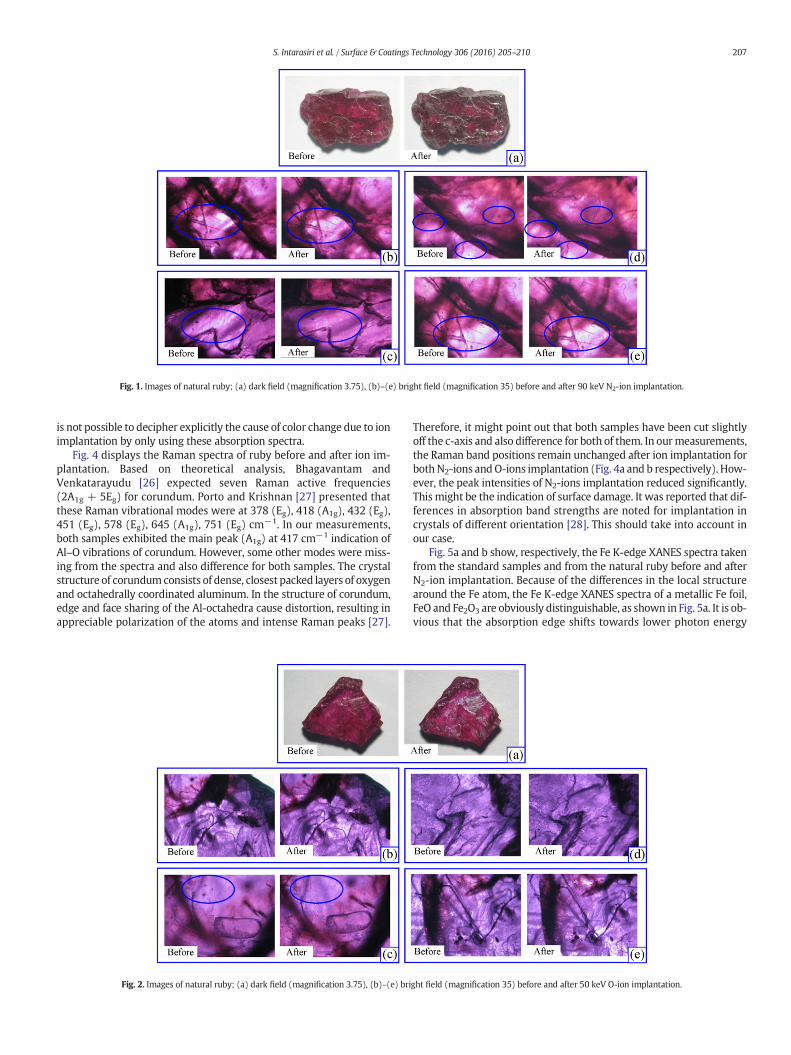
Fig. 1. Images of natural ruby; (a) dark field (magnification 3.75), (b)–(e) bright field (magnification 35) before and after 90 keV N2-ion implantation.
207S. Intarasiri et al. / Surface & Coatings Technology 306 (2016) 205–210
is not possible to decipher explicitly the cause of color change due to ionimplantation by only using these absorption spectra.
Fig. 4 displays the Raman spectra of ruby before and after ion im-plantation. Based on theoretical analysis, Bhagavantam andVenkatarayudu [26] expected seven Raman active frequencies(2A1g + 5Eg) for corundum. Porto and Krishnan [27] presented thatthese Raman vibrational modes were at 378 (Eg), 418 (A1g), 432 (Eg),451 (Eg), 578 (Eg), 645 (A1g), 751 (Eg) cm−1. In our measurements,both samples exhibited the main peak (A1g) at 417 cm−1 indication ofAl–O vibrations of corundum. However, some other modes were miss-ing from the spectra and also difference for both samples. The crystalstructure of corundumconsists of dense, closest packed layers of oxygenand octahedrally coordinated aluminum. In the structure of corundum,edge and face sharing of the Al-octahedra cause distortion, resulting inappreciable polarization of the atoms and intense Raman peaks [27].
Fig. 2. Images of natural ruby; (a) dark field (magnification 3.75), (b)–(e) bri
Therefore, it might point out that both samples have been cut slightlyoff the c-axis and also difference for both of them. In ourmeasurements,the Raman band positions remain unchanged after ion implantation forbothN2-ions andO-ions implantation (Fig. 4a and b respectively). How-ever, the peak intensities of N2-ions implantation reduced significantly.This might be the indication of surface damage. It was reported that dif-ferences in absorption band strengths are noted for implantation incrystals of different orientation [28]. This should take into account inour case.
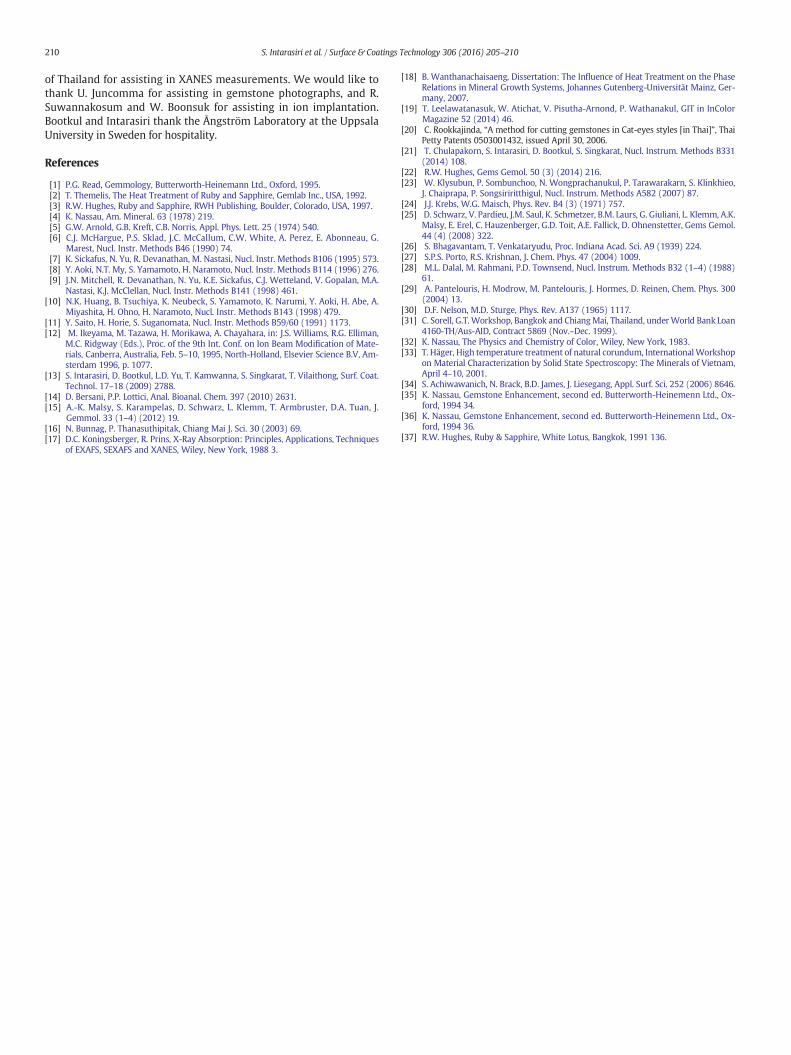
Fig. 5a and b show, respectively, the Fe K-edge XANES spectra takenfrom the standard samples and from the natural ruby before and afterN2-ion implantation. Because of the differences in the local structurearound the Fe atom, the Fe K-edge XANES spectra of a metallic Fe foil,FeO and Fe2O3 are obviously distinguishable, as shown in Fig. 5a. It is ob-vious that the absorption edge shifts towards lower photon energy
ght field (magnification 35) before and after 50 keV O-ion implantation.
Fig. 3. Uv–vis absorption spectra of natural ruby before and after; (a) 90 keV N2-ion implantation, (b) 50 keV O-ion implantation.
208 S. Intarasiri et al. / Surface & Coatings Technology 306 (2016) 205–210
when the oxidation state of Fe reduces. The pre-edge and the edge po-sitions of theXANES spectrumof the natural ruby before N2-ion implan-tation are located the same positions as those of Fe2O3, indicating thatoxidation state of Fe in the natural ruby is +3. The features of theXANES spectrum of the natural ruby before N2-ion implantation arevery similar to those of Fe2O3. This suggests that the local structurearound Fe in the ruby is similar to that in the standard Fe2O3 sample.The noticeable discrepancies between the Fe K-edge XANES spectrataken from the standard Fe2O3 sample and the natural ruby indicatingthe slight differences in the local structure around the Fe atom in bothsamples. There are big differences in the XANES spectra of the ruby be-fore and after N2-ion implantation. For the implanted sample, the pre-edge peak at 7111 eV becomes pronounced. In addition, the absorptionedge shifts towards lower photon energy, suggesting that the oxidationstate of some Fe atoms was changed to be lower numbers. It is notedthat the probed depth of XANES (tens of micron) is well below thethickness of the ion implanted layer. Thus themeasured XANES spectraare a combined result from the implanted layer and from the regionbelow the ion range. This results in multiple absorption edges for theimplanted ruby. By comparing to the standard spectra, the XANES spec-trumof the implanted ruby is from Fewith oxidation states+2 and+3.The Fe+3 may be from the region with the depth below the implantedlayer and the Fe+2 may be from the implanted layer.
It is noted that there are no differences in the Cr K-edge XANES spec-tra taken from the natural ruby before and after N2-ion implantation.This suggests that the oxidation of Cr in the ruby was not altered bythe N2-ion implantation. The oxidation state of Cr in the ruby sampleswas deduced by comparing the XANES of the ruby and the standardsamples. The most likely oxidation state number is +3, which is inagreement with a previous report [29]. It is also interesting to notethat XANES spectra of the natural ruby samples taken before and afterO-ion implantation are very similar for both Fe K-edge and the Cr K-edge (the spectra are not shown).
4. Discussions
Colors in corundum can be originated from many different mecha-nisms [1,2,30,31,32]. The well-known basic causes of color are the fol-lowings: Cr3+ generates pale pink through deep red as itsconcentration increases, Fe3+ generates a pale yellow and Fe2+–Ti4+
pairs generate blue through the intervalent charge transfer (IVCT)mechanism. The chemical information obtained from XANES measure-ments allowed us to focus on themajor mechanism caused by the pres-ence of Cr and IVCT of the trace elements existing in ruby (mainly Fe andTi) before and after ion implantation.
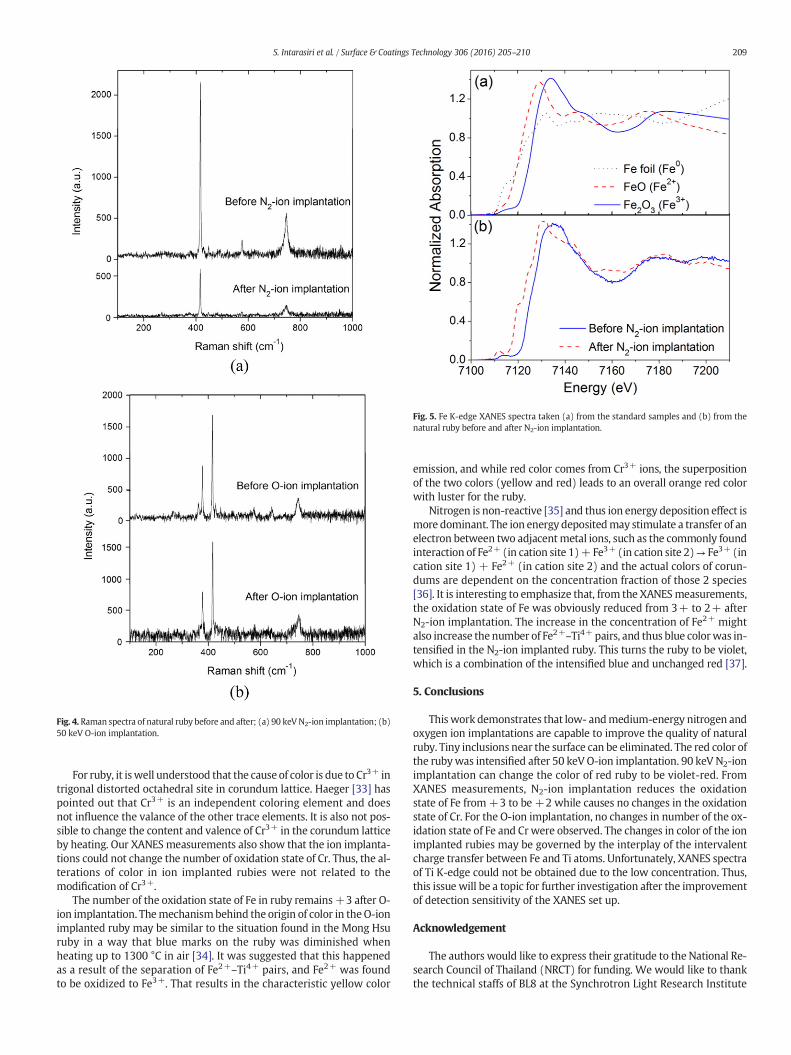
Fig. 4. Raman spectra of natural ruby before and after; (a) 90 keVN2-ion implantation; (b)50 keV O-ion implantation.
Fig. 5. Fe K-edge XANES spectra taken (a) from the standard samples and (b) from thenatural ruby before and after N2-ion implantation.
209S. Intarasiri et al. / Surface & Coatings Technology 306 (2016) 205–210
For ruby, it iswell understood that the cause of color is due to Cr3+ intrigonal distorted octahedral site in corundum lattice. Haeger [33] haspointed out that Cr3+ is an independent coloring element and doesnot influence the valance of the other trace elements. It is also not pos-sible to change the content and valence of Cr3+ in the corundum latticeby heating. Our XANES measurements also show that the ion implanta-tions could not change the number of oxidation state of Cr. Thus, the al-terations of color in ion implanted rubies were not related to themodification of Cr3+.
The number of the oxidation state of Fe in ruby remains+3 after O-ion implantation. Themechanismbehind the origin of color in the O-ionimplanted ruby may be similar to the situation found in the Mong Hsuruby in a way that blue marks on the ruby was diminished whenheating up to 1300 °C in air [34]. It was suggested that this happenedas a result of the separation of Fe2+–Ti4+ pairs, and Fe2+ was foundto be oxidized to Fe3+. That results in the characteristic yellow color
emission, and while red color comes from Cr3+ ions, the superpositionof the two colors (yellow and red) leads to an overall orange red colorwith luster for the ruby.
Nitrogen is non-reactive [35] and thus ion energy deposition effect ismore dominant. The ion energy depositedmay stimulate a transfer of anelectron between two adjacentmetal ions, such as the commonly foundinteraction of Fe2+ (in cation site 1)+ Fe3+ (in cation site 2)→ Fe3+ (incation site 1) + Fe2+ (in cation site 2) and the actual colors of corun-dums are dependent on the concentration fraction of those 2 species[36]. It is interesting to emphasize that, from the XANESmeasurements,the oxidation state of Fe was obviously reduced from 3+ to 2+ afterN2-ion implantation. The increase in the concentration of Fe2+ mightalso increase the number of Fe2+–Ti4+ pairs, and thus blue colorwas in-tensified in the N2-ion implanted ruby. This turns the ruby to be violet,which is a combination of the intensified blue and unchanged red [37].
5. Conclusions
Thiswork demonstrates that low- andmedium-energy nitrogen andoxygen ion implantations are capable to improve the quality of naturalruby. Tiny inclusions near the surface can be eliminated. The red color ofthe rubywas intensified after 50 keV O-ion implantation. 90 keV N2-ionimplantation can change the color of red ruby to be violet-red. FromXANES measurements, N2-ion implantation reduces the oxidationstate of Fe from+3 to be +2 while causes no changes in the oxidationstate of Cr. For the O-ion implantation, no changes in number of the ox-idation state of Fe and Cr were observed. The changes in color of the ionimplanted rubies may be governed by the interplay of the intervalentcharge transfer between Fe and Ti atoms. Unfortunately, XANES spectraof Ti K-edge could not be obtained due to the low concentration. Thus,this issue will be a topic for further investigation after the improvementof detection sensitivity of the XANES set up.
Acknowledgement
The authors would like to express their gratitude to the National Re-search Council of Thailand (NRCT) for funding. We would like to thankthe technical staffs of BL8 at the Synchrotron Light Research Institute
210 S. Intarasiri et al. / Surface & Coatings Technology 306 (2016) 205–210
of Thailand for assisting in XANES measurements. We would like tothank U. Juncomma for assisting in gemstone photographs, and R.Suwannakosum and W. Boonsuk for assisting in ion implantation.Bootkul and Intarasiri thank the Ångström Laboratory at the UppsalaUniversity in Sweden for hospitality.
References
[1] P.G. Read, Gemmology, Butterworth-Heinemann Ltd., Oxford, 1995.[2] T. Themelis, The Heat Treatment of Ruby and Sapphire, Gemlab Inc., USA, 1992.[3] R.W. Hughes, Ruby and Sapphire, RWH Publishing, Boulder, Colorado, USA, 1997.[4] K. Nassau, Am. Mineral. 63 (1978) 219.[5] G.W. Arnold, G.B. Kreft, C.B. Norris, Appl. Phys. Lett. 25 (1974) 540.[6] C.J. McHargue, P.S. Sklad, J.C. McCallum, C.W. White, A. Perez, E. Abonneau, G.
Marest, Nucl. Instr. Methods B46 (1990) 74.[7] K. Sickafus, N. Yu, R. Devanathan, M. Nastasi, Nucl. Instr. Methods B106 (1995) 573.[8] Y. Aoki, N.T. My, S. Yamamoto, H. Naramoto, Nucl. Instr. Methods B114 (1996) 276.[9] J.N. Mitchell, R. Devanathan, N. Yu, K.E. Sickafus, C.J. Wetteland, V. Gopalan, M.A.
Nastasi, K.J. McClellan, Nucl. Instr. Methods B141 (1998) 461.[10] N.K. Huang, B. Tsuchiya, K. Neubeck, S. Yamamoto, K. Narumi, Y. Aoki, H. Abe, A.
Miyashita, H. Ohno, H. Naramoto, Nucl. Instr. Methods B143 (1998) 479.[11] Y. Saito, H. Horie, S. Suganomata, Nucl. Instr. Methods B59/60 (1991) 1173.[12] M. Ikeyama, M. Tazawa, H. Morikawa, A. Chayahara, in: J.S. Williams, R.G. Elliman,
M.C. Ridgway (Eds.), Proc. of the 9th Int. Conf. on Ion Beam Modification of Mate-rials, Canberra, Australia, Feb. 5–10, 1995, North-Holland, Elsevier Science B.V, Am-sterdam 1996, p. 1077.
[13] S. Intarasiri, D. Bootkul, L.D. Yu, T. Kamwanna, S. Singkarat, T. Vilaithong, Surf. Coat.Technol. 17–18 (2009) 2788.
[14] D. Bersani, P.P. Lottici, Anal. Bioanal. Chem. 397 (2010) 2631.[15] A.-K. Malsy, S. Karampelas, D. Schwarz, L. Klemm, T. Armbruster, D.A. Tuan, J.
Gemmol. 33 (1–4) (2012) 19.[16] N. Bunnag, P. Thanasuthipitak, Chiang Mai J. Sci. 30 (2003) 69.[17] D.C. Koningsberger, R. Prins, X-Ray Absorption: Principles, Applications, Techniques
of EXAFS, SEXAFS and XANES, Wiley, New York, 1988 3.
[18] B. Wanthanachaisaeng, Dissertation: The Influence of Heat Treatment on the PhaseRelations in Mineral Growth Systems, Johannes Gutenberg-Universität Mainz, Ger-many, 2007.
[19] T. Leelawatanasuk, W. Atichat, V. Pisutha-Arnond, P. Wathanakul, GIT in InColorMagazine 52 (2014) 46.
[20] C. Rookkajinda, “A method for cutting gemstones in Cat-eyes styles [in Thai]”, ThaiPetty Patents 0503001432, issued April 30, 2006.
[21] T. Chulapakorn, S. Intarasiri, D. Bootkul, S. Singkarat, Nucl. Instrum. Methods B331(2014) 108.
[22] R.W. Hughes, Gems Gemol. 50 (3) (2014) 216.[23] W. Klysubun, P. Sombunchoo, N. Wongprachanukul, P. Tarawarakarn, S. Klinkhieo,
J. Chaiprapa, P. Songsiriritthigul, Nucl. Instrum. Methods A582 (2007) 87.[24] J.J. Krebs, W.G. Maisch, Phys. Rev. B4 (3) (1971) 757.[25] D. Schwarz, V. Pardieu, J.M. Saul, K. Schmetzer, B.M. Laurs, G. Giuliani, L. Klemm, A.K.
Malsy, E. Erel, C. Hauzenberger, G.D. Toit, A.E. Fallick, D. Ohnenstetter, Gems Gemol.44 (4) (2008) 322.
[26] S. Bhagavantam, T. Venkataryudu, Proc. Indiana Acad. Sci. A9 (1939) 224.[27] S.P.S. Porto, R.S. Krishnan, J. Chem. Phys. 47 (2004) 1009.[28] M.L. Dalal, M. Rahmani, P.D. Townsend, Nucl. Instrum. Methods B32 (1–4) (1988)
61.[29] A. Pantelouris, H. Modrow, M. Pantelouris, J. Hormes, D. Reinen, Chem. Phys. 300
(2004) 13.[30] D.F. Nelson, M.D. Sturge, Phys. Rev. A137 (1965) 1117.[31] C. Sorell, G.T.Workshop, Bangkok and ChiangMai, Thailand, underWorld Bank Loan
4160-TH/Aus-AID, Contract 5869 (Nov.–Dec. 1999).[32] K. Nassau, The Physics and Chemistry of Color, Wiley, New York, 1983.[33] T. Häger, High temperature treatment of natural corundum, InternationalWorkshop
on Material Characterization by Solid State Spectroscopy: The Minerals of Vietnam,April 4–10, 2001.
[34] S. Achiwawanich, N. Brack, B.D. James, J. Liesegang, Appl. Surf. Sci. 252 (2006) 8646.[35] K. Nassau, Gemstone Enhancement, second ed. Butterworth-Heinemenn Ltd., Ox-
ford, 1994 34.[36] K. Nassau, Gemstone Enhancement, second ed. Butterworth-Heinemenn Ltd., Ox-
ford, 1994 36.[37] R.W. Hughes, Ruby & Sapphire, White Lotus, Bangkok, 1991 136.