comet halley- india~ observationsnopr.niscair.res.in/bitstream/123456789/36466/1/ijrsp 17(6)...
TRANSCRIPT
Indian Journal of Radio & Space Physic\
Vol. 17, December 1988, pp. 296-304
Comet Halley - India~ ObservationsT CHANDRASEKHAR
Physical Research Laboratory, Ahmedabad 380 009
The recent apparition of Comet Halley in 1985-86 witnessed a well planned coordinated study by the spaceprobes as well as by an extensive observational network on the ground which has resulted in a sea change in ourunderstanding of the cometary environment. The Indian astronomers actively participated in the coordinated observational programme under the aegis of the International Halley Watch (IHW) and Indian Halley ObservationProgramme (IHOP) and have obtained several interesting results on the spatial distribution of coma emissions andon some transient events. The observations and some of the results are discussed.
1 Introduction
The apparition of Halley's comet in the winterof 1985-86 was a watershed in the history ofcometary astronomy. Never before had a cometbeen observed so intensively and with such sophisticated instrumentation. The earlier visitationschronicled since 240 Be or even earlier had been
little more than event markers in history. Duringthe last apparition of Halley's comet in 1910, astronomical instrumentation was in its infancy.Apart from photographing the extent of the cometand recording a few spectrographs, which revealed emissions in the coma, little else could bedone. For the present apparition however, themost recent advances in technology were put touse to maximize the scientific output. For a periodof about eight months from October 1985 to May1986 the comet v.;as under close observation by avery large number of telescopes around the world.Observations were also carried out from aircraft,balloons, rockets and satellites to overcome theabsorbing effects of the terrestrial atmosphere.
In March 1986 just a month after perihelionwhen the cometary activity was near its peak, anarmada of five spacecraft converged on the comet. In one eventful week the spacecraft encountersaltered forever our perception of the cometaryenvironment as detailed below:
(i) The cometary nucleus was imaged for thefirst time. A potato or avocado shaped dark nucleus (albedo < 4%), 16 km X 8 km x 8 km wasseen with highly asymmetric and localized centresof activity!.
(ii) In situ measurements also detected extremely small grains (- 10 - 16 g) rich in low Z elements - the so called CHON particles. These particles which cannot be detected from the earthsolve the problem of missing carbon in the come-
296
tary atmosphere and underscore the importanceof organic matter in comets.
(iii) A magnetic field free cavity surrounds thenucleus at a distance of 4500 km. This contact
surface separates the outflowing pure cometaryplasma from the solar wind contaminated cometary plasma.
Notwithstanding the significant achievements ofspacecraft encounters, some very important advances in our understanding of comets were alsomade from earth-based observations. For the first
time, from near infrared spectroscopic observations near 2.65 flm taken from an aircraft, it wasunambiguously established that water is the dominant constituent of the cometary nucleus2•
A comet, during its perihelion passage, is usually a higWy time variable object. Apart from itsdramatic evolution from nearly a point source toa spectacular body displaying a structured comaand a long tail, a comet also exhibits a number ofshort term events like dust jets, brightenings, outbursts, structures in the ion tail, disconnectionevents, etc. In order to continuously monitor thecomet and to coordinate the observations the International Halley Watch (IHW) was set up withseveral subdisciplines: (a) Astrometry, (b) Infraredspectroscopy, (c) Large scale phenomena, (d)Near nucleus studies, (e) Photometry, (f) Radiostudies, (g) Spectroscopy and (h) Meteor studies.Over a thousand professional astronomers from40 countries were involved in keeping a closewatch on Halley with a variety of techniques.
The Indian astronomical community participated actively in the coordinated Halley observationsunder the aegis of IHw. An Indian Halley Observation Programme (IHOP) comprising astronomers from the leading Indian institutions wasformed to coordinate the Indian observations. Af-
I I "I I;;' III 11'11· I
CHANDRASEKHAR :INDIAN OBSERVATIONS ON COMET HALLEY
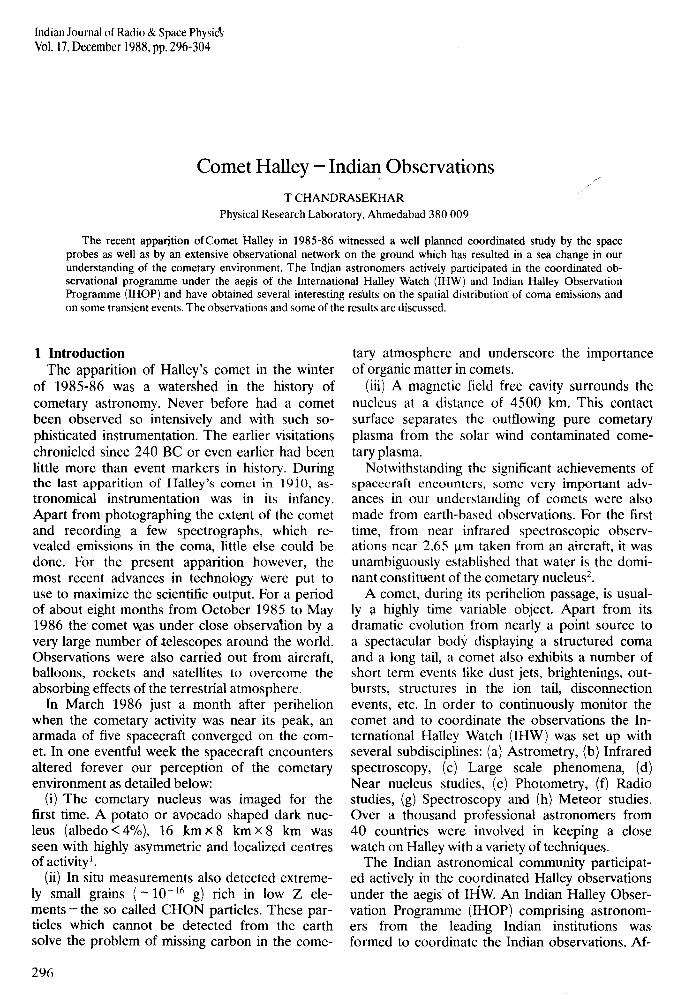
nucleus, (b) aperture displaced antisunward and(c) aperture displaced normal to the sun-cometaxis. The displacements totalled about i' from thenucleus.
ISRO telemetry,AFU-75 camera (f/3.5, Wide fieldtracking and 210 mm f.1.) photographycommand net- 10° x 14°work (Kavalur) astrometry*The stat mark indicates that these are collaborative experiments between PRL and IIA, i.e. PRL instruments used with IIA
telescope.
IHWfilter
imagery
eN rotationaltemperatureMeteor streamstudiesPhotoelectric
spectrometryrange: 32007000 AWidefield
photography4°.5 x 6°.5
Schmidt
MeinelspectrographMeteor radar
Spectrometer
10000 m2 103 MHz inter
planetary scintillation (IPS)
45cm
50 MHz
35 cm Celestron + Imageintensifier camera (Mode 1)
continuumIondensityinhomogeneities
array in the tailTata Institute 327 MHz Ooty radio telescope londensityof Fundamental inhomogeneit-Research ies
(TIFR), Bom,- in the tailbay
35 cm Celestron + Fabry-Perot Imagingoptics + Image intensifier spectroscopycamera (Mode 2) in C2,H,[O]-
interferograms*1 m (Kavalur) + Piezo-electric High resolution
Fabry-Perot spectrometer interferometricspectroscopy in[0I]6300AandNH2(0-8-0)
*1 m (Kavalur) + Photopolari- Polarization inmeter with IHW filters the emission
bands and
Table I - Observational Facilitiesfor Comet HalleyInstitution Telescope Instrument Remarks
Indian Institute 1 m Photoelectric b A =40 A; 20 Aof Astrophysics scanner tange: 3900-(IIA) 6200 A
40 cm Photometer IlIW filter
~otometry4f x 5° photographs
Astrograph AstrometryCentre for 20 cm
Advanced Studyin Astronomy 1.2 m(CASA),Osmania
UniversityUttar Pradesh 1 mState Observa-
tory (UPSO),NainitalPositional 35 cm Celestron with 20 cm
Astronomy Schmidt cameraCentre (PAC),Calcutta
PhysicalResearch
Laboratory(PRL),Ahmedabad
ter the campaign of observations ended and someanalysis had been done, a National Symposium onComet Halley was held in October 1987 in Bangalore wherein the main results were presentedand summarized. Some of the specific questionswhich the Indian astronomers addressed themselves to were the following:
(i) What are the values of column densities,production rates and abundances of neutral andionic species in the coma and tail of Comet Halley?
(ii) Are the above values time variable and alsospace variable? What are the scale sizes involved?Can we infer the underlying causes of the variability?
(iii) Are there detectable ion density inhomogeneities in the tail of the comet? Can we detect
radio scintillatiorts due to these inhomogeneities?(iv) Is there polarization in the emission bands?(v) Are there transient events occurring in the
coma in the time scale of :5 1 hr? Are these trig-gered by the sector boundary crossings by the interplanetary magnetic field or by high speed solarwind streams?
Table 1 summarizes the observational facilities
available to the Indian astronomers during theHalley campaign. In addition to the professionalastronomers, groups of enthusiastic amateur astronomers also actively participated in the Halleyobservations employing a variety of instrumentsranging from the naked eye to sophisticated 12.5cm aperture Schmidt cameras. A large number ofwide field photographs and sketches have beenobtained by them. Table 2 lists the details of theIHW filters used by many Indian observers.
2 Indian Observations
2.1 Indian Institute of Astrophysics (IIA), Bangalore
An extensive programme of observations consisting of spectrophotometry, imaging photometryand astrometry was carried out at the telescopesof the Vainu Bappu Observatory, Kavalur. Resultsof spectrophotometric observations - the fluxes inthe emissions bands and in the continuum as wellas the distribution of fluxes as a function of radialdistance from the nucleus - have been reported3•
The observations consisted of spectral scanstaken with an automated spectral scanner using athermo-electrically cooled photomultiplier tube inthe pulse counting mode at the Cassegrain focusof the 102 em retlector at Kavalur. Entrance aperture to the scanner was 25".9. Typically thespectral range covered was 3900 to 6200 A. Thespectral resolution was normally - 40 A.. Observations were taken with (a) aperture centred on the
297

INDIAN J RADIO & SPACE PHYS, VOL. 17, DECEMBER 1988
Table 2 - IHW Filters
Species
WavelengthBandwidthRemarksA
(FWHM),A
Continuum
3650100CN
387050(0,0) VioletsystemC,
406070CO+
426065(2,0) ProminentdoubletstructureContinuum
484565
C2
514090(0,0) bandContinuum
684090
H2O+
7000175
Using observations of standard stars, from thespectral energy curves the flux (F)J in the emissionbands of C3, CN, CH, Swan bands, NHz andHzO+ over and above the smoothed level of thecontinuum have been evaluated. The total number
of molecules in the line-of-sight through the comet for a resonance fluorescence emission is derived from the relation
FA 4rr~zN=--g
where
FA Band flux in the 26" diaphragmg Fluorescence efficiency factor for the emissionconcerned~ Comet-earth distance
Fig. 1 shows the variation of spectral energycurves with the displacement of aperture awayfrom the nucleus. The rapid decrease in the bandemissions away from the imcleus is clearly seen.In Table 3 the total number of molecules (N) ofeach species contained in a cylinder of diameter25".9 in the line-of-sight extending through thenucleus is given.
A comparison of the observed and theoreticalband sequence flux ratios for the Swan bands ofthe Cz molecule has been made. According toSivaraman et af.3 the Swan band sequence flux ratio F(~v=+l)/F(~v=O) and F(~v=-l)/F(~ v= 0) obtained from the observations do notmatch the ratio for Cz emission predicted by eventhe sophisticated model of Krishnaswamy andO'DeIl4• The Cz problem, i.e. the discrepancy between observations and theory based on resonance fluorescence mechanisms continues to be enigmatic.
From the observations, emission profiles, i.e. logFA versus log p where p is the distance of centre
298
1.4
1.01
0.6
0.6
o.s
IVI
NIE 0.5u\IIt7l•..~u..-< 1.3
X::J...Ju.. o.s
3.0
2.2
1.4
4000 4400
Fig. 1 - Spectrophotometric observations made on 1986March 31.9 [Plot of flux Fl. versus wavelength correspondingto 6 locations (deisgnated N, 2, 3, 6) of the 26" diaph-ragm within the coma, N being position on the nucleus. The 5successive positions of the diaphragm (- 28" from one another) in the anti-sunward direction are shown in the inset.Emission in the bands decreases rapidly as the diaphragm is
displaced away from the nucleus(r= 1.18, Ll = 0.53 AU)]
of aperture from the nucleus, have also been constructed for C3, Swan bands of Cz and continuumat 4860 A. Emission profiles along the radiusvector, i.e. the sun-comet line show that on thesame night 3 bands of Cz exhibit the same gradient while profiles of C3 and the continuum aresteeper. Normal to the radius vector the gradientsare steeper for Cz while the reverse is true for C3
and the continuum. The gradients on either sideof the radius vector are not the same. The profiles are clearly asymm~tric for all the species.
The ratio of the fluxes in the continuum over
the range 4000-6000 A to the sum of the fluxesin the Swan bands of Cz and C3 emission hasbeen taken as a measure of the dust-to-gas ratio.The ratio thus defined decreased from Nov. 1985
r-4.:
I I II 'I !!'1" '" 'I
------ --------~------------. ~
CHANDRASEKHAR :INDIAN OBSERVATIONS ON COMET HALLEY
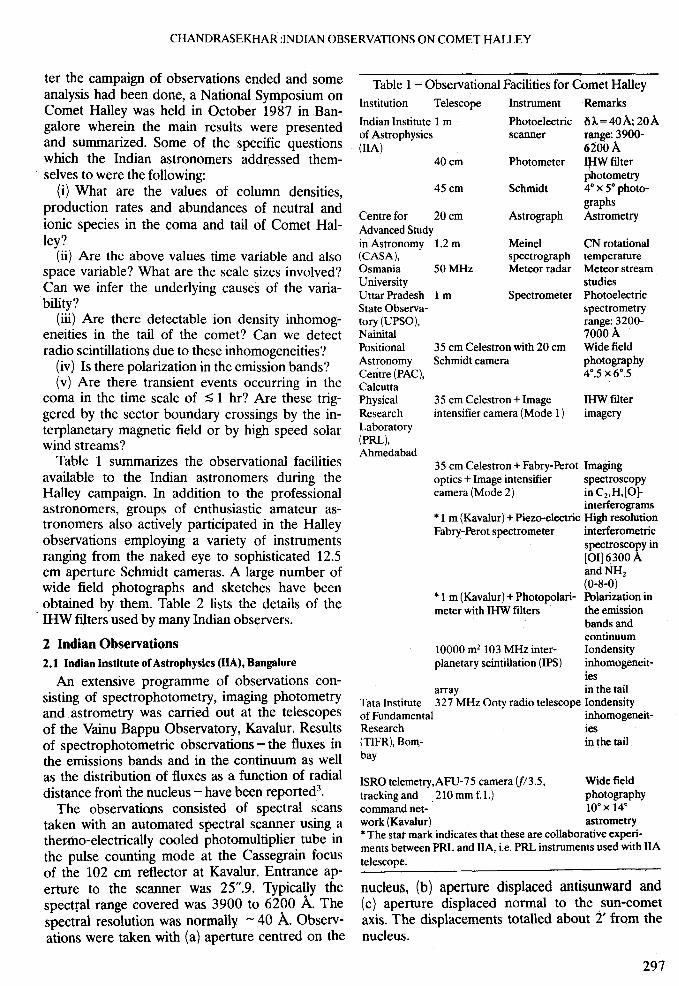
Table 3 - Column Densities Integrated over the Aperture (n:R2)
Date
AUR LogNUT
104 !an1985-86
C3Cz (1,0)Cz (0,0)Cz(O,l)NHzHzO+
(4040 A)(4700 A)(5165 A)(5500A)(0,7,0)
Nov. 16.904
1.710.67-293429.3129.2830.0728.54Nov 17.748
1.690.66-29.2929.3229.2530.3528.43Nov 18.762
1.680.65-29.2729.2729.2330.2728.36Dee 8.813
1.380.65-29:2029.1128.13Dee 19.576
1.210.8428.9429.8329.9830.12Dee 20.590
1.200.8628.8229.7830.0530.14Mar 21.918
1.000.7429.0229.7729.9530.12Mar 23.950
1.040.6928.8329.6329.8930.04Mar 28.883
1.110.5829.2529:7829.9230.08Mar 29.896
1.130.5529.16·30.0130.1830.19Mar 30.903
1.140.5328.8229.4929.7029.72Mar31.904
1.160.5129.2329.7730.0230.00
April 5.848
1.240.4329.0729.7929.7729.75
April 12.850
1.340.3929.1729.5629.5429.76
April 17.694
1.420.4429.0029.4729.4229.5930.45
April 30.638
1.620.7228.8329.6529.6429.87
May 7.662
1.720.9329.3929.8029.6629.77
16.904* (r= 1.71 AU) to Dec. 20.590 (r= 1.20AU). After perihelion the ratio increased fromMarch 1986 21.918 (r= 1.0 AU) to May 7622(r= 1.72 AU). The behaviour is consistent withthe breaking up of. the grain into fine particles byUV and solar wind and the general increase ofgaseous component during the preperihelion period considered. In the post perihelion period, theincrease is attributed to grain growth.
In addition to spectrophotometric observationslarge-field photographs of the coma and tail weretaken regularly with the Schmidt telescope. About150 good quality photographs have been obtainedwhich show several time varying features in theplasma tail.
2.2 Centre for Advanced Study in Astronomy (CASA),Osmania University
Photoelectric observations of Comet Halley inthe IHW filters for 10 nights with the 1.2 m telescope have been reported. Fluxes, column densities and production rates for the various emissionspecies have been determined.
The CN (0,0) band near A. 3880 A. was recorded on five spectrograms with the Meinelspectrograph. The spectrograms were analyzed toobtain rotational temperatures in the range 540630 K in the preperihelion phase. From the observations in the post perihelion period a rota-
* These numbers denote the exact time of observation in UT
as fraction of a day. For example, Nov. 1985 16.904 meansthat the date is 16th Nov. 1985 and the time of the day is0.904, i.e. the fraction of the day eqivalent to is 21.6 hrs.
tional temperature variation with heliocentric distance (r) of 430/,J-A was derived.
Astrometric observations with the 20 cm astro
graph gave positions of Comet Halley in agreement with Yeoman's orbit No. 33 within 1 arc s.
2.3 Uttar Pradesh State Observatory (UPSO), Nainital
Photoelectric spectrophotometry of the coma inthe wavelengtli region 3200-7000 A was carriedout in the post-perihelion period (r-1.4-1.6 AU).Emission features due to· CN, CH, Cz and C3
were clearly seen. Abundances of Cz and CNhave been estimated and production rates derivedin the usual way using band luminosities.
Photographic pho.tometry of the cometary picture taken on 15 Mar. 1986 at the 1 m telescopethrough a Schott GG 385 filter on Kodak 103 a-ohas been carried out. Average B magnitudes permm of the film at various distances from the nucleus are determined5• It is found that the integrated total magnitude within a radius of 2 arc mincentred on the nucleus is 5.5.
2.4 Positional Astronomy Centre (PAC), Calcutta
Using a 20 cm aperture Celestron Schmidtwide field photographs 4°.5 x 6°.5 of the cometfield have been obtained during the period Nov.1985 to April 1986. Analysis of a large jet likefeature seen on 17 Mar. 1986 spiralling outwardfrom the nucleus shows a prograde nuclear rotation of 53 ± 5 hours with an initial velocity ofejection of 0.65 kmls.2.5 Physical Research Laboratory (PRL), Ahmedabad
The Physical Research Laboratory carried out
299
INDIAN J RADIO & SPACE PHYS, VOL. 17, DECEMBER 1988
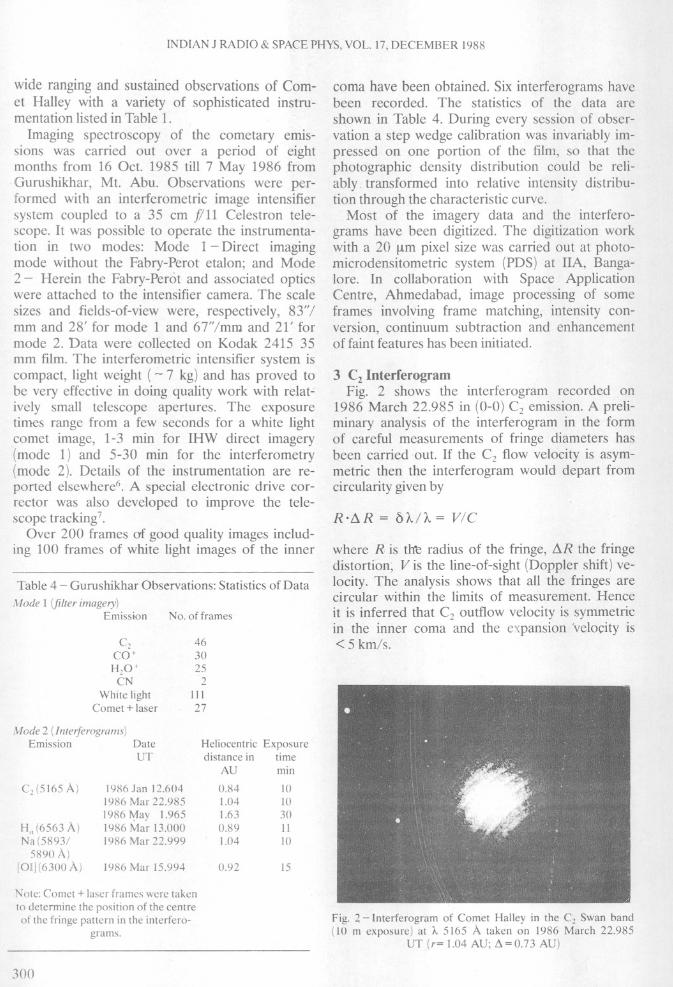
Table 4 - Gurushikhar Observations: Statistics of Data
Mode 1 (filler imagery)Emission No. of frames
C2 46CO+ 30
H20+ 25CN 2
White light 1I1Comet + laser 27
R·!:J.R = oA/A = vie
where R is th"e radius of the fringe, !:J.R the fringedistortion; V is the line-of-sight (Doppler shift) velocity. The analysis shows that all the fringes arecircular within the limits of measurement. Henceit is inferred that Cz outflow velocity is symmetricin the inner coma and the expansion 'velocity is< 5 km/s.
coma have been obtained. Six interferograms havebeen recorded. The statistics of the data areshown in Table 4. During every session of observation a step wedge calibration was invariably impressed on one portion of the film, so that thephotographic density distribution could be reliably. transformed into relative intensity distribution through the characteristic curve.
Most of the imagery data and the interferograms have been digitized. The digitization workwith a 20 !-tmpixel size was carried out at photomicrodensitometric system (PDS) at IIA, Bangalore. In collaboration with Space ApplicationCentre, Ahmedabad, image processing of someframes involving frame matching, intensity conversion, continuum subtraction and enhancementof faint features has been initiated.
3 Cz InterferogramFig. 2 shows the interferogram recorded on
1986 March 22.985 in (0-0) Cz emission. A preliminary analysis of the interferogram in the formof careful measurements of fringe diameters hasbeen carried out. If the Cz flow velocity is asymmetric then the interferogram would depart fromcircularity given by
Fig. 2 - Interferogram of Comet Halley in the C2 Swan band(10 m exposure) at f... 5165 A taken on 1986 March 22.985
UT (r= 1.04 AU; L\ = 0.73 AU)
0.92 15
Heliocentric Exposuredistance in time
AU min
0.84 101.04 101.63 300.89 II1.04 10
1986 Mar 15.994
1986 Jan 12.6041986 Mar 22.985
1986 May 1.9651986 Mar 13.0001986 Mar 22.999
H,,(6563 A)Na(5893/
5890 A)[01](6300 A)
Note: Comet + laser frames were taken
to determine the position of the centreof the fringe pattern in the interfero
grams.
Mode 2 (Inleiferogrlll1ls)Emission Date
UT
wide ranging and sustained observations of Comet Halley with a variety of sophisticated instrumentation listed in Table 1.
Imaging spectroscopy of the cometary emissions was carried out over a period of eightmonths from 16 Oct. 1985 till 7 May 1986 fromGurushikhar, Mt. Abu. Observations were performed with an interferometric image intensifiersystem coupled to a 35 cm .fl11 Celestron telescope. It was possible to operate the instrumentation in two modes: Mode 1 - Direct imagingmode without the Fabry-Perot etalon; and Mode2 - Herein the Fabry-Perot and associated opticswere attached to the intensifier camera. The scale
sizes and fields-of-view were, respectively, 83"/mm and 28' for mode 1 and 6T/mm and 21' formode 2. Data were collected on Kodak 2415 35mm film. The interferometric intensifier system iscompact, light weight ( - 7 kg) and has proved tobe very effective in doing quality work with relatively small telescope apertures. The exposuretimes range from a few seconds for a white lightcomet image, 1-3 min for IHW direct imagery(mode 1) and 5-30 min for the interferometry(mode 2). Details of the instrumentation are reported elsewhere6. A special electronic drive corrector was also developed to improve the telescope tracking 7.
Over 200 frames af good quality images including 100 frames of white light images of the inner
300
CHANDRASEKHAR :INDIAN OBSERVATIONS ON COMET HALLEY
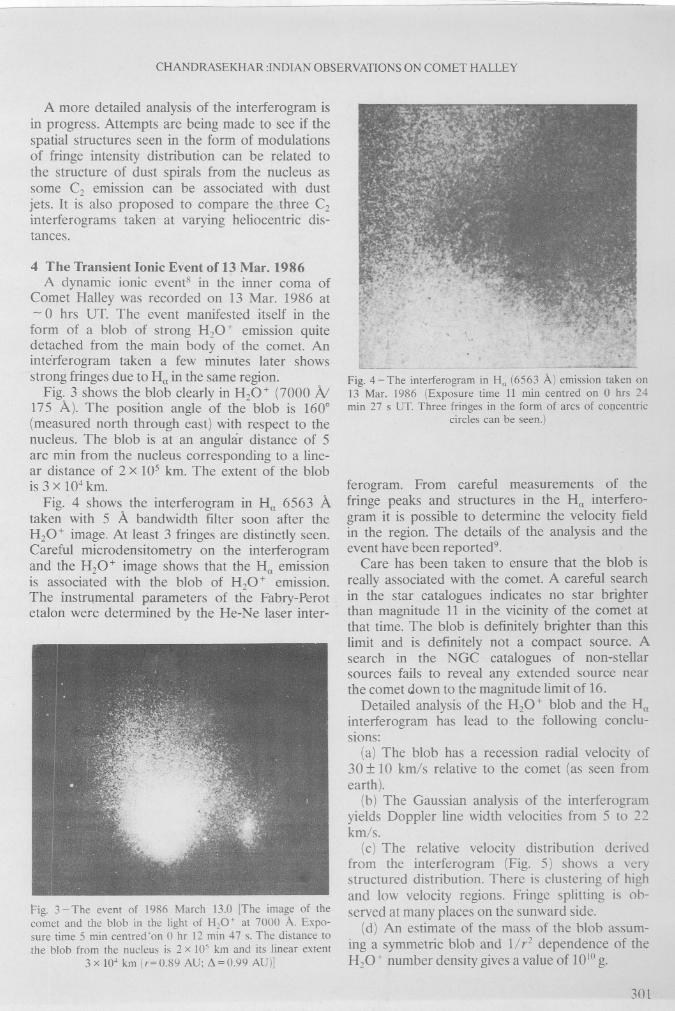
Ib.-....-_
Fig. 4-The interferogram in H" (6563 'A.) emission taken on13 Mar. 1986 (Exposure time 11 min centred on 0 hrs 24min 27 s UT. Three fringes in the form of arcs of concentric
circles can be seen.)
ferogram. From careful measurements of thefringe peaks and structures in the Ha interferogram it is possible to determine the velocity fieldin the region. The details of the analysis and theevent have been reported9.
Care has been taken to ensure that the blob is
really associated with the comet. A careful searchin the star catalogues indicates no star brighterthan magnitude 11 in the vicinity of the comet atthat time. The blob is definitely brighter than thislimit and is definitely not a compact source. Asearch in the NGC catalogues of non-stellarsources fails to reveal any extended source nearthe comet down to the magnitude limit of 16.
Detailed analysis of the H20 + blob and the Haimerferogram has lead to the following concluSIOns:
(a) The blob has a recession radial velocity of30 ± 10 km/s relative to the comet (as seen fromearth).
(b) The Gaussian analysis of the interferogramyields Doppler line width velocities from 5 to 22km/s.
(c) The relative velocity distribution derivedfrom the interferogram (Fig. 5) shows a verystructured distribution. There is clustering of highand low velocity regions. Fringe splitting is observed at many places on the sunward side.
(d) An estimate of the mass of the blob assuming a symmetric blob and 1/ r2 dependence of theH20+ number density gives a value of 1010 g.
Fig. 3 - The event of 1986 March 13.0 [The image of thecomet and the blob in the light of HzO+ at 7000 'A.. Exposure time 5 min centred'on 0 hr 12 min 47 s. The distance tothe blob from the nucleus is 2 x IOj km and its linear extent
3 x 10⁴ km (r= 0.89 AU; ~ = 0.99 AU)]
A more detailed analysis of the interferogram isin progress. Attempts are being made to see if thespatial structures seen in the form of modulationsof fringe intensity distribution can be related tothe structure of dust spirals from the nucleus assome C2 emission can be associated with dustjets. It is also proposed to compare the three C2
interferograms taken at varying heliocentric distances.
4 The Transient Ionic Event of 13 Mar. 1986A dynamic ionic event8 in the inner coma of
Comet Halley was recorded on 13 Mar. 1986 at- 0 hrs UT. The event manifested itself in the
form of a blob of strong H20 + emission quitedetached from the main body of the comet. Aninte"rferogram taken a few minutes later showsstrong fringes due to Ha in the same region.
Fig. 3 shows the blob clearly in H20+ (7000 AI175 A). The position angle of the blob is 1600(measured north through east) with respect to thenucleus. The blob is at an angular distance of 5arc min from the nucleus corresponding to a linear distance of 2 x 10⁵ km. The extent of the blobis 3 x 10⁴ km.
Fig. 4 shows the interferogram in Ha 6563 Ataken with 5 A bandwidth filter soon after theH20+ image. At least 3 fringes are distinctly seen.Careful microdensitometry on the interferogramand the H20 + image shows that the Ha emissionis associated with the blob of H20 + emission.The instrumental parameters of the Fabry-Perotetalon were determined by the He-Ne laser inter-
301
INDIAN J RADIO & SPACE PHYS, VOL. 17, DECEMBER 1988
EVENT OF 13 MAR.1986
DIFFERENTIAL VELOCITY MAP DF THE BLOB REGION IN THE PLANE OF T HE SKY IN km Is
..-././ ...-._._ ._._._._3_ .....",,' ..•.•.•.
"
""
+H20 CONTOUR LEVELS _
I 32 % 'mo. (Carnell2 16 %'3 8 %
Sky 2 %
INTERPLANETARY MAGNETICFIELD
HII t H1 0 SECTOR------- BOUNDARY
HIIJ Hl 0H1 0
- "" tan 42HII
MAX ERRORS
o ± 2 km/s
o ± 8 km/s
IoS: SPLIT FRINGE ZONE~o+ ISOPHOTES
o LOW VELOCITY ZONE
~ HIGH VELOCITY ZONE
Fig. 5 - The velocity field in the region of the blob denved from the interferogram of Fig. 4 [A structured velocity distributionwith many pockets of large differential movement (split fringe positions) can be seen]
(e) The dispersal time of the blob for a symmetric expansion rate of 30 kmls is half an hour.The event is therefore a transient one.
An explanation of the event can be attemptedfrom the state of the interplanetary magnetic fieldgeometry in the vicinity of the comet. The eventoccurred at the time of the sector boundarycrossing of interplanetary magnetic field by thecomet. Disconnection events are known to occur
particularly at these times 10 though other explanations for DEs in terms of high speed solar windstreams also exist 11. The event witnessed on 13Mar. 1986 is not a typical disconnection eventwherein a portion of plasma tail gets detachedfrom the comet and accelerates away anti-sunward. In the present case the event occurs in thecoma and its motion appears to be perpendicularto the sun-comet line. A detailed model of the so
lar wind comet interaction with the reversingmagnetic field of the interplanetary sector boundary serving as a trigger for instability processesis needed for a proper explanation of the event.
5 Piezo-electric Fabry-Perot Observations of[01] and NH2In collaboration with scientists from IIA, PRL
made high resolution observations (A/b). - 6 x 10⁴)of the comet in the emissions of [01], NHz (0-8-0)and Ha. The experiment was aimed at studyingthe spatial distribution of hydrogen and oxygenatoms and then velocity fields through high spectral and spatial resolution observations of [01]6300 A.. and 6563 A.. emission of Ha' A sophisticated piezo-electrically controlled and scannedFabry-Perot interferometer was used for this purpose at the 1 m telescope at Kavalur in April1986 (r-1.3-1.4 AU; ~=0.42 AU). Details ofthe instrumentation have been reported1z.
Under low resolution, study of cometary [01]6300 A.. emission is always limited by the blencing with the lines of the NHz (0-8-0) band. In th.sexperiment the high resolution (b). - 0.1 A..) e'}sured clear separation of cometary [01] from allthe lines of the NHz (0-8-0) band and also fromthe terrestrial airglow emission (Fig. 6). Line pro-
302
lJ< >1'11II'·1 t!l11f 'jl , I I fl'"

CHANDRASEKHAR :INDIAN OBSERVATIONS ON COMETHALLEY
I' I
"I
lSO.0
; e<-EARTHfTERRES1RIAl ~ ·t..l l AIRGLOWI ~ j. l j.w- ~ COMET1 2 3 4 5 ERROR BAR
w>t= -10.0<{-'wex:
-50.00.0 1.0 2.0 3.0 ".0 - 5.0
WAVELENGTHCJ()
Fig. 6 - The high resolution spectrum in the neighbourhoodof the 6300 A obtained with the piezo-electric Fabry-Perotspectrometer [2 indicates position of terrestrial 6300 airglowemission. 1 and 6 refer to the cometary 6300.304 A [01] line.3 and 4 are identified with cometary NH2 (0-8-0) transitions313-303 at 6299.004 A and 212-202 at 6298.6 A, respectively.The line profiles derived from the spectrum are symmetricwith Doppler widths (FWHM) of - 3 km/s. Feature 5 is un-
identified.]
file analysis shows that both [01] and NHz rotationallines were symmetric with a Doppler velocity (FWHM) of - 3 km/s. The ratio NHz (212-20z,
0-8-0)/[01] is 0.5 averaged over the 50 arc s aperture used. The cometary [01] flux is estimatedto be - 150 ± 40 Rayleighs consistent with measurements made earlier. No H emission could be
detected; upper limits of its intensity based on instrumental noise lead to a value of - 30 R.
6 Event of 8 Jan. 1986The white light images taken on 1986 Jan.
8.590 and Jan. 8.632 UT (r- 0.9 AU; ~ - 1.29AU) show a distinct condensation region in thetail direction at a distance of (2.4-3.0) x 105 kInfrom the nucleus. From the movement of the condensation relative to the comet in the two framesit is inferred that the average velocity of the feature is -28 ± 3 km/ s in a direction inclined at 56°northward of the ion tail in the plane of the sky.The feature appears to be mainly due to CO + asan image taken with 5900 A high pass filter between the two white light images fails to reveal it.The condensation might be telated to some nuclear activity observed in far IR region at 8.1 UTand to the tail structures observed in white fieldr\hotographs taken later at 8.719 UT on.the sameday in Czechoslovakia.
7 PhotopolarimetryPhotopolarimetric observations of Comet Hal-
ley in the IHW filters were carried out with thePRL photopolarlmetric system in March 1986with the 1 m telescope at Kavalur. These observations were also part of the collaborative programme with IIA on Comet Halley.
It was found that the linear polarization in theneutral emission bands Cz, C3, CN vary from 5 to7% while for the ionic species CO+ and HzO+ alarge polarization - 15% was observed.
Polarization measurements were also made
through narrow band interference filters centredat 3420, 4420, 5270, 5750 and 6420 A. Except5750 A filter which includes NH emission therest are free from cometary emission. The continuum linear polarization is found to slightly increase with wavelength (17% in UV to 20% in thered).
8 IPS Observations
Using the 10000 mZ 103 MHz IPS array atThaltej, Ahmedabad, observations of the occultation of several scintillating radio sources by theion tail of Comet Halley in Dec. 1985 have beenmade 13. Additional scintillations due to ion dens
ity inhomogeneities in the cometary ion tail havebeen reported. A scale size for .the inhomogeneities of - 100 kIn and < N; > + -10 el./cm3 havebeen derived.
Similar scintillations at 408 MHz dUe to thecometary ions have been reported by Slee et al.for 29 Mar. 1986 (Ref. 14). However, the observations made at 327 MHz by the Ooty radio telescope have not yielded any additional scintillations which could be attributed to the cometl5•
Clearly, a coordinated programme of these observations is needed on a future bright comet.
9 ISRO (Kavalur)-AstrometryThe aim of the investigation is to study the
non-gravitational effects (due to jet action) on theactual orbit of Comet Halley. Using an AFO-75Camera (f/3.5, 210 mm focal length) at Kavalur,about 150 photographs of the comet field(10° x 14°) were qbtained during the entire apparition. The precise topocentric equatorial coordinates of Comet Halley obtained from the photographs were used for orbit determination. Bestconvergence is obtained only when one day intervals of observations are used.
Apart from the observations of Comets Halleyand Giacobini Zinner a number of theoretical in
vestigations pertaining to the comets were alsotriggered by the Halley apparition. Some of thethemes on which theoretical work proceeded aregiven below:
303
,\,

INDIAN J RADIO & SPACE PHYS, VOL. 17. DECEMBER 1988
I 'I' q,. I
III,Iii 'I'
2 Weaver H A, Mumma M J, Larson H P & Davis D S,
Proceedings of the twentieth ESLAB symposium on theexploration of Halley's comet, Heidelberg, 27-31 Oct.1986, ESA SP-250 (ESA Publications Division, Netherlands). Vol. J, 1986,329.
3 Sivararnan K R, Babu G S D, Shylaja B S & Raj MohanR, Astron &Astrophys (Germany). 187 (1987) 543.
4 Krishnaswarny K S & O'Dell C R, Astrophys J (USA),216 (1977) 158.
5 Joshi S C & Sanwai B B, Earth, Moon & Planets (Netherlands), 39 (1987) 203.
6 Chandrasekhar T, Ashok N M, Debi Prasad C & Desai J
N. Opt Eng( USA), 27 (1988) 67.7 Ash<)k N M, Chandrasekhar T & Manian K S B, J Phys
E (GB), 20 (1987) 469.
(! Chandrasekhar T, Debi Prasad C, Desai J N &. Ashok NM, Proceedings of the symposium on diversity and similarity of comets, Brussels, 6-10 April 1987, ESA SP (ESAPublications Division, Netherlands), 1987,278.
9 Debi Prasad C, Chandrasekhar T, Desai J N & Ashok NM, J Astrophys &Astron (India), 1988 in press.
10 Niedner M B & Brandt J C, Astrophys J (USA), 223(1978)655 ..
11 Ip W H & Mendis D A, Astrophys J (USA), 223 (1978)671.
12 Chandrasekhar T, Debi Prasad C, Desai J N & Ashok N
M, Opt Eng( USA), 27 (1988) 1088.13 Alurkar S K, Bhonsle R V & Sharma A K, Nature (GB),
322(1986)493.14 Slee 0 B, Mc Connel D, Lirn J & Bobra A D, Nature
(GB), 325 (1987) 699.15 Ananthakrishnan S, Manoharan P K & Venugopal V R,
Nature (GB), 329 (1987) 698.
" n'I""'1 ,,'IIIIIl' I
(i) Helical wave structures in the ;:;omet plasmataiL
(ii) Hydromagnetic turbulence III cometaryplasma.
(iii) Speculations on the Oort cloud and its possible links with interstellar matter.
(iv) Scattering properties of cometary grains.
10 Conclusion
The Indian astronomical community has participated vigorously in the observations of the brightest and most well predicted periodic comet ofour times. A number of important results havebeen achieved. More will emerge when the analysis of the huge pile of photographic data is complete. Many new techniques and instruments weredeveloped for the Halley apparition which willprove to be of great use as and when a bright newcomet appears unheralded suddenly in theheavens.
304
AcknowledgementFinancial assistance for many of the Halley ob
servational programmes came from Departmentof Science and Technology and the Departmentof Space, which is gratefully acknowledged.
4 References1 Keller H U et al., Astron & Astrophys (Germany), 187
(1987) 807 .
t
•• "