common core state standards 6 – 8 mathematicsmaccss.ncdpi.wikispaces.net/file/view/math 6-8...
TRANSCRIPT
Common Core State Standards 6 – 8 Mathematics
Presented by NC Department of Public Instruc8on
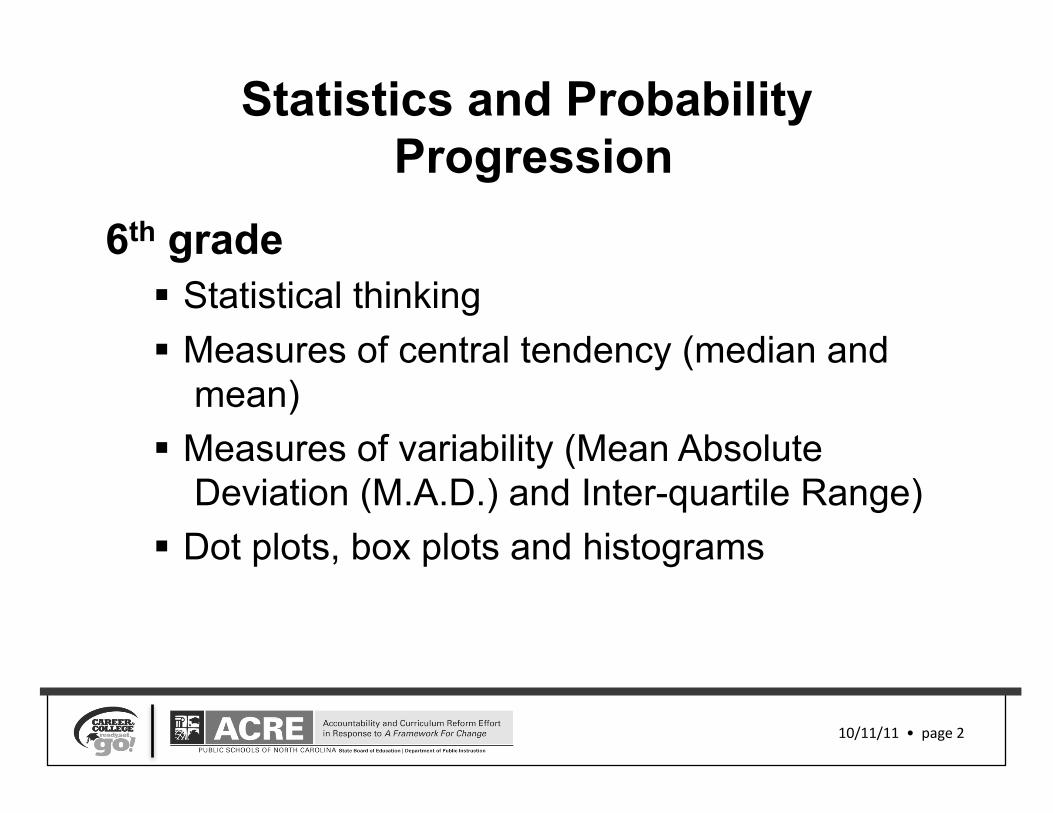
Statistics and Probability Progression
6th grade Statistical thinking Measures of central tendency (median and
mean) Measures of variability (Mean Absolute
Deviation (M.A.D.) and Inter-quartile Range) Dot plots, box plots and histograms
10/11/11 • page 2
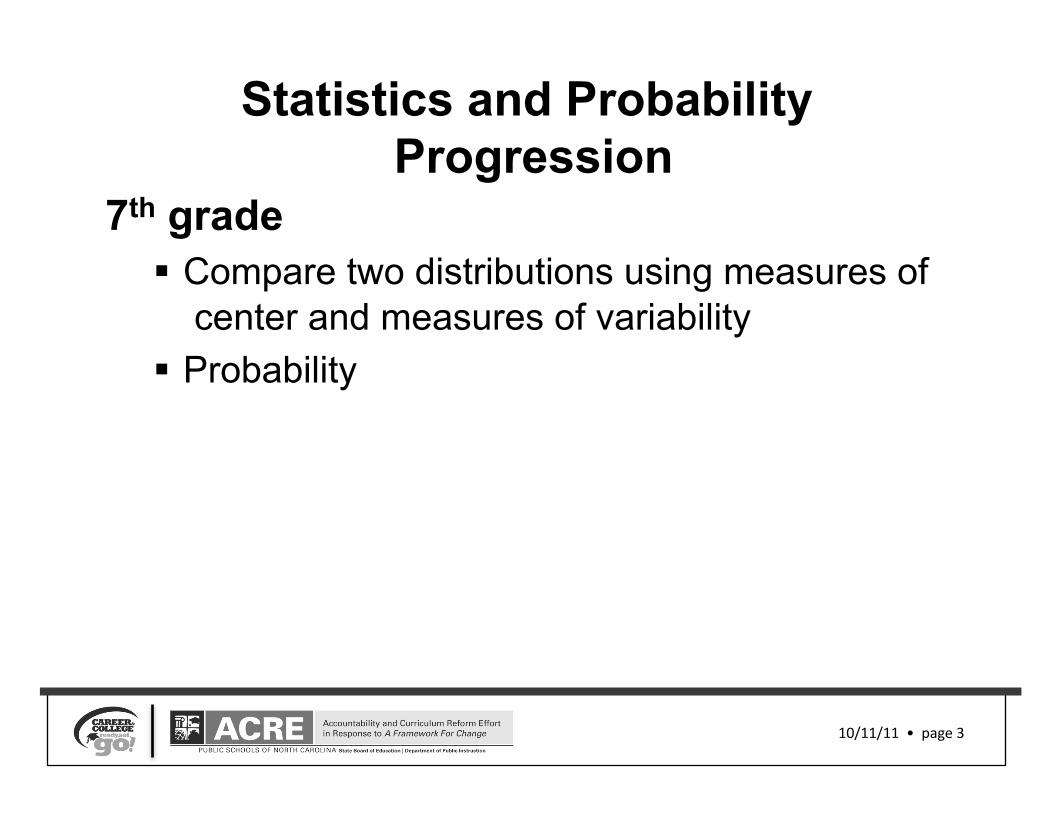
7th grade Compare two distributions using measures of
center and measures of variability Probability
10/11/11 • page 3
Statistics and Probability Progression
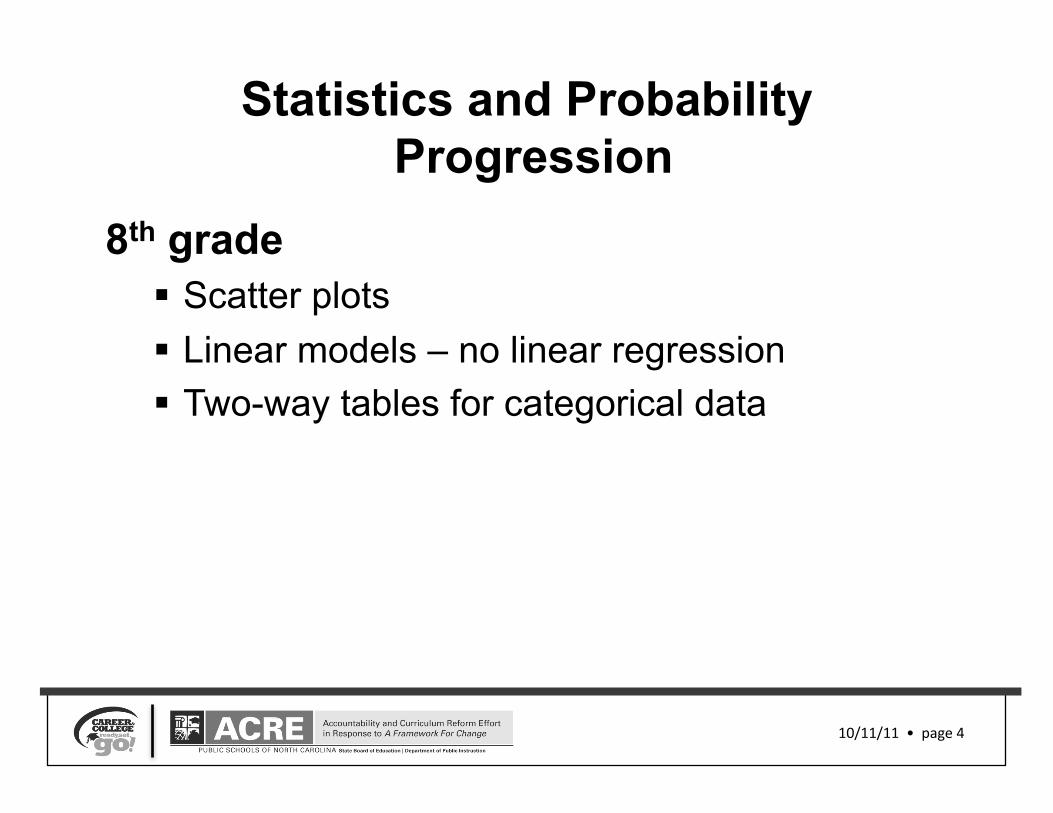
8th grade Scatter plots Linear models – no linear regression Two-way tables for categorical data
10/11/11 • page 4
Statistics and Probability Progression
High School Math One Interpret shape, center, spread and outliers Incorporate technology Standard deviation Scatter plots, linear models, LSRL and
correlation coefficient Two-way tables (joint, marginal, and
conditional relative frequencies)
10/11/11 • page 5
Statistics and Probability Progression

Finding the Median from a Dot Plot
10/11/11 • page 6
If you only know the MEDIAN…
Turn and Talk: What information can you give about the
data set?
What information can’t you give about the data set?
10/11/11 • page 7

Turn and Talk
Remove two values from the original data set so that:
a. The median stays the same b. The median increases c. The median decreases
10/11/11 • page 8
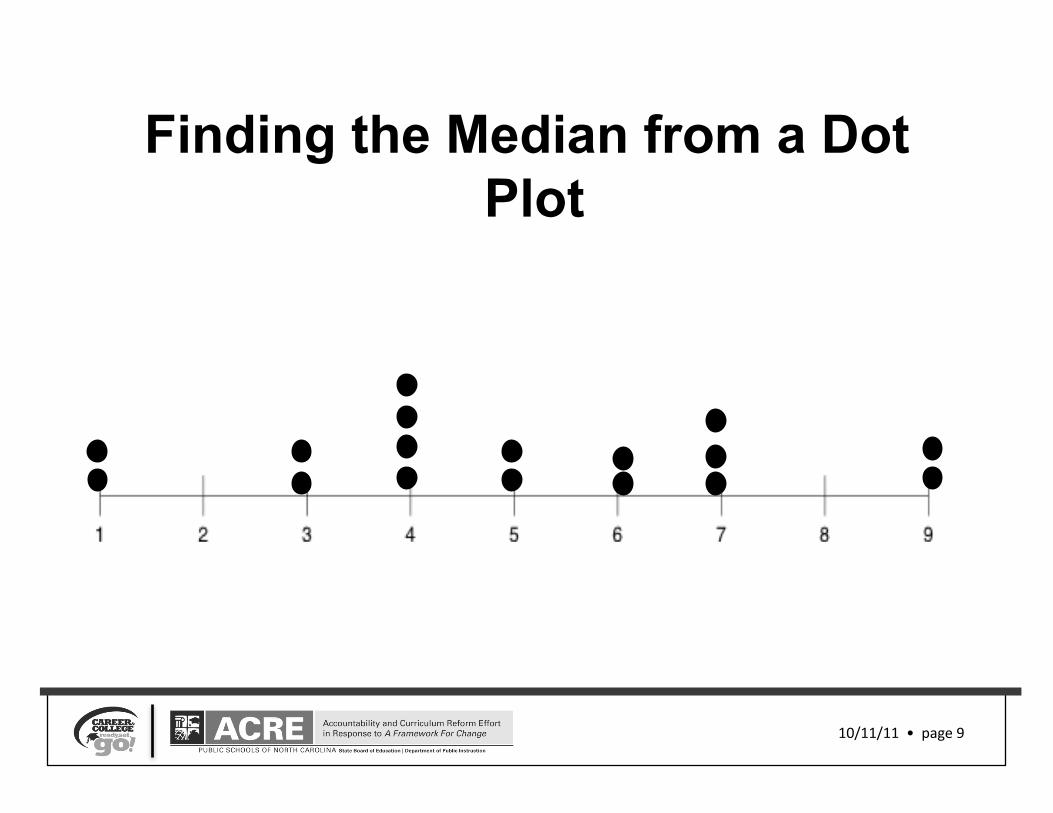
Finding the Median from a Dot Plot
10/11/11 • page 9
Turn and Talk
Add two values to the original data set so that
a. The median stays the same b. The median increases c. The median decreases
10/11/11 • page 10
What does it mean to understand the “mean”?
10/11/11 • page 11

Mean As A Fair Share • Use snap cubes to represent the number
of letters in each of the birth places on the red card.
10/11/11 • page 12
• Manipulate the snap cubes so that each city has the same number of letters.
• What strategies did you use to determine this amount?
What If… 1. Were there any “a-ha” moments?
10/11/11 • page 13
2. Reference Practice 3: Construct viable arguments and critique the reasoning of others. Give examples of how this practice was evidenced with this task.
3. Reference Practice 6: Attend to precision. Give examples of how this practice was evidenced with this task.
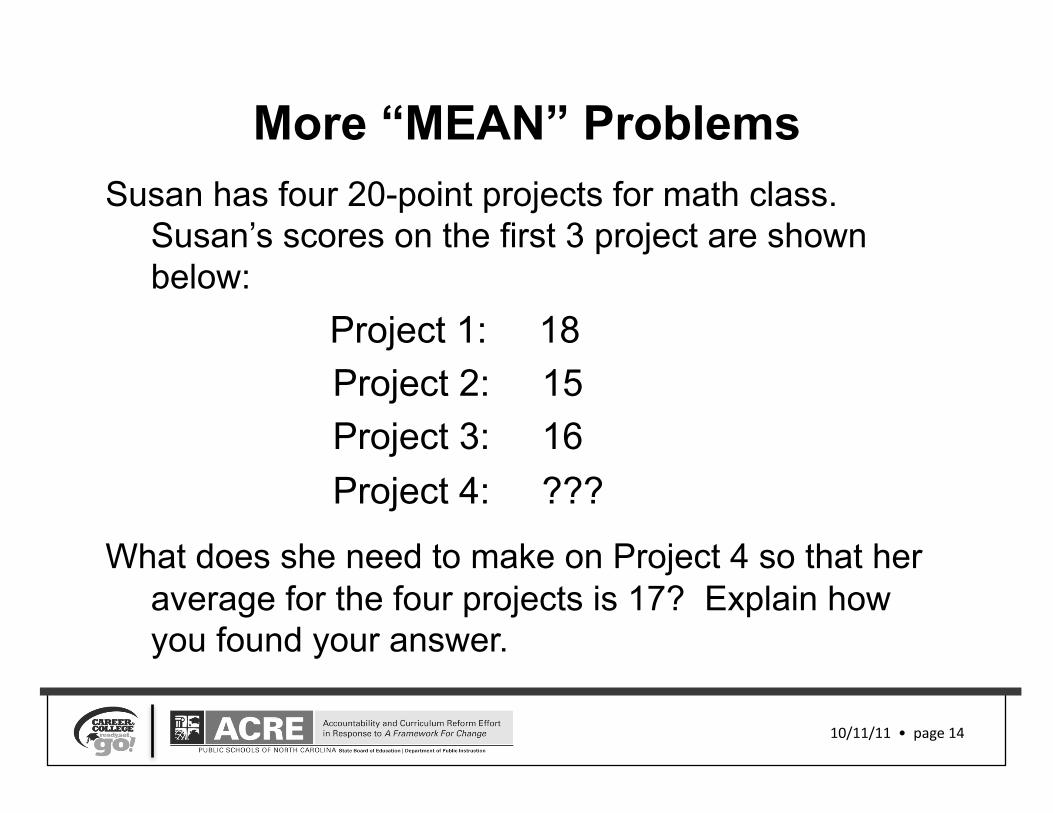
More “MEAN” Problems Susan has four 20-point projects for math class.
Susan’s scores on the first 3 project are shown below: Project 1: 18 Project 2: 15 Project 3: 16 Project 4: ???
What does she need to make on Project 4 so that her average for the four projects is 17? Explain how you found your answer.
10/11/11 • page 14

BREAK
10/11/11 • page 15
10/11/11 • page 16
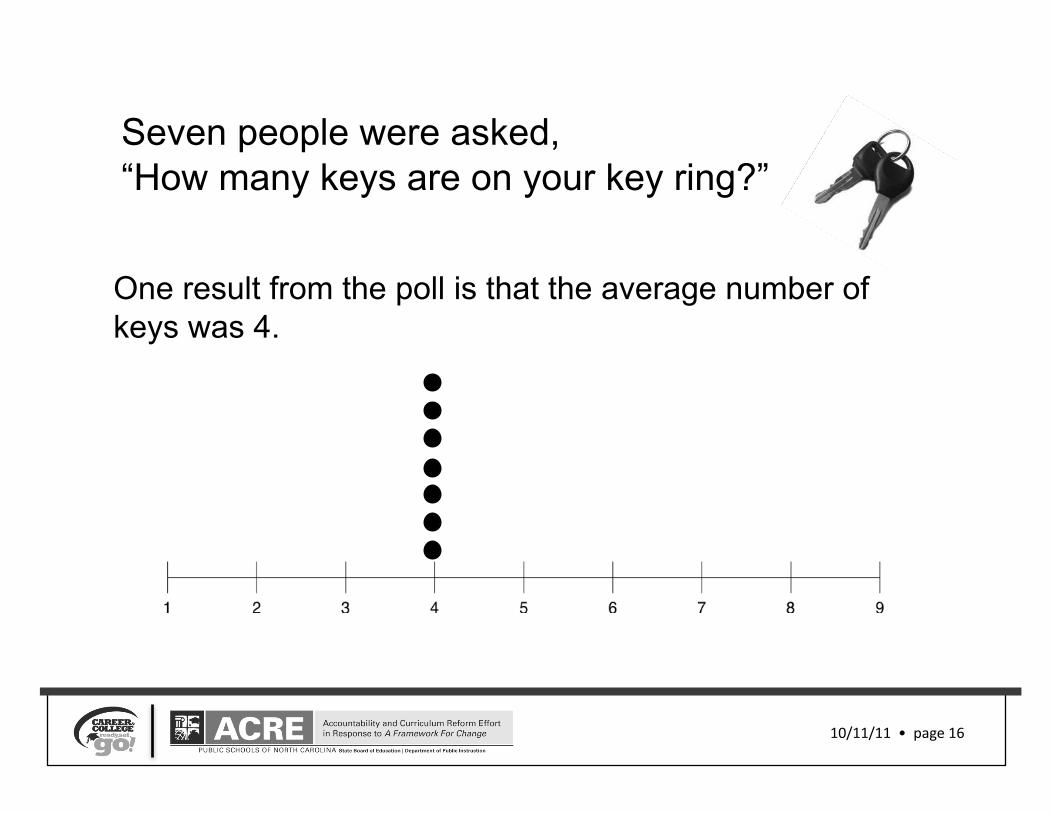
Seven people were asked, “How many keys are on your key ring?”
One result from the poll is that the average number of keys was 4.

What are possibilities for the distribution for the number of keys for seven people with the requirement that the mean number of keys be 4?
Use the number line to create a dot plot with 7 data points and a mean of 4.
10/11/11 • page 17

Summing Up
1. What strategies did you use to create your data set?
10/11/11 • page 18
2. Reference Practice 1: Make sense of problems and persevere in solving them. Give examples of how this practice was evidenced with this task.
If you only know the MEAN and the number of data points…
10/11/11 • page 19
Turn and Talk: What information can you give about the
data set?
What information can’t you give about the data set?
Differing Distributions
Which distribution shows data values that differ the least from the mean of 4?
10/11/11 • page 20
Which distribution shows data values that differ the most from the mean of 4?
How would you order the other distributions from least to most difference from a mean of 4?
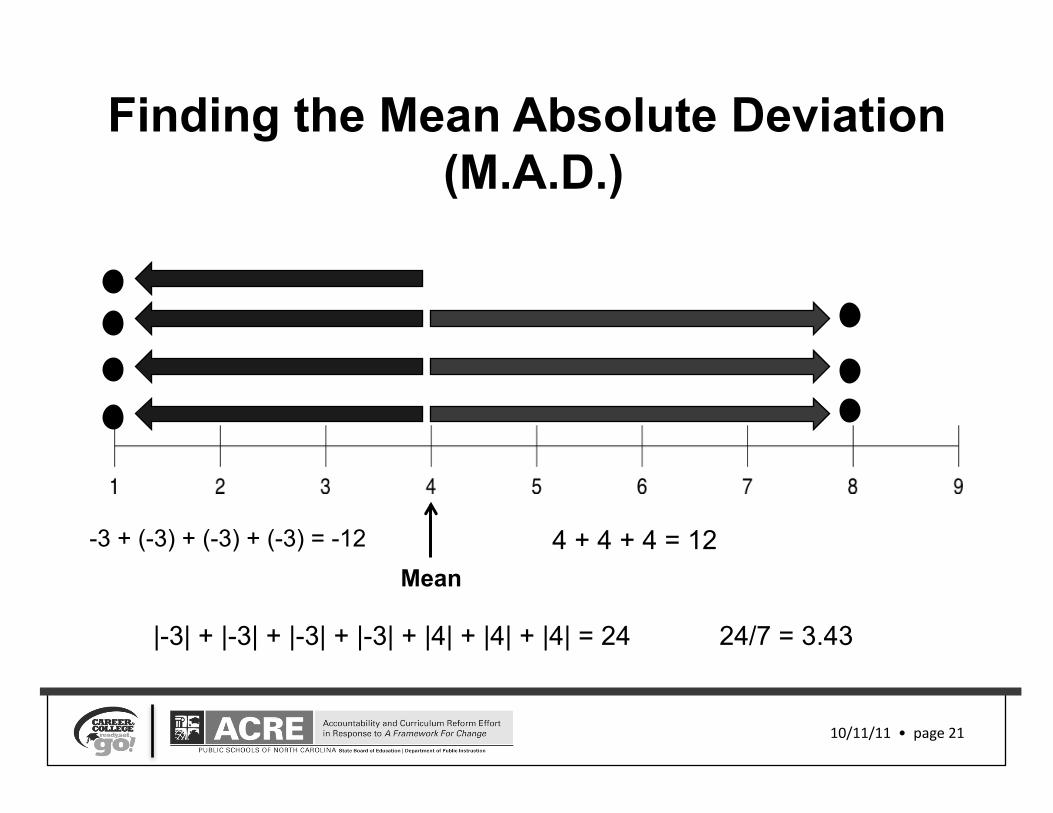
Finding the Mean Absolute Deviation (M.A.D.)
10/11/11 • page 21
Mean 4 + 4 + 4 = 12 -3 + (-3) + (-3) + (-3) = -12
|-3| + |-3| + |-3| + |-3| + |4| + |4| + |4| = 24 24/7 = 3.43

In the Classroom…
10/11/11 • page 22
Based on this informa8on, would you revise the order of the distribu8ons?
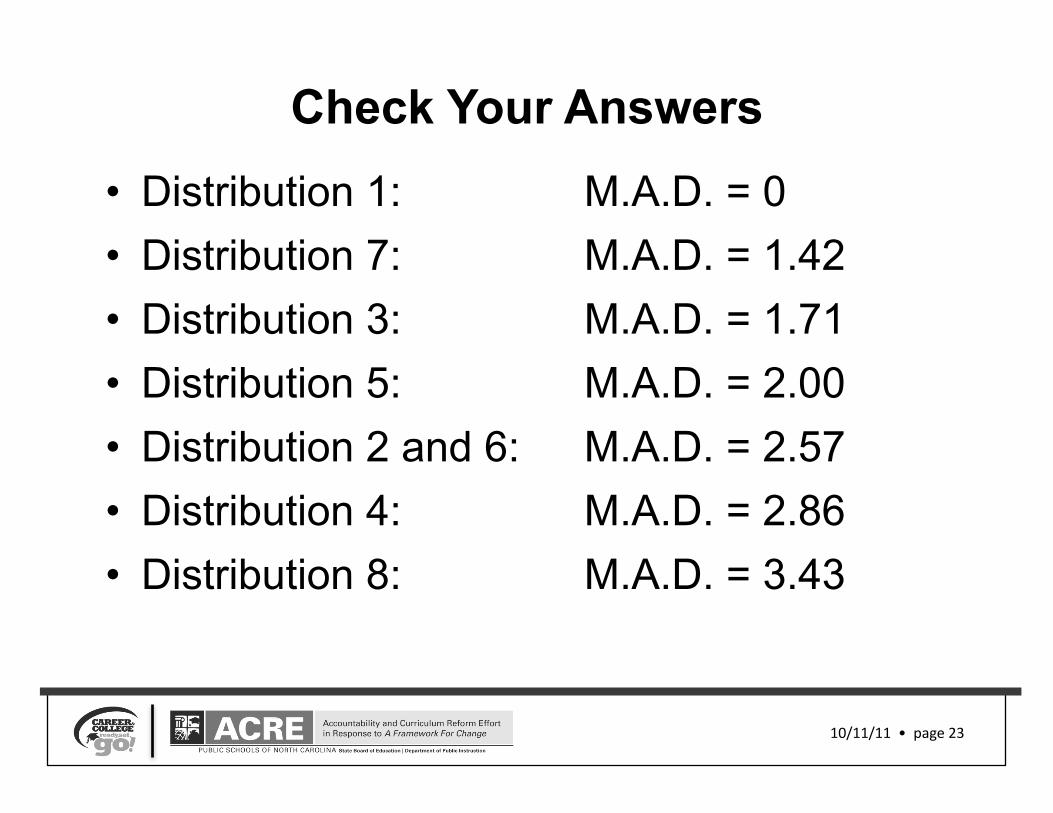
Check Your Answers • Distribution 1: M.A.D. = 0
10/11/11 • page 23
• Distribution 7: M.A.D. = 1.42 • Distribution 3: M.A.D. = 1.71 • Distribution 5: M.A.D. = 2.00 • Distribution 2 and 6: M.A.D. = 2.57 • Distribution 4: M.A.D. = 2.86 • Distribution 8: M.A.D. = 3.43
Summing Up • What does a small M.A.D. tell us about a
data set? • What does a large M.A.D. tell us about a
data set? • What does a M.A.D. of 2.89 tell us about
the distribution of keys? • How could you change the data set to
increase the M.A.D.?
10/11/11 • page 24
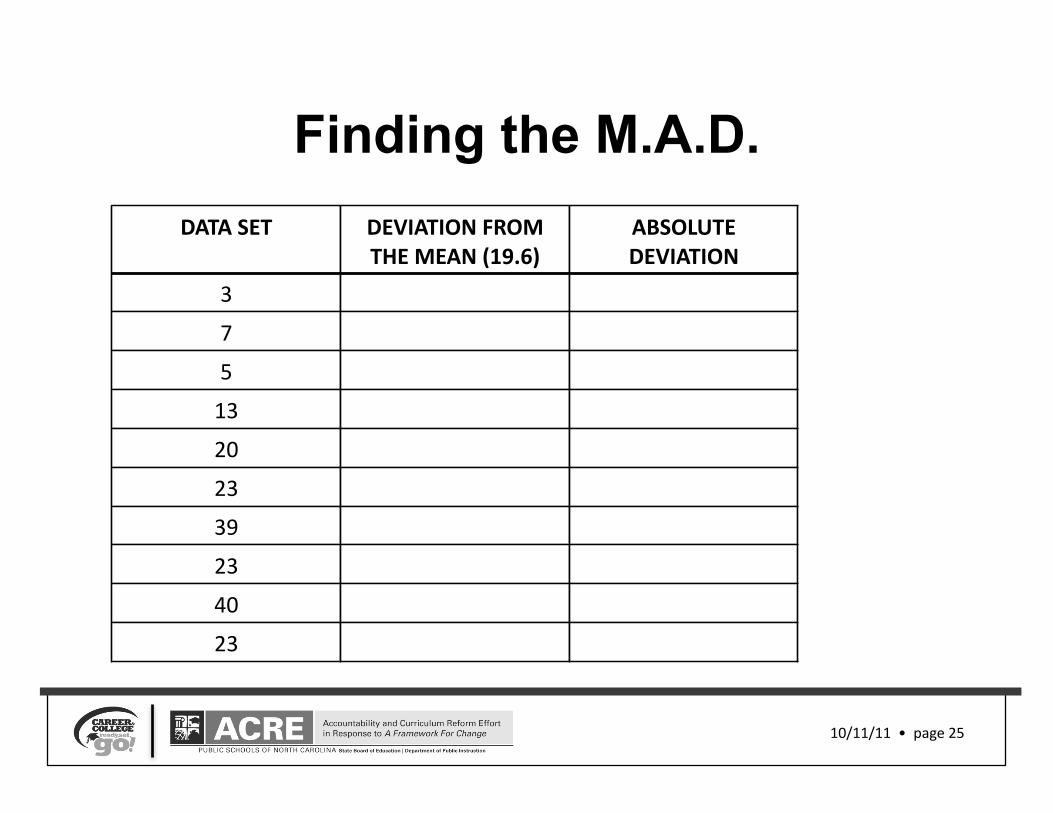
Finding the M.A.D.
10/11/11 • page 25
DATA SET DEVIATION FROM THE MEAN (19.6)
ABSOLUTE DEVIATION
3
7
5
13
20
23
39
23
40
23
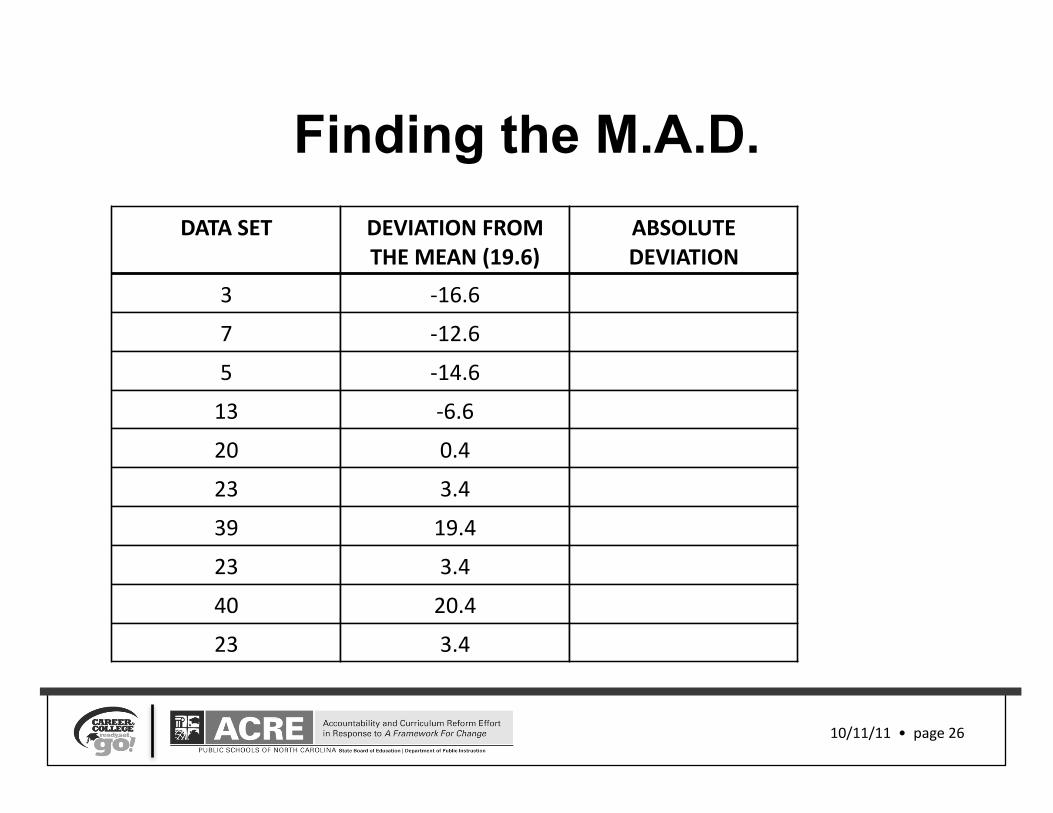
Finding the M.A.D.
10/11/11 • page 26
DATA SET DEVIATION FROM THE MEAN (19.6)
ABSOLUTE DEVIATION
3 -‐16.6
7 -‐12.6
5 -‐14.6
13 -‐6.6
20 0.4
23 3.4
39 19.4
23 3.4
40 20.4
23 3.4

Finding the M.A.D.
10/11/11 • page 27
DATA SET DEVIATION FROM THE MEAN (19.6)
ABSOLUTE DEVIATION
3 -‐16.6 16.6
7 -‐12.6 12.6
5 -‐14.6 14.6
13 -‐6.6 6.6
20 0.4 0.4
23 3.4 3.4
39 19.4 19.4
23 3.4 3.4
40 20.4 20.4
23 3.4 3.4
100.8/10 M.A.D. = 10.08
10/11/11 • page 28
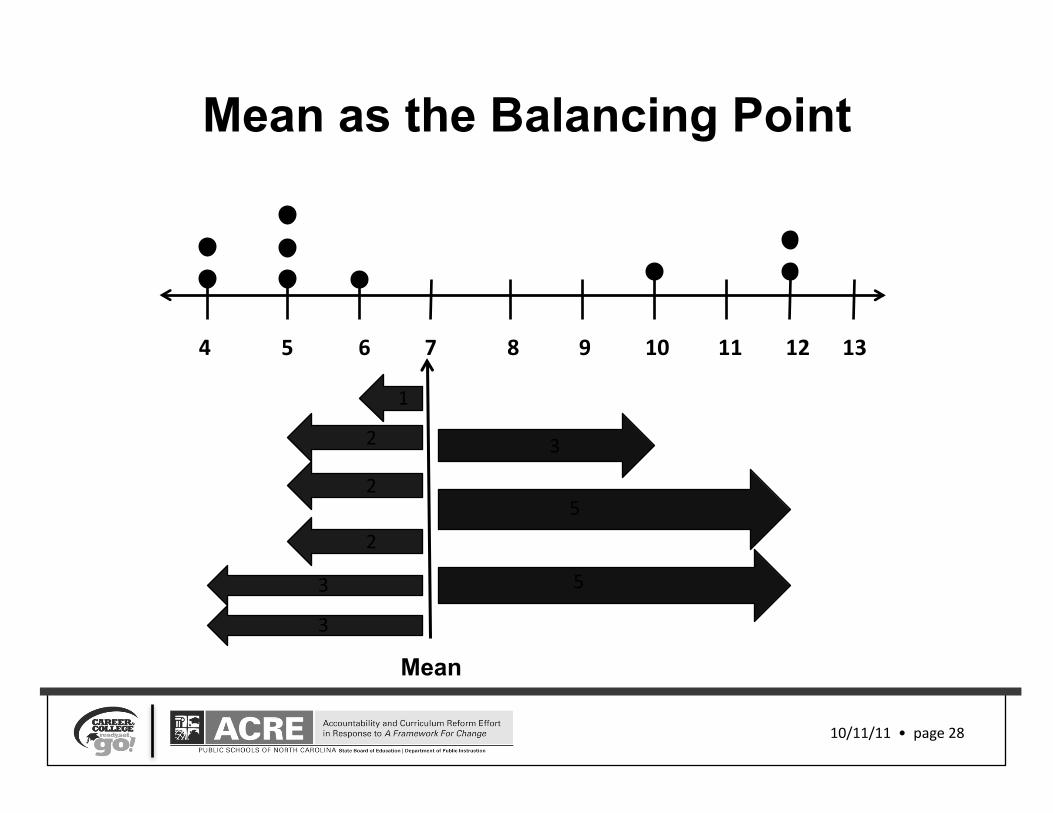
Mean as the Balancing Point
4 5 6 7 8 9 10 11 12 13
Mean
3
5
5
1
3
2
3
2
2
Middle School Standards
10/11/11 • page 29
Statistics and Probability 6.SP
6th Grade Statistics: Develop understanding of statistical variability. 3. Recognize that a measure of center for a numerical
data set summarizes all of its values with a single number, while a measure of variation describes how its values vary with a single number.

10/11/11 • page 30
6th Grade Statistics: Summarize and describe distributions. 4. Display numerical data in plots on a number line, including dot plots,
histograms, and box plots.
6. Summarize numerical data sets in relation to their context, such as by: c. Giving quantitative measures of center (median and/or mean) and
variability (interquartile range and/or mean absolute deviation), as well as describing any overall pattern and any striking deviations from the overall pattern with reference to the context in which the data were gathered.
Middle School Standards Statistics and Probability 6.SP

Middle School Standards
10/11/11 • page 31
Statistics and Probability 7.SP
7th Grade Statistics: Draw informal comparative inferences about two populations. 3. Informally assess the degree of visual overlap of two numerical
data distributions with similar variabilities, measuring the difference between the centers by expressing it as a multiple of a measure of variability.
4. Use measures of center and measures of variability for numerical data from random samples to draw informal comparative inferences about two populations.

Heights of Basketball Players vs.
Heights of Soccer Players
10/11/11 • page 32
Basketball Players: 185, 185, 185, 185, 185, 185, 185, 185, 185 Soccer Players: 175, 175, 175, 175, 175, 175, 175, 175, 175
174 175 176 177 178 179 180 181 182 183 184 185 186

Heights of Basketball Players vs.
Heights of Soccer Players
10/11/11 • page 33
Basketball Players: 175, 180, 182, 184, 185, 186, 187, 190, 195 Soccer Players: 165, 170, 172, 174, 175, 176, 177, 180, 185
165 170 175 180 185 190 195 200
Basketball Players
Soccer Players
In 7th grade, students understand…
10/11/11 • page 34
1. A full understanding of the data requires considera8on of the measures of variability as well as mean or median.
2. Variability is responsible for the overlap of two data sets and that an increase in variability can increase the overlap.
3. Median is paired with the interquar8le range and mean is paired with the mean absolute devia8on .

10/11/11 • page 35