common indicator report
TRANSCRIPT
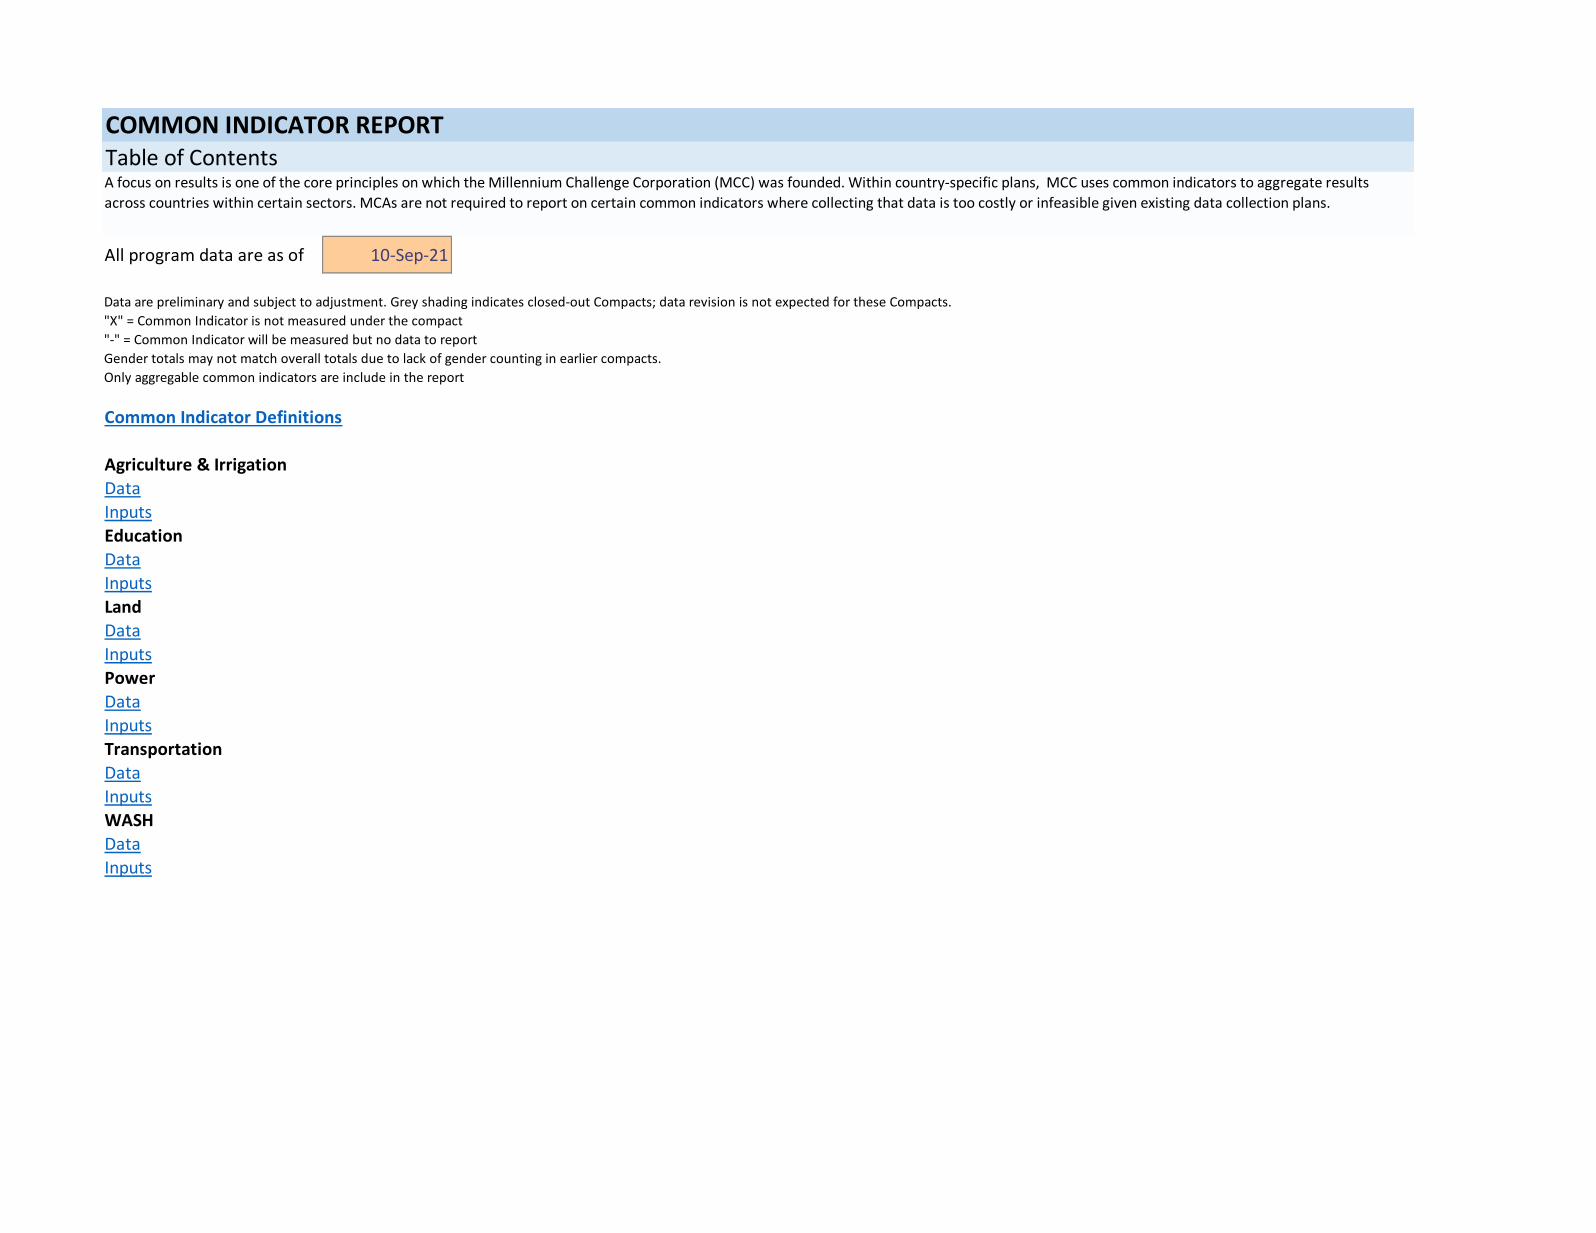
All program data are as of 10-Sep-21
X = Common Indicator is not measured under the compact
- = Common Indicator will be measured but no data to report
Only aggregable common indicators are include in the report
Common Indicator Definitions
Agriculture amp Irrigation
Data
Inputs
Education
Data
Inputs
Land
Data
Inputs
Power
Data
Inputs
Transportation
Data
Inputs
WASH
Data
Inputs
COMMON INDICATOR REPORTTable of Contents
Data are preliminary and subject to adjustment Grey shading indicates closed-out Compacts data revision is not expected for these Compacts
Gender totals may not match overall totals due to lack of gender counting in earlier compacts
A focus on results is one of the core principles on which the Millennium Challenge Corporation (MCC) was founded Within country-specific plans MCC uses common indicators to aggregate results
across countries within certain sectors MCAs are not required to report on certain common indicators where collecting that data is too costly or infeasible given existing data collection plans
Agriculture and Irrigation
Education
Land
Power
(P-3) Value of signed power infrastructure construction contracts The value of all signed construction contracts for power infrastructure investments using compact funds
(P-7) Kilometers of transmission lines upgraded or built The sum of linear kilometers of new reconstructed rehabilitated or upgraded transmission lines that
have been energized tested and commissioned with MCC support
(P-8) Transmission throughput capacity added The increase in throughput capacity measured in megawatts added by new reconstructed rehabilitated or
upgraded transmission lines that have been energized tested and commissioned with MCC support
(P-9) Transmission substation capacity added The total added transmission substation capacity measured in mega volt-amperes that is energized commissioned
and accompanied by a test report and supervising engineerrsquos certification resulting from new construction or refurbishment of existing substations that is due to MCC support
(P-1) Value of signed power infrastructure feasibility and design contracts The value of all signed feasibility design and environmental impact assessment contracts including resettlement action plans
for power infrastructure investments using 609(g) and compact funds
(P-2) Percent disbursed of power infrastructure feasibility and design contracts The total amount of all signed feasibility design and environmental impact assessment contracts including resettlement action plans
for power infrastructure disbursed divided by the total current value of signed contracts
(P-4) Percent disbursed of power infrastructure construction contracts The total amount of all signed construction contracts for power infrastructure investments disbursed divided
by the total current value of all signed contracts
(P-5) Temporary employment generated in power infrastructure construction The number of people temporarily employed or contracted by MCA-contracted construction companies
to work on construction of new power infrastructure or reconstruction rehabilitation or upgrading of existing power infrastructure
(P-6) Generation capacity added Generation capacity added measured in megawatts resulting from construction of new generating capacity or reconstruction
rehabilitation or upgrading of existing generating capacity funded with MCC support
(AI-12) Hectares under improved practices as a result of training The number of hectares on which farmers are applying new production or managerial techniques introduced or supported by MCC
(AI-13) Enterprises that have applied improved techniques The number of rural enterprises producer processing and marketing organizations water users associations trade and business
(L-1) Legal and regulatory reforms adopted The number of specific pieces of legislation or implementing regulations
(L-2) Land administration offices established or upgraded The number of land administration and service offices or other
(L-4) Conflicts successfully mediated The number of disputed land and property rights cases that have been resolved by
(L-5) Parcels corrected or incorporated in land system The number of parcels with relevant parcel information corrected
(L-6) Land rights formalized The number of household commercial and other legal entities (eg NGOs churches
(L-7) Percentage change in time for property transactions The average percentage change in number of days for an
(L-8) Percentage change in cost for property transactions The average percentage change in US Dollars of out of pocket
(E-1) Value of signed educational facility construction rehabilitation and equipping contracts The value of all signed construction
(L-3) Stakeholders trained The number of public officials traditional authorities project beneficiaries and representatives
(AI-5) Temporary employment generated in irrigation The number of people temporarily employed or contracted by MCA-contracted construction companies to work on construction of irrigation
(AI-6) Farmers trained The number of primary sector producers (farmers ranchers fishermen and other primary sector producers) receiving technical assistance or participating in a training session
(AI-7) Enterprises assisted The number of enterprises producer processing and marketing organizations water users associations trade and business associations and community-based
(AI-8) Hectares under improved irrigation The number of hectares served by existing or new irrigation infrastructure that are either rehabilitated or constructed with MCC funding
(AI-9) Loan borrowers The number of borrowers (primary sector producers rural entrepreneurs and associations) who access loans for on-farm off-farm and rural investment through MCC
(AI-10) Value of agricultural and rural loans The value of agricultural loans and rural loans disbursed for on-farm off-farm and rural investments
(E-7) Graduates from MCC-supported education activities The number of students graduating from the highest grade (year) for that
(E-8) Employed graduates of MCC-supported education activities The number of MCC-supported training program graduates
(E-2) Percent disbursed of educational facility construction rehabilitation and equipping contracts The total amount of all signed
(E-3) Legal financial and policy reforms adopted The number of reforms adopted by the public sector attributable to compact
(E-4) Educational facilities constructed or rehabilitated The number of educational facilities constructed or rehabilitated according to
(E-5) Instructors trained The number of classroom instructors who complete MCC-supported training focused on instructional quality
(E-6) Students participating in MCC-supported education activities The number of students enrolled or participating in MCC-
(AI-11) Farmers who have applied improved practices as a result of training The number of primary sector producers (farmers ranchers fishermen and other primary sector producers) that are
Common Indicator Definitions
(AI-1) Value of signed irrigation feasibility and design contracts The value of all signed feasibility design and environmental contracts including resettlement action plans for agricultural irrigation
(AI-2) Percent disbursed of irrigation feasibility and design contracts The total amount of all signed feasibility design and environmental contracts including resettlement action plans for
(AI-3) Value of signed irrigation construction contracts The value of all signed construction contracts for agricultural irrigation investments using compact funds
(AI-4) Percent disbursed of irrigation construction contracts The total amount of all signed construction contracts for agricultural irrigation investments disbursed divided by the total value of all
X1A0T
(P-13) Maintenance expenditure-asset value ratio Actual maintenance expenditures Total value of fixed assets
(P-14) Cost-reflective tariff regime Average Tariff per kilowatt-hour Long-run marginal cost per kilowatt-hour of electricity supplied to customers
(P-15) Total electricity supply Total electricity in megawatt hours produced or imported in a year
(P-17) Installed generation capacity Total generation capacity in megawatts installed plants can generate within the country
(P-18) Transmission system technical losses 1- [Total megawatt hours transmitted out from transmission substations Total megawatt hours received from generation to transmission substations]
(P-19) Distribution system losses 1 ndash [Total megawatt hours billed Total megawatt hours received from transmission]
(P-20) Commercial losses Total distribution system losses (P-19) minus distribution technical losses
(P-21) System Average Interruption Duration Index (SAIDI) Sum of durations in customer-hours of all customer interruptions in a quarter Total number of customers connected to network in the same quarter
(P-22) System Average Interruption Frequency Index (SAIFI) Sum of customer-interruptions in a quarter Total number of customers connected to network in the same quarter
(P-23) Total electricity sold The total megawatt hours of electricity sales to all customer types
(P-24) Operating cost-recovery ratio Total revenue collected Total operating cost Total operating cost is defined as operating expenses plus depreciation
(P-26) Share of renewable energy in the country Total installed generation capacity of on- or off-grid renewable energy in megawatts Total installed generation capacity (P-17)
Transportation
(R-1) Value of signed road feasibility and design contracts The value of all signed feasibility design and environmental contracts including resettlement action plans for road investments using 609(g) and compact funds
(R-3) Kilometers of roads under design The length of roads in kilometers under design contracts This includes designs for building new roads and reconstructing rehabilitating resurfacing or upgrading existing roads
(R-4) Value of signed road construction contracts The value of all signed construction contracts for new roads or reconstruction rehabilitation resurfacing or upgrading of existing roads using compact funds
(R-51) Value disbursed of roads construction contracts The value disbursed of all signed construction contracts for new roads or reconstruction rehabilitation resurfacing or upgrading of existing roads
(R-6) Kilometers of roads under works contracts The length of roads in kilometers under works contracts for construction of new roads or reconstruction rehabilitation resurfacing or upgrading of existing roads
(R-9) Roughness The measure of the roughness of the road surface in meters of height per kilometer of distance traveled
(R-10) Average annual daily traffic The average number and type of vehicles per day averaged over different times (day and night) and over different seasons to arrive at an annualized daily average
(R-11) Road traffic fatalities The number of road traffic fatalities per year on roads constructed rehabilitated or improved with MCC funding
WASH
(R-5) Percent disbursed of road construction contracts The total amount of all signed construction contracts for new roads or reconstruction rehabilitation
resurfacing or upgrading of existing roads disbursed divided by the total value of all signed contracts
(R-7) Temporary employment generated in road construction The number of people temporarily employed or contracted by MCA-contracted construction companies to work on construction of new roads
or reconstruction rehabilitation resurfacing or upgrading of existing roads(R-8) Kilometers of roads completed The length of roads in kilometers on which construction of new roads or reconstruction rehabilitation resurfacing or upgrading of existing roads is complete
(certificates handed over and approved)
(P-12) Customers added by project The number of new customers that have gained access to a legal connection to electricity service from an electrical utility or
service provider as a direct output of an MCC-funded project or intervention
(P-16) Power plant availability Unweighted average across all power plants of the following total number of hours per month that a plant is able and available to produce electricity
Total number of hours in the same month
(P-25) Percentage of households connected to the national grid Number of households that have access to a legal connection to electricity service from an electrical utility or service provider
Total number of households in the country
(R-21) Value disbursed of road reasibilty and design contracts The value disbursed of all signed feasibility design and environmental contracts including
resettlement action plans for road investments using 609(g) and compact funds
(R-2) Percent disbursed of road feasibility and design contracts The total amount of all signed feasibility design and environmental contracts including
resettlement action plans for road investments disbursed divided by the total value of all signed contracts
(P-10) Kilometers of distribution lines upgraded or built The sum of linear kilometers of new reconstructed rehabilitated or upgraded distribution lines that
have been energized tested and commissioned with MCC support
(P-11) Distribution substation capacity added The total added substation capacity measured in mega volt amperes that is energized commissioned and accompanied by a test report
and supervising engineerrsquos certification resulting from new construction or refurbishment of existing substations supported by MCC
(WS-8) Non revenue water The difference between water supplied and water sold (ie volume of water ldquolostrdquo) expressed as a percentage of water supplied
(WS-9) Continuity of service Average hours of service per day for water supply
(WS-7) Water points constructed The number of non-networked stand-alone water supply systems constructed such as protected dug wells tube-wells boreholes protected natural springs and
rainwater harvesting catchment systems
(WS-1) Value of signed water and sanitation feasibility and design contracts The value of all signed feasibility design and environmental contracts including
resettlement action plans for water and sanitation investments using 609(g) and compact funds
(WS-2) Percent disbursed of water and sanitation feasibility and design contracts The total amount of all signed feasibility design and environmental contracts including resettlement action plans for water and sanitation investments disbursed divided
(WS-3) Value of signed water and sanitation construction contracts The value of all signed construction contracts for reconstruction rehabilitation or upgrading of water and sanitation works using compact funds
(WS-4) Percent disbursed of water and sanitation construction contracts The total amount of all signed construction contracts for construction reconstruction rehabilitation or upgrading of water and
sanitation works disbursed divided by the total value of all signed contracts
(WS-5) Temporary employment generated in water and sanitation construction The number of people temporarily employed or contracted by MCA-contracted construction companies to work on construction
of water or sanitation systems
(WS-6) People trained in hygiene and sanitary best practices The number of people who have completed training on hygiene and sanitary practices that block the fecal-oral transmission route
(WS-14) Residential water consumption The average water consumption in liters per person per day
(WS-15) IndustrialCommercial water consumption The average amount of commercial water consumed measured in cubic meters per month
(WS-16) Incidence of diarrhea The percentage of individuals reported as having diarrhea in the two weeks preceding the survey
(WS-10) Operating cost coverage Total annual operational revenues divided by total annual operating costs
(WS-11) Volume of water produced Total volume of water produced in cubic meters per day for the service area ie leaving treatment works operated by the utility and purchased treated water if any
(WS-12) Access to improved water supply The percentage of households in the MCC project area whose main source of drinking water is a private piped connection (into dwelling or yard) public tapstandpipe tube-well
protected dug well protected spring or rainwater
(WS-13) Access to improved sanitation The percentage of households in the MCC project area who get access to and use an improved sanitation facility such as flush toilet to a piped sewer system
flush toilet to a septic tank flush or pour flush toilet to a pit composting toilet ventilated improved pit latrine or pit latrine with slab and cover
9102021 Process Indicators Output Indicators Outcome Indicators
Agriculture amp
Irrigation
Common
Indicators
(AI-1)
Value of signed
irrigation feasibility
and design contracts
(AI-21)
Amount Disbursed
(AI-2)
Percent disbursed of
irrigation feasibility
and design contracts
(AI-3)
Value of signed
irrigation construction
contracts
(AI-41)
Amount Disbursed
(AI-4)
Percent disbursed of
irrigation construction
contracts
(AI-5) Temporary
employment generated
in irrigation
(AI-6)
Farmers trained
(AI-7) Enterprises
assisted
(AI-8)
Hectares under
improved irrigation
(AI-9)
Loan borrowers
(AI-10)
Value of agricultural and rural
loans
(AI-11) Farmers who
have applied improved
practices as a result of
training
(AI-12) Hectares under
improved practices as a
result of training
(AI-13) Enterprises that
have applied improved
techniques
Unit USD Percentage USD Percentage Number Number Number Hectares Number USD Number Hectares Number
Classification Cumulative Level Cumulative Level Cumulative Cumulative Cumulative Cumulative Cumulative Cumulative Cumulative Cumulative Cumulative
MCC Total $56505447 $48242501 85 $729151521 $642371138 88 7160 407139 4224 203963 1195 $87074694 126837 42312 1016 Gender 4771 301025 520 1187 $14504981 57982 105 Female 252 92868 107 121 $924102 17668 20 Male 4519 208157 413 1066 $13580879 40314 85 CountryArmenia $4601073 $4601073 100 $106653443 $106653443 100 2389 45639 227 1008 $13133200 26424 X 178 El Salvador 15363 281 29 $4598748 11520 X 163 El Salvador II X X X X X X X X 1 X X X X X XGeorgia $1155881 $617380 53 X X X X X 291 X X $19880003 X X XHonduras X - X X X X X 7265 464 400 X $17100000 6996 X XIndonesia X - X X X X X 129142 X X X X X X XMoldova $4929620 $4719796 96 $84239288 $61489674 73 586 6569 334 11526 62 $117029810 2452 7279 77 Nicaragua $0 $0 X X X X X 9104 X X X X 9104 X XBurkina Faso $17268474 $12910518 75 $74339448 $70862959 95 2414 12307 278 2240 96 $2802000 8237 3369 28 Cabo Verde I X - X $5167848 $5043885 98 X 553 X 13 X $617000 106 X XGhana $5202887 $5202887 100 $13009963 $13009963 100 X 66930 1724 514 X $16740762 59060 X 535 Madagascar X - X X X X X 31366 324 X X X 1892 X 1
Mali $9077220 $8916457 98 $148951503 $146354137 98 X 1308 X 97503 X $500000 801 X X
Morocco X - X $111353027 $110239497 99 X 40863 114 53376 X X X 31578 34 Mozambique X - X X X X X 28830 186 X X X X X XNamibia X - X X X X X 9238 X X X X X X XNiger $4580119 $2912423 64 $30726352 $12631916 41 252 2662 X - X X 245 86 XSenegal $9690173 $8361968 86 $154710649 $116085665 75 1519 X X 38391 X X X X XCommon Indicator Definitions
X2A0T
(AI-5) Temporary
employment
generated in
irrigation
(AI-6) Farmers trained(AI-7) Enterprises
assisted
(AI-9) Loan
borrowers
(AI-10) Value of
agricultural and rural loans
(USD)
(AI-11) Farmers who have
applied improved practices as
a result of training
(AI-13) Enterprises that have
applied improved techniques
Female Male Female Male Female Male Female Male Female Male Female Male Female Male
Total 252 4519 92868 208157 107 413 121 1066 924102 13580879 17668 40314 20 85 Armenia X X 14520 31119 X X 106 902 X X 7816 18608 - -
Burkina Faso 87 2327 6476 5831 X X 3 93 123600 2678400 3714 4523 10 18
Cape Verde X X X X X X X X X X X X X X
El Salvador X X 3676 11687 X X 5 16 X X 2504 9016 X X
El Salvador II X X X X X X X X X X X X X X
Georgia X X X X X X X X X X X X X X
Ghana X X X X X X X X X X X X X X
Honduras X X X X X X X X X X X X X X
Honduras X X X X X X X X X X X X X X
Indonesia X X 42085 87057 X X X X X X X X X X
Madagascar X X X X X X X X X X X X X X
Mali X X 574 734 X X X X X X X X X X
Moldova 42 544 2333 4236 57 277 7 55 800502 10902479 898 1554 10 67
Morocco X X 4076 36787 X X X X X X X X X X
Mozambique X X 10528 18302 50 136 X X X X X X X X
Namibia X X 5528 3710 X X X X X X X X X X
Nicaragua X X 2728 6376 X X X X X X 2728 6376 X X
Niger 25 227 344 2318 X X X X X X 8 237 X X
Senegal 98 1421 X X X X X X X X X X X X
Agriculture
amp Irrigation
Inputs
Disaggregation Issues
X3A0T
9102021
Education
Common
Indicators
(E-1)
Value of signed
educational facility
construction
rehabilitation and
equipping contracts (USD)
Amount Disbursed (E-21)
(E-2)
Percent disbursed of
educational facility
construction
rehabilitation and
equipping contracts
(E-3)
Legal financial and
policy reforms
adopted
(E-4) Educational
facilities constructed
or rehabilitated
(E-5) Instructors
trained
(E-6) Students participating
in MCC-supported
education activities
(E-7) Graduates from MCC-
supported education
activities
(E-8) Employed graduates of
MCC-supported education
activities
Unit US Dollars US Dollars Number Number Number Number Number Number
Classification Level Level Level Cumulative Cumulative Cumulative Cumulative Cumulative
MCC Total $330091364 $284694708 86 17 844 10621 291165 62938 0
Gender 10621 212490 58230
Female 6186 108599 37091
Male 4435 103891 21139
Country
Burkina Faso $22758211 $22736023 100 X 396 557 31065 4035 X
Cote dIvoire - - - 4 - - 21 - -
El Salvador I $9857585 $9839371 100 X 22 378 30672 4285 X
El Salvador II $59449148 $48692482 82 7 7 5660 73407 - -
Georgia II $42742227 $41365549 97 X 91 604 2577 727 X
Ghana $18689747 $18689747 100 X 250 - 41019 X X
Mongolia $28179328 $27490984 98 5 18 1370 17480 11967 X
Morocco $4568837 $3480627 76 X X 2052 93424 41383 X
Morocco II $47555983 $16839347 35 1 - - X - X
Namibia $96290298 $95560578 99 X 60 X 1500 541 XCommon Indicator Definitions
Dagger All MCC education programs have as their long-term end goal an increase in individual or household income and a corresponding decrease in poverty
Process Indicators Output Indicators Outcome IndicatorsX4A0T
(E-5) Instructors trained(E-6) Students participating in MCC-
supported education activities
(E-7) Graduates from MCC-supported
education activities
(E-8) Employed graduates of MCC-
supported education activities
Female Male Female Male Female Male Female MaleTotal 6186 4435 108599 103891 37091 21139 - - Burkina Faso 206 351 13204 9162 2032 2003 X X
Cote dIvoire - - 3 18 - - - -
El Salvador I 182 196 X X X X X X
El Salvador II 3683 1977 35799 37608 X X X X
Georgia II 235 369 472 2105 101 626 X X
Ghana X X 2166 X X X X X
Mongolia 641 729 4720 12760 3182 8785 X X
Morocco 1239 813 51621 41803 31722 9661 X X
Morocco II - - X X - - X X
Namibia X X 614 435 54 64 X X
Education
Inputs
Disaggregation Issues
X5A0T
9102021 Output Indicators
Land Common
Indicators
(L-1)
Legal and regulatory reforms
adopted
(L-2)
Land administration offices
established or upgraded
(L-3) Stakeholders trained(L-4)
Conflicts successfully mediated
(L-5)
Parcels corrected or incorporated
in land system
(L-6)
Land rights formalized
Unit Number Number Number Number Parcels Number
Classification Cumulative Cumulative Cumulative Cumulative Cumulative CumulativeMCC Total 135 399 78216 12484 357900 320722
Gender 76781 159878
Female 21789 54903
Male 54992 85400
Joint 19575
Location 299679 280725
Urban 200922 156232
Rural 98757 124493
Country
Benin X X 50 X X X
Burkina Faso 54 78 61057 1364 18490 4793
Cabo Verde II 36 38 442 229 37495 11365
Ghana 4 3 427 23 1481 X
Indonesia X X 4463 X X X
Lesotho 11 1 575 151 53296 19325
Madagascar 4 237 X X X X
Mali X 1 1354 X X X
Mongolia 6 15 3920 10639 18336 20672
Morocco II 1 X - X X -
Mozambique X 26 1516 X 205005 251556
Namibia 19 X 2524 X 8869 4356
Nicaragua X X X X X X
Niger X X 248 - 4925 -
Senegal X X 1640 78 10003 8655 Common Indicator Definitions
X6A0T
(L-3) Stakeholders trained(L-5) Parcels corrected or
incorporated in land system(L-6) Household land rights formalized (L-6) Land rights formalized
Female Male Urban Rural Female Male Joint Urban Rural
Total 21789 54992 200922 98757 54903 85400 19575 156232 124493 Benin X X X X X X X X X
Burkina Faso 16496 44561 X 18490 63 4730 X X 4793
Cabo Verde II 167 201 23502 13993 877 1433 1086 9263 2102
Ghana X X X 1481 X X X X X
Indonesia 869 3315 X X X X X X X
Lesotho X X X X X X X X X
Madagascar X X X X X X X X X
Mali 614 710 X X X X X X X
Mongolia 1912 2008 7415 10921 X X X X X
Morocco II - - X X - - X X X
Mozambique 411 1105 170005 35000 53963 79237 18489 146969 104587
Namibia 749 1775 X 8869 X X X X 4356
Nicaragua X X X X X X X X X
Niger 72 176 X X X X X X X
Senegal 499 1141 X 10003 X X X X 8655
Land Inputs
Disaggregation Issues
X7A0T
9102021
Power
Common
Indicators
(P-1) Value of signed
power infrastructure
feasibility and
design contracts
(P-21)
Amount Disbursed
(P-2) Percent
disbursed of power
infrastructure
feasibility and
design contracts
(P-3) Value of signed
power infrastructure
construction
contracts
(P-41)
Amount Disbursed
(P-4) Percent
disbursed of power
infrastructure
construction
contracts
(P-5) Temporary
employment
generated in power
infrastructure
construction
(P-6) Generation
capacity added
(P-7 and P-10) Km
lines upgraded or
built
(P-8) Transmission
throughput capacity
added
(P-9 and P-11)
Substation capacity
added
(P-12) Customers
added by project
(P-15) Total electricity
supply
(P-17) Installed
generation capacity
(P-23) Total
electricity sold
Unit USD Percentage USD Percentage Number Megawatts Kilometers Megawatts Megavolt ampere Number Megawatt hours Megawatts Megawatt hoursClassification Cumulative Level Cumulative Level Cumulative Cumulative Cumulative Level Cumulative Cumulative Level (cumulative) Level Level
MCC Total $95927530 $84491663 88 $912763722 $641916747 70 12420 113 5772 NA 1550 44507 24483054 7141 11605895TampD 4318 Transmission 24 - Distribution 4294 -Gender 8347 Female 429 Male 7918 Grid 113 6192
On-grid 108 8 6126Off-grid 5 5 66
Tariff class 2535782Residential 990249Commercial 684896Industrial 860637Country
Benin II $19950089 $15612431 78 $230356722 $85889325 37 1330 X - X - X 1446580 X 1062611El Salvador X X X X X X X 1523 X X 35412 X X XGeorgia X X X X X X X X X X X X X XGhana X - X X X X X X 99 X X X X X XGhana II $39603334 $35936256 91 $150508010 $114351610 76 4683 X 849 X 560 X 21163175 5592 8684746Indonesia X X X X X X 13 169 X X 9095 X X XLiberia X X X $144858722 $144858722 100 X 88 51 X 84 X 242169 141 87881Malawi $20626684 $15837791 77 $233487716 $165898820 71 2334 12 409 X 906 X 1631130 459 1444888Mongolia X X X X X X X X X X X X X X XTanzania $15747424 $17105186 109 $153552553 $130918271 85 4073 X 2673 X X X X 949 325769
Process Indicators Output Indicators Outcome IndicatorsX8A0T
Female Male Foreign Local Skilled Semi-skilled Un-skilled Female Male On-grid Off-grid Renewable Thermal ResidentialCommercial Industrial Domestic Imports IPP
Government-
Owned On-grid Off-grid Residential Commercial Industrial
Total 429 7918 890 6991 3627 1390 3135 - - 108 5 12 - - - - 22164930 686995 11624991 10294076 6126 66 990249 684896 860637
Benin II 128 1202 92 1196 336 86 907 X X X X X X X X X 809202 637378 - 805508 X X 413467 446360 184617
El Salvador X X X X X X X X X X X X X X X X X X X X X X X X X
Georgia X X X X X X X X X X X X X X X X X X X X X X X X X
Ghana X X X X X X X X X X X X X X X X X X X X X X X X X
Ghana II 131 4552 163 4520 2580 1104 1265 - - - - - - - - - 21113559 49616 11624991 9488568 5527 66 - - -
Indonesia X X X X X X X X X 8 5 X X X X X X X X X X X X X X
Liberia X X X X X X X X X 88 - X X X X X 242169 - X X 141 X 31481 14232 738
Malawi 170 2164 635 1275 711 200 963 X X 12 X 12 X X X X X X X X 459 X 545301 224304 675283
Mongolia X X X X X X X X X X X X X X X X X X X X X X X X X
Tanzania X X X X X X X X X X X X X X X X X X X X X X X X X
Disaggregation Issues
(P-17) Installed
generation capacity
(P-12) Customers added by
project(P-23) Total electricity sold(P-15) Total electricity supply (P-15) Total electricity supply
(P-6) Generation
capacity addedPower Inputs
(P-5) Temporary
employment
generated in power
infrastructure
construction
(P-5) Temporary
employment
generated in power
infrastructure
construction
(P-5) Temporary employment
generated in power
infrastructure construction
(P-12) Customers
added by project
(P-6) Generation
capacity added
X9A0T
9102021 Output Indicators Outcome Indicators
Transportation Common Indicators
(R-1)
Value of signed road
feasibility and design
contracts
(R-21) Value disbursed of road
feasibilty and design contracts
(R-2)
Percent disbursed of road
feasibility and design
contracts
(R-3) Kilometers of
roads under design
(R-4)
Value of signed road
construction contracts
(R-51) Value disbursed of
roads construction
contracts
(R-5)
Percent disbursed of road
construction contracts
(R-6) Kilometers of roads
under works contracts
(R-7) Temporary employment
generated in road construction
(R-8)
Kilometers of roads
completed
(R-11)
Road traffic fatalities
Unit USD Percentage Kilometers USD USD Percentage Kilometers Number Kilometers Number
Classification Cumulative Level Cumulative Cumulative Cumulative Level Cumulative Cumulative Cumulative Level
MCC Total $149178209 $135937953 91 4773 $2536954765 $2159741480 85 42599 52472 3035 719
Gender 17107 110
Female 1460 8
Male 15647 102
Road Type $115356799 $102790980 89 4710 $2268898280 $1831686701 81 33482 2734
Primary $82645411 $72465108 88 2183 $1451578319 $1158838760 80 15344 1178
Secondary $25992205 $22767400 88 1591 $652814560 $533887257 82 11329 479
Tertiary $6719183 $7558472 112 935 $164505401 $138960684 84 6810 1078
Country
Armenia X - X X X X X 00 X 24 X
Burkina Faso $8339651 $9625883 115 536 $140205145 $142457135 102 4191 4162 278 6
Cape Verde I $3520000 $3230000 92 63 $24280000 $24279171 100 406 X 41 X
Cote dIvoire $15506313 $6622482 43 30 - - - - - - 64
El Salvador I $18321410 $18048524 99 223 $248378825 $240211648 97 2230 X 223 X
El Salvador II X X X 10 $101892088 $58739536 58 422 2650 X X
Georgia $11980000 $11868449 99 0 $197299030 $197299030 100 2202 X 220 X
Ghana $5549044 $5549044 100 943 $250604022 $250604022 100 4464 35455 445 602
Honduras $9500000 $7163000 75 673 $179400000 $128412000 72 6730 X 610 X
Liberia X X X X X X X X X X X
Mali $0 $0 X X $42918038 $15018313 35 810 X 79 X
Moldova X - X 96 $100807443 $97020289 96 960 1309 96 4
Mongolia $6083650 $5421254 89 19 $73108907 $66492533 91 1764 X 176 X
Mozambique $17669992 $15049358 85 253 $132240557 $116601108 88 2530 2308 253 X
Nicaragua $0 $0 X 376 $56507526 $56507526 100 740 X 74 X
Niger $3172736 $3091229 97 300 $89104056 $17634110 20 3000 - - X
Philippines $15235623 $14391002 94 222 $173156531 $139529147 81 2220 X 175 0
Senegal $12201371 $12444412 102 406 $271128882 $189227036 70 3750 2757 X 43
Tanzania $19143331 $20478228 107 473 $399926666 $363711825 91 4683 3831 190 0
Vanuatu $2955088 $2955088 100 150 $55997051 $55997051 100 1497 X 150 X
Common Indicator Definitions
According to the Common Indicator definition a road is completed when official certificates are handed over and approved In Senegal this was taken to mean final acceptance of the road works which typically happens after the end of the 1 year defects liability period which starts when the construction is completed and the roads are
provisionally accepted As part of its Compact Senegal intended to rehabilitate 372 kilometers of national roads By September 2015 when the Senegal Compact closed no roads had achieved final acceptance and therefore were not officially completed per the common indicator definition However by the end of the Compact 185km of roads had
been fully rehabilitated and had received provisional acceptance An additional 72km were provisionally accepted in November 2015 and the remaining 116km are anticipated to be provisionally accepted with the support of the Government of Senegal by mid-2016
Kilometers of road for Mozambique require verification through takeover certificates However takeover certificates were never provided and the number reported is not verified
Process IndicatorsX10A0T
Primary Secondary Tertiary Primary Secondary Tertiary Primary Secondary Tertiary Primary Secondary Tertiary Primary Secondary Tertiary Primary Secondary Female Male Primary Secondary Tertiary Primary Secondary Tertiary Primary Secondary Tertiary Female Male
Total 82645411 25992205 6719183 72465108 22767400 7558472 2183 1591 935 1451578319 652814560 164505401 1158838760 533887257 138960684 1534 1133 1460 15647 1178 479 1078 NA NA NA NA NA NA 8 102 Armenia X X X X X X X X X X X X X X X X X X X X X 24 X X 3 X X 735 X X
Burkina Faso 5814443 X 2525208 6418186 X 3207697 355 X 181 129574643 X 10630502 201528839 X 41678755 274 X 247 3915 194 X 84 X X X X X X X 6
Cape Verde X X X X X X X X X X X X X X X X X X X X X X X X X X X X X X
Cote dIvoire 15506313 X X 6622482 X X 30 X X - - - - - - - - - - - - - - - - - - - 4 57
El Salvador I X X X X X X X 190 33 X 225888160 22490665 X 220120113 2091535 X 185 X X X 185 38 X X X X X X X X
El Salvador II X X X X X X 10 X X 101892088 X X 58739536 X X 42 X 263 2387 X X X X X X X X X X XGeorgia X X X X X X X X X X X X X X X X X X X X X X X X X X X X X X
Ghana 3196669 X 2352375 3196669 X 2352375 257 X 686 187609312 X 62994710 187609312 - 62994710 89 - X X 88 - 357 X X X X X X X X
Honduras X 9500000 X X 7163000 X X 673 X X 179400000 X X 128412000 X X 673 X X 50 66 495 X X X X X X X X
Liberia X X X X X X X X X X X X X X X X X X X X X X X X X X X X X X
Mali X X X X X X - X X X X 42918038 - X 15018313 X X X X X X 79 X X X X X X X X
Moldova X X X X X X 96 X X 100807443 X X 97020289 X X 96 X 88 1221 96 X X X X X X X X X X
Mongolia 6083650 X X 5421254 X X 19 X X 73108907 X X 66492533 X X 176 X X X 176 X X 2 X X X X X X X
Mozambique 17669992 X X 15049358 X X 253 X X 132240557 X X 116601108 X X 253 X 237 2071 253 X X X X X X X X X X
Nicaragua X X X - X X 86 290 X 17722893 38784633 X 17722893 38784633 X 21 53 - - 21 53 X X X X X X X X X
Niger 1916154 1256582 X 1877831 1213398 X 83 217 X 7041364 35585237 X 10592746 7041364 X X X X X X X X X X X X X X X X
Philippines - 15235623 X - 14391002 X X 222 X X 173156531 X X 139529147 X X 222 X X X 175 X X X X X X X X X
Senegal 12201371 X X 12444412 X X 406 X X 271128882 X X X X X X 272 2485 X X X X X X X X X 4 39
Tanzania 17301731 X 1841600 18479828 X 1998400 438 X 35 374455179 X 25471487 346534454 X 17177371 433 X 353 3568 150 X X X X X X X X X XVanuatu 2955088 X X 2955088 X X 150 X X 55997051 X X 55997051 X X 150 X X X 150 X X X X X X X X X X
(R-11) Road traffic fatalities
(R-10) Average annual daily traffic
(R-9) Roughness(R-8) Kilometers of roads
completed
(R-6) Kilometers of roads under works
contracts
(R-51) Value disbursed of roads construction contracts
(R-4) Value of signed road construction contracts(R-21) Value disbursed of road feasibility
and design contracts(R-3) Kilometers of roads under
design(R-1) Value of signed road feasibility and
design contracts
(R-7) Temporary employment
generated in road
construction
Transportation Inputs
Disaggregation Issues
X11A0T
9102021
WASH
Common
Indicators
(WS-1)
Value of signed water and
sanitation feasibility and design
contracts (USD)
Amount Disbursed
(WS-2)
Percent disbursed of water and
sanitation feasibility and design
contracts
(WS-3)
Value of signed water and
sanitation construction contracts
(USD)
Amount Disbursed
(WS-4)
Percent disbursed of water and
sanitation construction
contracts
(WS-5)
Temporary employment generated
in water and sanitation
construction
(WS-6)
People trained in hygiene and
sanitary best practices
(WS-7)
Water points constructed
Residential population connnected to sewer
systemResidential population
Unit US Dollars Percentage USD Percentage Number Number Number Number NumberClassification Cumulative Level Cumulative Level Cumulative Cumulative Cumulative Cumulative Cumulative
MCC Total $54337691 $53735311 989 $816963219 $763548856 935 21776 12386 1191 NA NAGender 9862 Female 1123 - Male 8739 - CountryCabo Verde II $783369 $733263 936 $19315569 $18827292 975 759 32 X X XEl Salvador $4983800 $4785175 960 $10451448 $10188837 975 X 2406 X X XEl Salvador II X X X X X X X X - X XGeorgia $266865 $266865 1000 $54315000 $51178716 942 X X X X XGhana $1475148 $1475148 1000 $13949465 $13949465 1000 X 778 392 X XJordan $0 $0 X $238732246 $238486447 100 3825 X X X XLesotho X - X $59733645 $47189579 79 11527 454 175 X XMongolia II X X X X X X - X X X XMozambique $35076009 $34753498 991 $169500497 $148359134 875 2276 8400 614 X XTanzania $6861280 $7008600 1021 $45403796 $36801560 811 387 X X X XZambia $4891220 $4712762 964 $205561552 $198567825 966 3002 316 10 X XCommon Indicator Definitions
This is a monitoring indicator any change over baseline data represents the current trend and does not represent the direct impact of the MCC-investment Jordans MampE Plan has throughout the life of the compact defined hours of supply as hoursweek As such all documentation is in this form The value here has been divided by 7 here to accurately reflect supply hours per dayThe current unit for volume of water produced has a discrepancy MCC MampE is in the process of revising this common indicator to clarify and align with current industry standards
Process Indicators Output Indicators Output IndicatorsX12A0T
(WS-5) Temporary employment
generated in water and
sanitation construction
(WS-6) People trained in
hygiene and sanitary best
practices
Female Male Female MaleTotal 1123 8739 5913 6019 Cabo Verde II 111 648 20 12
El Salvador X X 1278 1128
Georgia X X X X
Ghana X X 246 532
Jordan 148 3677 X X
Lesotho X X X X
Mongolia II - - X X
Mozambique 200 2076 4195 4205
Tanzania X X X X
Zambia 664 2338 174 142
WASH
Inputs
Disaggregation Issues
Due to the current reporting style of Jordans ITT the male figure is the difference of
the Total minus the Female values
Jordans overall temporary employment figures now include employment
generated through the Water Smart Homes Activity and the As Samra Project as a
result of the December 2016 MampE Plan Revision in addition to the Water Network
Project Infrastructure Activity and the Wastewater Network Project
X13A0T
Sector Country Indicator Issue
Agriculture and Irrigation Madagascar Farmers Trained Lack of disaggregations in early compacts
Agriculture and Irrigation Madagascar Enterprises assisted Lack of disaggregations in early compacts
Agriculture and Irrigation Madagascar Farmers who have applied improved practices as a result of training Lack of disaggregations in early compacts
Agriculture and Irrigation Madagascar Enterprises that have applied improved techniques Lack of disaggregations in early compacts
Agriculture and Irrigation Georgia Enterprises assisted Lack of disaggregations in early compacts
Agriculture and Irrigation Georgia Value of agricultural and rural loans Lack of disaggregations in early compacts
Agriculture and Irrigation Ghana Farmers Trained Lack of disaggregations in early compacts
Agriculture and Irrigation Ghana Enterprises assisted Lack of disaggregations in early compacts
Agriculture and Irrigation Ghana Value of agricultural and rural loans Lack of disaggregations in early compacts
Agriculture and Irrigation Ghana Farmers who have applied improved practices as a result of training Lack of disaggregations in early compacts
Agriculture and Irrigation Ghana Enterprises that have applied improved techniques Lack of disaggregations in early compacts
Agriculture and Irrigation El Salvador Enterprises assisted Lack of disaggregations in early compacts
Agriculture and Irrigation El Salvador Value of agricultural and rural loans Lack of disaggregations in early compacts
Agriculture and Irrigation El Salvador Enterprises that have applied improved techniques Lack of disaggregations in early compacts
Agriculture and Irrigation Mali Value of agricultural and rural loans Lack of disaggregations in early compacts
Agriculture and Irrigation Mali Farmers who have applied improved practices as a result of training Lack of disaggregations in early compacts
Education El Salvador Students Participating in MCC-supported education activities Lack of disaggregations in early compacts
Education El Salvador Graduated from MCC-supported Education activities Lack of disaggregations in early compacts
Education Burkina Faso Students Participating in MCC-supported education activities The total does not equal the sum of the disaggregations
Education Namibia Students Participating in MCC-supported education activities The total does not equal the sum of the disaggregations
Education Ghana Students Participating in MCC-supported education activities The total does not equal the sum of the disaggregations
Land Ghana Stakeholders trained Lack of disaggregations in early compacts
Land Namibia Household land rights formalized Lack of availabe data
Land Senegal Household land rights formalized Lack of availabe data
Land Lesotho Stakeholders trained Lack of availabe data
Land Lesotho Parcels corrected or incorporated in land system Lack of availabe data
Land Lesotho Household land rights formalized Lack of availabe data
Land Mozambique Household land rights formalized The total does not equal the sum of the disaggregations
Power Tanzania Temporary Employment Lack of disaggregations in early compacts
Transport Georgia Value of signed road feasibility and design contracts Lack of disaggregations in early compacts
Transport Georgia Value disbursed of road feasibility and design contracts Lack of disaggregations in early compacts
Transport Georgia Kilometers of roads under design Lack of disaggregations in early compacts
Transport Georgia Value of signed road construction contracts Lack of disaggregations in early compacts
Transport Georgia Value disbursed of road construction contracts Lack of disaggregations in early compacts
Transport Georgia Kilometers of roads under work contracts Lack of disaggregations in early compacts
Transport Georgia Kilometers of roads completed Lack of disaggregations in early compacts
Transport Ghana Temporary Employment generated in road construction Lack of disaggregations in early compacts
Transport Ghana Road traffic fatalities Lack of disaggregations in early compacts
WASH Tanzania
Temporary Employment generated in water and sanitation
construction Lack of availabe data
WASH Lesotho
Temporary Employment generated in water and sanitation
construction Lack of availabe data
WASH Lesotho People trained in hygiene and sanitary best practices Lack of availabe data
Disaggregation Issues X14A0T
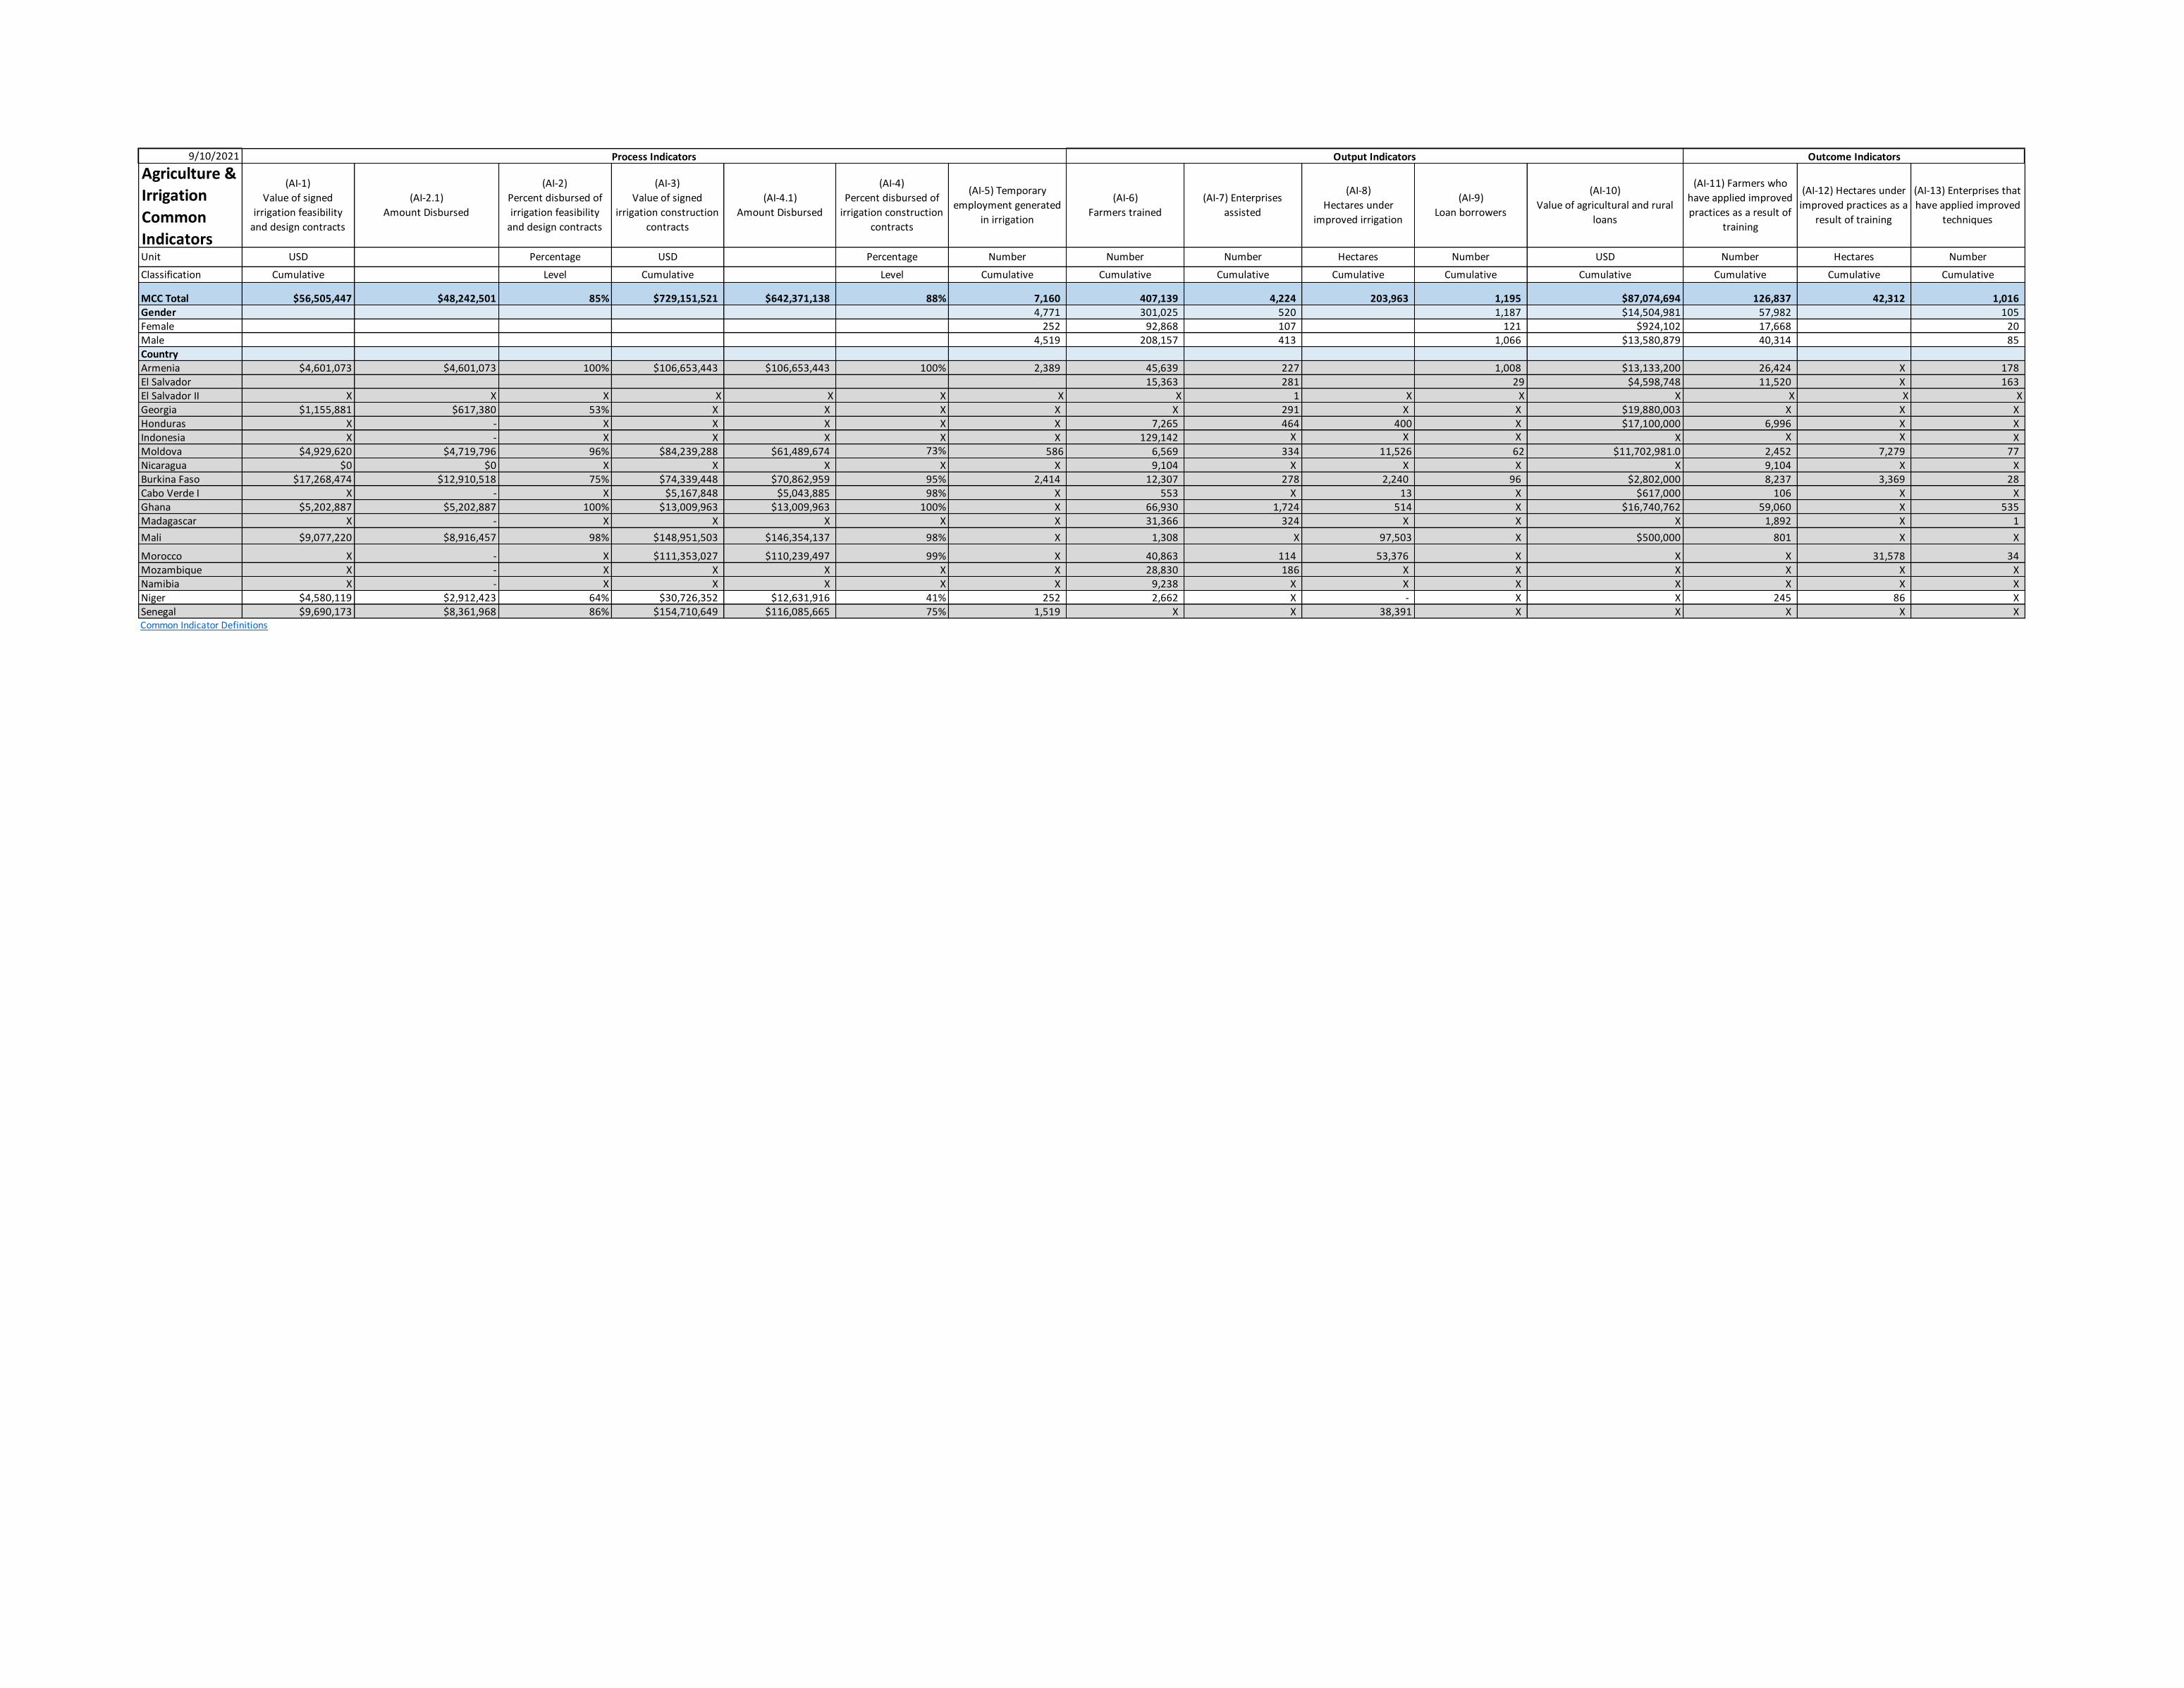
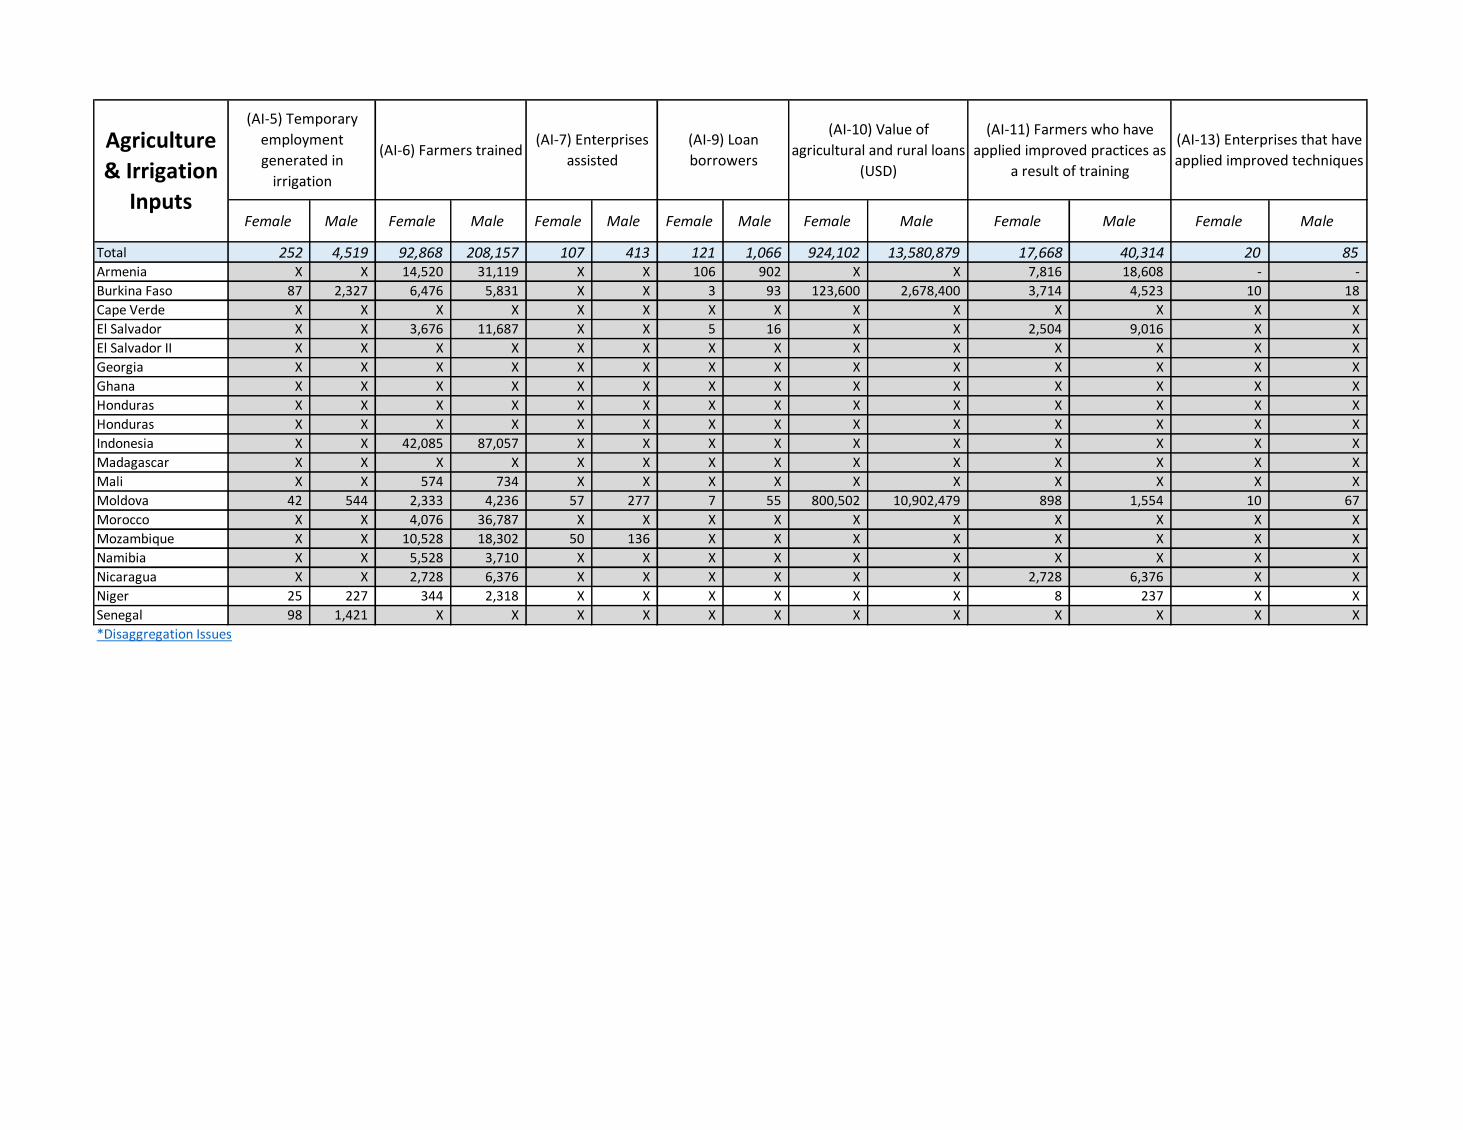
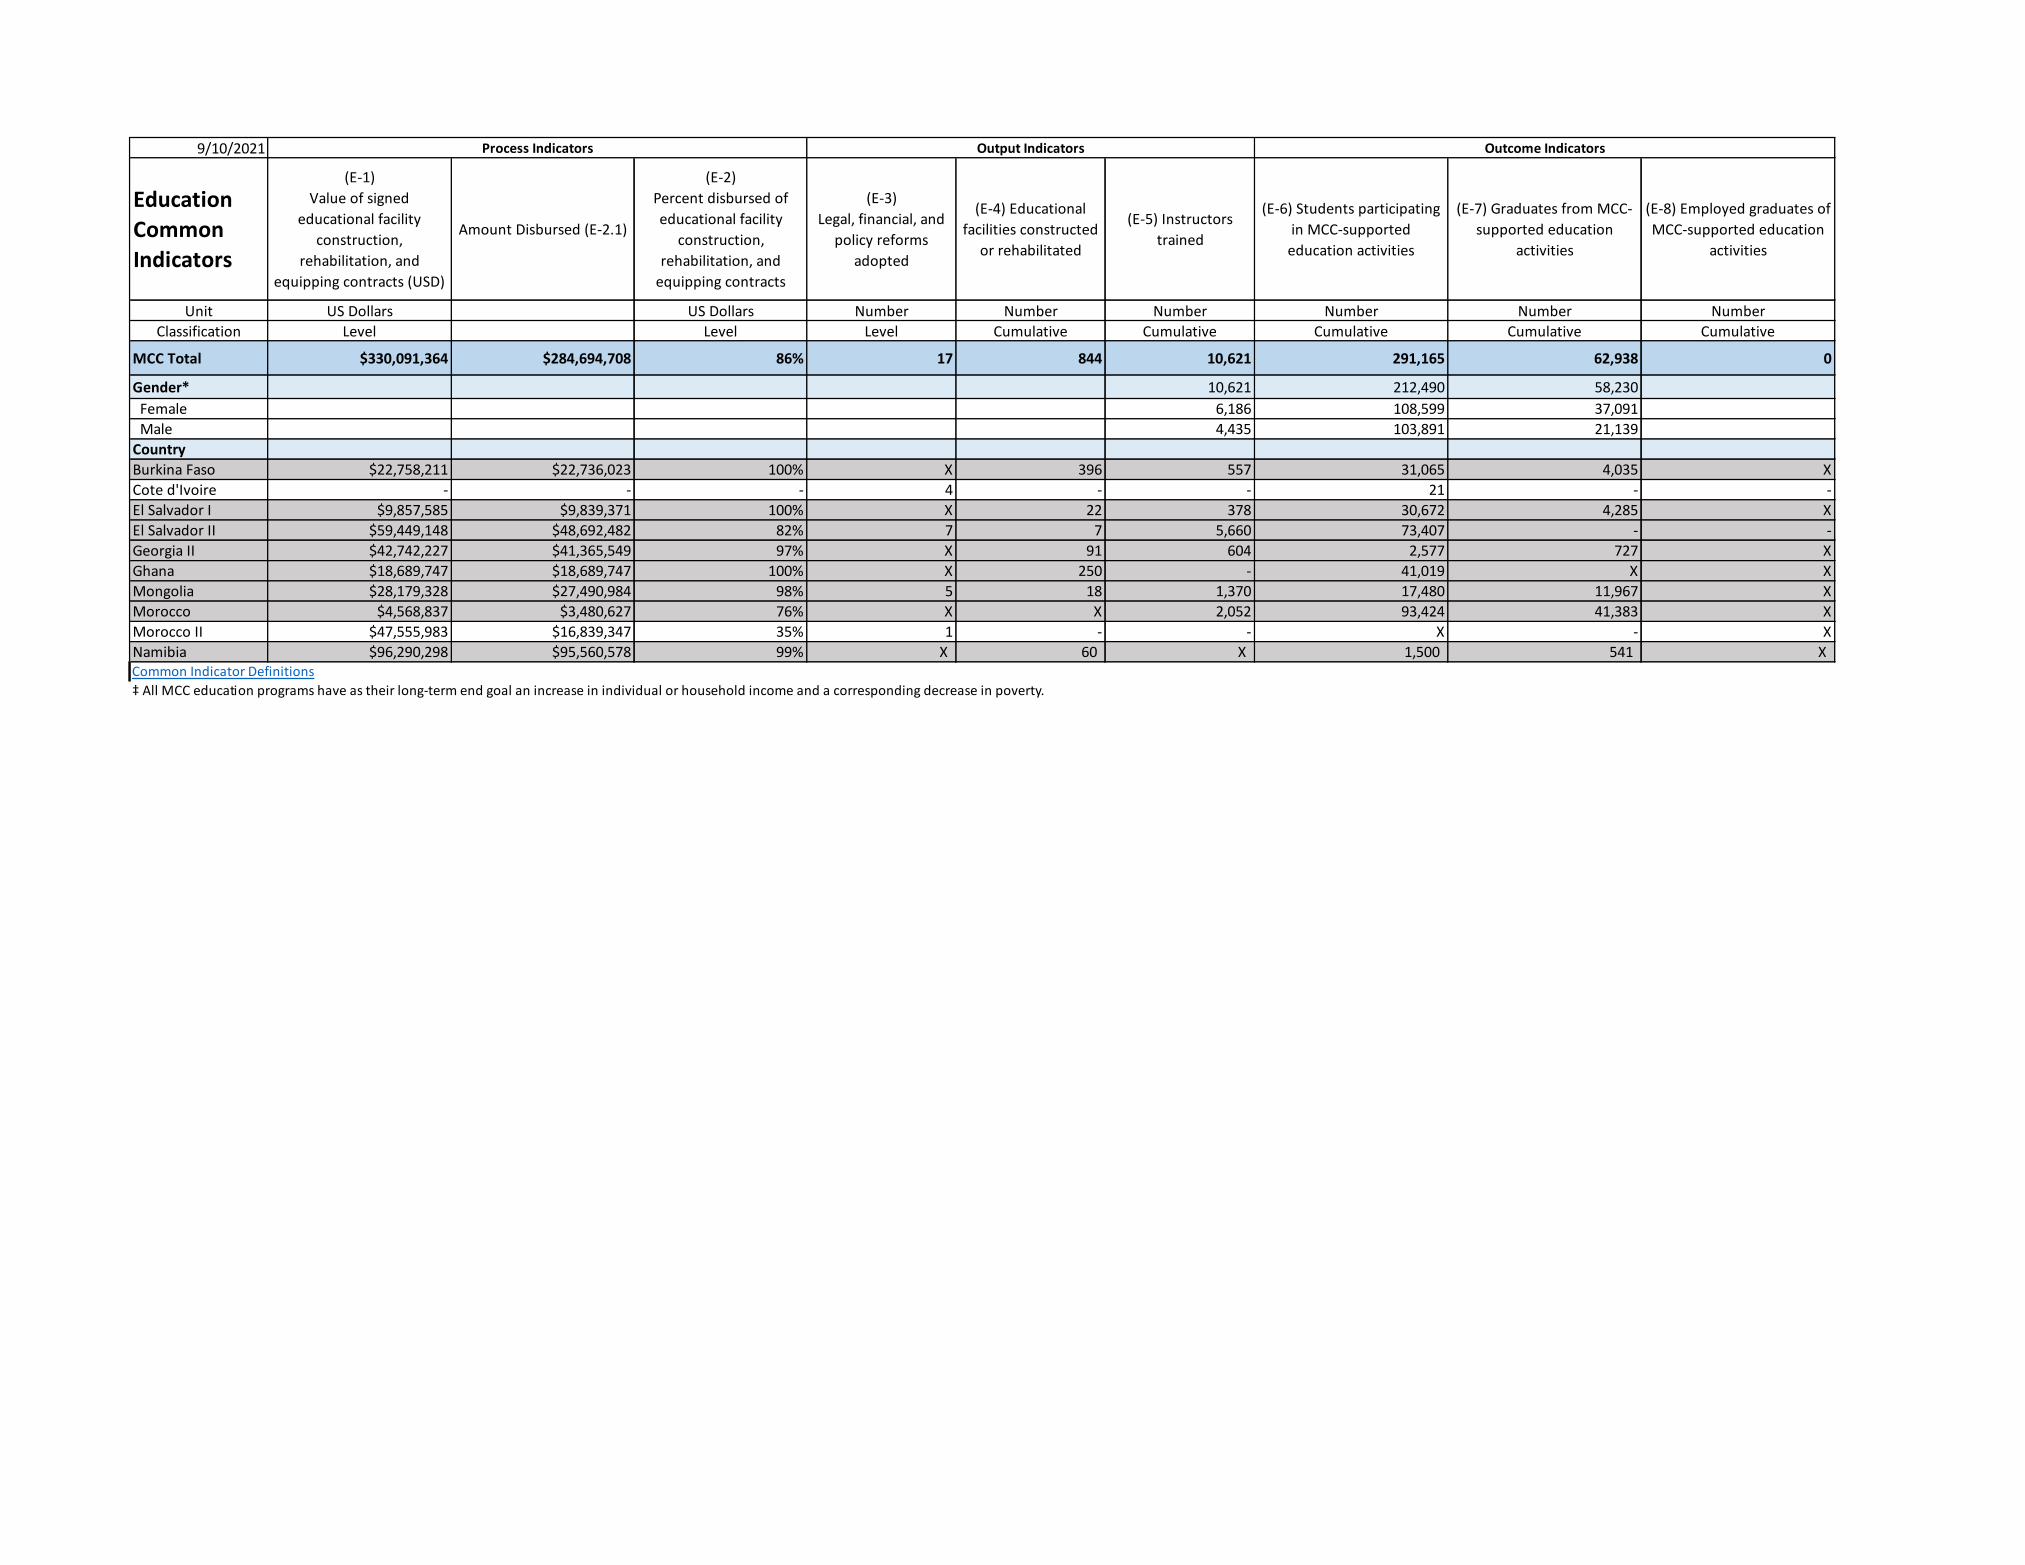
9102021
Education
Common
Indicators
(E-1)
Value of signed
educational facility
construction
rehabilitation and
equipping contracts (USD)
Amount Disbursed (E-21)
(E-2)
Percent disbursed of
educational facility
construction
rehabilitation and
equipping contracts
(E-3)
Legal financial and
policy reforms
adopted
(E-4) Educational
facilities constructed
or rehabilitated
(E-5) Instructors
trained
(E-6) Students participating
in MCC-supported
education activities
(E-7) Graduates from MCC-
supported education
activities
(E-8) Employed graduates of
MCC-supported education
activities
Unit US Dollars US Dollars Number Number Number Number Number Number
Classification Level Level Level Cumulative Cumulative Cumulative Cumulative Cumulative
MCC Total $330091364 $284694708 86 17 844 10621 291165 62938 0
Gender 10621 212490 58230
Female 6186 108599 37091
Male 4435 103891 21139
Country
Burkina Faso $22758211 $22736023 100 X 396 557 31065 4035 X
Cote dIvoire - - - 4 - - 21 - -
El Salvador I $9857585 $9839371 100 X 22 378 30672 4285 X
El Salvador II $59449148 $48692482 82 7 7 5660 73407 - -
Georgia II $42742227 $41365549 97 X 91 604 2577 727 X
Ghana $18689747 $18689747 100 X 250 - 41019 X X
Mongolia $28179328 $27490984 98 5 18 1370 17480 11967 X
Morocco $4568837 $3480627 76 X X 2052 93424 41383 X
Morocco II $47555983 $16839347 35 1 - - X - X
Namibia $96290298 $95560578 99 X 60 X 1500 541 XCommon Indicator Definitions
Dagger All MCC education programs have as their long-term end goal an increase in individual or household income and a corresponding decrease in poverty
Process Indicators Output Indicators Outcome IndicatorsX4A0T
(E-5) Instructors trained(E-6) Students participating in MCC-
supported education activities
(E-7) Graduates from MCC-supported
education activities
(E-8) Employed graduates of MCC-
supported education activities
Female Male Female Male Female Male Female MaleTotal 6186 4435 108599 103891 37091 21139 - - Burkina Faso 206 351 13204 9162 2032 2003 X X
Cote dIvoire - - 3 18 - - - -
El Salvador I 182 196 X X X X X X
El Salvador II 3683 1977 35799 37608 X X X X
Georgia II 235 369 472 2105 101 626 X X
Ghana X X 2166 X X X X X
Mongolia 641 729 4720 12760 3182 8785 X X
Morocco 1239 813 51621 41803 31722 9661 X X
Morocco II - - X X - - X X
Namibia X X 614 435 54 64 X X
Education
Inputs
Disaggregation Issues
X5A0T
9102021 Output Indicators
Land Common
Indicators
(L-1)
Legal and regulatory reforms
adopted
(L-2)
Land administration offices
established or upgraded
(L-3) Stakeholders trained(L-4)
Conflicts successfully mediated
(L-5)
Parcels corrected or incorporated
in land system
(L-6)
Land rights formalized
Unit Number Number Number Number Parcels Number
Classification Cumulative Cumulative Cumulative Cumulative Cumulative CumulativeMCC Total 135 399 78216 12484 357900 320722
Gender 76781 159878
Female 21789 54903
Male 54992 85400
Joint 19575
Location 299679 280725
Urban 200922 156232
Rural 98757 124493
Country
Benin X X 50 X X X
Burkina Faso 54 78 61057 1364 18490 4793
Cabo Verde II 36 38 442 229 37495 11365
Ghana 4 3 427 23 1481 X
Indonesia X X 4463 X X X
Lesotho 11 1 575 151 53296 19325
Madagascar 4 237 X X X X
Mali X 1 1354 X X X
Mongolia 6 15 3920 10639 18336 20672
Morocco II 1 X - X X -
Mozambique X 26 1516 X 205005 251556
Namibia 19 X 2524 X 8869 4356
Nicaragua X X X X X X
Niger X X 248 - 4925 -
Senegal X X 1640 78 10003 8655 Common Indicator Definitions
X6A0T
(L-3) Stakeholders trained(L-5) Parcels corrected or
incorporated in land system(L-6) Household land rights formalized (L-6) Land rights formalized
Female Male Urban Rural Female Male Joint Urban Rural
Total 21789 54992 200922 98757 54903 85400 19575 156232 124493 Benin X X X X X X X X X
Burkina Faso 16496 44561 X 18490 63 4730 X X 4793
Cabo Verde II 167 201 23502 13993 877 1433 1086 9263 2102
Ghana X X X 1481 X X X X X
Indonesia 869 3315 X X X X X X X
Lesotho X X X X X X X X X
Madagascar X X X X X X X X X
Mali 614 710 X X X X X X X
Mongolia 1912 2008 7415 10921 X X X X X
Morocco II - - X X - - X X X
Mozambique 411 1105 170005 35000 53963 79237 18489 146969 104587
Namibia 749 1775 X 8869 X X X X 4356
Nicaragua X X X X X X X X X
Niger 72 176 X X X X X X X
Senegal 499 1141 X 10003 X X X X 8655
Land Inputs
Disaggregation Issues
X7A0T
9102021
Power
Common
Indicators
(P-1) Value of signed
power infrastructure
feasibility and
design contracts
(P-21)
Amount Disbursed
(P-2) Percent
disbursed of power
infrastructure
feasibility and
design contracts
(P-3) Value of signed
power infrastructure
construction
contracts
(P-41)
Amount Disbursed
(P-4) Percent
disbursed of power
infrastructure
construction
contracts
(P-5) Temporary
employment
generated in power
infrastructure
construction
(P-6) Generation
capacity added
(P-7 and P-10) Km
lines upgraded or
built
(P-8) Transmission
throughput capacity
added
(P-9 and P-11)
Substation capacity
added
(P-12) Customers
added by project
(P-15) Total electricity
supply
(P-17) Installed
generation capacity
(P-23) Total
electricity sold
Unit USD Percentage USD Percentage Number Megawatts Kilometers Megawatts Megavolt ampere Number Megawatt hours Megawatts Megawatt hoursClassification Cumulative Level Cumulative Level Cumulative Cumulative Cumulative Level Cumulative Cumulative Level (cumulative) Level Level
MCC Total $95927530 $84491663 88 $912763722 $641916747 70 12420 113 5772 NA 1550 44507 24483054 7141 11605895TampD 4318 Transmission 24 - Distribution 4294 -Gender 8347 Female 429 Male 7918 Grid 113 6192
On-grid 108 8 6126Off-grid 5 5 66
Tariff class 2535782Residential 990249Commercial 684896Industrial 860637Country
Benin II $19950089 $15612431 78 $230356722 $85889325 37 1330 X - X - X 1446580 X 1062611El Salvador X X X X X X X 1523 X X 35412 X X XGeorgia X X X X X X X X X X X X X XGhana X - X X X X X X 99 X X X X X XGhana II $39603334 $35936256 91 $150508010 $114351610 76 4683 X 849 X 560 X 21163175 5592 8684746Indonesia X X X X X X 13 169 X X 9095 X X XLiberia X X X $144858722 $144858722 100 X 88 51 X 84 X 242169 141 87881Malawi $20626684 $15837791 77 $233487716 $165898820 71 2334 12 409 X 906 X 1631130 459 1444888Mongolia X X X X X X X X X X X X X X XTanzania $15747424 $17105186 109 $153552553 $130918271 85 4073 X 2673 X X X X 949 325769
Process Indicators Output Indicators Outcome IndicatorsX8A0T
Female Male Foreign Local Skilled Semi-skilled Un-skilled Female Male On-grid Off-grid Renewable Thermal ResidentialCommercial Industrial Domestic Imports IPP
Government-
Owned On-grid Off-grid Residential Commercial Industrial
Total 429 7918 890 6991 3627 1390 3135 - - 108 5 12 - - - - 22164930 686995 11624991 10294076 6126 66 990249 684896 860637
Benin II 128 1202 92 1196 336 86 907 X X X X X X X X X 809202 637378 - 805508 X X 413467 446360 184617
El Salvador X X X X X X X X X X X X X X X X X X X X X X X X X
Georgia X X X X X X X X X X X X X X X X X X X X X X X X X
Ghana X X X X X X X X X X X X X X X X X X X X X X X X X
Ghana II 131 4552 163 4520 2580 1104 1265 - - - - - - - - - 21113559 49616 11624991 9488568 5527 66 - - -
Indonesia X X X X X X X X X 8 5 X X X X X X X X X X X X X X
Liberia X X X X X X X X X 88 - X X X X X 242169 - X X 141 X 31481 14232 738
Malawi 170 2164 635 1275 711 200 963 X X 12 X 12 X X X X X X X X 459 X 545301 224304 675283
Mongolia X X X X X X X X X X X X X X X X X X X X X X X X X
Tanzania X X X X X X X X X X X X X X X X X X X X X X X X X
Disaggregation Issues
(P-17) Installed
generation capacity
(P-12) Customers added by
project(P-23) Total electricity sold(P-15) Total electricity supply (P-15) Total electricity supply
(P-6) Generation
capacity addedPower Inputs
(P-5) Temporary
employment
generated in power
infrastructure
construction
(P-5) Temporary
employment
generated in power
infrastructure
construction
(P-5) Temporary employment
generated in power
infrastructure construction
(P-12) Customers
added by project
(P-6) Generation
capacity added
X9A0T
9102021 Output Indicators Outcome Indicators
Transportation Common Indicators
(R-1)
Value of signed road
feasibility and design
contracts
(R-21) Value disbursed of road
feasibilty and design contracts
(R-2)
Percent disbursed of road
feasibility and design
contracts
(R-3) Kilometers of
roads under design
(R-4)
Value of signed road
construction contracts
(R-51) Value disbursed of
roads construction
contracts
(R-5)
Percent disbursed of road
construction contracts
(R-6) Kilometers of roads
under works contracts
(R-7) Temporary employment
generated in road construction
(R-8)
Kilometers of roads
completed
(R-11)
Road traffic fatalities
Unit USD Percentage Kilometers USD USD Percentage Kilometers Number Kilometers Number
Classification Cumulative Level Cumulative Cumulative Cumulative Level Cumulative Cumulative Cumulative Level
MCC Total $149178209 $135937953 91 4773 $2536954765 $2159741480 85 42599 52472 3035 719
Gender 17107 110
Female 1460 8
Male 15647 102
Road Type $115356799 $102790980 89 4710 $2268898280 $1831686701 81 33482 2734
Primary $82645411 $72465108 88 2183 $1451578319 $1158838760 80 15344 1178
Secondary $25992205 $22767400 88 1591 $652814560 $533887257 82 11329 479
Tertiary $6719183 $7558472 112 935 $164505401 $138960684 84 6810 1078
Country
Armenia X - X X X X X 00 X 24 X
Burkina Faso $8339651 $9625883 115 536 $140205145 $142457135 102 4191 4162 278 6
Cape Verde I $3520000 $3230000 92 63 $24280000 $24279171 100 406 X 41 X
Cote dIvoire $15506313 $6622482 43 30 - - - - - - 64
El Salvador I $18321410 $18048524 99 223 $248378825 $240211648 97 2230 X 223 X
El Salvador II X X X 10 $101892088 $58739536 58 422 2650 X X
Georgia $11980000 $11868449 99 0 $197299030 $197299030 100 2202 X 220 X
Ghana $5549044 $5549044 100 943 $250604022 $250604022 100 4464 35455 445 602
Honduras $9500000 $7163000 75 673 $179400000 $128412000 72 6730 X 610 X
Liberia X X X X X X X X X X X
Mali $0 $0 X X $42918038 $15018313 35 810 X 79 X
Moldova X - X 96 $100807443 $97020289 96 960 1309 96 4
Mongolia $6083650 $5421254 89 19 $73108907 $66492533 91 1764 X 176 X
Mozambique $17669992 $15049358 85 253 $132240557 $116601108 88 2530 2308 253 X
Nicaragua $0 $0 X 376 $56507526 $56507526 100 740 X 74 X
Niger $3172736 $3091229 97 300 $89104056 $17634110 20 3000 - - X
Philippines $15235623 $14391002 94 222 $173156531 $139529147 81 2220 X 175 0
Senegal $12201371 $12444412 102 406 $271128882 $189227036 70 3750 2757 X 43
Tanzania $19143331 $20478228 107 473 $399926666 $363711825 91 4683 3831 190 0
Vanuatu $2955088 $2955088 100 150 $55997051 $55997051 100 1497 X 150 X
Common Indicator Definitions
According to the Common Indicator definition a road is completed when official certificates are handed over and approved In Senegal this was taken to mean final acceptance of the road works which typically happens after the end of the 1 year defects liability period which starts when the construction is completed and the roads are
provisionally accepted As part of its Compact Senegal intended to rehabilitate 372 kilometers of national roads By September 2015 when the Senegal Compact closed no roads had achieved final acceptance and therefore were not officially completed per the common indicator definition However by the end of the Compact 185km of roads had
been fully rehabilitated and had received provisional acceptance An additional 72km were provisionally accepted in November 2015 and the remaining 116km are anticipated to be provisionally accepted with the support of the Government of Senegal by mid-2016
Kilometers of road for Mozambique require verification through takeover certificates However takeover certificates were never provided and the number reported is not verified
Process IndicatorsX10A0T
Primary Secondary Tertiary Primary Secondary Tertiary Primary Secondary Tertiary Primary Secondary Tertiary Primary Secondary Tertiary Primary Secondary Female Male Primary Secondary Tertiary Primary Secondary Tertiary Primary Secondary Tertiary Female Male
Total 82645411 25992205 6719183 72465108 22767400 7558472 2183 1591 935 1451578319 652814560 164505401 1158838760 533887257 138960684 1534 1133 1460 15647 1178 479 1078 NA NA NA NA NA NA 8 102 Armenia X X X X X X X X X X X X X X X X X X X X X 24 X X 3 X X 735 X X
Burkina Faso 5814443 X 2525208 6418186 X 3207697 355 X 181 129574643 X 10630502 201528839 X 41678755 274 X 247 3915 194 X 84 X X X X X X X 6
Cape Verde X X X X X X X X X X X X X X X X X X X X X X X X X X X X X X
Cote dIvoire 15506313 X X 6622482 X X 30 X X - - - - - - - - - - - - - - - - - - - 4 57
El Salvador I X X X X X X X 190 33 X 225888160 22490665 X 220120113 2091535 X 185 X X X 185 38 X X X X X X X X
El Salvador II X X X X X X 10 X X 101892088 X X 58739536 X X 42 X 263 2387 X X X X X X X X X X XGeorgia X X X X X X X X X X X X X X X X X X X X X X X X X X X X X X
Ghana 3196669 X 2352375 3196669 X 2352375 257 X 686 187609312 X 62994710 187609312 - 62994710 89 - X X 88 - 357 X X X X X X X X
Honduras X 9500000 X X 7163000 X X 673 X X 179400000 X X 128412000 X X 673 X X 50 66 495 X X X X X X X X
Liberia X X X X X X X X X X X X X X X X X X X X X X X X X X X X X X
Mali X X X X X X - X X X X 42918038 - X 15018313 X X X X X X 79 X X X X X X X X
Moldova X X X X X X 96 X X 100807443 X X 97020289 X X 96 X 88 1221 96 X X X X X X X X X X
Mongolia 6083650 X X 5421254 X X 19 X X 73108907 X X 66492533 X X 176 X X X 176 X X 2 X X X X X X X
Mozambique 17669992 X X 15049358 X X 253 X X 132240557 X X 116601108 X X 253 X 237 2071 253 X X X X X X X X X X
Nicaragua X X X - X X 86 290 X 17722893 38784633 X 17722893 38784633 X 21 53 - - 21 53 X X X X X X X X X
Niger 1916154 1256582 X 1877831 1213398 X 83 217 X 7041364 35585237 X 10592746 7041364 X X X X X X X X X X X X X X X X
Philippines - 15235623 X - 14391002 X X 222 X X 173156531 X X 139529147 X X 222 X X X 175 X X X X X X X X X
Senegal 12201371 X X 12444412 X X 406 X X 271128882 X X X X X X 272 2485 X X X X X X X X X 4 39
Tanzania 17301731 X 1841600 18479828 X 1998400 438 X 35 374455179 X 25471487 346534454 X 17177371 433 X 353 3568 150 X X X X X X X X X XVanuatu 2955088 X X 2955088 X X 150 X X 55997051 X X 55997051 X X 150 X X X 150 X X X X X X X X X X
(R-11) Road traffic fatalities
(R-10) Average annual daily traffic
(R-9) Roughness(R-8) Kilometers of roads
completed
(R-6) Kilometers of roads under works
contracts
(R-51) Value disbursed of roads construction contracts
(R-4) Value of signed road construction contracts(R-21) Value disbursed of road feasibility
and design contracts(R-3) Kilometers of roads under
design(R-1) Value of signed road feasibility and
design contracts
(R-7) Temporary employment
generated in road
construction
Transportation Inputs
Disaggregation Issues
X11A0T
9102021
WASH
Common
Indicators
(WS-1)
Value of signed water and
sanitation feasibility and design
contracts (USD)
Amount Disbursed
(WS-2)
Percent disbursed of water and
sanitation feasibility and design
contracts
(WS-3)
Value of signed water and
sanitation construction contracts
(USD)
Amount Disbursed
(WS-4)
Percent disbursed of water and
sanitation construction
contracts
(WS-5)
Temporary employment generated
in water and sanitation
construction
(WS-6)
People trained in hygiene and
sanitary best practices
(WS-7)
Water points constructed
Residential population connnected to sewer
systemResidential population
Unit US Dollars Percentage USD Percentage Number Number Number Number NumberClassification Cumulative Level Cumulative Level Cumulative Cumulative Cumulative Cumulative Cumulative
MCC Total $54337691 $53735311 989 $816963219 $763548856 935 21776 12386 1191 NA NAGender 9862 Female 1123 - Male 8739 - CountryCabo Verde II $783369 $733263 936 $19315569 $18827292 975 759 32 X X XEl Salvador $4983800 $4785175 960 $10451448 $10188837 975 X 2406 X X XEl Salvador II X X X X X X X X - X XGeorgia $266865 $266865 1000 $54315000 $51178716 942 X X X X XGhana $1475148 $1475148 1000 $13949465 $13949465 1000 X 778 392 X XJordan $0 $0 X $238732246 $238486447 100 3825 X X X XLesotho X - X $59733645 $47189579 79 11527 454 175 X XMongolia II X X X X X X - X X X XMozambique $35076009 $34753498 991 $169500497 $148359134 875 2276 8400 614 X XTanzania $6861280 $7008600 1021 $45403796 $36801560 811 387 X X X XZambia $4891220 $4712762 964 $205561552 $198567825 966 3002 316 10 X XCommon Indicator Definitions
This is a monitoring indicator any change over baseline data represents the current trend and does not represent the direct impact of the MCC-investment Jordans MampE Plan has throughout the life of the compact defined hours of supply as hoursweek As such all documentation is in this form The value here has been divided by 7 here to accurately reflect supply hours per dayThe current unit for volume of water produced has a discrepancy MCC MampE is in the process of revising this common indicator to clarify and align with current industry standards
Process Indicators Output Indicators Output IndicatorsX12A0T
(WS-5) Temporary employment
generated in water and
sanitation construction
(WS-6) People trained in
hygiene and sanitary best
practices
Female Male Female MaleTotal 1123 8739 5913 6019 Cabo Verde II 111 648 20 12
El Salvador X X 1278 1128
Georgia X X X X
Ghana X X 246 532
Jordan 148 3677 X X
Lesotho X X X X
Mongolia II - - X X
Mozambique 200 2076 4195 4205
Tanzania X X X X
Zambia 664 2338 174 142
WASH
Inputs
Disaggregation Issues
Due to the current reporting style of Jordans ITT the male figure is the difference of
the Total minus the Female values
Jordans overall temporary employment figures now include employment
generated through the Water Smart Homes Activity and the As Samra Project as a
result of the December 2016 MampE Plan Revision in addition to the Water Network
Project Infrastructure Activity and the Wastewater Network Project
X13A0T
Sector Country Indicator Issue
Agriculture and Irrigation Madagascar Farmers Trained Lack of disaggregations in early compacts
Agriculture and Irrigation Madagascar Enterprises assisted Lack of disaggregations in early compacts
Agriculture and Irrigation Madagascar Farmers who have applied improved practices as a result of training Lack of disaggregations in early compacts
Agriculture and Irrigation Madagascar Enterprises that have applied improved techniques Lack of disaggregations in early compacts
Agriculture and Irrigation Georgia Enterprises assisted Lack of disaggregations in early compacts
Agriculture and Irrigation Georgia Value of agricultural and rural loans Lack of disaggregations in early compacts
Agriculture and Irrigation Ghana Farmers Trained Lack of disaggregations in early compacts
Agriculture and Irrigation Ghana Enterprises assisted Lack of disaggregations in early compacts
Agriculture and Irrigation Ghana Value of agricultural and rural loans Lack of disaggregations in early compacts
Agriculture and Irrigation Ghana Farmers who have applied improved practices as a result of training Lack of disaggregations in early compacts
Agriculture and Irrigation Ghana Enterprises that have applied improved techniques Lack of disaggregations in early compacts
Agriculture and Irrigation El Salvador Enterprises assisted Lack of disaggregations in early compacts
Agriculture and Irrigation El Salvador Value of agricultural and rural loans Lack of disaggregations in early compacts
Agriculture and Irrigation El Salvador Enterprises that have applied improved techniques Lack of disaggregations in early compacts
Agriculture and Irrigation Mali Value of agricultural and rural loans Lack of disaggregations in early compacts
Agriculture and Irrigation Mali Farmers who have applied improved practices as a result of training Lack of disaggregations in early compacts
Education El Salvador Students Participating in MCC-supported education activities Lack of disaggregations in early compacts
Education El Salvador Graduated from MCC-supported Education activities Lack of disaggregations in early compacts
Education Burkina Faso Students Participating in MCC-supported education activities The total does not equal the sum of the disaggregations
Education Namibia Students Participating in MCC-supported education activities The total does not equal the sum of the disaggregations
Education Ghana Students Participating in MCC-supported education activities The total does not equal the sum of the disaggregations
Land Ghana Stakeholders trained Lack of disaggregations in early compacts
Land Namibia Household land rights formalized Lack of availabe data
Land Senegal Household land rights formalized Lack of availabe data
Land Lesotho Stakeholders trained Lack of availabe data
Land Lesotho Parcels corrected or incorporated in land system Lack of availabe data
Land Lesotho Household land rights formalized Lack of availabe data
Land Mozambique Household land rights formalized The total does not equal the sum of the disaggregations
Power Tanzania Temporary Employment Lack of disaggregations in early compacts
Transport Georgia Value of signed road feasibility and design contracts Lack of disaggregations in early compacts
Transport Georgia Value disbursed of road feasibility and design contracts Lack of disaggregations in early compacts
Transport Georgia Kilometers of roads under design Lack of disaggregations in early compacts
Transport Georgia Value of signed road construction contracts Lack of disaggregations in early compacts
Transport Georgia Value disbursed of road construction contracts Lack of disaggregations in early compacts
Transport Georgia Kilometers of roads under work contracts Lack of disaggregations in early compacts
Transport Georgia Kilometers of roads completed Lack of disaggregations in early compacts
Transport Ghana Temporary Employment generated in road construction Lack of disaggregations in early compacts
Transport Ghana Road traffic fatalities Lack of disaggregations in early compacts
WASH Tanzania
Temporary Employment generated in water and sanitation
construction Lack of availabe data
WASH Lesotho
Temporary Employment generated in water and sanitation
construction Lack of availabe data
WASH Lesotho People trained in hygiene and sanitary best practices Lack of availabe data
Disaggregation Issues X14A0T
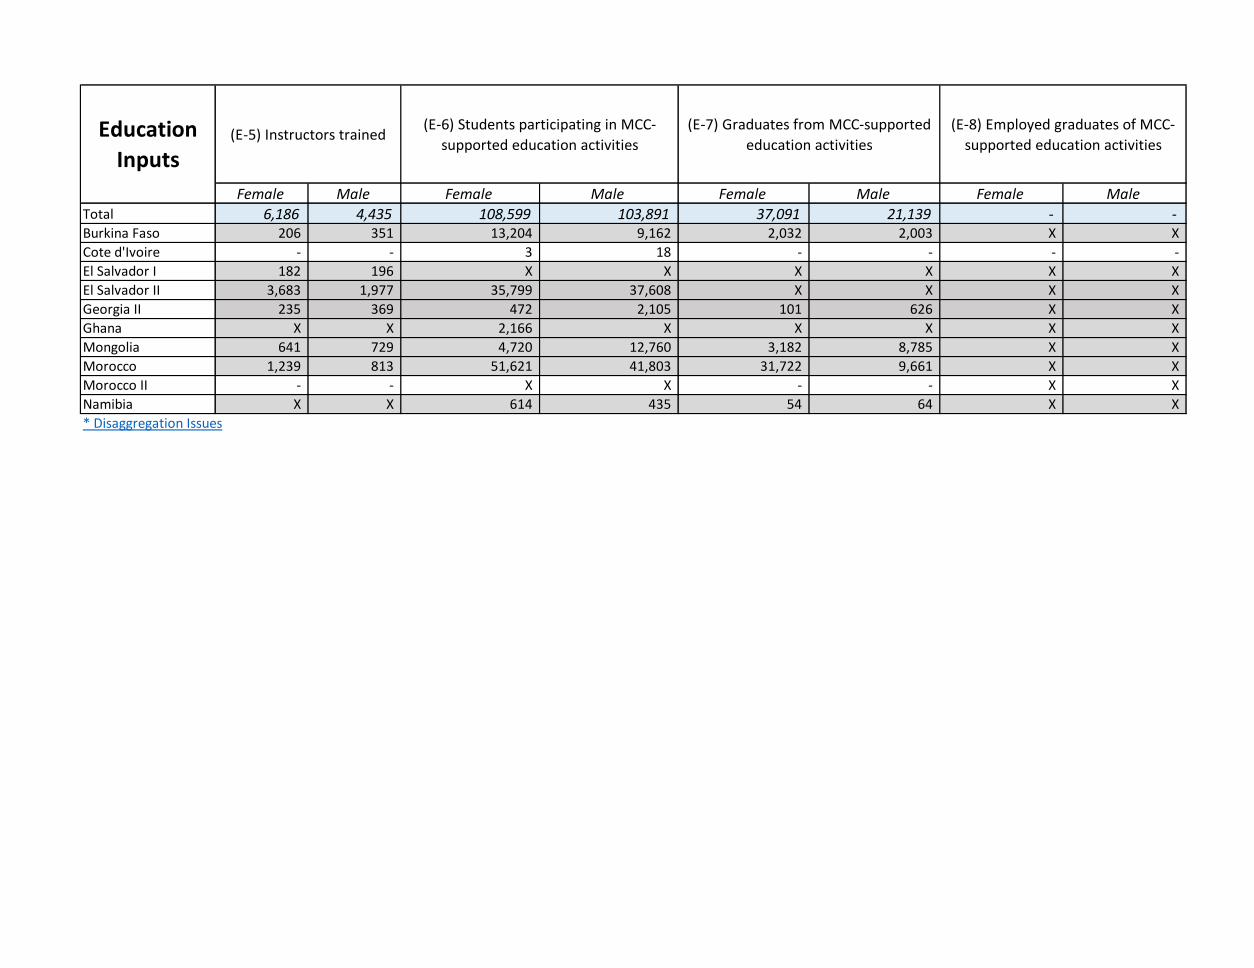

9102021
Power
Common
Indicators
(P-1) Value of signed
power infrastructure
feasibility and
design contracts
(P-21)
Amount Disbursed
(P-2) Percent
disbursed of power
infrastructure
feasibility and
design contracts
(P-3) Value of signed
power infrastructure
construction
contracts
(P-41)
Amount Disbursed
(P-4) Percent
disbursed of power
infrastructure
construction
contracts
(P-5) Temporary
employment
generated in power
infrastructure
construction
(P-6) Generation
capacity added
(P-7 and P-10) Km
lines upgraded or
built
(P-8) Transmission
throughput capacity
added
(P-9 and P-11)
Substation capacity
added
(P-12) Customers
added by project
(P-15) Total electricity
supply
(P-17) Installed
generation capacity
(P-23) Total
electricity sold
Unit USD Percentage USD Percentage Number Megawatts Kilometers Megawatts Megavolt ampere Number Megawatt hours Megawatts Megawatt hoursClassification Cumulative Level Cumulative Level Cumulative Cumulative Cumulative Level Cumulative Cumulative Level (cumulative) Level Level
MCC Total $95927530 $84491663 88 $912763722 $641916747 70 12420 113 5772 NA 1550 44507 24483054 7141 11605895TampD 4318 Transmission 24 - Distribution 4294 -Gender 8347 Female 429 Male 7918 Grid 113 6192
On-grid 108 8 6126Off-grid 5 5 66
Tariff class 2535782Residential 990249Commercial 684896Industrial 860637Country
Benin II $19950089 $15612431 78 $230356722 $85889325 37 1330 X - X - X 1446580 X 1062611El Salvador X X X X X X X 1523 X X 35412 X X XGeorgia X X X X X X X X X X X X X XGhana X - X X X X X X 99 X X X X X XGhana II $39603334 $35936256 91 $150508010 $114351610 76 4683 X 849 X 560 X 21163175 5592 8684746Indonesia X X X X X X 13 169 X X 9095 X X XLiberia X X X $144858722 $144858722 100 X 88 51 X 84 X 242169 141 87881Malawi $20626684 $15837791 77 $233487716 $165898820 71 2334 12 409 X 906 X 1631130 459 1444888Mongolia X X X X X X X X X X X X X X XTanzania $15747424 $17105186 109 $153552553 $130918271 85 4073 X 2673 X X X X 949 325769
Process Indicators Output Indicators Outcome IndicatorsX8A0T
Female Male Foreign Local Skilled Semi-skilled Un-skilled Female Male On-grid Off-grid Renewable Thermal ResidentialCommercial Industrial Domestic Imports IPP
Government-
Owned On-grid Off-grid Residential Commercial Industrial
Total 429 7918 890 6991 3627 1390 3135 - - 108 5 12 - - - - 22164930 686995 11624991 10294076 6126 66 990249 684896 860637
Benin II 128 1202 92 1196 336 86 907 X X X X X X X X X 809202 637378 - 805508 X X 413467 446360 184617
El Salvador X X X X X X X X X X X X X X X X X X X X X X X X X
Georgia X X X X X X X X X X X X X X X X X X X X X X X X X
Ghana X X X X X X X X X X X X X X X X X X X X X X X X X
Ghana II 131 4552 163 4520 2580 1104 1265 - - - - - - - - - 21113559 49616 11624991 9488568 5527 66 - - -
Indonesia X X X X X X X X X 8 5 X X X X X X X X X X X X X X
Liberia X X X X X X X X X 88 - X X X X X 242169 - X X 141 X 31481 14232 738
Malawi 170 2164 635 1275 711 200 963 X X 12 X 12 X X X X X X X X 459 X 545301 224304 675283
Mongolia X X X X X X X X X X X X X X X X X X X X X X X X X
Tanzania X X X X X X X X X X X X X X X X X X X X X X X X X
Disaggregation Issues
(P-17) Installed
generation capacity
(P-12) Customers added by
project(P-23) Total electricity sold(P-15) Total electricity supply (P-15) Total electricity supply
(P-6) Generation
capacity addedPower Inputs
(P-5) Temporary
employment
generated in power
infrastructure
construction
(P-5) Temporary
employment
generated in power
infrastructure
construction
(P-5) Temporary employment
generated in power
infrastructure construction
(P-12) Customers
added by project
(P-6) Generation
capacity added
X9A0T
9102021 Output Indicators Outcome Indicators
Transportation Common Indicators
(R-1)
Value of signed road
feasibility and design
contracts
(R-21) Value disbursed of road
feasibilty and design contracts
(R-2)
Percent disbursed of road
feasibility and design
contracts
(R-3) Kilometers of
roads under design
(R-4)
Value of signed road
construction contracts
(R-51) Value disbursed of
roads construction
contracts
(R-5)
Percent disbursed of road
construction contracts
(R-6) Kilometers of roads
under works contracts
(R-7) Temporary employment
generated in road construction
(R-8)
Kilometers of roads
completed
(R-11)
Road traffic fatalities
Unit USD Percentage Kilometers USD USD Percentage Kilometers Number Kilometers Number
Classification Cumulative Level Cumulative Cumulative Cumulative Level Cumulative Cumulative Cumulative Level
MCC Total $149178209 $135937953 91 4773 $2536954765 $2159741480 85 42599 52472 3035 719
Gender 17107 110
Female 1460 8
Male 15647 102
Road Type $115356799 $102790980 89 4710 $2268898280 $1831686701 81 33482 2734
Primary $82645411 $72465108 88 2183 $1451578319 $1158838760 80 15344 1178
Secondary $25992205 $22767400 88 1591 $652814560 $533887257 82 11329 479
Tertiary $6719183 $7558472 112 935 $164505401 $138960684 84 6810 1078
Country
Armenia X - X X X X X 00 X 24 X
Burkina Faso $8339651 $9625883 115 536 $140205145 $142457135 102 4191 4162 278 6
Cape Verde I $3520000 $3230000 92 63 $24280000 $24279171 100 406 X 41 X
Cote dIvoire $15506313 $6622482 43 30 - - - - - - 64
El Salvador I $18321410 $18048524 99 223 $248378825 $240211648 97 2230 X 223 X
El Salvador II X X X 10 $101892088 $58739536 58 422 2650 X X
Georgia $11980000 $11868449 99 0 $197299030 $197299030 100 2202 X 220 X
Ghana $5549044 $5549044 100 943 $250604022 $250604022 100 4464 35455 445 602
Honduras $9500000 $7163000 75 673 $179400000 $128412000 72 6730 X 610 X
Liberia X X X X X X X X X X X
Mali $0 $0 X X $42918038 $15018313 35 810 X 79 X
Moldova X - X 96 $100807443 $97020289 96 960 1309 96 4
Mongolia $6083650 $5421254 89 19 $73108907 $66492533 91 1764 X 176 X
Mozambique $17669992 $15049358 85 253 $132240557 $116601108 88 2530 2308 253 X
Nicaragua $0 $0 X 376 $56507526 $56507526 100 740 X 74 X
Niger $3172736 $3091229 97 300 $89104056 $17634110 20 3000 - - X
Philippines $15235623 $14391002 94 222 $173156531 $139529147 81 2220 X 175 0
Senegal $12201371 $12444412 102 406 $271128882 $189227036 70 3750 2757 X 43
Tanzania $19143331 $20478228 107 473 $399926666 $363711825 91 4683 3831 190 0
Vanuatu $2955088 $2955088 100 150 $55997051 $55997051 100 1497 X 150 X
Common Indicator Definitions
According to the Common Indicator definition a road is completed when official certificates are handed over and approved In Senegal this was taken to mean final acceptance of the road works which typically happens after the end of the 1 year defects liability period which starts when the construction is completed and the roads are
provisionally accepted As part of its Compact Senegal intended to rehabilitate 372 kilometers of national roads By September 2015 when the Senegal Compact closed no roads had achieved final acceptance and therefore were not officially completed per the common indicator definition However by the end of the Compact 185km of roads had
been fully rehabilitated and had received provisional acceptance An additional 72km were provisionally accepted in November 2015 and the remaining 116km are anticipated to be provisionally accepted with the support of the Government of Senegal by mid-2016
Kilometers of road for Mozambique require verification through takeover certificates However takeover certificates were never provided and the number reported is not verified
Process IndicatorsX10A0T
Primary Secondary Tertiary Primary Secondary Tertiary Primary Secondary Tertiary Primary Secondary Tertiary Primary Secondary Tertiary Primary Secondary Female Male Primary Secondary Tertiary Primary Secondary Tertiary Primary Secondary Tertiary Female Male
Total 82645411 25992205 6719183 72465108 22767400 7558472 2183 1591 935 1451578319 652814560 164505401 1158838760 533887257 138960684 1534 1133 1460 15647 1178 479 1078 NA NA NA NA NA NA 8 102 Armenia X X X X X X X X X X X X X X X X X X X X X 24 X X 3 X X 735 X X
Burkina Faso 5814443 X 2525208 6418186 X 3207697 355 X 181 129574643 X 10630502 201528839 X 41678755 274 X 247 3915 194 X 84 X X X X X X X 6
Cape Verde X X X X X X X X X X X X X X X X X X X X X X X X X X X X X X
Cote dIvoire 15506313 X X 6622482 X X 30 X X - - - - - - - - - - - - - - - - - - - 4 57
El Salvador I X X X X X X X 190 33 X 225888160 22490665 X 220120113 2091535 X 185 X X X 185 38 X X X X X X X X
El Salvador II X X X X X X 10 X X 101892088 X X 58739536 X X 42 X 263 2387 X X X X X X X X X X XGeorgia X X X X X X X X X X X X X X X X X X X X X X X X X X X X X X
Ghana 3196669 X 2352375 3196669 X 2352375 257 X 686 187609312 X 62994710 187609312 - 62994710 89 - X X 88 - 357 X X X X X X X X
Honduras X 9500000 X X 7163000 X X 673 X X 179400000 X X 128412000 X X 673 X X 50 66 495 X X X X X X X X
Liberia X X X X X X X X X X X X X X X X X X X X X X X X X X X X X X
Mali X X X X X X - X X X X 42918038 - X 15018313 X X X X X X 79 X X X X X X X X
Moldova X X X X X X 96 X X 100807443 X X 97020289 X X 96 X 88 1221 96 X X X X X X X X X X
Mongolia 6083650 X X 5421254 X X 19 X X 73108907 X X 66492533 X X 176 X X X 176 X X 2 X X X X X X X
Mozambique 17669992 X X 15049358 X X 253 X X 132240557 X X 116601108 X X 253 X 237 2071 253 X X X X X X X X X X
Nicaragua X X X - X X 86 290 X 17722893 38784633 X 17722893 38784633 X 21 53 - - 21 53 X X X X X X X X X
Niger 1916154 1256582 X 1877831 1213398 X 83 217 X 7041364 35585237 X 10592746 7041364 X X X X X X X X X X X X X X X X
Philippines - 15235623 X - 14391002 X X 222 X X 173156531 X X 139529147 X X 222 X X X 175 X X X X X X X X X
Senegal 12201371 X X 12444412 X X 406 X X 271128882 X X X X X X 272 2485 X X X X X X X X X 4 39
Tanzania 17301731 X 1841600 18479828 X 1998400 438 X 35 374455179 X 25471487 346534454 X 17177371 433 X 353 3568 150 X X X X X X X X X XVanuatu 2955088 X X 2955088 X X 150 X X 55997051 X X 55997051 X X 150 X X X 150 X X X X X X X X X X
(R-11) Road traffic fatalities
(R-10) Average annual daily traffic
(R-9) Roughness(R-8) Kilometers of roads
completed
(R-6) Kilometers of roads under works
contracts
(R-51) Value disbursed of roads construction contracts
(R-4) Value of signed road construction contracts(R-21) Value disbursed of road feasibility
and design contracts(R-3) Kilometers of roads under
design(R-1) Value of signed road feasibility and
design contracts
(R-7) Temporary employment
generated in road
construction
Transportation Inputs
Disaggregation Issues
X11A0T
9102021
WASH
Common
Indicators
(WS-1)
Value of signed water and
sanitation feasibility and design
contracts (USD)
Amount Disbursed
(WS-2)
Percent disbursed of water and
sanitation feasibility and design
contracts
(WS-3)
Value of signed water and
sanitation construction contracts
(USD)
Amount Disbursed
(WS-4)
Percent disbursed of water and
sanitation construction
contracts
(WS-5)
Temporary employment generated
in water and sanitation
construction
(WS-6)
People trained in hygiene and
sanitary best practices
(WS-7)
Water points constructed
Residential population connnected to sewer
systemResidential population
Unit US Dollars Percentage USD Percentage Number Number Number Number NumberClassification Cumulative Level Cumulative Level Cumulative Cumulative Cumulative Cumulative Cumulative
MCC Total $54337691 $53735311 989 $816963219 $763548856 935 21776 12386 1191 NA NAGender 9862 Female 1123 - Male 8739 - CountryCabo Verde II $783369 $733263 936 $19315569 $18827292 975 759 32 X X XEl Salvador $4983800 $4785175 960 $10451448 $10188837 975 X 2406 X X XEl Salvador II X X X X X X X X - X XGeorgia $266865 $266865 1000 $54315000 $51178716 942 X X X X XGhana $1475148 $1475148 1000 $13949465 $13949465 1000 X 778 392 X XJordan $0 $0 X $238732246 $238486447 100 3825 X X X XLesotho X - X $59733645 $47189579 79 11527 454 175 X XMongolia II X X X X X X - X X X XMozambique $35076009 $34753498 991 $169500497 $148359134 875 2276 8400 614 X XTanzania $6861280 $7008600 1021 $45403796 $36801560 811 387 X X X XZambia $4891220 $4712762 964 $205561552 $198567825 966 3002 316 10 X XCommon Indicator Definitions
This is a monitoring indicator any change over baseline data represents the current trend and does not represent the direct impact of the MCC-investment Jordans MampE Plan has throughout the life of the compact defined hours of supply as hoursweek As such all documentation is in this form The value here has been divided by 7 here to accurately reflect supply hours per dayThe current unit for volume of water produced has a discrepancy MCC MampE is in the process of revising this common indicator to clarify and align with current industry standards
Process Indicators Output Indicators Output IndicatorsX12A0T
(WS-5) Temporary employment
generated in water and
sanitation construction
(WS-6) People trained in
hygiene and sanitary best
practices
Female Male Female MaleTotal 1123 8739 5913 6019 Cabo Verde II 111 648 20 12
El Salvador X X 1278 1128
Georgia X X X X
Ghana X X 246 532
Jordan 148 3677 X X
Lesotho X X X X
Mongolia II - - X X
Mozambique 200 2076 4195 4205
Tanzania X X X X
Zambia 664 2338 174 142
WASH
Inputs
Disaggregation Issues
Due to the current reporting style of Jordans ITT the male figure is the difference of
the Total minus the Female values
Jordans overall temporary employment figures now include employment
generated through the Water Smart Homes Activity and the As Samra Project as a
result of the December 2016 MampE Plan Revision in addition to the Water Network
Project Infrastructure Activity and the Wastewater Network Project
X13A0T
Sector Country Indicator Issue
Agriculture and Irrigation Madagascar Farmers Trained Lack of disaggregations in early compacts
Agriculture and Irrigation Madagascar Enterprises assisted Lack of disaggregations in early compacts
Agriculture and Irrigation Madagascar Farmers who have applied improved practices as a result of training Lack of disaggregations in early compacts
Agriculture and Irrigation Madagascar Enterprises that have applied improved techniques Lack of disaggregations in early compacts
Agriculture and Irrigation Georgia Enterprises assisted Lack of disaggregations in early compacts
Agriculture and Irrigation Georgia Value of agricultural and rural loans Lack of disaggregations in early compacts
Agriculture and Irrigation Ghana Farmers Trained Lack of disaggregations in early compacts
Agriculture and Irrigation Ghana Enterprises assisted Lack of disaggregations in early compacts
Agriculture and Irrigation Ghana Value of agricultural and rural loans Lack of disaggregations in early compacts
Agriculture and Irrigation Ghana Farmers who have applied improved practices as a result of training Lack of disaggregations in early compacts
Agriculture and Irrigation Ghana Enterprises that have applied improved techniques Lack of disaggregations in early compacts
Agriculture and Irrigation El Salvador Enterprises assisted Lack of disaggregations in early compacts
Agriculture and Irrigation El Salvador Value of agricultural and rural loans Lack of disaggregations in early compacts
Agriculture and Irrigation El Salvador Enterprises that have applied improved techniques Lack of disaggregations in early compacts
Agriculture and Irrigation Mali Value of agricultural and rural loans Lack of disaggregations in early compacts
Agriculture and Irrigation Mali Farmers who have applied improved practices as a result of training Lack of disaggregations in early compacts
Education El Salvador Students Participating in MCC-supported education activities Lack of disaggregations in early compacts
Education El Salvador Graduated from MCC-supported Education activities Lack of disaggregations in early compacts
Education Burkina Faso Students Participating in MCC-supported education activities The total does not equal the sum of the disaggregations
Education Namibia Students Participating in MCC-supported education activities The total does not equal the sum of the disaggregations
Education Ghana Students Participating in MCC-supported education activities The total does not equal the sum of the disaggregations
Land Ghana Stakeholders trained Lack of disaggregations in early compacts
Land Namibia Household land rights formalized Lack of availabe data
Land Senegal Household land rights formalized Lack of availabe data
Land Lesotho Stakeholders trained Lack of availabe data
Land Lesotho Parcels corrected or incorporated in land system Lack of availabe data
Land Lesotho Household land rights formalized Lack of availabe data
Land Mozambique Household land rights formalized The total does not equal the sum of the disaggregations
Power Tanzania Temporary Employment Lack of disaggregations in early compacts
Transport Georgia Value of signed road feasibility and design contracts Lack of disaggregations in early compacts
Transport Georgia Value disbursed of road feasibility and design contracts Lack of disaggregations in early compacts
Transport Georgia Kilometers of roads under design Lack of disaggregations in early compacts
Transport Georgia Value of signed road construction contracts Lack of disaggregations in early compacts
Transport Georgia Value disbursed of road construction contracts Lack of disaggregations in early compacts
Transport Georgia Kilometers of roads under work contracts Lack of disaggregations in early compacts
Transport Georgia Kilometers of roads completed Lack of disaggregations in early compacts
Transport Ghana Temporary Employment generated in road construction Lack of disaggregations in early compacts
Transport Ghana Road traffic fatalities Lack of disaggregations in early compacts
WASH Tanzania
Temporary Employment generated in water and sanitation
construction Lack of availabe data
WASH Lesotho
Temporary Employment generated in water and sanitation
construction Lack of availabe data
WASH Lesotho People trained in hygiene and sanitary best practices Lack of availabe data
Disaggregation Issues X14A0T
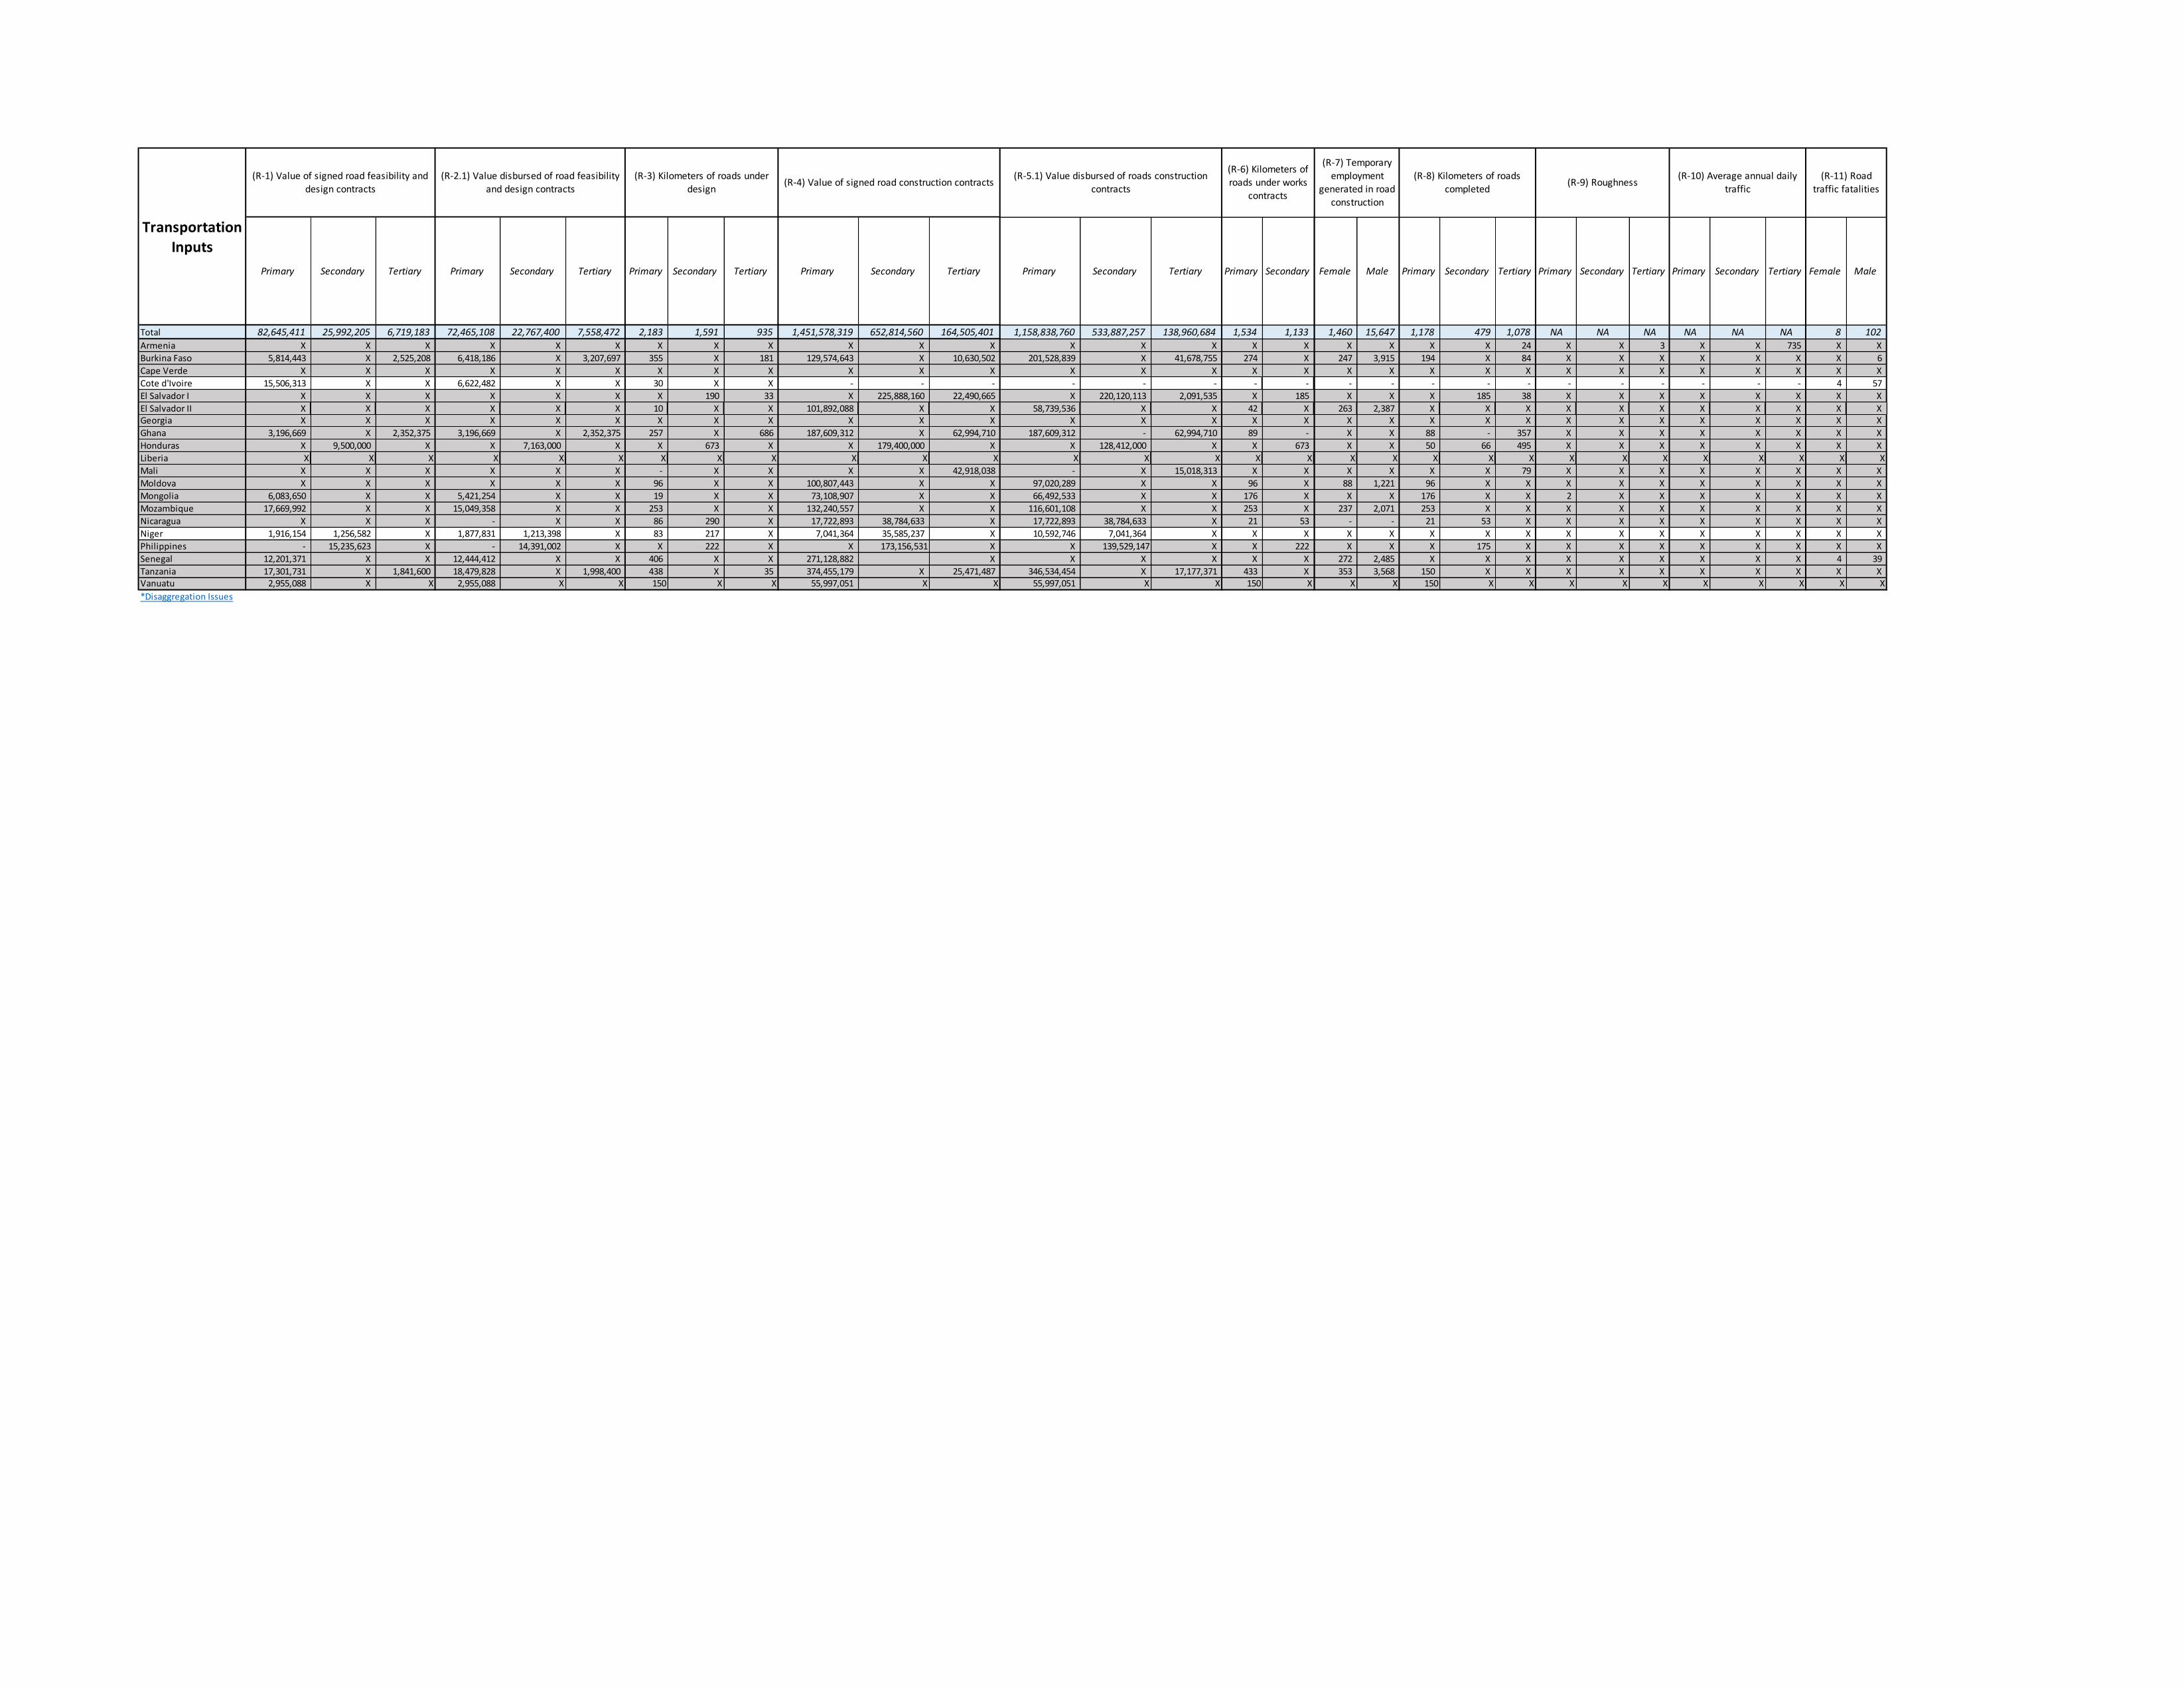
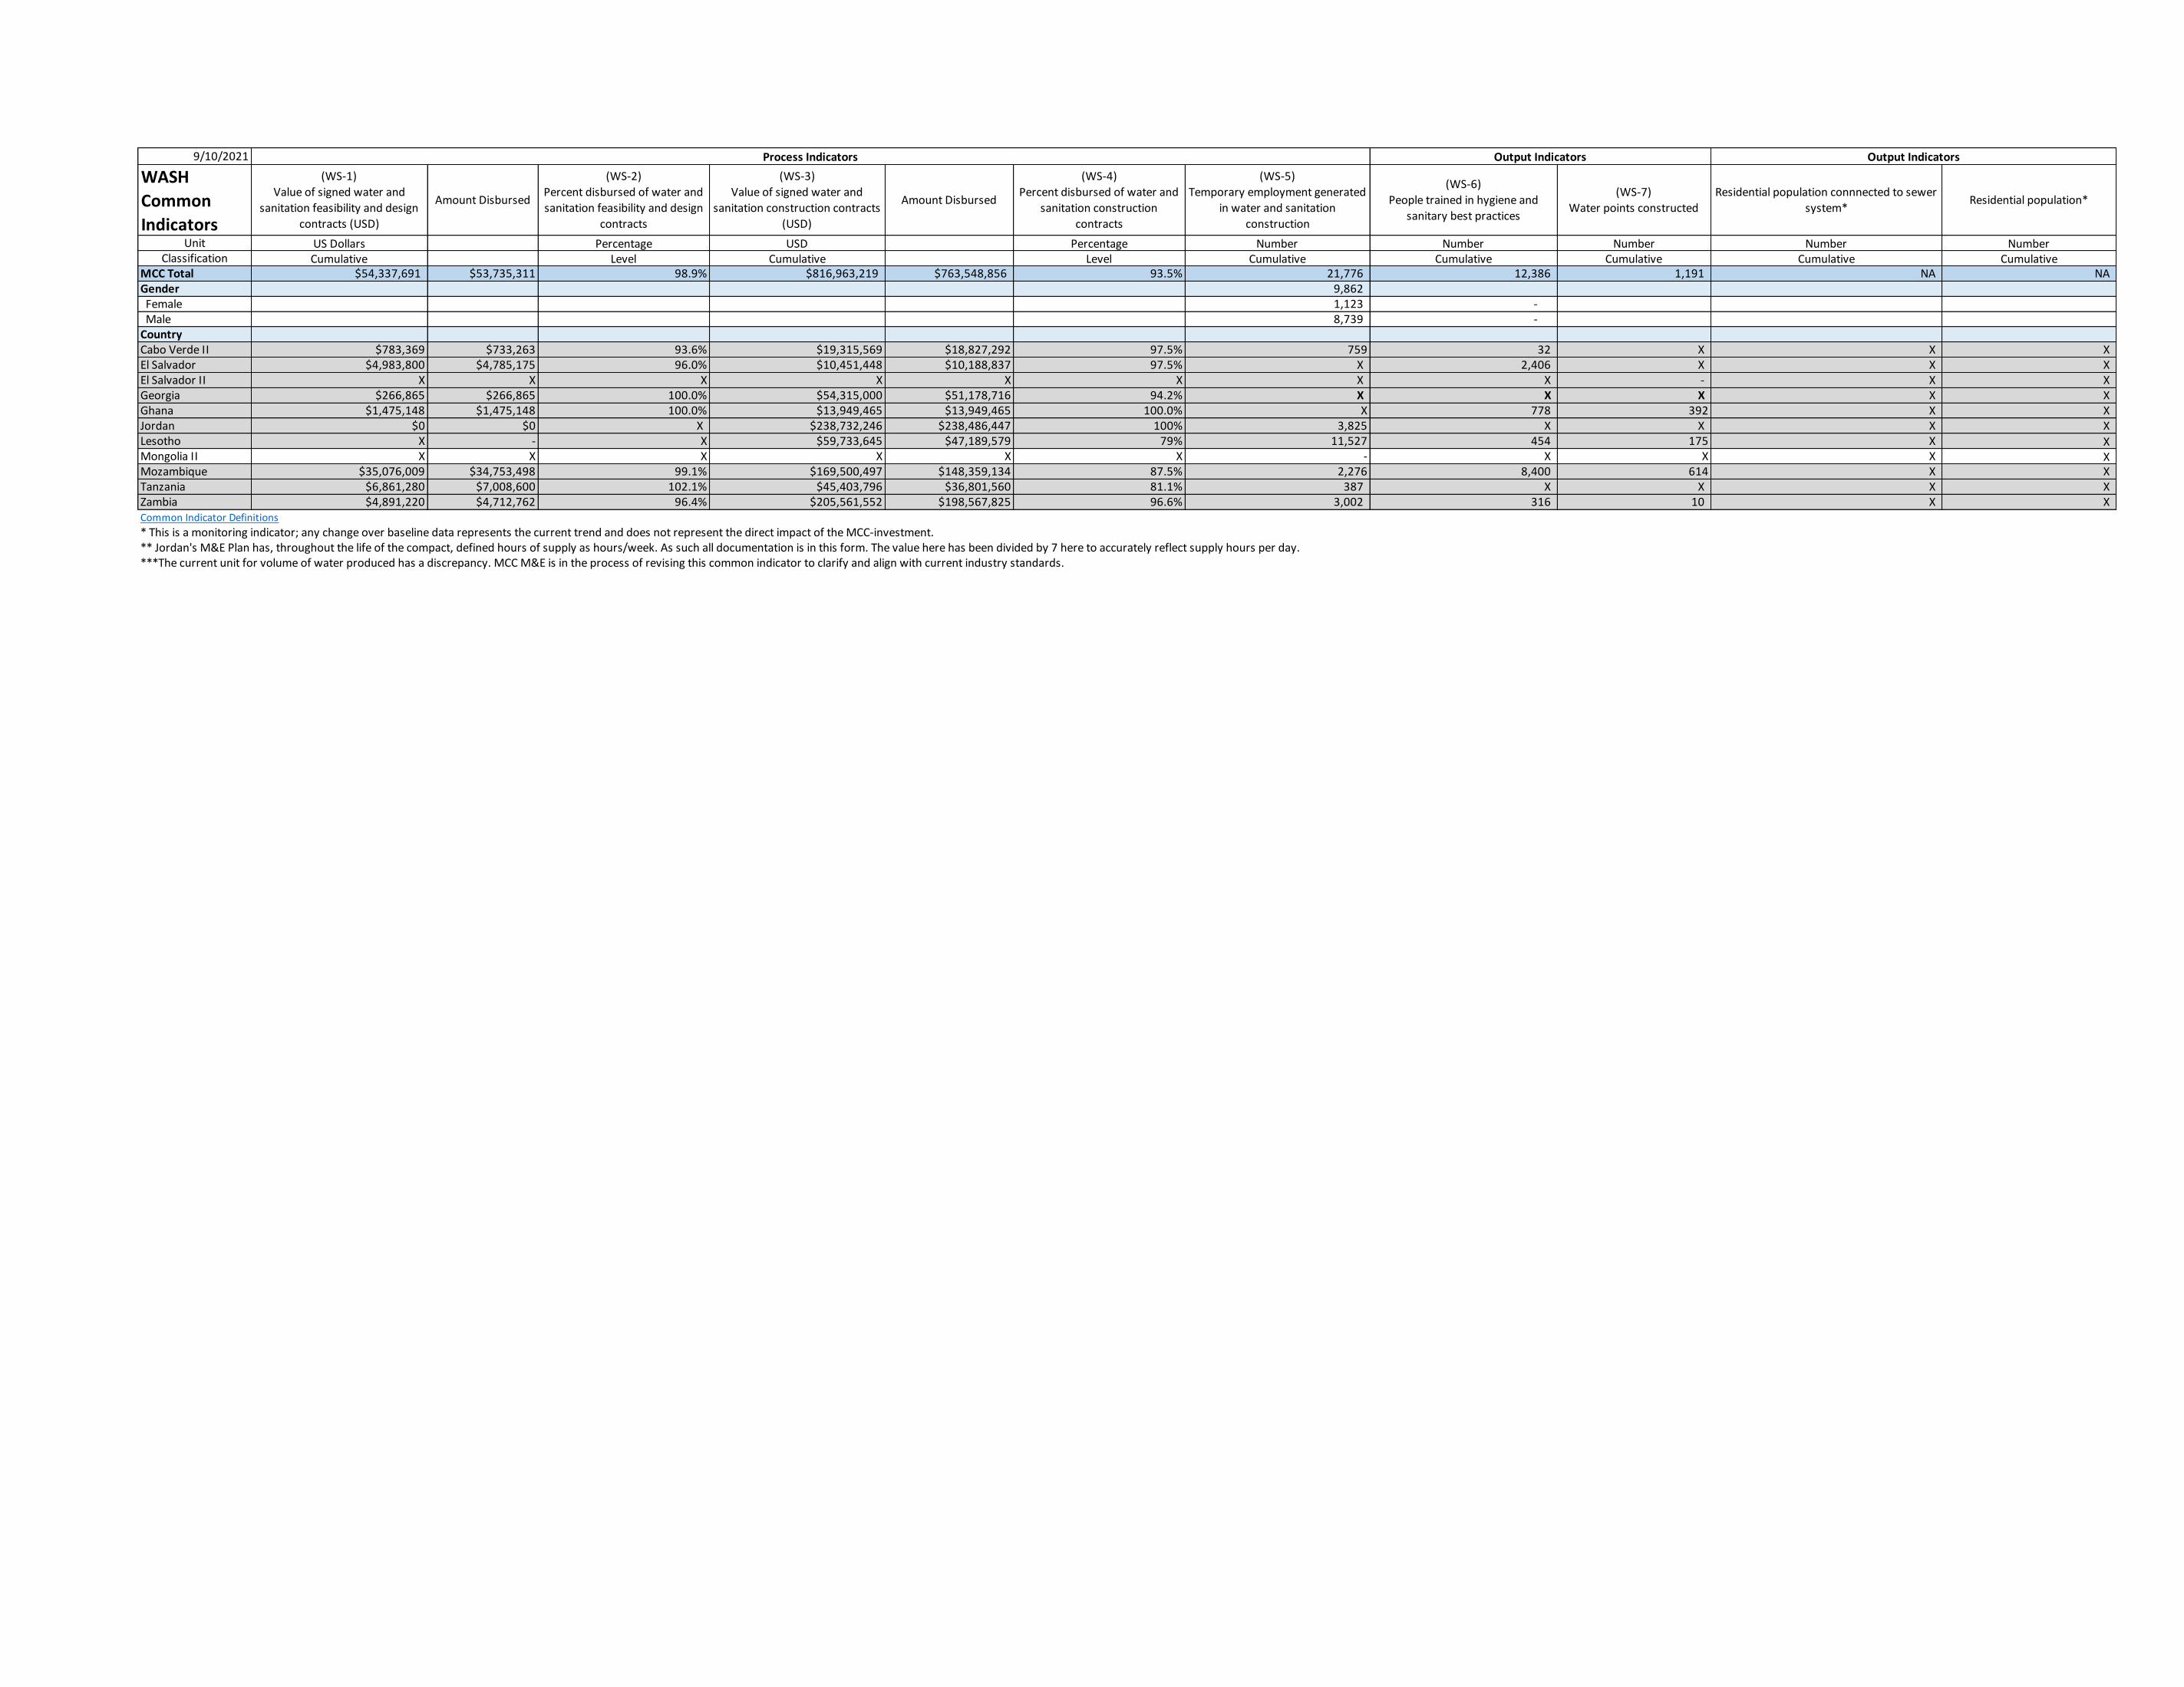
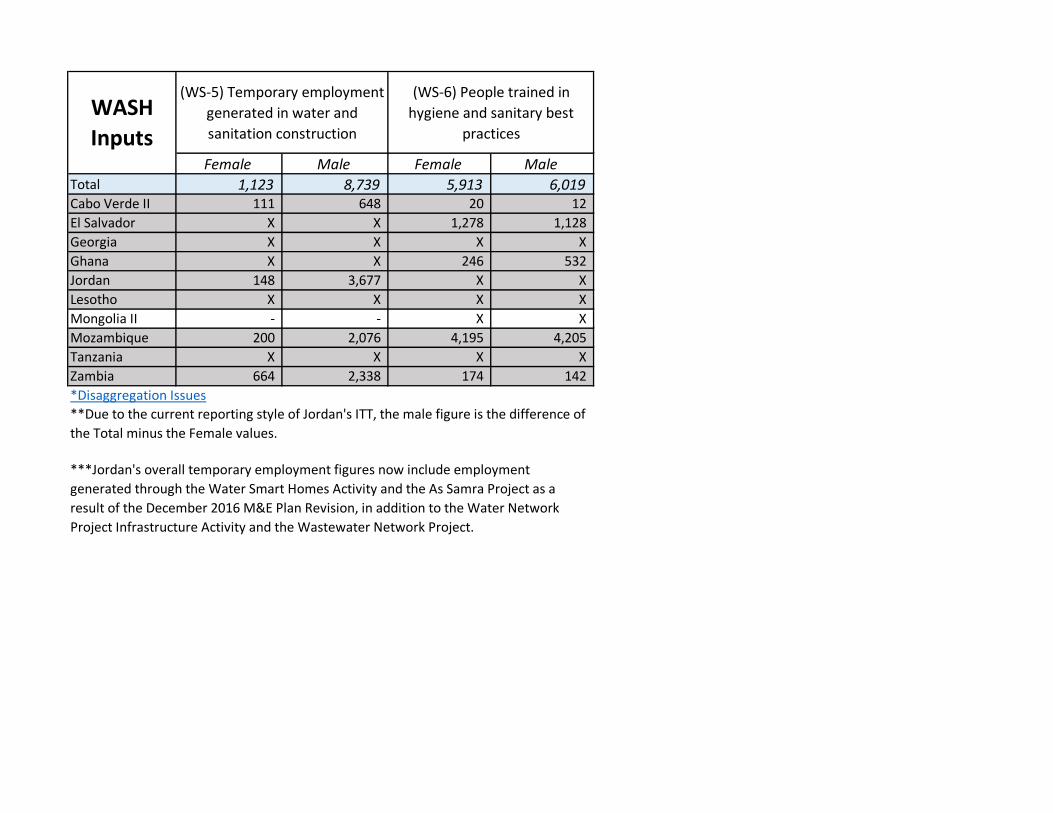
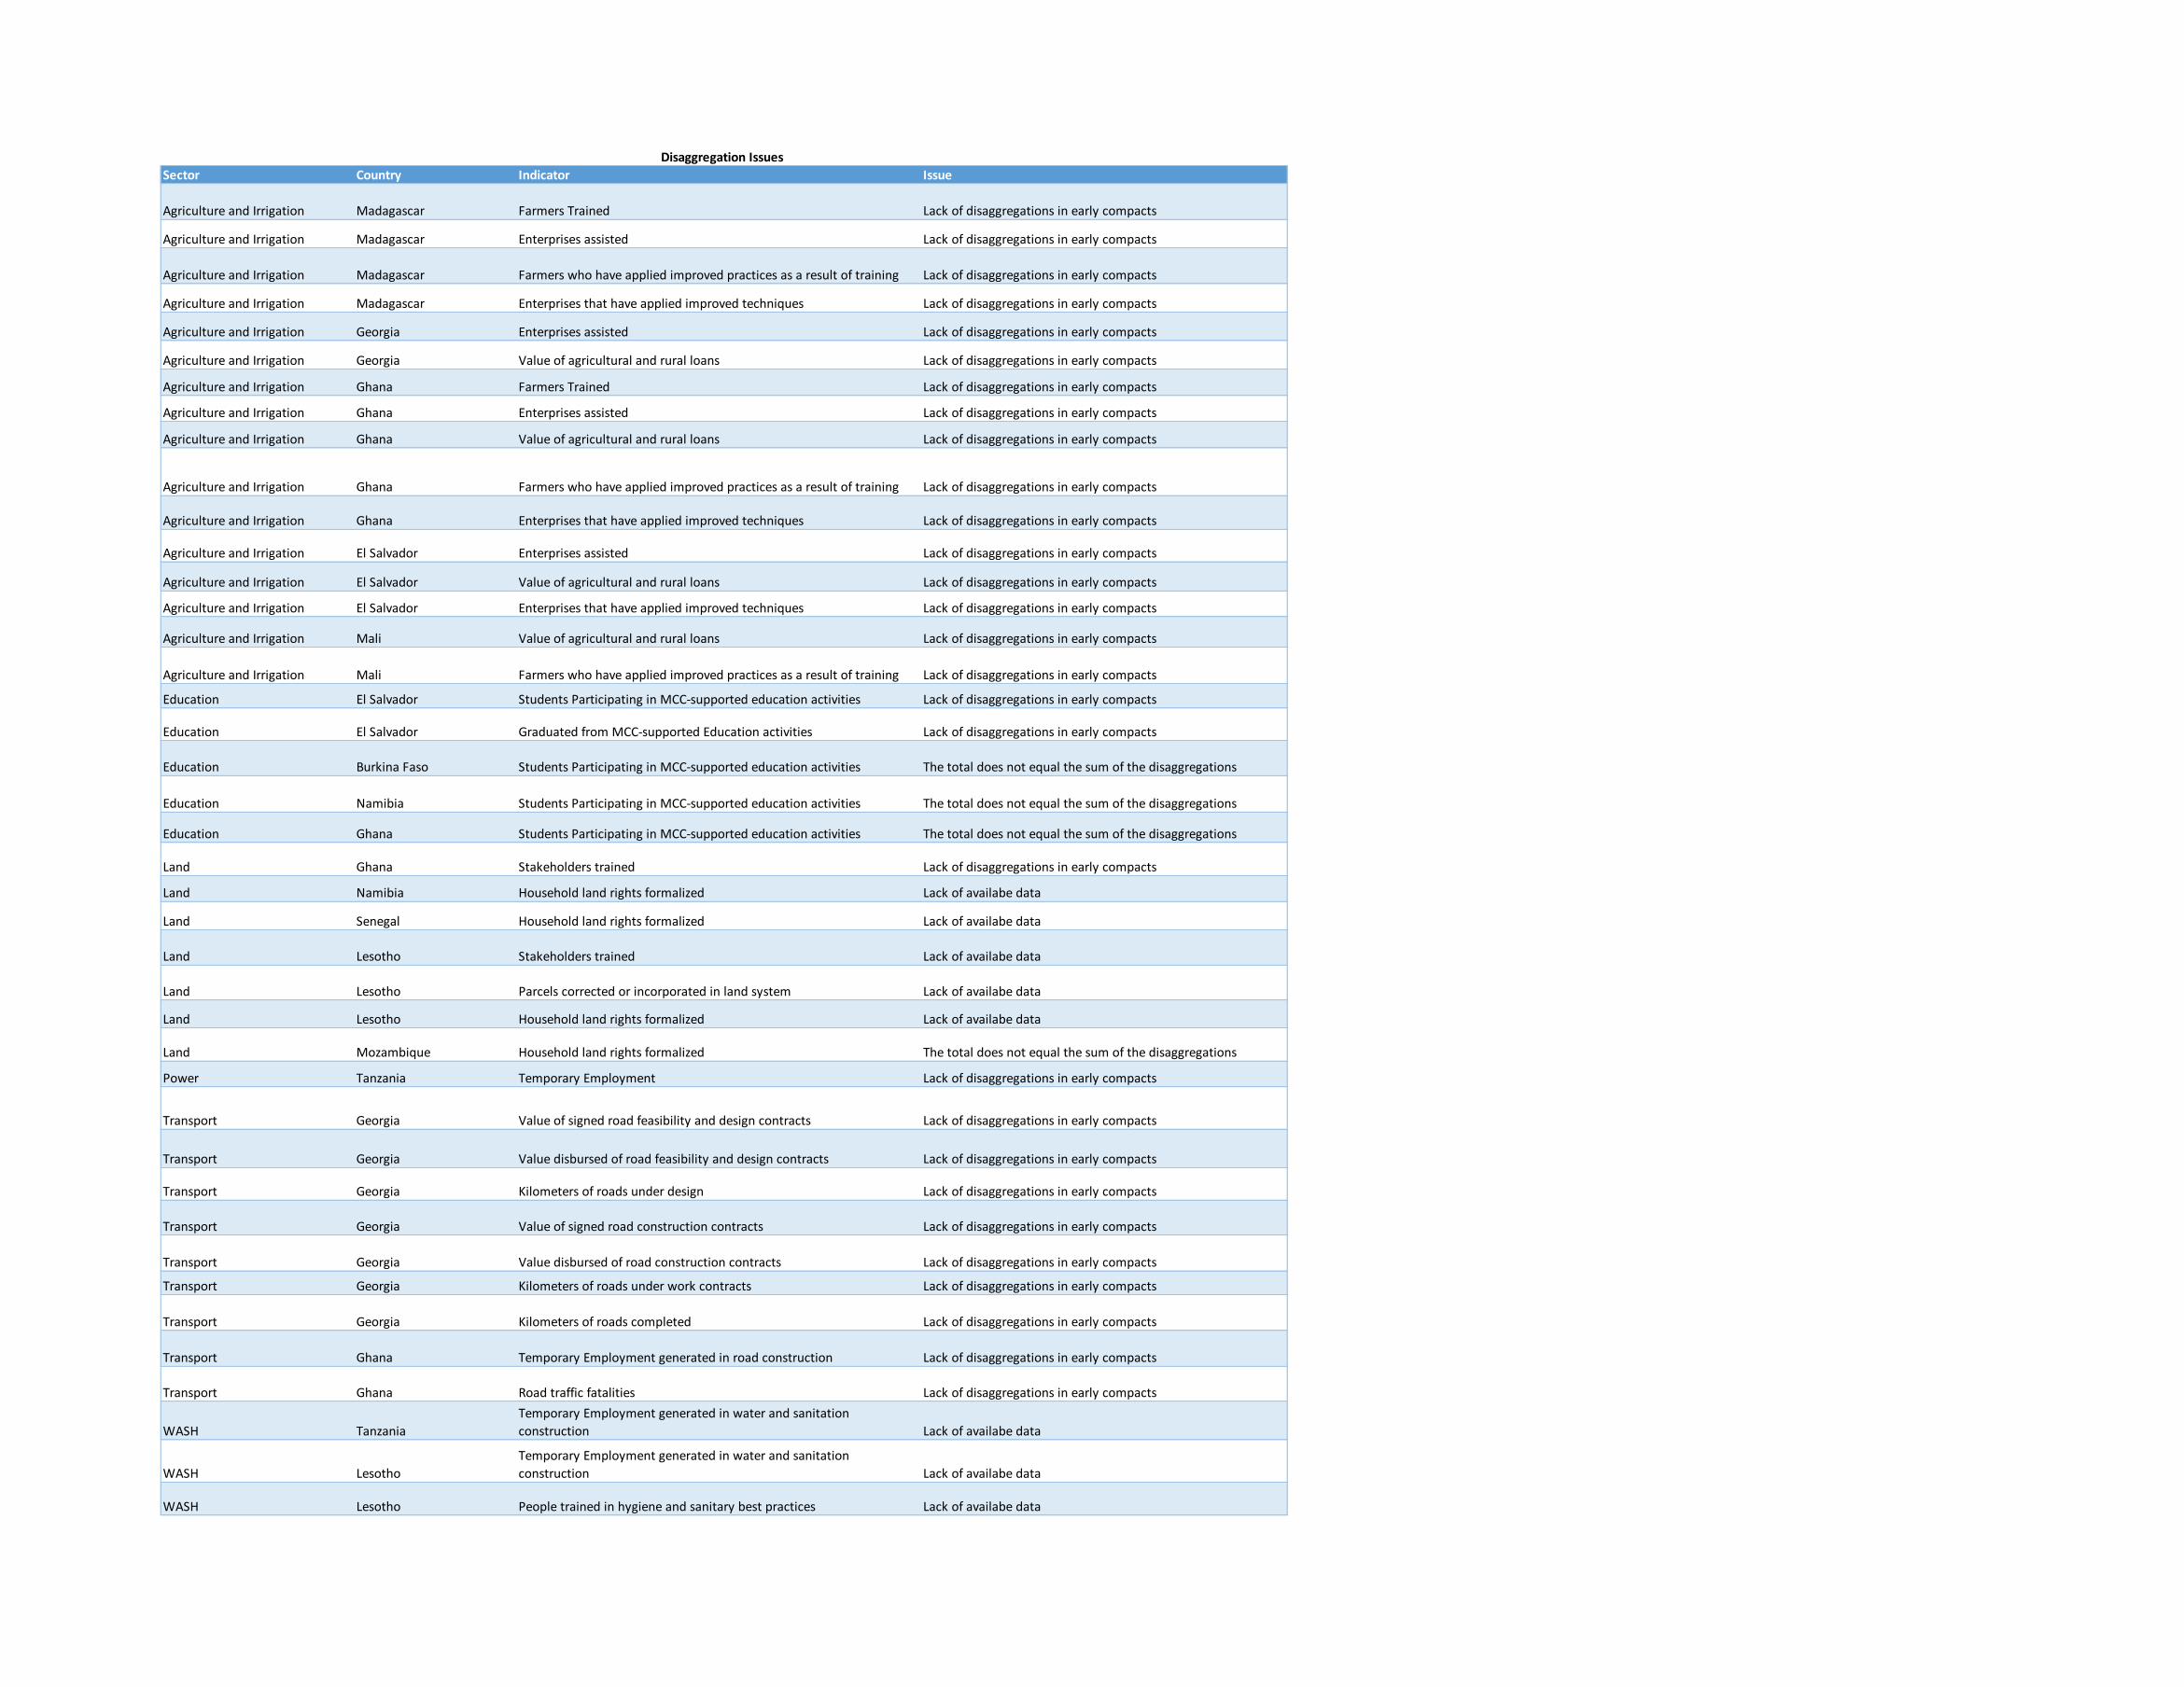