commonwealth of kentucky cabinet for health and … · 2019-11-22 · commonwealth of kentucky...
TRANSCRIPT

COMMONWEALTH
OF KENTUCKY
CABINET FOR HEALTH
AND FAMILY SERVICES
Preliminary Feasibility Study of a
Pharmacy Carve-Out Model
November 19, 2019
Myers and Stauffer LC
700 W. 47th Street, Suite 1100
Kansas City, MO 64112

Transmittal Letter
November 19, 2019
Carol H. Steckel, MPH Commissioner
Cabinet for Health and Family Services (CHFS)
Department for Medicaid Services
275 East Main Street
Frankfort, KY 40601
Dear Ms. Steckel:
Myers and Stauffer LC (Myers and Stauffer) is pleased to present this report which assesses the fiscal
impact of carving out the pharmacy benefit from the Commonwealth’s current Medicaid managed care
delivery system and providing pharmacy benefits exclusively through the Medicaid fee-for-service
program. The primary goal of the study is to compare prescription claims reimbursement methodologies
under the two delivery systems and to provide an estimated fiscal impact were CHFS to carve out the
pharmacy benefit.
We appreciate the opportunity to work with CHFS on this project and we look forward to further
discussion with you and your team regarding the issues addressed within this report. If I can be of
further assistance, please do not hesitate to contact me via email at [email protected] or by phone at
800.374.6858.
Sincerely,
Allan Hansen
Principal

www.myersandstauffer.com page 3
TABLE OF
CONTENTS
Table of Contents
Transmittal Letter ............................................................................................................................ 2
Table of Contents ............................................................................................................................. 3
Table of Tables ................................................................................................................................. 4
Table of Figures ................................................................................................................................ 5
Executive Summary .......................................................................................................................... 6
Prescription Claim Reimbursement Methodologies ................................................................. 6
Administrative Costs .................................................................................................................. 8
Rebates ...................................................................................................................................... 9
Premium Assessments, Allowance for Profit and Health Insurance Fees ............................... 10
Summary of Findings ............................................................................................................... 11
Implications of a Pharmacy Carve-Out Model for Management of Prescriptions Purchased
through the 340B Drug Pricing Program ................................................................................. 12
Background .................................................................................................................................... 14
Prescription Drug Coverage and Reimbursement in Medicaid ............................................... 14
Pharmacy Benefits Delivered Through Managed Care Organizations .................................... 15
Pharmacy Benefits Delivered Through Fee-for-Service .......................................................... 16
Concerns Related to the Pharmacy Benefit Delivered through MCOs and PBMs .................. 17
Pharmacy Carve-Out Analysis ................................................................................................. 19
Study Scope .................................................................................................................................... 20
MCO Versus FFS Pharmacy Claims Repricing ................................................................................. 21
Overview.................................................................................................................................. 21
Data ......................................................................................................................................... 22
Approach and Assumptions .................................................................................................... 23
Results ..................................................................................................................................... 26

www.myersandstauffer.com page 4
TABLE OF
CONTENTS
Additional Factors Impacting a Pharmacy Carve-Out Fiscal Impact .............................................. 31
Overview.................................................................................................................................. 31
Administrative Costs ................................................................................................................ 31
Rebates .................................................................................................................................... 37
Overview of the Federal Drug Rebate Program ...................................................................... 38
Federal Offset of Rebates ........................................................................................................ 39
Supplemental Drug Rebate Agreements ................................................................................. 40
Overall Rebate Impact ............................................................................................................. 40
Potential Impact of a Pharmacy Carve-Out on Rebates within the Kentucky Medicaid
Program ................................................................................................................................... 40
Premium Assessments, Allowance for Profit, and Health Insurance Fees .............................. 42
Additional Considerations .............................................................................................................. 44
Other State Experiences .......................................................................................................... 44
Potential Stakeholder Concerns .............................................................................................. 44
Management of Prescriptions Purchased through the 340B Drug Pricing Program .............. 44
Opportunities to Improve Reimbursement Policies with the FFS Pharmacy Program ........... 46
Study Limitations ........................................................................................................................... 48
Table of Tables
Table 1. Estimated Fiscal Impact -- Summary of Findings in Millions ......................................................... 12
Table 2. Current DMS FFS Pharmacy Reimbursement Methodology ......................................................... 23
Table 3. Claim Count and Payment Totals by MCO (in millions) ................................................................ 24
Table 4. Summary of MCO Pharmacy Claims Excluded from Analysis ....................................................... 25
Table 5. Estimated Fiscal Impact by Plan (State and Federal Dollars in Millions) ...................................... 27
Table 6. Average Ingredient and Dispense Fee Reimbursement Per Claim ............................................... 27
Table 7. Adjusted Estimated Fiscal Impact by Plan (State and Federal Dollars in Millions) ....................... 29

www.myersandstauffer.com page 5
TABLE OF
CONTENTS
Table of Figures
Figure 1. Chart of Average Ingredient Amount Paid Per Claim .................................................................. 28
Figure 2. Chart of Average Dispensing Fee Per Claim ................................................................................. 28
Figure 3. Pricing Benchmark Coverage by Claims Count and Expenditure ................................................. 47

www.myersandstauffer.com page 6
EXECUTIVE
SUMMARY
Executive Summary
The Kentucky Cabinet for Health and Family Services (CHFS), Department of Medicaid Services (DMS),
has contracted with Myers and Stauffer LC, a certified public accounting firm, to perform a preliminary
feasibility study of a pharmacy “carve-out” model. Under this model, the pharmacy benefit would be
removed from the Commonwealth’s current Medicaid managed care delivery system and provided
exclusively through the Medicaid fee-for-service (FFS) program. The primary goal of the study is to
compare prescription claims reimbursement methodologies under the two delivery systems and to
provide an estimated fiscal impact associated with the prescription claims reimbursement
methodologies were DMS to carve out the pharmacy benefit. To further provide an overview of
additional issues associated with a pharmacy carve-out that would have an impact on an assessment of
the feasibility of such a change, the following additional issues were addressed:
Administrative costs.
Rebates.
Premium assessments, allowance for profit and health insurer fees.
The above areas of additional research are not intended to result in precise calculations of the fiscal
impact, but rather to provide a high-level overview of relevant issues and direct DMS towards additional
areas of study that may be required should DMS elect to further research a carve-out approach to
managing Medicaid pharmacy benefits. Notably, this study is not intended to be an actuarial analysis
that would provide insight into the impact of a carve-out model on the capitated reimbursement rates
paid to managed care organizations (MCOs). Since overall Medicaid expenditures through the managed
care delivery system would drastically change if the pharmacy benefit were carved out, an actuarial
analysis would be necessary to determine the impact on the capitated rates paid to MCOs.
This report is not intended to provide a recommendation either in favor of a pharmacy carve-out or
otherwise. Regardless of any potential fiscal impact considerations, the implementation of a pharmacy
carve-out would be a significant endeavor for DMS and would require thorough planning and
development of transition strategies. Furthermore, DMS has recently initiated a number of strategies
directed towards increased transparency within the MCO and PBM contracting process and greater
oversight of pharmacy reimbursement rates within the managed care delivery system. Since this study
focuses on prior time periods, the full impact of these recent initiatives have not been assessed.
Prescription Claim Reimbursement Methodologies
One significant shift that would occur were the pharmacy benefit to be carved out and delivered under
the FFS program is the transition to the adjudication and payment of all prescription claims under the
FFS reimbursement methodology. To estimate the impact of shifting the pharmacy benefit from
www.myersandstauffer.com page 7
EXECUTIVE
SUMMARY
managed care to the FFS program, Myers and Stauffer repriced two years of MCO encounter data for
prescription claims as provided by DMS. This data was comprised of encounters with dates of service
from January 1, 2017, through December 31, 2018. The ingredient and dispensing fee amounts of
prescription reimbursement reported on the encounters were reflective of the amounts paid by the
MCOs to their respective pharmacy benefit managers (PBM). It is extremely important to note that the
encounter reimbursement amounts reported do not reflect the actual payments to pharmacies by the
PBMs. The difference between payments made by the MCO to its PBM and the amounts paid by PBMs
to pharmacies is commonly referred to as “spread pricing” and is addressed later within this report.
The results of our repricing analysis indicate that the impact to prescription claim amounts in the
aggregate would be relatively budget neutral. For calendar year (CY) 2017, the total estimated
ingredient impact is a savings of $193.5 million as compared to a total estimated dispensing fee cost of
$204.9 million. The net impact for CY 2017 is a projected cost of $11.4 million. For calendar year 2018,
the total estimated ingredient impact was a savings of $196.4 million, as compared to a total estimated
dispensing fee cost of $187.8 million. The net impact for CY 2018 is a projected savings of $8.6 million. In
total, the estimated net fiscal impact for the two-year period is a cost of $2.8 million. The $20.0 million
net difference in the calculated impact between the two years, as compared to the average annual
spend of $1.5 billion, proves to be a negligible impact of less than 2 percent of total expenditures for
prescription claims.
The swing from a projected cost to a projected savings between CY 2017 and CY 2018 can be attributed
to a policy change implemented by DMS in July 2018. The new policy required MCOs to pay a minimum
dispensing fee of $2.00 per claim. This requirement decreased the differential between the dispensing
fee paid by MCOs and the repriced dispensing fee of $10.64 under the FFS methodology. To better
model the dispensing fee cost associated with the minimum dispensing fee requirement in effect today,
the average dispensing fee of $2.40 observed on encounters from July 2018 through December 2018
was retroactively applied to all encounters for the two-year time period. When calculated with this
“normalized” dispensing fee, the resulting estimated net fiscal impact for the two-year time period was
a savings under the FFS methodology of approximately $56.0 million, or $28 million annually. The state
share of savings is estimated as $5.7 million.1 These adjusted results with a “normalized” dispensing fee
may be the most meaningful result from the repricing analysis, as it represents a more accurate picture
of expected differences between MCO and FFS prescription reimbursements that would occur in a
future scenario.
1 The state share portion was estimated using a factor of 20.23%. This estimate was based on state fiscal year 2021 (i.e., July 2020 to June 2021) FMAP amounts of 71.96% for the traditional Medicaid population, 83.27% for the CHIP population and 90.00% for the ACA Medicaid population. Weighting factors based on projected enrollment of 55.61%, 2.88% and 41.50% were applied for the traditional Medicaid, CHIP and ACA Medicaid populations respectively yielding a composite estimated FMAP of 79.77% (with the corresponding state share being 20.23%).
www.myersandstauffer.com page 8
EXECUTIVE
SUMMARY
Administrative Costs
Another consideration when comparing the costs of an MCO model to a FFS model are the
administrative costs associated with the delivery of prescription drug benefits. Under the MCO model,
these costs are incurred by the MCO and their associated PBM, and include services such as pharmacy
network management, eligibility management, claims processing, preferred drug list (PDL) development
and maintenance, and drug utilization review. Under a FFS model, DMS would bear these costs directly,
in addition to overhead for DMS staff, expenses for pharmacy claims and rebate processing vendors,
PDL maintenance, as well as other consulting and administrative services cost.
This study includes a high-level analysis of estimated administrative costs that are included within the
current managed care capitation rates along with the level of spread pricing included within the
managed care reimbursement paradigm which allows for PBMs to receive remuneration to cover their
administrative costs and realize a profit. Assumptions used within this high-level analysis of
administrative costs were derived from the methodology employed by DMS actuaries to incorporate an
allowance for such costs into the capitation rates. Assumptions relating to spread pricing were derived
from a recent report published by DMS.
The MCO and PBM administrative costs under the managed care delivery system are contrasted with a
high-level analysis of potential administrative costs that would be incurred under a carve-out model.
Although the number of Medicaid members currently served by Kentucky’s FFS pharmacy program is
relatively small compared to the number of members receiving their pharmacy benefits through a
managed care plan, some portion of the administrative overhead cost associated with running the FFS
program are already being incurred by DMS. A transition to administering all pharmacy benefits under a
FFS model would likely entail additional administrative services costs.
Assumptions associated with potential administrative cost under a pharmacy carve-out model were
derived from current expenditure levels for claims administration services reported within the Kentucky
Medicaid FFS pharmacy program and estimates of the cost to address expanded services under a larger
FFS pharmacy program developed internally by DMS.
The analysis presented within this report also incorporates the impact of differences in the federal
medical assistance percentage (FMAP) associated with administrative costs under the managed care and
fee-for-service delivery systems.
Details of the high-level administrative cost analysis are presented within the section of this report titled
“Additional Factors Impacting a Pharmacy Carve-Out Fiscal Impact”. To summarize the results, the total
savings in administrative cost (state and federal share) was estimated at $132.0 million. Applying the
appropriate FMAP factors to administrative costs under both the managed care and fee-for-service
models, the state share of savings for administrative cost was estimated at $23.3 million.

www.myersandstauffer.com page 9
EXECUTIVE
SUMMARY
Given the high-level nature of this analysis, Myers and Stauffer recommends that DMS consult with its
actuaries regarding potential shifts in MCO administrative cost allocations within the capitation rate-
setting process under a carve-out model. Additionally, we recommend that DMS perform a more
comprehensive analysis of the potential changes in administrative costs that would occur within the FFS
pharmacy program under a carve-out model including estimates of cost associated with claims
administration vendors and other contractors, and a detailed analysis of internal staffing that DMS
would require to operate a FFS pharmacy program.
Rebates
One concern that has been raised regarding the delivery of pharmacy benefits through the managed
care delivery system is that PDLs created by MCOs and PBMs may not always align with the financial
goals of the Medicaid program at large. Opportunities for significant savings exist when pharmacy
utilization corresponds with the most cost-effective drugs, considering the sizable rebates available
through the federal Medicaid Drug Rebate Program (MDRP) and through the supplemental rebates
available to Kentucky. These rebates guarantee that Medicaid programs obtain the lowest net price of
any payer. In 2016, the average federal rebate was 53 percent of gross pharmacy reimbursement. After
inclusion of supplemental rebates, the average total discount ranged from 56 to 59 percent of gross
pharmacy reimbursement. In other words, for every dollar spent in the Medicaid pharmacy program, an
estimated 56 to 59 percent of that dollar is returned in the form of a federal and/or supplemental
rebate, making Medicaid rebates a critical tool in managing pharmacy expenditures and their overall
impact to state and federal Medicaid budgets.
DMS recently requested its rebate processing vendor to perform an analysis of the potential amount of
rebates that could be collected under the MDRP, as well as for Kentucky-specific supplemental rebates if
the current structure of the multiple PDLs administered by MCOs were shifted to a single PDL (even if
the pharmacy benefit were to remain within the managed care delivery system). This analysis provides
some insight into the potential shift in rebates that could occur through a carve-out given such a change
would also consolidate all pharmacy benefits under a single PDL.
The analysis performed by DMS’ rebate vendor indicated that shifts in utilization to align with the PDL
currently used within the FFS pharmacy program could increase rebates collected under the MDRP
within the current managed care program from 49.7 percent of total reimbursement to 56.1 percent of
total reimbursement. However, concurrent with this increase, it would be expected that an approximate
19.3 percent increase in the average amount paid per prescription claim would occur. This is the result
of the drugs included in the FFS program PDL that are influenced by clinical considerations, as well as
the net cost to DMS after both federal and supplemental rebates are considered. In particular, the
difference between gross cost (i.e., reimbursements to pharmacies) and net cost (i.e., after rebates) may
be more pronounced, as there would be some instances where higher priced products would be
preferred over generic alternatives or other products with lower list prices, in order to secure a more
advantageous net price after rebates.

www.myersandstauffer.com page 10
EXECUTIVE
SUMMARY
Considering the results of the analysis performed by the rebate vendor, as well as overall MCO
reimbursement within the MCO encounter data for CY 2018 (i.e., $1.59 billion), the shifts in rebates and
reimbursement that could potentially occur are as follows:
Overall claims payments could potentially increase by approximately $306.3 million. Given the
analysis performed by the rebate vendor for DMS was focused on the impact of a shift to a single
PDL and not a carve-out of the pharmacy benefit into the FFS program, this calculation is based
on the assumption that there would be a continuation of the payment of claims under the same
reimbursement methodology in use under the current delivery system.
Additional MDRP invoicing of $273.3 million in rebates could potentially occur. Of the additional
MDRP invoicing, approximately $41.6 million would be attributable to rebate offset amounts
that would accrue entirely to the federal government.
Additional supplemental rebates of $60.5 million could potentially be invoiced.
In total, DMS could potentially realize a net decrease in cost of approximately $14.1 million
annually due to the ability to collect additional rebates (federal and state share combined; with
the state share portion of this amount estimated at $2.9 million2).
The aforementioned results are based on the rebate vendor’s high level analysis of rebate collection
given utilization trends within FFS claims data as compared to utilization trends within MCO encounter
data. DMS may wish to pursue a more robust analysis to examine the PDL of the current FFS program as
compared to the PDLs of the five MCO pharmacy programs. An analysis of the highest volume
therapeutic classes could be performed in order to determine the therapeutic classes with the greatest
potential for shifts in utilization which may result in enhanced rebate collection. Such an analysis could
be based on more specific utilization patterns under the FFS program and the five MCOs, and also
incorporate the most recent unit rebate amounts (URA) calculated by CMS.
Premium Assessments, Allowance for Profit and Health Insurance Fees
In the process of setting capitation rates for Kentucky Medicaid MCOs, several factors in addition to
anticipated claims cost and administrative costs are considered. These “add-ons” include the following:
Allowance for the Commonwealth’s premium assessment.
Allowance for a target profit margin.
Allowance for Affordable Care Act (ACA) health insurer fees (HIF).
The combined impact of these add-ons are equivalent to approximately 4 percent of the portion of MCO
premiums that are associated with the pharmacy benefit. Using the total reimbursement reported
within the MCO encounter data as a proxy for the portion of the capitated rates associated with the
2 The state share portion was estimated using a composite factor of 20.23% as previously described.

www.myersandstauffer.com page 11
EXECUTIVE
SUMMARY
pharmacy benefit, the 4 percent allowance for these factors is approximately $63.4 million for CY 2018
and would have been considered in the development of the gross premiums received by MCOs. The
state share portion share of this amount was estimated as $12.8 million.3Under a carve-out model, DMS
would not incur the expenses associated with the pharmacy portion of MCO premiums. However, DMS
should also consider that premium assessments paid by MCOs are also revenues to the Commonwealth
and potentially should not be considered as a “savings”, particularly in consideration of applicable FMAP
amounts.
Summary of Findings
The primary goal of the study is to compare prescription claims reimbursement methodologies under
the two delivery systems and to provide an estimated fiscal impact associated with the prescription
claims reimbursement methodologies were DMS to carve out the pharmacy benefit. The study also
provides a high-level overview of other relevant issues that would result in a fiscal impact under a
pharmacy carve-out model. The other issues include administrative costs, rebates, premium
assessments, allowance for profit and health insurer fees. The aforementioned categories of fiscal
impact are summarized in Table 1 below, with the total estimated impact representing a net savings of
$237.5 million per year. The state share portion of the savings were estimated at $44.7 million. The
majority of expected savings come from expected reductions in administrative cost and, secondarily,
from the removal of expenses exclusive to the managed care capitation rate-setting process.
Calculating the estimated annual net savings of $237.5 million as a percentage of current expenditures
requires additional estimation. Total reimbursement during the most recent CY (2018) as reflected
within the MCO encounter data were approximately $1.59 billion. However, current annual
expenditures to DMS for the pharmacy benefit administered through the MCOs is likely higher given the
various factors noted above (i.e., administration, premium assessment, target profit margin, and ACA
insurer fees), which are applied to capitation rates in addition to the actuaries’ estimates of the
anticipated per member per month (PMPM) cost for prescription claims. Nonetheless, since capitation
rates are not separately calculated for the pharmacy benefit, determination of the current gross
premium cost to DMS for the pharmacy benefit must be estimated. Based on the various add-on factors
that are used within the capitation rate process, the $237.5 million in expected savings represents
approximately 13 percent4 of estimated current expenditures.
3 The state share portion was estimated using a composite factor of 20.23% as previously described.
4 Approximated as $237.5 / (1.59 billion * 1.082 (administrative cost) * 1.04 (premium assessments, allowance for profit and health insurer fees)).

www.myersandstauffer.com page 12
EXECUTIVE
SUMMARY
Table 1. Estimated Fiscal Impact -- Summary of Findings in Millions
2017 2018 Total
Pharmacy Claims Reprice
Ingredient ($193.3) ($196.2) ($389.5) Dispensing Fee (incorporates
“normalized dispensing fee” adjustment)
$165.9 $167.7 $333.6
Total Pharmacy Reprice ($27.4) ($28.6) ($56.0)
Annualized State / Federal Funds
Annualized State Only
Funds
Pharmacy Claims Reprice (average, based on 2017 and 2018 analysis)
($28.0) ($5.7)
Administrative (detailed in “Additional Factors
Impacting a Pharmacy Carve-Out Fiscal Impact”
section of the report)
($132.0) ($23.3)
Rebates ($14.1) ($2.9) Other (includes allowances for premium
assessments, target profit margin and HIF totaling
4% add to capitation rates; 4% x $1.5855 billion =
$63.4 million)
($63.4) ($12.8)
Net Estimated Impact ($237.5) ($44.7)
Implications of a Pharmacy Carve-Out Model for Management of Prescriptions Purchased
through the 340B Drug Pricing Program
Consistent application of policies for drugs purchased through the 340B program are complicated within
the MCO paradigm and potentially create lost opportunities for the Medicaid program to realize savings
through collections of rebates. Currently, a DMS payment policy does not exist regarding MCO payment
for covered outpatient drugs dispensed or administered by 340B covered entities and their contract
pharmacies. This allows the MCOs to establish their own reimbursement policies for 340B dispensed
drugs, which may result in the MCOs paying at, or near, normal market reimbursement rates for these
deeply discounted drugs. While such arrangements may be beneficial to providers (i.e., covered entities)
and potentially to the MCOs and PBMs, DMS is not permitted to collect federal rebates when a 340B
program drug has been dispensed. Therefore, the potential exists for DMS to be overpaying for these
340B drugs (as these 340B drug reimbursements, at near normal market reimbursement rates, are
passed through to the capitation rate-setting process), and also sacrificing the ability to collect
substantial federal rebates.
In contrast, within the FFS pharmacy delivery system, state Medicaid programs are required under CMS-
2345-FC to adopt policies that ensure the Medicaid program benefits (i.e., realizes savings) from
dispensed prescriptions that were eligible for 340B discounts on essentially an equal basis as the
program would benefit from prescriptions dispensed that were not eligible for 340B discounts, but were

www.myersandstauffer.com page 13
EXECUTIVE
SUMMARY
eligible for rebates through the MDRP. CMS allows states some flexibility in its reimbursement policy
regarding prescription drugs obtained with 340B discounts. As such, the Commonwealth has adopted a
policy whereby covered entities using 340B drugs for Medicaid members must not bill more than their
340B actual acquisition cost, plus a professional dispensing fee (currently $10.64).
Although there are challenges relating to managing drugs purchased through the 340B program within
the FFS pharmacy delivery system, there is also the potential to realize net savings to the Medicaid
program if the benefit is carved out, given MCOs have no obligation under CMS-2345-FC to limit
reimbursement for 340B drugs and may not have a financial incentive to do so. As it was beyond the
scope of this study, an analysis was not performed to quantify the impact of potential savings relating to
340B issues if all such claims were under FFS program management. However, if the pharmacy benefit
were carved out, there is the potential for DMS to implement policies that would allow the Medicaid
program to realize additional benefits from the 340B program.

www.myersandstauffer.com page 14
BACKGROUND
Background
Prescription Drug Coverage and Reimbursement in Medicaid
Medicaid is a joint federal-state program that pays for medical assistance for individuals and
families with low incomes and relatively few assets. Although pharmacy coverage is an optional
benefit under federal Medicaid law, all states currently provide coverage for outpatient prescription
drugs to all categorically eligible individuals and most other enrollees within their state Medicaid
programs.
The amount Medicaid spends for a particular outpatient prescription drug reflects two components ―
the gross initial cost (made up of payment to a provider for the drug and the applicable dispensing fee)
and the net cost of the drug after rebates (federal and/or supplemental) that Medicaid receives from
drug manufacturers. States set pharmacy payment policy within federal guidelines and requirements;
however, these policies must be approved by the Centers for Medicare & Medicaid Services (CMS)
through the State Plan Amendment (SPA) process. Additionally, a drug manufacturer must enter into a
statutorily-defined rebate agreement with the Secretary of the U.S. Department of Health and Human
Services (HHS) in order for its products to be considered covered outpatient drugs by Medicaid.
State Medicaid programs may use a single delivery system approach or a combination of delivery
systems to provide prescription drug coverage to their enrolled beneficiaries. This may depend on a
number of factors including, but not limited to, the population being served and/or characteristics of the
geographic regions in the state.
In a fee-for-service (FFS) arrangement, the state enrolls and pays providers directly. The state typically
hires vendors or performs some roles internally for various functions such as enrollment, claims
processing, auditing, actuarial services, rate setting, medical policy, drug rebate administration, clinical
services, and program consulting.
In a risk-based or capitated arrangement, the state procures managed care organizations (MCOs) to
contract and pay providers directly. This approach requires a SPA or waiver from CMS for
implementation. The state pays these organizations through a calculated capitation rate which is
required to be approved by CMS. Some services, such as prescription drugs (even specific subsets of
drugs), dental, long-term care (LTC), or specific populations may be “carved out” of the capitation rate.
The term “carve-out” applies to services or populations that are not included in the capitation rate
calculation and payment to the MCO, but paid for directly by the FFS delivery system.
The Medicaid program in Kentucky is operated by the Cabinet for Health and Family Services through
the Department for Medicaid Services (DMS). The majority of Kentucky Medicaid beneficiaries receive
health care services through five MCOs:

www.myersandstauffer.com page 15
BACKGROUND
Anthem.
Aetna Better Health of KY.
Humana CareSource.
Passport Health Plan.
WellCare of Kentucky.
Kentucky Medicaid beneficiaries not enrolled in one of the five health plans receive their health care
services through the FFS program.
Pharmacy Benefits Delivered Through Managed Care Organizations
The Medicaid and CHIP Managed Care Final Rule (CMS-2390-F) provided updated regulations regarding
the provision of health care services delivered through MCOs. Among many other things, this rule
specifies requirements for states and managed care plans that provide covered outpatient drugs under a
capitated arrangement. Specifically, the rule addresses covered outpatient drug access in managed care
and the application of federal rebates for covered outpatient drugs. Highlights of the rule related to
covered outpatient drugs include the following:
Prescription drug coverage under MCOs should demonstrate coverage consistent with the
amount, duration, and scope as described by Medicaid FFS.
MCOs cannot have medical necessity criteria for prescription drugs that are more stringent than
Medicaid FFS.
MCOs must provide coverage of covered outpatient drugs as specified in their contracts.
If an MCO is not contractually obligated to provide coverage of a particular covered outpatient
drug, or class of drugs, the state is required to provide the covered outpatient drug through FFS
that is consistent with the state plan.
Each state may include covered outpatient drug coverage as part of the capitated contractual
services or as a carve-out from the capitation rate calculations.
An MCO that agrees to provide coverage of a subset of covered outpatient drugs under the
contract with the state would need to provide coverage of every covered outpatient drug
included in the subset if the manufacturer of those drugs entered into a rebate agreement.
MCOs have the flexibility to maintain their own PDLs or formularies and apply their own
utilization management practices.
It is incumbent upon the states and MCOs to address formulary/PDL requirements in their
contract documents. Each party must clearly understand their responsibilities and requirements
when administering the Medicaid-covered outpatient drug benefit.
www.myersandstauffer.com page 16
BACKGROUND
MCOs need to ensure all covered outpatient drugs are covered unless the drug is contractually
carved out of the pharmacy benefit.
Payment to providers, prior authorization (PA) requirements, drug utilization review programs
and annual reports, access to pharmacy services, utilization data for rebate invoicing, and 340B
claim identification must all be addressed in MCO contracts.
Currently, the pharmacy benefit in the Kentucky Medicaid program is “carved in” to the managed care
program meaning that MCOs receive capitated payments from DMS and, in turn, provide pharmacy
benefits as well as medical benefits to their plan participants. To administer the pharmacy benefit,
Kentucky Medicaid MCOs have contracted with pharmacy benefits managers (PBMs), which provide
plan participants access to their existing pharmacy networks. PBMs also provide a number of
administrative services including claims processing, benefit design, help desk functions, prior
authorization, dispute resolution, drug utilization review, etc.
MCOs and their contracted PBMs typically reimburse pharmacies using reimbursement methods similar
to those used in commercial health plans. These reimbursement methodologies rely heavily on the
following elements:
Ingredient reimbursement tied to published benchmarks such as the average wholesale price
(AWP). Typically, percentage adjustments are applied to these benchmarks.
Proprietary maximum allowable cost (MAC) lists for pricing of generic products. These MAC lists
are specific to each PBM and each PBM may maintain multiple MAC lists based on their
contracts with pharmacies in their respective networks.
Minimal dispensing fees on the order of $0.50 to $2.00 per prescription claim.5
The potential for retrospective adjustments to reimbursements made through the point of sale
system as DIR fees.
Pharmacy Benefits Delivered Through Fee-for-Service
Notably, FFS pharmacy programs must follow CMS guidelines that were included in the Final Rule for
Covered Outpatient Drugs (CMS-2345-FC). This rule requires Medicaid FFS pharmacy reimbursement to
be based on the following guidelines:
Ingredient reimbursement based on actual acquisition cost (AAC).
Professional dispensing fees that are based on survey results of the actual overhead and labor
costs incurred by pharmacies to dispense prescriptions to Medicaid beneficiaries.
5 Effective July 1, 2018, PBMs affiliated with Kentucky Medicaid MCOs reimburse a minimum
dispensing fee of $2.00 per prescription based on funding provided by House Bill 200 (2018).

www.myersandstauffer.com page 17
BACKGROUND
Similar to approximately 40 other states, Kentucky’s FFS pharmacy program primarily relies on the
National Average Drug Acquisition Cost (NADAC) benchmark published by CMS to meet the AAC
requirement. The Kentucky FFS reimbursement methodology also incorporates wholesale acquisition
cost (WAC) as a “fallback” price for drugs where a NADAC price does not exist. For multiple source
products, the federal upper limit (FUL) and state MAC prices are used when applicable. An additional
benchmark, the average sales price (ASP) is relied upon as the basis for ingredient reimbursement for
hemophilia factor and physician-administered drugs. The Medicaid FFS program in Kentucky currently
pays a professional dispensing fee of $10.64.
Concerns Related to the Pharmacy Benefit Delivered through MCOs and PBMs
As more states have transitioned into managed care arrangements for their Medicaid programs, several
concerns have surfaced relative to the value of the “carve in” model of providing pharmacy benefits.
One concern relates to the model under which PBMs have received remuneration for their services from
MCOs and the frequent use of so-called “spread pricing” models. Under this model of contracting
between MCOs and PBMs, the pricing guarantees in MCO and PBM contracts are at higher levels than
corresponding terms in the contracts between PBMs and their member pharmacies, both in terms of
ingredient reimbursement and dispensing fees. The margin between the amount charged to a plan
sponsor and the amount paid by a PBM to pharmacies for a prescription is typically referred to as
“spread pricing.”
Perhaps the most significant drawback of the spread pricing model is its lack of transparency. The
spread pricing model tends to obscure the amount of remuneration retained by PBMs and makes it
difficult for state agencies administering the Medicaid benefit to determine if the amount of PBM
remuneration is a reasonable expense to be borne by a Medicaid program. Recent reports issued by
DMS have confirmed that spread pricing has been present with MCOs and PBMs operating within the
Kentucky Medicaid program.6 A recently issued Request for Proposal (RFP) to procure MCOs for the
Kentucky Medicaid program included a draft contract template with language that would prohibit
spread pricing contract models between MCOs and PBMs.7
6 See “Medicaid Pharmacy Pricing: Opening the Black Box;” Kentucky Cabinet for Health and Family Service, Department for Medicaid Services, Office of Health Data Analytics; February 19, 2019. 7 See “Commonwealth of Kentucky Request for Proposal (RFP) for Medicaid Managed Care
Organization (MCO) – All Regions RFP 758 1900000093;” Commonwealth of Kentucky, Finance and
Administration Cabinet, Office of Procurement Services; release date May 16, 2019. Attachment F
includes draft contract language which states:
31.14 PBM Pricing Transparency
The Contractor shall:

www.myersandstauffer.com page 18
BACKGROUND
Another concern relating to PBMs operating in a Medicaid managed care environment has been the
issue of pharmacy reimbursement adequacy. Concerns, particularly among independently-owned
pharmacies, suggest that PBM reimbursement for certain drug products is inadequate and that
pharmacies may unexpectedly face clawbacks for claims for which they were previously reimbursed.
Pharmacies have expressed concern about MAC reimbursement rates as well as other adjustments, also
known as direct and indirect remuneration (i.e., DIR fees). Common concerns cited are that MAC rates
are insufficient and that adjustments such as DIR fees are significant and not sufficiently detailed or
documented. In addition to draft contract terms in its recent RFP that would regulate DIR fees, DMS has
been actively implementing mechanisms to regulate PBM MAC rates pursuant to authority under Senate
Bill 5 (SB5) passed by the Kentucky legislature in its 2018 regular session.
Concerns have also been cited that the financial incentives of MCOs and PBMs with respect to the
pharmacy benefit may not always be aligned with the best overall interests of the Medicaid program.
For example, preferred drug lists (PDLs) created by MCOs and PBMs may not always align with the
financial goals of the Medicaid program at large, which represents opportunities for significant savings
when pharmacy utilization corresponds with the most cost-effective drugs, after considering sizable
rebates that are available through the federal MDRP. Furthermore, the use of multiple PDLs within the
Medicaid managed care and FFS programs create inconsistencies that impact members and complicate
the roles of prescribing practitioners and pharmacies. Another area in which concerns are cited relating
to financial incentives is the potential conflict of interest created when retail and specialty pharmacies
within the PBM network are under common ownership as the PBM, with reimbursement rates
determined by the PBM and audit functions under PBM oversight.
Consistent application of policies for drugs purchased through the 340B program is also complicated
within the MCO paradigm and potentially creates lost opportunities for the Medicaid program to realize
savings through collection of rebates. Currently, a DMS payment policy does not exist regarding MCO
payment for covered outpatient drugs dispensed or administered by 340B covered entities and their
contract pharmacies. This allows the MCOs to establish their own reimbursement policies for 340B-
dispensed drugs, which may result in the MCO delivery systems paying at or near normal market
A. Disclose all contract terms it has with its contracted PBM;
B. Utilize a pass-through pricing model in which there is no difference in the PBM to pharmacy and MCO to PBM reported payment amounts;
C. Provide any and all Claims -level detail that provides the basis for comparing the actual amount paid to pharmacies to the amount that the PBM charged the MCO for the transaction; and
D. No additional direct or indirect remuneration fees or any membership fees or the like may be imposed on a pharmacy as a condition of Claims payment or network inclusion. No additional retrospective remuneration models including Generic Effective Rates (GERs) shall be permitted. However, nothing shall preclude the reprocessing of Claims due to Claims adjudication errors of the Contractor or its agent.

www.myersandstauffer.com page 19
BACKGROUND
reimbursement rates for these deeply discounted drugs. While such arrangements may be beneficial to
providers (i.e., covered entities), and potentially to the MCOs and PBMs, DMS is not permitted to collect
federal rebates when a 340B-program drug has been dispensed; therefore, DMS may not only be
overpaying for these 340B drugs (i.e., these 340B drug reimbursements at near normal market
reimbursement rates are passed through to the capitation rate-setting process), but also sacrificing their
ability to collect substantial federal rebates.
Finally, concerns have been generally expressed that the Medicaid managed care delivery system
inherently includes mechanisms that are more likely to direct public funds towards administrative costs
and profits, as opposed to providers directly serving beneficiaries.8
Pharmacy Carve-Out Analysis
DMS has requested Myers and Stauffer provide an overview of the potential implications and fiscal
impact of implementing a pharmacy carve-out model within the Kentucky Medicaid program. Full and
partial pharmacy benefit carve-out models are used in several states, and represent a removal of either
the entire pharmacy benefit, or a portion of that benefit, from the management of MCOs and
accordingly removing an amount commensurate with that benefit from the capitated rates paid to the
MCOs. In a carve-out model, the portion of the pharmacy benefit included in the carve-out is returned
to the traditional FFS model and subject to direct management by the state Medicaid agency, typically
with the assistance of a PBM or fiscal agent contracted directly to the state agency.
8See “Medicaid Managed Care: Lots of Unanswered Questions (Part 1)," Health Affairs Blog; May 3, 2018.

www.myersandstauffer.com page 20
STUDY
SCOPE
Study Scope
DMS has indicated to Myers and Stauffer that our analysis relating to a pharmacy carve-out should focus
on the fiscal implications of the differences in pharmacy reimbursement models used under the
managed care delivery system versus the reimbursement paradigm of a FFS delivery system. The
analysis should also address other implications of a carve-out model at a high level. Outside of the fiscal
impact of the difference in the pharmacy reimbursement model, these areas of additional research are
not intended to result in precise calculations of the fiscal impact, but rather will provide a high-level
overview of relevant issues and direct DMS towards additional areas of study that may be required
should DMS elect to further research a carve-out approach to managing Medicaid pharmacy benefits.
This report also highlights various advantages and disadvantages of a pharmacy carve-out model. Areas
addressed within this report include:
The net impact to pharmacy claims reimbursement between the managed care and FFS models
of reimbursement based on a claims repricing analysis and also reflective of the implications of
PBM spread pricing as previously researched by DMS.
High level assessment of the impact on administrative expenses associated with the pharmacy
benefit under the managed care model versus the FFS model.
High level estimates of the impact to pharmacy rebates that may result from shifting from a
pharmacy benefit provided through multiple MCOs and PBMs using distinct PDLs, versus the use
of a single PDL provided within the context of a carved out pharmacy benefit administered under
a FFS model.
High level estimates of the fiscal impact associated with other factors included within the
capitation rate-setting process such as premium assessments, allowance for profit, and health
insurer fees.
Discussion of potential concerns which stakeholders may raise regarding a carve-out of the
pharmacy benefit.
Notably, this study is not intended to be an actuarial analysis that would provide insight into the impact
of a carve-out model on the capitated rates paid to MCOs. Since overall Medicaid expenditures through
the managed care delivery system would drastically change should the pharmacy benefit be carved out,
an actuarial analysis would be necessary to determine the impact on the capitated rates paid to MCOs.
www.myersandstauffer.com page 21
MCO VERSUS FFS PHARMACY
CLAIMS REPRICING
MCO Versus FFS Pharmacy Claims Repricing
Overview
A primary area of analysis for this study was a focus on the fiscal implications of the differences in
pharmacy claims reimbursement models used under the managed care model versus the
reimbursement paradigm of a FFS model. Under a FFS model, the state enrolls and pays providers
directly. This direct payment of pharmacy claims is the primary cost driver for the FFS model, although
administrative costs and cost offsets associated with rebate collections are also relevant factors to
consider.
In contrast, under the Medicaid managed care model, the state does not pay providers directly, but
rather pays the MCOs a capitated rate, individualized to specific population groups through actuarial
analysis. The capitated rates are inclusive of all the medical and pharmacy benefits that beneficiaries are
entitled to receive. Although the claims payments made by the MCO to their PBM, and payments from
the PBM to the pharmacy, are not the direct payments made by the state under the MCO model, it is
the primary component driving the total cost to the state to fund the pharmacy benefit. The cost
associated with these claims payments must be considered in conjunction with other issues such as the
impact of spread pricing, trending factors, applicable taxes, and other adjustments applied by the
actuaries (discussed in further detail later in this report), all of which result in the capitation payments
that are paid directly by the state.
This section of the report focuses on an analysis which was based on MCO prescription claim encounter
data reported by the MCOs, which presents the payments made by MCOs to their PBMs for each
prescription that was reimbursed by the plan. These claims-level MCO payments to PBMs were
contrasted with the payment which would have been made had similar claims been presented under
the Kentucky FFS pharmacy program.
It is important to note that for purposes of this analysis, the encounter data which DMS provided to
Myers and Stauffer were viewed as transactions which occurred between MCOs and their partner
PBMs. In contrast to FFS claims data which are records of actual payments made to pharmacies, in the
case of MCO encounter data, the actual payments made to pharmacies by the PBM are not readily
available to DMS. However, recent reports issued by DMS have confirmed that spread pricing has been
present with MCOs and PBMs operating within the Kentucky Medicaid program.9 The term “spread
9 See “Medicaid Pharmacy Pricing: Opening the Black Box;” Kentucky Cabinet for Health and Family
Service, Department for Medicaid Services, Office of Health Data Analytics; February 19, 2019.

www.myersandstauffer.com page 22
MCO VERSUS FFS PHARMACY
CLAIMS REPRICING
pricing” implies that there is a margin between the amount charged to a plan sponsor and the amount
paid by a PBM to pharmacies for a prescription.10
Data
Myers and Stauffer used a data set provided by DMS to perform the claims pricing comparison. The data
included MCO pharmacy encounter data and FFS pharmacy claims for dates of service within the two-
year time period of January 1, 2017, to December 31, 2018. The analysis focused on a repricing that was
applied on a claims-level basis for the MCO encounter data. Each claim was repriced under the current
DMS FFS pharmacy reimbursement methodology and compared to the MCO amount paid on the claim.
The current DMS FFS pharmacy reimbursement methodology is outlined in Table 2.
10 Myers and Stauffer reviewed the contracts between the MCOs and PBMs operating in the Kentucky Medicaid
program with a focus on the financial terms associated with payments for prescriptions, pricing guarantees,
dispensing fees, and administrative fees.
For brand name drug products, pricing guarantees in the MCO/PBM contracts had an average discount from AWP
of approximately 16 percent. For generic products, pricing was generally based on each PBM’s proprietary MAC
rates. The average discount from AWP for generic products pricing guarantees was approximately 79 percent.
Dispensing fee guarantees in the contracts reviewed by Myers and Stauffer, which represented pricing terms
between the MCO and the PBM, did not reflect the current requirement for a $2 minimum dispensing fee to be
paid to pharmacies. Dispensing fee guarantees for brand name products averaged approximately $1. The average
dispensing fee guarantee for generic products was approximately $1.08.
Although Myers and Stauffer did not have access to contracts between PBMs and pharmacies for the PBMs operating within the Kentucky Medicaid program, based on experience with review of PBM/pharmacy contracts in other settings, these contracts tend to have average reimbursement for brand name products on the order of AWP minus 18 percent. For generic drug products, pricing terms in the PBM/pharmacy contracts tend to be predominately based on each PBM’s proprietary MAC prices with either fallback pricing (e.g., a generic without a MAC might default to AWP minus 25 percent) or pricing guarantees that range up to AWP minus 88.5 percent.

www.myersandstauffer.com page 23
MCO VERSUS FFS PHARMACY
CLAIMS REPRICING
Table 2. Current DMS FFS Pharmacy Reimbursement Methodology
Type Logic
Retail Community, Specialty, and Institutional Pharmacy
Lowest of: National Average Drug Acquisition Cost (NADAC), plus a $10.64 professional
dispensing fee (PDF); or
Wholesale acquisition Cost (WAC), plus a $10.64 PDF 11; or
Federal upper limit (FUL), plus a $10.64 PDF; or
The Kentucky established maximum allowable cost (MAC), plus a $10.64 PDF; or
The provider’s usual and customary (U&C) charge to the public, as identified by the claim charge.
Hemophilia Products Lowest of:
Same criteria as above plus the addition of average sales price (ASP) + 6%, plus a $10.64 professional dispensing fee (PDF).
Drugs purchased through the 340B
program
Lowest of:
Same criteria as above plus the addition of the 340B Ceiling Price, plus a $10.64 professional dispensing fee (PDF). Covered entities using drugs purchased under the 340B Program for Medicaid members must bill no more than their actual acquisition cost, plus the professional dispensing fee.
In addition to the MCO encounter data, the following data sources were required for the accurate
repricing of the MCO encounter data:
Monthly MAC files, used with the FFS program, provided to Myers and Stauffer by DMS for the
same two-year time period.
Historical NADAC, FUL, and WAC pricing benchmarks as well as drug classification data obtained
via Myers and Stauffer’s contractual agreement with First Databank.
Historical ASP pricing published by CMS.
Approach and Assumptions
To adequately measure the fiscal impact of carving out the pharmacy reimbursement component of
Medicaid MCO into Medicaid FFS, many factors were considered. The first phase of the analysis focused
on data integrity and the identification of items to exclude from the analysis. Like most state Medicaid
programs that utilize MCOs, the primary source to identify the prescription reimbursement amounts
11 The current professional dispensing fee of $10.64 used within the FFS methodology was derived from a review of the results of cost of dispensing surveys performed in other states. Requirements for professional dispensing fees included within CMS-2345-FC allow state Medicaid programs to set professional dispensing fees based on the results of either its own cost of dispensing survey, the results of cost of dispensing surveys in other states or on results of national surveys. DMS has not performed its own cost of dispensing survey of Kentucky pharmacies since the implementation of CMS-2345-FC.

www.myersandstauffer.com page 24
MCO VERSUS FFS PHARMACY
CLAIMS REPRICING
paid by the MCOs to the PBMs lies in the encounter data received by the Commonwealth’s fiscal agent.
In Kentucky, this data was provided by DXC (the fiscal agent for DMS) for the five MCO plans in the
current program. The following table summarizes the MCO encounter claims counts and total of
payments for each plan for CY 2017 and CY 2018.
Table 3. Claim Count and Payment Totals by MCO (in millions)
CY 2017 CY 2018 Total
MCO Claims Payments Claims Payments Claims Payments
Aetna 3.9 $213.1 3.6 $217.7 7.4 $430.8
Anthem 2.0 $129.4 2.1 $162.4 4.2 $291.8
Humana 3.2 $191.0 3.4 $227.6 6.6 $418.6
Passport 5.3 $352.2 5.3 $372.3 10.6 $724.5
Wellcare 10.5 $567.5 10.5 $605.5 21.0 $1,172.9
Totals 24.9 $1,453.1 24.9 $1,585.5 49.7 $3,038.7
Any reliance on the MCO encounter data for an estimate of the potential fiscal impact of a change to a
carve-out approach to the delivery of pharmacy benefits is only as accurate as the underlying data
permits. MCO encounter data is imported into the Medicaid management information system (MMIS)
operated by DMS after submission by each plan who in turn received the source data for prescription
claims from the claims reporting systems of their PBM. In these multiple processes of passing through
prescription claims data, data fields from diverse systems are eventually placed in the standardized
format available within the MMIS. To the extent that data fields from foreign systems have differing
interpretations than the definitions used with the MMIS data set, the potential for misinterpretation of
data can occur. Myers and Stauffer is relying upon the standardized MMIS field definitions that were
provided by DMS.
Upon detailed review of the data, there were multiple items identified that were excluded to preserve
accuracy and help ensure consistency when conducting the repricing using the FFS reimbursement
methodology. The claims count and total of payments for each of these categories of excluded claims
are identified in Table 4 below.

www.myersandstauffer.com page 25
MCO VERSUS FFS PHARMACY
CLAIMS REPRICING
Table 4. Summary of MCO Pharmacy Claims Excluded from Analysis
Exclusion Category12 Claims Payments
Blank NDC 70,934 $3,323,150 Invalid NDC 95,822 $1,542,987 Compound Claims 102,029 $27,574,341 TPL Claims 323,544 $32,906,110 Zero Amount Billed 32,930 $1,527,430
Total Excluded 625,259 $66,874,018 Percent Excluded 1.3% 2.2%
Total Included13 49,137,981 $2,971,776,547 Percent Included 98.7% 97.8%
Total 49,763,240 $3,038,650,565
In addition to any potential issues relating to data integrity, it should also be noted that a reliance on
claims data from CY 2017 and CY 2018 as a means of projecting the potential fiscal impact of a switch to
a carve-out model is inherently subject to a number of limitations including:
Drug prices shift continuously. While general trends of price increases for brand name products
over time and an overall trend of decreasing prices for generic products (for benchmarks tied to
actual acquisition cost) can be inferred, it is not possible to predict future price changes. Future
pharmacy benefit expenditures, whether under the existing managed care delivery system or a
carved out model under a FFS delivery system will be subject to future shifts in drug pricing.
Drug utilization shifts continuously. Utilization changes may occur as a result of changes in
patient populations, changes in patient acuity, changes in prescribing patterns, changes in drugs
which are given preferential status on each of the MCOs’ PDLs, the introduction of new products
(and the unpredictable launch prices of those products), etc. Future pharmacy benefit
expenditures, whether under the existing managed care delivery system or a carve-out model
under a FFS delivery system will be subject to future shifts in drug utilization.
Policy changes create shifts in reimbursement trends. One notable change in reimbursement
policy during the time period under review was the introduction in July 2018 of the requirement
that MCOs include a minimum dispensing fee of $2.00 in the reimbursement for their pharmacy
12 Claims were excluded from the carve-out analysis for the following reasons: (1) Blank NDC: The “CDE_NDC” field is blank or null; (2) Invalid NDC: The “CDE_NDC” field does not contain a value in the First Databank drug history database; (3) Compound Claims: The “CDE_CLM_TYPE” field has a value of ‘Q’ or multiple claim lines per unique “NUM_ICN” were present; (4) TPL Claims: The “AMT_TPL” field has a value greater than 0, indicating a third-party amount was paid; and (5) Zero Amount Billed: The “AMT_BILLED” field has a value of 0, indicating the provider billed amount (i.e., U&C) value cannot be determined.
13 The total of payments included in the analysis will not tie to the total of payments in the fiscal results due to the implication of copayments made on the claims. Further detail regarding the handling of copayments is described later within this report.

www.myersandstauffer.com page 26
MCO VERSUS FFS PHARMACY
CLAIMS REPRICING
claims payments. This significantly impacts any comparisons of the payment of prescription
claims under the MCO payment methodology and the current FFS reimbursement methodology
since the requirement for the minimum dispensing fee of $2.00 was absent during 18 out of 24
months of the analysis time period. Methods to account for this change in MCO prescription
reimbursement methodology policy are discussed subsequently within this report.
Possible data integrity issues. It should be noted that for MCO encounter data submitted by
Humana, for the vast majority of claims (82 percent of claims), the claim payment amount was
equal to the pharmacy’s billed charges. In contrast, for all other plans, the percentage of claims
for which the claim payment amount was equal the to the pharmacy’s billed charges was
substantially less, ranging from 12 percent to 14 percent among the four other plans. Whether
this is an accurate difference occurring in the source transactions between PBMs and
pharmacies, or is an artifact of the migration of the data in the MMIS was not readily
discernable. No adjustment was made to the FFS repricing methodology for Humana claims on
this basis, but it could be an indicator of other data integrity issues not readily apparent to Myers
and Stauffer.
For the claims included in the analysis, each was repriced assuming the current FFS reimbursement
methodology used by DMS based on the “lowest of” logic previously defined in Table 2. To best simulate
how each claim would have paid under the FFS reimbursement logic, the pricing benchmarks effective
on the date of service of the claim were used. If a copayment existed on the claim, it was subtracted
from the dispensing fee portion of reimbursement first, then any remaining copayment was subtracted
from the ingredient portion of reimbursement. It is worth noting that total copayments paid on
prescription claims for the two-year period of CY 2017 to CY 2018 equated to $5.2 million (i.e., 0.17
percent of total payments). Therefore, regardless of how this aspect of claims reimbursement was
considered, copayments did not have a material impact on the overall results.
Another consideration of the repricing analysis involved the handling of “brand medically necessary”
products. In instances in which the brand product was dispensed and the claim indicated that the
dispensing of the brand product was medically necessary, the claim was repriced utilizing only the brand
pricing benchmarks (i.e., pricing was not based on a generic equivalent product). All other claims were
repriced assuming Kentucky’s current mandatory generic drug law. 14
Results
For CY 2017 and CY 2018, approximately 49.1 million encounter claims were repriced using the current
DMS FFS pharmacy reimbursement logic. To adequately represent the shift in cost due to a much higher
dispensing fee under the FFS reimbursement methodology, the estimated fiscal impact was divided into
both the ingredient and dispensing fee components of payment. For CY 2017, the total estimated
14 See provisions relating to the dispensing of generic alternatives at KRS 217.822.

www.myersandstauffer.com page 27
MCO VERSUS FFS PHARMACY
CLAIMS REPRICING
savings on the ingredient portion of reimbursement of $193.5 million was offset by a total increased
estimated dispensing fee cost of $204.9 million, resulting in a net increased cost of $11.4 million. For CY
2018, the total estimated ingredient savings of $196.4 million was offset by a total increased estimated
dispensing fee cost of $187.8 million, resulting in a net savings of $8.6 million. The total combined net
fiscal impact for both years is estimated as a net cost of $2.8 million comparing reimbursement to
pharmacies under the FFS methodology to the MCO payment amounts reported within the encounter
data. When analyzing the projected impact between CYs, the $20.0 million change from net impact of
increased cost using the CY 2017 data to a net impact of savings accounts for less than 2 percent of total
reported MCO spend for the two-year time period. Table 5 below presents a summary of these findings.
Table 5. Estimated Fiscal Impact by Plan (State and Federal Dollars in Millions)
MCO
2017
2018
Total
Ingredient
Dispensing Fee
Total Ingredient Dispensing
Fee Total Ingredient
Dispensing Fee
Total
Aetna ($28.0) $33.6 $5.7 ($28.1) $27.6 ($0.5) ($56.1) $61.2 $5.1 Anthem ($26.0) $16.8 ($9.2) ($35.7) $16.2 ($19.5) ($61.7) $33.0 ($28.7) Humana ($27.5) $10.0 ($17.5) ($32.9) $14.3 ($18.6) ($60.4) $24.3 ($36.1) Passport ($39.9) $47.5 $7.6 ($47.8) $42.9 ($4.9) ($87.7) $90.4 $2.7 Wellcare ($72.2) $96.9 $24.7 ($51.8) $86.8 $35.0 ($124.0) $183.7 $59.7
Total ($193.5) $204.9 $11.4 ($196.4) $187.8 ($8.6) ($389.9) $392.7 $2.8
Although the trend for savings due to decreased ingredient reimbursement was consistent between the
repriced results using encounter data from both CY 2017 and CY 2018, there was a significant shift in the
dispensing fee differential over the same period. The notable change in this differential can be primarily
attributed to a change in the dispensing fees paid by MCOs beginning in July 2018. This change appears
to be a direct result of the minimum $2.00 dispensing fee requirement for MCOs implemented by DMS
effective July 1, 2018. Table 6 below represents the trends in the average ingredient and dispensing fee
paid for each time period, as well as the six-month period from July to December 2018. Figure 1 and
Figure 2 are graphical representations of this data.
Table 6. Average Ingredient and Dispense Fee Reimbursement Per Claim
2017
2018 Overall Average
July-Dec 2018 "Normalized"
Average Ingredient Paid per Claim - MCO $57.64 $63.15 $60.40 $60.39
Average Ingredient Paid per Claim - FFS $49.76 $55.16 $52.46 $52.46 FFS Ingredient Paid as Percent of MCO 86.3% 87.4% 86.9% 86.9%
Average Dispensing Fee Paid per Claim - MCO $0.73 $1.47 $1.10 $2.30 Average Dispensing Fee Paid per Claim - FFS $9.08 $9.11 $9.09 $9.09 FFS vs MCO Dispensing Fee Differential $8.35 $7.64 $7.99 $6.79

www.myersandstauffer.com page 28
MCO VERSUS FFS PHARMACY
CLAIMS REPRICING
Figure 1. Chart of Average Ingredient Amount Paid Per Claim
Figure 2. Chart of Average Dispensing Fee Per Claim
It was observed that the relationship between average FFS ingredient amount paid per claim and
average MCO ingredient amount paid per claim remained relatively consistent at approximately 87
percent (FFS ingredient paid amount as a percent of MCO ingredient paid amount) for both CY 2017 and
$57.64
$63.15 $60.40 $60.39
$49.76
$55.16 $52.46 $52.46
86.3%87.4% 86.9% 86.9%
65.0%
70.0%
75.0%
80.0%
85.0%
90.0%
95.0%
100.0%
$0.00
$10.00
$20.00
$30.00
$40.00
$50.00
$60.00
$70.00
2017 2018 Total July-Dec 2018Normalized
Average Ingredient Amount Paid Per Claim
MCO FFS FFS as Percent of MCO
$0.73
$1.47 $1.10
$2.30
$9.08 $9.11 $9.09 $9.09
$0.00
$1.00
$2.00
$3.00
$4.00
$5.00
$6.00
$7.00
$8.00
$9.00
$10.00
2017 2018 Total July-Dec 2018Normalized
Average Dispensing Fee Per Claim
MCO FFS
www.myersandstauffer.com page 29
MCO VERSUS FFS PHARMACY
CLAIMS REPRICING
CY 2018. However, the difference between the average dispensing fee per claim under the FFS
reimbursement methodology and the average dispensing fee per claim reported within the MCO
encounter data shifted by more than $1.00 per claim for the six-month period subsequent to the
implementation of the $2.00 minimum dispensing fee requirement. This change in dispensing fees,
which essentially adds $1.00 per claim, has a significant impact on the outcome of the repricing analysis.
However, the impact of this change in policy is not reflected in claims included within the analysis over
the time period of January 2017 to June 2018.
Based on the impact of the new minimum dispensing fee requirement implemented in July 2018, Myers
and Stauffer recalculated the repricing results utilizing a “normalized” dispensing fee, which was
determined by calculating the average MCO dispensing fee paid from July through December of 2018.
An average dispensing fee of $2.40 per claim was retroactively applied to the MCO encounters from
January 2017 to June 2018, to produce an adjusted repricing result that was more representative of
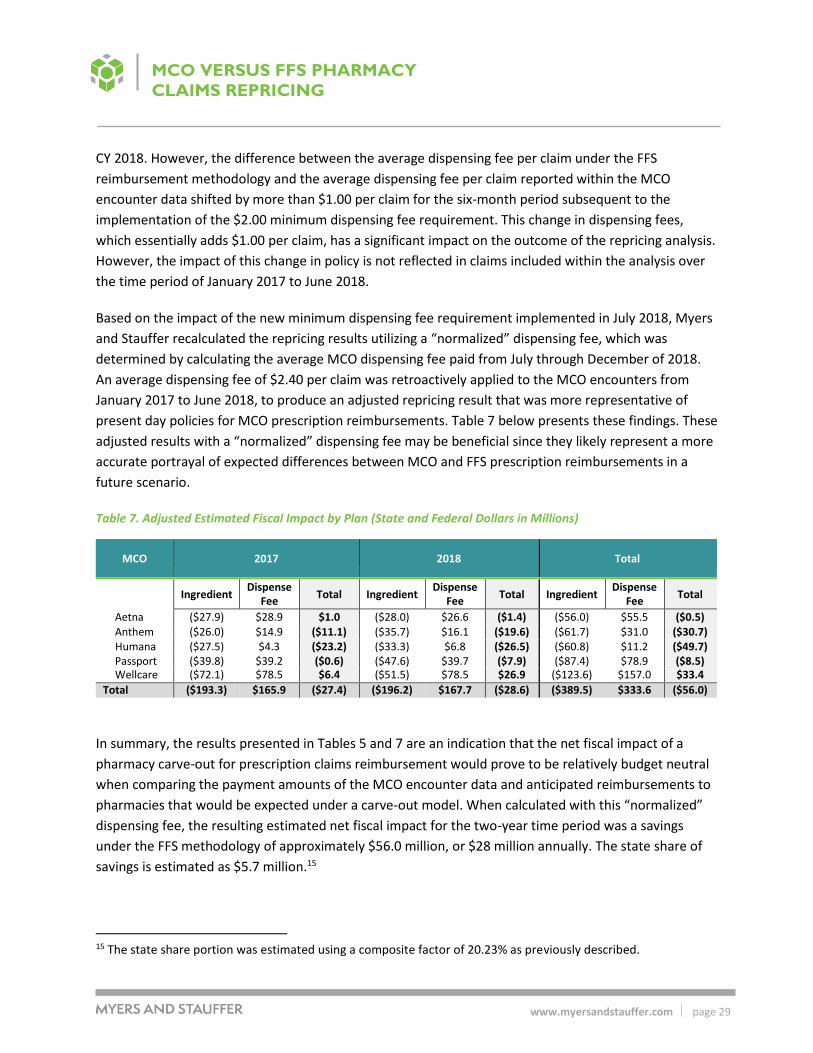
present day policies for MCO prescription reimbursements. Table 7 below presents these findings. These
adjusted results with a “normalized” dispensing fee may be beneficial since they likely represent a more
accurate portrayal of expected differences between MCO and FFS prescription reimbursements in a
future scenario.
Table 7. Adjusted Estimated Fiscal Impact by Plan (State and Federal Dollars in Millions)
MCO
2017
2018
Total
Ingredient
Dispense Fee
Total Ingredient Dispense
Fee Total Ingredient
Dispense Fee
Total
Aetna ($27.9) $28.9 $1.0 ($28.0) $26.6 ($1.4) ($56.0) $55.5 ($0.5) Anthem ($26.0) $14.9 ($11.1) ($35.7) $16.1 ($19.6) ($61.7) $31.0 ($30.7) Humana ($27.5) $4.3 ($23.2) ($33.3) $6.8 ($26.5) ($60.8) $11.2 ($49.7) Passport ($39.8) $39.2 ($0.6) ($47.6) $39.7 ($7.9) ($87.4) $78.9 ($8.5) Wellcare ($72.1) $78.5 $6.4 ($51.5) $78.5 $26.9 ($123.6) $157.0 $33.4
Total ($193.3) $165.9 ($27.4) ($196.2) $167.7 ($28.6) ($389.5) $333.6 ($56.0)
In summary, the results presented in Tables 5 and 7 are an indication that the net fiscal impact of a
pharmacy carve-out for prescription claims reimbursement would prove to be relatively budget neutral
when comparing the payment amounts of the MCO encounter data and anticipated reimbursements to
pharmacies that would be expected under a carve-out model. When calculated with this “normalized”
dispensing fee, the resulting estimated net fiscal impact for the two-year time period was a savings
under the FFS methodology of approximately $56.0 million, or $28 million annually. The state share of
savings is estimated as $5.7 million.15
15 The state share portion was estimated using a composite factor of 20.23% as previously described.
www.myersandstauffer.com page 30
MCO VERSUS FFS PHARMACY
CLAIMS REPRICING
It should be noted that the MCO encounter data reflects the payments made by MCOs to their PBMs.
The spread pricing analysis performed by DMS indicated that actual payments from PBMs to pharmacies
were less, in the aggregate, than the payments from MCOs to PBMs. In its recent analysis of spread
pricing within the Kentucky Medicaid program, DMS reported that spread pricing for CY 2017 and CY
2018 total approximately $86.7 million and $123.5 million respectively.16 For CY 2018, the spread
amount represented approximately 12.9 percent of MCO payments to their PBMs, or approximately $5
per prescription.
Given the results of the repricing analysis, with an emphasis on the adjusted results using a
“normalized” dispensing fee, and the results of the study of spread pricing performed by DMS, it can be
inferred that if the pharmacy benefits currently delivered through managed care were carved out,
payments to pharmacies would potentially be slightly less at approximately 1.5 percent to 2.0 percent
than the MCO to PBM payments being reported within pharmacy encounter data (the adjusted repricing
analysis indicated a two-year decrease in reimbursement of $56.0 million on $2.97 billion in MCO
encounter payments included in the analysis). However, given that under the spread pricing model of
MCO and PBM contracting, pharmacies did not actually receive the entire amount reported within the
MCO encounter data, net payments to pharmacies under the FFS reimbursement methodology would
be expected to be approximately 5 to 6 percent higher than under the current MCO delivery system
(applying the $123.5 million in spread pricing reported by DMS for CY 2018).
16 See “Medicaid Pharmacy Pricing: Opening the Black Box;” Kentucky Cabinet for Health and Family
Service, Department for Medicaid Services, Office of Health Data Analytics; February 19, 2019.

www.myersandstauffer.com page 31
ADDITIONAL FACTORS
IMPACTING A PHARMACY
CARVE-OUT FISCAL IMPACT
Additional Factors Impacting a Pharmacy
Carve-Out Fiscal Impact
Overview
While the repricing of prescription claims that were delivered through the current managed care
delivery system versus the reimbursement methodology of the FFS pharmacy program was a significant
component of the analysis, there are multiple additional factors that would impact expenditures by DMS
were the pharmacy benefit to be carved out. The primary issues that would create additional fiscal
impacts include the following:
Changes to the structure of the administrative costs incurred to administer the pharmacy
benefit.
Rebates.
Premium assessments.
Allowance for target profit margin.
ACA health insurer fees.
Each of the above issues is addressed in greater detail in the following sections. However, since the
primary focus of Myers and Stauffer’s engagement was to consider the impact of the repricing of
prescription claims that were delivered through the current managed care delivery system versus the
reimbursement methodology of the FFS pharmacy program, these additional areas are addressed at a
high level and likely require additional research and analysis by DMS. Notably, this section of the report
does not address the impact of a carve-out model on the capitation rates paid to MCOs. Since overall
Medicaid expenditures through the managed care delivery system would drastically change should the
pharmacy benefit be carved out, an actuarial analysis would be necessary to determine the impact on
the capitation rates paid to MCOs.
Administrative Costs
Under the managed care model, administrative costs associated with the delivery of prescription drug
benefits are incurred by both the MCO and its associated PBM. Based on a review of PBM contracts for
MCOs operating under the Kentucky Medicaid program (provided by DMS), the primary administrative
services being provided by PBMs include the following services:
Pharmacy network management (establish, contract, and maintain network; monitor and audit
for compliance).
Eligibility management (24 hour eligibility/claims processing support).

www.myersandstauffer.com page 32
ADDITIONAL FACTORS
IMPACTING A PHARMACY
CARVE-OUT FISCAL IMPACT
Online electronic claims processing/administration (including online viewing access to 12 months
of claims history).
Drug utilization review.
Full-service pharmacist/member help desk (live – available 24/7).
Formulary/therapeutic management programs.
Financial services (including pharmacy reimbursement).
ID cards and member welcome communications.
Maintain accurate pharmacy directory, searchable by zip code to allow members to find in-
network pharmacy.
Prior authorization management.
Rebate management (submit, collect, and remit to plan).17
Due to the use of spread pricing practices, the means and amounts by which PBMs are remunerated by
the MCOs for these services is obscured. In its recent analysis of spread pricing within the Kentucky
Medicaid program, DMS reported that spread pricing for CY 2017 and CY 2018 total approximately $86.7
million and $123.5 million respectively.18 For CY 2018, the spread amount represented approximately
12.9 percent of MCO payments to their PBMs, or approximately $5 per prescription. While it may not be
reasonable to entirely equate spread pricing with pharmacy benefit administrative cost under the
managed care pharmacy delivery system, the amounts associated with spread pricing represent a
substantial portion of expenses that are ultimately borne by the Medicaid program and do not represent
direct reimbursements to pharmacies for providing prescription drug products and the associated
professional dispensing services.
Considered in another way, during the capitation rate-setting process undertaken by the actuaries for
DMS, administrative costs incurred by MCOs are reviewed and an allowance for administrative cost is
incorporated into the capitation rates. The capitation rates are developed in association with all covered
services for which Medicaid members are eligible to receive. Accordingly, they are inclusive of costs for
medical benefits and pharmacy benefits. The allowances for administrative costs that are applied within
17 Rebate management in this sense generally refers to rebates negotiated independently between PBMs and drug manufacturers and not rebates under the MDRP. DMS utilizes its own vendor to collect utilization data from both the managed care and FFS pharmacy programs and to invoice pharmaceutical manufacturers for rebates due under the MDRP. In general, rebates obtained independently by the PBMs operating under Medicaid managed care plans are substantially less than rebates available under the MDRP. 18 See “Medicaid Pharmacy Pricing: Opening the Black Box;” Kentucky Cabinet for Health and Family
Service, Department for Medicaid Services, Office of Health Data Analytics; February 19, 2019.

www.myersandstauffer.com page 33
ADDITIONAL FACTORS
IMPACTING A PHARMACY
CARVE-OUT FISCAL IMPACT
the capitation rate-setting process are globally applied as a percentage add-on to the calculated per
member per month (PMPM) expected average expenditures for medical and pharmacy services. The
actuaries perform the PMPM calculations separately for various sub-groups of the Medicaid-eligible
population in order to determine capitated rates for each “rate cell.” The administrative add-on varies
according to the specific rate cell in question, but falls within the range of 7 percent to 9 percent, and
averages approximately 8.2 percent. This implies that MCOs are receiving an administrative allowance
within their capitated rates of approximately $5 per prescription. Since the actuaries have traditionally
not accounted for spread pricing within the capitated rate-setting process (i.e., the MCO encounters
which represent MCO payments to the PBM are used to develop forecast claims which the capitation
rates should cover even though these amounts do not represent the actual claims payment amounts to
pharmacies), this implies that the allowance for MCO administrative expenses within the capitated rate
is in addition to administrative costs for which PBMs derive remuneration for their services through the
spread pricing differential. Some limits to administrative expenses incurred may be applied
retrospectively to individual MCOs through other processes, but those limits would be applied across
both the medical and pharmacy portion of benefits collectively.19
19 CMS policies related to Medicaid managed care programs set limits on the amounts of administrative services
expense which MCOs can realize through the capitated payments which they receive relative to their payments to
providers for covered benefits for members. CMS has recently issued guidance for medical loss ratio (MLR)
standards which specifically impacts MCO and PBM spread pricing arrangements. Within this guidance, CMS
stated:
In calculating and reporting the MLR, states are responsible for ensuring that managed care plans are complying
with these MLR requirements and should be routinely auditing reported data and MLR calculations to ensure that
revenues, expenditures, and other amounts are appropriately identified and classified within each managed care
plan’s MLR; that is, distinguishing which amounts were actually paid for benefits, or activities that improve health
care quality, and which amounts were actually paid for administrative services, taxes, or other activities ...
We illustrate the application of these requirements in the situation where a Medicaid managed care plan
subcontracts with a pharmacy benefit manager (PBM) for the administration of the Medicaid covered outpatient
drug benefit. The PBM administers the covered outpatient drug benefit through a contracted network of
pharmacies and does not provide any of the Medicaid covered outpatient drugs directly to enrollees through its
own employees. In this circumstance, the PBM is required to report to the managed care plan all of the
information necessary for the managed care plan to meet its MLR obligations under 42 CFR 438.8. The PBM is
required to classify and report revenues and expenditures associated with the administration of the Medicaid
covered outpatient drug benefit to the managed care plan in the same manner that the managed care plan would
be required itself to classify and report this information if the managed care plan had administered the covered
outpatient drug benefit directly.
(See CMCS Informational Bulletin, May 15, 2019, “Medical Loss Ratio (MLR) Requirements Related
to Third-Party Vendors.”)

www.myersandstauffer.com page 34
ADDITIONAL FACTORS
IMPACTING A PHARMACY
CARVE-OUT FISCAL IMPACT
Under a FFS pharmacy program, administrative expenses which would be incurred directly by DMS
include the following broad categories:
Expenses for administrative staff employed directly by DMS. This includes pharmacists, business
analysts and other staff that play a key role in the oversight of contractors performing functions
associated with the FFS pharmacy program.
Expenses for a pharmacy claims and rebate processing vendor.
Expenses associated with maintenance of the PDL, prior authorization, and supplemental rebate
program.
Expenses for additional consulting and administrative services vendors.
Although the number of Medicaid members currently served by Kentucky’s FFS pharmacy program is
relatively small compared to the number of members receiving their pharmacy benefits through their
benefits administered by managed care plans, some level of all of the administrative overhead cost
associated with running the FFS program is already being incurred by DMS. A transition to administering
all pharmacy benefits under a FFS model would entail additional administrative services costs, but these
would primarily represent the marginal costs associated with operating the FFS pharmacy benefit at a
larger scale, as opposed to the relatively modest size of the FFS pharmacy program currently. A
significant portion of additional administrative cost incurred by DMS would likely include an expansion
of current levels of contracting for clinical and claims administration services (e.g., claims adjudication,
preferred drug list (PDL) development and maintenance, prior authorization call centers and appeals
processes, prospective and retrospective drug utilization review, rebate management, audit functions,
provider and member communications, drug compendia data sources, etc.). The expansion of the FFS
pharmacy program would also result in commensurate increases in DMS staff to perform contract
oversight and other administrative functions.
It is not within the scope of this study to develop a line item budget for the expected administrative
expenses that would be incurred within the FFS program under a carve-out model. Myers and Stauffer
reviewed current expenditure levels for claims administration services reported within the Kentucky
Medicaid FFS pharmacy program and also estimates developed internally by DMS to address the cost of
expanded services under a larger FFS pharmacy program. An estimate of administrative costs per
prescription claim at current rates, but with the scale of prescription volume that would be experienced
under a pharmacy carve-out model is approximately $2.10 per prescription. Lower administrative costs,
on a per claim basis, at the scale of a pharmacy carve-out model appear to be attainable, potentially as
low as $1.00 per prescription, but would be subject to the vendor procurement and negotiation process.
For purposes of this analysis, the figure of $2.00 per prescription is used along with the assumption of
additional DMS staffing needs on the order of $0.20 per prescription.
www.myersandstauffer.com page 35
ADDITIONAL FACTORS
IMPACTING A PHARMACY
CARVE-OUT FISCAL IMPACT
In contrast, the current levels of administrative expense being incurred by DMS for prescription claims
delivered through the managed care delivery system, including estimates of PBM spread and an
assumption of a level allocation of MCO administrative cost across both medical and pharmacy benefits,
may be as high as $10 per prescription. This estimate was developed as follows:
The average MCO prescription claim payment amount for CY 2018 is $63.67 (i.e., $1.5855
billion/24.9 million claims = $63.67).
Assuming that prescription claim payments form the basis for the development of capitation
rates, the estimated administrative cost that is included per prescription claim, on average, is
$5.22 (i.e., $63.67 x 8.2% = $5.22).20
The estimate of spread pricing per claim for CY 2018 was $123.5 million. Averaging this amount
across the number of MCO prescription claims for CY 2018 yields $4.96 (i.e, $123.5 million/24.9
million claims = $4.96).21
Total estimated administrative cost per claim plus spread pricing per claim is $10.18 (i.e., $5.22 +
$4.96 = $10.18).
In addition to the differing levels of administrative cost, it is also important to consider the impact of
varying levels of federal medical assistance percentage (FMAP) available for different types of
administrative costs under the managed care and fee-for service delivery models.
Relevant FMAP considerations for the managed care delivery model include the following:
Since administrative costs are built into the capitated rates, the applicable FMAP rates are the
Medicaid benefits FMAP which vary according to the enrollment and eligibility status of
Medicaid members. For purposes of this analysis, the state share portion was estimated using a
composite factor of 20.23%.22
20 For this calculation, aggregated MCO administrative costs are being allocated equally across both the medical and pharmacy components of the capitated rates using the average administrative cost factor of 8.2% since no further breakdown of MCO administrative costs was available for review. This approach does not account for any cost differential that may be associated exclusively with the administration of the pharmacy benefit versus administration for all benefits combined nor does it account for shifts in overall administrative cost efficiency that may occur if the pharmacy benefit were no longer delivered through MCOs. Under a carve-out model, the assumptions currently used to estimate the administrative cost to be include within the capitation rates may be modified in future rate-setting analyses performed by DMS actuaries.
21 It should be noted that the report prepared by DMS on spread pricing calculated the total estimate of spread pricing for CY 2018 across four of the five PBMs, based on whether MCO and PBM contracts included remuneration through spread pricing.
22 The state share portion was estimated using a composite factor of 20.23% as previously described.

www.myersandstauffer.com page 36
ADDITIONAL FACTORS
IMPACTING A PHARMACY
CARVE-OUT FISCAL IMPACT
Relevant FMAP considerations for the fee-for service delivery model include the following:
Administrative costs incurred for a pharmacy benefits claims administration vendor would be
eligible for a FMAP of 75% for the federal portion and 25% for the state portion.
For DMS internal staff, the FMAP varies based on staffing positions.
Skilled professional medical staff are subject to a FMAP of 75% for the federal portion
and 25% for the state portion.
Information technology staff are subject to a FMAP of either 75% for the federal portion
and 25% for the state portion or, in some cases, 90% for the federal portion and 10% for
the state portion.
Other staff would be subject to a FMAP of 50% for the federal portion and 50% for the
state portion.
For purposes of internal estimates, DMS frequently assumes an aggregate match rate
for DMS staffing of 60% for the federal portion and 40% for the state portion.
To develop a high level estimate of the impact of a pharmacy carve-out model on overall administrative
cost, considering also the impact of varying levels of FMAP, the following calculations were made.
Estimated administrative cost under the managed care delivery model
Estimated administrative cost per claim, inclusive of PBM spread pricing: $10.18; however, in
recognition of the high-level nature of this analysis and the potential limitations of using the
average MCO administrative cost allocation of 8.2 percent, the estimate of MCO administrative
cost, inclusive of PBM spread pricing was conservatively reduced to $7.50 per prescription for
purposes of this analysis.
Estimated administrative cost (inclusive of PBM spread pricing) over annual claims volume of
24.9 million claims (CY 2018): $186.8 million (i.e., $7.50 x 24.9 million = $186.8 million).
Estimated state share of administrative cost: $37.8 million (i.e., $186.8 million x 20.23% = $37.8
million).
Estimated administrative cost under the fee-for-service delivery model
Estimated administrative cost per paid claim for claims administration services: $2.00.
Estimated administrative cost for claims administration services over annual claims volume of
24.9 million claims (CY 2018): $49.8 million (i.e., $2.00 x 24.9 million = 49.8 million).
Estimated state share of administrative cost for claims administration services: $12.5 million
(i.e., $49.8 million x 25% = $12.5 million).

www.myersandstauffer.com page 37
ADDITIONAL FACTORS
IMPACTING A PHARMACY
CARVE-OUT FISCAL IMPACT
Estimated administrative cost per claim for DMS staff supporting Medicaid FFS pharmacy
program: $0.20.
Estimated administrative cost for DMS staff supporting Medicaid FFS pharmacy program over
annual claims volume of 24.9 million claims (CY 2018): $5.0 million (i.e., $0.20 x 24.9 million =
$5.0 million).
Estimated state share of administrative cost for DMS staff supporting Medicaid FFS pharmacy
program: $ 2.0 million (i.e., $5.0 million x 40% = $2.0 million).
Total estimated administrative cost under the fee-for-service model: $54.8 million (i.e., $49.8
million + $5.0 million = $54.8 million).
Total estimated state share of administrative cost under the fee-for-service model: $14.5 million
(i.e., $12.5 million + $2.0 million = $14.5 million).
Estimated savings in administrative cost under the fee-for-service delivery model
Total estimated savings in administrative cost (state and federal share): $132.0 million (i.e.,
$186.8 million - $54.8 million = $132.0 million).
Estimated savings in administrative cost (state share only): $23.3 million (i.e., $37.8 million –
$14.5 million = $23.3 million).
Based on the assumptions incorporated into these estimates, potential total savings of administrative
costs of $132.0 million were calculated with the state share of the savings estimated as $23.3 million.
Given the high-level nature of this analysis, Myers and Stauffer recommends that DMS consult with its
actuaries regarding potential shifts in MCO administrative cost allocations within the capitation rate-
setting process under a carve-out model. Additionally, we recommend that DMS perform a more
comprehensive analysis of the potential changes in administrative cost that would occur within the FFS
pharmacy program under a carve-out model including estimates of costs associated with claims
administration vendors and other contractors and a detailed analysis of internal staffing that DMS would
require to operate a FFS pharmacy program.
Rebates
One concern that has been raised regarding the delivery of pharmacy benefits through the managed
care delivery system is that PDLs created by MCOs and PBMs may not always align with the financial
goals of the Medicaid program at large. Medicaid programs have opportunities for significant savings to
accrue when pharmacy utilization corresponds with the most cost-effective drugs, after considering
sizable rebates that are available through the federal MDRP. Furthermore, the use of multiple PDLs
within the Medicaid managed care and FFS delivery systems create inconsistencies that impact
members and complicate the roles of prescribing practitioners and pharmacies.

www.myersandstauffer.com page 38
ADDITIONAL FACTORS
IMPACTING A PHARMACY
CARVE-OUT FISCAL IMPACT
Overview of the Federal Drug Rebate Program
The MDRP was established by Congress (Title XIX of the Social Security Act) to ensure Medicaid receives
a net price that is consistent with the lowest or best price for which manufacturers sell their drugs to
other statutorily-defined payers. The state Medicaid agency is responsible for paying claims, submitting
invoices to manufacturers, and collecting Medicaid drug rebates for covered outpatient drugs. In
exchange for the rebates, state Medicaid programs must generally cover a participating manufacturer’s
drugs, although they may limit the use of some drugs through drug utilization management tools such as
PDLs, medical necessity reviews, prior authorization (PA) programs, or various other claim edits.
The rebates collected through the MDRP are shared between the federal government and states based
on the state’s current FMAP. The FMAP can vary for different populations (i.e., traditional versus
expansion) and for certain drugs (i.e., family planning and breast/cervical cancer). CMS calculates a unit
rebate amount (URA) for each drug based on a defined formula for that category of drug and provides
this URA to each state. The state then utilizes the CMS- supplied URA and the number of drug units that
it paid for during the rebate period to calculate the rebate invoice amount. The state then submits a
rebate invoice to the manufacturer each quarter.
Rebates are invoiced and collected by the state through a process that is separate from their payments
to pharmacies and other providers billing for covered outpatient drugs.
There are separate rebate formulas for brand drugs versus generic drugs. The base brand rebate rate is
23.1 percent of the average manufacturer price (AMP) per unit. Rebates for certain clotting factor drugs
and drugs approved exclusively for pediatric indications are 17.1 percent of the AMP per unit. The base
generic rebate rate is 13 percent of the AMP per unit. The MDRP is intended to guarantee Medicaid the
lowest net purchase price. The base rebate formula is supplemented by two additional provisions. The
best price component assures that Medicaid pays no more than the lowest price available to any
wholesaler, retailer, provider, or paying entity excluding certain government payers. In addition to the
base rebate and best price provision, a consumer price index (CPI) penalty is added to the calculation to
protect against continual price increases that exceed the CPI for brand and generic drugs. Over recent
years, brand name drug price increases have averaged eight to ten percent per year which emphasizes
the importance of the CPI penalty. Due to the prescribed methodology used in calculating rebates, a
manufacturer can control its rebate liability by virtue of their own pricing policies.
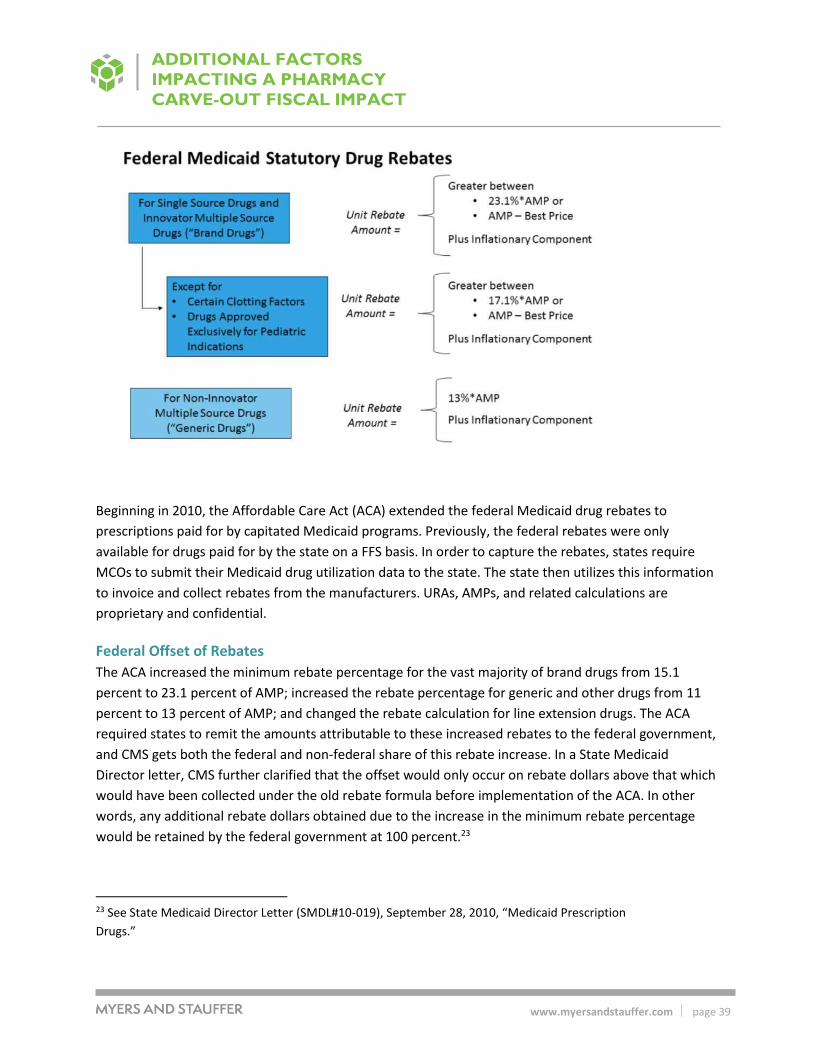
www.myersandstauffer.com page 39
ADDITIONAL FACTORS
IMPACTING A PHARMACY
CARVE-OUT FISCAL IMPACT
Beginning in 2010, the Affordable Care Act (ACA) extended the federal Medicaid drug rebates to
prescriptions paid for by capitated Medicaid programs. Previously, the federal rebates were only
available for drugs paid for by the state on a FFS basis. In order to capture the rebates, states require
MCOs to submit their Medicaid drug utilization data to the state. The state then utilizes this information
to invoice and collect rebates from the manufacturers. URAs, AMPs, and related calculations are
proprietary and confidential.
Federal Offset of Rebates
The ACA increased the minimum rebate percentage for the vast majority of brand drugs from 15.1
percent to 23.1 percent of AMP; increased the rebate percentage for generic and other drugs from 11
percent to 13 percent of AMP; and changed the rebate calculation for line extension drugs. The ACA
required states to remit the amounts attributable to these increased rebates to the federal government,
and CMS gets both the federal and non-federal share of this rebate increase. In a State Medicaid
Director letter, CMS further clarified that the offset would only occur on rebate dollars above that which
would have been collected under the old rebate formula before implementation of the ACA. In other
words, any additional rebate dollars obtained due to the increase in the minimum rebate percentage
would be retained by the federal government at 100 percent.23
23 See State Medicaid Director Letter (SMDL#10-019), September 28, 2010, “Medicaid Prescription
Drugs.”

www.myersandstauffer.com page 40
ADDITIONAL FACTORS
IMPACTING A PHARMACY
CARVE-OUT FISCAL IMPACT
Supplemental Drug Rebate Agreements
Supplemental drug rebates are collected in addition to the statutorily required rebates collected under
the MDRP. A total of 47 Medicaid programs participate in supplemental rebate agreements. Some states
pursue supplemental rebate agreements on their own (single-state) while others join groups of states
(multi-state pools) to increase negotiating power. States negotiate with manufacturers to obtain
supplemental rebates within selected therapeutic classes. Manufacturers offer these supplemental
rebates through a bidding process as an incentive to be selected for a state’s PDL. Preferred drugs on
the PDL are often not subject to PA, which results in increased utilization and market share of the
preferred drugs over their non-preferred counterparts. It should be noted that a supplemental rebate
offer from a manufacturer does not guarantee preferred placement on the PDL.
The supplemental rebate agreements between states and manufacturers are typically established
through a guaranteed net unit price (GNUP) that the manufacturer will provide to the state. The
supplemental rebate is generally calculated by comparing the federal rebate and GNUP to a benchmark
price such as wholesale acquisition cost (WAC). GNUP contracts provide protection to state Medicaid
programs from manufacturer pricing increases throughout the contract period. It is important to note
that the federal rebate is typically responsible for the vast majority of total rebates collected. Often, the
federal rebate satisfies the GNUP contractual requirement by itself.
Overall Rebate Impact
The impact of federal and supplemental rebates within a Medicaid pharmacy program is substantial.
These rebates guarantee that Medicaid programs obtain the lowest net price of any payer. In 2016, the
average federal rebate was 53 percent of gross pharmacy reimbursement. After inclusion of
supplemental rebates, the average total discount ranged from 56 percent to 59 percent of gross
pharmacy reimbursement. In other words, for every dollar spent in the Medicaid pharmacy program, an
estimated 56 percent to 59 percent of that dollar comes back in the form of a federal and/or
supplemental rebate, making Medicaid rebates a critical tool in managing pharmacy expenditures and
their overall impact to state and federal Medicaid budgets.
Potential Impact of a Pharmacy Carve-Out on Rebates within the Kentucky Medicaid Program
DMS recently requested its rebate processing vendor to perform an analysis of the potential amount of
rebates that could be collected under the MDRP as well as for Kentucky-specific supplemental rebates if
the current structure of the multiple PDLs administered by MCOs were shifted to a single PDL (even if
the pharmacy benefit were to still be delivered through MCOs). This analysis provides some insight into
the potential shift in rebates which could occur through a carve-out model, given such a change would
also consolidate all pharmacy benefits under a single PDL.
The analysis performed by DMS’s rebate vendor indicated that shifts in utilization to align with the PDL
currently used within the FFS pharmacy program could increase rebates collected under the MDRP
within the current managed care program from 49.7 percent of total reimbursement to 56.1 percent of

www.myersandstauffer.com page 41
ADDITIONAL FACTORS
IMPACTING A PHARMACY
CARVE-OUT FISCAL IMPACT
total reimbursement. However, in conjunction with this increase, an approximate 19.3 percent increase
in the average amount paid per prescription claim would likely occur. This is the result of the drugs
included in the PDL of the FFS program that are influenced by clinical considerations, as well as the net
cost to DMS after both federal and supplemental rebates are considered. In particular, the impact
between gross cost (i.e., reimbursements to pharmacies) and net cost (i.e., after rebates) may be more
pronounced, as there would be some instances where higher priced products would be preferred over
generic alternatives or other products with lower list prices, in order to secure a more advantageous net
price after rebates.
Considering the results of the analysis performed by the rebate vendor, as well as overall MCO
reimbursement within the MCO encounter data for CY 2018 (i.e., $1.59 billion), the shifts in rebates and
reimbursement that could potentially occur are as follows:
Overall claims payments could potentially increase by approximately $306.3 million. Given the
analysis performed by the rebate vendor for DMS was focused on the impact of a shift to a single
PDL and not a carve-out of the pharmacy benefit into the FFS program, this calculation is based
on the assumption that there would be a continuation of the payment of claims under the same
reimbursement methodology in use under the current delivery system.
Additional MDRP invoicing of $273.3 million in rebates could potentially occur. Of the additional
MDRP invoicing, approximately $41.6 million would be attributable to rebate offset amounts
that would accrue entirely to the federal government.
Additional supplemental rebates of $60.5 million could potentially be invoiced.
In total, DMS could potentially realize a net decrease in cost of approximately $14.1 million
annually due to the ability to collect additional rebates (federal and state share combined; with
the state share portion of this amount estimated at $2.9 million24).
The aforementioned results are based on the rebate vendor’s high level analysis of rebate collection
given utilization trends within FFS claims data as compared to utilization trends within MCO encounter
data. DMS may wish to pursue a more robust analysis to examine the PDL of the current FFS program as
compared to the PDLs of the five MCO pharmacy programs. An analysis of the highest volume
therapeutic classes could be performed in order to determine the therapeutic classes with the greatest
potential for shifts in utilization to occur which may result in enhanced rebate collection. Such an
analysis could be based on more specific utilization patterns under the FFS program and the five MCOs,
and also incorporate the most recent unit rebate amounts (URAs) calculated by CMS.
The analysis could also consider mitigating factors that might be applicable which set practical
limitations on the ability to fully realize a transition of current managed care utilization patterns to those
24 The state share portion was estimated using a composite factor of 20.23% as previously described.

www.myersandstauffer.com page 42
ADDITIONAL FACTORS
IMPACTING A PHARMACY
CARVE-OUT FISCAL IMPACT
of the FFS pharmacy program and its current PDL. Changes to the PDL structures that are in place have
the potential to result in disruption to patient care and access to medications patients are currently
taking. A process of transitioning patients to a new PDL should consider mechanisms to mitigate such
disruption and consider the impact to prescribers and pharmacies regarding therapy conversions and
the PA process. A more robust analysis of this type may lend additional insight into expectations
regarding changes in rebate invoicing and collection that would be realistic under a carve-out model.
Under a managed care delivery system, PBMs under contract to the MCOs are able to negotiate with
manufacturers to receive rebates. Contracts between the Kentucky Medicaid MCOs and PBMs indicate
that either all, or a significant portion, of rebates collected by the PBM for pharmacy claims volume
attributed to Kentucky Medicaid members, is distributed to the MCOs. The actuaries that perform the
capitation rate-setting process for DMS collect information from the MCOs relating to their retained
rebates and use this information as an offset to incurred pharmacy claims in the capitation rate-setting
process. Sufficient data was not available to compare the level of rebates obtained by PBMs on behalf of
Kentucky Medicaid MCOs to compare with the levels of supplemental rebates potentially available
under a carve-out model.
Premium Assessments, Allowance for Profit, and Health Insurance Fees
In the process of setting capitation rates for Kentucky Medicaid MCOs, there are several factors in
addition to anticipated claims cost and administrative costs that are included in the rate-setting process.
These add-ons include the following:
Allowance for the Commonwealth’s premium assessment.
Allowance for a target profit margin.
Allowance for ACA health insurer fees.
According to the actuarial firm that sets capitation rates for the Kentucky Medicaid managed care
program, an allowance of one percent of premium revenue is built into the capitation rates to cover the
Commonwealth’s premium assessment. Additionally, an adjustment of one percent of premium revenue
is allowed for MCOs to realize a target profit margin.25
Under the ACA, health insurers may be assessed a “health insurer fee” (HIF) which is tied to a number of
factors including premium revenue and overall market share. Health insurers must report information
on premiums received to the Internal Revenue Service (IRS), which then makes the determination of the
fee that will be assessed to a given insurer. Although the HIF varies from year to year and has been
subject to a moratorium in some years, to estimate the potential impact of the HIF on the portion of
premiums associated with the pharmacy benefits under the Kentucky Medicaid program, Myers and
25 See “Capitation Rate Development for the Medicaid Managed Care Program for the period January 1, 2018 through June 30, 2018,” prepared by Wakely Consulting Group, December 14, 2017, page 5.

www.myersandstauffer.com page 43
ADDITIONAL FACTORS
IMPACTING A PHARMACY
CARVE-OUT FISCAL IMPACT
Stauffer reviewed the aggregate fee assessed under the ACA for 2018, in addition to net premium
reports to the IRS for 2018. Based on this information, a factor of 2 percent was used as an estimate for
the impact of the HIF.
The combined impact of these add-ons (i.e., premium assessment, target profit margin, and ACA insurer
fees) are equivalent to approximately 4 percent of the portion of MCO premiums associated with the
pharmacy benefit. Using the total reimbursement reported within the MCO encounter data as a proxy
for the portion of capitated rates associated with the pharmacy benefit, the 4 percent allowance is
approximately $63.4 million (4% x $1.5855 billion = $63.4 million) for CY 2018 and would have been
considered in the development of the gross premiums received by MCOs. The state share portion
associated with these factors is estimated as $12.8 million. 26 Under a carve-out model, DMS would not
incur portions of these expenses that are associated with the pharmacy portion of the MCO premiums.27
26 The state share portion was estimated using a composite factor of 20.23% as previously described.
27 Premium assessments paid by MCOs are also revenues to the Commonwealth even if through
another state agency. DMS may wish to consider whether the lack of such expenses would be
considered “savings” that could potentially result from a carve-out of the pharmacy benefit into the
FFS program since a corresponding decrease in Commonwealth revenues would also be a
consequence. Furthermore, to the extent that DMS leverages the inclusion of premium
assessments into the capitation rates paid to MCOs as a means of obtaining additional federal
funds, the removal of the pharmacy benefits portion of the premium assessments could mean a net
loss in funding available to DMS. Additionally, the amount of ACA insurer fees assessed on a
national basis is fixed and allocated across health plans based on reported premium revenue. The
removal of the pharmacy benefit from the Kentucky Medicaid MCOs will not change the overall
amount of the ACA insurer fee on a national basis, but will impact the allocation of those fees to
the respective MCOs.

www.myersandstauffer.com page 44
ADDITIONAL
CONSIDERATIONS
Additional Considerations
Other State Experiences
Several states administer their pharmacy benefit fully through the FFS program either because managed
care programs do not exist within the state, or because the states have carved out the pharmacy
benefit. Notably, several of the states which border Kentucky operate a Medicaid pharmacy carve-out
model (i.e., Missouri, West Virginia, and Tennessee). The other states bordering Kentucky (i.e., Indiana28,
Illinois, Ohio, and Virginia), currently do not. Generally, states which have carved out the pharmacy
benefit have reported successful outcomes and satisfaction. Several states, notably California and
Michigan, have been reported to be considering a pharmacy carve-out or are in the process of
transitioning to a carve-out model.
Potential Stakeholder Concerns
In states leveraging a pharmacy carve-out model or considering doing so, a number of stakeholder
concerns have typically been expressed, particularly by MCOs currently managing the benefit, that
transitioning would result in negative outcomes including increased cost to the Medicaid program and a
degradation in the provision of care to Medicaid members. Additional concerns typically expressed
include the following:
The claim that a carve-out of the pharmacy benefit represents a return to a “siloed” approach to
benefit management as opposed to a “whole person” approach which is realized by the
managed care delivery system. Related to this issue is the claim that a pharmacy carve-out will
create barriers to allowing MCOs to have real-time access to pharmacy utilization data for its
members in order to provide effective care coordination.
The assertion that FFS pharmacy programs are overly focused on “chasing rebates” and,
therefore, less sensitive to up-front opportunities to reduce expenditures through higher
utilization of generic drug products.
The claim that estimates of administrative cost savings that could be realized under a carve-out
model are overstated because much of the administrative structures in place at MCOs to
administer both the medical and pharmacy benefits will necessarily remain in place, despite
removing the pharmacy benefit.
Management of Prescriptions Purchased through the 340B Drug Pricing Program
Consistent application of policies for drugs purchased through the 340B program are complicated within
the MCO paradigm and potentially create lost opportunities for the Medicaid program to realize savings
through collections of rebates. Currently, a DMS payment policy does not exist regarding MCO payment
28 Indiana utilizes a “partial carve-out” model for a limited number of high-cost specialty drugs.

www.myersandstauffer.com page 45
ADDITIONAL
CONSIDERATIONS
for covered outpatient drugs dispensed or administered by 340B covered entities and their contract
pharmacies. This allows the MCOs to establish their own reimbursement policies for 340B dispensed
drugs, which may result in the MCOs paying at, or near, normal market reimbursement rates for these
deeply discounted drugs. While such arrangements may be beneficial to providers (i.e., covered entities)
and potentially to the MCOs and PBMs, DMS is not permitted to collect federal rebates when a 340B
program drug has been dispensed. Therefore, the potential exists for DMS to be overpaying for these
340B drugs (as these 340B drug reimbursements, at near normal market reimbursement rates, are
passed through to the capitation rate-setting process), and also sacrificing the ability to collect
substantial federal rebates.
In contrast, within the FFS pharmacy delivery system, state Medicaid programs are required under CMS-
2345-FC to adopt policies that ensure the Medicaid program benefits (i.e., realizes savings) from
dispensed prescriptions that were eligible for 340B discounts on essentially an equal basis as the
program would benefit from prescriptions dispensed that were not eligible for 340B discounts, but were
eligible for rebates through the MDRP. CMS allows states some flexibility in its reimbursement policy
regarding prescription drugs obtained with 340B discounts. As such, the Commonwealth has adopted a
policy whereby covered entities using 340B drugs for Medicaid members must not bill more than their
340B actual acquisition cost, plus a professional dispensing fee (currently $10.64). In order to simplify
often confusing billing practices, DMS has opted to not allow 340B contract pharmacies to bill for drugs
acquired through the 340B program under the Kentucky Medicaid FFS pharmacy program.
In practice, enforcement of compliance with policies for the reimbursement of drugs purchased through
the 340B program and billed through the FFS program is a challenge, and has been made additionally
difficult due to state Medicaid programs’ lack of access to 340B ceiling price data to use as an upper
bound for testing whether covered entities are properly submitting claims for drugs purchased through
the 340B program. Typically, FFS pharmacy programs must utilize a broad set of tools to enforce policies
relating to drugs purchased through the 340B program including provider education, reasonableness
edits, and audits.
Although there are challenges relating to managing drugs purchased through the 340B program within
the FFS pharmacy delivery system, there is also the potential to realize net savings to the Medicaid
program if the benefit is carved out, given MCOs have no obligation under CMS-2345-FC to limit
reimbursement for 340B drugs and may not have a financial incentive to do so. However, even if
prescriptions for drugs acquired under the 340B program are reimbursed at or near normal market
reimbursement rates, DMS will not be permitted to collect rebates under the MDRP.
As it was beyond the scope of this study, an analysis was not performed to quantify the impact of
potential savings relating to 340B issues if all such claims were under FFS program management.
However, if the pharmacy benefit were carved out, there is the potential for DMS to implement policies
that would allow the Medicaid program to realize additional benefits from the 340B program.

www.myersandstauffer.com page 46
ADDITIONAL
CONSIDERATIONS
Opportunities to Improve Reimbursement Policies with the FFS Pharmacy Program
In repricing MCO prescription claims, Myers and Stauffer noted that there are opportunities for DMS to
improve the reimbursement policies under the FFS program in order to realize further savings. These
opportunities may have lesser significance currently, given the limited size of the FFS program; however,
if the pharmacy benefit were to be carved out, the significantly increased scale of the FFS program
would justify increased attention to potential policy changes that could result in savings to the
Commonwealth. Some of the areas in which DMS might benefit from further evaluation of its current
reimbursement policies for the FFS pharmacy program include the following:
Reimbursement for retail community pharmacies, specialty pharmacies, and institutional
pharmacies is currently heavily dependent on the use of the NADAC, with WAC as a source of
backup pricing. For many specialty pharmaceutical products, the use of WAC may provide
reimbursement that is in excess of provider’s cost to acquire products. Given the dollar value of
these products, surveys of providers of specialty products to determine their actual acquisition
costs could potentially result in a rate that is more appropriate.
The current ingredient reimbursement methodology for hemophilia products is based on ASP
plus 6 percent. Providers’ actual cost to acquire clotting factor products tends to have very little
relationship to published pricing benchmarks including the AWP, WAC, and ASP. Given the dollar
value of these products, surveys of providers of clotting factor products to determine their actual
acquisition costs could potentially result in a rate that is more appropriate.
The chart below reflects observations made during the MCO encounter data repricing analysis regarding
the percentage of claims and percentage of expenditures for which various pricing benchmarks were
primary within the application of the “lesser of” algorithm of the current FFS reimbursement
methodology. While the NADAC benchmark was the predominate pricing benchmark being applied to
claims, the instances in which the WAC was used as a fallback pricing source (approximately 4 percent of
the total claims count) impacted the FFS payment amounts disproportionately (with WAC prices being
used to calculate reimbursement for approximately 16.3 percent of claims expenditures).

www.myersandstauffer.com page 47
ADDITIONAL
CONSIDERATIONS
Figure 3. Pricing Benchmark Coverage by Claims Count and Expenditure
Myers and Stauffer recommends that if the entire pharmacy benefit were to be carved out and
managed under the FFS program, reimbursement policies such as those highlighted here, as well as
others, be evaluated to consider if additional opportunities exist for better management of pharmacy
expenditures. An evaluation of pharmacy reimbursement policies should ideally incorporate principals
of transparency and be based on cost observations obtained from pharmacy providers enrolled in the
Kentucky Medicaid program. In accordance with CMS guidelines included within CMS-2345-FC, a
reasonable professional dispensing fee based on provider’s actual cost should also be evaluated
simultaneous to any proposed adjustments to ingredient reimbursement.

www.myersandstauffer.com page 48
STUDY
LIMITATIONS
Study Limitations
Payments made by DMS for pharmacy benefits currently administered through the managed care
program are based on the pharmacy benefit portion of premiums paid to MCOs. This preliminary
feasibility study of a pharmacy carve-out model has focused on the pricing of prescription claims in MCO
encounter data, which represents payments by the MCOs to their PBMs, and comparing such amounts
to the payment amounts that would have been made to pharmacies under the FFS methodology.
Although the reimbursements included with the MCO encounter data are the most significant
component of cost that impacts the process of setting the capitation rates paid to MCOs, they do not
represent the actual payments currently being made by DMS for pharmacy benefits delivered through
MCOs. Accordingly, comparing the reimbursement within the MCO encounter data to the
reimbursement that would be made under the FFS methodology does not provide a direct comparison
to the change in expenditures that DMS would realize if a carve-out of the pharmacy benefit were to be
implemented.
This study is not intended to be an actuarial analysis that would provide insight into the impact of a
carve-out model on the capitated rates paid to MCOs. Since overall Medicaid expenditures through the
managed care delivery system would drastically change should the pharmacy benefit be carved out, an
actuarial analysis would be necessary to determine the impact on the capitated rates paid to MCOs,
including the impact to current assumptions relating to MCO administrative cost. By removing the
pharmacy benefit from the managed care delivery system, MCOs would have decreased control over the
delivery of benefits and lose some control over one of the tools which are used to manage disease
states. This loss of control correlates with increased risk to the MCOs and may have an impact on
capitation rates under a pharmacy carve-out model. Furthermore, the current capitation rate structure
incorporates elements of risk adjustment. Risk adjustment is applied to the capitation rates on a cost
neutral basis within each rate cell based on category of eligibility and region within the Commonwealth,
such that the MCOs with higher than average member risk scores receive capitation payments above
their contracted rates, and MCOs with lower than average member risk scores receive capitation
payments below their contracted rates. Since the current risk adjustment process is based on risk to the
MCO in terms of both medical and pharmacy benefits, a carve-out of the pharmacy benefit would
necessitate that some changes be made to the current risk adjustment process.
This study relied upon the MCO encounter data for an estimate of the potential fiscal impact of a change
to a carve-out approach to the delivery of pharmacy benefits. Accordingly, the estimate can only be as
accurate as the underlying data permits. MCO encounter data is imported into the Medicaid
management information system (MMIS) operated by DMS after submission by each plan, which in turn
received the source data for prescription claims from the claims reporting systems of their PBM. In these
multiple processes of passing through prescription claims data, data fields from diverse systems

www.myersandstauffer.com page 49
STUDY
LIMITATIONS
eventually are placed in the standardized format available within the MMIS. To the extent that data
fields from foreign systems have differing interpretations than the definitions used with the MMIS data
set, the potential for misinterpretation of data can occur. Myers and Stauffer is relying upon the
standardized MMIS field definitions that were provided by DMS.