community development understanding the rural community · 6/12/14 4 definions o...
TRANSCRIPT
6/12/14
1
Understanding the Rural Community: A Context for Rural Health
Brad Gibbens, MPA, Deputy Director and Assistant Professor
Community Development Pillar
June 3, 2014
• Established in 1980, at The University of North Dakota (UND) School of Medicine and Health Sciences in Grand Forks, ND
• One of the country’s most experienced state rural health offices
• UND Center of Excellence in Research, Scholarship, and CreaQve AcQvity
• Home to seven naQonal programs
• Recipient of the UND Award for Departmental Excellence in Research Focus on
– EducaQng and Informing – Policy – Research and EvaluaQon – Working with CommuniQes – American Indians – Health Workforce – Hospitals and FaciliQes
ruralhealth.und.edu 2
6/12/14
2
3
Session ObjecNves
• Understanding rural communiNes from the perspecNve of a rural context (economics, demographics, poverty, policy)
• Understanding the differences between rural and urban • Understanding the importance of values and beliefs • Understanding that rural communiNes are essenNal to building stronger rural health systems.
An Englishman’s PerspecNve Americans can always be relied upon to do the right thing…aVer they have exhausted all the other possibiliNes. Sir Winston Churchill
6/12/14
3
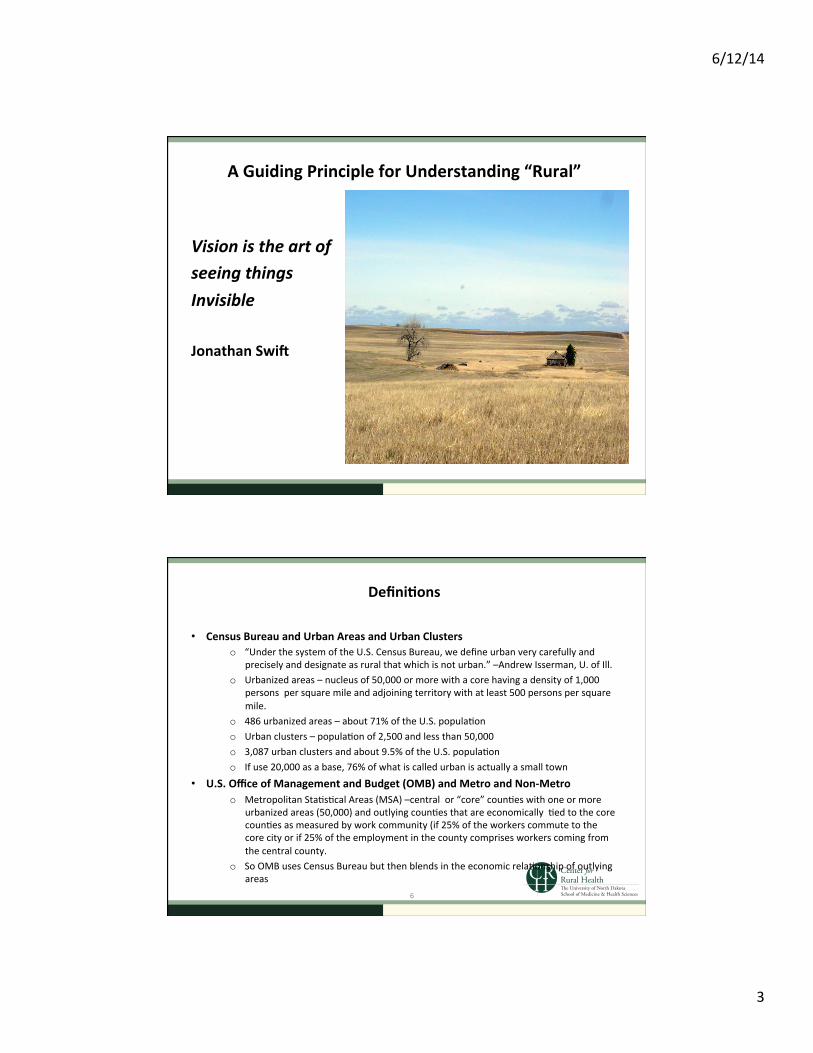
A Guiding Principle for Understanding “Rural”
Vision is the art of seeing things Invisible Jonathan SwiV
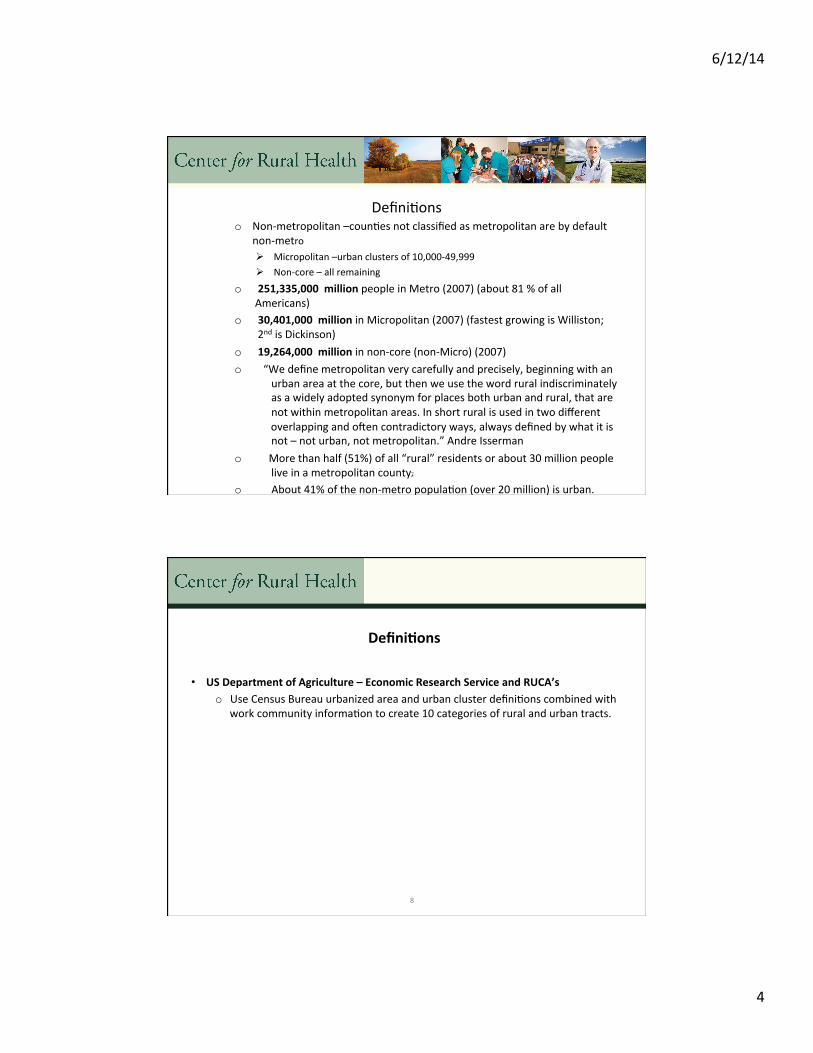
DefiniNons
• Census Bureau and Urban Areas and Urban Clusters o “Under the system of the U.S. Census Bureau, we define urban very carefully and
precisely and designate as rural that which is not urban.” –Andrew Isserman, U. of Ill. o Urbanized areas – nucleus of 50,000 or more with a core having a density of 1,000
persons per square mile and adjoining territory with at least 500 persons per square mile.
o 486 urbanized areas – about 71% of the U.S. populaQon o Urban clusters – populaQon of 2,500 and less than 50,000 o 3,087 urban clusters and about 9.5% of the U.S. populaQon o If use 20,000 as a base, 76% of what is called urban is actually a small town
• U.S. Office of Management and Budget (OMB) and Metro and Non-‐Metro o Metropolitan StaQsQcal Areas (MSA) –central or “core” counQes with one or more
urbanized areas (50,000) and outlying counQes that are economically Qed to the core counQes as measured by work community (if 25% of the workers commute to the core city or if 25% of the employment in the county comprises workers coming from the central county.
o So OMB uses Census Bureau but then blends in the economic relaQonship of outlying areas
6
6/12/14
4
DefiniQons o Non-‐metropolitan –counQes not classified as metropolitan are by default
non-‐metro Ø Micropolitan –urban clusters of 10,000-‐49,999 Ø Non-‐core – all remaining
o 251,335,000 million people in Metro (2007) (about 81 % of all Americans)
o 30,401,000 million in Micropolitan (2007) (fastest growing is Williston; 2nd is Dickinson)
o 19,264,000 million in non-‐core (non-‐Micro) (2007) o “We define metropolitan very carefully and precisely, beginning with an urban area at the core, but then we use the word rural indiscriminately as a widely adopted synonym for places both urban and rural, that are not within metropolitan areas. In short rural is used in two different overlapping and ohen contradictory ways, always defined by what it is not – not urban, not metropolitan.” Andre Isserman
o More than half (51%) of all “rural” residents or about 30 million people live in a metropolitan county.
o About 41% of the non-‐metro populaQon (over 20 million) is urban. 7
8
DefiniNons
• US Department of Agriculture – Economic Research Service and RUCA’s o Use Census Bureau urbanized area and urban cluster definiQons combined with
work community informaQon to create 10 categories of rural and urban tracts.
6/12/14
5
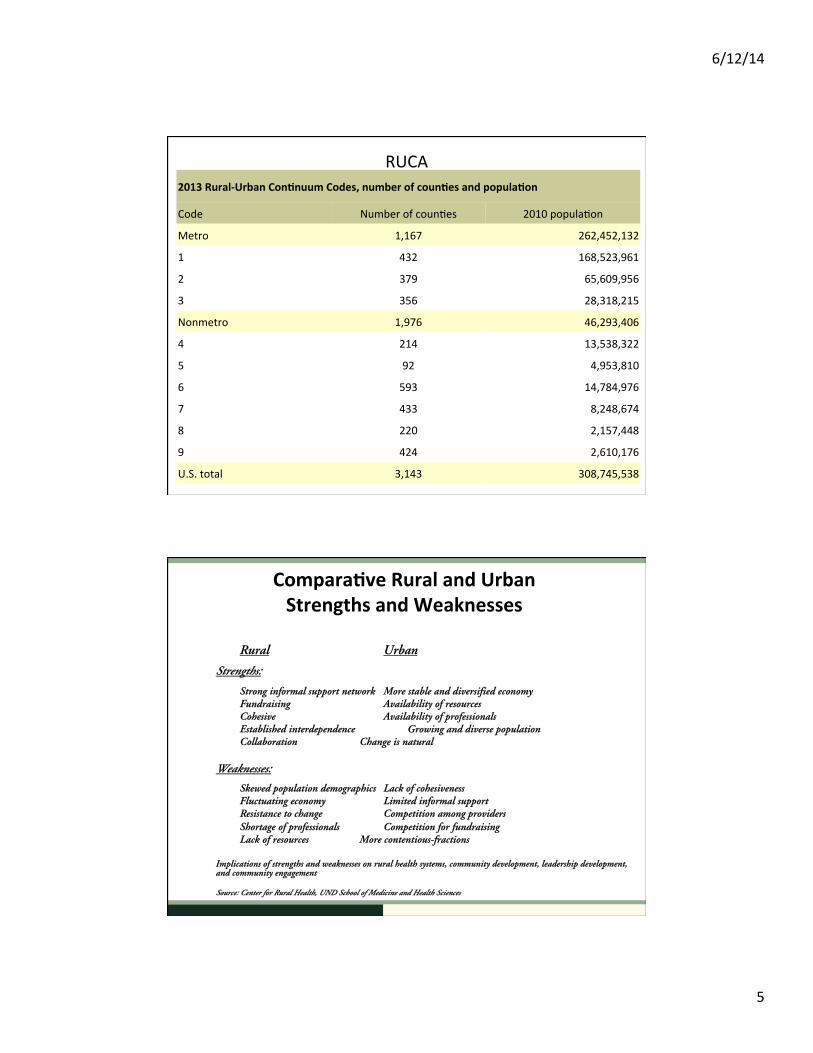
RUCA
9
2013 Rural-‐Urban ConNnuum Codes, number of counNes and populaNon
Code Number of counQes 2010 populaQon
Metro 1,167 262,452,132
1 432 168,523,961
2 379 65,609,956
3 356 28,318,215
Nonmetro 1,976 46,293,406
4 214 13,538,322
5 92 4,953,810
6 593 14,784,976
7 433 8,248,674
8 220 2,157,448
9 424 2,610,176
U.S. total 3,143 308,745,538
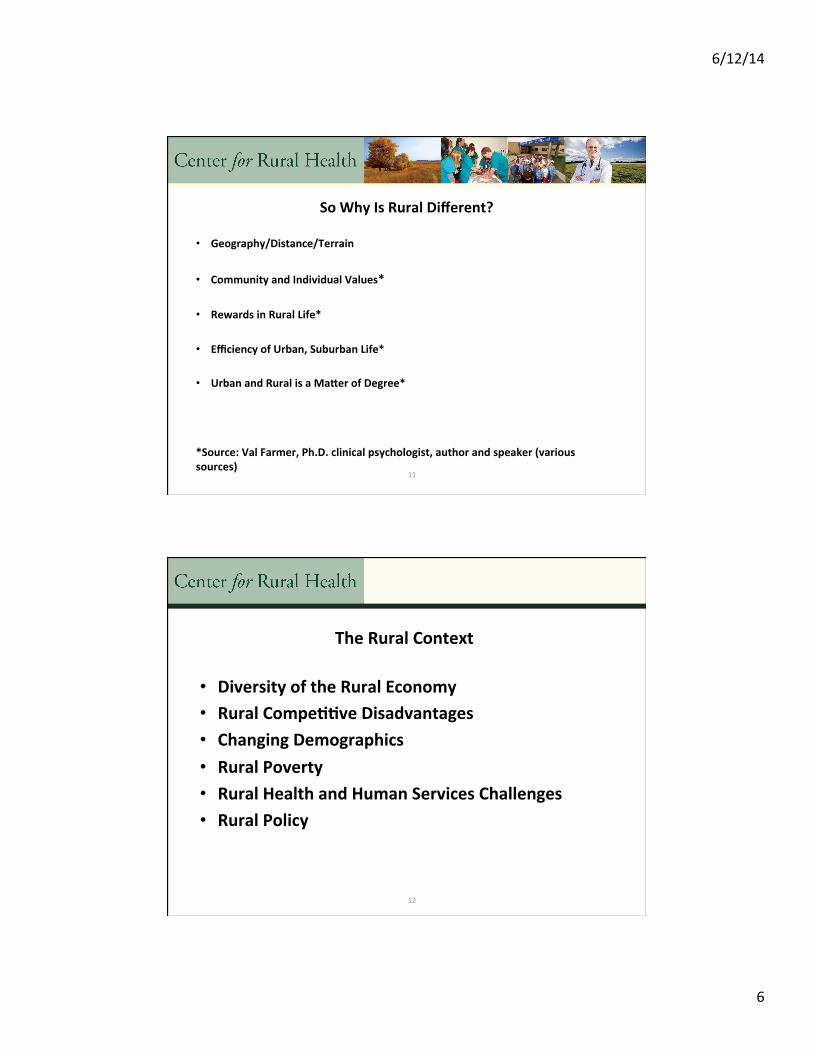
ComparaNve Rural and Urban Strengths and Weaknesses
Rural Urban
Strengths:
Strong informal support network More stable and diversified economy Fundraising Availability of resources Cohesive Availability of professionals Established interdependence Growing and diverse population Collaboration Change is natural
Weaknesses:
Skewed population demographics Lack of cohesiveness Fluctuating economy Limited informal support Resistance to change Competition among providers Shortage of professionals Competition for fundraising Lack of resources More contentious-fractions
Implications of strengths and weaknesses on rural health systems, community development, leadership development, and community engagement Source: Center for Rural Health, UND School of Medicine and Health Sciences
6/12/14
6
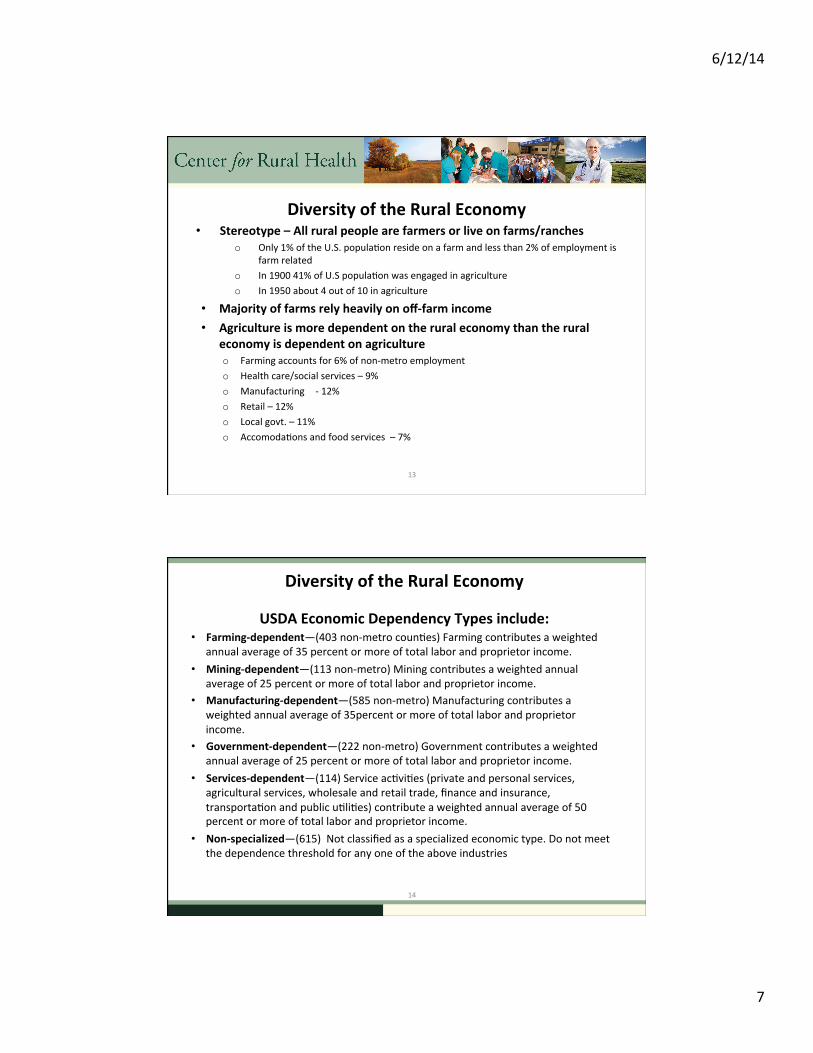
So Why Is Rural Different?
• Geography/Distance/Terrain • Community and Individual Values* • Rewards in Rural Life* • Efficiency of Urban, Suburban Life* • Urban and Rural is a Majer of Degree* *Source: Val Farmer, Ph.D. clinical psychologist, author and speaker (various sources)
11
12
The Rural Context
• Diversity of the Rural Economy • Rural CompeNNve Disadvantages • Changing Demographics • Rural Poverty • Rural Health and Human Services Challenges • Rural Policy
6/12/14
7
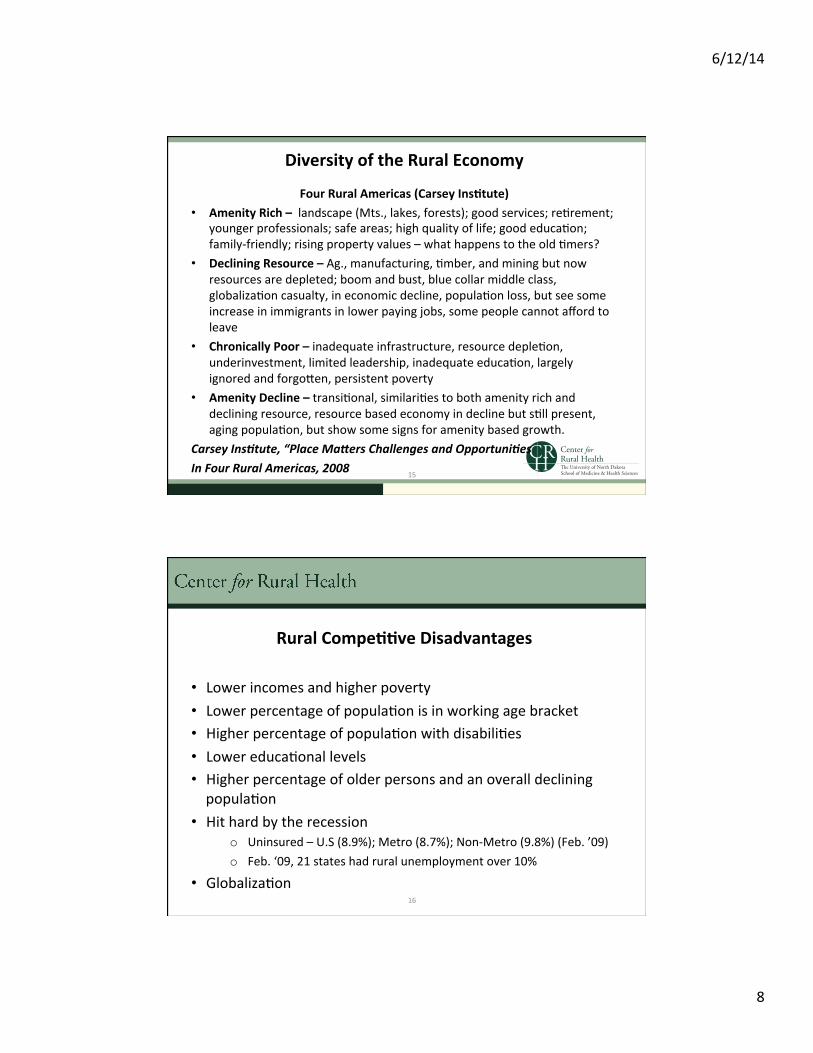
Diversity of the Rural Economy • Stereotype – All rural people are farmers or live on farms/ranches
o Only 1% of the U.S. populaQon reside on a farm and less than 2% of employment is farm related
o In 1900 41% of U.S populaQon was engaged in agriculture o In 1950 about 4 out of 10 in agriculture
• Majority of farms rely heavily on off-‐farm income • Agriculture is more dependent on the rural economy than the rural
economy is dependent on agriculture o Farming accounts for 6% of non-‐metro employment o Health care/social services – 9% o Manufacturing -‐ 12% o Retail – 12% o Local govt. – 11% o AccomodaQons and food services – 7%
13
Diversity of the Rural Economy
USDA Economic Dependency Types include: • Farming-‐dependent—(403 non-‐metro counQes) Farming contributes a weighted
annual average of 35 percent or more of total labor and proprietor income. • Mining-‐dependent—(113 non-‐metro) Mining contributes a weighted annual
average of 25 percent or more of total labor and proprietor income. • Manufacturing-‐dependent—(585 non-‐metro) Manufacturing contributes a
weighted annual average of 35percent or more of total labor and proprietor income.
• Government-‐dependent—(222 non-‐metro) Government contributes a weighted annual average of 25 percent or more of total labor and proprietor income.
• Services-‐dependent—(114) Service acQviQes (private and personal services, agricultural services, wholesale and retail trade, finance and insurance, transportaQon and public uQliQes) contribute a weighted annual average of 50 percent or more of total labor and proprietor income.
• Non-‐specialized—(615) Not classified as a specialized economic type. Do not meet the dependence threshold for any one of the above industries
14
6/12/14
8
Diversity of the Rural Economy
Four Rural Americas (Carsey InsNtute) • Amenity Rich – landscape (Mts., lakes, forests); good services; reQrement;
younger professionals; safe areas; high quality of life; good educaQon; family-‐friendly; rising property values – what happens to the old Qmers?
• Declining Resource – Ag., manufacturing, Qmber, and mining but now resources are depleted; boom and bust, blue collar middle class, globalizaQon casualty, in economic decline, populaQon loss, but see some increase in immigrants in lower paying jobs, some people cannot afford to leave
• Chronically Poor – inadequate infrastructure, resource depleQon, underinvestment, limited leadership, inadequate educaQon, largely ignored and forgolen, persistent poverty
• Amenity Decline – transiQonal, similariQes to both amenity rich and declining resource, resource based economy in decline but sQll present, aging populaQon, but show some signs for amenity based growth.
Carsey Ins8tute, “Place Ma=ers Challenges and Opportuni8es In Four Rural Americas, 2008 15
16
Rural CompeNNve Disadvantages
• Lower incomes and higher poverty • Lower percentage of populaQon is in working age bracket • Higher percentage of populaQon with disabiliQes • Lower educaQonal levels • Higher percentage of older persons and an overall declining populaQon
• Hit hard by the recession o Uninsured – U.S (8.9%); Metro (8.7%); Non-‐Metro (9.8%) (Feb. ’09) o Feb. ‘09, 21 states had rural unemployment over 10%
• GlobalizaQon
6/12/14
9
17
Rural CompeNNve Disadvantages
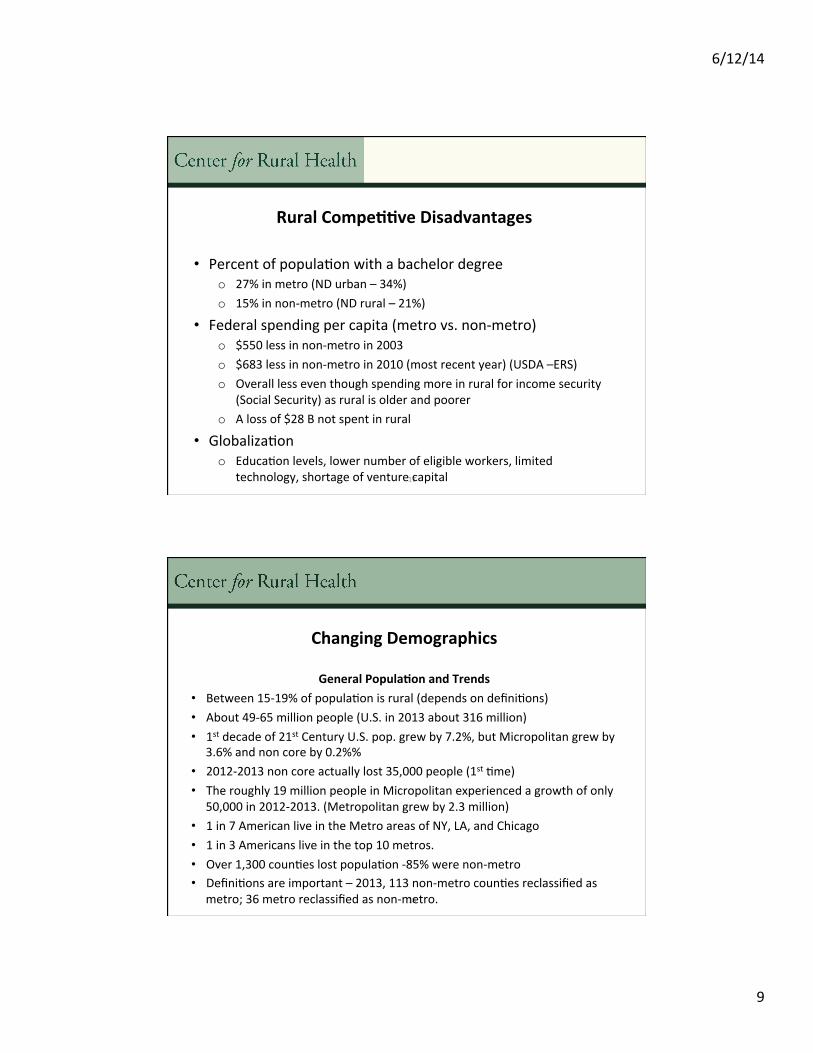
• Percent of populaQon with a bachelor degree o 27% in metro (ND urban – 34%) o 15% in non-‐metro (ND rural – 21%)
• Federal spending per capita (metro vs. non-‐metro) o $550 less in non-‐metro in 2003 o $683 less in non-‐metro in 2010 (most recent year) (USDA –ERS) o Overall less even though spending more in rural for income security
(Social Security) as rural is older and poorer o A loss of $28 B not spent in rural
• GlobalizaQon o EducaQon levels, lower number of eligible workers, limited
technology, shortage of venture capital
18
Changing Demographics
General PopulaNon and Trends • Between 15-‐19% of populaQon is rural (depends on definiQons) • About 49-‐65 million people (U.S. in 2013 about 316 million) • 1st decade of 21st Century U.S. pop. grew by 7.2%, but Micropolitan grew by
3.6% and non core by 0.2%% • 2012-‐2013 non core actually lost 35,000 people (1st Qme) • The roughly 19 million people in Micropolitan experienced a growth of only
50,000 in 2012-‐2013. (Metropolitan grew by 2.3 million) • 1 in 7 American live in the Metro areas of NY, LA, and Chicago • 1 in 3 Americans live in the top 10 metros. • Over 1,300 counQes lost populaQon -‐85% were non-‐metro • DefiniQons are important – 2013, 113 non-‐metro counQes reclassified as
metro; 36 metro reclassified as non-‐metro.
6/12/14
10
19
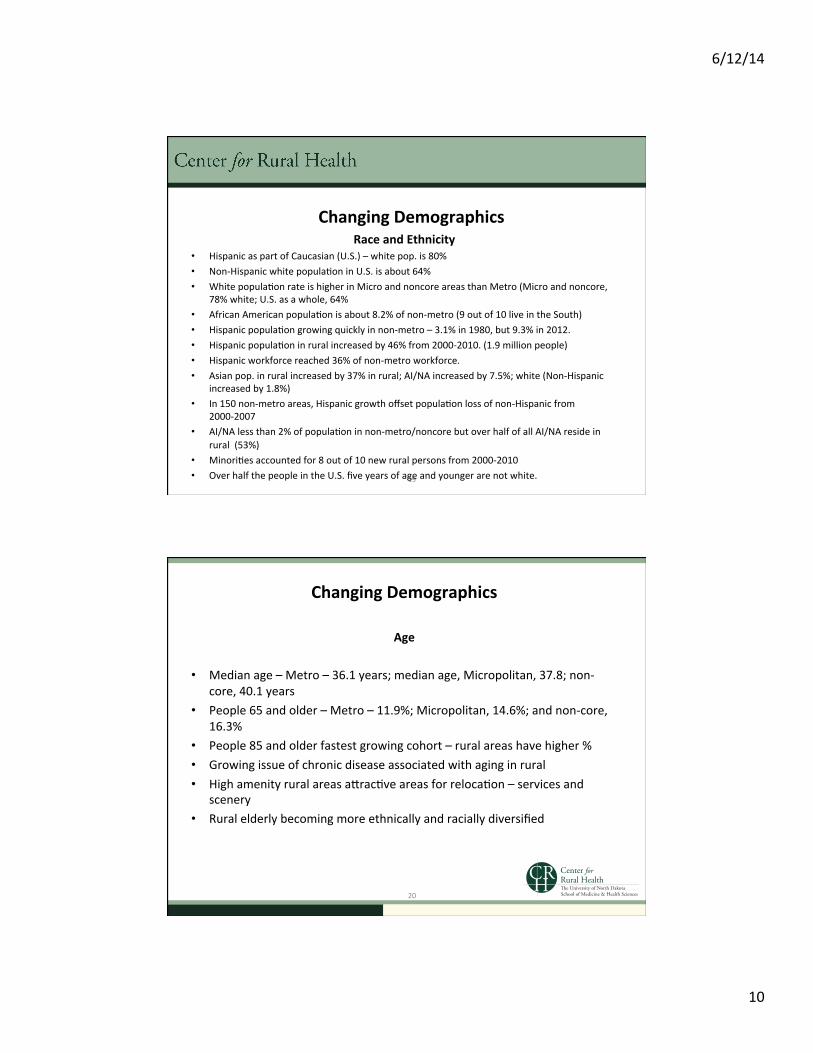
Changing Demographics Race and Ethnicity
• Hispanic as part of Caucasian (U.S.) – white pop. is 80% • Non-‐Hispanic white populaQon in U.S. is about 64% • White populaQon rate is higher in Micro and noncore areas than Metro (Micro and noncore,
78% white; U.S. as a whole, 64% • African American populaQon is about 8.2% of non-‐metro (9 out of 10 live in the South) • Hispanic populaQon growing quickly in non-‐metro – 3.1% in 1980, but 9.3% in 2012. • Hispanic populaQon in rural increased by 46% from 2000-‐2010. (1.9 million people) • Hispanic workforce reached 36% of non-‐metro workforce. • Asian pop. in rural increased by 37% in rural; AI/NA increased by 7.5%; white (Non-‐Hispanic
increased by 1.8%) • In 150 non-‐metro areas, Hispanic growth offset populaQon loss of non-‐Hispanic from
2000-‐2007 • AI/NA less than 2% of populaQon in non-‐metro/noncore but over half of all AI/NA reside in
rural (53%) • MinoriQes accounted for 8 out of 10 new rural persons from 2000-‐2010 • Over half the people in the U.S. five years of age and younger are not white.
Changing Demographics
Age
• Median age – Metro – 36.1 years; median age, Micropolitan, 37.8; non-‐core, 40.1 years
• People 65 and older – Metro – 11.9%; Micropolitan, 14.6%; and non-‐core, 16.3%
• People 85 and older fastest growing cohort – rural areas have higher % • Growing issue of chronic disease associated with aging in rural • High amenity rural areas alracQve areas for relocaQon – services and
scenery • Rural elderly becoming more ethnically and racially diversified
20
6/12/14
11
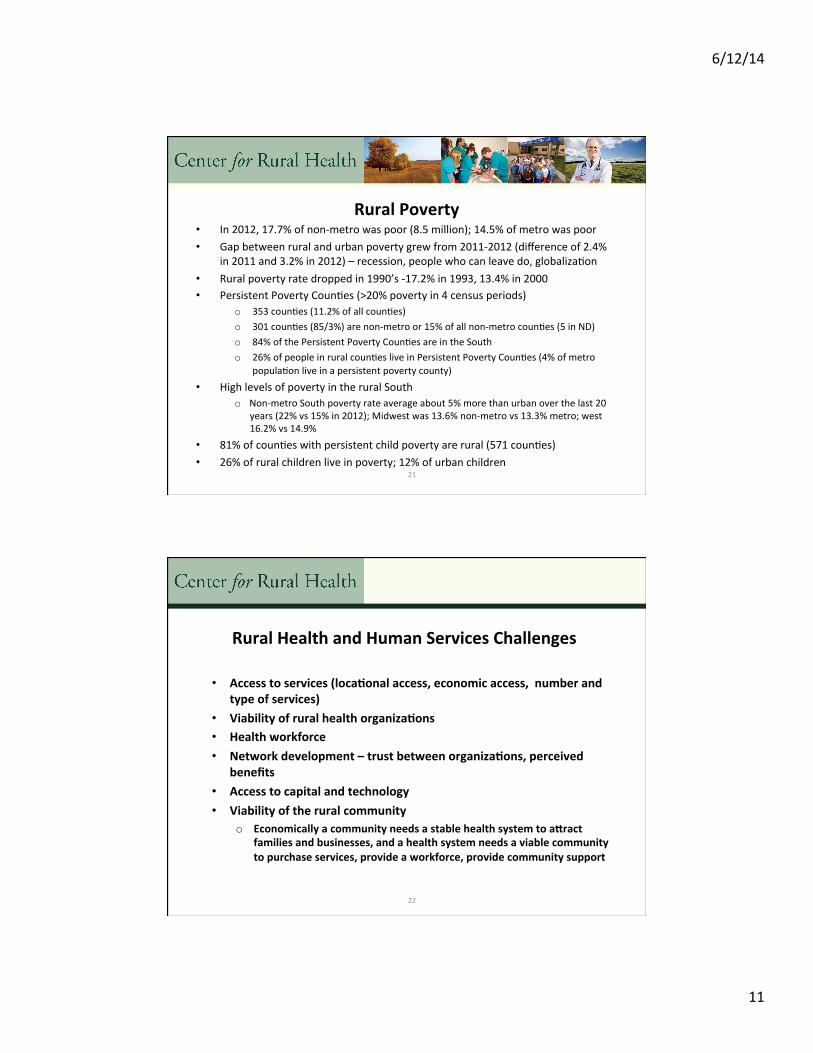
Rural Poverty • In 2012, 17.7% of non-‐metro was poor (8.5 million); 14.5% of metro was poor • Gap between rural and urban poverty grew from 2011-‐2012 (difference of 2.4%
in 2011 and 3.2% in 2012) – recession, people who can leave do, globalizaQon • Rural poverty rate dropped in 1990’s -‐17.2% in 1993, 13.4% in 2000 • Persistent Poverty CounQes (>20% poverty in 4 census periods)
o 353 counQes (11.2% of all counQes) o 301 counQes (85/3%) are non-‐metro or 15% of all non-‐metro counQes (5 in ND) o 84% of the Persistent Poverty CounQes are in the South o 26% of people in rural counQes live in Persistent Poverty CounQes (4% of metro
populaQon live in a persistent poverty county) • High levels of poverty in the rural South
o Non-‐metro South poverty rate average about 5% more than urban over the last 20 years (22% vs 15% in 2012); Midwest was 13.6% non-‐metro vs 13.3% metro; west 16.2% vs 14.9%
• 81% of counQes with persistent child poverty are rural (571 counQes) • 26% of rural children live in poverty; 12% of urban children
21
22
Rural Health and Human Services Challenges
• Access to services (locaNonal access, economic access, number and type of services)
• Viability of rural health organizaNons • Health workforce • Network development – trust between organizaNons, perceived
benefits • Access to capital and technology • Viability of the rural community
o Economically a community needs a stable health system to ajract families and businesses, and a health system needs a viable community to purchase services, provide a workforce, provide community support
6/12/14
12
23
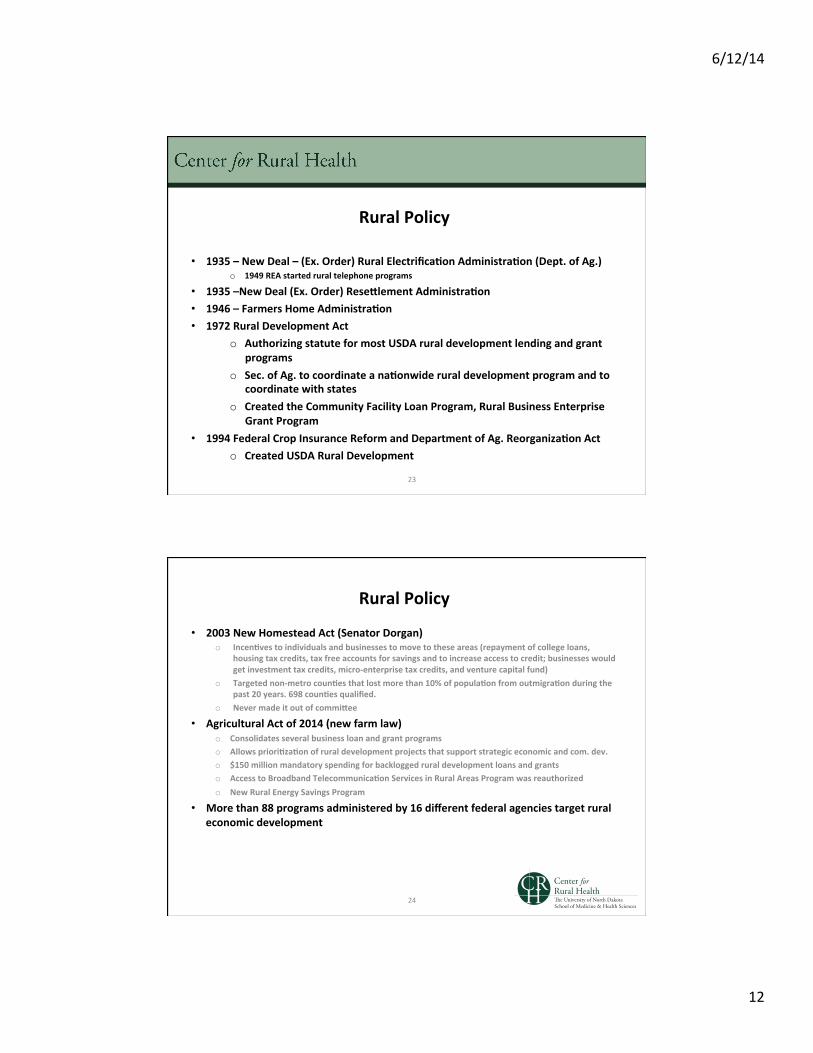
Rural Policy
• 1935 – New Deal – (Ex. Order) Rural ElectrificaNon AdministraNon (Dept. of Ag.) o 1949 REA started rural telephone programs
• 1935 –New Deal (Ex. Order) Resejlement AdministraNon • 1946 – Farmers Home AdministraNon • 1972 Rural Development Act
o Authorizing statute for most USDA rural development lending and grant programs
o Sec. of Ag. to coordinate a naNonwide rural development program and to coordinate with states
o Created the Community Facility Loan Program, Rural Business Enterprise Grant Program
• 1994 Federal Crop Insurance Reform and Department of Ag. ReorganizaNon Act o Created USDA Rural Development
• 2003 New Homestead Act (Senator Dorgan) o IncenNves to individuals and businesses to move to these areas (repayment of college loans,
housing tax credits, tax free accounts for savings and to increase access to credit; businesses would get investment tax credits, micro-‐enterprise tax credits, and venture capital fund)
o Targeted non-‐metro counNes that lost more than 10% of populaNon from outmigraNon during the past 20 years. 698 counNes qualified.
o Never made it out of commijee
• Agricultural Act of 2014 (new farm law) o Consolidates several business loan and grant programs o Allows prioriNzaNon of rural development projects that support strategic economic and com. dev. o $150 million mandatory spending for backlogged rural development loans and grants o Access to Broadband TelecommunicaNon Services in Rural Areas Program was reauthorized o New Rural Energy Savings Program
• More than 88 programs administered by 16 different federal agencies target rural economic development
Rural Policy
24
6/12/14
13
25
Rural Policy
“Culture eventually trumps everything. The ‘rural’ aura which once blessed American Agriculture has dimmed. We are in dire need of the engaging new rural metaphor, which should be centered within the following realiQes: “ • Growth • Prosperity • Security • Resilience and Risk Management • Equity Chuck Fluharty, President and CEO of RURPI (May 2013)Gerng Our Story Straight: Rural Facts in Search of the ‘Grand NarraQve
26
New Focus for Rural Policy
• Acknowledge current agriculture policy has many goals, but has failed to adequately assure broad-‐based rural economic growth
• Build innovaNve new regional approaches for global compeNNon • Support necessary insNtuNonal innovaNon
Source: Chuck Fulharty
6/12/14
14
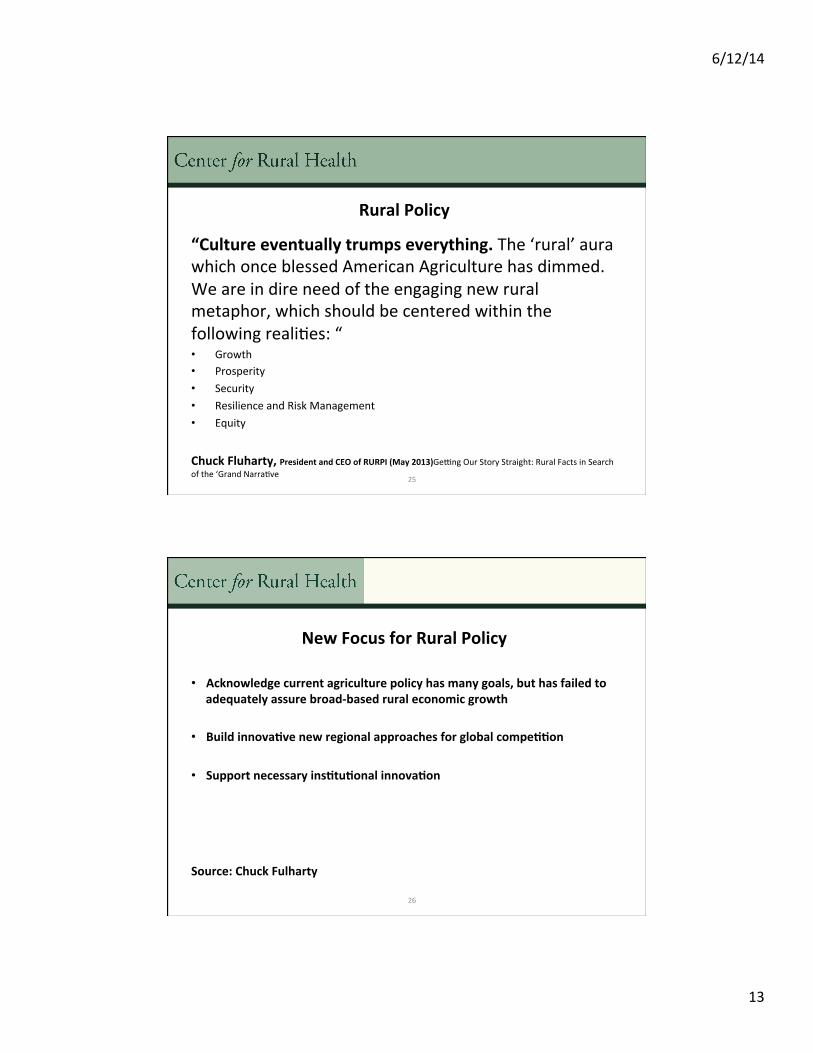
Rural Community Change Model
27
Environmental CondiQons • Demographics • Economics • Policy • Health Status • Workforce • Finance • Technology • Health System Change • Rural Community Culture
& Dynamics
Impact on Community or Health OrganizaQon • Threat to survival • Growth/Decline • IdenQty • PercepQon toward change • PercepQon toward opportunity • How we respond
Community AcQon and Engagement • What do people think, want, or need?
• Assessments • Forums-‐Discussions • Interviews
• Community Ownership (not health system ownership) • CollaboraQon • Inclusion • ParQcipaQon • Interdependence
• Community Capacity • Skills and knowledge • Leadership development • Planning and advocacy • Manage change – non reacQve
Source: Brad Gibbens, Deputy Director UND Center for Rural Health
501 North Columbia Road, Stop 9037 Grand Forks, North Dakota 58202-‐9037 701.777.3848 • ruralhealth.und.edu
Contact us for more information!
28