comparative evaluation of artificial lift ...1)/2016(7.1-01).pdftable 1. artificial lifts methods...
TRANSCRIPT
Academic Research International Vol. 7(1) January 2016
____________________________________________________________________________________________________________________________________________________________________________________________________________________________________________________________________________________________________________
Copyright © 2016 SAVAP International ISSN: 2223-9944, e ISSN: 2223-9553
www.savap.org.pk 1 www.journals.savap.org.pk
COMPARATIVE EVALUATION OF ARTIFICIAL LIFT METHODS
ON A NIGER DELTA FIELD
Okologume Chinedu Wilfred1, Ofesi Samuel F.
2
1, 2Department of Petroleum and Natural Gas Engineering,
Federal University of Petroleum Resources, Effurun, Delta State, NIGERIA.
ABSTRACT
During the reservoir production life reservoir pressure will decline. Also after water
breakthrough the fluid column weight will increase as hydrostatic pressure will
increase because of increased water and oil mixture density. In this case, reservoir pressure may not be enough to lift up the fluid from bottom to the surface. These
reasons decrease or even may cause to stop flowing of fluids from the well. Some
techniques must be applied to prevent the production decline. Artificial lift system technologies are used to augment fluid production from the reservoir. These fall into
several categories depending on the operating principle, design and energy source.
Artificial lift techniques are applied to add energy to the produced fluids. Artificial
lift as a system of adding energy to the fluid column in a wellbore to initiate and enhance production from the well is necessary when reservoir drives do not sustain
acceptable rates or cause fluids to flow at all in some cases; which use a range of
operating principles, including pumping and gas lifting. The reliability of the production forecast is dependent on the reservoir pressure, and mostly the water cut.
A small change in water cut gives a large change in oil production. This study uses a
simulation based model of the PIPESIM artificial lift method based on operating limits of each artificial lift technique to present suitable artificial lift type regarding
application conditions for a hypothetical well on a Niger Delta field. The results from
the developed simulation based model shows that the ESP solution gives a superior
production rate compared to gas lift and the “base case”.
Keywords: Artificial Lift, Production, Downhole, Water cut, Fluid flow, ESP,
Gas lift
INTRODUCTION
The production of crude oil in oil reservoirs can include up to three distinct phases; primary,
secondary, and tertiary recovery. Fluids will flow from reservoir to the surface when the well
is completed and reservoir pressure is sufficient to receive fluid from matrix, transport it to
the wellbore and lift to the surface. During primary recovery, the reservoir’s natural pressure,
combined with pumping equipment, brings oil to the surface. During the reservoir production
life reservoir pressure will decline and this could cause increase in water cut and decrease in
gas fraction (Clegg, 1988). These reasons decrease or even may cause to stop flowing of
fluids from the well. Some techniques must be applied to prevent the production decline.
Before artificial lift application the wells were being produced only naturally. Therefore,
most of the brown fields were abandoned as reservoir pressure depleted. Because wells were
produced under the natural flow regime and there wasn’t any additional energy to the well as
bottom-hole pressure decreased. Additional energy source must be added to the well in order
to lift up the fluid to the surface. In these cases, artificial lift techniques are applied to add
energy to the produced fluids. Artificial lift is used in petroleum production when the energy
Academic Research International Vol. 7(1) January 2016
____________________________________________________________________________________________________________________________________________________________________________________________________________________________________________________________________________________________________________
Copyright © 2016 SAVAP International ISSN: 2223-9944, e ISSN: 2223-9553
www.savap.org.pk 2 www.journals.savap.org.pk
of the reservoir is not enough to sustain the flow of oil in the well up to the surface with
satisfactory economic return. Artificial lift allows wells that are non-flowing or insufficiently
flowing to be produced (Saepudin et al., 2007). It is mainly designed for oil producers but the
technology can also be applied to wells that produce water for a number of different uses
such as for utilities or water injection to maintain pressure. It may prove necessary from the
beginning of production for oil wells when the reservoir does not have enough energy to lift
the fluid to the surface process facilities or when the productivity index is deemed
inadequate.
ARTIFICIAL LIFT LITERATURE SURVEY
Artificial lift methods fall into two groups as presented in table 1 below. Those that use
pumps and those that uses gas.
Table 1. Artificial Lifts Methods Group
Pump Types Gas Method
Beam Pump / Sucker Rod Pumps (Rod Lift) Gas Lift
Progressive Cavity Pumps (Jet /piston lift)
Subsurface Hydraulic Pumps
Electric Submersible Pumps (ESP)
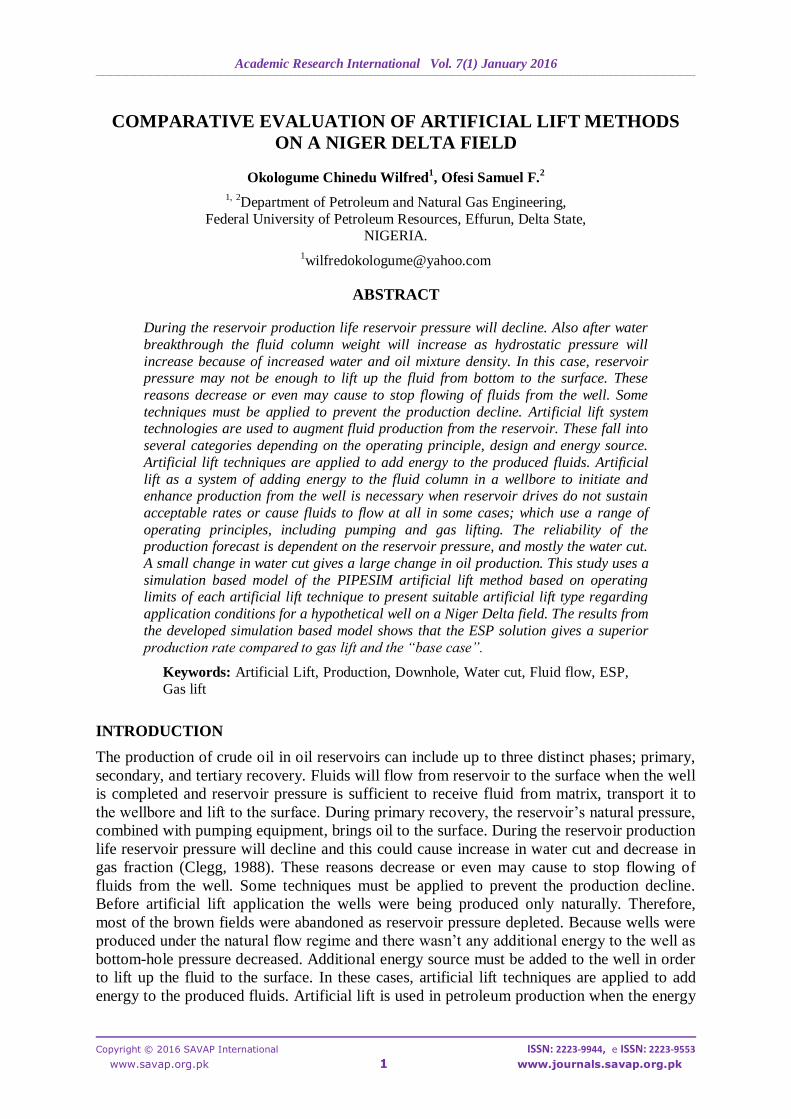
Maximizing the use of natural energy in a reservoir is critical to any production installation.
In a naturally flowing well there is enough energy stored in the reservoir to flow the produced
fluid to the surface. Reservoir pressure and formation gas provide this energy in the flowing
well. When reservoir energy is too low for natural flow, or when the desired production rate
is greater than the reservoir energy can deliver, it becomes necessary to put the well on some
form of artificial lift. It is estimated that 95% of the world’s oil wells are on some form of
artificial lift (Mathew, 2013).
Figure 1: Artificial Lift Market Share by Type
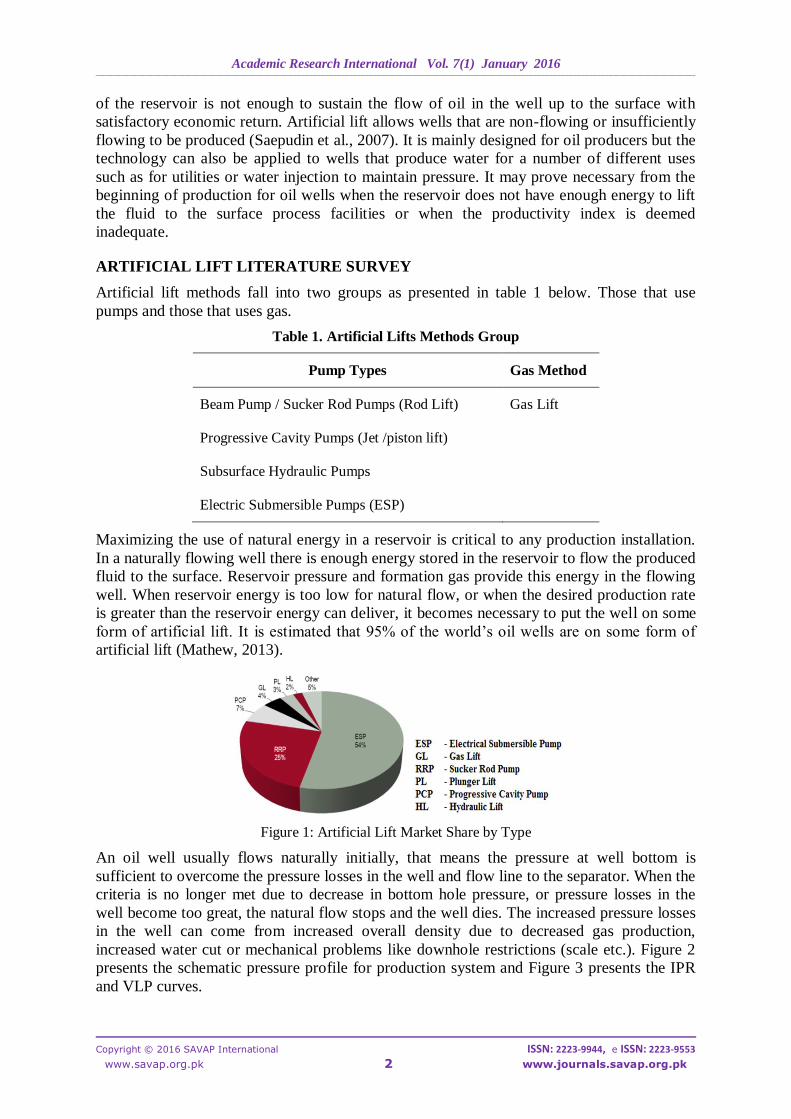
An oil well usually flows naturally initially, that means the pressure at well bottom is
sufficient to overcome the pressure losses in the well and flow line to the separator. When the
criteria is no longer met due to decrease in bottom hole pressure, or pressure losses in the
well become too great, the natural flow stops and the well dies. The increased pressure losses
in the well can come from increased overall density due to decreased gas production,
increased water cut or mechanical problems like downhole restrictions (scale etc.). Figure 2
presents the schematic pressure profile for production system and Figure 3 presents the IPR
and VLP curves.
Academic Research International Vol. 7(1) January 2016
____________________________________________________________________________________________________________________________________________________________________________________________________________________________________________________________________________________________________________
Copyright © 2016 SAVAP International ISSN: 2223-9944, e ISSN: 2223-9553
www.savap.org.pk 3 www.journals.savap.org.pk
Figure 2: Schematic Pressure Profile for Production System (Source: HWU)
Figure 3: IPR curve Operating point (intersection between IPR and VLP curves)
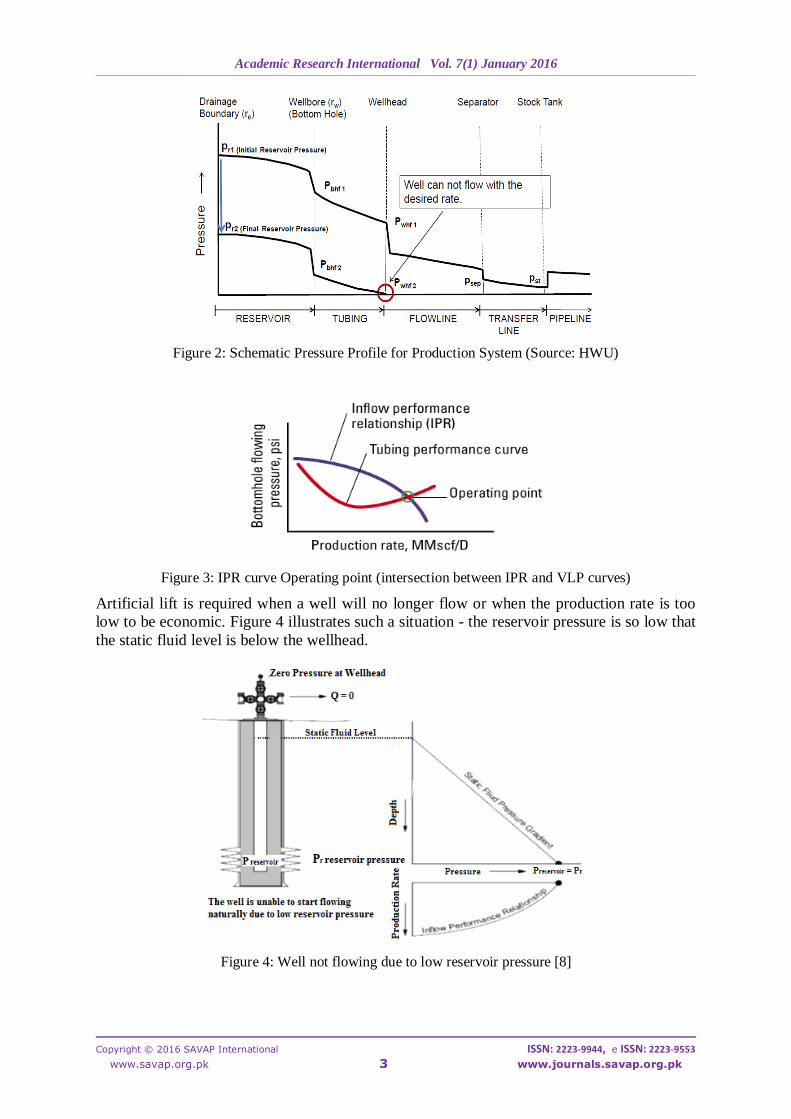
Artificial lift is required when a well will no longer flow or when the production rate is too
low to be economic. Figure 4 illustrates such a situation - the reservoir pressure is so low that
the static fluid level is below the wellhead.
Figure 4: Well not flowing due to low reservoir pressure [8]
Academic Research International Vol. 7(1) January 2016
____________________________________________________________________________________________________________________________________________________________________________________________________________________________________________________________________________________________________________
Copyright © 2016 SAVAP International ISSN: 2223-9944, e ISSN: 2223-9553
www.savap.org.pk 4 www.journals.savap.org.pk
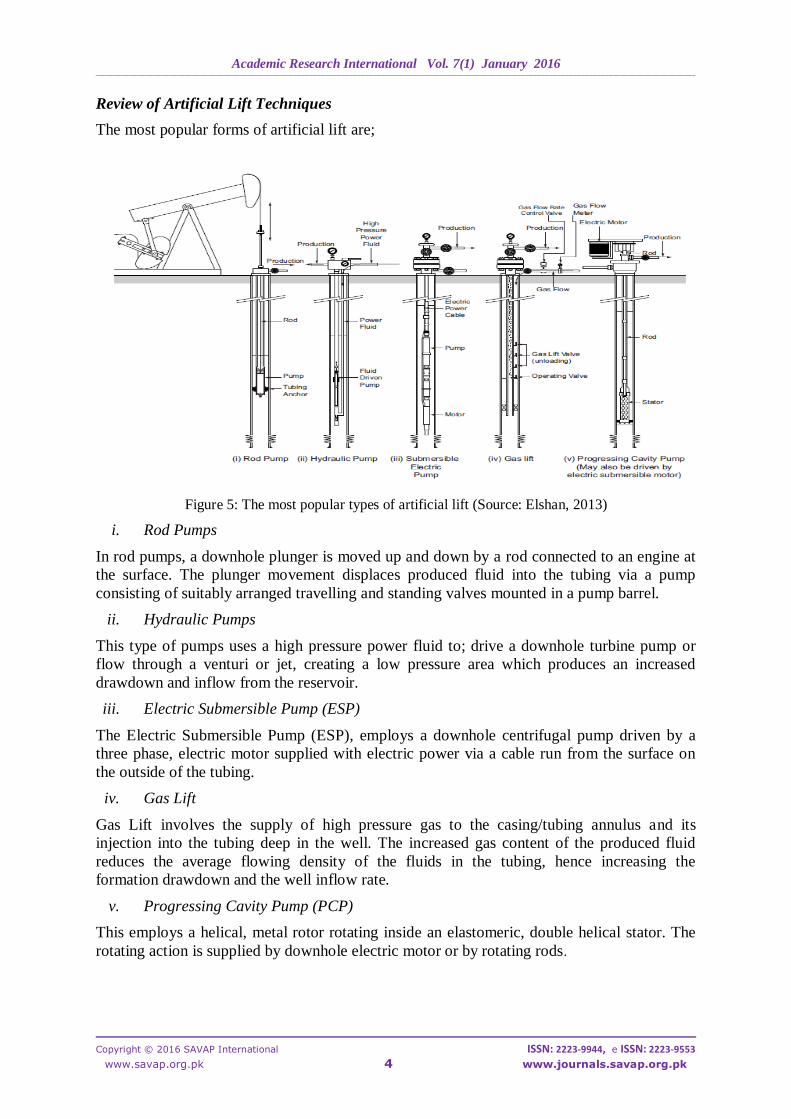
Review of Artificial Lift Techniques
The most popular forms of artificial lift are;
Figure 5: The most popular types of artificial lift (Source: Elshan, 2013)
i. Rod Pumps
In rod pumps, a downhole plunger is moved up and down by a rod connected to an engine at
the surface. The plunger movement displaces produced fluid into the tubing via a pump
consisting of suitably arranged travelling and standing valves mounted in a pump barrel.
ii. Hydraulic Pumps
This type of pumps uses a high pressure power fluid to; drive a downhole turbine pump or
flow through a venturi or jet, creating a low pressure area which produces an increased
drawdown and inflow from the reservoir.
iii. Electric Submersible Pump (ESP)
The Electric Submersible Pump (ESP), employs a downhole centrifugal pump driven by a
three phase, electric motor supplied with electric power via a cable run from the surface on
the outside of the tubing.
iv. Gas Lift
Gas Lift involves the supply of high pressure gas to the casing/tubing annulus and its
injection into the tubing deep in the well. The increased gas content of the produced fluid
reduces the average flowing density of the fluids in the tubing, hence increasing the
formation drawdown and the well inflow rate.
v. Progressing Cavity Pump (PCP)
This employs a helical, metal rotor rotating inside an elastomeric, double helical stator. The
rotating action is supplied by downhole electric motor or by rotating rods.
Academic Research International Vol. 7(1) January 2016
____________________________________________________________________________________________________________________________________________________________________________________________________________________________________________________________________________________________________________
Copyright © 2016 SAVAP International ISSN: 2223-9944, e ISSN: 2223-9553
www.savap.org.pk 5 www.journals.savap.org.pk
METHODOLOGY
Development of the PIPESIM System
The PIPESIM software modeling tool is an integrated petroleum engineer and facilities
package for design, operation and optimization. PIPESIM is a production engineer’s tool that
covers a wide range of applications relevant to the oil and gas industry. The software allow
building of well models with the ability to address all variables such as well configuration,
fluid characteristics (PVT), multiphase VLP correlations and various IPR models. The
artificial lifting methods available are:
a. Electric Submersible Pump – ESP
b. Gas Lift
c. Rod Pumps
A full range of well types can be modelled in PIPESIM which includes gas, gas condensate,
liquid, liquid and gas, steam. Different configurations such as angled, multi-layer and multi-
laterals can also be modelled as well as various completion configurations such as gravel
pack, open, cased and perforated hole are also available. Pipesim uses a full range of IPR
models.
Basic theory of PIPESIM
To predict pressure and temperature changes from the reservoir, along the wellbore and flow
line tubular it is necessary to accurately predict fluid properties as a function of pressure and
temperature. The Black Oil PVT model is used for the vast majority of applications. Different
applications can be chosen for the Black Oil model in PIPESIM. Black oil fluid modeling
utilizes correlation models to simulate the key PVT fluid properties of the oil/gas/water
system. These empirical correlations treat the oil/gas system as a simple two component
system, unlike the more rigorous multi-component compositional model methods. The
hydrocarbon is treated simply as a liquid component (if present) and a gas component related
to stock tank conditions. All that is needed for most applications is a minimum of production
data, oil gravity, gas gravity, solution gas/oil ratio and, if water is also present in the system,
the watercut.
Black oil fluid modeling is appropriate for use with a wide range of applications and
hydrocarbon fluid systems. In general, the basic black oil correlations will provide reasonable
accuracy in most PVT fluid property evaluations over the range of pressures and
temperatures likely to be found in production or pipeline systems.
It should be noted that the black oil calibration feature is only applicable to oil fluid types, as
it is not appropriate for a gas fluid type. The oil and water model which is used for this study,
takes the surface production of oil and associated gas together with the water cut to determine
the well mass flow rate.
There is no universal rule for selecting the best correlation for a given well. The correlation
must be selected on the basis of flow regimes and closeness of fit to measured pressure data.
In making a selection the purpose of analysis should be considered. The IPR describes
pressure drawdown as a function of production rate.
Building a Model
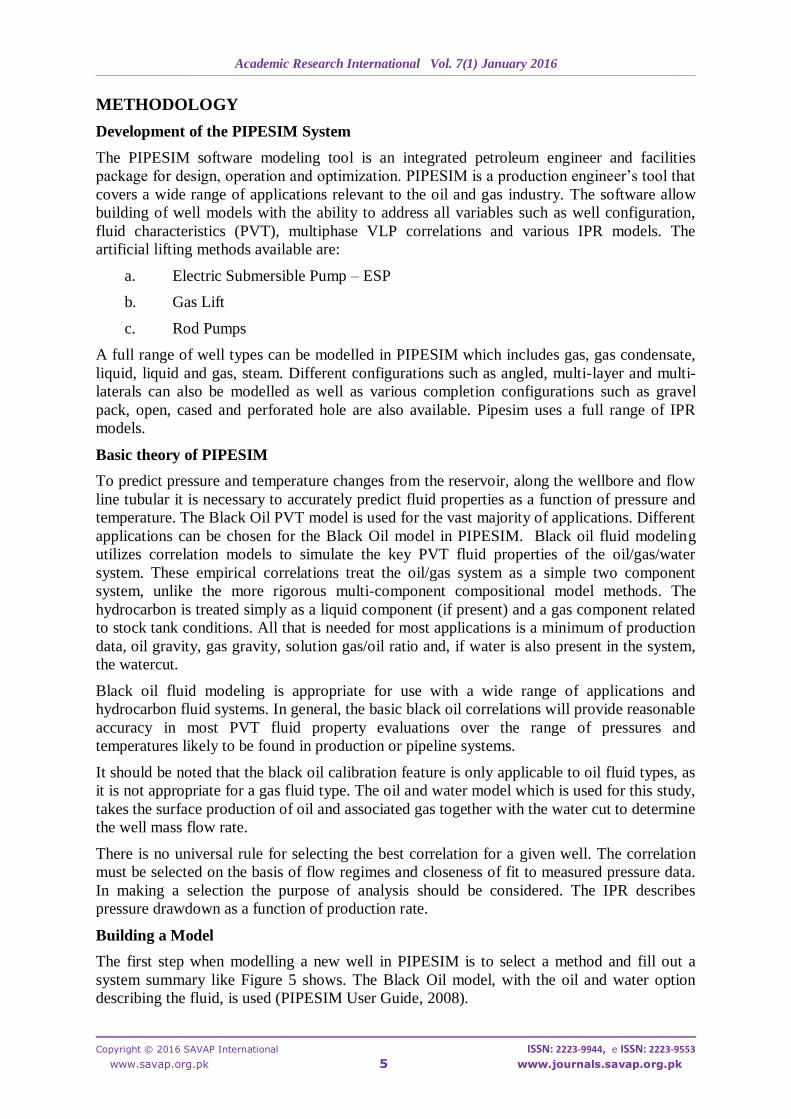
The first step when modelling a new well in PIPESIM is to select a method and fill out a
system summary like Figure 5 shows. The Black Oil model, with the oil and water option
describing the fluid, is used (PIPESIM User Guide, 2008).
Academic Research International Vol. 7(1) January 2016
____________________________________________________________________________________________________________________________________________________________________________________________________________________________________________________________________________________________________________
Copyright © 2016 SAVAP International ISSN: 2223-9944, e ISSN: 2223-9553
www.savap.org.pk 6 www.journals.savap.org.pk
Figure 5: Layout of PIPESIM system summary
After entering the fluid data, the next step is to fill in the PVT data. First the basic data for the
Black Oil model for the well is entered (Appendices A to B). Second, PVT test data is
entered and matched to the Black Oil correlations.
Then a well model is constructed and a Nodal Analysis performed at bottom hole. (At the
initial stage, no pump in the well is assumed).
Pump Selection/Design
In selecting and designing the ESP, the design condition given in appendix E is used, with the
aim to determine the following:
i. The number of stages required using Reda HN13000 pump.
ii. The motor HP required.
iii. Generate a Pump Performance Plot showing the potential operating flowrate
range for variable frequency between 50 to 70Hz.
Also, from the Pump Performance Plot, the flow rate that the pump pressure will fall below
the bubble point is determined.
Gas Lift Design
When performing a gas lift design, the best compromise between a numbers of objectives are
sought:
i. Find optimum production and lift gas injection rates.
ii. Inject gas as deep as possible.
iii. Determine depth and number of unloading valves.
iv. Produce at stable conditions without "heading" and avoiding pressure surges that
could result in multipoint injection and cause pressure fluctuations large enough to be
disruptive to surface facilities.
When designing a gas lift system with more than one well, one should optimize the allocation
of available gas, so that the total production is maximized. The developers of PIPESIM have
made software for this (GAP), but this is not the scope of this study and has not been done.
Academic Research International Vol. 7(1) January 2016
____________________________________________________________________________________________________________________________________________________________________________________________________________________________________________________________________________________________________________
Copyright © 2016 SAVAP International ISSN: 2223-9944, e ISSN: 2223-9553
www.savap.org.pk 7 www.journals.savap.org.pk
Modelling the Well with Gas Lift
When modelling a gas lift well a number of parameters have been entered into the system.
The design conditions given in appendix F and G were used to determine the required
Mandrel spacing to unload the well and also to test rack pressure of each of the unloading
valves.
RESULTS AND DISCUSSIONS
Base Case
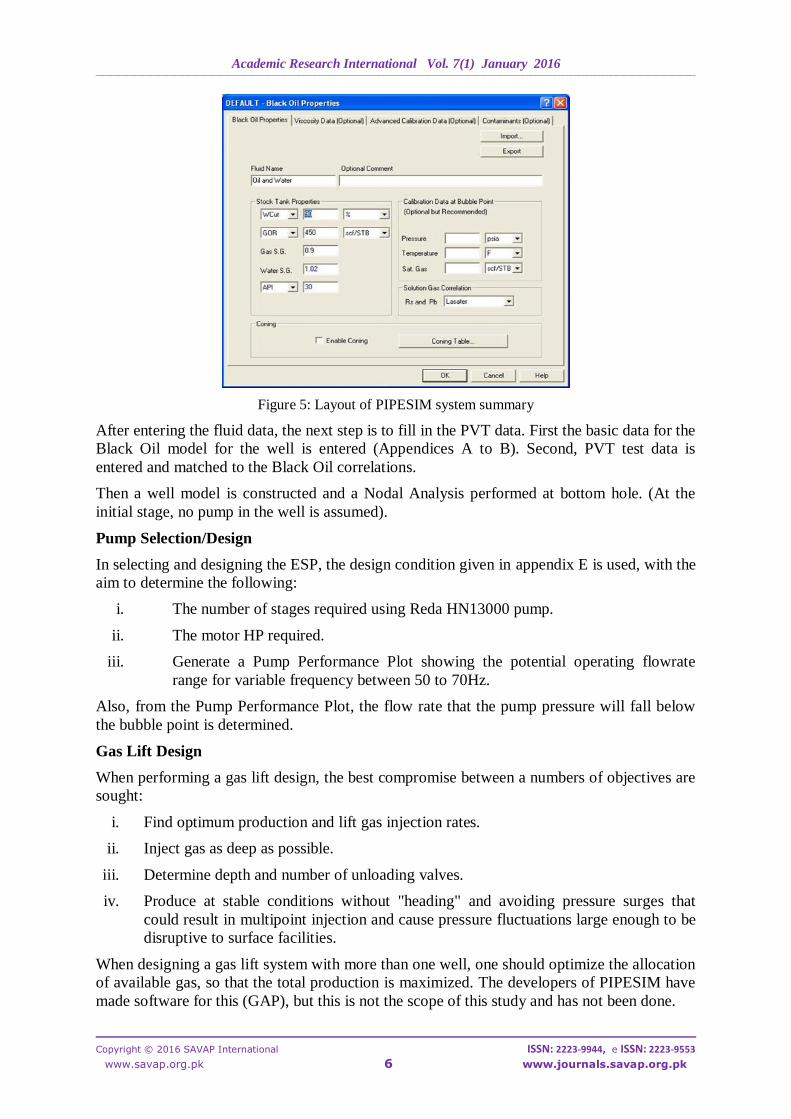
Given the input parameters in the appendix, PIPESIM gives a production profile, with no
artificial lift, for the hypothetical well. The well has no oil production, therefore the well must
be considered as dead. (see Figure 6)
Figure 6: Well Production with No Artificial Lift
(No intersection between IPR and VLP “situation today”)
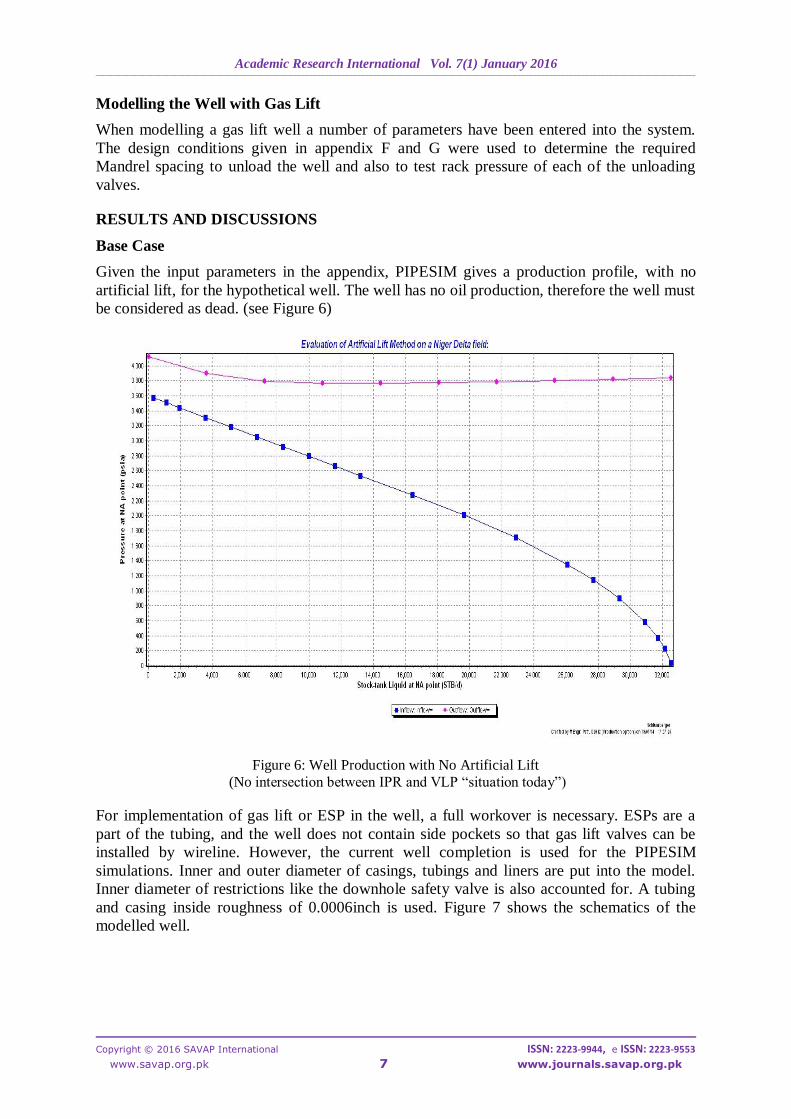
For implementation of gas lift or ESP in the well, a full workover is necessary. ESPs are a
part of the tubing, and the well does not contain side pockets so that gas lift valves can be
installed by wireline. However, the current well completion is used for the PIPESIM
simulations. Inner and outer diameter of casings, tubings and liners are put into the model.
Inner diameter of restrictions like the downhole safety valve is also accounted for. A tubing
and casing inside roughness of 0.0006inch is used. Figure 7 shows the schematics of the
modelled well.
Academic Research International Vol. 7(1) January 2016
____________________________________________________________________________________________________________________________________________________________________________________________________________________________________________________________________________________________________________
Copyright © 2016 SAVAP International ISSN: 2223-9944, e ISSN: 2223-9553
www.savap.org.pk 8 www.journals.savap.org.pk
Figure 7: Schematics of the Modelled Well
ESP Considered
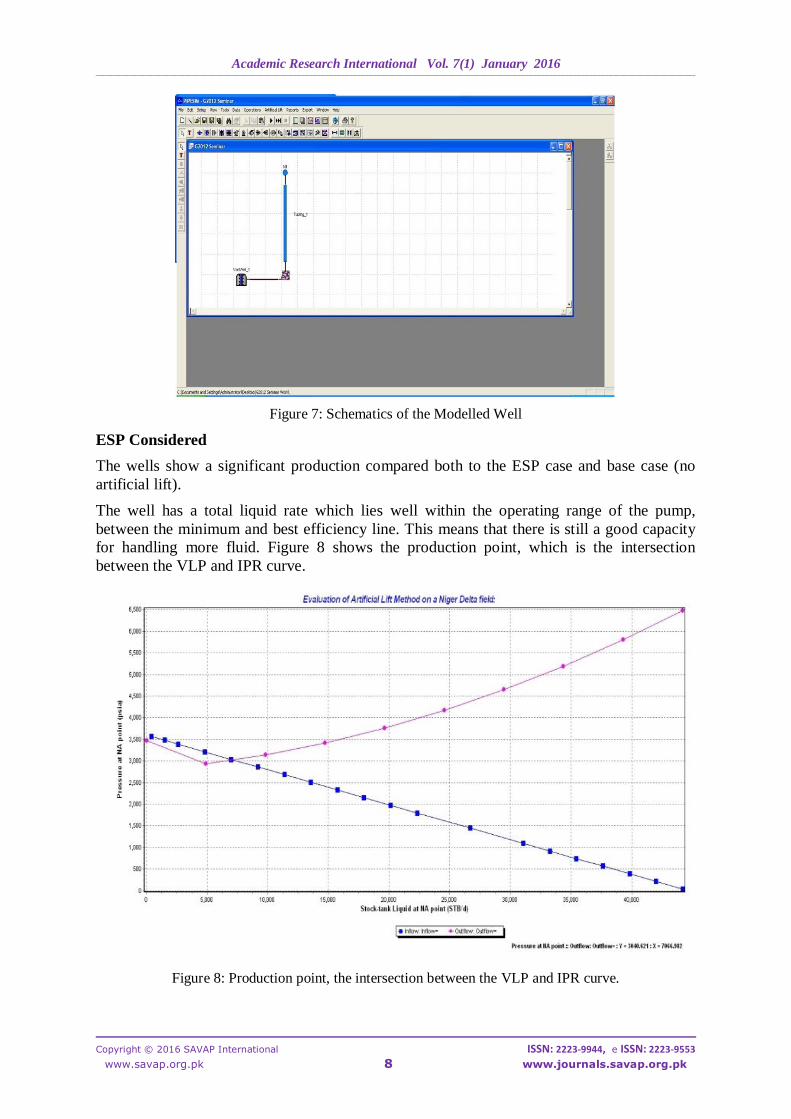
The wells show a significant production compared both to the ESP case and base case (no
artificial lift).
The well has a total liquid rate which lies well within the operating range of the pump,
between the minimum and best efficiency line. This means that there is still a good capacity
for handling more fluid. Figure 8 shows the production point, which is the intersection
between the VLP and IPR curve.
Figure 8: Production point, the intersection between the VLP and IPR curve.
Academic Research International Vol. 7(1) January 2016
____________________________________________________________________________________________________________________________________________________________________________________________________________________________________________________________________________________________________________
Copyright © 2016 SAVAP International ISSN: 2223-9944, e ISSN: 2223-9553
www.savap.org.pk 9 www.journals.savap.org.pk
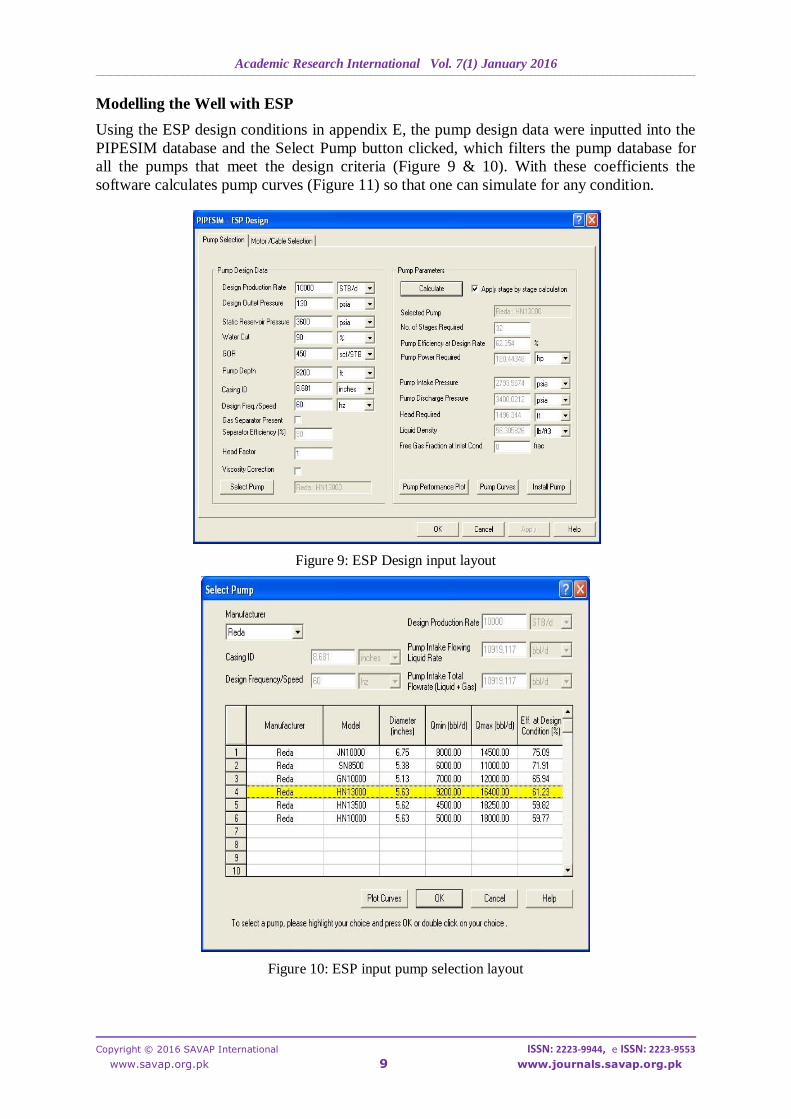
Modelling the Well with ESP
Using the ESP design conditions in appendix E, the pump design data were inputted into the
PIPESIM database and the Select Pump button clicked, which filters the pump database for
all the pumps that meet the design criteria (Figure 9 & 10). With these coefficients the
software calculates pump curves (Figure 11) so that one can simulate for any condition.
Figure 9: ESP Design input layout
Figure 10: ESP input pump selection layout
Academic Research International Vol. 7(1) January 2016
____________________________________________________________________________________________________________________________________________________________________________________________________________________________________________________________________________________________________________
Copyright © 2016 SAVAP International ISSN: 2223-9944, e ISSN: 2223-9553
www.savap.org.pk 10 www.journals.savap.org.pk
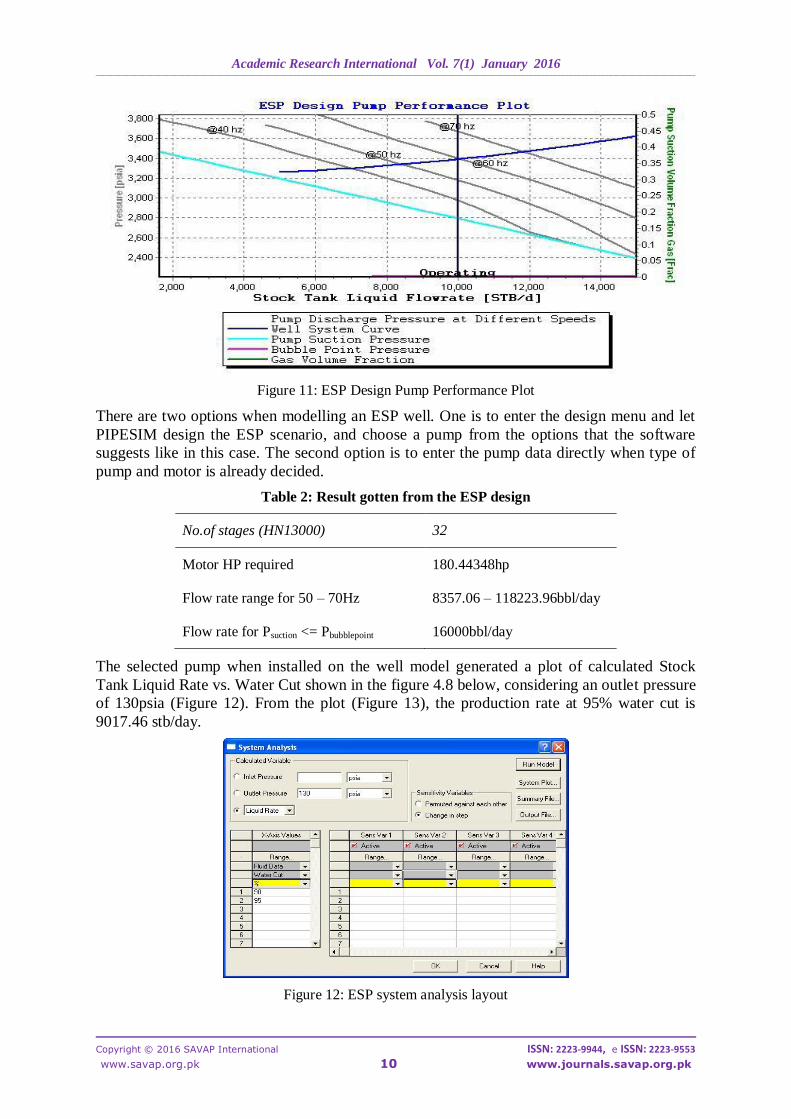
Figure 11: ESP Design Pump Performance Plot
There are two options when modelling an ESP well. One is to enter the design menu and let
PIPESIM design the ESP scenario, and choose a pump from the options that the software
suggests like in this case. The second option is to enter the pump data directly when type of
pump and motor is already decided.
Table 2: Result gotten from the ESP design
No.of stages (HN13000) 32
Motor HP required 180.44348hp
Flow rate range for 50 – 70Hz 8357.06 – 118223.96bbl/day
Flow rate for Psuction <= Pbubblepoint 16000bbl/day
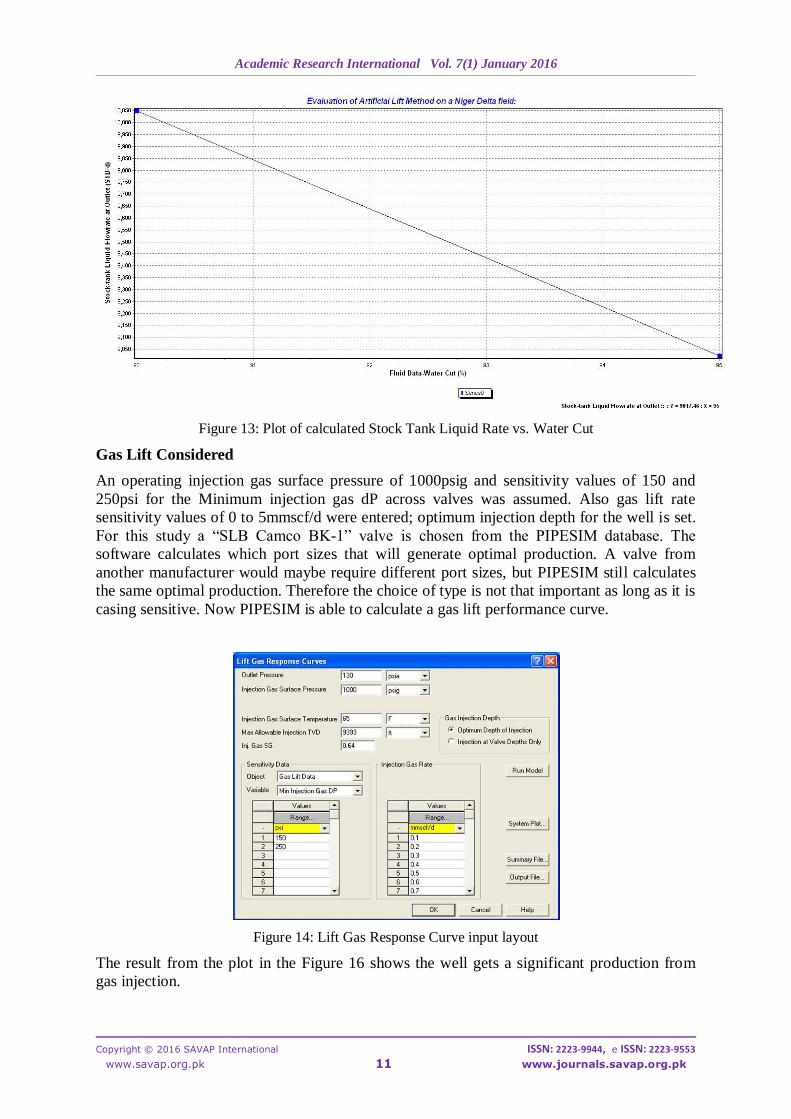
The selected pump when installed on the well model generated a plot of calculated Stock
Tank Liquid Rate vs. Water Cut shown in the figure 4.8 below, considering an outlet pressure
of 130psia (Figure 12). From the plot (Figure 13), the production rate at 95% water cut is
9017.46 stb/day.
Figure 12: ESP system analysis layout
Academic Research International Vol. 7(1) January 2016
____________________________________________________________________________________________________________________________________________________________________________________________________________________________________________________________________________________________________________
Copyright © 2016 SAVAP International ISSN: 2223-9944, e ISSN: 2223-9553
www.savap.org.pk 11 www.journals.savap.org.pk
Figure 13: Plot of calculated Stock Tank Liquid Rate vs. Water Cut
Gas Lift Considered
An operating injection gas surface pressure of 1000psig and sensitivity values of 150 and
250psi for the Minimum injection gas dP across valves was assumed. Also gas lift rate
sensitivity values of 0 to 5mmscf/d were entered; optimum injection depth for the well is set.
For this study a “SLB Camco BK-1” valve is chosen from the PIPESIM database. The
software calculates which port sizes that will generate optimal production. A valve from
another manufacturer would maybe require different port sizes, but PIPESIM still calculates
the same optimal production. Therefore the choice of type is not that important as long as it is
casing sensitive. Now PIPESIM is able to calculate a gas lift performance curve.
Figure 14: Lift Gas Response Curve input layout
The result from the plot in the Figure 16 shows the well gets a significant production from
gas injection.
Academic Research International Vol. 7(1) January 2016
____________________________________________________________________________________________________________________________________________________________________________________________________________________________________________________________________________________________________________
Copyright © 2016 SAVAP International ISSN: 2223-9944, e ISSN: 2223-9553
www.savap.org.pk 12 www.journals.savap.org.pk
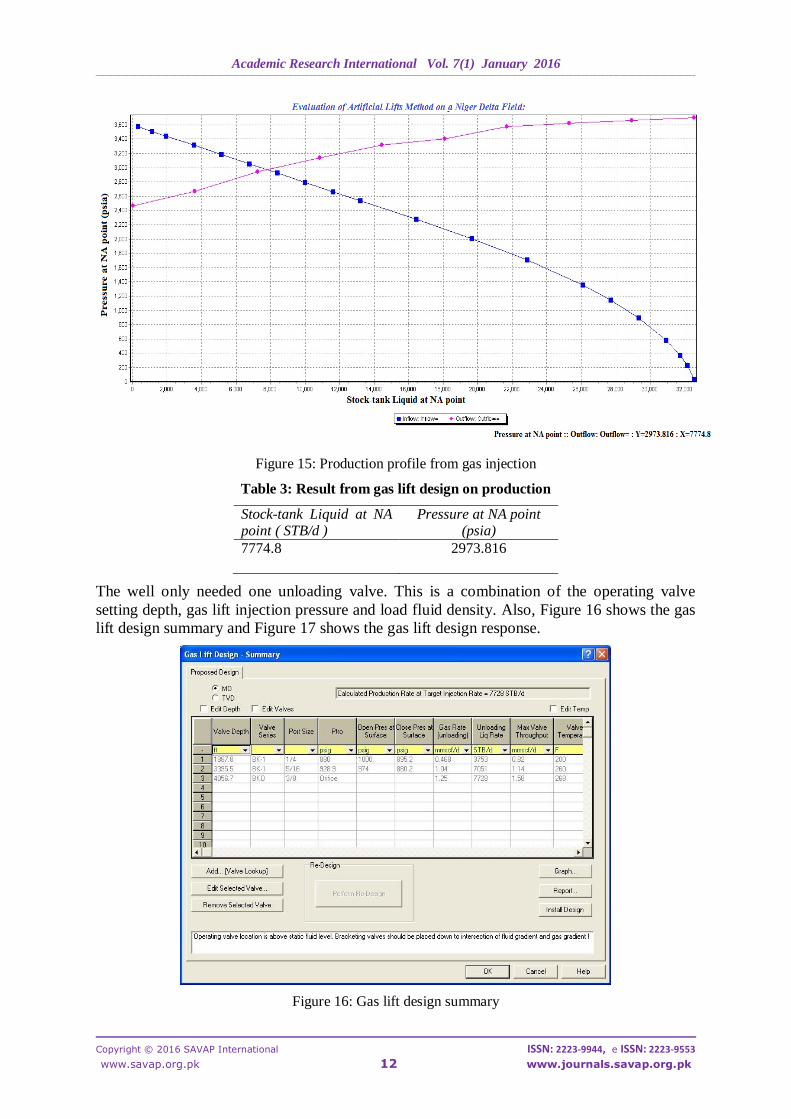
Figure 15: Production profile from gas injection
Table 3: Result from gas lift design on production
Stock-tank Liquid at NA point ( STB/d )
Pressure at NA point (psia)
7774.8 2973.816
The well only needed one unloading valve. This is a combination of the operating valve
setting depth, gas lift injection pressure and load fluid density. Also, Figure 16 shows the gas
lift design summary and Figure 17 shows the gas lift design response.
Figure 16: Gas lift design summary
Academic Research International Vol. 7(1) January 2016
____________________________________________________________________________________________________________________________________________________________________________________________________________________________________________________________________________________________________________
Copyright © 2016 SAVAP International ISSN: 2223-9944, e ISSN: 2223-9553
www.savap.org.pk 13 www.journals.savap.org.pk
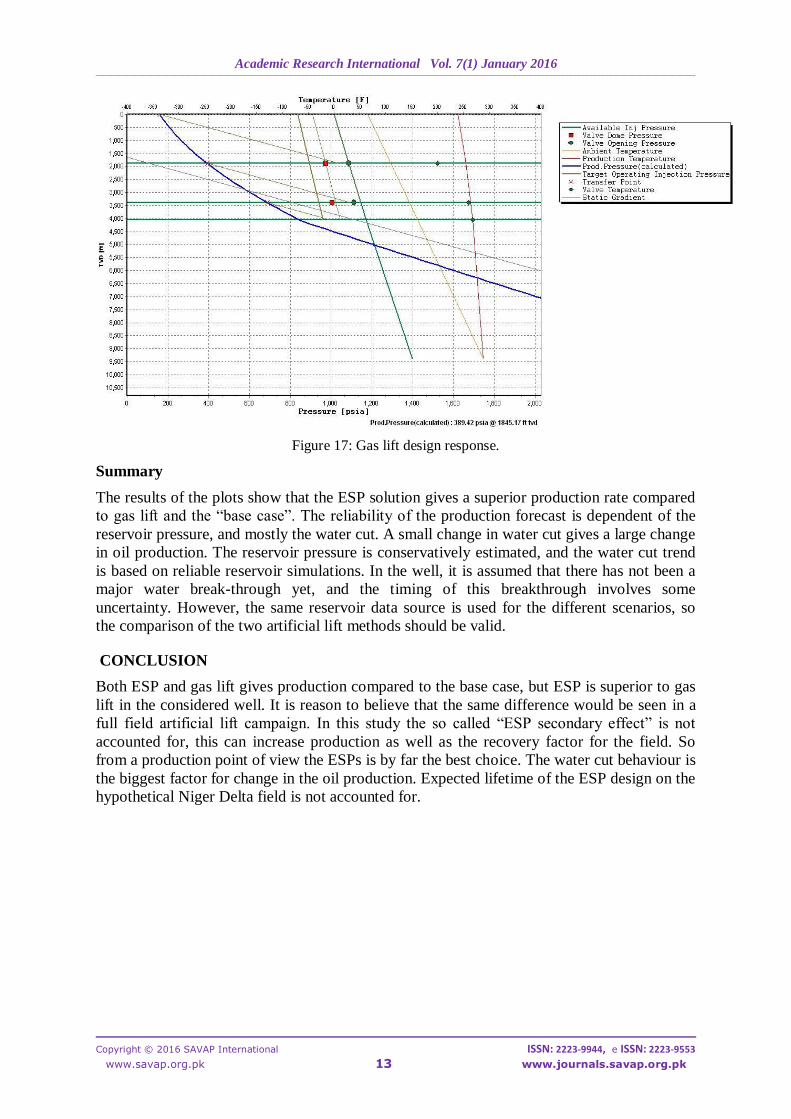
Figure 17: Gas lift design response.
Summary
The results of the plots show that the ESP solution gives a superior production rate compared
to gas lift and the “base case”. The reliability of the production forecast is dependent of the
reservoir pressure, and mostly the water cut. A small change in water cut gives a large change
in oil production. The reservoir pressure is conservatively estimated, and the water cut trend
is based on reliable reservoir simulations. In the well, it is assumed that there has not been a
major water break-through yet, and the timing of this breakthrough involves some
uncertainty. However, the same reservoir data source is used for the different scenarios, so
the comparison of the two artificial lift methods should be valid.
CONCLUSION
Both ESP and gas lift gives production compared to the base case, but ESP is superior to gas
lift in the considered well. It is reason to believe that the same difference would be seen in a
full field artificial lift campaign. In this study the so called “ESP secondary effect” is not
accounted for, this can increase production as well as the recovery factor for the field. So
from a production point of view the ESPs is by far the best choice. The water cut behaviour is
the biggest factor for change in the oil production. Expected lifetime of the ESP design on the
hypothetical Niger Delta field is not accounted for.
Academic Research International Vol. 7(1) January 2016
____________________________________________________________________________________________________________________________________________________________________________________________________________________________________________________________________________________________________________
Copyright © 2016 SAVAP International ISSN: 2223-9944, e ISSN: 2223-9553
www.savap.org.pk 14 www.journals.savap.org.pk
REFERENCES
[1] Clegg, J.D. (1988). “High-rate Artificial Lift” J. Petroleum Technol. SPE17638.
[2] Saepudin, D., Soewono, E., Sidarto, K.A., Gunawan, A.Y., Siregar, S., & Pudjo, S.,
(2007). “An Investigation on Gas Lift Performance Curve in an Oil- Producing Well”
Hindawi Publishing Corporation, International Journal of Mathematics &
Mathematical Sciences, Article ID 81519.
[3] Fleshman, R., & Harryson, O.L. (1999).“Artificial Lift for High-Volume production,
Oilfield Review.
[4] “Basic artificial lift” Canadian Oilwell Systems Company Ltd,
http://www.coscoesp.com
[5] User Guide, (2008): “PIPESIM Suite” Schlumberger.
[6] Clegg, J.D., Bucaram, S.M., & Hein, N.W., (1993): “Recommendations and
Comparisons for Selecting Artifcial Lift Methods” J. Petrol. Tech.
[7] Heriot Watt University, “Production Technology Course Notes” Wikepeadia,
www.wikipedia.org
[8] Elshan, A. (2013). Development of Expert System for Artificial Lift Selection. Master
Thesis, Petroleum and Natural Gas Engineering Department, Middle East Technical
University. p5
[9] Matthew, A. (2013). “Artificial Lift Systems” Artificial Lift Methods and Surface
Operations PGE 482 Lecture Note. p16
Academic Research International Vol. 7(1) January 2016
____________________________________________________________________________________________________________________________________________________________________________________________________________________________________________________________________________________________________________
Copyright © 2016 SAVAP International ISSN: 2223-9944, e ISSN: 2223-9553
www.savap.org.pk 15 www.journals.savap.org.pk
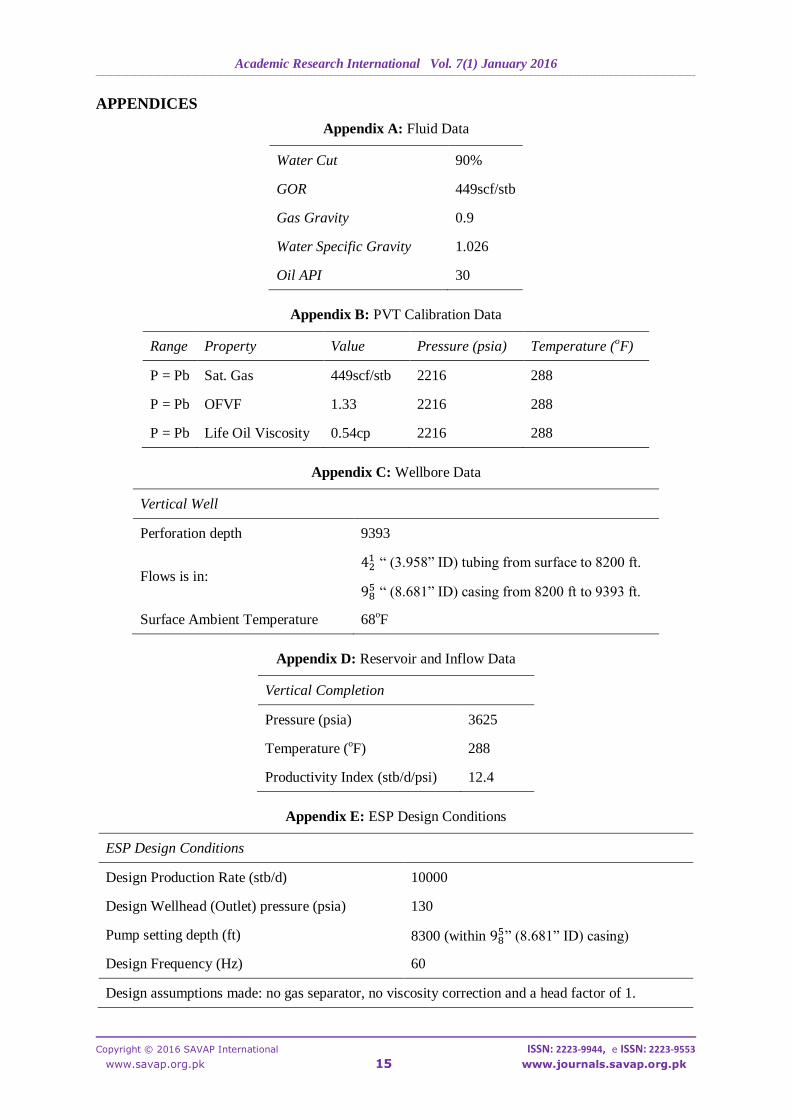
APPENDICES
Appendix A: Fluid Data
Water Cut 90%
GOR 449scf/stb
Gas Gravity 0.9
Water Specific Gravity 1.026
Oil API 30
Appendix B: PVT Calibration Data
Range Property Value Pressure (psia) Temperature (oF)
P = Pb Sat. Gas 449scf/stb 2216 288
P = Pb OFVF 1.33 2216 288
P = Pb Life Oil Viscosity 0.54cp 2216 288
Appendix C: Wellbore Data
Vertical Well
Perforation depth 9393
Flows is in: “ (3.958” ID) tubing from surface to 8200 ft.
“ (8.681” ID) casing from 8200 ft to 9393 ft.
Surface Ambient Temperature 68oF
Appendix D: Reservoir and Inflow Data
Vertical Completion
Pressure (psia) 3625
Temperature (oF) 288
Productivity Index (stb/d/psi) 12.4
Appendix E: ESP Design Conditions
ESP Design Conditions
Design Production Rate (stb/d) 10000
Design Wellhead (Outlet) pressure (psia) 130
Pump setting depth (ft) 8300 (within ” (8.681” ID) casing)
Design Frequency (Hz) 60
Design assumptions made: no gas separator, no viscosity correction and a head factor of 1.
Academic Research International Vol. 7(1) January 2016
____________________________________________________________________________________________________________________________________________________________________________________________________________________________________________________________________________________________________________
Copyright © 2016 SAVAP International ISSN: 2223-9944, e ISSN: 2223-9553
www.savap.org.pk 16 www.journals.savap.org.pk
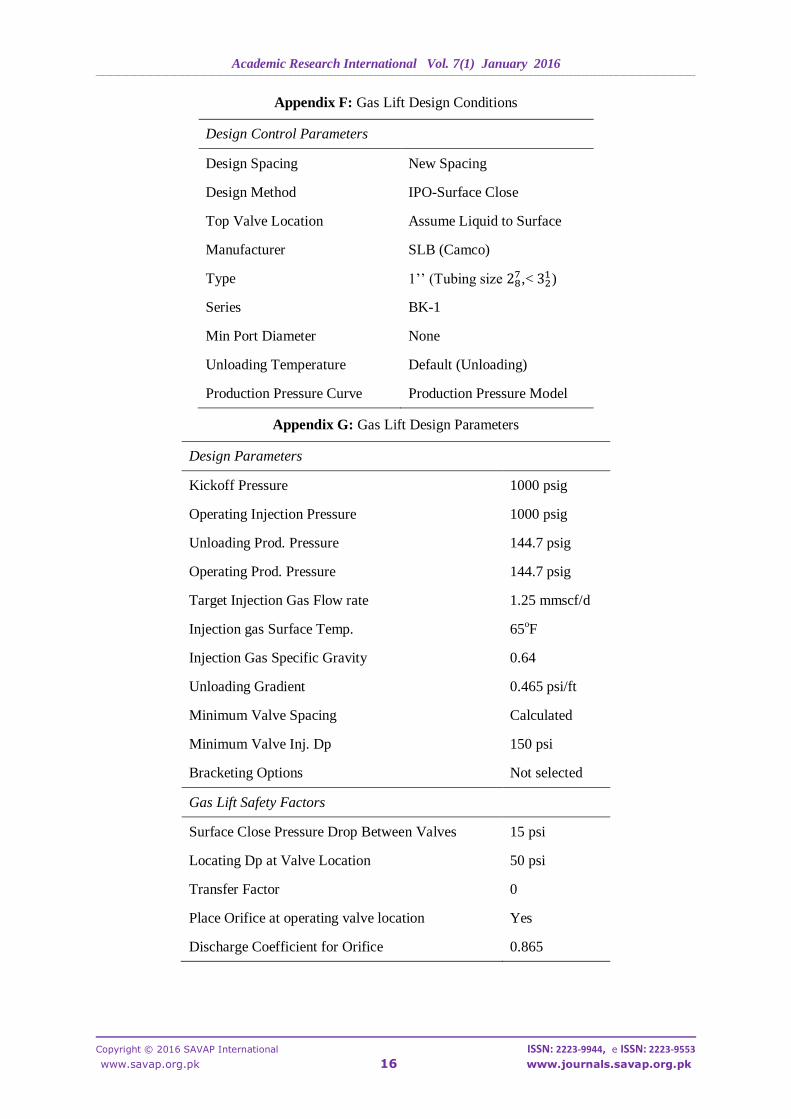
Appendix F: Gas Lift Design Conditions
Design Control Parameters
Design Spacing New Spacing
Design Method IPO-Surface Close
Top Valve Location Assume Liquid to Surface
Manufacturer SLB (Camco)
Type 1’’ (Tubing size ,<
)
Series BK-1
Min Port Diameter None
Unloading Temperature Default (Unloading)
Production Pressure Curve Production Pressure Model
Appendix G: Gas Lift Design Parameters
Design Parameters
Kickoff Pressure 1000 psig
Operating Injection Pressure 1000 psig
Unloading Prod. Pressure 144.7 psig
Operating Prod. Pressure 144.7 psig
Target Injection Gas Flow rate 1.25 mmscf/d
Injection gas Surface Temp. 65oF
Injection Gas Specific Gravity 0.64
Unloading Gradient 0.465 psi/ft
Minimum Valve Spacing Calculated
Minimum Valve Inj. Dp 150 psi
Bracketing Options Not selected
Gas Lift Safety Factors
Surface Close Pressure Drop Between Valves 15 psi
Locating Dp at Valve Location 50 psi
Transfer Factor 0
Place Orifice at operating valve location Yes
Discharge Coefficient for Orifice 0.865