comparing epa swtr baffling factors to full scale tracer ... · data analysis plot conductivity...
TRANSCRIPT

Comparing EPA
SWTR Baffling Factors
to Full Scale Tracer
Study Empirical Data
Rachel Smith, EIT
PA AWWA
2018 Annual Conference
May 2018
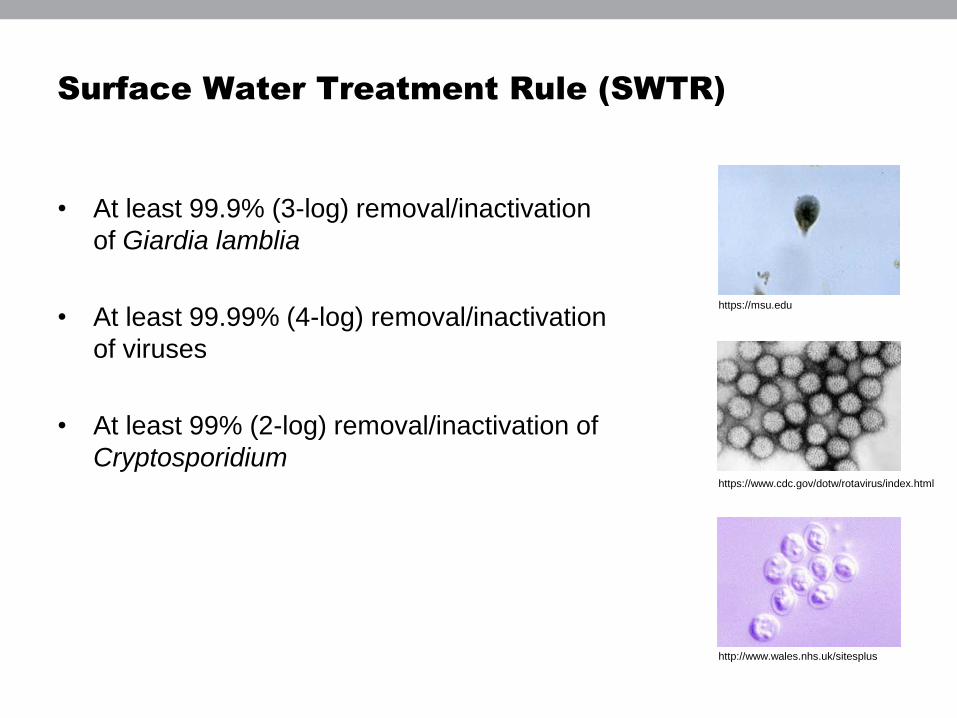
Surface Water Treatment Rule (SWTR)
• At least 99.9% (3-log) removal/inactivation
of Giardia lamblia
• At least 99.99% (4-log) removal/inactivation
of viruses
• At least 99% (2-log) removal/inactivation of
Cryptosporidium
https://msu.edu
https://www.cdc.gov/dotw/rotavirus/index.html
http://www.wales.nhs.uk/sitesplus

CT Requirement
𝐶𝑇 = 𝐶 𝑥 𝑇
C = concentration of free chlorine (mg/L)
T = disinfection contact time (minutes)
𝐿𝑜𝑔 𝐼𝑛𝑎𝑐𝑡𝑖𝑣𝑎𝑡𝑖𝑜𝑛 =𝐶𝑇𝑎𝑐ℎ𝑖𝑒𝑣𝑒𝑑𝐶𝑇𝑟𝑒𝑞𝑢𝑖𝑟𝑒𝑑
CTachieved = Empirically measured CT
CTrequired = CT required by the EPA
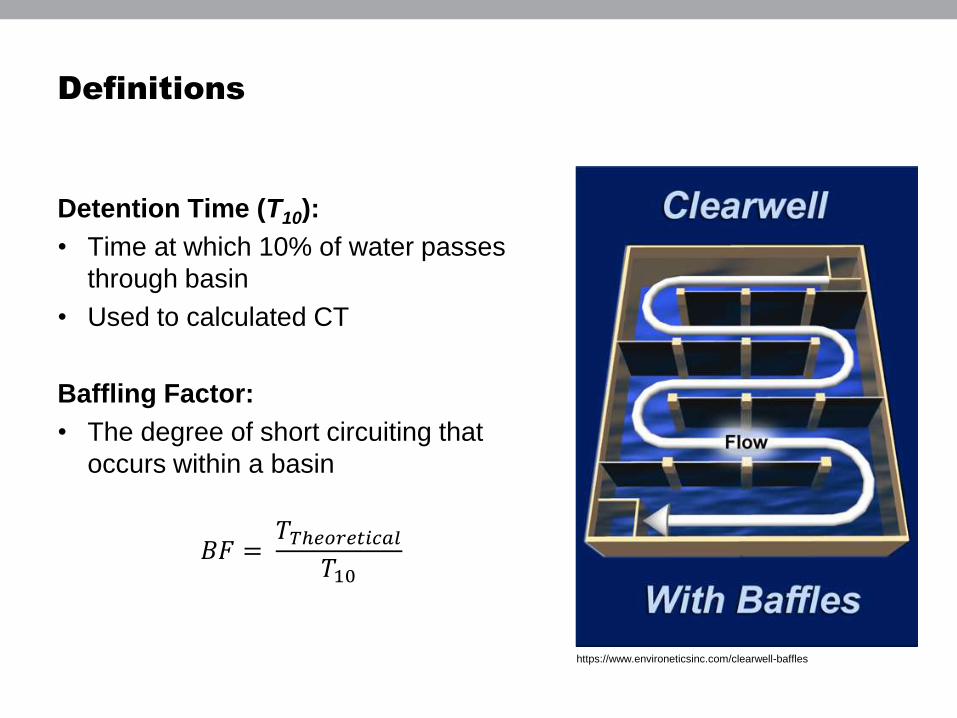
Definitions
Detention Time (T10):
• Time at which 10% of water passes
through basin
• Used to calculated CT
Baffling Factor:
• The degree of short circuiting that
occurs within a basin
𝐵𝐹 =𝑇𝑇ℎ𝑒𝑜𝑟𝑒𝑡𝑖𝑐𝑎𝑙
𝑇10
https://www.environeticsinc.com/clearwell-baffles
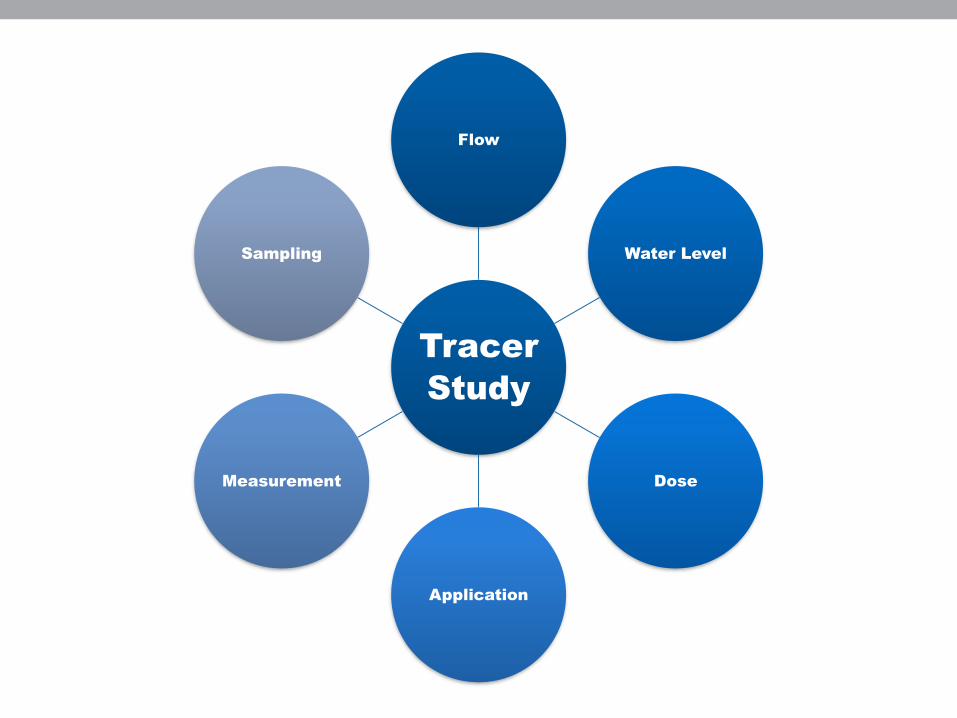
Tracer
Study
Flow
Water Level
Dose
Application
Measurement
Sampling
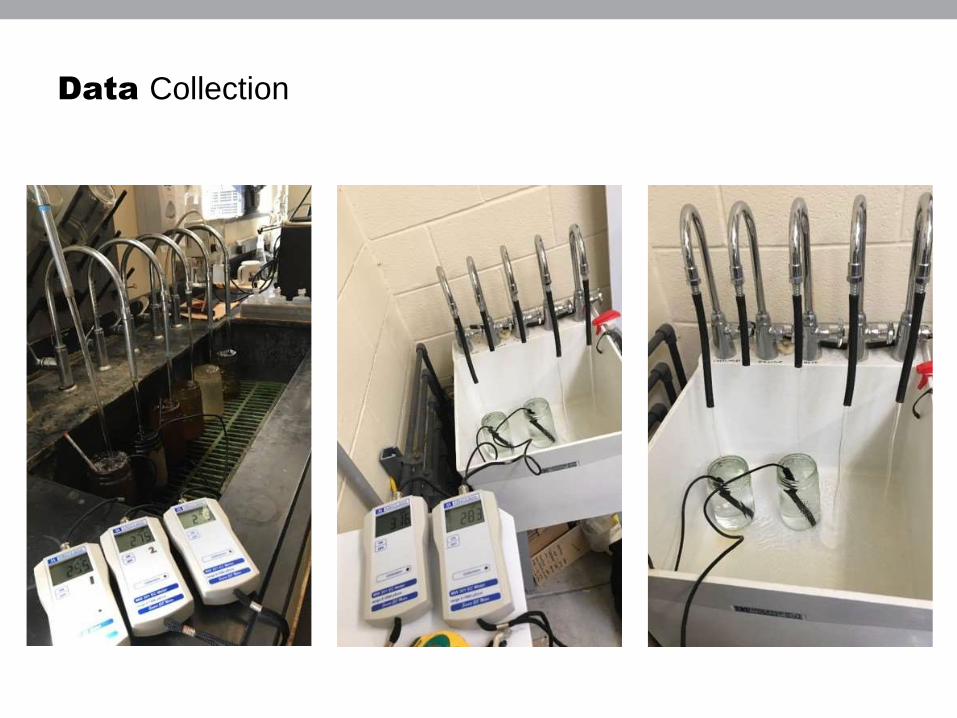
Data Collection

Data Analysis
Plot conductivity against
time on log10
scale
Determine R2
Estimate T10
Calculate baffling factor
Compare to EPA SWTR
baffling factors

Data Analysis – Pre-Filtration
0.01
0.10
1.00
10:04 11:16 12:28 13:40 14:52 16:04
Dim
en
sio
nle
ss C
on
du
cti
vit
y(1
-C
/Co
)
Time
Pre-Sedimentation Basin
Sedimentation Basin
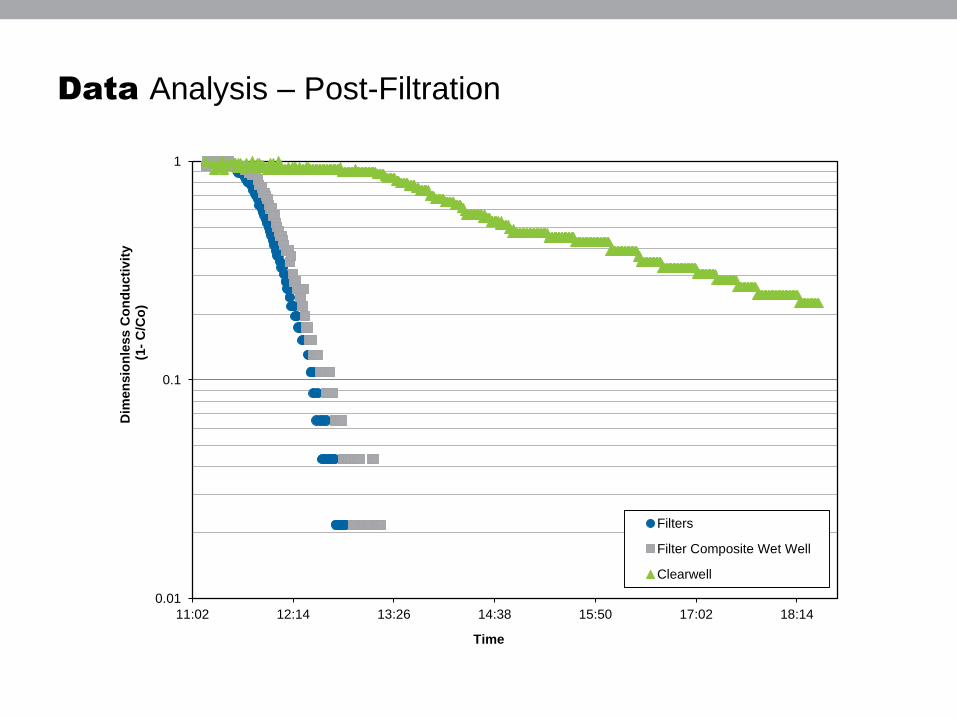
Data Analysis – Post-Filtration
0.01
0.1
1
11:02 12:14 13:26 14:38 15:50 17:02 18:14
Dim
en
sio
nle
ss C
on
du
cti
vit
y(1
-C
/Co
)
Time
Filters
Filter Composite Wet Well
Clearwell

Results – PLANT A
Plant Segment
T10
(min)
Volume
of
Section
(gal)
Theoreti
cal Time
(min)
BF EPA BF
Plant Flow Rate: 8.02 MGD or 5569 gpm
Raw Water Wet Well to Mixed Water (Acti-
flo Influent)5 33,950 5.3 0.8 1
Acti-flo Inlet to Filter Top 22 201,971 31.6 0.6 0.7
Plant Flow Rate: 8.2MGD or 5625 gpm
Filter Top Channel inlet to Filter Effluent
Combined Header33 354,407 65.5 0.5 0.7
Filter Effluent Header to Clearwell Influent 33 273,849 45.4 0.7 0.2-1
Clearwell Influent to Plant Effluent 111 1,208,749 132.6 0.5 0.5

Results – PLANT B
Plant Segment
T10
(min)
Volume
of
Section
(gal)
Theoreti
cal Time
(min)
BF EPA BF
Pre Filtration: Flow Rate = 7.6 MGD or 5278 gpm
Raw Water Mixer to Sedimentation Basin
Inlet24 334,453 63.4 0.4 0.2-0.4
Sedimentation Basin Inlet to Filter Top 87 1,898,963 359.8 0.2 0.3
Post Filtration: Flow Rate = 6.5 MGD or 4514 gpm
Filter Top to Filter Composite 21 178,263 33.8 0.6 0.7
Filter Composite to Clearwell Influent 10 184,322 40.8 0.2 0.1-0.3
Clearwell Influent to Sendout 66 1,422,438 315.1 0.2 0.1
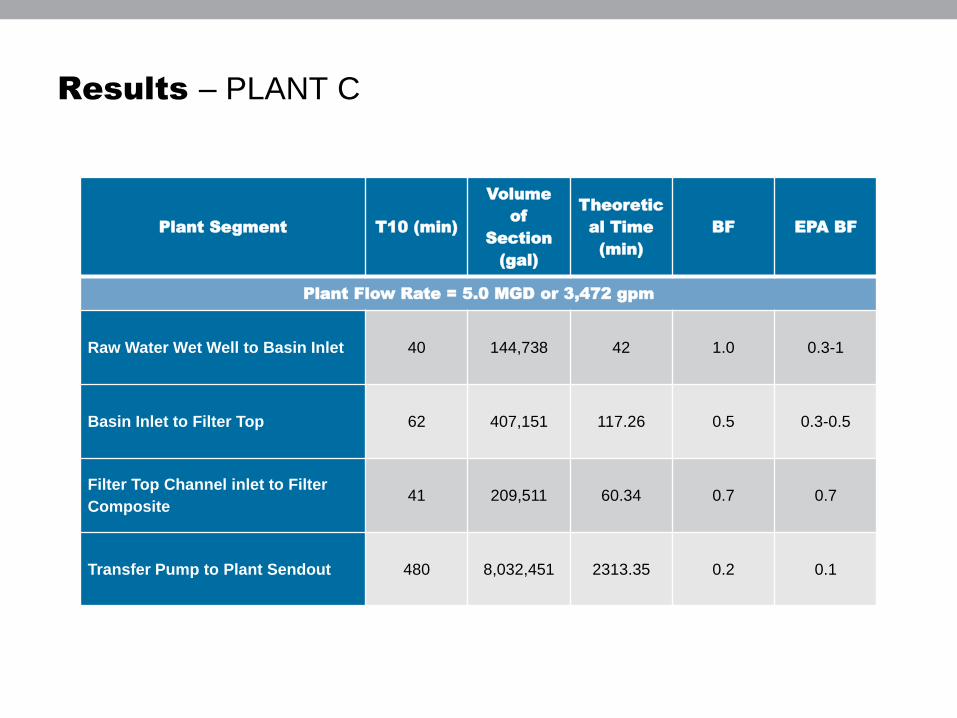
Results – PLANT C
Plant Segment T10 (min)
Volume
of
Section
(gal)
Theoretic
al Time
(min)
BF EPA BF
Plant Flow Rate = 5.0 MGD or 3,472 gpm
Raw Water Wet Well to Basin Inlet 40 144,738 42 1.0 0.3-1
Basin Inlet to Filter Top 62 407,151 117.26 0.5 0.3-0.5
Filter Top Channel inlet to Filter
Composite41 209,511 60.34 0.7 0.7
Transfer Pump to Plant Sendout 480 8,032,451 2313.35 0.2 0.1

Results – PLANT D
Plant Segment
T10
(min)
Volume
of
Section
(gal)
Theoreti
cal Time
(min)
BF EPA BF
Plant Flow Rate = 16.0 MGD or 11111.1 gpm
Lab Channel to Sedimentation Basin Inlet 12.0 137,000 12.3 1.0 1.0
Basin Inlet to Basin Outlet 22.5 884,494 79.6 0.2 0.3
Basin Outlet to Filter Top 3.0 39,336 3.5 1.0 1.0
Filter Top to Filter Comp 33.0 1,074,182 96.7 0.4 0.7
Filter Comp to Plant Effluent 103.0 1,973,334 177.6 0.6 0.6-0.65
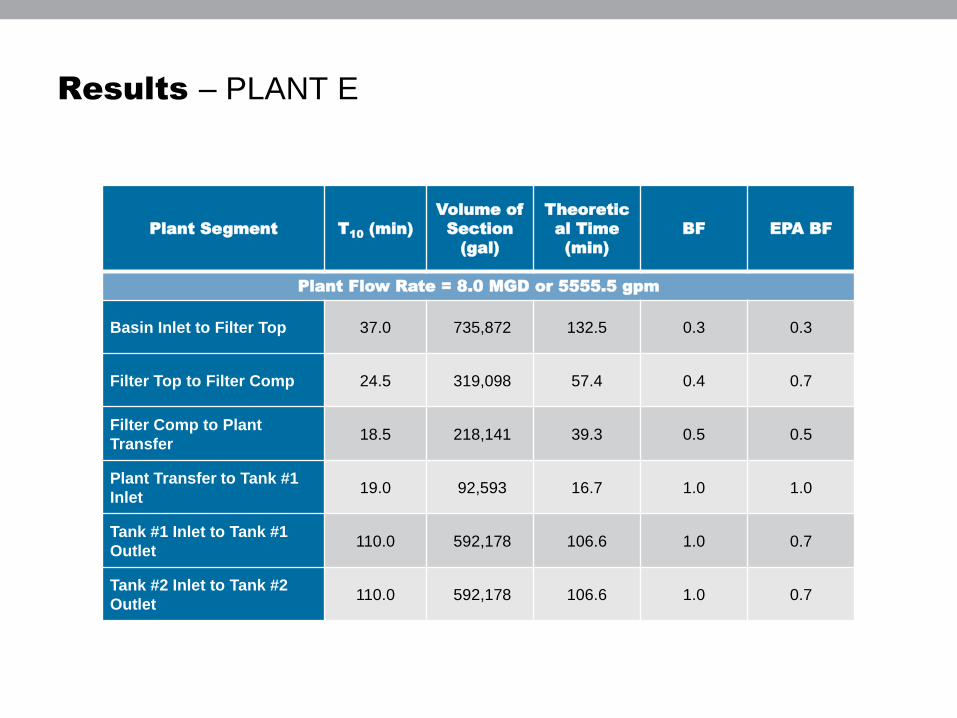
Results – PLANT E
Plant Segment T10
(min)
Volume of
Section
(gal)
Theoretic
al Time
(min)
BF EPA BF
Plant Flow Rate = 8.0 MGD or 5555.5 gpm
Basin Inlet to Filter Top 37.0 735,872 132.5 0.3 0.3
Filter Top to Filter Comp 24.5 319,098 57.4 0.4 0.7
Filter Comp to Plant
Transfer18.5 218,141 39.3 0.5 0.5
Plant Transfer to Tank #1
Inlet19.0 92,593 16.7 1.0 1.0
Tank #1 Inlet to Tank #1
Outlet110.0 592,178 106.6 1.0 0.7
Tank #2 Inlet to Tank #2
Outlet110.0 592,178 106.6 1.0 0.7
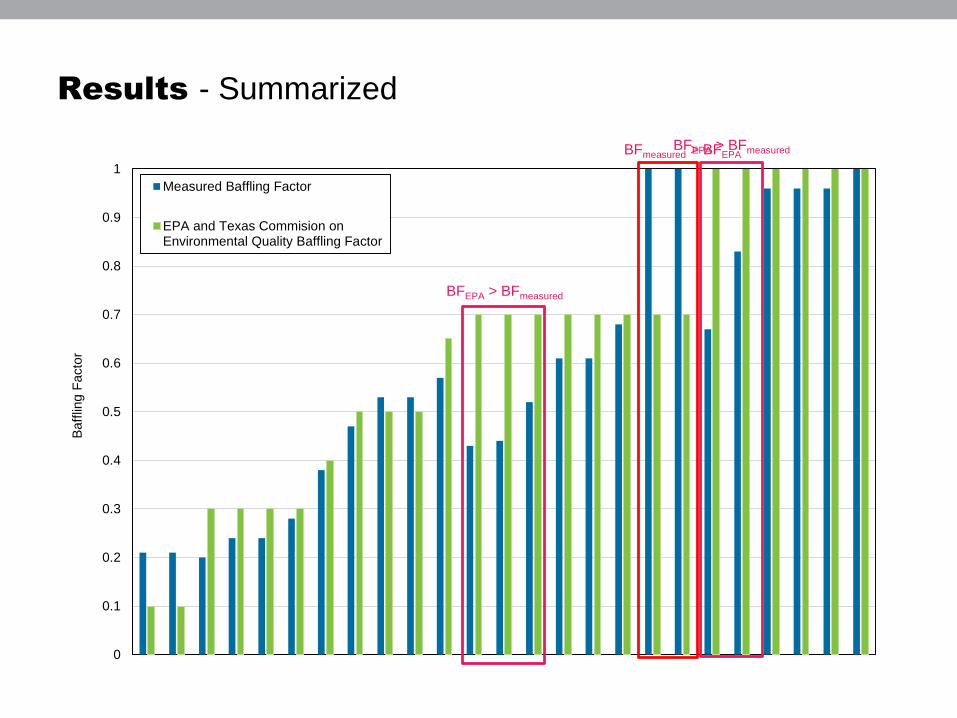
Results - Summarized
0
0.1
0.2
0.3
0.4
0.5
0.6
0.7
0.8
0.9
1
Baff
ling F
acto
r
Measured Baffling Factor
EPA and Texas Commision onEnvironmental Quality Baffling Factor
BFEPA > BFmeasured
BFEPA > BFmeasuredBFmeasured > BFEPA
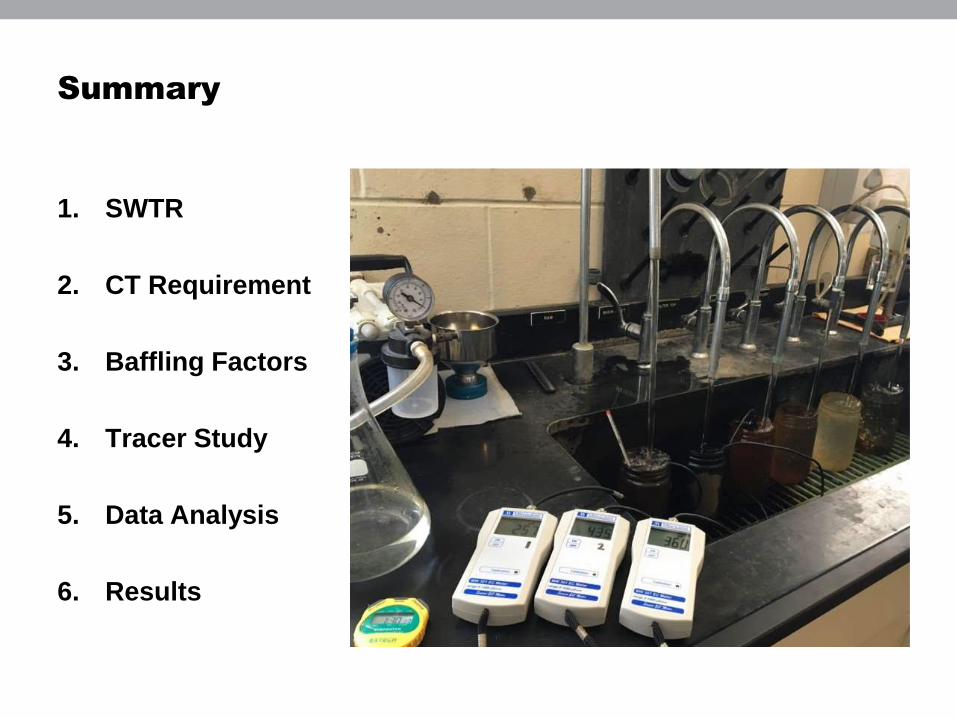
Summary
1. SWTR
2. CT Requirement
3. Baffling Factors
4. Tracer Study
5. Data Analysis
6. Results

References
Environmental Protection Agency. (1999, August). Disinfection Profiling and
Benchmarking Guidance Manual. Retrieved April 2013
Texas Commission on Environmental Quality. (2004, April 1). Selection of
Baffling Factors and Operating Conditions for “T10” Calculations. Retrieved
April 2013
United States, Environmental Protection Agency, Office of Drinking Water.
(1991). Guidance manual for compliance with the filtration and disinfection
requirements for public water systems using surface water sources.
Washington, D.C.: U.S. Environmental Protection Agency

Questions
?