compendium of philippine environment statistics 2 0 0 4 2004.pdf · compendium of philippine...
TRANSCRIPT

Republika ng PilipinasPAMBANSANG LUPON SA UGNAYANG PANG-ESTADISTIKA(NATIONAL STATISTICAL COORDINATION BOARD)http://www.nscb.gov.ph
Compendium of Philippine Environment
Statistics2 0 0 4

Compendium of Philippine Environment Statistics
2004
November 2004
Republika ng Pilipinas PAMBANSANG LUPON SA UGNAYANG PANG-ESTADISTIKA
(NATIONAL STATISTICAL COORDINATION BOARD)

Compendium of Philippine Environment Statistics 2004 i
FOREWORD
This is the third issue of the Compendium of Philippine Environment Statistics. The compendium is a compilation of statistical information collected from data produced by various government agencies and from data available in different statistical publications. The compilation of statistical data in this compendium is based on the Philippine Framework of Environment Statistics (PFDES) which in turn is based on the United Nations Framework for the Development of Environment Statistics. It covers data for the period 1992 to 2002, whenever possible. Latest figures presented vary depending on the availability of data.
The PFDES provides a systematic approach to the development of
environment statistics and is an instrument for compiling and integrating data coming from various data collecting institutions to make them more useful in the formulation and evaluation of socio-economic and environmental programs and policies.
As in the previous editions, the focus of this compendium is on the five main
items of environmental issues, namely: flora/fauna, atmosphere, water, land, mineral and energy and human settlements. The NSCB will strive to further improve the scope and coverage of the compendium in the future. It is hoped that this compendium will serve as a useful and convenient reference on the Philippine environment.
With this publication the NSCB fulfills in part its function of providing
information to planners, decision makers, researchers and other users towards sustainable development.
The preparation of this publication would not have been possible without the
valuable assistance and cooperation of the different source agencies. We take this opportunity to acknowledge their continued support towards a more responsive Philippine statistical system.
ROMULO A. VIROLA Secretary General

Compendium of Philippine Environment Statistics 2004 ii
NSCB Publications Regular Publications Economic and Social Statistics and Indicators (National)
•• Philippine Statistical Yearbook •• Economic and Social Indicators •• Statwatch •• Compendium of Philippine Social
Statistics •• Economic Indicators
o Economic Indicators o Quarterly Economic Indices o Foreign Direct Investments o Food Balance Sheet of the
Philippines •• Social Indicators
o Women and Men in the Philippines o Statistical Report on Children and
Women o Report on the Philippine Human
Development Index o Philippine Poverty Statistics
National Accounts of the Philippines (NAP) •• Quarterly, Semestral and Annual NAP •• Gross Regional Domestic Product •• Gross Regional Domestic Expenditure •• Input-Output Accounts •• Philippine National Health Accounts •• Philippine Education Accounts
Sub-national Statistics •• The Countryside in Figures •• Regional Social and Economic Trends
(RSET) o RSET CAR o RSET I o RSET IV o RSET V o RSET VI o RSET VIII o RSET IX o RSET XII
•• Southern Mindanao Statistical Yearbook •• Women and Men
o Ilocos Region o Eastern Visayas o Central Mindanao o Southern Mindanao
•• Facts and Figures o Bicol o Western Mindanao o Eastern Visayas in Figures
Serial Publications
• Factsheets • NSCB Statistics Series
o Metro Manila: A Gateway to the Philippines
o The Internal Revenue Allotment (IRA) as a Source of Funds for Local Governance
o Statistical Capacity Building in the Philippine Statistical System
o Reported Rape Cases m the Philippines
• NSCB Technical Papers o Environmental Accounting in the
Philippines o Poverty Assessment in the
Philippines o Rebasing, Linking and Constant
Price Estimation of the National Accounts of the Philippines
o Recent Initiatives of the NSCB in Improving Official Statistics in the Philippines
o Measuring the Contribution of the Informal Sector in the Philippines
o Enhancing The Relevance Of The PSNA
o Challenges in the Compilation of Official Poverty Statistics
Others
Standard Classifications
• Philippine Standard Industrial Classification (PSIC) o PSIC Amendment 1997
• Philippine Standard Commodity Classification (PSCC) o PSCC Amendment 1999 •
• Philippine Standard Classification for Education (PSCEd)
• Philippine Standard Occupational Classification (PSOC)
Proceedings of Conventions • National Convention on Statistics • Asian Regional Section, International
Conference on Statistical Computing Reference Materials
• Inventory of Airports • Inventory of Ports • Philippine Statistical Development
Program, 1999-2004 • Profile of Censuses and Surveys • Directory of Statistical Services in the
Philippines • Catalogue of Philippine Statistical
Publications • Directory of Selected Statistical Terms • Manual on the Preparation of Statistical
Project Proposals • A Guide to Statistics for Business
Planning • Framework for the Development of
Environment Statistics • Registry of Top Foreign Direct
Investment Enterprises in the Philippines
Compendium of Philippine Environment Statistics 2004 iii
Other NSCB Products and Services Products
1. Statistical policies and measures to resolve specific issues and provide policy directions in the Philippine Statistical System
2. The Philippine Statistical Development Program (PSDP) to serve as blueprint of priority
programs and activities to be undertaken to improve the Philippine Statistical System in the Medium Term
3. National Accounts and related economic accounts to assess the economic performance of the
country thru the following: § National Accounts § Regional Accounts § Input-Output (I-O) Accounts § National Health Accounts § National Education Accounts
4. Other social and economic indicators
§ Poverty statistics § Environment statistics § Food balance sheet § Indicators on children and women § Gender and development statistics § Quarterly economic indices § Foreign investments § Leading economic indicators § Economic and social impact analysis indicators § Human development index
5. Standards and classification systems to prescribe uniform standards in government statistics
§ Philippine Standard Occupational Classification (PSOC) § Philippine Standard Commodity Classification (PSCC) § Philippine Standard Industrial Classification (PSIC) § Philippine Standard Geographic Code (PSGC) § Philippine Standard Classification of Education (PSCED) § Philippine Classification of Commodities by Broad Economic Categories
(PCCBEC) § Philippine Central Product Classification (PCPC)
6. Statistical publications to disseminate the most relevant information produced by the PSS and
to make statistics more accessible to the public Services
1. Maintenance of a one-stop statistical information center 2. Monitoring of designated statistics 3. Coordination of subnational statistical system 4. Coordination of inter-agency concerns on statistics 5. Survey review and clearance 6. On-line statistical service through the internet (www.nscb.gov.ph) 7. Servicing data requests 8. Technical services 9. Advocacy for statistical awareness
§ National Statistics Month § National Convention on Statistics § Government Statistics Accessibility Program § Hosting of international conferences in statistics

Compendium of Philippine Environment Statistics 2004 iv
THE NATIONAL STATISTICAL COORDINATION BOARD
DIRECTOR GENERAL OF THE NATIONAL ECONOMIC AND DEVELOPMENT AUTHORITY
Chairman
UNDERSECRETARY OF THE DEPARTMENT OF BUDGET AND MANAGEMENT
Vice Chairman
MEMBERS OF THE BOARD
UNDERSECRETARIES of the:
Department of Agriculture Department of Justice
Department of Agrarian Reform Department of Labor and Employment Department of Education Department of National Defense Department of Energy Department of Public Works and Highways Department of Environment and Natural Resources Department of Science and Technology Department of Finance Department of Social Welfare and Development Department of Foreign Affairs Department of Tourism Department of Health Department of Trade and Industry Department of the Interior and Local Government Department of Transportation and
Communication Deputy Governor of the Bangko Sentral ng Pilipinas Secretary General of the National Statistical Coordination Board (NSCB) Administrator of the National Statistics Office (NSO) Executive Director of the Statistical Research and Training Center Representative of the Philippine Chamber of Commerce and Industry
Representative of the League of Governors and City Mayors TECHNICAL STAFF
Assistant Secretary General of the NSCB
Deputy Administrator of the NSO Director of the Economic Statistics Office, NSCB Director of the Social Statistics Office, NSCB Director of the Programs, Policies and Standards Office, NSCB
Director of the Bureau of Agricultural Statistics Director of the Bureau of Labor and Employment Statistics

Compendium of Philippine Environment Statistics 2004 v
NSCB TECHNICAL STAFF*
ROMULO A. VIROLA Secretary General
ESTRELLA V. DOMINGO
Assistant Secretary General PROGRAMS, POLICIES SOCIAL STATISTICS OFFICE AND STANDARDS OFFICE FRANCISCO K. MALLION LINA V. CASTRO Director Director CYNTHIA S. REGALADO FE VIDA N, DY-LIACCO OIC, Programs, Policies, OIC, Population, Health and Nutrition, and Advocacy Division and Education Statistics Division MARGARITA D. SALUTAN REDENCION M. IGNACIO Chief, Standards and Classification Chief, Poverty, Human Development, Systems Division and gender Statistics Division
ECONOMIC STATISTICS OFFICE
RAYMUNDO J. TALENTO Director
VIVIAN R. ILARINA MA. FE M. TALENTO Chief, Production Accounts Division OIC, Integrated Accounts Division MINERVA D. MARTIN JOHN FREDERIC P. DE GUIA OIC, Expenditure Accounts Division Chief, Economic Indicators and Satellite Accounts Division NATIONAL STATISTICAL MANGEMENT SERVICES INFROMATION CENTER OFFICE LINA V. CASTRO ROMEO M. NIMEMO Director Chief, Administrative Services Division CANDIDO J. ASTROLOGO HAZEL MARIE V. ORDONEZ Head, Information Services, OIC, Human Resource and International Publications and Archives Division Affairs Division
OFFICE OF THE SECREATRY GENERAL
ZENAIDA M. TORRES Head, Board Secretariat
FRANCISCO K. MALLION
Director, Subnational Services *As of October 2004

Compendium of Philippine Environment Statistics 2004 vi
LIST OF DATA SOURCES
Department of Agriculture (DA) Bureau of Agricultural Statistics (BAS) Bureau of Fisheries and Aquatic Resources (BFAR) Bureau of Soils and Water Management (BSWM) Fertilizer and Pesticide Authority (FPA)
National Economic and Devt. Authority (NEDA)
National Statistical Coordination Board (NSCB) National Statistics Office (NSO)
Dept. of Environment and Natural Resources (DENR) Environmental Management Bureau (EMB) Forest Management Bureau (FMB) Mines and Geo-Sciences Bureau (MGB) National Water Resources Board National Mapping & Resource Info. Authority (NAMRIA) Planning Development and Evaluation Office Planning and Policy Statistics Office Protected Area and Wildlife Bureau (PAWB)
Department of Energy (DOE) Department of Health (DOH) Department of National Defense (DND)
National Disaster Coordinating Council (NDCC) Department of Public Works and Highways (DPWH) Department of Science and Technology (DOST)
Philippine Atmospheric, Geophysical and Astronomical Services Administration (PAG-ASA)
Dept. of Transportation and Comm. (DOTC)
Land Transportation Office Government Owned and Controlled Corp.
National Irrigation Administration (NIA) Home Development Mutual Fund (HDMF) Local Waterworks and Utilities Administration (LWUA) Philippine Ports Authority (PPA)
Housing and Land Regulatory Board (HLURB)
klima Climate Change Center http://www.klima.ph The Manila Observatory Ateneo de Manila University Campus Loyola Heights, Quezon City, Philippines

Compendium of Philippine Environment Statistics 2004 vii
CONTENTS
Foreword i
List of NSCB Publications ii
List of Other NSCB Product and Services iii
List of Figures v
List of Tables vi
Introduction 1
Philippine Framework for the Development of Environment Statistics 2
Chapter 1 FLORA AND FAUNA 1-1
Chapter 2 ATMOSPHERE 2-1
Chapter 3 WATER 3-1
Chapter 4 LAND AND SOIL 4-1
Chapter 5 MINERAL AND ENERGY 5-1
Chapter 6 HUMAN SETTLEMENTS 6-1
Appendix A Glossary of Terms A-1

Compendium of Philippine Environment Statistics 2004 viii
LIST OF FIGURES
Figure
No. Title Page
Chapter 1. Flora and Fauna 1 Philippine Land Classification (as of year 2002) 1-1 2 Log Production, 1992 to 2002 1-2 3 Production of Selected Non Timber Products, 1992 to 2002 1-2 4 Government Revenues from Wildlife Export, 1992 to 2001 1-3 5 Rare, Threatened and Endangered Wildlife Species, 1992 to 2002 1-4 6 Comparison of Percent Share of Fish Production, year 1992 and
2002 1-5 7 Wildlife Species Protected: Listed Under CITES Appendix I and
Whose Commercial Export/Trade are Strictly Prohibited, 1992 to 2002 1-6
8 Wildlife Species Protected: Listed Under CITES Appendix II and Whose Commercial Export/Trade are Strictly Prohibited, 1992 to 2002 1-7
9 A Comparison of Local Transport and Export Permits Issued, 1992 to 2002 1-8
Chapte2. Atmosphere 1 Philippine Emission Inventory, 2001, (in 000 tons) 2-1 2 Minimum, Maximum and Average Concentration of Total
Suspended Particulates in Selected Monitoring Stations of Metro Manila, 2002 (in Ug/Ncm) 2-3
3 Composition of Air Pollutants Coming from Area Source Emissions in Metro Manila Area, 2001 2-2
Chapter 3. Water
1 Stock of Groundwater, 1992 to 2001 3-1 2 Stock of Surface Water, 1992 to 2000 3-2 3 Inventory of Classified Water Bodies, as of 2002 3-2 4 Withdrawal of Groundwater, 1992 to 2001 3-3 5 Surface Water Withdrawal, 1992 to 2000 3-4 6 Industrial Water Demand, year 2000 3-4 7 Depletion of Groundwater, 1992 to 2001 3-5 8 Annual Average Dissolved Oxygen Concentration in NCR Rivers,
1996 to 2002 3-6 9 Annual Average BOD Concentration in NCR Rivers, 1995 to 2002 3-6
Chapter 4. Land and Soil 1 Land Use Conversion. 1988 - 2000 4-3

Compendium of Philippine Environment Statistics 2004 ix
Chapter 5. Mineral and Energy 1 Production of Selected Metallic Mineral, 1992 to 2002 5-1 2 Production of Selected Non-Metallic Mineral, 1992 to 2002 (in
metric tons) 5-2 3 Installed Generating Capacity, 1992 to 2002 (in megawatts) 5-2 4 Electric Energy Consumption by Sector (million kilowatt hour),
2002 5-3 5 Mining Accidents Incidence and Frequency Rate, 1994 to 2002 5-4
Chapter 6. Human Settlements 1 Percentage of Households With/Without Access to Sanitary Toilet
and Safe Drinking Water in the Philippines, 2002 6-3 2 Selected Disaster Occurrence, 1993 to 2002 6-4

Compendium of Philippine Environment Statistics 2004 x
LIST OF TABLES
Table No. Title Page
A Conceptual Framework on Flora 3 B Conceptual Framework on Fauna 4 C Conceptual Framework on Atmosphere 5 D Conceptual Framework on Water 6 E Conceptual Framework on Mineral And Energy Resources 7 F Conceptual Framework on Human Settlements 9 Statistical Framework On Flora
G.1 Information Category: Social and Economic Activities and Natural Events 11
G.2 Information Category: Environmental Impacts of Activities and Events 13
G.3 Information Category: Responses to Environmental Impacts 14 G.4 Information Category: Stocks and Inventories 15
Statistical Framework on Fauna H.1 Information Category: Social and Economic Activities and Natural
Events 16 H.2 Information Category: Environmental Impacts of Activities and
Events 18 H.3 Information Category: Responses to Environmental Impacts 19 H.4 Information Category: Stocks and Inventories 20
Statistical Framework on Atmosphere I.1 Information Category: Social and Economic Activities and
Natural Events 21 I.2 Information Category: Environmental Impacts of Activities and
Events 22 I.3 Information Category: Responses to Environmental Impacts 23 I.4 Information Category: Stocks and Inventories 24
Statistical Framework on Water J.1 Information Category: Social and Economic Activities and
Natural Events 25 J.2 Information Category: Environmental Impacts of Activities and
Events 27 J.3 Information Category: Responses to Environmental Impacts 29 J.4 Information Category: Stocks and Inventories 34
Statistical Framework on Land and Soil K.1 Information Category: Social and Economic Activities and
Natural Events 36 K2 Information Category: Environmental Impacts of Activities and
Events 38 K.3 Information Category: Responses to Environmental Impacts 39 K.4 Information Category: Stocks and Inventory 41

Compendium of Philippine Environment Statistics 2004 xi
Statistical Framework on Mineral and Energy Resources L.1 Information Category: Social and Economic Activities and
Natural Events 42 L.2 Information Category: Environmental Impacts of Activities and
Events 43 L.3 Information Category: Responses to Environmental Impacts 44 L4 Information Category: Stocks and Inventory 45
Statistical Framework on Human Settlements M.1 Information Category: Social and Economic Activities and Natural
Events 46 M.2 Information Category: Environmental Impacts of Activities and
Events 48 M.3 Information Category: Responses to Environmental Impacts 49 M.4 Information Category: Stocks, Inventories and Background
Conditions 50
Chapter 1. Flora and Fauna 1 Total Fish Production, 1992 to 2002, (metric tons) 1-3 2 Net Change (in percent) in the Quantity of Fish Landed, by Type of
Fishing, 1992 to 2002 1-5 3 Permits Issued for Wildlife Local Transport and Export, 1992 to
2002 1-8 1.1 Land Classification, 1991-2002 (in hectares) 1-10 1.2 Roundwood Production, 1992 to 2002 (in ‘000 cubic meters) 1-11 1.3 Log Production, by Region, 1992 to 2002 (in cubic meters) 1-11 1.4. Lumber Production, by Region, by Province, 1992 to 2002 (in cubic
meters) 1-12 1.5 Veneer Production, by Region, 1992 to 2002 (in cubic meter) 1-15 1.6 Plywood Production, by Region, 1992 to 2002 (in cubic meter) 1-15 1.7 Production of Processed Wood Products, 1992 to 2002 1-16 1.8 Production of Non-Timber Forest Products, by Region, 1992 to 2002 1-17 1.9 Production and Value of Seaweeds, 1995 to 2002 1-23
1.10a. Carabao: Total Inventory, by Region, 1992 to 2002 (in number of heads)) 1-24
1.10b Cattle: Total Inventory, by Region, 1992 to 2002 (in number of heads) 1-25
1.10c Goat: Total Inventory, by Region, 1992 to 2002 (in number of heads) 1-26
1.10d Hog: Total Inventory, by Region, 1992 to 2002 (in number of heads) 1-27
1.10e Chicken: Total Inventory, by Region, 1992 to 2002 (in number of heads) 1-28
1.10f Duck: Total Inventory, By Region, 1992 to 2002 (in number of heads) 1-29
1.11 Livestock and Poultry Production, 1992 to 2002, (in ‘000 metric tons) 1-30
1.12a Carabao Total Production, by Region, 1992 to 2002 (in metric tons) 1-31

Compendium of Philippine Environment Statistics 2004 xii
1.12b Cattle Total Production, by Region, 1992 to 2002 (in metric tons) 1-32 1.12c Goat Total Production, by Region, 1992 to 2002 (in metric tons) 1-33 1.12d Hog Total Production, by Region, 1992 to 2002 (in metric tons) 1-34 1.12e Chicken Total Production, by Region, 1992 to 2002 (in metric tons) 1-35 1.12f Duck Total Production, by Region, 1990 to 2002 (in metric tons, live
weight) 1-36 1.13 Wildlife Species Exported based on CITES/Non-CITES Permits
Issued, 1992 to 2002 1-37 1.14 Government Revenues from Wildlife Export, 1992 to 2002 (in Peso) 1-41 1.15 Total Fish Production, by Region, 1992 to 2002 (in metric tons) 1-42 1.16a Marine Fish Catch (Commercial and Marine Municipal Fishing):
Quantity of Fish Landed, by Region, 1992 to 2002 (in metric tons) 1-43 1.16b Marine Fish Catch (Commercial Fishing): Quantity of Fish Landed,
by Region, 1992 to 2002 (in metric tons) 1-44 1.16c Marine Fish Catch (Marine Municipal Fishing): Quantity of Fish
Landed, by Region, 1992 to 2002 (in metric tons) 1-45 1.16d Inland Fish Catch (Inland Municipal Fishing): Quantity of Fish
Landed, by Region, 1992 to 2002 (in metric tons) 1-46 1.16e Aquaculture Fishing: Quantity of Fish Production, by Region, 1992
to 2002 (in metric tons) 1-47 1.17 Total Value of Fish Production, 1992 to 2002 (in million pesos) 1-48 1.18a Marine Fish Catch (Commercial and Marine Municipal Fishing):
Value of Fish Landed, by Region, 1992 to 2001 (in ‘000 pesos) 1-49 1.18b Marine Fish Catch (Commercial Fishing): Value of Fish Landed, by
Region, 1992 to 2002 (in ‘000 pesos) 1-50 1.18c Marine Fish Catch (Marine Municipal Fishing): Value of Fish
Landed, by Region, 1992 to 2001 (in ‘000 pesos) 1-51 1.18d Inland Fish Catch (Inland Municipal Fishing): Value of Fish
Landed, by Region, 1992 to 2001 (in ‘000 pesos) 1-52 1.18e Aquaculture Fishing: Value of Fish Landed, by Region, 1992 to
2002 (in million pesos) 1-53 1.19 Export of Fish and Fishery Products: Quantity and Value by Kind,
1992 to 2002 1-54 1.20 Forest Disturbance, 1992 to 2002 (in hectares) 1-56 1.21 Forest Disturbance, by Region, 1996 to 2002 (in hectares) 1-57 1.22a Carabao: Percent Change in Population, by Region, 1992 to 2002 1-60 1.22b Cattle: Percent Change in Population, by Region, 1992 to 2002 1-61 1.22c Goat: Percent Change in Population, by Region, 1992 to 2002 1-62 1.22d Hog: Percent Change in Population, by Region, 1992 to 2002 1-63 1.22e Chicken: Percent Change in Population, by Region, 1992 to 2002 1-64 1.22f Duck: Percent Change in Population, by Region, 1992 to 2002 1-65 1.23a Carabao: Change in Population, by Region, 1992 to 2002 (in
number of heads) 1-66 1.23b Cattle: Change in Population, by Region, 1992 to 2002 (in number
of heads) 1-67 1.23c Goat: Change in Population, by Region, 1992 to 2002 (in number of
heads) 1-68

Compendium of Philippine Environment Statistics 2004 xiii
1.23d Hog: Change in Population, by Region, 1992 to 2002 (in number of heads) 1-69
1.23e Chicken: Change in Population, by Region, 1992 to 2002 (in number of heads) 1-70
1.23f Duck: Change in Population, by Region, 1992 to 2002 (in number of heads) 1-71
1.24 Rare, Threatened and Endangered Wildlife Species, 1992-2002 (Number of species) 1-72
1.25 Total Fish Production by Region: Percent Change in the Quantity of Fish Landed, by Region, 1992 to 2002 1-73
1.26a Marine Fish Catch (Commercial and Marine Municipal Fishing):Percent Change in the Quantity of Fish Landed, by Region, 1992 to 2002 1-74
1.26b Marine Fish Catch (Commercial Fishing): Percent Change in the Quantity of Fish Landed, by Region, 1992 to 2002 1-75
1.26c Marine Fish Catch (Marine Municipal Fishing): Percent Change in the Quantity of Fish Landed, by Region, 1992 to 2002 1-76
1.26d Inland Fish Catch (Inland Municipal Fishing): Percent Change in the Quantity of Fish Landed, by Region, 1992 to 2002 1-77
1.26e Aquaculture Fishing: Percent Change in the Quantity of Fish Landed, by Region, 1992 to 2002 1-78
1.26f Aquaculture Fishing (Brackishwater Fishpond): Percent Change in the Quantity of Fish Landed, by Region, 1992 to 2002 1-79
1.27 Total Fish Production by Region: Change in the Quantity of Fish Landed, by Region, 1992 to 2002 (in metric tons) 1-80
1.28a Marine Fish Catch (Commercial and Marine Municipal Fishing): Change in the Quantity of Fish Landed, by Region, 1992 To 2002 (In Metric Tons) 1-81
1.28b. Marine Fish Catch (Commercial Fishing): Change in the Quantity of Fish Landed, by Region, 1992 to 2000 (in metric tons) 1-82
1.28c Marine Fish Catch (Marine Municipal Fishing): Change in the Quantity of Fish Landed, by Region, 1992 to 2002 (in metric tons) 1-83
1.28d Inland Fish Catch (Inland Municipal Fishing): Change in the Quantity of Fish Landed, by Region, 1992 to 2002 (in metric tons) 1-84
1.28e Aquaculture Fishing: Change in the Quantity of Fish Landed, by Region, 1992 to 2002 (in metric tons) 1-85
1.29a Wildlife Species Protected: Listed under Cites Appendix I and Whose Commercial Export/Trade are Strictly Prohibited, 1992 to 2002 (number of species) 1-86
1.29b Wildlife Species Protected: Listed under Cites Appendix II and Whose Commercial Export/Trade are Strictly Regulated, 1992 to 2002 (number of species) 1-86
1.30 List of Flora and Fauna for Priority Protection Based on IUCN Red List of Threatened Species and CITES 1-87
1.31 Proclaimed Protected/Declared Areas under NIPAS, (as of year 2000) 1-140
1.32a Summary of Protected Areas, by Region, 1992 (area in hectares) 1-149 1.32b Summary of Protected Areas, by Region, 1993 (area in hectares) 1-150
Compendium of Philippine Environment Statistics 2004 xiv
1.32c Summary of Protected Areas, by Region, 1994 (area in hectares) 1-151 1.32d Summary of Protected Areas, by Region, 1995 (area in hectares) 1-152 1.32e Summary of Protected Areas, by Region, 1996 (area in hectares) 1-153 1.32f Summary of Protected Areas, by Region, 1997 (area in hectares) 1-154 1.32g Summary of Protected Areas, by Region, 1998 (area in hectares) 1-155 1.32h. Summary of Protected Areas, by Region, 1999 (area in hectares) 1-156 1.32i Summary of Protected Areas, by Region, 2000 (area in hectares) 1-157 1.32j Summary of Protected Areas, by Region, 2001 (area in hectares) 1-158 1.32k Summary of Protected Areas, by Region, 2002 (area in hectares) 1-159 1.33 List of Policy Issuances, 1995 to 2002 1-160 1.34 Forestry Licenses, Leases and Permits, 1992 to 2002 (area in
hectares, AAC in cubic meters, linear meter) 1-181 1.35 Permits Issued for Wildlife Local Transport, 1990 to 2002 (Number) 1-192 1.36 Permits Issued for Wildlife Export, 1992 to 2002 (number) 1-197 1.37 Number of Plants Confiscated, 1992 to 2001 1-198 1.38 Area Reforested by the Government and Private Sectors, 1992 to
2002 (In hectares) 1-201 1.39 Status of Known Mammals and Birds Species in the Philippines,
1997 -2002 (number of species) 1-202 1.40 Catcher Boats Issued CFVGL by BFAR, 1992 and 1996 to 2002 1-203
Chapter 2. Atmosphere 1 Pollutants from Different Sources in the National Capital Region,
2001 2.22.1 Philippine Emission Inventory, 2001 (tons) 2-52.2 Particulate Matter (PM) from Area, Stationary and Mobile Sources,
by Region, 2001 (tons) 2-62.3 Sulfur Dioxide (SOx) from Area, Stationary and Mobile Sources, by
Region, 2001 (tons) 2-72.4 Nitrogen Dioxide (NOx) from Area, Stationary and Mobile Sources,
by Region, 2001 2-82.5 Carbon Monoxide (CO) from Area, Stationary and Mobile Sources,
by Region, 2001 (tons) 2-92.6 Volatile Organic Compounds (VOC) from Area and Stationary
Sources, by Region, 2001 2-102.7 Power Plant Emissions (Based on Self Monitoring Reports), by
Region, 2001 2-112.8 Philippine Greenhouse Gas Inventory, 1994 (Ktons) 2-122.9 Philippine Annual Consumption of Hydroflourocarbons and
Alternatives Chloroflourocrabons, 1993 – 2001 (metric tons) 2-142.1 Philippine Annual Consumption of Chloroflourocarbons, 1993 –
2002 (metric tons) 2-152.11 Philippine Annual Consumption of Hydrochloroflourocarbons and
Methyl Bromides, 1993 – 2002 (metric tons) 2-162.12 Number of Forest Fire and Area Affected, 1987 to 2002 2-172.13 Historical Climate Data of the Philippines, 1966 to 2002 2-182.14 Annual Frequency of Tropical Cyclone, 1983 to 2002 2-20

Compendium of Philippine Environment Statistics 2004 xv
2.15 Min, Max and Ave Concentration of Total Suspended Particulates (Tsp) (Ug/Ncm) in the Atmosphere Air Quality Monitoring Station in Metro Manila, 1993 to 2002 2-21
2.16 Morbidity due to Respiratory Diseases, 1993 – 2001 (number and rate per 100,000 population) 2-23
2.17 Permits Issued for Air and Water Pollution Control Devices, 2000 To 2002 2-24
2.18 Climatological Normals by Month and by Selected Station, 1971 to 2000 2-25
2.19 List of Policy Issuances for the Air Sector, 1996-2002 2-31
Chapter 3. Water 1 Groundwater Permits Issued, by Use and by Region, 2002 3-82 Surface Water Permits Issued, by Use and by Region, 2002 3-9
3.1 Domestic Demand from Groundwater, 1988-2001 (in million cubic meters) 3-10
3.2 Domestic Demand from Surface Water, 1988-2000, (in million cubic meters) 3-11
3.3. Agricultural Demand for Surface Water, 1988 - 2000 (in million cubic meters) 3-12
3.4 Industrial Ground Water Demand, by Region, 1988 - 2001 (in million cubic meters) 3-12
3.5 Industrial Demand for Surface Water, by Region, 1988 – 2000 (in million cubic meters) 3-13
3.6 Physical Accounts: Groundwater, 1988- 2001 (in million cubic meter) 3-143.7 Physical Accounts: Surface Water, 1988 - 2000 (in million cubic
meters) 3-143.8 Water Production Data of Water Districts with Available Data (in
‘000 cubic meters) 2003 3-153.9 Duly Organized Water Districts, Filed and Issued Conditional
Certificate of Conformance, per region, 1999 to 2002 3-163.10a Irrigation Development by Region, 1996 and 1997, (area in hectares) 3-173.10b Status of Irrigation Development, by Region, 1998 and 1999 (area in
hectares) 3-183.10c Status of Irrigation Development, by Region, as of December 31,
2000 (area in hectares) 3-193.10d Status of Irrigation Development, by Region, 2001 and 2002 (area in
hectares) 3-203.11 Number of Ports by Region (as of December 1999) 3-213.12 Summary of Disaster Incidents, 1994, 1996 to 2002 3-223.13 Annual Average BOD and DO Concentration in Pasig River, 1996-
2000 Mg/L 3-233.14 Annual Averages of DO and BOD Concentrations in NCR Rivers,
1995 - 2002 (mg/l) 3-233.15 Occurrence of Harmful Algal Blooms (HABS) in the Philippines,
1992 to 2002 3-24

Compendium of Philippine Environment Statistics 2004 xvi
3.16a Reported Cases of Notifiable Diseases - Typhoid & Paratyphoid Fever and other Salmonella Inf., 1994 – 1998, 2000 (no. and rate/100,000 Pop.) 3-27
3.16b Reported Cases of Notifiable Diseases - H-Fever and Dengue Fever, 1994 – 1998, 2000 (no. and rate/100,000 Pop.) 3-28
3.16c Reported Cases of Notifiable Diseases – Malaria, 1994 – 1998, 2000(no. and rate/100,000 Pop.) 3-29
3.16d Reported Cases of Notifiable Diseases – Schistosomiasis, 1994 –1998, 2000 (no. and rate/100,000 Pop.) 3-30
3.16e Reported Cases of Notifiable Diseases – Cholera, 1994 – 1998, 2000(no. and rate/100,000 Pop.) 3-31
3.17 Water Rights for Industrial Consumption Granted by National Water Resources Board (NWRB), 1992 to 2002 3-32
3.18a Water Rights Granted by the National Water Resources Board(NWRB), 1997, in lps 3-33
3.18b Water Rights Granted by the National Water Resources Board (NWRB), 1998, in lps 3-34
3.18c Water Rights Granted by the National Water Resources Board (NWRB), 1999, in lps 3-35
3.18d Water Rights Grants by National Water Resources Board (NWRB),2000, in lps 3-36
3.18e Water Rights Grants by National Water Resources Board (NWRB),2001, in lps 3-37
3.18f Water Rights Grants by National Water Resources Board (NWRB),2002, in lps 3-38
3.19 Projected Water Consumption in Metro Manila, 1995 to 2025,in million cubic meters 3-39
3.20 Projected Water Consumption by Water Districts in Selected, Regions, (in million cubic meters), 1990 to 2025 3-40
3.21 Projected Services Coverage and Water Demand for Public Water Supply, 2000 and 2005 3-41
3.22 Utilization of Areas for Industrialization, as of year 2003 3-463.23 Inventory of Classified Waterbodies, as of December 2002 3-603.24 Classification of Water Bodies 3-803.25 List of Rivers Surveyed and Categorized According to Pollution
Level in Selected Regions, 1989 to 2002 3-813.26 Policy Issuances 3-85
Chapter 4. Land and Soil
1 Physical Asset Account of Land Resources Devoted to Forest Uses, 1988-1997 4-1
2 Number and Floor Area of Residential Building Constructed 1992 –2001 (area in ‘000 sq. m) 4-2
4.1 Physical Area of Land by Utilization, 1988-2000 4-54.2 Physical Area of Land by Agricultural Production, 1988-2000, (in
‘000 hectares) 4-64.3 Number and Floor Area/Length of Local Government Construction
by Type of Construction, 1992 to 2000 (area in ‘000 square 4-7
Compendium of Philippine Environment Statistics 2004 xvii
kilometers)
4.4 Length of National Roads, by Type of Surface, 1992 to 1998 and 2000 to 2002 4-8
4.5a Length of Local Roads, by Type of Surface, 2000 and 2001 (in kilometers) 4-9
4.5b Length of Local Roads, by Type of Surface (as of December 2002) in kilometers 4-10
4.6a Production, Importation and Consumption of Fertilizers, 1995 to 2000 (in ‘000 metric tons) 4-11
4.6b Production and Importation of Fertilizers, 2001 to 2002 (in ‘000 metric tons) 4-12
4.7 Inventory of Land Area Reclaimed Nationwide Prior to 1988, 1993 to 2001 (in hectares) 4-13
4.8 Hazardous Waste Generation, Amount by Type of Hazardous Waste, as of year 2000 4-14
4.9 Hazardous Waste Generation Amount by Type and Industrial Category (Unit: tons/year), as of year 2000 4-15
4.10 Regional Distribution of HW Generation Amount by Type of HW, as of year 2000 4-16
4.11 Damages Caused by Major Natural Disasters, 1990 to 2002 4-174.12 Irrigated Land by Type of Irrigation, 1993 to 2002 (in hectare) 4-184.13 Summary of Approved and Disapproved Applications for Land Use
Conversion, 1979 to 2001 (in hectares) 4-194.14 Summary of Approved and Disapproved Applications for Land Use
Conversion, by Region, 2001 (in hectares) 4-204.15 Physical Asset Account of the Land and Soil Resources Devoted to
Agricultural Uses, 1988-2000 4-214.16 Physical Asset Account of Land Resources Devoted to Forest Uses,
1988-1997 4-224.17 Physical Asset Account of (Environmental) Land Resources
Devoted to Forest Uses, 1988-1997 4-234.18 Physical Asset Account of (Economic) Land Resources Devoted to
Forest Uses, 1988-2000 4-244.19 Physical Asset Account of Brushland Resources, 1988-1997 4-254.20 Physical Agricultural Soil Resource Accounts, 1988-2000 4-264.21 List of Policy Issuances for the Lands Sector, 1996-2002 4-27
Chapter 5. Mineral and Energy
1 Production of Selected Non-metallic Minerals, 1992 to 2002 (in ‘000 metric tons) 5-2
2 Installed Generating Capacity, 1992 to 2002 (in megawatts) 5-35.1 Metallic Mineral Production, 1992 to 2002 (volume: in ‘000s unit
used; value: in million pesos) 5-65.2 Non-Metallic Mineral Production, 1992- 2002 (volume in ‘000s unit
used, value: in million pesos) 5-75.3 Accident Statistics, FY 1994 to 2002 5-8
Compendium of Philippine Environment Statistics 2004 xviii
5.4 Metallic Mine Waste and Tailings Generated, Utilized and Contained, 1970 to 2002 (quantity in ‘000 metric tons; value in ‘000 pesos) 5-10
5.5a Metallic Mine Waste and Tailings Generation (by region), 2000 5-115.5b Metallic Mine Waste and Tailings Generation (by region), 2002 5-115.6 Non-Metallic Mine Waste and Tailings Generated, Utilized and
Contained, 1970 to 2000, and 2002 (quantity in ‘000 metric tons; value in ‘000 pesos) 5-12
5.7a Non-Metallic Mine and Plant Wastes Generation (by region) (as of 2000) 5-13
5.7b Non-Metallic Mine and Plant Wastes Generation, by region, as of 2002 (in metric tons) 5-13
5.8a Summary of Philippine Metallic Mineral Resource and Reserve Inventory, by commodity, as of year 2000 5-14
5.8b Summary of Philippine Metallic Mineral Resource and Reserve Inventory, by commodity, as of year 2001 5-15
5.9a Summary of Philippine Metallic Mineral Resource and Reserve Inventory, by commodity, as of year 2000 5-16
5.9b Summary Philippine Non Metallic Mineral Resource and Reserve Inventory, by Commodity, as of year 2002 5-19
5.10 Coal Production, By Major Area, 1995 - 2002 (quantity at 10,000 BTU per pound) 5-21
5.11 Energy Consumption by Source, 1992 to 2002 (in million barrels of fuel-oil equivalent, MMBFOE) 5-22
5.12 Coal Consumption, By Major User, 1990 - 2002 (metric tons) 5-235.13 Electric Energy Consumption by Sector, 1992 to 2002 (in million
kilowatt hours) 5-245.14 Installed Generating Capacity, 1992 to 2002 (in megawatts) 5-255.15 Power Generation by Utility, 1992 to 2002 (in million kilowatt-
hours) 5-265.16 List of DENR Policy Issuances for the Mines Sector (1996-2002) 5-27
Chapter 6. Human Settlements
1 Population of the Philippines and Energy Consumption, 1990, 1995, 2000 6-2
2 Number of Shelter Security Units Constructed, Financed and/or Administered by the Government 1992-2002 6-2
3 Percentage Distribution of Households with Access to Sanitary Toilets and Safe Drinking Water, 1999 to 2002 6-3
4 Selected Natural Disaster Occurrences, 1993 to 2002 6-46.1 Population Growth Rate, by Region and Province: Census Years,
1980 to 2000 6-66.2 Volume of Crude Oil Importations, by Country of Origin, 1992 to
2002 6-76.3 Energy Consumption by Source, 1992 to 2002 6-86.4 Number of Motor Vehicles Registered, by Type of Vehicle: 1990 to
2002 6-9

Compendium of Philippine Environment Statistics 2004 xix
6.5 Summary of Status of Preparation of Comprehensive Land Use Plans of Cities/Municipalities, by region, as of May 30, 2000 6-10
6.6a Number of Shelter Security Units/Expenditures (values in M Pesos) by Shelter Agencies and Program, 1992 – 2000 6-11
6.6b Number of Shelter Security Units/Expenditures (values in M Pesos) by Shelter Agencies and Program, 1990 – 2000 6-14
6.7 Number of Shelter Security Units Constructed, Financed and/or Administered by the Government, 1992-2002 6-16
6.8 Subdivisions/Projects Investigated for Violations1994 - 2002 6-176.9 Disaster Occurrences, 1993 to 2002 6-18
6.10a Natural Disaster Incidents, 1995 6-206.10b Natural Disaster Incidents, 1996 6-216.10c Natural Disaster Incidents, 1997 6-226.10d Natural Disaster Incidents, 1998 6-236.10e Natural Disaster Incidents, 1999 6-246.10f Natural Disaster Incidents, 2000 6-256.10g Natural Disaster Incidents, 2001 6-266.10h Natural Disaster Incidents, 2002 6-276.11 Population by Age Group and Region, 2000 6-286.12 Percentage of Households with Access to Sanitary Toilet, by
Region, 1994, and 1998 to 20029 6-306.13 Percentage of Households with Access to Safe Water Supply, by
Region, 1998 to 2002 6-316.14 National Roads, by Surface Type, 1992 to 1996 and 2002 (in
kilometers) 6-326.15 Length and Percentage of Permanent and Temporary Bridges, by
Region, Philippines, 1999 to 2002 6-336.16a List of Disaster Prone Areas, by Type of Disaster (as of December
2000) 6-346.16b List of Disaster Prone Areas, by Type of Disaster (as of December
2002) 6-376.17 Infant Mortality Rate, by Region 1992 to 1998 (in ‘000) 6-406.18 Unemployment Rate, by Region 1992 to 2002 (In percent) 6-41

Introduction
Compendium of Philippine Environment Statistics 2004 1
INTRODUCTION
This is the third issue of the Compendium of Philippine Environment
Statistics (CPES) compiled by the National Statistical Coordination Board (NSCB). The compilation is an ongoing effort of NSCB in fulfilling its foremost objective: to develop an orderly Philippine Statistical System capable of providing timely, accurate, relevant, and useful data for the government and the public for planning and decision.
The work on environment statistics was initiated through the technical
Assistance of the Asian Development Bank (ADB) through RETA 555 “Institutional Strengthening and Collection of Environment Statistics in Selected Developing Member Countries. The primary objective of the project was the development of the Philippine Framework for the Development of Environment Statistics (PFDES).
The document is divided into six chapters corresponding to the following
components of our natural environment: Flora and Fauna; Atmosphere; Water; Land and Soil; Mineral and Energy Resources; and Human Settlements. The first five chapters concern our natural resources while the last chapter, Human Settlements, deals with the “habitat” or environment of human beings encompassing both rural and urban areas where man settles to live.
Each chapter/component contain: (a) the statistical framework showing the
specific variables and the measurements needed to quantify the topics/items in the conceptual framework; (b) a short discussion on the major issues and concerns supported by data collected; and (c) additional statistical tables reflecting the sequence of events from human activities and natural events creating an impact on the environment and individuals and social responses to avoid or mitigate these impacts. The levels of disaggregation vary depending on the availability of data.
The Glossary of Terms, which contains the terminologies and definitions used
in the compendium, is included in the publication. Inclusion of the Glossary is a way by which we hope to enhance the usefulness of the statistics presented in the compendium. As work on the institutionalization of the PFDES continues, we hope to expand and improve our future publications, including the standardization of terms to conform with internationally accepted definitions while at the same time maintaining relevance to the local situation.
A List of Acronyms and Abbreviations of Terms used in the compendium is
likewise added.

The Philippine Framework for the Development of
Environment Statistics (PFDES) The PFDES is a systematic organization of the interdisciplinary nature of
environment statistics and focuses on the identification, description and presentation of data variables which are useful for tracing and verifying interrelationships of human activities and natural events with the environment. As agreed upon during the Inception Workshop on the Institutional Strengthening and Collection of Environment Statistics in selected developing member countries (RETA 5555) held in Manila on September 18-21, 1995, the United Nations FDES (UNFDES) will serve as a guide in formulating the PFDES. The UNFDES was then realigned to the Philippine setting to meet the country’s specific concerns.
The PFDES relates each component of the environment (Flora, Fauna,
Atmosphere, Water, Land and Soil, Mineral and Energy Resources, Flora and Human Settlements) to four information categories, namely: (1) Social and economic activities and natural events; (2) Environmental impacts of activities and events; (3) Responses to environmental impacts; and (4) Stocks and inventories (Tables A to F).
Social and economic activities and natural events include human activities and
natural events which directly affect the different components of the environment, thus, producing environmental impacts. Human activities like the production and consumption of goods and services affect the different components of the environment through the direct use or misuse of natural resources or through the generation of waste and the emissions in production and consumption processes. Likewise, natural events such as typhoons, earthquakes and volcanic eruptions also have impacts on the different environmental media. Natural disasters, largely caused by human activities, also stress the balance of the environment.
Environmental impacts of activities and events, as the name suggests, attempts
to quantify the negative effects on the environment of man’s activities and natural events. Negative impacts are manifested in the depletion of natural resources (measured in terms of changes in the quantity), environmental degradation (measured in terms of the changes in the quality) and the consequential health and welfare effects.
Man’s various attempts to curb and mitigate these negative impacts give rise to
the third information category, namely, responses to environmental impact s. These responses can either be defensive/curative such as cleaning up or preventive such as regulating human behaviour. Further, responses may be in the form of policies, programs and projects designed to monitor and control pollutants, develop and apply environmentally sound techniques, change the production and consumption patterns, manage and use properly the natural resources, prevent and mitigate the effects of natural disasters and improve the living conditions in human settlements. Such efforts are, in turn, carried out either through individual actions in the case of households and entrepreneurs, or through collective actions in the case of government organizations such as UNESCO.

TABLE A: CONCEPTUAL FRAMEWORK ON FLORA
Social and economic activities and natural events
Environmental impacts of activities and events Responses to environmental impacts Stocks and inventories
1. Agriculture 1. Proliferation, depletion, and 1. Management, protection, and 1. Forestry stocks
1.1 Upland farming extinction of species conservation 1.1 Regulation 1.1 Forest inventories
2. Forestry and logging 2. Depletion/growth of forest (a) issuance of policies and (a) timber inventory 2.1 Logging resources administrative orders (b) non-timber inventory
(a) Roundwood production (b) issuance of licenses, (b) Non-timber production 3. Changes of habitat/ecosystem permits,certificates, 1.2 Genetic resources
2.2 Wood production for paper agreements, and leases manufacturing (c) confiscation of banned and 1.3 Manmade capital stocks
2.3 Deforestation protected flora 1.2 Protection of degraded 2. Other flora inventory
3. Informal hunting, trapping, and habitat/ecosystem gathering 2. Rehabilitation of degraded
4. Naturally-growing flora habitat/ecosystem 4.1 Non-marine
(a) Roundwood production (b) Non-timber production
4.2 Marine 5. Natural events
5.1 Weather and climatic hazards 5.2 Geological hazards 5.3 Biological hazards
6. Land use

TABLE B. CONCEPTUAL FRAMEWORK ON FAUNA
Social and economic activities and natural events
Environmental impacts of activities and events
Responses to environmental impacts
Stocks and inventories
1. Livestock and Poultry 1. Proliferation, depletion, 1. Management, protection and 1. Livestock inventory
Production extinction of species conservation of wild animals 2. Hunting/trapping and 2. Changes of habitats/ecosystem 2. Rehabilitation of degraded 2. Fauna Inventory
gathering of wildlife environments 3. Fishing 3. Human health and welfare 3. Agencies involved in wildlife 3. Endangered and threatened impacts protection (PAWB, BFAR, species inventory BAI) 4. Introduced species 4. Fishery stock 5. Use of draught animals 6. Emissions hazardous to fauna 7. Natural disasters (drought, fire,
pests)

TABLE C. CONCEPTUAL FRAMEWORK OF ATMOSPHERE
Social and economic activities and natural events
Environmental impacts of activities and events
Responses to environmental impacts Stocks and inventories
Emission of air pollutants from: Air quality (ambient concentrations Air pollution monitoring and control Climate conditions and air quality
− Stationary sources (industry, of air pollutants) households, agriculture) Disaster Management
− Mobile sources Human health and welfare impacts Emission inventory (types and (transportation) sources of pollution)
Solar energy generation Climate changes (global warming) Inventory of areas vulnerable to air Natural events and man-made Impacts on land, water, biodiversity, pollution
disasters artifacts (from acidic − Forest fires precip itation) − Volcanic eruptions − Weather and climate hazards

TABLE D. CONCEPTUAL FRAMEWORK ON WATER Social and Economic Activities
and Natural Events Environmental Impacts of
Activities and Events Responses to Environmental
Impacts Stocks and Inventories
Freshwater: 1. Use of water resources and 1. Water depletion 1. Water protection, management 1. Cyclical resources
related activities and conservation 2. Effluents, waste loadings and 2. Environmental quality 2. Water pollution monitoring and 2. Stock of infrastructure
application of chemicals control 3. Natural events 3. Environmental disaster 3. Prevention and hazard mitigation of natural disasters Marine water: 1. Use of water resources and 1. Water degradation 1. Water management and 1. Cyclical resources
related activities rehabilitation
2. Effluents, waste loadings into 2. Environmental quality 2. Pollution monitoring and control 2. Stock of infrastructure marine water
3. Natural events 3. Environmental disaster 3. Prevention and mitigation of natural disasters

TABLE E: CONCEPTUAL FRAMEWORK ON MINERAL AND ENERGY RESOURCES
Social and Economic Activities, and Natural Events
Environmental Impacts of Activities/Events
Responses to Environmental Impacts
Stocks, Inventories and Background Conditions
I. Mineral Resources 1. Extraction of mineral resources 1. Mineral resources depletion 1. Mineral resource management 1. Non-renewable mineral
1.1 Surface 1.1 Depletion of non- metallic and conservation resources (opening and 1.1a Non-metallic mineral mineral resources by type closing stocks)
production by type 1.1 Issuance of mining licenses 1.1 Non-metallic 1.1.b. Non-metallic 1.2 Depletion of metallic vis-à-vis : environmental mineral reserves by type
mineral exploration mineral resources by type compliance certificate by type 1.2 Mining infrastructure
1.2 Subsurface 2. Discharges of residue 1.2 Closure of mining 1.2.a Metallic mineral sites due to negative 1.3 Metallic mineral reserves
exploration by type 3. Human health impacts effects on the environment by type 1.2.b Metallic mineral
production by type 2. Rehabilitation of mining areas 2.1 Rehabilitation of 2. Mineral reserves 2. Political, economic, and abandoned mine sites
natural events 2.2 Protection works for 2.1 Political on-going mining
Closure of mining sites operations due to peace and order problems
2.2 Economic Closure of mining sites economic reasons (price too due to low)

TABLE E. (continued)…
Social and Economic Activities, and Natural Events
Environmental Impacts of Activities/Events
Responses to Environmental Impacts
Stocks, Inventories and Background Conditions
2.3 Nature Closure of mining sites due to natural calamities like volcanic eruptions
II. Energy Resources 1. Production and consumption of 1. Mineral resource depletion 1. Mineral resource management 1. Non-renewable mineral
mineral and conservation 1.1 Stock of Energy 1.1 Energy resources 1.1 Depletion of energy 1.1 Regulation via permit and resources by type
production(discovery, licensing system to development, and Resources conduct mining activities extraction) by type 1.2 Private sector
1.2 Energy conversion by type response on energy 1.3 Energy consumption by conservation
type of user 1.3 Economic policies
2. Natural events regulating the energy sector
2.1 Closure of mining sites due to natural calamities like volcanic eruptions
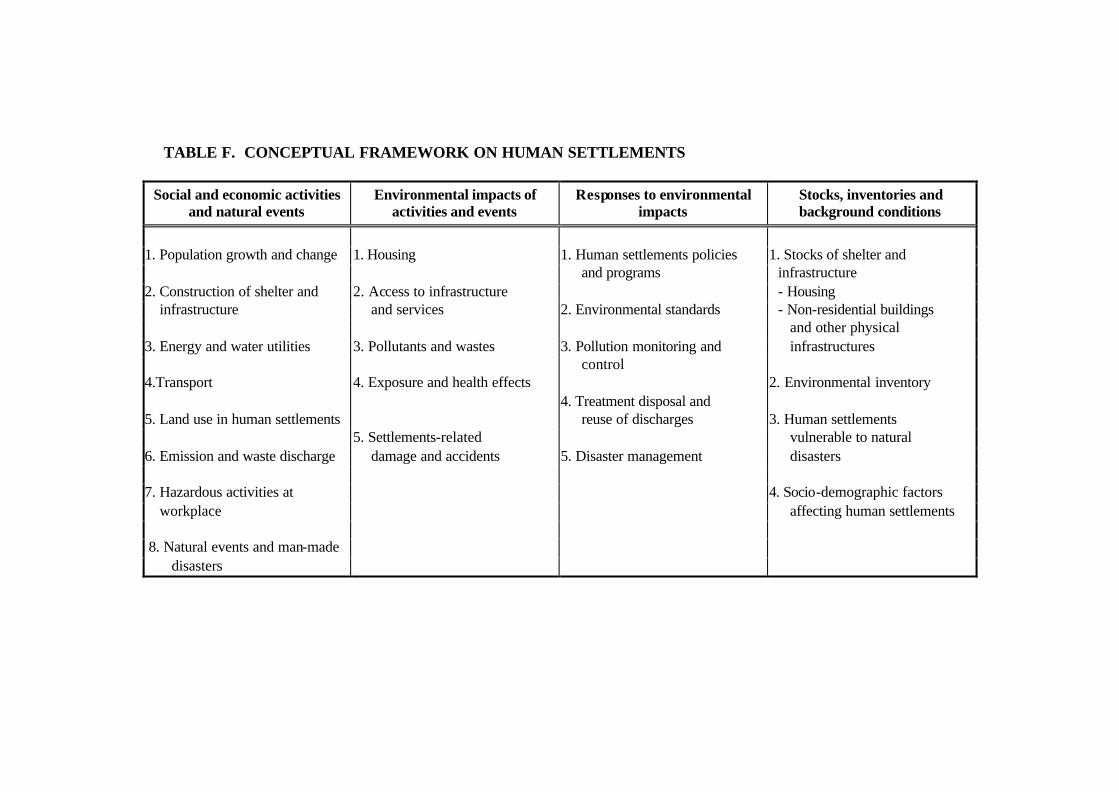
TABLE F. CONCEPTUAL FRAMEWORK ON HUMAN SETTLEMENTS
Social and economic activities and natural events
Environmental impacts of activities and events
Responses to environmental impacts
Stocks, inventories and background conditions
1. Population growth and change 1. Housing 1. Human settlements policies 1. Stocks of shelter and and programs infrastructure 2. Construction of shelter and 2. Access to infrastructure - Housing
infrastructure and services 2. Environmental standards - Non-residential buildings and other physical 3. Energy and water utilities 3. Pollutants and wastes 3. Pollution monitoring and infrastructures control 4.Transport 4. Exposure and health effects 2. Environmental inventory 4. Treatment disposal and 5. Land use in human settlements reuse of discharges 3. Human settlements 5. Settlements-related vulnerable to natural 6. Emission and waste discharge damage and accidents 5. Disaster management disasters 7. Hazardous activities at 4. Socio-demographic factors
workplace affecting human settlements 8. Natural events and man-made
disasters

The fourth category, stocks and inventories, is intended to provide “benchmark” data for possible linkage with other subject areas.
Within each information category are statistical topics which formed the basis
in identifying relevant statistical variables to be included in the framework. Statistical Framework
To operationalize the conceptual framework, the statistical framework for all the component of the environment (Flora, Fauna, Atmosphere, Water, Land and Soil, Mineral and Energy Resources, Flora and Human Settlements) as related to the four information categories was developed. The statistical framework for each component is shown in Table G to L. The statistical framework starts with the topics/items identified in the conceptual framework and proceeds to the identification of specific relevant variables and their corresponding units of measurement needed to quantify the earlier discussed concepts.
However, not all variables identified in the statistical framework are available

TABLE G.1. STATISTICAL FRAMEWORK ON FLORA INFORMATION CATEGORY: Social and Economic Activities and Natural Events
TOPIC/ITEM VARIABLE/S MEASUREMENT
1. Agriculture 1.1 Upland Farming Forest area cleared for agricultural production hectare
Area harvested/used in kaingin hectare 2. Forestry and logging
2.1 Logging (a) roundwood production Volume of log production cubic meter/year (b) non-timber production Annual rate of change percent
Rattan production number of poles or linear meter 2.2 Wood production used for paper Volume of production cubic meter/year
manufacturing Annual rate of change percent 2.3 Deforestration Average annual deforested area hectare
3. Informal hunting, trapping, and gathering Number of confiscated wildlife flora number 4. Naturally-growing flora
4.1 Non-marine Annual rate of change percent (a) roundwood production Production of ornamentals number (b) non-timber production Production of bamboo stumps number
4.2 Marine Production of (a) seagrass ton (b) mangrove ton (c) seaweed ton

TABLE G.1. STATISTICAL FRAMEWORK ON FLORA INFORMATION CATEGORY: Social and Economic Activities and Natural Events (continued)….
TOPIC/ITEM VARIABLE/S MEASUREMENT
5. Natural events 5.1 Weather and climatic hazards Precipitation, deviation from seasonal mean mm, km2 Temperature, deviation from seasonal mean 0C, km2 Cloud cover, deviation from seasonal mean h, km2 Wind km/h Forest fire days, km2 5.2 Geological hazards Earthquake and volcanic eruption Richter scale, km2, h Tidal wave m, h, km2
Floods m, h, km2 Landslides km2
5.3 Biological hazards Infestation km2, days Disease outbreak number, km2 , days
6. Land use Area of land conversion hectare Area of forestry and grazing land hectare
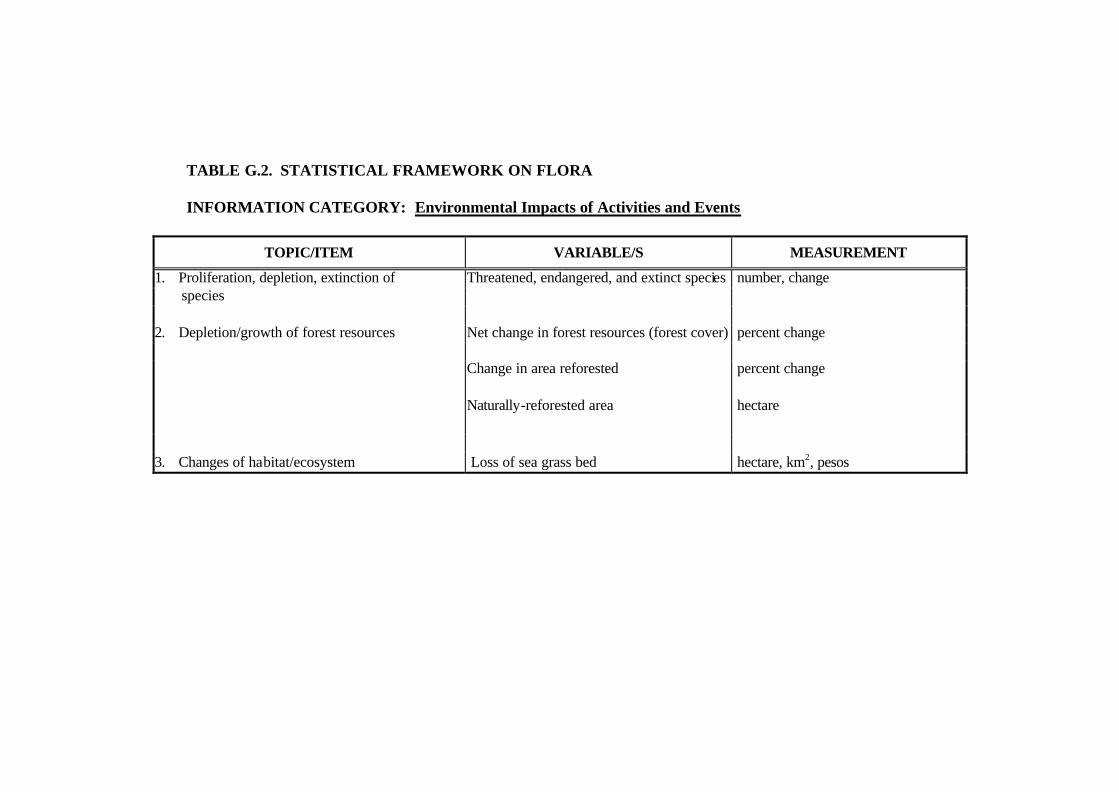
TABLE G.2. STATISTICAL FRAMEWORK ON FLORA INFORMATION CATEGORY: Environmental Impacts of Activities and Events
TOPIC/ITEM VARIABLE/S MEASUREMENT
1. Proliferation, depletion, extinction of Threatened, endangered, and extinct species number, change species
2. Depletion/growth of forest resources Net change in forest resources (forest cover) percent change Change in area reforested percent change Naturally-reforested area hectare 3. Changes of habitat/ecosystem Loss of sea grass bed hectare, km2, pesos

TABLE G.3. STATISTICAL FRAMEWORK ON FLORA INFORMATION CATEGORY: Responses to Environmental Impacts
TOPIC/ITEM VARIABLE/S MEASUREMENT
1. Management, protection and conservation 1.1 Regulation
(a) issuance of policies and administrative Policy and administrative order number/list orders
(b) issuance of licenses, permits, certificates, Licenses, permits, certificates, agreements, agreements, and leases and leases number, hectare
(c) confiscation of banned and protected flora Confiscated banned and protected flora number
1.2 Protection and conservation National protected areas number (fully and partially (a) NIPAS sites protected areas), percentage to (b) IUCN categories total forest area International protected areas number, hectare (a) World Heritage Sites (b) Biosphere reserves Protected flora species number Budget million pesos Expenditure million pesos Protected areas management boards number of sites 2. Rehabilitation of degraded habitat
2.1 Rehabilitation of degraded flora habitat Rehabilitation programs implemented number, hectare (area covered) Area afforested and reforested hectare

TABLE G.4. STATISTICAL FRAMEWORK ON FLORA INFORMATION CATEGORY: Stocks and Inventories
TOPIC/ITEM VARIABLE/S MEASUREMENT
1. Forestry stocks
1.1 Forest inventories Stock of forest trees metric ton/year (a) timber and non-timber inventories Known and endemic species by forest type number
1.2 Genetic resources Adopted varieties number
1.3 Man-made capital stocks Machinery and equipment, technology, etc. number, pesos
for forestry activities Capacity to produce seedlings for reforestation 2. Other flora inventory Area covered by aquatic plants hectare Aquatic plants number Threatened, endangered and extinct species number

TABLE H.1. STATISTICAL FRAMEWORK ON FAUNA INFORMATION CATEGORY: Social and Economic Activities and Natural Events
TOPIC/ITEM VARIABLES MEASUREMENT
1. Livestock and poultry production Livestock and poultry (as it affects wild fauna) − population Quantity (number of head)
− production Volume (metric ton)
− practice of raising animals (feedlot, pasturage,
rangeland, etc.) Area (hectare)
Ranch area for stock farm Area (hectare) 2. Hunting/Trapping and gathering of Formal sector of hunting and trapping Quantity (number) and Value (peso)
Wildlife − large and small mammals − birds − other animals − reptiles − amphibians − fishes − insects Informal sector of hunting and trapping Quantity (number) and Value (peso) − mammals − birds − other fauna (e.g., snakes, crocodile, frogs, etc.) 3. Fishing Fish catch Volume (metric ton) and Value (peso) − marine − freshwater − invertebrate − aquaculture Export of fish and fish products Volume (metric ton) and Value (peso)

TABLE H.1. STATISTICAL FRAMEWORK ON FAUNA INFORMATION CATEGORY: Social and Economic Activities and Natural Events (continued)...
TOPIC/ITEM VARIABLES MEASUREMENT
Imputed value of informal fish catch Value (peso) 4. Introduced species Number of introduced species Quantity (number of species) 5. Use of draught animals Population of draught animals by type of activity used Quantity (number) 6. Emissions hazardous to Fauna Population of affected fauna by type of emission Quantity (number of head) Amount of emission Volume 7. Natural disasters Population of affected fauna by type of natural disaster Quantity (number of head) Number of animals affected by type of disease Quantity (number of head)
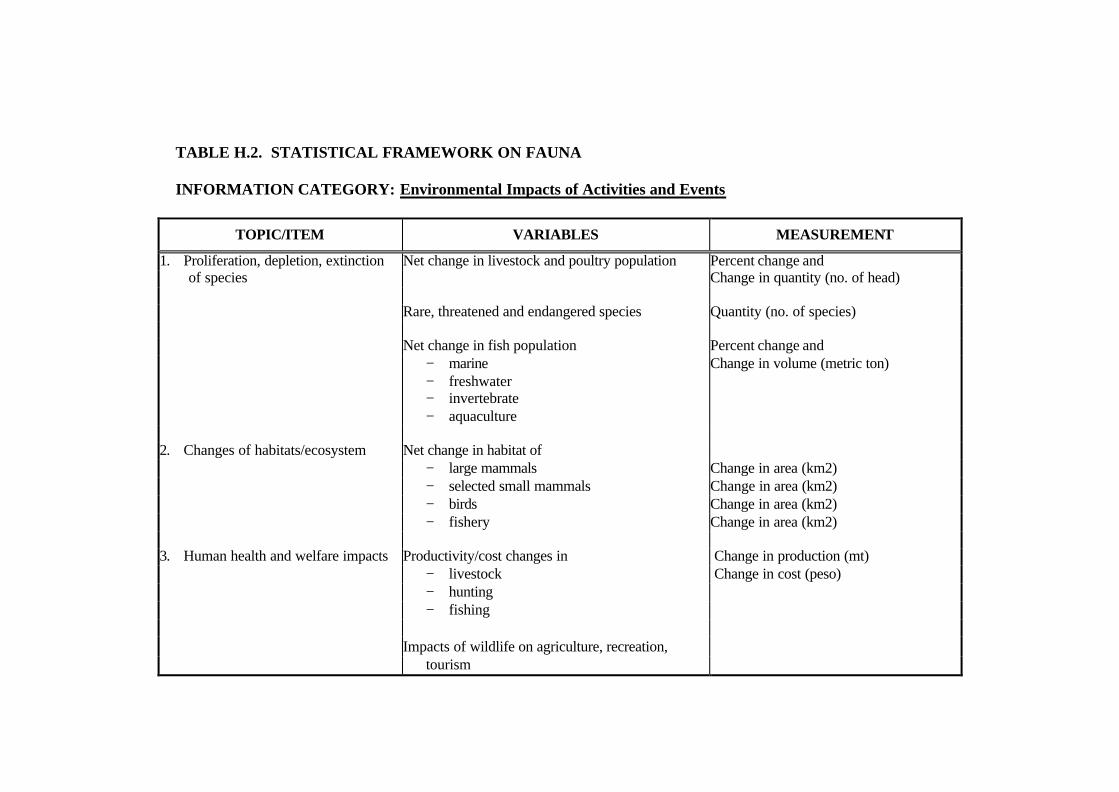
TABLE H.2. STATISTICAL FRAMEWORK ON FAUNA INFORMATION CATEGORY: Environmental Impacts of Activities and Events
TOPIC/ITEM VARIABLES MEASUREMENT
1. Proliferation, depletion, extinction Net change in livestock and poultry population Percent change and of species Change in quantity (no. of head)
Rare, threatened and endangered species Quantity (no. of species) Net change in fish population Percent change and − marine Change in volume (metric ton) − freshwater − invertebrate − aquaculture 2. Changes of habitats/ecosystem Net change in habitat of − large mammals Change in area (km2) − selected small mammals Change in area (km2) − birds Change in area (km2) − fishery Change in area (km2) 3. Human health and welfare impacts Productivity/cost changes in Change in production (mt) − livestock Change in cost (peso) − hunting − fishing Impacts of wildlife on agriculture, recreation, tourism
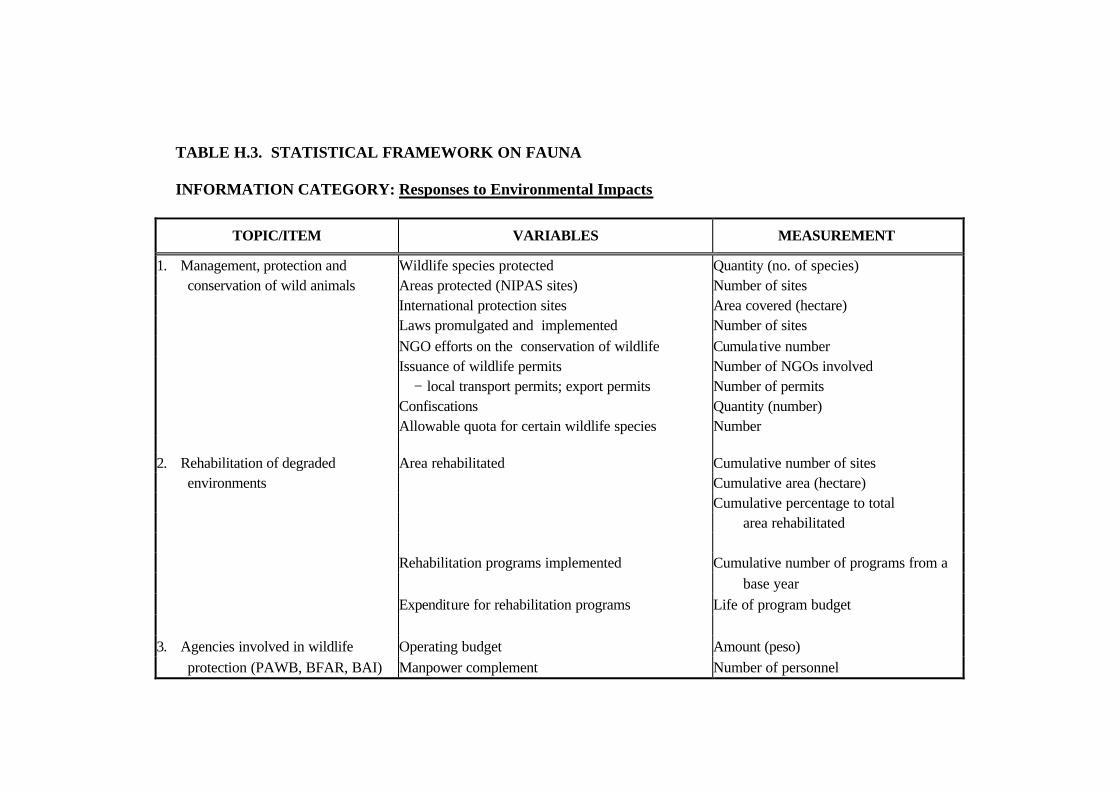
TABLE H.3. STATISTICAL FRAMEWORK ON FAUNA INFORMATION CATEGORY: Responses to Environmental Impacts
TOPIC/ITEM VARIABLES MEASUREMENT
1. Management, protection and Wildlife species protected Quantity (no. of species) conservation of wild animals Areas protected (NIPAS sites) Number of sites
International protection sites Area covered (hectare) Laws promulgated and implemented Number of sites NGO efforts on the conservation of wildlife Cumulative number Issuance of wildlife permits Number of NGOs involved − local transport permits; export permits Number of permits Confiscations Quantity (number) Allowable quota for certain wildlife species Number 2. Rehabilitation of degraded Area rehabilitated Cumulative number of sites
environments Cumulative area (hectare) Cumulative percentage to total area rehabilitated Rehabilitation programs implemented Cumulative number of programs from a base year Expenditure for rehabilitation programs Life of program budget 3. Agencies involved in wildlife Operating budget Amount (peso)
protection (PAWB, BFAR, BAI) Manpower complement Number of personnel

TABLE H.4. STATISTICAL FRAMEWORK ON FAUNA
INFORMATION CATEGORY: Stocks and Inventories
TOPIC/ITEM VARIABLES MEASUREMENT
1. Livestock Number of livestock and poultry Quantity (no. of head) 2. Fauna inventory Number of Quantity (no. of species) − large/small mammals − birds − reptiles − amphibians − insects 3. Endangered and threatened species Rare, threatened and endangered species Quantity (no. of species)
inventory 4. Fishery stocks Fish stocks Volume (metric ton) − marine − freshwater − invertebrate
− aquaculture Capital Stocks Number − fishing fleet − fishing equipment Employment in the fishery sector − households dependent on fishing as source of Number livelihood − number of fishermen Number

TABLE I.1. STATISTICAL FRAMEWORK ON ATMOSPHERE INFORMATION CATEGORY: Social and Economic Activities and Natural Events
TOPIC/ITEM VARIABLE MEASUREMENT
1. Emission of air pollutants from: Total emissions from motor vehicles in Metro Manila Tons/Year
− Stationary sources (industry, house- holds by vehicle type and agriculture)
− - Mobile sources (transportation) Toxic air contaminant emissions in Metro Manila Tons/Year Stationary source emissions in Metro Manila Tons/Year Philippine greenhouse gas emissions Gg Chemical importations Metric tons 2. Solar energy generation Amount of energy generated 3. Natural events and man-made disasters
− Forest fires Number of forest fires and area affected Number/Hectares − Volcanic eruptions Volcanic eruptions Number/ Intensity − Weather and climate hazards Average rainfall/precipitation Mm Temperature (ave., max., min.) Centigrade
Frequency of tropical cyclones Frequency

TABLE I.2. STATISTICAL FRAMEWORK ON ATMOSPHERE INFORMATION CATEGORY: Environmental Impacts of Activities and Events
TOPIC/ITEM VARIABLE MEASUREMENT
1. Air quality (ambient concentrations of Average concentration of total suspended particulates Ambient concentration air pollutants) (TSP) and sulfur dioxide in the atmosphere by air microgram/scm quality monitoring station (Metro Manila) 2. Human health and welfare impacts Morbidity due to respiratory diseases Number 3. Climate changes (global warming) Mean sea level pressure Mbs 4. Impacts on land, water, biodiversity,
artifacts (from acidic precipitation)

TABLE I.3. STATISTICAL FRAMEWORK ON ATMOSPHERE INFORMATION CATEGORY: Responses to Environmental Impacts
TOPIC/ITEM VARIABLE MEASUREMENT
1. Air pollution monitoring and control Air pollution control compliance statistics Number of firms Number of vehicles apprehended for smoke belching Number of in Metro Manila apprehensions Applications and issuance of Environmental Number of ECC Compliance Certificates (ECCs) applications Budget for environmental management Pesos Number and list of legislations, i.e. executive orders, Number memo circulars, etc. (Clean air act) 2. Disaster management Expenditure on management of natural disasters, Pesos i.e. Research and Surveillance, Emergency plans programs Number of warnings and advisory issued Number

TABLE I.4. STATISTICAL FRAMEWORK ON ATMOSPHERE INFORMATION CATEGORY: Stocks and Inventories
TOPIC/ITEM VARIABLE MEASUREMENT
1. Climate conditions and air quality Climatological normals (rainfall, number of rainy days, Millimeter/Number/ maximum temperature, minimum temperature) Centigrade 2. Emission inventory (types and sources Summary of emission from all sources in Metro Manila Tons/Year
of pollution) and by type of pollutants Area source emissions in Metro Manila Tons/Year 3. Inventory of areas vulnerable to air
pollution

TABLE J.1. STATISTICAL FRAMEWORK ON WATER INFORMATION CATEGORY: Social and Economic Activities and Natural Events
TOPIC / ITEM VARIABLES MEASUREMENT
Freshwater 1. Utilization 1.1 Water abstraction Amount of surface water abstracted by source (rivers, cubic meters per year (m3/y);
lakes) liters per second (lps) − amount of transbasin transfers m3/year, lps − amount of groundwater abstracted by source m3/year, lps
1.2 Use of abstracted water Amount/quantity of abstracted water for use in m3/year, lps; hectares (ha.) irrigation Amount/quantity of abstracted water for industrial use m3/year, lps Amount/quantity of abstracted water for domestic/ m3/year, lps; per capita municipal use
1.3 In-site use Amount/quantity of water used for power generation m3/year, lps Number of sites used for inland fishery number of sites Number of sites by region used for recreation number of sites 2. Discharges/Effluents Amount of loadings volume and concentration *Number of rivers and lakes affected by sedimentation number of rivers and lakes affected due to agricultural and/or industrial use
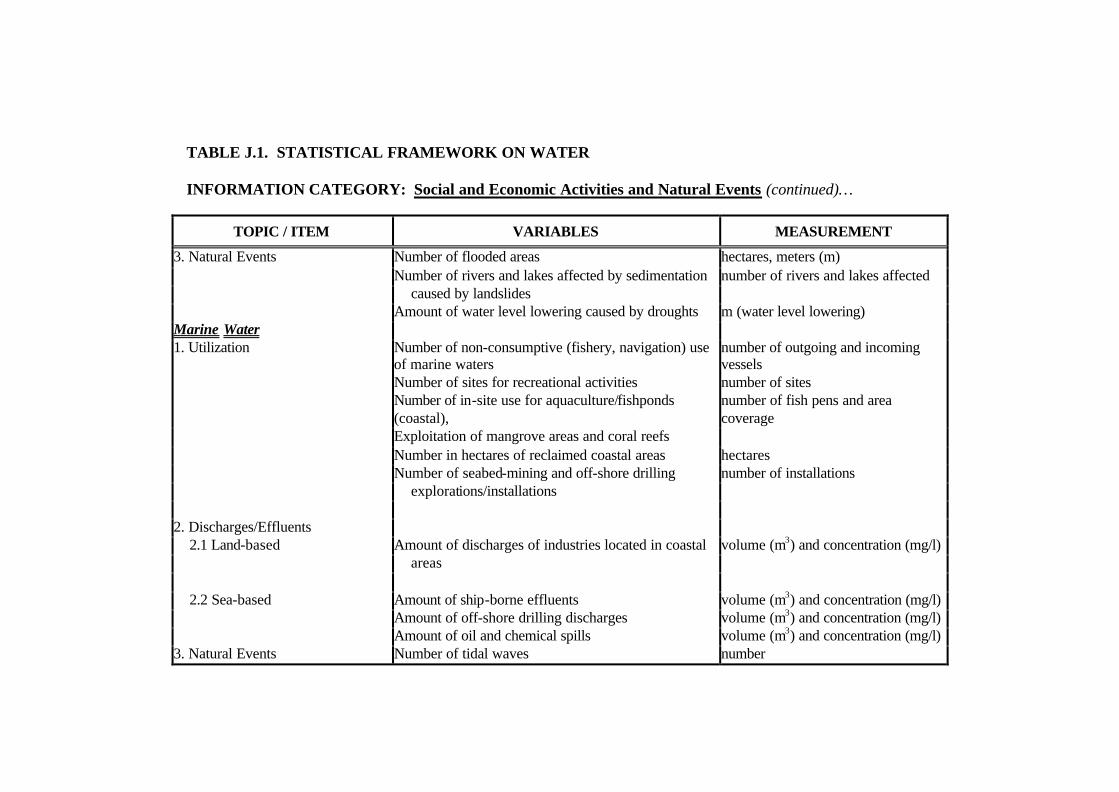
TABLE J.1. STATISTICAL FRAMEWORK ON WATER INFORMATION CATEGORY: Social and Economic Activities and Natural Events (continued)…
TOPIC / ITEM VARIABLES MEASUREMENT
3. Natural Events Number of flooded areas hectares, meters (m) Number of rivers and lakes affected by sedimentation number of rivers and lakes affected caused by landslides Amount of water level lowering caused by droughts m (water level lowering) Marine Water 1. Utilization Number of non-consumptive (fishery, navigation) use
of marine waters number of outgoing and incoming vessels
Number of sites for recreational activities number of sites Number of in-site use for aquaculture/fishponds number of fish pens and area (coastal), coverage Exploitation of mangrove areas and coral reefs Number in hectares of reclaimed coastal areas hectares Number of seabed-mining and off-shore drilling number of installations explorations/installations 2. Discharges/Effluents 2.1 Land-based Amount of discharges of industries located in coastal volume (m3) and concentration (mg/l) areas 2.2 Sea-based Amount of ship-borne effluents volume (m3) and concentration (mg/l) Amount of off-shore drilling discharges volume (m3) and concentration (mg/l) Amount of oil and chemical spills volume (m3) and concentration (mg/l) 3. Natural Events Number of tidal waves number

TABLE J.2. STATISTICAL FRAMEWORK ON WATER INFORMATION CATEGORY: Environmental Impacts of Activities and Events
TOPIC / ITEM VARIABLES MEASUREMENT
Freshwater 1. Depletion of water resources Amount of change in water levels (surface water and m groundwater) Average stream flows m3/second Amount of loss of water storage capacity due to m3 sedimentation Amount in meters of groundwater mining m3 2. Degradation of water quality Water quality of receiving water bodies concentration (mg/l) Amount of suspended solids volume and concentration Physical properties (color, odor, etc.) of potable water standards (of DOH for safe drinking water) Number of areas affected by salt water intrusion number of areas, extent of intrusion Incidence of water-borne diseases percent 3. Environmental disaster 3.1 Impacts on water Number of areas affected by flood number, hectares, depth Amount of water level lowering caused by droughts m, water level lowering Number of rivers and lakes affected by sedimentation number of rivers and lakes affected caused by landslides

TABLE J.2. STATISTICAL FRAMEWORK ON WATER INFORMATION CATEGORY: Environmental Impacts of Activities and Events (continued)…
TOPIC / ITEM VARIABLES MEASUREMENT
Marine Water 1. Degradation of marine water Number of degraded marine water sites number of affected sites, water quality (concentration) Number of incidents of fish kills due to oil spills and/or number of incidents Chemical spills Number of red tide occurrences number of occurrences Number of degraded beaches number of affected sites 2. Environmental quality Water quality of receiving areas volume and concentration Amount of suspended solids volume and concentration Physical properties (color, odor, etc.) of marine waters versus standards

TABLE J.3. STATISTICAL FRAMEWORK ON WATER INFORMATION CATEGORY: Responses to Environmental Impacts
TOPIC / ITEM VARIABLES MEASUREMENT
Freshwater 3. Water resource management
and rehabilitation 1.1 Water resource protection
and conservation 1.1.1 Watersheds Amount of public expenditure for watershed protection annual expenditure in pesos
and conservation Number and size of protected watersheds for water supply number and size of watershed
1.1.2 Rivers and lakes Amount of public expenditures for the protection and annual expenditures in pesos conservation of rivers and lakes Number of rivers and lakes with protection programs number of rivers and lakes (site-specific)
1.1.3 Reservoirs Number of newly-constructed reservoirs number of new reservoirs; capacity (m3)
1.2 Regulation of water use Number of water permits issued number of water permits Number of water conservation programs number of programs and amount of water (in m3) conserved Price of water price/m3 1.3 Rehabilitation of degraded Number of water bodies undergoing rehabilitation number
water bodies

TABLE J.3. STATISTICAL FRAMEWORK ON WATER INFORMATION CATEGORY: Responses to Environmental Impacts (continued)…
TOPIC / ITEM VARIABLES MEASUREMENT
2.4 Standards, control and Percent compliance with water quality standards percent compliance enforcement Amount of expenditures for water quality control pesos (annual budget)
Number of licenses and quantities used of restricted number, tons, kilograms substances/chemicals
2.5 Emergency clean-up of oil and Number of containment and clean-up activities number chemical spills
3. Prevention and hazard mitigation
of natural disasters 3.1 Physical infrastructure to Amount of expenditures for flood control pesos
control natural disasters
3.2 Watershed rehabilitation Amount of expenditures for watershed rehabilitation and pesos and protection for flood protection for flood control control
3.3 Flood warning systems Amount of expenditures for flood warning systems pesos
3.4 Cloud seeding Number of cloud seeding activities number

TABLE J.3. STATISTICAL FRAMEWORK ON WATER INFORMATION CATEGORY: Responses to Environmental Impacts (continued)…
TOPIC / ITEM VARIABLES MEASUREMENT
1.4 Water treatment Number of industries with wastewater treatment plants number Number of public wastewater treatment plants number Percentage of population with safe drinking water percent 2. Pollution monitoring, control and clean-up
2.1 Water quality research Amount of expenditures for water quality research pesos 2.2 Water quality monitoring Number of water quality monitoring stations number
stations Amount of expenditures for water quality monitoring pesos (budget) stations
2.3 Pollution control facilities Amount of expenditures for waste water treatment pesos Amount of expenditures for sludge disposal pesos Marine Water 1. Resource management and
rehabilitation 1.1 Protection, conservation and Number of marine protection and conservation sites number and size of sites
management of marine water Number of coastal community projects number of sites

TABLE J.3. STATISTICAL FRAMEWORK ON WATER INFORMATION CATEGORY: Responses to Environmental Impacts (continued)…
TOPIC / ITEM VARIABLES MEASUREMENT
1.1 Protection, conservation Number of marine protection and conservation sites number and size of sites and management of marine water
2. Pollution monitoring, control
and clean-up
2.1 Marine water quality Amount of expenditures for marine water quality pesos research research
2.2 Marine water quality number of marine water quality monitoring stations number
monitoring stations Amount of expenditures for marine water quality pesos (budget) Monitoring stations
2.3 Pollution control facilities Amount of expenditures for waste water treatment pesos Amount of expenditures for sludge disposal pesos

TABLE J.3 STATISTICAL FRAMEWORK ON WATER INFORMATION CATEGORY: Responses to Environmental Impacts (continued)…
TOPIC / ITEM VARIABLES MEASUREMENT
2.4 Standards, control and Percent compliance with marine water quality standards percent compliance enforcement
Amount of expenditures for marine water quality pesos (annual budget) Number of licenses and quantities used of restricted number, tons, kilograms substances/chemicals
2.5 Emergency clean-up of oil Number of containment and clean-up activities number and chemical spills
3. Prevention and mitigation of
natural disasters
3.1 Physical infrastructure to Amount of coastal protection infrastructure works budget and length of coastal protection control natural disasters works

TABLE J.4. STATISTICAL FRAMEWORK ON WATER INFORMATION CATEGORY: Stocks and Inventories
TOPIC / ITEM VARIABLES MEASUREMENT
Freshwater 1. Cyclical resources
1.1 Water stock and flow Amount in cubic meters of water balance of surface and m3 Groundwater Amount in cubic meters of the annual/seasonal m3 precipitation and transpiration
1.2 Socio-economic factors Population growth number, percent Per capita consumption over time levels (m3) Number of water utilities privatized number 2. Stock of infrastructure Number of water supply facilities (both private and number public)
2.1 Man-made infrastructure for water resources Number of delivery systems number

TABLE J.4. STATISTICAL FRAMEWORK ON WATER INFORMATION CATEGORY: Stocks and Inventories (continued)
TOPIC/ITEM VARIABLES MEASUREMENT
Marine Water 1. Cyclical resources
1.1 Water level of coastal areas Tidal patterns of selected areas m
1.2 Socio-economic factors affecting Coastal population number the use of marine water
Number of industries located along coastal areas number Number of resorts located along coastal areas number 2. Stock of infrastructure
2.1 Man-made infrastructure Number of hectares of reclaimed land number (in ha.) Number of oil and gas exploration development number Number of ports number Number of areas under economic zone number (in ha.)
2.2 Inventory of Discharges/ Amount of discharges/effluents metric tons Effluents to Water
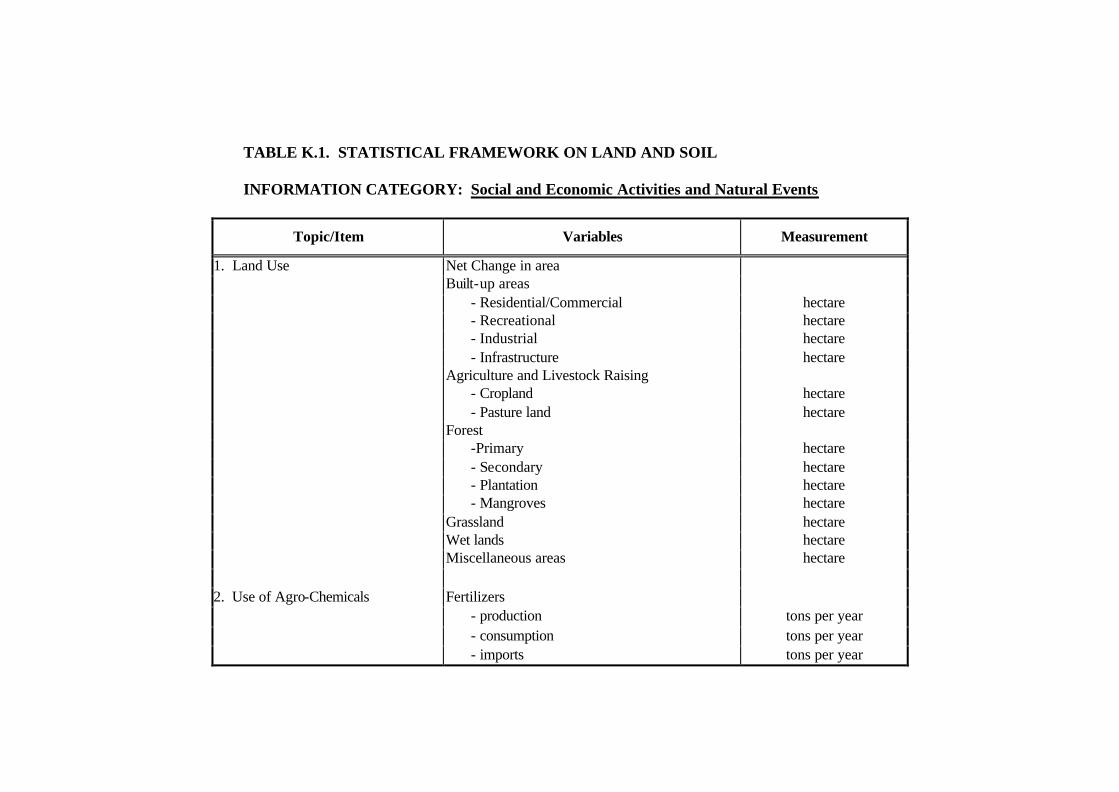
TABLE K.1. STATISTICAL FRAMEWORK ON LAND AND SOIL INFORMATION CATEGORY: Social and Economic Activities and Natural Events
Topic/Item Variables Measurement
1. Land Use Net Change in area Built-up areas - Residential/Commercial hectare - Recreational hectare - Industrial hectare - Infrastructure hectare Agriculture and Livestock Raising - Cropland hectare - Pasture land hectare Forest -Primary hectare - Secondary hectare - Plantation hectare - Mangroves hectare Grassland hectare Wet lands hectare Miscellaneous areas hectare 2. Use of Agro-Chemicals Fertilizers - production tons per year - consumption tons per year - imports tons per year

TABLE K.1. STATISTICAL FRAMEWORK ON LAND AND SOIL INFORMATION CATEGORY: Social and Economic Activities and Natural Events (continued)...
Topic/Item Variables Measurement
Pesticides - production tons per year - consumption tons per year - imports tons per year 3. Reclamation Activity Areas reclaimed hectares (cumulative and annual) 4. Solid Waste Disposal Solid waste generation tons per year, kilogram per
capita Solid waste disposed in landfills tons per year Solid waste disposed by incineration tons per year 5. Toxic Waste Disposal Toxic waste generated tons per year (As defined in RA 6969) 6. Natural Calamities:
Earthquake Occurrences number, intensity Volcanic eruptions Eruptions, areas affected number, hectares Floods Occurrences (i.e., La Niña, typhoons) number
Extent of areas flooded hectares Droughts Effects of El Niño (changes/loss/ tons per year, % change
decrease in crop productivity)

TABLE K2. STATISTICAL FRAMEWORK ON LAND AND SOIL INFORMATION CATEGORY: Environmental Impacts of Activities and Events
TOPIC/ITEM VARIABLES MEASUREMENT
1. Physical Land Degradation Areas affected by: - soil erosion hectare - salinization hectare - water logging hectare - siltation hectare - toxic wastes hectare 2. Nutrient Loss Loss of soil fertility tons per year 3. Human Health Impacts Morbidity associated to exposure from number of reported cases soil-borne diseases
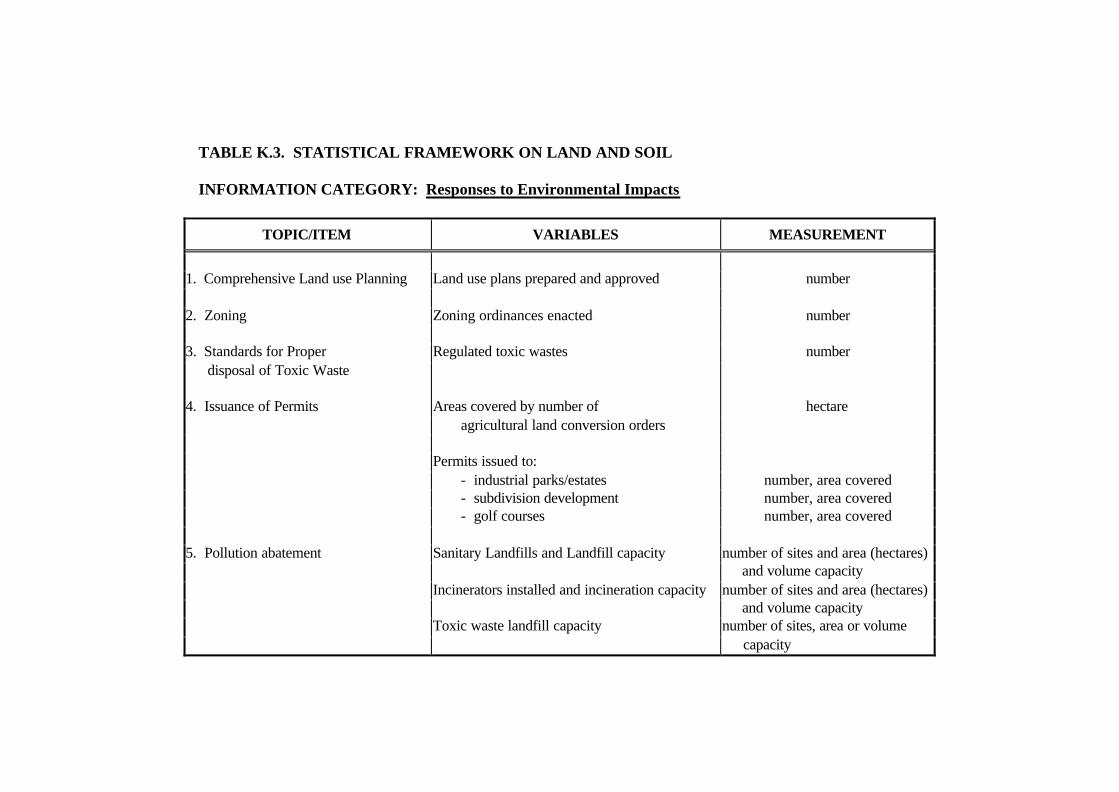
TABLE K.3. STATISTICAL FRAMEWORK ON LAND AND SOIL INFORMATION CATEGORY: Responses to Environmental Impacts
TOPIC/ITEM VARIABLES MEASUREMENT
1. Comprehensive Land use Planning Land use plans prepared and approved number 2. Zoning Zoning ordinances enacted number 3. Standards for Proper Regulated toxic wastes number
disposal of Toxic Waste 4. Issuance of Permits Areas covered by number of hectare agricultural land conversion orders Permits issued to: - industrial parks/estates number, area covered - subdivision development number, area covered - golf courses number, area covered 5. Pollution abatement Sanitary Landfills and Landfill capacity number of sites and area (hectares) and volume capacity Incinerators installed and incineration capacity number of sites and area (hectares) and volume capacity Toxic waste landfill capacity number of sites, area or volume capacity

TABLE K.3. STATISTICAL FRAMEWORK ON LAND AND SOIL INFORMATION CATEGORY: Responses to Environmental Impacts (continued)...
TOPIC/ITEM VARIABLES MEASUREMENT
6. Rehabilitation Activities Rehabilitation of: number of projects, area covered − degraded areas (hectares), annual and cumulative − silted areas − eroded areas − waterlogged areas − salinized areas − areas affected by toxic wastes Demonstration projects for soil management number of sites and hectares covered Rehabilitation of areas affected by: number of area − volcanic eruption − earthquake

TABLE K.4. STATISTICAL FRAMEWORK ON LAND AND SOIL INFORMATION CATEGORY: Stocks and Inventory
TOPIC/ITEM VARIABLES MEASUREMENT
1. Inventory of Land Resources Opening and closing stocks of land Area in hectares or square
resources in one accounting period: kilometers − agriculture − forestry − grassland − built-up − wet land − miscellaneous Per capita ratios Hectare per capita

TABLE L.1. STATISTICAL FRAMEWORK ON MINERAL AND ENERGY RESOURCES
INFORMATION CATEGORY: Social And Economic Activities And Natural Events
Topic/Item Variables Measurement
I. Mineral Resources 1. Extraction of mineral Resources 1. Mineral production Volume (thousand metric tons)
a. Metallic b. Non-Metallic 2. Mineral Exploration a. Metallic Volume (thousand metric tons) b. Non-metallic
2. Political, economic, and natural Closure of mining sites/firms due to: Number of Mining sites/firms events a. peace and order problem
b. Natural calamities c. Public clamor d. Economic reasons II. Energy Resources
1. Production and consumption of 1. Energy resources production By capacity (gwh) energy resources a. by sector
b. by utility 2. Energy conversion By capacity (gwh) a. by plant b. by utility 3. Energy Consumption By capacity (gwh) a. by sector b. by source
2. Natural events Closure of sites due to natural calamities Number of Mining sites/firms

TABLE L.2. STATISTICAL FRAMEWORK ON MINERAL AND ENERGY RESOURCES INFORMATION CATEGORY: Environmental Impacts of Activities and Events
Topic/Item Variables Measurement
I. Mineral Resources 1. Mineral Resources depletion Depletion of mineral resources Percentage a. Metallic b. Non-metallic 1. Mine tailing production Area affected a. Metallic (cubic meters per year) b. Non-metallic 2. Siltation Area Affected (hectare) 3. Production of hazardous chemical residue Area affected (cubic meters per year) 3. Human Health impacts 1. Morbidity associated to exposure to Number of reported cases hazardous mine wastes 2. Accidents associated to mining activities Number of reported cases
II. Energy Resources Energy resource depletion Depletion of energy resources Volume (thousand metric tones)

TABLE L.3. STATISTICAL FRAMEWORK ON MINERAL AND ENERGY RESOURCES INFORMATION CATEGORY: Responses to Environmental Impacts
Topic/Item Variables Measurement
I. Mineral Resources 1. Mineral resource management 1. Mining licenses issued vis-a-is ECC issued Number of licenses and ECC issue And conservation 2. Mining operations closed due to adverse
effects on environment Number of sectors
3. Amount of tax collected on mine tailings Value in pesos per year 4. Amount of environment guarantee fund for Annual and cumulative amount mining operations (pesos) 2. Rehabilitation of mining areas 1. Rehabilitation of abandoned mine sites Number of sites, area covered 2. Protection works for on-going mining Number of sites operations
II. Energy Resources Mineral (energy) resource 1. Regulation via permit and licensing system As the need arises management and conservation to conduct mining activities 2. Private sector response on energy conservation 3. Economic policies regulating the energy sector

TABLE L4. STATISTICAL FRAMEWORK ON MINERAL AND ENERGY RESOURCES INFORMATION CATEGORY: Stocks and Inventory
Topic/Item Variables Measurement
I. Mineral Resources 1. Opening and closing stocks over 1. Metallic Accounts of stocks and flows
the accounting period 2. Non-metallic (tons or cubic meter) 3. Milling capacity for mineral resources Volume capacity (thousand metric tons) 2. Mineral reserves 1. Metallic Volume capacity 2. Non-metallic (thousand metric tons) 3. Inventory of active firms Number of active mining operations
engaged in mining operations II. Energy Resources 1. Opening and closing stocks over Non renewable mineral resources Volume capacity
the accounting period (thousand metric tons)

TABLE M.1. STATISTICAL FRAMEWORK ON HUMAN SETTLEMENTS
INFORMATION CATEGORY: Social and Economic Activities and Natural Events
TOPIC/ITEM VARIABLE MEASUREMENT
Population growth and change Average rate of change in population size Percent Net migration rate Percent Construction of shelter and Housing units/residential buildings constructed/ Number Infrastructure restored Institutional buildings constructed/restored Number Non-residential buildings constructed/restored Number Energy and water utilities Energy supply and consumption Thousand barrels of fuel oil equivalent Electricity supply and consumption Gigawatthours Water supply and consumption cu. m Transport Registered motor vehicles Number Vessel arrivals and departures Number, tonnage Air traffic Number of flights

TABLE M.1. STATISTICAL FRAMEWORK ON HUMAN SETTLEMENTS
INFORMATION CATEGORY: Social and Economic Activities and Natural Events (continued)…
TOPIC/ITEM VARIABLE MEASUREMENT
Passenger transport Number of passengers, passenger, kilometers Volume of traffic Average daily traffic count Freight transport Tons of freight, ton kilometers Land use in human settlements Settlement land area Sq. km Emission and waste discharge Air pollution emissions Tons Solid waste collected Cu. m or tons Hazardous activities at workplace Occurrence of hazardous activities Number Natural events and man-made disasters Occurrence of natural events and disasters Frequency, magnitude
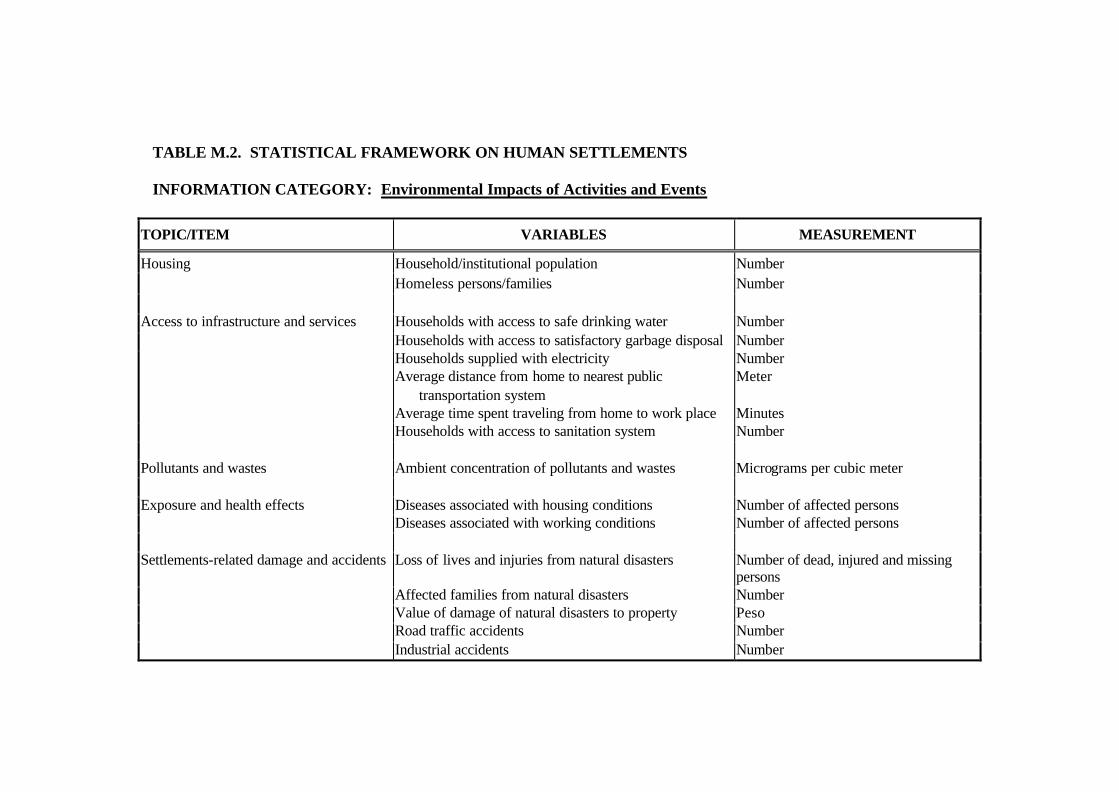
TABLE M.2. STATISTICAL FRAMEWORK ON HUMAN SETTLEMENTS INFORMATION CATEGORY: Environmental Impacts of Activities and Events
TOPIC/ITEM VARIABLES MEASUREMENT
Housing Household/institutional population Number Homeless persons/families Number Access to infrastructure and services Households with access to safe drinking water Number Households with access to satisfactory garbage disposal Number Households supplied with electricity Number Average distance from home to nearest public Meter transportation system Average time spent traveling from home to work place Minutes Households with access to sanitation system Number Pollutants and wastes Ambient concentration of pollutants and wastes Micrograms per cubic meter Exposure and health effects Diseases associated with housing conditions Number of affected persons Diseases associated with working conditions Number of affected persons Settlements-related damage and accidents Loss of lives and injuries from natural disasters Number of dead, injured and missing
persons Affected families from natural disasters Number Value of damage of natural disasters to property Peso Road traffic accidents Number Industrial accidents Number

TABLE M.3. STATISTICAL FRAMEWORK ON HUMAN SETTLEMENTS INFORMATION CATEGORY: Responses to Environmental Impacts
TOPIC/ITEM VARIABLES MEASUREMENT
Human settlements policies and programs Expenditures for human settlements development Peso Community development programs Number Violations of building codes and regulations prosecuted Number Settlements area under land use regulations Square kilometers Historic sites preserved Number Resettlement areas for displaced families/communities Number Environmental standards Air pollution emission standards Number of parts per measured
unit Air pollution concentration standards Microgrammes per cubic meter Water pollution standards Solid waste treatment and removal standards Pollution monitoring and control Monitoring stations Number Violations prosecuted and regulatory actions Number Expenditures for pollution control Peso Treatment disposal and reuse of dischargesWaste water treatment Reuse and recycling of solid waste Tons Treatment and disposal of solid waste Tons Disaster management Disaster preparedness and mitigation programs Number and type of programs Expenditures on management of natural disasters Peso Investments for mitigating natural disasters Peso

TABLE M.4. STATISTICAL FRAMEWORK ON HUMAN SETTLEMENTS INFORMATION CATEGORY: Stocks, Inventories and Background Conditions
TOPIC/ITEM VARIABLES MEASUREMENT
Stocks of shelter and infrastructure - Housing Residential buildings Number Housing units with toilet Number Housing units with water supply system Number - Non-residential buildings and other Non-residential buildings Number physical infrastructures Civil engineering structures Number Environmental inventory Air pollutants Solid wastes Human settlements vulnerable to natural disasters Areas prone to disasters Number Socio-demographic factors affecting Population Number human settlements Population density Number per sq. km. Fertility rate Percent Infant mortality rate Percent Unemployment rate Percent

Flora and Fauna
Compendium of Philippine Environment Statistics 2004
FFFlllooorrraaa aaannnddd FFFaaauuunnnaaa
1 C
hapt
er

Flora and Fauna
Compendium of Philippine Environment Statistics 2004 1-1
FLORA AND FAUNA
HIGHLIGHTS OF RESULTS a. Social and Economic Activities and Natural Events
Forest Resources
The total land area of the Philippines is about 30 million hectares. This is classified into certified alienable and disposable land and Forestland. Forestlands are further classified into established forest reserve; established timberland; national parks (game refuge and bird sanctuaries and wilderness areas); military and naval reservation; civil reservations; and, fishponds.
In 2002, 14,765,804 hectares (49 percent) of the Philippines’ total land area
were characterized as classified forestland while 14,145,078 hectares (47 percent) were distinguished as alienable and disposable land. The remaining, 1,089,118 hectares (4 percent) were characterized as unclassified forestland. (see Figure 1 and Table 1.1).
Figure 1. Philippine Land Classification (as of year 2002)
To conserve and protect the forest, the old growth dipterocarp forest areas
were placed under the National Integrated Protected Areas Systems (NIPAS) since January 1992. As a consequence, the trend in log production decreased progressively from 1992 to 2002 (Figure 2) with an annual average drop of 11 percent.
Likewise, the trend in production of selected non-timber products,
particularly, unsplit rattan and almaciga, from 1992 to 2002 were also on the downtrend with an average annual decline of 10.2 and 1.8 percent, respectively.
47%
4%
49%
Certified A & DUnclassifiedForestland

Flora and Fauna
Compendium of Philippine Environment Statistics 2004 1-2
Production of unsplit rattan was highest in 2000 while harvest of almaciga resin was highest in 1994 (Figure 3). Harvest of nipa shingles, on the other hand, continued to fluctuate with 1999 posting the highest harvest at 12,745,204 pieces.
Figure 2. Log Production, 1992 to 2002
0
200,000
400,000
600,000
800,000
1,000,000
1,200,000
1,400,000
1,600,000
1992 1993 1994 1995 1996 1997 1998 1999 2000 2001 2002
Year
cubi
c m
eter
s
Figure 3. Production of Selected Non Timber Products, 1992 to 2002
0
5,000
10,000
15,000
20,000
25,000
30,000
35,000
1992 1993 1994 1995 1996 1997 1998 1999 2000 2001 2002
Year
Unsplit Rattan
Nipa Shingles
Almaciga Resin
Besides harvesting of forest products, forest fires were still the number one cause that aggravated the depletion of forest flora and fauna. In 2002, forest fires affected about 3,165 hectares of forestlands while kaingin burned about 2,172 hectares of forest particularly in the Cordillera Administrative Region (CAR).

Flora and Fauna
Compendium of Philippine Environment Statistics 2004 1-3
Fish Resources
As shown in Table 1, the country’s total fish production steadily increased from 1997 to 2002. In 2002, marine fish catch (which includes production from both commercial and marine municipal fishing) continued to account for the largest share at 56.4 percent (Figure 6) of the total fish production of the country. This growth occurred after the decline reported in 1996. On the other hand, commercial fishing followed a similar pattern as municipal fishing except in 2000 where a slight decline was reported.
Table 1. Total Fish Production 1992 to 2002 (metric tons)
Region 1992 1993 1994 1995 1996 1997 1998 1999 2000 2001 2002
Marine 1,659,553 1,627,550 1,646,175 1,678,601 1,610,381 1,649,378 1,685,208 1,728,574 1,740,309 1,809,727 1,899,487
commercial 804,866 824,356 859,328 893,232 879,073 884,651 940,533 948,754 946,485 976,539 1,042,193
municipal 854,687 803,194 786,847 785,369 731,308 764,727 744,675 779820 793824 833,188 857,294
Inland 229,673 210,775 205,731 186,674 177,940 159,739 146,471 146,519 152,121 136,347 131,644
Subtotal 1,889,226 1,838,325 1,851,906 1,865,275 1,788,321 1,809,117 1,831,679 1,875,093 1,892,430 1,946,074 2,031,131
Aquaculture 386,876 375,152 376,703 509,708 672,079 628,793 997,841 1,048,679 1,100,902 1,220,456 1,338,175
Total 2,276,102 2,213,477 2,228,609 2,374,983 2,460,400 2,437,910 2,829,520 2,923,772 2,993,332 3,166,530 3,369,306
In addition to this, inland fishing continued to decline from 1992 to 2002. In
1992, inland fishing posted a total harvest of 229,673 metric tons while in 2002, this amounted only to 131,644 metric tons, a decrease of 57 percent.
Wildlife Exportation
Figure 4. Government Revenues from Wildlife Export
0.00
1,000,000.00
2,000,000.00
3,000,000.00
4,000,000.00
5,000,000.00
6,000,000.00
7,000,000.00
8,000,000.00
1992 1993 1994 1995 1996 1997 1998 1999 2000 2001
Year
Am
ount
CITES*
Non-CITES
Linear (CITES*)
Linear (Non-CITES)

Flora and Fauna
Compendium of Philippine Environment Statistics 2004 1-4
The government grant permits for the exportation and local transport of wildlife. Wildlife, CITES and non-CITES, are exported in various forms: head and other body parts of the animals, derivatives of animal products, whole and parts of plants, etc. In 2001, the total revenue of the government from wildlife export reached P 7.1 million. This amount was 149 percent higher than the revenues collected in 1992. It was also noted that from 1992 to 2001, revenues of the government from wildlife export steadily increased especially from wildlife species whose commercial export or trade are strictly regulated and/or prohibited (see Figure 4). b. Environmental Impacts of Activities and Events
Rare, Threatened and Endangered Wildlife Species
Despite government efforts to preserve wildlife species, the number of rare, threatened and endangered fauna species continued to increase at an average annual growth of 6.1 percent from 1992 to 2002. Most alarming was the rate at which mammal and bird species were becoming endangered registering an average annual growth of 7.7 percent and 5.6 percent, respectively from 1992 to 2002 (see Figure 6). As of 2002, of the total 322 total endangered fauna species, 216 were birds and 99 were mammals.
Figure 5. Rare, Threatened and Endangered Wildlife Species, 1992 to 2002
0
50
100
150
200
250
1991 1992 1993 1994 1995 1996 1997 1998 1999 2000 2001 2002
Year
No.
of S
peci
es
Mammals
Birds
Reptiles
Amphibians
Insecta
Linear(Mammals)
Linear(Birds)
Net Change in Fish Catch
An indicator of sustainability of fishing activity is the net change in fish catch shown in Table 2 and Figure 4.
The country’s annual total fish production from 1992 to 2002 was
characterized by annual fluctuations on the average by 4.1 percent. The year 1997 was the most bountiful year at 16.1 percent following a reported drop of 0.9 percent in 1996, the lowest during the 10-year period.
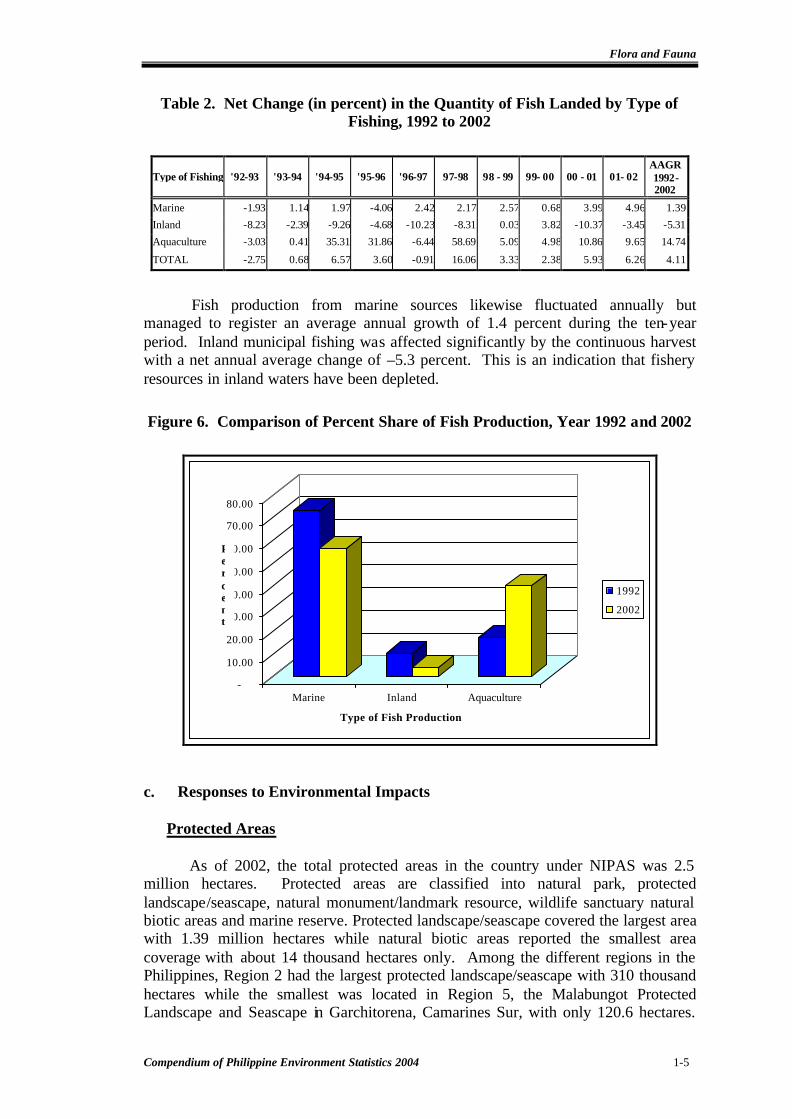
Flora and Fauna
Compendium of Philippine Environment Statistics 2004 1-5
Table 2. Net Change (in percent) in the Quantity of Fish Landed by Type of Fishing, 1992 to 2002
Type of Fishing '92-93 '93-94 '94-95 '95-96 '96-97 97-98 98 - 99 99- 00 00 - 01 01- 02 AAGR 1992-2002
Marine -1.93 1.14 1.97 -4.06 2.42 2.17 2.57 0.68 3.99 4.96 1.39
Inland -8.23 -2.39 -9.26 -4.68 -10.23 -8.31 0.03 3.82 -10.37 -3.45 -5.31
Aquaculture -3.03 0.41 35.31 31.86 -6.44 58.69 5.09 4.98 10.86 9.65 14.74
TOTAL -2.75 0.68 6.57 3.60 -0.91 16.06 3.33 2.38 5.93 6.26 4.11
Fish production from marine sources likewise fluctuated annually but managed to register an average annual growth of 1.4 percent during the ten-year period. Inland municipal fishing was affected significantly by the continuous harvest with a net annual average change of –5.3 percent. This is an indication that fishery resources in inland waters have been depleted.
Figure 6. Comparison of Percent Share of Fish Production, Year 1992 and 2002
-
10.00
20.00
30.00
40.00
50.00
60.00
70.00
80.00
Marine Inland Aquaculture
Type of Fish Production
1992
2002
c. Responses to Environmental Impacts
Protected Areas
As of 2002, the total protected areas in the country under NIPAS was 2.5 million hectares. Protected areas are classified into natural park, protected landscape/seascape, natural monument/landmark resource, wildlife sanctuary natural biotic areas and marine reserve. Protected landscape/seascape covered the largest area with 1.39 million hectares while natural biotic areas reported the smallest area coverage with about 14 thousand hectares only. Among the different regions in the Philippines, Region 2 had the largest protected landscape/seascape with 310 thousand hectares while the smallest was located in Region 5, the Malabungot Protected Landscape and Seascape in Garchitorena, Camarines Sur, with only 120.6 hectares.
Percent

Flora and Fauna
Compendium of Philippine Environment Statistics 2004 1-6
The largest single area protected landscape/seascape was the Siargao Protected Landscape/Seascape with a total area of 278.9 thousand hectares.
Wildlife Species Protected
The Philippines acceded to the Convention on International Trade in Endangered Species of Wild Fauna and Flora (CITES) in 1981 and became an actual member in 1983. Pursuant to the provisions of the treaty, the Philippines is required to report lists of wildlife species categorized into: Appendix I (endangered fauna and flora prohibited by the contracting states of CITES for commercial trade and/or export), Appendix II (plant and animal species whose commercial export/trade is strictly regulated) and Appendix III (species that highly need local protection set under national policies as determined by the country’s CITES Management Authority). Wildlife species are categorized according to the level of threat to their survival.
The 2002 list of Philippine endemic and indigenous flora and fauna for priority
protection based on CITES Appendix I released by the Protected Areas and Wildlife Bureau (PAWB) reached a total of 25 species: 8 mammal, 9 birds, 6 reptiles, 1 insects and 1 plant (Figure 6). In 1992, the total number of species under CITES I was 29. A significant change was observed in the number of bird species under CITES I, i.e. from a total of 13 in 1994, this went down to 9 in 2002.
Figure 7. Wildlife Species Protected: Listed Under CITES Appendix I and Whose Commercial Export/Trade are Strictly Prohibited, 1992 to 2002
4
9
11 11 11 11 11
12
10 10
8
13 13
10 10 10 10 10 10 10 10
9
6 6
7 7 7 7 7 7 7 7
6
1 1 1 1
2 2 2 2 2 2
4 4
2 2
1 1 1
0
2
4
6
8
10
12
14
1992 1993 1994 1995 1996 1997 1998 1999 2000 2001 2002
Year
Mamalia
Aves
Reptilia
Insecta
Pisces
Flora
On the other hand, the number of flora and fauna species under Appendix II increased from 108 in 1992 to 132 in 2002 or an increase of 22 percent. Out of the 132 species, 27 were mammals, 67 birds, 13 reptiles, 3 insects, 7 mollusks and 15

Flora and Fauna
Compendium of Philippine Environment Statistics 2004 1-7
plants (Figure 7). The most significant change was noted in the reptile species which increased from 3 in 1992 to 13 in 2002.
Laws Promulgated, Policies and Programs Implemented
A total of 49 policy issuances (Republic Act, Proclamation, Executive Order, Malacañang Memorandum Circulars/Order/Administrative Order, Department of Environment and Natural Resources (DENR) and Department of Agriculture (DA) Administrative Order, DENR and DA Memorandum Circular, DENR and DA Memorandum Order, Department Circulars of DENR and Joint Memorandum Circulars) affecting protected areas and wildlife sector were added to the existing 227 policies issued from 1998 to 2000.
Figure 8. Wildlife Species Protected: Listed Under CITES Appendix II and Whose Commercial Export/Trade are Strictly Regulated, 1992 to 2002
19
32
27 27 27 27 27
36 36 36
27
66 6663 63 63 63 62
65 65 6567
3 35 5 5 5 5 5 5 6
13
3 3 3 32 2 2 2 2 2
11 1113
15 15 15 1511 11
1315 15
0
10
20
30
40
50
60
70
80
1992 1993 1994 1995 1996 1997 1998 1999 2000 2001 2002Year
Mamalia
Aves
Reptilia
Insecta
Pisces
Mollusca
Flora
The most significant of these polices was Republic Act No. 9147 entitled an Act Providing for the Conservation and Protection of Wildlife Resources and their Habitats, Appropriating Funds thereof and for other Purposes which was approved by the Philippine Congress in July 30, 2001. The Law was aimed to:
a. conserve and protect wildlife species and their habitats to promote
ecological balance and enhance biological diversity; b. regulate the collection and trade of wildlife; c. pursue, with due regard to the national interest, the Philippine
commitment to international conventions, protection of wildlife and their habitats; and,
d. initiate or support scientific studies on the conservation of biological diversity.
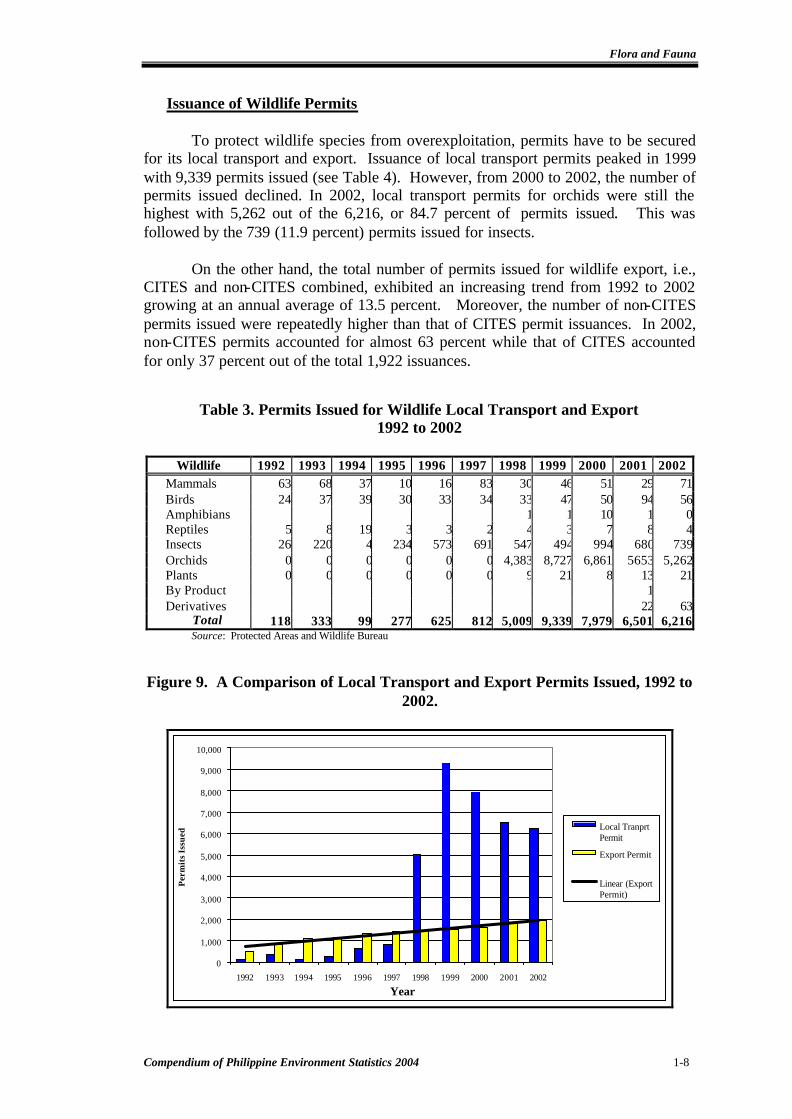
Flora and Fauna
Compendium of Philippine Environment Statistics 2004 1-8
Issuance of Wildlife Permits
To protect wildlife species from overexploitation, permits have to be secured for its local transport and export. Issuance of local transport permits peaked in 1999 with 9,339 permits issued (see Table 4). However, from 2000 to 2002, the number of permits issued declined. In 2002, local transport permits for orchids were still the highest with 5,262 out of the 6,216, or 84.7 percent of permits issued. This was followed by the 739 (11.9 percent) permits issued for insects.
On the other hand, the total number of permits issued for wildlife export, i.e.,
CITES and non-CITES combined, exhibited an increasing trend from 1992 to 2002 growing at an annual average of 13.5 percent. Moreover, the number of non-CITES permits issued were repeatedly higher than that of CITES permit issuances. In 2002, non-CITES permits accounted for almost 63 percent while that of CITES accounted for only 37 percent out of the total 1,922 issuances.
Table 3. Permits Issued for Wildlife Local Transport and Export
1992 to 2002
Wildlife 1992 1993 1994 1995 1996 1997 1998 1999 2000 2001 2002 Mammals 63 68 37 10 16 83 30 46 51 29 71Birds 24 37 39 30 33 34 33 47 50 94 56Amphibians 1 1 10 1 0Reptiles 5 8 19 3 3 2 4 3 7 8 4Insects 26 220 4 234 573 691 547 494 994 680 739Orchids 0 0 0 0 0 0 4,383 8,727 6,861 5653 5,262Plants 0 0 0 0 0 0 9 21 8 13 21By Product 1 Derivatives 22 63
Total 118 333 99 277 625 812 5,009 9,339 7,979 6,501 6,216 Source: Protected Areas and Wildlife Bureau
Figure 9. A Comparison of Local Transport and Export Permits Issued, 1992 to 2002.
0
1,000
2,000
3,000
4,000
5,000
6,000
7,000
8,000
9,000
10,000
1992 1993 1994 1995 1996 1997 1998 1999 2000 2001 2002
Year
Per
mit
s Is
sued
Local TranprtPermit
Export Permit
Linear (ExportPermit)
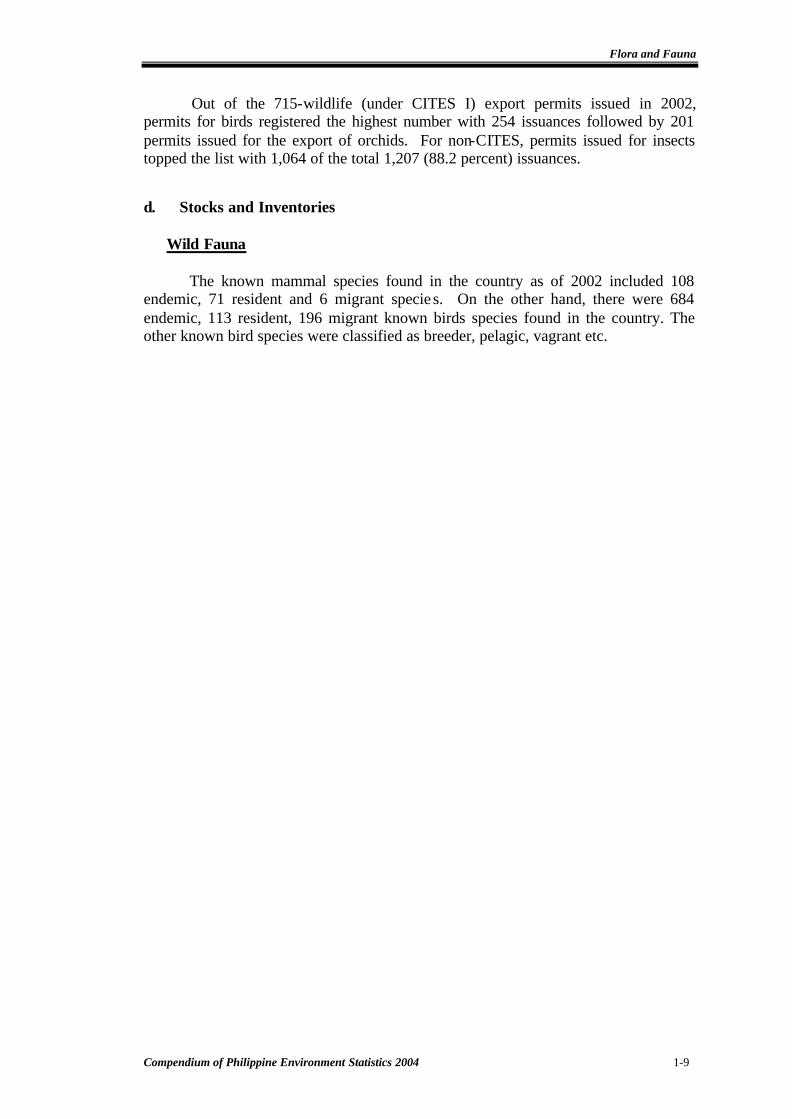
Flora and Fauna
Compendium of Philippine Environment Statistics 2004 1-9
Out of the 715-wildlife (under CITES I) export permits issued in 2002, permits for birds registered the highest number with 254 issuances followed by 201 permits issued for the export of orchids. For non-CITES, permits issued for insects topped the list with 1,064 of the total 1,207 (88.2 percent) issuances. d. Stocks and Inventories
Wild Fauna
The known mammal species found in the country as of 2002 included 108
endemic, 71 resident and 6 migrant specie s. On the other hand, there were 684 endemic, 113 resident, 196 migrant known birds species found in the country. The other known bird species were classified as breeder, pelagic, vagrant etc.

Flora and Fauna
Compendium of Philippine Environment Statistics 2004
Statistical Tables

TABLE 1.1. LAND CLASSIFICATION, 1991-2002, (in hectares)
Note: GRBS – Game Refuge and Bird Sanctuaries WA – Wilderness Area A & D – Alienable and Disposable
a/ Area subject to rectification upon completion of "Updating of Land Classification Status by Province Project" and/or upon approval by the DENR Secretary of surveyed/classified areas b/ does not include NCR and Region IV
Source: NAMRIA
Forest Land
Classified Year Total Area
Certified A & D Total Unclassified
Total Established
Forest Reserve
Established Timberland
National parks
GRBS/WA
Military & naval reserv'n
Civil reserv'n
Fish- pond
1991 30,000,000 14,117,729 15,882,271 881,157 15,001,114 3,272,912 10,015,381 1,340,997 130,330 165,946 75,5481992 30,000,000 14,117,244 15,882,756 881,157 15,001,599 3,272,912 10,015,866 1,340,997 130,330 165,946 75,5481993 30,000,000 14,117,244 15,882,756 881,157 15,001,599 3,272,912 10,015,866 1,340,997 130,330 165,946 75,5481994 30,000,000 14,117,244 15,882,756 881,157 15,001,599 3,272,912 10,015,866 1,340,997 130,330 165,946 75,5481995 30,000,000 14,117,244 15,882,756 881,157 15,001,599 3,272,912 10,015,866 1,340,997 130,330 165,946 75,548
1996 30,000,000 14,117,244 15,882,756 881,157 15,001,599 3,272,912 10,015,866 1,340,997 130,330 165,946 75,5481997 30,000,000 14,145,027 15,854,973 1,089,118 14,765,804 3,272,912 10,015,866 1,340,997 130,330 165,946 75,5481998 30,000,000 14,145,027 15,854,973 1,089,118 14,765,804 3,272,912 10,015,866 1,340,997 130,330 165,946 75,5481999 30,000,000 14,145,027 15,854,973 1,089,118 14,765,804 3,272,912 10,015,866 1,340,997 130,330 165,946 75,5482000 30,000,000 14,145,078 15,854,922 1,089,118 14,765,804 3,272,912 10,227,847 893,221 130,330 165,946 75,548
2001 30,000,000 14,145,078 15,854,973 1,089,118 a 14,145,078 a 2,817517 b 9,324,176 b 311,496 b 126,495 b 120,668 b 69,540 b
2002 30,000,000 14,145,078 15,854,922 1,089,118 a 14,145,078 a 2,817517 b 9,324,176 b 311,496 b 126,495 b 120,668 b 69,540 b

TABLE 1.2. ROUNDWOOD PRODUCTION, 1992 to 2002 (in thousand cu.m.)
1992 1993 1994 1995 1996 1997 1998 1999 2000 2001 2002
Total 1,757 1,152 1,063 868 804 593 721 860 912 713 541
Log 1,438 1,022 957 758 771 556 665 730 800 571 403
Fuelwood/Firewood 319 130 106 110 33 37 56 130 112 142 138
Source: Forest Economics Division, FMB, DENR
TABLE 1.3. LOG PRODUCTION BY REGION, 1992 to 2002 (in cu.m.)
Region 1992 1993 1994 1995 1996 1997 1998 1999 2000 2001 2002
CAR 2,536 12,355 11,387 18,534 379 104 648 6,599 10,388Region I 89 41 2,757 2,731 2,193 1,872Region II 40,845 51,728 21,661 28,482 8,602 10903 11,545 16,189 17,472 14,061 18,797Region III 312 420 293 152Region IV 100,341 22,352 50,054 61,770 22,855 21454 30,997 7,207 19,569 13,412Region IV A 817Region IV B 402Region V 213 191 173 433 1,004 2,770 359 595 514Region VI 15,928 321 2,742Region VII 486 1,505 1,772 2,395 1,825 8,242Region VIII 1,117 374 754 1,377 2,283Region IX 50,015 33,980 35,349 44,875 1,231 18941 5,938 18,574 17,210 34,877 33,084Region X 552,820 244,881 61,557 73,273 - 63042 9,806 20,740 13,123 34,662 49,903Region XI 586,279 496,983 644,542 426,726 81,944 43224 38,978 49,649 64,617 42,515 39,697Region XII 301 27,784 23,698 29,466 3,497 5,953 9,174 14,112 16,540 20,951Region XIII 588,042 339675 464,450 583,108 621,691 401618 208,654ARMM 105,100 131,312 108,930 74,878 63,393 58141 63,580 17,542 9,058 - 4,765
Philippines 1,438,237 1,021,588 957,369 758,490 771,322 555,917 664,794 730,170 800,087 570,890 403,263Details may not add up to totals due to rounding Source: Forest Economics Division, FMB, DENR

TABLE 1.4. LUMBER PRODUCTION, BY REGION, BY POVINCE, 1992 to 2002 (in cubic meters)
Region/Province 1992 1993 1994 1995 1996 1997 1998 1999 2000 2001 2002
NCR 192,120 100,234 61,216 25,999 62,849 80830 76,195 - 48,984 43,190 37,423 Metro Manila 192,120 100,234 61,216 25,999 62,849 80830 76,195 - 48,984 43,190 37,423
CAR 335 - 334 5,743 6,952 Abra 14 Apayao 5,534 6,334 Benguet 4,414 4,092 2,282 11,687 - - 334 152 209 Ifugao 57 392 Kalinga 4 Kalinga-Apayao 8,027 - 6485 - - - -
Region I - - 2,848 2,808 4,643 Ilocos Norte 791 - 7 61 Ilocos Sur 400 - - La Union 2,254 177 2,389 2,425 3,919 Pangasinan 925 784 3,764 - 2100 294 1,388 459 376 662
Region II 1,447 4,598 4,996 Cagayan 11,609 5,066 4,654 - 132 18 58 Isabela 36,831 28,649 7,810 21,820 2,072 8,950 3,374 16,007 1,249 4,534 4,996 Nueva Vizcaya 6 Quirino 116 1,653 - 50 - -
Region III 11,070 15,292 312 4,437 22,807 1,297 Bataan 200 - - 1,297 Bulacan 89,003 31,676 50,866 6,309 11,070 99,963 15,292 1,254 15,319 Nueva Ecija - 5 - - Pampanga 3,184 7,488 Tarlac 107 - - Zambales 1,508 - - -
Region IVa 6,116 Aurora 17,599 30,676 23,942 23,059 18,025 11,216 10,818 6,436 5,669 6914 5,580 Cavite 176 - Batangas 716 1,651 2,031 2,349 26,069 487 1,049 447 503 374 Quezon 16,529 12,849 12,882 13,296 2,555 1,654 1,583 - 274 366

TABLE 1.4 (continued)…..
Region/Province 1992 1993 1994 1995 1996 1997 1998 1999 2000 2001 2002
Region IVb - - - Marinduque 12 - - -
Oriental Mindoro 213 - - - Palawan 6,596 - 10 - - - Romblom 206 - - -
Region 5 50 293 1,070Albay 28 37 57Camarines Norte 22 33 641Camarines Sur 202 269Masbate 22 92
Sorsogon 11Region VI - 1,110 2,533 3,108
Aklan 134 354 457Antique 259Capiz 10 - 539 897 1,321Guimaras 26 49 189
Iloilo 3 93 173Negros Occidental 319 - 409 880 968
Region VII 2,289 3,468 2,326Bohol - - 9Cebu City 4,351 1,370 320 - 2,126 1,112 2,289 3,468 1,499Negros Oriental 818
Region VIII - - - - Biliran - - - Leyte - - - - Southern Leyte - - -
Region IX 1,065 3,150 1,692Zamboanga del Norte 76 256 1,982 - 147 - 642 10
Zamboanga del Sur 6,422 17,048 8,854 6,874 11,693 8,357 3,048 1,065 2,472 1,552Zamboanga Sibugay 36 130
Region X 7,800 1,274 3,074 3,044Bukidnon - -Misamis Occidental 73 3,735 127 16,918 - 41 273Misamis Oriental 47,053 9,583 7,800 13,386 7,458 1,274 3,033 2,771

TABLE 1.4 (continued)…..
Region/Province 1992 1993 1994 1995 1996 1997 1998 1999 2000 2001 2002
Region XI 13,884 20,008 16,734Compostela Valley 437 1,556 1,677Davao del Norte 9,429 19,576 22,287 9,311 16,217 16,195 7,989 11,844 11,177Davao del Sur 14,540 18,301 33,741 32,370 17,781 24,192 5,383 6,547 3,733Davao Oriental 360 411 815 75 61 147
Region XII 183 1,215 1,162Sarangani 1,081 902South Cotabato 2,755 3,425 1,492 889 77 1,069 183 134 201Sultan Kudarat 58Lanao del Norte 12,678 3,441 2,724 -
Region XIII 62,298 76,571 64,682Agusan del Norte 77,948 71,592 72,421 45,542 - 62,161 44,076 42,427 58,429 53,172Agusan del Sur 7,659 6,961 13,583 - 19,598 1,324 451 1,884Surigao del Sur 55,971 58,307 54,960 61,143 16,192 9,490 18,547 17,690 9,626
ARRM 4,332 7,768Lanao del Sur 366Maguindanao 42,614 10,066 10,982 1,690 4,332 7,402
Philippines 839,306 540,199 468,168 316,025 161,338 350,634 221,988 730,170 150,651 197,148 163,218
Source: Forest Economics Division, FMB, DENR

TABLE 1.5. VENEER PRODUCTION, 1992 to 2002 (in cubic meter)
Region 1992 1993 1994 1995 1996 1997 1998 1999 2000 2001 2002
NCR -- 4,425 1,488 Region II 102 1,917 1,260 2,666 88 Region III 3,160 1,845 5,547 21,539 Region IV 1,251 811 Region IVA 1,900 Region VII 4,054 3,986 4,114 5,528 4,027 3,310 21,245 5,212 5,627 5,174 Region IX 3,889 322 1,842 2,873 11,130 6,293 2,640 508 8,782 26,547 14,345 Region X 50,562 54,264 5,179 5,868 5,869 4,678 5,876 9,690 17,292 55,343 47,939 Region XI 19,929 4,264 24,459 4,943 32,598 15,311 1,553 5,482 11,659 21,510 26,457 Region XII -- 2,860 1,542 Region XIII 22,045 31,307 45,413 49,148 133,292 140,227 86,215 Philippines 79,787 64,753 38,765 19,058 82,189 61,616 58,880 89,234 178,082 254,801 205,057
Source: Forest Economics Division, FMB, DENR
TABLE 1.6. PLYWOOD PRODUCTION, 1992 to 2002 (in cubic meter)
Region 1992 1993 1994 1995 1996 1997 1998 1999 2000 2001 2002
NCR 7,975 1,220 3,684 2,686 5,448 2,914 16903Region II 1,909 1,364 3,795 4,949 7,425 3,198 Region III 2,704 3,433 3,859 9,739 8,975 7,576 290 6,344 19,599 Region IV 3,975 3,684 5,565 5,686 5512 (IVA) 10284(IVA) 8167(IVA) 7797(IVA) 3,884 6554 4131 (IVA)Region IX 15,760 8,646 24,867 35,867 27,564 32,714 27,146 13,452 15,283 22,127 14,905 Region X 139,319 105,026 99,036 131,351 58,811 54,208 26,558 43,817 56,023 68,077 67,157 Region XI 161,642 130,047 119,522 105,137 93,958 87,097 61,953 79,105 104,755 83,430 92,365 Region XII 10,727 3,019 2,043 976 151,972 110,025 106,078 Region XIII 105,763 135,293 ARMM 12,480 194,305 198,102 91,817 Philippines 330,580 260,714 258,397 289,998 507,645 544,171 246,023 243,563 286,313 292,295 346,222
Source: Forest Economics Division, DENR
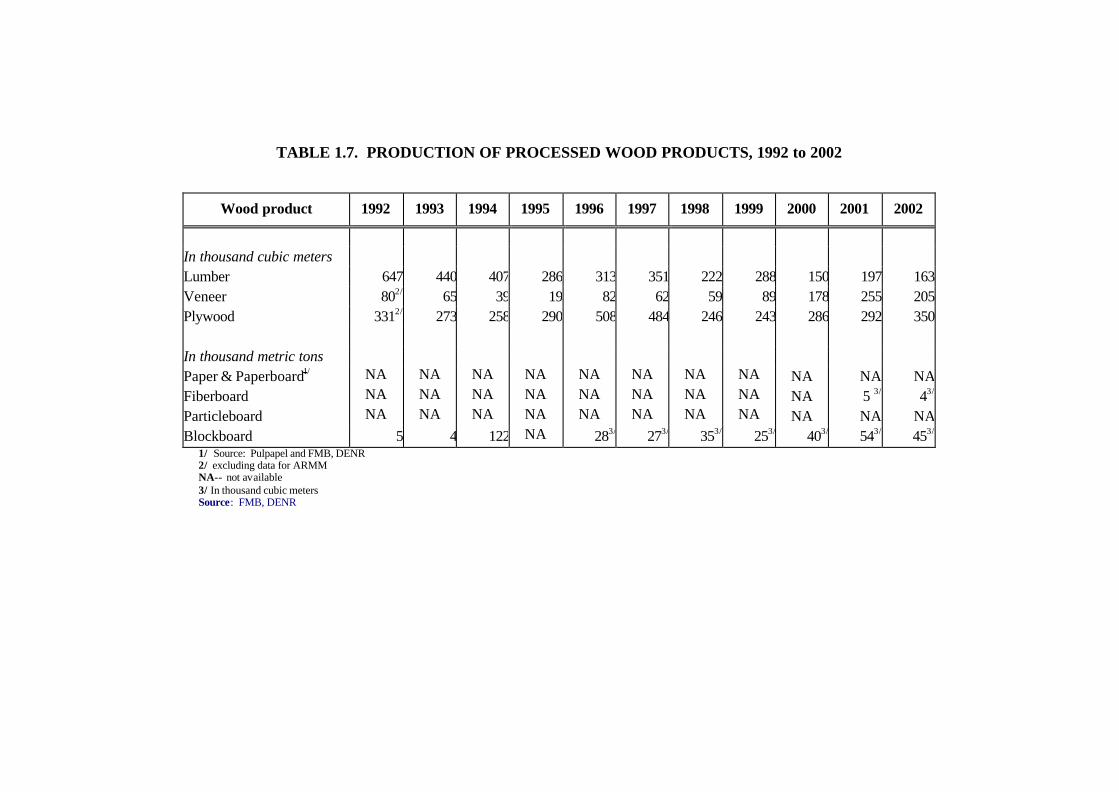
TABLE 1.7. PRODUCTION OF PROCESSED WOOD PRODUCTS, 1992 to 2002
Wood product 1992 1993 1994 1995 1996 1997 1998 1999 2000 2001 2002
In thousand cubic meters Lumber 647 440 407 286 313 351 222 288 150 197 163Veneer 802/ 65 39 19 82 62 59 89 178 255 205Plywood 3312/ 273 258 290 508 484 246 243 286 292 350 In thousand metric tons Paper & Paperboard1/ NA NA NA NA NA NA NA NA NA NA NAFiberboard NA NA NA NA NA NA NA NA NA 5 3/ 43/
Particleboard NA NA NA NA NA NA NA NA NA NA NABlockboard 5 4 122 NA 283/ 273/ 353/ 253/ 403/ 543/ 453/
1/ Source: Pulpapel and FMB, DENR 2/ excluding data for ARMM NA-- not available 3/ In thousand cubic meters Source: FMB, DENR

TABLE 1.8. PRODUCTION OF NON-TIMBER FOREST PRODUCTS, by region, 1992 to 2002
Year 1992 Year 1993
Region Unsplit Rattan
(L.M.) Almaciga Resin
(Kilo) Bamboo Poles
(piece) Palma Brava
(piece) Nipa Shingles
(piece) Unsplit Rattan
(L.M.)
Almaciga Resin (Kilo)
Bamboo Poles (piece)
Palma Brava (piece)
Nipa Shingles (piece)
CAR 65,350 602,300 8,000
Region I 244,934 29,760 17,180
Region II 988,825 885 2,662,017 647,264 9,000 10,000 2,701,647
Region III 872,561 76,750 587,287 79,960
Region IV 2,406,879 567,421 19,940 128,000 4,488,029 509,095 69,762
Region V 75,093 2,050 32,341 1,734,850 89,044 31,897 31,500 1,771,700
Region VI 7,117,589 3,291,164
Region VII
Region VIII 1,003,514 66,500 1,377,271 67,000
Region IX 1,097,802 116,480 455,665 73,164
Region X 3,133,995 384,500 3,122,147 446,000
Region XI 12,207,314 360,402 490,600 11,446,868 329,278 664,200
Region XII 841,746 1,310,801
ARMM 689,000
Philippines 22,693,079 633,921 704,076 33,226 12,634,036 24,845,436 576,095 475,315 41,500 9,017,637
Note: L.M – Lineal Meter Source : FMB, DENR

TABLE 1.8. (continued…..)
Year. 1994 Year 1995 Region
Unsplit Rattan (L.M.)
Almaciga Resin (Kilo)
Bamboo Poles (piece)
Palma Brava (piece)
Nipa Shingles (piece)
Unsplit Rattan (L.M.)
Almaciga Resin (Kilo)
Bamboo Poles (piece)
Palma Brava (piece)
Nipa Shingles (piece)
CAR 352,500
Region I 29,800 24,515
Region II 1,814,027 3,767,356 3,501,137 4,322,620
Region III 27,750 33,869
Region IVa 55,000 79,690 130 1,000 226,281 70,866 750
Region IVb 2,007,603 1,087,827 33,885 10,581 5,700 2,413,798 987,636 14,102
Region V 24,734 510,250 59,659 149,451 14,000 482,650
Region VI 1,068,000 3,157,750
Region VII 171,500 300 39,000
Region VIII 1,355,442 63,500 221,061
Region IX 678,742 389,687
Region X 3,625,187 179,250 3,159,635 295,200
Region XI 8,049,216 326,416 579,700 6,587,174 91,717 20,740
Region XII 1,046,152 482,844 40,000
ARMM 431,500
Philippines 19,087,603 1,231,017 388,181 10,581 6,282,756 17,457,445 1,058,502 306,733 14,000 8,332,062
Note: L.M – Lineal Meter Source : FMB, DENR

TABLE 1.8. (continued)…..
Year 1996 Year 1997 Region Unsplit Rattan
(L.M.) Almaciga Resin
(Kilo) Bamboo Poles
(piece) Palma Brava
(piece) Nipa Shingles
(piece) Unsplit Rattan
(L.M.) Almaciga Resin
(Kilo) Bamboo Poles
(piece) Palma Brava
(piece) Nipa Shingles
(piece)
CAR 273,480 29,474 124,497 11,736
Region I 36,286 82,370 1,035
Region II 4,281,842 3,881 4,667,500 2,447,260 12,000 1,140 3,226,750
Region III 1,500
Region IVa 110,996 950 13,200 3,750
Region IVb 2,589,388 751,283 12,500 1,761,417 200,974 13,842
Region V 30,477 58,913 1,916,080 14,640 293,360
Region VI 1,215,126 1,058,500
Region VII 278,000
Region VIII 1,677,615 139,100 1,787,452 97,500
Region IX 270,044
Region X 354,650 528,293 10,140
Region XI 5,003,786 453,682 13,090 3,498,064 123,227
Region XII 549,161 797,358
Region XIII 8,399,391 313,500 7,833,844 306,500
ARMM 1,035,766 741,000
Philippines 24,612,882 890,383 626,889 4,916 8,428,996 19,519,185 310,474 163,493 1,140 4,898,952
Note: L.M – Lineal Meter Source : FMB, DENR

TABLE 1.8. (continued)…..
Year 1998 Year 1999 Region Unsplit Rattan
(L.M.) Almaciga Resin
(Kilo) Bamboo Poles
(piece) Palma Brava
(piece) Nipa Shingles
(piece) Unsplit Rattan
(L.M.) Almaciga Resin
(Kilo) Bamboo Poles
(piece) Palma Brava
(piece) Nipa Shingles
(piece)
CAR 64,470 4,325 504,189 - 16,454 -
Region I 11,720 35,570 5,000 - 203,638 182 -
Region II 1,715,578 15,000 1,478,625 2,493,189 5,000 3,377,000
Region III - - 8,930 - -
Region IVa 44,980 36,790 1,940 81,380 606,580 43,380 5,680 56,172
Region IVb 1,000,688 245,605 798,838 140,130 1,000
Region V 84,350 17,240 2,017,550 90,695 286,831 2,190,203
Region VI 2,618,000 5,381,437
Region VII 273 503,800 41,150 1,733,892
Region VIII 122,000 1,866,096 152,700
Region IX 49,040 410,692
Region X 444,487 23,803 361,170
Region XI 2,017,739 262,505 2,116,140 578,788
Region XII 709,500 265,741 575 5,500
Region XIII 4,283,336 46,000 6,124,289 1,000
ARMM
Philippines 10,463,538 260,605 447,616 19,180 6,745,355 15,551,924 297,830 984,610 292,693 12,745,204
Note: L.M – Lineal Meter Source : FMB, DENR
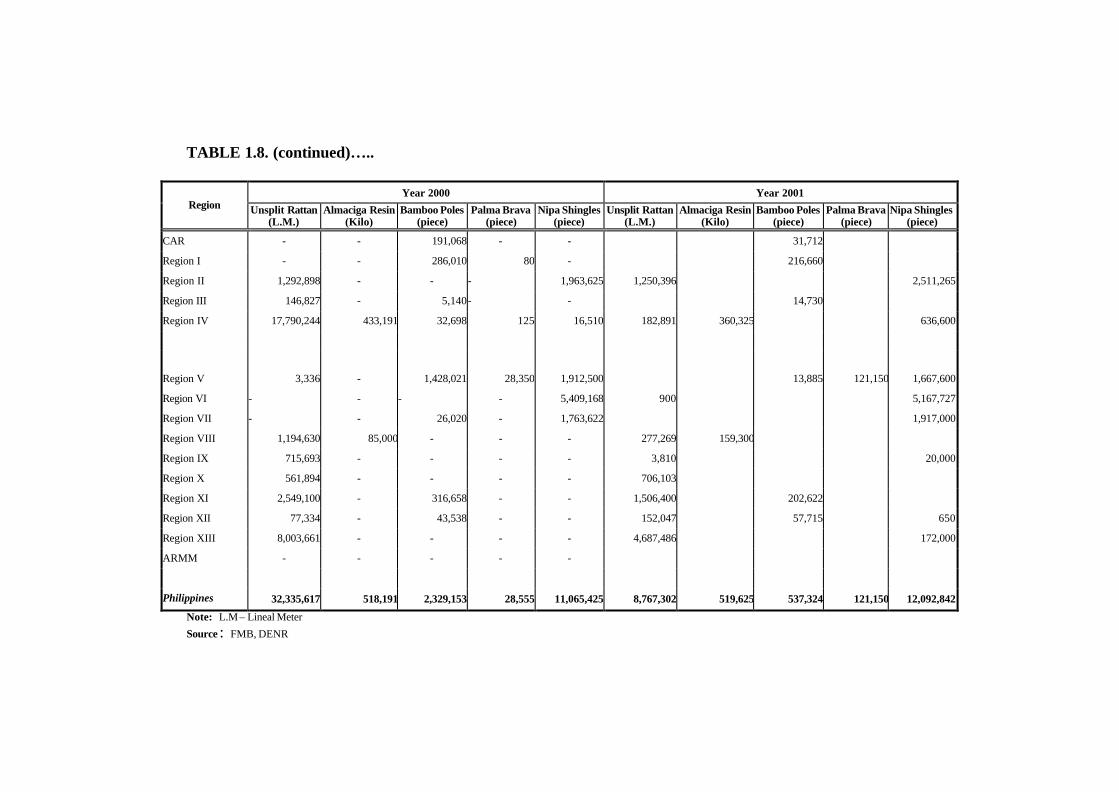
TABLE 1.8. (continued)…..
Year 2000 Year 2001 Region Unsplit Rattan
(L.M.) Almaciga Resin
(Kilo) Bamboo Poles
(piece) Palma Brava
(piece) Nipa Shingles
(piece) Unsplit Rattan
(L.M.) Almaciga Resin
(Kilo) Bamboo Poles
(piece) Palma Brava
(piece) Nipa Shingles
(piece)
CAR - - 191,068 - - 31,712
Region I - - 286,010 80 - 216,660
Region II 1,292,898 - - - 1,963,625 1,250,396 2,511,265
Region III 146,827 - 5,140 - - 14,730
Region IV 17,790,244 433,191 32,698 125 16,510 182,891 360,325 636,600
Region V 3,336 - 1,428,021 28,350 1,912,500 13,885 121,150 1,667,600
Region VI - - - - 5,409,168 900 5,167,727
Region VII - - 26,020 - 1,763,622 1,917,000
Region VIII 1,194,630 85,000 - - - 277,269 159,300
Region IX 715,693 - - - - 3,810 20,000
Region X 561,894 - - - - 706,103
Region XI 2,549,100 - 316,658 - - 1,506,400 202,622
Region XII 77,334 - 43,538 - - 152,047 57,715 650
Region XIII 8,003,661 - - - - 4,687,486 172,000
ARMM - - - - -
Philippines 32,335,617 518,191 2,329,153 28,555 11,065,425 8,767,302 519,625 537,324 121,150 12,092,842
Note: L.M – Lineal Meter Source : FMB, DENR
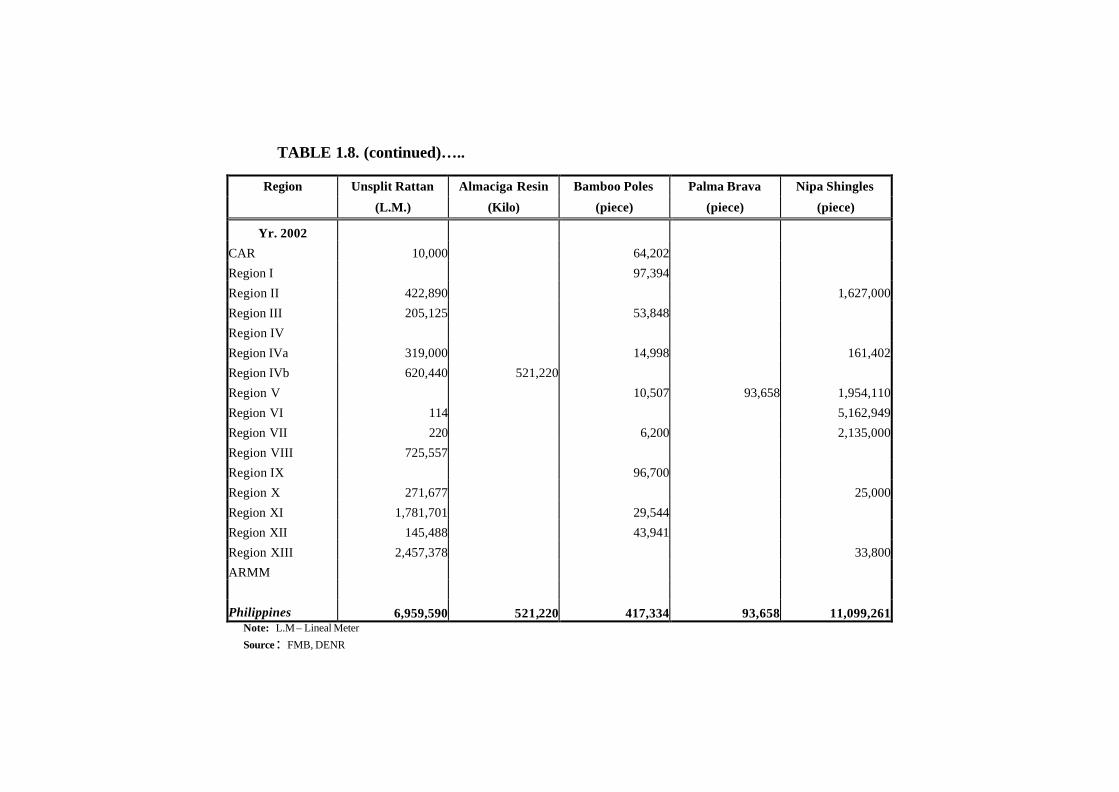
TABLE 1.8. (continued)…..
Region Unsplit Rattan Almaciga Resin Bamboo Poles Palma Brava Nipa Shingles
(L.M.) (Kilo) (piece) (piece) (piece)
Yr. 2002
CAR 10,000 64,202
Region I 97,394
Region II 422,890 1,627,000
Region III 205,125 53,848
Region IV
Region IVa 319,000 14,998 161,402
Region IVb 620,440 521,220
Region V 10,507 93,658 1,954,110
Region VI 114 5,162,949
Region VII 220 6,200 2,135,000
Region VIII 725,557
Region IX 96,700
Region X 271,677 25,000
Region XI 1,781,701 29,544
Region XII 145,488 43,941
Region XIII 2,457,378 33,800
ARMM
Philippines 6,959,590 521,220 417,334 93,658 11,099,261 Note: L.M – Lineal Meter Source : FMB, DENR
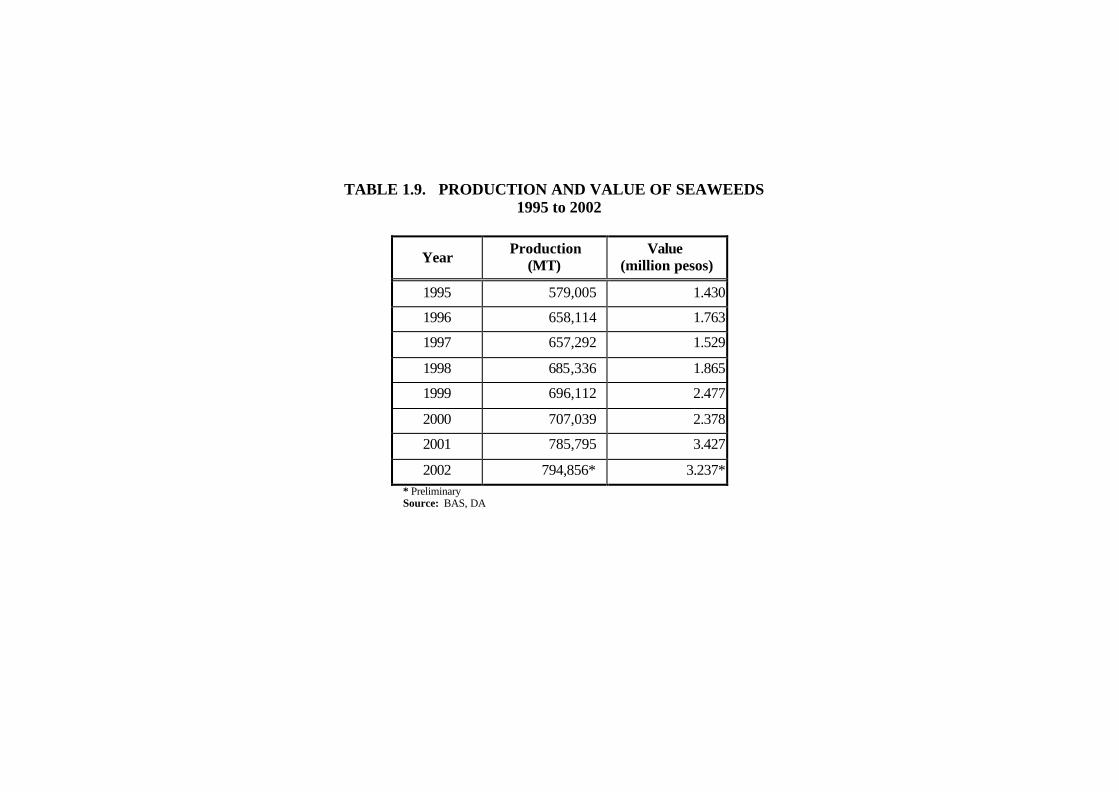
TABLE 1.9. PRODUCTION AND VALUE OF SEAWEEDS 1995 to 2002
Year Production (MT)
Value (million pesos)
1995 579,005 1.430
1996 658,114 1.763
1997 657,292 1.529
1998 685,336 1.865
1999 696,112 2.477
2000 707,039 2.378
2001 785,795 3.427
2002 794,856* 3.237* * Preliminary Source: BAS, DA
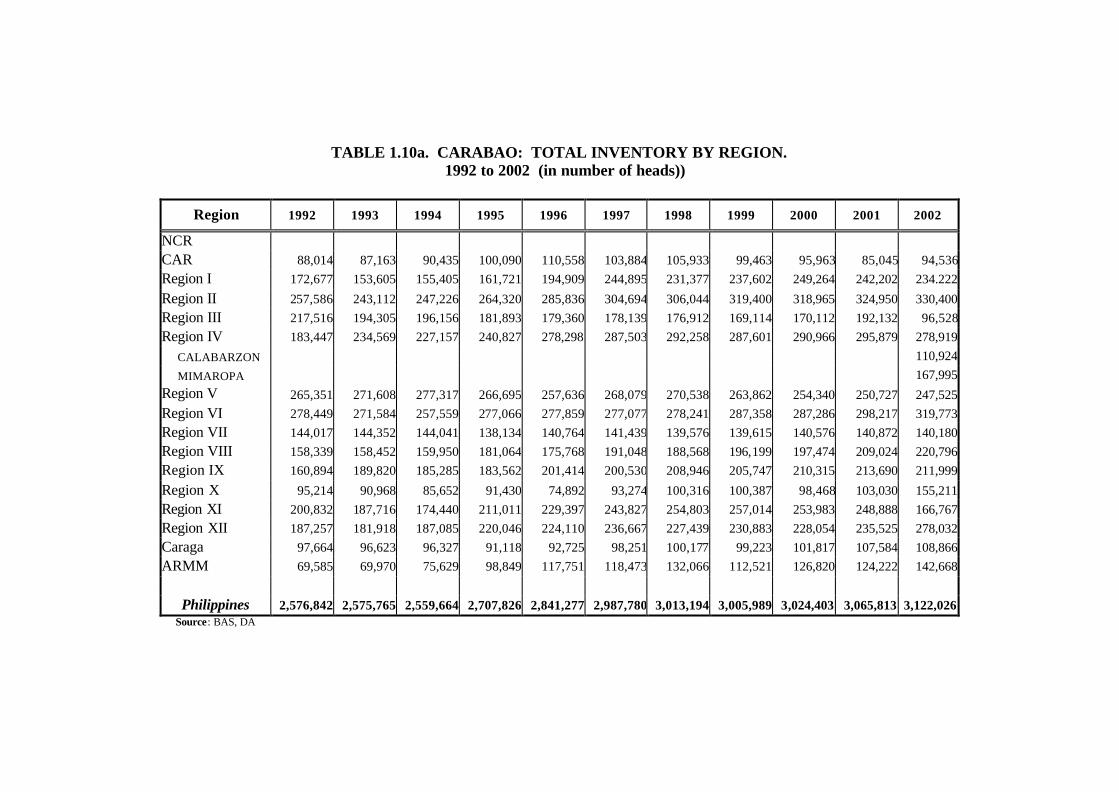
TABLE 1.10a. CARABAO: TOTAL INVENTORY BY REGION. 1992 to 2002 (in number of heads))
Region 1992 1993 1994 1995 1996 1997 1998 1999 2000 2001 2002
NCR
CAR 88,014 87,163 90,435 100,090 110,558 103,884 105,933 99,463 95,963 85,045 94,536Region I 172,677 153,605 155,405 161,721 194,909 244,895 231,377 237,602 249,264 242,202 234.222
Region II 257,586 243,112 247,226 264,320 285,836 304,694 306,044 319,400 318,965 324,950 330,400Region III 217,516 194,305 196,156 181,893 179,360 178,139 176,912 169,114 170,112 192,132 96,528Region IV 183,447 234,569 227,157 240,827 278,298 287,503 292,258 287,601 290,966 295,879 278,919
CALABARZON 110,924
MIMAROPA 167,995Region V 265,351 271,608 277,317 266,695 257,636 268,079 270,538 263,862 254,340 250,727 247,525Region VI 278,449 271,584 257,559 277,066 277,859 277,077 278,241 287,358 287,286 298,217 319,773Region VII 144,017 144,352 144,041 138,134 140,764 141,439 139,576 139,615 140,576 140,872 140,180Region VIII 158,339 158,452 159,950 181,064 175,768 191,048 188,568 196,199 197,474 209,024 220,796Region IX 160,894 189,820 185,285 183,562 201,414 200,530 208,946 205,747 210,315 213,690 211,999
Region X 95,214 90,968 85,652 91,430 74,892 93,274 100,316 100,387 98,468 103,030 155,211Region XI 200,832 187,716 174,440 211,011 229,397 243,827 254,803 257,014 253,983 248,888 166,767Region XII 187,257 181,918 187,085 220,046 224,110 236,667 227,439 230,883 228,054 235,525 278,032Caraga 97,664 96,623 96,327 91,118 92,725 98,251 100,177 99,223 101,817 107,584 108,866ARMM 69,585 69,970 75,629 98,849 117,751 118,473 132,066 112,521 126,820 124,222 142,668
Philippines 2,576,842 2,575,765 2,559,664 2,707,826 2,841,277 2,987,780 3,013,194 3,005,989 3,024,403 3,065,813 3,122,026
Source: BAS, DA

TABLE 1.10b. CATTLE: TOTAL INVENTORY BY REGION. 1992 to 2002 (in number of heads)
Region 1992 1993 1994 1995 1996 1997 1998 1999* 2000 2001 2002
CAR 64,536 55,630 54,662 60,869 62,801 59,406 61,062 58,410 57,487 62,253 69,016
Region I 209,698 212,993 205,515 231,352 266,012 309,767 325,160 338,878 332,423 327,684 330,546
Region II 83,882 91,256 105,135 116,771 121,765 138,770 144,340 150,521 152,493 171,489 170,996
Region III 140,066 132,119 152,078 138,480 148,413 170,074 155,228 166,198 180,287 159,963 165,830
Region IV 214,683 248,421 224,671 219,828 235,285 256,136 276,425 302,389 310,026 317,818 329,409
CALABARZON 211,693
MIMAROPA 117,716
Region V 111,970 124,272 130,525 122,559 121,642 125,948 129,994 124,415 115,009 115,754 110,664
Region VI 129,202 164,282 157,245 176,520 172,574 172,164 175,713 189,951 192,676 191,525 188,490
Region VII 217,654 241,619 262,812 276,650 297,496 299,821 293,575 295,440 288,922 289,310 288,268
Region VIII 22,844 30,980 34,306 40,260 35,947 35,774 31,457 31,001 30,035 29,366 29,775
Region IX 66,465 88,803 82,845 92,670 103,116 123,976 128,252 126,083 152,992 2,566 188,521
Region X 197,446 229,113 211,903 205,400 203,465 213,202 247,838 248,065 246,054 249,728 290,700
Region XI 139,194 131,525 146,768 169,430 176,458 179,422 197,578 199,835 190,988 191,754 116,703
Region XII 62,500 76,440 78,830 82,280 91,523 94,943 104,269 101,466 102,708 116,305 161,048
Caraga 10,977 14,277 15,545 15,262 14,177 11,051 10,372 11,108 12,955 13,746 13,622
ARMM 59,453 73,131 73,209 72,720 77,781 75,830 102,311 93,376 113,798 94,015 94,231
Philippines 1,730,570 1,914,861 1,936,049 2,021,051 2,128,455 2,266,284 2,383,574 2,437,136 2,478,853 2,495,601 2,547,819 Source: BAS, DA
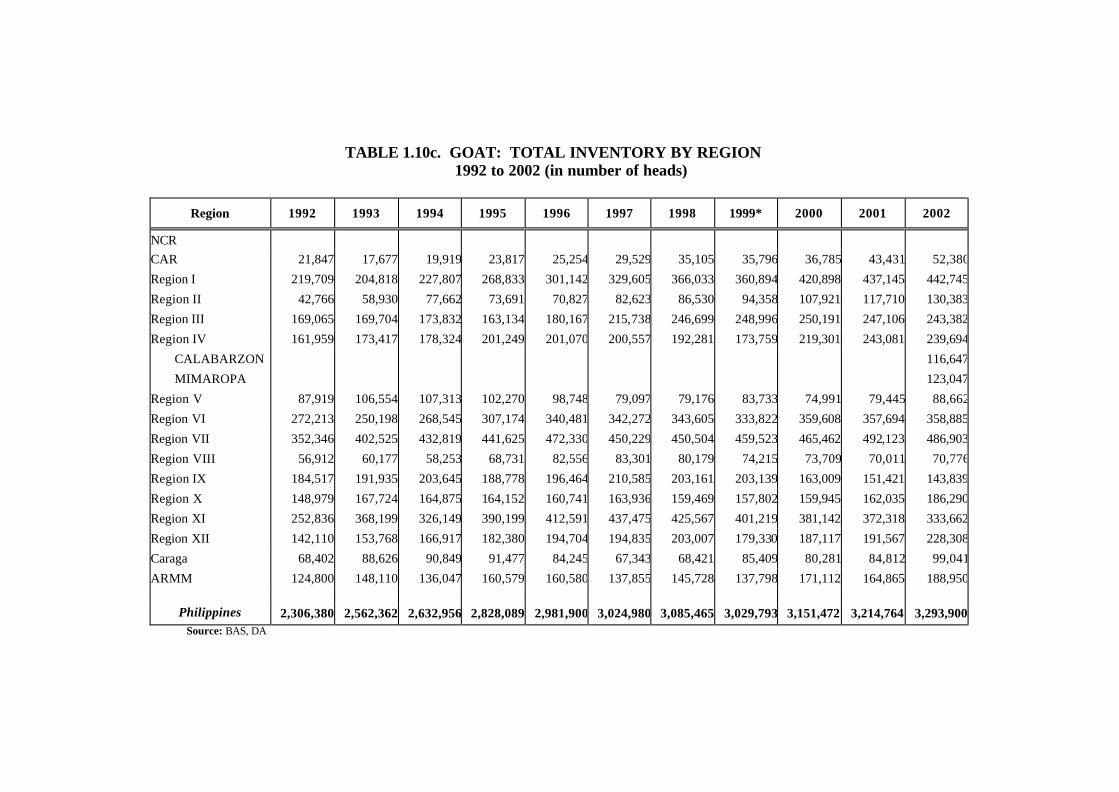
TABLE 1.10c. GOAT: TOTAL INVENTORY BY REGION 1992 to 2002 (in number of heads)
Region 1992 1993 1994 1995 1996 1997 1998 1999* 2000 2001 2002
NCR CAR 21,847 17,677 19,919 23,817 25,254 29,529 35,105 35,796 36,785 43,431 52,380
Region I 219,709 204,818 227,807 268,833 301,142 329,605 366,033 360,894 420,898 437,145 442,745
Region II 42,766 58,930 77,662 73,691 70,827 82,623 86,530 94,358 107,921 117,710 130,383
Region III 169,065 169,704 173,832 163,134 180,167 215,738 246,699 248,996 250,191 247,106 243,382
Region IV 161,959 173,417 178,324 201,249 201,070 200,557 192,281 173,759 219,301 243,081 239,694
CALABARZON 116,647
MIMAROPA 123,047
Region V 87,919 106,554 107,313 102,270 98,748 79,097 79,176 83,733 74,991 79,445 88,662
Region VI 272,213 250,198 268,545 307,174 340,481 342,272 343,605 333,822 359,608 357,694 358,885
Region VII 352,346 402,525 432,819 441,625 472,330 450,229 450,504 459,523 465,462 492,123 486,903
Region VIII 56,912 60,177 58,253 68,731 82,556 83,301 80,179 74,215 73,709 70,011 70,776
Region IX 184,517 191,935 203,645 188,778 196,464 210,585 203,161 203,139 163,009 151,421 143,839
Region X 148,979 167,724 164,875 164,152 160,741 163,936 159,469 157,802 159,945 162,035 186,290
Region XI 252,836 368,199 326,149 390,199 412,591 437,475 425,567 401,219 381,142 372,318 333,662
Region XII 142,110 153,768 166,917 182,380 194,704 194,835 203,007 179,330 187,117 191,567 228,308
Caraga 68,402 88,626 90,849 91,477 84,245 67,343 68,421 85,409 80,281 84,812 99,041
ARMM 124,800 148,110 136,047 160,579 160,580 137,855 145,728 137,798 171,112 164,865 188,950
Philippines 2,306,380 2,562,362 2,632,956 2,828,089 2,981,900 3,024,980 3,085,465 3,029,793 3,151,472 3,214,764 3,293,900Source: BAS, DA

TABLE 1.10d. HOG: TOTAL INVENTORY BY REGION 1992 to 2002 (in number of heads)
Region 1992 1993 1994 1995 1996 1997 1998 1999* 2000 2001 2002
CAR 202,113 200,475 217,374 251,650 252,130 247,800 257,610 250,390 251,700 293,920 294,500
Region I 482,604 482,317 448,071 402,060 433,470 505,880 510,370 480,240 412,810 456,580 474,880
Region II 454,021 474,928 462,930 476,640 445,510 508,640 589,670 565,290 537,780 642,530 642,530
Region III 1,024,788 1,052,993 1,125,582 1,235,750 1,329,910 1,373,500 1,569,880 1,478,970 1,574,240 1,589,120 1,738,760
Region IV 1,140,151 1,180,899 1,221,882 1,353,450 1,355,740 1,495,210 1,533,060 1,584,750 1,656,240 1,714,100 1,794,010
CALABARZON 1,418,010
MIMAROPA 376,000
Region V 568,849 568,774 558,217 519,050 473,060 581,330 568,150 616,930 632,390 635,880 705,850
Region VI 581,888 590,032 654,556 685,870 770,300 770,060 778,710 844,450 920,380 982,820 1,000,760
Region VII 750,265 707,184 721,574 772,310 708,490 747,050 789,950 788,880 792,850 818,300 862,330
Region VIII 574,210 553,662 585,356 697,780 693,130 737,400 697,280 730,770 738,450 682,780 713,590
Region IX 438,075 382,388 421,300 481,520 502,950 562,830 608,890 612,970 663,220 717,070 711,680
Region X 424,415 361,792 399,517 428,240 475,360 509,740 534,550 659,040 630,280 636,490 754,780
Region XI 733,703 760,491 796,018 947,000 886,680 1,016,590 1,030,210 1,020,600 1,099,850 1,895,760 844,990
Region XII 373,117 364,648 337,002 340,430 307,240 301,360 326,850 360,850 439,370 458,910 677,920
Caraga 252,677 255,322 257,480 322,830 353,740 366,920 388,280 381,630 338,310 349,330 386,710
ARMM 21,021 17,765 19,670 26,620 38,240 27,870 27,010 21,240 22,820 26,480 49,410
Philippines 8,021,897 7,953,670 8,226,529 8,941,200 9,025,950 9,752,180 10,210,470 10,397,000 10,710,690 11,063,140 11,652,700Source: Bureau of Agricultural Statistics, DA

TABLE 1.10.e. CHICKEN: TOTAL INVENTORY BY REGION 1992 to 2002 (in number of heads)
Region 1992 1993 1994 1995 1996 1997 1998 1999* 2000 2001 2002
NCR 742,537 861,935 943,818 756,899 1,067,063 1,169,274 954,138 269,761 507,900 507,900 580,840
CAR 1,176,471 1,025,076 1,015,921 1,319,477 1,467,172 1,591,311 1,441,592 1,453,477 1,461,147 1,922,434 1,826,004
Region I 4,866,993 4,997,988 4,688,928 5,380,226 5,654,176 6,627,778 7,240,219 5,512,711 5,669,526 6,128,596 6,101,954
Region II 3,020,351 3,614,847 3,659,026 4,938,777 5,799,468 6,727,936 8,021,831 7,085,670 7,018,329 7,211,699 7,772,187
Region III 14,509,267 15,398,356 16,590,571 15,430,550 20,771,288 23,435,670 26,110,294 21,100,961 20,336,579 19,753,635 21,169,335
Region IV 17,237,570 18,700,194 20,456,055 19,228,054 24,362,154 28,127,884 23,313,001 20,973,171 18,773,278 17,123,829 21,351,879
CALABARZON 18,017,834
MIMAROPA 3,334,045
Region V 4,050,268 3,775,204 3,800,243 3,675,045 4,337,752 4,801,784 6,171,260 7,570,241 6,035,831 6,023,564 6,701,822
Region VI 8,785,626 8,639,799 9,387,405 10,478,508 11,364,667 13,255,039 13,827,678 11,599,664 13,094,635 12,543,781 14,228,646
Region VII 6,932,603 8,908,518 7,812,707 8,462,666 8,969,125 10,925,840 11,522,181 8,155,092 9,055,476 9,766,548 11,201,637
Region VIII 2,591,128 2,523,981 3,581,116 3,960,081 4,639,387 5,537,212 6,408,467 4,814,958 5,501,014 5,158,128 4,637,680
Region IX 3,276,986 3,016,727 4,279,601 4,821,493 4,728,052 5,781,920 4,992,192 4,466,900 4,176,400 3,877,343 6,374,814
Region X 3,273,013 3,204,658 3,945,518 4,573,151 5,174,819 6,274,345 7,362,996 6,122,347 5,449,187 5,892,176 6,989,644
Region XI 6,002,624 7,138,588 7,668,333 7,147,585 10,374,370 12,913,197 13,434,122 10,040,942 10,445,403 10,828,026 7,706,504
Region XII 2,638,614 2,593,775 2,512,559 2,808,855 3,120,112 3,513,202 3,479,014 3,099,909 3,950,931 3,995,719 5,928,824
Caraga 1,443,732 1,464,228 1,418,172 1,731,781 2,098,846 2,407,572 2,579,242 2,131,601 2,047,041 2,322,142 2,404,819
ARMM 977,426 1,293,645 1,349,738 1,502,577 1,853,944 1,872,844 1,662,432 1,441,827 1,663,784 1,659,485 1,854,541
Philippines 81,525,209 87,157,519 93,109,711 96,215,725 115,782,395 134,962,808 138,520,660 115,839,232 115,186,461 115,606,517 168,797,934Source: BAS, DA
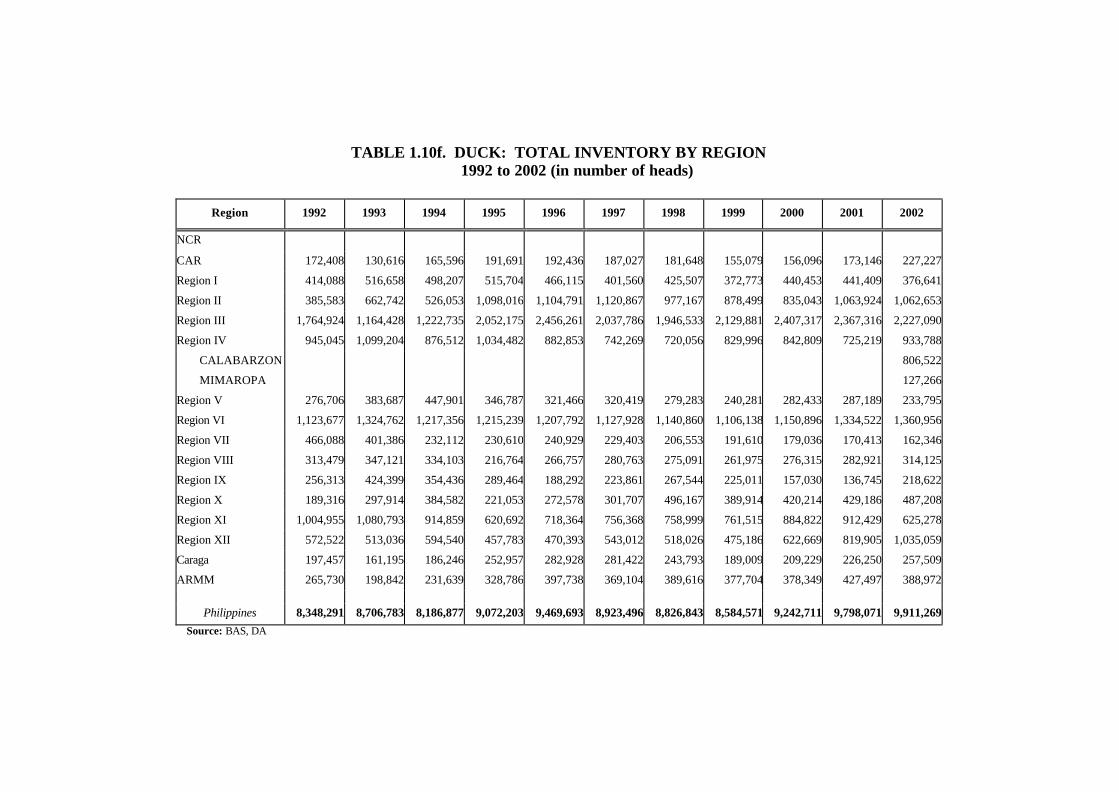
TABLE 1.10f. DUCK: TOTAL INVENTORY BY REGION 1992 to 2002 (in number of heads)
Region 1992 1993 1994 1995 1996 1997 1998 1999 2000 2001 2002
NCR
CAR 172,408 130,616 165,596 191,691 192,436 187,027 181,648 155,079 156,096 173,146 227,227
Region I 414,088 516,658 498,207 515,704 466,115 401,560 425,507 372,773 440,453 441,409 376,641
Region II 385,583 662,742 526,053 1,098,016 1,104,791 1,120,867 977,167 878,499 835,043 1,063,924 1,062,653
Region III 1,764,924 1,164,428 1,222,735 2,052,175 2,456,261 2,037,786 1,946,533 2,129,881 2,407,317 2,367,316 2,227,090
Region IV 945,045 1,099,204 876,512 1,034,482 882,853 742,269 720,056 829,996 842,809 725,219 933,788
CALABARZON 806,522
MIMAROPA 127,266
Region V 276,706 383,687 447,901 346,787 321,466 320,419 279,283 240,281 282,433 287,189 233,795
Region VI 1,123,677 1,324,762 1,217,356 1,215,239 1,207,792 1,127,928 1,140,860 1,106,138 1,150,896 1,334,522 1,360,956
Region VII 466,088 401,386 232,112 230,610 240,929 229,403 206,553 191,610 179,036 170,413 162,346
Region VIII 313,479 347,121 334,103 216,764 266,757 280,763 275,091 261,975 276,315 282,921 314,125
Region IX 256,313 424,399 354,436 289,464 188,292 223,861 267,544 225,011 157,030 136,745 218,622
Region X 189,316 297,914 384,582 221,053 272,578 301,707 496,167 389,914 420,214 429,186 487,208
Region XI 1,004,955 1,080,793 914,859 620,692 718,364 756,368 758,999 761,515 884,822 912,429 625,278
Region XII 572,522 513,036 594,540 457,783 470,393 543,012 518,026 475,186 622,669 819,905 1,035,059
Caraga 197,457 161,195 186,246 252,957 282,928 281,422 243,793 189,009 209,229 226,250 257,509
ARMM 265,730 198,842 231,639 328,786 397,738 369,104 389,616 377,704 378,349 427,497 388,972
Philippines 8,348,291 8,706,783 8,186,877 9,072,203 9,469,693 8,923,496 8,826,843 8,584,571 9,242,711 9,798,071 9,911,269Source: BAS, DA

TABLE 1.11. LIVESTOCK AND POULTRY PRODUCTION, 1992 to 2002
(in thousand metric tons)
Sector 1992 1993 1994 1995 1996 1997 1998 1999 2000 2001 2002 Ave. Annual Growth Rate
Livestock 336.24 356.74 365.95 388.96 403.06 429.83 447.22 1930.78 1988.51 2045.42 2136.02 20.31
Carabao 108.6 108.34 100.69 103.96 99.24 106.14 113.05 118.96 123.97 125.15 132.4 2.00Cattle 166.91 181.71 195.55 213.08 232.34 251.47 260.81 271.24 271.56 261.17 261.06 4.57Goat 59.67 65.59 68.56 70.71 70.18 70.86 71.95 73.90 75.19 74.59 74.79 2.28Hog 1,056.98 1,101.52 1,152.68 1,213.10 1,296.47 1,357.78 1,406.59 1,466.68 1,517.79 1,584.52 1,667.76 4.67
Poultry 691.08 720.42 753. 46 795.22 902.76 980.45 970.74 980.39 1,049.31 1,152.31 1,227.85 5.92
Chicken 651.99 678.76 709.46 747.85 851.81 929.68 919.45 929.16 997.82 1,098.79 1,173.74 6.06Duck 39.09 41.66 44.00 47.37 50.95 50.77 51.29 51.23 51.49 53.52 54.11 3.30
TOTAL 1,027.32 1,077.16 1,119.41 1,184.18 1,305.82 1,410.28 1,417.96 2,911.17 3,037.81 3,197.74 3,363.87 12.59Source: BAS, DA
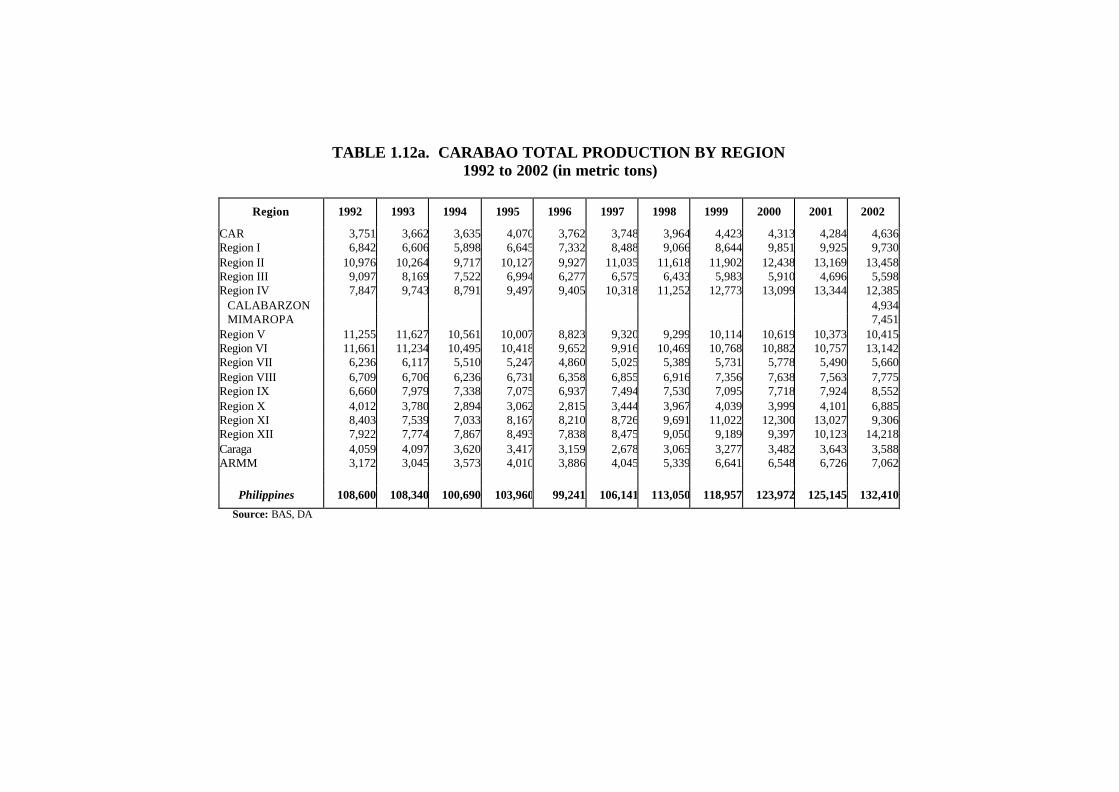
TABLE 1.12a. CARABAO TOTAL PRODUCTION BY REGION 1992 to 2002 (in metric tons)
Region 1992 1993 1994 1995 1996 1997 1998 1999 2000 2001 2002
CAR 3,751 3,662 3,635 4,070 3,762 3,748 3,964 4,423 4,313 4,284 4,636Region I 6,842 6,606 5,898 6,645 7,332 8,488 9,066 8,644 9,851 9,925 9,730Region II 10,976 10,264 9,717 10,127 9,927 11,035 11,618 11,902 12,438 13,169 13,458Region III 9,097 8,169 7,522 6,994 6,277 6,575 6,433 5,983 5,910 4,696 5,598Region IV 7,847 9,743 8,791 9,497 9,405 10,318 11,252 12,773 13,099 13,344 12,385
CALABARZON 4,934MIMAROPA 7,451
Region V 11,255 11,627 10,561 10,007 8,823 9,320 9,299 10,114 10,619 10,373 10,415Region VI 11,661 11,234 10,495 10,418 9,652 9,916 10,469 10,768 10,882 10,757 13,142Region VII 6,236 6,117 5,510 5,247 4,860 5,025 5,389 5,731 5,778 5,490 5,660Region VIII 6,709 6,706 6,236 6,731 6,358 6,855 6,916 7,356 7,638 7,563 7,775Region IX 6,660 7,979 7,338 7,075 6,937 7,494 7,530 7,095 7,718 7,924 8,552Region X 4,012 3,780 2,894 3,062 2,815 3,444 3,967 4,039 3,999 4,101 6,885Region XI 8,403 7,539 7,033 8,167 8,210 8,726 9,691 11,022 12,300 13,027 9,306Region XII 7,922 7,774 7,867 8,493 7,838 8,475 9,050 9,189 9,397 10,123 14,218Caraga 4,059 4,097 3,620 3,417 3,159 2,678 3,065 3,277 3,482 3,643 3,588ARMM 3,172 3,045 3,573 4,010 3,886 4,045 5,339 6,641 6,548 6,726 7,062
Philippines 108,600 108,340 100,690 103,960 99,241 106,141 113,050 118,957 123,972 125,145 132,410
Source: BAS, DA

TABLE 1.12b. CATTLE TOTAL PRODUCTION BY REGION 1992 to 2002 (in metric tons)
Region 1992 1993 1994 1995 1996 1997 1998 1999 2000 2001 2002
CAR 5,751 5,087 5,609 6,553 6,648 6,554 6,446 6,515 6,695 6,553 7,132Region I 19,789 19,915 21,306 25,403 29,274 34,584 35,852 37,077 37,460 35,145 33,303Region II 8,402 8,875 10,552 12,096 13,540 15,457 16,163 17,236 17,003 15,398 15,127Region III 13,534 12,811 15,033 14,636 16,596 18,823 18,185 19,919 20,109 19,277 20,403Region IV 21,073 23,410 22,060 23,566 25,911 28,297 29,855 30,799 30,751 28,663 29,735
CALABARZON 19,132MIMAROPA 10,603
Region V 11,015 12,359 12,653 12,665 13,042 14,142 14,292 15,954 15,598 14,614 14,339Region VI 13,078 15,360 16,656 18,077 18,636 19,061 18,965 19,953 20,263 20,464 22,981Region VII 21,028 23,180 26,717 29,103 31,975 32,197 32,479 32,965 33,683 33,144 31,705Region VIII 2,129 2,968 3,694 4,049 3,856 3,457 3,680 3,224 3,375 3,095 3,243Region IX 6,641 8,509 8,619 9,954 11,547 14,087 14,413 14,802 15,112 15,817 15,807Region X 18,750 20,792 20,734 21,330 22,435 24,290 25,727 26,968 26,509 25,921 28,506Region XI 12,511 13,066 15,263 17,645 18,991 19,863 21,135 22,766 22,443 21,009 12,326Region XII 6,169 7,174 7,872 8,774 9,973 10,604 11,124 11,670 11,134 10,196 14,917Caraga 1,001 1,400 1,556 1,557 1,499 1,270 1,286 1,328 1,423 1,431 1,388ARMM 6,039 6,805 7,226 7,672 8,418 8,785 11,206 10,060 9,998 10,442 10,146
Philippines 166,910 181,710 195,550 213,080 232,341 251,470 260,810 271,236 271,556 261,169 261,058
Source: BAS, DA
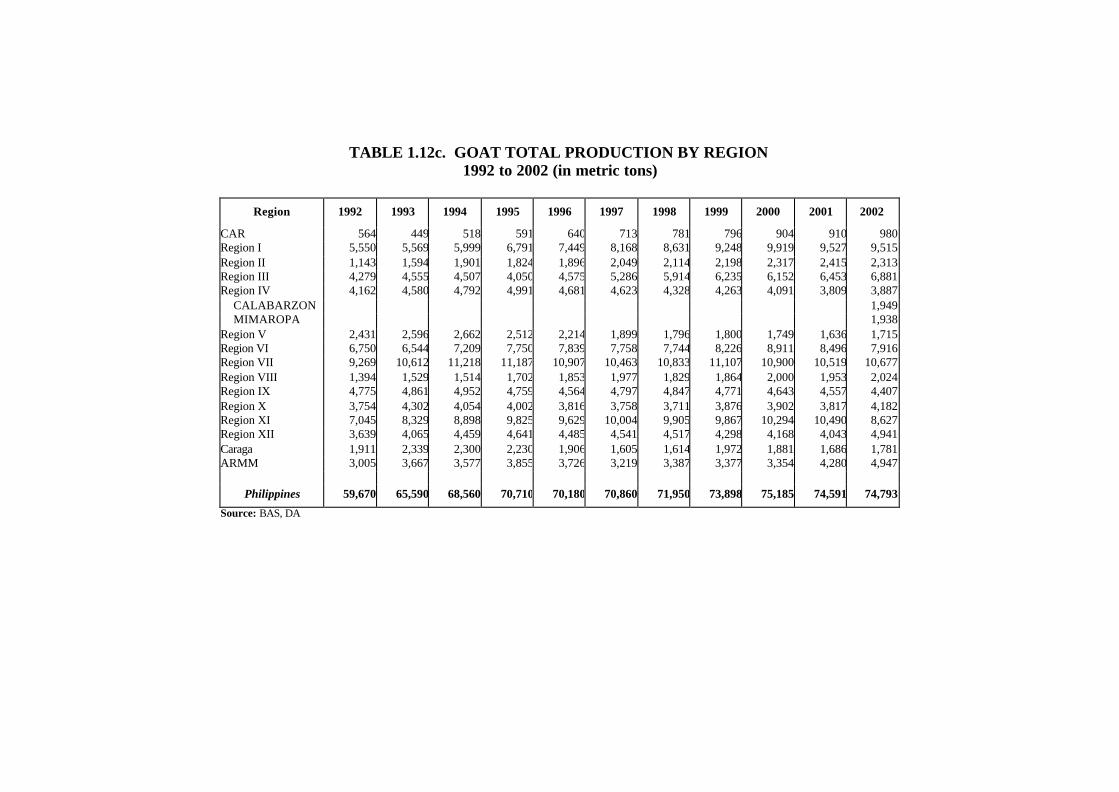
TABLE 1.12c. GOAT TOTAL PRODUCTION BY REGION 1992 to 2002 (in metric tons)
Region 1992 1993 1994 1995 1996 1997 1998 1999 2000 2001 2002
CAR 564 449 518 591 640 713 781 796 904 910 980 Region I 5,550 5,569 5,999 6,791 7,449 8,168 8,631 9,248 9,919 9,527 9,515 Region II 1,143 1,594 1,901 1,824 1,896 2,049 2,114 2,198 2,317 2,415 2,313 Region III 4,279 4,555 4,507 4,050 4,575 5,286 5,914 6,235 6,152 6,453 6,881 Region IV 4,162 4,580 4,792 4,991 4,681 4,623 4,328 4,263 4,091 3,809 3,887
CALABARZON 1,949 MIMAROPA 1,938
Region V 2,431 2,596 2,662 2,512 2,214 1,899 1,796 1,800 1,749 1,636 1,715 Region VI 6,750 6,544 7,209 7,750 7,839 7,758 7,744 8,226 8,911 8,496 7,916 Region VII 9,269 10,612 11,218 11,187 10,907 10,463 10,833 11,107 10,900 10,519 10,677 Region VIII 1,394 1,529 1,514 1,702 1,853 1,977 1,829 1,864 2,000 1,953 2,024 Region IX 4,775 4,861 4,952 4,759 4,564 4,797 4,847 4,771 4,643 4,557 4,407 Region X 3,754 4,302 4,054 4,002 3,816 3,758 3,711 3,876 3,902 3,817 4,182 Region XI 7,045 8,329 8,898 9,825 9,629 10,004 9,905 9,867 10,294 10,490 8,627 Region XII 3,639 4,065 4,459 4,641 4,485 4,541 4,517 4,298 4,168 4,043 4,941 Caraga 1,911 2,339 2,300 2,230 1,906 1,605 1,614 1,972 1,881 1,686 1,781 ARMM 3,005 3,667 3,577 3,855 3,726 3,219 3,387 3,377 3,354 4,280 4,947
Philippines 59,670 65,590 68,560 70,710 70,180 70,860 71,950 73,898 75,185 74,591 74,793
Source: BAS, DA

TABLE 1.12d. HOG TOTAL PRODUCTION BY REGION 1992 to 2002 (in metric tons)
Region 1992 1993 1994 1995 1996 1997 1998 1999 2000 2001 2002
CAR 29,132 29,080 29,943 33,153 35,408 35,475 33,769 33,548 35,380 37,295 40,311Region I 61,753 66,671 62,283 54,555 65,460 65,049 68,659 72,410 74,286 77,152 79,197Region II 57,810 61,545 62,394 66,402 68,420 75,320 78,085 81,936 82,011 87,416 93,225Region III 133,859 148,729 160,028 158,108 184,083 206,047 224,765 226,469 240,673 254,983 282,513Region IV 151,427 162,217 171,806 186,443 192,360 201,032 211,864 223,020 230,368 246,137 259,918
CALABARZON 207,635MIMAROPA 52,283
Region V 72,594 78,243 73,121 69,715 72,015 77,786 79,130 82,998 84,732 85,907 92,855Region VI 78,460 83,644 89,273 98,326 106,099 104,032 108,811 116,445 121,044 123,995 126,772Region VII 98,924 96,323 105,190 104,030 101,832 104,009 107,253 112,627 116,268 121,796 125,256Region VIII 74,890 81,655 85,442 94,535 95,993 99,720 96,077 99,164 100,092 103,332 105,002Region IX 57,106 55,122 56,949 68,392 75,744 74,585 76,091 80,923 83,758 87,827 92,166Region X 52,699 53,475 55,546 62,502 68,470 72,712 75,069 76,865 80,088 82,657 96,159Region XI 100,656 101,115 115,662 125,488 133,260 146,035 148,634 156,470 164,635 166,290 124,646Region XII 50,999 46,506 44,849 43,402 42,251 43,898 44,779 47,768 49,028 51,888 86,768Caraga 33,631 34,827 37,221 44,262 49,858 48,646 50,239 52,446 51,633 53,385 56,294ARMM 3,040 2,367 2,975 3,785 5,216 3,434 3,367 3,593 3,797 4,457 6,681
Philippines 1,056,980 1,101,520 1,152,680 1,213,100 1,296,469 1,357,780 1,406,592 1,466,682 1,517,793 1,584,517 1,667,763
Source: BAS, DA

TABLE 1.12e. CHICKEN TOTAL PRODUCTION BY REGION 1992 to 2002 (in metric tons)
Region 1990 1991 1992 1993 1994 1995 1996 1997 1998 1999 2000 2001 2002
NCR 9,784 9,808 12,064 14,652 13,328 13,973 16,774 * * - - - - CAR 5,730 5,547 5,404 4,494 5,484 5,850 5,501 5,551 4,906 5,804 6,351 6,998 7,176Region I 28,177 29,982 31,410 29,989 32,633 33,012 34,951 40,188 41,153 43,843 45,789 50,256 51,194Region II 20,898 18,832 19,543 21,960 22,710 26,049 27,275 30,894 36,300 38,810 38,554 41,315 45,717Region III 143,473 142,197 152,446 181,982 189,765 193,702 229,556 251,086 268,732 263,626 282,429 323,227 352,686Region IV 157,670 159,713 188,712 190,831 193,974 213,296 267,755 282,373 225,704 224,503 251,211 264,146 297,890
CALABARZON 290,855MIMAROPA 7,035
Region V 16,887 19,995 19,142 18,600 18,865 18,091 19,066 20,694 23,275 24,386 22,204 25,629 26,012Region VI 41,919 45,995 48,757 48,568 55,264 54,728 58,523 60,375 69,142 71,564 79,164 88,608 26,333Region VII 32,452 39,426 60,035 41,823 43,439 48,181 52,963 59,334 65,335 62,456 67,149 72,635 69,501Region VIII 13,266 13,998 16,019 16,466 17,273 20,442 23,460 26,342 28,136 30,181 31,700 33,676 76,096Region IX 14,355 17,302 15,059 17,216 19,685 19,154 19,373 21,045 20,135 20,669 20,773 22,539 37,047Region X 14,045 17,670 16,237 15,625 19,857 21,875 22,301 25,400 32,436 31,060 32,605 38,979 42,642Region XI 39,160 33,949 41,675 50,970 46,563 51,595 61,379 73,537 75,214 78,150 84,839 92,143 85,535Region XII 11,224 11,148 12,951 11,678 14,812 12,868 13,319 15,417 12,735 16,331 17,076 18,067 33,372Caraga 6,144 7,194 7,734 8,174 9,251 8,442 9,474 10,373 10,440 11,230 11,281 12,758 13,866ARMM 4,469 5,124 4,802 5,732 6,557 6,592 6,916 7,072 5,806 6,547 6,691 7,817 8,671
Philippines 559,650 577,880 651,990 678,760 709,460 747,850 868,586 929,680 919,450 929,160 997,816 1,098,793 1,173,738Source: BAS, DA
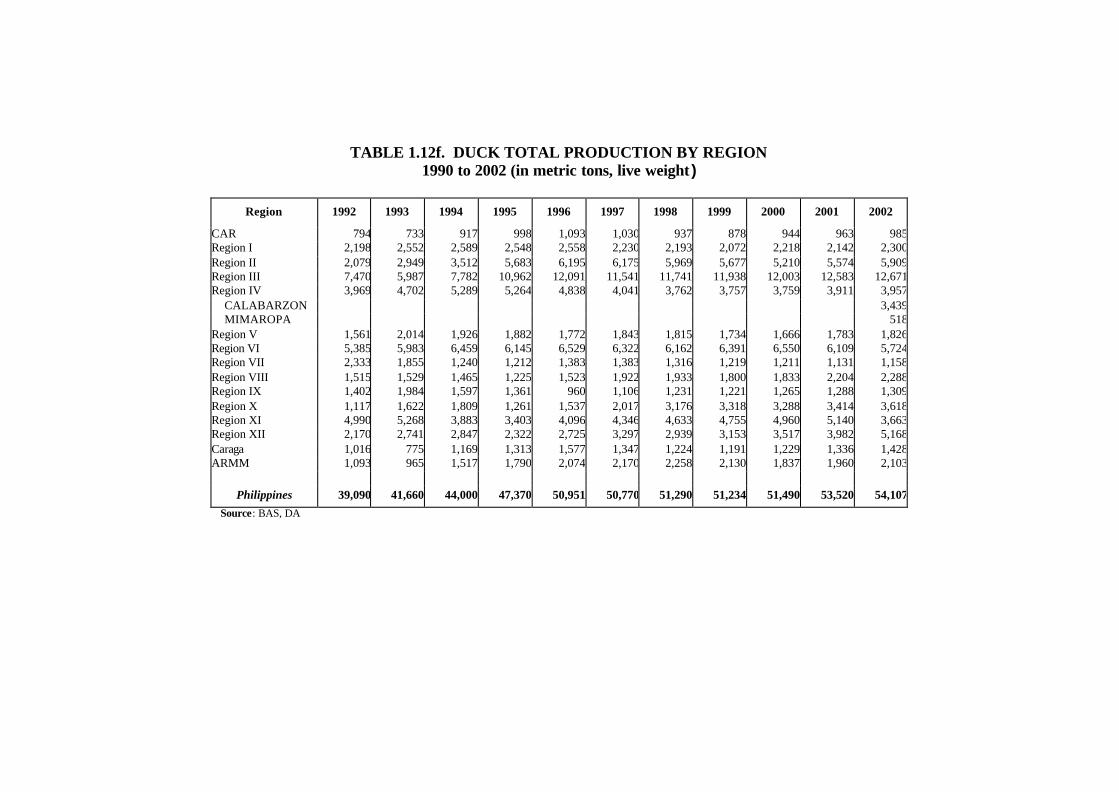
TABLE 1.12f. DUCK TOTAL PRODUCTION BY REGION 1990 to 2002 (in metric tons, live weight )
Region 1992 1993 1994 1995 1996 1997 1998 1999 2000 2001 2002
CAR 794 733 917 998 1,093 1,030 937 878 944 963 985Region I 2,198 2,552 2,589 2,548 2,558 2,230 2,193 2,072 2,218 2,142 2,300Region II 2,079 2,949 3,512 5,683 6,195 6,175 5,969 5,677 5,210 5,574 5,909Region III 7,470 5,987 7,782 10,962 12,091 11,541 11,741 11,938 12,003 12,583 12,671Region IV 3,969 4,702 5,289 5,264 4,838 4,041 3,762 3,757 3,759 3,911 3,957
CALABARZON 3,439MIMAROPA 518
Region V 1,561 2,014 1,926 1,882 1,772 1,843 1,815 1,734 1,666 1,783 1,826Region VI 5,385 5,983 6,459 6,145 6,529 6,322 6,162 6,391 6,550 6,109 5,724Region VII 2,333 1,855 1,240 1,212 1,383 1,383 1,316 1,219 1,211 1,131 1,158Region VIII 1,515 1,529 1,465 1,225 1,523 1,922 1,933 1,800 1,833 2,204 2,288Region IX 1,402 1,984 1,597 1,361 960 1,106 1,231 1,221 1,265 1,288 1,309Region X 1,117 1,622 1,809 1,261 1,537 2,017 3,176 3,318 3,288 3,414 3,618Region XI 4,990 5,268 3,883 3,403 4,096 4,346 4,633 4,755 4,960 5,140 3,663Region XII 2,170 2,741 2,847 2,322 2,725 3,297 2,939 3,153 3,517 3,982 5,168Caraga 1,016 775 1,169 1,313 1,577 1,347 1,224 1,191 1,229 1,336 1,428ARMM 1,093 965 1,517 1,790 2,074 2,170 2,258 2,130 1,837 1,960 2,103
Philippines 39,090 41,660 44,000 47,370 50,951 50,770 51,290 51,234 51,490 53,520 54,107Source: BAS, DA

TABLE 1.13. WILDLIFE SPECIES EXPORTED BASED ON CITESa//NON-CITES PERMITS ISSUED 1992 to 2002
Wildlife UMb/ 1992 1993 1994 1995 1996 1997 1998 1999 2000 2001 2002
CITES Mammals head 5,975 5,277 7,103 4,227 2,044 2,563 2,112 2099 2119 2065 1706 vial pair 12 Birds head 898 1,403 3,442 1,999 2,204 3,321 2,317 3510 3378 5707 2759 piece 119 179 290 pair 23 Reptiles head 386 106 119 186 53 357 43 10 - 2 Insects piece 14 694 2510 1094 3597 Amphibians head 2 1 - - Derivatives piece 67 446 6 405 422 3,362 6036 2180 636 819 vial 1,620 1,497 2,472 7,064 4,166 8,579 9108 5549 5031 8831 ml 500 450 600 1,160 1,310 - - skin 2 - pickle 2 - gram 505 - bottle 65 25 26 8 59 50 - 3 liter 3 bags 66 38 tubes 6 470 957 563 23 905 2302 slides 8 66 1084 3048 140
set 40
centrifuge 83
parafin block 6
head 200 1 36

TABLE 1.13. (continued)….
Wildlife UMb/ 1992 1993 1994 1995 1996 1997 1998 1999 2000 2001 2002
Derivatives tissue 496 10 tubes 76 905 blocks 45 histopack 11 box 1 1 3 plastic 42 container 130 150 3 pack 20 45 52 119 137 body organ 172 pair 1 10 1 stick 296 strip 14 spoids 208 80 5 By-products piece 1,600 8 850 879 494 - 1249 418 Orchids pc/flask/compot 65,217 8,504 5,500 piece 75,601 85,165 72,870 93,063 91,469 73,289 30,307 74,365 114,269 flask 239 757 687 647 1,296 775 103 6 19 compot 67 11 541 26 2,871 4,039 2,008 shoot 17 2 pot 1 38 3 bulb 2,000 Plants piece 11,063 1273 - 280 - 130 - 117 6,064 10,625
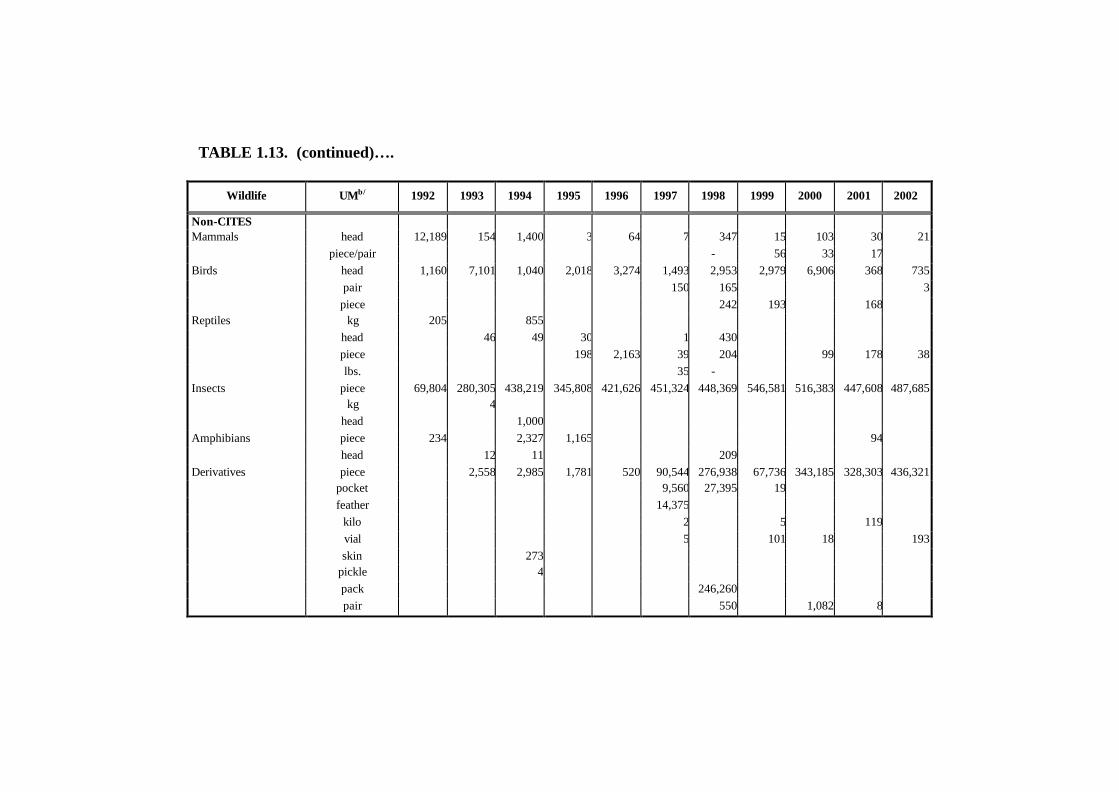
TABLE 1.13. (continued)….
Wildlife UMb/ 1992 1993 1994 1995 1996 1997 1998 1999 2000 2001 2002
Non-CITES Mammals head 12,189 154 1,400 3 64 7 347 15 103 30 21 piece/pair - 56 33 17 Birds head 1,160 7,101 1,040 2,018 3,274 1,493 2,953 2,979 6,906 368 735 pair 150 165 3 piece 242 193 168 Reptiles kg 205 855 head 46 49 30 1 430 piece 198 2,163 39 204 99 178 38 lbs. 35 - Insects piece 69,804 280,305 438,219 345,808 421,626 451,324 448,369 546,581 516,383 447,608 487,685 kg 4 head 1,000 Amphibians piece 234 2,327 1,165 94 head 12 11 209 Derivatives piece 2,558 2,985 1,781 520 90,544 276,938 67,736 343,185 328,303 436,321 pocket 9,560 27,395 19 feather 14,375 kilo 2 5 119 vial 5 101 18 193 skin 273 pickle 4
pack 246,260
pair 550 1,082 8

TABLE 1.13. (continued)….
Wildlife UMb/ 1992 1993 1994 1995 1996 1997 1998 1999 2000 2001 2002
Derivatives items 434 tube 25 22 bag 91 tissue 35 hair 10,000 By-products piece 4,923 6,809 16,698 3,104 1,011 518 6507 12,005 13,166 kg. 482 pocket 71,700 pair 14 17 items 32 Asstd. Species piece 19 50 52 head 43 Plants piece 2,581 467 3,491 2,545 1,555 9,049 387 2883 3,224 637 1,229Orchids piece 128 316 12 58 Unidentified 19 Nematodes piece 50
a - Convention on International Trade in Endangered Species b - Unit of Measurement Source: PAWB, DENR

TABLE 1.14. GOVERNMENT REVENUES FROM WILDLIFE EXPORT 1990 to 2001 (in Peso)
Wildlife 1992 1993 1994 1995 1996 1997 1998 1999 2000 2001
CITES* Mammals 4,517,772.83 4,631,114.84 6,178,799.97 4,829,842.90 2,700,202.00 5,238,833.96 5,455,724.21 5,191,182.20 5,663,660.65 6,404,859.83 Birds 198,858.19 385,639.67 545,509.76 292,298.04 336,325.76 392,087.48 491,591.61 663,306.86 506,239.61 419,075.15 Reptiles 50.00 280.00 100.00 80.00 20.00 950.00 900.00 800.00 - Insects 240.40 - 1,838.00 5,825.00 2,822.35Amphibians - - 250.00 - Animals - 400.00 Orchids 34,772.23 46,355.41 66,501.14 54,709.31 69,779.66 78,878.47 58,429.50 167,725.00 180,572.18 230,494.65 Derivatives 400.00 600.00 1,120.00 3,706.20 3,080.00 20,440.00 41,120.94 33,003.16 23,673.92 By-products 60.00 20.00 20.00 240.00 60.00 3,987.32 2,139.41Plants 3,505.74 15,459.30 1,270.00 1,243.00 1,264.00 6,360.00 13,615.00 Sub-total 4,754,958.99 5,079,549.62 6,791,430.87 5,179,360.25 3,110,333.62 5,714,202.91 6,027,135.32 6,067,737.00 6,400,697.92 7,096,680.31 Non-CITES Mammals 12,498.92 40.00 1,497.45 20.00 40.00 40.00 340.00 900.00 402.55 500.00 Birds 1,142.00 12,232.48 182.00 180.00 2,753.00 2,817.00 5,806.90 35,209.52 10,034.63 4,695.00 Reptiles 0.00 20.00 80.00 20.00 5,805.20 70.00 1,200.00 0.00 300.00 400.00 Insects 12,352.27 114,731.10 236,487.25 193,727.33 252,163.22 363,423.51 381,031.17 329,612.80 386,136.64 0.00 Amphibians 20.00 5,372.18 3,454.18 100Plants 2,424.60 5,422.55 1,349.65 1,831.06 6,736.88 7,563.20 2,620.00 2827.5 2175 - Derivatives 140.00 2,659.95 2,344.02 1,193.50 12,381.61 6,455.05 21,237.80 21,526.32 11,775.30 By-products 7,445.34 2,622.06 3,180.22 1,255.80 1,224.80 1,094.00 0.00 511.71 2,030.46Orchids 468.73 733.20 910 1250 100 - Asstd. Species 27.80 20.00 100 Sub-total 28,417.79 140,079.27 250,270.54 204,756.81 270,416.33 388,253.32 399,457.12 391,137.62 421,186.85 19,500.76
Grand Total 4,783,376.78 5,219,628.89 7,041,701.41 5,384,117.06 3,380,749.95 6,102,456.23 6,426,592.44 6,458,874.62 6,821,884.77 7,116,181.07Source: PAWB, DENR
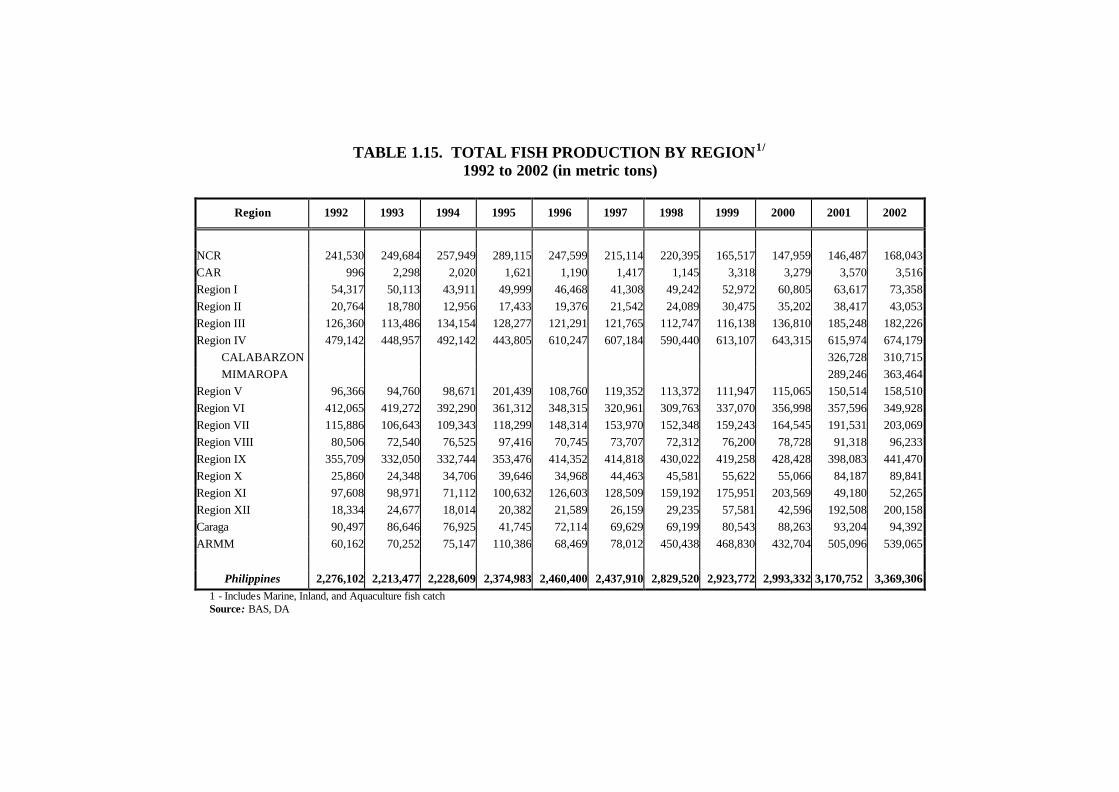
TABLE 1.15. TOTAL FISH PRODUCTION BY REGION1/
1992 to 2002 (in metric tons)
Region 1992 1993 1994 1995 1996 1997 1998 1999 2000 2001 2002
NCR 241,530 249,684 257,949 289,115 247,599 215,114 220,395 165,517 147,959 146,487 168,043 CAR 996 2,298 2,020 1,621 1,190 1,417 1,145 3,318 3,279 3,570 3,516 Region I 54,317 50,113 43,911 49,999 46,468 41,308 49,242 52,972 60,805 63,617 73,358 Region II 20,764 18,780 12,956 17,433 19,376 21,542 24,089 30,475 35,202 38,417 43,053 Region III 126,360 113,486 134,154 128,277 121,291 121,765 112,747 116,138 136,810 185,248 182,226 Region IV 479,142 448,957 492,142 443,805 610,247 607,184 590,440 613,107 643,315 615,974 674,179
CALABARZON 326,728 310,715 MIMAROPA 289,246 363,464
Region V 96,366 94,760 98,671 201,439 108,760 119,352 113,372 111,947 115,065 150,514 158,510 Region VI 412,065 419,272 392,290 361,312 348,315 320,961 309,763 337,070 356,998 357,596 349,928 Region VII 115,886 106,643 109,343 118,299 148,314 153,970 152,348 159,243 164,545 191,531 203,069 Region VIII 80,506 72,540 76,525 97,416 70,745 73,707 72,312 76,200 78,728 91,318 96,233 Region IX 355,709 332,050 332,744 353,476 414,352 414,818 430,022 419,258 428,428 398,083 441,470 Region X 25,860 24,348 34,706 39,646 34,968 44,463 45,581 55,622 55,066 84,187 89,841 Region XI 97,608 98,971 71,112 100,632 126,603 128,509 159,192 175,951 203,569 49,180 52,265 Region XII 18,334 24,677 18,014 20,382 21,589 26,159 29,235 57,581 42,596 192,508 200,158 Caraga 90,497 86,646 76,925 41,745 72,114 69,629 69,199 80,543 88,263 93,204 94,392 ARMM 60,162 70,252 75,147 110,386 68,469 78,012 450,438 468,830 432,704 505,096 539,065
Philippines 2,276,102 2,213,477 2,228,609 2,374,983 2,460,400 2,437,910 2,829,520 2,923,772 2,993,332 3,170,752 3,369,306 1 - Includes Marine, Inland, and Aquaculture fish catch Source: BAS, DA

TABLE 1.16a. MARINE FISH CATCH (COMMERCIAL AND MARINE MUNICIPAL FISHING): QUANTITY OF FISH LANDED BY REGION, 1992 to 2002 (in metric tons)
Region 1992 1993 1994 1995 1996 1997 1998 1999 2000 2001 2002
NCR 232,522 241,014 248,853 281,416 242,669 210,866 215,315 164,254 146,831 145,099 163,318Region I 22,603 21,496 21,598 20,395 19,326 19,630 24,424 24,345 25,094 24,108 28,808Region II 12,513 11,792 7,326 10,803 12,668 14,329 17,035 24,436 27,939 28,473 32,153Region III 21,416 14,985 19,967 17,531 14,728 16,197 17,841 19,163 21,153 27,162 23,431Region IV 207,935 230,882 248,061 245,046 239,143 256,056 264,301 300,036 287,853 279,477 304,119
CALABARZON 143,604 137,885MIMAROPA 135,873 166,234
Region V 74,928 77,991 82,964 81,039 86,179 98,699 96,505 94,366 94,979 118,993 126,359Region VI 322,324 318,948 301,763 269,729 258,530 256,232 238,444 254,490 263,324 256,367 243,837Region VII 101,098 94,126 95,162 93,204 99,315 105,421 103,663 107,815 111,533 106,014 111,481Region VIII 68,580 58,840 68,835 64,492 63,883 66,743 64,755 67,610 69,696 77,809 79,376Region IX 345,474 321,445 314,753 334,592 307,565 312,700 301,671 270,802 288,449 276,582 316,356Region X 20,750 22,532 32,612 37,516 32,433 35,331 35,610 39,270 38,047 60,880 64,809Region XI 80,228 75,349 63,483 82,601 107,178 118,306 151,847 169,037 194,789 39,060 40,586Region XII 12,050 12,740 11,066 10,439 10,143 14,933 15,253 33,806 17,158 165,953 167,625Caraga 87,350 72,753 68,013 31,947 61,849 61,152 62,482 66,227 68,534 69,710 63,105ARMM 49,782 52,657 61,719 97,851 54,772 62,783 76,062 92,917 84,930 134,040 134,124
Philippines 1,659,553 1,627,550 1,646,175 1,678,601 1,610,381 1,649,378 1,685,208 1,723,393 1,740,309 1,809,727 1,899,487 Source: BAS, DA
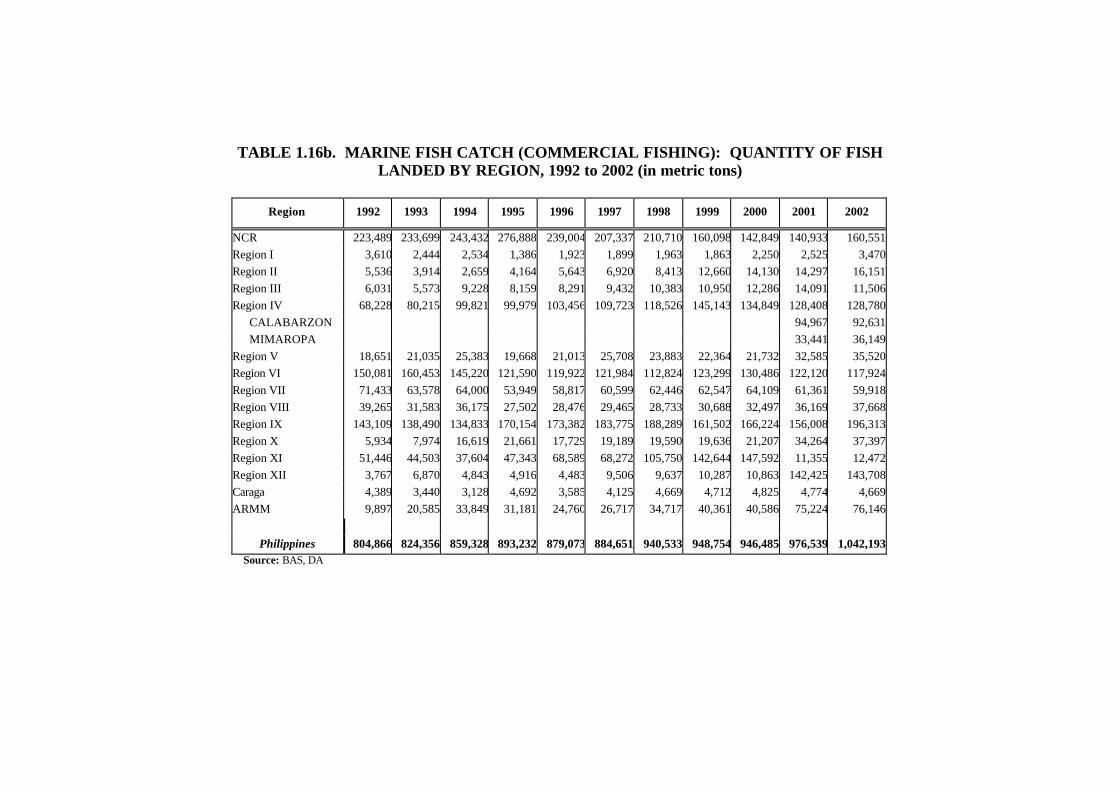
TABLE 1.16b. MARINE FISH CATCH (COMMERCIAL FISHING): QUANTITY OF FISH LANDED BY REGION, 1992 to 2002 (in metric tons)
Region 1992 1993 1994 1995 1996 1997 1998 1999 2000 2001 2002
NCR 223,489 233,699 243,432 276,888 239,004 207,337 210,710 160,098 142,849 140,933 160,551Region I 3,610 2,444 2,534 1,386 1,923 1,899 1,963 1,863 2,250 2,525 3,470Region II 5,536 3,914 2,659 4,164 5,643 6,920 8,413 12,660 14,130 14,297 16,151Region III 6,031 5,573 9,228 8,159 8,291 9,432 10,383 10,950 12,286 14,091 11,506Region IV 68,228 80,215 99,821 99,979 103,456 109,723 118,526 145,143 134,849 128,408 128,780
CALABARZON 94,967 92,631MIMAROPA 33,441 36,149
Region V 18,651 21,035 25,383 19,668 21,013 25,708 23,883 22,364 21,732 32,585 35,520Region VI 150,081 160,453 145,220 121,590 119,922 121,984 112,824 123,299 130,486 122,120 117,924Region VII 71,433 63,578 64,000 53,949 58,817 60,599 62,446 62,547 64,109 61,361 59,918Region VIII 39,265 31,583 36,175 27,502 28,476 29,465 28,733 30,688 32,497 36,169 37,668Region IX 143,109 138,490 134,833 170,154 173,382 183,775 188,289 161,502 166,224 156,008 196,313Region X 5,934 7,974 16,619 21,661 17,729 19,189 19,590 19,636 21,207 34,264 37,397Region XI 51,446 44,503 37,604 47,343 68,589 68,272 105,750 142,644 147,592 11,355 12,472Region XII 3,767 6,870 4,843 4,916 4,483 9,506 9,637 10,287 10,863 142,425 143,708Caraga 4,389 3,440 3,128 4,692 3,585 4,125 4,669 4,712 4,825 4,774 4,669ARMM 9,897 20,585 33,849 31,181 24,760 26,717 34,717 40,361 40,586 75,224 76,146
Philippines 804,866 824,356 859,328 893,232 879,073 884,651 940,533 948,754 946,485 976,539 1,042,193Source: BAS, DA

TABLE 1.16c. MARINE FISH CATCH (MARINE MUNICIPAL FISHING): QUANTITY OF FISH LANDED BY REGION, 1992 to 2002 (in metric tons)
Region 1992 1993 1994 1995 1996 1997 1998 1999 2000 2001 2002
NCR 9,033 7,315 5,421 4,528 3,665 3,529 4,605 4,156 3,982 4,166 2,767Region I 18,993 19,052 19,064 19,009 17,403 17,731 22,461 22,482 22,844 21,583 25,338Region II 6,977 7,878 4,667 6,639 7,025 7,409 8,622 11,776 13,809 14,176 16,002Region III 15,385 9,412 10,739 9,372 6,437 6,765 7,458 8,213 8,867 13,071 11,925Region IV 139,707 150,667 148,240 145,067 135,687 146,333 145,775 154,893 153,004 151,069 175,339
CALABARZON 48,637 45,254MIMAROPA 102,432 130,085
Region V 56,277 56,956 57,581 61,371 65,166 72,991 72,622 72,002 73,247 86,408 90,839Region VI 172,243 158,495 156,543 148,139 138,608 134,248 125,620 131,191 132,838 134,247 125,913Region VII 29,665 30,548 31,162 39,255 40,498 44,822 41,217 45,268 47,424 44,653 51,563Region VIII 29,315 27,257 32,660 36,990 35,407 37,278 36,022 36,922 37,199 41,640 41,708Region IX 202,365 182,955 179,920 164,438 134,183 128,925 113,382 109,300 122,225 120,574 120,043Region X 14,816 14,558 15,993 15,855 14,704 16,142 16,020 19,634 16,840 26,616 27,412Region XI 28,782 30,846 25,879 35,258 38,589 50,034 46,097 26,393 47,197 27,705 28,114Region XII 8,283 5,870 6,223 5,523 5,660 5,427 5,616 23,519 6,295 23,528 23,917Caraga 82,961 69,313 64,885 27,255 58,264 57,027 57,813 61,515 63,709 64,936 58,436ARMM 39,885 32,072 27,870 66,670 30,012 36,066 41,345 52,556 44,344 58,816 57,978
Philippines 854,687 803,194 786,847 785,369 731,308 764,727 744,675 779,820 793,824 833,188 857,294Source: BAS, DA
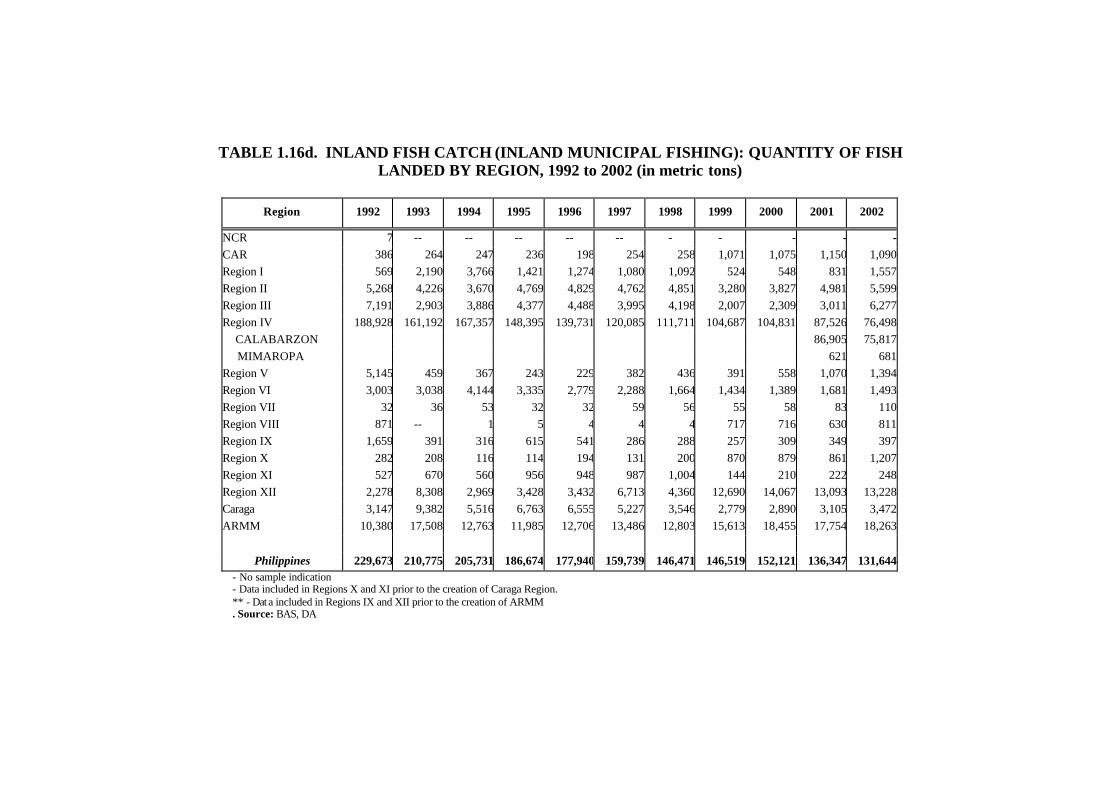
TABLE 1.16d. INLAND FISH CATCH (INLAND MUNICIPAL FISHING): QUANTITY OF FISH LANDED BY REGION, 1992 to 2002 (in metric tons)
Region 1992 1993 1994 1995 1996 1997 1998 1999 2000 2001 2002
NCR 7 -- -- -- -- -- - - - - -CAR 386 264 247 236 198 254 258 1,071 1,075 1,150 1,090Region I 569 2,190 3,766 1,421 1,274 1,080 1,092 524 548 831 1,557Region II 5,268 4,226 3,670 4,769 4,829 4,762 4,851 3,280 3,827 4,981 5,599Region III 7,191 2,903 3,886 4,377 4,488 3,995 4,198 2,007 2,309 3,011 6,277Region IV 188,928 161,192 167,357 148,395 139,731 120,085 111,711 104,687 104,831 87,526 76,498
CALABARZON 86,905 75,817MIMAROPA 621 681
Region V 5,145 459 367 243 229 382 436 391 558 1,070 1,394Region VI 3,003 3,038 4,144 3,335 2,779 2,288 1,664 1,434 1,389 1,681 1,493Region VII 32 36 53 32 32 59 56 55 58 83 110Region VIII 871 -- 1 5 4 4 4 717 716 630 811Region IX 1,659 391 316 615 541 286 288 257 309 349 397Region X 282 208 116 114 194 131 200 870 879 861 1,207Region XI 527 670 560 956 948 987 1,004 144 210 222 248Region XII 2,278 8,308 2,969 3,428 3,432 6,713 4,360 12,690 14,067 13,093 13,228Caraga 3,147 9,382 5,516 6,763 6,555 5,227 3,546 2,779 2,890 3,105 3,472ARMM 10,380 17,508 12,763 11,985 12,706 13,486 12,803 15,613 18,455 17,754 18,263
Philippines 229,673 210,775 205,731 186,674 177,940 159,739 146,471 146,519 152,121 136,347 131,644- No sample indication - Data included in Regions X and XI prior to the creation of Caraga Region. ** - Dat a included in Regions IX and XII prior to the creation of ARMM . Source: BAS, DA
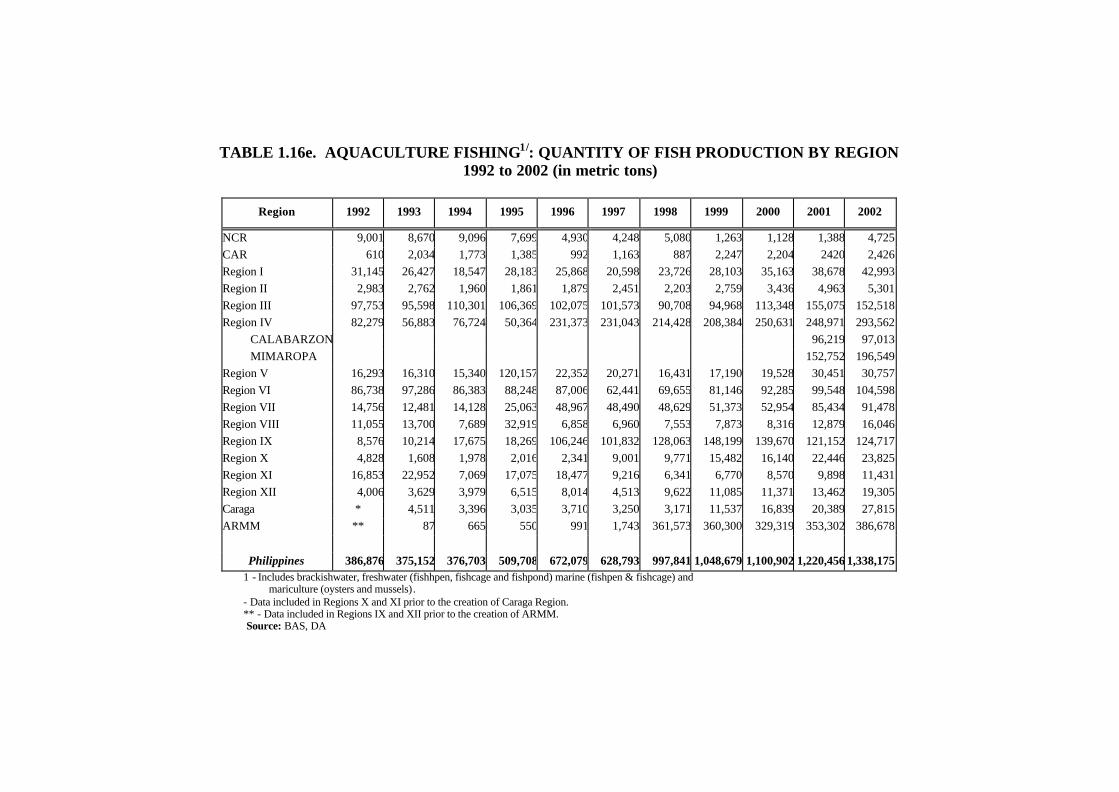
TABLE 1.16e. AQUACULTURE FISHING1/: QUANTITY OF FISH PRODUCTION BY REGION 1992 to 2002 (in metric tons)
Region 1992 1993 1994 1995 1996 1997 1998 1999 2000 2001 2002
NCR 9,001 8,670 9,096 7,699 4,930 4,248 5,080 1,263 1,128 1,388 4,725 CAR 610 2,034 1,773 1,385 992 1,163 887 2,247 2,204 2420 2,426 Region I 31,145 26,427 18,547 28,183 25,868 20,598 23,726 28,103 35,163 38,678 42,993 Region II 2,983 2,762 1,960 1,861 1,879 2,451 2,203 2,759 3,436 4,963 5,301 Region III 97,753 95,598 110,301 106,369 102,075 101,573 90,708 94,968 113,348 155,075 152,518 Region IV 82,279 56,883 76,724 50,364 231,373 231,043 214,428 208,384 250,631 248,971 293,562
CALABARZON 96,219 97,013 MIMAROPA 152,752 196,549
Region V 16,293 16,310 15,340 120,157 22,352 20,271 16,431 17,190 19,528 30,451 30,757 Region VI 86,738 97,286 86,383 88,248 87,006 62,441 69,655 81,146 92,285 99,548 104,598 Region VII 14,756 12,481 14,128 25,063 48,967 48,490 48,629 51,373 52,954 85,434 91,478 Region VIII 11,055 13,700 7,689 32,919 6,858 6,960 7,553 7,873 8,316 12,879 16,046 Region IX 8,576 10,214 17,675 18,269 106,246 101,832 128,063 148,199 139,670 121,152 124,717 Region X 4,828 1,608 1,978 2,016 2,341 9,001 9,771 15,482 16,140 22,446 23,825 Region XI 16,853 22,952 7,069 17,075 18,477 9,216 6,341 6,770 8,570 9,898 11,431 Region XII 4,006 3,629 3,979 6,515 8,014 4,513 9,622 11,085 11,371 13,462 19,305 Caraga * 4,511 3,396 3,035 3,710 3,250 3,171 11,537 16,839 20,389 27,815 ARMM ** 87 665 550 991 1,743 361,573 360,300 329,319 353,302 386,678
Philippines 386,876 375,152 376,703 509,708 672,079 628,793 997,841 1,048,679 1,100,902 1,220,456 1,338,175 1 - Includes brackishwater, freshwater (fishhpen, fishcage and fishpond) marine (fishpen & fishcage) and
mariculture (oysters and mussels). - Data included in Regions X and XI prior to the creation of Caraga Region. ** - Data included in Regions IX and XII prior to the creation of ARMM. Source: BAS, DA

TABLE 1.17. TOTAL VALUE OF FISH PRODUCTION1/
1992 to 2002 (in million pesos)
Region 1992 1993 1994 1995 1996 1997 1998 1999 2000 2001 2002
NCR 6,479.52 8,512.43 9,304.23 11,093.23 11,504.52 10,481.60 11,935.35 9,905.22 9,508.10 9,323.10 10,048.38CAR 42.27 94.25 102.70 77.07 61.02 79.21 78.81 201.60 209.36 224.07 215.88Region I 2,055.63 1,963.86 2,175.93 2,610.74 2,399.72 2,208.36 2,613.27 3,056.46 3,656.64 3,781.51 4,199Region II 492.56 553.22 473.86 716.81 763.92 851.47 840.32 1,035.37 1,292.34 1,602.28 2,263Region III 7,310.53 7,539.04 11,742.14 10,988.87 11,138.25 11,346.57 10,473.68 10,510.80 11,722.94 15,031.31 14,017Region IV 9,414.08 10,276.87 12,655.62 12,260.55 12,320.59 14,093.46 16,035.92 17,723.66 18,262.40 17,838.22 17,984Region V 2,637.74 2,483.75 2,431.36 2,891.02 2,914.34 3,760.44 3,525.76 4,148.05 4,183.40 5,005.25 6,015.13Region VI 14,762.45 18,117.89 17,445.12 15,773.95 13,997.18 10,278.76 10,089.16 11,762.43 12,796.42 12,792.72 12,886.87Region VII 3,315.25 12,601.13 3,310.27 4,180.86 4,711.93 3,928.68 4,005.36 4,076.49 4,307.28 5,094.83 6,145.11Region VIII 1,957.76 1,634.19 1,822.70 1,890.03 1,904.52 2,350.60 2,437.91 2,735.70 2,838.36 3,337.24 4,240.14Region IX 7,695.14 6,674.38 8,538.63 8,552.93 8,151.70 8,087.23 8,518.46 10,170.12 10,999.00 12,027.55 12,144.86Region X 940.77 622.77 941.42 2,905.70 3,288.67 3,487.50 3,497.62 3,593.13 3,788.81 4,332.62 4,504.80Region XI 2,978.02 2,978.49 3,658.98 1,148.51 1,338.53 1,568.92 15,253.85 1,652.48 1,733.84 1,952.72 2,255.62Region XII 652.73 1,293.00 980.24 3,168.40 3,736.92 2,739.70 3,571.47 5,090.02 6,115.33 6,349.06 7,236.50Caraga 2,057.87 2,426.99 2,471.24 2,754.75 2,649.07 2,555.94 2,606.92 2,672.90 3,085.97 3,347.49 3,538.27ARMM 1,124.68 983.23 904.44 2,173.90 2,394.32 2,798.65 3,377.68 3,987.91 4,157.45 5,153.81 5,549.27
Philippines 63,916.98 78,755.48 78,958.86 83,187.3 83,275.19 80,617.09 98,861.52 92,322.32 98,657.63 107,193.79 113,244.081 - Includes Marine, Inland, and Aquaculture value of fish production Source: BAS, DA

TABLE 1.18a. MARINE FISH CATCH (COMMERCIAL AND MARINE MUNICIPAL FISHING): VALUE OF FISH
LANDED BY REGION, 1992 to 2001 (in million pesos)
Region 1992 1993 1994 1995 1996 1997 1998 1999 2000 2001
NCR 6,045.28 8,052.56 8,813.59 10,657.03 11,193 8,536 11,585 9,840 9,448 9,250Region I 878.56 783.08 876.97 827.39 786 875 1,122 1,224 1,328 1,305Region II 163.08 343.69 183.50 428.21 461 506 529 656 812 945Region III 398.92 522.96 458.27 478.35 409 549 672 684 735 876Region IV 4,520.35 6,148.67 7,899.12 8,122.06 8,141 9,161 10,698 12,430 12,643 12,348Region V 1,586.22 1,709.96 1,608.36 1,992.95 2,164 2,969 2,955 3,283 3,385 4,134Region VI 6,466.10 6,904.53 7,431.45 7,077.41 7,048 6,975 7,727 8,941 9,264 9,246Region VII 2,247.92 11,555.85 2,229.80 2,594.37 2,744 3,438 2,729 2,908 3,085 3,731Region VIII 1,667.64 1,368.56 1,614.89 1,681.45 1,708 2,259 2,272 2,525 2,617 3,041Region IX 6,973.37 5,807.01 6,583.12 6,866.40 6,521 7,574 6,973 7,492 7,935 8,539Region X 415.90 391.90 661.91 1,019.20 873 925 1,328 1,412 1,530 1,981Region XI 1,940.21 1,632.57 1,999.13 1,336.77 2,666 3,724 1,801 1,930 1,970 1,449Region XII 218.69 244.78 216.08 1,223.62 289 422 2,129 3,589 4,599 5,199Caraga 1,955.15 1,781.17 1,945.47 2,197.95 1,997 2,025 2,126 2,169 2,391 2,417ARMM 767.60 630.15 519.81 898.17 887 1,231 1,725 1,989 2,112 2,942 -
Philippines 36,245.01 47,877.44 43,041.44 47,401.33 47,888 51,171 56,372 61,073 63,854 67,403- Data included in Regions X and XI prior to the creation of Caraga Region. ** - Data included in Regions IX and XII prior to the creation of ARMM. Source: BAS, DA

TABLE 1.18b. MARINE FISH CATCH (COMMERCIAL FISHING): VALUE OF FISH LANDED BY REGION, 1992 to 2002 (in million pesos)
Region 1992 1993 1994 1995 1996 1997 1998 1999 2000 2001 2002
NCR 5,732.00 7,632.00 8,403.00 10,318.21 10,911.00 8,360.28 11,346.56 9,591.11 9,211.01 8,993.91 9,683.21CAR -Region I 161.00 113.00 98.00 61.95 66.00 68.21 80.17 82.70 101.60 112.72 185.22Region II 77.00 74.00 63.00 79.99 83.00 191.75 149.17 212.69 279.92 403.54 814.46Region III 136.00 125.00 230.00 197.11 211.00 249.04 325.73 335.62 352.64 454.41 474.43Region IV 1,460.00 1,882.00 2,660.00 2,916.68 3,140.00 3,475.65 4,077.33 5,520.89 5,800.94 5,735.70 5,832.15Region V 345.00 401.00 410.00 367.21 391.00 534.87 590.40 637.18 669.50 951.73 1,231.92Region VI 2,782.00 3,112.00 2,959.00 2,440.37 2,591.00 2,873.98 3,430.91 3,923.33 4,122.35 4,029.65 4,177.95Region VII 1,157.00 1,082.00 1,256.00 1,088.97 1,149.00 2,028.98 1,392.21 1,509.49 1,586.85 2,300.15 2,160.67Region VIII 785.00 662.00 859.00 593.25 638.00 763.46 764.13 828.50 879.15 1,096.71 1,535.25Region IX 2,646.00 1,689.00 1,828.00 2,709.30 3,037.00 3,935.85 3,544.56 3,735.00 3,924.46 4,323.24 5,259.43Region X 92.00 92.00 262.00 559.24 435.00 461.79 860.06 932.51 979.82 1,134.63 1,095.38Region XI 1,223.00 845.00 1,276.00 163.82 1,347.00 2,173.69 325.83 364.37 348.74 418.68 513.43Region XII 58.00 120.00 111.00 1,102.53 162.00 263.79 1,960.54 3,418.04 4,412.60 4,455.93 5,019.83Caraga 77.00 78.00 77.00 125.57 137.00 146.07 166.07 178.91 187.99 200.25 161.30ARMM 70.00 114.00 222.00 341.18 257.00 407.93 723.41 971.81 1,021.11 1,477.38 1,536.55
Philippines 16,801.00 18,021.00 20,714.00 23,065.36 24,555.00 25,935.33 29,737.07 32,242.14 33,878.68 36,088.64 39,681.16Source: BAS, DA
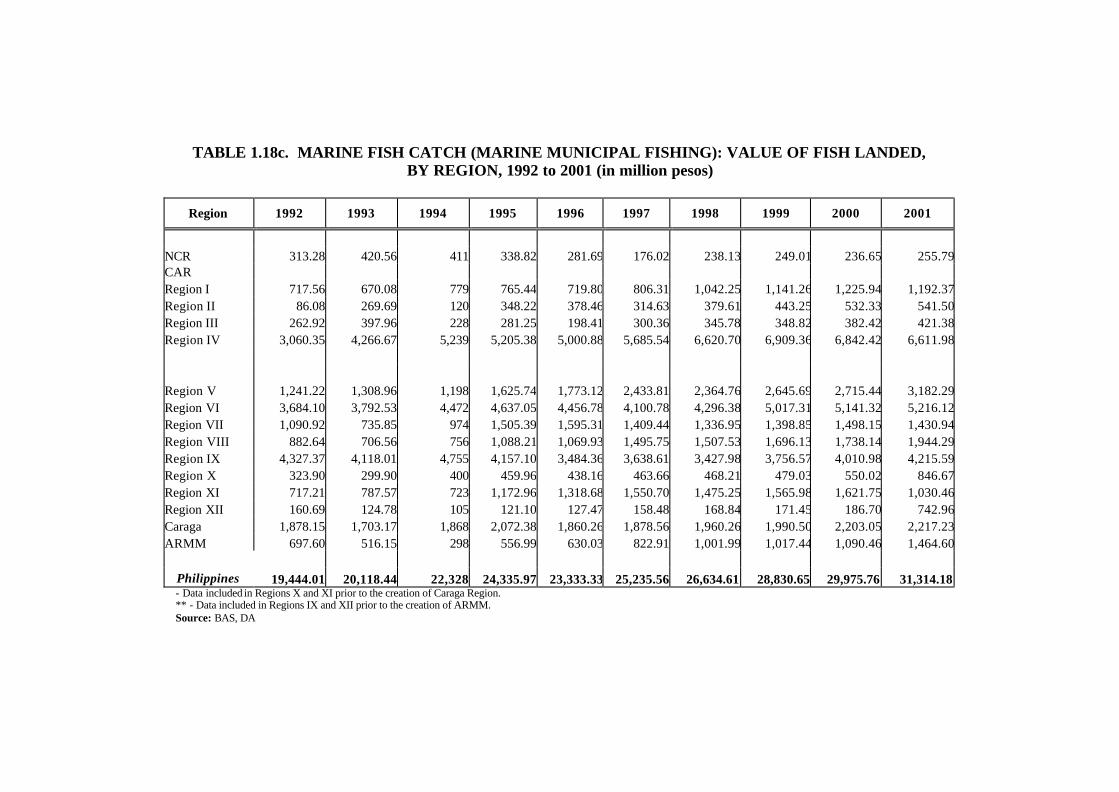
TABLE 1.18c. MARINE FISH CATCH (MARINE MUNICIPAL FISHING): VALUE OF FISH LANDED, BY REGION, 1992 to 2001 (in million pesos)
Region 1992 1993 1994 1995 1996 1997 1998 1999 2000 2001
NCR 313.28 420.56 411 338.82 281.69 176.02 238.13 249.01 236.65 255.79CAR Region I 717.56 670.08 779 765.44 719.80 806.31 1,042.25 1,141.26 1,225.94 1,192.37Region II 86.08 269.69 120 348.22 378.46 314.63 379.61 443.25 532.33 541.50Region III 262.92 397.96 228 281.25 198.41 300.36 345.78 348.82 382.42 421.38Region IV 3,060.35 4,266.67 5,239 5,205.38 5,000.88 5,685.54 6,620.70 6,909.36 6,842.42 6,611.98 Region V 1,241.22 1,308.96 1,198 1,625.74 1,773.12 2,433.81 2,364.76 2,645.69 2,715.44 3,182.29Region VI 3,684.10 3,792.53 4,472 4,637.05 4,456.78 4,100.78 4,296.38 5,017.31 5,141.32 5,216.12Region VII 1,090.92 735.85 974 1,505.39 1,595.31 1,409.44 1,336.95 1,398.85 1,498.15 1,430.94Region VIII 882.64 706.56 756 1,088.21 1,069.93 1,495.75 1,507.53 1,696.13 1,738.14 1,944.29Region IX 4,327.37 4,118.01 4,755 4,157.10 3,484.36 3,638.61 3,427.98 3,756.57 4,010.98 4,215.59Region X 323.90 299.90 400 459.96 438.16 463.66 468.21 479.03 550.02 846.67Region XI 717.21 787.57 723 1,172.96 1,318.68 1,550.70 1,475.25 1,565.98 1,621.75 1,030.46Region XII 160.69 124.78 105 121.10 127.47 158.48 168.84 171.45 186.70 742.96Caraga 1,878.15 1,703.17 1,868 2,072.38 1,860.26 1,878.56 1,960.26 1,990.50 2,203.05 2,217.23ARMM 697.60 516.15 298 556.99 630.03 822.91 1,001.99 1,017.44 1,090.46 1,464.60
Philippines 19,444.01 20,118.44 22,328 24,335.97 23,333.33 25,235.56 26,634.61 28,830.65 29,975.76 31,314.18- Data included in Regions X and XI prior to the creation of Caraga Region. ** - Data included in Regions IX and XII prior to the creation of ARMM. Source: BAS, DA

TABLE 1.18d. INLAND FISH CATCH (INLAND MUNICIPAL FISHING): VALUE OF FISH LANDED BY REGION, 1992 to 2001 (in million pesos)
Region 1992 1993 1994 1995 1996 1997 1998 1999 2000 2001
NCR 0.25 -- -- -- -- -- CAR 13.14 5.25 12.47 8.94 7.41 9.97 33.45 68.28 70.66 74.56Region I 19.27 43.06 162.59 67.55 61.67 66.87 50.47 37.58 43.18 61.85Region II 175.61 81.27 179.60 179.97 180.60 258.10 173.16 188.61 247.51 331.97Region III 246.06 58.10 130.85 206.32 209.52 183.98 239.82 105.62 121.44 162.80Region IV 1,846.71 940.59 863.28 878.44 714.84 806.26 840.77 676.64 887.43 895.16 Region V 169.74 8.80 13.50 9.13 8.46 14.96 12.95 15.07 23.16 44.65Region VI 96.27 57.11 203.37 120.36 104.85 83.53 44.26 62.60 72.27 99.79Region VII 1.09 0.71 1.62 0.97 983.00 1,819.00 0.79 1.32 1.94 3.22Region VIII 28.66 -- 0.08 0.28 0.25 0.30 0.32 22.17 22.00 32.11Region IX 50.74 6.96 4.73 14.76 12.49 6.60 6.54 7.26 9.88 10.50Region X 9.20 3.95 3.42 2.98 6.10 2.90 8.44 43.42 42.27 41.34Region XI 17.36 12.88 17.90 26.35 26.10 28.89 9.15 4.69 7.24 8.23Region XII 78.49 166.07 99.59 128.51 128.81 193.70 429.45 385.94 360.13 345.92Caraga 102.72 178.16 116.29 147.27 146.98 137.48 64.42 71.99 82.65 99.30ARMM 357.08 350.00 338.20 336.05 430.80 361.98 417.85 512.30 627.46 696.16
Philippines 3,212.38 1,912.91 2,147.49 2,127.86 3,021.86 3,974.53 2,331.85 2,203.48 2,619.22 2,907.55- No sample indication - Data included in Regions X and XI prior to the creation of CARAGA Region. ** - Data included in Regions IX and XII prior to the creation of ARMM.
Source: BAS, DA

TABLE 1.18e. AQUACULTURE FISHING1/: VALUE OF FISH LANDED BY REGION, 1992 to 2002 (in million pesos)
Region 1992 1993 1994 1995 1996 1997 1998 1999 2000 2001 2002
NCR 434 459.86 490.65 436.20 311.80 227.51 350.66 65 60.44 73.40 178.55CAR 29 89.00 90.22 68.13 53.60 69.24 45.35 133 138.70 149.51 146.90Region I 1,158 1,137.71 1,136.37 1,715.81 1,552.04 1,265.26 1,440.39 1,795 2,285.92 2,414.61 2,341.01Region II 154 128.26 110.76 108.63 121.55 148.65 138.38 191 232.59 325.27 344.77Region III 6,666 6,957.98 11,153.02 10,304.19 10,519.88 10,607.09 9,562.35 9,721 10,866.44 14,051.17 12,504.71Region IV 3,047 3,187.60 3,893.22 3,260.05 3,464.40 3,958.00 4,497.13 4,617 4,731.60 4,511.03 4,532.50Region V 882 764.99 809.51 888.94 741.69 782.39 557.64 850 775.31 826.58 960.03Region VI 8,200 11,156.25 9,810.29 8,576.17 6,844.50 3,102.17 2,317.60 2,759 3,460.48 3,447.15 3,075.73Region VII 1,066 1,044.58 1,078.85 1,585.53 1,966.45 1,303.20 1,275.41 1,167 1,220.34 1,139.92 1,239.26Region VIII 261 265.63 207.73 208.30 196.44 167.26 165.92 189 198.49 264.14 326.82Region IX 671 860.41 1,950.79 1,788.98 1,843.09 1,555.28 1,717.47 2,856 3,241.88 3,478.22 3,292.48Region X 516 226.92 276.09 1,723.96 2,092.17 2,075.89 2,016.31 2,020 2,087.58 2,309.97 2,341.38Region XI 1,020 1,333.04 1,641.95 350.28 463.02 350.55 298.85 329 392.72 492.74 568.88Region XII 356 882.15 664.57 1,410.93 1,819.52 470.65 573.55 622 648.41 804.25 1,028.35Caraga * 467.66 409.49 409.53 505.16 392.84 416.17 431 612.28 830.72 917.68ARMM ** 2.79 46.43 822.48 851.37 812.89 1,056.35 1,301 1,230.21 1515.667 1,605.02
Philippines 24,460 28,964.83 33,769.93 33,658.12 33,346.67 27,288.85 26,429.53 29,046 32,183.39 36,634.35 35,404.051 - Includes brackishwater, freshwater (fishhpen, fishcage and fishpond) marine (fish pen & fish cage) and mariculture (oysters and mussels). Source: BAS, DA

Table 1.19. EXPORT OF FISH AND FISHERY PRODUCTS: QUANTITY AND VALUE BY KIND, 1992 to 2002
Item 1992 1993 1994 1995 1996 1997 1998 1999 2000 2001 2002
TOTAL QUANTITY (in metric tons) 131,915 163,745 172,080 169,746 164,673 173,887 185,758 172,845 199,719 159,069 182,032
I. FISH AND FISH PREPARATIONS 104,485 135,573 143,468 128,340 124,375 130,368 148,047 128,807 139,600 114,791 135,518
1. Fish, fresh (live or dead), 15,411 34,664 39,128 41,497 32,040 38,355 62,374 57,221 65,665 41,397 42,300
chilled or frozen
2. Fish, dried, salted or in brine, 728 685 703 493 575 754 592 820 1,322 1,534 2,057
smoked fish (whether or not
cooked before or during smoking)
3. Crustaceans, mollusks, whether 36,614 38,140 38,688 34,498 28,568 30,817 28,289 30,530 32,408 34,042 38,236
in shell or not, fresh (live or
dead), chilled, frozen, salted
in brine or dried; crustaceans
in shells, simply boiled in water
4. Fish, crustaceans and mollusks, 51,732 62,084 64,949 51,852 63,192 60,442 56,792 40,236 40,205 37,818 52,925
prepared or preserved, n.e.s.
II. SHELLS AND BY-PRODUCTS 4,141 2,818 3,260 2,387 2,329 2,226 1,978 1,765 1,654 2,233 2,714
III. MISCELLANEOUS FISHERY 23,289 25,354 25,352 39,019 37,969 41,293 35,733 42,273 58,465 42,045 43,800
PRODUCTS AND BY PRODUCTS Source: BAS, DA.and NSO

TABLE 1.19. (continued)…..
Item 1992 1993 1994 1995 1996 1997 1998 1999 2000 2001 2002
TOTAL VALUE ('000 P) 11,090,306 14,074,021 15,027,333 15,656,803 15,110,548 16,337,349 20,553,378 19,337,504 20,422,791 22,723,208 26,177,760
I. FISH AND FISH PREPARATIONS 9,959,672 13,006,324 13,898,842 13,016,446 12,229,034 13,027,518 17,287,928 15,049,346 16,169,195 18,479,850 21,319,561
1. Fish, fresh (live or dead), chilled or 736,598 1,597,003 1,736,966 2,185,166 1,890,815 2,006,088 4,059,091 3,618,836 4470746 4,295,247 4313862
frozen
2. Fish, dried, salted or in brine, 58,450 57,587 57,935 54,857 66,552 113,695 117,284 122,130 161012 230,090 235357
smoked fish(whether or not cooked
before or during smoking)
3. Crustaceans, mollusks, whether in 6,535,884 7,665,126 8,074,867 7,518,637 6,543,652 6,614,592 7,682,142 7,843,420 8570537 9,666,784 10862225
shell or not, fresh (live or dead),
chilled, frozen, salted in brine or
dried; crustaceans in shells,
simply boiled in water
4. Fish, crustaceans and mollusks, 2,628,740 3,686,608 4,029,074 3,257,786 3,728,015 4,293,143 5,429,411 3,464,960 2966900 4,287,729 5908117
prepared or preserved, n.e.s.
II. SHELLS AND BY-PRODUCTS 498,736 426,677 517,417 467,380 400,282 514,298 700,389 762,754 736090 649,878 952920
III. MISCELLANEOUS FISHERY 631,898 641,020 611,074 2,172,977 2,481,232 2,795,533 2,565,061 3,525,404 3517506 3,593,480 3905279
PRODUCTS AND BY-PRODUCTS
Source: BAS, DA and NSO

TABLE 1.20. FOREST DISTURBANCE, 1992 to 2002
(in hectares)
Year Kaingin Illegal
Logging Pest &
Diseases Typhoon Forest Fire Others Unknwon
2002 782.28 2,435.27 4,782.25 2001 113 775.85 586.98 2000 72.61 4510 - 93.5 4,596.33 1,353.05 460.41 1999 118.85 45.19 98.87 3205.42 592.7 1998 14,429.65 2.30 - 1,380.63 21,318.10 210.00 2,263.91 1997 4,693 93 16,567.47 3539 1996 94 140 524.17 4558 1995 409 9 10331 1994 1,529 107 7720 1993 90 - 15330 1992 86 - 12,720.00
1/ Including unknown others – Pest and diseases, natural calamities, etc Source: Planning Development and Evaluation Division, DENR

TABLE 1.21. FOREST DISTURBANCE, BY REGION, 1996 to 2002 (in hectares)
1996 1997 Region
Kaingin Illegal Logging
Typhoon Forest Fire Kaingin Illegal Logging
Typhoon Forest Fire
CAR 2 322 20 228 342
Region I 958 719 Region II 172 80 699 691 Region III 25 2,325 1,141 1,306 Region IV 37 82 4,453 162 Region V 0 2
Region VI 167 99 Region VII 196 90 62 Region VIII 10 Region IX 53 154 3 38 Region X 5 5 86 75
Region XI 2 204 Region XII 27 Region XIII 519 14,500 17 Philippines 94 10 524 4,558 4,693 93 16,567 3,539 1/ Including unknown Source: Planning Development and Evaluation Division, DENR

TABLE 1.21. (continued)…..
1998 1999 Region
Kaingin Illegal Logging Typhoon Forest
Fire Others Unknown Kaingin Illegal Logging Typhoon Forest
Fire Others Unknown
CAR 370 5 95
Region I 1,102 20.98 36 1899.98 516.151/
Region II 11 1,753 151/
Region III 40 2,054.60 41 930.10
Region IV 13,993.23 3,442.19 205 808.60 4 27.40
Region V 1,380.63 50 3 15.872/
Region VI 367 384.85 9
Region VII 1,594.98 1 135
Region VIII 138.50 - - - - - -
Region IX 1,276 1055 11 301/
Region X 14.94 2.30 293.58 74 71
Region XI 3 1,865 0.49
Region XII 410 10 1.551/
Region XIII 6,633.60 5 264.33 45.19 35.52 832/
Philippines 14,429.65 2.30 1380.63 21,318.10 210 2,263.91 118.85 45 0 3,205.75 98.87 562.70 1/ Including unknown Source: Planning, Policy Studies and Economic Affairs, DENR

TABLE 1.21. (continued)…..
2000 2001 2002 Region
Kaingin Illegal Logging Typhoon Forest
Fire Others Unknown Kaingin Forest Fire Others Kaingin Typhoon Forest
Fire Others Unknown
CAR 3 10 34.70 9 45 - 2,171.50 - 1,074.11 - - Region I 800.95 - 659.17 - - - 1,408.37 - - Region II 186.25 - 11 1 - - 46 - - Region III 3,415.85 1160 98.69 - 18 504.5 - - 295.50 1,729.50 - Region IV A 46 20 - - - - - - - Region IV B Region V 20 47.50 1 - - - - 23.05 - - Region VI 2.5 30 259.95 - 6.62 - - 4 113.80 Region VII 49 262 120 30.86 30 - 100 - - 19 196.03 Region VIII 2.50 1 - - - - - - - Region IX - - - -- - - 5 - 0.50 - - 0.05 - Region X 9 23.05 - - - - - 112.88 - Region XI 0.61 4,500 17.86 5 6 2 - - 341.07 - - Region XII 6 - - - - - - - - Region XIII - - - -- 70.91 - 41.54- - - - 29.37 - Philippines 72.61 4,510.00 93.50 4,752.61 1,353.05 460.41 37 740.17 653.66 2,172.00 23.05 3,165.05 1,895.29 309.83
Others: pest and diseases, natural calamities, unlawful occupation, graqssfire, landslide, boho gathering, cogon gathering, illegal entry,cultural community practices, accident hunting, etc.
Source: Planning, Policy Studies and Economic Affairs, DENR

TABLE 1.22a. CARABAO: PERCENT CHANGE IN POPULATION BY REGION, 1992 to 2002
Region '92-'93 '93-'94 '94-'95 '95-'96 '96-'97 '97-'98 '98-'99 '99-'00 00 - '01 01 - '02
CAR (0.97) 3.75 10.68 10.46 (6.04) 1.97 (6.11) (3.5) (11.4) 11.2 Region I (11.04) 1.17 4.06 20.52 25.65 (5.52) 2.69 4.9 (2.8) (3.3)Region II (5.62) 1.69 6.91 8.14 6.60 0.44 4.36 (0.1) 1.9 1.7 Region III (10.67) 0.95 (7.27) (1.39) (0.68) (0.69) (4.41) 0.6 1.3 11.5 Region IV 27.87 (3.16) 6.02 15.56 3.31 1.65 (1.59) 1.2 1.7 (5.7)Region V 2.36 2.10 (3.83) (3.40) 4.05 0.92 (2.47) (3.6) (1.4) (1.3)Region VI (2.47) (5.16) 7.57 0.29 (0.28) 0.42 3.28 (0.0) 3.8 7.2 Region VII 0.23 (0.22) (4.10) 1.90 0.48 (1.32) 0.03 0.7 0.2 (0.5)Region VIII 0.07 0.95 13.20 (2.92) 8.69 (1.30) 4.05 0.6 5.8 5.6 Region IX 17.98 (2.39) (0.93) 9.73 (0.44) 4.20 (1.53) 2.2 1.6 (0.8)Region X (4.46) (5.84) 6.75 (18.09) 24.54 7.55 0.07 (1.9) 4.6 50.6 Region XI (6.53) (7.07) 20.96 8.71 6.29 4.50 0.87 (1.2) (2.0) (33.0)Region XII (2.85) 2.84 17.62 1.85 5.60 (3.90) 1.51 (1.2) 3.3 18.0 Caraga (1.07) (0.31) (5.41) 1.76 5.96 1.96 (0.95) 2.6 5.7 1.2 ARMM 0.55 8.09 30.70 19.12 0.61 11.47 (14.80) 12.7 (2.0) 14.8
Philippines (0.04) (0.63) 5.79 4.93 5.16 0.85 (0.24) 0.6 0.4 1.4Source: BAS, DA
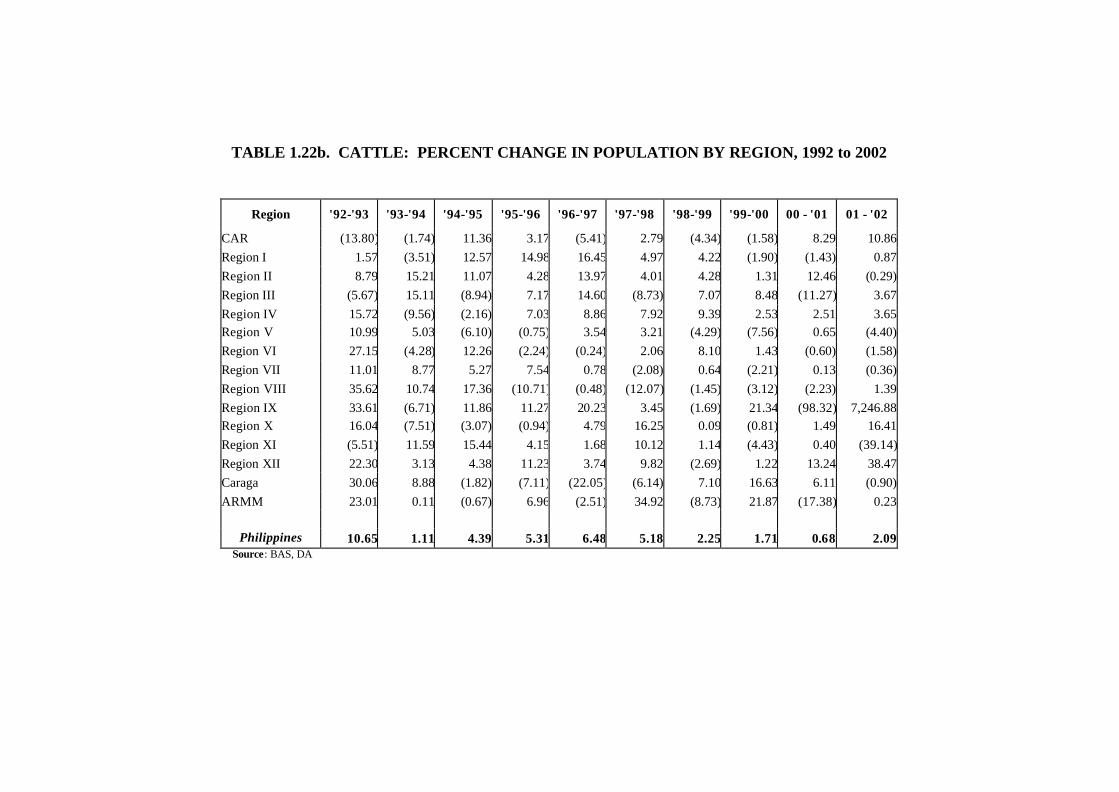
TABLE 1.22b. CATTLE: PERCENT CHANGE IN POPULATION BY REGION, 1992 to 2002
Region '92-'93 '93-'94 '94-'95 '95-'96 '96-'97 '97-'98 '98-'99 '99-'00 00 - '01 01 - '02
CAR (13.80) (1.74) 11.36 3.17 (5.41) 2.79 (4.34) (1.58) 8.29 10.86 Region I 1.57 (3.51) 12.57 14.98 16.45 4.97 4.22 (1.90) (1.43) 0.87 Region II 8.79 15.21 11.07 4.28 13.97 4.01 4.28 1.31 12.46 (0.29)Region III (5.67) 15.11 (8.94) 7.17 14.60 (8.73) 7.07 8.48 (11.27) 3.67 Region IV 15.72 (9.56) (2.16) 7.03 8.86 7.92 9.39 2.53 2.51 3.65 Region V 10.99 5.03 (6.10) (0.75) 3.54 3.21 (4.29) (7.56) 0.65 (4.40)Region VI 27.15 (4.28) 12.26 (2.24) (0.24) 2.06 8.10 1.43 (0.60) (1.58)Region VII 11.01 8.77 5.27 7.54 0.78 (2.08) 0.64 (2.21) 0.13 (0.36)Region VIII 35.62 10.74 17.36 (10.71) (0.48) (12.07) (1.45) (3.12) (2.23) 1.39 Region IX 33.61 (6.71) 11.86 11.27 20.23 3.45 (1.69) 21.34 (98.32) 7,246.88 Region X 16.04 (7.51) (3.07) (0.94) 4.79 16.25 0.09 (0.81) 1.49 16.41 Region XI (5.51) 11.59 15.44 4.15 1.68 10.12 1.14 (4.43) 0.40 (39.14)Region XII 22.30 3.13 4.38 11.23 3.74 9.82 (2.69) 1.22 13.24 38.47 Caraga 30.06 8.88 (1.82) (7.11) (22.05) (6.14) 7.10 16.63 6.11 (0.90)ARMM 23.01 0.11 (0.67) 6.96 (2.51) 34.92 (8.73) 21.87 (17.38) 0.23
Philippines 10.65 1.11 4.39 5.31 6.48 5.18 2.25 1.71 0.68 2.09 Source: BAS, DA

TABLE 1.22c. GOAT: PERCENT CHANGE IN POPULATION BY REGION, 1992 to 2002
Region '92-'93 '93-'94 '94-'95 '95-'96 '96-'97 '97-'98 '98-'99 '99-'00 00 - '01 01 - '02
CAR (19.09) 12.68 19.57 6.03 16.93 18.88 1.97 2.76 18.07 20.61 Region I (6.78) 11.22 18.01 12.02 9.45 11.05 (1.40) 16.63 3.86 1.28 Region II 37.80 31.79 (5.11) (3.89) 16.65 4.73 9.05 14.37 9.07 10.77 Region III 0.38 2.43 (6.15) 10.44 19.74 14.35 0.93 0.48 (1.23) (1.51)Region IV 7.07 2.83 12.86 (0.09) (0.26) (4.13) (9.63) 26.21 10.84 (1.39)Region V 21.20 0.71 (4.70) (3.44) (19.90) 0.10 5.76 (10.44) 5.94 11.60 Region VI (8.09) 7.33 14.38 10.84 0.53 0.39 (2.85) 7.72 (0.53) 0.33 Region VII 14.24 7.53 2.03 6.95 (4.68) 0.06 2.00 1.29 5.73 (1.06)Region VIII 5.74 (3.20) 17.99 20.11 0.90 (3.75) (7.44) (0.68) (5.02) 1.09 Region IX 4.02 6.10 (7.30) 4.07 7.19 (3.53) (0.01) (19.75) (7.11) (5.01)Region X 12.58 (1.70) (0.44) (2.08) 1.99 (2.72) (1.05) 1.36 1.31 14.97 Region XI 45.63 (11.42) 19.64 5.74 6.03 (2.72) (5.72) (5.00) (2.32) (10.38)Region XII 8.20 8.55 9.26 6.76 0.07 4.19 (11.66) 4.34 2.38 19.18 Caraga 29.57 2.51 0.69 (7.91) (20.06) 1.60 24.83 (6.00) 5.64 16.78 ARMM 18.68 (8.14) 18.03 0.00 (14.15) 5.71 (5.44) 24.18 (3.65) 14.61 Philippines 11.10 2.76 7.41 5.44 1.44 2.00 (1.80) 4.02 2.01 2.46
Source: BAS, DA

TABLE 1.22d. HOG: PERCENT CHANGE IN POPULATION BY REGION, 1992 to 2002
Region '92-'93 '93-'94 '94-'95 '95-'96 '96-'97 '97-'98 '98-'99 '99-'00 00 - '01 01 - '02
CAR (0.81) 8.43 15.77 0.19 (1.72) 3.96 (2.80) 0.52 16.77 0.20 Region I (0.06) (7.10) (10.27) 7.81 16.70 0.89 (5.90) (14.04) 10.60 4.01 Region II 4.60 (2.53) 2.96 (6.53) 14.17 15.93 (4.13) (4.87) 19.48 0.00 Region III 2.75 6.89 9.79 7.62 3.28 14.30 (5.79) 6.44 0.95 9.42 Region IV 3.57 3.47 10.77 0.17 10.29 2.53 3.37 4.51 3.49 4.66 Region V (0.01) (1.86) (7.02) (8.86) 22.89 (2.27) 8.59 2.51 0.55 11.00 Region VI 1.40 10.94 4.78 12.31 (0.03) 1.12 8.44 8.99 6.78 1.83 Region VII (5.74) 2.03 7.03 (8.26) 5.44 5.74 (0.14) 0.50 3.21 5.38 Region VIII (3.58) 5.72 19.21 (0.67) 6.39 (5.44) 4.80 1.05 (7.54) 4.51 Region IX (12.71) 10.18 14.29 4.45 11.91 8.18 0.67 8.20 8.12 (0.75)Region X (14.76) 10.43 7.19 11.00 7.23 4.87 23.29 (4.36) 0.99 18.58 Region XI 3.65 4.67 18.97 (6.37) 14.65 1.34 (0.93) 7.77 72.37 (55.43)Region XII (2.27) (7.58) 1.02 (9.75) (1.91) 8.46 10.40 21.76 4.45 47.72 Caraga 1.05 0.85 25.38 9.57 3.73 5.82 (1.71) (11.35) 3.26 10.70 ARMM (15.49) 10.72 35.33 43.65 (27.12) (3.09) (21.36) 7.44 16.04 86.59 Philippines (0.85) 3.43 8.69 0.95 8.05 4.70 1.83 3.02 3.29 5.33
Source: BAS, DA

TABLE 1.22e CHICKEN: PERCENT CHANGE IN POPULATION BY REGION, 1992 to 2002
Region '92-'93 '93-'94 '94-'95 '95-'96 '96-'97 '97-'98 '98-'99 '99-'00 00 - '01 01 - '02
NCR 16.08 9.50 (19.80) 40.98 9.58 (18.40) (71.73) 88.28 0.00 14.36 CAR (12.87) (0.89) 29.88 11.19 8.46 (9.41) 0.82 0.53 31.57 (5.02)Region I 2.69 (6.18) 14.74 5.09 17.22 9.24 (23.86) 2.84 8.10 (0.43)Region II 19.68 1.22 34.98 17.43 16.01 19.23 (11.67) (0.95) 2.76 7.77 Region III 6.13 7.74 (6.99) 34.61 12.83 11.41 (19.19) (3.62) (2.87) 7.17 Region IV 8.49 9.39 (6.00) 26.70 15.46 (17.12) (10.04) (10.49) (8.79) 24.69 Region V (6.79) 0.66 (3.29) 18.03 10.70 28.52 22.67 (20.27) (0.20) 11.26 Region VI (1.66) 8.65 11.62 8.46 16.63 4.32 (16.11) 12.89 (4.21) 13.43 Region VII 28.50 (12.30) 8.32 5.98 21.82 5.46 (29.22) 11.04 7.85 14.69 Region VIII (2.59) 41.88 10.58 17.15 19.35 15.73 (24.87) 14.25 (6.23) (10.09)Region IX (7.94) 41.86 12.66 (1.94) 22.29 (13.66) (10.52) (6.50) (7.16) 64.41 Region X (2.09) 23.12 15.91 13.16 21.25 17.35 (16.85) (11.00) 8.13 18.63 Region XI 18.92 7.42 (6.79) 45.15 24.47 4.03 (25.26) 4.03 3.66 (28.83)Region XII (1.70) (3.13) 11.79 11.08 12.60 (0.97) (10.90) 27.45 1.13 48.38 Caraga 1.42 (3.15) 22.11 21.20 14.71 7.13 (17.36) (3.97) 13.44 3.56 ARMM 32.35 4.34 11.32 23.38 1.02 (11.23) (13.27) 15.39 (0.26) 11.75 Philippines 6.91 6.83 3.34 20.34 16.57 2.64 (16.37) (0.56) 0.36 46.01
Source: BAS, DA

TABLE 1.22f. DUCK: PERCENT CHANGE IN POPULATION BY REGION, 1992 to 2002
Region '92-'93 '93-'94 '94-'95 '95-'96 '96-'97 '97-'98 '98-'99 '99-'00 00 - '01 01 - '02
CAR (24.24) 26.78 15.76 0.39 (2.81) (2.88) (14.63) 0.66 10.92 31.23Region I 24.77 (3.57) 3.51 (9.62) (13.85) 5.96 (12.39) 18.16 0.22 -14.67Region II 71.88 (20.62) 108.73 0.62 1.46 (12.82) (10.10) -4.95 27.41 -0.12Region III (34.02) 5.01 67.83 19.69 (17.04) (4.48) 9.42 13.03 -1.66 -5.92Region IV 16.31 (20.26) 18.02 (14.66) (15.92) (2.99) 15.27 1.54 -13.95 28.76Region V 38.66 16.74 (22.58) (7.30) (0.33) (12.84) (13.97) 17.54 1.68 -18.59Region VI 17.90 (8.11) (0.17) (0.61) (6.61) 1.15 (3.04) 4.05 15.96 1.98Region VII (13.88) (42.17) (0.65) 4.47 (4.78) (9.96) (7.23) -6.56 -4.82 -4.73Region VIII 10.73 (3.75) (35.12) 23.06 5.25 (2.02) (4.77) 5.47 2.39 11.03Region IX 65.58 (16.49) (18.33) (34.95) 18.89 19.51 (15.90) -30.21 -12.92 59.88Region X 57.36 29.09 (42.52) 23.31 10.69 64.45 (21.41) 7.77 2.14 13.52Region XI 7.55 (15.35) (32.15) 15.74 5.29 0.35 0.33 16.19 3.12 -31.47Region XII (10.39) 15.89 (23.00) 2.75 15.44 (4.60) (8.27) 31.04 31.68 26.24Caraga (18.36) 15.54 35.82 11.85 (0.53) (13.37) (22.47) 10.70 8.14 13.82ARMM (25.17) 16.49 41.94 20.97 (7.20) 5.56 (3.06) 0.17 12.99 -9.01 Philippines 4.29 (5.97) 10.81 4.38 (5.77) (1.08) (2.74) 7.67 6.01 1.16
Source: BAS, DA

TABLE 1.23a CARABAO: CHANGE IN POPULATION BY REGION, 1992 to 2002 (in number of heads)
Region 92-93 93-94 94-95 95-96 96-97 97-98 98-99 99-00 00 - '01 01 - '02
CAR (851) 3,272 9,655 10,468 (6,674) 2,049 13,356 (3,500) (10,918) 9,491 Region I (19,072) 1,800 6,316 33,188 49,986 (13,518) 6,225 11,662 (7,062) (7,980)Region II (14,474) 4,114 17,094 21,516 18,858 1,350 13,356 (435) 5,985 5,450 Region III (23,211) 1,851 (14,263) (2,533) (1,221) (1,227) (7,798) 998 2,212 19,808 Region IV 51,122 (7,412) 13,670 37,471 9,205 4,755 (4,657) 3,365 4,913 (16,960)
CALABARZON 110,924 MIMAROPA 167,995
Region V 6,257 5,709 (10,622) (9,059) 10,443 2,459 (6,676) (9,522) (3,613) (3,202)Region VI (6,865) (14,025) 19,507 793 (782) 1,164 9,117 (72) 10,931 21,556 Region VII 335 (311) (5,907) 2,630 675 (1,863) 39 961 296 (692)Region VIII 113 1,498 21,114 (5,296) 15,280 (2,480) 7,631 1,275 11,550 11,772 Region IX 28,926 (4,535) (1,723) 17,852 (884) 8,416 (3,199) 4,568 3,375 (1,691)Region X (4,246) (5,316) 5,778 (16,538) 18,382 7,042 71 (1,919) 4,562 52,181 Region XI (13,116) (13,276) 36,571 18,386 14,430 10,976 2,211 (3,031) (5,095) (82,121)Region XII (5,339) 5,167 32,961 4,064 12,557 (9,228) 3,444 (2,829) 7,471 42,507 Caraga (1,041) (296) (5,209) 1,607 5,526 1,926 (954) 2,594 5,767 1,282 ARMM 385 5,659 23,220 18,902 722 13,593 (19,545) 14,299 (2,598) 18,446
Philippines (1,077) (16,101) 148,162 133,451 146,503 25,414 12,621 18,414 41,410 56,213
Computation: Change 1990 = As of January 1, 1991 - As of January 1, 1990 (Ending-Beginning Inventory) Source: BAS, DA

TABLE 1.23b CATTLE: CHANGE IN POPULATION BY REGION, 1992 to 2002 (in number of heads)
Region 92-93 93-94 94-95 95-96 96-97 97-98 98-99 99-00 00 - '01 01 - '02
CAR (8,906) (968) 6,207 1,932 (3,395) 1,656 (2,652) (923) 4,766 6,763 Region I 3,295 (7,478) 25,837 34,660 43,755 15,393 13,718 (6,455) (4,739) 2,862 Region II 7,374 13,879 11,636 4,994 17,005 5,570 6,181 1,972 18,996 (493)Region III (7,947) 19,959 (13,598) 9,933 21,661 (14,846) 10,970 14,089 (20,324) 5,867 Region IV 33,738 (23,750) (4,843) 15,457 20,851 20,289 25,964 7,637 7,792 11,591
CALABARZON 211,693 MIMAROPA 117,716
Region V 12,302 6,253 (7,966) (917) 4,306 4,046 (5,579) (9,406) 745 (5,090)Region VI 35,080 (7,037) 19,275 (3,946) (410) 3,549 14,238 2,725 (1,151) (3,035)Region VII 23,965 21,193 13,838 20,846 2,325 (6,246) 1,865 (6,518) 388 (1,042)Region VIII 8,136 3,326 5,954 (4,313) (173) (4,317) (456) (966) (669) 409 Region IX 22,338 (5,958) 9,825 10,446 20,860 4,276 (2,169) 26,909 (150,426) 185,955 Region X 31,667 (17,210) (6,503) (1,935) 9,737 34,636 227 (2,011) 3,674 40,972 Region XI (7,669) 15,243 22,662 7,028 2,964 18,156 2,257 (8,847) 766 (75,051)Region XII 13,940 2,390 3,450 9,243 3,420 9,326 (2,803) 1,242 13,597 44,743 Caraga 3,300 1,268 (283) (1,085) (3,126) (679) 736 1,847 791 (124)ARMM 13,678 78 (489) 5,061 (1,951) 26,481 (8,935) 20,422 (19,783) 216
Philippines 184,291 21,188 85,002 107,404 137,829 117,290 53,562 41,717 16,748 52,218 Computation: Change 1990 = As of January 1, 1991 - As of January 1, 1990 (Ending-Beginning Inventory) Source: BAS, DA

TABLE 1.23c GOAT: CHANGE IN POPULATION BY REGION, 1992 to 2002 (in number of heads)
Region 92-93 93-94 94-95 95-96 96-97 97-98 98-99 99-00 00 - '01 01 - '02
CAR (4,170) 2,242 3,898 1,437 4,275 5,576 691 989 6,646 8,949 Region I (14,891) 22,989 41,026 32,309 28,463 36,428 (5,139) 60,004 16,247 5,600 Region II 16,164 18,732 (3,971) (2,864) 11,796 3,907 7,828 13,563 9,789 12,673 Region III 639 4,128 (10,698) 17,033 35,571 30,961 2,297 1,195 (3,085) (3,724)Region IV 11,458 4,907 22,925 (179) (513) (8,276) (18,522) 45,542 23,780 (3,387)
CALABARZON 116,647 MIMAROPA 123,047
Region V 18,635 759 (5,043) (3,522) (19,651) 79 4,557 (8,742) 4,454 9,217 Region VI (22,015) 18,347 38,629 33,307 1,791 1,333 (9,783) 25,786 (1,914) 1,191 Region VII 50,179 30,294 8,806 30,705 (22,101) 275 9,019 5,939 26,661 (5,220)Region VIII 3,265 (1,924) 10,478 13,825 745 (3,122) (5,964) (506) (3,698) 765 Region IX 7,418 11,710 (14,867) 7,686 14,121 (7,424) (22) (40,130) (11,588) (7,582)Region X 18,745 (2,849) (723) (3,411) 3,195 (4,467) (1,667) 2,143 2,090 24,255 Region XI 115,363 (42,050) 64,050 22,392 24,884 (11,908) (24,348) (20,077) (8,824) (38,656)Region XII 11,658 13,149 15,463 12,324 131 8,172 (23,677) 7,787 4,450 36,741 Caraga 20,224 2,223 628 (7,232) (16,902) 1,078 16,988 (5,128) 4,531 14,229 ARMM 23,310 (12,063) 24,532 1 (22,725) 7,873 (7,930) 33,314 (6,247) 24,085
Philippines 255,982 70,594 195,133 153,811 43,080 60,485 (55,672) 121,679 63,292 79,136 Computation: Change 1990 = As of January 1, 1991 - As of January 1, 1990 (Ending-Beginning Inventory) Source: BAS, DA

TABLE 1.23d. HOG: CHANGE IN POPULATION BY REGION, 1992 to 2002 (in number of heads)
Region 92-93 93-94 94-95 95-96 96-97 97-98 98-99 99-00 00 - '01 01 - '02
CAR (1,638) 16,899 34,276 480 (4,330) 9,810 (7,220) 1,310 42,220 580 Region I (287) (34,246) (46,011) 31,410 72,410 4,490 (30,130) (67,430) 43,770 18,300 Region II 20,907 (11,998) 13,710 (31,130) 63,130 81,030 (24,380) (27,510) 104,750 0 Region III 28,205 72,589 110,168 94,160 43,590 196,380 (90,910) 95,270 14,880 149,640 Region IV 40,748 40,983 131,568 2,290 139,470 37,850 51,690 71,490 57,860 79,910
CALABARZON 1,418,010MIMAROPA 376,000
Region V (75) (10,557) (39,167) (45,990) 108,270 (13,180) 48,780 15,460 3,490 69,970 Region VI 8,144 64,524 31,314 84,430 (240) 8,650 65,740 75,930 62,440 17,940 Region VII (43,081) 14,390 50,736 (63,820) 38,560 42,900 (1,070) 3,970 25,450 44,030 Region VIII (20,548) 31,694 112,424 (4,650) 44,270 (40,120) 33,490 7,680 (55,670) 30,810 Region IX (55,687) 38,912 60,220 21,430 59,880 46,060 4,080 50,250 53,850 (5,390)Region X (62,623) 37,725 28,723 47,120 34,380 24,810 124,490 (28,760) 6,210 118,290 Region XI 26,788 35,527 150,982 (60,320) 129,910 13,620 (9,610) 79,250 795,910 (1,050,770)Region XII (8,469) (27,646) 3,428 (33,190) (5,880) 25,490 34,000 78,520 19,540 219,010 Caraga 2,645 2,158 65,350 30,910 13,180 21,360 (6,650) (43,320) 11,020 37,380 ARMM (3,256) 1,905 6,950 11,620 (10,370) (860) (5,770) 1,580 3,660 22,930
Philippines (68,227) 272,859 714,671 84,750 726,230 458,290 186,530 313,690 352,450 589,560 Computation: Change 1990 = As of January 1, 1991 - As of January 1, 1990 (Ending-Beginning Inventory) Source: BAS, DA
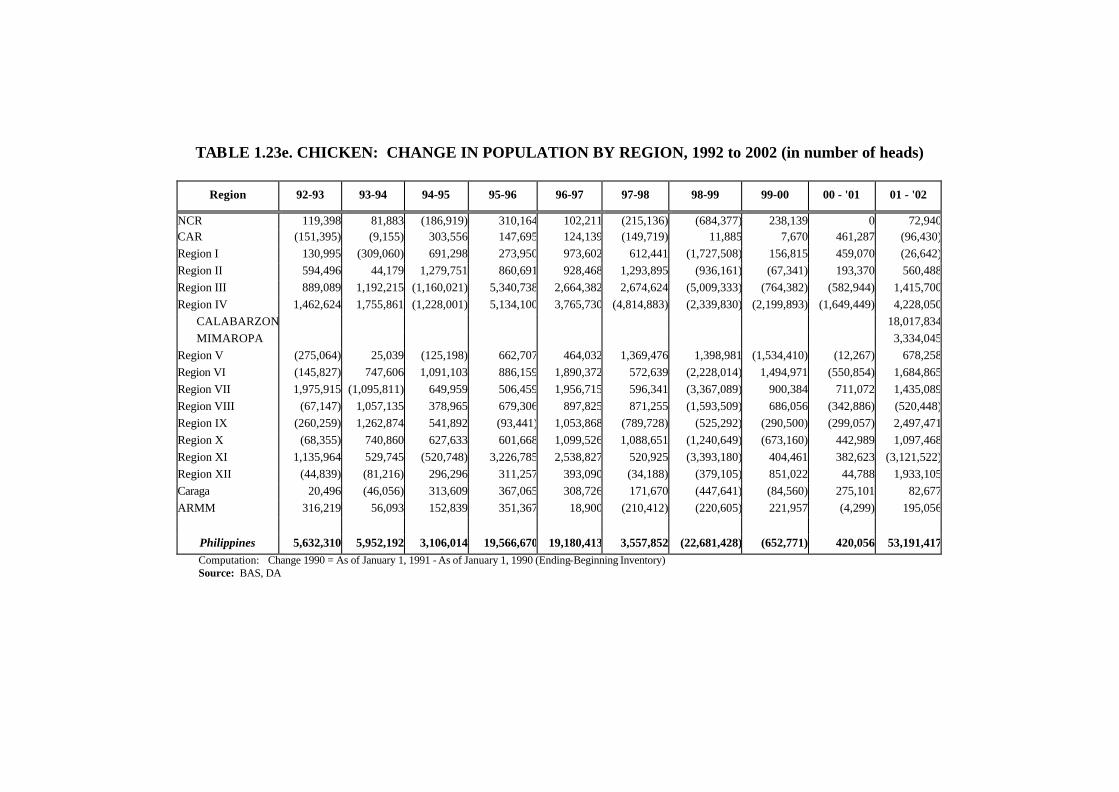
TABLE 1.23e. CHICKEN: CHANGE IN POPULATION BY REGION, 1992 to 2002 (in number of heads)
Region 92-93 93-94 94-95 95-96 96-97 97-98 98-99 99-00 00 - '01 01 - '02
NCR 119,398 81,883 (186,919) 310,164 102,211 (215,136) (684,377) 238,139 0 72,940 CAR (151,395) (9,155) 303,556 147,695 124,139 (149,719) 11,885 7,670 461,287 (96,430)Region I 130,995 (309,060) 691,298 273,950 973,602 612,441 (1,727,508) 156,815 459,070 (26,642)Region II 594,496 44,179 1,279,751 860,691 928,468 1,293,895 (936,161) (67,341) 193,370 560,488 Region III 889,089 1,192,215 (1,160,021) 5,340,738 2,664,382 2,674,624 (5,009,333) (764,382) (582,944) 1,415,700 Region IV 1,462,624 1,755,861 (1,228,001) 5,134,100 3,765,730 (4,814,883) (2,339,830) (2,199,893) (1,649,449) 4,228,050
CALABARZON 18,017,834 MIMAROPA 3,334,045
Region V (275,064) 25,039 (125,198) 662,707 464,032 1,369,476 1,398,981 (1,534,410) (12,267) 678,258 Region VI (145,827) 747,606 1,091,103 886,159 1,890,372 572,639 (2,228,014) 1,494,971 (550,854) 1,684,865 Region VII 1,975,915 (1,095,811) 649,959 506,459 1,956,715 596,341 (3,367,089) 900,384 711,072 1,435,089 Region VIII (67,147) 1,057,135 378,965 679,306 897,825 871,255 (1,593,509) 686,056 (342,886) (520,448)Region IX (260,259) 1,262,874 541,892 (93,441) 1,053,868 (789,728) (525,292) (290,500) (299,057) 2,497,471 Region X (68,355) 740,860 627,633 601,668 1,099,526 1,088,651 (1,240,649) (673,160) 442,989 1,097,468 Region XI 1,135,964 529,745 (520,748) 3,226,785 2,538,827 520,925 (3,393,180) 404,461 382,623 (3,121,522)Region XII (44,839) (81,216) 296,296 311,257 393,090 (34,188) (379,105) 851,022 44,788 1,933,105 Caraga 20,496 (46,056) 313,609 367,065 308,726 171,670 (447,641) (84,560) 275,101 82,677 ARMM 316,219 56,093 152,839 351,367 18,900 (210,412) (220,605) 221,957 (4,299) 195,056
Philippines 5,632,310 5,952,192 3,106,014 19,566,670 19,180,413 3,557,852 (22,681,428) (652,771) 420,056 53,191,417 Computation: Change 1990 = As of January 1, 1991 - As of January 1, 1990 (Ending-Beginning Inventory) Source: BAS, DA
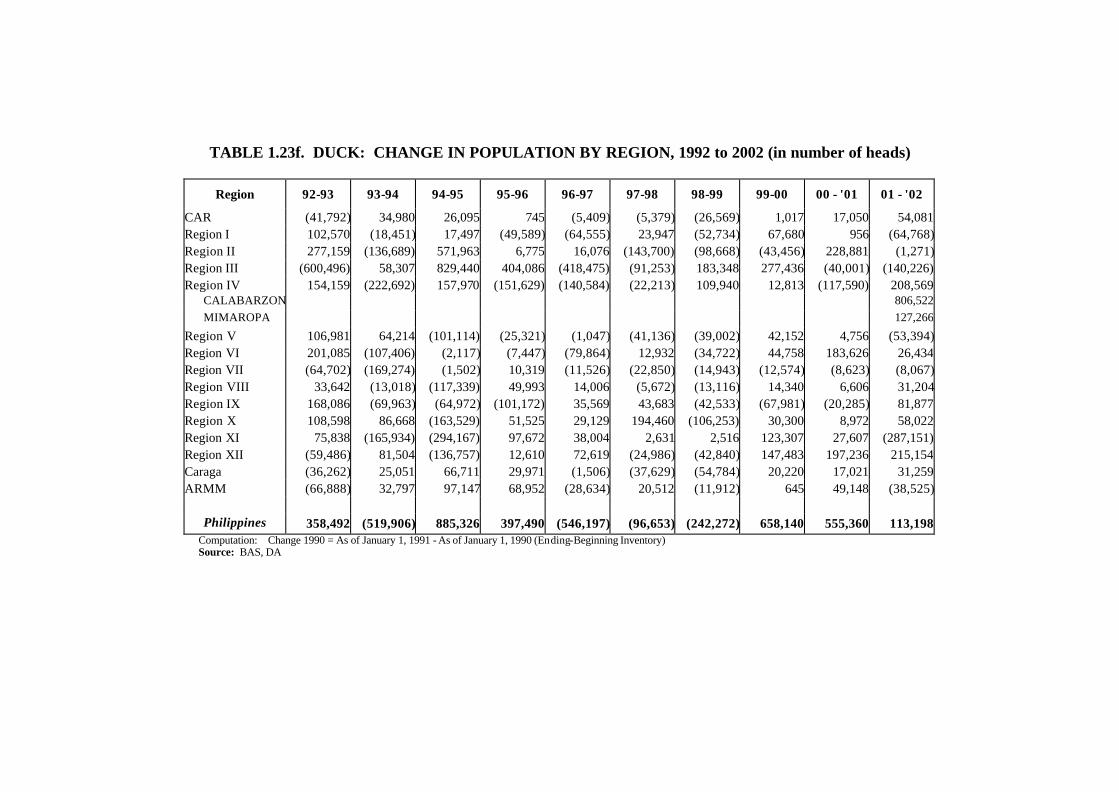
TABLE 1.23f. DUCK: CHANGE IN POPULATION BY REGION, 1992 to 2002 (in number of heads)
Region 92-93 93-94 94-95 95-96 96-97 97-98 98-99 99-00 00 - '01 01 - '02
CAR (41,792) 34,980 26,095 745 (5,409) (5,379) (26,569) 1,017 17,050 54,081 Region I 102,570 (18,451) 17,497 (49,589) (64,555) 23,947 (52,734) 67,680 956 (64,768)Region II 277,159 (136,689) 571,963 6,775 16,076 (143,700) (98,668) (43,456) 228,881 (1,271)Region III (600,496) 58,307 829,440 404,086 (418,475) (91,253) 183,348 277,436 (40,001) (140,226)Region IV 154,159 (222,692) 157,970 (151,629) (140,584) (22,213) 109,940 12,813 (117,590) 208,569
CALABARZON 806,522 MIMAROPA 127,266
Region V 106,981 64,214 (101,114) (25,321) (1,047) (41,136) (39,002) 42,152 4,756 (53,394)Region VI 201,085 (107,406) (2,117) (7,447) (79,864) 12,932 (34,722) 44,758 183,626 26,434 Region VII (64,702) (169,274) (1,502) 10,319 (11,526) (22,850) (14,943) (12,574) (8,623) (8,067)Region VIII 33,642 (13,018) (117,339) 49,993 14,006 (5,672) (13,116) 14,340 6,606 31,204Region IX 168,086 (69,963) (64,972) (101,172) 35,569 43,683 (42,533) (67,981) (20,285) 81,877 Region X 108,598 86,668 (163,529) 51,525 29,129 194,460 (106,253) 30,300 8,972 58,022 Region XI 75,838 (165,934) (294,167) 97,672 38,004 2,631 2,516 123,307 27,607 (287,151)Region XII (59,486) 81,504 (136,757) 12,610 72,619 (24,986) (42,840) 147,483 197,236 215,154 Caraga (36,262) 25,051 66,711 29,971 (1,506) (37,629) (54,784) 20,220 17,021 31,259 ARMM (66,888) 32,797 97,147 68,952 (28,634) 20,512 (11,912) 645 49,148 (38,525)
Philippines 358,492 (519,906) 885,326 397,490 (546,197) (96,653) (242,272) 658,140 555,360 113,198 Computation: Change 1990 = As of January 1, 1991 - As of January 1, 1990 (Ending-Beginning Inventory) Source: BAS, DA

TABLE 1.24. RARE, THREATENED AND ENDANGERED WILDLIFE SPECIES 1992 - 2002 (number of species)
Wildlife 1992 1993 1994 1995 1996 1997 1998 1999 2000 2001 2002
Mammals 47 64 64 63 94 95 94 98 108 99 99
Birds 125 125 150 162 176 174 173 149 192 205 216Reptiles 11 11 14 14 15 15 15 18 16 16 16Amphibians 2 -- -- Insecta 4 4 -- --
Total 183 200 228 239 285 284 282 269 322 320 331*includes species that are critically endangered, near threatened, extinct, vulnerable, conservation dependent, of least concern, at lower risk, indeterminate, in CITES I and II. Source: PAWB, DENR
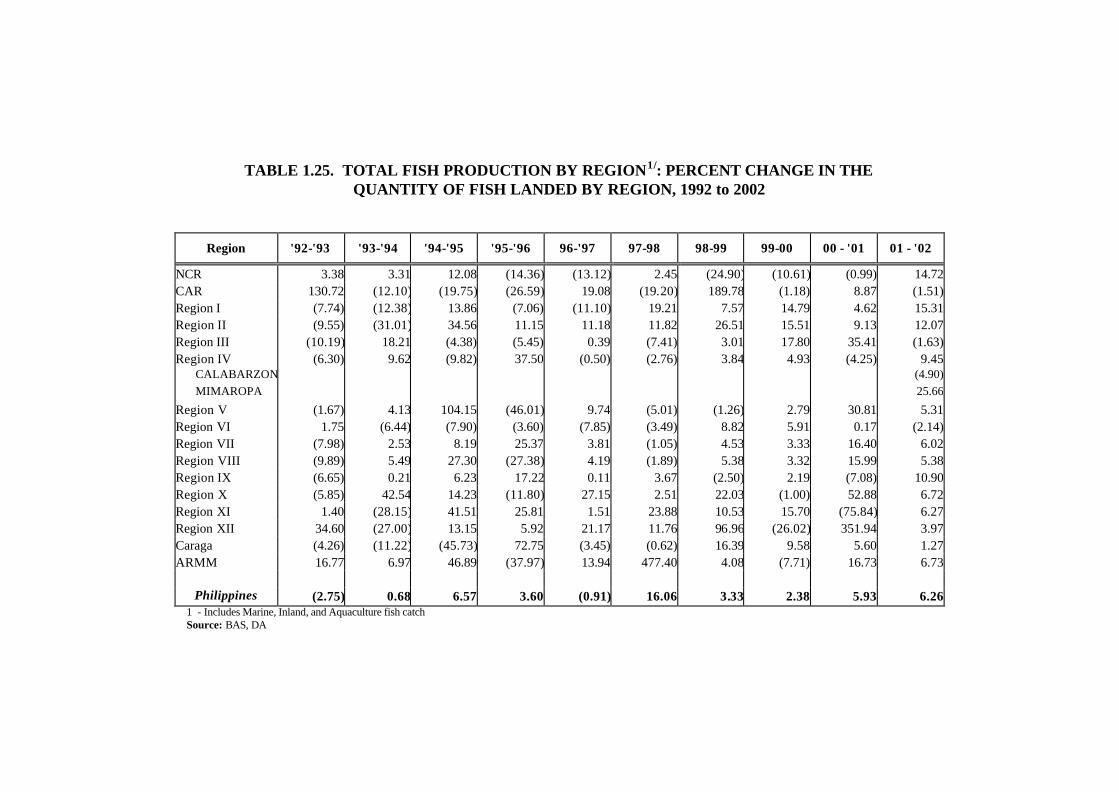
TABLE 1.25. TOTAL FISH PRODUCTION BY REGION1/: PERCENT CHANGE IN THE
QUANTITY OF FISH LANDED BY REGION, 1992 to 2002
Region '92-'93 '93-'94 '94-'95 '95-'96 96-'97 97-98 98-99 99-00 00 - '01 01 - '02
NCR 3.38 3.31 12.08 (14.36) (13.12) 2.45 (24.90) (10.61) (0.99) 14.72 CAR 130.72 (12.10) (19.75) (26.59) 19.08 (19.20) 189.78 (1.18) 8.87 (1.51)Region I (7.74) (12.38) 13.86 (7.06) (11.10) 19.21 7.57 14.79 4.62 15.31 Region II (9.55) (31.01) 34.56 11.15 11.18 11.82 26.51 15.51 9.13 12.07 Region III (10.19) 18.21 (4.38) (5.45) 0.39 (7.41) 3.01 17.80 35.41 (1.63)Region IV (6.30) 9.62 (9.82) 37.50 (0.50) (2.76) 3.84 4.93 (4.25) 9.45
CALABARZON (4.90)MIMAROPA 25.66
Region V (1.67) 4.13 104.15 (46.01) 9.74 (5.01) (1.26) 2.79 30.81 5.31 Region VI 1.75 (6.44) (7.90) (3.60) (7.85) (3.49) 8.82 5.91 0.17 (2.14)Region VII (7.98) 2.53 8.19 25.37 3.81 (1.05) 4.53 3.33 16.40 6.02 Region VIII (9.89) 5.49 27.30 (27.38) 4.19 (1.89) 5.38 3.32 15.99 5.38 Region IX (6.65) 0.21 6.23 17.22 0.11 3.67 (2.50) 2.19 (7.08) 10.90 Region X (5.85) 42.54 14.23 (11.80) 27.15 2.51 22.03 (1.00) 52.88 6.72 Region XI 1.40 (28.15) 41.51 25.81 1.51 23.88 10.53 15.70 (75.84) 6.27 Region XII 34.60 (27.00) 13.15 5.92 21.17 11.76 96.96 (26.02) 351.94 3.97 Caraga (4.26) (11.22) (45.73) 72.75 (3.45) (0.62) 16.39 9.58 5.60 1.27 ARMM 16.77 6.97 46.89 (37.97) 13.94 477.40 4.08 (7.71) 16.73 6.73
Philippines (2.75) 0.68 6.57 3.60 (0.91) 16.06 3.33 2.38 5.93 6.26 1 - Includes Marine, Inland, and Aquaculture fish catch Source: BAS, DA

TABLE 1.26a. MARINE FISH CATCH (COMMERCIAL AND MARINE MUNICIPAL FISHING): PERCENT CHANGE IN THE QUANTITY OF FISH LANDED BY REGION, 1992 to 2002
Region '92-'93 '93-'94 '94-'95 '95-'96 96-'97 '97-'98 98-'99 '99-'00 00 - '01 01 - '02
NCR 3.65 3.25 13.09 (13.77) (13.11) 2.11 (23.71) (10.61) (1.18) 12.56 CAR Region I (4.90) 0.47 (5.57) (5.24) 1.57 24.42 (0.32) 3.08 (3.93) 19.50 Region II (5.76) (37.87) 47.46 17.26 13.11 18.88 43.45 14.34 1.91 12.92 Region III (30.03) 33.25 (12.20) (15.99) 9.97 10.15 7.41 10.38 28.41 (13.74) Region IV 11.04 7.44 (1.22) (2.41) 7.07 3.22 13.52 (4.06) (2.91) 8.82
CALABARZON (3.98) MIMAROPA 22.35
Region V 4.09 6.38 (2.32) 6.34 14.53 (2.22) (2.22) 0.65 25.28 6.19 Region VI (1.05) (5.39) (10.62) (4.15) (0.89) (6.94) 6.73 3.47 (2.64) (4.89) Region VII (6.90) 1.10 (2.06) 6.56 6.15 (1.67) 4.01 3.45 (4.95) 5.16 Region VIII (14.20) 16.99 (6.31) (0.94) 4.48 (2.98) 4.41 3.09 11.64 2.01 Region IX (6.96) (2.08) 6.30 (8.08) 1.67 (3.53) (10.23) 6.52 (4.11) 14.38 Region X 8.59 44.74 15.04 (13.55) 8.94 0.79 10.28 (3.11) 60.01 6.45 Region XI (6.08) (15.75) 30.12 29.75 10.38 28.35 11.32 15.23 (79.95) 3.91 Region XII 5.73 (13.14) (5.67) (2.84) 47.22 2.14 121.64 (49.25) 867.20 1.01 Caraga (16.71) (6.52) (53.03) 93.60 (1.13) 2.17 5.99 3.48 1.72 (9.47) ARMM 5.78 17.21 58.54 (44.03) 14.63 21.15 22.16 (8.60) 57.82 0.06
Philippines (1.93) 1.14 1.97 (4.06) 2.42 2.17 2.57 0.68 3.99 4.96 Source: BAS, DA
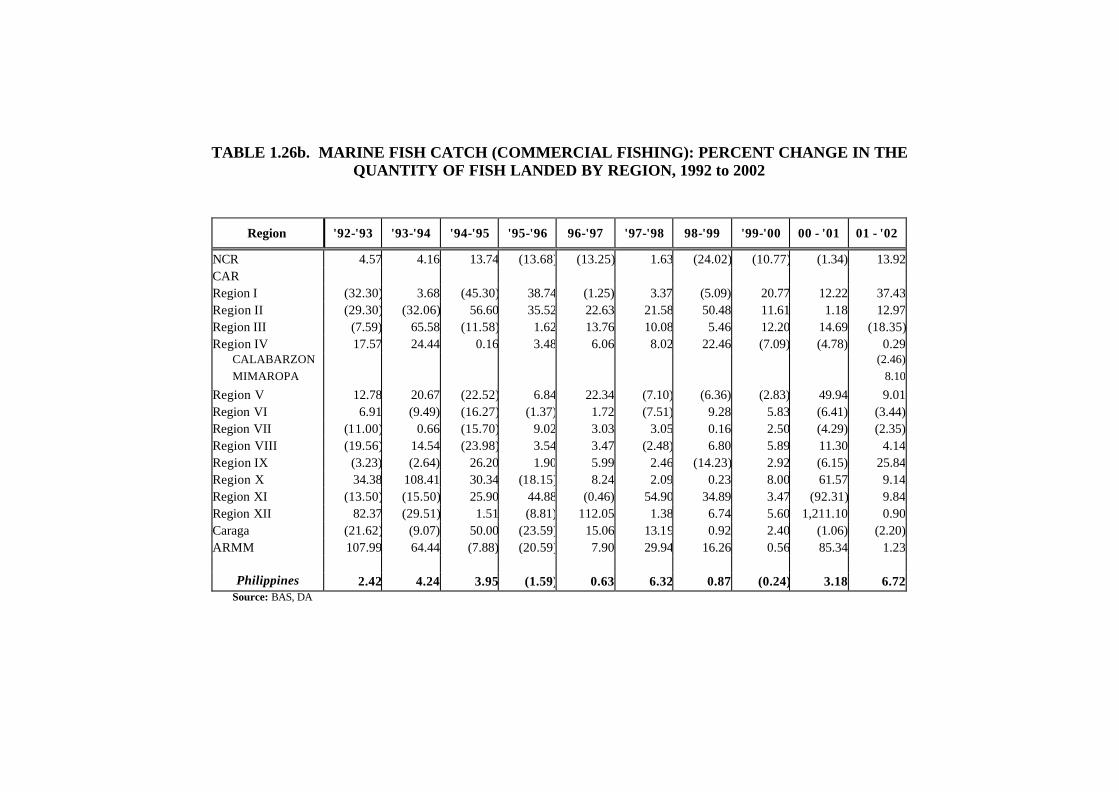
TABLE 1.26b. MARINE FISH CATCH (COMMERCIAL FISHING): PERCENT CHANGE IN THE QUANTITY OF FISH LANDED BY REGION, 1992 to 2002
Region '92-'93 '93-'94 '94-'95 '95-'96 96-'97 '97-'98 98-'99 '99-'00 00 - '01 01 - '02
NCR 4.57 4.16 13.74 (13.68) (13.25) 1.63 (24.02) (10.77) (1.34) 13.92 CAR Region I (32.30) 3.68 (45.30) 38.74 (1.25) 3.37 (5.09) 20.77 12.22 37.43 Region II (29.30) (32.06) 56.60 35.52 22.63 21.58 50.48 11.61 1.18 12.97 Region III (7.59) 65.58 (11.58) 1.62 13.76 10.08 5.46 12.20 14.69 (18.35)Region IV 17.57 24.44 0.16 3.48 6.06 8.02 22.46 (7.09) (4.78) 0.29
CALABARZON (2.46)MIMAROPA 8.10
Region V 12.78 20.67 (22.52) 6.84 22.34 (7.10) (6.36) (2.83) 49.94 9.01 Region VI 6.91 (9.49) (16.27) (1.37) 1.72 (7.51) 9.28 5.83 (6.41) (3.44)Region VII (11.00) 0.66 (15.70) 9.02 3.03 3.05 0.16 2.50 (4.29) (2.35)Region VIII (19.56) 14.54 (23.98) 3.54 3.47 (2.48) 6.80 5.89 11.30 4.14 Region IX (3.23) (2.64) 26.20 1.90 5.99 2.46 (14.23) 2.92 (6.15) 25.84 Region X 34.38 108.41 30.34 (18.15) 8.24 2.09 0.23 8.00 61.57 9.14 Region XI (13.50) (15.50) 25.90 44.88 (0.46) 54.90 34.89 3.47 (92.31) 9.84 Region XII 82.37 (29.51) 1.51 (8.81) 112.05 1.38 6.74 5.60 1,211.10 0.90 Caraga (21.62) (9.07) 50.00 (23.59) 15.06 13.19 0.92 2.40 (1.06) (2.20)ARMM 107.99 64.44 (7.88) (20.59) 7.90 29.94 16.26 0.56 85.34 1.23
Philippines 2.42 4.24 3.95 (1.59) 0.63 6.32 0.87 (0.24) 3.18 6.72 Source: BAS, DA

TABLE 1.26c. MARINE FISH CATCH (MARINE MUNICIPAL FISHING): PERCENT CHANGE IN THE QUANTITY OF FISH LANDED BY REGION, 1992 to 2002
Region '92-'93 '93-'94 '94-'95 '95-'96 96-'97 '97-'98 98-'99 '99-'00 00 - '01 01 - '02
NCR (19.02) (25.89) (16.47) (19.06) (3.71) 30.49 (9.75) (4.19) 4.62 (33.58)CAR Region I 0.31 0.06 (0.29) (8.45) 1.88 26.68 0.09 1.61 (5.52) 17.40 Region II 12.91 (40.76) 42.25 5.81 5.47 16.37 36.58 17.26 2.66 12.88 Region III (38.82) 14.10 (12.73) (31.32) 5.10 10.24 10.12 7.96 47.41 (8.77)Region IV 7.84 (1.61) (2.14) (6.47) 7.85 (0.38) 6.25 (1.22) (1.26) 16.07
CALABARZON (6.96)MIMAROPA 27.00
Region V 1.21 1.10 6.58 6.18 12.01 (0.51) (0.85) 1.73 17.97 5.13 Region VI (7.98) (1.23) (5.37) (6.43) (3.15) (6.43) 4.43 1.26 1.06 (6.21)Region VII 2.98 2.01 25.97 3.17 10.68 (8.04) 9.83 4.76 (5.84) 15.47 Region VIII (7.02) 19.82 13.26 (4.28) 5.28 (3.37) 2.50 0.75 11.94 0.16 Region IX (9.59) (1.66) (8.60) (18.40) (3.92) (12.06) (3.60) 11.83 (1.35) (0.44)Region X (1.74) 9.86 (0.86) (7.26) 9.78 (0.76) 22.56 (14.23) 58.05 2.99 Region XI 7.17 (16.10) 36.24 9.45 29.66 (7.87) (42.74) 78.82 (41.30) 1.48 Region XII (29.13) 6.01 (11.25) 2.48 (4.12) 3.48 318.79 (73.23) 273.76 1.65 Caraga (16.45) (6.39) (57.99) 113.77 (2.12) 1.38 6.40 3.57 1.93 (10.01)ARMM (19.59) (13.10) 139.22 (54.98) 20.17 14.64 27.12 (15.63) 32.64 (1.42)
Philippines (6.02) (2.04) (0.19) (6.88) 4.57 (2.62) 4.72 1.80 4.96 2.89 Source: BAS, DA

TABLE 1.26d. INLAND FISH CATCH (INLAND MUNICIPAL FISHING): PERCENT CHANGE IN THE QUANTITY OF FISH LANDED BY REGION, 1992 to 2002
Region '92-'93 '93-'94 '94-'95 '95-'96 96-'97 '97-'98 98-'99 '99-'00 00 - '01 01 - '02
NCR -- -- -- -- -- CAR (31.61) (6.44) (4.45) (16.10) 28.28 1.57 315.12 0.37 6.98 (5.22)Region I 284.89 71.96 (62.27) (10.34) (15.23) 1.11 (52.01) 4.58 51.64 87.36 Region II (19.78) (13.16) 29.95 1.26 (1.39) 1.87 (32.39) 16.68 30.15 12.41 Region III (59.63) 33.86 12.64 2.54 (10.98) 5.08 (52.19) 15.05 30.40 108.47 Region IV (14.68) 3.82 (11.33) (5.84) (14.06) (6.97) (6.29) 0.14 (16.51) (12.60)
CALABARZON (12.76)MIMAROPA 9.66
Region V (91.08) (20.04) (33.79) (5.76) 66.81 14.14 (10.32) 42.71 91.76 30.28 Region VI 1.17 36.41 (19.52) (16.67) (17.67) (27.27) (13.82) (3.14) 21.02 (11.18)Region VII 12.50 47.22 (39.62) 0.00 84.38 (5.08) (1.79) 5.45 43.10 32.53 Region VIII -- -- 400.00 -- 0.00 -- -- -- -- -- Region IX (76.43) (19.18) 94.62 (12.03) (47.13) 0.70 (10.76) 20.23 12.94 13.75 Region X (26.24) (44.23) (1.72) 70.18 (32.47) 52.67 335.00 1.03 (2.05) 40.19 Region XI 27.13 (16.42) 70.71 (0.84) 4.11 1.72 (85.66) 45.83 5.71 11.71 Region XII 264.71 (64.26) 15.46 0.12 95.60 (35.05) 191.06 10.85 (6.92) 1.03 Caraga 198.13 (41.21) 22.61 (3.08) (20.26) (32.16) (21.63) 3.99 7.44 11.82 ARMM 68.67 (27.10) (6.10) 6.02 6.14 (5.06) 21.95 18.20 (3.80) 2.87
Philippines (8.23) (2.39) (9.26) (4.68) (10.23) (8.31) 0.03 3.82 (10.37) (3.45)- No sample indication Source: BAS, DA

TABLE 1.26e. AQUACULTURE FISHING1/: PERCENT CHANGE IN THE QUANTITY OF FISH LANDED BY REGION, 1992 to 2002
Region '92-'93 '93-'94 '94-'95 '95-'96 96-'97 '97-'98 98-'99 '99-'00 00 - '01 01 - '02
NCR (3.68) 4.91 (15.36) (35.97) (13.83) 19.59 (75.14) (10.69) 23.05 240.42 CAR 233.44 (12.83) (21.88) (28.38) 17.24 (23.73) 153.33 (1.91) 9.80 0.25 Region I (15.15) (29.82) 51.95 (8.21) (20.37) 15.19 18.45 25.12 10.00 11.16 Region II (7.41) (29.04) (5.05) 0.97 30.44 (10.12) 25.24 24.54 44.44 6.81 Region III (2.20) 15.38 (3.56) (4.04) (0.49) (10.70) 4.70 19.35 36.81 (1.65)Region IV (30.87) 34.88 (34.36) 359.40 (0.14) (7.19) (2.82) 20.27 (0.66) 17.91
CALABARZON 0.83 MIMAROPA 28.67
Region V 0.10 (5.95) 683.29 (81.40) (9.31) (18.94) 4.62 13.60 55.94 1.00 Region VI 12.16 (11.21) 2.16 (1.41) (28.23) 11.55 16.50 13.73 7.87 5.07 Region VII (15.42) 13.20 77.40 95.38 (0.97) 0.29 5.64 3.08 61.34 7.07 Region VIII 23.93 (43.88) 328.13 (79.17) 1.49 8.52 4.24 5.63 54.87 24.59 Region IX 19.10 73.05 3.36 481.56 (4.15) 25.76 15.72 (5.76) (13.26) 2.94 Region X (66.69) 23.01 1.92 16.12 284.49 8.55 58.45 4.25 39.07 6.14 Region XI 36.19 (69.20) 141.55 8.21 (50.12) (31.20) 6.77 26.59 15.50 15.49 Region XII (9.41) 9.64 63.73 23.01 (43.69) 113.21 15.20 2.58 18.39 43.40 Caraga * (24.72) (10.63) 22.24 (12.40) (2.43) 263.83 45.96 21.08 36.42 ARMM ** 664.37 (17.29) 80.18 75.88 20,644.29 (0.35) (8.60) 7.28 9.45
Philippines (3.03) 0.41 35.31 31.86 (6.44) 58.69 5.09 4.98 10.86 9.65 1 Includes brackishwater, freshwater (fishhpen, fishcage and fishpond) marine (fishpen & fishcage) and
mariculture (oysters and mussels). * - Data included in Regions X and XI prior to the creation of Caraga Region ** - Data included in Regions IX and XII prior to the creation of ARMM Source: BAS, DA

TABLE 1.26f. AQUACULTURE FISHING (BRACKISHWATER FISHPOND): PERCENT CHANGE IN THE QUANTITY OF FISH LANDED BY REGION, 1992 to 2002
Region '92-'93 '93-'94 '94-'95 '95-'96 96-'97 '97-'98 98-'99 '99-'00 00 - '01 01 - '02
NCR 40.52 2.12 49.94 (26.51) (17.24) 19.75 (89.12) (11.59) 41.11 (21.73) CAR Region I (26.73) (3.52) 55.42 (7.21) (21.17) (16.47) 23.39 10.49 9.15 0.05 Region II (44.85) (12.00) 136.36 8.33 18.15 (6.68) 16.28 16.31 16.27 2.28 Region III (4.68) 29.23 (2.27) (7.32) (1.61) (7.42) 3.21 20.68 36.24 (10.75) Region IV (23.72) 7.81 (34.33) 19.11 (1.01) 40.76 (18.56) (0.33) 11.24 7.00
CALABARZON MIMAROPA
Region V (2.50) (33.95) (9.34) (19.22) 7.70 (4.51) 54.84 (3.02) 0.31 (3.52) Region VI 13.41 (14.16) (4.85) (12.72) (22.48) (8.65) 10.85 19.44 (5.86) (6.94) Region VII (16.40) 14.19 (17.96) 22.03 (19.26) (19.57) (4.95) (3.34) (1.59) 1.41 Region VIII 30.11 6.24 (8.00) (6.39) (19.88) 4.58 5.89 7.16 8.55 20.54 Region IX 18.87 79.51 (24.80) (3.23) (8.04) (18.90) 139.04 13.63 (17.45) (9.73) Region X (66.45) 27.87 2.91 10.34 334.63 7.20 9.45 4.14 9.60 (0.82) Region XI 0.65 (12.31) (3.38) 4.13 (63.78) (7.17) 9.77 12.20 24.33 1.94 Region XII (11.02) 8.90 69.26 14.30 (40.55) 69.09 8.83 (0.70) 6.49 (3.08) Caraga * (19.66) (9.06) 7.15 (20.45) (1.94) (12.00) 26.60 20.62 5.78 ARMM ** 758.67 (17.86) 79.96 79.62 (7.25) 56.05 (2.26) 8.93 8.01
Philippines (0.10) 4.14 (2.97) (4.99) (13.13) (3.43) 9.82 13.60 10.83 (5.69) * - Data included in Regions X and XI prior to the creation of Caraga Region ** - Data included in Regions IX and XII prior to the creation of ARMM Source: BAS, DA

TABLE 1.27. TOTAL FISH PRODUCTION BY REGION1/: CHANGE IN THE QUANTITY OF FISH LANDED BY REGION, 1992 to 2002 (in metric tons)
Region 92-93 93-94 94-95 95-96 96-97 97-98 98-99 99-00 00 - '01 01 - '02
NCR 8,154 8,265 31,166 (41,516) (32,485) 5,281 (54,878) (17,558) (1,472) 21,556 CAR 1,302 (278) (399) (431) 227 (272) 2,173 (39) 291 (54)Region I (4,204) (6,202) 6,088 (3,531) (5,160) 7,934 3,730 7,833 2,812 9,741 Region II (1,984) (5,824) 4,477 1,943 2,166 2,547 6,386 4,727 3,215 4,636 Region III (12,874) 20,668 (5,877) (6,986) 474 (9,018) 3,391 20,672 48,438 (3,022)Region IV (30,185) 43,185 (48,337) 166,442 (3,063) (16,744) 22,667 30,208 (27,341) 58,205
CALABARZON (16,013)MIMAROPA 74,218
Region V (1,606) 3,911 102,768 (92,679) 10,592 (5,980) (1,425) 3,118 35,449 7,996 Region VI 7,207 (26,982) (30,978) (12,997) (27,354) (11,198) 27,307 19,928 598 (7,668)Region VII (9,243) 2,700 8,956 30,015 5,656 (1,622) 6,895 5,302 26,986 11,538 Region VIII (7,966) 3,985 20,891 (26,671) 2,962 (1,395) 3,888 2,528 12,590 4,915 Region IX (23,659) 694 20,732 60,876 466 15,204 (10,764) 9,170 (30,345) 43,387 Region X (1,512) 10,358 4,940 (4,678) 9,495 1,118 10,041 (556) 29,121 5,654 Region XI 1,363 (27,859) 29,520 25,971 1,906 30,683 16,759 27,618 (154,389) 3,085 Region XII 6,343 (6,663) 2,368 1,207 4,570 3,076 28,346 (14,985) 149,912 7,650 Caraga (3,851) (9,721) (35,180) 30,369 (2,485) (430) 11,344 7,720 4,941 1,188 ARMM 10,090 4,895 35,239 (41,917) 9,543 372,426 18,392 (36,126) 72,392 33,969
Philippines (62,625) 15,132 146,374 85,417 (22,490) 391,610 94,252 69,560 177,420 198,554 1 - Includes Marine, Inland, and Aquaculture fish catch Source: BAS, DA

TABLE 1.28a. MARINE FISH CATCH (COMMERCIAL AND MARINE MUNICIPAL FISHING): CHANGE IN THE QUANTITY OF FISH LANDED BY REGION, 1992 to 2002 (in metric tons)
Region 92-93 93-94 94-95 95-96 96-97 97-98 98-99 99-00 00 - '01 01 - '02
NCR 8,492 7,839 32,563 (38,747) (31,803) 4,449 (51,061) (17,423) (1,732) 18,219 CAR Region I (1,107) 102 (1,203) (1,069) 304 4,794 (79) 749 (986) 4,700 Region II (721) (4,466) 3,477 1,865 1,661 2,706 7,401 3,503 534 3,680 Region III (6,431) 4,982 (2,436) (2,803) 1,469 1,644 1,322 1,990 6,009 (3,731)Region IV 22,947 17,179 (3,015) (5,903) 16,913 8,245 35,735 (12,183) (8,376) 24,642
CALABARZON (5,719)MIMAROPA 30,361
Region V 3,063 4,973 (1,925) 5,140 12,520 (2,194) (2,139) 613 24,014 7,366 Region VI (3,376) (17,185) (32,034) (11,199) (2,298) (17,788) 16,046 8,834 (6,957) (12,530)Region VII (6,972) 1,036 (1,958) 6,111 6,106 (1,758) 4,152 3,718 (5,519) 5,467 Region VIII (9,740) 9,995 (4,343) (609) 2,860 (1,988) 2,855 2,086 8,113 1,567 Region IX (24,029) (6,692) 19,839 (27,027) 5,135 (11,029) (30,869) 17,647 (11,867) 39,774 Region X 1,782 10,080 4,904 (5,083) 2,898 279 3,660 (1,223) 22,833 3,929 Region XI (4,879) (11,866) 19,118 24,577 11,128 33,541 17,190 25,752 (155,729) 1,526 Region XII 690 (1,674) (627) (296) 4,790 320 18,553 (16,648) 148,795 1,672 Caraga (14,597) (4,740) (36,066) 29,902 (697) 1,330 3,745 2,307 1,176 (6,605)ARMM 2,875 9,062 36,132 (43,079) 8,011 13,279 16,855 (7,987) 49,110 84
Philippines (32,003) 18,625 32,426 (68,220) 38,997 35,830 43,366 11,735 69,418 89,760 Source: BAS, DA

TABLE 1.28b. MARINE FISH CATCH (COMMERCIAL FISHING): CHANGE IN THE QUANTITY OF FISH LANDED BY REGION, 1992 to 2002 (in metric tons)
Region 92-93 93-94 94-95 95-96 96-97 97-98 98-99 99-00 00 - '01 01 - '02
NCR 10,210 9,733 33,456 (37,884) (31,667) 3,373 (50,612) (17,249) (1,916) 19,618 CAR Region I (1,166) 90 (1,148) 537 (24) 64 (100) 387 275 945 Region II (1,622) (1,255) 1,505 1,479 1,277 1,493 4,247 1,470 167 1,854 Region III (458) 3,655 (1,069) 132 1,141 951 567 1,336 1,805 (2,585)Region IV 11,987 19,606 158 3,477 6,267 8,803 26,617 (10,294) (6,441) 372
CALABARZON (2,336)MIMAROPA 2,708
Region V 2,384 4,348 (5,715) 1,345 4,695 (1,825) (1,519) (632) 10,853 2,935 Region VI 10,372 (15,233) (23,630) (1,668) 2,062 (9,160) 10,475 7,187 (8,366) (4,196)Region VII (7,855) 422 (10,051) 4,868 1,782 1,847 101 1,562 (2,748) (1,443)Region VIII (7,682) 4,592 (8,673) 974 989 (732) 1,955 1,809 3,672 1,499 Region IX (4,619) (3,657) 35,321 3,228 10,393 4,514 (26,787) 4,722 (10,216) 40,305 Region X 2,040 8,645 5,042 (3,932) 1,460 401 46 1,571 13,057 3,133 Region XI (6,943) (6,899) 9,739 21,246 (317) 37,478 36,894 4,948 (136,237) 1,117 Region XII 3,103 (2,027) 73 (433) 5,023 131 650 576 131,562 1,283 Caraga (949) (312) 1,564 (1,107) 540 544 43 113 (51) (105)ARMM 10,688 13,264 (2,668) (6,421) 1,957 8,000 5,644 225 34,638 922
Philippines 19,490 34,972 33,904 (14,159) 5,578 55,882 8,221 (2,269) 30,054 66,026 Source: BAS, DA

TABLE 1.28c. MARINE FISH CATCH (MARINE MUNICIPAL FISHING): CHANGE IN THE QUANTITY OF FISH LANDED BY REGION, 1992 to 2002 (in metric tons)
Region 92-93 93-94 94-95 95-96 96-97 97-98 98-99 99-00 00 - '01 01 - '02
NCR (1,718) (1,894) (893) (863) (136) 1,076 (449) (174) 184 (1,399)CAR Region I 59 12 (55) (1,606) 328 4,730 21 362 (1,261) 3,755 Region II 901 (3,211) 1,972 386 384 1,213 3,154 2,033 367 1,826 Region III (5,973) 1,327 (1,367) (2,935) 328 693 755 654 4,204 (1,146)Region IV 10,960 (2,427) (3,173) (9,380) 10,646 (558) 9,118 (1,889) (1,935) 24,270
CALABARZON (3,383)MIMAROPA 27,653
Region V 679 625 3,790 3,795 7,825 (369) (620) 1,245 13,161 4,431 Region VI (13,748) (1,952) (8,404) (9,531) (4,360) (8,628) 5,571 1,647 1,409 (8,334)Region VII 883 614 8,093 1,243 4,324 (3,605) 4,051 2,156 (2,771) 6,910 Region VIII (2,058) 5,403 4,330 (1,583) 1,871 (1,256) 900 277 4,441 68 Region IX (19,410) (3,035) (15,482) (30,255) (5,258) (15,543) (4,082) 12,925 (1,651) (531)Region X (258) 1,435 (138) (1,151) 1,438 (122) 3,614 (2,794) 9,776 796 Region XI 2,064 (4,967) 9,379 3,331 11,445 (3,937) (19,704) 20,804 (19,492) 409 Region XII (2,413) 353 (700) 137 (233) 189 17,903 (17,224) 17,233 389 Caraga (13,648) (4,428) (37,630) 31,009 (1,237) 786 3,702 2,194 1,227 (6,500)ARMM (7,813) (4,202) 38,800 (36,658) 6,054 5,279 11,211 (8,212) 14,472 (838)
Philippines (51,493) (16,347) (1,478) (54,061) 33,419 (20,052) 35,145 14,004 39,364 24,106 Source: BAS, DA

TABLE 1.28d. INLAND FISH CATCH (INLAND MUNICIPAL FISHING): CHANGE IN THE QUANTITY OF FISH LANDED BY REGION, 1992 to 2002 (in metric tons)
Region 92-93 93-94 94-95 95-96 96-97 97-98 98-99 99-00 00 - '01 01 - '02
NCR -- -- -- -- -- -- -- -- -- -- CAR (122) (17) (11) (38) 56 4 813 4 75 (60)Region I 1,621 1,576 (2,345) (147) (194) 12 (568) 24 283 726 Region II (1,042) (556) 1,099 60 (67) 89 (1,571) 547 1,154 618 Region III (4,288) 983 491 111 (493) 203 (2,191) 302 702 3,266 Region IV (27,736) 6,165 (18,962) (8,664) (19,646) (8,374) (7,024) 144 (17,305) (11,028)
CALABARZON (11,088)MIMAROPA 60
Region V (4,686) (92) (124) (14) 153 54 (45) 167 512 324 Region VI 35 1,106 (809) (556) (491) (624) (230) (45) 292 (188)Region VII 4 17 (21) 0 27 (3) (1) 3 25 27 Region VIII (871) 1 4 (1) 0 0 713 (1) (86) 181 Region IX (1,268) (75) 299 (74) (255) 2 (31) 52 40 48 Region X (74) (92) (2) 80 (63) 69 670 9 (18) 346 Region XI 143 (110) 396 (8) 39 17 (860) 66 12 26 Region XII 6,030 (5,339) 459 4 3,281 (2,353) 8,330 1,377 (974) 135 Caraga 6,235 (3,866) 1,247 (208) (1,328) (1,681) (767) 111 215 367 ARMM 7,128 (4,745) (778) 721 780 (683) 2,810 2,842 (701) 509
Philippines (18,898) (5,044) (19,057) (8,734) (18,201) (13,268) 48 5,602 (15,774) (4,703)-- - No sample indication Source: BAS, DA
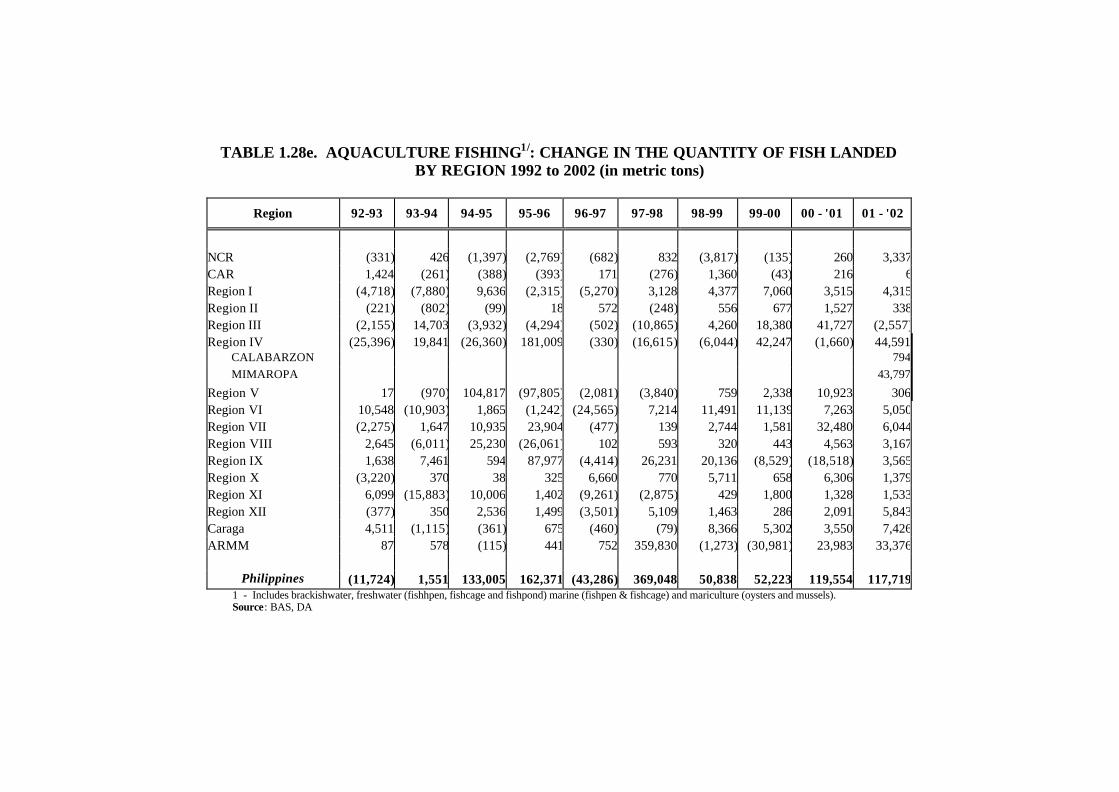
TABLE 1.28e. AQUACULTURE FISHING1/: CHANGE IN THE QUANTITY OF FISH LANDED BY REGION 1992 to 2002 (in metric tons)
Region 92-93 93-94 94-95 95-96 96-97 97-98 98-99 99-00 00 - '01 01 - '02
NCR (331) 426 (1,397) (2,769) (682) 832 (3,817) (135) 260 3,337 CAR 1,424 (261) (388) (393) 171 (276) 1,360 (43) 216 6 Region I (4,718) (7,880) 9,636 (2,315) (5,270) 3,128 4,377 7,060 3,515 4,315 Region II (221) (802) (99) 18 572 (248) 556 677 1,527 338 Region III (2,155) 14,703 (3,932) (4,294) (502) (10,865) 4,260 18,380 41,727 (2,557)Region IV (25,396) 19,841 (26,360) 181,009 (330) (16,615) (6,044) 42,247 (1,660) 44,591
CALABARZON 794 MIMAROPA 43,797
Region V 17 (970) 104,817 (97,805) (2,081) (3,840) 759 2,338 10,923 306 Region VI 10,548 (10,903) 1,865 (1,242) (24,565) 7,214 11,491 11,139 7,263 5,050 Region VII (2,275) 1,647 10,935 23,904 (477) 139 2,744 1,581 32,480 6,044 Region VIII 2,645 (6,011) 25,230 (26,061) 102 593 320 443 4,563 3,167 Region IX 1,638 7,461 594 87,977 (4,414) 26,231 20,136 (8,529) (18,518) 3,565 Region X (3,220) 370 38 325 6,660 770 5,711 658 6,306 1,379 Region XI 6,099 (15,883) 10,006 1,402 (9,261) (2,875) 429 1,800 1,328 1,533 Region XII (377) 350 2,536 1,499 (3,501) 5,109 1,463 286 2,091 5,843 Caraga 4,511 (1,115) (361) 675 (460) (79) 8,366 5,302 3,550 7,426 ARMM 87 578 (115) 441 752 359,830 (1,273) (30,981) 23,983 33,376
Philippines (11,724) 1,551 133,005 162,371 (43,286) 369,048 50,838 52,223 119,554 117,719 1 - Includes brackishwater, freshwater (fishhpen, fishcage and fishpond) marine (fishpen & fishcage) and mariculture (oysters and mussels). Source: BAS, DA

TABLE 1.29a. WILDLIFE SPECIES PROTECTED: LISTED UNDER CITES APPENDIX I AND WHOSE COMMERCIAL EXPORT/TRADE ARE STRICTLY PROHIBITED
1992 to 2002 (number of species)
Wildlife Species 1992 1993 1994 1995 1996 1997 1998 1999 2000 2001 2002
Mamalia 4 9 11 11 11 11 11 12 10 10 8Aves 13 13 10 10 10 10 10 10 10 10 9Reptilia 6 6 7 7 7 7 7 7 7 7 6Insecta 1 1 1 1Pisces 2 2 2 2 2 2 Flora 4 4 2 2 1 1 1
Total 29 34 30 30 30 30 30 32 29 29 25Source: PAWB, DENR and BFAR, DA
TABLE 1.29b. WILDLIFE SPECIES PROTECTED: LISTED UNDER CITES APPENDIX II AND WHOSE COMMERCIAL EXPORT/TRADE ARE STRICTLY REGULATED
1992 to 2002 (number of species)
Wildlife Species 1992 1993 1994 1995 1996 1997 1998 1999 2000 2001 2002
Mamalia 19 32 27 27 27 27 27 36 36 36 27 Aves 66 66 63 63 63 63 62 65 65 65 67 Reptilia 3 3 5 5 5 5 5 5 5 6 13 Insecta 3 3 3 3 Pisces 2 2 2 2 2 2 Mollusca 7 7 7 7 7 7 7 7 7 7 Flora 11 11 13 15 15 15 15
Total 108 121 104 104 104 104 114 131 131 125 132Source: PAWB, DENR and BFAR, DA

TABLE 1.30: LIST OF FLORA AND FAUNA FOR PRIORITY PROTECTION BASED ON IUCN RED LIST OF THREATENED SPECIES AND CITES (as of year 2002)
FLORA
ORDER FAMILY COMMON NAME SCIENTIFIC NAME CONSERVATION STATUS
CYCADOPSIDA Cycadaceae Arayat Pitogo Cycas chambelainii IUCN (V) (Cycads) CITES (II)
Culion Pitogo Cycas wadei IUCN (E), CITES (II) LYCOPODIOPSIDA
(Fern Allies) Lycopodiaceae Lycopodium halconense IUCN (R) Selaginellaceae Selaginella atimonanense IUCN (R) Selaginella pricei IUCN (R) PTEROPSIDA
(True ferns) Adiantaceae Adiantum mindanaense Cyatheaceae Cyathea acuminata IUCN (V), CITES (II) Notong Cyathea apoensis CITES (I) Cyathea christii IUCN (R) Cyathea cinerea IUCN (R) Pakong-Buwaya Cyathea curanii IUCN (R) Cyathea edanoi IUCN (R) Cyathea ferruginea IUCN (R) Cyathea halconensis IUCN (R) Cyathea. latipinnula IUCN (R) Cyathea microchlamys IUCN (R) Cyathea masapilidensis IUCN (R) Cyathea Negrosiana IUCN (R) Cyathea Obliqua IUCN (V) Cyathea robinsonii IUCN (R) Cyathea Rufopannosa IUCN (R) Cyathea Setulosa IUCN (R) Cyathea Zamboanga IUCN (R), CITES (II)

TABLE 1.30 (continued)….
ORDER FAMILY COMMON NAME SCIENTIFIC NAME CONSERVATION STATUS
Dryopteridaceae Ctenitis dubia IUCN (R) Ctenitis mearsii IUCN (E) Ctenitis paleolata IUCN (EX) Tectaridium primitivum IUCN (R) Dicksoniaceae Cibotium cumingii CITES (I) Gramitidaceae Grammitis torricelliana IUCN (R) Grammitis Alepidota IUCN (R) Grammitis Merrillii IUCN (R) Lomariopsidaceae Edanyoa difformis IUCN (R) Elaphoglosum Calanasanicum IUCN (R) Elaphoglosum Negrosensis IUCN (R) Polypodiaceae Giant Staghorn Fern Platycerium grande IUCN (EX) Thayeria cornucopia IUCN (R) Thelypteridaceae Chingia pricei IUCN (R) Chingia urens IUCN (R) Haplodictyum bulusanicum IUCN (R) PINOPSIDA (Conifers) Araucariaceae Almaciga Agathis philippinensis IUCN (VU) Pinaceae Mindoro pine Pinus merkusii IUCN (VU) Podocarpaceae Podocarpus costalis IUCN (EN) Podocarpus lophatus IUCN (VU) Falcatifolium gruezoi IUCN (R) Igem-dagat Podocarpus costalis IUCN (V) Podocarpus lophatus IUCN (V) Podocarpus rotundus MAGNOLIOPSIDA (Dicots) Acanthaceae Gymnostachyum pictum CITES (I) Hallieracantha addisoniensis CITES (I) Hallieracantha aequifolia CITES (I)

TABLE 1.30. (continued)….
ORDER FAMILY COMMON NAME SCIENTIFIC NAME CONSERVATION STATUS
Hallieracantha elmeri CITES (I) Hallieracantha pulgarensis CITES (I) Hypoestes merrillii CITES (I) Hypoestes palawanensis CITES (I) Lepidagathis amaranthoides CITES (I) L. palawanensis CITES (I) Pseuderanthemum minutiflorum CITES (I) Ruellia nudispica CITES (I) Ruella philippinensis CITES (I) Strobilanthes palawanensis CITES (I) Alangiaceae Malatapai Alangium longiflorum IUCN (VU) Anacardiaceae Malapaho Mangifera monandra IUCN (EN) Ligas – ilanan Semecarpus paucinervis CITES (VU) Annonaceae Artabotrys vidaliana CITES (I) Buntotan Desmos palawanensis CITES (I) Saccopetalum arboreum CITES (I) Ulvaria nudistellata CITES (I) Dasymaschalon scandens IUCN (VU) Lanutan - buntotan Mitrephora caudata IUCN (VU) Lanutan - banguhan Mitrephora fragrans IUCN (VU) Lanutan Mitrephora lanota IUCN (VU) Orophea palawanensis IUCN (VU) Mapatak Orophea submaculata IUCN (VU) Bangar Polyalthia elmeri IUCN (VU) Palawan lanutan Polyalthia palawanensis IUCN (VU) Apocynaceae Elmer pasnit Kibatalia elmeri IUCN (VU) Laneteng - gubat Kibatalia gitingensis IUCN (VU) Malapasnit Kibatalia longifolia IUCN (CR) Mcgregore pasnit Kibatalia macgregorii IUCN (VU) Merril pasnit Kibatalia merrilliana IUCN (VU)

TABLE 1.30. (continued)….
ORDER FAMILY COMMON NAME SCIENTIFIC NAME CONSERVATION STATUS
Paslit - mobolo Kibatalia puberula IUCN (EN) Paslit kitid Kibatalia stenopetala IUCN (EN) Sakang-manok Tabernaemontana cordata IUCN (VU) Urceola laevis CITES (I) lanite Wrightia pubescens IUCN (V) Aquifoliaceae Palawan - kalasan Ilex palawanica IUCN (VU) Araliaceae Schefflera foxworthyi CITES (I) Higin Arthrophyllum pulgarense IUCN (VU) Schefflera agamea IUCN (EN) Schefflera albido - bracteata IUCN (EN) Schefflera curannii IUCN (EN) Schefflera palawanensis IUCN (EN) Begoniaceae Begonia palawanensis CITES (I) Begonia woodii CITES (I) Boraginaceae Coldenia procumbens CITES (I) Burseraceae Piling - liitan Canarium lozunicum IUCN (VU) Pili Canarium Ovatum IUCN (VU) Mangarub Protium connarifolium IUCN (VU) Celastraceae Glyptopetalum palawanense IUCN (VU) Salacia cymosa CITES (I) Salacia marginata CITES (I) Clethraceae Tagobahi Clethra pulgarensis IUCN (V) Combretaceae Sakat Terminalia nitens IUCN (VU) Dalinsi Terminlia pellucida IUCN (VU) Connaraceae Connarus culionensis var. stellatus CITES (I) Connarus culionensis var. culiones CITES (I) Dilleniaceae Katmon Dillenia fischeri IUCN (VU) Malakatmon Dillenia luzoniensis IUCN (VU) Katmon-bayani Dillenia megalantha IUCN (VU) Katmon Dillenia philippinensis IUCN (VU)

TABLE 1.30. (continued)….
ORDER FAMILY COMMON NAME SCIENTIFIC NAME CONSERVATION STATUS
Katmon – kalabau Dillenia reifferscheidtia IUCN (VU) Dipterocarpaceae Mindanao palosapis (= Balingan) Anisoptera costata IUCN (EN) Palosapis Anisoptera thurifera ssp. Thurifera IUCN (CR) Diptericarpus alatus IUCN (EN) Leaf - tailed panau Diptericarpus caudatus ssp. Caudatus IUCN (CR) Dipterocarpus eurynchus IUCN (CR) Panau Dipterocarpus gracilis IUCN (CR) Apitong Dipterocarpus grandiflorus IUCN (CR) Hasselt panau (=Palawan panau) Dipterocarpus hasseltii IUCN (CR) Malapanau Dipterocarpus kerrii IUCN (CR) Broad-winged apitong Dipterocarpus kunstleri IUCN (CR) Hagakgak Dipterocarpus validus IUCN (CR) Manggachapui (=Dalingdingan) Hopea acuminata IUCN (CR) Basilan Yakal Hopea basilanica IUCN (CR) Mindanao narek Hopea brachytera IUCN (CR) Narek Hopea cagayanensis IUCN (CR) Dalingdingan Hopea foxworthyi IUCN (VU) Yakal - kaliot Hopea malibato IUCN (CR) Yakal - magasusu Hopea mendanensis IUCN (CR) Gisok-gisok Hopea philippinensis IUCN (CR) Yakal-saplungan Hopea plagata IUCN (CR) Quisumbing gisok Hopea quisumbingiana IUCN (CR) Samar gisok Hopea samarensis IUCN (CR) Bagtikan Parashorea malaaanon IUCN (CR) Almon Shorea almon IUCN (CR) Manggasinoro Shorea assamica ssp. Globifera IUCN (CR) Manggasinorong-tilos Shorea assamica koordersii IUCN (VU) Manggasinoro Shorea assamica ssp. philippinensis IUCN (CR) Yakal Shorea astylosa IUCN (CR)

TABLE 1.30 (continued)….
ORDER FAMILY COMMON NAME SCIENTIFIC NAME CONSERVATION STATUS
White lauan Shorea contorta IUCN (CR) Shorea falciferoides IUCN (CR) Yakal-yamban Shorea falciferoides ssp.falciferoides IUCN (CR) Guijo Shorea guiso IUCN (CR) Kalunti Shorea hopeifolia IUCN (CR) Yakal - malibato Shorea malibato IUCN (CR) Red lauan Shorea negrosensis IUCN (CR) Tiaong Shorea ovata IUCN (EN) Mayapis Shorea palosapis IUCN (CR) Malaanonang Shorea polita IUCN (V) Tanguile Shorea polysperma IUCN (CR) Malayakal Shorea seminis IUCN (CR) Kaladis narig Vatica elliptica IUCN (CR) Narig Vatica mangachapoi IUCN (EN) Narig-laot Vatica maritima IUCN (EN) Mindanao narig Vatica odorata ssp. Mindanensis IUCN (EN) Thick -leafed Narig Vatica pachyphylla IUCN (CR) Ebenaceae Diospyros blancoi IUCN (VU) Kamagong Diospyros philippinensis IUCN (EN) Apunan Diospyros pulgarensis IUCN (VU) Elaeocarpaceae Kurakatul Elaeocarpus calomala var. pustulatus IUCN (VU)
Hunggong-mabolo Elaeocarpus calomala var. villosiusculus
IUCN (DD)
Dinagat -konakon Elaeocarpus dinagatensis IUCN (VU)
Nabol Elaeocarpus gigantifolius ssp. Fusicarpus
IUCN (VU)
Nabol - tilos Elaeocarpus submonoceras ssp. Fusicarpus
IUCN (VU)
Pagapos Elaeocarpus submonoceras spp. Oliganthus
IUCN (CR)
Tabung - hangin Elaeocarpus submonoceras ssp. Procerus
IUCN (VU)
Ericaceae Bantigi Rhododendron taxifolium IUCN (R)

TABLE 1.30. (continued)….
ORDER FAMILY COMMON NAME SCIENTIFIC NAME CONSERVATION STATUS
Vaccinium palawanensis CITES (I) Euphorbiaceae Aniam Antidesma obliquinervium IUCN (VU) Aniam - Gubat Antidesma subolivaceum IUCN (VU) Apnong - tilos Aporusa elliptifolia IUCN (VU) Dilak-linis Baccaurea glabrifolia IUCN (VU) Dilak-banguhan Baccaurea odoratissima IUCN (VU) Tombong - uak Drypetes palawanensis IUCN (VU) Glochidion cenabrei CITES (I) Glochidion dolichostylum CITES (I) Glochidion palawanense CITES (I) Glochidion pulgarense CITES (I) Hamindang Macaranga bicolor IUCN (VU) Daha Macaranga caudatifolia IUCN (VU) Amublit Macaranga cogostiflora IUCN (VU) Takip - asin Macaranga grandifolia IUCN (VU) Somau Mallotus odoratus IUCN (VU) Phyllanthus glochidioides CITES (I) Baguilumbang Reutealis trisperma IUCN (VU) Balakat - gubat Sapium luzonicum IUCN (VU) Anislag Securinega flexuosa IUCN (VU) Fagaceae Mangasiriki Lithocarpus ovalis IUCN (VU) Flacourtiaceae Xylosma palawanense IUCN (VU) Gesneriaceae Cyrtandra elastostemmoides CITES (I) Cyrtandra inaequifolia CITES (I) Cyrtandra livida CITES (I) Cyrtandra rupicola CITES (I) Dichrotrichum biflorum CITES (I) Dichrotrichum pauciflorum CITES (I) Guttifereae Calophyllum laticostatum IUCN (DD) Calophyllum pulgarense CITES (I)

TABLE 1.30 (continued)….
ORDER FAMILY COMMON NAME SCIENTIFIC NAME CONSERVATION STATUS
Garcinia sulphurea CITES (I) Hammalidaceae Paningit Embolanthera spicata IUCN (VU) Laureaceae Kalingag Cinnamomum mercadoi IUCN (VU) Cinnamomum parthenoxylon IUCN (DD) Bulingog Cryptocarya elliptifolia IUCN (CR) Paren Cryptocarya palawanensis IUCN (EN) Batikuling Litsea leytensis IUCN (VU) Puso - puso Neolitsea vidalii IUCN (VU) Persea philippinensis IUCN (VU) Beilschmiedia nigrifolia CITES (I) Mindanao Cinnamon Cinnamomum mindanaense IUCN (V) Margapali Dehaasa triandra Litsea cinerea CITES (I) Patugao Neolitsea incana CITES (I) Leeaceae Leea philipinensis IUCN (V) Liguminosae Tanglin Adenanthera intermedia IUCN (VU) Tindalo Afzelia rhomboidea IUCN (VU) Leguminosae Malaipil Intsia acuminata IUCN (VU) Butad Parkia harbesonii IUCN (VU) Narra Pterocarpus indicus IUCN (VU) Kayugalu Sindora inermis IUCN (VU) Supa Sindora supa IUCN (VU) Kunstleria altroviolacea CITES (I) Millettia foxworthyi CITES (I) Parkia harbesonii CITES (I) Phanera semibifida CITES (I) Pueraria tetragona CITES (I) Akle Serialbizzia acle IUCN (V) Jade vine Strongylodon macrobotrys IUCN (V) Loganiaceae Strychnos oleifolia CITES (I)
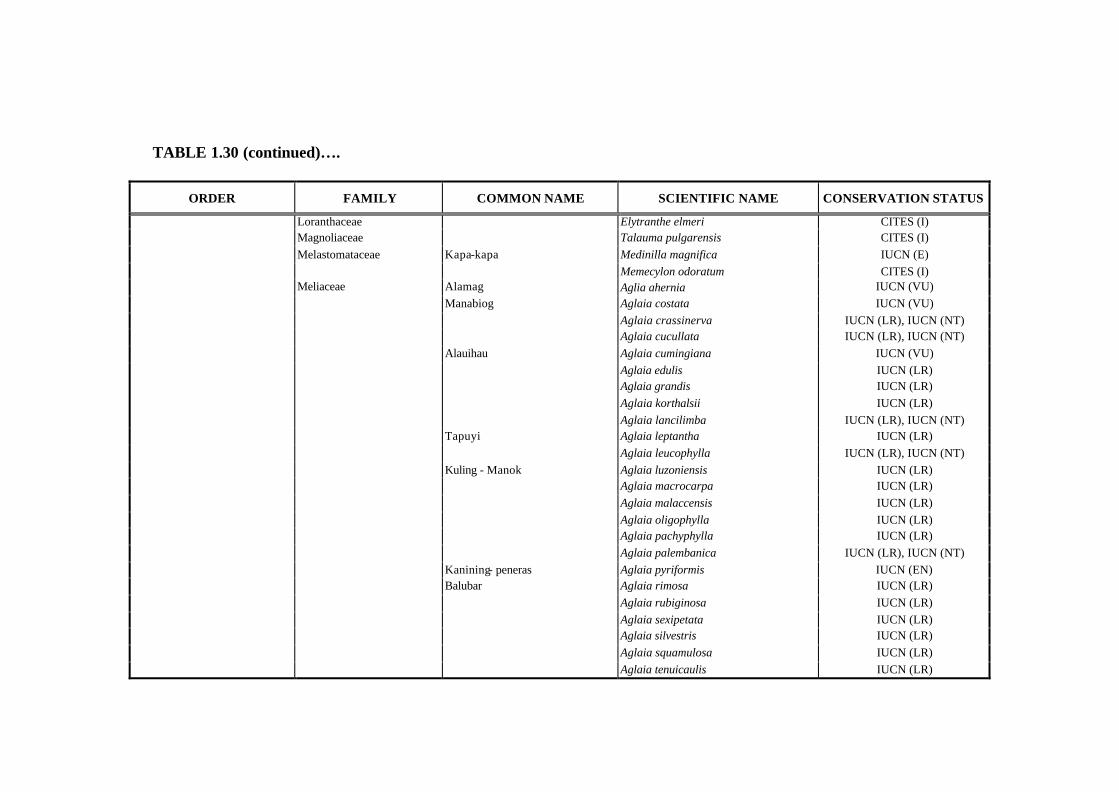
TABLE 1.30 (continued)….
ORDER FAMILY COMMON NAME SCIENTIFIC NAME CONSERVATION STATUS
Loranthaceae Elytranthe elmeri CITES (I) Magnoliaceae Talauma pulgarensis CITES (I) Melastomataceae Kapa-kapa Medinilla magnifica IUCN (E) Memecylon odoratum CITES (I) Meliaceae Alamag Aglia ahernia IUCN (VU) Manabiog Aglaia costata IUCN (VU) Aglaia crassinerva IUCN (LR), IUCN (NT) Aglaia cucullata IUCN (LR), IUCN (NT) Alauihau Aglaia cumingiana IUCN (VU) Aglaia edulis IUCN (LR) Aglaia grandis IUCN (LR) Aglaia korthalsii IUCN (LR) Aglaia lancilimba IUCN (LR), IUCN (NT) Tapuyi Aglaia leptantha IUCN (LR) Aglaia leucophylla IUCN (LR), IUCN (NT) Kuling - Manok Aglaia luzoniensis IUCN (LR) Aglaia macrocarpa IUCN (LR) Aglaia malaccensis IUCN (LR) Aglaia oligophylla IUCN (LR) Aglaia pachyphylla IUCN (LR) Aglaia palembanica IUCN (LR), IUCN (NT) Kanining- peneras Aglaia pyriformis IUCN (EN) Balubar Aglaia rimosa IUCN (LR) Aglaia rubiginosa IUCN (LR) Aglaia sexipetata IUCN (LR) Aglaia silvestris IUCN (LR) Aglaia squamulosa IUCN (LR) Aglaia tenuicaulis IUCN (LR)

TABLE 1.30. (continued)….
ORDER FAMILY COMMON NAME SCIENTIFIC NAME CONSERVATION STATUS Aglaia teysmanniana IUCN (LR), IUCN (NT) Salakin Aphanamixis cumingiana IUCN (VU) Dysoxylum angustifolium IUCN (VU) Paluahan Dysoxylum palawanensis IUCN (VU) Kayatau Dysoxylum turczaninowii IUCN (VU) Malasantol Sandoricum vidallii IUCN (VU) Kalantas Toona calantas IUCN (DD) Alamag Aglaia angustifolia IUCN (VU) Aglaia costata IUCN (VU) Ilo-ilo Aglaia iloilo IUCN (V) Halupait-dagat Munronia palawanensis CITES (I) Moraceae Antipolo Artocarpus blancoi IUCN (VU) Kululot Artocarpus rubrovenus IUCN (VU) Pakak Artocarpus treculianus IUCN (VU) Isis Ficus ulmifolia IUCN (VU) Niyog-niyogan Ficus pseudopalma IUCN (V) Myristicaceae Tapol Horsfieldia andisiifolia IUCN (VU) Yabnob-linis Horsfieldia obscurineria IUCN (EN) Horsfieldia samarensis IUCN (VU) Alvarez tambalau Knema alvarezii IUCN (VU) Duhao Knema latericia ssp. Latericia IUCN (VU) Knema ridsdaleana IUCN (VU) Libago Knema stenocarpa IUCN (VU) Agusan - duguan Myristica agusanensis ssp. squamulosa IUCN (VU) Myristica basilanica IUCN (VU) Myristica colinridsdalei IUCN (VU) Myristica frugifera IUCN (VU) Myristica laevis ssp. badia IUCN (VU) Myristica laevis ssp. laevis IUCN (VU)
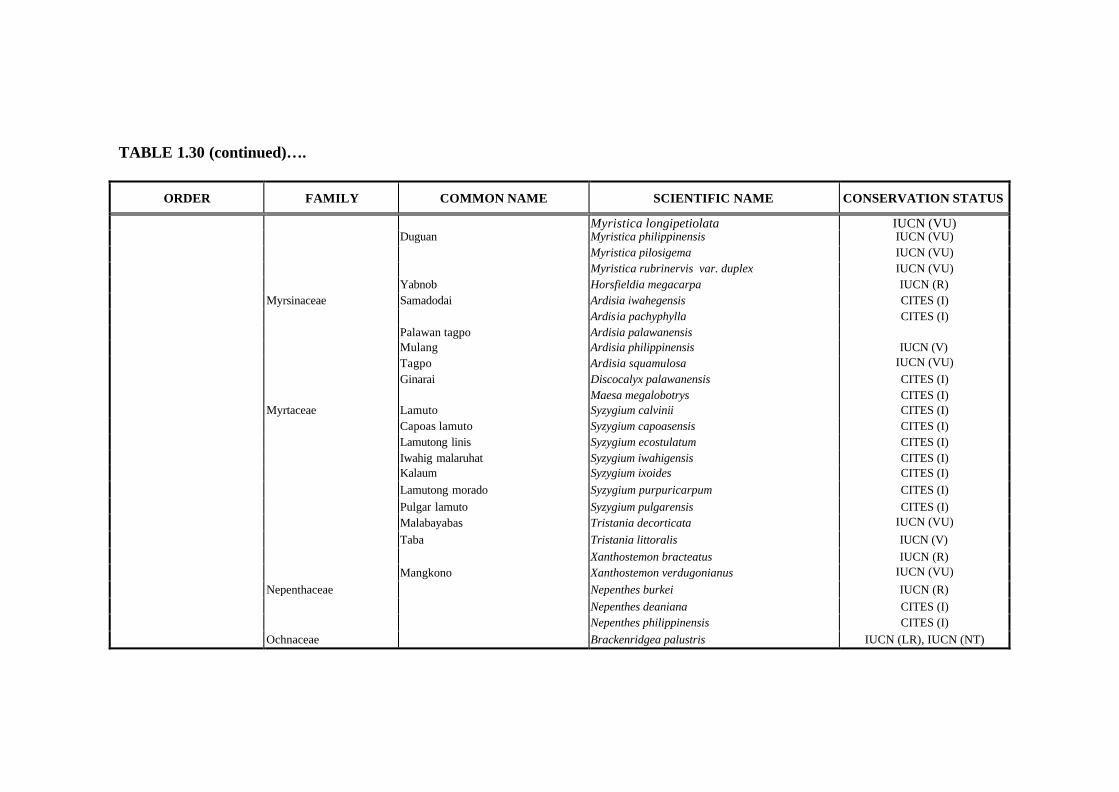
TABLE 1.30 (continued)….
ORDER FAMILY COMMON NAME SCIENTIFIC NAME CONSERVATION STATUS
Myristica longipetiolata IUCN (VU) Duguan Myristica philippinensis IUCN (VU) Myristica pilosigema IUCN (VU) Myristica rubrinervis var. duplex IUCN (VU) Yabnob Horsfieldia megacarpa IUCN (R) Myrsinaceae Samadodai Ardisia iwahegensis CITES (I) Ardisia pachyphylla CITES (I) Palawan tagpo Ardisia palawanensis Mulang Ardisia philippinensis IUCN (V) Tagpo Ardisia squamulosa IUCN (VU) Ginarai Discocalyx palawanensis CITES (I) Maesa megalobotrys CITES (I) Myrtaceae Lamuto Syzygium calvinii CITES (I) Capoas lamuto Syzygium capoasensis CITES (I) Lamutong linis Syzygium ecostulatum CITES (I) Iwahig malaruhat Syzygium iwahigensis CITES (I) Kalaum Syzygium ixoides CITES (I) Lamutong morado Syzygium purpuricarpum CITES (I) Pulgar lamuto Syzygium pulgarensis CITES (I) Malabayabas Tristania decorticata IUCN (VU) Taba Tristania littoralis IUCN (V) Xanthostemon bracteatus IUCN (R) Mangkono Xanthostemon verdugonianus IUCN (VU) Nepenthaceae Nepenthes burkei IUCN (R) Nepenthes deaniana CITES (I) Nepenthes philippinensis CITES (I) Ochnaceae Brackenridgea palustris IUCN (LR), IUCN (NT)

TABLE 1.30. (continued)….
ORDER FAMILY COMMON NAME SCIENTIFIC NAME CONSERVATION STATUS
Brackenridgea palustris ssp. foxworthyi CITES (I) Oleaceae Karakaan Linociera ramiflora CITES (DD) Piperaceae Piper palawanum CITES (I) Polygalaceae Securidaca atro-violacea CITES (I) Rafflesiaceae Malabo Rafflesia manillana IUCN (E) Rhamnaceae Ventilago palawanensis CITES (I) Lumuluas Ziziphus hutchinsonii IUCN (VU) Ziziphus palawanensis CITES (I) Balakat Ziziphus talanai IUCN (VU) Rosaceae Prunus clementis IUCN (LR) Prunus grisea var. tomentosa IUCN (VU) Prunus kinabalunensis IUCN (RR) Prunus pulgarensis IUCN (EN) Prunus rubiginosa IUCN (EN) Prunus subglabra IUCN (VU) Rubiaceae Badusa palawanensis CITES (I) Lumangog Antirhoea livida CITES (I) Hedyotis perhispida CITES (I) Opeg Ixora intermedia CITES (I) Ixora palawanensis CITES (I) Mussaenda grandifolia CITES (I) Malabuyon Mussaenda palawanensis CITES (I) Ophiorrhiza pulgarense CITES (I) Pavetta phanerophlebia CITES (I) Psychotria balabacensis CITES (I) Psychotria iwahigensis CITES (I) Psychotria repens CITES (I) Bunkol kalauang Timonius ferrugineus CITES (I) Bunkol Timonius palawanensis CITES (I) Urophyllum elliptifolium CITES (I)

TABLE 1.30. (continued)….
ORDER FAMILY COMMON NAME SCIENTIFIC NAME CONSERVATION STATUS
Rutaceae Clausena grandiflora CITES (I) Evodia arborea CITES (I) Evodia pulgarensis CITES (I) Salai Zantophyllum integrifoliulom IUCN (DD) Santalaceae Exocarpus rolfeenus CITES (I) Sandal wood Santalum album IUCN (VU) Sapindaceae Tamaho Gloeocarpus patentivalis IUCN (EN) Kasau-kasau Gongrospermum philippinense IUCN (CR) Pasi Guioa acuminata IUCN (EN) Kaningning Guioa bicolor IUCN (VU) Alahan - puti Guioa discolor IUCN (EN) Ulas Guioa myriadenia IUCN (EN) Guioa palawanica IUCN (CR) Angset Guioa parvifolia IUCN (CR) Alahan-sinima Guioa reticulata IUCN (CR) uyos Guioa truncata IUCN (EN) Mamoko Hedyachras philippinensis IUCN (V) Palawan sarakag Lepisanthes palawanica CITES (I) Ringis Mischocarpus endotrichus CITES (I) Sapotaceae betis Madhuca betis IUCN (VU) Malabatis Madhuca oblongifolia IUCN (VU) pianga Madhuca obovatifolia IUCN (VU) Red nato/nato Palaquium luzoniense IUCN (VU) Pinulog Palaquium mindanaense IUCN (VU) Malak-malak Palaquium philippense IUCN (VU) Villamil nato Pouteria villamillii IUCN (VU) Theaceae Schima wallichi ssp. crenata CITES (I) Schima wallichi var. pulgarensis IUCN (VU) Camellia megacarpa CITES (I)

TABLE 1.30. (continued)….
ORDER FAMILY COMMON NAME SCIENTIFIC NAME CONSERVATION STATUS
Tiliaceae Balobo Diplodiscus paniculatus IUCN (VU) Bagun Grewia palawanensis CITES (I) Ulmaceae magabuyo Celtis luzonica IUCN (VU) Urticaceae Elatostema palawanensis CITES (I) Verbenaceae Callicarpa rivularis CITES (I) Philippine Teak/bunglas Tectona philippinensis IUCN (EN) Molave Vitex parviflora IUCN (VU) LILIOPSIDA (Monocots) Araceae Sander's alocasia Alocasia sanderiana IUCN (VU) Alocasia siuata CITES (I) Alocasia zebrina IUCN (VU) Homalomena palawanensis CITES (I) Homalomena elmeri CITES (I) Rhaphidophora palawanensis CITES (I) Dioscoreaceae Dioscorea palawana CITES (I) Graminae Ischaemum glaucescens CITES (I) Schizostachyum palawanense CITES (I) Orchidaceae Bulbophyllum stramineum CITES (I), CITES (II) Dendrobium lumatum CITES (I), CITES (II) Dendrochilum palawanense CITES (I), CITES (II) Eria palawanensis CITES (I), CITES (II) Eria curanii CITES (I), CITES (II) Paphiopedilum philippinense CITES (I), CITES (II) Paphiopedilum philippinense Var. roebelenii CITES (I), CITES (II) Paphiopedilum randsii CITES (I), CITES (II) Phalaenopsis schileriana IUCN (V), CITES (II) Phalaenopsis stuartiana IUCN (V), CITES (II) Sarcanthus malleifer CITES (I), CITES (II) Vanda Sanderiana IUCN (V), CITES (II) Vanilla calopogon IUCN (V), CITES (II)

TABLE 1.30. (continued)….
ORDER FAMILY COMMON NAME SCIENTIFIC NAME CONSERVATION STATUS
Liparis palawanensis CITES (I), CITES (II) Palmae Adonidia merrillii IUCN (LR), IUCN (NT) Biliran - buri Corypha microclada IUCN (VU) Areca camariensis IUCN (R) Areca catechu Var. batanensis CITES (I) Areca catechu Var. silvatica CITES (I) Bungang-tadiang Areca costulata CITES (I) Pisa Areca hutchinsonia IUCN (LR), IUCN (NT) Bungang - ipod Areca ipot IUCN (VU), IUCN (NT) Bungang - lakihan Areca macrocarpa IUCN (VU) Boga Areca mammillata CITES (I) Takobtob Areca parens IUCN (DD) Bungang - gubat Areca whitfardii var. luzoniensis IUCN (VU) Bungang-gubat Areca whitfordii var. whitfordii CITES (I) Lasi Calamus bicolor CITES (I) Douung-douung Calamus cumingianus CITES (I)
Tandulang-Montalban Calamus dimorphacanthus var. montalbanicus
Tandulang-Zambales Calamus dimorphacanthus var.
zambalensis CITES (I)
Kumaboi Calamus discolor var. discolor CITES (I) Negros Kumaboi Calamus discolor var.negrosensis CITES (I) Calamus foxworthyi CITES (I) Uai Calamus grandifolius CITES (I) Lagipi Calamus jenningsianus CITES (I) Banakbo/Lintokan Calamus megaphyllus CITES (I) Dalimban Calamus melanorhynchus CITES (I) Palasan Calamus merrillii var. merrillii IUCN (V) Lokuan Calamus meyenianus CITES (I) Calamus mitis CITES (I)

TABLE 1.30. (continued)….
ORDER FAMILY COMMON NAME SCIENTIFIC NAME CONSERVATION STATUS
Sarani Calamus moseleyanus CITES (I) Balala Calamus multinervis CITES (I) Oban-oban Calamus trispermus CITES (I) Yantok Calamus vidalianus CITES (I) Yaming Calamus vinosus CITES (I) Caryota rumphiana var. oxyodonta CITES (I) Bag-bag Daemonorops affinis CITES (I) Daemonorops clemensiana CITES (I) Saranoy Daemonorops curranii CITES (I) Alinduyag Daemonorops. gracilis CITES (I) Sabilag Daemonorops pannosa CITES (I) Kaapi Daemonorops loheriana var. palawanicus CITES (I) Sahaan Daemonorops urdanetana CITES (I) Heterospathe elmeri CITES (I) Korthalsia merrilli CITES (I) Korthalsia squamosa CITES (I) Kayabing Livistonia robinsonia IUCN (VU) Anibong-laparan Oncosperma platyphyllum IUCN (VU) Banga Orania decipiens IUCN (LR), IUCN (NT) Mindanao Banga Orania decipiens var. mindanaoensis CITES (I) Bangang-bundok orania decipiens var. montana CITES (I) Voiavoi Phoenix hanceana var. philippinensis CITES (I) Buburis Pinanga basilanensis CITES (I) Pinanga geonomiformis CITES (I) Gasigan Pinanga heterophylla CITES (I) Takon Pinanga isabelensis CITES (I) Pinanga maculata CITES (I) Pinanga negrosensis CITES (I) Pinaga rigida CITES (I)
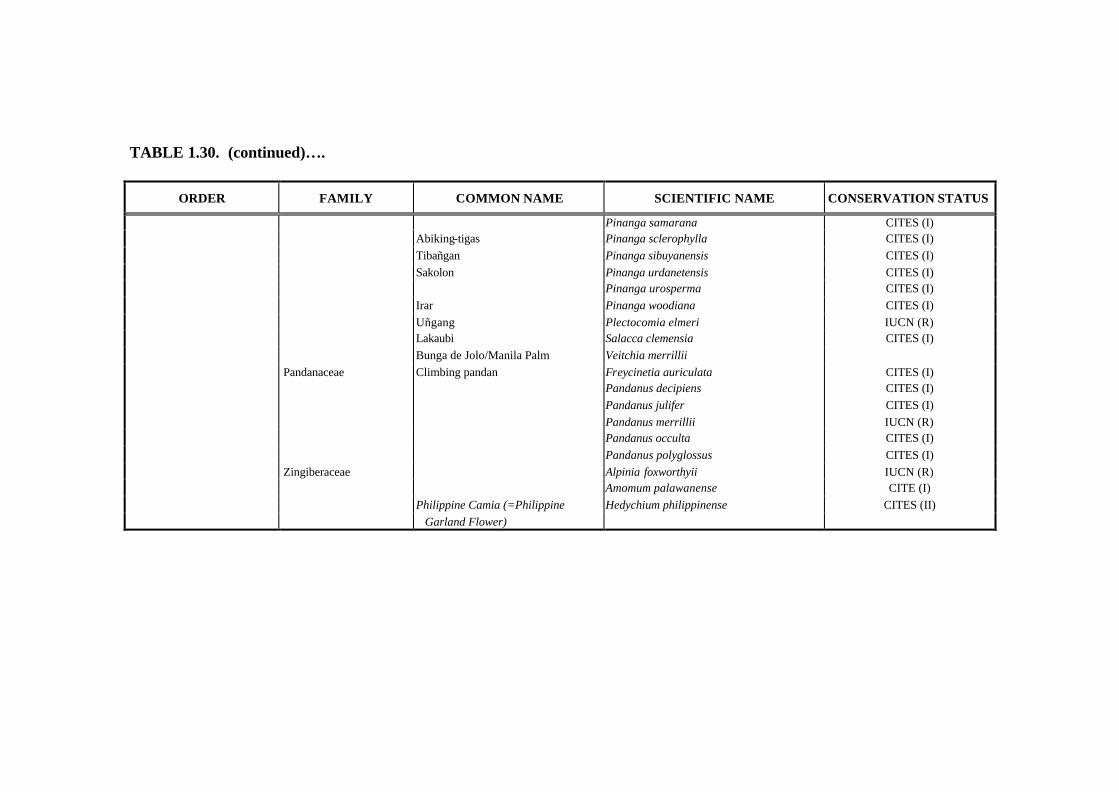
TABLE 1.30. (continued)….
ORDER FAMILY COMMON NAME SCIENTIFIC NAME CONSERVATION STATUS
Pinanga samarana CITES (I) Abiking-tigas Pinanga sclerophylla CITES (I) Tibañgan Pinanga sibuyanensis CITES (I) Sakolon Pinanga urdanetensis CITES (I) Pinanga urosperma CITES (I) Irar Pinanga woodiana CITES (I) Uñgang Plectocomia elmeri IUCN (R) Lakaubi Salacca clemensia CITES (I) Bunga de Jolo/Manila Palm Veitchia merrillii Pandanaceae Climbing pandan Freycinetia auriculata CITES (I) Pandanus decipiens CITES (I) Pandanus julifer CITES (I) Pandanus merrillii IUCN (R) Pandanus occulta CITES (I) Pandanus polyglossus CITES (I) Zingiberaceae Alpinia foxworthyii IUCN (R) Amomum palawanense CITE (I) Philippine Camia (=Philippine Hedychium philippinense CITES (II) Garland Flower)

TABLE 1.30. (continued)….
FAUNA
CONSERVAT ION STATUS
TAXONOMIC CLASSIFICATION
(Class, Order & Family) COMMON NAME SCIENTIFIC
NAME VERNACULAR NAME USED
IUCN CITES CMS
KNOWN OCCURRENCE/ DISTRIBUTION
AVES
PELECANIFORMES a. Pelecanidae Spot-billed Pelican Pelecanus philippensis Pagala VU
Luzon and Mindanao. Recorded in Bulacan; Tarlac; Candaba Swamp; Lake Buluan; Kabaksalas; Liguasan; and east coast of Davao Gulf. Reportedly occurs also along he coasts of Cagayan Valley; Laguna Bay; and, Rio Grande.
CICONIIFORMES
a. Ardeidae Chinese Egret Egretta eulophotes Tagak; Tulabong (Hiligay- non (Hil.)
EN I Basilan, Batan, Bohol, Cebu, Luzon, Mindoro, Olango, Palawan, Panay, and Samar
Japanese Night-Heron Gorsachius goisagi Bakaw-gabi VU Leyte, Luzon, Mindanao, Negros, Palawan, Semirara, and Siquijor
b. Ciconiidae Oriental Stork Ciconia boyciana EN Recorded only in Luzon (Maconacon, Isabela)
c. Threskiornithidae Black-faced Spoonbill Platalea minor CR Luzon. Manila area, and Bulacan and Pangasinan Province
a. Anatidae Philippine Duck Anas luzonica Pato del Monte; Dumaras; Papan (Tag) Kamasu; Gakit (Bis); Pato Ilahas (Hil.) Pato ilahas (Hil.)
VU Bohol, Catanduanes, Guimaras, Lubang, Luzon, Marinduque, Masbate, Mindanao, Mindoro, Negros, Panay, Polillo, Samar, Sibuyan, Siquijor, and Ticao
Baer's Pochard Aythya baeri VU Recorded in Luzon (Candaba Swamp)
FALCONIFORMES
a. Accipitridae Jerdon's Baza/ Crested Lizard-Hawk
Aviceda jerdoni Lawin
II
Leyte, Luzon, Mindanao, Palawan, and Samar

TABLE 1.30. (continued)….
CONSERVATION STATUS
TAXONOMIC CLASSIFICATION
(Class, Order & Family) COMMON NAME SCIENTIFIC
NAME VERNACULAR NAME USED
IUCN CITES CMS
KNOWN OCCURRENCE/ DISTRIBUTION
Barred Honeybuzzard Pernis celebensis Buhag (Tag)
II
Catanduanes, Luzon, Marinduque, Polillo, Samar, Sibuyan, Mindoro, Romblon, Tablas, Basilan, Bohol, Dinagat, Leyte, Masbate, Mindanao, Negros, Samar, Siargao, and Tawi-tawi
Asiatic Honeybuzzard/Oriental Honeybuzzard
Pernis ptilorhynchus Mamuhag (Tag)
II
Calauit, Palawan, Basilan, Biliran, Catanduanes, Cebu, Leyte, Luzon, Mindanao, Mindoro, Negros, Panay, Samar and Jolo
Black-shouldered Kite Elanus caeruleus Pu-wik (Tag)
II
Bantayan, Basilan, Bohol, Bongao, Burias, Busuanga, Catanduanes, Cebu, Guimaras, Jolo, Leyte, Loran, Luzon, Mindanao, Mindoro, Negros, Panay, Samar, Siasi, Sibuyan, Tawi-tawi, and Ticao
Black Kite Milvus migrans Palawan
Brahminy Kite Haliastur indus Lawin (Tag.); Kali (Iloc.) ; Banog (Bis.); Dapay (Hil.)
II Balukbaluk, Balut, Banga, Bantayan, Basilan, Biliran, Bohol, Bongao, Bucas, Buluan, Cabo, Cagayan Sulu, Calamianes, Calauit, Camotes, Carabao, Catanduanes, Calicoan, Cebu, Corregidor, Cuyo, Dinagat, Dungdung, Fatima, Guimaras, Jolo, Leyte, Lubang, Luzon, Mactan, Maestre de Campo, Malanipa, Manuk Manka, Marinduque, Masbate, Mindanao, Mindoro, Negros, Palawan, Panay, Pata, Polillo, Romblon, Samar, Sarangani, Semirara, Siargao, Siasi, Sibutu, Sibuyan, Simaluc, Siquijor, Tablas, Tawi-tawi, Ticao, Tres Islas, Tumindao, and West Bolod.

TABLE 1.30. (continued)….
CONSERVATION STATUS
TAXONOMIC CLASSIFICATION
(Class, Order & Family) COMMON NAME SCIENTIFIC
NAME VERNACULAR NAME USED
IUCN CITES CMS
KNOWN OCCURRENCE/ DISTRIBUTION
White-bellied Sea-Eagle Haliaeetus leucogaster Aguila (Tag); Manaol (Bis); Aguilang dagat (Hil);
II
Balukbaluk, Balut, Bancoran, Banga, Bantayan, Basilan, Batan, Bohol, Bongao, Buluan, Cabo, Cagayan Sulu, Calagna- an, Calauit, Calayan, Camiguin Norte, Catanduanes, Cebu, Coron, Corregidor, Culion, Dungdung, East Bolod, Fatima, Fuga, Gigantes, Ivojos, Jolo, Luzon, Malamaui, Manuc Manukan, Manuk Manka, Marinduque, Masbate, Mindanao, Mindoro, Negros, Palawan, Panay, Pan de Azucar, Pujada, Romblon, Sabtang, Samar, Sarangani, Semirara, Siasi, Sibago, Sibay, Sibutu, Sibuyan, Simaluc, Siquijor Sitanki, Tablas,, Talicud, Tawi-tawi, Ticao, Tres Islas, Tumindao, Ursula, Verde, West Bolod, and Y'Ami
Grey-headed Fish -Eagle Ichthyophaga ichthyaetus Alak-ak (Tag) NT II Basilan, Bongao, Calamianes, Luzon, Mindanao, Mindoro, Negros, and Samar
Philippine Serpent-Eagle Spilorn is holospilus Bakes (Bis); Mambubuhag (Mindoro)
II Basilan, Biliran, Bohol, Bongao, Bucas, Calagna-an, Calicoan, Camiguin Sur, Catanduanes, Cebu, Dinagat, Guimaras, Jolo, Leyte, Luzon, Marinduque, Masbate, Mindanao, Mindoro, Negros, Panay, Pan de Azucar, Polillo, Romblon, Samr, Siargao, Sibuyan, Sicogon, Tablas, Talicud, and Tawi-tawi
Crested Serpent-Eagle Spilornis cheela Bankas (Tag) II Balabac, Busuanga, and Palawan
Eastern Marsh-Harrier Circus spilonotus Mamamalaka (Tag) II Batan, Cagayan Sulu, Calayan, Jolo, Leyte, Luzon, Mindanao, Mindoro and Palawan

TABLE 1.30. (continued)….
CONSERVATION STATUS
TAXONOMIC CLASSIFICATION
(Class, Order & Family) COMMON NAME
SCIENTIFIC NAME
VERNACULAR NAME USED
IUCN CITES CMS
KNOWN OCCURRENCE/ DISTRIBUTION
Pied Harrier Circus melanoleucos Mamamalaka (Tag) II
Bantayan, Basilan, Biliran, Bohol, Calayan, Guimaras, Jolo, Leyte, Luzon, Mindanao, Mindoro, Negros, Panay, Sibay, and Ticao
Japanese Sparrowhawk Accipiter gularis Sakbit (Tag) II
Batan, Fuga, Luzon, Mindanao, Palawan, Sanga Sanga, Siasi, Sibutu, and Siquijor
Philippine Sparrowhawk/Besra Accipiter virgatus Sakbit (Tag) II
Catanduanes, Luzon, Mindoro, Negros, Panay, Biliran, Bohol, Cebu, Leyte, Mindanao, Samar, and Siquijor
Crested Goshawk Accipiter trivirgatus Sakbit (Tag) II
Balabac, Batas, Culion, Linapacan, Palawan, Rasa, Polillo, Bohol, Calicoan, Dinagat, Leyte, Mindanao, Negros, Samar, and Siargao
Chinese Goshawk Accipiter soloensis Sakbit (Tag)
II
Basilan, Biliran, Bohol, Bongao, Cagayancillo, Calayan, Cebu, Fuga, Guimaras, Leyte, Lubang, Luzon, Mindanao, Mindoro, Negros, Palawan, Panay, Sanga Sanga, Sibutu, Sibuyan, and Tawi-tawi
Grey-faced Buzzard Butastur indicus Tik-we (Tag); limbas
II II Balabac, Basilan, Batan, Biliran, Bohol, Cagayancillo, Cagayan Sulu, Calayan, Camiguin Norte, Catanduanes, Cebu, Culion, Cuyo, Fuga, Guimaras, Ivojos, Jolo, Leyte, Lubang, Luzon, Masbate, Mindanao, Mindoro, Negros, Palawan, Panay, Polillo, Pujada, Romblon, Siasi, Sabtang, Sibuyan, Samar, Sibay, Siquijor, Tawi-tawi, and Verde.
Common Buzzard Buteo buteo Lawin II Northern Luzon
Philippine Eagle Pithecophaga jefferyi Haring-ibon; Tipule manaol; Tipule; maboogook; Agila; darayod; garuda Kalumbata
CR I
Leyte, Luzon, Mindanao, and Samar
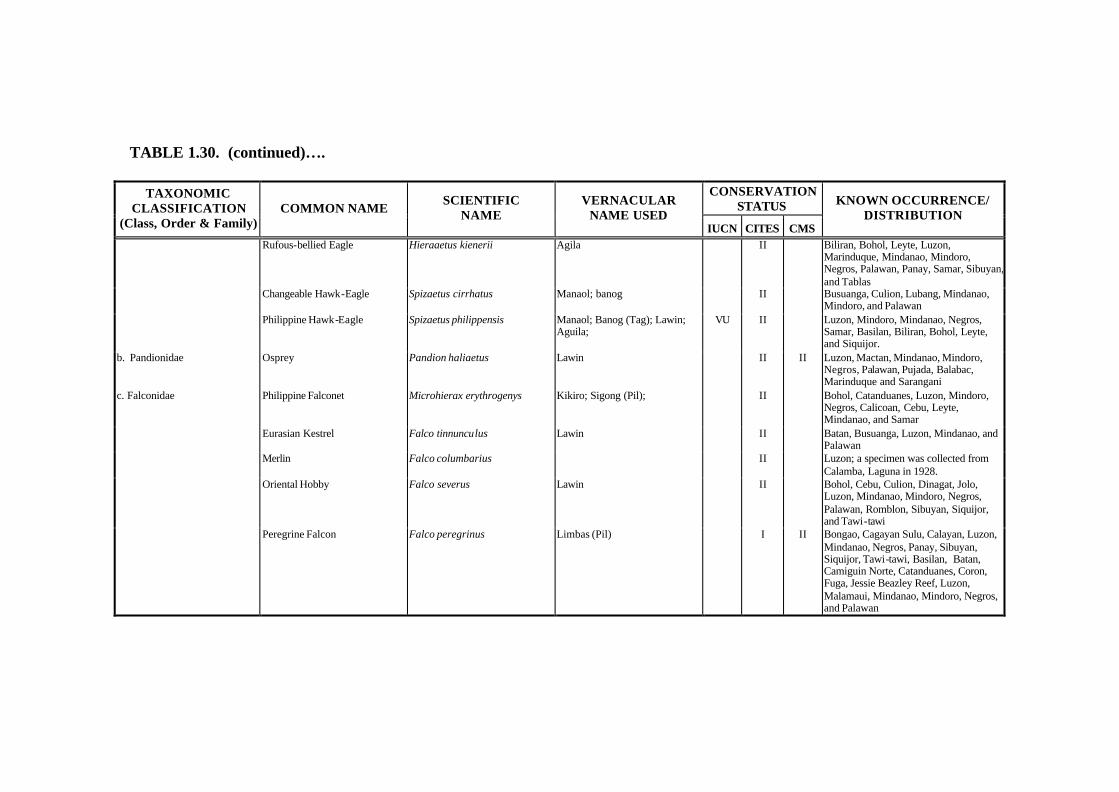
TABLE 1.30. (continued)….
CONSERVATION STATUS
TAXONOMIC CLASSIFICATION
(Class, Order & Family) COMMON NAME
SCIENTIFIC NAME
VERNACULAR NAME USED
IUCN CITES CMS
KNOWN OCCURRENCE/ DISTRIBUTION
Rufous-bellied Eagle Hieraaetus kienerii Agila II
Biliran, Bohol, Leyte, Luzon, Marinduque, Mindanao, Mindoro, Negros, Palawan, Panay, Samar, Sibuyan, and Tablas
Changeable Hawk-Eagle Spizaetus cirrhatus Manaol; banog II
Busuanga, Culion, Lubang, Mindanao, Mindoro, and Palawan
Philippine Hawk-Eagle Spizaetus philippensis Manaol; Banog (Tag); Lawin; Aguila;
VU II Luzon, Mindoro, Mindanao, Negros, Samar, Basilan, Biliran, Bohol, Leyte, and Siquijor.
b. Pandionidae Osprey Pandion haliaetus Lawin II II Luzon, Mactan, Mindanao, Mindoro, Negros, Palawan, Pujada, Balabac, Marinduque and Sarangani
c. Falconidae Philippine Falconet Microhierax erythrogenys Kikiro; Sigong (Pil); II Bohol, Catanduanes, Luzon, Mindoro, Negros, Calicoan, Cebu, Leyte, Mindanao, and Samar
Eurasian Kestrel Falco tinnunculus Lawin II Batan, Busuanga, Luzon, Mindanao, and Palawan
Merlin Falco columbarius II Luzon; a specimen was collected from Calamba, Laguna in 1928.
Oriental Hobby Falco severus Lawin II Bohol, Cebu, Culion, Dinagat, Jolo, Luzon, Mindanao, Mindoro, Negros, Palawan, Romblon, Sibuyan, Siquijor, and Tawi-tawi
Peregrine Falcon Falco peregrinus Limbas (Pil) I II Bongao, Cagayan Sulu, Calayan, Luzon, Mindanao, Negros, Panay, Sibuyan, Siquijor, Tawi-tawi, Basilan, Batan, Camiguin Norte, Catanduanes, Coron, Fuga, Jessie Beazley Reef, Luzon, Malamaui, Mindanao, Mindoro, Negros, and Palawan

TABLE 1.30. (continued)….
CONSERVATION STATUS
TAXONOMIC CLASSIFICATION
(Class, Order & Family) COMMON NAME
SCIENTIFIC NAME
VERNACULAR NAME USED
IUCN CITES CMS
KNOWN OCCURRENCE/ DISTRIBUTION
GALLIFORMES
a. Megapodidae Tabon Scrubfowl/ Philippine Megapode/ Incubator Bird
Megapodius cumingii Tabon (Pil)
Balabac, Busuanga, Calauit, Culion, Palawan, Talampulan, Tanobon, Ursula, Balukbaluk, Bantayan, Batan, Basilan, Bohol, East Bolod, Bongao, Buluan, Cabo, Cagayancillo, Cagayan Sulu, Calayan, Camiguin Norte, Camiguin Sur, Catanduanes, Cebu, Cresta de Gallo, Dinagat, Fatima, Fuga, Gigantes, Jolo, Leyte, Luzon, Manuk Manka, Marinduque, Masbate, Mindanao, Mindoro, Negros, Polillo, Romblon, Samar, Semirara, Sicogon, Siargao, Sibutu, Sibuyan, Tablas, Tara, Tawi-tawi, Ticao, Tres Islas, and Tumindao
b. Phasianidae Palawan Peacock-Pheasant Polyplectron emphanum Tandikan (Palawan, Tagbanua, Batak)
VU I Palawan
GRUIFORMES
a. Turnicidae Luzon Buttonquail/Worcester's Buttonquail
Turnix worcesteri Pugo (Pil) DD Luzon (Benguet, Nueva Vizcaya, Rizal Prov)
b. Gruidae Sarus crane Grus antigone Tipol; Bibiraw (Pil) NT II II Luzon mainland. Recorded in Nueva Ecija; Candaba Swamp; Cagayan; Ilocos Norte; Quezon; and, Isabela
c. Rallidae Brown-banded Rail/ Luzon Rail Dryolimnas mirificus Tighik; tikugas (Bis) DD Luzon mainland. Recorded in Bengue, Camarines Norte,Kalinga Apayao, Mt. Province, Nueva Ecija, and Nueva Vizcaya Prov)
CHARADRIIFORMES
a. Charadriidae Grey-headed Lapwing Vanellus cinereus II Luzon. Recorded in Malabon and Batan Island.

TABLE 1.30. (continued)….
CONSERVATION STATUS
TAXONOMIC CLASSIFICATION
(Class, Order & Family) COMMON NAME SCIENTIFIC
NAME VERNACULAR NAME USED
IUCN CITES CMS
KNOWN OCCURRENCE/ DISTRIBUTION
Malaysian Plover Charadrius peronii Taringting (Pil) NT II Balabac, Bantayan, Basilan, Bohol, Bongao, Cahayagan, Calayan, Catanduanes, Cebu, Dumaran, Dinagat, Fuga, Leyte, Lubang, Luzon, Mindanao, Mindoro, Palaui, Palawan, Panay, Polillo, Romblon, Sibutu, Sibuyan, Tambaron, Ticao, and Ursula
Little Ringed-Plover Charadrius dubius
II Basilan, Bohol, Cagayancillo, Calayan, Catanduanes, Cebu, Guimaras, Leyte, Lubang, Luzon, Marinduque, Mindanao, Mindoro, Negros, Palawan, Panay, Polillo, Samar, Sibuyan, Tablas, Balabac, Batan, Luzon, Mactan, Olango, Semirara, and Sibutu
Kentish Plover Charadrius alexandrinus
II Batan; Bohol; Calayan; Cebu; Cuyo; Jolo; Leyte; Mactan, Lubang; Luzon; Masbate; Mindanao; Mindoro; Olango; Negros; Palawan; Polillo; Saluag; Sibutu; Siquijor; and, Ticao.
Greater Sand-Plover Charadrius leschenaultii Taringting (Pil) II Balut, Bantayan, Basilan, Batan, Bohol, Bongao, Cagayancillo, Cebu, Cuyo, Jolo, Leyte, Lubang, Luzon, Mindanao, Mindoro, Negros, Olango, Palawan, Panay, Pata, Polillo, Saluag, Sibutu, Sibuyan, Simunul, Siquijor, Tambaron, Tataan, Tres Islas, and Tumindao.
Oriental Plover Charadrius veredus II Luzon, Palawan, and Sibutu
b. Scolopacidae Long-billed Curlew/Far Eastern Curlew
Numenius madagascariensis Balangkawitan (Pil) NT II Bohol, Cebu, Luzon, Mactan, Mindoro, Negros, Olango, Saluag, and Sibutu
Little Curlew/Pygmy Curlew Numenius minutus II Batan, Luzon, Marindduque, Mindanao, and Olango
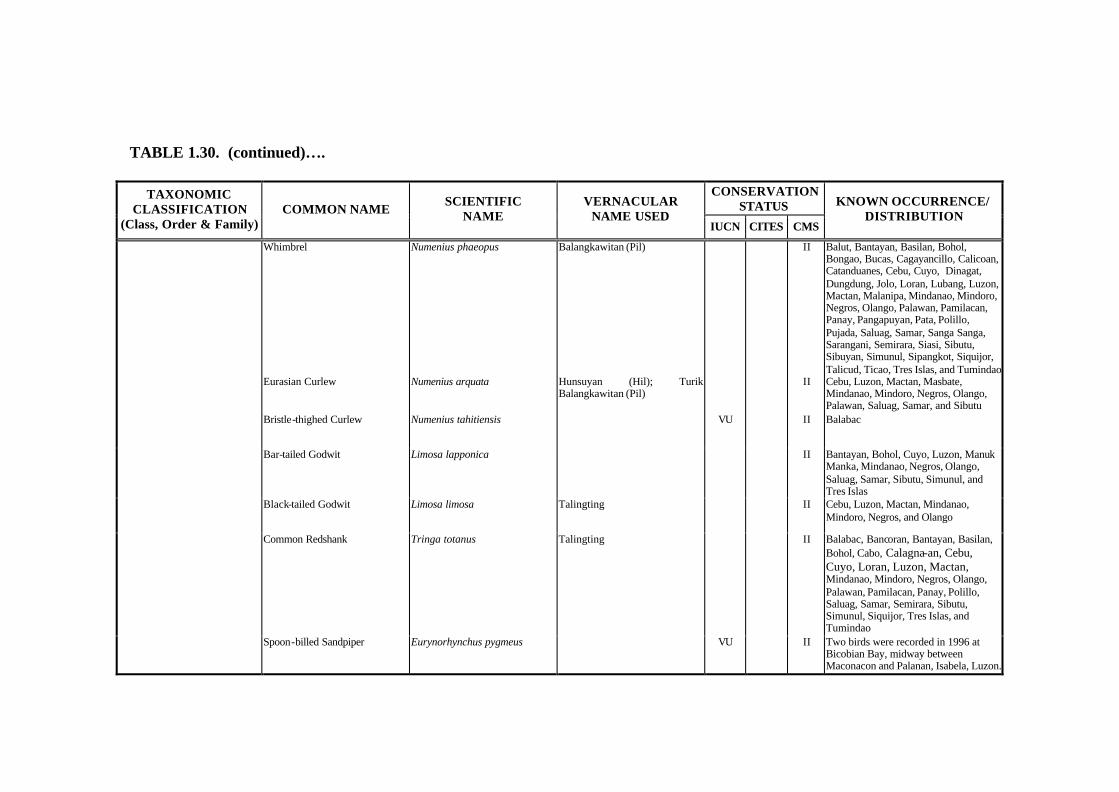
TABLE 1.30. (continued)….
CONSERVATION STATUS
TAXONOMIC CLASSIFICATION
(Class, Order & Family) COMMON NAME
SCIENTIFIC NAME
VERNACULAR NAME USED
IUCN CITES CMS
KNOWN OCCURRENCE/ DISTRIBUTION
Whimbrel Numenius phaeopus Balangkawitan (Pil) II Balut, Bantayan, Basilan, Bohol, Bongao, Bucas, Cagayancillo, Calicoan, Catanduanes, Cebu, Cuyo, Dinagat, Dungdung, Jolo, Loran, Lubang, Luzon, Mactan, Malanipa, Mindanao, Mindoro, Negros, Olango, Palawan, Pamilacan, Panay, Pangapuyan, Pata, Polillo, Pujada, Saluag, Samar, Sanga Sanga, Sarangani, Semirara, Siasi, Sibutu, Sibuyan, Simunul, Sipangkot, Siquijor, Talicud, Ticao, Tres Islas, and Tumindao
Eurasian Curlew Numenius arquata Hunsuyan (Hil); Turik Balangkawitan (Pil)
II Cebu, Luzon, Mactan, Masbate, Mindanao, Mindoro, Negros, Olango, Palawan, Saluag, Samar, and Sibutu
Bristle-thighed Curlew Numenius tahitiensis VU II Balabac
Bar-tailed Godwit Limosa lapponica II Bantayan, Bohol, Cuyo, Luzon, Manuk Manka, Mindanao, Negros, Olango, Saluag, Samar, Sibutu, Simunul, and Tres Islas
Black-tailed Godwit Limosa limosa Talingting II Cebu, Luzon, Mactan, Mindanao, Mindoro, Negros, and Olango
Common Redshank Tringa totanus Talingting II Balabac, Bancoran, Bantayan, Basilan, Bohol, Cabo, Calagna-an, Cebu, Cuyo, Loran, Luzon, Mactan, Mindanao, Mindoro, Negros, Olango, Palawan, Pamilacan, Panay, Polillo, Saluag, Samar, Semirara, Sibutu, Simunul, Siquijor, Tres Islas, and Tumindao
Spoon-billed Sandpiper Eurynorhynchus pygmeus VU II Two birds were recorded in 1996 at Bicobian Bay, midway between Maconacon and Palanan, Isabela, Luzon.

TABLE 1.30. (continued)….
CONSERVATION STATUS
TAXONOMIC CLASSIFICATION
(Class, Order & Family) COMMON NAME
SCIENTIFIC NAME
VERNACULAR NAME USED
IUCN CITES CMS
KNOWN OCCURRENCE/ DISTRIBUTION
Marsh Sandpiper Tringa stagnatilis Talingting II Cebu, Luzon, Mindanao, Negros, Olango,
Palawan, and Panay.
Common Greenshank Tringa nebularia Talingting II Batan, Bohol, Cebu, Luzon, Mindanao, Mindoro, Negros, Olango, Palawan, Pamilacan, Panay, Polillo, and Sibutu
Nordmann's Greenshank/ Spotted Greenshank
Tringa guttifer Talingting EN I II Cebu and Luzon. Recorded in Obando, Bulacan; Calatagan, Batangas; and, Minglanilla, Cebu
Green Sandpiper Tringa ochropus Talingting II Batan, Bohol, Jolo, Luzon, Mindoro, Negros, Palawan, Polillo, Samar, and Sanga Sanga
Wood Sandpiper Tringa glareola Talingting II Batan, Basilan, Biliran, Bohol, Bongao, Bucas, Busuanga, Cagayan Sulu, Calayan, Cebu, Cuyo, Guimaras, Jolo, Lubang, Luzon, Mactan, Mindanao, Mindoro, Negros, Olango, Palawan, Panay, Polillo, Samar, Sanga Sanga, Sibuyan, Siquijor, and Ticao.
Common Sandpiper Actitis hypoleucos Talingting II Agutaya, Balabac, Balukbaluk, Balut, Bancoran, Bantayan, Basilan, Batan, Biliran, Bohol, Bucas, Cabo, Cagayncillo, Cagayan Sulu, Calayan, Camiguin Sur, Calagna-an, Catanduanes, Cebu, Culion, Cuyo, Dadagican, Dinagat, Dungdung, East Bolod, Guimaras, Jolo, Leyte, Linapacan, Lubang, Luzon, Mactan, Malinipa, Manuk Manka, Manuk Manukan, Masbate, Mindanao, Mindoro, Negros, Olango, Palawan, Pamilacan, Panay, Pangapuyan, Pata, Polillo, Samar, Sanga Sanga, Sarangani, Semirara, Siargao, Siasi, Sibay, Sibuyan, Siquijor, Talicud, Tawi-tawi, Ticao, Tres Islas, Tumindao, and Verde

TABLE 1.30. (continued)….
CONSERVATION STATUS
TAXONOMIC CLASSIFICATION
(Class, Order & Family) COMMON NAME SCIENTIFIC
NAME VERNACULAR NAME USED
IUCN CITES CMS
KNOWN OCCURRENCE/ DISTRIBUTION
Grey-tailed Tattler Heteroscelus brevipes Talingting II Bantayan, Batan, Basilan, Bohol, Bongao, Cagayancillo, Calayan, Calicoan, Cebu, Cuyo, Dinagat, Leyte, Loran, Lubang, Luzon, Mactan, Malamaui, Malanipa, Manuc Manukan, Mindanao, Mindoro, Negros, Olango, Palawan, Panay, Pangapuyan, Pata, Polillo, Pujada, Saluag, Sanga Sanga, Sibutu, Sibuyan, Siquijor, Talicud, Ticao, Tres Islas, and Tumindao
Terek Sandpiper Xenus cinereus Talingting II Bohol, Cebu, Luzon, Masbate, Mindanao,
Negros, Olango, and Palawan
Ruddy Turnstone Arenaria interpres Talingting (Vis) II Balukbaluk, Bantayan, Batan, Bohol, Bucas, Cagayancillo, Cagayan Sulu, Cahayagan, Cebu, East Bolod, Jolo, Loran, Lubang, Luzon, Mactan, Manuc Manukan, Masbate, Mindanao, Mindoro, Negros, Olango, Palawan, Panay, Polillo, Saluag, Samar, Siasi, Simaluc, Simunul, Siquijor, and Tumindao
Asian Dowitcher Limnodromus semipalmatus Turik NT II Cebu, Luzon, Olango, and Simunul.
Jack Snipe Lymnocryptes minimus II Luzon and Palawan. Recorded in Apalit,
Pampanga and Iwahig, Puerto Princesa
Swinhoe's Snipe Gallinago megala Puk; Dasak; Kanduro (Pil)
II Bantayan, Basilan, Batan, Bohol, Bucas, Catanduanes, Cebu, Dinagat, Leyte, Lubang, Luzon, Malamaui, Masbate, Mindanao, Mindoro, Negros, Olango, Palawan, Panay, Polillo, Samar, Siargao, Sibuyan, Siquijor, and Tawi-tawi.
Pintail Snipe Gallinago stenura Usok-usok (Pil) II Calayan, Luzon, Mindanao, and Palawan
Common Snipe Gallinago gallinago Puk; Dasak; Kanduro (Pil) II Basilan, Bohol, Leyte, Luzon, Mindanao,
Mindoro, and Palawan
Eurasian Woodcock Scolopax rusticola
II Luzon. Recorded in Santo Tomas, Pampanga;
Fort Bonifacio; and Rizal Province Red Knot Calidris canutus Turik II Luzon, Mactan, Mindoro, and Olango

TABLE 1.30. (continued)….
CONSERVATION STATUS
TAXONOMIC CLASSIFICATION
(Class, Order & Family) COMMON NAME SCIENTIFIC
NAME VERNACULAR NAME USED
IUCN CITES CMS
KNOWN OCCURRENCE/ DISTRIBUTION
Great Knot Calidris tenuirostris Turik
II Batan, Cebu, Cuyo, Loran, Luzon, Negros, Olango, Palawan, Sibutu, Sitanki, Tres Islas, and Tumindao
Sanderling Calidris alba Talingting II Gaza, Luzon, Mindanao, Polillo, Olango,
Saluag, and Tumindao
Rufuos-necked Stint Calidris ruficollis Talingting II Balabac, Bantayan, Basilan, Batan, Bohol, Calayan, Calicoan, Cebu, Cuyo, Fuga, Luzon, Mactan, Masbate, Mindanao, Mindoro, Negros, Olango, Palawan, Polillo, Saluag, Sibutu, and Simunul
Long-toed Stint Calidris subminuta Talingting II Cebu, Luzon, Malamaui, Mindanao, Mindoro, Negros, Palawan, Panay, and Samar
Little Stint Calidris minuta Talingting II Mindanao and Negros. Recorded in
Dumaguete and Zamboanga.
Temminck's Stint Calidris temminckii II Luzon, Mindoro and Palawan. Recorded in Laoag, Ilocos Norte; San Jose, Mindoro; and Iwahig, Puerto Princesa
Sharp-tailed Sandpiper Calidris acuminata Talingting II Batan, Cebu, Luzon, Mactan, Mindanao,
Olango, Panay, and Palawan
Curlew Sandpiper Calidris ferruginea Talingting II Cebu, Luzon, Mindoro, Negros, Olango,
Palawan, Panay, and Simunul
Broad-billed Sandpiper Limicola falcinellus Talingting II Bohol, Cebu, Cuyo, Luzon, Mindanao,
Negros, and Palawan. Ruff/Reeve Philomachus pugnax Talingting II Luzon; Mindoro; Palawan; and, Cebu c. Phalaropopidae Red-necked Phalarope Phalaropus lobatus Talingting II Basilan; Calicoan; Luzon; Negros; Mindanao;
Pamilacan, Panay; Mindoro; Bohol; Palawan; Cebu; Ramesamey, and, Camotes.
d. Recurvirostridae Black-winged Stilt/ White-headed Stilt
Himantopus himantopus Talingting II Batan, Cebu, Mindoro, Negros, Palawan, Luzon, Malamaui, Mindanao, and Negros
e. Sternidae Chinese Crested Tern Sterna bernsteini Kanaway (Pil); ibong dagat CR II Luzon. A bird was collected along Manila Bay in 1905. Another record simply indicated "Philippines".

TABLE 1.30. (continued)….
CONSERVATION STATUS
TAXONOMIC CLASSIFICATION
(Class, Order & Family) COMMON NAME SCIENTIFIC
NAME VERNACULAR
NAME USED IUCN CITES CMS
KNOWN OCCURRENCE/ DISTRIBUTION
COLUMBIFORMES a. Columbidae Whistling Green-Pigeon Treron formosae Punay (Pil), Vojit (Ivatan) NT Camiguin Norte, Calayan, Batan, and
Sabtang Islands Mindanao Brown Dove Phapitreron brunneiceps VU
Mindanao. Recorded in Isabela, Basilan; Mt. Apo; Mt. Malindang; Mt. Mayo; Mt. Hilong-Hilong; and, Bukidnon.
Dark-eared Brown Dove/Tawitawi Brown Dove
Phapitreron cinereiceps CR
Basilan, Mindanao, and Tawitawi
Flame-breasted Fruit-Dove Ptilinopus marchei Punay (Pil) VU
Luzon. Recorded in Mt. Banahaw, Quezon; Lepanto, Bontoc; Mt. Tabuan, Cagayan; Casiguran, Aurora; Abra; Mt. Sicapo-o, Ilocos Norte; and, Mt. Polis, Mt. Province.
Cream-bellied Fruit -Dove Ptilinopus merrilli Punay; Merilay (Pil) NT Luzon and Catanduanes. Recorded in Mt. Tabuan, Cagayan; Polillo; Paete and Pangil, Laguna; Albay; Lucban; Quezon; Sierra Madre near Tanay, Rizal; and, Papaya, Nueva Ecija.
Negros Fruit -Dove Ptilinopus arcanus Punay CR Negros. A specimen was taken from Mt. Kanla-on in 1953.
Mindoro Imperial-Pigeon Ducula mindorensis Balud (Pil) VU I Mindoro. Pink-bellied Imperial-Pigeon Ducula poliocephala Balud Primera, Agum-um(Pil);
Hagumhum, Agumum (Vis) NT Basilan; Biliran; Bohol; Catanduanes; Cebu;
Dinagat; Leyte; Luzon; Masbate; Mindanao; Mindoro; Negros; Panay; Samar; Sibuyan; and Tawitawi.
Grey Imperial-Pigeon Ducula pickeringii Balud (Pil) VU Cagayancillo; Cagayan Sulu; Jolo; Sibutu; Mangsi; Balabac; Calusa; Cavilli; Calauit; Lumbacan; Sipangkot; Ursula; West and East Bolod; Loran; Dammi; and, Tumindao.
Spotted Imperial-Pigeon Ducula carola Balud (Pil) VU Luzon; Mindoro; Sibuyan; Negros, and Siquijor
Luzon Bleeding-Heart Gallicolumba luzonica Punalada (Pil) NT II Luzon. Recorded in Ilocos Norte, Cagayan; Polillo; Catanduanes; Panay; and, unspecified areas near Manila.
Mindoro Bleeding-heart Gallicolumba platenae Punalada (Pil) VU Mindoro only. Negros Bleeding-heart Gallicolumba keayi Punalada (Pil) CR Negros and Panay.

TABLE 1.30. (continued)….
CONSERVATION STATUS
TAXONOMIC CLASSIFICATION
(Class, Order & Family) COMMON NAME SCIENTIFIC
NAME VERNACULAR NAME USED
IUCN CITES CMS
KNOWN OCCURRENCE/ DISTRIBUTION
Sulu Bleeding-heart Gallicolumba menagei CR Tawi-Tawi. Mindanao Bleeding-heart Gallicolumba criniger Mukid (Pil) EN Leyte, Samar, Dinagat, Mindanao, and Basilan. Nicobar Pigeon Caloenas nicobarica Siete Colores (Pil) NT I Apo Reef, Balabac, Balukbaluk, Basilan,
Cayoagan, Cavilli, Jolo, Lumbucan, Mangsi, Mindanao, Mindoro, Negros, Palawan, Sibutu, Siquijor, Talaran, Tawi-tawi, Tumindao, and Ursula
PSITTACIFORMES a. Psittacidae Mindanao Lorikeet Trichoglossus johnstoniae NT II Mindanao. Recorded in Mt. Apo; Mt.
Kitanglad; Mt. Malindang; Lanao (in an area near Lake Lanao); Mt. Matutum; and, Mt. Piapayungan.
Philippine Cockatoo Cacatua haematuropygia Kalangay (Tag); Abucay; Katala (Vis); Abukay (Pil)
CR I Balabac, Bantayan, Basilan, Bohol, Bongao, Boracay, Buad, Calauit, Calicoan, Catanduanes, Cebu, Culion, Dinagat, Gigantes, Guimaras, Jolo, Lapac, Leyte, Loran, Lubang, Luzon, Manuk Manka, Marinduque, Masbate, Mindanao, Mindoro, Negros, Nipa, Palawan, Panaon, Panay, Polillo, Samar, Sanga sanga, Sarangani, Siargao, Simunul, Siquijor, Tablas, Tawi-Tawi, Ticao, and Tumindao.
Blue-headed Racquet-tail Prioniturus platenea Loro; Kanawihan (Tag); Managuing; Biloy (Bis); Pikoy (Hil.); Kilit (Tagbanua)
VU II Balabac, Busuanga, Calauit, Culion, Dumaran, and Palawan
Montane Raquet -tail/ Luzon Racquet-tail/
Prioniturus montanus Ulis (Benguet); Loro NT II Luzon. Recorded in Mt. Data, Benguet; Abra; Ilocos Norte; and, Mt. Puguis, Mt. Province.
Blue-crowned Racquet -tail Prioniturus discurus Kaguit (Pil); Loro, Kanauihan (Tag); Managuing (Vis)
II Biliran, Bohol, Catanduanes, Cebu, Guimaras, Leyte, Luzon, Masbate, Negros, Samar, Sibuyan, Tablas, Ticao, Balut, Basilan, Jolo, Mindanao, Olutanga, and Mindoro.
Green Racquet -tail Prioniturus luconensis Kaguit (Pil) VU II Luzon and Marinduque. Mindanao Racquet-tail Prioniturus waterstradti NT II
Mindanao. Recorded in Mts. Apo, Matutum and Mayo.

TABLE 1.30. (continued)….
CONSERVATION STATUS
TAXONOMIC CLASSIFICATION
(Class, Order & Family) COMMON NAME SCIENTIFIC
NAME VERNACULAR NAME USED
IUCN CITES CMS
KNOWN OCCURRENCE/ DISTRIBUTION
Blue-winged Racquet-tail Prioniturus verticalis EN II
Bongao, Manuk Manka, Sibutu, Tawi-tawi, and Tumindao.
Blue-naped Parrot Tanygnathus lucionensis Loro (Pil); Perio; Picoy; Angale (Bis); Perico
NT II
Luzon, Mindoro, Polillo, Balut, Bantayan, Basilan, Biliran, Bohol, Boracay, Burias, Busuanga, Cagayan Sulu, Calauit, Caluya, Cebu, Culion, Fatima, Guimaras, Jinamoc, Jolo, Lapac, Leyte, Loran, Maestre de Campo, Malanipa, Manuk Manka, Marinduque, Masbate, Mindanao, Negros, Palawan, Panay, Pangapuyan, Romblon, Samal, Samar, Sarangani, Semirara, Sibay, Sibutu, Sibuyan, Siquijor, Tablas, Tawi-tawi, Ticao, Tumindao, Verde, and West Bolod
Blue-backed Parrot Tanygnathus sumatranus Loro (Pil) II
Luzon, Polillo, Leyte, Mindanao, Negros, Panay, Samar, Basbas, Bongao, Jolo, Loran, Sanga Sanga, Sibutu, and Tawi-tawi.
Great-billed Parrot/ Large-billed Parrot
Tanygnathus megalorynchos Loro (Pil) II
Balut and Saranggani.
Guaiabero Bolbopsittacus lunulatus Batotok; Bubutok (Pil) II
Samar; Leyte; Panaon; Mindanao; and, Luzon
Philippine Hanging Parakeet/Colasisi
Loriculus philippensis Colasisi (Pil); Kusi; Kolansi; Kolasisi (Vis) Bullilising (Iloc)
II
Banton, Catanduanes, Luzon, Marinduque, Polillo, Biliran, Bohol, Buad, Calicoan, Leyte, Maripipi, Samar, Bazol, Balut, Camiguin Sur, Dinagat, Mindanao, Siargao, Basilan, Bongao, Jolo, Manuk Manka, Siasi, Tawi-tawi, Siquijor, Guimaras, Masbate, Negros, Panay, Romblon, Tablas, Ticao, Cebu, Sibuyan, and Mindoro
CUCULIFORMES a. Cuculidae Black-hooded Coucal Centropus steerii Sukut-sukut (Pil) CR Mindoro only Rufous coucal Centropus unirufus Sabukot Kanela (Pil) NT Catanduanes, Luzon, and Polillo

TABLE 1.30. (continued)….
CONSERVATION STATUS
TAXONOMIC CLASSIFICATION
(Class, Order & Family) COMMON NAME SCIENTIFIC
NAME VERNACULAR
NAME USED IUCN CITES CMS
KNOWN OCCURRENCE/ DISTRIBUTION
STRIGIFORMES a. Tytonidae Grass owl Tyto capensis Kwagong Talahib (Pil); Basilan, Batan, Biliran, Cagayan Sulu,
Calamianes, Ngiw-ngiw (Vis); Kullaaw (Iloc);
Morogmon (Hil) Calauit, Cebu, Ivojos, Jolo, Luzon,
Mindanao, Mindoro, Negros, Palawan, Panay, Pujada, Sabtang, Sibuyan, and Siquijor.
b. Phodilidae Oriental Bay-owl Phodilus badius Bukaw II Samar. Recorded in Lognilocon, Paranes, Samar
c. Strigidae Luzon Scops-Owl Otus longicornis Botbot Kuwaw (Pil); bang-ao; bukaw
NT II Luzon. Recorded in Benguet; Bulacan; Camarines Norte, Camarines Sur, Ifugao, Ilocos Norte, Mountain Province, Nueva Ecija, and Zambales.
Mantanani Scops-Owl Otus mantananensis NT II Palawan, Cuyo, Dicabaito, Linapacan, Banton, Romblon, Semirara, Sibuyan, Tablas, Tres Reyes, Sibutu, and Tumindao.
Mindoro Scops-owl Otus mindorensis Kwago NT II Mindoro. Recorded in Mt. Halcon. Philippine Scops-Owl Otus megalotis Kuago (Tag); Bukao (Vis)
Botbot Kuwaw (Pil); II Catanduanes, Luzon, Marinduque, Basilan,
Biliran, Bohol, Dinagat, Leyte, Mindanao, Samar, Negros, and Panay.
Mindanao Scops-Owl Otus mirus NT II
Mindanao. Recorded in Mts. Apo, Hilong-hilong, and Kitangald.
Palawan Scops-Owl Otus fuliginosus NT II Palawan Ryukyu Scops-Owl/ Elegant
Scops-Owl Otus elegans Bantuluk (Ivatan) II
Batan, Calayan, and Sabtang.
Giant Scops-Owl Mimizuku gurneyi Kwago VU II Dinagat, Siargao, and Mindanao. Philippine Hawk-Owl Ninox philippensis Kuwago (Pil); Kuago (Tag);
Bukao, Bukaw (Vis); Lukluk (Tawi-Tawi)
II
Buad, Catanduanes, Leyte, Luzon, Marinduque, Polillo, Samar, Basilan, Dinagat, Mindanao, Siargao, Bongao, Jolo, Sanga Sanga, Siasi, Sibutu, Tawi-tawi, Bohol, Boracay, Carabao, Guimaras, Negros, Panay, Semirara, Siquijor, Camiguin Sur, Cebu, Sibuyan, Tablas, Masbate, Ticao, and Mindoro.

TABLE 1.30. (continued)….
CONSERVATION STATUS
TAXONOMIC CLASSIFICATION
(Class, Order & Family) COMMON NAME SCIENTIFIC
NAME VERNACULAR
NAME USED IUCN CITES CMS
KNOWN OCCURRENCE/ DISTRIBUTION
Brown Hawk-Owl Ninox scutulata Kuwago; bukaw
II
Palawan, Basilan, Cebu, Luzon, Marinduque, Mindanao, Mindoro, Negros, Siquijor, Basilan, Batan, Bongao, Calayan, Camiguin Norte, Cebu, Cuyo, Fuga, Guimaras, Luzon, Masbate, Mindanao, Mindoro, Negros, Palawan, Sanga Sanga, Siquijor, Tawi-tawi, Calayan, Jolo, Luzon, and Mindanao.
Spotted Wood-Owl/ Strix seloputo
Strix seloputo Kuwago (Pil); Gok-gok (Batak, Tagbanua)
II Busuanga and Palawan.
Short -eared Owl Asio flammeus Kuwago II Luzon, Mindanao, Mindoro, Olango, and Palawan.
Philippine Eagle-Owl Bubo philippensis Kuwago (Pil) VU II Catanduanes, Luzon, Bohol, Leyte, Mindanao, and Samar.
APODIFORMES a. Apodidae Whitehead's Swiftlet Collocalia whiteheadi Layang-layang DD Luzon; Negros; and, Mindanao.
Recorded in Mt. Data and Mts. Apo and Busa in Mindanao and Mt. Kanlaon, Negros.
Philippine Needletail Mearnsia picina NT Biliran; Cebu; Leyte; Mindanao, Negros, Samar, Sanga Sanga, and Tawi-tawi.
CORACIIFORMES a. Alcedinidae Blue-capped Wood-
Kingfisher Actenoides hombroni Salaksak VU Mindanao. Recorded in (Mts. Apo, Busa,
Hilong-Hilong, Kitanglad, and Pasian).
Silvery Kingfisher Alcedo argentata Salaksak; Kibid (Pil); Susulbot; Tikarol
VU Basilan, Dinagat, Mindanao, Siargao, Bohol, Leyte, and Samar.
Rufous-lored Kingfisher Halcyon winchelli Salaksak; Tikarol VU Biliran, Bohol, Calicoan, Cebu, Leyte, Negros, Samar, Siquijor, Romblon, Sibuyan, Sicogon, Tablas, Mindanao, Basilan, Bongao, Jolo, Papahag, Sanga Sanga, and Tawi-tawi.
Philippine Dwarf-Kingfisher Ceyx melanurus Biding (Pil); Salaksak VU Alabat, Catanduanes, Luzon, Polillo, Leyte, Samar, Basilan, and Mindanao.

TABLE 1.30. (continued)….
CONSERVATION STATUS
TAXONOMIC CLASSIFICATION
(Class, Order & Family) COMMON NAME SCIENTIFIC
NAME VERNACULAR
NAME USED IUCN CITES CMS
KNOWN OCCURRENCE/ DISTRIBUTION
b. Bucerotidae Tarictic Hornbill/Visayan Tarictic
Penelopides panini Tariktik (Tag); Talusi; Taosi (Bis); Taric; T ularik (Hil.)
EN II Catanduanes, Luzon, Marinduque, Polillo, Biliran, Bohol, Calicoan, Leyte, Samar, Bucas, Dinagat, Mindanao, Siargao, Basilan, Guimaras, Masbate, Negros, Pan de Azucar, Panay, Sicogon, Ticao, and Mindoro.
Samar Hornbill Penelopides samarensis Taosi II Biliran, Bohol, Calicoan, Leyte, and Samar.
Mindoro Hornbill Penelopides mindorensis Tarictic EN II Mindoro. Luzon Hornbill Penelopides manillae Kalaw II Catanduanes, Luzon, and Marinduque.
Mindanao Hornbill Penelopides affinis Tarictic II
Bucas, Dinagat, Mindanao, and Siargao. Siargao; and Bucas.
Palawan Hornbill Anthracoceros marchei Talusi (Palawan, Tagbanua) VU II Balabac, Busuanga, Calauit and Palawan.
Sulu Hornbill Anthracoceros montani Talusi (Pil) CR II Jolo, Sanga Sanga, and Tawi-tawi.
Rufous Hornbill Buceros hydrocorax Kalaw (Pil) NT II
Luzon, Marinduque, Biliran, Bohol, Buad, Calicoan, Leyte, Panaon, Samar, Balut, Basilan, Bucas, Dinagat, Mindanao, Siargao, and Talicud.
Walden's Hornbill/ Wrinkled-Billed Hornbill/Visayan Writhed Hornbill Writhed Hornbill/Mindanao Wrinkled Hornbill
Aceros waldeni Dulungan (Ilongo); Kalaw (Pil) CR II
Guimaras, Negros, and Panay.
Aceros leucocephalus Tuhek (Pil) NT II Camiguin Sur, Dinagat, and Mindanao.
PICIFORMES
a. Picidae Sulu Woodpecker Picoides ramsayi Kasay-kasay VU Restricted to Sulu Islands. PASSERIFORMES a. Pittidae Steere's Pitta/Azure-breasted
Pitta Pitta steerii Babaqua (Vis) VU
Bohol; Samar; Leyte; and, Mindanao.
Whiskered Pitta Pitta kochi Kong Kong (Igorot) VU I
Luzon. Recorded in Mt. Cagua and Cordillera Mountain, Cagayan; Balian, Laguna; Mt. Isarog, Camarines Sur and, Sierra Madre Mts.
b. Eurylaimidae Wattled Broadbill Eurylaimus steerii Tukal; Tukat (Mind) VU Mindanao. Recorded in Agusan; Basilan; Dinagat; Malamaui; and Siargao.
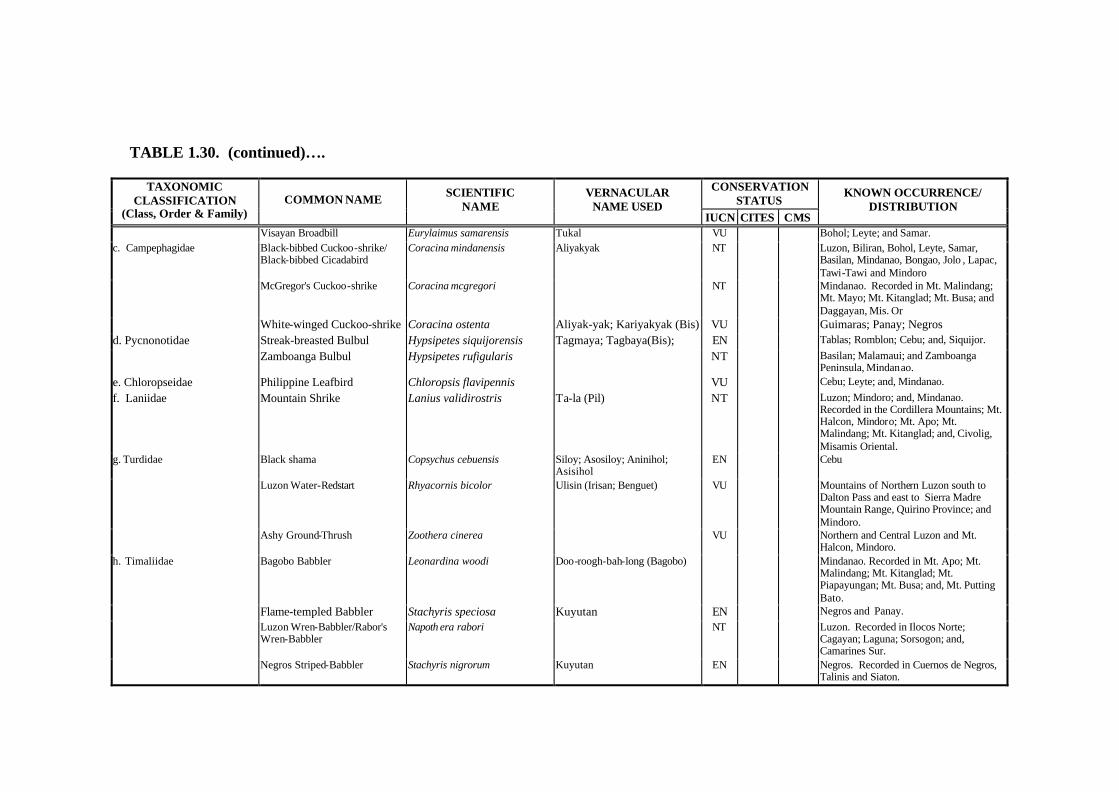
TABLE 1.30. (continued)….
CONSERVATION STATUS
TAXONOMIC CLASSIFICATION
(Class, Order & Family) COMMON NAME SCIENTIFIC
NAME VERNACULAR
NAME USED IUCN CITES CMS
KNOWN OCCURRENCE/ DISTRIBUTION
Visayan Broadbill Eurylaimus samarensis Tukal VU Bohol; Leyte; and Samar. c. Campephagidae Black-bibbed Cuckoo-shrike/
Black-bibbed Cicadabird Coracina mindanensis Aliyakyak NT Luzon, Biliran, Bohol, Leyte, Samar,
Basilan, Mindanao, Bongao, Jolo , Lapac, Tawi-Tawi and Mindoro
McGregor's Cuckoo-shrike Coracina mcgregori NT Mindanao. Recorded in Mt. Malindang; Mt. Mayo; Mt. Kitanglad; Mt. Busa; and Daggayan, Mis. Or
White-winged Cuckoo-shrike Coracina ostenta Aliyak-yak; Kariyakyak (Bis) VU Guimaras; Panay; Negros d. Pycnonotidae Streak-breasted Bulbul Hypsipetes siquijorensis Tagmaya; Tagbaya(Bis); EN Tablas; Romblon; Cebu; and, Siquijor.
Zamboanga Bulbul Hypsipetes rufigularis NT Basilan; Malamaui; and Zamboanga Peninsula, Mindanao.
e. Chloropseidae Philippine Leafbird Chloropsis flavipennis VU Cebu; Leyte; and, Mindanao.
f. Laniidae Mountain Shrike Lanius validirostris Ta-la (Pil) NT Luzon; Mindoro; and, Mindanao. Recorded in the Cordillera Mountains; Mt. Halcon, Mindoro; Mt. Apo; Mt. Malindang; Mt. Kitanglad; and, Civolig, Misamis Oriental.
g. Turdidae Black shama Copsychus cebuensis Siloy; Asosiloy; Aninihol; Asisihol
EN
Cebu
Luzon Water-Redstart Rhyacornis bicolor Ulisin (Irisan; Benguet) VU
Mountains of Northern Luzon south to Dalton Pass and east to Sierra Madre Mountain Range, Quirino Province; and Mindoro.
Ashy Ground-Thrush Zoothera cinerea VU
Northern and Central Luzon and Mt. Halcon, Mindoro.
h. Timaliidae Bagobo Babbler Leonardina woodi Doo-roogh-bah-long (Bagobo) Mindanao. Recorded in Mt. Apo; Mt. Malindang; Mt. Kitanglad; Mt. Piapayungan; Mt. Busa; and, Mt. Putting Bato.
Flame-templed Babbler Stachyris speciosa Kuyutan EN Negros and Panay. Luzon Wren-Babbler/Rabor's
Wren-Babbler Napoth era rabori NT
Luzon. Recorded in Ilocos Norte; Cagayan; Laguna; Sorsogon; and, Camarines Sur.
Negros Striped-Babbler Stachyris nigrorum Kuyutan EN
Negros. Recorded in Cuernos de Negros, Talinis and Siaton.

TABLE 1.30. (continued)….
CONSERVATION STATUS
TAXONOMIC CLASSIFICATION
(Class, Order & Family) COMMON NAME SCIENTIFIC
NAME VERNACULAR
NAME USED IUCN CITES CMS
KNOWN OCCURRENCE/ DISTRIBUTION
Melodius Babbler Malacopteron palawanense NT
Palawan. Recorded in Balabac and Puerto Princesa.
Miniature tit -babbler Micromacronus leytensis DD
Mindanao; Samar; Leyte. Recorded in Mt. Matutum, Cotabato; Mt. Sugarloaf, Zamboanga del Sur; Mt. Piapayungan, Lanao del Sur; Mt. Lobi, Leyte; and, Maraput Samar.
Falcated Ground-Babbler/ Falcated Wren-Babbler
Ptilocichla falcata VU
Balabac and Palawan.
Luzon Striped-Babbler Stachyris striata Gaas-gaas (Mind) NT
Northern Luzon. Recorded in Cape Engaño; San Mariano and Molino, Isabela; Peñablanca; Cagayan; Dilalongan, Aurora (in the eastern slopes of the Sierra Madre Mountains); and Southwestern slope of Mt. Mariveles, Bataan.
Panay Striped-Babbler Stachyris latistriata NT
Panay. Known only from Mt. Baloy, San Agustin, Valderrama, and Mt. Madja-as, Culasi, Antique.
Palawan-Striped-Babbler Stachyris hypogrammica NT
Palawan. Known only from Mt. Borang-bato near Brooke's Point; Victoria Mountains, Narra, and Mt. Mantaling, Mantalingajan Range.
Golden-crowned Babbler/ Golden-crowned Tree Babbler
Stachyris dennistouni NT Luzon. Recorded in Cape Engaño, Cagayan; Ilocos Norte; Isabela; and Ma. Aurora, Aurora Province.
Pygmy Babbler/ Pygmy Tree Babbler
Stachyris plateni NT Samar; Leyte; and, Mindanao. Recorded in Bonga, Samar; Malabang, Lanao del Sur; Mt. Malindang; Misamis Oriental and Lanao del Sur; Mt. Agtuuganon, Davao Oriental; throughout Mt. Apo range; Kalambogan; Lanao del Norte; Bukidnon; Mt. Piapayungan; Turod and Na-awan, Misamis Oriental; Mt. Matumtum; and, Barugo, Northern Leyte.
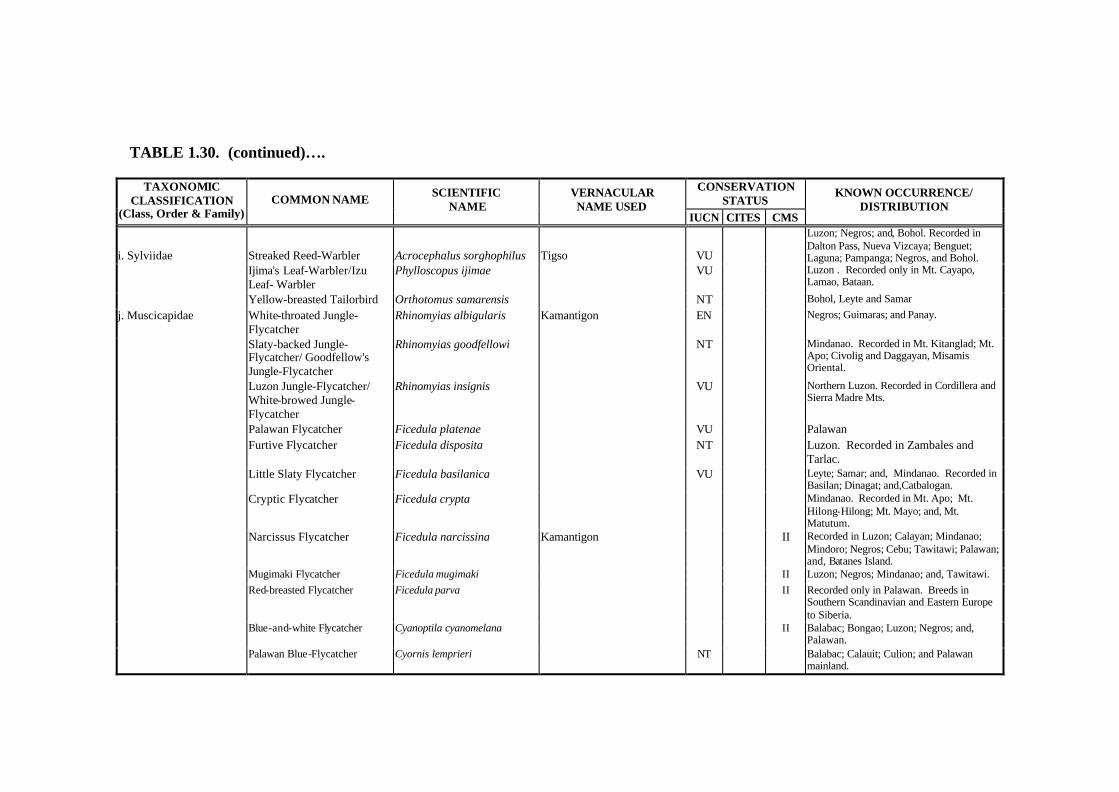
TABLE 1.30. (continued)….
CONSERVATION STATUS
TAXONOMIC CLASSIFICATION
(Class, Order & Family) COMMON NAME SCIENTIFIC
NAME VERNACULAR NAME USED
IUCN CITES CMS
KNOWN OCCURRENCE/ DISTRIBUTION
i. Sylviidae Streaked Reed-Warbler Acrocephalus sorghophilus Tigso VU
Luzon; Negros; and, Bohol. Recorded in Dalton Pass, Nueva Vizcaya; Benguet; Laguna; Pampanga; Negros, and Bohol.
Ijima's Leaf-Warbler/Izu Leaf- Warbler
Phylloscopus ijimae VU Luzon . Recorded only in Mt. Cayapo, Lamao, Bataan.
Yellow-breasted Tailorbird Orthotomus samarensis NT Bohol, Leyte and Samar
j. Muscicapidae White-throated Jungle-Flycatcher
Rhinomyias albigularis Kamantigon EN Negros; Guimaras; and Panay.
Slaty-backed Jungle-Flycatcher/ Goodfellow's Jungle-Flycatcher
Rhinomyias goodfellowi NT Mindanao. Recorded in Mt. Kitanglad; Mt. Apo; Civolig and Daggayan, Misamis Oriental.
Luzon Jungle-Flycatcher/ White-browed Jungle-Flycatcher
Rhinomyias insignis VU Northern Luzon. Recorded in Cordillera and Sierra Madre Mts.
Palawan Flycatcher Ficedula platenae VU Palawan
Furtive Flycatcher Ficedula disposita NT Luzon. Recorded in Zambales and
Tarlac.
Little Slaty Flycatcher Ficedula basilanica VU Leyte; Samar; and, Mindanao. Recorded in
Basilan; Dinagat; and,Catbalogan.
Cryptic Flycatcher Ficedula crypta
Mindanao. Recorded in Mt. Apo; Mt. Hilong-Hilong; Mt. Mayo; and, Mt. Matutum.
Narcissus Flycatcher Ficedula narcissina Kamantigon
II Recorded in Luzon; Calayan; Mindanao; Mindoro; Negros; Cebu; Tawitawi; Palawan; and, Batanes Island.
Mugimaki Flycatcher Ficedula mugimaki II Luzon; Negros; Mindanao; and, Tawitawi.
Red-breasted Flycatcher Ficedula parva II Recorded only in Palawan. Breeds in Southern Scandinavian and Eastern Europe to Siberia.
Blue-and-white Flycatcher Cyanoptila cyanomelana II Balabac; Bongao; Luzon; Negros; and,
Palawan.
Palawan Blue-Flycatcher Cyornis lemprieri NT Balabac; Calauit; Culion; and Palawan
mainland.
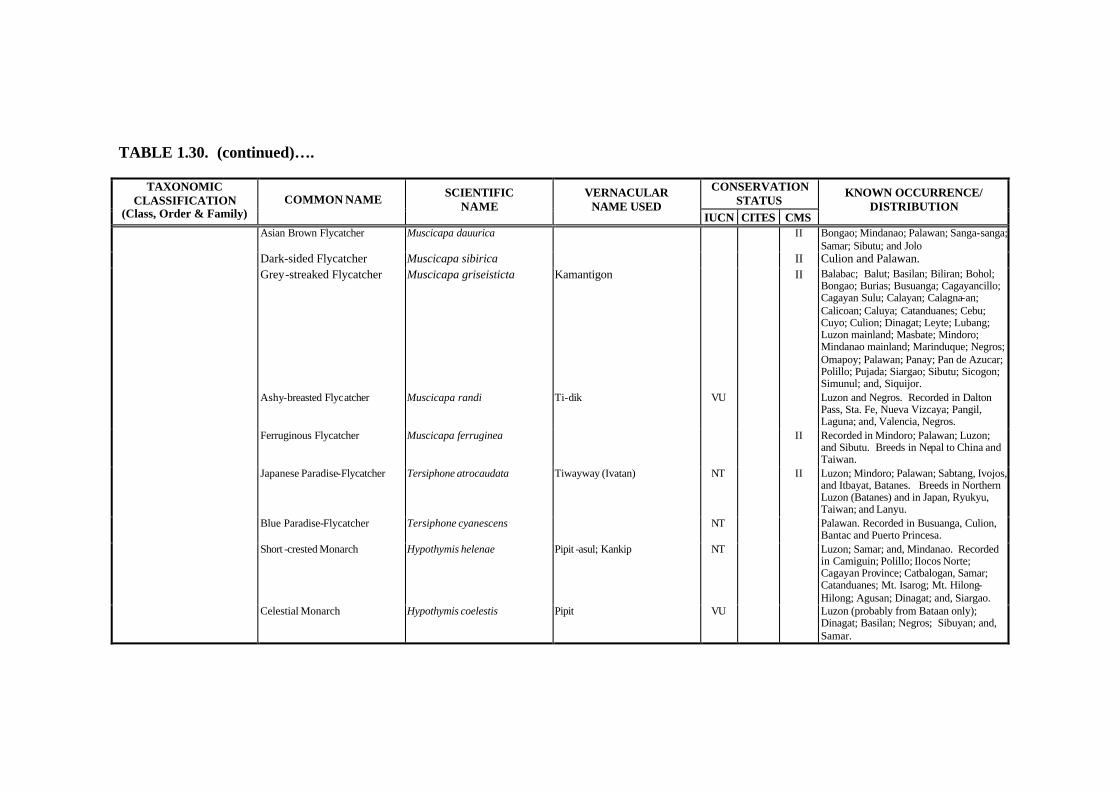
TABLE 1.30. (continued)….
CONSERVATION STATUS
TAXONOMIC CLASSIFICATION
(Class, Order & Family) COMMON NAME SCIENTIFIC
NAME VERNACULAR
NAME USED IUCN CITES CMS
KNOWN OCCURRENCE/ DISTRIBUTION
Asian Brown Flycatcher Muscicapa dauurica II Bongao; Mindanao; Palawan; Sanga-sanga;
Samar; Sibutu; and Jolo Dark-sided Flycatcher Muscicapa sibirica II Culion and Palawan.
Grey-streaked Flycatcher Muscicapa griseisticta Kamantigon II Balabac; Balut; Basilan; Biliran; Bohol; Bongao; Burias; Busuanga; Cagayancillo; Cagayan Sulu; Calayan; Calagna-an; Calicoan; Caluya; Catanduanes; Cebu; Cuyo; Culion; Dinagat; Leyte; Lubang; Luzon mainland; Masbate; Mindoro; Mindanao mainland; Marinduque; Negros; Omapoy; Palawan; Panay; Pan de Azucar; Polillo; Pujada; Siargao; Sibutu; Sicogon; Simunul; and, Siquijor.
Ashy-breasted Flycatcher Muscicapa randi Ti-dik VU
Luzon and Negros. Recorded in Dalton Pass, Sta. Fe, Nueva Vizcaya; Pangil, Laguna; and, Valencia, Negros.
Ferruginous Flycatcher Muscicapa ferruginea II Recorded in Mindoro; Palawan; Luzon; and Sibutu. Breeds in Nepal to China and Taiwan.
Japanese Paradise-Flycatcher Tersiphone atrocaudata Tiwayway (Ivatan) NT II Luzon; Mindoro; Palawan; Sabtang, Ivojos, and Itbayat, Batanes. Breeds in Northern Luzon (Batanes) and in Japan, Ryukyu, Taiwan; and Lanyu.
Blue Paradise-Flycatcher Tersiphone cyanescens NT Palawan. Recorded in Busuanga, Culion,
Bantac and Puerto Princesa.
Short -crested Monarch Hypothymis helenae Pipit -asul; Kankip NT Luzon; Samar; and, Mindanao. Recorded in Camiguin; Polillo; Ilocos Norte; Cagayan Province; Catbalogan, Samar; Catanduanes; Mt. Isarog; Mt. Hilong-Hilong; Agusan; Dinagat; and, Siargao.
Celestial Monarch Hypothymis coelestis Pipit VU Luzon (probably from Bataan only); Dinagat; Basilan; Negros; Sibuyan; and, Samar.

TABLE 1.30. (continued)….
CONSERVATION STATUS
TAXONOMIC CLASSIFICATION
(Class, Order & Family) COMMON NAME SCIENTIFIC
NAME VERNACULAR
NAME USED IUCN CITES CMS
KNOWN OCCURRENCE/ DISTRIBUTION
k. Paridae White-fronted Tit Parus semilarvatus NT
Luzon and Mindanao. Recorded in Molino and San Mariano, Isabela; Cape Engaño and Gonzaga; Cagayan; Mt. Arayat, Pampanga; Sierra Madre Mt. Range near Sampaloc, Rizal; Bataan; Sorsogon; Mt. Sugarloaf, Zamboanga del Sur; Mt. Piapayungan; Lanao del Sur; Glan, Cotabato; Mainit, Iligan, Lanao del Norte; and Montical, Misamis Oriental.
Palawan Tit Parus amabilis NT Balabac; Calauit; and Palawan mainland l. Dicaeidae Cebu Flowerpecker Dicaeum quadricolor Panago -to CR Cebu only. Visayan Flowerpecker Dicaeum haematostictum Panago-to VU Negros; Panay; and, Guimaras.
Whiskered Flowerpecker Dicaeum proprium NT Mindanao. Recorded in Mt. Mayo, Davao Oriental; Mt. Matutum, Cotabato; Mt. Piapayungan; Lanao del Sur; Iligan, Lanao del Norte; Mt. Sugarloaf; Zamboanga del Sur; and Mt. Apo, Davao.
Scarlet-collared Flowerpecker Dicaeum retrocinctum Tariti VU Mindoro only.
Flame-crowned Flowerpecker Dicaeum anthonyi Tikloy NT
Luzon and Mindanao. Recorded in Mt. Polis, Ifugao; Mt. Tabuan, Cagayan; Mt. Puguis, Mountain Province; Mt. Kitanglad and Daggayan, Misamis Oriental; Mt Kampalili and Mt. Apo, Davao.
m. Nectariniidae Apo sunbird Aethopyga boltoni NT Mindanao. Recorded in Mt. Apo; Mt. Busa; Mt. Malin - dang; Mt. Parker; Mt. Matutum; and, Mt. Kitanglad
Lina's Sunbird Aethopyga linaraborae NT Restricted only to the eastern mountains of Mindanao from Mt. Pasian in the north to Mt. Mayo in the South. Described only in 1996 from the specimens collected in 1965, 1993 and 1994.
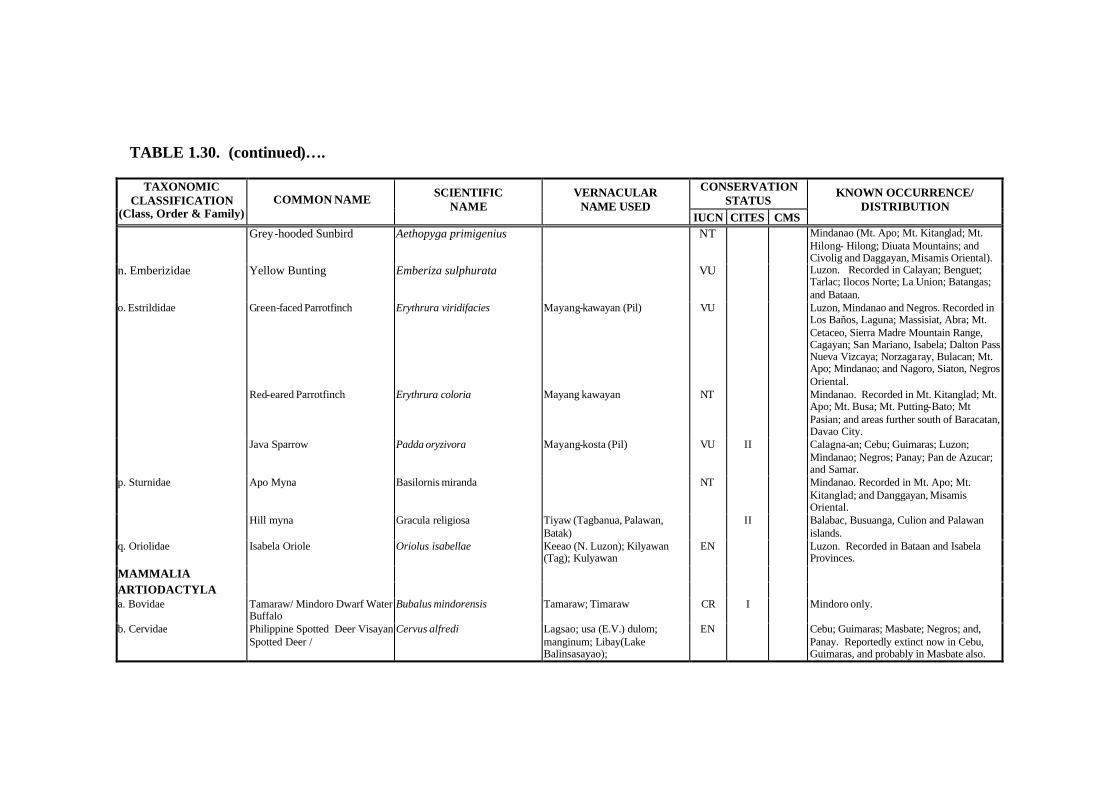
TABLE 1.30. (continued)….
CONSERVATION STATUS
TAXONOMIC CLASSIFICATION
(Class, Order & Family) COMMON NAME SCIENTIFIC
NAME VERNACULAR
NAME USED IUCN CITES CMS
KNOWN OCCURRENCE/ DISTRIBUTION
Grey-hooded Sunbird Aethopyga primigenius NT Mindanao (Mt. Apo; Mt. Kitanglad; Mt. Hilong- Hilong; Diuata Mountains; and Civolig and Daggayan, Misamis Oriental).
n. Emberizidae Yellow Bunting Emberiza sulphurata VU Luzon. Recorded in Calayan; Benguet; Tarlac; Ilocos Norte; La Union; Batangas; and Bataan.
o. Estrildidae Green-faced Parrotfinch Erythrura viridifacies Mayang-kawayan (Pil) VU
Luzon, Mindanao and Negros. Recorded in Los Baños, Laguna; Massisiat, Abra; Mt. Cetaceo, Sierra Madre Mountain Range, Cagayan; San Mariano, Isabela; Dalton Pass, Nueva Vizcaya; Norzagaray, Bulacan; Mt. Apo; Mindanao; and Nagoro, Siaton, Negros Oriental.
Red-eared Parrotfinch Erythrura coloria Mayang kawayan NT
Mindanao. Recorded in Mt. Kitanglad; Mt. Apo; Mt. Busa; Mt. Putting-Bato; Mt Pasian; and areas further south of Baracatan, Davao City.
Java Sparrow Padda oryzivora Mayang-kosta (Pil) VU II Calagna-an; Cebu; Guimaras; Luzon; Mindanao; Negros; Panay; Pan de Azucar; and Samar.
p. Sturnidae Apo Myna Basilornis miranda NT Mindanao. Recorded in Mt. Apo; Mt. Kitanglad; and Danggayan, Misamis Oriental.
Hill myna Gracula religiosa Tiyaw (Tagbanua, Palawan, Batak)
II Balabac, Busuanga, Culion and Palawan islands.
q. Oriolidae Isabela Oriole Oriolus isabellae Keeao (N. Luzon); Kilyawan (Tag); Kulyawan
EN Luzon. Recorded in Bataan and Isabela Provinces.
MAMMALIA ARTIODACTYLA a. Bovidae Tamaraw/ Mindoro Dwarf Water
Buffalo Bubalus mindorensis Tamaraw; Timaraw CR I Mindoro only.
b. Cervidae Philippine Spotted Deer Visayan Spotted Deer /
Cervus alfredi Lagsao; usa (E.V.) dulom; manginum; Libay(Lake Balinsasayao);
EN Cebu; Guimaras; Masbate; Negros; and, Panay. Reportedly extinct now in Cebu, Guimaras, and probably in Masbate also.

TABLE 1.30. (continued)….
CONSERVATION STATUS
TAXONOMIC CLASSIFICATION
(Class, Order & Family) COMMON NAME SCIENTIFIC
NAME VERNACULAR
NAME USED IUCN CITES CMS
KNOWN OCCURRENCE/ DISTRIBUTION
Calamian Hog Deer/Calamian Deer
Axis calamianensis Usa EN I Palawan. Recorded only in Busuanga and Culion.
Philippine Brown Deer Cervus mariannus Usa (Tag); Ugsa (Ilok) DD
Throughout the Philippines except in the Negros Panay Faunal Region, Babuyan-Batanes Groups; Palawan and Sulu Faunal Regions. Recorded in Masbate, Basilan, Catanduanes; Leyte, Isabela, Bukidnon, Davao del Norte, Davao del Sur; Agusan del Norte; and, South Cotabato. Probably extinct now in Catanduanes and Biliran
c. Suidae Visayan Warty Pig Sus cebifrons Baboy ihalas (Bis); Baboy Tolonon (Tablas); Baboy talonon (Hil.)
CR
Cebu; Guimaras; Masbate; Negros; and Panay, but probably extinct now in Cebu and Guimaras.
Philippine Warty Pig Sus philippensis Baboy-damo; baboy ihalas NT Luzon; Visayas; and, Mindanao. Recorded in Abra, Biliran, Catanduanes; Rizal; Leyte; Camiguin, Bukidnon, Davao del Norte; Davao del Sur, Maguindanao, Mindoro, North Cotabato; South Cotabato, Zamboanga del Norte, and Samar. Extinct on Marinduque.
Palawan Bearded Pig Sus barbatus ahoenobarbus Babuy; Pagil; baktin(young) NT Palawan. Recorded in Busuanga and Palawan mainland. Also reported from Balabac; Bugsuc; Calauit; Culion; Coron; and adjacent islands.
d. Tragulidae Greater Mouse Deer/ Balabac Chevrotain
Tragulus napu Pilandok EN Known only from Balabac and adjacent small islands, including Bugsuc and Ramos in Palawan
a. Manidae Malayan pangolin Manis javanica Halintong; Balintong; NT II Palawan and Culion.
CARNIVORA a. Felidae Leopard Cat Prionailurus bengalensis Maral; Tamaral (E.V.) II Palawan and Visayas. Recorded in
Busuanga; Palawan mainland; Panay; and, Negros.
b. Mustelidae Oriental Small-clawed Otter Amblonyx cinereus NT II Palawan Island only.

TABLE 1.30. (continued)….
CONSERVATION STATUS
TAXONOMIC CLASSIFICATION
(Class, Order & Family) COMMON NAME SCIENTIFIC
NAME VERNACULAR
NAME USED IUCN CITES CMS
KNOWN OCCURRENCE/ DISTRIBUTION
Palawan Stink Badger Mydaus marchei Pantot VU Palawan Faunal Region. Recorded in Busuanga, Calauit, Calamian and Palawan mainland.
c. Viverridae Binturong Arctictis binturong Binturong; Manturon VU Palawan Faunal Region. Norte; Maguindanao; & Palawan mainland.
RODENTIA a. Muridae Mindoro Climbing Rat Anonymomys mindorensis VU
Mindoro only. Recorded in Ilong Peak, Halcon Range.
Mt. Isarog Shrew-Mouse Archboldomys luzonensis EN Mt. Isarog, Camarines Sur only. Dinagat Hairy-tailed Cloud Rat Crateromys australis EN Known only from Dinagat Island. Ilin Hairy-tailed Cloud Rat Crateromys paulus CR
Known only to occur in Ilin Island, Mindoro but unverified reports suggest its presence on southern Mindoro
Luzon Bushy-tailed Cloud Rat Crateromys schadenbergi Buut; Yutyut; letlet (Igorot) VU Recorded only in Benguet; Ifugao; and, Mt. Province, Luzon.
Panay Bushy-tailed Cloud Rat/ Panay Cloud Runner
Crateromys heaneyi Kuneho sa bukid (Hil.) EN Panay only
Southern Luzon Giant Cloud Rat
Phloeomys cumingi Daga; Bugkun; Bugkoon Buot; Buut
VU Southern Luzon. Recorded in Laguna; Quezon; Camarines Sur; and, Catanduanes. Reported also from Marinduque.
Northern Luzon Giant Cloud Rat Phloeomys pallidus Buot; Buut; Mang-angkra; Mang-angla; Kunehong-gubat
NT Northern and Central Luzon. Recorded in Abra, Bataan, Zambales, Benguet; Kalinga-Apayao, Laguna and Nueva Vizcaya.
Tawi-Tawi Forest Rat Rattus tawitawiensis VU Tawitawi Island, Sulu Archipelago Mindoro Soft-furred Rat Rattus mindorensis VU Mindoro only. Isarog Shrew Rat Rhynchomys isarogensis Daga VU
Known only from Mt. Isarog, Camarines Sur.
Large Mindoro Forest Mouse Apomys gracilirostris Daga (Tag); Ilaga (Bis); Tandean (Bagobo)
VU
Mindoro only.
Long-nosed Luzon Forest Mouse Apomys sacobianus VU Luzon. Recorded in Isabela; Pampanga; and Zambales. Mindanao and Visayas. Recorded in Camiguin; Leyte, Bukidnon; Cotabato; and, Davao del Norte
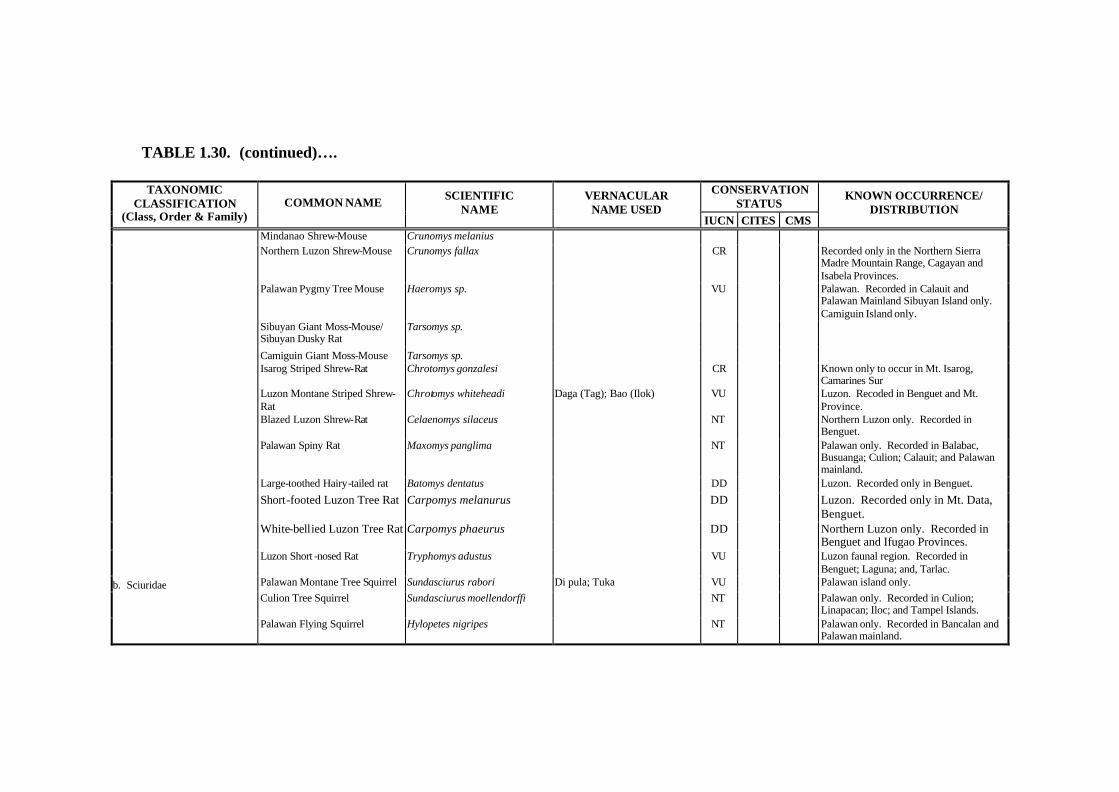
TABLE 1.30. (continued)….
CONSERVATION STATUS
TAXONOMIC CLASSIFICATION
(Class, Order & Family) COMMON NAME SCIENTIFIC
NAME VERNACULAR
NAME USED IUCN CITES CMS
KNOWN OCCURRENCE/ DISTRIBUTION
Mindanao Shrew-Mouse Crunomys melanius
Northern Luzon Shrew-Mouse Crunomys fallax CR Recorded only in the Northern Sierra Madre Mountain Range, Cagayan and Isabela Provinces.
Palawan Pygmy Tree Mouse Haeromys sp. VU Palawan. Recorded in Calauit and Palawan Mainland Sibuyan Island only. Camiguin Island only.
Sibuyan Giant Moss-Mouse/ Sibuyan Dusky Rat
Tarsomys sp.
Camiguin Giant Moss-Mouse Tarsomys sp.
Isarog Striped Shrew-Rat Chrotomys gonzalesi CR
Known only to occur in Mt. Isarog, Camarines Sur
Luzon Montane Striped Shrew-Rat
Chrotomys whiteheadi Daga (Tag); Bao (Ilok) VU Luzon. Recoded in Benguet and Mt. Province.
Blazed Luzon Shrew-Rat Celaenomys silaceus NT Northern Luzon only. Recorded in
Benguet.
Palawan Spiny Rat Maxomys panglima NT Palawan only. Recorded in Balabac, Busuanga; Culion; Calauit; and Palawan mainland.
Large-toothed Hairy-tailed rat Batomys dentatus DD Luzon. Recorded only in Benguet.
Short-footed Luzon Tree Rat Carpomys melanurus DD Luzon. Recorded only in Mt. Data,
Benguet.
White-bellied Luzon Tree Rat Carpomys phaeurus DD Northern Luzon only. Recorded in
Benguet and Ifugao Provinces.
Luzon Short -nosed Rat Tryphomys adustus VU Luzon faunal region. Recorded in
Benguet; Laguna; and, Tarlac. b. Sciuridae Palawan Montane Tree Squirrel Sundasciurus rabori Di pula; Tuka VU Palawan island only.
Culion Tree Squirrel Sundasciurus moellendorffi NT
Palawan only. Recorded in Culion; Linapacan; Iloc; and Tampel Islands.
Palawan Flying Squirrel Hylopetes nigripes NT
Palawan only. Recorded in Bancalan and Palawan mainland.

TABLE 1.30. (continued)….
CONSERVATION STATUS
TAXONOMIC CLASSIFICATION
(Class, Order & Family) COMMON NAME SCIENTIFIC
NAME VERNACULAR
NAME USED IUCN CITES CMS
KNOWN OCCURRENCE/ DISTRIBUTION
PRIMATES a. Loridae Slow loris Nycticebus coucang Tarababuey; Taliraba- buey
(Bag); Kokang; Kokay; Kokam II Sulu Archipelago. Recorded in Bongao;
Sanga-Sanga; Simunul; and Tawi-tawi. b. Tarsiidae Philippine tarsier Tarsius syrichta tarsius; maomag; tagsing CD II Visayas and Mindanao. Recorded in Bohol;
Leyte; Samar; Basilan; Biliran; Davao del Norte; Davao del Sur; Misamis Occ.; Misamis Oriental; South Cotabato; and, Zamboanga del Norte.
c. Cercopithecidae Crab-eating Macaque/Long- tailed Macaque
Macaca fascicularis Matsing; Tsonggo (Tag); Ayung (Cag); Bakes(Ilok); Ukay (Cam. Sur); Amo: Unggoy (Bis); Loo; Toong (Manobo)
NT II Throughout the Philippines. Recorded in Balabac; Basilan; Balut; Biliran; Bohol; Busuanga; Cagayan Sulu; Culion; Jolo; Leyte; Abra; Batangas; Cagayan Valley; Camarines Sur; Ilocos Norte; Isabela; Laguna; Maripipi; Davao del Norte; Davao del Sur; Lanao del Norte; Misamis Occ.; Zamboanga del Norte; Zamboanga del Sur; Mindoro; Negros; Palawan mainland; Samar; Sibuyan; Davao Oriental; and Maguindanao.
SCANDENTIA a. Tupaiidae Mindanao Tree Shrew Urogale everetti Tara baboy; Kalasagsoy(Mind) VU II Mindanao. Recorded in Dinagat; Bukidnon;
Davao del Sur; Misamis Occidental; Misamis Oriental; South Cotabato; Surigao del Norte; Zamboanga del Sur; and Siargao.
Palawan Tree Shrew Tupaia palawanensis Bisin (Palawan); Tarababuey (Manobo) Klongi (Bilaan); Kologtsuey; Tara- bahbooey (Bagobo)
II Palawan. Recorded in Balabac, Busuanga; Culion; Cuyo; and Palawan mainland.
CHIROPTERA a. Pteropodidae Ryuku Flying Fox/Wooly Flying
Fox Pteropus dasymallus Bayakan; Kaboy (Mind) EN II Babuyan Island group. Recorded in Batan,
Dalupiri, and Fuga.

TABLE 1.30. (continued)….
CONSERVATION STATUS
TAXONOMIC CLASSIFICATION
(Class, Order & Family) COMMON NAME SCIENTIFIC
NAME VERNACULAR
NAME USED IUCN CITES CMS
KNOWN OCCURRENCE/ DISTRIBUTION
Common Island Flying Fox Pteropus hypomelanus Bayakan; kabag; kabog II Throughout the Philippines except in Palawan and Batanes/Babuyan Faunal Regions. Recorded in Cagayan, Sulu, Camiguin, Cebu, Cuyo, Dinagat, Guimaras, Leyte, Camarines Sur, Ilocos Norte, Nueva Ecija; Mactan, Marinduque, Maripipi, Zamboanga; Negros and Panay, Polillo, Romblon, Samar, Siargao, Sibuyan and, Siquijor
Common Island Flying Fox Pteropus hypomelanus Bayakan; kabag; kabog II Throughout the Philippines except in Palawan and Batanes/Babuyan Faunal Regions. Recorded in Cagayan, Sulu, Camiguin, Cebu, Cuyo, Dinagat, Guimaras, Leyte, Camarines Sur, Ilocos Norte, Nueva Ecija; Mactan, Marinduque, Maripipi, Zamboanga; Negros and Panay, Polillo, Romblon, Samar, Siargao, Sibuyan and, Siquijor
Mottle-winged Flying Fox/ Pteropus leucopterus Bayakan; kabag; kabog EN II Luzon Faunal Region and Dinagat. Recorded in
White-winged Flying Fox Catanduanes, Abra, Cagayan, Isabela, Laguna, Nueva Viscaya, and Quezon.
Little Golden-mantled Flying Fox Pteropus pumilus Bayakan; kabag; kabog VU II
Throughout the Philippines excluding Palawan & Batanes/Babuyan Faunal Regions. Recorded Balut, Camiguin, Leyte, Maripipi; Masbate; Mindoro, Negros; Palmas; Panay, Sibuyan; Siquijor, Tablas, and, Zamboanga del Sur.
Philippine Gray Flying Fox Pteropus speciosus Kabog (Bis); Kulong- kulong (Mindanao)
VU II Mindanao and Sulu Faunal Regions. Recorded in Basilan, Malanipa, Zamboanga del Sur; Sanga-sanga, Sibutu, and Tawitawi.

TABLE 1.30. (continued)….
CONSERVATION STATUS
TAXONOMIC CLASSIFICATION
(Class, Order & Family) COMMON NAME SCIENTIFIC
NAME VERNACULAR
NAME USED IUCN CITES CMS
KNOWN OCCURRENCE/ DISTRIBUTION
Large Flying Fox Pteropus vampyrus Paniki; Kabog (Hil.); Kulaknit II Throughout the Philippines except in the Batanes/Babuyan region. Recorded in Bohol; Bongao; Cabo; Catanduanes; Culion; Leyte; Guimaras; Abra; Cagayan; Ilocos Norte; Isabela; La Union; Tarlac; Agusan del Norte; Bukidnon; Cotobato; Davao del Sur, Davao Oriental, Lanao del Norte; Lanao del Sur; Maguindanao; Misamis Occ.; Misamis Oriental; North Cotabato; South Cotabato; Zamboanga del Norte; Zamboanga del Sur; Mindoro, Negros, Palawan, Panay, Puerto Galera, Tantangan, Dinagat, & Romblon.
Palawan Flying Fox Acerodon leucotis VU II Palawan. Recorded in Balabac; Busuanga;
and Palawan Islands.
Golden-crowned Flying Fox Acerodon jubatus Paniki (Tag); Kabog (Bis); Kalabing
EN I Throughout the Philippines with the exception of Palawan faunal region and the Batanes and Babuyan Groups. Recorded in Basilan; Bongao; Cabo; Bohol; Dinagat; Jolo; Leyte; Abra; Rizal; Isabela; Manila; Quezon; Tarlac; Maripipi; Davao del Norte; Davao del Sur; Lanao del Norte; Lanao del Sur; Maguindanao; Misamis Oriental; South Cotabato; Sultan Kudarat; Surigao del Sur; Zamboanga del Norte; Zamboanga del Sur; Mindoro; Negros; Sibutu; and Siquijor.
Philippine Nectar Bat/ Philippine Dawn Bat
Eonycteris robusta Kuwaknit; Kulalaknit (Bis)
Throughout the Philippines with the exception of Palawan faunal region and the Batanes and Babuyan Groups. Recorded in Biliran; Catanduanes; Leyte Lubang; Abra; Cavite; Rizal; Maripipi; Bukidnon; Lanao del Norte; Maguindanao; Misamis Oriental; Negros; Zamboanga del Sur; and, Siargao.;
Sibuyan Pygmy Fruit Bat Haplonycteris sp. I Sibuyan Island
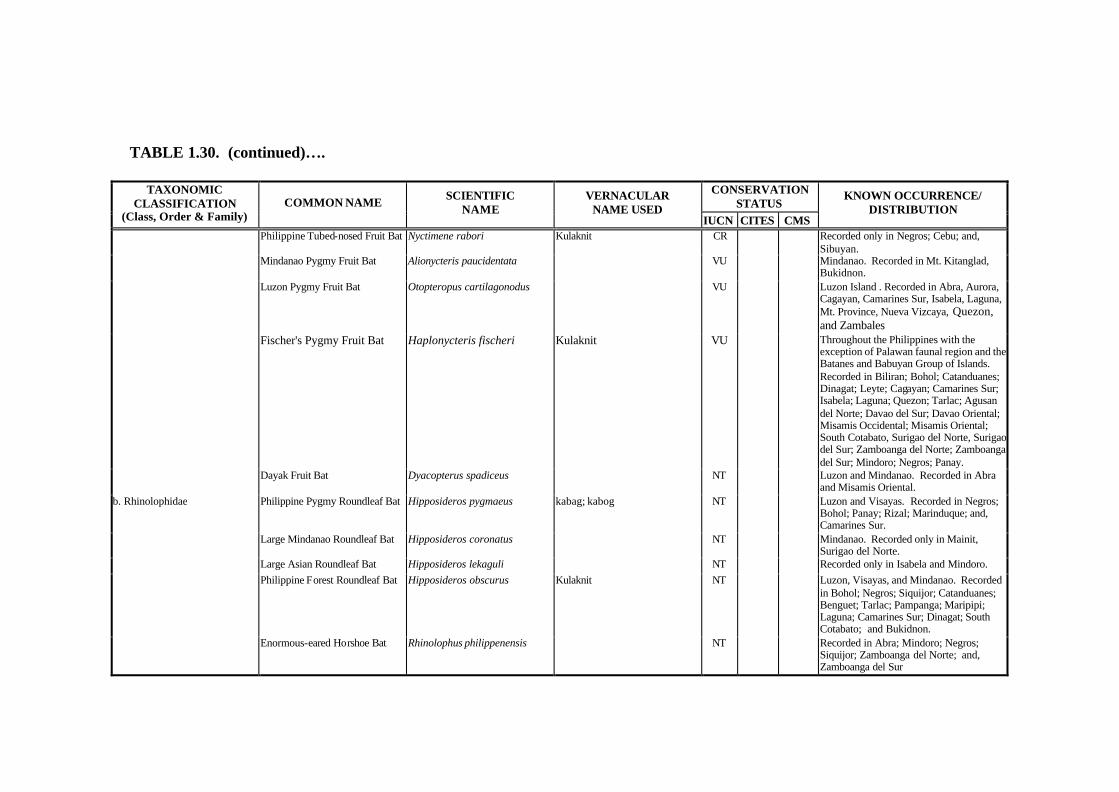
TABLE 1.30. (continued)….
CONSERVATION STATUS
TAXONOMIC CLASSIFICATION
(Class, Order & Family) COMMON NAME SCIENTIFIC
NAME VERNACULAR
NAME USED IUCN CITES CMS
KNOWN OCCURRENCE/ DISTRIBUTION
Philippine Tubed-nosed Fruit Bat Nyctimene rabori Kulaknit CR Recorded only in Negros; Cebu; and,
Sibuyan.
Mindanao Pygmy Fruit Bat Alionycteris paucidentata VU Mindanao. Recorded in Mt. Kitanglad,
Bukidnon.
Luzon Pygmy Fruit Bat Otopteropus cartilagonodus VU Luzon Island . Recorded in Abra, Aurora, Cagayan, Camarines Sur, Isabela, Laguna, Mt. Province, Nueva Vizcaya, Quezon, and Zambales
Fischer's Pygmy Fruit Bat Haplonycteris fischeri Kulaknit VU Throughout the Philippines with the exception of Palawan faunal region and the Batanes and Babuyan Group of Islands. Recorded in Biliran; Bohol; Catanduanes; Dinagat; Leyte; Cagayan; Camarines Sur; Isabela; Laguna; Quezon; Tarlac; Agusan del Norte; Davao del Sur; Davao Oriental; Misamis Occidental; Misamis Oriental; South Cotabato, Surigao del Norte, Surigao del Sur; Zamboanga del Norte; Zamboanga del Sur; Mindoro; Negros; Panay.
Dayak Fruit Bat Dyacopterus spadiceus NT Luzon and Mindanao. Recorded in Abra
and Misamis Oriental. b. Rhinolophidae Philippine Pygmy Roundleaf Bat Hipposideros pygmaeus kabag; kabog NT Luzon and Visayas. Recorded in Negros;
Bohol; Panay; Rizal; Marinduque; and, Camarines Sur.
Large Mindanao Roundleaf Bat Hipposideros coronatus NT Mindanao. Recorded only in Mainit, Surigao del Norte.
Large Asian Roundleaf Bat Hipposideros lekaguli NT Recorded only in Isabela and Mindoro. Philippine Forest Roundleaf Bat Hipposideros obscurus Kulaknit NT Luzon, Visayas, and Mindanao. Recorded
in Bohol; Negros; Siquijor; Catanduanes; Benguet; Tarlac; Pampanga; Maripipi; Laguna; Camarines Sur; Dinagat; South Cotabato; and Bukidnon.
Enormous-eared Horshoe Bat Rhinolophus philippenensis NT Recorded in Abra; Mindoro; Negros; Siquijor; Zamboanga del Norte; and, Zamboanga del Sur

TABLE 1.30. (continued)….
CONSERVATION STATUS
TAXONOMIC CLASSIFICATION
(Class, Order & Family) COMMON NAME SCIENTIFIC
NAME VERNACULAR
NAME USED IUCN CITES CMS
KNOWN OCCURRENCE/ DISTRIBUTION
Large Rufuos Horseshoe Bat Rhinolophus rufus kabag; kabog NT Recorded in Bohol; Catanduanes; Laguna; Leyte; Pampanga, Marinduque; Rizal; Mindoro; Polillo; Davao del Sur; and Maguindanao provinces
Small Rufous Horseshoe Bat Rhinolopus subrufus DD Recorded in Camiguin; Catanduanes; Abra, Isabela, Pampanga; Manila; Laguna; Mindoro, Camarines Sur, Sorsogon; Rizal; South Cotabato; and Davao del Sur
INSECTIVORA a. Erinaceidae Dinagat Moonrat/Dinagat
Gymnure/Dinagat Wood Shrew
Podogymnura aureospinula EN Dinagat Island
b. Soricidae Greater Mindanao White-toothed Shrew
Crocidura grandis Bubuit; bulilit EN Mindanao. Recorded only in Mt. Malindang, Misamis Occidental.
Mindoro White-toothed Shrew/Mindoro Shrew
Crocidura mindorus Bubuit; bulilit EN Mindoro and Sibuyan Islands.
Negros White-toothed Shrew/Negros Shrew
Crocidura negrina Bubuit; bulilit CR Negros Island
Palawan White-toothed Shrew/Palawan Shrew
Crocidura palawanensis Bubuit; bulilit VU Palawan only. Recorded in Balabac and Palawan mainland.
DERMOPTERA a. Cynocephalidae Flying Lemur Cynocephalus volans Gagua; Kago; Kalago; Kaabuit;
Mimmal(Samal-moro); Kabal(Mind); Kolago; Gigua(Tag); Kagwang (Bis)
VU
Visayas and Mindanao. Recorded in Basilan; Biliran; Bohol; Dinagat; Leyte; Maripipi; Agusan del Norte; Bukidnon; Davao City; Davao del Norte; Davao del Sur; Lanao del Norte; Lanao del Sur; Misamis Occidental; Misamis Oriental; South Cotabato; Surigao del Sur; Zamboanga del Norte; Zamboanga del Sur; Siargao; and Samar.
SIRENIA a. Dugongidae Sea Cow/Dugong Dugong dugon Dugong (Tag.), Duyong (Bis.);
Baboy dagat (Tag.); Dujong (Sur.); Navago (Batanes)
VU I II Indian and Pacific Oceans. In the country, recorded in Palawan, Isabela, Quezon and Southern Mindanao.
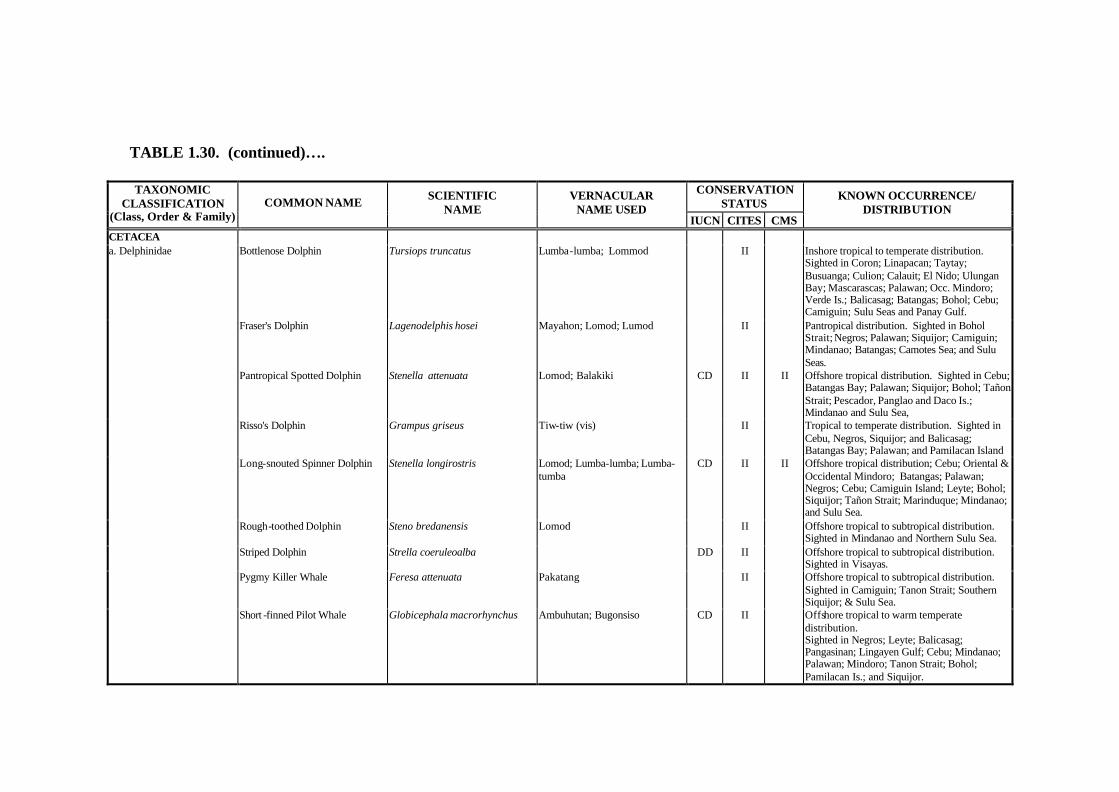
TABLE 1.30. (continued)….
CONSERVATION STATUS
TAXONOMIC CLASSIFICATION
(Class, Order & Family) COMMON NAME SCIENTIFIC
NAME VERNACULAR
NAME USED IUCN CITES CMS
KNOWN OCCURRENCE/ DISTRIBUTION
CETACEA a. Delphinidae Bottlenose Dolphin Tursiops truncatus Lumba-lumba; Lommod II Inshore tropical to temperate distribution.
Sighted in Coron; Linapacan; Taytay; Busuanga; Culion; Calauit; El Nido; Ulungan Bay; Mascarascas; Palawan; Occ. Mindoro; Verde Is.; Balicasag; Batangas; Bohol; Cebu; Camiguin; Sulu Seas and Panay Gulf.
Fraser's Dolphin Lagenodelphis hosei Mayahon; Lomod; Lumod II Pantropical distribution. Sighted in Bohol Strait; Negros; Palawan; Siquijor; Camiguin; Mindanao; Batangas; Camotes Sea; and Sulu Seas.
Pantropical Spotted Dolphin Stenella attenuata Lomod; Balakiki CD II II Offshore tropical distribution. Sighted in Cebu; Batangas Bay; Palawan; Siquijor; Bohol; Tañon Strait; Pescador, Panglao and Daco Is.; Mindanao and Sulu Sea,
Risso's Dolphin Grampus griseus Tiw-tiw (vis) II Tropical to temperate distribution. Sighted in Cebu, Negros, Siquijor; and Balicasag; Batangas Bay; Palawan; and Pamilacan Island
Long-snouted Spinner Dolphin Stenella longirostris Lomod; Lumba-lumba; Lumba-tumba
CD II II Offshore tropical distribution; Cebu; Oriental & Occidental Mindoro; Batangas; Palawan; Negros; Cebu; Camiguin Island; Leyte; Bohol; Siquijor; Tañon Strait; Marinduque; Mindanao; and Sulu Sea.
Rough-toothed Dolphin Steno bredanensis Lomod II Offshore tropical to subtropical distribution. Sighted in Mindanao and Northern Sulu Sea.
Striped Dolphin Strella coeruleoalba DD II Offshore tropical to subtropical distribution. Sighted in Visayas.
Pygmy Killer Whale Feresa attenuata Pakatang II Offshore tropical to subtropical distribution. Sighted in Camiguin; Tanon Strait; Southern Siquijor; & Sulu Sea.
Short -finned Pilot Whale Globicephala macrorhynchus Ambuhutan; Bugonsiso CD II Offshore tropical to warm temperate distribution. Sighted in Negros; Leyte; Balicasag; Pangasinan; Lingayen Gulf; Cebu; Mindanao; Palawan; Mindoro; Tanon Strait; Bohol; Pamilacan Is.; and Siquijor.
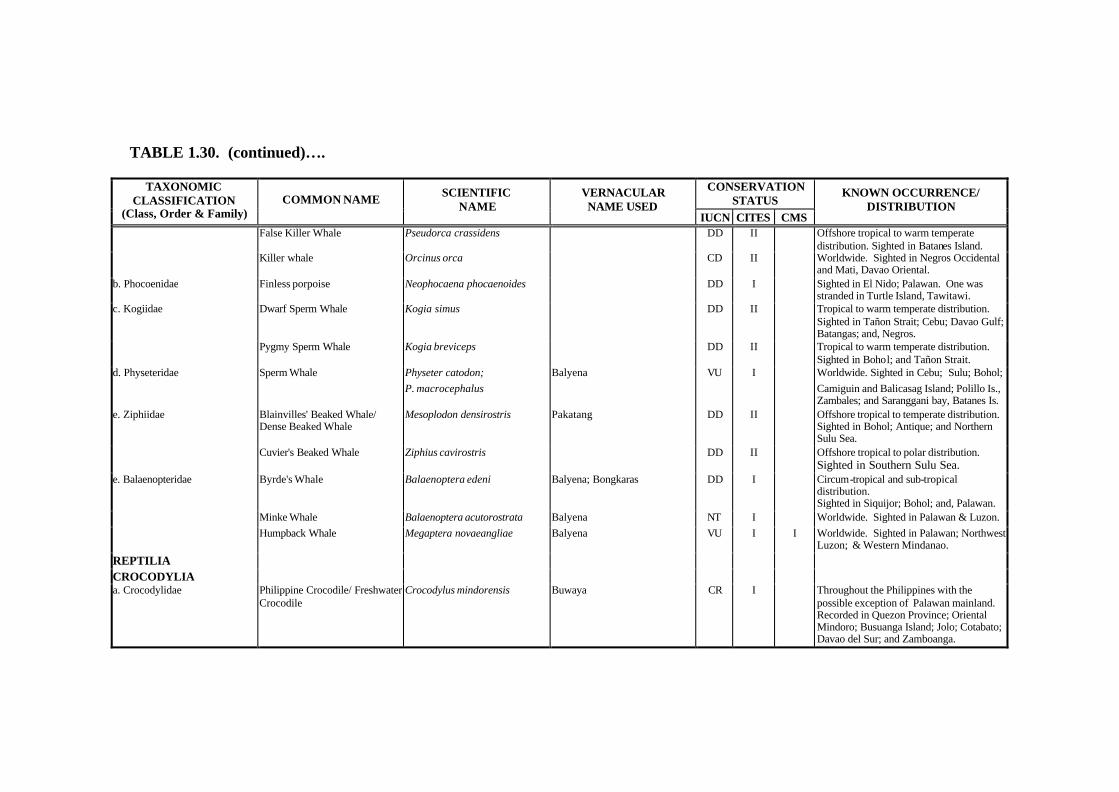
TABLE 1.30. (continued)….
CONSERVATION STATUS
TAXONOMIC CLASSIFICATION
(Class, Order & Family) COMMON NAME SCIENTIFIC
NAME VERNACULAR NAME USED
IUCN CITES CMS
KNOWN OCCURRENCE/ DISTRIBUTION
False Killer Whale Pseudorca crassidens DD II Offshore tropical to warm temperate
distribution. Sighted in Batanes Island.
Killer whale Orcinus orca CD II Worldwide. Sighted in Negros Occidental
and Mati, Davao Oriental. b. Phocoenidae Finless porpoise Neophocaena phocaenoides DD I Sighted in El Nido; Palawan. One was
stranded in Turtle Island, Tawitawi. c. Kogiidae Dwarf Sperm Whale Kogia simus DD II Tropical to warm temperate distribution.
Sighted in Tañon Strait; Cebu; Davao Gulf; Batangas; and, Negros.
Pygmy Sperm Whale Kogia breviceps DD II Tropical to warm temperate distribution.
Sighted in Bohol; and Tañon Strait. d. Physeteridae Sperm Whale Physeter catodon; Balyena VU I Worldwide. Sighted in Cebu; Sulu; Bohol; P. macrocephalus Camiguin and Balicasag Island; Polillo Is.,
Zambales; and Saranggani bay, Batanes Is. e. Ziphiidae Blainvilles' Beaked Whale/
Dense Beaked Whale Mesoplodon densirostris Pakatang DD II Offshore tropical to temperate distribution.
Sighted in Bohol; Antique; and Northern Sulu Sea.
Cuvier's Beaked Whale Ziphius cavirostris DD II
Offshore tropical to polar distribution. Sighted in Southern Sulu Sea.
e. Balaenopteridae Byrde's Whale Balaenoptera edeni Balyena; Bongkaras DD I Circum-tropical and sub-tropical distribution. Sighted in Siquijor; Bohol; and, Palawan.
Minke Whale Balaenoptera acutorostrata Balyena NT I Worldwide. Sighted in Palawan & Luzon.
Humpback Whale Megaptera novaeangliae Balyena VU I I Worldwide. Sighted in Palawan; Northwest
Luzon; & Western Mindanao. REPTILIA CROCODYLIA a. Crocodylidae Philippine Crocodile/ Freshwater
Crocodile Crocodylus mindorensis Buwaya CR I
Throughout the Philippines with the possible exception of Palawan mainland. Recorded in Quezon Province; Oriental Mindoro; Busuanga Island; Jolo; Cotabato; Davao del Sur; and Zamboanga.

TABLE 1.30. (continued)….
CONSERVATION STATUS
TAXONOMIC CLASSIFICATION
(Class, Order & Family) COMMON NAME SCIENTIFIC
NAME VERNACULAR
NAME USED IUCN CITES CMS
KNOWN OCCURRENCE/ DISTRIBUTION
Estuarine Crocodile/ Saltwater Crocodile
Crocodylus porosus Buwaya; Buaya I Throughout the Philippines. Recorded in Palawan; Cagayan; Isabela; Quezon; Aklan; Iloilo; Negros Occidental and Oriental; Cebu; Leyte; Samar; Bohol; Surigao del Norte; Agusan del Norte and del Sur; Cotabato; Lanao; Basilan; Zamboanga del Sur; and Davao.
SQUAMATA a. Varanidae Variable Monitor Lizard/ Water
Monitor Lizard Varanus salvator Bayawak II
Throughout the Philippines.
Gray's Monitor Lizard Varanus olivaceus Bayawak; Butaan; Baneas; Batua VU
Recorded in Laguna, Quezon, Manila, Albay, Camarines Norte, Camarines Sur; Sorsogon, Polillo, Catanduanes.
b. Agamidae Sailfin Lizard Hydrosaurus pustulatus DD
Throughout the Philippines except in Palawan. Recorded in Quezon; Zamboanga; Davao; Bohol; Negros; Mindoro; Catanduanes; Basilan; Camiguin Sur; Dinagat; Guimaras; Leyte;; Panay; Polillo; Siargao and Sibuyan; Cebu, Samar.
SERPENTES a. Boidae Reticulated Python Python reticulatus Sawa II Throughout the Philippines. b. Elapidae King Cobra Ophiophagus hannah Kobra II Palawan, Mindanao, Mindoro, Luzon and
Sulu Islands. TESTUDINATA Asiatic Cobra Naja naja Kobra II Palawan, Mindoro, Luzon, Mindanao,
Bohol, Samar and Leyte.

TABLE 1.30. (continued)….
CONSERVATION STATUS
TAXONOMIC CLASSIFICATION
(Class, Order & Family) COMMON NAME SCIENTIFIC
NAME VERNACULAR
NAME USED IUCN CITES CMS
KNOWN OCCURRENCE/ DISTRIBUTION
a. Cheloniidae Green Turtle Chelonia mydas Payukan, Bildog; Pudno; Pawikan; Talisayon; Magdarait; Mangdarahit; Daranawan; Wara-cara; Tortuga; Kutuan
EN I I Recorded in La Union; Batanes; Cagayan;Isabela; Bataan; Zambales; Batangas; Oriental & Occidental Mindoro; Palawan; Romblon; Marinduque; Albay; Sorsogon; Catanduanes; Negros Occ.; Iloilo; Antique; Capiz; Guimaras; Cebu; Negros Oriental; Bohol; Siquijor; Leyte; Samar; Basilan; Zamboanga del Sur; Zamboanga del Norte; Tawi-Tawi; Misamis Occ & Oriental; Camiguin; Agusan del Norte; Surigao del Norte and Sur; South Cotabato; Davao del Sur and Davao Oriental.
Hawksbill Turtle Eretmochelys imbricata Karahan; Sisikan; Pawikan; Payukan; Ulaniban; Kinarahan
CR I I Recorded in La Union; Batanes; Cagayan; Isabela; Zambales; Quezon; Mindoro Occidental; Palawan Marinduque; Albay; Sorsogon; Negros Occidental; Iloilo; Antique; Capiz; Cebu; Negros Oriental; Leyte; Samar; Biliran; Zamboanga del Sur; & del Norte; Basilan; Sulu; Misamis Occ. & Oriental; Camiguin; Agusan del Norte; Surigao del Sur; Davao Oriental; South Cotabato.
Olive Ridley Turtle Lepidochelys olivacea Pawikan; Mukoy EN I I Recorded in La Union; Batanes; Isabela; Zambales; Oriental Mindoro; Palawan; Marinduque; Albay; Sorsogon; Catanduanes; Negros Occidental; Cebu; Pangasinan; Negros, Oriental; Bohol; Leyte; Eastern Samar, Zamboanga del Norte & Sur; Misamis Occidental& Oriental; South Cotabato; Davao Oriental.

TABLE 1.30. (continued)….
CONSERVATION STATUS
TAXONOMIC CLASSIFICATION
(Class, Order & Family) COMMON NAME SCIENTIFIC
NAME VERNACULAR
NAME USED IUCN CITES CMS
KNOWN OCCURRENCE/ DISTRIBUTION
Loggerhead Turtle Caretta caretta Pawikan; Bulawon EN I I Confirmed sightings Palawan ; Albay; and,
Basilan. b. Dermocheliidae Leatherback Turtle Dermochelys coriacea Pawikan; Binalimbing;
Manahanga; Kulod; Ratong; Kantuhan
EN I I Romblon; Marinduque; Negros Oriental; Southern Leyte; Zamboanga del Norte; and, Agusan del Norte.
c. Emydidae Leyte Pond Turtle/ Leyte Freshwater Turtle/ Philippine Pond Turtle
Geoemyda (Heosemys) leytensis Bao (Bis); Bao-o (Kitanglad) Pagong (Tag)
EN Recorded only in Cabalian, Southern Leyte and Taytay, Northern Palawan
South Asian Box Turtle Cuora amboinensis Pagong; Pawikan NT Throughout the Philippines d. Trionychidae Asian Giant Softshell Turtle Pelochelys bibroni Pagong VU Agusan Marsh and Quezon.
Conservation Status : CR - Critically Endangered CD - Conservation Dependent DD - Data Deficient I - Indeterminate LR - Lower Risk R – Rare EN - Endangered NT - Near Threatened EX - Extinct VU - Vulnerable LC - Least Concern Source: Wildlife Resources Division, PAWB, DENR

TABLE 1.31: PROCLAIMED PROTECTED/DECLARED AREAS UNDER NIPAS, (as of year 2002)
NAME OF PROTECTED AREA LOCATION LEGISLATION DATE AREA (ha)
Resource Reserve Proc. 268 23-Apr-00 77,561.00
Cordillera Administrative Region Upper Agno River Basin Resource
Reserve* Atok, Buguias, Itogon, Kabayan, Tublay, Kibungan, La Trinidad, Benguet Province, Hungduan, and Kiangan, Ifugao Province, Kayapa, Province of Nueva Vizcaya
Region 1 Protected Landscape and Seascape Lidlidda Protected Landscape* Lidlidda, Banayoyo, Ilocos Sur Proc. 266 23-Apr-00 2266.49
Agoo, Sto. Tomas and Rosario, La Union Proc. 277 23-Apr-00 PA 10,513.30
Agoo-Damortis Protected Landscape and Seascape*
BZ 135.64 Libunao Protected Landscape* Sinait, Ilocos Sur Proc. 280 23-Apr-00 46.700 Bigbiga Protected Landscape* Narvacan, Ilocos Sur Proc. 290 23-Apr-00 135.714 Sta. Lucia Protected Landscape* Balidbed, Salcedo, Ilocos Sur Proc. 297 23-Apr-00 174.160 Natural Monument/Landmark
Bessang Pass Natural Monument/Landmark* Cervantes, Ilocos Sur Proc. 284 23-Apr-00 1,121.108
BZ 427.792 Region 2 Protected Landscape and Seascape
Peñablanca Protected Landscape* Peñablanca, Cagayan Proc. 416 29-Jun-94 4,136.00

TABLE 1.31. (continued)….
NAME OF PROTECTED AREA LOCATION LEGISLATION DATE AREA (ha)
Magapit Protected Landscape* Gattaran and Lallo, Cagayan Proc. 285 23-Apr-00 3,403.62 Casecnan Protected Landscape* Dupax del Norte, Dupax del Sur Proc. 289 23-Apr-00 88,846.80 Nueva Vizcaya, Madella and Dipaculao, Quirino and Aurora Batanes Protected Landscape/Seascape Batanes Proc. 335 28-Feb-94 213,578.00 National Parks Northern Sierra Madre Natural Park* Palanan, Dinilacan, Maconacon Proc. 978 10-Mar-97 247,861 Ilagan, San Mariano, Dinapigue water 71,652 and Isabela Natural Monument Salinas Natural Monument* Bambang, Kayapa and Proc. 275 23-Apr-00 6,675.56 Aritao, Nueva Vizcaya Marine Reserve Palaui Island Marine Reserve Sta. Ana, Cagayan Proc. 447 28-Aug-94 7,415..480 Region 3 Protected Landscape Roosevelt Protected Landscape* Dinalupihan and Hermosa, Bataan Proc. 273 23-Apr-00 786.040 Marine Reserve
Masinloc and Oyon Bay Marine Reserve Masinloc, Oyon, Zambales Proc. 231 18-Aug-93 7,568.000

TABLE 1.31. (continued)….
NAME OF PROTECTED AREA LOCATION LEGISLATION DATE AREA (ha)
Region 4-A Natural Park Taal Volcano Natural Park* Proc. 923 19-Nov-96 62,292.137
Talisay, Malvar, Tanauan, Laurel, Agoncillo, Santa Teresita, Cuenca, Alitagtag, Mataas na Kahoy, Lipa City, Balete, San Nicolas, Province of Batangas and Tagaytay City
Protected Landscape/Seascape
Simbahan-Talagas Protected Landscape*
Dinalungan, Aurora Province Proc. 267 23-Apr-00 1,157.4379
Amro River Protected Landscape* Casiguran and Dilasag, Aurora Province Proc. 274 23-Apr-00 6,471.08 Dipaculao, Aurora. Proc. 278 23-Apr-00 3,371.33
Dinadiawan River Protected Landscape*
Talaytay Protected Landscape* Dinalungan, Aurora Proc. 283 23-Apr-00 3,526.29 Buenavista Protected Landscape* Mulanay, Quezon Proc. 294 23-Apr-00 284.27 Maulawin Spring Protected Landscape*Guinyangan, Quezon Proc. 295 23-Apr-00 149.01 Antipolo, Rizal Proc. 412 17-Nov-00 3.2
Hinulugang Taktak Protected Landscape*
Pamitinan Protected Landscape Rodriguez, Rizal Proc. 901 10-Oct-96 600.00 Region 4-B Natural Park
Puerto Princesa Subterranean Natural Park*
Puerto Princesa Proc. 212 12-Nov-99 22,202.00
Mt. Guiting-Guiting Natural Park Casidiocan, Magdiwang, San Fernando, Proc. 746 20-Feb-96 15,265.00 Sibuyan, Romblon Apo Reef Natural Park Sablayan, Occidental Mindoro Proc. 868 6-Sep-96 15,792.00

TABLE 1.31. (continued)….
NAME OF PROTECTED AREA LOCATION LEGISLATION DATE AREA (ha)
Wildlife Sanctauary Mt. Calavite Wildlife Sanctuary* Paluan, Occidental Mindoro Proc. 292 23-Apr-00 18,016.19
Resource Reserve El Nido Managed Resource Protected Area El Nido, Palawan Proc. 32 8-Oct-98 89,134.76 Protected Landscape/Seascape Malampaya Sound Protected Taytay and San Vicente, Palawan Proc. 342 12-Jul-00 200,115.00 Landscape/Seascape
Region 5 Wildlife Sanctuary Chico Island Wildlife Sanctuary* Cawayan, Masbate Proc. 272 23-Apr-00 7.770 Naro Island Wildlife Sanctuary Cawayan, Masbate Proc. 317 31-May-00 109.980 Protected Landscape/Seascape
Malabungot Protected Landscape and Seascape
Gatchitorena, Camarines Sur Proc. 288 23-Apr-00 120.620
Natural Biotic Area Lagonoy Natural Biotic Area* Lagonoy, Camarines Sur Proc. 298 23-Apr-00 444.600
Abasig Matogdon Mananap Natural Biotic Area
San Vicente, San Lorenzo Ruiz and Labo, Camarines Norte
Proc. 318 31-May-00 5,420.120
Natural park Bongsalay Natural Park* Batuan, Masbate Proc. 319 31-May-00 244.721
Mayon Volcano Natural Park* Albay, Camalig, Guinobatan, Libon,
Malilipot & Tabaco, Albay Proc. 413 21-Nov-00 5,775.700
Bicol Natural Park* Mun. of Baasud & Daet, Cam. Norte
Mun. Sipocot & Lupi, Cam. Sur Proc.431 29-Dec-00 5,201.000
Mt. Isarog Natural Park * Naga, Calabanaga, Tinambac, Goa,
Tigaon & Pili, Camarines Sur. Proc. 214 20-Jun-02
10,112.35
Bulusan Volcano Natural Park* Casiguran, Barcelona, Irosin & Juban
Province of Sorsogon. Proc. 421 27-Nov-00
3,672.00

TABLE 1.31. (continued)….
NAME OF PROTECTED AREA LOCATION LEGISLATION DATE AREA (ha)
Region 6 Natural Park Canlaon Natural Park Murcia and La Castellana, Bago Proc. 1005 8-May-97 PA 24,557.000 Mt. Kanl-on Natural Park* La Carlota, Canlaon and San Carlos BZ 169.000 Sibalom Natural Park* Sibalom, Antique Proc. 282 23-Apr-00 5,511.470
Northwest Panay Peninsula Natural Park Nabas, Malay, & Buruanga,
Aklan/Libertad & Pandan, Antique. Proc. 186 18-Apr-02
12,009.29
Protected Landscape/Seascape Sagay Protected Seascape Sagay, Negros Occidental Proc. 592 1-Jun-95 28,300.000 Sagay Marine Reserve RA. 9106 4-Apr-01 32,000.000
Region 7 Protected Landscape/Seascape Municipality of Talibon, Bohol Proc. 923 5-Jul-98 6,455.870
Talibon Group of Islands Protected Landscape/Seascape*
Rajah Sikatuna Protected Landscape* Proc. 287 23-Apr-00 10,452.600
Carmen, Sierra Bullones, Garcia Hernandez, Valencia, Dimia, Bilar and Batuan, Bohol
Proc. 293 23-Apr-00 1,164.160
Alburquerque-Loay-Loboc Protected Landscape/Seascape*
San Agustin, Bahi, Epo, Sta. Fe and Tagbanue, Alburquerque, Coastal Reef of Loay and Riverside of Loay & Riverside of Loboc, Bohol
Apo Island Protected Landscape/Seascape Zamboangita, Negros Oriental Proc. 438 9-Aug-96 691.000
Tañon Strait Protected Seascape Cebu, Negros Occidental and Negros
Oriental Proc. 1234 22-May-98 450.000
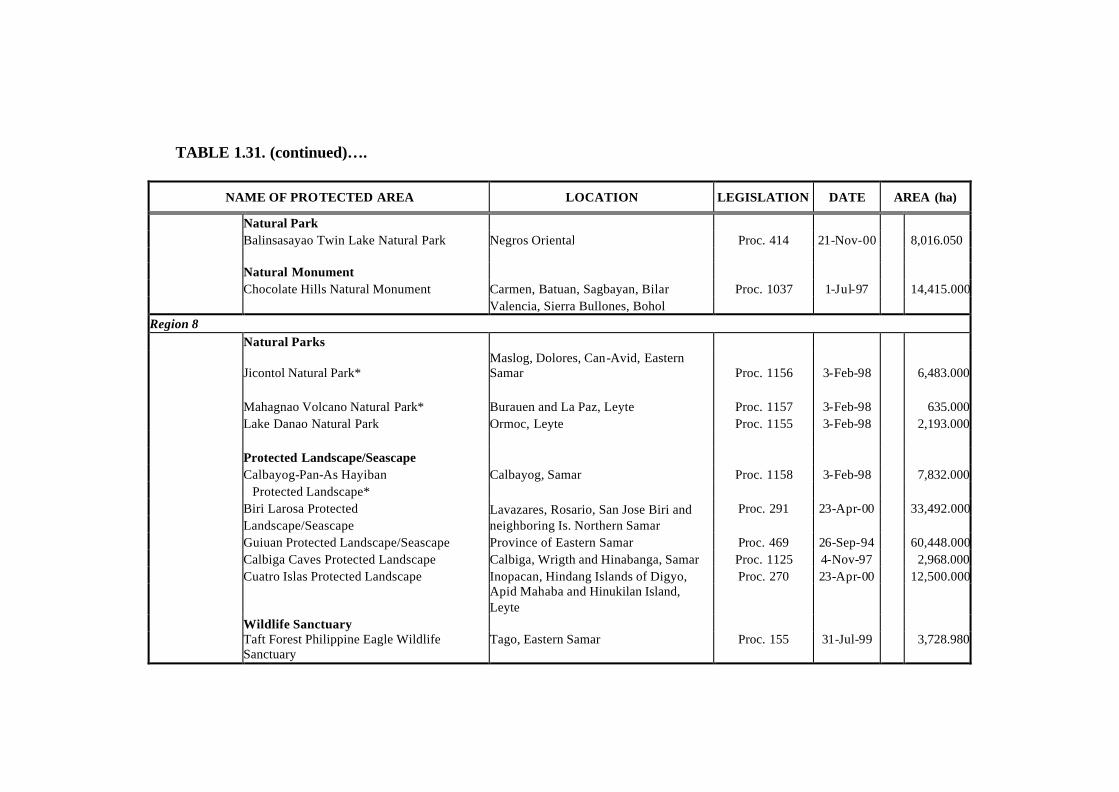
TABLE 1.31. (continued)….
NAME OF PROTECTED AREA LOCATION LEGISLATION DATE AREA (ha)
Natural Park Balinsasayao Twin Lake Natural Park Negros Oriental Proc. 414 21-Nov-00 8,016.050 Natural Monument Chocolate Hills Natural Monument Carmen, Batuan, Sagbayan, Bilar Proc. 1037 1-Jul-97 14,415.000 Valencia, Sierra Bullones, Bohol
Region 8 Natural Parks
Jicontol Natural Park* Maslog, Dolores, Can-Avid, Eastern Samar Proc. 1156 3-Feb-98 6,483.000
Mahagnao Volcano Natural Park* Burauen and La Paz, Leyte Proc. 1157 3-Feb-98 635.000 Lake Danao Natural Park Ormoc, Leyte Proc. 1155 3-Feb-98 2,193.000
Protected Landscape/Seascape Calbayog-Pan-As Hayiban Calbayog, Samar Proc. 1158 3-Feb-98 7,832.000 Protected Landscape* Biri Larosa Protected Proc. 291 23-Apr-00 33,492.000 Landscape/Seascape
Lavazares, Rosario, San Jose Biri and neighboring Is. Northern Samar
Guiuan Protected Landscape/Seascape Province of Eastern Samar Proc. 469 26-Sep-94 60,448.000 Calbiga Caves Protected Landscape Calbiga, Wrigth and Hinabanga, Samar Proc. 1125 4-Nov-97 2,968.000 Cuatro Islas Protected Landscape Inopacan, Hindang Islands of Digyo, Proc. 270 23-Apr-00 12,500.000
Apid Mahaba and Hinukilan Island, Leyte
Wildlife Sanctuary
Taft Forest Philippine Eagle Wildlife Sanctuary
Tago, Eastern Samar Proc. 155 31-Jul-99 3,728.980

TABLE 1.31. (continued)….
NAME OF PROTECTED AREA LOCATION LEGISLATION DATE AREA (ha)
Region 9 Natural Biotic Area Buug Natural Biotic Area* Buug, Zamboanga del Sur Proc. 63 22-Dec-98 1,095.000 BZ 470.000 Basilan Natural Biotic Area* Lamitan, Sumisip, Tipo-Tipo Proc. 321 31-May-00 4497.000 and Isabela, Basilan BZP1 78.000 BZP2 373.000 BZP3 750.000 BZP4 818.000 Resource Reserve Siocon Resource Reserve* Siocon, Zamboanga del Norte Proc. 84 22-Feb-99 186.000 Natural Park Pasonanca Natural Park* Zamboanga City Proc. 132 5-Jul-99 PA- 681 BZ 4,626 Protected Landscape/Seascape
Great and Little Sta. Cruz Islands Protected Landscape and Seascape*
Zamboanga City Proc. 271 23-Apr-00 1,548.000
Jose Rizal Memorial Protected Landscape* Dapitan City, Zamboanga del Norte Proc. 279 23-Apr-00 439.000 Aliguay Island Protected Landscape/Seascape Dapitan City, Zamboanga del Norte Proc. 106 6-May-99 1,187.509
Dumanquilas Protected Landscape/Seascape Malanga, Buug, Margosatubig Sagun,
Zamboanga del Sur Proc. 158 10-Aug-99 25,948.000 BZ 3,714.98
Selinog Island Protected Landscape and Seascape
Dapitan City, Zamboanga del Norte Proc. 276 23-Apr-00 1,294.350
Labason, Zamboanga del Norte Proc. 281 23-Apr-00 151.000
Murcialagus Island Protected Landscape and Seascape BZ 150.000
Mt. Timolan Protected landscape Proc. 354 14-Aug-00 1,994.796
San Miguel, Gulpos & Tigbao, Zamboanga del Sur BZ 695.393

TABLE 1.31. (continued)….
NAME OF PROTECTED AREA LOCATION LEGISLATION DATE AREA (ha)
Wildlife Sanctuary Turtle Island Wildlife Sanctuary Tawi-Tawi Proc. 171 26-Aug-99 242649.000 land 318.000
Region 10
Natural Park Mt. Kitanglad Natural Park Talakag, Banagon, Libona Proc. 896 24-Sep-96 29,716.000 Manolo Fortich, Sumilao, Impasug-ong, BZ (10460.000) Mt. Kitanglad Range Protected Area* Malaybalay & Lantapan, Bukidnon RA. 8978 9-Nov-00 31,235.190 BZ 16034.81 Mt. Kalatungan Range Natural Park* Valencia, Maramag and Proc. 305 5-May-00 13,891.500 Pangantungan, Bukidnon BZ 13891.500 Mt. Malindang Natural Park* Misamis Occidental Proc. 228 02-Aug-02 34,694.00 Protected Landscape/Seascape Baliangao Protected Landscape/Seascape Misamis Occidental Proc. 418 22-Nov-00 294.998 Mimbilisan Protected Landscape* Talisayan and Balingoan, Proc. 134 5-Jul-99 66.000 Misamis Oriental
Initao-Libertad Protected Landscape and Seascape*
Initao and Libertad Misamis Oriental Proc. 260 16-Sep-02
1,300.78
Region 11 Natural Park Mt. Apo Natural Park* Kidapawan, Makilala, Magpet, Proc. 882 24-Sep-96 72,113.000 Cotabato and Bansalan, Digos Sta. Cruz, Davao City Protected Landscape/Seascape Baganga Protected Landscape* Baganga, Davao Oriental Proc. 269 23-Apr-00 114.878 Mabini Protected Landscape and Seascape* Nabunturan, Compostela Valley Proc. 316 15-May-00 6,106.000

TABLE 1.31. (continued)….
NAME OF PROTECTED AREA LOCATION LEGISLATION DATE AREA (ha)
Mainit Hotspring Protected Landscape* Nabunturan, Compostela Valley Proc. 320 31-May-00 1,374.000 BZ 401.000 Pujada Bay Protected Landscape/Seascape Mati-Davao Oriental Proc. 431 31-Jul-94 21,200.000
Region 12 Protected Landscape/Seascape Sarangani Bay Protected Seascape Maitum, Kiamba, Maasim, Sarangani Proc. 756 5-Mar-96 215,950.000 Mt. Matutum Protected Landscape Tupi, Tampakan, Palomolok, South Proc. 552 20-Mar-95 15,600.000 Cotabato and Malungon, Sarangani
Region 13 Protected Landscape/Seascape
Siargao Protected Landscape/Seascape* Siargao, Surigao del Norte Proc. 902 10-Oct-96 278,914.131 BZ 4360.569 Wildlife Sanctuary Agusan Marsh Wildlife Sanctuary San Francisco, Bunawan, De Ruela, Proc. 913 31-Oct-96 14,835.989 Loreto and Lapaz BZ 4360.569 Province of Agusan del Sur
*Initial Components PA - Protected Area BZ - Buffer Zone Source : Biodiversity Management Division, PAWB, DENR

TABLE 1.32a. SUMMARY OF PROTECTED AREAS BY REGION, 1992 (area in hectares)
National Park Game Refuges and Bird Sanctuaries
Wilderness Areas Total
Region
No. Area (has.) No. Area (has.) No. Area (has.) No. Area (has.)
NCR 1 24.00 1 24.00 CAR 4 15,795.00 4 15,795.00 Region I 5 12,998.65 5 12,998.65 Region II 2 3,673.00 1 3,344.00 2 1,095.00 5 8,112.00 Region III 7 35,611.25 1 12.35 8 35,623.60 Region IV 11 183,432.18 5 906,823.00 1 430.00 17 1,090,685.18 Region V 6 24,811.69 3 465.00 9 25,276.69 Region VI 3 24,650.38 1 52.00 4 24,702.38 Region VII 4 23,575.08 1 480.00 2 12,656.00 7 36,711.08 Region VIII 5 4,038.78 5 4,038.78 Region IX 3 3,323.35 3 3,323.35 Region X 3 84,616.00 1 4,194.60 4 88,810.60 Region XI 2 53,642.59 1 14.82 3 53,657.41 Region XII 7 22,282.00 2 36,300.00 9 58,582.00 Caraga ARMM
Philippines 63 492,473.95 11 947,011.35 10 18,855.42 84 1,458,341 Source: PAWB, DENR
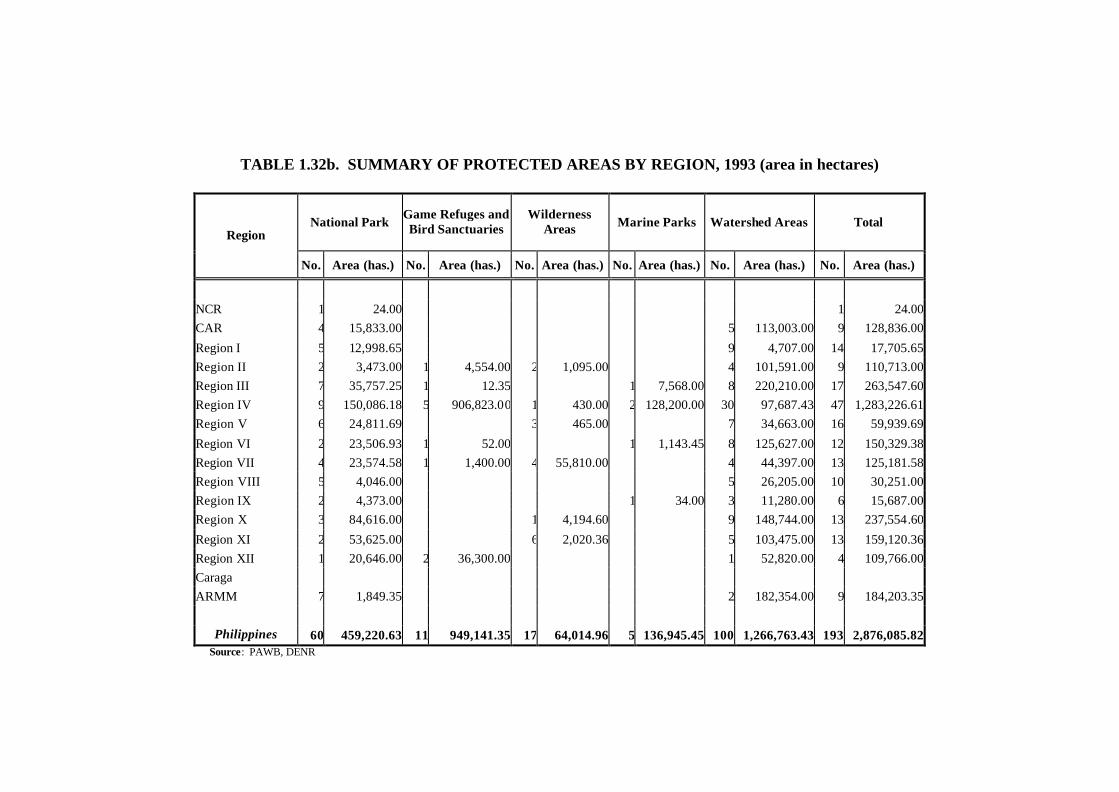
TABLE 1.32b. SUMMARY OF PROTECTED AREAS BY REGION, 1993 (area in hectares)
National Park Game Refuges and Bird Sanctuaries
Wilderness Areas Marine Parks Watershed Areas Total
Region
No. Area (has.) No. Area (has.) No. Area (has.) No. Area (has.) No. Area (has.) No. Area (has.)
NCR 1 24.00 1 24.00 CAR 4 15,833.00 5 113,003.00 9 128,836.00
Region I 5 12,998.65 9 4,707.00 14 17,705.65 Region II 2 3,473.00 1 4,554.00 2 1,095.00 4 101,591.00 9 110,713.00 Region III 7 35,757.25 1 12.35 1 7,568.00 8 220,210.00 17 263,547.60 Region IV 9 150,086.18 5 906,823.00 1 430.00 2 128,200.00 30 97,687.43 47 1,283,226.61 Region V 6 24,811.69 3 465.00 7 34,663.00 16 59,939.69
Region VI 2 23,506.93 1 52.00 1 1,143.45 8 125,627.00 12 150,329.38 Region VII 4 23,574.58 1 1,400.00 4 55,810.00 4 44,397.00 13 125,181.58 Region VIII 5 4,046.00 5 26,205.00 10 30,251.00 Region IX 2 4,373.00 1 34.00 3 11,280.00 6 15,687.00 Region X 3 84,616.00 1 4,194.60 9 148,744.00 13 237,554.60
Region XI 2 53,625.00 6 2,020.36 5 103,475.00 13 159,120.36 Region XII 1 20,646.00 2 36,300.00 1 52,820.00 4 109,766.00 Caraga ARMM 7 1,849.35 2 182,354.00 9 184,203.35
Philippines 60 459,220.63 11 949,141.35 17 64,014.96 5 136,945.45 100 1,266,763.43 193 2,876,085.82 Source: PAWB, DENR

TABLE 1.32c. SUMMARY OF PROTECTED AREAS BY REGION, 1994 (area in hectares)
National Park Game Refuges and Bird Sanctuaries Wilderness Areas Marine Parks Watershed Areas Total
Region
No. Area (has.) No. Area (has.) No. Area (has.) No. Area (has.) No. Area (has.) No. Area (has.)
NCR 1 24.00 1 24.00
CAR 4 15,833.00 6 113,008.98 10 128,841.98 Region I 5 12,998.65 10 6,167.00 15 19,165.65 Region II 2 3,473.00 1 4,554.00 2 1,095.00 5 119,261.00 10 128,383.00 Region III 7 35,757.25 1 12.35 8 221,385.10 16 257,154.70 Region IV 10 150,086.18 5 906,823.00 1 430.00 2 128,200.00 35 106,295.57 53 1,291,834.75
Region V 6 24,811.69 3 465.00 10 36,564.95 19 61,841.64 Region VI 2 23,506.93 1 52.00 1 1,143.45 8 125,627.00 12 150,329.38 Region VII 4 23,575.08 2 1,400.00 4 55,810.00 5 96,913.00 15 177,698.08 Region VIII 5 4,046.00 6 27,009.00 11 31,055.00 Region IX 2 3,110.00 1 34.00 3 11,280.00 6 14,424.00
Region X 3 84,616.00 1 4,194.60 8 148,717.00 12 237,527.60 Region XI 2 53,625.00 6 2,020.36 6 110,227.00 14 165,872.36 Region XII 1 20,646.00 2 36,300.00 1 52,820.00 4 109,766.00 Caraga ARMM 7 1,849.35 2 182,354.00 9 184,203.35
Philippines 61 457,958.13 12 949,141.35 17 64,014.96 4 129,377.45 113 1,357,629.60 207 2,958,121.49
Source: PAWB, DENR

TABLE 1.32d. SUMMARY OF PROTECTED AREAS BY REGION, 1995 (area in hectares)
National Park Game Refuges and Bird Sanctuaries Wilderness Areas Watershed Areas Total Region
No. Area (has.) No. Area (has.) No. Area (has.) No. Area No. Area
NCR 1 24.00 1 24.00 CAR 4 18,457.00 6 113,008.98 10 131,465.98 Region I 5 12,998.65 10 6,167.00 15 19,165.65 Region II 1 819.00 1 4,554.00 2 1,095.00 5 119,261.00 9 125,729.00 Region III 7 31,425.25 1 12.35 8 221,385.10 16 252,822.70 Region IV 11 187,618.18 5 906,823.00 1 430.00 35 107,399.19 52 1,202,270.37 Region V 6 24,811.69 3 465.00 10 36,564.95 19 61,841.64 Region VI 3 26,555.38 1 52.00 9 131,777.00 13 158,384.38 Region VII 4 21,670.08 2 1,400.00 4 55,810.00 5 96,913.00 15 175,793.08 Region VIII 5 4,046.00 7 28,874.99 12 32,920.99 Region IX 2 3,110.00 4 11,456.00 6 14,566.00 Region X 3 84,616.00 1 4,194.60 8 148,717.00 12 237,527.60 Region XI 2 74,177.00 6 2,020.36 7 111,364.29 15 187,561.65 Region XII 1 94.00 2 36,300.00 1 52,820.00 4 89,214.00 Caraga ARMM 7 1,849.35 2 182,354.00 9 184,203.35
Philippines 62 492,271.58 12 949,141.35 17 64,014.96 117 1,368,062.50 208 2,873,490.39 Source: PAWB, DENR

TABLE 1.32e. SUMMARY OF PROTECTED AREAS BY REGION, 1996 *(area in hectares)
National Park Game Refuges and Bird Sanctuaries Wilderness Areas Wildlife Sanctuary Watershed Forest
Reserve Mangrove Swamp
Forest Reserve Virgin Forest Old Growth Mossy/Forest Total Region
No. Area (has.) No. Area (has.) No. Area (has.) No. Area (has) No. Area (has) No. Area (has) No. Area (has) No. Area (has) No. Area (has)
NCR 1 58.85 1 58.85
CAR 4 18,457.00 5 119,095.00 9 137,552.00
Region I 7 20,994.95 9 4,826.00 16 25,820.95
Region II 2 4,955.00 2 10,119.00 1 1,095.00 4 101,591.00 9 117,760.00
Region III 7 31,406.00 1 12.00 7 211,611.00 15 243,029.00
Region IV 15 160,367.85 3 906,799.00 1 430.00 24 60,410.00 43 1,128,006.85
Region V 7 42,422.00 4 465.00 10 32,821.00 21 75,708.00
Region VI 3 26,555.00 7 125,195.00 7 undetermined 10 151,750.00
Region VII 4 21,671.00 6 undetermined 1 920.00 3 29,863.00 14 52,454.00
Region VIII 5 2,118.00 3 17,614.00 2 undetermined 3 18,720.00 14 38,904.00
1 452.00
Region IX 3 3,110.00 4 11,280.00 7 14,390.00
Region X 3 84,616.00 1 undetermined 4 114,970.00 1 undetermined 6 undetermined 8 199,586.00
Region XI 2 74,195.00 1 Undetermined 9 103,475.00 12 177,670.00
Region XII 1 94.00 1 6,300.00 1 52,820.00 3 59,214.00
Caraga 1 3 32,089.00 1 18.00 5 32,107.00
ARMM 7 1,849.00 2 182,354.00 4 undetermined 13 184,203.00
Philippines 71 492,869.65 7 923,230.00 15 1,990.00 1 920.00 95 1,200,014.00 9 470.00 7 9 18,720.00 200 2,638,213.65
These are the initial components of National Integrated Protected Areas System as of 1996. Source: PAWB, DENR

TABLE 1.32f. SUMMARY OF PROTECTED AREAS BY REGION, 1997 (area in hectares)
Initial Components Other Protected Areas National Parks, National Marine Parks, National Marine Reserve
Game Refuge & Bird Sanctuary Wilderness Area
Watershed Forest Reserve Mangrove Swamp Tourist Zone and
Marine Reserve
Protected Areas Declared thru
Admin. Memo. Order
Newly Proclaimed Protected Areas Under NIPAS
Category
Total Region
No. Area (has.) No. Area (has.) No. Area (has.) No. Area (has.) No. Area (has.) No. Area (has.) No. Area (has.) No. Area (has.) No. Area (has.)
NCR 3 540.00 0 0.00 0 0.00 0 0.00 0 0.00 0 0.00 0 0.00 0 0.00 3 540.00
CAR 4 18,457.00 0 0.00 0 0.00 5 119,096.00 0 0.00 0 0.00 0 0.00 0 0.00 9 137,553.00
Region I 7 20,995.00 0 0.00 0 0.00 9 4,826.00 0 0.00 0 0.00 0 0.00 0 0.00 16 25,821.00
Region II 1 819.00 2 10,119.00 2 1,095.00 4 101,591.00 0 0.00 1 undetermined 0 0.00 4 544,642.00 14 658,266.00
Region III 7 31,405.00 1 12.00 0 0.00 7 211,611.00 0 0.00 0 0.00 0 0.00 1 7,568.00 16 250,596.00
Region IV 12 183,024.00 3 906,799.00 1 430.00 24 60,410.00 6 undetermined 32 undetermined 7 95024.00 4 93,949.00 89 1,339,636.00
Region V 7 42,423.00 0 0.00 4 465.00 5 32,821.00 7 undetermined 0 0.00 0 0.00 0 0.00 23 75,709.00
Region VI 6 23,667.00 1 920.00 4 1,307.00 10 155,058.00 5 undetermined 12 undetermined 3 532.00 4 55,324.00 45 236,808.00
Region VII 0 0 0 0.00 0 0.00 0 0.00 0 0.00 0 0.00 0 0.00 0 0.00 0 -
Region VIII 5 2,118.00 0 0.00 0 0.00 3 17,614.00 1 undetermined 1 undetermined 1 2193.00 1 60,448.00 12 82,373.00
Region IX 3 3,110.00 0 0.00 0 0.00 3 11,280.00 1 undetermined 5 undetermined 0 0.00 0 0.00 12 14,390.00
Region X 2 53,319.00 0 0.00 0 0.00 4 114,970.00 2 undetermined 2 undetermined 0 0.00 1 29,716.00 11 198,005.00
Region XI 2 73,494.00 0 0.00 1 undetermined 5 103,589.00 1 undetermined 3 undetermined 0 0.00 2 93,313.00 14 270,396.00
Region XII 1 48.00 1 6,300.00 0 0.00 2 54,714.00 0 0.00 0 0.00 3 30000.00 2 231,550.00 9 322,612.00
Caraga 0 0.00 0 0.00 4 undetermined 3 32,089.00 3 undetermined 0 0.00 0 0.00 2 293,750.00 12 325,839.00
ARMM 7 1,895.00 0 0.00 0 0.00 1 180,460.00 1 undetermined 0 0.00 0 0.00 0 0.00 9 182,355.00
Philippines 67 455,314.00 8 924,150.00 16 3,297.00 85 1,200,129.00 27 undetermined 56 undetermined 14 127,749.00 21 1,410,260.00 294 4,120,899.00
Source: PAWB, DENR
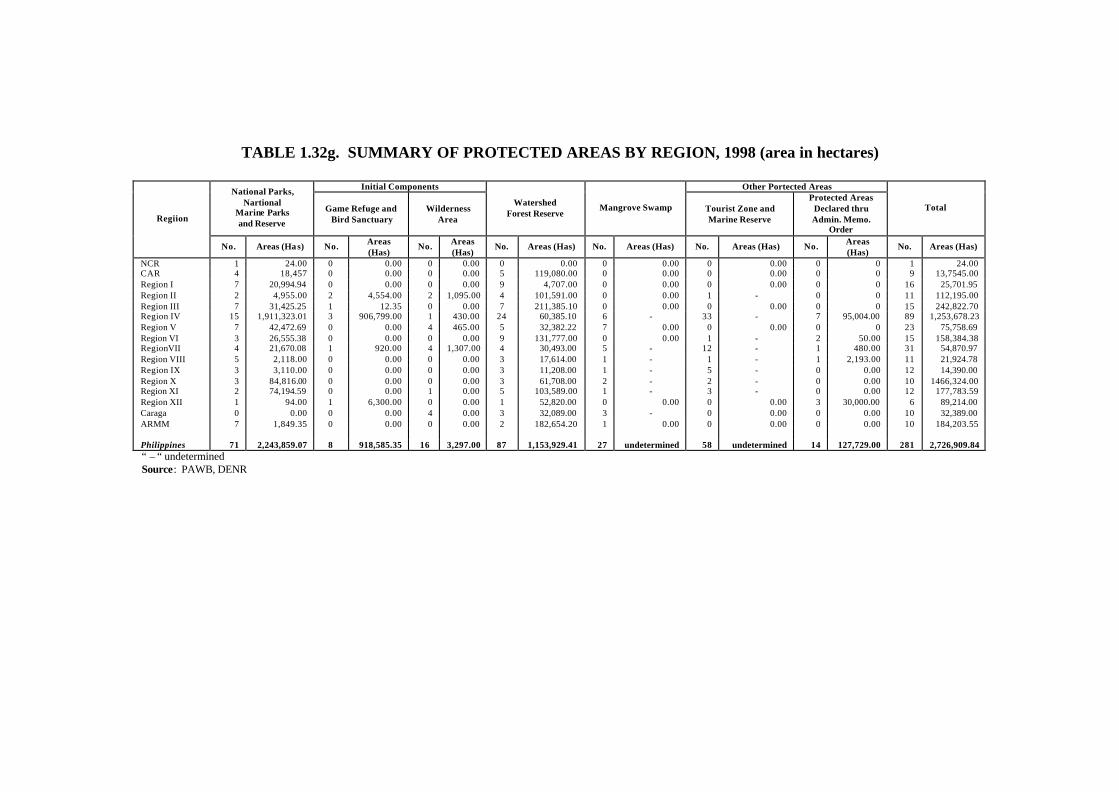
TABLE 1.32g. SUMMARY OF PROTECTED AREAS BY REGION, 1998 (area in hectares)
Initial Components Other Portected Areas National Parks, Nartional
Marine Parks and Reserve
Game Refuge and Bird Sanctuary
Wilderness Area
Watershed Forest Reserve
Mangrove Swamp Tourist Zone and Marine Reserve
Protected Areas Declared thru Admin. Memo.
Order
Total Regiion
No. Areas (Ha s) No. Areas (Has)
No. Areas (Has)
No. Areas (Has) No. Areas (Has) No. Areas (Has) No. Areas (Has)
No. Areas (Has)
NCR 1 24.00 0 0.00 0 0.00 0 0.00 0 0.00 0 0.00 0 0 1 24.00 CAR 4 18,457 0 0.00 0 0.00 5 119,080.00 0 0.00 0 0.00 0 0 9 13,7545.00 Region I 7 20,994.94 0 0.00 0 0.00 9 4,707.00 0 0.00 0 0.00 0 0 16 25,701.95 Region II 2 4,955.00 2 4,554.00 2 1,095.00 4 101,591.00 0 0.00 1 - 0 0 11 112,195.00 Region III 7 31,425.25 1 12.35 0 0.00 7 211,385.10 0 0.00 0 0.00 0 0 15 242,822.70 Region IV 15 1,911,323.01 3 906,799.00 1 430.00 24 60,385.10 6 - 33 - 7 95,004.00 89 1,253,678.23 Region V 7 42,472.69 0 0.00 4 465.00 5 32,382.22 7 0.00 0 0.00 0 0 23 75,758.69 Region VI 3 26,555.38 0 0.00 0 0.00 9 131,777.00 0 0.00 1 - 2 50.00 15 158,384.38 RegionVII 4 21,670.08 1 920.00 4 1,307.00 4 30,493.00 5 - 12 - 1 480.00 31 54,870.97 Region VIII 5 2,118.00 0 0.00 0 0.00 3 17,614.00 1 - 1 - 1 2,193.00 11 21,924.78 Region IX 3 3,110.00 0 0.00 0 0.00 3 11,208.00 1 - 5 - 0 0.00 12 14,390.00 Region X 3 84,816.00 0 0.00 0 0.00 3 61,708.00 2 - 2 - 0 0.00 10 1466,324.00 Region XI 2 74,194.59 0 0.00 1 0.00 5 103,589.00 1 - 3 - 0 0.00 12 177,783.59 Region XII 1 94.00 1 6,300.00 0 0.00 1 52,820.00 0 0.00 0 0.00 3 30,000.00 6 89,214.00 Caraga 0 0.00 0 0.00 4 0.00 3 32,089.00 3 - 0 0.00 0 0.00 10 32,389.00 ARMM 7 1,849.35 0 0.00 0 0.00 2 182,654.20 1 0.00 0 0.00 0 0.00 10 184,203.55 Philippines 71 2,243,859.07 8 918,585.35 16 3,297.00 87 1,153,929.41 27 undetermined 58 undetermined 14 127,729.00 281 2,726,909.84 “ – “ undetermined Source: PAWB, DENR

TABLE 1.32h. SUMMARY OF PROTECTED AREAS BY REGION, 1999 (area in hectares)
Initial Components National Parks, National Marine Parks, National Marine Reserve
Game Refuge & Bird Sanctuary Wildernes Area
Watershed Forest Reserve Mangrove Swamp
Region
No. Area (has.) No. Area (has.) No. Area (has.) No. Area (has.) No. Area (has.)
NCR 1 24.00 CAR 4 18,457.00 0 0.00 0 0.00 5 119,088.00 0 0Region I 7 20,994.95 0 0.00 0 0.00 9 4,707.00 0 0Region II 2 4,955.00 2 4,554.00 2 1,095.00 4 101,591.00 0 0Region III 7 31,425.25 1 12.35 0 0 7 211,385.10 0 0Region IV 15 191,133 3 906,799.00 1 430.00 24 60,312.22 6 0Region V 7 42,472.69 0 0.00 4 465.00 5 32,821.00 7 - Region VI 3 26,555.38 0 0.00 0 0.00 9 131,777.00 0 0Region VII 4 21,670.08 1 920.00 4 1,307.00 4 30,493.89 5 - Region VIII 5 2,117.78 0 0.00 0 0.00 3 17,614.00 1 - Region IX 3 3,110.00 0 0.00 0 0.00 3 11,280.00 1 - Region X 3 84,616.00 0 0.00 0 0.00 3 61,708.00 2 - Region XI 2 74,194.59 0 0.00 1 0.00 5 103,589.00 1 - Region XII 1 94.00 1 6,300.00 0 0.00 1 52,820.00 0 0Caraga 0 0 0 0.00 4 0.00 3 32,089.00 3 - ARMM 7 1,849.35 0 0.00 0 0.00 2 182,354.20 1 0
Philippines 71 523,669.08 8 918,585.35 16 3,297.00 87 1,153,629.41 27 0"-" undetermined
Source: Source: PAWB, DENR

TABLE 1.32i. SUMMARY OF PROTECTED AREAS BY REGION, 2000 (area in hectares)
Initial Components Proclaimed Protected Area under NIPAS
National Parks, National Marine Parks, National Marine Reserve
Game Refuge and Bird Sanctuary
Wilderness Area
Watershed Forest
Mangrove Swamp
Natural Park
Protected Landscape/ Seascape
Natural Monument /Landmark
Reosurce Reserve
Wildlife Sanctuary
Natural Biotic Areas
Marine Reserve
Region
No. Area (has.) No. Area (has.) No. Area (has.) No. Area (has.) No. Area (has.) No. Area (has.) No. Area (has.) No. Area (has.) No. Area (has.) No. Area (has.) No. Area (has.) No. Area (has.)
.
NCR
CAR 4 18,457.00 0 0 109,388.00 0 0 0 0 1 77561 0 0 0
Region I 5 9,744.00 0 0 4 3,123.00 0 0 5 13,272.00 1 1121.11 0 0 0 0
Region II 1 819.00 0 1 1,095.00 5 16,372.00 0 1 319,486.00 4 309,964.42 1 6675.56 0 0 0 1 7415.48
Region III 6 30,090.66 1 12.35 0 3 211,385.10 0 0 1 786.04 0 0 0 0 1 7,568.00
Region IV 12 183,141.44 2 766,799 .00 1 430.00 7 44,100.86 6 4 115,554.62 9 216,786.67 0 1 89134.76 1 18,016.19 0 0
Region V 5 31,813.04 0 0 347.25 18 26,806.00 7 3 11,221.42 1 120.62 0 0 2 117.75 2 5864.72 0
Region VI 2 1,997.78 0 4 3 124,040.00 0 2 30,068.47 1 28,300.00 0 0 0 0 0
Region VII 3 12,647.08 1 920.00 4 1,307.00 8 30,493.89 5 1 8,016.05 5 19,214.08 1 14,415.00 0 0 0 0
Region VIII 4 1,482.78 0 0 4 2,392.00 1 3 9,311.00 5 117,240.00 0 0 1 3,728.98 0 0
Region IX 0 0 0 1 1 1 12,107.00 7 32,511.66 0 1 793.74 1 242,967.00 2 5,592.00 0
Region X 2 53,319.00 0 0 0 136.00 2 2 52,482.49 2 361.00 0 0 0 0 0
Region XI 0 0 0 1 1,125.00 1 1 72,113.00 4 28,794.88 0 0 0 0 0
Region XII 1 94.00 1 6,300.00 0 2 155,170.00 0 0 2 231,550.00 0 0 0 0 0
Caraga 0 0 3 0.00 3 32,089.00 2 0 1 278,914.13 0 0 1 14,835.989 0 0
ARMM 7 1,849.35 0 0 3 182,354.20 1 0 0 0 0 0 0 0
2
Philippines 52 345,455.13 5 774,031.35 13 3,179.25 938,975.05 26 Undetermined 18 630,360.05 47 1,277,815.50 3 22,211.67 3 167,489.50 6 279,665.91 4 11,456.72 2 14,983.48
Source: PAWB, DENR

TABLE 1.32j. SUMMARY OF PROTECTED AREAS BY REGION, 2001 (area in hectares)
Initial Components Proclaimed Protected Area under NIPAS
Watershed Mangrove
Forest Total
National Parks, National Marine
Parks and Reserve
Game Refuge & Bird Sanctuary
Wildernes Area
Reserve Swamp
Total Natural Park Protected Landscape /Seascape
Natural Monument Landmark
Reosurce Reserve
Wildlife Sanctuary
Natural Biotic Areas
Marine Reserve Region
No. Area (has.) No. Area (has.) No. Area (has.) No. Area (has.) No. Area (has.) No. Area (has.) No. Area (has.) No. Area (has.) No. Area (has.)
No. Area (has.)
No. Area (has.)
No. Area (has.)
No. Area (has.)
No. Area (has.)
NCR 1 24.00 1 24.00 -
CAR 9 137,545.00 4 18,457.00 5 119,088.00 0
1 77,561.00 1 77,561.00 0
Region I 16 25,701.95 7 20,994.95 9 4,707.00 0
6 14,393.11 5 13,272.00 1 1,121.11 0
Region II 10 112,195.00 2 4,955.00 2 4,554.00 2 1,095.00 4 101,591.00 0
7 683,541.46 1 359,486.00 4 309,964.42 1 6,675.56 0 1 7415.48
Region III 15 242,822.70 7 31,425.25 1 12.35 7 211,385.10 0
2 8,354.04 1 786.04 0 1 7,568.00
Region IVA 33 106,804.63 11 56,931.41 1 430.00 19 49,443.22 2
9 77,854.76 9 77,854.76 1 89,134.76
Region IVB 16 1,051,869.60 4 134,201.60 3 906,799.00 5 10,869.00 4
6 372,202.43 3 64,936.48 1 200,115.00 1 18,016.19
Region V 23 75,758.69 7 42,472.69 4 465.00 5 32,821.00 7
9 20,996.51 4 14,893.42 1 120.62 2 117.75 2 5,864.72
Region VI 12 158,332.38 3 26,555.38 9 131,777.00
3 58,368.47 2 30,068.47 1 28300
Region VII 18 54,390.97 4 21,670.08 1 920.00 4 1,307.00 4 30,493.89 5
7 41,376.13 1 8,016.05 5 19,215.08 1 14,145.00
Region VIII 9 19,731.78 5 2,117.78 3 17,614.00 1
9 130,279.98 3 9,311.00 5 117,240.00 1 3,728.98
Region IX 7 14,390.00 3 3,110.00 3 11,280.00 1
12 310,544.58 1 17,414.00 7 41,102.18 1 980.4 1 242,967.00 2 8,081.00
Region X 8 146,324.00 3 84,616.00 3 61,708.00 2 - 4 82,770.23 2 82,409.23 2 361.00 0
Region XI 7 75,433.59 2 74,194.59 1 0.00 3 1,239.00 1 - 5 101,308.88 1 72,113.00 4 29,195.88 0
Region XII 5 161,564.00 1 94.00 1 6,300.00 3 155,170.00 2 231,550.00 2 231,550.00 0
Region XIII 10 32,089.00 4 0.00 3 32,089.00 3 - 2 298,110.69 1 278,914.13 1 19,196.560
ARMM 10 184,203.55 7 1,849.35 2 182,354.20 1 - - - 0
Philippines 209 2,599,180.84 71 523,669.08 8 918,585.35 3,297.00 87 1,153,629.41 27 undetermined 84 2,509,212.27 18 658,647.65 47 1,319,691.11 3 21,941.67 3 167,676.16 6 284,026.48 4 13,945.72 3 43,283.48
Source: PAWB, DENR

TABLE 1.32k. SUMMARY OF PROTECTED AREAS BY REGION, 2002 (area in hectares)
Proclaimed Protected Area under NIPAS
Total Natural
Park
Protected Landscape/
Seascape
Natural Monument/ Landmark
Reosurce Reserve
Wildlife Sanctuary
Natural Biotic Areas
Marine Reserve Region
No. Area (has.) No. Area (has.) No. Area (has.) No.Area (has.) No.Area (has.) No.Area (has.) No. Area (has.) No.Area (has.)
NCR CAR 1 77,561.00 1 77,561.00 Region I 6 14,820.90 5 13,272.00 1 1,548.90 Region II 7 643,568.46 1 319,513.00 4 309,964.42 1 6,675.56 1 7415.48Region III 2 8,354.04 1 786.04 1 7,568.00Region IV A 9 77,854.76 1 62,292.14 8 15,562.62 Region IV B 6 360,524.95 3 53,259.00 1 200,115.00 1 89134.76 1 18,016.19 Region V 10 31,108.86 5 25,005.77 1 120.62 2 117.75 2 5,864.72 Region VI 5 102,546.76 3 42,246.76 2 60,300.00Region VII 7 41,644.68 1 8,016.05 5 19,213.63 1 14,415.00Region VIII 9 130,279.98 3 9,311.00 5 117,240.00 1 3,728.98Region IX 12 293,664.03 1 5,307.00 7 37,123.03 1 186 1 242,967.00 2 8,081.00Region X 7 130,664.78 4 129,003.00 3 1,661.78Region XI 5 101,308.88 1 72,113.00 4 29,195.88Region XII 2 231,550.00 2 231,550.00Region XIII 2 302,471.26 1 283,274.70 1 19,196.560 Philippines 90 2,547,923.34 23 726,066.72 49 1,319,379.72 3 22,639.46 3 16,6881.76 6 28,4026.48 4 13,945.72 2 14,983.48
Source: PAWB, DENR
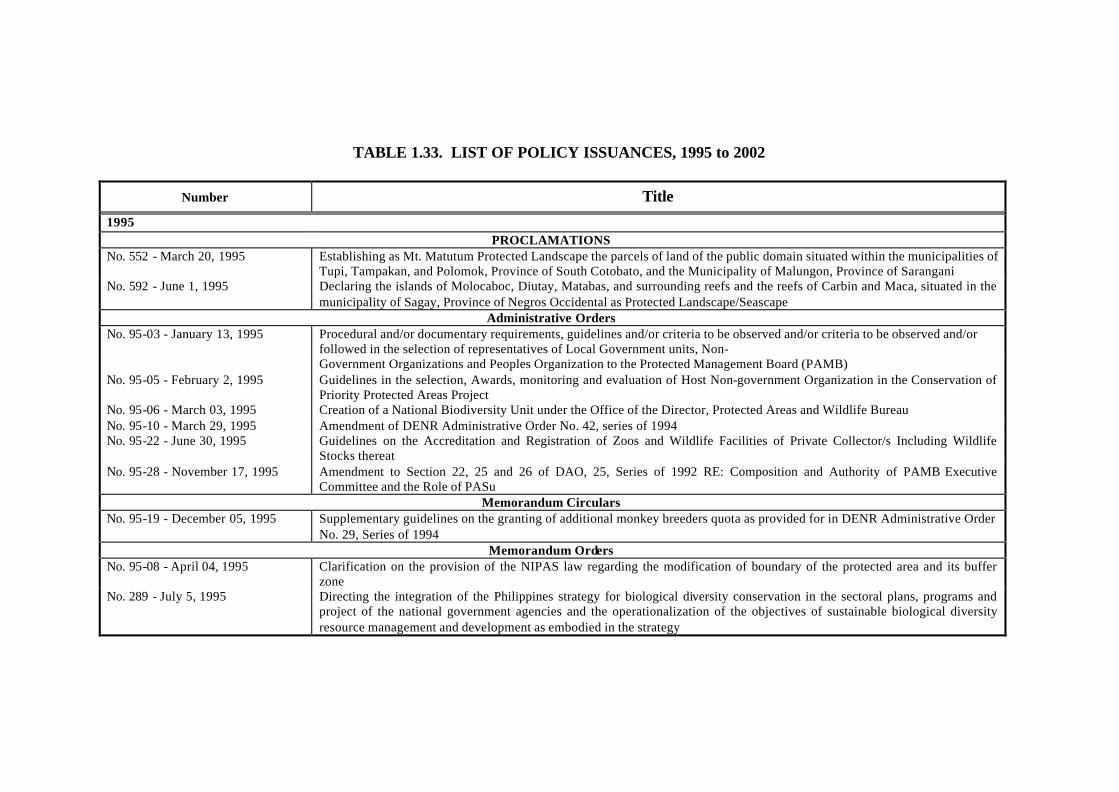
TABLE 1.33. LIST OF POLICY ISSUANCES, 1995 to 2002
Number Title
1995 PROCLAMATIONS
No. 552 - March 20, 1995 Establishing as Mt. Matutum Protected Landscape the parcels of land of the public domain situated within the municipalities of Tupi, Tampakan, and Polomok, Province of South Cotobato, and the Municipality of Malungon, Province of Sarangani
No. 592 - June 1, 1995 Declaring the islands of Molocaboc, Diutay, Matabas, and surrounding reefs and the reefs of Carbin and Maca, situated in the municipality of Sagay, Province of Negros Occidental as Protected Landscape/Seascape
Administrative Orders No. 95-03 - January 13, 1995 Procedural and/or documentary requirements, guidelines and/or criteria to be observed and/or criteria to be observed and/or
followed in the selection of representatives of Local Government units, Non- Government Organizations and Peoples Organization to the Protected Management Board (PAMB) No. 95-05 - February 2, 1995 Guidelines in the selection, Awards, monitoring and evaluation of Host Non-government Organization in the Conservation of
Priority Protected Areas Project No. 95-06 - March 03, 1995 Creation of a National Biodiversity Unit under the Office of the Director, Protected Areas and Wildlife Bureau No. 95-10 - March 29, 1995 Amendment of DENR Administrative Order No. 42, series of 1994 No. 95-22 - June 30, 1995 Guidelines on the Accreditation and Registration of Zoos and Wildlife Facilities of Private Collector/s Including Wildlife
Stocks thereat No. 95-28 - November 17, 1995 Amendment to Section 22, 25 and 26 of DAO, 25, Series of 1992 RE: Composition and Authority of PAMB Executive
Committee and the Role of PASu Memorandum Circulars
No. 95-19 - December 05, 1995 Supplementary guidelines on the granting of additional monkey breeders quota as provided for in DENR Administrative Order No. 29, Series of 1994
Memorandum Orders No. 95-08 - April 04, 1995 Clarification on the provision of the NIPAS law regarding the modification of boundary of the protected area and its buffer
zone No. 289 - July 5, 1995 Directing the integration of the Philippines strategy for biological diversity conservation in the sectoral plans, programs and
project of the national government agencies and the operationalization of the objectives of sustainable biological diversity resource management and development as embodied in the strategy

TABLE 1.33. (continued)
Number Title
1996 PROCLAMATIONS
No. 746 - February 20, 1996 Declaring as protected area a certain parcel of land of public domain to be known as the mount GUITING-GUITING Natural Park embraced and situated in the municipalities of Cajidiocan, Magdiwang and San Fernando, in the island of Sibuyan, Romblon
No. 756 - March 5, 1996 Establishing Sarangani Bay and a portion of the municipal waters of Maitum, Kiamba and Maasim Sarangani province as protected seascape for the purpose of protecting and maintaining its coastal and marine resources for the benefit and enjoyment of the people of the Philippines
No. 868 - September 6, 1996 Amending Presidential Proclamation No. 1801, Series of 1980, by declaring certain parcels of land of public domain and reef areas covering Apo Reef situated in the municipality of Sablayan, Occidental Mindoro as protected area under the category of natural park
No. 882 - September 24, 1996 Amending Presidential Proclamation No. 59, dated May 9, 1936 by declaring certain parcels of land of the public domain covering Mt. Apo situated in Kidapawan, Makilala and Magpet in Cotobato, Bansalan, Digos, Sta. Cruz, Davao del Sur, Davao, Island Mindanao as protected area under the category of Natural Park
No. 896 - October 24, 1996 Amending Proclamation No. 677 dated December 14, 1990 by declaring certain parcels of land of the public domain covering Mt. Kitanglad range situated in Talakag, Baungon, Libona, Manolo Fortich, Sumilao, Impasug-ong, Malaybalay and Lantapan, all in the province of Bukidnon as protected area under the category of Natural Park and its peripheral areas as buffer zone.
No. 901 - October 10, 1996 Declaring a certain parcel of land within the coverage of Proclamation Nos. 1636 and 1687 dated 18 April 1977, situated in the municipality of Rodriguez, Rizal, as Pamitinan protected landscape
No. 902 - October 10, 1996 Amending Proclamation No. 1801 dated August 30, 1979, Proclamation No. 2151 dated December 29, 1981, and Proclamation No. 2152 dated December 29, 1981 by declaring the terrestrial, wetland and marine areas of Siargao and its surrounding islets in northeastern part of Mindanao, province of Surigao del Norte as protected area under the category of protected landscape and seascape
No. 923 - November 19, 1996 Amending Proclamation No. 235, dated July 22, 1967, by declaring the Taal Volcano island national park, province of Batangas, Island of Luzon as protected area under the category of protected landscape
Administrative Orders No. 96-02 - January 23, 1996 Amendment to DENR Administrative Order No. 95-28 Re : Composition and Authority of PAMB Executive Committee and
the Role of the PASu No. 96-16 - April 15, 1996 Amending DENR Administrative Order No. 95-22 dated 30 June 1995 RE : Guidelines on the Accreditation and Registration
of Zoos and Wildlife Facilities of Private Collector/s including Wildlife Stocks Threat
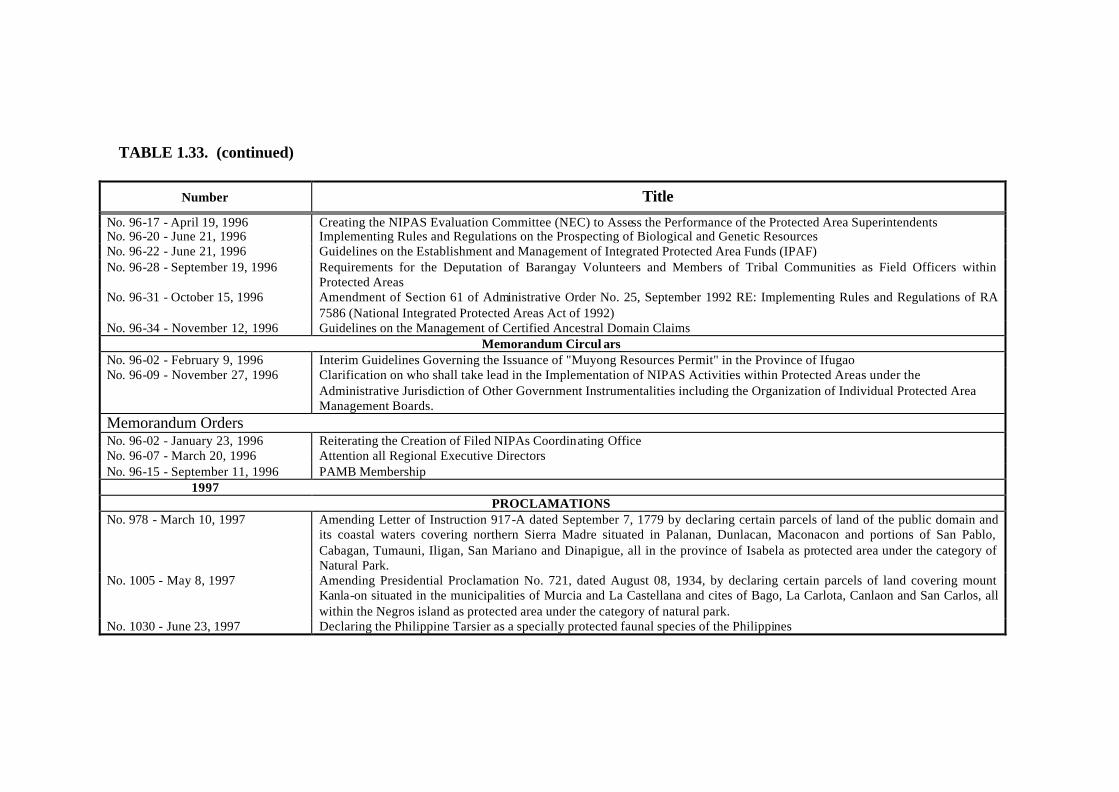
TABLE 1.33. (continued)
Number Title
No. 96-17 - April 19, 1996 Creating the NIPAS Evaluation Committee (NEC) to Assess the Performance of the Protected Area Superintendents No. 96-20 - June 21, 1996 Implementing Rules and Regulations on the Prospecting of Biological and Genetic Resources No. 96-22 - June 21, 1996 Guidelines on the Establishment and Management of Integrated Protected Area Funds (IPAF) No. 96-28 - September 19, 1996 Requirements for the Deputation of Barangay Volunteers and Members of Tribal Communities as Field Officers within
Protected Areas No. 96-31 - October 15, 1996 Amendment of Section 61 of Administrative Order No. 25, September 1992 RE: Implementing Rules and Regulations of RA
7586 (National Integrated Protected Areas Act of 1992) No. 96-34 - November 12, 1996 Guidelines on the Management of Certified Ancestral Domain Claims
Memorandum Circul ars No. 96-02 - February 9, 1996 Interim Guidelines Governing the Issuance of "Muyong Resources Permit" in the Province of Ifugao No. 96-09 - November 27, 1996 Clarification on who shall take lead in the Implementation of NIPAS Activities within Protected Areas under the
Administrative Jurisdiction of Other Government Instrumentalities including the Organization of Individual Protected Area Management Boards.
Memorandum Orders No. 96-02 - January 23, 1996 Reiterating the Creation of Filed NIPAs Coordinating Office No. 96-07 - March 20, 1996 Attention all Regional Executive Directors No. 96-15 - September 11, 1996 PAMB Membership
1997 PROCLAMATIONS
No. 978 - March 10, 1997 Amending Letter of Instruction 917-A dated September 7, 1779 by declaring certain parcels of land of the public domain and its coastal waters covering northern Sierra Madre situated in Palanan, Dunlacan, Maconacon and portions of San Pablo, Cabagan, Tumauni, Iligan, San Mariano and Dinapigue, all in the province of Isabela as protected area under the category of Natural Park.
No. 1005 - May 8, 1997 Amending Presidential Proclamation No. 721, dated August 08, 1934, by declaring certain parcels of land covering mount Kanla-on situated in the municipalities of Murcia and La Castellana and cites of Bago, La Carlota, Canlaon and San Carlos, all within the Negros island as protected area under the category of natural park.
No. 1030 - June 23, 1997 Declaring the Philippine Tarsier as a specially protected faunal species of the Philippines

TABLE 1.33. (continued)
Number Title
No. 1037 - July 1, 1997 Establishing the 1,776 hills, more or less, popularly known as Chocolate hills and the areas within around and surrounding them located in the municipalities of Carmen, Batuan and Sagbayan, Bilar, Valencia and Sierra Bullones, Province of Bohol as a natural monument to protect and maintain its natural beauty and to provide restraining mechanisms for inappropriate exploitation.
No. 1125 - November 4, 1997 Declaring an area of the public domain situated in the municipalities of Calbiga, Wright and Hinabangan, Province of Samar, as Calbiga caves protected landscape
DENR Administrative Order No. 97-12 - April 11, 1997 Amendment of DENR Administrative Order No. 56, Series of 1993 No. 97-14 - April 21, 1997 Amending DENR Administrative Order Nos. 95-22 and 96-16 RE: Guidelines on the Accreditation and Registration of Zoos
and Wildlife Facilities of Private Collector/s including Wildlife Stocks Threat No. 97-16 - April 28, 1997 Addendum to the Guidelines on the Establishment and Management of the Integrated Protected Area Fund. No. 97-17 - April 29, 1997 Establishing the Disposition Program for Confiscated and Donated Wildlife in the Custody of DENR Wildlife Rescue Centers
and Similar DENR Facilities and Providing Guidelines Therefor No. 97-27 - July 31, 1997 Amendment of Section 15, Transitory Provisions of Department Administrative Order No. 96-20 also known as the
Implementing Rules and Regulations on the Prospecting of Biological and Genetic Resources No. 97-33 - November 24, 1997 Guidelines on the Issuance of Permit for the Collection and Transport of Biological Specimens From Protected Areas for Use
by DENR Biodiversity Conservation Programs/Projects No. 97-36 - December 15, 1997 Institutionalizing the Dalaw-Turo of the Protected Areas and Wildlife Bureau (PAWB) as an Environmental Education
Strategy for Nature Conservation and Environmental Awareness Projects and Activities No. 97-42 - December 29, 1997 Transferring the Tamaraw Conservation Program (TCP) from the Protected Areas and Wildlife Bureau (PAWB) to DENR
Region IV DENR Memorandum Circular
No. 97-17 - September 11, 1997 Criteria for the Identification of Wetlands critical to Biodiversity Conservation DENR Memorandum Order
No. 97-01 March 18, 1997 Institutionalization of the Port Integrated Clearance Office (PICO) within the Forest Management Services of the DENR Regional Office
No. 97-02 May 23, 1997 Interim Guidelines in the Conduct of Watershed Characterization Survey and Preparation of Watershed Management Plan 97-05 July 18, 1997 Guidelines on the Protection and Management of Expired, Cancelled, and Expiring Timber License Agreements (TLAS)

TABLE 1.33. (continued)
Number Title
1998 PROCLAMATIONS
Procla mation No. 32 - October 8, 1998
Declaring the El Nido Marine Reserve Situated in the Municipality of El Nido, Province of Palawan as a Protected Area Pursuant to Republic Act 7586 (National Integrated Protected Areas System [NIPAS] Act of 1992) to be Known as El Nido Managed Resource Protected Area.
DENR Administrative Order No. 98 - 01 January 6, 1998 Establishing the Forest Resource Securitization Strategy for Mobilization of Private Capital to Support Sustainable Forestry in
the Philippines. No. 98 – 08 February 25, 1998 Amendment to DAO 97-35 Entitled “Governing the Entry and Disposition of Imported Logs, Lumber, Veneer, Plywood, Poles
and Piles, and Pulpwood Including Wood Chips”. No. 98 – 10 March 04, 1998 Guidelines on the Establishment and Management of Community-Based Forest Management (CBFM) Projects Within
Mangrove Areas. No. 98 – 11 March 11, 1998 Temporary Lifting of the Ban on Lumber Export. No. 98 – 13 March 16, 1998 Reversion of Mantigue Island from the Category of Alienable and Disposable Land to Forest Land. No. 98 – 14 March 26, 1998 Declaring and Certifying Certain Portion of the Public Forest as Available for Fishpond Development Under LC Project No.
28-B of Jaro, Iloilo. No. 98 – 19 April 21, 1998 Recalling DAO 98-11. No. 98 – 25 June 03, 1998 Declaring the Philippine Centennial Trees as Protected Trees. No. 98 - 27 June 17, 1998 Interim Annual Rental for Special Use of Forestland for Energy Projects. No. 98 – 30 June 11, 1998 Declaring Certain Portions of the Public Forest as Alienable or Disposable for Cropland and Other Purposes, and setting aside
Certain Parcels Thereof for Permanent Forest Purposes Under LC Project Nos. 10-G of Tuba, Benguet and 13-F of San Manuel, Pangasinan.
No. 98 – 31 June 18, 1998 Declaring Certain Portions of the Public Forest as Forest Lands for Permanent Forest and as Alienable or Disposable for Cropland and Other Purposes Under LC Project Nos. 11-E, 9-H, 12-G of Tublay, La Trinidad and Sablan, Benguet; and 16-B of Bagulin, La Union, Respectively.
No. 98 – 32 June 18, 1998 Declaring Certain Portions of the Public Forest as Forest Lands for Permanent Forest Purposes and as Alienable or Disposable for Cropland and Other Purposes Under LC Project Nos. 1-A, 7-C, 18-B and 12-E of Atok, Kapangan, Kibungan and Sablan, Benguet; and 20-B of Burgos, La Union, Respectively.
No. 98 – 33 June 11, 1998 Declaring Certain Portions of the Public Forest as Forest Lands for Permanent Forest Purposes and as Alienable or Disposable for Cropland and Other Purposes Under LC Project Nos. 18-A of Nagtipunan, Province of Quirino.

TABLE 1.33. (continued)
Number Title
No. 98 - 34 June 11, 1998 Declaring Certain Portions of the Public Forest as Forest Lands for Permanent Forest Purposes and as Alienable or Disposable for Cropland and Other Purposes Under LC Project Nos. 15-H, 16-K, 17-A and 18 of Aglipay, Maddela, Cabarroguis, and Nagtipunan, Province of Quirino.
No. 98 – 35 June 11, 1998 Declaring Certain Portions of the Public Forest as Forest Lands for Permanent Forest Purposes and as Alienable or Disposable for Cropland and Other Purposes Under LC Project Nos. 16-M of Maddela, Quirino and 10-H of San Agustin, Isabela, Respectively.
No. 98 – 36 June 18, 1998 Declaring and Establishing Certain Portions of the Public Forest as Permanent Forest Multiple-Use Development and Management Purposes Under LC Project No. 12- J of Abra De Ilog, Mindoro Occidental and 11-D of Puerto Galera, Mindoro Oriental.
No. 98 – 37 June 18, 1998 Declaring and Establishing Certain Portions of the Public Forestlands for Permanent Forest Purposes and as Alienable or Disposable for Cropland and Other Purposes Under LC Project No. 18-D and 10-E of San Teodoro and Baco, Mindoro Oriental and LC Project No. 10-C of Sta. Cruz, Mindoro Oriental Respectively.
No. 98 – 38 June 11, 1998 Declaring Certain Portions of the Public Forest as Forestlands for Permanent Forest Purposes and as Alienable or Disposable for Cropland and Other Purposes Under LC Project No. 38-C of General Nakar, Quezon.
No. 98 – 39 June 18, 1998 Declaring Certain Portions of the Public Forest as Forestland for Permanent Forest Purposes and as Alienable or Disposable for Cropland and Other Purposes Under LC Project No. 60-B of Guiuan, Province of Eastern Samar.
No. 98 – 40 June 11, 1998 Declaring Certain Portions of the Public Forest as Alienable or Disposable for Cropland and Other Purposes and Setting Aside Certain Parcels Thereof for Permanent Forest Purposes Under LC Project No. 5-G of El Nido, Palawan.
No. 98 – 41 June 24, 1998 Guidelines on the Establishment and Management of Community-Based Forest Management (CBFM) Projects Within Watershed Reservations.
No. 98 – 42 June 24, 1998 Production Sharing Agreement With People’s Organizations in the Harvest of Forest Plantations Owned by the Government Inside CBFM areas.
No. 98 – 43 June 24, 1998 Exemption of Community Based Forest Management Projects from the Payment of Administrative Fees. No. 98 – 44 June 24, 1998 Guidelines on the Establishment and Management of the CBFM Special Account No. 98 – 45 June 24, 1998 Guidelines Governing the Issuance and Transfer of Certificate of Stewardship (CS) Within CBFM Areas No. 98 – 60 September 25, 1998 Placing All Integrated Protected Area System (IPAS) Special Projects such as the National Integrated Protected Areas
Programme (NIPAP), The Conservation of Priority Protected Areas Project (CPPAP), etc. Under the Supervision of the Protected Areas and Wildlife Bureau (PAWB).
No. 98 – 61 September 25, 1998 “Lets Go Green” Guidelines on Planting Along the National, Provincial and Municipal Highways, and Along the River/Stream Banks.

TABLE 1.33. (continued)
Number Title
No. 98 – 62 October 01, 1998 Regulation and Guidelines Governing the Implementation of “Adopt-A-Mountain” Program. No. 98 – 66 October 28, 1998 Amendments to DENR Administrative Order No. 97-04, dated March 04, 1997 Re: Rules and Regulations Governing the
Industrial Forest Management Program. No. 98-67 December 09, 1998 Guidelines For The Identification, Declaration And Award Of Areas Suitable For Salt Production
DENR Memorandum Circular No. 98 - 04 April 27, 1998 Guidelines and Procedures in the Collection, Utilization and Management of Rattan Special Deposit. No. 98 – 08 June 24, 1998 Guidelines on Contracting Inside Community-Based Forest Management (CBFM) Areas No. 98 – 09 June 24, 1998 Additional Guidelines on the Issuance of Interim Resource Use Permit or IRUP No. 98 – 10 June 24, 1998 Test Implementation of the Project Impact Monitoring and Evaluation System (PRIMES) as Monitoring and Evaluation
Guidelines for Community-Based Forest Management Program (CBFMP). DENR Memorandum Order
No. 98 – 07 April 15, 1998 Suspension of the Implementation of DAO 98-11. No. 98 – 10 June 02, 1998 Additional Terms and Conditions to be Incorporated in the Forest Land Grazing Lease Agreements (FLGLAs) Relative to the
Conduct of Prescribed Burning Inside Pasture Areas. No. 98 – 15 September 25, 1998 Stopping the Processing and Issuance of CADCs and CALCs. No. 98 – 16 October 30, 1998 Interim Guidelines for the Issuance of Cutting Permits for Private Land Timber Permits (PLTP) and Special Private Land
Timber Permits (SPLTP). No. 98 – 17 November 03, 1998 Banning the Further Zonification of Mangrove Forest for Fishpond Development and/or the Release of Mangrove Forestlands
Previously Zonified as Such. 1999
PROCLAMATIONS No. 79- February 24, 1999 Declaring June 4 to 10 of Every Year as Philippine Eagle Week. No. 84 February 24, 1999 Declaring Siocon Watershed Forest Reserve Situated in the Municipality of Siocon, Province of Zamboanga Del Norte as
Protected Area and Its Peripheral Areas as Buffer Zone Pursuant to Republic Act No. 7586 (NIPAS Act of 1992), and Shall Be Known as Siocon Resource Reserve.
No. 106 May 6, 1999 Declaring Aliguay Island Situated in the City of Dapitan, province of Zamboanga Del Norte as Protected Area and its Peripheral Areas as Buffer Zone Pursuant to Republic Act No. 7586 (NIPAS Act of 1992), and Shall be Known as Aliguay Island Protected Landscape and Seascape.
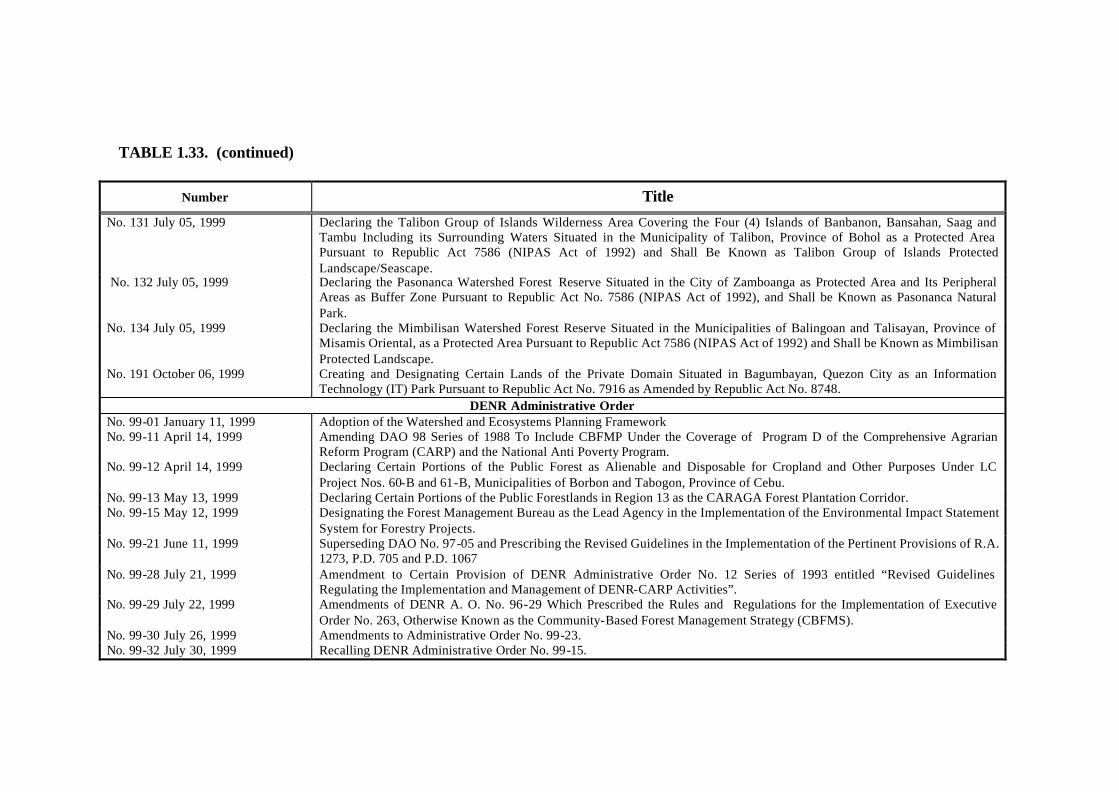
TABLE 1.33. (continued)
Number Title
No. 131 July 05, 1999 Declaring the Talibon Group of Islands Wilderness Area Covering the Four (4) Islands of Banbanon, Bansahan, Saag and Tambu Including its Surrounding Waters Situated in the Municipality of Talibon, Province of Bohol as a Protected Area Pursuant to Republic Act 7586 (NIPAS Act of 1992) and Shall Be Known as Talibon Group of Islands Protected Landscape/Seascape.
No. 132 July 05, 1999 Declaring the Pasonanca Watershed Forest Reserve Situated in the City of Zamboanga as Protected Area and Its Peripheral Areas as Buffer Zone Pursuant to Republic Act No. 7586 (NIPAS Act of 1992), and Shall be Known as Pasonanca Natural Park.
No. 134 July 05, 1999 Declaring the Mimbilisan Watershed Forest Reserve Situated in the Municipalities of Balingoan and Talisayan, Province of Misamis Oriental, as a Protected Area Pursuant to Republic Act 7586 (NIPAS Act of 1992) and Shall be Known as Mimbilisan Protected Landscape.
No. 191 October 06, 1999 Creating and Designating Certain Lands of the Private Domain Situated in Bagumbayan, Quezon City as an Information Technology (IT) Park Pursuant to Republic Act No. 7916 as Amended by Republic Act No. 8748.
DENR Administrative Order No. 99-01 January 11, 1999 Adoption of the Watershed and Ecosystems Planning Framework No. 99-11 April 14, 1999 Amending DAO 98 Series of 1988 To Include CBFMP Under the Coverage of Program D of the Comprehensive Agrarian
Reform Program (CARP) and the National Anti Poverty Program. No. 99-12 April 14, 1999 Declaring Certain Portions of the Public Forest as Alienable and Disposable for Cropland and Other Purposes Under LC
Project Nos. 60-B and 61-B, Municipalities of Borbon and Tabogon, Province of Cebu. No. 99-13 May 13, 1999 Declaring Certain Portions of the Public Forestlands in Region 13 as the CARAGA Forest Plantation Corridor. No. 99-15 May 12, 1999 Designating the Forest Management Bureau as the Lead Agency in the Implementation of the Environmental Impact Statement
System for Forestry Projects. No. 99-21 June 11, 1999 Superseding DAO No. 97-05 and Prescribing the Revised Guidelines in the Implementation of the Pertinent Provisions of R.A.
1273, P.D. 705 and P.D. 1067 No. 99-28 July 21, 1999 Amendment to Certain Provision of DENR Administrative Order No. 12 Series of 1993 entitled “Revised Guidelines
Regulating the Implementation and Management of DENR-CARP Activities”. No. 99-29 July 22, 1999 Amendments of DENR A. O. No. 96-29 Which Prescribed the Rules and Regulations for the Implementation of Executive
Order No. 263, Otherwise Known as the Community-Based Forest Management Strategy (CBFMS). No. 99-30 July 26, 1999 Amendments to Administrative Order No. 99-23. No. 99-32 July 30, 1999 Recalling DENR Administrative Order No. 99-15.

TABLE 1.33. (continued)
Number Title
No. 99-34 August 10, 1999 Rules and Regulations Governing the Administration, Management and Development of Foreshore Areas, Marshy Lands and Other Lands Bordering Bodies of Water.
No. 99-35, August 10, 1999 Revised Guidelines in the Implementation of the Resource Use Permit in Community-Based Forest Management Program. No. 99-36, August 10, 1999 Revised Rules and Regulations Governing the Administration, Management, Development and Disposition of Forest Lands
Used for Grazing Purposes. No. 99-40, September 13, 1999 Declaring and Setting Aside Certain Tracts of Public Forest Land for the DENR Employees Forest Production Area in Region
VI. No. 99-42, October 11, 1999 Declaring and Setting Aside Certain Tracts of Public Forest Land for the DENR Employees Forest Production and Eco-Village
Area in CARAGA Region XIII. No. 99-43, October 13, 1999 Declaring and Setting Aside Certain Tracts of Public Forest Land For Usufruct Rights in Tree Farming of DENR-10
Employees. No. 99-44, October 19, 1999 Declaring and Setting Aside Certain Tracts of Public Forest Land Within the Marikina Watershed Reservation, Province of
Rizal for the DENR Employees Forest Production Area. No. 99-46, November 10, 1999 Revised Regulations Governing the Entry and Disposition of Imported Logs, Lumber, Veneer, Plywood, Other Wood Based
Panels, Poles and Piles, Pulpwood and Wood Chips. No. 99-50, October 08, 1999 Declaring and Setting Aside Certain Tracts of Public Forest Land for the DENR Employees Forest Production Area for the
Province of Misamis Occidental. No. 99-53, December 23, 1999 Regulations Governing the Integrated Forest Management Program (IFMP) No. 99-58, November 19, 1999 Declaring and Setting Aside Certain Tracts of Public Forest Lands for the DENR Employees Forest Production Area in Region
XI. No. 99-59, November 19, 1999 Declaring and Setting Aside Certain Tracts of Public Forest Lands for USUFRUCT Rights in Tree Farming of DENR-XI
Employees. DENR Memorandum Circular
No. 99-03 February 18, 1999 Disposition of Excess Seedlings Produced Under the ADB Forestry Sector Project. No. 99-04 February 18, 1999 Extension of the Community Organizing Contract Under the Forestry Sector Project Loan II. No. 99-06 April 05, 1999 Implementation of the Common Sustainable Rural Development Framework in the Convergence Model Sites. No. 99 – 07 April 12, 1999 Guidelines for Regional and Provincial Offices for Sustainable Rural Development (SRD) Planning in Convergence Model
Sites. No. 99-08 April 13, 1999 Preparation and Evaluation of the Phase Out plan of the Assisting Organizations for the Forestry Sector Project.

TABLE 1.33. (continued)
Number Title
No. 99 – 09 April 13, 1999 Guidelines For The Implementation Of The DENR Forest Production Project No. 99-16 May 28, 1999 Amending Certain Provisions of MC No. 97-03 Regarding Guidelines and Procedures in the Processing of Payments for
Community Organizing and Comprehensive Site Development of Subprojects Under the Forestry Sector Project. No. 99-17 June 02, 1999 Guidelines on the Conduct of Monitoring and Evaluation (M & E) of Forestry Sector Projects Under Loan II.
DENR Memorandum Order No. 99-09 March 09, 1999 Allowing Lumber Permittee To Participate From The NRDC Public Bidding Of Confiscated Logs And To Process Bidded
Logs. No. 99 –12 April 14, 1999 Suspension Of The Issuance Of Cutting Permit In Private Lands Covered By Private Forest Development Agreement (PFDA). No. 99-15 May 06, 1999 Delegating to the Director, Forest Management Bureau the Function of Referring to the Concerned DENR Regional Offices
Documents Such as Court Notices, Order and Letters of Land Registration Cases Forwarded for Appropriate Action No 99-16 May 17, 1999 Special Task Force On Priority Programs And Economic Affairs Action Plan For The Rehabilitation, Development, Protection
And Maintenance Of The Marikina Watershed Reservation And The Marikina Wawa River Basin; The Creation Of Task Force Marikina Watershed Development Center And Providing Funds For The Purpose
No. 99-24 June 11, 1999 Guidelines Concerning the Transport of Timber and Timber Products from the Autonomous Region of Muslim Mindanao (ARMM) to the DENR Administrative Regions 9, 10, 11 & 12.
No. 99-28 August 26, 1999 Disallowing The Entry Of Forest Products Emanating From Lanao Del Sur No. 99-29 September 15, 1999 Guidelines In The Implementation Of Usufruct Rights In Tree Farming Within Forestlands Where Occupation Is Not Allowed No. 99 – 30 October 20, 1999 Authority To Approve PLTP Applications No. 99- 31 October 26, 1999 Allowing The Transport Of Logs Outside The Autonomous Region Of Muslim Mindanao
2000 Proclamation
No. 226 January 10, 2000 Creating and Designating a certain Parcel of land of the Private Domain situated in Barangay Sahud-ulan, Municipality of Tanza, Province of Cavite, as a Special Economic Zone Pursuant to Republic Act. No. 7916, as amended by Republic Act No. 8748
No. 241 February 8, 2000 Establishing as Kabulnan river watershed forest reserve for the purpose of protecting, maintaining or improving the water yield and providing restraining mechanism for inappropriate forest exploitation and disruptive land-use, a certain parcel of land of the public domain situated in the Municipalities of Esperanza, Isulan, Bagumbayan, Ninoy Aquino, Kalamansig and Palembang, all in the province of Sultan Kudarat, Municipality of Ampatuan in the Province of Maguindanao and Municipality of Lake Sebu in the Province of south Cotabato, Philippines

TABLE 1.33. (continued)
Number Title
No. 266 April 23, 2000 Declaring the Lidlidda Watershed Forest Reserve situated in the Municipalities of Lidlidda and Banayoyo, Province of Ilocos Sur, Island of Luzon as a Protected Area Pursuant To Republic Act 7586 (NIPAs Act Of 1992) and shall be known as Lidlidda Protected Landscape
No. 267 April 23, 2000 Declaring the Simbahan-Talagas River Watershed Forest Reserve situated in the Municipality of Dinalungan, Province of Aurora, as a Protected Area Pursuant to Republic Act 7586 (NIPAs Act Of 1992) and shall be known as Simbahan-Talagas Protected Landscape
No. 268 April 23, 2000 Declaring the Ambuklao-Binga Watershed Forest Reserve situated in the Municipalities Of Atok, Bokod, Buguias, Itogon, Kabayan, Tublay, Kibungan and La Trinidad, Province of Benguet, Municipalities of Hungduan and Kiangan, Province of Ifugao; and Municipality Of Kayapa, Province of Nueva Viscaya as a Protected Area pursuant To Republic Act 7586 (NIPAs Act Of 1992) and shall be known as Upper Agno River Basin Resource Reserve
No. 269 April 23, 2000 Declaring the Baganga Watershed Reservation situated in the Municipality of Baganga, Province of Davao Oriental, Island of Mindanao as a Protected Area pursuant to R.A. 7586 (NIPAs Act Of 1992), which shall be known as "Baganga Protected Landscape"
No. 270 April 23, 2000 Declaring the Cuatro Islas Protected Landscape/Seascape situated in the coastal areas of the Municipalities of Inopacan, Hindang and neighboring islands comprising Digyo, Apid, Mahaba and Himukilan Islands and their surrounding Reefs, Province of Leyte, Island of Visayas as a Protected Area Pursuant to R.A. 7586 (NIPAs Act Of 1992) and shall be known as Cuatro Islas Protected Landscape/Seascape
No. 271 April 23, 2000 Declaring the Big and Small Sta. Cruz Islands tourist zone and marine reserve situated in the City Of Zamboanga, Province of Zamboanga Del Sur as a Protected Area and its peripheral areas as Buffer Zone pursuant to Republic Act No. 7586 (NIPAs Act Of 1992), and shall be known as Great And Little Sta. Cruz Islands Protected Landscape and Seascape
No. 272 April 23, 2000 Declaring the Chico Mangrove Wilderness Area situated in the Municipality of Cawayan, Province of Masbate, Island of Luzon as a protected area pursuant To Republic Act 7586 (NIPAs Act Of 1992) and shall be known as Chico Island Wildlife Sanctuary
No. 273 Declaring the Roosevelt National Park situated in the Municipalities of Dinalupihan and Hermosa, Province of Bataan as a protected area pursuant to Republic Act 7586 (NIPAs Act Of 1992) and shall be known as Roosevelt Protected Landscape
No. 274 April 23, 2000 Declaring Amro River Watershed Forest Reserve, situated in the Municipalities of Casiguran and Dilasag, Province of Aurora as a protected area pursuant to Republic Act 7586 (NIPAs Act Of 1992) and shall be known as Amro River Protected Landscape
No. 275 April 23, 2000 Declaring the Salinas Forest Reserve and Deer Refuge situated in the Municipalities of Bambang, Kayapa and Aritao, Province of Nueva Vizcaya, Island of Luzon as protected area pursuant to Republic Act 7586 (NIPAs Act Of 1992) and shall be known as Salinas Natural Monument

TABLE 1.33. (continued)
Number Title
No. 276 April 23, 2000 Declaring Selinog Island situated in the City of Dapitan, Province of Zamboanga Del Norte as protected area and Its peripheral areas as buffer zone pursuant to Republic Act No. 7586 (NIPAs Act Of 1992), and shall be known as Selinog Island Protected Landscape and Seascape
No. 277 April 23, 2000 Declaring the Agoo-Damortis National Seashore Park situated in the Municipalities of Agoo, Sto. Tomas and Rosario, Province of La Union, Island of Luzon as protected area and its peripheral areas as buffer zone, pursuant to R.A. 7586 (NIPAs Act Of 1992) and shall be known as Agoo-Damortis Protected Landscape and Seascape
No. 278 April 23, 2000 Declaring Dinadiawan River Watershed Forest Reserve situated in the Municipality of Dipaculao, Province of Aurora as protected area pursuant to Republic Act 7586 (NIPAs Act of 1992) and shall be known as Dinadiawan River Protected Landscape
No. 279 April 23, 2000 Declaring Rizal National Park situated In the City of Dapitan, Province of Zamboanga Del Norte as protected area and Its peripheral areas as Buffer Zone pursuant to Republic Act No. 7586 (NIPAs Act of 1992), and shall be Known as Jose Rizal Memorial Protected Landscape
No. 280 April 23, 2000 Declaring the Libunao Spring Watershed Forest Reserve Situated In the Municipality of Sinait, Province of Ilocos Sur, Island of Luzon as protected area under the category of Protected Landscape Pursuant to R.A. 7586 (NIPAs Act Of 1992) and shall be known as Libunao Protected Landscape
No. 281 April 23, 2000 Declaring Murcielagos Island situated in the Municipality of Labason, Province of Zamboanga Del Norte as protected area and its Peripheral areas as Buffer Zone pursuant to Republic Act No. 7586 (NIPAs Act of 1992), and shall be known as Murcielagos Island protected Landscape and Seascape
No. 282 April 23, 2002 Declaring the Tipulu-An Mau-It Watershed Forest Reserve situated in the Municipality of Sibalom, Province of Antique as A protected area pursuant to Republic Act 7586 (NIPAs Act of 1992) and shall be known as Sibalom Natural Park
No. 283 April 23, 2000 Declaring Talaytay Watershed Forest Reserve, situated in the Municipality of Dinalungan, Province of Aurora as protected area pursuant to Republic Act 7586 (NIPAs Act of 1992) and shall be known as Talaytay protected Landscape
No. 284 April 23, 2000 Declaring the Bessang Pass National Shrine situated in the Municipality of Cervantes, Province of Ilocos Sur, Island of Luzon as A protected area and its Peripheral areas as Buffer Zone, pursuant to R.A. 7586 (NIPAs Act of 1992) and shall be known as Bessang Pass Natural Monument/Landmark
No. 285 April 23, 2000 Declaring the Magapit Game Refuge and Bird Sanctuary situated in the Municipalities of Gattaran and Lal-Lo, Province of Cagayan, Island of Luzon as protected area pursuant to R.A. 7586 (NIPAs Act of 1992) and shall be known as Magapit protected Landscape
No. 286 April 23, 2000 Declaring the Rajah Sikatuna National Park situated in the Municipalities of Carmen, Sierra Bullones, Garcia Hernandez, Valencia, Dimiao, Bilar and Batuan, Province of Bohol as protected area pursuant to Republic Act 7586 (NIPAs Act of 1992) and shall be known as Rajah Sikatuna protected Landscape
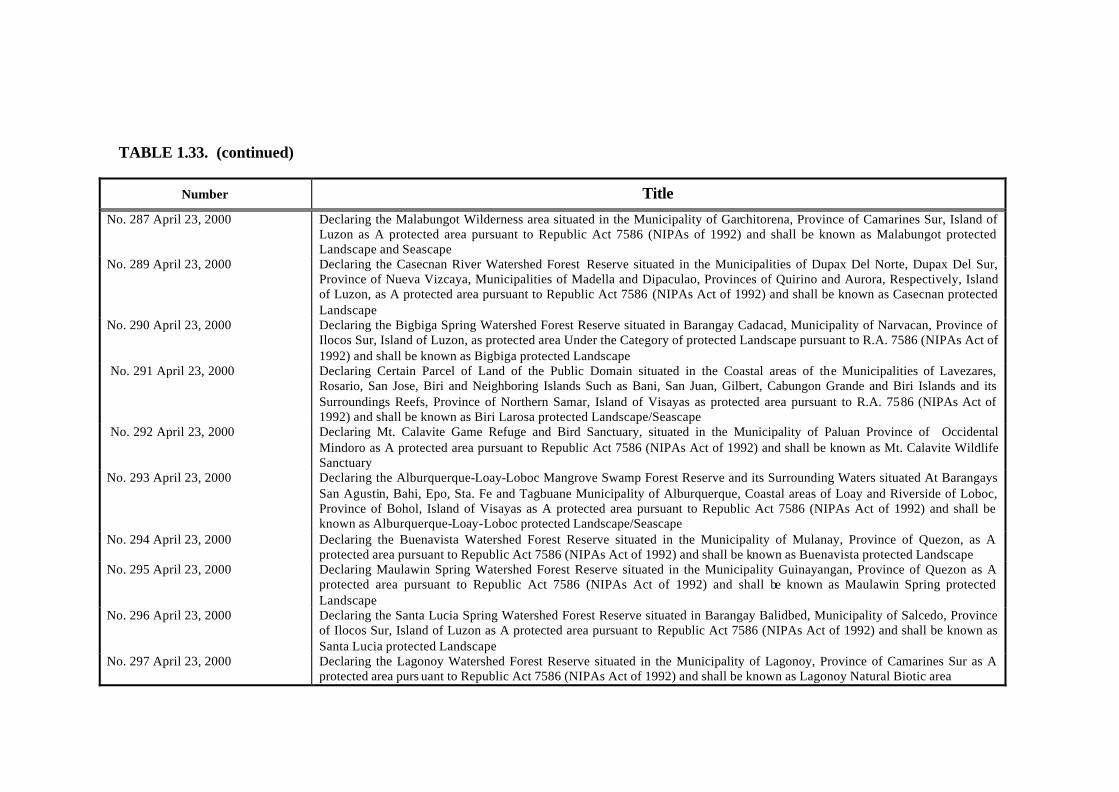
TABLE 1.33. (continued)
Number Title
No. 287 April 23, 2000 Declaring the Malabungot Wilderness area situated in the Municipality of Garchitorena, Province of Camarines Sur, Island of Luzon as A protected area pursuant to Republic Act 7586 (NIPAs of 1992) and shall be known as Malabungot protected Landscape and Seascape
No. 289 April 23, 2000 Declaring the Casecnan River Watershed Forest Reserve situated in the Municipalities of Dupax Del Norte, Dupax Del Sur, Province of Nueva Vizcaya, Municipalities of Madella and Dipaculao, Provinces of Quirino and Aurora, Respectively, Island of Luzon, as A protected area pursuant to Republic Act 7586 (NIPAs Act of 1992) and shall be known as Casecnan protected Landscape
No. 290 April 23, 2000 Declaring the Bigbiga Spring Watershed Forest Reserve situated in Barangay Cadacad, Municipality of Narvacan, Province of Ilocos Sur, Island of Luzon, as protected area Under the Category of protected Landscape pursuant to R.A. 7586 (NIPAs Act of 1992) and shall be known as Bigbiga protected Landscape
No. 291 April 23, 2000 Declaring Certain Parcel of Land of the Public Domain situated in the Coastal areas of the Municipalities of Lavezares, Rosario, San Jose, Biri and Neighboring Islands Such as Bani, San Juan, Gilbert, Cabungon Grande and Biri Islands and its Surroundings Reefs, Province of Northern Samar, Island of Visayas as protected area pursuant to R.A. 7586 (NIPAs Act of 1992) and shall be known as Biri Larosa protected Landscape/Seascape
No. 292 April 23, 2000 Declaring Mt. Calavite Game Refuge and Bird Sanctuary, situated in the Municipality of Paluan Province of Occidental Mindoro as A protected area pursuant to Republic Act 7586 (NIPAs Act of 1992) and shall be known as Mt. Calavite Wildlife Sanctuary
No. 293 April 23, 2000 Declaring the Alburquerque-Loay-Loboc Mangrove Swamp Forest Reserve and its Surrounding Waters situated At Barangays San Agustin, Bahi, Epo, Sta. Fe and Tagbuane Municipality of Alburquerque, Coastal areas of Loay and Riverside of Loboc, Province of Bohol, Island of Visayas as A protected area pursuant to Republic Act 7586 (NIPAs Act of 1992) and shall be known as Alburquerque-Loay-Loboc protected Landscape/Seascape
No. 294 April 23, 2000 Declaring the Buenavista Watershed Forest Reserve situated in the Municipality of Mulanay, Province of Quezon, as A protected area pursuant to Republic Act 7586 (NIPAs Act of 1992) and shall be known as Buenavista protected Landscape
No. 295 April 23, 2000 Declaring Maulawin Spring Watershed Forest Reserve situated in the Municipality Guinayangan, Province of Quezon as A protected area pursuant to Republic Act 7586 (NIPAs Act of 1992) and shall be known as Maulawin Spring protected Landscape
No. 296 April 23, 2000 Declaring the Santa Lucia Spring Watershed Forest Reserve situated in Barangay Balidbed, Municipality of Salcedo, Province of Ilocos Sur, Island of Luzon as A protected area pursuant to Republic Act 7586 (NIPAs Act of 1992) and shall be known as Santa Lucia protected Landscape
No. 297 April 23, 2000 Declaring the Lagonoy Watershed Forest Reserve situated in the Municipality of Lagonoy, Province of Camarines Sur as A protected area purs uant to Republic Act 7586 (NIPAs Act of 1992) and shall be known as Lagonoy Natural Biotic area
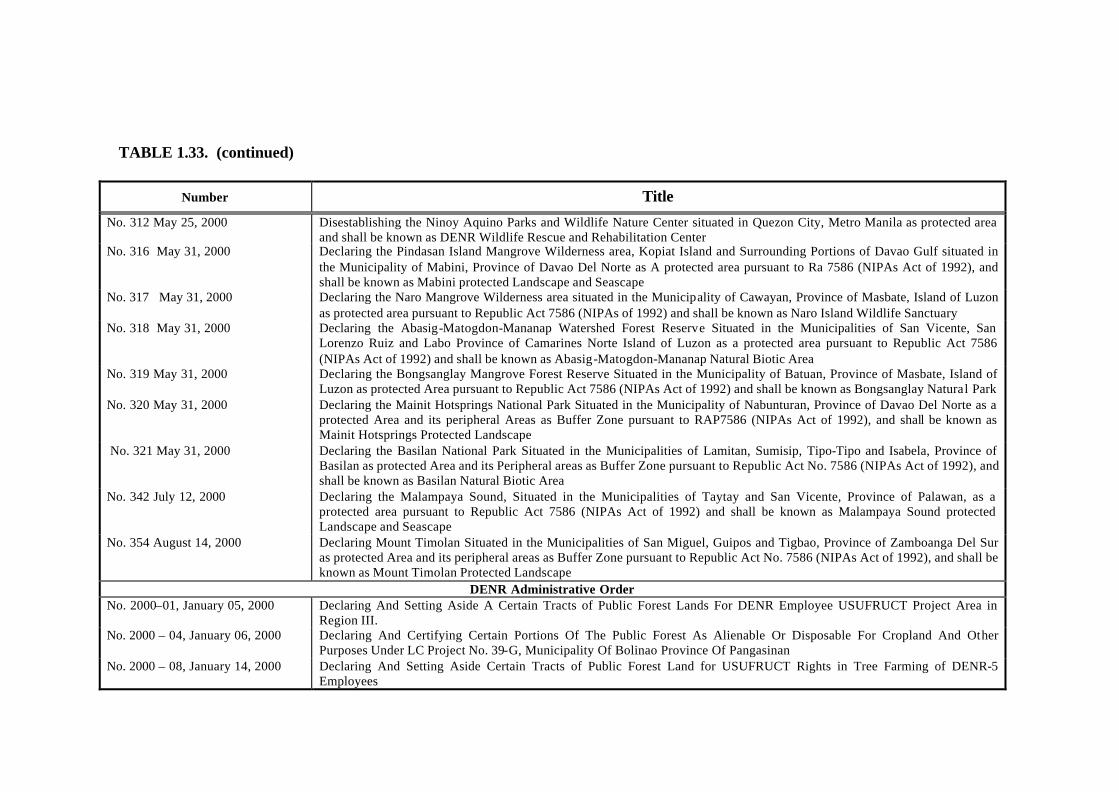
TABLE 1.33. (continued)
Number Title
No. 312 May 25, 2000 Disestablishing the Ninoy Aquino Parks and Wildlife Nature Center situated in Quezon City, Metro Manila as protected area and shall be known as DENR Wildlife Rescue and Rehabilitation Center
No. 316 May 31, 2000 Declaring the Pindasan Island Mangrove Wilderness area, Kopiat Island and Surrounding Portions of Davao Gulf situated in the Municipality of Mabini, Province of Davao Del Norte as A protected area pursuant to Ra 7586 (NIPAs Act of 1992), and shall be known as Mabini protected Landscape and Seascape
No. 317 May 31, 2000 Declaring the Naro Mangrove Wilderness area situated in the Municipality of Cawayan, Province of Masbate, Island of Luzon as protected area pursuant to Republic Act 7586 (NIPAs of 1992) and shall be known as Naro Island Wildlife Sanctuary
No. 318 May 31, 2000 Declaring the Abasig-Matogdon-Mananap Watershed Forest Reserve Situated in the Municipalities of San Vicente, San Lorenzo Ruiz and Labo Province of Camarines Norte Island of Luzon as a protected area pursuant to Republic Act 7586 (NIPAs Act of 1992) and shall be known as Abasig-Matogdon-Mananap Natural Biotic Area
No. 319 May 31, 2000 Declaring the Bongsanglay Mangrove Forest Reserve Situated in the Municipality of Batuan, Province of Masbate, Island of Luzon as protected Area pursuant to Republic Act 7586 (NIPAs Act of 1992) and shall be known as Bongsanglay Natural Park
No. 320 May 31, 2000 Declaring the Mainit Hotsprings National Park Situated in the Municipality of Nabunturan, Province of Davao Del Norte as a protected Area and its peripheral Areas as Buffer Zone pursuant to RAP7586 (NIPAs Act of 1992), and shall be known as Mainit Hotsprings Protected Landscape
No. 321 May 31, 2000 Declaring the Basilan National Park Situated in the Municipalities of Lamitan, Sumisip, Tipo-Tipo and Isabela, Province of Basilan as protected Area and its Peripheral areas as Buffer Zone pursuant to Republic Act No. 7586 (NIPAs Act of 1992), and shall be known as Basilan Natural Biotic Area
No. 342 July 12, 2000 Declaring the Malampaya Sound, Situated in the Municipalities of Taytay and San Vicente, Province of Palawan, as a protected area pursuant to Republic Act 7586 (NIPAs Act of 1992) and shall be known as Malampaya Sound protected Landscape and Seascape
No. 354 August 14, 2000 Declaring Mount Timolan Situated in the Municipalities of San Miguel, Guipos and Tigbao, Province of Zamboanga Del Sur as protected Area and its peripheral areas as Buffer Zone pursuant to Republic Act No. 7586 (NIPAs Act of 1992), and shall be known as Mount Timolan Protected Landscape
DENR Administrative Order No. 2000–01, January 05, 2000 Declaring And Setting Aside A Certain Tracts of Public Forest Lands For DENR Employee USUFRUCT Project Area in
Region III. No. 2000 – 04, January 06, 2000 Declaring And Certifying Certain Portions Of The Public Forest As Alienable Or Disposable For Cropland And Other
Purposes Under LC Project No. 39-G, Municipality Of Bolinao Province Of Pangasinan No. 2000 – 08, January 14, 2000 Declaring And Setting Aside Certain Tracts of Public Forest Land for USUFRUCT Rights in Tree Farming of DENR-5
Employees

TABLE 1.33. (continued)
Number Title
No. 2000- 09, January 17, 2000 Declaring And Setting Aside Certain Tracts Of Public Forest Lands For The DENR Employees Forest Production Area In DENR Region VII, Visayas.
No. 2000 – 12, February 09, 2000 Requiring The Planting Of Permanent Trees On Portions Of Alienable And Disposable Areas Susceptible To Soil Erosion No. 2000 – 13, February 09, 2000 Guidelines on the Implementation of the Biodiversity Monitoring System (BMS) in Protected Areas No. 2000 – 14, February 10, 2000 Amending Section 4 of DAO No. 99-46 Dated November 18, 1999 which Provides the Revised Regulations Governing the
Entry and Disposition of Imported Logs, Lumber Veneer, Plywood, Other Wood-Based Panels, Poles and Piles, Pulpwood and Wood Chips.
No. 2000-17, February 09, 2000 Addendum to DAO 99-44 Dated October 19, 1999 Series of 1999 Declaring and Setting Aside Certain Tracts of Public Forest Land Within Region IV for the DENR Employees Forest Production Area.
No. 2000 – 19, February 23, 2000 Declaring And Certifying Portion Of Public Forest As Alienable And Disposable Land For Cropland And Other Purposes Under LC Project No. 5-G Of Zamboanga City
No. 2000 – 20, February 20, 2000 Amendment to DENR Administrative Order No. 99-46 dated November 10, 1999, Re: Revised Regulations Governing the Entry and Disposition of Imported Logs, Lumber, Veneer, Plywood, Other Wood Based Panels, Poles and Piles, Pulpwood and Wood Chips.
No. 2000- 21, February 28, 2000 Revised Guidelines In The Issuance Of Private Land Timber Permit/Special Private Land Timber Permit (PLTP/SPLTP). No. 2000- 23, March 03, 2000 Amending Certain Sections of DAO 99-36 entitled "Revised Rules and Regulations Governing the Administration,
Management, Development and Disposition of Forest Lands Used for Grazing Purposes." No. 2000-24, March 09, 2000 Guidelines For The Implementation Of CY 2000 Banner Program – Delineation And Establishment Of Permanent Forestland
Boundaries No. 2000 – 29, March 14, 2000 Guidelines Regulating The Harvesting And Utilization Of Forest Products Within Community-Based Forest Management
Areas. No. 2000 – 30, March 20, 2000 Annual Government Share/Rental for Special Use of Forestland for Energy Projects No. 2000 – 31, March 31, 2000 Declaring And Setting Aside Certain Tracts Of Public Forest Land For USUFRUCT Rights In Tree Farming Activities Of
DENR-1 Employees No. 2000-32, March 31, 2000 Declaring And Setting Aside Certain Tracts Of Public Forest Land For Usufruct Rights In Tree Farming, Forest Production
Area And Housing Project For DENR Region 8 Personnel. No. 2000-33, March 31, 2000 Declaring And Setting Aside Additional Parcels Of Public Forest Land For USUFRUCT Rights In Tree Farming Of DENR-10
Employees No. 2000 – 34, January 27, 2000 Declaring & Setting Aside Certain Tract of Public Forest for the USUFRUCT Rights Area of DENR Personnel Region 02.

TABLE 1.33. (continued)
Number Title
No. 2000 – 35, April 04, 2000 Declaring And Setting Aside Certain Tracts Of Public Forest Land For Production Forest (MODIFIED SIFMA) Of DENR –I Employees.
No. 2000-36, April 07, 2000 Declaring and Setting Aside a Certain Tracts of Public Forest Lands for DENR Employee as Additional Sites for Usufruct Project Area in Region III.
No. 2000 – 41, May 15, 2000 Declaring And Setting Aside Additional Parcels Of Public Forest Land For Usufruct Rights In Tree Farming Of DENR-10 Employees.
No. 2000-42, May 24, 2000 Declaring And Setting Aside A Certain Tracts Of Public Forestland For DENR Employees As Additional Site For Usufruct Project In Reg1on III.
No. 2000-43, May 24, 2000 Declaring And Setting Aside A Certain Tracts Of Public Forest Land For DENR Employees As Additional Sites For Forest Production Project Area In Region III
No. 2000- 44, June 06, 2000 Amending Certain Provisions of DAO 96-29 and Providing Specific Guidelines for the Establishment and Management of Community-Based Projects within Protected Areas.
No. 2000-45, June 06, 2000 Amendment of DAO 25, S. Of 1992, Re: Duties and Responsibilities of Protected Area Superintendents (PASus) and their Functional Relationships with Other DENR Officers
No. 2000 – 50, June 21, 2000 Rules And Regulations Governing Sanitation Cutting On Pest-Infested Forests No.2000-5,1 June 21, 2000 Guidelines and Principle In Determin ing Fees for Access to and Sustainable Use of Resources in Protected Area. No. 2000-52, June 23, 2000 Amending DENR Administrative Order No. 2000-35. No. 2000 – 55, July 12, 2000 Rules And Regulations Governing The Implementation Of The Revised Price Monitoring System (RPMS) For Forest Products No. 2000-56, July 17, 2000 Amending The Project Area Covered Under DENR Administrative Order No. 99-44, Dated October 19,1999. No. 2000 – 57, July 14, 2000 Guidelines Governing The Implementation And Management Of Mangrove Subprojects Under The Forestry Sector Project No. 2000 – 60, July 24, 2000 Declaring And Setting Aside Certain Tracts Of Public Forest Land For The DENR Employees Forest Production Area In The
Province Of Negros Occidental. No. 2000 – 63, July 31, 2000 New Rates of Forest Charges Pursuant to Republic Act No. 7161 (R.A.) 7161) And Based on the 1999 FOB Market Price of
Forest Products. No. 2000 – 64, July 31, 2000 Regulation in the Cutting/Gathering And/Or Utilization Of Anahaw Palms. No. 2000- 65, August 07, 2000 Guidelines Governing The Creation Of Subproject Site Management Office And Its Institutionalization In The Forestry Sector
Project Implementation. No. 2000-66, August 30, 2000 Rules and Regulations to Govern the DENR-Palawan Wildlife Rescue and Conservation Center (PWRCC) Accreditation of
Palawan Ecological Destination Guides.

TABLE 1.33. (continued)
Number Title
No. 2000- 73, November 07, 2000 Amending DENR Administrative Order No. 2000-31 No. 2000 – 74, November 07, 2000 Declaring And Setting Aside Certain Tracts Of Public Forest Land For DENR Employees As Additional Site For Usufruct
Project In Region III No. 2000-75, November 07, 2000 Declaring and Setting Aside Certain Tracts of Public Forestland For Usufruct Rights In Tree Farming In The City of Cagayan
De Oro. No. 2000 – 76, November 07, 2000 Declaring And Setting Aside Additional Parcel Of Public Forest Land For Usufruct Rights In Tree Farming Of DENR-10
Employees No. 2000 – 78 November 07, 2000 Regulations in the Recovery and Disposition of Abandoned Logs, Drifted Logs, Sunken Logs, Uprooted and Fire/Typhoon
Damaged Trees, Tree Stumps, Tops and Branches. No. 2000 – 79, November 07, 2000 Declaring And Setting Aside A Certain Tract Of Public Forest Land For Usufruct Rights In Tree Farming For DENR-CENRO
Tacloban Personnel No. 2000-80, November 07, 2000 Declaring And Setting Aside Certain Tracts Of Public Forestland As Additional Area For Usufruct Rights In Tree Farming In
The City Of Malaybalay, Province Of Bukidnon. No. 2000 – 83, November 13, 2000 Guidelines For The Management And Development Of Small Islands, Including Its Coastal Areas. No. 2000-85, November 29, 2000 Declaring and Setting Aside a Certain Tracts of Public Forest Lands as Additional Sites for USUFRUCT Project Areas in
Region III. No. 2000 – 88, December 15, 2000 Declaring and Setting Aside Certain Tract of Public Forestland Within The Kaliwa River Watershed Reservation, Province of
Rizal Specifically For The DENR-NAMRIA Employees Usufruct Area. No. 2000 – 89, December 19, 2000 Amending Sections 7, 8.2 and 9 of DAO No. 97-36, Series of 1997 “Institutionalizing the Dalaw-Turo (DT) of the Protected
Areas and Wildlife Bureau (PAWB) as Environmental Education Strategy for Nature Conservation and Environmental Awareness Projects and Activities”.
No. 2000 – 90, December 15, 2000 Declaring and Setting Aside Certain Tracts of Public Forest Land for Usufruct Rights in Tree Farming and Production Forest Area of DENR CENRO Albuera, Regional Office and CENRO Maasin Personnel, Respectively.
No. 2000 – 91, December 15, 2000 Declaring and Setting Aside Certain Tract of Public Forest Land For the Use of the Usufruct Rights Area of DENR Region 2 Employees.
No. 2000 – 92, December 15, 2000 Declaring and Setting Aside Certain Tract of Forest Land for the DENR Employees Forest Production Area in Region 02. No. 2000-93, December 19, 2000 Declaring And Setting Aside A Certain Tracts Of Public Forest Land For The DENR – Natural Resources Development
Corporation Employees Forest Production Project Area In Region III.

TABLE 1.33. (continued)
Number Title
DENR Memorandum Circular No. 2000 – 18 August 30, 2000 Guidelines Amending MC No. 97- 03 Otherwise Known as Guidelines and Procedures in the Processing of Payments for
Community Organizing and Comprehensive Site Development of Subprojects Under the Forestry Sector Project No. 2000-19 September 04, 2000 Guidelines Governing The Updating Of Cost Estimates And Intensification Of Plantation Maintenance and Protection
Activities For DENR-FSP Watershed Subprojects Under JBIC Funding. No. 2000-22 December 19, 2000 Prescribing the Operational and Fund Management Guidelines for the Implementation of Phase IV of the Water Resources
Development Project-Watershed Management Improvement Component (WRDP-WMIC) DENR Memorandum Order
MC No. 2000-22 December 19, 2000
Prescribing the Operational and Fund Management Guidelines for the Implementation of Phase IV of the Water Resources Development Project-Watershed Management Improvement Component (WRDP-WMIC)
No. 2000 – 05 - October 05, 2000 Establishing Region IX As Pilot Area For The "Plant And Study Altogether Program" Of The DENR 2001
Republic Act 9072, April 09, 2001 An Act To Manage And Protect Caves And Cave Resources And For Other Purposes 9147, July 30, 2001 An Act Providing for the Conservation and Protection of Wildlife Resources And Their Habitats, Appropriating Funds
Therefor And For Other Purposes DENR Administrative Order
No. 2001 – 01, January 3, 2001 Payment of the Retention Fees for Community Organizing and Comprehensive Site Development of Subprojects Under Forestry Sector Project Funded by the Japan Bank for International Cooperation.
No. 2001 – 02, January 12, 2001 Amending Relevant Provisions of DAO 2000-68, Re: Institutionalization of the Directorate on Special Projects for Water and Integrated Ecosystems Management and Development (DSPWIEMD) and Related Functions, DAO No. 2000-70, Re: Suspension of DAO 2000-68 and Inclusion of Biodiversity Conservation Programs and Projects Within the Protected Areas and Wildlife Bureau.
No. 2001-06, January 16, 2001 Declaring and Setting Aside Certain Tracts of Public Forestland for Usufruct Rights in Tree Farming Activities of DENR-CAR Employees.
No. 2001-07, January 16, 2001 Suspending the Implementation of DAO No. 2000-63 Dated 31 July 2000 and Reverting the Rates of Forest Charges to and Under DAO No. 95-19 Pursuant to Republic Act 7161 (R.A. 7161).
No. 2001-14, March 29, 2001 Creation of the International Coral Reef Initiative Joint Philippine – Sweden Secretariat

TABLE 1.33. (continued)
Number Title
No. 2001 – 16, May 07, 2001 Institutionalizing the Counter-Partnership Institutionalizing the Counter-Partnership of the Civil Society Action Network in DENR Programs and Projects.
No. 2001 – 18, June 29, 2001 Amendments to DENR Administrative Order No. 99-27, dated July 19, 1999 Re: Implementation of Gender and Development (GAD) in the DENR.
No. 2001 – 19, July 02, 2001 Reiterating The Jurisdiction Of The Protected Areas And Wildlife Bureau (PAWB) Over The DENR Wildlife Rescue And Rehabilitation Center (DWRRC) - Ninoy Aquino Park And Wildlife Nature Center (NAPWNC).
No. 2001 – 22, August 16, 2001 Addendum to Section 4 of DENR Administrative Order No. 99-46 Providing for the Revised Regulations Governing the Entry and Disposition of Imported Logs, Lumber, Veneer, Plywood, Other Wood-Based Panels, Poles and Piles, Pulpwood and Wood Chips.
DENR Memorandum Circular No. 2001 – 01, January 04, 2001 Participatory 3-Dimensional Modeling as a Strategy in Protected Area Planning and Sustainable Natural Resource
Management. No. 2001- 03, January 09, 2001 Guidelines Governing the Utilization of Contingency Fund of Subprojects Under the Forestry Sector Project Funded by Japan
Bank for International Cooperation. No. 2001- 04, January 10, 2001 Revised Guidelines on the Conduct of Monitoring and Evaluation of the Forestry Sector Project. No. 2001 – 05, January 22, 2001 Preparation and Submission of an Island Physical Framework Plan for Small Island/Island Group. No. 2001- 07, March 13, 2001 Monthly Progress Report Form for the Forestry Sector Project. No. 2001 – 08, March 29, 2001 Renewal of Expired Rattan Cutting Contracts. No. 2001 – 11, June 06, 2001 Standard Format in the Monitoring and Evaluation of Status of Biodiversity Monitoring System (BMS) Implementation and
Results. DENR Memorandum Order
No. 2001 – 06, Adoption of Prescribed Methods in Monitoring Biodiversity. No. 2001 – 14, October 22, 2001 Creation of the Itogon Integrated Watershed Management Project (IIWMP), Itogon, Benguet, Cordillera Administrative
Region and Establishing a Project Management Office (PMO) at the Project Site. 2002
Republic Act No. 9175, November 7, 2002 An Act Regulating the Ownership. Possession, Sale, importation and Use of Chain Saws, Penalizing Violations Thereof and
for Other Purposes

TABLE 1.33. (continued)
Number Title
Proclamation No.176, April 15, 2002 Declaring the Year of 2002 as "The Year of Mountains", and the Month of June of Every Year thereafter as the "Month of
Mountains" in the Philippines, and Providing for the Conduct of Activities for its celebration No. 186 April 18, 2002 Declaring the Mountain Ranges of Northwest Panay Peninsula Situated in the Municipalities of Nabas, Malay, Buruanga,
Province of Aklan and Municipalities of Libertad and Pandan in the Province of Antique as Protected Area Pursuant to R.A.7586 (NIPAS ACT of 1992) and shall be known as the Northwest Panay Peninsula Natural Park
No. 214, June 20, 2002 Declaring the Mt. Isarog National Park situated in the City of Naga and Municipalities of Calabanga, Tinambac, Tigaon, Goa, Ocampo and Pili, Province of Camarines Sur, as a Protected Area pursuant to Republic Act 7586 (NIPAS ACT of 1992) to be henceforth known as Mt. Isarog National Park
No. 228 August 2, 2002 Declaring Mt. Malindang national Park situated in the Province of Misamis Occidental as a Protected Area and its Peripheral as Buffer Zone Pursuant to Republic Act 7586 (NIPAS ACT of 1992) and shall be known as Mt. Malindag Natural Park
No. 260 September 16, 2002 Declaring Initao National Park and Portion of Initao-Libertad Marine Waters Situated in the Municipalities of Initao and Libertad, Province of Misamis Oriental as a Protected Areas and its Peripheral Area as Buffer zone Pursuant to Republic Act 7586 (NIPAS ACT of 1992) and shall be known as Initao-Libertad Protected Landscape and Seascape
DENR Administrative Order No.2002-01, January 3, 2002 Amending Section 4 (Program Management) of DENR Administrative Order (DAO) No. 2000-102 Entitled " Establishing the
National Support Program on Local Environmental and Natural Resources Planning and Management (ENRPM) No. 2002-02, January 03, 2002 Establishment and Management of Community Based Program in Protected Area No.2002-03, January 22, 2002 Creation of the Organizational and Management Structure for the Implementation of the USAID Assisted Eco-Governance
Program No.2002-04, January 22, 2002 Rule and Regulation Governing the Issuance of Permits for Treasure Hunting, Shipwreck/Sunken Vessel recovery and
Disposition of Recovered Treasures/Valuable Cargoes, including Hoarded Hidden Treasures No.2002-08, February 20, 2002 Strengthening the Coastal Environment Program (CEP) through the Establishment of the Coastal and Marine Coordinating
Officer (CMM)) as the National Coordinating Office for all Coastal and Marine Environment Activities No.2002-11, March 5, 2002 Transfer of the Palawan Wildlife and Conservation Center, formerly Crocodile Farming Institute, from the Protected Areas and
Wildlife Bureau to the Natural Resources Development Corporation No.2002-15, July 10, 2002 Revising DAO No. 97-21 RE: Institutionalizing the Community Environment and Natural Resources (CENR) Management
Course in the Department of Environment and Natural Resources No. 2002-19, September 16, 2002 Guidelines on the Trade of Captive-bred Butterfly Specimen
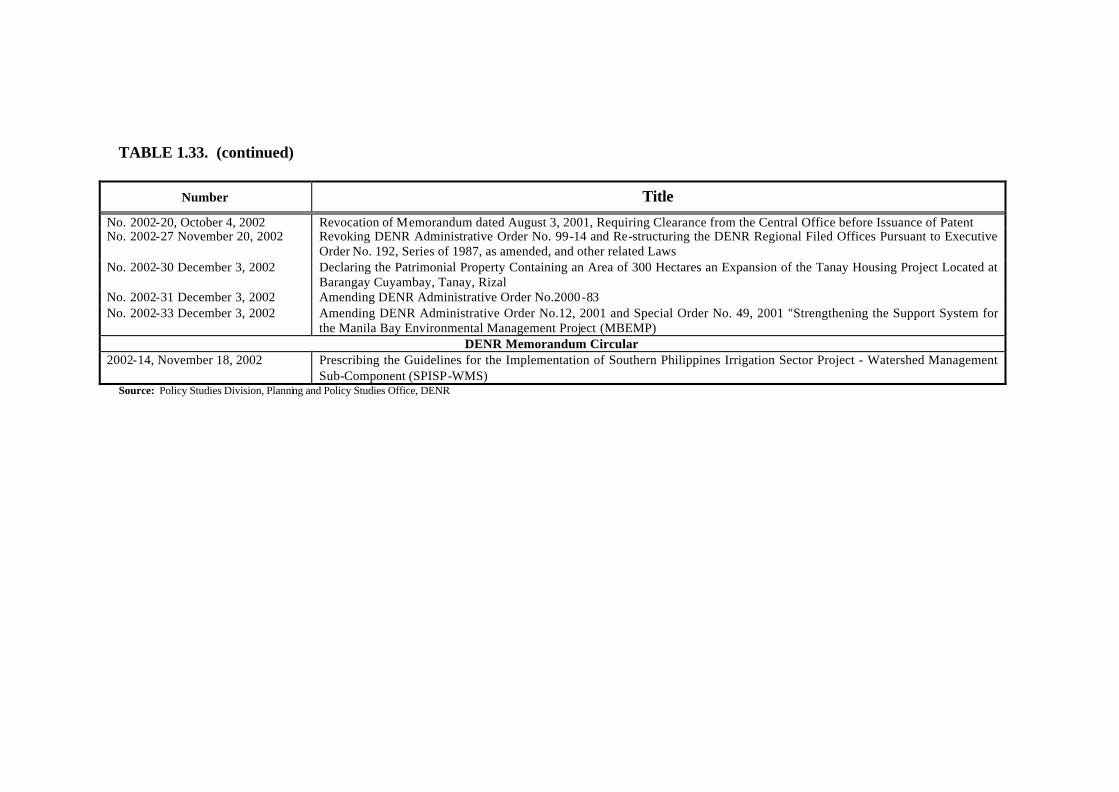
TABLE 1.33. (continued)
Number Title
No. 2002-20, October 4, 2002 Revocation of Memorandum dated August 3, 2001, Requiring Clearance from the Central Office before Issuance of Patent No. 2002-27 November 20, 2002 Revoking DENR Administrative Order No. 99-14 and Re-structuring the DENR Regional Filed Offices Pursuant to Executive
Order No. 192, Series of 1987, as amended, and other related Laws No. 2002-30 December 3, 2002 Declaring the Patrimonial Property Containing an Area of 300 Hectares an Expansion of the Tanay Housing Project Located at
Barangay Cuyambay, Tanay, Rizal No. 2002-31 December 3, 2002 Amending DENR Administrative Order No.2000-83 No. 2002-33 December 3, 2002 Amending DENR Administrative Order No.12, 2001 and Special Order No. 49, 2001 "Strengthening the Support System for
the Manila Bay Environmental Management Project (MBEMP) DENR Memorandum Circular
2002-14, November 18, 2002 Prescribing the Guidelines for the Implementation of Southern Philippines Irrigation Sector Project - Watershed Management Sub-Component (SPISP-WMS)
Source: Policy Studies Division, Planning and Policy Studies Office, DENR

TABLE 1.34. FORESTRY LICENCES, LEASES AND PERMITS, 1992 to 2002 (area in hectares, AAC in cubic meters, linear meter)
TLA ITPLA/IFMA Rattan Cutting Contracts AFFLA TFA Grazing Leases
and Permits Region
No. Area AAC No. Area No. Area AAC(lm) No. Area No. Area No. Area
Yr. 1992 CAR 1 69,000 25,000 2 10,400 8 106,480 6,388,318 3 606 7 278 85 25,255 Region 1 - - - 8 8,641 6 19,082 899,256 7 2,459 21 1,764 52 12,151 Region 2 18 569,660 238,779 6 17,198 34 245,000 9,235,036 9 3,642 6 274 195 64,392 Region 3 - - - 12 15,055 3 15,000 3,147,808 14 5,297 25 1,555 62 25,125 Region 4 7 333,153 120,527 11 28,700 85 602,206 30,070,066 15 7,189 7 2,753 202 75,195 Region 5 - - - 3 3,630 3 9,464 323,017 3 6,301 6 836 111 38,442 Region 6 - - - 4 5,111 1 5,000 423,912 - - 15 517 29 7,612 Region 7 - - - 5 2,510 - - - - - - - 13 7,057 Region 8 - - - 4 3,095 44 293,262 14,791,019 2 4,210 - - 2 840 Region 9 5 134,050 68,462 22 28,807 41 256,234 6,752,685 2 590 3 622 2 2,796 Region 10 12 542,577 524,318 18 147,864 38 222,960 18,069,541 15 46,084 10 1,446 99 32,035 Region 11 11 458,428 450,719 44 148,514 79 637,508 68,889,490 12 20,587 6 3,836 87 49,516 Region 12 1 14,080 21,996 3 23,797 6 30,000 2,758,871 6 3,219 1 960 23 24,270 Region 13 5 138,865 257,455 - - 8 115,845 27,828,008 - - - - - - Philippines 60 2,259,813 1,707,256 142 443,322 356 2,558,041 189,577,027 88 100,184 107 14,841 962 364,686
Note: TLA - Timber License Agreement IFMA - Industrial Forest Plantation Management Agreement AFF - Agro Forestry Farm Leases TF - Tree Farm Leases
Source: FMB, DENR

TABLE 1.34. (continued)…
TLA ITPLA/IFMA Rattan Cutting
Contracts AFFLA TFA Grazing Leases
and Permits Region
No. Area AAC No. Area No. Area AAC(lm) No. Area No. Area No. Area
Yr. 1993 CAR 1 74,500 60,000 2 10,400 9 106,480 6,388,318 3 606 7 278 79 24,076Region 1 - - - 9 8,981 6 19,082 899,256 7 2,459 21 1,764 49 11,259
Region 2 9 324,935 151,604 17 27,754 35 255,000 9,805,692 9 3,642 6 274 172 54,980Region 3 - - - 10 14,451 3 15,000 3,147,808 13 4,033 26 1,655 60 23,865Region 4 4 152,455 48,881 12 29,600 85 602,206 30,070,066 14 7,044 7 2,753 177 61,859Region 5 - - - 3 3,630 3 9,464 323,017 3 6,301 6 836 108 37,483Region 6 - - - 4 1,042 1 5,000 423,912 - - 15 517 27 6,834
Region 7 - - - 4 2,244 - - - - - 1 234 13 7,057Region 8 - - - 4 3,095 44 293,262 14,791,019 2 4,210 - - 2 840Region 9 5 131,695 52,226 36 38,858 41 256,234 6,752,685 2 590 4 632 2 2,796Region 10 7 417,247 222,467 24 154,856 39 231,535 18,717,370 15 46,084 10 1,446 93 29,055Region 11 10 445,998 478,748 59 161,031 901,073,080 87,188,235 12 20,587 6 3,836 80 44,168
Region 12 1 54,170 33,422 3 24,685 6 30,000 2,758,871 6 3,219 1 960 21 21,050Region 13 4 64,037 123,070 - - 8 115,845 27,828,008 - - - - - - Philippines 41 1,665,037 1,170,418 187 480,627 3703,012,188 209,094,257 86 98,775 110 15,185 883 325,322
Note: TLA - Timber License Agreement IFMA - Industrial Forest Plantation Management Agreement AFF - Agro Forestry Farm Leases TF - Tree Farm Leases
Source: FMB, DENR

TABLE 1.34. (continued)…
TLA ITPLA/IFMA Rattan Cutting Contracts AFFLA TFA Grazing Leases
and Permits Region
No. Area AAC No. Area No. Area AAC(lm) No. Area No. Area No. Area
Yr. 1994 CAR 1 74,500 27,782 2 10,400 11 174,780 7,719,759 3 606 9 681 76 22,496 Region 1 - - - 10 9,971 6 18,513 899,256 7 2,459 24 1,835 50 10,067 Region 2 4 145,965 36,306 17 27,754 29 223,370 10,493,102 9 3,642 8 698 154 48,553
Region 3 - - - 14 16,654 2 10,000 1,200,114 13 4,033 29 2,087 69 23,826 Region 4-A 5 203,806 53,888 12 17,186 13 122,789 6,557,767 14 7,044 7 2,753 4 414 Region 4-B - - - 5 15,392 69 519,991 23,076,675 6 4,122 4 2,350 143 50,937 Region 5 - - - 3 3,630 3 9,464 323,567 3 6,301 6 836 98 31,717 Region 6 - - - 5 1,583 1 5,000 423,912 - - 15 517 17 3,165
Region 7 - - - 5 3,522 44 293,262 14,791,119 - - 1 234 8 4,718 Region 8 - - - 6 3,367 34 222,295 6,413,280 2 4,210 2 840 Region 9 5 131,695 52,226 45 47,696 39 247,417 18,900,493 2 590 4 632 2 3,020 Region 10 7 409,642 223,871 31 163,928 93 1,030,187 85,232,974 15 46,084 10 1,446 77 24,071 Region 11 9 479,730 389,142 65 167,111 7 37,200 3,562,781 12 20,587 6 3,836 74 39,129
Region 12 2 66,020 38,750 7 28,220 13 154,270 31,426,954 6 3,219 1 960 18 19,191 Region 13 4 64,037 123,070 - - - - - - - - - - - Philippines 37 1,575,395 945,035 227 516,414 364 3,068,538 211,021,753 92 102,897 124 18,865 792 282,144
Note: TLA - Timber License Agreement IFMA - Industrial Forest Plantation Management Agreement AFF - Agro Forestry Farm Leases TF - Tree Farm Leases
Source: FMB, DENR

TABLE 1. 34 (continued)……
TLA ITPLA/IFMA Rattan Cutting Contracts AFFLA TFA Grazing Leases
and Permits Region
No. Area AAC No. Area No. Area AAC(lm) No. Area No. Area No. Area Yr. 1995
CAR 1 74,500 27,782 2 10,400 11 174,780 7,719,759 3 606 9 681 75 21,735 Region 1 - - - 10 9,971 6 18,513 899,256 7 2,459 24 1,835 39 7,778 Region 2 5 160,315 48,842 18 25,450 29 223,370 10,493,102 7 1,418 11 1,251 142 43,639 Region 3 - - - 19 21,206 2 10,000 1,200,114 13 4,033 33 2,601 49 19,128 Region 4-A 5 163,451 75,315 12 17,186 13 122,789 6,557,767 8 2,922 3 403 4 414 Region 4-B - - - 5 15,392 69 519,991 23,076,675 6 4,122 3 2,194 133 47,056 Region 5 - - - 2 1,630 3 9,464 323,567 3 6,301 6 836 87 27,447 Region 6 - - - 5 1,583 1 5,000 423,912 - - 15 517 14 2,232 Region 7 - - - 6 4,154 44 293,262 14,791,119 - - 3 366 8 4,718 Region 8 - - - 7 4,295 30 165,376 4,320,436 2 4,210 2 840 Region 9 5 131,695 52,226 48 55,165 44 298,214 12,916,511 2 590 4 632 1 1,720 Region 10 9 487,607 265,165 34 168,044 100 1,125,492 95,890,630 15 46,084 10 1,446 79 24,457 Region 11 7 340,783 335,530 72 174,807 10 68,460 7,284,037 12 20,587 6 3,836 71 37,019 Region 12 2 72,270 38,750 8 28,944 8 115,845 27,858,751 6 3,219 1 960 18 19,191 Region 13 3 66,495 218,735 - - - - - - - - - - -Philippines 37 1,497,116 1,062,345 248 538,227 370 3,150,556 213,755,636 84 96,551 128 17,558 722 257,374
Note: TLA - Timber License Agreement IFMA - Industrial Forest Plantation Management Agreement AFF - Agro Forestry Farm Leases TF - Tree Farm Leases
Source: FMB, DENR

TABLE 1.34. (continued)……
Grazing Leases TLA ITPLA/IFMA Rattan Cutting Contracts AFFLA TFA and Permits Region
No. Area AAC No. Area No. Area AAC(lm) No. Area No. Area No. Area
Yr. 1996 CAR 1 74,500 20,611 2 10,400 11 174,780 7,719,759 3 606 9 681 73 18,509Region 1 - - - 11 10,966 5 15,115 674,982 7 2,459 24 1,835 42 8,155Region 2 5 160,315 45,488 18 25,450 46 393,170 15,451,437 7 1,418 32 2,867 164 41,732Region 3 - - - 19 21,206 2 10,000 1,200,114 13 4,033 32 2,561 46 15,727Region 4-A 5 163,451 75,315 12 17,186 13 122,791 6,550,764 8 2,922 3 403 3 334Region 4-B - - - 5 15,392 68 441,367 23,284,605 6 4,122 3 2,194 111 39,079Region 5 - - - 2 1,630 3 9,404 323,567 3 6,301 6 836 82 26,490Region 6 - - - 5 1,583 1 5,260 423,912 - - 20 1,057 13 2,102Region 7 - - - 6 4,154 - - - - - 3 366 5 1,990Region 8 - - - 7 4,295 44 293,262 14,791,119 2 4,210 - - 1 560Region 9 4 114,865 36,433 43 48,372 16 125,704 3,767,108 2 590 4 632 1 1,720Region 10 2 96,055 42,471 10 51,240 15 79,005 5,320,186 4 4,189 3 404 76 23,067Region 11 2 72,575 26,055 60 109,444 74 1,039,990 85,080,210 12 20,587 6 3,836 65 32,333Region 12 1 54,170 33,422 8 28,944 10 63,851 5,020,872 6 3,219 1 960 17 15,191Region 13 12 659,760 489,888 25 174,414 38 318,528 24,992,002 11 41,895 7 1,042 1 460ARMM 3 66,495 218,735 - - 9 115,645 29,352,966 - - - - - -Philippines 35 1,462,186 988,418 233 524,676 355 3,207,872 223,953,603 84 96,551 153 19,674 700 227,449
Note: TLA - Timber License Agreement IFMA - Industrial Forest Plantat ion Management Agreement AFF - Agro Forestry Farm Leases TF - Tree Farm Leases
Source: FMB, DENR

TABLE 1.34. (continued)…
Grazing Leases TLA ITPLA/IFMA Rattan Cutting Contracts AFFLA TFA and Permits Region
No. Area AAC No. Area No. Area AAC(lm) No. Area No. Area No. Area Yr. 1997
CAR 1 74,500 27,782 1 10,080 3 82,840 820,979 3 606 9 681 67 17,190Region 1 - - - 11 10,966 5 15,115 675,032 7 2,459 24 1,835 30 6,055Region 2 5 160,465 42,984 18 25,450 24 260,670 11,575,261 7 1,418 30 2,767 148 37,819Region 3 - - - 18 16,980 - - - 12 3,533 31 2,455 39 12,494Region 4-A 3 120,870 24,930 11 17,006 14 100,330 6,480,364 8 2,922 3 403 4 444Region 4-B - - - 5 15,392 41 296,041 14,024,846 5 2,347 2 2,146 77 25,940Region 5 - - - 2 1,630 2 5,619 278,550 3 6,301 5 236 70 21,648Region 6 - - - 5 1,583 - - - - - 20 1,057 12 1,944Region 7 - - - 6 4,154 - - - - - 3 366 5 1,990Region 8 - - - 7 4,295 18 - 4,555,455 2 4,210 0 0 1 580Region 9 3 84,535 40,960 42 48,265 39 205,878 6,045,310 2 590 4 632 1 1,720Region 10 2 96,055 42,471 6 42,302 13 67,320 4,237,313 4 4,189 3 404 64 20,971Region 11 - - - 43 71,518 78 685,598 77,584,116 12 20,587 6 3,836 58 27,121Region 12 1 54,170 33,422 8 28,944 10 63,851 5,020,872 6 3,219 1 960 12 11,332Region 13 8 574,390 473,257 23 173,334 45 284,561 28,102,135 11 41,895 7 1,042 - -ARMM 2 42,915 136,026 - - 3 - 13,038,015 - - - - - -Philippines 25 1,207,900 821,832 206 471,899 295 2,067,823 172,438,248 82 94,276 148 18,820 588 187,248
Note: TLA - Timber License Agreement IFMA - Industrial Forest Plantation Management Agreement AFF - Agro Forestry Farm Leases TF - Tree Farm Leases
Source: FMB, DENR

TABLE 1.34. (continued)…
Rattan Cutting Grazing Leases TLA ITPLA/IFMA Contracts
AFFLA TFA and Permits Region
No. Area AAC No. Area No. Area AAC(lm) No. Area No. Area No. Area Yr. 1998
CAR 1 74,500 20,611 1 10,080 1 24,180 199,979 3 606 9 681 60 13,245Region 1 - - - 11 10,966 5 15,685 674,982 7 2,459 23 1,756 27 6,152Region 2 3 67,875 21,492 18 25,450 16 178,170 8,555,376 7 1,418 30 2,767 119 29,713Region 3 - - - 17 16,729 - - - 12 3,533 31 2,005 56 16,762Region 4-A 2 84,450 8,042 9 15,826 16 139,330 7,874,020 8 2,922 3 403 4 444Region 4-B - - - 5 15,392 25 141,950 5,937,346 4 2,247 2 2,146 84 31,875Region 5 - - - - - 2 8,275 48,017 3 6,301 5 236 63 19,348Region 6 - - - 4 1,483 - - - - - 20 1,057 13 1,976Region 7 - - - 6 4,154 - - - - - 3 366 4 1,887Region 8 - - - 7 4,295 - - - 2 47,210 - - 1 580Region 9 2 67,705 - 42 48,266 2 n.a. 394,359 2 590 4 632 1 1,720Region 10 - - - 5 42,102 13 67,320 5,296,448 4 4,189 3 404 51 15,836Region 11 - - - 42 71,238 78 685,598 77,584,116 12 20,587 6 3,836 49 23,347Region 12 1 54,170 - 8 28,945 11 68,850 4,688,944 6 3,219 1 960 9 7,032Region 13 7 531,662 402,446 24 231,788 21 128,671 11,466,859 11 41,895 7 1,042 - -ARMM 2 42,915 136,026 - - - - - - -Philippines 18 923,277 588,617 199 526,714 1901,458,029 122,720,446 81 94,176 147 18,291 541 169,917
Note: TLA - Timber License Agreement IFMA - Industrial Forest Plantation Management Agreement AFF - Agro Forestry Farm Leases TF - Tree Farm Leases
Source: FMB, DENR
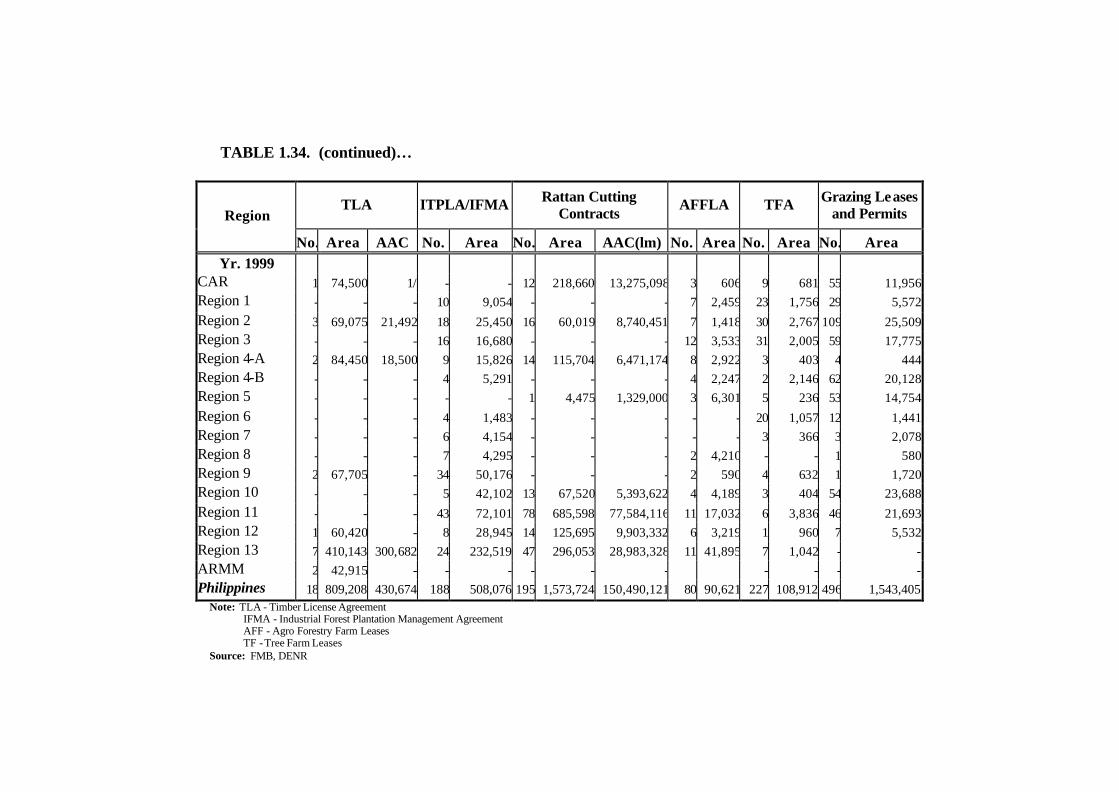
TABLE 1.34. (continued)…
TLA ITPLA/IFMA Rattan Cutting Contracts AFFLA TFA Grazing Leases
and Permits Region
No. Area AAC No. Area No. Area AAC(lm) No. Area No. Area No. Area Yr. 1999
CAR 1 74,500 1/ - - 12 218,660 13,275,098 3 606 9 681 55 11,956 Region 1 - - - 10 9,054 - - - 7 2,459 23 1,756 29 5,572 Region 2 3 69,075 21,492 18 25,450 16 60,019 8,740,451 7 1,418 30 2,767 109 25,509 Region 3 - - - 16 16,680 - - - 12 3,533 31 2,005 59 17,775 Region 4-A 2 84,450 18,500 9 15,826 14 115,704 6,471,174 8 2,922 3 403 4 444 Region 4-B - - - 4 5,291 - - - 4 2,247 2 2,146 62 20,128 Region 5 - - - - - 1 4,475 1,329,000 3 6,301 5 236 53 14,754 Region 6 - - - 4 1,483 - - - - - 20 1,057 12 1,441 Region 7 - - - 6 4,154 - - - - - 3 366 3 2,078 Region 8 - - - 7 4,295 - - - 2 4,210 - - 1 580 Region 9 2 67,705 - 34 50,176 - - - 2 590 4 632 1 1,720 Region 10 - - - 5 42,102 13 67,520 5,393,622 4 4,189 3 404 54 23,688 Region 11 - - - 43 72,101 78 685,598 77,584,116 11 17,032 6 3,836 46 21,693 Region 12 1 60,420 - 8 28,945 14 125,695 9,903,332 6 3,219 1 960 7 5,532 Region 13 7 410,143 300,682 24 232,519 47 296,053 28,983,328 11 41,895 7 1,042 - - ARMM 2 42,915 - - - - - - - - - - Philippines 18 809,208 430,674 188 508,076 195 1,573,724 150,490,121 80 90,621 227 108,912 496 1,543,405
Note: TLA - Timber License Agreement IFMA - Industrial Forest Plantation Management Agreement AFF - Agro Forestry Farm Leases TF - Tree Farm Leases
Source: FMB, DENR

TABLE 1.34. (continued)…
TLA ITPLA/IFMA Rattan Cutting Contracts AFFLA TFA Grazing Leases
and Permits Region
No. Area AAC No. Area No. Area AAC(lm) No. Area No. Area No. Area Yr. 2000
CAR 1 74,500 15,814 - - 10 101,540 893,109 3 606 9 681 51 11,199 Region 1 - - - 9 9,054 6 19,082 899,256 7 2,459 27 1,805 17 4,230 Region 2 3 85,466 25,794 18 36,210 42 323,370 13,487,397 7 1,418 34 3,125 101 22,286 Region 3 - - - 15 14,730 2 16,670 2,782,181 12 3,533 31 2,005 38 12,119 Region 4 2 72,800 7,694 14 34,644 102 1,281,082 32,624,748 12 5,169 5 2,549 59 18,511 Region 5 - - - - - 4 9,419 326,567 3 6,301 5 236 49 13,710 Region 6 - - - 4 1,483 1 5,000 423,912 - - 20 1,057 10 1,233 Region 7 - - - 6 4,154 - - 3 366 1 816 Region 8 - - - 7 4,099 23 177,000 9,088,172 2 4,210 - - - - Region 9 2 67,705 8,765 29 62,322 33 183,419 5,133,025 2 590 4 632 1 1,720 Region 10 2 96,055 120,032 5 42,102 15 76,652 6,163,279 4 4,189 3 404 41 11,242 Region 11 - - - 30 73,505 51 488,883 69,312,016 7 12,186 4 2,938 2 386 Region 12 1 60,420 - 23 38,527 19 176,853 21,280,299 10 8,065 3 1,858 49 24,483 Region 13 6 363,744 510,696 24 227,523 49 2,005,206 26,260,112 11 41,895 7 1,042 - - ARMM 2 42,915 n.a. - - 13 138,010 31,892,087 - - - - - - Philippines 19 863,605 688,795 184 548,353 370 5,002,186 220,566,160 80 90,621 155 18,698 419 121,935
Note: TLA - Timber License Agreement IFMA - Industrial Forest Plantation Management Agreement AFF - Agro Forestry Farm Leases TF - Tree Farm Leases
Source: FMB, DENR

TABLE 1.34. (continued)…
TLA ITPLA/IFMA Rattan Cutting
Contracts AFFLA TFA
Grazing Leases and Permits Region
No. Area AAC No. Area No.Area AAC(lm) No. Area No. Area No. Area
Yr. 2001
CAR 1 74,500 - - - - - - 3 606 9 681 51 11,199
Region 1 - - - 9 9,054 - - - 7 2,459 28 2,195 17 4,230
Region 2 3 85,466 16,284 18 36,210 - - - 7 1,418 34 3,127 100 21,666
Region 3 - - - 15 14,730 - - - 11 3,333 40 2,993 37 11,546
Region 4 2 72,800 - 15 106,261 - - - 12 5,169 5 2,549 58 18,341
Region 5 - - - - - - - - 3 6,301 5 236 49 13,710
Region 6 - - - 4 1,483 - - - - - 20 1,057 9 1,132
Region 7 - - - 7 4,912 - - - - - 3 366 1 816
Region 8 - - - 7 4,099 - - - 2 4,210 - - - -
Region 9 2 67,705 8,765 30 62,322 - - - 2 590 4 632 - -
Region 10 2 96,055 120,032 6 42,302 - - - 4 4,189 3 404 36 10,099
Region 11 - - - 30 73,705 - - - 7 12,186 4 2,938 2 386
Region 12 1 60,420 - 23 38,527 - - - 10 8,065 3 1,858 47 25,813
Region 13 7 410,143 67,073 22 221,103 - - - 11 41,895 7 1,042 - -
ARMM 2 42,915 NA - - - - - - - - - - -
Philippines 20 910,004 212,154 186 614,708 - - - 79 90,421 165 20,078 407 118,938 Note: TLA - Timber License Agreement
IFMA - Industrial Forest Plantation Management Agreement AFF - Agro Forestry Farm Leases TF - Tree Farm Leases
Source: FMB, DENR

TABLE 1.34. (continued)…
TLA ITPLA/IFMA Rattan Cutting
Contracts AFFLA TFA Grazing Leases
and Permits
Region No. Area AAC No. Area No. Area AAC(lm) No. Area No. Area No. Area
Yr. 2002
CAR 1 74,500 12,765 1 13,658 2 30,000 839,576 4 892 9 681 51 11,199
Region 1 - - - 9 9,054 - - - 7 2,459 28 2,195 17 4,111
Region 2 3 85,466 23,620 17 35,400 10 48,347 2,553,680 7 1,418 35 3,148 100 21,626
Region 3 - - - 17 17,905 1 12,913 823,563 11 3,333 40 2,993 38 11,656
Region 4 2 72,800 - - - - - - - - - -
Region 4A - - - 14 144,660 - - - 8 2,922 3 403 2 239
Region 4B - - - 3 4,891 2 10,000 333,330 4 2,247 2 2,146 52 16,157
Region 5 - - - - - - - - 3 6,301 5 236 49 13,710
Region 6 - - - 6 8,683 - - - - - 20 1,057 6 565
Region 7 - - - 7 4,912 - - - - - 3 366 1 816
Region 8 - - - 7 4,099 6 30,850 1,587,618 2 4,210 - - - - Region 9 1 20,325 = 31 74,196 - - - 2 590 4 632 - - Region 10 2 96,055 120,032 5 42,102 4 25,825 2,242,400 4 4,189 3 404 36 10,099
Region 11 - - - 31 79,130 6 133,009 30,017,683 7 12,186 4 2,938 2 386
Region 12 1 60,420 - 23 38,527 - - - 10 8,065 3 1,858 46 24,896
Region 13 6 334,598 14,618 22 219,523 8 217,719 5,018,654 11 41,895 7 1,042 - - ARMM 2 42,915 NA - - - - - - - - - - - Philippines 18 787,079 171,035 193 696 39 508,663 43,416,504 80 90,707 166 20,099 400 115,460
Note: TLA - Timber License Agreement IFMA - Industrial Forest Plantation Management Agreement AFF - Agro Forestry Farm Leases TF - Tree Farm Leases
Source: FMB, DENR

TABLE 1.35. NUMBER OF PERMITS ISSUED FOR WILDLIFE LOCAL TRANSPORT, 1990 to 2002 (By Region)
Wildlife 1990 1991 1992 1993 1994 1995 1996 1997 1998 1999 2000 2001 2002
CAR Mammals 1 3 1 3 1 1 Birds 1 2 1 3 2 1 1 Reptiles 1 1 1 Insects 2 2 Amphibians 2 Orchids 1 Plants By Product Derivatives 3
Subtotal 4 8 2 7 4 2 1 1 1 1 3 NCR
Mammals 1 4 Birds 2 8 4 Reptiles 1 2 Insects 1 Orchids 1
Subtotal 3 10 11 Region I
Mammals 2 3 Birds 0 2 Insects 0 Orchids 3 1 Plants 0 By Product 0
Subtotal 3 3 5 0

TABLE 1.35 (continued)…..
Wildlife 1990 1991 1992 1993 1994 1995 1996 1997 1998 1999 2000 2001 2002
Region III Mammals 1 1 37Birds 2 4Plants 12Derivatives 47
Subtotal 1 3 100 Region IV
Mammals 7 68 5 12 Birds 3 Amphibians 8 Reptiles 2 Insects 168 234 573 691 547 494 994 Derivatives
Subtotal 168 234 580 759 547 499 1019 Region IV A
Mammals 5 37Birds 3 4Plants 12Derivatives 47
Subtotal 8 100 Region IV B Mammals 1 Birds 1 Amphibians Reptiles Insects 678 738Derivatives 8Plants 2
Subtotal 682 746

TABLE 1.35 (continued)…..
Wildlife 1990 1991 1992 1993 1994 1995 1996 1997 1998 1999 2000 2001 2002
Region V Birds 3 1 2 Orchids 2 13 13 Plants 1
Subtotal 3 0 0 1 4 14 13 0 Region VI
Mammals 2 7 1 4 2 1 0 3 7 6 3 2Birds 1 2 2 2 11 22 16 10 9 7 10 5
Amphibians 1 Reptiles 1 1 1
Insects 1 Orchids 21 42 15 19 28Plants 4 2 2 3By Product 1 3 0Derivatives 1 22 5
Subtotal 4 9 3 4 2 13 23 17 36 62 33 58 44 Region VII
Mammals 1 2 6 2 6 2 1 0 3 4 4 14 1Birds 4 24 14 22 18 7 4 16 13 20 11 13 4Amphibians 1 1 2 0 Reptiles 2 8 18 1 1 3 1 3 8 1Insects 6 24 52 4 1 Orchids 158 413 577 310 296Plants 2 6 1 2
Subtotal 5 34 44 84 46 9 6 17 180 445 598 348 302
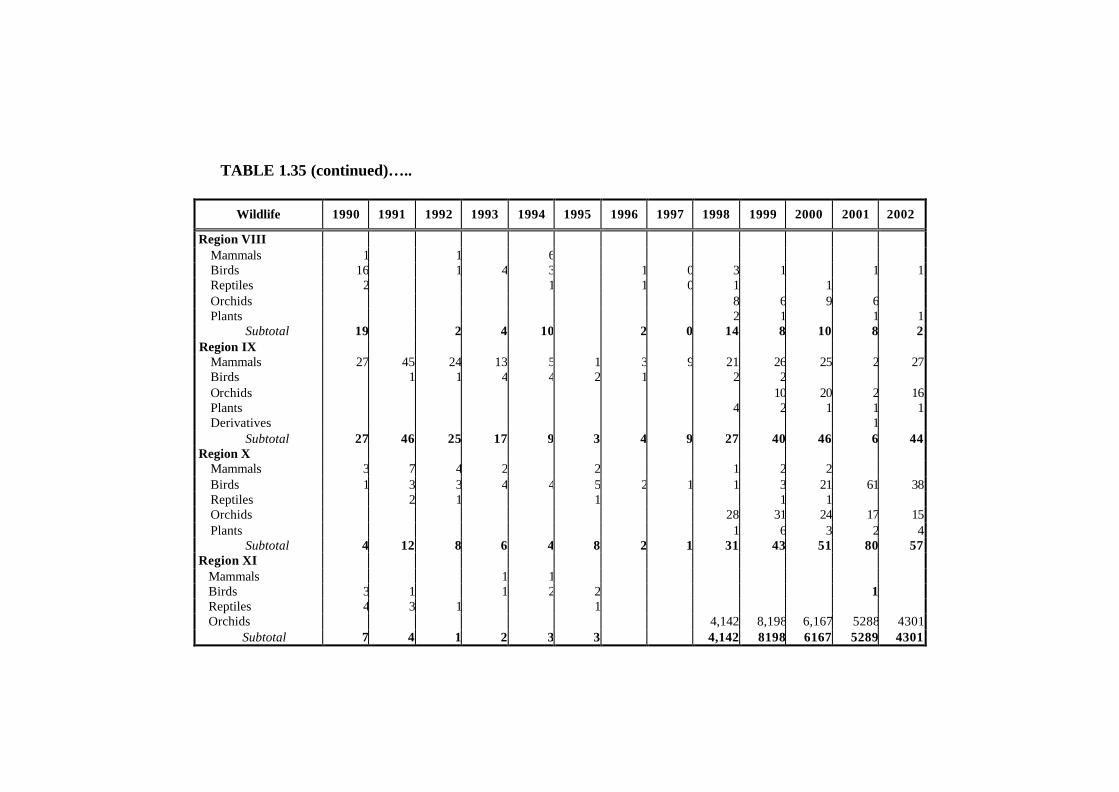
TABLE 1.35 (continued)…..
Wildlife 1990 1991 1992 1993 1994 1995 1996 1997 1998 1999 2000 2001 2002
Region VIII Mammals 1 1 6 Birds 16 1 4 3 1 0 3 1 1 1 Reptiles 2 1 1 0 1 1 Orchids 8 6 9 6 Plants 2 1 1 1
Subtotal 19 2 4 10 2 0 14 8 10 8 2 Region IX
Mammals 27 45 24 13 5 1 3 9 21 26 25 2 27 Birds 1 1 4 4 2 1 2 2 Orchids 10 20 2 16 Plants 4 2 1 1 1 Derivatives 1
Subtotal 27 46 25 17 9 3 4 9 27 40 46 6 44 Region X
Mammals 3 7 4 2 2 1 2 2 Birds 1 3 3 4 4 5 2 1 1 3 21 61 38 Reptiles 2 1 1 1 1 Orchids 28 31 24 17 15 Plants 1 6 3 2 4
Subtotal 4 12 8 6 4 8 2 1 31 43 51 80 57 Region XI
Mammals 1 1 Birds 3 1 1 2 2 1 Reptiles 4 3 1 1 Orchids 4,142 8,198 6,167 5288 4301
Subtotal 7 4 1 2 3 3 4,142 8198 6167 5289 4301

TABLE 1.35 (continued)…..
Wildlife 1990 1991 1992 1993 1994 1995 1996 1997 1998 1999 2000 2001 2002
Region XII Mammals 2 18 23 46 18 3 6 1 Birds 1 2 2 1 Reptiles 7 2 Orchids 10 17 12
Subtotal 9 18 26 48 20 4 6 11 17 32 12 Region XIII
Mammals 1 Birds 1 3 2 2 Orchids 9 14 17 11 10 Plants 1 1 3
Subtotal 10 16 21 16 12
Philippines Mammals 36 80 63 68 37 10 16 83 30 46 51 29 71 Birds 25 32 24 37 39 30 33 34 33 47 50 94 56 Amphibians 1 1 10 1 0 Reptiles 14 7 5 8 19 3 3 2 4 3 7 8 4 Insects 0 8 26 220 4 234 573 691 547 494 994 680 739 Orchids 0 0 0 0 0 0 0 0 4,383 8,727 6,861 5653 5262 Plants 0 0 0 0 0 0 0 0 9 21 8 13 21 By Product 1 Derivatives 22 63
Total 75 127 118 333 99 277 625 812 5,009 9,339 7,979 6,501 6,216 Source: PAWB, DENR

TABLE 1.36. PERMITS ISSUED FOR WILDLIFE EXPORT, 1992 to 2002 (number)
Wildlife 1990 1991 1992 1993 1994 1995 1996 1997 1998 1999 2000 2001 2002
CITES 1/ Mammals 79 159 135 101 155 109 63 78 72 90 75 50 54
Birds 23 62 57 85 144 110 128 159 170 216 238 271 254Reptiles 3 3 5 6 8 4 1 6 3 4 2Amphibians 2 1 0 1 0Insects 1 0 3 5 7 37Derivatives 24 34 58 93 108 183 148 164 111 152
By-products 3 1 1 10 2 15 12 0Orchids 149 143 184 220 234 256 257 237 222 211 267 201Plants 4 6 1 2 5 5 7 15
Sub-total 105 373 344 410 556 522 554 607 668 687 718 725 715 Non-CITES1/
Mammals 10 8 13 2 1 2 2 3 3 4 3 2Birds 4 6 11 17 9 10 21 25 25 37 30 19 20Reptiles 3 3 1 4 4 3 3 4 0 1 3 1Amphibians 2 6 7 0 3 0 2 0Insects 11 94 378 515 562 715 696 696 734 754 956 1064
Derivatives 7 5 2 2 45 33 43 64 61 97By-products 7 10 12 10 7 2 11 16 13Orchids 3 Plants 22 16 13 18 19 35 20 28 26 22 16 10
Sub-total 17 50 134 427 567 617 788 798 794 843 886 1,079 1,207 TOTAL 122 423 478 837 1,123 1,139 1,342 1,405 1,462 1530 1,604 1,804 1,922
1/ - Convention on International Trade in Endangered Species Source: PAWB, DENR

TABLE 1.37. NUMBER OF PLANTS CONFISCATED, 1992 to 2001
Annual Total Species
Unit of Measure 1991 1992 1993 1994 1995 1996 1997 1998 1999* 2000* 2001
Assorted Orchids Piece 1,447 339 4,847 124 96 39 20 62 13 187 Assorted Orchids Pots 7 5 35 10 15 Assorted Orchids Flask 2 15 Compots Orchids Pots 7 Birds' Nest Piece 1 7 10 Cactus Piece 2 2 1 Cycas or Pitogo Piece 25 17 5 4 6 Fern Piece 1 10 1 6 1 Orchids Flask Pitogo Piece 5 Sabila or Aloe Vera Piece 10 2 5 14 1 11 5 9 Sabila Flask 8 African Daisy pieces 2 Ammoguis bd.ft 170.5 Asstd. Dipterocarp species* pieces 5 84 bd. ft. 1296 Biological Specimen of Wild Plants sacks 6 Cattleya spp pieces 13 cocnut seedling pieces 6 Damo-damo orchid pcs 14 Dancing Lady pots 130 Dendrobium spp pieces 49 24 Dove Orchid pcs 9 Endemic root crop shoots 8 Firewood bundles 20 Giant Ferns (Trunks) pieces 878

TABLE 1.37. (continued)….
Annual Total Species
Unit of Measure 1991 1992 1993 1994 1995 1996 1997 1998 1999* 2000* 2001
Gumamela pcs 6 Horse Radish piece 1 Jackfuit seeds 51 kakawate pcs 17 Malagangaw pieces 14 Ord. Cycas pieces 7 Ornamental stalks 2 Palaenopsis pieces 5 Palm bundle 1 Pitcher Plant pieces 156 Red and White Lauan pieces 38 bd. ft. 827.43 Red palm pieces 2 Round Logs Narra pieces 9 bd. ft. 2464.15 Round Post Charcoal pieces 7 Salaguisog pcs 20 San Fracisco (live) cans 5 Sangumay pieces 2 Teak Tree cu.m. 0 Tugawe bd. ft. 37 Vanda spp pieces 29 380 White Lauan bd. ft. 452 198.1 Wild orchieds pcs 20 Wooden Stakes bundles 5

TABLE 1.37. (continued)…
Annual Total Species
Unit of Measure 1991 1992 1993 1994 1995 1996 1997 1998 1999* 2000* 2001
Yakal pieces 7 sacks 20 Balintong pcs 1 Grande Flora pcs 10 Ipil bd. ft. 213.33 bundles 25 Jungle Vines bdles 2 Bagtikan bd. ft. 100.32 Baligang bd. ft. 70 Kuyawyaw bd. ft. 394.32 lanka pcs 10 Malacatmon bd. ft. 440 Rattan pcs 225 Calachuchi (cuttings) pcs 6 Coco Seedlings pcs 1 Cave Materials pcs 2 Indian Tree pcs 1
Source: PAWB, DENR
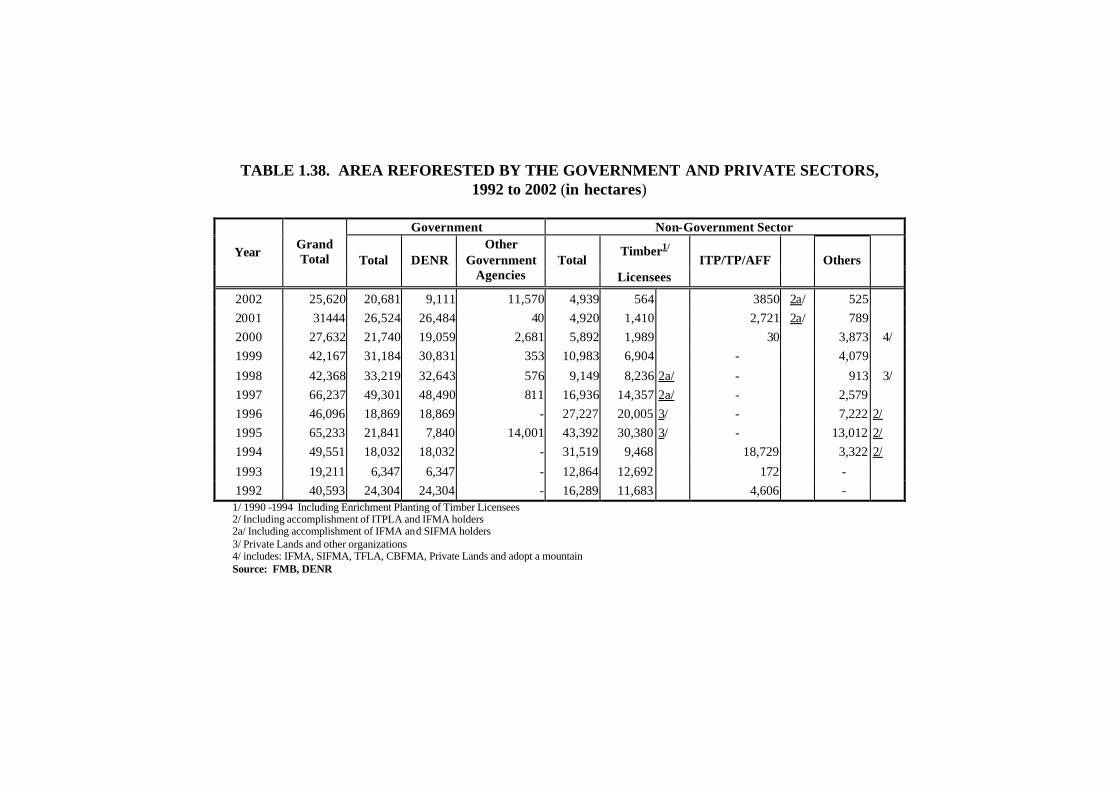
TABLE 1.38. AREA REFORESTED BY THE GOVERNMENT AND PRIVATE SECTORS,
1992 to 2002 (in hectares)
Government Non-Government Sector
Timber1/ Year Grand Total Total DENR
Other Government
Agencies Total
Licensees ITP/TP/AFF Others
2002 25,620 20,681 9,111 11,570 4,939 564 3850 2a/ 525 2001 31444 26,524 26,484 40 4,920 1,410 2,721 2a/ 789 2000 27,632 21,740 19,059 2,681 5,892 1,989 30 3,873 4/ 1999 42,167 31,184 30,831 353 10,983 6,904 - 4,079
1998 42,368 33,219 32,643 576 9,149 8,236 2a/ - 913 3/ 1997 66,237 49,301 48,490 811 16,936 14,357 2a/ - 2,579 1996 46,096 18,869 18,869 - 27,227 20,005 3/ - 7,222 2/ 1995 65,233 21,841 7,840 14,001 43,392 30,380 3/ - 13,012 2/ 1994 49,551 18,032 18,032 - 31,519 9,468 18,729 3,322 2/
1993 19,211 6,347 6,347 - 12,864 12,692 172 - 1992 40,593 24,304 24,304 - 16,289 11,683 4,606 -
1/ 1990 -1994 Including Enrichment Planting of Timber Licensees 2/ Including accomplishment of ITPLA and IFMA holders 2a/ Including accomplishment of IFMA and SIFMA holders 3/ Private Lands and other organizations 4/ includes: IFMA, SIFMA, TFLA, CBFMA, Private Lands and adopt a mountain Source: FMB, DENR

Table 1.39. STATUS OF KNOWN MAMMALS AND BIRDS SPECIES IN THE PHILIPPINES 1997 -2002 (Number of Species)
1997 1998 1999 2000* Wildlife Species
Status Status Status Status
E 5 M RM S U TOTAL
E R M RM S U TOTAL
E R M I RM S U V TOTAL
E R M I EX RM S U V TOTAL
Mammals 109 69 3 17 198 108 71 3 17
199 108 71 6 14 199 98 70 6 12 186
Birds 159 235 104 4 55 3 560 159 220 105
4 55 5 548 172 220 125 2 3 2 2 36 562 172 220 124 3 1 3 2 3 36 564
750
2001 2002
Status Status Wildlife Species
E R M I EX RM S U V E, M, S
TOTAL E R M R/M M/R RM SU U A NE B P V
Total
-- Mammals
108 71 6 -- -- -- -- -- -- --
185 108 71 6 -- -- -- -- -- -- -- -- -- 185
Birds
172 222 125 3 1 3 2 3 36 1 568 684 113 196 9 2 1 2 1 8 9 1 1 1 1,028
753 1,213E – Endemic R – Resident M – Migrant I - Introduced Ex - Reportedly Extinct RM - Resident Migrant S – Straggler U – Unclassified V – Vagrant B – Breeder NE - Near Endemic P- Pelagic U – Unknown SU - Status Unknown Source: PAWB, DENR

Table 1.40. CATCHER BOATS ISSUED CFVGL BY BFAR, 1992 and 1996 to 2002
Fishing Equipment
Year Trawl Baby
Trawl Otter Trawl
Tuna Purse Seine
Danish Seine
Purse Seine
Baby Purse Seine
Spear Zipper Drive -in Net Ring Net Baby
Ring NetHook &
Line Push Net Gill Net
1996 166 - - - 152 125 - 4 - - 244 - 79 5 301997 445 - - - 404 331 - - - - 244 - 60 9 11998 232 - - - 35 109 - - - - 18 - 34 24 41999 182 9 4 1 33 161 - - - - 29 - 23 14 - 2000 131 2 - 4 28 123 8 2 4 1 28 1 18 13 82001 43 33 - 47 40 59 2 - 1 - 54 19 3 12 92002 17 5 - 15 14 34 - 2 - 60 5 23 3 8
Fishing Equipment
Year Bottom Set Gill
Net
Long Line
Tuna Long Line
Bagnet Fish Trap
Beach Seine
Drift Filter Net
Round Haul Seine
Pearling Paaling Hulbot-hulbot Basnig Kub-
kuban Boat Seine Buli-buli Total
1996 - 11 - 356 2 - - - - - 159 - - - 9 8051997 - 23 - 196 - 3 15 10 1 26 - - - - - 14941998 - 9 - 6 - - - - 1 17 101 4 1 4 4561999 - 13 - 4 - - - - - 24 2 - 1 5 4562000 2 14 2 12 - - 3 - - 15 93 1 - 2 3712001 - 7 1 20 - - - - 10 48 - - 2 1 3222002 - 10 7 12 - - 2 - - 2 21 - - - - 186
CFVGL - Commercial Fishing Vessel Gear License Source: BFAR, DA

Atmosphere
Compendium of Philippine Environment Statistics
AAAtttmmmooosssppphhheeerrreee
2 C
hapt
er

Atmosphere
Compendium of Philippine Environment Statistics 2004 2-1
ATMOSPHERE HIGHLIGHTS OF RESULTS
Air Quality The Air Quality Management Section (AQMS) of the central office and the Environment Quality Monitoring Sections of the regional offices of the Environment Management Bureau (EMB) of DENR monitor air quality nationwide. In the past, only total suspended particulate (TSP) was consistently monitored. However, with the passage of the Clean Air Act and wider capability of DENR, particulate matter with a diameter of 10 micron (PM10) or smaller, sulfur dioxide (SO2), nitrogen dioxide (NO2), carbon monoxide (CO), ozone (O3), and lead (Pb) are now being monitored as “criteria pollutants”.
Criteria Pollutants are air pollutants for which National Ambient Air Quality Guideline Standards have been established for the protection of public health, safety, and general welfare.
Figure 1. Philippine Emission Inventory, 2001, (in 000 tons)
-
500
1,000
1,500
2,000
2,500
3,000
Area Stationary MobileSource
(000
, ton
s)
PM
SOx
NOx
CO
VOC
Figure 1 illustrates the composition of emission pollutants in the Philippines by source. While monitoring of ambient levels is focused on the criteria pollutant nitrogen dioxide (NO2) and sulfur dioxide (SO2), emission inventories usually cover all oxides of nitrogen (NOx), also called nitrogen oxides, which include NO, NO2, N2O and NO3 and all oxides of sulfur (SOx) also called sulfur oxides, which includes SO2 and SO3, respectively.
For area sources (such as burning and construction work), nitrogen oxide was
the number one pollutant, contributing more than 77 percent of total area source pollutants. Nitrogen oxides are produced whenever air is heated to high temperatures,
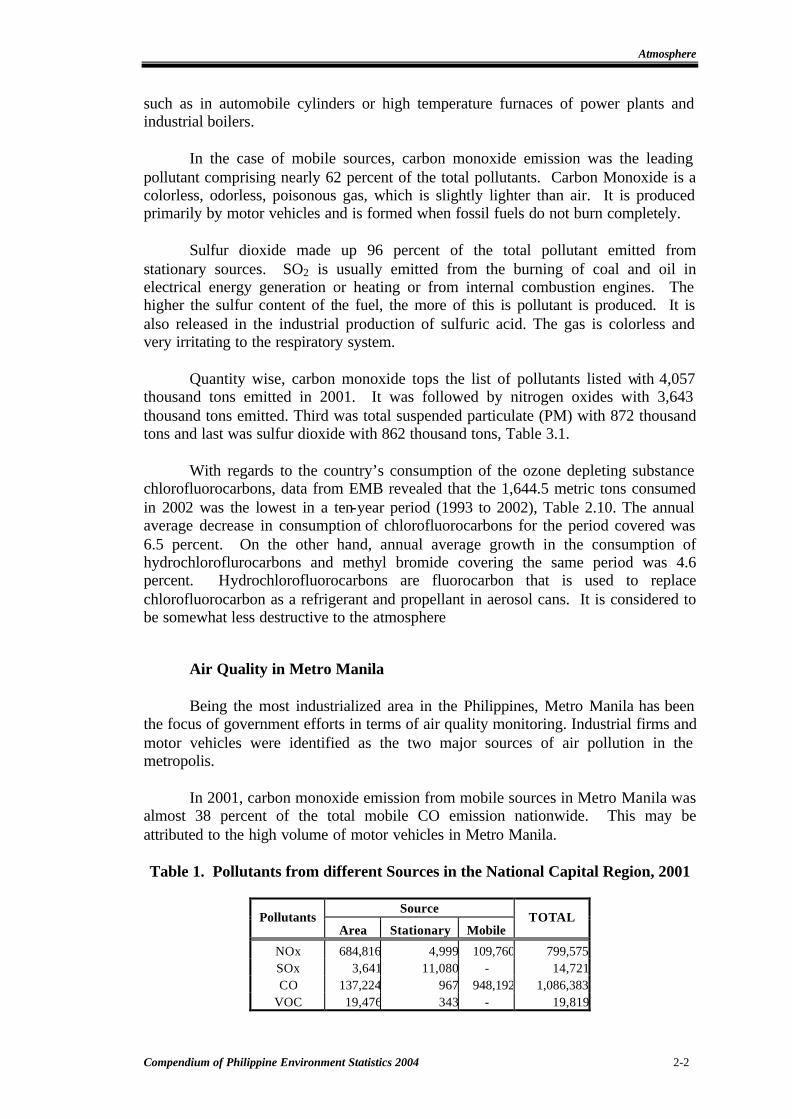
Atmosphere
Compendium of Philippine Environment Statistics 2004 2-2
such as in automobile cylinders or high temperature furnaces of power plants and industrial boilers.
In the case of mobile sources, carbon monoxide emission was the leading
pollutant comprising nearly 62 percent of the total pollutants. Carbon Monoxide is a colorless, odorless, poisonous gas, which is slightly lighter than air. It is produced primarily by motor vehicles and is formed when fossil fuels do not burn completely.
Sulfur dioxide made up 96 percent of the total pollutant emitted from
stationary sources. SO2 is usually emitted from the burning of coal and oil in electrical energy generation or heating or from internal combustion engines. The higher the sulfur content of the fuel, the more of this is pollutant is produced. It is also released in the industrial production of sulfuric acid. The gas is colorless and very irritating to the respiratory system.
Quantity wise, carbon monoxide tops the list of pollutants listed with 4,057
thousand tons emitted in 2001. It was followed by nitrogen oxides with 3,643 thousand tons emitted. Third was total suspended particulate (PM) with 872 thousand tons and last was sulfur dioxide with 862 thousand tons, Table 3.1.
With regards to the country’s consumption of the ozone depleting substance
chlorofluorocarbons, data from EMB revealed that the 1,644.5 metric tons consumed in 2002 was the lowest in a ten-year period (1993 to 2002), Table 2.10. The annual average decrease in consumption of chlorofluorocarbons for the period covered was 6.5 percent. On the other hand, annual average growth in the consumption of hydrochloroflurocarbons and methyl bromide covering the same period was 4.6 percent. Hydrochlorofluorocarbons are fluorocarbon that is used to replace chlorofluorocarbon as a refrigerant and propellant in aerosol cans. It is considered to be somewhat less destructive to the atmosphere
Air Quality in Metro Manila Being the most industrialized area in the Philippines, Metro Manila has been
the focus of government efforts in terms of air quality monitoring. Industrial firms and motor vehicles were identified as the two major sources of air pollution in the metropolis.
In 2001, carbon monoxide emission from mobile sources in Metro Manila was
almost 38 percent of the total mobile CO emission nationwide. This may be attributed to the high volume of motor vehicles in Metro Manila. Table 1. Pollutants from different Sources in the National Capital Region, 2001
Source
Pollutants Area Stationary Mobile
TOTAL
NOx 684,816 4,999 109,760 799,575SOx 3,641 11,080 - 14,721CO 137,224 967 948,192 1,086,383
VOC 19,476 343 - 19,819

Atmosphere
Compendium of Philippine Environment Statistics 2004 2-3
With regards to the area source pollution in Metro Manila, the 2001 data released by EMB revealed that the Metro Manila air contained 684,816 tons of NOx (79 percent), 19,476 tons of VOC (15.8 percent), 3,641 tons of SOx (0.4 percent), 137,224 tons of CO, and 21,836 tons of PM, Table 1 and Figure 2. The pollutants NOx, VOC and SOx found in NCR were the highest in the country.
Figure 2. Composition of Air Pollutants Coming from Area Source Emissions in Metro Manila Area, 2001
2.5%15.8%
79.0%
0.4%
2.2%
PM
CO
NOx
SOx
VOC
Figure 3. Minimum, Maximum and Average Concentration of Total Suspended Particulates in Selected Monitoring
Stations of Metro Manila, 2002 (in Ug/Ncm)
4981
37
108
54
106
42 51
342
228
170
761
218
374399
154166145
80
206
143
206
157
90
0
100
200
300
400
500
600
700
800
Pasay Mandaluyong Las Piñas Valenzuela Manila Quezon City Makati Pasig
City
Ug/
NC
M
Minimum
Maximum
Average
Note: Quezon City – Congressional Road Makati – Guadalalupe Viejo
Las Piñas – Pulang Lupa Belisaro Subd. Las Piñas Valenzuela – Valenzuela City Hall Pasig City – Pasig City Hall Pasay City- Pasay City Hall, F. B. Harrison St. Manila - DOH, San Lazaro St. Rizal Ave.
In 2002, Valenzuela City posted the highest maximum concentration of Total
Suspended Particulates (TSP), 706 ug/Ncm, in selected cities of Metro Manila.

Atmosphere
Compendium of Philippine Environment Statistics 2004 2-4
However, the average TSP concentration was only 206 ug/Ncm for a 24-hour period. The monitoring station at Congressional Road, Quezon City also registered the same average concentration as that of Valenzuela City (see Figure 2). These averages were still below the national ambient air quality standard which is set at 230ug/Ncm.
Air Quality in the Regions Table 2.3 listed the total estimated emission of SOx in 2001 in all regions based on the Self-Monitoring Reports submitted and emission inventory of major industries. The Highest SOx emissions occurred in Region 3 with 474,471 tons, Region 7 with 130,990 tons and Region 4 with 66,277tons. The lowest were in Region 2 with 712 tons, Region 12 with 917 tons and Region 11 with 1,213 tons.
Region 4 was second to Metro Manila when it comes to NOx emissions with
an estimated total of 781,468 tons in 2001. About 668,000 tons or 85 percent of these came from area sources. On the other hand, Caraga had the lowest estimated emission of NOx with 4,680 tons in 2001 (see Table 2.4).
Table 2.5 listed the total estimated emission of CO in 2001 in all regions. The
highest carbon monoxide emission, except NCR, occurred in Region 3 with 421,069 tons and Region7 with 405,860 tons. The lowest were in Caraga with 20,209 tons and Region 10 with 77,602 tons.
With regards to particulate matter emissions, Region 4 topped the list as the
major producer with 346,214 tons. Eighty six percent of these came from stationary sources. Region 4 contributed almost 40 percent PM to the nationwide total of 871,757 tons while Caraga contributed only 8.2 percent or 2,525 tons of PM to the nationwide total, Table 2.2. On the other hand, the highest VOC occurred in Region 7 with 65,224 tons followed by Region 4 with 22,293 tons. The lowest were in Caraga with 22 tons and Region 2 with 3,596 tons, Table 2.6.
Laws Promulgated, Polices and Programs Implemented A total of 17 policies (Administrative Orders, Memorandum Circulars, and Memorandum Orders) affecting the atmosphere were issued by DENR in 2001 to 2002. Noteworthy of these policies were the interim guidelines for the designation of an airshed. An airhsed is a contiguous area with common sources of air pollution and weather or meteorological conditions which affect the interchange and diffusion of pollution in the surrounding atmosphere. The designation of airsheds is pursuant to the Clean Air Act of 1999.
Nine interim airsheds have been designated: the Metro Manila airshed includes NCR, Region III except Nueva Ecija, and Region IVA except Quezon; Metro Cebu Airshed; the Cagayan de Oro City, Geothermal Aished; Davao Airshed; Naga City airshed; Baguio City Airshed, and the Municipalities of La Trinidad, Itogon, Sablan and Tuba – collectively known as BLIST Airshed; Agusan del Norte Airshed; and the Zamboanga City Airshed.

Atmosphere
Compendium of Philippine Environment Statistics 2004
Statistical Tables
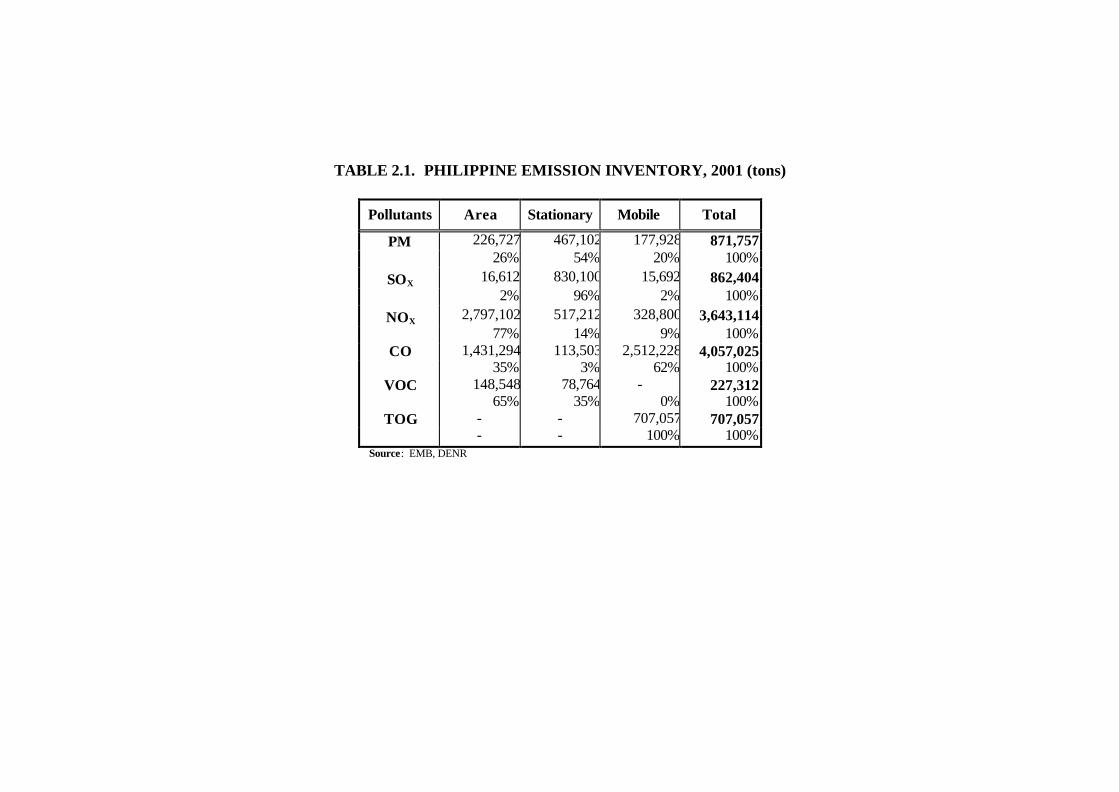
TABLE 2.1. PHILIPPINE EMISSION INVENTORY, 2001 (tons)
Pollutants Area Stationary Mobile Total
PM 226,727 467,102 177,928 871,757 26% 54% 20% 100%
SOX 16,612 830,100 15,692 862,404 2% 96% 2% 100%
NOX 2,797,102 517,212 328,800 3,643,114 77% 14% 9% 100%
CO 1,431,294 113,503 2,512,228 4,057,025 35% 3% 62% 100%
VOC 148,548 78,764 - 227,312 65% 35% 0% 100%
TOG - - 707,057 707,057 - - 100% 100%
Source: EMB, DENR

TABLE 2.2. PARTICULATE MATTER (PM) FROM AREA, STATIONARY
AND MOBILE SOURCES, BY REGION, 2001 (tons)
Source Region Area Stationary Mobile
TOTAL
1 8,975 89,899 10,958 109,8322 3,609 223 7,405 11,2373 15,777 12,424 24,397 52,5984 20,706 299,148 26,360 346,2145 33,899 613 5,564 40,0766 14,644 3,689 12,296 30,6297 18,828 15,761 12,291 46,8808 19,330 21,040 3,889 44,2599 9,987 28 4,974 14,989
10 10,821 4,973 5,053 20,84711 24,998 3,571 7,692 36,26112 19,729 413 3,372 23,514
Caraga 15 193 2,317 2,525CAR 3,573 14,248 2,895 20,716NCR 21,836 880 48,465 71,181TOTAL 226,727 467,103 177,928 871,758
26% 54% 20% 100%Source: EMB, DENR

TABLE 2.3. SULFUR DIOXIDE (SOX) FROM AREA, STATIONARY
AND MOBILE SOURCES, BY REGION, 2001 (tons)
Source Region Area Stationary Mobile
TOTAL
1 878 54,661 - 55,5392 712 - - 7123 2,562 471,909 - 474,4714 3,547 62,730 - 66,2775 886 6,025 - 6,9116 915 6,027 - 6,9427 787 130,203 - 130,9908 696 62,659 - 63,3559 312 1,031 - 1,343
10 242 2,093 - 2,33511 567 646 - 1,21312 439 378 - 817
Caraga - 7,390 - 7,390CAR 429 13,269 15,692 29,390NCR 3,641 11,080 - 14,721TOTAL 16,613 830,101 15,692 862,406
2% 96% 2% 100%The national guideline values for Sox are 180ug/Ncm (0.07 ppm) for a s4 hr. exposure and
80 ug/Ncm (0.03) maximum for a one-year exposure. Source: EMB, DENR
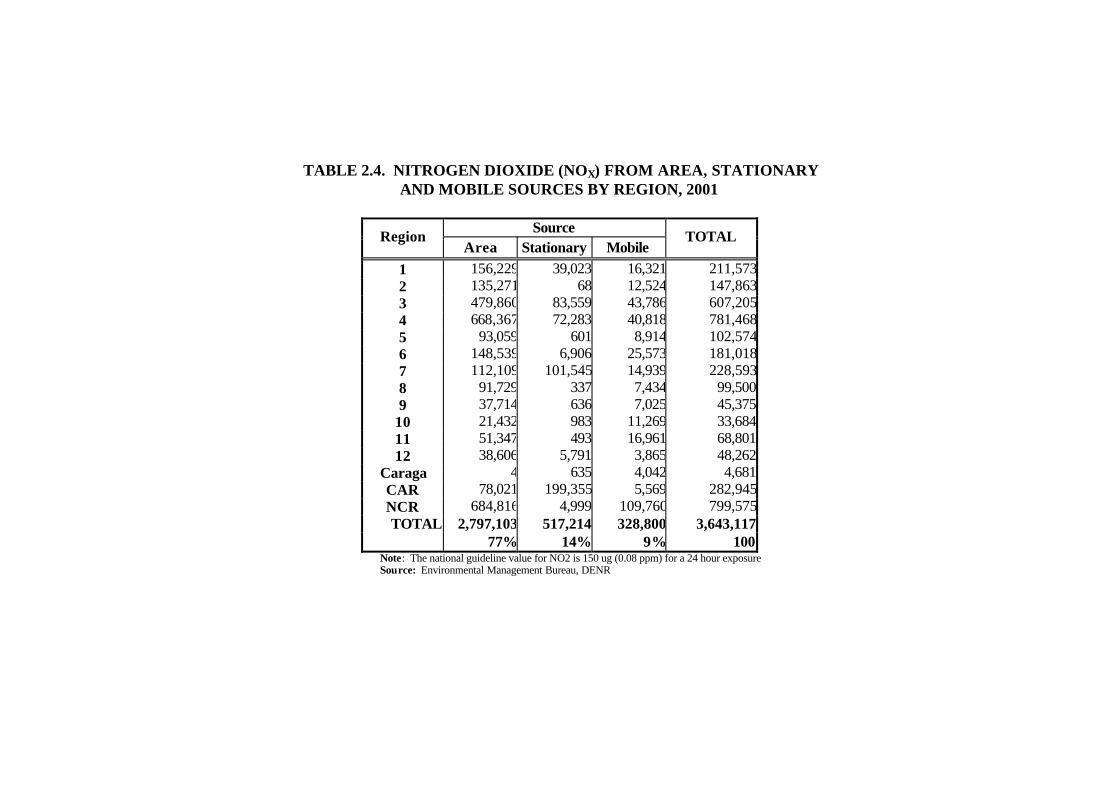
TABLE 2.4. NITROGEN DIOXIDE (NOX) FROM AREA, STATIONARY
AND MOBILE SOURCES BY REGION, 2001
Source Region Area Stationary Mobile
TOTAL
1 156,229 39,023 16,321 211,5732 135,271 68 12,524 147,8633 479,860 83,559 43,786 607,2054 668,367 72,283 40,818 781,4685 93,059 601 8,914 102,5746 148,539 6,906 25,573 181,0187 112,109 101,545 14,939 228,5938 91,729 337 7,434 99,5009 37,714 636 7,025 45,375
10 21,432 983 11,269 33,68411 51,347 493 16,961 68,80112 38,606 5,791 3,865 48,262
Caraga 4 635 4,042 4,681CAR 78,021 199,355 5,569 282,945NCR 684,816 4,999 109,760 799,575TOTAL 2,797,103 517,214 328,800 3,643,117
77% 14% 9% 100Note: The national guideline value for NO2 is 150 ug (0.08 ppm) for a 24 hour exposure Source: Environmental Management Bureau, DENR

TABLE 2.5. CARBON MONOXIDE (CO) FROM AREA STATIONARY
AND MOBILE SOURCES BY REGION, 2001 (tons)
Source Region Area Stationary Mobile
TOTAL
1 62,309 2,103 117,739 182,151 2 22,825 38 65,424 88,287 3 102,566 10,529 308,874 421,969 4 30,180 10,212 334,126 374,518 5 252,463 76 55,625 308,164 6 104,959 2,197 135,802 242,958 7 136,663 41,514 227,684 405,861 8 142,826 183 46,356 189,365 9 73,991 23 58,998 133,012
10 71,230 612 5,760 77,602 11 85,469 429 127,004 212,902 12 4,065 1,253 32,669 37,987
Caraga 160 11 20,038 20,209 CAR 24,363 43,356 27,937 95,656 NCR 137,224 967 948,192 1,086,383 TOTAL 1,251,293 113,503 2,512,228 3,877,024
32% 3% 65% 100 Note: The national guideline values for CO are 35ug/Ncm (30 ppm) maximum for a one-hour
exposure and 10 ug/Ncm (9 ppm) maximum for an 8 hr. exposure Source: EMB, DENR

TABLE 2.6. VOLATILE ORGANIC COMPOUNDS (VOC) FROM AREA
AND STATIONARY SOURCES BY REGION, 2001
Source Region Area Stationary
TOTAL
1 6,674 899 7,573 2 3,565 31 3,596 3 14,078 4,066 18,144 4 18,759 3,534 22,293 5 17,559 61 17,620 6 9,223 1,383 10,606 7 10,787 54,437 65,224 8 10,882 156 11,038 9 5,489 4 5,493
10 5,684 585 6,269 11 13,150 178 13,328 12 10,389 475 10,864
Caraga 21 1 22 CAR 2,811 12,609 15,420 NCR 19,476 343 19,819
TOTAL 148,547 78,762 227,309 65% 35% 100%
Source: EMB, DENR

TABLE 2.7. POWER PLANT EMISSIONS (BASED ON SELF
MONITORING REPORTS) BY REGION, 2001
Region PM CO NOX SOX VOC 1 2760.4 1829.5 37342.9 41072.9 503.4 2 3.2 13 60.3 3.9 4.9 3 1286.6 1469.9 14632.5 29749.7 528.3 4a 210.44 3312.44 39016.01 45291.83 748.82 4b 33.6 81.1 403.3 423 30.2 5 3.2 9.7 45 2.9 3.7 6 26.9 82.5 383 24.9 31.3 7 211 89.6 2824 9634.7 0 8 0.2 0.7 3.2 0.2 0.3 9
10 0 0.1 0.4 0 0 11 0.6 1.8 55.9 0.7 0.7 12 0.5 1.6 7.6 0.5 0.6 13
CAR 4,984.3 15,174.4 6,9773.2 4,641.6 3,740.5 NCR 1,396.5 6,787.7 17,848.9 14,817.3 424.3
TOTAL 10,917.44 28,854.04 182,396.21 145,664.13 6,017.02 Source: EMB, DENR
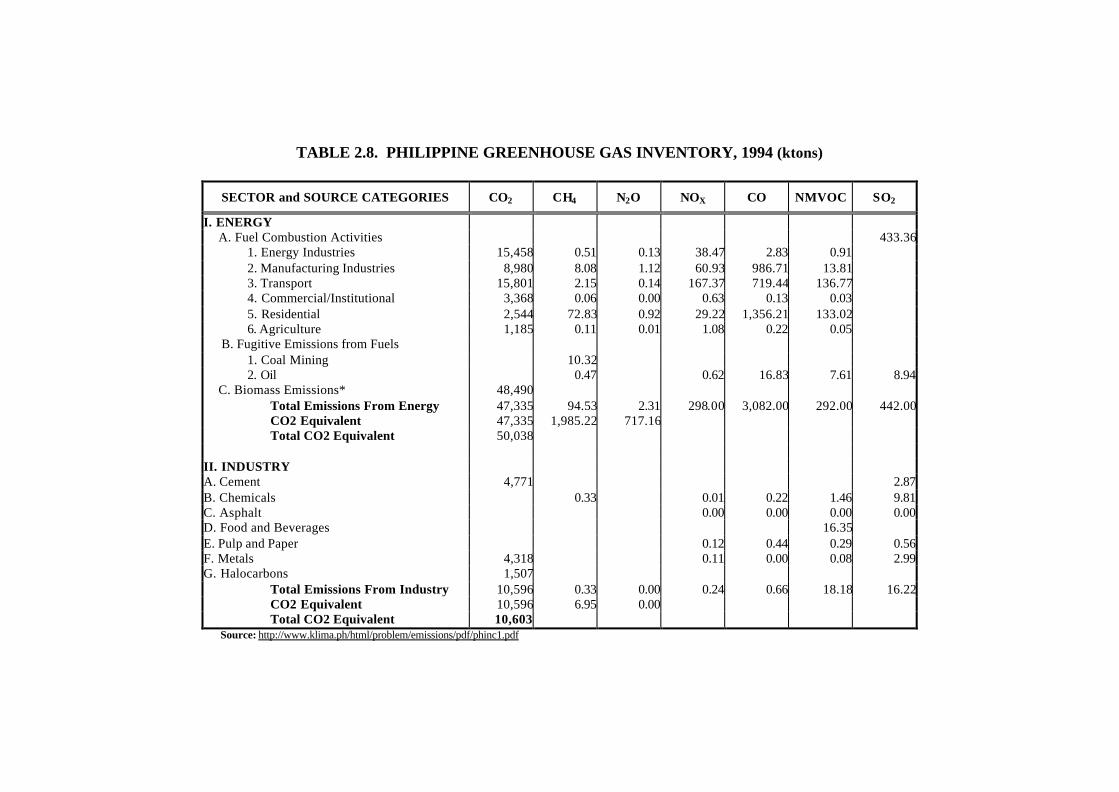
TABLE 2.8. PHILIPPINE GREENHOUSE GAS INVENTORY, 1994 (ktons)
SECTOR and SOURCE CATEGORIES CO2 CH4 N2O NOX CO NMVOC SO2
I. ENERGY A. Fuel Combustion Activities 433.36
1. Energy Industries 15,458 0.51 0.13 38.47 2.83 0.91 2. Manufacturing Industries 8,980 8.08 1.12 60.93 986.71 13.81 3. Transport 15,801 2.15 0.14 167.37 719.44 136.77 4. Commercial/Institutional 3,368 0.06 0.00 0.63 0.13 0.03 5. Residential 2,544 72.83 0.92 29.22 1,356.21 133.02 6. Agriculture 1,185 0.11 0.01 1.08 0.22 0.05
B. Fugitive Emissions from Fuels 1. Coal Mining 10.32 2. Oil 0.47 0.62 16.83 7.61 8.94
C. Biomass Emissions* 48,490 Total Emissions From Energy 47,335 94.53 2.31 298.00 3,082.00 292.00 442.00CO2 Equivalent 47,335 1,985.22 717.16 Total CO2 Equivalent 50,038
II. INDUSTRY A. Cement 4,771 2.87B. Chemicals 0.33 0.01 0.22 1.46 9.81C. Asphalt 0.00 0.00 0.00 0.00D. Food and Beverages 16.35 E. Pulp and Paper 0.12 0.44 0.29 0.56F. Metals 4,318 0.11 0.00 0.08 2.99G. Halocarbons 1,507
Total Emissions From Industry 10,596 0.33 0.00 0.24 0.66 18.18 16.22CO2 Equivalent 10,596 6.95 0.00 Total CO2 Equivalent 10,603
Source: http://www.klima.ph/html/problem/emissions/pdf/phinc1.pdf
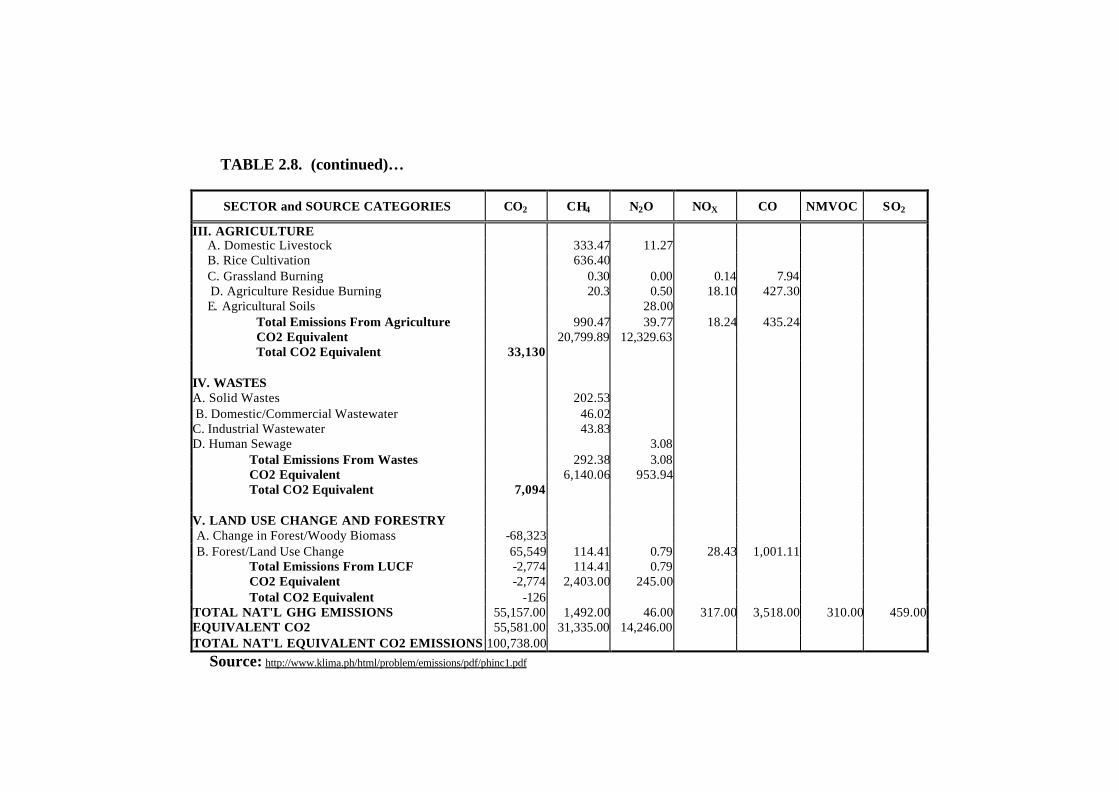
TABLE 2.8. (continued)…
SECTOR and SOURCE CATEGORIES CO2 CH4 N2O NOX CO NMVOC SO2
III. AGRICULTURE A. Domestic Livestock 333.47 11.27 B. Rice Cultivation 636.40 C. Grassland Burning 0.30 0.00 0.14 7.94 D. Agriculture Residue Burning 20.3 0.50 18.10 427.30 E. Agricultural Soils 28.00
Total Emissions From Agriculture 990.47 39.77 18.24 435.24 CO2 Equivalent 20,799.89 12,329.63 Total CO2 Equivalent 33,130
IV. WASTES A. Solid Wastes 202.53 B. Domestic/Commercial Wastewater 46.02 C. Industrial Wastewater 43.83 D. Human Sewage 3.08
Total Emissions From Wastes 292.38 3.08 CO2 Equivalent 6,140.06 953.94 Total CO2 Equivalent 7,094
V. LAND USE CHANGE AND FORESTRY A. Change in Forest/Woody Biomass -68,323 B. Forest/Land Use Change 65,549 114.41 0.79 28.43 1,001.11
Total Emissions From LUCF -2,774 114.41 0.79 CO2 Equivalent -2,774 2,403.00 245.00 Total CO2 Equivalent -126
TOTAL NAT'L GHG EMISSIONS 55,157.00 1,492.00 46.00 317.00 3,518.00 310.00 459.00 EQUIVALENT CO2 55,581.00 31,335.00 14,246.00 TOTAL NAT'L EQUIVALENT CO2 EMISSIONS 100,738.00
Source: http://www.klima.ph/html/problem/emissions/pdf/phinc1.pdf

TABLE 2.9. PHILIPPINE ANNUAL CONSUMPTION OF HYDROFLOUROCARBONS AND ALTERNATIVES CHLOROFLOUROCRABONS, 1993 – 2001 (metric tons)
Chemicals 1993 1994 1995 1996 1997 1998 1999 2000 2001
HFC-134A 11.78 72.23 153.19 319.02 289.76 479.29 655.77 479.87 538.44HFC-404A 0.00 0.11 0.49 2.68 8.02 23.74 11.44 28.41 26.31HFC-407C 0.00 0.00 0.00 0.00 0.00 0.52 1.25 0.00 2.25HFC-23 0.00 0.00 0.00 0.48 0.00 19.31 0.09 0.00 0.05HFC-507 0.00 0.00 0.00 0.00 0.61 0.00 0.34 0.00 4.55HFC-413A 0.00 0.00 0.00 0.00 0.00 0.00 1.25 0.00 0.00HFC-227EA 0.00 0.00 0.00 0.00 0.00 0.00 0.00 0.26 0.00HFC-416A 0.00 0.00 0.00 0.00 0.00 0.00 0.00 0.00 4.81HFC-152A 0.00 0.00 0.00 0.00 0.86 0.00 0.00 0.00 0.00 Total 11.78 72.34 153.68 322.18 299.25 522.86 670.14 508.54 576.41Source: EMB, DENR.

TABLE 2.10. PHILIPPINE ANNUAL CONSUMPTION OF CHLOROFLOUROCARBONS, 1993 – 2002 (metric tons)
Chemicals 1993 1994 1995 1996 1997 1998 1999 2000 2001 2002
CFC-11 996.99 1,727.24 1,244.32 789.49 629.34 139.11 345.36 270.63 668.57 231.39 CFC-12 1,911.16 2,132.61 2,094.92 2,199.44 2,001.06 1,893.91 1,742.22 2,632.82 1,378.28 1,413.10 CFC 113 44.84 46.09 65.53 30.80 0.00 0.00 0.00 0.00 0.00 - CFC-115 14.33 1.51 5.99 0.00 0.75 0.00 0.00 0.00 4.10 - CFC-502 44.87 42.92 27.65 18.85 12.67 6.99 6.27 5.58 0.00 - HALON 1211 7.17 24.16 33.60 39.40 42.20 15.60 0.00 0.00 0.00 - CTC 40.30 121.75 100.80 60.48 0.00 0.00 0.00 0.00 0.00 - TCA/MCF 155.04 119.64 79.70 38.93 0.00 0.00 0.00 0.00 0.00 - TOTAL 3,214.70 4,215.92 3,652.51 3,177.39 2,686.02 2,055.61 2,093.85 2,909.03 2,050.95 1,644.49
Source: EMB, DENR

TABLE 2.11. PHILIPPINE ANNUAL CONSUMPTON OF HYDROCHLOROFLOUROCARBONS AND
METHYL BROMIDES, 1993 – 2002 (metric tons)
Chemicals 1993 1994 1995 1996 1997 1998 1999 2000 2001 2002
HCFC-22 1442.9 1768.89 1616.59 2017.3 1833.06 1749.55 1890.38 2259.14 1741.71 1,927.72HCFC-123 0.10 6.17 2.72 12.79 8.54 68.41 50.51 42.58 75.86 66.42HCFC-141b 44.80 217.98 75.57 209.21 116.59 238.79 217.36 307.51 293.75 322.1HCFC-141b (BLEND) 0.00 0.00 0.00 0.00 0.00 0.12 1.15 13.62 4.54 - HCFC-225 1.58 0.00 0.00 0.00 2.40 9.00 34.43 6.00 6.00 - HCFC-124 0.24 59.13 0.00 0.33 0.00 0.13 0.00 0.00 0.00 - HCFC-402a 0.00 0.00 0.00 0.37 0.00 0.12 0.37 0.00 0.25 - HCFC 402b 0.00 0.00 0.12 0.68 0.30 0.12 1.36 0.18 0.34 - HCFC-401a 0.00 0.00 3.6700 5.78 2.72 0.00 1.09 2.04 0.88 - HCFC-401b 0.00 0.00 0.8200 0.00 0.00 0.00 0.00 0.00 0.71 - HCFC-401c 0.00 0.00 0.00 0.14 0.00 0.00 0.00 0.00 0.00 - HCFC-403c 0.00 0.00 0.00 0.00 0.00 0.00 0.00 1.25 0.00 - Methyl Bromide 0.00 0.00 15.84 31.62 15.81 0.00 0.00 5.00 0.00 13.00 TOTAL 1489.62 2052.17 1715.33 2278.22 1979.42 2066.24 2196.65 2637.32 2124.04 2,329.24
Source: EMB, DENR.

TABLE 2.12. NUMBER OF FOREST FIRE AND AREA AFFECTED, 1987 to 2002
Estimated Value Area Affected Year Number (Pesos) (hectares)
1987 5,386.00 1988 423.00 1989 675.00 1990 11,872.00 1991 5,871.97 1992 1106 185,463,558.30 51,310.38 1993 595 165,866,132.73 15,329.88 1994 218 20,685,649.80 7,720.77 1995 280 50,668,410.53 10,709.69 1996 194 111,263,443.05 5,463.42 1997 147 56,066,969.52 3,561.43 1998 941 216,547,415.15 52,681.20 1999 - - 3,205.422000 3,376,278.35 4,596.332001 5,667,232.73 775.852002 13,840,145.64 2,435.27
Source: Planning Development and Evaluation Office and FMB, DENR

TABLE 2.13. HISTORICAL CLIMATE DATA OF THE PHILIPPINES, 1966 to 2002
YEAR Average Rainfall
(mm)
Average Minimum
Temperature (oC)
Average Maximum
Temperature (oC)
Average Mean
Temperature (oC)
Average Relative
Humidity (%)
Average Mean Sea
Level Pressure
1966 2471.2 23.0 31.3 27.1 81 1011.1
1967 2361.8 22.7 30.6 26.7 81 1010.9
1968 1876.7 22.6 31.0 26.8 80 1011.1
1969 1985.6 22.9 31.3 27.1 80 1011.0
1970 2613.3 23.1 31.2 27.1 82 1010.3
1971 2902.0 22.6 30.4 26.5 82 1009.8
1972 2577.6 22.8 31.0 26.9 81 1010.6
1973 2438.5 22.8 31.3 27.1 80 1010.7
1974 2680.3 22.7 30.7 26.7 81 1009.4
1975 2378.1 22.8 31.0 26.9 81 1010.0
1976 2455.3 22.6 30.6 26.6 81 1010.2
1977 2131.0 22.9 31.0 26.9 81 1010.4
1978 2392.9 22.8 30.9 26.9 81 1009.8
1979 2021.6 22.9 31.0 27.0 81 1009.9
1980 2418.1 22.9 30.9 26.9 83 1010.0
1981 2274.8 22.9 31.0 26.9 82 1010.0
1982 2162.4 22.9 31.0 26.9 82 1009.9
1983 1991.3 23.0 31.5 27.3 80 1010.8
1984 2488.0 22.9 31.0 27.0 82 1009.1
1985 2584.6 22.9 31.2 27.1 82 1008.9

TABLE 2.13. (continued)...
YEAR Average Rainfall
(mm)
Average Minimum
Temperature (oC)
Average Maximum
Temperature (oC)
Average Mean
Temperature (oC)
Average Relative
Humidity (%)
Average Mean Sea
Level Pressure
1986 2571.5 22.8 31.0 26.9 82 1009.5
1987 1847.6 23.2 31.7 27.4 80 1010.5
1988 2539.9 23.3 31.7 27.5 81 1009.4
1989 2508.1 23.1 31.2 27.2 82 1009.4
1990 2386.4 23.2 31.5 27.4 81 1009.9
1991 2050.6 23.0 31.3 27.2 81 1010.1
1992 1929.9 23.0 31.4 27.2 81 1010.3
1993 2242.7 23.0 31.2 27.1 81 1008.2
1994 2182.5 23.2 31.1 27.2 82 1010.0
1995 2560.6 23.3 31.0 27.2 83 1010.2
1996 2518.0 23.5 30.9 27.2 83 1009.6
1997 1833.7 23.3 31.1 27.0 82 1011.0
1998 3194.6 23.9 32.0 28.0 81 1010.3
1999 3141.8 23.6 30.9 27.2 84 1009.0
2000 3201.1 23.6 31.1 27.4 84 1008.6
2001 2,747.3 23.7 31.2 27.5 83 1008.7
2002* 2,274.1 23.6 31.2 27.4 82 1024.6*
Average Rainfall: from 51 stations Average Mean Sea Level Pressure: From 54 stations Average Minimum Temperature: From54 Average Maximum Temperature: From 53 stations Average Mean Temperature: From 54 stations Average Relative Humidity: From 53 stations
Source of Basic Data: PAG-ASA, DOST

TABLE 2.14. ANNUAL FREQUENCY OF TROPICAL CYCLONE 1983 to 2002
Frequency of Year
Tropical Cyclone
1983 23 1984 20 1985 17 1986 21 1987 16 1988 20 1989 19 1990 20 1991 19 1992 15 1993 32 1994 25 1995 16 1996 17 1997 14 1998 11 1999 16 2000 18 2001 17 2002 13
Source: PAG-ASA, DOST
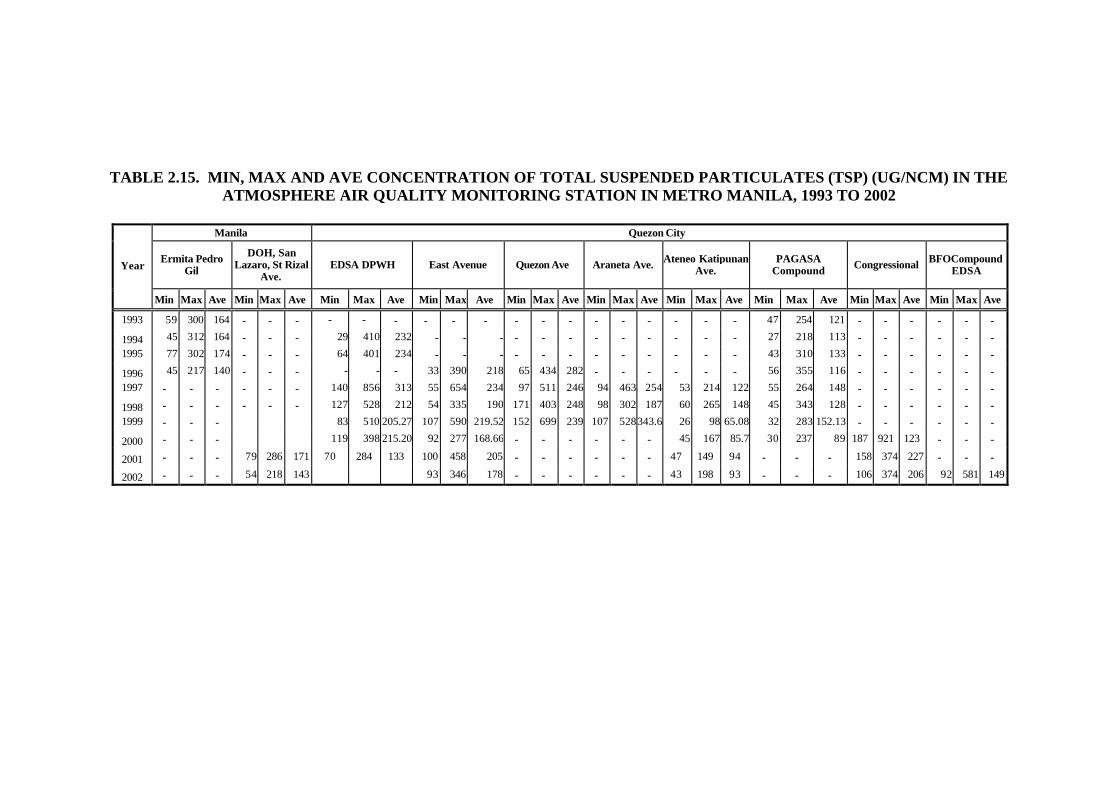
TABLE 2.15. MIN, MAX AND AVE CONCENTRATION OF TOTAL SUSPENDED PARTICULATES (TSP) (UG/NCM) IN THE ATMOSPHERE AIR QUALITY MONITORING STATION IN METRO MANILA, 1993 TO 2002
Manila Quezon City
Ermita Pedro Gil
DOH, San Lazaro, St Rizal
Ave. EDSA DPWH East Avenue Quezon Ave Araneta Ave. Ateneo Katipunan
Ave. PAGASA
Compound Congressional BFOCompound EDSA Year
Min Max Ave Min Max Ave Min Max Ave Min Max Ave Min Max Ave Min Max Ave Min Max Ave Min Max Ave Min Max Ave Min Max Ave
1993 59 300 164 - - - - - - - - - - - - - - - - - - 47 254 121 - - - - - -
1994 45 312 164 - - - 29 410 232 - - - - - - - - - - - - 27 218 113 - - - - - - 1995 77 302 174 - - - 64 401 234 - - - - - - - - - - - - 43 310 133 - - - - - -
1996 45 217 140 - - - - - - 33 390 218 65 434 282 - - - - - - 56 355 116 - - - - - - 1997 - - - - - - 140 856 313 55 654 234 97 511 246 94 463 254 53 214 122 55 264 148 - - - - - -
1998 - - - - - - 127 528 212 54 335 190 171 403 248 98 302 187 60 265 148 45 343 128 - - - - - - 1999 - - - 83 510 205.27 107 590 219.52 152 699 239 107 528 343.6 26 98 65.08 32 283 152.13 - - - - - -
2000 - - - 119 398 215.20 92 277 168.66 - - - - - - 45 167 85.7 30 237 89 187 921 123 - - -
2001 - - - 79 286 171 70 284 133 100 458 205 - - - - - - 47 149 94 - - - 158 374 227 - - -
2002 - - - 54 218 143 93 346 178 - - - - - - 43 198 93 - - - 106 374 206 92 581 149
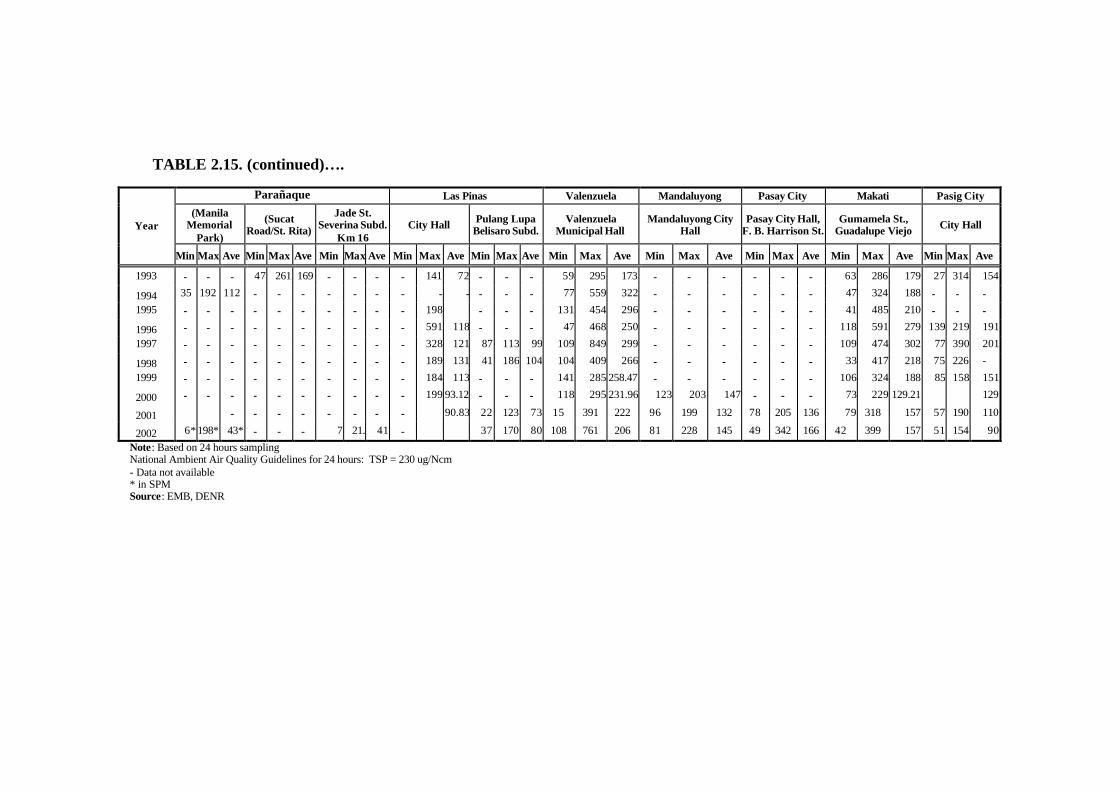
TABLE 2.15. (continued)….
Parañaque Las Pinas Valenzuela Mandaluyong Pasay City Makati Pasig City
(Manila Memorial
Park)
(Sucat Road/St. Rita)
Jade St. Severina Subd.
Km 16 City Hall Pulang Lupa
Belisaro Subd. Valenzuela
Municipal Hall Mandaluyong City
Hall Pasay City Hall,
F. B. Harrison St. Gumamela St.,
Guadalupe Viejo City Hall Year
Min Max Ave Min Max Ave Min Max Ave Min Max Ave Min Max Ave Min Max Ave Min Max Ave Min Max Ave Min Max Ave Min Max Ave
1993 - - - 47 261 169 - - - - 141 72 - - - 59 295 173 - - - - - - 63 286 179 27 314 154
1994 35 192 112 - - - - - - - - - - - - 77 559 322 - - - - - - 47 324 188 - - - 1995 - - - - - - - - - - 198 - - - 131 454 296 - - - - - - 41 485 210 - - -
1996 - - - - - - - - - - 591 118 - - - 47 468 250 - - - - - - 118 591 279 139 219 191
1997 - - - - - - - - - - 328 121 87 113 99 109 849 299 - - - - - - 109 474 302 77 390 201
1998 - - - - - - - - - - 189 131 41 186 104 104 409 266 - - - - - - 33 417 218 75 226 -
1999 - - - - - - - - - - 184 113 - - - 141 285 258.47 - - - - - - 106 324 188 85 158 151
2000 - - - - - - - - - - 199 93.12 - - - 118 295 231.96 123 203 147 - - - 73 229 129.21 129
2001 - - - - - - - - 90.83 22 123 73 15 391 222 96 199 132 78 205 136 79 318 157 57 190 110
2002 6* 198* 43* - - - 7 21. 41 - 37 170 80 108 761 206 81 228 145 49 342 166 42 399 157 51 154 90
Note: Based on 24 hours sampling National Ambient Air Quality Guidelines for 24 hours: TSP = 230 ug/Ncm - Data not available * in SPM Source: EMB, DENR

TABLE 2.16. MORBIDITY DUE TO RESPIRATORY DISEASES, 1993 – 2001
(number and rate per 100,000 population)
Bronchitis Pneumonia Tuberculosis, All Forms Year Number Rate Number Rate Number Rate
1993 903,508 1,348.90 470,574 702.5 159,049 237.51994 1,140,366.00 1,661.80 614,353 895.2 167,763 244.51995 85,557.00 999.60 98,913 1,155.7 19,483 227.61996 602,708.00 891.00 679,172 1,004.1 165,453 244.61997 - - - - - - 1998 635,089.00 868.20 646,789 884.2 151,650 207.31999 - - - - - - 2000 700,105.00 917.00 632,930 829.0 126,521 165.72001 694,836.00 891.70 652,585 837.4 110,841 142.2
Note: "-" Data not Available Source: Philippine Health Statistics, DOH

TABLE 2.17. PERMITS ISSUED FOR AIR AND WATER POLLUTION CONTROL DEVICES, 2000 to 2002
Permit Issued APCD WPCD Region
2000 2001 2002 2000 2001 2002
NCR 610 556 958 146 179 190 CAR 28 75 147 15 26 24 Region I 825 278 330 208 163 173 Region II 127 196 206 34 54 64 Region III 686 687 684 402 299 404 Region IV-A 260 445 1,282 102 196 206 Region IV-B 108 175 248 46 45 52 Region V 168 148 199 43 48 53 Region VI 146 152 212 67 87 106 Region VII 484 526 558 - 147 152 Region VIII 126 182 179 35 30 78 Region IX 162 168 124 77 89 67 Region X 46 217 192 68 214 201 Region XI 281 240 171 144 139 85 Region XII 198 89 48 179 53 55 Region XIII 100 124 121 47 30 21
Total 4,355 4,258 5,659 1,613 1,799 1,931 Note: APCD - Air Pollution Control Device
WPCD - Water Pollution Control Device Source: EMB, DENR

TABLE 2.18. CLIMATOLOGICAL NORMALS BY MONTH AND BY SELECTED STATION, 1971 TO 2000
Sampling Station Jan Feb Mar Apr May Jun Jul Aug Sep Oct Nov Dec
Ambulong, Batangas Rainfall (mm) 19.9 9.9 24.2 37.0 125.0 238.1 358.7 340.2 268.1 257.6 166.2 106.0 Number of Rainy Days 4.0 2.0 3.0 4.0 10.0 15.0 18.0 18.0 18.0 15.0 13.0 10.0 Maximum Temperature (oC) 30.5 31.7 33.3 34.5 33.9 32.6 31.4 30.9 31.4 31.6 31.3 30.2 Minimum Temperature (oC) 21.8 21.7 22.4 23.4 24.1 24.2 23.8 23.9 23.7 23.4 23.2 22.4
Aparri, Cagayan Rainfall (mm) 106.3 53.9 40.7 31.6 110.5 134.7 171.8 194.5 248.3 359.5 329.5 185.1 Number of Rainy Days 13.0 8.0 5.0 4.0 9.0 10.0 11.0 13.0 13.0 16.0 19.0 17.0 Maximum Temperature (oC) 27.2 28.3 30.2 32.1 32.9 33.4 32.8 32.5 32.0 30.7 29.2 27.5 Minimum Temperature (oC) 20.6 20.9 22.1 23.6 24.4 24.8 24.7 24.5 24.2 23.7 22.9 21.2
Baguio City, Benguet Rainfall (mm) 12.1 11.7 29.3 92.3 354.7 436.4 838.4 911.8 581.0 461.8 124.6 23.7 Number of Rainy Days 3.0 2.0 4.0 9.0 19.0 21.0 26.0 27.0 24.0 17.0 8.0 5.0 Maximum Temperature (oC) 23.1 23.9 25.0 25.7 24.9 24.4 23.4 22.5 23.5 23.9 23.9 23.3 Minimum Temperature (oC) 12.9 13.2 14.3 15.7 16.3 16.5 16.2 16.1 15.9 15.7 15.0 13.8
Baler, Quezon Rainfall (mm) 202.1 156.2 198.3 231.3 314.6 276.9 266.5 187.5 308.7 494.4 397.3 330.4 Number of Rainy Days 15.0 14.0 14.0 16.0 17.0 17.0 17.0 16.0 18.0 19.0 16.0 16.0 Maximum Temperature (oC) 28.5 29.2 30.3 31.7 32.7 33.0 32.6 32.6 32.3 31.2 30.3 28.7 Minimum Temperature (oC) 20.4 20.7 21.5 22.6 23.4 23.7 23.6 23.7 23.3 22.7 22.0 21.1
Basco, Batanes Rainfall (mm) 198.4 105.8 92.4 59.8 200.9 224.6 273.2 429.7 331.9 429.2 297.4 227.2 Number of Rainy Days 18.0 14.0 10.0 8.0 12.0 14.0 16.0 20.0 18.0 20.0 20.0 20.0 Maximum Temperature (oC) 25.5 26.3 28.2 30.1 31.5 32.3 32.3 31.6 31.2 30.2 28.2 26.1 Minimum Temperature (oC) 19.6 20.0 21.6 23.5 25.0 25.7 25.5 25.2 24.7 24.0 22.4 20.4
Butuan City, Agusan del Norte Rainfall (mm) 308.0 211.8 149.8 107.2 104.8 135.1 157.5 105.1 1,140.2 195.2 192.8 218.8 Number of Rainy Days 21.0 15.0 16.0 12.0 14.0 16.0 16.0 12.0 14.0 17.0 18.0 19.0 Maximum Temperature (oC) 30.1 30.8 31.8 33.1 33.8 33.0 32.5 32.8 32.9 32.3 31.6 30.8 Minimum Temperature (oC) 22.0 22.0 22.4 23.1 23.8 23.6 23.3 23.5 23.3 23.2 23.0 22.5

TABLE 2.18. (continued)…..
Sampling Station Jan Feb Mar Apr May Jun Jul Aug Sep Oct Nov Dec
Cabanatuan, Nueva Ecija Rainfall (mm) 8.3 9.8 17.3 29.7 179.1 250.4 370.4 380.7 307.3 207.3 104.1 40.6 Number of Rainy Days 2.0 1.0 2.0 4.0 12.0 17.0 21.0 23.0 20.0 14.0 7.0 5.0 Maximum Temperature (oC) 31.3 32.2 33.3 35.0 35.1 33.7 32.5 31.6 32.2 32.3 32.3 31.5 Minimum Temperature (oC) 20.3 20.7 21.4 23.0 23.9 23.9 23.6 23.5 23.4 23.0 22.2 21.2
Cagayan de Oro, Misamis Oriental Rainfall (mm) 97.3 59.2 52.1 45.8 84.1 207.6 212.1 192.2 200.0 189.9 131.5 99.9 Number of Rainy Days 10.0 8.0 6.0 5.0 10.0 17.0 17.0 16.0 16.0 16.0 12.0 11.0 Maximum Temperature (oC) 31.0 31.4 32.3 33.2 33.9 33.1 32.9 33.3 32.9 32.7 32.3 31.5 Minimum Temperature (oC) 22.4 22.2 22.5 23.4 24.2 23.8 23.4 23.4 23.4 23.3 23.1 22.8
Calapan, Oriental Mindoro Rainfall (mm) 93.0 56.0 70.4 114.8 156.4 219.5 241.8 189.6 218.9 325.5 244.5 1,211.3 Number of Rainy Days 16.0 10.0 9.0 10.0 12.0 15.0 17.0 15.0 16.0 18.0 19.0 20.0 Maximum Temperature (oC) 28.9 29.7 30.8 32.0 32.8 32.4 31.9 31.8 31.8 31.1 30.4 29.2 Minimum Temperature (oC) 22.2 22.4 23.1 24.0 24.2 23.9 23.6 23.6 23.6 23.6 23.4 22.7
Catarman, Northern Samar Rainfall (mm) 444.2 278.0 229.8 142.9 129.3 205.5 192.8 153.1 203.1 314.8 523.2 573.9 Number of Rainy Days 22.0 18.0 16.0 12.0 12.0 15.0 15.0 12.0 16.0 20.0 24.0 26.0 Maximum Temperature (oC) 29.0 29.5 30.4 31.7 32.9 32.7 32.3 32.8 32.3 31.4 30.3 29.3 Minimum Temperature (oC) 22.3 22.1 22.1 22.8 23.5 23.7 23.7 24.0 23.6 23.4 23.2 22.9
Catbalogan, Western Samar Rainfall (mm) 231.5 168.9 149.1 117.5 145.1 231.2 266.4 182.1 263.5 303.2 323.3 298.2 Number of Rainy Days 19.0 16.0 15.0 12.0 14.0 19.0 18.0 15.0 19.0 21.0 22.0 22.0 Maximum Temperature (oC) 30.6 31.1 32.1 33.3 33.5 33.0 32.5 32.8 32.6 32.1 31.4 30.8 Minimum Temperature (oC) 22.0 22.1 22.5 23.6 24.4 24.3 24.3 24.7 24.2 23.8 23.2 22.6
Coron, Palawan Rainfall (mm) 21.1 10.1 11.6 31.6 192.1 348.6 486.7 481.8 422.0 280.2 102.8 78.1 Number of Rainy Days 3.0 2.0 2.0 3.0 11.0 19.0 23.0 21.0 20.0 17.0 9.0 6.0 Maximum Temperature (oC) 32.1 32.4 32.9 33.6 33.1 31.7 30.8 30.8 30.9 31.6 32.3 32.1 Minimum Temperature (oC) 22.0 22.3 22.8 23.6 23.9 23.4 22.8 22.9 22.9 23.0 22.9 22.4
Cuyo, Palawan Rainfall (mm) 9.7 1.1 16.5 44.2 191.5 360.7 413.0 405.3 365.3 296.2 138.4 58.0 Number of Rainy Days 1.0 0.0 1.0 3.0 13.0 19.0 21.0 19.0 20.0 16.0 7.0 4.0 Maximum Temperature (oC) 29.7 30.1 31.1 32.4 32.8 32.0 31.5 31.6 31.4 31.3 31.0 30.1 Minimum Temperature (oC) 25.2 25.1 25.4 26.2 26.0 25.3 25.1 25.2 25.1 25.5 26.0 25.6
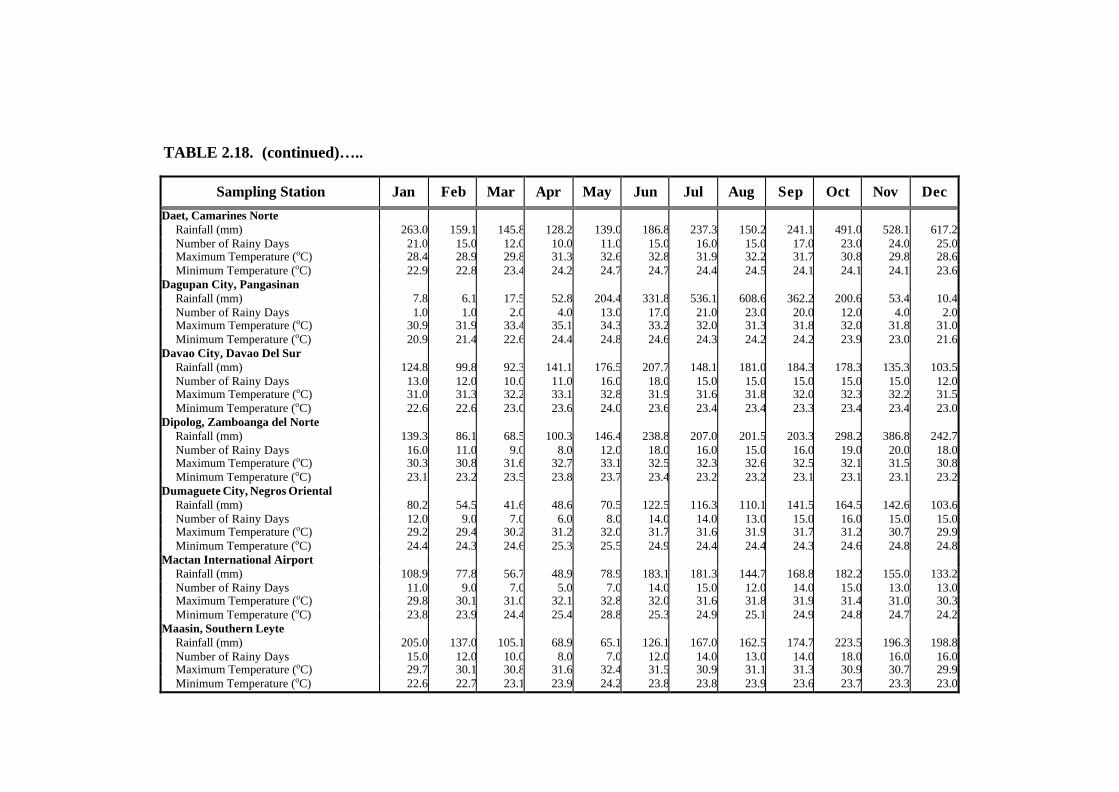
TABLE 2.18. (continued)…..
Sampling Station Jan Feb Mar Apr May Jun Jul Aug Sep Oct Nov Dec
Daet, Camarines Norte Rainfall (mm) 263.0 159.1 145.8 128.2 139.0 186.8 237.3 150.2 241.1 491.0 528.1 617.2 Number of Rainy Days 21.0 15.0 12.0 10.0 11.0 15.0 16.0 15.0 17.0 23.0 24.0 25.0 Maximum Temperature (oC) 28.4 28.9 29.8 31.3 32.6 32.8 31.9 32.2 31.7 30.8 29.8 28.6 Minimum Temperature (oC) 22.9 22.8 23.4 24.2 24.7 24.7 24.4 24.5 24.1 24.1 24.1 23.6
Dagupan City, Pangasinan Rainfall (mm) 7.8 6.1 17.5 52.8 204.4 331.8 536.1 608.6 362.2 200.6 53.4 10.4 Number of Rainy Days 1.0 1.0 2.0 4.0 13.0 17.0 21.0 23.0 20.0 12.0 4.0 2.0 Maximum Temperature (oC) 30.9 31.9 33.4 35.1 34.3 33.2 32.0 31.3 31.8 32.0 31.8 31.0 Minimum Temperature (oC) 20.9 21.4 22.6 24.4 24.8 24.6 24.3 24.2 24.2 23.9 23.0 21.6
Davao City, Davao Del Sur Rainfall (mm) 124.8 99.8 92.3 141.1 176.5 207.7 148.1 181.0 184.3 178.3 135.3 103.5 Number of Rainy Days 13.0 12.0 10.0 11.0 16.0 18.0 15.0 15.0 15.0 15.0 15.0 12.0 Maximum Temperature (oC) 31.0 31.3 32.2 33.1 32.8 31.9 31.6 31.8 32.0 32.3 32.2 31.5 Minimum Temperature (oC) 22.6 22.6 23.0 23.6 24.0 23.6 23.4 23.4 23.3 23.4 23.4 23.0
Dipolog, Zamboanga del Norte Rainfall (mm) 139.3 86.1 68.5 100.3 146.4 238.8 207.0 201.5 203.3 298.2 386.8 242.7 Number of Rainy Days 16.0 11.0 9.0 8.0 12.0 18.0 16.0 15.0 16.0 19.0 20.0 18.0 Maximum Temperature (oC) 30.3 30.8 31.6 32.7 33.1 32.5 32.3 32.6 32.5 32.1 31.5 30.8 Minimum Temperature (oC) 23.1 23.2 23.5 23.8 23.7 23.4 23.2 23.2 23.1 23.1 23.1 23.2
Dumaguete City, Negros Oriental Rainfall (mm) 80.2 54.5 41.6 48.6 70.5 122.5 116.3 110.1 141.5 164.5 142.6 103.6 Number of Rainy Days 12.0 9.0 7.0 6.0 8.0 14.0 14.0 13.0 15.0 16.0 15.0 15.0 Maximum Temperature (oC) 29.2 29.4 30.2 31.2 32.0 31.7 31.6 31.9 31.7 31.2 30.7 29.9 Minimum Temperature (oC) 24.4 24.3 24.6 25.3 25.5 24.9 24.4 24.4 24.3 24.6 24.8 24.8
Mactan International Airport Rainfall (mm) 108.9 77.8 56.7 48.9 78.9 183.1 181.3 144.7 168.8 182.2 155.0 133.2 Number of Rainy Days 11.0 9.0 7.0 5.0 7.0 14.0 15.0 12.0 14.0 15.0 13.0 13.0 Maximum Temperature (oC) 29.8 30.1 31.0 32.1 32.8 32.0 31.6 31.8 31.9 31.4 31.0 30.3 Minimum Temperature (oC) 23.8 23.9 24.4 25.4 28.8 25.3 24.9 25.1 24.9 24.8 24.7 24.2
Maasin, Southern Leyte Rainfall (mm) 205.0 137.0 105.1 68.9 65.1 126.1 167.0 162.5 174.7 223.5 196.3 198.8 Number of Rainy Days 15.0 12.0 10.0 8.0 7.0 12.0 14.0 13.0 14.0 18.0 16.0 16.0 Maximum Temperature (oC) 29.7 30.1 30.8 31.6 32.4 31.5 30.9 31.1 31.3 30.9 30.7 29.9 Minimum Temperature (oC) 22.6 22.7 23.1 23.9 24.2 23.8 23.8 23.9 23.6 23.7 23.3 23.0

TABLE 2.18. (continued)…..
Sampling Station Jan Feb Mar Apr May Jun Jul Aug Sep Oct Nov Dec
Malaybalay, Bukidnon Rainfall (mm) 181.3 133.3 131.0 129.4 231.1 316.9 329.4 301.4 302.8 315.6 187.1 181.5 Number of Rainy Days 16.0 13.0 12.0 12.0 17.0 23.0 24.0 21.0 22.0 23.0 18.0 15.0 Maximum Temperature (oC) 28.6 29.1 30.1 31.2 31.0 29.5 28.7 28.9 29.2 29.2 29.5 29.0 Minimum Temperature (oC) 17.8 17.5 17.6 18.2 19.1 19.4 19.1 18.9 18.9 19.0 18.7 18.3
Masbate, Masbate Rainfall (mm) 165.6 98.0 87.0 59.7 93.5 156.7 205.1 158.7 230.7 236.4 253.6 275.6 Number of Rainy Days 16.0 13.0 11.0 7.0 9.0 14.0 17.0 17.0 17.0 18.0 18.0 20.0 Maximum Temperature (oC) 30.2 30.8 31.9 33.3 34.1 33.4 32.6 32.7 32.6 32.3 31.5 30.4 Minimum Temperature (oC) 22.9 22.9 23.4 24.6 25.4 25.2 24.8 24.8 24.6 24.5 24.1 23.6
Puerto Princesa, Palawan Rainfall (mm) 29.5 23.7 32.1 42.7 128.1 178.6 163.9 159.8 181.8 222.3 205.4 146.1 Number of Rainy Days 5.0 3.0 4.0 6.0 12.0 16.0 17.0 18.0 17.0 19.0 15.0 10.0 Maximum Temperature (oC) 30.7 30.9 31.7 32.7 32.6 31.5 31.2 31.1 31.2 31.1 31.0 30.6 Minimum Temperature (oC) 22.7 22.8 23.2 24.2 24.5 23.9 23.5 23.5 23.4 23.4 23.4 23.2
Romblon, Romblon Rainfall (mm) 97.3 54.7 48.9 69.2 106.1 223.3 237.8 193.0 235.0 311.2 232.6 206.2 Number of Rainy Days 13.0 9.0 8.0 7.0 10.0 16.0 18.0 15.0 17.0 19.0 18.0 17.0 Maximum Temperature (oC) 28.3 29.1 30.3 31.8 32.6 31.6 30.8 30.6 30.7 30.5 29.7 28.5 Minimum Temperature (oC) 23.6 23.8 24.5 25.6 26.0 25.4 25.1 25.3 25.1 25.1 24.9 24.2
Roxas City, Aklan Rainfall (mm) 87.6 44.9 56.5 72.2 121.9 254.1 235.2 216.9 241.1 294.8 253.4 177.2 Number of Rainy Days 12.0 9.0 6.0 5.0 9.0 16.0 16.0 15.0 16.0 18.0 17.0 16.0 Maximum Temperature (oC) 28.9 29.2 30.2 31.6 32.5 31.9 31.4 31.6 31.4 30.9 30.3 29.3 Minimum Temperature (oC) 23.7 23.6 24.0 24.7 24.8 24.4 24.1 24.1 24.1 24.2 24.5 24.1
San Francisco, Quezon Rainfall (mm) 46.4 19.3 21.6 19.4 89.3 191.9 221.6 148.6 148.8 138.5 111.6 179.9 Number of Rainy Days 10.0 7.0 5.0 5.0 9.0 14.0 18.0 13.0 15.0 16.0 15.0 15.0 Maximum Temperature (oC) 29.4 30.1 30.9 32.4 32.5 31.7 30.7 30.7 30.8 31.3 30.6 29.3 Minimum Temperature (oC) 21.7 22.0 22.3 23.5 24.4 24.3 24.3 24.6 24.0 23.8 23.0 22.4

Table 2.18. (continued)…..
Sampling Station Jan Feb Mar Apr May Jun Jul Aug Sep Oct Nov Dec
San Jose, Occidental Mindoro Rainfall (mm) 5.3 6.8 14.1 27.2 142.0 380.2 482.1 460.2 405.8 262.3 105.8 65.0 Number of Rainy Days 3.0 1.0 2.0 3.0 9.0 17.0 21.0 21.0 20.0 16.0 9.0 5.0 Maximum Temperature (oC) 32.3 32.7 33.9 34.6 33.9 32.1 30.8 30.8 30.7 31.5 32.3 32.1 Minimum Temperature (oC) 22.6 22.6 23.7 24.5 24.7 24.3 23.9 23.9 23.8 23.7 23.6 23.2
Sangley Point, Cavite Rainfall (mm) 17.4 6.7 8.3 15.8 126.1 251.1 380.7 481.9 308.3 224.2 108.8 56.7 Number of Rainy Days 3.0 2.0 2.0 2.0 8.0 15.0 19.0 20.0 18.0 14.0 10.0 6.0 Maximum Temperature (oC) 29.9 30.7 32.6 34.5 34.2 32.8 31.6 31.2 31.3 31.3 30.9 29.9 Minimum Temperature (oC) 22.6 22.9 23.9 25.1 25.3 25.1 24.8 24.8 24.7 24.7 24.3 23.2
Science Garden, Quezon City Rainfall (mm) 19.5 8.9 22.9 35.1 160.4 311.6 504.1 526.8 391.7 312.0 155.5 83.9 Number of Rainy Days 4.0 2.0 3.0 4.0 12.0 18.0 22.0 24.0 22.0 19.0 14.0 9.0 Maximum Temperature (oC) 30.4 31.6 33.3 34.9 34.6 32.9 31.6 31.1 31.5 31.3 31.1 30.3 Minimum Temperature (oC) 20.4 20.6 21.6 23.3 24.4 24.3 24.0 23.9 23.7 23.2 22.4 21.3
Surigao, Surigao del Norte Rainfall (mm) 600.8 444.7 334.6 235.6 126.4 140.3 164.8 131.5 149.0 261.6 447.2 524.9 Number of Rainy Days 24.0 21.0 21.0 17.0 13.0 14.0 13.0 12.0 14.0 20.0 22.0 25.0 Maximum Temperature (oC) 29.3 29.6 30.4 31.6 32.7 32.5 32.2 32.6 32.6 31.9 30.6 29.8 Minimum Temperature (oC) 22.7 22.7 23.1 23.7 24.2 24.1 24.1 24.2 24.1 23.8 23.5 23.3
Tacloban City, Leyte Rainfall (mm) 288.5 215.6 173.2 129.4 140.2 177.6 177.1 150.0 167.9 218.5 297.9 360.0 Number of Rainy Days 21.0 17.0 17.0 14.0 14.0 18.0 17.0 15.0 16.0 20.0 21.0 23.0 Maximum Temperature (oC) 29.0 29.5 30.2 31.3 31.9 31.6 31.4 31.8 31.7 31.2 30.4 29.5 Minimum Temperature (oC) 23.0 23.0 23.3 24.3 25.0 24.8 24.6 24.6 24.5 24.4 24.1 23.6
Tagbilaran City, Bohol Rainfall (mm) 103.1 78.7 68.2 69.6 75.1 112.3 118.8 111.8 135.5 178.7 182.0 126.3 Number of Rainy Days 14.0 11.0 10.0 8.0 10.0 15.0 14.0 13.0 15.0 18.0 18.0 16.0 Maximum Temperature (oC) 30.8 31.3 32.1 33.0 33.3 32.6 32.3 32.7 32.5 32.1 31.7 31.2 Minimum Temperature (oC) 22.1 22.0 22.2 23.1 24.1 24.1 24.1 24.3 24.1 23.8 23.3 22.7

TABLE 2.18. (continued)..…
Sampling Station Jan Feb Mar Apr May Jun Jul Aug Sep Oct Nov Dec
Tuguegarao, Cagayan Rainfall (mm) 27.6 13.9 21.4 42.9 136.5 141.8 191.7 242.7 216.7 324.4 233.2 114.4 Number of Rainy Days 8.0 5.0 5.0 5.0 11.0 12.0 15.0 15.0 14.0 16.0 15.0 13.0 Maximum Temperature (oC) 28.7 30.7 33.4 35.5 36.0 35.3 34.1 33.7 33.1 31.5 29.6 28.0 Minimum Temperature (oC) 19.3 19.6 20.9 22.7 23.6 23.8 23.5 23.4 23.1 22.4 21.4 20.0 Vigan, Ilocos Sur Rainfall (mm) 3.5 2.9 3.2 12.0 182.2 357.7 550.5 642.2 362.1 154.3 33.2 4.9 Number of Rainy Days 1.0 0.0 1.0 1.0 10.0 16.0 19.0 21.0 15.0 9.0 3.0 1.0 Maximum Temperature (oC) 30.2 30.7 31.8 33.1 33.0 31.9 31.0 30.3 30.8 31.4 31.4 30.5 Minimum Temperature (oC) 21.1 21.5 23.1 24.6 24.9 24.3 23.9 23.6 23.7 23.6 23.1 22.2 Virac Radar, Catanduanes Rainfall (mm) 374.8 226.2 176.7 183.8 184.0 263.8 236.8 167.2 244.1 417.4 543.7 598.5 Number of Rainy Days 23.0 17.0 17.0 16.0 16.0 17.0 16.0 14.0 17.0 22.0 25.0 26.0 Maximum Temperature (oC) 26.4 26.8 27.6 28.7 29.6 29.6 29.3 29.5 29.5 29.0 28.0 26.9 Minimum Temperature (oC) 21.1 21.2 21.8 22.7 23.4 23.5 23.1 23.2 23.0 23.0 22.4 21.6 Virac Synop, Catanduanes Rainfall (mm) 219.1 120.4 128.9 127.0 154.7 261.0 242.0 152.3 234.6 374.9 453.1 450.0 Number of Rainy Days 17.0 13.0 13.0 13.0 13.0 15.0 16.0 13.0 17.0 21.0 22.0 22.0 Maximum Temperature (oC) 29.0 29.4 30.2 31.2 31.9 31.7 31.3 31.6 31.4 30.9 30.2 29.3 Minimum Temperature (oC) 21.8 21.6 21.9 22.8 23.6 23.7 23.6 23.7 23.4 23.2 22.9 22.3 Zamboanga City, Zamboanga del Sur Rainfall (mm) 43.6 54.1 44.4 50.6 80.2 134.9 154.8 131.1 144.6 188.8 120.8 62.2Number of Rainy Days 7.0 7.0 7.0 8.0 10.0 15.0 14.0 13.0 13.0 15.0 12.0 9.0Maximum Temperature (oC) 32.2 32.3 32.1 32.9 32.7 31.9 31.6 32.0 32.1 32.0 32.3 32.3Minimum Temperature (oC) 23.0 23.1 23.6 24.0 24.3 24.1 23.9 23.9 23.8 23.7 23.6 23.3
Note: Climatological Normal refers to the period averages for a uniform and relative long period comprising at least 3 consecutive 10-year period. Source: PAG-ASA, DOST.

TABLE 2.19. LIST OF POLICY ISSUANCES FOR THE AIR SECTOR, 1996-2002
Number Title
1997 DENR Administrative Orders
97-39 Chemical Control Order for Cyanide and Cyanide Compounds
DENR Memorandum Circulars 97-10 Classification on Section 60 (b) of DENR Administrative Order No. 14, Series of 1993 (DAO 14, S93). 1998
DENR Administrative Orders 98-46 1998 Revised Rules and Regulations for the Prevention, Control and Abatement of Air Pollution from Motor
Vehicles. 98-47 Implementing Rules and Regulations (IRR) for Mandating the Phase-Out of Leaded Gasoline as One of the Means of
Solving Air Pollution. 98-58 Priority Chemical List. DAO Chemical List 1998
DENR Memorandum Circulars 98-18 Errata to the DENR Administrative Order No. 98-46 (DAO 98-46) Dated 29 June 1998. 98-20 Designation of the Task Force Air Quality as the Sole Body to Receive, Process and Approve/Disapprove
Application for “Certificate of Conformity”. Executive Orders
1998 Creating the Presidential Air Quality Commission
1999
Republic Act
8749 An Act Providing For a Comprehensive Air Pollution Control Policy and For Other Purposes. 1999 DENR Memorandum Circulars
99-10 Errata to the DENR Administrative Order No. 98-46 Dated 29 June 1998.

TABLE 2.19. (continued)….
Number Title
2000
2000 DENR Administrative Orders
2000-02 Chemical Control Order For Asbestos. 2000-03 Interim Implementing Rules And Regulations Of Republic Act No. 8749, “The Philippine Clean Air Act Of 1999”. 2000-18 Chemical Control Order For Ozone Depleting Substances (ODS).
2000-81 Implementing Rules And Regulations For RA 8749.
2000-82 Integrated Air Quality Improvement Frame -Work Air Quality Control Action Plan.
2001
DENR Administrative Orders No. 2001 – 09, January 16, 2001 General Guidelines for the Establishment and Management of the EIA Review Support Fund.
No. 2001 – 12, March 13, 2001
Creation of the Manila Bay Environmental Management Project Coordinating Committee and Project Management Office for the GEF/UNDP/IMO Regional Programme “Building Partnership in Environmental Management for the Seas of East Asia”.
No. 2001- 13, March 13, 2001
Strengthening The DENR Support System For The GEF/UNDP/IMO Regional Programme, "Partnership In Environmental Management For The Seas Of East Asia” (PEMSEA) By The Creation Of A Programme National Coordinating Committee And Management Office.
DENR Memorandum Circulars
2001-06 Errata to the DENR Administrative Order No. 2000-81, Series of 2000. 2001-16 Adoption of the “Guidelines on Administrative and Financial Policies and Procedures” for the Philippine Ozone
Desk Grant Funds. 2002
DENR Administrative Orders
No.2002-05, January 23, 2002
Initial Designation of the Metro Manila Airshed and the Creation of its Interim Governing Board

TABLE 2.19. (continued)…..
Number Title
No.2002-16, July 11, 2002
DENR-EMB National Environmental User's Fee of 2002
No.2002-17, July 24, 2002
Defining the Organizational Structure and Major Responsibilities of the Environmental Management Bureau as a Line Bureau by Virtue of Section 34 of the Philippine Clean Air Act of 1999 (RA 8749)
No. 2002-21, October 7, 2002
Initial Designation of the Members of the Metro Cebu Airshed Governing Board
No. 2002-22, October 22, 2002
Deletion of Footnote No.3 of DAO No. 2000-18 (Chemical Control Order for Ozone Depleting Substances)
No. 2002-23 October 22, 2002
Implementation Guidelines on the Operationalization of the Air Quality Management Fund under Republic Act 8749
DENR Memorandum Circulars 2002-01 Initial Designation of Airshed for Metro Manila
2002-02 Withdrawal of the Announcement to the Public Signed on 24 July 2001 Regarding the Ban of Carbon Dioxide found in Fire Extinguishers, Suppressors, Fire Fighting Paraphernalia, Refrigerators and the Like
2002-03 Interim Guidelines for the Designation of an Airshed
2002-05 Clarification on the Incinerator Ban in the Philippine Clean Air Act of 1999
2002-12 Delegation of Authority to the EMB Regional Offices to Issue "Permit to Transport" for Hazardous Wastes, and "Certification" and "Importation Clearance" for Chemicals and Chemical Substances
2002-13 Establishment of Geothermal Areas as Airsheds Source: Policy Studies Division, Planning and Policy Statistics Office, DENR
Water
Compendium of Philippine Environment Statistics 2004
WWWaaattteeerrr
3 C
hapt
er
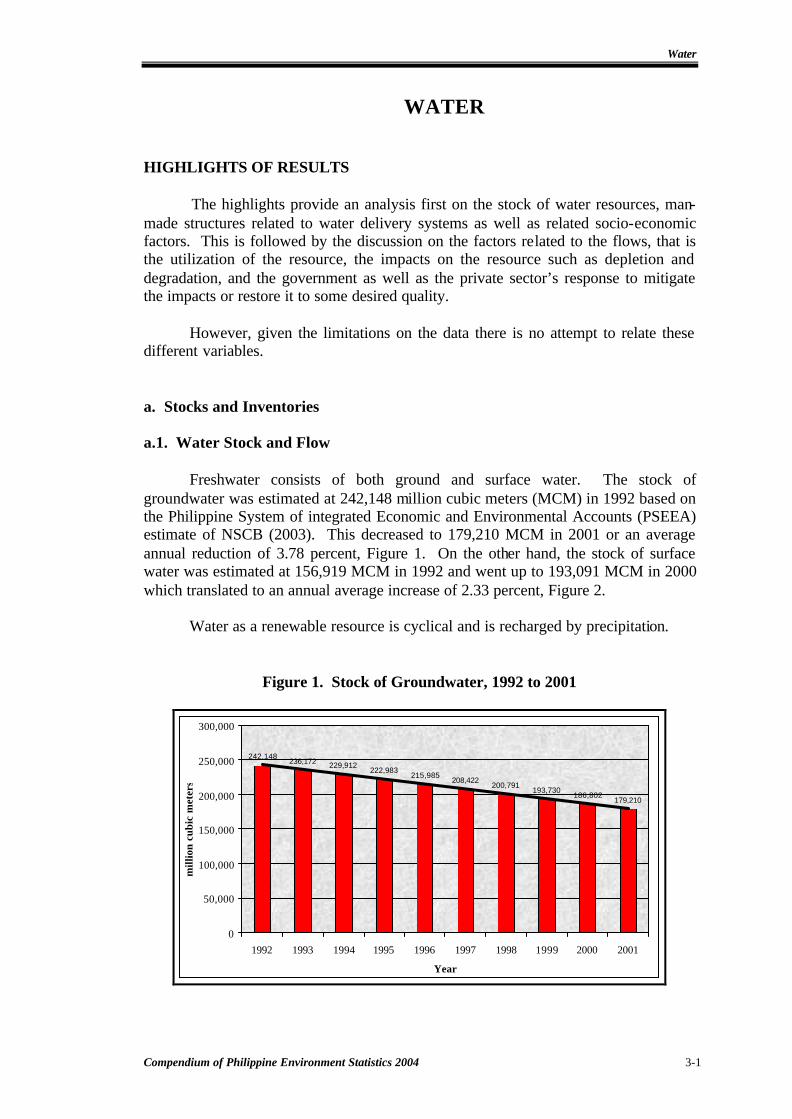
Water
Compendium of Philippine Environment Statistics 2004 3-1
WATER
HIGHLIGHTS OF RESULTS The highlights provide an analysis first on the stock of water resources, man-made structures related to water delivery systems as well as related socio-economic factors. This is followed by the discussion on the factors related to the flows, that is the utilization of the resource, the impacts on the resource such as depletion and degradation, and the government as well as the private sector’s response to mitigate the impacts or restore it to some desired quality.
However, given the limitations on the data there is no attempt to relate these different variables. a. Stocks and Inventories a.1. Water Stock and Flow
Freshwater consists of both ground and surface water. The stock of groundwater was estimated at 242,148 million cubic meters (MCM) in 1992 based on the Philippine System of integrated Economic and Environmental Accounts (PSEEA) estimate of NSCB (2003). This decreased to 179,210 MCM in 2001 or an average annual reduction of 3.78 percent, Figure 1. On the other hand, the stock of surface water was estimated at 156,919 MCM in 1992 and went up to 193,091 MCM in 2000 which translated to an annual average increase of 2.33 percent, Figure 2.
Water as a renewable resource is cyclical and is recharged by precipitation.
Figure 1. Stock of Groundwater, 1992 to 2001
242,148236,172 229,912
222,983215,985
208,422200,791
193,730186,802
179,210
0
50,000
100,000
150,000
200,000
250,000
300,000
1992 1993 1994 1995 1996 1997 1998 1999 2000 2001
Year
mill
ion
cubi
c m
eter
s

Water
Compendium of Philippine Environment Statistics 2004 3-2
Figure 2. Stock of Surface Water, 1992 to 2000
156,919 158,497
178,476 183,293
130,607 135,509
215,087206,486
193,091
0
50,000
100,000
150,000
200,000
250,000
1992 1993 1994 1995 1996 1997 1998 1999 2000
Year
Mill
ion
cubi
c m
eter
s
a.2. Socio-Economic Factors
The country’s water resource has to support a population growing at an average annual rate of 2.32 percent, estimated at 68.6 million as of the 1995 count and 76.5 million based on the 2000 census.
Figure 3. Inventory of Classified Water Bodies, as of 2002.
159
104
181
163
0
20
40
60
80
100
120
140
160
180
200
Class A Class B Class C Class D Class AA
The Inventory of Classified Water Bodies released by the Department of Environment and Natural Resources (DENR) showed that in December 2002 there were only 3 out of the 501 classified water bodies belonging to class AA, that is, water having watersheds which are uninhabited and otherwise protected and thus require only approved disinfection in order to meet the National Standards for

Water
Compendium of Philippine Environment Statistics 2004 3-3
Drinking Water (NSDW) of the Philippines. The three class AA water bodies were located in the upper reach of Nagan River, Apayao Province, Guinabasan River, Cebu and Lipadas River, Davao City. On the other hand, there were 159 water bodies classified under class A, (Figure 3) i.e., sources of water supply that require complete treatment (coagulation, sedimentation, filtration and disinfection) in order to meet the NSDW. These class A water bodies were distributed as follows: 67 in Luzon, 38 in the Visayas and 53 in Mindanao.
As of 2003, the operating economic zones all over the country covered a total
area of 12,358.7 hectares. Majority of these were found in Region 4 with 26 eco-zones and an area of 2,283.3 hectares. There were other economic zones listed as development in progress, approved/registered and proclaimed with an area of 792,643.2 hectares.
As indicated in the Inventory of DENR, there were 181 water bodies classified under class C, i.e., Industrial Water Supply Class I (for manufacturing processes after treatment), Fishery Water (for the propagation and growth of fish and other aquatic resources), and Recreational Water Class II (for boating, etc.); while there were only 16 classified under class D, i.e. Industrial Water Supply Class II (for cooling, etc.). Water for agriculture, irrigation, livestock watering, etc. and, other inland water, by their quality, belong to this classification. b. Socioeconomic Activities and Natural Events
Figure 4. Withdrawal of Groundwater, 1992 to 2001
7,3077,608 7,848
8,552 8,653 8,8269,093 9,218 9,224
9,599
0
2,000
4,000
6,000
8,000
10,000
12,000
1992 1993 1994 1995 1996 1997 1998 1999 2000 2001
Year
mill
ion
cubi
c m
eter
s
Water resource utilization which is directly affected by increased population and economic progress is taking its toll on the country’s water resources. The quantity of water demand from groundwater amounted to 9,599 MCM in 2001 from 7,307 MCM in 1992, increasing on the average by 2.77 percent annually, Figure 4. In 2000, industrial use accounted for a bigger proportion of groundwater demand (14

Water
Compendium of Philippine Environment Statistics 2004 3-4
percent) compared with that of domestic use. Across regions, Region IV accounted for about 26.8 percent of total groundwater demand, Table 3.1.
The quantity of water abstracted from surface water amounted to 36,925.80
MCM in 2000 compared to 33,509.4 MCM in 1992 or an average annual increase of 1.08 percent. Surface water was primarily used for agriculture, accounting for about 95.4 percent or 32,236.8 MCM of the total demand in 2000.
Figure 5. Surface Water Withdrawal, 1992 to 2000
-39,000.00
-38,000.00
-37,000.00
-36,000.00
-35,000.00
-34,000.00
-33,000.00
-32,000.00
-31,000.001992 1993 1994 1995 1996 1997 1998 1999 2000
It is important to note however, that in 2000, the industrial demand for groundwater was much higher than that for surface water with 4, 340.9 MCM (94.7 percent) and 242.3 MCM (5.4 percent), respectively.
Figure 6. Industrial Water Demand, year 2000
4340.94
242.34
Groundwater
Surface Water

Water
Compendium of Philippine Environment Statistics 2004 3-5
c. Environmental Impacts
The rapid increase in water demand from domestic, industrial and agriculture users, compounded by the heavy pollution loads caused by the disposals of the same users and climatic changes, resulted in the depletion and degradation of the country’s water resources posing threats on the sustainability of these resources and related ecosystems and on the health of the general populace.
The Physical Asset Accounts compiled for groundwater showed that from 1992 to 2001 recharge was much lower than water withdrawal which continued to increase. With such trend, groundwater was being depleted annually on the average by 2.6 percent. Depletion as defined here is abstraction beyond the replenishment rate. Estimated depletion for 2001 was 7,593 million cubic meters (see Figure 7).
Figure 7. Depletion of Groundwater, 1992 to 2001
(5,884) (5,976)(6,260)
(6,928) (6,998)
(7,563) (7,631)
(7,061) (6,928)
(7,593)
(9,000)
(8,000)
(7,000)
(6,000)
(5,000)
(4,000)
(3,000)
(2,000)
(1,000)
01992 1993 1994 1995 1996 1997 1998 1999 2000 2001
Year
mill
ion
cubi
c m
eter
s
In the case of surface water, recharge was higher than the withdrawals from
1992 to 1994. However, from 1995 to 2000 withdrawal was higher than recharge and estimates showed that the highest depletion in surface water occurred in 2000 with 36,464 million cubic meters.
With regards to water quality of surface water, only the monitoring stations of
the rivers of Metro Manila, particularly Pasig, Marikina, San Juan, Paranaque and Tullahan-Tenejeros Rivers submitted reports. From 1995 to 2002, San Juan River had the highest annual average Biochemical Oxygen Demand (BOD) concentration with 28.7 mg/L. In 2002, the said river had 34.8 mg/L. On the other hand, the lowest annual average BOD concentration from 1995 to 2002 can be found in Markina River with 8.0 mg/L. In 2002, the river had the lowest concentration among the rivers of NCR with 12.1 mg/L (see Figure 8).
Conversely, Marikina River consistently reflected the highest concentration of
dissolved oxygen from 1996 to 2002 with 4.4 mg/L. In 2002, the DO concentration of the river was 5.0 mg/L. On the other hand, San Juan River showed the lowest

Water
Compendium of Philippine Environment Statistics 2004 3-6
average of DO with 1.8 mg/L from 1996 to 2002. The annual average for 2002 river was 3.0 mg/L (see Figure 9).
Figure 8. Annual Average Dissolved Oxygen Concentration in NCR Rivers, 1996 to 2002
0.00
1.00
2.00
3.00
4.00
5.00
6.00
1996 1997 1998 1999 2000 2001 2002
Year
mg/
L
NMTT
San Juan
Marikina
Parañaque
Pasig
Figure 9. Annual Average BOD Concentration in NCR Rivers, 1995 to 2002
0
5
10
15
20
25
30
35
40
45
50
1995 1996 1997 1998 1999 2000 2001 2002
Year
mg/
L
NMTT
San Juan
Marikina
Parañaque
Pasig
Data on harmful algal blooms (Pyrodinium blooms) monitored from 1992 to 2002 showed that this has become a regular occurrence in Philippine waters indicative of the extent of degradation of Philippine water bodies. Pyrodinium produces saxitoxin, a suite of toxins that cause Paralytic Shellfish Poisoning (PSP). Sad to say that even Honda Bay of Palawan was infested with the blooms in 2001 and 2002. Occurrences of the blooms were also recorded in Bais Bay of Dumaguete, Cancabato

Water
Compendium of Philippine Environment Statistics 2004 3-7
and San Pedro Bays of Tacloban, Masinloc Bay of Zambales, Mandaon and Milgagros of Masbate, and Juag Lagoon of Sorsogon in 2002. Fish kill (Prorocentrum minimum) also occurred in Bolinao, Pangasinan in 2002 (see Table 3.15).
Based on the list of 93 rivers surveyed in Luzon Island from 1989 to 2001, 11
were identified as dead rivers. Five of these dead rivers can be found in the province of Bulacan and they are: Balagtas, Bocaue, Guiguinto, Marilao and Meycauyan Rivers. Hagonoy/Labangan River of Bulacan and San Fernando River of Bacolor Pampanga were considered as highly polluted river. From the 93 rivers surveyed, 47 were considered not polluted.
d. Response to Environmental Impacts Currently there are five government units charged with the management of the country’s water resources. The National Water Resources Board (NWRB) which was created in 1974 as the government coordinating and regulating agency for all water resources management development activities. It is tasked with the formulation and development of policies on water utilization and appropriation, the control and supervision of water utilities and franchises, and the regulation and rationalization of water rates. The Local Water Utilities Administration (LWUA) is responsible for the supply of water outside of Metro Manila and is also tasked with the creation of local Water Districts (WDs) in the municipalities. The National Irrigation Administration (NIA) manages the irrigation facilities in support of the needs of the agriculture sector.
For the regulation of water quality, the responsibility is divided between the Department of Health (DOH) for drinking water and the Water Quality Management Section of Department of Environment and Natural Resources (DENR) for the regulation of sewerage discharges and industrial effluents. The DENR is also generally responsible for the protection of watersheds except for a few that are assigned to the NIA and NAPOCOR.
The privatized Metropolitan and Waterworks and Sewerage System (MWSS) is responsible for the water supply and sewerage disposal in the greater Metro Manila. MWSS service area is divided into the West and East Zones. MWSS granted the concessions to two different private companies in order to promote competition and generate yardstick information for more effective regulation. The West Zone accounts for about 60 percent of the population and of water connections in the service area and is also more densely populated. It is bounded in the west by the coastal area of Manila Bay, where groundwater depletion has already lowered water tables increasing pumping costs and causing saline water intrusion. Because of an older pipe distribution network, the West Zone is characterized by a higher rate of non-revenue water (estimated to be 60-70 percent in comparison to 50-55 percent for the East Zone)11 .
1 David, Cristina C. 2000. MWSS Privatization: Implications on the Price of Water, the Poor, and the Environment. Philippine Institute for Development Studies. Discussion Paper Series No. 2000-14. April 2000.
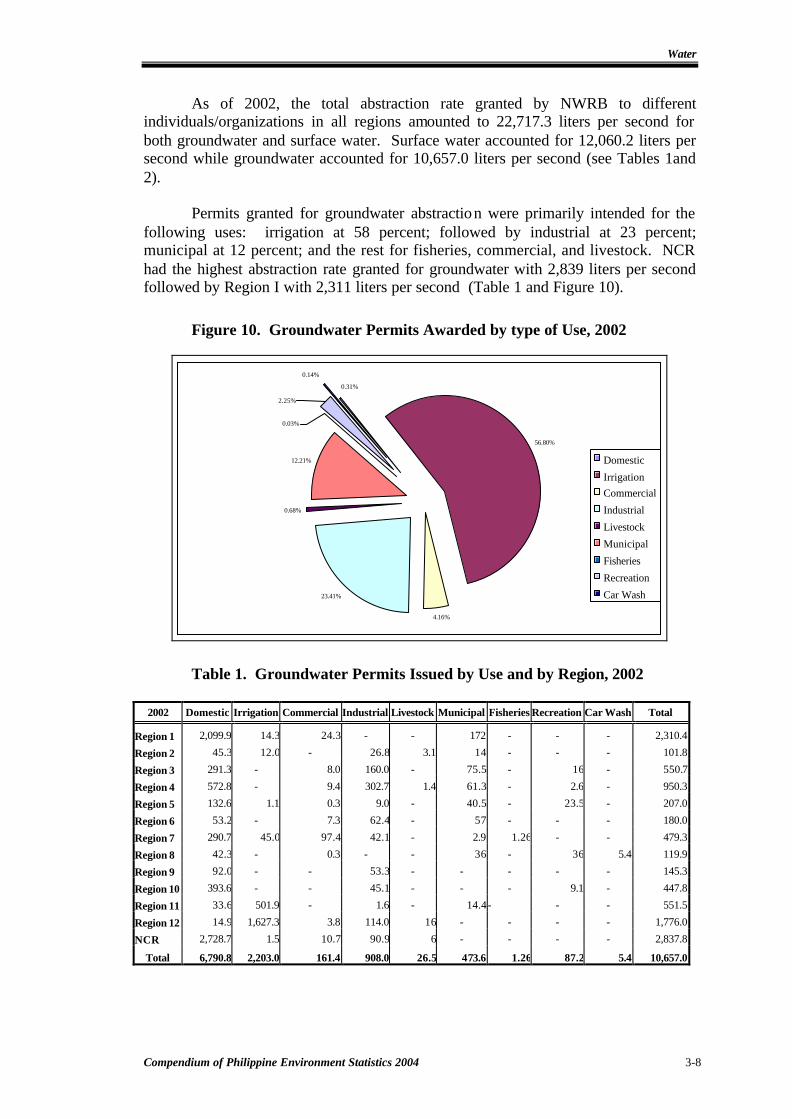
Water
Compendium of Philippine Environment Statistics 2004 3-8
As of 2002, the total abstraction rate granted by NWRB to different individuals/organizations in all regions amounted to 22,717.3 liters per second for both groundwater and surface water. Surface water accounted for 12,060.2 liters per second while groundwater accounted for 10,657.0 liters per second (see Tables 1and 2).
Permits granted for groundwater abstraction were primarily intended for the
following uses: irrigation at 58 percent; followed by industrial at 23 percent; municipal at 12 percent; and the rest for fisheries, commercial, and livestock. NCR had the highest abstraction rate granted for groundwater with 2,839 liters per second followed by Region I with 2,311 liters per second (Table 1 and Figure 10).
Figure 10. Groundwater Permits Awarded by type of Use, 2002
56.80%
4.16%
23.41%
0.68%
12.21%
0.14%
0.31%
0.03%
2.25%
Domestic
IrrigationCommercial
Industrial
Livestock
Municipal
Fisheries
Recreation
Car Wash
Table 1. Groundwater Permits Issued by Use and by Region, 2002
2002 Domestic Irrigation Commercial Industrial Livestock Municipal Fisheries Recreation Car Wash Total
Region 1 2,099.9 14.3 24.3 - - 172 - - - 2,310.4
Region 2 45.3 12.0 - 26.8 3.1 14 - - - 101.8
Region 3 291.3 - 8.0 160.0 - 75.5 - 16 - 550.7
Region 4 572.8 - 9.4 302.7 1.4 61.3 - 2.6 - 950.3
Region 5 132.6 1.1 0.3 9.0 - 40.5 - 23.5 - 207.0
Region 6 53.2 - 7.3 62.4 - 57 - - - 180.0
Region 7 290.7 45.0 97.4 42.1 - 2.9 1.26 - - 479.3
Region 8 42.3 - 0.3 - - 36 - 36 5.4 119.9
Region 9 92.0 - - 53.3 - - - - - 145.3
Region 10 393.6 - - 45.1 - - - 9.1 - 447.8
Region 11 33.6 501.9 - 1.6 - 14.4- - - 551.5
Region 12 14.9 1,627.3 3.8 114.0 16 - - - - 1,776.0
NCR 2,728.7 1.5 10.7 90.9 6 - - - - 2,837.8
Total 6,790.8 2,203.0 161.4 908.0 26.5 473.6 1.26 87.2 5.4 10,657.0

Water
Compendium of Philippine Environment Statistics 2004 3-9
In the case of surface water, 63 percent of the permitees granted used the water abstracted for irrigation purposes, 18 percent for power, and 9 percent for commercial purposes. The rest was divided among domestic, fisheries, industrial and municipal uses (Figure 11).
By regional distribution, Region 4 posted the highest abstraction rate with
2,356 liters per second followed by Region 1 with 2,067 liters per second (see Table 2).
Figure 11. Surface Water Abstraction Permits Awarded by Use, 2002
6%
63%
9%
1%
18%
2%1%
Domestic
Irrigation
Commercial
Industrial
Power
Municipal
Fisheries
Table 2. Surface Water Permits Issued by Use and by Region, 2002 2002 Domestic Irrigation Commercial Industrial Power Municipal Fisheries Total
Region 1 643.2 488.3 926.5 - - - 9.2 2,067.2
Region 2 - 1782.6 - - - - 2.31 1,784.9
Region 3 0.9 1365 - - - - - 1,365.9
Region 4 29.0 - - 126.8 2200 - 0.04 2,355.8
Region 5 - 198.4 - - - - - 198.4
Region 6 - 45.6 - - - - - 45.6
Region 7 - 376.3 - - - - 2 378.3
Region 8 - 101.7 219.0 - - 124.5 - 445.2
Region 9 - - - - - - - --
Region 10 - 1937.8 - - - - - 1,937.8
Region 11 60.0 949.0 - - - - 80 1,089.0
Region 12 - 218.3 - - - 174 - 392.3
NCR - - - - - - - --
Total 733.1 7,462.9 1,145.5 126.8 2200 298.5 93.55 12,060.2*Rounding up may not add up t o total
From 2001 to 2002, only 6 policies related to water resources in the form of administrative orders, memorandum orders and circulars were issued by DENR
Water
Compendium of Philippine Environment Statistics 2004
Statistical Tables
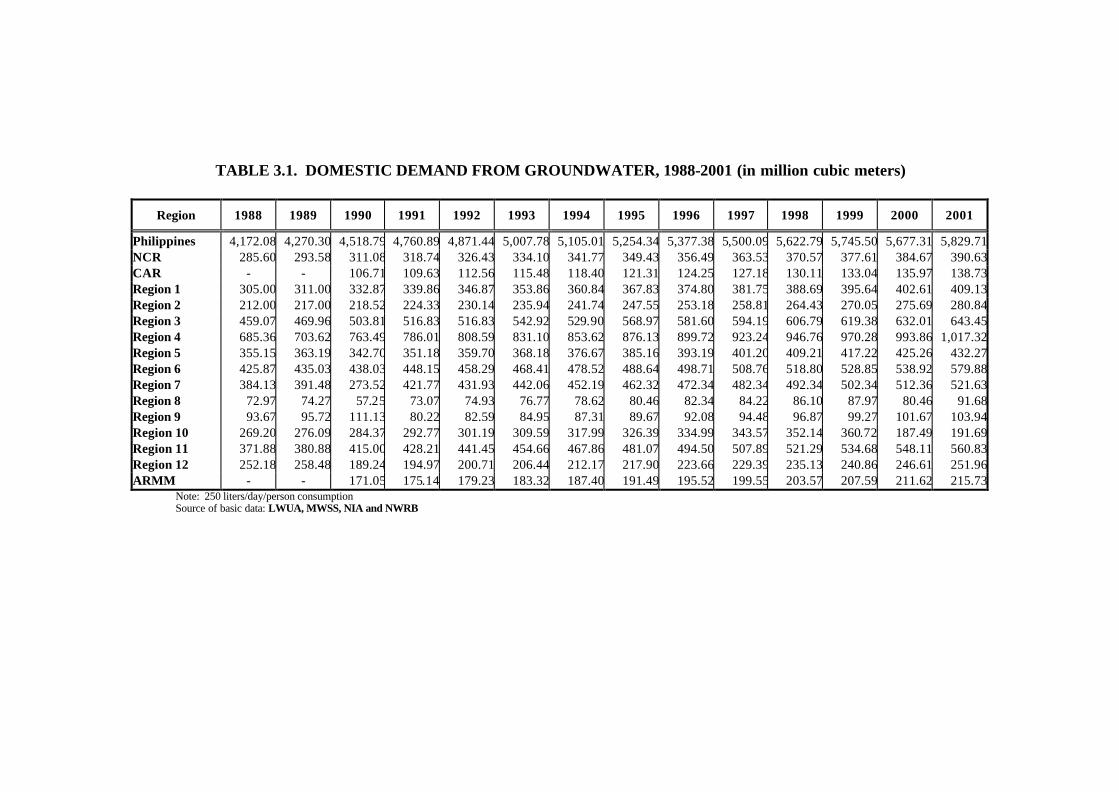
TABLE 3.1. DOMESTIC DEMAND FROM GROUNDWATER, 1988-2001 (in million cubic meters)
Region 1988 1989 1990 1991 1992 1993 1994 1995 1996 1997 1998 1999 2000 2001
Philippines 4,172.08 4,270.30 4,518.79 4,760.89 4,871.44 5,007.78 5,105.01 5,254.34 5,377.38 5,500.09 5,622.79 5,745.50 5,677.31 5,829.71NCR 285.60 293.58 311.08 318.74 326.43 334.10 341.77 349.43 356.49 363.53 370.57 377.61 384.67 390.63CAR - - 106.71 109.63 112.56 115.48 118.40 121.31 124.25 127.18 130.11 133.04 135.97 138.73Region 1 305.00 311.00 332.87 339.86 346.87 353.86 360.84 367.83 374.80 381.75 388.69 395.64 402.61 409.13Region 2 212.00 217.00 218.52 224.33 230.14 235.94 241.74 247.55 253.18 258.81 264.43 270.05 275.69 280.84Region 3 459.07 469.96 503.81 516.83 516.83 542.92 529.90 568.97 581.60 594.19 606.79 619.38 632.01 643.45Region 4 685.36 703.62 763.49 786.01 808.59 831.10 853.62 876.13 899.72 923.24 946.76 970.28 993.86 1,017.32Region 5 355.15 363.19 342.70 351.18 359.70 368.18 376.67 385.16 393.19 401.20 409.21 417.22 425.26 432.27Region 6 425.87 435.03 438.03 448.15 458.29 468.41 478.52 488.64 498.71 508.76 518.80 528.85 538.92 579.88Region 7 384.13 391.48 273.52 421.77 431.93 442.06 452.19 462.32 472.34 482.34 492.34 502.34 512.36 521.63Region 8 72.97 74.27 57.25 73.07 74.93 76.77 78.62 80.46 82.34 84.22 86.10 87.97 80.46 91.68Region 9 93.67 95.72 111.13 80.22 82.59 84.95 87.31 89.67 92.08 94.48 96.87 99.27 101.67 103.94Region 10 269.20 276.09 284.37 292.77 301.19 309.59 317.99 326.39 334.99 343.57 352.14 360.72 187.49 191.69Region 11 371.88 380.88 415.00 428.21 441.45 454.66 467.86 481.07 494.50 507.89 521.29 534.68 548.11 560.83Region 12 252.18 258.48 189.24 194.97 200.71 206.44 212.17 217.90 223.66 229.39 235.13 240.86 246.61 251.96ARMM - - 171.05 175.14 179.23 183.32 187.40 191.49 195.52 199.55 203.57 207.59 211.62 215.73
Note: 250 liters/day/person consumption Source of basic data: LWUA, MWSS, NIA and NWRB

TABLE 3.2. DOMESTIC DEMAND FROM SURFACE WATER, 1988-2000, (in million cubic meters)
Region 1988 1989 1990 1991 1992 1993 1994 1995 1996 1997 1998 1999 2000
Philippines 1,027.54 1,048.50 1,041.27 1,050.99 1,077.68 1,104.29 1,130.90 1,157.52 1,183.42 1,209.25 1,235.08 1,260.91 1,259.65NCR 400.17 411.12 429.58 440.17 450.79 461.38 471.96 482.55 492.30 502.02 511.74 521.46 531.21CAR - - - - - - - - - - - - - Region 1 - - - - - - - - - - - - - Region 2 - - - - - - - - - - - - - Region 3 69.55 71.20 75.28 77.23 79.18 81.13 83.07 85.02 86.91 88.79 90.67 92.55 94.44Region 4 7.02 7.21 7.71 7.94 8.17 8.39 8.62 8.85 9.09 9.33 9.56 9.80 10.04Region 5 22.98 23.50 21.87 22.42 22.96 23.50 24.04 24.58 25.10 25.61 26.12 26.63 27.14Region 6 64.52 65.91 65.45 66.96 68.48 69.99 71.50 73.01 74.52 76.02 77.52 79.02 80.53Region 7 16.23 16.54 11.40 17.57 18.00 18.42 18.84 19.26 19.68 20.10 20.51 20.93 21.35Region 8 221.94 222.82 171.75 219.22 224.78 230.31 235.85 241.39 247.03 252.66 258.29 263.92 269.56Region 9 184.35 188.38 215.73 155.72 160.32 164.90 169.49 174.07 178.74 183.39 188.05 192.70 197.37Region 10 40.78 41.83 42.49 43.75 45.01 46.26 47.52 48.77 50.06 51.34 52.62 53.90 28.02Region 11 - - - - - - - - - - - - - Region 12 - - - - - - - - - - - - - ARMM - - - - - - - - - - - - - Caraga - - - - - - - - - - - - -
Note: 250-liters/day/person-consumption rate Source of basic data: LWUA, MWSS, NIA and NWRB

TABLE 3.3. AGRICULTURAL DEMAND FOR SURFACE WATER, 1988 - 2000 (in million cubic meters)
1988 1989 1990 1991 1992 1993 1994 1995 1996 1997 1998 1999 2000 Livestock 20.16 21.06 21.46 23.77 24.23 25.79 26.51 28.74 29.17 29.66 31.50
Poultry 4.128 3.983 4.138 4.414 4.668 4.171 5.767 6.625 6.784 5.636 4.180Irrigation 35,736.63 36,453.8 36,007.6 36,005.5 32,184.736,425.07 36,285.2 30,000.9 29,820.7 30,193.1531,447.3931,938.9032,201.11
TOTAL 35,736.6336,453.7636,031.9136,030.5332,210.3436,453.2636,314.1430,030.82 29,853.00
30,228.52 31,483.3531,974.2032,236.79
Source: NSCB
TABLE 3.4. INDUSTRIAL GROUND WATER DEMAND BY REGION, 1988 - 2001 (in million cubic meters)
Year CAR Region 1 Region 2 Region 3 Region 4 Region 5 Region 6 Region 7 Region 8 Region 9 Region 10 Region 11 Region 12 ARMM Caraga TOTAL
1988 - 134.12 6.67 70.57 1,040.56 106.64 154.72 417.08 15.03 29.22 38.88 57.17 158.28 - - 2,228.951989 - 162.77 8.40 74.92 1,092.02 116.81 157.46 420.62 15.49 28.67 38.96 56.98 150.19 - - 2,323.281990 - 153.56 4.67 71.13 1,090.11 116.75 146.45 401.45 14.95 25.70 39.38 56.48 146.46 - - 2,267.101991 - 116.63 3.31 81.14 1,182.21 126.99 162.81 407.99 15.03 27.07 39.81 55.05 154.84 - - 2,372.891992 - 115.22 5.25 82.31 1,209.50 132.06 168.72 414.45 16.88 30.16 40.28 57.53 163.16 - - 2,435.531993 - 146.41 5.89 84.71 1,292.92 141.73 181.27 425.93 18.80 29.56 44.05 60.40 169.01 - - 2,600.681994 - 172.36 5.60 91.90 1,328.30 142.27 190.03 483.04 18.41 26.42 45.33 67.41 172.03 - - 2,743.111995 - 201.39 6.45 102.88 1,605.26 181.84 231.22 615.96 22.86 29.70 51.08 59.50 189.98 - - 3,298.111996 - 209.98 5.47 101.96 1,574.09 179.87 224.44 622.95 22.21 27.37 59.21 59.97 188.60 - - 3,276.111997 - 238.75 6.48 93.86 1,567.49 184.27 236.75 635.57 22.54 27.80 56.61 70.90 185.19 - - 3,326.221998 - 249.85 5.41 95.64 1,640.91 192.78 244.83 664.62 23.44 28.42 59.31 72.54 192.28 - - 3,470.021999 - 230.30 6.16 98.24 1,643.56 188.78 252.30 667.69 25.15 29.63 60.27 71.86 198.20 - - 3,472.152000 - 237.36 5.74 99.02 1,686.21 193.53 256.56 683.81 23.95 25.81 62.71 74.48 197.81 - - 3,547.002001 - 273.29 5.29 102.73 1,819.27 204.35 266.73 698.93 24.44 27.89 63.04 76.45 206.43 - - 3,768.83
Source: NSCB

TABLE 3.5. INDUSTRIAL DEMAND FOR SURFACE WATER BY REGION, 1988 – 2000 (in million cubic meters)
Year CAR Region 1 Region 2 Region 3 Region 4 Region 5 Region 6 Region 7 Region 8 Region 9 Region 10 Region 11 Region 12 ARMM Caraga TOTAL
1988 - - - 10.54 10.51 6.81 23.12 17.38 45.10 56.72 5.81 - - - - 175.991989 - - - 11.19 11.03 7.46 23.53 17.53 46.47 55.65 5.82 - - - - 178.681990 - - - 10.63 11.01 7.45 21.88 16.73 44.86 49.90 5.88 - - - - 168.351991 - - - 12.12 11.94 8.11 24.33 17.00 45.10 52.55 5.95 - - - - 177.091992 - - - 12.30 12.22 8.43 25.21 17.27 50.63 58.54 6.02 - - - - 190.621993 - - - 12.66 13.06 9.05 27.09 17.75 56.39 57.38 6.58 - - - - 199.951994 - - - 13.73 13.42 9.08 28.39 20.13 55.24 51.28 6.77 - - - - 198.051995 - - - 15.37 16.21 11.61 34.55 25.67 68.57 57.65 7.63 - - - - 237.261996 - - - 15.24 15.90 11.48 33.54 25.96 66.63 53.13 8.85 - - - - 230.711997 - - - 14.03 15.83 11.76 35.38 26.48 67.61 53.97 8.46 - - - - 233.511998 - - - 14.29 16.57 12.31 36.58 27.69 70.31 55.17 8.86 - - - - 241.791999 - - - 14.68 16.60 12.05 37.70 27.82 75.44 57.53 9.01 - - - - 250.832000 - - - 14.80 17.03 12.35 38.34 28.49 71.86 50.10 9.37 - - - - 242.34
Source: NSCB

TABLE 3.6. PHYSICAL ACCOUNTS: GROUNDWATER, 1988- 2001 (in million cubic meter)
1988 1989 1990 1991 1992 1993 1994 1995 1996 1997 1998 1999 2000 2001
OPENING STOCK 267,960 263,375 258,552 253,660 248,032 242,148 236,172 229,912 222,983 215,985 208,422 200,791 193,730 186,802
Changes in Quantity 6,446 6,679 6,786 7,134 7,307 7,608 7,848 8,552 8,653 8,826 9,093 9,218 9,224 9,599
(Withdrawal)
Other Accumulation 1,861 1,856.0 1,894.00 1,506.0 1,423.0 1,631.83 1,588.02 1,624.25 1,655.28 1,263.18 1,462.05 2,156.61 2,296.34 2,005.88
(Recharge)
CLOSING STOCK 263,375 258,552 253,660 248,032 242,148 236,172 229,912 222,983 215,985 208,422 200,791 193,730 186,802 179,210 Source: NSCB
TABLE 3.7. PHYSICAL ACCOUNTS: SURFACE WATER, 1988 - 2000 (in million cubic meters)
1988 1989 1990 1991 1992 1993 1994 1995 1996 1997 1998 1999 2000
Opening Stock 220,400.00 198,402.39 189,172.35 152,373.05 144,709.73 156,919.22 158,496.53 178,475.75 183,293.35 130,607.35 135,509.39 215,086.50 206,486.09 Changes in Quantity 36,925.80 37,669.57 37,261.40 37,292.33 33,509.35 37,785.35 37,667.85 37,292.33 36,925.80 37,669.57 36,925.80 37,669.57 36,925.80 Other Accumulation 14,928.19 28,439.53 462.10 29,629.01 45,718.84 39,362.66 57,647.07 29,629.01 14,928.19 28,439.53 14,928.19 28,439.53 462.10 Closing Stock 198,402.39 189,172.35 152,373.05 144,709.73 156,919.22 158,496.53 178,475.75 183,293.35 130,607.35 135,509.39 215,086.50 206,486.09 193,090.74
Source: NSCB

TABLE 3.8. WATER PRODUCTION DATA OF WATER DISTRICTS
WITH AVAILABLE DATA (in thousand cubic meters) 2003
Region
No. of WDs with Available Data as of Dec. 31,
2003
Total Cubic meters produced
Total Cubic Meters Billed
Total Rated Capacity
CAR 2 25,075 20,016 29,304Region 1 3 14,839 7,650 18,635Region 2 11 12,814 7,602 16,095Region 3 7 3,688 3,395 6,876Region 4 22 58,731 45,775 82,149Region 5 11 35,157 22,325 41,057Region 6 13 35,501 25,736 51,794Region 7 9 24,332 16,031 36,644Region 8 11 70,237 47,732 82,987Region 9 9 10,250 6,779 12,357Region 10 2 4,030 3,099 5,005Region 11 3 34,986 23,754 43,109Region 12 6 73,235 54,150 69,002Region 13 4 7,514 4,686 14,349ARMM 4 3,109 1,756 2,693
Total 117 493,498 Source: LWUA

TABLE 3.9. DULY ORGANIZED WATER DISTRICTS, FILED AND ISSUED CONDITIONAL
CERTIFICATE OF CONFORMANCE, per region, 1999 to 2002
Region 1991 1992 1993 1994 1995 1996 1997 1998 1999 2000 2001 2002
Philippines 30 8 13 17 4 9 8 4 7 4 4 5 CAR 1 - - - - - - - - - - - Region 1 - - 2 - 2 2 3 2 - - - - Region 2 2 - - 3 - - - 1 - - 1 - Region 3 6 1 - 4 1 1 - - - - - 2Region 4 2 1 2 2 - 1 2 1 1 2 - - Region 5 1 - - - - - 1 - 2 - 1 - Region 6 1 2 1 1 - - - - - - - - Region 7 4 - - 1 - - - - 1 - - - Region 8 1 - 3 1 - 2 2 - 1 1 1 1Region 9 2 3 2 1 - - - - - - - - Region 10 3 0 1 - - - - - 1 1 - 2Region 11 4 1 - - 1 1 - - 1 - 1 - Region 12 3 - 2 4 - 2 - - - - - -
Source: LWUA

TABLE 3.10a. IRRIGATION DEVELOPMENT BY REGION, 1996 and 1997, (area in hectares)
1996 1997
Service Area Service Area Region
Potential Irrigable
Area Total National Communal Private
Irrigation Development
in percent
Potential Irrigable
Area Total National Communal Private
Irrigation Development
in percent
Philippines 3,126,340 1,260,812 651,812 436,000 173,000 40.33 3,126,340 1,335,517 662,714 491,356 181,447 42.72
CAR 99,650 80,444 11,444 41,000 28,000 80.73 99,650 58,959 11,444 19,498 28,017 59.17
1 277,180 153,314 42,314 92,000 19,000 55.31 277,180 173,396 53,400 90,530 29,466 62.56
2 472,640 195,060 143,060 24,000 28,000 41.27 472,640 196,005 143,060 29,850 23,095 41.47
3 482,230 238,073 173,073 48,000 17,000 49.37 482,230 254,544 172,889 63,663 17,992 52.78
4 263,590 112,228 52,228 37,000 23,000 42.58 263,590 120,062 52,228 44,010 23,824 45.55
5 239,660 82,412 23,412 36,000 23,000 34.39 239,660 109,554 23,412 63,432 22,710 45.71
6 197,250 71,235 52,235 14,000 5,000 36.11 197,250 76,988 52,235 19,254 5,499 39.03
7 and 8 135,120 64,842 15,842 41,000 8,000 47.99 135,120 72,513 15,842 49,216 7,455 53.67
9 76,500 32,282 14,282 16,000 2,000 42.20 76,500 33,582 15,162 16,448 1,972 43.90
10 230,150 66,540 29,540 32,000 5,000 28.91 108,140 35,193 17,757 14,684 2,752 32.54
11 290,280 84,983 46,983 29,000 9,000 29.28 301,860 109,023 59,029 37,925 12,069 36.12
12 362,090 79,399 47,399 26,000 6,000 21.93 310,220 61,096 31,365 26,264 3,467 19.69
13 - - - - - - 162,300 34,602 14,891 16,582 3,129 21.32 Note: Service areas of Communal and Private Irrigation Systems are currently being firmed up. Source: NIA
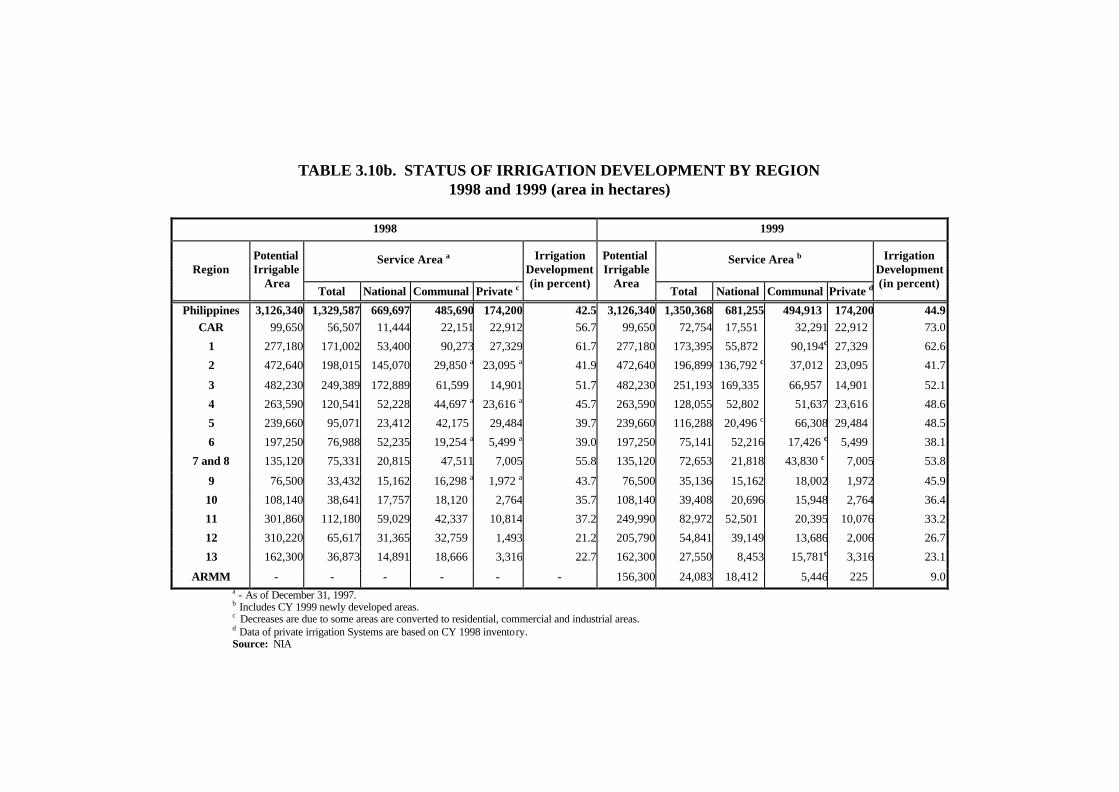
TABLE 3.10b. STATUS OF IRRIGATION DEVELOPMENT BY REGION
1998 and 1999 (area in hectares)
1998 1999
Service Area a Service Area b Region
Potential Irrigable
Area Total National Communal Private c
Irrigation Development (in percent)
Potential Irrigable
Area Total National Communal Private d
Irrigation Development (in percent)
Philippines 3,126,340 1,329,587 669,697 485,690 174,200 42.5 3,126,340 1,350,368 681,255 494,913 174,200 44.9 CAR 99,650 56,507 11,444 22,151 22,912 56.7 99,650 72,754 17,551 32,291 22,912 73.0
1 277,180 171,002 53,400 90,273 27,329 61.7 277,180 173,395 55,872 90,194c 27,329 62.6
2 472,640 198,015 145,070 29,850 a 23,095 a 41.9 472,640 196,899 136,792 c 37,012 23,095 41.7
3 482,230 249,389 172,889 61,599 14,901 51.7 482,230 251,193 169,335 66,957 14,901 52.1
4 263,590 120,541 52,228 44,697 a 23,616 a 45.7 263,590 128,055 52,802 51,637 23,616 48.6
5 239,660 95,071 23,412 42,175 29,484 39.7 239,660 116,288 20,496 c 66,308 29,484 48.5
6 197,250 76,988 52,235 19,254 a 5,499 a 39.0 197,250 75,141 52,216 17,426 c 5,499 38.1
7 and 8 135,120 75,331 20,815 47,511 7,005 55.8 135,120 72,653 21,818 43,830 c 7,005 53.8
9 76,500 33,432 15,162 16,298 a 1,972 a 43.7 76,500 35,136 15,162 18,002 1,972 45.9
10 108,140 38,641 17,757 18,120 2,764 35.7 108,140 39,408 20,696 15,948 2,764 36.4
11 301,860 112,180 59,029 42,337 10,814 37.2 249,990 82,972 52,501 20,395 10,076 33.2
12 310,220 65,617 31,365 32,759 1,493 21.2 205,790 54,841 39,149 13,686 2,006 26.7
13 162,300 36,873 14,891 18,666 3,316 22.7 162,300 27,550 8,453 15,781c 3,316 23.1
ARMM - - - - - - 156,300 24,083 18,412 5,446 225 9.0 a - As of December 31, 1997.
b Includes CY 1999 newly developed areas. c Decreases are due to some areas are converted to residential, commercial and industrial areas. d Data of private irrigation Systems are based on CY 1998 inventory. Source: NIA

TABLE 3.10c. STATUS OF IRRIGATION DEVELOPMENT BY REGION As of December 31, 2000 (area in hectares)
Service Area Region Potential
Irrigable Area Total National Communal Private a
Irrigation Development (in percent)
Philippines 3,126,340 1,361,454 685,812 501,442 174,200 44.55
CAR 99,650 72,921 17,55 32,458 22,912 73.18 1 277,180 174,024 55,872 90,823 27,329 62.78 2 472,640 197,841 136,792 37,954 23,095 41.86 3 482,230 254,195 171,783 67,511 14,901 52.71 4 263,590 129,692 52,935 53,141 23,616 49.20 5 239,660 117,048 20,496 67,068 29,484 48.84 6 197,250 75,419 52,216 17,704 5,499 38.24 7 50,740 26,428 5,823 18,066 2,539 52.09 8 84,380 46,814 15,995 26,353 4,466 55.48 9 76,500 35,238 15,162 18,104 1,972 46.06
10 108,140 39,716 20,696 16,256 2,764 36.73 11 249,990 83,325 52,501 20,748 10,076 33.33 12 205,790 55,038 39,149 13,883 2,006 26.74 13 162,300 37,949 18,727 15,906 3,316 23.38
ARMM 156,300 15,806 10,114 5,467 225 10.11 Data of private irrigation Systems are based on CY 1998 inventory. Source: NIA

TABLE 3.10d. STATUS OF IRRIGATION DEVELOPMENT BY REGION
2001 and 2002 (area in hectares)
2001 2002a
Service Area Service Area
Region Potential Irrigable
Area Total National Communal Private a
Irrigation Development (in percent)
Potential Irrigable
Area Total National Communal Private
Irrigation Development (in percent)
Philippines 3,126,340 1,373,627 689,010 510,417 174,200 43.90 43.90 1,387,236 689,113 523,923 174,200 44.40
CAR 99,650 73,215 17,551 32,752 22,912 73.50 73.50 73,343 17,551 32,880 22,912 73.60
1 277,180 174,963 55,872 91,762 27,329 63.10 63.10 176,933 55,872 93,732 27,329 63.90 2 472,640 198,524 136,792 38,637 23,095 42.00 42.00 199,909 136,792 40,022 23,095 42.30 3 482,230 253,663 169,335 69,427 14,901 52.60 52.60 254,791 169,335 70,555 14,901 52.80 4 263,590 130,748 52,706 54,426 23,616 49.60 49.60 132,068 52,706 55,746 23,616 50.10 5 239,660 117,699 20,496 67,719 29,484 49.10 49.10 118,541 20,496 68,561 29,484 49.50 6 197,250 75,507 52,216 17,792 5,499 38.30 38.30 75,766 52,216 18,051 5,499 38.40 7 50,740 25,875 4,973 18,363 2,539 51.00 51.00 27,318 5,512 19,267 2,539 53.80 8 84,380 48,585 16,672 27,447 4,466 57.60 57.60 49,618 16,236b 28,916 4,466 58.80
9 76,500 35,271 15,162 18,137 1,972 46.10 46.10 35,910 15,162 18,776 1,972 46.90 10 108,140 39,845 20,696 16,385 2,764 36.87 36.87 40,598 20,696 17,138 2,764 37.50 11 249,990 83,822 52,486 21,260 10,076 33.50 33.50 85,321 52,486 22,759 10,076 34.10 12 205,790 55,813 39,576 14,231 2,006 27.10 27.10 56,009 39,576 14,427 2,006 27.20
Caraga 162,300 38,436 18,412 16,708 3,316 23.70 23.70 39,167 18,412 17,439 3,316 24.10 ARMM 156,300 21,661 16,065 5,371 225 13.9 13.9 21,94416,065 5,654 225 14.00
a Data of private irrigation Systems are based on CY 1998 inventory. b Firmed-up Service Area Source: NIA.

TABLE 3.11. NUMBER OF PORTS BY REGION (as of December 1999)
Region Total Fishing Feeder Commercial
Private Public Operational
Non- Operational
NCR 71 3 - 64 4 66 5Region I 45 19 6 9 11 40 5Region II 40 24 7 4 5 35 5Region III 60 18 4 28 10 51 9Region IV 278 81 61 60 76 250 28Region V 119 61 7 20 31 109 10Region VI 152 49 11 68 24 152 -Region VII 180 44 20 73 43 162 18Region VIII 150 40 26 43 41 136 14Region IX 84 21 5 22 36 81 3Region X 68 21 2 27 18 63 5Region XI 105 18 6 61 20 97 8Region XII 40 10 - 22 8 38 2Region XIII 153 35 56 32 30 132 21ARMM 47 18 13 6 10 47 - Total 1,592 462 224 539 367 1,459 133
Source of Basic Data: PPA, PFDA, DOTC - Project Management Office for Ports Project (DOTC-PMO Ports) and the DPWH
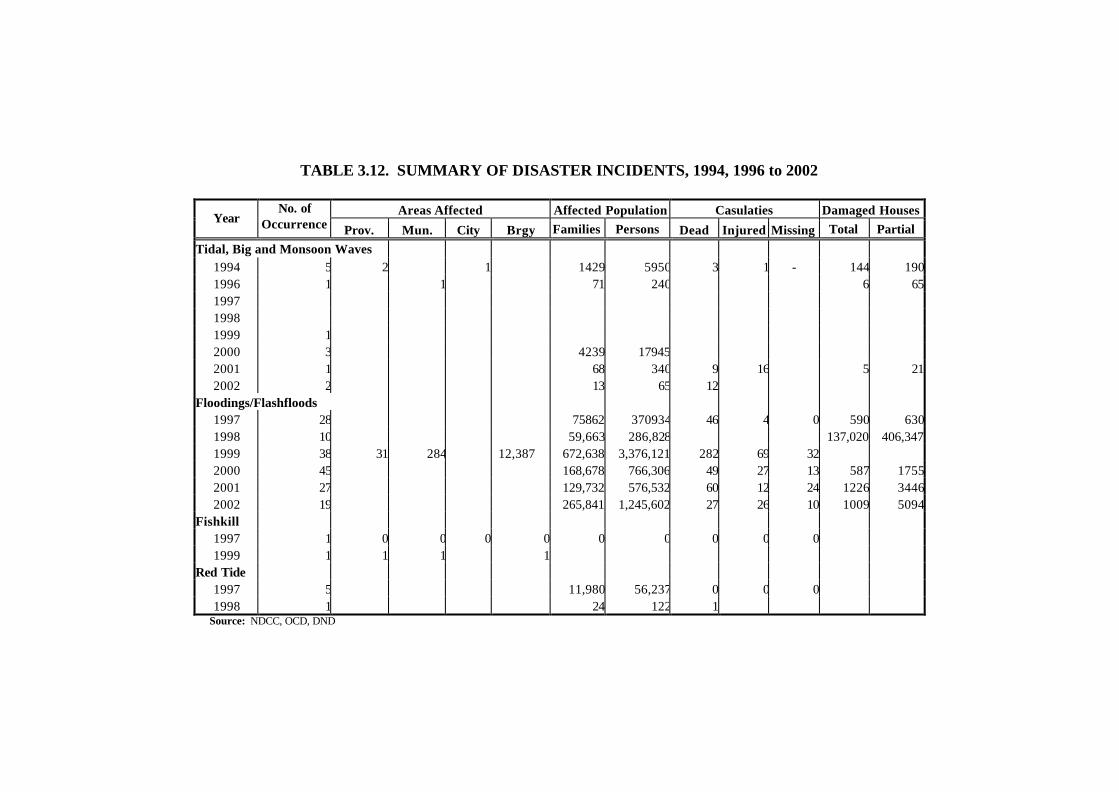
TABLE 3.12. SUMMARY OF DISASTER INCIDENTS, 1994, 1996 to 2002
Areas Affected Affected Population Casulaties Damaged Houses
Year No. of
Occurrence Prov. Mun. City Brgy Families Persons Dead Injured Missing Total Partial
Tidal, Big and Monsoon Waves 1994 5 2 1 1429 5950 3 1 - 144 1901996 1 1 71 240 6 651997 1998 1999 1 2000 3 4239 17945 2001 1 68 340 9 16 5 212002 2 13 65 12
Floodings/Flashfloods 1997 28 75862 370934 46 4 0 590 6301998 10 59,663 286,828 137,020 406,3471999 38 31 284 12,387 672,638 3,376,121 282 69 322000 45 168,678 766,306 49 27 13 587 17552001 27 129,732 576,532 60 12 24 1226 34462002 19 265,841 1,245,602 27 26 10 1009 5094
Fishkill 1997 1 0 0 0 0 0 0 0 0 0 1999 1 1 1 1
Red Tide 1997 5 11,980 56,237 0 0 0 1998 1 24 122 1
Source: NDCC, OCD, DND
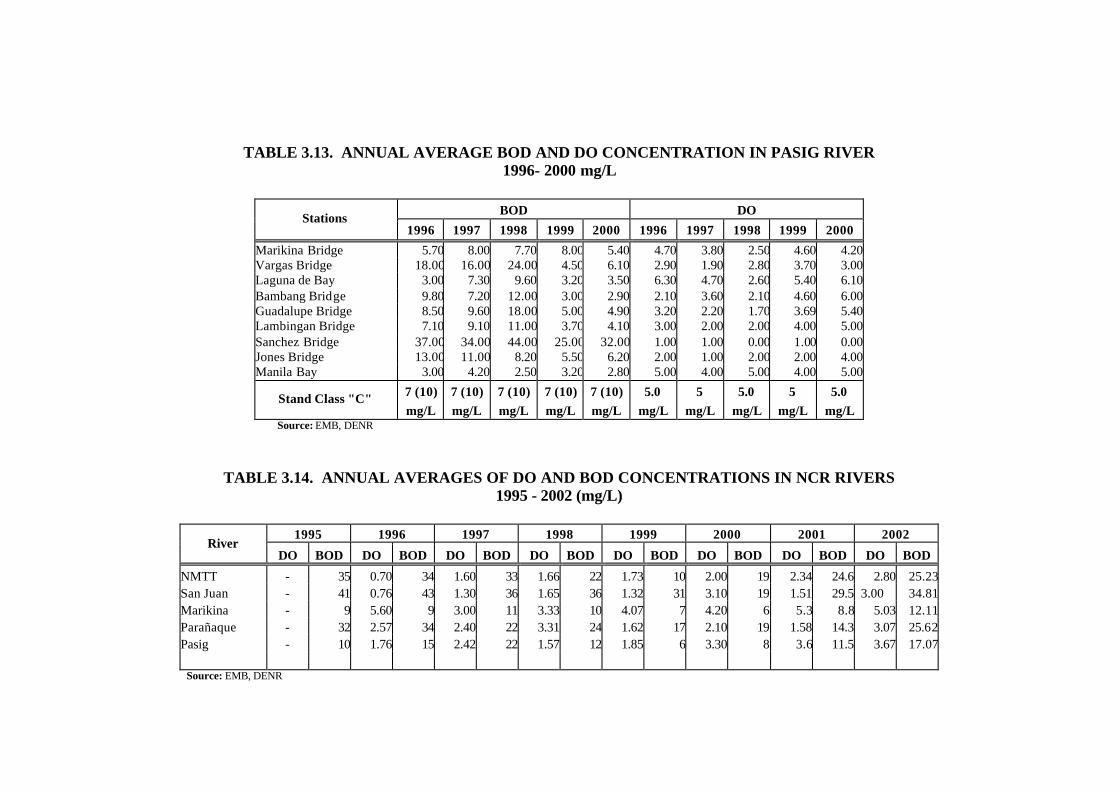
TABLE 3.13. ANNUAL AVERAGE BOD AND DO CONCENTRATION IN PASIG RIVER 1996- 2000 mg/L
BOD DO
Stations 1996 1997 1998 1999 2000 1996 1997 1998 1999 2000
Marikina Bridge 5.70 8.00 7.70 8.00 5.40 4.70 3.80 2.50 4.60 4.20Vargas Bridge 18.00 16.00 24.00 4.50 6.10 2.90 1.90 2.80 3.70 3.00Laguna de Bay 3.00 7.30 9.60 3.20 3.50 6.30 4.70 2.60 5.40 6.10Bambang Bridge 9.80 7.20 12.00 3.00 2.90 2.10 3.60 2.10 4.60 6.00Guadalupe Bridge 8.50 9.60 18.00 5.00 4.90 3.20 2.20 1.70 3.69 5.40Lambingan Bridge 7.10 9.10 11.00 3.70 4.10 3.00 2.00 2.00 4.00 5.00Sanchez Bridge 37.00 34.00 44.00 25.00 32.00 1.00 1.00 0.00 1.00 0.00Jones Bridge 13.00 11.00 8.20 5.50 6.20 2.00 1.00 2.00 2.00 4.00Manila Bay 3.00 4.20 2.50 3.20 2.80 5.00 4.00 5.00 4.00 5.00
7 (10) 7 (10) 7 (10) 7 (10) 7 (10) 5.0 5 5.0 5 5.0 Stand Class "C" mg/L mg/L mg/L mg/L mg/L mg/L mg/L mg/L mg/L mg/L
Source: EMB, DENR
TABLE 3.14. ANNUAL AVERAGES OF DO AND BOD CONCENTRATIONS IN NCR RIVERS 1995 - 2002 (mg/L)
1995 1996 1997 1998 1999 2000 2001 2002
River DO BOD DO BOD DO BOD DO BOD DO BOD DO BOD DO BOD DO BOD
NMTT - 35 0.70 34 1.60 33 1.66 22 1.73 10 2.00 19 2.34 24.6 2.80 25.23San Juan - 41 0.76 43 1.30 36 1.65 36 1.32 31 3.10 19 1.51 29.5 3.00 34.81Marikina - 9 5.60 9 3.00 11 3.33 10 4.07 7 4.20 6 5.3 8.8 5.03 12.11Parañaque - 32 2.57 34 2.40 22 3.31 24 1.62 17 2.10 19 1.58 14.3 3.07 25.62Pasig - 10 1.76 15 2.42 22 1.57 12 1.85 6 3.30 8 3.6 11.5 3.67 17.07
Source: EMB, DENR

TABLE 3.15. OCCURRENCE OF HARMFUL ALGAL BLOOMS (HABS)
IN THE PHILIPPINES, 1992 to 2002
Year Place of Occurrence Type of Harmful Algal Blooms
(HABs) 1992 Maqueda and Villareal Bays, Western Samar PSP (Pyrodinuium Blooms)
Manila Bay PSP (Pyrodinuium Blooms) Carigara Bay, Samar PSP (Pyrodinuium Blooms) Calbayog Waters, Western Samar PSP (Pyrodinuium Blooms) Masbate waters PSP (Pyrodinuium Blooms) Benoni Lagoon, Camiguin Island PSP (Pyrodinuium Blooms)
1993 Masinloc, Zambales PSP (Pyrodinuium Blooms) Manila Bay PSP (Pyrodinuium Blooms) Maqueda and Villareal Bays, Western Samar PSP (Pyrodinuium Blooms) Carigara Bay, Samar PSP (Pyrodinuium Blooms) Benoni Lagoon, Camiguin Island PSP (Pyrodinuium Blooms)
1994 Cancabato Bay, Tacloban City PSP (Pyrodinuium Blooms) Manila Bay PSP (Pyrodinuium Blooms) Dumanquillas Bay, Zamboanga del Sur PSP (Pyrodinuium Blooms) Juag Lagoon, Matnog, Sorsogon PSP (Pyrodinuium Blooms) Masbate Waters PSP (Pyrodinuium Blooms) Masinloc Waters PSP (Pyrodinuium Blooms) Carigara Bay PSP (Pyrodinuium Blooms) Benoni Lagoon, Camiguin Island PSP (Pyrodinuium Blooms)
1995 Asid Gulf, Masbate PSP (Pyrodinuium Blooms) Manila Bay PSP (Pyrodinuium Blooms) Ticao Pass, Masbate PSP (Pyrodinuium Blooms) Benoni Lagoon, Camiguin Island PSP (Pyrodinuium Blooms) Masinloc, Zambales PSP (Pyrodinuium Blooms) Juag Lagoon, Matnog, Sorsogon PSP (Pyrodinuium Blooms) Cancabato Bay, Tacloban City PSP (Pyrodinuium Blooms) Calbayog Waters, Western Samar PSP (Pyrodinuium Blooms) Carigara Bay PSP (Pyrodinuium Blooms) Dumanquillas Bay, Zamboanga del Sur PSP (Pyrodinuium Blooms)

TABLE 3.15. (continued)…..
Year Place of Occurrence Type of Harmful Algal Blooms
(HABs) 1996 Sibuguey, Bay PSP (Pyrodinuium Blooms)
Manila Bay PSP (Pyrodinuium Blooms) Dumanquillas Bay, Zamboanga del Sur PSP (Pyrodinuium Blooms) Benoni Lagoon, Camiguin Island PSP (Pyrodinuium Blooms) Masinloc, Zambales PSP (Pyrodinuium Blooms) Juag Lagoon, Matnog, Sorsogon PSP (Pyrodinuium Blooms) Cancabato Bay, Tacloban City PSP (Pyrodinuium Blooms) Calbayog Waters, Western Samar PSP (Pyrodinuium Blooms) Banago and Victorias, Negros Occidental PSP (Pyrodinuium Blooms) Pujada and Balite Bay PSP (Pyrodinuium Blooms)
1997 Dumanquillas Bay, Zamboanga del Sur PSP (Pyrodinuium Blooms) Sibuguey, Bay PSP (Pyrodinuium Blooms) Illana Bay PSP (Pyrodinuium Blooms) Lianga Bay, Surigao del Sur PSP (Pyrodinuium Blooms) Masinloc, Zambales PSP (Pyrodinuium Blooms) Juag Lagoon, Matnog, Sorsogon PSP (Pyrodinuium Blooms) Asid Gulf, Masbate PSP (Pyrodinuium Blooms) Cancabato Bay, Tacloban City PSP (Pyrodinuium Blooms) Pujada and Balite Bay PSP (Pyrodinuium Blooms)
1998 Manila Bay PSP (Pyrodinuium Blooms) Taytay, Palawan PSP (Pyrodinuium Blooms) Zamboanga del Sur PSP (Pyrodinuium Blooms) Lianga Bay, Surigao del Sur PSP (Pyrodinuium Blooms) Calbayog Waters, Western Samar PSP (Pyrodinuium Blooms) Pujada and Balite Bay, Mati, Davao PSP (Pyrodinuium Blooms) Tinagong Dagat, Capiz PSP (Pyrodinuium Blooms) Juag Lagoon, Matnog, Sorsogon PSP (Pyrodinuium Blooms) Cancabato Bay, Tacloban City PSP (Pyrodinuium Blooms) Asid Gulf, Masbate PSP (Pyrodinuium Blooms)

TABLE 3.15. (continued)…..
Year Place of Occurrence Type of Harmful Algal Blooms
(HABs) 1999 Masinloc, Zambales PSP (Pyrodinuium Blooms)
Sibuguey, Bay PSP (Pyrodinuium Blooms) Illana Bay PSP (Pyrodinuium Blooms) Dumanquillas Bay, Zamboanga del Sur PSP (Pyrodinuium Blooms) Mandaon and Milagros, Masbate PSP (Pyrodinuium Blooms) Cancabato Bay, Tacloban City PSP (Pyrodinuium Blooms) Lianga Bay, Surigao del Sur PSP (Pyrodinuium Blooms) Sorsogon Bay PSP (Pyrodinuium Blooms) Malampaya Sound, Palawan PSP (Pyrodinuium Blooms) Bataan, Manila Bay PSP (Pyrodinuium Blooms)
2000 Masinloc, Zambales PSP (Pyrodinuium Blooms) Mandaon, Masbate PSP (Pyrodinuium Blooms) Dumanquillas Bay, Zamboanga del Sur PSP (Pyrodinuium Blooms) Sibuguey, Bay PSP (Pyrodinuium Blooms) Illana Bay PSP (Pyrodinuium Blooms) Cancabato Bay, Tacloban City PSP (Pyrodinuium Blooms)
2001 Illana and Sibuguey Bay PSP (Pyrodinuium Blooms) Dumanquillas Bay, Zamboanga del Sur PSP (Pyrodinuium Blooms) Mandaon and Milagros, Masbate PSP (Pyrodinuium Blooms) Honda Bay, Palawan PSP (Pyrodinuium Blooms) Juag Lagoon, Matnog, Sorsogon PSP (Pyrodinuium Blooms)
2002 Bolinao, Pangasinan Fish Kill (Prorocentrum minimum) Bais Bay, Dumaguete PSP (Pyrodinuium Blooms) Cancabato and San Pedro Bays PSP (Pyrodinuium Blooms) Masinloc Bay PSP (Pyrodinuium Blooms) Mandaon and Milagros, Masbate PSP (Pyrodinuium Blooms) Honda Bay, Palawan PSP (Pyrodinuium Blooms) Juag Lagoon, Matnog, Sorsogon PSP (Pyrodinuium Blooms)
Source: Marine Biotoxins Monitoring Unit Fisheries Resources Management Division BFAR, DA

TABLE 3.16a. REPORTED CASES OF NOTIFIABLE DISEASES - TYPHOID & PARATYPHOID FEVER AND OTHER SALMONELLA INF. 1994 – 1998, 2000 (no. and rate/100,000 pop.)
1994 1995 1996 1997 1998 2000
AREA NO. RATE NO. RATE NO. RATE NO. RATE NO. RATE NO. RATE
Philippines 2,308 25.9 21,011 33.0 12,815 18.3 12,435 17.7 15,507 21.2 13,034 17.1NCR 173 1.9 1,020 11.9 1,769 18.1 1,075 10.6 1,827 17.4 656 6.3CAR 25 1.9 1,549 123.4 783 61.3 473 36.4 2,174 71.4 1,111 79.2Region 1 44 1.1 847 27.6 561 14.6 268 6.9 565 14.30 484 11.7Region 2 20 0.8 561 34.2 285 11.1 210 8.0 1 49.9 1,040 37.2Region 3 1.9 2.0 517 7.7 491 9.2 322 5.4 794 10.8 981 12.7Region 4 76 0.8 1,036 10.9 808 7.8 1,340 13.3 1,540 13.9 1,558 13.8Aurora 0 0.0. 11 6.9 0 - 0 - 0 - Region 5 614 14.0 1,117 29.9 292 6.6 955 19.0 351 7.7 769 16.2Region 6 52 0.9 2,969 56.7 2,447 42.8 2,281 38.5 3,028 50.4 2,504 39.6Region 7 135 2.6 1,486 32.0 1,628 31.9 1,078 20.8 510 9.7 427 7.7Region 8 51 1.5 2,132 63.3 692 20.1 587 16.8 809 26.3 1,189 31.7Region 9 66 2.3 893 32.0 696 24.3 926 31.6 939 31.2 564 17.9Region 10 1,443 36.9 860 33.8 649 25.0 811 30.5 77 2.8Region 11 152 3.0 2,119 41.40 350 7.4 911 18.8 99 2.0 297 5.7Region 12 69 3.0 1,645 69.1 890 36.7 1,162 46.6 1,637 64.5 715 26.9ARMM 77 3.7 1,677 94.7 114 7.7 132 6.3 82 3.8 486 22.2Caraga 149 7.5 166 8.2 226 71.4 176 8.1
Note: For 1996 data on Mandaluyong City is included in District 3 Data on Pasig City is included in District 2
1996 Data on Sagay City is included in Negros Occidental 2000 data Source: Philippine Health Statistics 1994, 1995 and 1996
Field Health Service Information System, 1997 and 1998 2000 data taken from DOH Website
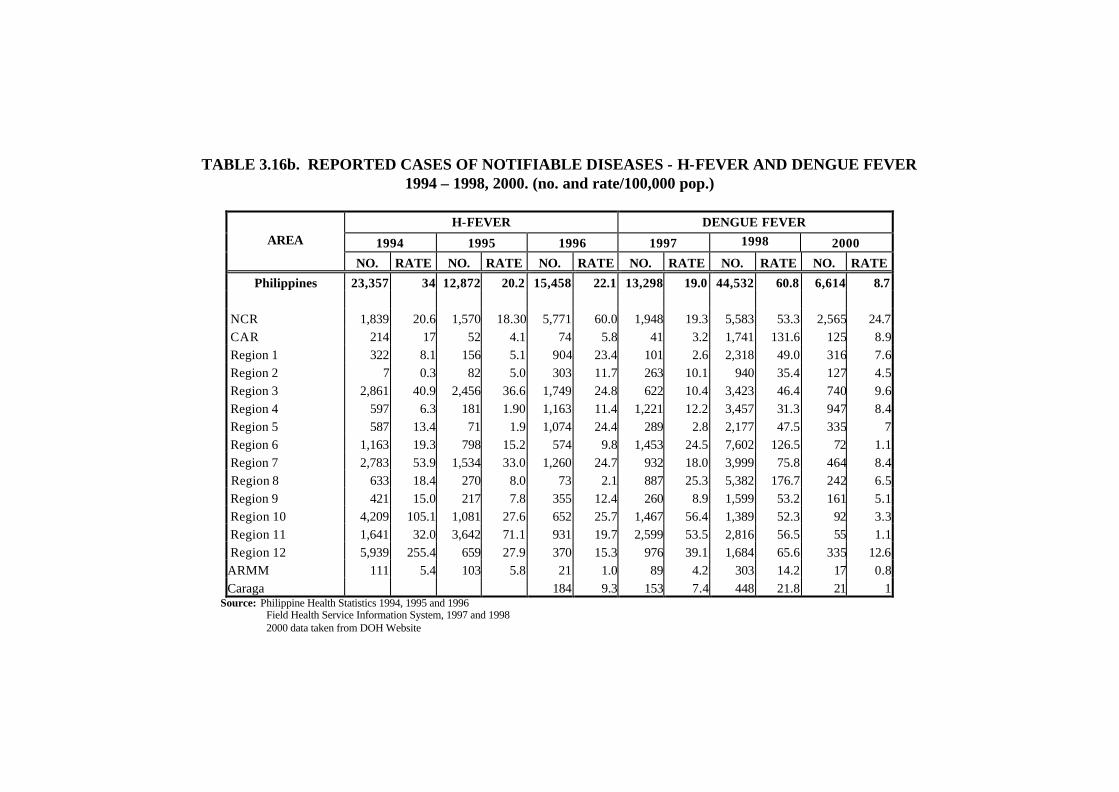
TABLE 3.16b. REPORTED CASES OF NOTIFIABLE DISEASES - H-FEVER AND DENGUE FEVER 1994 – 1998, 2000. (no. and rate/100,000 pop.)
H-FEVER DENGUE FEVER
1994 1995 1996 1997 1998 2000 AREA
NO. RATE NO. RATE NO. RATE NO. RATE NO. RATE NO. RATE
Philippines 23,357 34 12,872 20.2 15,458 22.1 13,298 19.0 44,532 60.8 6,614 8.7
NCR 1,839 20.6 1,570 18.30 5,771 60.0 1,948 19.3 5,583 53.3 2,565 24.7 CAR 214 17 52 4.1 74 5.8 41 3.2 1,741 131.6 125 8.9 Region 1 322 8.1 156 5.1 904 23.4 101 2.6 2,318 49.0 316 7.6 Region 2 7 0.3 82 5.0 303 11.7 263 10.1 940 35.4 127 4.5 Region 3 2,861 40.9 2,456 36.6 1,749 24.8 622 10.4 3,423 46.4 740 9.6 Region 4 597 6.3 181 1.90 1,163 11.4 1,221 12.2 3,457 31.3 947 8.4 Region 5 587 13.4 71 1.9 1,074 24.4 289 2.8 2,177 47.5 335 7 Region 6 1,163 19.3 798 15.2 574 9.8 1,453 24.5 7,602 126.5 72 1.1 Region 7 2,783 53.9 1,534 33.0 1,260 24.7 932 18.0 3,999 75.8 464 8.4 Region 8 633 18.4 270 8.0 73 2.1 887 25.3 5,382 176.7 242 6.5 Region 9 421 15.0 217 7.8 355 12.4 260 8.9 1,599 53.2 161 5.1 Region 10 4,209 105.1 1,081 27.6 652 25.7 1,467 56.4 1,389 52.3 92 3.3 Region 11 1,641 32.0 3,642 71.1 931 19.7 2,599 53.5 2,816 56.5 55 1.1 Region 12 5,939 255.4 659 27.9 370 15.3 976 39.1 1,684 65.6 335 12.6 ARMM 111 5.4 103 5.8 21 1.0 89 4.2 303 14.2 17 0.8 Caraga 184 9.3 153 7.4 448 21.8 21 1
Source: Philippine Health Statistics 1994, 1995 and 1996 Field Health Service Information System, 1997 and 1998 2000 data taken from DOH Website

TABLE 3.16c. REPORTED CASES OF NOTIFIABLE DISEASES - MALARIA
1994 – 1998, 2000, (no. and rate/100,000 pop.)
1994 1995 1996 1997 1998 2000 AREA NO. RATE NO. RATE NO. RATE NO. RATE NO. RATE NO. RATE
Philippines 58,615 85.4 56,285 88.5 68,055 100.4 69,248 98.8 70,859 96.8 50,869 66.6 NCR 373 4.2 1,306 15.3 27 0.3 22 0 29 0.3 12 0.1 CAR 7457 574.7 5,546 442.0 10,522 824.0 12,728 979.3 15,564 1,176.5 4,772 340 Region 1 432 10.9 331 10.8 62 1.6 24 0.6 20 0.5 179 4.3 Region 2 10,418 393.2 3,407 207.6 4,238 164.6 4,412 168.8 4,816 181.4 1,220 43.6 Region 3 1,801 25.5 844 12.6 580 10.9 441 7.4 876 11.9 116 1.5 Region 4 8080 85.5 12,835 135.6 24,511 238.1 22,800 227.1 15,075 136.3 24,628 217.5 Region 5 23411 100.4 2,352 63.0 613 13.9 74 1.6 417 9.1 76 1.6 Region 6 132 2.2 71 1.4 19 0.3 10 0.2 3 0.05 2 0.03 Region 7 373 7.2 121 2.6 52 1.0 30 1 19 0.4 5 0.1 Region 8 38 1.1 27 0.8 0 - 4 0.3 0 - - - Region 9 3729 132.5 1,329 47.6 709 24.8 959 32.7 812 27.0 193 6.1 Region 10 6807 169.9 3,230 82.6 917 36.1 400 15.4 989 37.2 281 10.1 Region 11 9981 194.7 10,330 201.8 4,359 92.2 8,671 178.6 7,689 154.2 1,439 27.5 Region 12 3445 148.2 147 6.2 2,764 113.9 920 36.9 879 34.2 550 20.7 ARMM 1150 56.0 15,578 880.0 13,296 902.6 9,972 475.9 17,607 825.3 13,307 608.5 Caraga 5,380 271.9 7,781 385.9 6,064 295.2 4,089 187.2 Source: Philippine Health Statistics 1994, 1995 and 1996
Field Health Service Information System, 1997 and 1998 2000 data taken from DOH Website

TABLE 3.16d. REPORTED CASES OF NOTIFIABLE DISEASES - SCHISTOSOMIASIS
1994 – 1998, 2000, (no. and rate/100,000 pop.)
1994 1995 1996 1997 1998 2000 AREA
NO. RATE NO. RATE NO. RATE NO. RATE NO. RATE NO. RATE
Philippines 12,689 18.5 8,795 13.8 9,096 13.4 12,524 17.9 10,986 15.0 4,240 5.6
NCR 129 1.4 84 1.0 1 0.01 0 - 1 0.01 - - CAR 0 0.0 0 0.0 0 - 0 - 0 - - - Region 1 61 1.5 40 1.3 0 - 0 - 0 - 1 0.02 Region 2 2 0.1 1 0.1 0 0 0 - 0 - - - Region 3 7 0.1 13 0.1 0 0 0 - 0 - - - Region 4 26 2.40 0 0.0 0 - 0 - 0 - 1 0.01 Region 5 69 1.6 0 0.0 71 1.6 0 - 0 - 155 3.3 Region 6 15 0.2 109 2.1 0 - 0 - 0 - - - Region 7 50 0.0 0 0.0 1 0.02 9 0.2 14 0.3 19 0.3 Region 8 2,848 82.6 1,225 36.4 1,044 30.4 2332 66.6 1079 35.1 608 16.2 Region 9 468 16.6 0 0.0 240 8.4 367 12.5 551 18.3 1,556 49.3 Region 10 3,044 76.0 1,189 0.0 399 15.7 606 23.3 392 14.7 88 3.2 Region 11 5,938 115.8 6,140 119.9 2,392 50.6 5274 108.6 4040 81.0 281 5.4 Region 12 30 1.3 2 0.1 2,333 96.1 1853 74.2 1775 69.1 241 9.1ARMM 2 0.1 0 0.0 616 41.8 10 0.5 1040 48.7 200 9.1Caraga 1,972 99.7 2073 102.8 2094 101.9 1,090 49.9
Source: Philippine Health Statistics 1994, 1995 and 1996 Field Health Service Information System, 1997 and 1998 2000 data taken from DOH Website
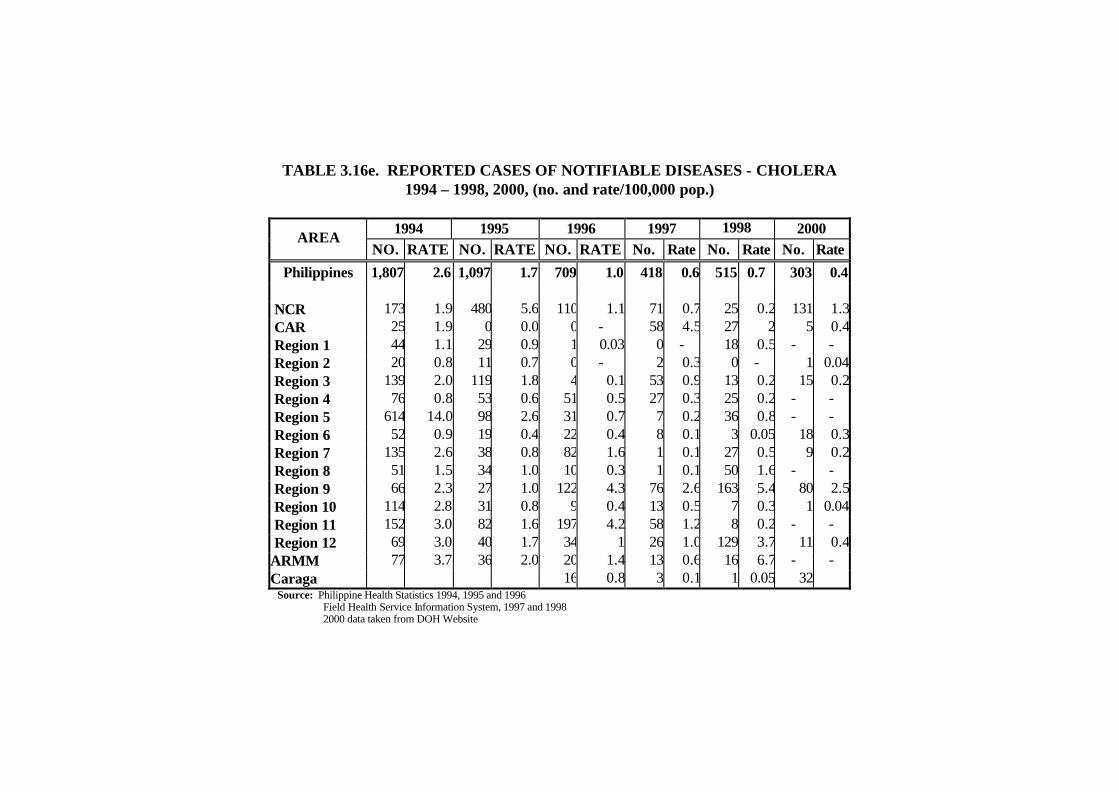
TABLE 3.16e. REPORTED CASES OF NOTIFIABLE DISEASES - CHOLERA
1994 – 1998, 2000, (no. and rate/100,000 pop.)
1994 1995 1996 1997 1998 2000 AREA NO. RATE NO. RATE NO. RATE No. Rate No. Rate No. Rate
Philippines 1,807 2.6 1,097 1.7 709 1.0 418 0.6 515 0.7 303 0.4
NCR 173 1.9 480 5.6 110 1.1 71 0.7 25 0.2 131 1.3 CAR 25 1.9 0 0.0 0 - 58 4.5 27 2 5 0.4 Region 1 44 1.1 29 0.9 1 0.03 0 - 18 0.5 - - Region 2 20 0.8 11 0.7 0 - 2 0.3 0 - 1 0.04 Region 3 139 2.0 119 1.8 4 0.1 53 0.9 13 0.2 15 0.2 Region 4 76 0.8 53 0.6 51 0.5 27 0.3 25 0.2 - - Region 5 614 14.0 98 2.6 31 0.7 7 0.2 36 0.8 - - Region 6 52 0.9 19 0.4 22 0.4 8 0.1 3 0.05 18 0.3 Region 7 135 2.6 38 0.8 82 1.6 1 0.1 27 0.5 9 0.2 Region 8 51 1.5 34 1.0 10 0.3 1 0.1 50 1.6 - - Region 9 66 2.3 27 1.0 122 4.3 76 2.6 163 5.4 80 2.5 Region 10 114 2.8 31 0.8 9 0.4 13 0.5 7 0.3 1 0.04 Region 11 152 3.0 82 1.6 197 4.2 58 1.2 8 0.2 - - Region 12 69 3.0 40 1.7 34 1 26 1.0 129 3.7 11 0.4ARMM 77 3.7 36 2.0 20 1.4 13 0.6 16 6.7 - - Caraga 16 0.8 3 0.1 1 0.05 32
Source: Philippine Health Statistics 1994, 1995 and 1996 Field Health Service Information System, 1997 and 1998 2000 data taken from DOH Website

TABLE 3.17. WATER RIGHTS FOR INDUSTRIAL CONSUMPTION GRANTED BY NATIONAL WATER RESOURCES BOARD
(NWRB), 1992 to 2002
1992 1993 1994 1995 1996 1997** 1998 1999 2000 2001 2002 Region
GW SW Total GW SW Total GW SW Total GW SW Total GW SW Total GW SW Total GW SW Total GW SW Total GW SW Total GW SW Total GW SW Total
Region I 582 1,645 2,227 617 1,645 2,262 617 1,645 2,262 617 1,645 2,262 647 1,645 2,292 - 10.00 10.00 - 30.00 30.00 3.27 - 3.27 - - - - - - - - -
Region II 366 489 855 377 489 866 498 489 987 498 489 987 498 489 987 - - - - - - 6.71 - 6.71 - - - 0.25 - 0.25 26.81 - 26.81
Region III 1,226 4,045 5,271 1,255 4,045 5,300 1,255 4,045 5,300 1,263 4,045 5,308 1,466 4,045 5,511 86.63 500.00 586.63 63.57 56,315.60 56,379.17 92.63 - 92.63 134.31 - 134.31 43.88 - 43.88 158.98 - 158.98
Region IV 1,132 7,810 8,942 1,142 7,813 8,955 1,157 7,813 8,970 2,897 13,053 15,950 3,463 13,093 16,556 224.47 - 224.47 261.44 46,296.00 46,557.44 715.78 17,761.81 18,477.59 263.69 - 263.69 9,385.07 - 9,385.07 314.73 126.75 441.48
Region V 172 444 616 172 444 616 172 444 616 172 503 675 172 562 734 - 0.21 0.21 - - - - - - 1.70 - 1.70 - - - 9.04 - 9.04
Region VI 833 16,452 17,285 852 16,452 17,304 881 16,602 17,483 881 16,605 17,486 899 16,725 17,624 30.90 - 30.90 146.65 - 146.65 - - - - - - 8.57 - 8.57 62.44 - 62.44
Region VII 1,225 2,016 3,241 1,249 2,016 3,265 1,407 2,442 3,849 1,418 2,476 3,894 1,430 2,511 3,941 291.87 23.57 315.44 116.39 12.00 128.39 4.22 21.61 25.83 7.60 - 7.60 53.93 - 53.93 42.05 - 42.05
Region VIII 382 348 730 382 348 730 382 348 730 382 348 730 389 365 754 - - - - - - - - - 1.70 - 1.70 - - - - - -
Region IX 17 134 151 17 134 151 22 135 157 22 135 157 22 135 157 - 0.90 0.90 - 55.25 55.25 5.05 - 5.05 - - - 3.35 - 3.35 28.35 - 28.35
Region X 2 6,408 6,410 2 6,408 6,410 93 6,456 6,549 93 6,456 6,549 102 6,456 6,558 3.16 1,025.00 1,028.16 - - - - - - 10,815.00 - 10,815.00 - - - 45.08 - 45.08
Region XI 13 5,182 5,195 13 5,740 5,753 64 6,567 6,631 94 6,567 6,661 220 6,567 6,787 - - - - 1,262.00 1,262.00 0.93 - 0.93 - - - 13.30 - 13.30 1.57 - 1.57
Region XII 0 2,819 2,819 0 2,819 2,819 0 2,819 2,819 0 2,824 2,824 63 3,965 4,028 - - - - 17.20 17.20 - - - - - - - - - 114.04 - 114.04
NCR 12.58 - 12.58 - 7.22 7.22 10.59 15.59 26.18 - - - 65.46 - 65.46 75.92 - 75.92
Philippines 5,950 47,792 53,742 6,078 48,353 54,431 6,548 49,805 56,353 8,337 55,146 63,483 9,371 56,558 65,929 649.60 1,559.68 2,209.28 588.05 103,995.27 104,583.32 839.18 17,799.01 18,638.19 36,437.20 36,437.20 9,573.81 9,573.81 879.00 126.75 1,005.75
Note: GW – groundwater SW - surface water 1992 to 1996 in cubic meters 1997 to 2002 in liters per second
Source: NWRB

TABLE 3.18a. WATER RIGHTS GRANTED BY THE NATIONAL WATER RESOURCES BOARD (NWRB)
1997, in lps
DOMESTIC IRRIGATION POWER INDUS TRIAL COMMERCIAL LIVESTOCK RECREATION FISHERIES REGION
GW SW GW SW GW SW GW SW GW SW GW SW GW SW GW SW
Region I 4,722.80 1,160.20 1,968.30 102,325.60 - 146,881.10 227.10 1,775.30 6.70 - 0.10 - 0.80 - 0.10 6.60
Region II 456.10 67.20 586.10 15,555.00 - 583,726.20 1,108.90 - - 2.50 0.90 2.50 5.00 - 295.60
Region III 3,216.70 13,917.10 6,423.40 366,389.50 - 191,243.00 1,377.60 18,722.60 1 31.7 8.10 - 11.70 24.00 149.70 171.30
Region IV 6,643.60 6,643.60 2,492.30 191,262.80 579.00 508,276.90 2,534.30 9,765.70 128 - 81.30 41.60 230.60 1,519.40 77.10 861.10
Region V 90,326.10 3,417.70 2,722.70 85,619.00 - 18,257.80 52.30 588.80 0.2 15 - - 900.90 1,254.10 4.10 191.20
Region VI 87.40 2,016.40 2,059.60 269,034.00 - 22,350.70 1,228.10 16,458.80 64.4 - 7.00 - 2.00 - 462.40 4,198.30
Region VII 65.70 2,907.10 2,162.80 59,665.70 - 38,615.50 1,439.00 2,462.80 24.2 - 2.30 - 106.00 1,141.00 485.90 3,153.80
Region VIII 748.10 296.90 410.80 85,661.00 - 2,913.00 687.40 363.30 14.7 - - - 5.00 - - 55.60
Region IX 25.70 465.60 164.20 36,289.30 113.00 4,512.00 41.30 134.90 - - 66.00 - 0.50 - 1.00 3,757.10
Region X 3,623.20 769.80 984.00 70,451.30 - 103,087.70 150.50 2,398.80 946 - 0.10 - 26.90 7.00 - 235.30
Region XI 226.40 2,067.90 1,951.50 18,070.10 - 48,700.00 256.80 6,244.00 - - 4.60 - - - 262.80 589.60
Region XII 1,377.10 1,298.90 2,819.20 237,990.10 - 1,223,941.00 115.90 4,146.50 9.9 - 3.70 - 13.50 - 17.60 756.10
NCR 3,326.30 - 73.10 - - 150000 1,064.80 - 22.9 - 1.00 - - 126.20 - 2.00
TOTAL 114,845.20 35,028.40 24,818.00 1,538,313.40 692 3,042,504.90 9,175.10 64,170.40 1,218.00 46.70 176.70 42.50 1,300.40 4,076.70 1,460.70 14,273.60Note: GW - groundwater
SW - surface water lps - liters per second
Source: NWRB

TABLE 3.18b. WATER RIGHTS GRANTED BY THE NATIONAL WATER RESOURCES BOARD (NWRB)
1998, in lps
Domestic Irrigation Commercial Industrial Power Livestock Fisheries Quarrying Recreation REGION GW SW GW SW GW SW GW SW GW SW GW SW GW SW GW SW GW SW
Region 1 117.251 203.99 84.590 1,621.76 - - - 30 - 12461.23 - - - - - - - -
Region 2 76.44 - 199.26 13,550.11 - - - - - 15473.19 - - - - - - - -
Region 3 121.334 6.1 170.568 90.73 231.815 - 63.57 56,315.60 - 260000 1.6420 - - - - - 44 -
Region 4 1,153.112 10 68.947 1,776.77 27.403 - 262.440 46,296.00 - 43000 - - - 7.79 - 2.6 100.54 -
Region 5 117.35 591.6 36.45 432.02 - - - - - - - - - - - - - -
Region 6 146.03 - 24 5,140.50 12.05 100 146.65 - - - - - - 20 - - 20 -
Region 7 40.625 1,267.120 63.21 845.68 87.162 - 116.39 12 - - - - - - - - - 30
Region 8 0.487 - 0.875 1,064.33 - - - - - - - - - - - - - -
Region 9 26.338 - - 601.68 - - - 55.15 - - - - - - - - - -
Region 10 - 2,380.00 - 5,838.13 - - - - - 1226 - - - - - - - -
Region 11 117.1 - 120.92 541.725 - - - 1262 - - - - - - - - - -
Region 12 - - 142.5 2,809.58 - - - 17.2 - 3535.8 - - - - - - 950 -
NCR 57.16 - - 0.5 1.5 - 7.22 - - - - - - - - - - -
Total 1,973.23 4,458.81 911.32 34,313.52 359.93 100.00 596.27 103,987.95 - 335,696.22 1.64 - - - - - 1,114.54 30Note: GW - groundwater
SW - surface water lps - liters per second
Source: NWRB

TABLE 3.18c. WATER RIGHTS GRANTED BY THE NATIONAL WATER RESOURCES BOARD (NWRB)
1999, in lps
Domestic Irrigation Commercial Industrial Power Livestock Fisheries Recreation REGION
GW SW GW SW GW SW GW SW GW SW GW SW GW SW GW SW
Region 1 64.8 0.35 7.404 307.837 173.9 - 3.27 - - - - - - - - -
Region 2 5.76 5.22 16.95 650.08 - - 6.71 - - - - - - - - -
Region 3 85.364 - 59.18 4920.71 51.74 - 92.63 - - - - - 18.3 12.96 - -
Region 4 320.785 - 193.13 2934.34 8.092 - 18356.408 17761.808 - 6116.25 1.883 - - - - -
Region 5 83.393 20.126 4.66 1400.3 - - - - - - - - - 19.86 - 6.44
Region 6 178.35 - 44.23 936.859 - - - - - - - - - - - -
Region 7 20.088 - 31.878 29 - - 25.83 21.613 - - - - - - - -
Region 8 6.34 - 2.25 649.89 - - - - - - - - - - - -
Region 9 21.39 - - 754.18 - - 5.05 - - - - - - - 13.32 -
Region 10 554.57 326.16 61.375 364.11 2.3 - - - - 37513 - - - - 115 -
Region 11 171.98 - 210.91 375.4 - - 0.927 - - - - - - - - -
Region 12 215.41 - 41.1 145.4 - - - - - - - - - - - 1.15
NCR 145.92 - - - 28.087 - 10.593 - - - - - - - 10 -
Total 1,874.15 351.86 673.07 13,468.11 264.120 - 18,501.418 17,783.421 - 43,629.250 1.883 - 18.300 32.820 138.320 7.590Note: GW - groundwater
SW - surface water lps - liters per second
Source: NWRB

TABLE 3.18d. WATER RIGHTS GRANTS BY NATIONAL WATER RESOURCES BOARD (NWRB)
2000, in lps
Domestic Irrigation Commercial Industrial Livestock Fisheries Recreation REGION
GW SW GW SW GW SW GW SW GW SW GW SW GW SW
Region 1 10.5 52.17 3.74 400.0520 5.22 - - - - - - - 1 -
Region 2 - - - 1541.61 - - - - - - - - - -
Region 3 332.76 - 0.84 387.26 12.4 - 134.31 - - - - - - -
Region 4 250.384 2.6 - 162.91 34.260 - 263.685 - 2.16 - 1.5 - 92.87 -
Region 5 123.62 251 - 173.25 0.25 - 1.7 - - - - - 7.5 3
Region 6 - - 7.5 - 0.26 - - - - - - 8.04 - -
Region 7 108.914 8.95 15 20 7.163 - 7.604 - - - - - - -
Region 8 49.8 160.59 - 2261.003 - - 1.7 - - - - - - -
Region 9 2.5 - 72 - - - - - - - - - - -
Region 10 28.5 - 147.49 1504.74 - - - 10,815.00 0.48 - - - 50 -
Region 11 172.14 - - 121.72 - - - - - - - - - -
Region 12 7.26 - - 121.72 0.263 - - - - - - - - -
NCR 209.732 - - - 32.978 - 15.68 - - - - - - -
1,296.11 475.31 246.57 6,694.27 92.79 - 424.679 10,815.000 2.64 - 1.50 8.04 151.37 3.00Note: GW - groundwater
SW - surface water lps - liters per second
Source: NWRB

TABLE 3.18e. WATER RIGHTS GRANTS BY NATIONAL WATER RESOURCES BOARD (NWRB)
2001, in lps
Domestic Irrigation Commercial Industrial Power Livestock Fisheries Recreation REGION
GW SW GW SW GW SW GW SW GW SW GW SW GW SW GW SW
Region 1 715.460 1889.96 31.25 103.09 4.38 - - - - - - - - - -
Region 2 16.628 3.11 - 198.45 0.25 - - - - - - - - -
Region 3 426.750 - 107.1 177.736 43.88 - - - - - - - 1 -
Region 4 190.987 - 44.92 1004.45 16.343 378.068 9002 - - 8.9 - - - 15.41 -
Region 5 49.360 75.05 0.567 239.91 0.55 - - - - - - - - 0.53 -
Region 6 48.260 - 2.063 2002.047 6.119 8.57 - - - 0.05 - - - - -
Region 7 55.408 - 16.5 68.4 16.106 53.93 - - - - - - - - -
Region 8 18.600 - - 3 - - - - - - - - - -
Region 9 10.000 - - - 0.290 3.35 - - - - - - - - -
Region 10 212.095 96.22 - 1092.31 - - - - - - - - 1.5 -
Region 11 35.590 - - 1268.18 13.3 - - - - - 3.7 - - -
Region 12 7.000 - - 45 - - - 12000 - - - - - -
NCR 38.492 - 2.73 - 19.21 65.464 - - - - - - - - -
1,824.630 2,064.340 205.130 6,202.573 62.998 0 566.812 9002 0 12000 8.95 0 3.7 0 18.44 0 Note: GW - groundwater
SW - surface water lps - liters per second
Source: NWRB

TABLE 3.18f. WATER RIGHTS GRANTS BY NATIONAL WATER RESOURCES BOARD (NWRB)
2002, in lps
Domestic Irrigation Commercial Industrial Power Livestock Municipal Fisheries Recreation Car Wash REGION
GW SW GW SW GW SW GW SW GW SW GW SW GW SW GW SW GW SW GW SW
Region 1 149.220 643.21 14.258 488.34 24.278 926.470 - - - - - 172 - - 9.2 - - - -
Region 2 6.437 - 11.97 1782.55 26.81 - - - 3.110 - 14 - - 2.31 - - - -
Region 3 223.301 0.87 - 1365 8.000 159.98 - - - - 75.47 - - - 16 - - -
Region 4 542.604 29 - 9.440 302.73 126.75 - 2200 1.360 - 61.3 - - 0.043 2.58 - - -
Region 5 211.220 - 1.145 198.35 0.290 9.04 - - - - 40.5 - - - 23.5 - - -
Region 6 60.850 - - 45.6 7.310 62.44 - - - - 57 - - - - - - -
Region 7 94.172 - 44.96 376.3 97.410 42.05 - - - - 2.88 - 1.26 2 - - - -
Region 8 1.000 - - 101.7 0.250 219.000 - - - - 36 124.5 - - 36 - 5.4 -
Region 9 7.640 - - 53.34 - - - - - - - - - - - -
Region 10 45.350 - - 1937.84 45.075 - - - - - - - - 9.085 - - -
Region 11 47.900 60 501.87 948.95 1.57 - - - - 14.4 - - 80 - - - -
Region 12 11.410 - 1,627.308 218.25 3.780 114.04 - - - 16.00 - - 174 - - - - - -
NCR 151.049 - 1.5 - 10.650 90.918 - - - 6.00 - - - - - - - - -
1,552.153 733.080 2,203.011 7,462.880 161.408 1,145.470 907.993 126.750 - 2,200.000 26.470 - 473.550 298.500 1.260 93.553 87.165 - 5.400 - Note: GW - groundwater
SW - surface water lps - liters per second
Source: NWRB

TABLE 3.19. PROJECTED WATER CONSUMPTION IN METRO MANILA, in million cubic meters
1995 to 2025
Year Domestic Commercial Industrial Sub-total Revenue Water Non-Revenue Water Total
1995 127 26 6 159 44% 56% 361
2000 148 30 7 185 50% 50% 370
2005 161 32 8 201 55% 45% 366
2010 173 35 9 217 60% 40% 362
2015 186 37 9 232 65% 35% 357
2020 196 39 10 245 70% 30% 350
2025 206 41 10 257 70% 30% 368 Note: Water consumption for the year 2000 to 2025 were projected on the basis of trend described in the Master Plan.
Non-Revenue Water Ratio was modified based on existing condition. Source: MWSS

TABLE 3.20. PROJECTED WATER CONSUMPTION BY WATER DISTRICTS IN SELECTED REGIONS, (in million cubic meters), 1990 to 2025
Group Item 1990 1995 2000 2005 2010 2015 2020 2025
1 Domestic Use 155 165 175 184 193 203 214 224 Commercial/Industrial/Institutional 33 34 35 37 39 41 43 45 Accounted-for water 188 199 210 221 232 244 257 269 Unaccounted-for water 73 98 90 86 77 69 64 67 Total 261 297 300 307 310 313 321 337 2 Domestic Use 135 143 150 158 166 174 183 192 Commercial/Industrial/Institutional 23 27 30 32 33 34 36 38 Accounted-for water 158 170 180 190 199 208 219 230 Unaccounted-for water 62 84 77 74 66 59 55 58 Total 220 254 257 263 265 267 274 288 3 Domestic Use 120 128 135 142 149 157 165 173 Commercial/Industrial/Institutional 19 23 24 27 29 31 33 35 Accounted-for water 139 151 159 169 178 188 198 208 Unaccounted-for water 54 74 68 66 59 53 49 52 Total 193 225 227 235 237 241 247 260 4 Domestic Use 110 118 125 131 138 145 153 160 Commercial/Industrial/Institutional 15 18 20 23 26 29 31 32 Accounted-for water 125 136 145 154 164 174 184 192 Unaccounted-for water 49 67 62 60 55 49 46 48 Total 174 203 207 214 219 223 229 240 5 Domestic Use 100 105 110 116 122 128 134 141 Commercial/Industrial/Institutional 13 15 17 20 22 24 26 28 Accounted-for water 113 120 127 136 144 152 160 169 Unaccounted-for water 44 59 54 53 48 43 40 42 Total 157 179 181 188 191 194 200 211
NRW Rate (%) 40 33 30 28 25 22 20 20 Note: Annual rate of increase of domestic water consumption/use: 1.5 percent for 2000; 1 percent for 2001 to 2010. Source: Design Criteria, LWUA

TABLE 3.21. PROJECTED SERVICES COVERAGE AND WATER DEMAND FOR PUBLIC WATER SUPPLY, 2000 and 2005
2000 2005
Region Type Public Water Supply Coverage/Demand Total Urban Rural Total Urban Rural
WRR-1 Total Population ('000) 2,582 921 1,661 2,807 1,078 1,728 L-III Population Served 594 403 191 782 591 191 Coverage (%) 23% 44% 11% 28% 55% 11% Water Demand (M.cum/y) 37 25 12 52 39 13 L-I, II Population Served 1,472 318 1,154 1,597 303 1,293 Coverage (%) 57% 35% 69% 57% 28% 75% Water Demand (M.cum/y) 17 4 13 20 4 16 Total Population Served 2,067 722 1,345 2,379 895 1,484 Coverage (%) 80% 78% 81% 85% 83% 86% Water Demand (M.cum/y) 54 29 26 71 42 29 WRR-2 Total Population ('000) 3,368 745 2,623 3,694 854 2,840 L-III Population Served 240 191 48 380 332 48 Coverage (%) 7% 26% 2% 10% 39% 2 Water Demand (M.cum/y) 14 11 3 24 21 3% L-I, II Population Served 2,263 326 1,937 2,585 311 2,274 Coverage (%) 67% 44% 74% 70% 36% 80% Water Demand (M.cum/y) 26 4 23 32 4 28 Total Population Served 2,503 518 1,986 2,965 643 2,322 Coverage (%) 74% 69% 76% 80% 75% 82% Water Demand (M.cum/y) 41 15 25 56 25 31 WRR-3 Total Population ('000) 10,036 5,814 4,222 10,975 6,756 4,220 L-III Populat ion Served 2,741 2,365 376 3,831 3,455 376 Coverage (%) 27% 41% 9% 35% 51% 9% Water Demand (M.cum/y) 212 185 27 309 280 28 L-I, II Population Served 5,021 1,957 3,064 5,279 1,961 3,319 Water Demand (M.cum/y) 59 23 36 66 24 41 Total Population Served 7,762 4,322 3,440 9,110 5,416 3,695 Coverage (%) 77% 74% 81% 83% 80% 88% Water Demand (M.cum/y) 270 207 63 374 305 69

TABLE 3.21. (continued)..…
2000 2005 Region Type Public Water Supply
Coverage/Demand Total Urban Rural Total Urban Rural
WRR-4 Total Population ('000) 21,633 17,235 4398 24,002 19,422 4,580 L-III Population Served 11,266 11,011 265 13,959 13,694 265 Coverage (%) 52% 64% 6% 58% 71% 6% Water Demand (M.cum/y) 1,433 1,406 27 1,735 1,709 26 L-I, II Population Served 5,024 1,998 3,036 5,525 2,044 3,482 Coverage (%) 23% 12% 69% 23% 11% 76% Water Demand (M.cum/y) 59 23 35 69 25 43 Total Population Served 16,290 12,989 3,301 19,485 15,738 3,747 Coverage (%) 75% 75% 75% 81% 81% 82% Water Demand (M.cum/y) 1,492 1,430 62 1,804 1,734 70 WRR-5 Total Population ('000) 4,740 1,857 2,883 5,144 1,611 3,533 L-III Population Served 788 593 195 960 765 195 Coverage (%) 17% 32% 7% 19% 47% 6% Water Demand (M.cum/y) 55 41 14 72 58 14 L-I, II Population Served 2,988 770 2,219 3,442 500 2,942 Coverage (%) 63% 41% 77% 67% 31% 83% Water Demand (M.cum/y) 35 9 26 43 6 37 Total Population Served 3,776 1,362 2,414 4,402 1,264 3,138 Coverage (%) 80% 73% 84% 86% 78% 89% Water Demand (M.cum/y) 90 50 40 115 64 51 WRR-6 Total Population ('000) 6,452 2,879 3,573 7,018 3,354 3,664 L-III Population Served 1,149 890 260 1,725 1,465 260 Coverage (%) 18% 31% 7% 25% 44% 7% Water Demand (M.cum/y) 83 65 18 130 111 18 L-I, II Population Served 3,983 1,270 2,713 4,206 1,218 2,988 Coverage (%) 62% 44% 76% 60% 36% 82% Water Demand (M.cum/y) 47 15 32 52 15 37
Total Population Served 5,132 2,159 2,973 5,931 2,683 3,248
Coverage (%) 80% 75% 83% 85% 80% 89%
Water Demand (M.cum/y) 130 80 49 182 126 56
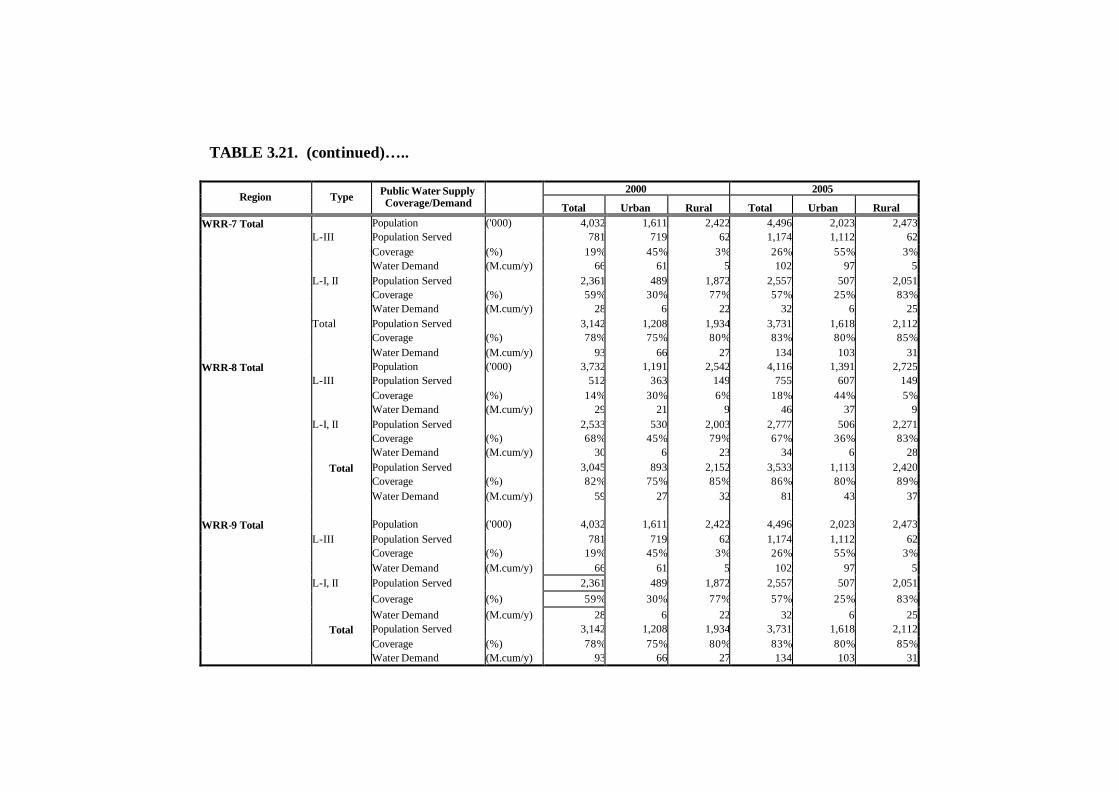
TABLE 3.21. (continued)…..
2000 2005 Region Type Public Water Supply
Coverage/Demand Total Urban Rural Total Urban Rural WRR-7 Total Population ('000) 4,032 1,611 2,422 4,496 2,023 2,473 L-III Population Served 781 719 62 1,174 1,112 62 Coverage (%) 19% 45% 3% 26% 55% 3% Water Demand (M.cum/y) 66 61 5 102 97 5 L-I, II Population Served 2,361 489 1,872 2,557 507 2,051 Coverage (%) 59% 30% 77% 57% 25% 83% Water Demand (M.cum/y) 28 6 22 32 6 25 Total Population Served 3,142 1,208 1,934 3,731 1,618 2,112 Coverage (%) 78% 75% 80% 83% 80% 85% Water Demand (M.cum/y) 93 66 27 134 103 31 WRR-8 Total Population ('000) 3,732 1,191 2,542 4,116 1,391 2,725 L-III Population Served 512 363 149 755 607 149 Coverage (%) 14% 30% 6% 18% 44% 5% Water Demand (M.cum/y) 29 21 9 46 37 9 L-I, II Population Served 2,533 530 2,003 2,777 506 2,271 Coverage (%) 68% 45% 79% 67% 36% 83% Water Demand (M.cum/y) 30 6 23 34 6 28 Total Population Served 3,045 893 2,152 3,533 1,113 2,420 Coverage (%) 82% 75% 85% 86% 80% 89% Water Demand (M.cum/y) 59 27 32 81 43 37 WRR-9 Total Population ('000) 4,032 1,611 2,422 4,496 2,023 2,473 L-III Population Served 781 719 62 1,174 1,112 62 Coverage (%) 19% 45% 3% 26% 55% 3% Water Demand (M.cum/y) 66 61 5 102 97 5 L-I, II Population Served 2,361 489 1,872 2,557 507 2,051 Coverage (%) 59% 30% 77% 57% 25% 83% Water Demand (M.cum/y) 28 6 22 32 6 25 Total Population Served 3,142 1,208 1,934 3,731 1,618 2,112 Coverage (%) 78% 75% 80% 83% 80% 85% Water Demand (M.cum/y) 93 66 27 134 103 31

TABLE 3.21. (continued)…..
Public Water Supply 2000 2005 Region Type
Coverage/Demand Total Urban Rural Total Urban Rural
WRR-10 Total Population ('000) 4,426 2,088 2,338 4,937 2,515 2,422 L-III Population Served 1,038 926 111 1,477 1,366 111 Coverage (%) 23% 44% 5% 30% 54% 5% Water Demand (M.cum/y) 72 64 8 107 99 9 L-I, II Population Served 2,417 639 1,778 2,635 646 1,988 Coverage (%) 55% 31% 76% 53% 26% 82% Water Demand (M.cum/y) 28 7 21 33 8 25 Total Population Served 3,455 1,566 1,889 4,112 2,012 2,100 Coverage (%) 78% 75% 81% 83% 80% 87% Water Demand (M.cum/y) 100 71 29 140 107 33 WRR-11 Total Population ('000) 4,318 1,721 2,598 4,740 1,947 2,793 L-III Population Served 1,224 1,135 88 1,489 1,401 88 Coverage (%) 28% 66% 3% 31% 72% 3% Water Demand (M.cum/y) 73 68 5 93 88 5 L-I, II Population Served 2,350 346 2,004 2,638 322 2,316 Coverage (%) 54% 20% 77% 56% 17% 83% Water Demand (M.cum/y) 27 4 23 33 4 29 Total Population Served 3574 1481 2093 4127 1723 2404 Coverage (%) 83% 86% 81% 87% 88% 86% Water Demand (M.cum/y) 100 72 28 126 92 34 WRR-12 Total Population ('000) 5,479 2,084 3,395 6,244 2,608 3,636 L-III Population Served 590 572 18 1,081 1,063 18 Coverage (%) 11% 27% 1% 17% 41% 1% Water Demand (M.cum/y) 42 40 1 82 81 1 L-I, II Population Served 3,655 991 2,663 4,095 1,023 3,072 Coverage (%) 67% 48% 78% 66% 39% 84% Water Demand (M.cum/y) 43 12 31 51 13 38 Total Population Served 4,245 1,563 2,682 5,177 2,086 3,090 Coverage (%) 77% 75% 79% 83% 80% 85% Water Demand (M.cum/y) 84 52 32 133 93 39
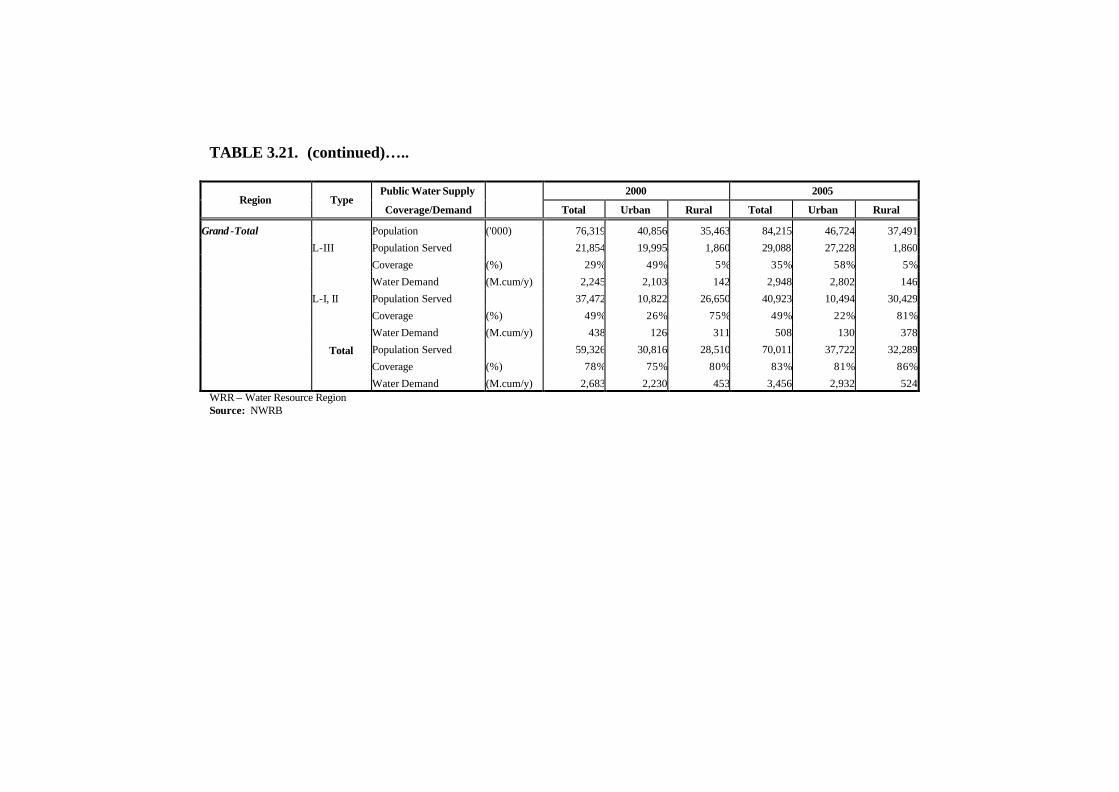
TABLE 3.21. (continued)…..
Public Water Supply 2000 2005 Region Type
Coverage/Demand Total Urban Rural Total Urban Rural
Grand -Total Population ('000) 76,319 40,856 35,463 84,215 46,724 37,491
L-III Population Served 21,854 19,995 1,860 29,088 27,228 1,860
Coverage (%) 29% 49% 5% 35% 58% 5%
Water Demand (M.cum/y) 2,245 2,103 142 2,948 2,802 146
L-I, II Population Served 37,472 10,822 26,650 40,923 10,494 30,429
Coverage (%) 49% 26% 75% 49% 22% 81%
Water Demand (M.cum/y) 438 126 311 508 130 378
Total Population Served 59,326 30,816 28,510 70,011 37,722 32,289
Coverage (%) 78% 75% 80% 83% 81% 86%
Water Demand (M.cum/y) 2,683 2,230 453 3,456 2,932 524 WRR – Water Resource Region Source: NWRB

TABLE 3.22. UTILIZATION OF AREAS FOR INDUSTRIALIZATION (as of July 2003)
ECOZONES Location: Status Area (ha) Preferred Industries:
Region 1 Eastern Pangasinan Agro-Industrial Park
Sta. Maria, Umingan, Pangasinan Development in progress
57 Wood Products, Food Processing, Wearing Apparel, Garments/Textiles, Ceramic
Pangasinan Industrial Park I Tagudin, Mabini, Pangasinan Development in progress
97 Light to medium scale, non-pollutive industries
Pangasinan Industrial Park II Alos, Alaminos, Pangasinan and Tagudin, Mabini, Pangasinan
Proclaimed 26.5 Light to medium scale, non-pollutive industries
Sual Special Economic Zone Baybay Sur, Sual, Pangasinan Development in progress
59 Non-Pollutive, Light to Medium industries
Fort Ilocandia Tourism Economic Zone
Laoag City, Ilocos Norte Approved by the PEZA Board on 26 February 1997 under B.R. No. 97-058
774,680 Casino, Hotels, Sports Center, Golf Course
CAR Abra Agro-Industrial Center Barangay Gaddani, Tayum, Abra
(Old Cellophil Resources, Corp. Industrial Plant)
Proclaimed under Presidential Proclamation No. 26
34.29 Medium scale food processing
Baguio City Economic Zone Loakan Road, Baguio City Operating 119.3669 Manufacture of textiles, wearing apparel, electronics/semiconductors, plastic and paper products, eco-friendly machinery, wooden home decors, burn-in board repairs
Kelly Special Economic Zone Kelly, Tuding & Gumatdang, Itogon, Benguet
Proclaimed 133.26 Information technology and related industries, telecommunications, electronics, computers, semiconductors and agro-based industries
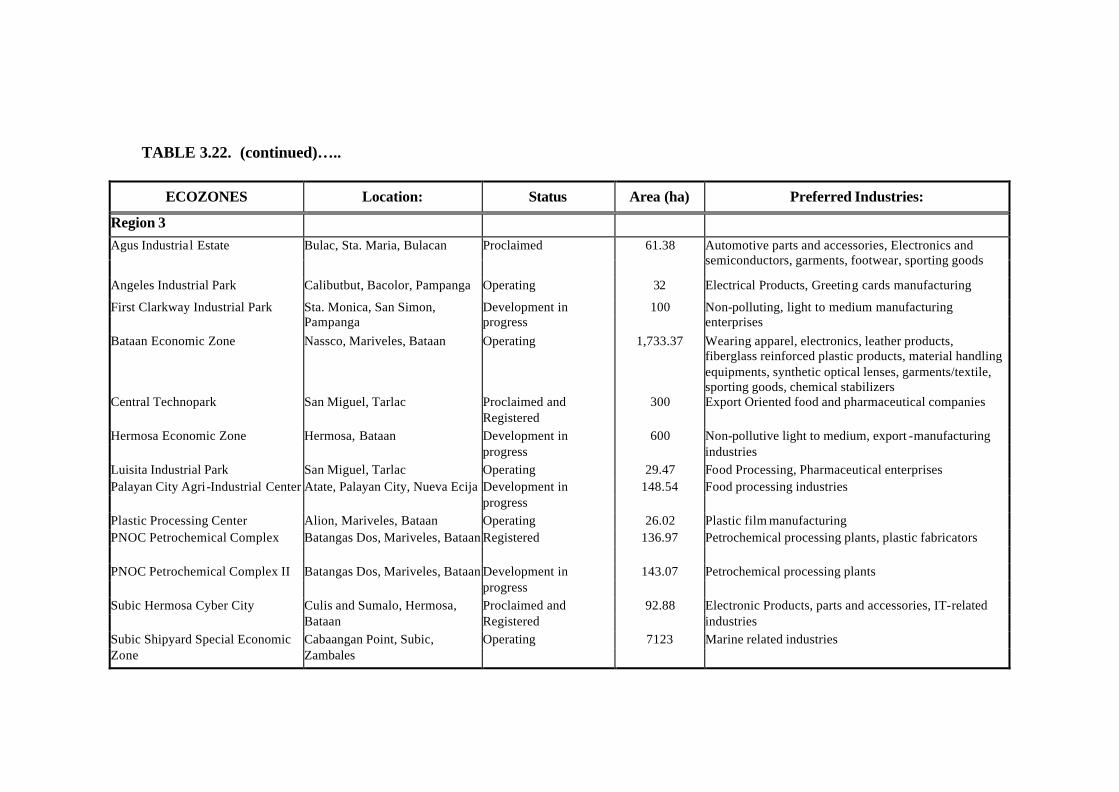
TABLE 3.22. (continued)…..
ECOZONES Location: Status Area (ha) Preferred Industries:
Region 3
Agus Industrial Estate Bulac, Sta. Maria, Bulacan Proclaimed 61.38 Automotive parts and accessories, Electronics and semiconductors, garments, footwear, sporting goods
Angeles Industrial Park Calibutbut, Bacolor, Pampanga Operating 32 Electrical Products, Greeting cards manufacturing
First Clarkway Industrial Park Sta. Monica, San Simon, Pampanga
Development in progress
100 Non-polluting, light to medium manufacturing enterprises
Bataan Economic Zone Nassco, Mariveles, Bataan Operating 1,733.37 Wearing apparel, electronics, leather products, fiberglass reinforced plastic products, material handling equipments, synthetic optical lenses, garments/textile, sporting goods, chemical stabilizers
Central Technopark San Miguel, Tarlac Proclaimed and Registered
300 Export Oriented food and pharmaceutical companies
Hermosa Economic Zone Hermosa, Bataan Development in progress
600 Non-pollutive light to medium, export -manufacturing industries
Luisita Industrial Park San Miguel, Tarlac Operating 29.47 Food Processing, Pharmaceutical enterprises Palayan City Agri-Industrial Center Atate, Palayan City, Nueva Ecija Development in
progress 148.54 Food processing industries
Plastic Processing Center Alion, Mariveles, Bataan Operating 26.02 Plastic film manufacturing PNOC Petrochemical Complex Batangas Dos, Mariveles, Bataan Registered 136.97 Petrochemical processing plants, plastic fabricators
PNOC Petrochemical Complex II Batangas Dos, Mariveles, Bataan Development in progress
143.07 Petrochemical processing plants
Subic Hermosa Cyber City Culis and Sumalo, Hermosa, Bataan
Proclaimed and Registered
92.88 Electronic Products, parts and accessories, IT-related industries
Subic Shipyard Special Economic Zone
Cabaangan Point, Subic, Zambales
Operating 7123 Marine related industries

TABLE 3.22. (continued)….
ECOZONES Location : Status Area (ha) Preferred Industries:
TECO Special Economic Zone Barangays Bundagul and Paralayunan, Mabalacat, Pampanga
Operating 63.84 hectares, more or less
High to medium industries
Region 4 Allegis Information Technology Park
Carmelray Industrial Park II Barangay Tulo, Calamba, Laguna
Proclaimed 5.71 IT Software developers and related industries
Batangas Tourism Estate Maligaya, Rosario, Batangas Development in progress
50 Car/Tire manufacturing, oil companies, car racing parts/accessories, kart equipment
Best World Technopark Batas, Silang, Cavite Development in progress
145.06 Electronics and semi -conductor
Calamba Premiere International Park
Batino, Parian & Barandal, Calamba Laguna
Operating 65.63 Light to medium, non-polluting industries
Cambridge Intelligent Park Malinta, Dasmariñas, Cavite Approved by the PEZA Board
80 Light to medium, non-polluting industries
Carmelray Industrial Park I Canlubang, Calamba, Laguna Operating 50.75 Chemical and chemical products, precision instruments, transport and auto parts, electronics and semiconductors, plastic products, metal products/precision tools, packing and packaging materials
Carmelray Industrial Park II Punta & Tulo, Calamba, Laguna Operating 143.03 Electronics and semiconductors
Carmelray International Business Park
Canlubang, Calamba, Laguna Proclaimed 40 IT services industries
Cavite Eco-Industrial Estate Pasong Kawayan II, General Trias, Cavite
Proclaimed and Registered
104.95 Light to medium, non-polluting industries

TABLE 3.22. (continued)….
ECOZONES Location : Status Area (ha) Preferred Industries:
Cavite Economic Zone Rosario, Cavite Operating 278.51 Tobacco products, wearing apparels, leather products, wood and wood products, paper and paper board products, plastics/rubber/glass products, fabricated metal products, office computing machinery, electrical machines, apparatus, appliances, food industries, clocks and watch parts, packaging
Cavite Productivity & Economic Zone
Sahud-ulan, Tanza, Cavite Proclaimed and Registered
116.22 Electronic products, electrical machinery, semiconductor products
Cocochem Agro-Industrial Park Aplaya & Danglayan, Bauan, Batangas
Operating 42 Downstream or upstream industries in oleo chemical products
Daiichi Industrial Park Maguyam, Silang, Cavite Operating 55.02 Molds and plastic products, plastic injection and parts for audio components & other electronic equipment, fabrication or precision molding dye, design of equipment for automation and energy consumption
EMI - Special Economic Zone Brgy. Anabu II, Imus, Cavite Operating 12.1997 Light Industries
Eastbay Arts, Recreational and Tourism Zone
San Roque, Angono and Darangan, Binangonan, Rizal
Proclaimed 26.68 Tourism related activities
Fil-Estate Industrial Park - Cavite Trece Martirez City and Tanza, Cavite
Proclaimed 80.62 Electronics, garments, food processing, leather products, metal fabrication, toys, gifts and house wares
Filinvest Technology Park - Calamba
Punta & Burol-Bubuyan, Calamba, Laguna
Proclaimed 250 Light, non-polluting industries
Filinvest Technology Park - Cavite Hugo Perez, Trece Martirez, Cavite
Development in progress
86 Light to medium, non-polluting industries
Filinvest Technology Park - Tanauan
Pantay Matanda, Tanauan, Batangas
Development in progress
100.73 Electronics, electrical and consumer goods
Filinvest Technology Park - Teresa Dalig, Teresa, Rizal Development in progress
26.6 Manufacture of electronics, electrical and consumer goods
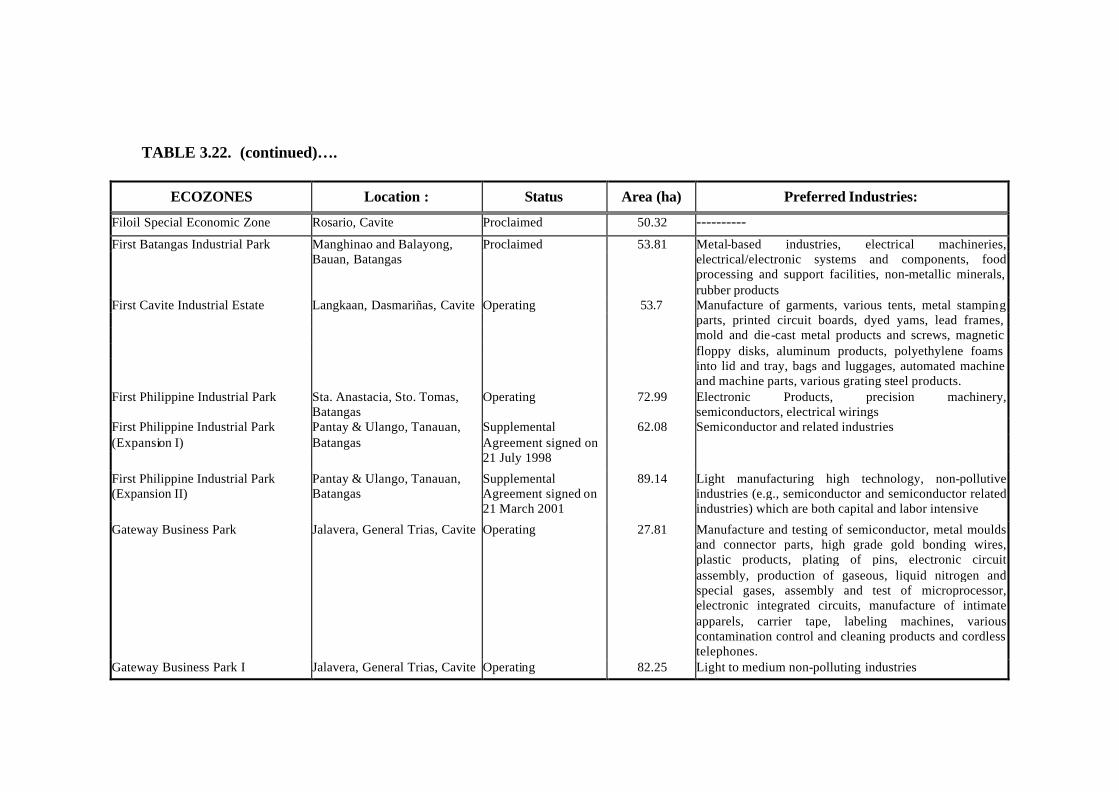
TABLE 3.22. (continued)….
ECOZONES Location : Status Area (ha) Preferred Industries:
Filoil Special Economic Zone Rosario, Cavite Proclaimed 50.32 ---------- First Batangas Industrial Park Manghinao and Balayong,
Bauan, Batangas Proclaimed 53.81 Metal-based industries, electrical machineries,
electrical/electronic systems and components, food processing and support facilities, non-metallic minerals, rubber products
First Cavite Industrial Estate Langkaan, Dasmariñas, Cavite Operating 53.7 Manufacture of garments, various tents, metal stamping parts, printed circuit boards, dyed yams, lead frames, mold and die-cast metal products and screws, magnetic floppy disks, aluminum products, polyethylene foams into lid and tray, bags and luggages, automated machine and machine parts, various grating steel products.
First Philippine Industrial Park Sta. Anastacia, Sto. Tomas, Batangas
Operating 72.99 Electronic Products, precision machinery, semiconductors, electrical wirings
First Philippine Industrial Park (Expansion I)
Pantay & Ulango, Tanauan, Batangas
Supplemental Agreement signed on 21 July 1998
62.08 Semiconductor and related industries
First Philippine Industrial Park (Expansion II)
Pantay & Ulango, Tanauan, Batangas
Supplemental Agreement signed on 21 March 2001
89.14 Light manufacturing high technology, non-pollutive industries (e.g., semiconductor and semiconductor related industries) which are both capital and labor intensive
Gateway Business Park Jalavera, General Trias, Cavite Operating
27.81 Manufacture and testing of semiconductor, metal moulds and connector parts, high grade gold bonding wires, plastic products, plating of pins, electronic circuit assembly, production of gaseous, liquid nitrogen and special gases, assembly and test of microprocessor, electronic integrated circuits, manufacture of intimate apparels, carrier tape, labeling machines, various contamination control and cleaning products and cordless telephones.
Gateway Business Park I Jalavera, General Trias, Cavite Operating 82.25 Light to medium non-polluting industries
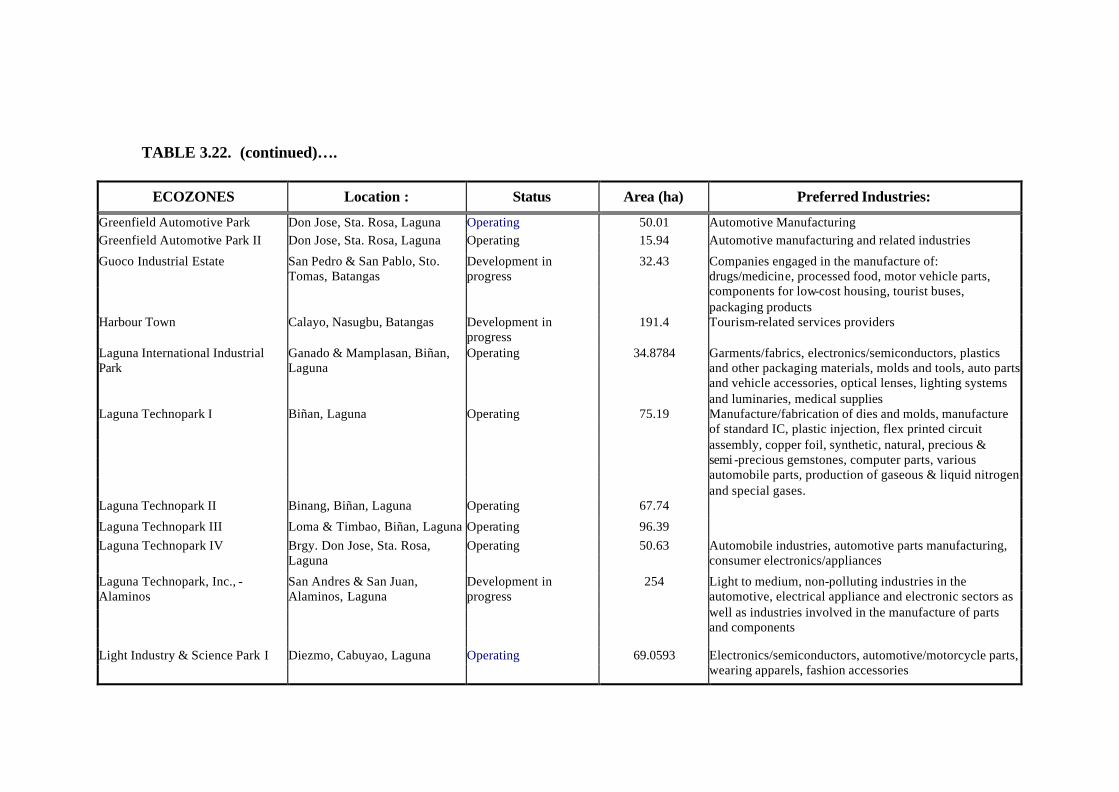
TABLE 3.22. (continued)….
ECOZONES Location : Status Area (ha) Preferred Industries:
Greenfield Automotive Park Don Jose, Sta. Rosa, Laguna Operating 50.01 Automotive Manufacturing Greenfield Automotive Park II Don Jose, Sta. Rosa, Laguna Operating 15.94 Automotive manufacturing and related industries
Guoco Industrial Estate San Pedro & San Pablo, Sto. Tomas, Batangas
Development in progress
32.43 Companies engaged in the manufacture of: drugs/medicine, processed food, motor vehicle parts, components for low-cost housing, tourist buses, packaging products
Harbour Town Calayo, Nasugbu, Batangas Development in progress
191.4 Tourism-related services providers
Laguna International Industrial Park
Ganado & Mamplasan, Biñan, Laguna
Operating 34.8784 Garments/fabrics, electronics/semiconductors, plastics and other packaging materials, molds and tools, auto parts and vehicle accessories, optical lenses, lighting systems and luminaries, medical supplies
Laguna Technopark I Biñan, Laguna Operating 75.19 Manufacture/fabrication of dies and molds, manufacture of standard IC, plastic injection, flex printed circuit assembly, copper foil, synthetic, natural, precious & semi -precious gemstones, computer parts, various automobile parts, production of gaseous & liquid nitrogen and special gases.
Laguna Technopark II Binang, Biñan, Laguna Operating 67.74 Laguna Technopark III Loma & Timbao, Biñan, Laguna Operating 96.39 Laguna Technopark IV Brgy. Don Jose, Sta. Rosa,
Laguna Operating 50.63 Automobile industries, automotive parts manufacturing,
consumer electronics/appliances
Laguna Technopark, Inc., - Alaminos
San Andres & San Juan, Alaminos, Laguna
Development in progress
254 Light to medium, non-polluting industries in the automotive, electrical appliance and electronic sectors as well as industries involved in the manufacture of parts and components
Light Industry & Science Park I Diezmo, Cabuyao, Laguna Operating 69.0593 Electronics/semiconductors, automotive/motorcycle parts, wearing apparels, fashion accessories

TABLE 3.22. (continued)….
ECOZONES Location : Status Area (ha) Preferred Industries:
Light Industry & Science Park II Real & La Mesa, Calamba, Laguna
Operating 66.71 Manufacture of thermoforming trays, flexible circuit board, rewritable CD drive mechanical loader assembly, hi-focus asymmetrical digital subscriber line, pressed metal parts for terminal printers and micro-printers, main board printers, plastic injected gears for washing machine hinges, paper board and various filing systems, base and blocks for computer hard disk drives, multi-layer capacitor, assembly of planer, CPU and other miscellaneous cards, various pumps and other related products.
Light Industry & Science Park III San Rafael & Sta. Anastacia, Sto. Tomas, Batangas
Proclaimed 134.80 hectares Clean, non-polluting, light to medium primarily export oriented industries
Lima Technology Center Santiago & Payapa, Malvar, Batangas & San Lucas & Bugtong na Dulo, Inosluban Lipa City
Operating 109.15 (Malvar), 171.02 (Lipa City)
Electronics, auto parts, food processing, pharmaceuticals
Marcelo IPG Industrial and Aqua Farming Park Project
Bacoor Bay, Cavite City Development in progress
150 hectares Light to medium industries
Pagbilao Industrial & Science Park Ibabang Polo, Pagbilao, Quezon Development in progress
198 Automotive spare parts manufacturing, body stamping plant for automotive components, computer manufacturing operation including integrated circuits, various electrical and electronic products, components and petrochemical companies
PEC Industrial Park Barrio Buenavista, Batas, General Trias, Cavite
Development in progress
177 Garments & Textiles, semiconductors, food processing, pharmaceuticals
People's Technology Complex Maduya, Carmona, Cavite Operating 52.99 Processed food, metal products, electronics, garments, gifts, toys, house wares
Philtown Technology Center Trapiche, Pagaspas & Baloc-Baloc, Tanauan, Batangas
Proclaimed 66.63 electronics, automotive industries

TABLE 3.22. (continued)….
ECOZONES Location : Status Area (ha) Preferred Industries:
Prince Cabuyao Special Economic Zone
Banlic, Cabuyao, Laguna Development in progress
25.45
Puerto Princesa Environmental Estate
Sta. Lucia, Puerto Princesa, Palawan
Development in progress
1,072 Tourism-related activities/services
Quezon International Center Mangalang & Quiling, Sariaya, Quezon
Development in progress
350 Tourism related activities/services
Rancho Montana Ecozone Luyos, Sulpoc & Suplang Tanauan, Batangas
Development in progress
900 Electronics, computer assembly, automotive spare parts, garments and other consumer products
Rio Tuba Export Processing Zone Barangay Rio Tuba, Bataraza, Palawan
Operating 423.95 Mining
Rizal Industrial Estate San Andres & Cuyambay, Tanay, Rizal
Development in progress
326 Agro-industrial enterprises & ancillary industries, mining, manufacturing, tool engineering, food processing, handicraft, house ware/consumer durables, environment-related enterprises, utility & related services, IT enterprises, export-oriented.
RLC Special Economic Zone Simlong, Batangas City Proclaimed and Registered
87.43 Petrochemical and related industries
South Coast Ecozone Papaya, Nasugbu, Batangas Proclaimed 195.54 Tourism related industries/services Southwoods Ecocentrum Tourism Estate
Halang, Biñan, Laguna Development in progress
76 Tourism and cultural related activities
Sterling Technopark Special Economic Zone
Maguyam, Silang, Cavite and Bancal and Lantic, Carmona, Cavite
Development in progress
100 Light to medium, non-polluting industries
Tabangao Special Economic Zone Tabangao, Batangas Operating 86 Petrochemicals and related industries

TABLE 3.22. (continued)….
ECOZONES Location : Status Area (ha) Preferred Industries:
Taipan Go ld Industrial Park Defuego & San Francisco, General Trias, Cavite
Development in progress
100 Electronics and electrical products, transportation equipment and parts, machinery equipment and parts, wearing apparel
Toyota Sta. Rosa (Laguna) Special Zone
Pulong Sta. Cruz, Laguna Operating 25 Automotive parts industries
Toyota Sta. Rosa (Laguna) Special Economic Zone II
Pulong Sta. Cruz, Laguna Proclaimed 52.67 Automotive parts industries
YTMI Realty Special Economic Zone
Brgy. Makiling, Calamba, Laguna
Operating 20.66 Automotive wiring harness
Region 5 Bicol Industrial Park Sitio Banasi, San Jose, Bula,
Camarines Sur Development in progress
100 Food Processing. wood products, ceramics, textiles, wearing apparels, electronics-computers.
Global Industrial Maritime Complex (GIMCO)
Larap, Jose Panganiban, Camarines Norte
Development in progress
30 Agri-business and electronics industries as well as manufacturers of military supplies/armaments
Isarog Heights Special Economic Zone
Cadlan, Pili, Camarines Sur Development in progress
124.32 Food processing/manufacturing
Legaspi City Special Economic Zone
Sitio Caridad, Banquerohan, Legaspi City
Proclaimed 33.13 Food processing and beverage, light metals industry, electronics and appliance manufacturing, furniture and fixtures, garments, textiles and wearable, ceramics and non-metallic minerals processing, organic chemicals, gifts, toys and house wares
Naga Agro-Industrial Center Pacol, Naga City Development in progress
105 Light to medium, non -polluting industries like electronics, electrical, agro-based industries, food manufacturing, wood products, ceramics, textiles
Rapu-Rapu Ecozone Brgys. Malobago and Pagcolbon, Municipality of Rapu-Rapu, Albay
Development in Progress
41.39

TABLE 3.22. (continued)…
ECOZONES Location : Status Area (ha) Preferred Industries:
Sta. Rita Industrial Park San Jose & Sagurong, Pili, Camarines Sur
Development in progress
219 Manufacturers of IT and IT related products such as computer motherboards, telephone sets, CD- ROM units, electronic equipment & peripherals
Tiwi Ecozone Bagumbayan, Tiwi, Albay Development in progress
31.3 Electronics/computer peripherals, garments, ready to wear apparels and wood-based products
Region 6 Barotac Nuevo Industry and Economic Park
Tinori-an, Barotac Nuevo, Iloilo Development in progress
50
Boracay Eco-Village Resort Tourism Economic Zone
Barangay Yapak, Boracay Island, Malay Aklan
Development in Progress
79.21 Tourism Facilities and Activities
Guimaras Growth Center Maclain, Buenavista, Guimaras Development in progress
216.49 Garments, agro-chemicals, electronics, agro-based industries, wood based industries
Leganes Industrial Growth Center Leganes, Iloilo Development in progress
177.58 Agri-based industries, garments, toys, gifts, and hardware, metal products, machinery and equipment, packaging, fertilizers, electronics and electrical components, chemical products
New Coast Boracay Ecozone Balabag & Yapak, Malay, Aklan Development in progress
120.9 Tourism
Pavia Special Economic Zone Pa-agon and Mali-ao, Pavia, Iloilo
Development in progress
50 Toys and household appliances, processed fruits, machine spare parts, garments, canned fruits and vegetables, agro-chemical products and fertilizers, electronics and electrical components, agro-industrial and food processing, furniture and metal stamping
Pulupandan Ecozone Patic, Pulupandan, Negros Occidental
Development in progress
57.03
San Carlos Ecozone Palampas & Punao, San Carlos City, Negros Occidental
Proclaimed 25.79

TABLE 3.22. (continued)…..
ECOZONES Location : Status Area (ha) Preferred Industrie s:
Region 7 Arcenas Estate IT Building Banawa Hills, Barangay
Labangon, Cebu City Development in Progress
12,799 sq. m. (land area); 5,241 sq. m. (gross floor area)
IT Related Enterprises
Asiatown IT Park Lahug and Apas, Cebu City Proclaimed 23.6973 Companies that develop leading edge applications or services, multimedia and other content creation and related activities. IT divisions of companies and companies that support IT Firms.
Bais City Ecozone Tamisu, Bais City, Negros Oriental
Development in progress
104.94 Cutflower packaging, bamboo and wood-based furniture making, cassava based products manufacturing
Cebu Cyber town Information Technology Park
Lapu-Lapu City, Mactan, Cebu Development in progress
11.51 IT and IT related companies
Cebu Light Industrial Park Basak, Lapu-Lapu City, Mactan, Cebu
Operating 62.49 Export-oriented manufacturing companies
Cebu South Reclamation Project Tangke and Talisay, Cebu City Development in progress
330 Light metal engineering, plastics, packaging, food processing and furniture making
Mactan Economic Zone Lapu-Lapu City, Mactan, Cebu Operating 119.37 Wearing apparels, iron and steel, electronics, camera and camera parts/binoculars, novelty items, processed food, plastic products, industrial chemicals/gases, machineries, bags/luggages, fashion jewelries, wood products, paper and paper products, rubber products, watches, optical lenses/glass filters, electrical machinery, industrial gloves, auto wire harness/parts and accessories
Mactan Economic Zone II Basak, Lapu-Lapu City, Mactan, Cebu
Operating 63.3 Garments/bags, electronic products, medical and optical instruments, paper products, automotive wires, concrete products
Mira Nila Ecozone Barili and Aloquinsan, Cebu Development in progress
3,030 Electronics, pharmaceutical products, medical facilities and tourism facilities
MRI Ecozone Sabang, Danao City, Cebu Operating 28.29 Semi -conductor, electronics and related industries New Cebu Township Cantao-an, Naga, Cebu Operating 122.83 Manufacture of (SMD) crystal quartz and industrial chemical
and gases.
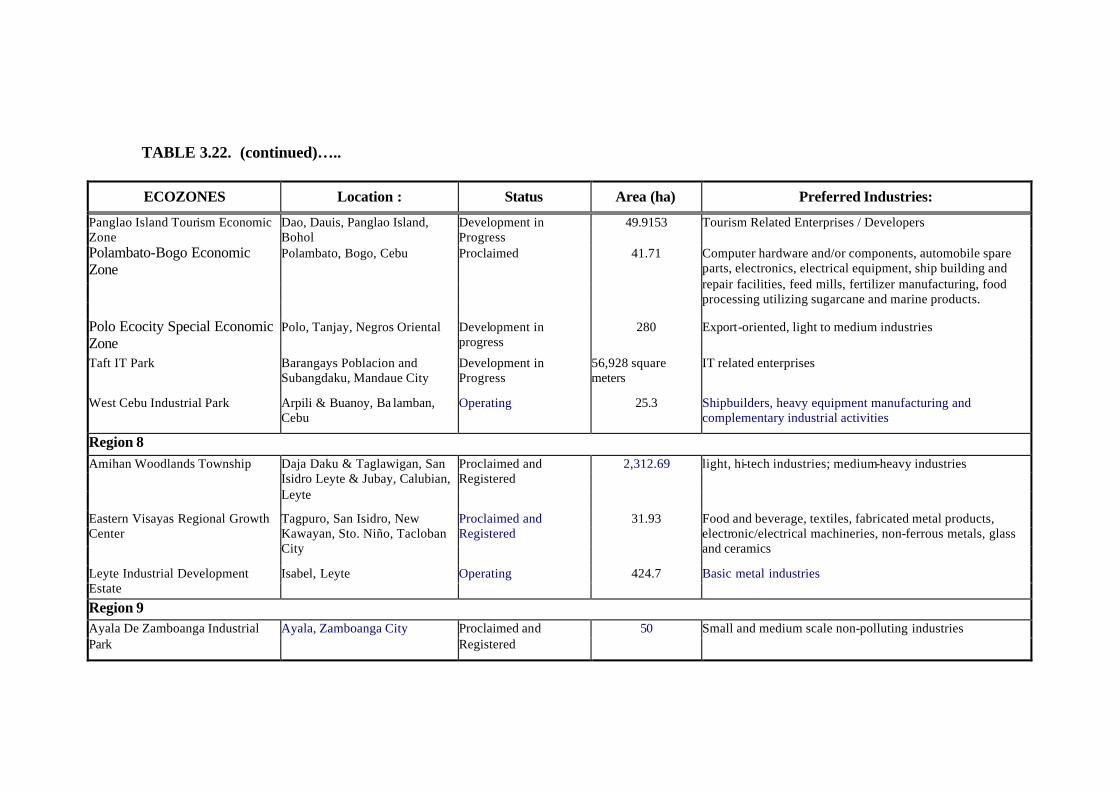
TABLE 3.22. (continued)…..
ECOZONES Location : Status Area (ha) Preferred Industries:
Panglao Island Tourism Economic Zone
Dao, Dauis, Panglao Island, Bohol
Development in Progress
49.9153 Tourism Related Enterprises / Developers
Polambato-Bogo Economic Zone
Polambato, Bogo, Cebu Proclaimed 41.71 Computer hardware and/or components, automobile spare parts, electronics, electrical equipment, ship building and repair facilities, feed mills, fertilizer manufacturing, food processing utilizing sugarcane and marine products.
Polo Ecocity Special Economic Zone
Polo, Tanjay, Negros Oriental Development in progress
280 Export-oriented, light to medium industries
Taft IT Park Barangays Poblacion and Subangdaku, Mandaue City
Development in Progress
56,928 square meters
IT related enterprises
West Cebu Industrial Park Arpili & Buanoy, Ba lamban, Cebu
Operating 25.3 Shipbuilders, heavy equipment manufacturing and complementary industrial activities
Region 8 Amihan Woodlands Township Daja Daku & Taglawigan, San
Isidro Leyte & Jubay, Calubian, Leyte
Proclaimed and Registered
2,312.69 light, hi-tech industries; medium-heavy industries
Eastern Visayas Regional Growth Center
Tagpuro, San Isidro, New Kawayan, Sto. Niño, Tacloban City
Proclaimed and Registered
31.93 Food and beverage, textiles, fabricated metal products, electronic/electrical machineries, non-ferrous metals, glass and ceramics
Leyte Industrial Development Estate
Isabel, Leyte Operating 424.7 Basic metal industries
Region 9 Ayala De Zamboanga Industrial Park
Ayala, Zamboanga City Proclaimed and Registered
50 Small and medium scale non-polluting industries

TABLE 3.22. (continued)…..
ECOZONES Location : Status Area (ha) Preferred Industries:
Region 10 First Cagayan De Oro Business Park San Martin, Villanueva,
Misamis Oriental Development in progress
79.9 Steel and related industries
Global Ispat Industrial Park Brgy. Tominobo, Overton, Iligan City, Lanao del Norte
Development in Progress 187
Jasaan Misamis Oriental Ecozone Solana and Luz Banzon, Jasaan, Misamis Oriental
Operating 25.25 Oleochemical Industries
Pueblo de Oro IT Park Pueblo Business Park, Brgy. Upper Carmen, Cagayan de Oro City
Development in Progress
10.2609 Call centers, Business Process Outsourcing (BOP) firms, other IT related business
Region 11 Apo Estates Special Economic Zone Barangay Madaum, Tagum
City, Davao Development in progress
25 Manufacture and assembly of light industrial and construction equipment, agricultural machinery, vehicles, motorcycles, home appliances, plastic extrusions and pipes, basic pharmaceuticals, garments and other related businesses
Filinvest Technology Park - General Santos
Tambler, General Santos Development in progress
80
First Oriental Business & Industrial Park
Ilang, Bunawan District, Davao City
Registered 57.26 Processing/canning of fruits and vegetables, fabricated metals, garments and textiles, jewelry making, furniture making
General Santos City Special Economic Zone
Tambler, General Santos City
Development in progress
28 Transhippers/processors of marine products from international waters
Samal Casino Resort San Isidro and Libertad Island, Garden City of Samal, Davao del Norte
Registered 215.92 Tourism related services/activities

TABLE 3.22. (continued)…..
ECOZONES Location : Status Area (ha) Preferred Industries:
Region 12 NSC Special Economic Zone Brgys. Tominobo and Sta.
Elena, Iligan City Approved by the PEZA Board
274 Welded pipe manufacturing, shipbuilding repair, drum manufacturing, appliance manufacturing, bar and wire rod manufacturing, GI Sheet manufacturing, construction and engineering
Balo-I Special Economic Zone Maria Cristina, Balo-i, Lanao Del Norte
Approved by the PEZA Board
13.09
Sarangani Economic Development Zone
Cannery, Polomolok, South Cotabato
Operating 60.9 Food and vegetable processing/packing/canning, meat processing, canning, quick frozen products, corn flour and starch manufacturing
Sarangani Economic Development Zone (Matinao)
Matinao, Polomolok, South Cotabato
Development in progress
59.91 Food and vegetable processing/packing/canning, meat processing, canning, quick frozen products, corn flour and starch manufacturing
Tiger Valley Industrial Estate Klinan 6, Polomolok, South Cotabato
Development in progress
54.79 Agro-industrial processing, technology based industries, light and manufacturing assembly
Caraga Nasipit Agusan del Norte Industrial Estate
Camagong and Talisay, Nasipit Agusan Del Norte
Proclaimed 62.07 Light to medium industries
Philnico Industrial Estate Nonoc Island, Surigao del Norte
Registered 106.47 Nickel refinery operations, service and utility providers, support industries to the nickel refinery and downstream industries
Shannalyne Technological and Environmental Park
Milagros, Esperanza, Agusan del Sur
Registered 258.05 Wood-based industries
Tubay Agro Processing Center Doña Rosario, Tubay, Agusan del Norte
Proclaimed 237.91
ARMM Maguindanao Ecocity Special Economic Zone
Parang, Maguindanao Development in Progess
351.76 Light to medium industries engaged in the processing of agricultural products, manufacturing of electronics, building materials
Source: PEZA (http://www.peza.gov.ph)

TABLE 3.23. INVENTORY OF CLASSIFIED WATERBODIES, as of December 2002
Name of River Location Class
Region 1 Abra Ilocos Sur A Agno Lower Reach Pangasinan C Alaminos River Pangasinan C Ambayaoan Pangasinan C Amburayan Ilocos Sur-La Union C Aringay* Ilocos Norte B Bacarra-Vintar* Ilocos Norte A Balincaguing Pangasinan B Barroro* La Union A Bauang* Lower Reach La Union C Bonga Ilocos Norte A Buaya* Upper Reach Ilocos Sur A Bulu* Upper Reach Ilocos Norte A Bulu Lower Reach Ilocos Norte B Dagupan* Upper Reach Pangasinan A Dagupan* Lower Reach Pangasinan C Laoag* Ilocos Norte A Naguillan La Union C Quaiot* Ilocos Norte C Patalan* La Union C Silag-Sta. Maria* Ilocos Sur A Silag-Sta. Maria* Ilocos Sur B Sinocalan Pangasinan C Abulug* Kalinga Apayao C Agno* Upper Reach Benguet A Akutan River Apayao A

TABLE 3.23. (continued)…..
Name of River Location Class
Amburayan* Upper Reach Benguet B Alimit* Mt. Province C Ambalanga Benguet C Baren Apayao B Binuan Apayao B Bokod Benguet A Budacao River Benguet A Bued Benguet C Cabicungan Apayao B Depanay River Benguet A Ibulao* Mt. Province C Karagawan Apayao B Laco Apayao B Lamut* Mt. Province C Malabanig Apayao B Malig Upper Reach Mt. Province B Nabuangan Apayao B Nagan Upper Reach Pudtol, Apayao AA Nagan Lower Reach Pudtol, Apayao A Naguillan Upper Reach Benguet A Pugo River Upper Benguet B Saltan* Apayao B Siffu Mt. Province B Tanudan* Kalinga Apayao A Tineg* Abra B Galiano Upper Reach Tuba Benguet B

TABLE 3.23. (continued)…..
Name of River Location Class
Chico* Upper Reach Mt. Province B Ziwanan Apayao B Zumigue Apayao B
Region 2 Abuan* Isabela C Abuyo Nueva Vizcaya C Addalam* Quirino B Balasig* Isabela D Baua* Upper Reach Cagayan A Baua* Lower Reach Cagayan C Cabicungan* Upper Reach Cagayan B Cabicungan* Lower Reach Cagayan C Cagayan* Upper Reach Quezon A Cagayan* Lower Reach Cagayan C Casecnan Nueva Vizcaya C Diadi Isabela C Disabungan* Isabela C Ganano* Isabela C Ilagan* Isabela C Linao* Cagayan C Magat* Isabela C Marang River Nueva Vizcaya C Matuno* Nueva Vizcaya C Palanan-Pinacanauan* Isabela D Palawig* Upper Reach Cagayan A Palawig* Lower Reach Cagayan C

TABLE 3.23. (continued)…..
Name of River Location Class
Pamplona* Upper Reach Cagayan B Pamplona* Lower Reach Cagayan C Parred* Cagayan C Pinacanauan* Isabela D Tangatan* Cagayan C Sta. Fe* Nueva Vizcaya C Siffu* Isabela C Tamauni* Isabela D Tuguegarao* Upper Reach Cagayan B Tuguegarao* Lower Reach Cagayan C
Region 3 Aguang* Nueva Ecija A Angat* Upper Reach Bulacan B Angat* Lower Reach Bulacan C Bagac Bay Bataan SB Balagtas Bulacan C Bamban Tarlac A Bambang Bulacan C Bancal* Zambales C Binuangan Bulacan C Bocaue Upper Reach Bulacan A Bocaue Lower Reach Bulacan C Bucao* Zambales B Bulacan Bulacan C Cabigo Point Bataan SC Calumpit Bulacan C Camiling* Tarlac C

TABLE 3.23. (continued)…..
Name of River Location Class
Eguia Zambales D Guiguinto Bulacan C Lamao Upper Reach Bataan A Lamao Lower Reach Bataan C La Paz Tarlac A Lawis Zambales B Looc Bay Bataan SB Mabayuan Zambales A Marilao Upper Reach Bulacan A Marilao Lower Reach Bulacan C Meycauayan Bulacan C Napot Point Bataan SC Nayom* Upper Reach Zambales B Nayom* Lower Reach Zambales C O'Donnel* Tarlac C Pamatawan* Upper Reach Zambales B Pamatawan* Lower Reach Zambales C Pampanga* Upper Reach Nueva Ecija A Pampanga* Lower Reach Pampanga C Paniguian Lower Reach Bataan C Pantabangan* Nueva Ecija C Pantal Zambales C Parongking Zambales C Polo Bulacan C Porac Upper Reach Pampanga A Porac Lower Reach Pampanga C Rio Chico* Tarlac C San Fernando Pampanga C

TABLE 3.23. (continued)…..
Name of River Location Class
San Juan Bataan C Sinocalan Zambales C Sorabia Tarlac A Sta. Rita Upper Reach Zambales C Sto. Tomas* Zambales A Talisay* Bataan B Talisay* Bataan C Tarlac Tarlac C
Region 4 Banadero Laguna C Balete* Oriental Mindoro C Bansud* Oriental Mindoro C Batangas Bay Batangas SC Baroc* Oriental Mindoro C Binambang Batangas C Boac* Marinduque C Bongabong* Oriental Mindoro D Bulalacao* Oriental Mindoro C Buso-buso Rizal C Butas* Oriental Mindoro C Caguray* Occidental Mindoro A Cajimos Bay Romblon SC Calancan Bay Marinduque SB Calapan Oreintal Mindoro C Dacanlao Batangas C Dumacaa Quezon C Iyam* Quezon C Kalumpang* Batangas C

TABLE 3.23. (continued)…..
Name of River Location Class
Katubusan Palawan C Lagnas Quezon C Lumintao* Occidental Mindoro A Magasawang Tubig* Oriental Mindoro A Magbando* Occidental Mindoro A Malaking Ilog* Tiaong, Quezon C Malampaya Sound Taytay, Palawan SA Malatgao Palawan A Malaylay-Buco* Oriental Mindoro A Mamburao* Occidental Mindoro A Masin Quezon C Mogpog Marinduque C Molino Cavite C Naujan Lake Occidental Mindoro B Pagbahan* Occidental Mindoro C Pagsanjan* Laguna B Palico Batangas C Pandanan* Palawan C Pansipit* Batangas C
Puerto Galera (Muelle Bay) Oriental Mindoro SA
Pula* Oriental Mindoro C Pulang Tubig* Oriental Mindoro A Rosario* Lobo, Batangas A Sumagui* Oriental Mindoro C San Cristobal* Laguna C San Juan* Upper Reach Batangas A San Juan* Lower Reach Laguna C

TABLE 3.23. (continued)…..
Name of River Location Class
San Pedro Laguna C Sta. Cruz* Laguna C Sta. Rosa Laguna B Sapang Baho Quezon C Taal Lake Batangas B Tayuman Palawan C Teretian Palawan C Tigas Laguna A Ylang-Ylang* Upper Reach Cavite B Ylang-Ylang* Lower Reach Cavite C
Region 5 Auada/Nauco* Masbate A Asid* Masbate A Baleno* Masbate A Banuang Doan* Sorsogon A Bato* Catanduanes A Bicol* Camarines Sur A Bombon Albay A Cadacan Sorsogon A Cawayan Sorsogon B Daet* Upper Reach Camarines Norte A Daet* Lower Reach Camarines Norte C Daraga* Masbate B Donsol* Sorsogon A Fabrica* Sorsogon A Guiom Masbate B Gumaus Camarines Norte D

TABLE 3.23. (continued)…..
Name of River Location Class
Kamanitohan River Albay C Kilbay-Katabangan* Camarines Sur B Labo* Upper Reach Camarines Norte A Labo* Lower Reach Camarines Norte C Lagonoy* Camarines Sur C Lanang* Masbate A Malaguit Camarines Norte C Malbug* Masbate A Mandaon* Masbate B Matnog* Sorsogon A Naga Albay C Nainday* Masbate C Napayawan* Masbate B Ogod* Sorsogon A Quinale Albay C Pajo* Catanduanes A Pawili Camarines Sur C Putiao* Sorsogon B Ragay * Camarines Sur B Salog River Upper Reach Sorsogon B Salog River Lower Reach Sorsogon C San Francisco Albay B Sipocot* Camarines Sur A Tagas Albay C Talisay Upper Reach Camarines Norte A Talisay Lower Reach Camarines Norte C Tambang-Tinambac Camarines Sur A Tayli Albay A

TABLE 3.23. (continued)…..
Name of River Location Class
Tinalmud* Camarines Sur A Viga Catanduanes A Yawa Albay C
Region 6 Aklan* Upper Reach Aklan A Aklan* Lower Reach Aklan B Alacaygan* Iloilo C Alugon* Capiz C Bago* Negros Occidental C
Bago-Pulupandan Coastline Negros Occidental SB
Balantias* Iloilo B Banate Bay Iloilo SB Barotac* Iloilo B Batiano Iloilo C Cairnan* Upper Reach Antique A Cairnan* Lower Reach Antique B Calajunan Creek Iloilo C Cangaranan* Antique A Dalanas* Antique A Guimbal* Iloilo B Himoga-an* Negros Occidental C Ibajay* Upper Reach Aklan A Ibajay* Lower Reach Aklan B Ilog* Upper Reach Negros Occidental A Ilog* Lower Reach Negros Occidental C Iloilo Coastline Boulevard to Anhawan/ Villarica SB

TABLE 3.23. (continued)…..
Name of River Location Class
Iloilo Coastline Wesvico to Fishing Port SC Imbang* Upper Reach Negros Occidental A Imbang* Lower Reach Negros Occidental C Jalaur* Upper Reach Iloilo A Jalaur* Lower Reach Iloilo C Jaro-Agaman Iloilo C Jaro Upper Reach Iloilo A Jaro Middle Reach Iloilo B Malihao* Upper Reach Negros Occidental B Malihao* Lower Reach Negros Occidental C Malisbog Upper Reach Negros Occidental B Malisbog Lower Reach Negros Occidental C Malogo* Upper Reach Negros Occidental A Malogo* Middle Reach Negros Occidental B Malogo* Lower Reach Negros Occidental B Palawan* Antique A Panay Capiz A Pontevedra Negros Occidental C
Roxas Coastline Barangay Punta to
Barangay Nipa Roxas City
SB Port, Culasi SC Salamanca Negros Occidental C Sicaba* Negros Occidental C Sibalom* Upper Reach Antique A Sibalom* Lower Reach Iloilo-Antique B Sipalay* Upper Reach Negros Occidental A Sipalay* Lower Reach Negros Occidental C

TABLE 3.23. (continued)…..
Name of River Location Class
Southern Iloilo Coastline
Iloilo SB
Tumagbok Upper Reach Iloilo A Tumagbok Lower Reach Iloilo C
Region 7 Abatan* Upper Reach Bohol A Abatan* Middle Reach Bohol B Abatan* Lower Reach Bohol C Argao Upper Reach Cebu A Argao Lower Reach Cebu B Balamban* Upper Reach Cebu A Balamban* Lower Reach Cebu B Banica Upper Reach Negros Oriental A Banica Middle Reach Negros Oriental B Banica Lower Reach Negros Oriental C Bayawan* Upper Reach Negros Oriental A Bayawan* Lower Reach Negros Oriental B Butuanon Cebu D Canamay Negros Oriental A Cansaga Bay Cebu SC Cawitan* Negros Oriental A
Coastal Waters of Dumaguete City Negros Oriental SB
Coastal Waters of Danao City
Cebu SC
Cotcot Cebu A

TABLE 3.23. (continued)…..
Name of River Location Class
Danao Upper Reach Cebu A Danao Lower Reach Cebu B Guinabasan* Cebu AA Guinabasan* Cebu A Guadalupe Cebu B Guadalupe Cebu C Guihulngan Cebu A Guihulngan Cebu B Guinadarohan Upper Reach Cebu A Guinadarohan Lower Reach Cebu C Inabanga* Upper Reach Bohol A Inabanga* Lower Reach Bohol C Ipil* Bohol A La Libertad* Negros Oriental A Loboc* Bohol B Luyang Upper Reach Cebu A Luyang Lower Reach Cebu C Mactan Channel Cebu SC Manaba Upper Reach Bohol A Manaba Bohol B Manaba Lower Reach Bohol C Mananga* Bohol A Matul-id* Cebu A Ocoy Upper Reach Negros Oriental A Ocoy Lower Reach Negros Oriental B Pagatban* Negros Oriental B Panamangan Negros Oriental C Sapang Daku* Upper Reach Cebu A

TABLE 3.23. (continued)…..
Name of River Location Class
Sapang Daku* Lower Reach Cebu C Siaton* Negros Oriental A Sicopong Negros Oriental A Sicopong Negros Oriental B Silot Bay Cebu SB Tanjay* Upper Reach Negros Oriental A Tanjay* Lower Reach Negros Oriental B Tyabanan* Negros Oriental B
Region 8 Bao Leyte C Bacan River Leyte C Camotes Sea Leyte SD Camotes Sea Palompon, Leyte SC Cancabato Bay Leyte SC Dupon Bay Southeast of Bay Leyte SD Dupon Bay Southwest of Bay Leyte SC Embarkadero Tanuan, Leyte C Mahalo Southern Leyte C Matlang Bay Northwest of Bay Leyte SD Matlang Bay Southeast of Bay Leyte SC Maqueda Bay Samar SC Ormoc Bay Leyte SC Pangasinan River* Leyte C Taft* Samar C Tigbao Leyte C

TABLE 3.23. (continued)…..
Name of River Location Class
Region 9 Ayala Upper Reach Zamboanga City A Lower Reach Zamboanga City B Bolong Upper Reach Zamboanga A Bolong Lower Reach Zamboanga B Cabaluay Upper Reach Zamboanga B Cabaluay Lower Reach Zamboanga C Cunuan Upper Reach Zamboanga City A Lower Reach Zamboanga City B Dipolog* Zamboanga del Norte B Manicahan Zamboanga B Kabasalan Upper Reach Zamboanga del Sur A Kabasalan Lower Reach Zamboanga del Sur C Kipit Zamboanga del Norte B Labangan Upper Reach Zamboanga del Sur A Labangan Lower Reach Zamboanga del Sur B Mercedes Upper Reach Zamboanga B Mercedes Lower Reach Zamboanga C Patalon Upper Reach Zamboanga City A Patalon Lower Reach Zamboanga City B Polo Upper Reach Zamboanga del Norte B Polo Lower Reach Zamboanga del Norte C Saaz Upper Reach Zamboanga City A Saaz Lower Reach Zamboanga City B Salug Daku River Upper Reach Zamboanga del Sur A Lower Reach Zamboanga del Sur B Sibuguey* Upper Reach Zamboanga del Sur A Sibuguey* Lower Reach Zamboanga del Sur C

TABLE 3.23. (continued)…..
Name of River Location Class
Sindanga Zamboanga del Norte B Sinunuc Upper Reach Zamboanga City A Sinunuc Lower Reach Zamboanga City B Tigbao River* Upper Reach Zamboanga del Sur A Lower Reach Zamboanga del Sur B Tumaga* Upper Reach Zamboanga A Tumaga* Middle Reach Zamboanga B Tumaga* Lower Reach Zamboanga C
Region 10 Adgawan* Agusan del Sur A Agusan* Upper Reach Misamis Oriental A Agusan* Lower Reach Misamis Oriental C Alae Upper Reach Bukidnon A Alae Lower Reach Bukidnon C Alubijid* Upper Reach Misamis Oriental A Alubijid* Lower Reach Misamis Oriental C Balatocan* Misamis Oriental A Bigaan Upper Reach Misamis Oriental A Bigaan Lower Reach Misamis Oriental C Bubunawan Upper Reach Bukidnon A Bubunawan Lower Reach Misamis Oriental A Buncalalan Upper Reach Misamis Oriental C Buncalalan Lower Reach Misamis Oriental A Cagayan* Misamis Oriental A Clarin* Misamis Occidental A Cabulig* Misamis Oriental A Cugman Upper Reach Misamis Oriental A

TABLE 3.23. (continued)…..
Name of River Location Class
Cugman Lower Reach Misamis Oriental C Gingoog* Misamis Oriental A Gingoog Bay Misamis Occidental SC Ihawan Misamis Oriental A Iligan River Upper Reach Iligan City A Middle Reach Iligan City B Lower Reach Iligan City C Iponan* Misamis Oriental A Kalawaig Bukidnon A Luait River Upper Reach Misamis Oriental A Lower Reach Misamis Oriental C Odiongan* Misamis Oriental A Oroguieta* Misamis Occidental A Magpayang Misamis Oriental A Magsaysay Misamis Oriental A Naawan Misamis Oriental A Palilan Upper Reach Misamis Oriental A Palilan Lower Reach Misamis Oriental C Polangi Bukidnon A Sawaga Bukidnon A Solana Misamis Oriental A Tagolo-an* Misamis Oriental A Umalag Upper Reach Misamis Oriental A Umalag Lower Reach Misamis Oriental C
Caraga Wawa* Agusan del Norte A Agusan Agusan del Norte C Andanan Agusan del Sur C

TABLE 3.23. (continued)…..
Name of River Location Class
Cabadbaran* Agusan del Norte A Gibong* Agusan del Sur A Ojot* Agusan del Norte A Magallanes* Agusan del Norte C Simulao* Agusan del Sur A Surigao* Agusan del Norte A Taganito Surigao del Norte C
Taganito Bay Coastal Water Along Brgy
Urbiztondo Surigao del Norte SA
Coastal Water Along Brgy
Taganito Surigao del Norte SB
Coastal Water Along Brgy
Hayanggabon Surigao del Norte SB
Coastal Water along Brgy
Taganito near Taganito Delta SC Taguibo River Upper Reach Agusan del Norte A Midddle Reach C Lower Reach D Tubay* Agusan del Norte A
Region 11 Agusan Davao C Bunawan Davao City C Davao* Upper Reach Davao City A Davao* Lower Reach Davao City B Digos* Upper Reach Davao del Sur B Digos* Lower Reach Davao del Sur C Hijo-Masara* Davao del Norte D

TABLE 3.23. (continued)…..
Name of River Location Class
Hijo Riverine System Davao del Norte/Comval Province C
Ilang Davao City C Lasang* Davao City B Lipadas* Upper Reach Davao City AA Middle Reach Davao City A Middle Reach Davao City B Lower Reach Davao City C Malita River Davao del Sur B Padada* Davao del Sur D Sibulan Upper Reach Davao del Sur A Sibulan Lower Reach Davao del Sur B Sumlog* Brgy. Tagugpo to Davao Oriental A Headwaters Upstream B Sumlog* Sumlog Bridge to Tagugpo Sumlog Confluence of Sumlog Davao Oriental C River to Davao Gulf Talomo* Davao City B Tagum* Davao del Norte D Tuganay* Davao del Norte B
Region 12 Agus* Lanao del Norte C Allah* Sultan Kudarat B Iligan Bay Cotabato City SC Illan Bay (Parola Beach) Cotabato City SC Lake Lanao Lanao del Sur D Libungan* Cotabato D

TABLE 3.23. (continued)…..
Name of River Location Class
Mandulog* Iligan City D Marbel Upper Reach Cotabato B Marbel Lower Reach Cotabato D Marbel South Cotabato C Matingao Cotabato B Nuangan Cotabato D Panguil Bay Lanao del Norte SC Polangi* Cotabato D
Rio Grande de Mindanao* Cotabato C
Saguing Cotabato C Silway Upper Reach General Santos City A Silway Lower Reach General Santos City B Tubod Iligan City C
National Capaital Region Marikina* Upper Reach Metro Manila A Marikina* Lower Reach Metro Manila C Paranaque-Zapote Metro Manila C Pasig* Metro Manila C San Juan Metro Manila C Tullahan-Tenejeros Metro Manila C Note: * Principal river
Note: * Principal river Source: EMB, Department of Environment and Natural Resources
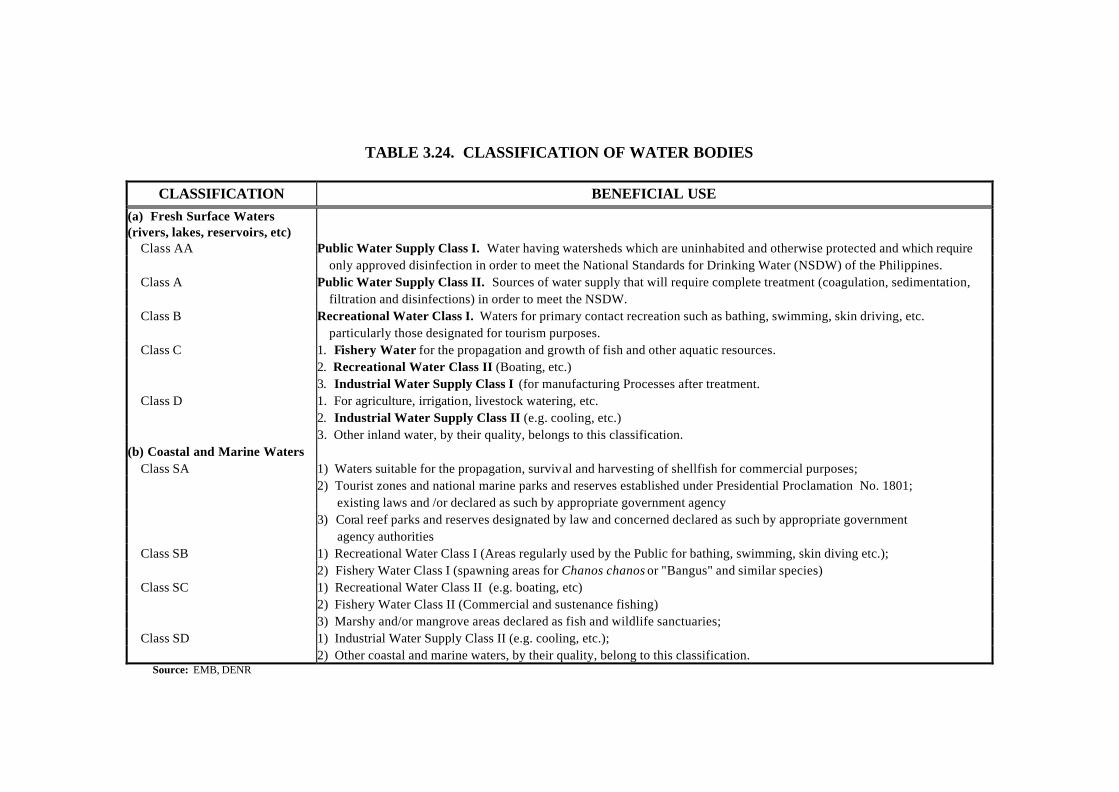
TABLE 3.24. CLASSIFICATION OF WATER BODIES
CLASSIFICATION BENEFICIAL USE (a) Fresh Surface Waters (rivers, lakes, reservoirs, etc)
Class AA Public Water Supply Class I. Water having watersheds which are uninhabited and otherwise protected and which require only approved disinfection in order to meet the National Standards for Drinking Water (NSDW) of the Philippines. Class A Public Water Supply Class II. Sources of water supply that will require complete treatment (coagulation, sedimentation, filtration and disinfections) in order to meet the NSDW. Class B Recreational Water Class I. Waters for primary contact recreation such as bathing, swimming, skin driving, etc. particularly those designated for tourism purposes. Class C 1. Fishery Water for the propagation and growth of fish and other aquatic resources. 2. Recreational Water Class II (Boating, etc.) 3. Industrial Water Supply Class I (for manufacturing Processes after treatment. Class D 1. For agriculture, irrigation, livestock watering, etc.
2. Industrial Water Supply Class II (e.g. cooling, etc.) 3. Other inland water, by their quality, belongs to this classification. (b) Coastal and Marine Waters
Class SA 1) Waters suitable for the propagation, survival and harvesting of shellfish for commercial purposes; 2) Tourist zones and national marine parks and reserves established under Presidential Proclamation No. 1801; existing laws and /or declared as such by appropriate government agency 3) Coral reef parks and reserves designated by law and concerned declared as such by appropriate government agency authorities Class SB 1) Recreational Water Class I (Areas regularly used by the Public for bathing, swimming, skin diving etc.); 2) Fishery Water Class I (spawning areas for Chanos chanos or "Bangus" and similar species) Class SC 1) Recreational Water Class II (e.g. boating, etc) 2) Fishery Water Class II (Commercial and sustenance fishing) 3) Marshy and/or mangrove areas declared as fish and wildlife sanctuaries; Class SD 1) Industrial Water Supply Class II (e.g. cooling, etc.); 2) Other coastal and marine waters, by their quality, belong to this classification.
Source: EMB, DENR

TABLE 3.25. LIST OF RIVERS SURVEYED AND CATEGORIZED ACCORDING TO POLLUTION LEVEL IN SELECTED REGIONS, 1989 to 2001
REGION/NAME OF RIVER LOCATION CATEGORIZATION YEAR SURVEYED
ILOCOS
Abra Vigan, Ilocos Sur NP 1990 Agno (U) San Miguel, Pangasinan NP 1990 Amburayan Sudipen, La Un ion Dead 1990 Aringay Aringay, La Union NP 1990 Baroro Bacnotan, La Union Dead 1990 Balincaquin Agno, Pangasinan Dead 1990 Bued (D) San Fabian, Pangasinan Dead 1990 Dagupan (D) Tambal, Dagupan City Dead 1990 Laoag Sarrat, Ilocos Sur NP 1990 Naguilan Bauang, La Union SP 1990
CAGAYAN VALLEY
Apiyan (D) Bambang, N.V. NP 1991 Cagayan Bal-lo, Cagayan NP 1991 Ganano Santiago, Isabela NP 1991 Karaballo (M) Aritao, N. V. SP 1992 Magat (U) Bambang, N.V. SP 1992 Magat (D) Bayumbong, N.V. NP 1991 Matuno Bambang, N.V. NP 1992 Pinacanauan Tuguegarao, Cagayan NP 1991 Sta Cruz (D) Bambang, N.V. NP 1992 Sta Fe (D) Bambang, N.V. NP 1992 Sta. Fe Nueva Vizcaya NP 2001

TABLE 3.25. (continued)….
REGION/NAME OF RIVER LOCATION CATEGORIZATION YEAR SURVEYED
CENTRAL LUZON Abucay Abucay, Bataan SP 1991 Balagtas Balagtas, Bulacan DEAD 1989 Bamban (M) Bamban, Tarlac NP 1992 Bocaue Bocaue, Bulacan DEAD 1989 Caulamang Dinalupihan, Pampanga NP 1989 Dinalupihan Dinalupihan, Pampanga NP 1991 Guagua Guagua, Pampanga SP 1991 Guiguinto Guiguinto, Bulacan Dead 1981 Gumain (m) Lubao, Pampanga SP 1992 Hagonoy/Labangan Hagonoy, Bulacan HP 1997 Ibayo Balanga, Bataan NP 1991 Kalaguiman Samal, Bataan NP 1991 Labangan Calumpit, Bulacan NP 1989 Lamao Limay, Bataan NP 1999 Layac (M) Dinalupihan, Bataan NP 1991 Limay Limay, Bataan NP 1991 Maasin Candaba, Pampanga NP 1989 Mapahuepe Zambales NP 1989 Marella Zambales NP 1989 Marilao Marilao, Bulacan DEAD 1989 Meycauayan Meycauayan, Bulacan DEAD 1989 Pamatawan (D) Zambales NP 1989 Pamatawan (M) Subic, Zambales NP 1992 Pampanga Apalit, Pampanga NP 1989 Pasig Potrero Potrero, Pampanga NP 1992 Polo Lubao, Pampanga SP 1991 Porac (D) Florida Blanca, Pampanga SP 1992 Porac (M) Porac, Pampanga NP 1992 Potrero Guagua, Pampanga NP 1991

TABLE 3.25. (continued)..…
REGION/NAME OF RIVER LOCATION CATEGORIZATION YEAR SURVEYED
O'Donnel Sitio Dam, Tarlac NP 1991 Orani Orani, Bataan SP 1992 Rio Chico Gapan, N.Ecija NP 1989 Samal Samal, Bataan SP 1991 San Fernando Bacolor, Pampanga HP 1983 San Juan Samal, Bataan SP 1991 Sta. Catalina Lubao, Pampanga SP 1991 Sta Maria Sta. Maria, Pampanga NP 1989 Sta Rita (U) Olongapo, Zambales NP 1992 Sta Rita (D) Olongapo, Zambales NP 1992 Sto. Tomas (M) Castillejos, Zambales NP 1992 Sto. Tomas (D) San Narciso, Zambales SP 1992 Tagwaling Pilar, Bataan NP 1991 Talisay Balanga, Bataan NP 2000
SOUTHERN TAGALOG Alitao (U) Tayabas, Quezon SP 1992 Balatuin (U) San Pablo City, Laguna NP 1992 Banadero (U) San Pablo, Laguna NP 1992 Calaca Calaca, Batangas SP 1992 Calumpang Calumpang, Batangas City SP 1992 Dumaca-a (D) Cotta, Lucena City, Quezon DEAD 1992 Dumaca-a (M) Sto. Rosario, Lucena, Quezon SP 1992 Dumaca-a (U) Tayabas, Quezon SP 1992 Dumuklong (U) Bagbaguin, Lucena City SP 1992 Iyan (D) Teachers Village, Lucena City SP 1992 Iyan (M) Ilayang Iyan, Lucena City SP 1992 Iyan (U) Tayabas, Quezon SP 1992 Lacawan (M) Bagbaguin, Lucena City SP 1992 Lian Lian, Batangas SP 1992 Lobo Lobo, Batangas SP 1992 Mahangpong San Pablo City, Laguna NP 1992 Malaunod (U) San Pablo City, Laguna NP 1992

TABLE 3.25. (continued)…..
REGION/NAME OF RIVER LOCATION CATEGORIZATION YEAR SURVEYED
Molino Molino, Batangas SP 1992 Pagbilao (M) Pagbilao, Quezon SP 1992 Palico Batangas SP 2001 Palsabangan (U) Pagbilao, Quezon SP 1992 Pansipit San Nicolas, Batangas NP 1997 Prinsa (U) San Pablo City, Laguna NP 1992 San Cristobal (T) Calamba, Laguna SP 1992 San Cristobal (M) Calamba, Laguna SP 1992 San Cristobal (U) Calamba, Laguna SP 1992 San Juan (M) Real Calamba, Laguna SP 1992 San Juan (D) Calamba, Laguna NP 1992
BICOL
Naga City Naga City NP 1991
Legend: T – Tributary NP - Not polluted M – Midstream SP - Slightly Polluted D – Downstream HP - Highly Polluted U – Upstream UC – Unclassified
Source: Environmental Management Bureau, Department of Environment and Natural Resources

TABLE 3.26. POLICY ISSUANCES, 1997 - 2002
NUMBER TITLE
Administrative Order 1997 97-15 Strengthening the Environmental of the Environmental Management Bureau (EMB) 97-38 Chemical Control Order for Mercury and Mercury Compounds 1998
Administrative Order 98-56 Modifying the Organizational Structure of the Pasig River Rehabilitation Program (PRRP) and the River
Rehabilitation Secretariat (RRS). Memorandum Circulars
98-05 List of Classified Water Bodies in 1996-1997. 98-06 Guidelines in Water Quality Monitoring. 1999
Administrative Order 99-08 Amending DENR Administrative Order No. 98-67.
Memorandum Circulars 99-18 List of Classified Water Bodies in 1998. 2000
Administrative Order 2000-37 Addendum To Article VIII Section 1.0 Of DAO 96-37 Re: Standard Costs And Fees For Various Services Of The
Environmental Management Bureau Relative To The Imple mentation Of The Philippine EIS System. 2000-68 Institutionalization Of The Directorate On Special Projects For Water And Integrated Ecosystems Management And
Development (SDPWIEMD) And Related Functions.
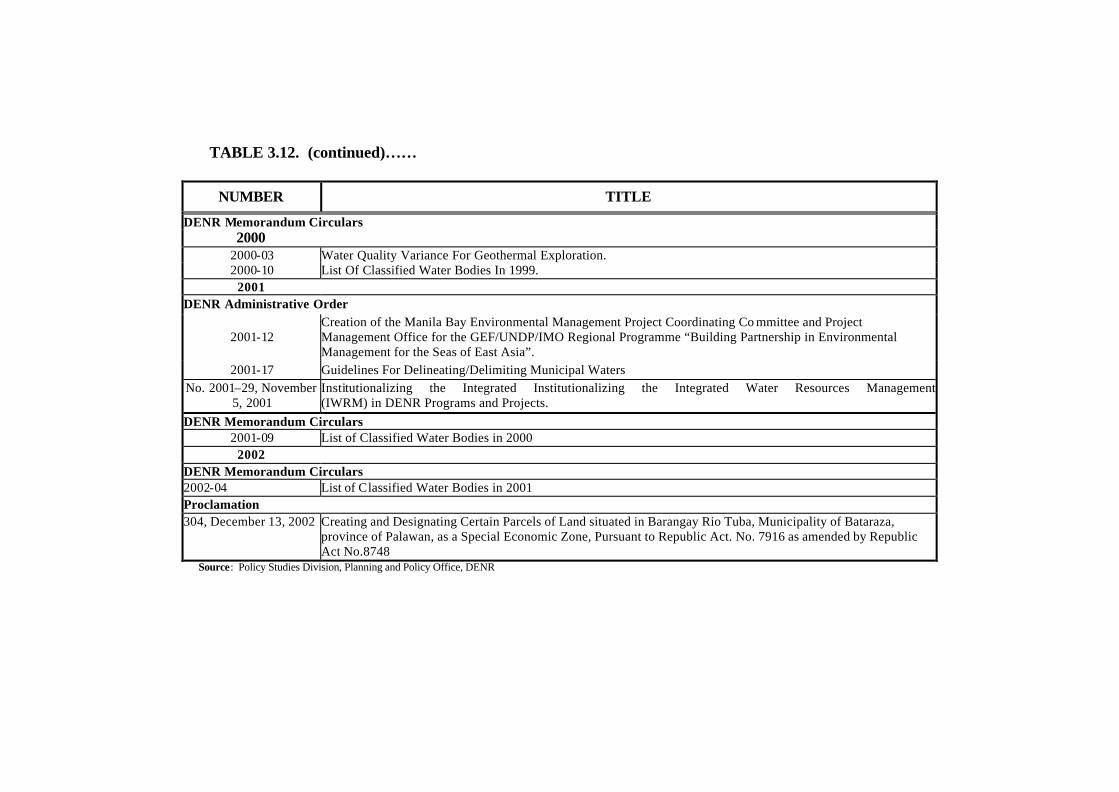
TABLE 3.12. (continued)……
NUMBER TITLE
DENR Memorandum Circulars 2000
2000-03 Water Quality Variance For Geothermal Exploration. 2000-10 List Of Classified Water Bodies In 1999.
2001 DENR Administrative Order
2001-12 Creation of the Manila Bay Environmental Management Project Coordinating Co mmittee and Project Management Office for the GEF/UNDP/IMO Regional Programme “Building Partnership in Environmental Management for the Seas of East Asia”.
2001-17 Guidelines For Delineating/Delimiting Municipal Waters No. 2001–29, November
5, 2001 Institutionalizing the Integrated Institutionalizing the Integrated Water Resources Management (IWRM) in DENR Programs and Projects.
DENR Memorandum Circulars 2001-09 List of Classified Water Bodies in 2000
2002 DENR Memorandum Circulars 2002-04 List of Classified Water Bodies in 2001 Proclamation 304, December 13, 2002 Creating and Designating Certain Parcels of Land situated in Barangay Rio Tuba, Municipality of Bataraza,
province of Palawan, as a Special Economic Zone, Pursuant to Republic Act. No. 7916 as amended by Republic Act No.8748
Source: Policy Studies Division, Planning and Policy Office, DENR

Land and Soil
Compendium of Philippine Environment Statistics 2004
LLLaaannnddd aaannnddd SSSoooiiilll
4 C
hapt
er

Land and Soil
Compendium of Philippine Environment Statistics 2004 4-1
LAND AND SOIL RESOURCES HIGHLIGHTS OF RESULTS Land Use
Land devoted to agricultural use increased to 10.18 million hectares in 2000 compared to the 9.9 million hectares reported in 1988 or an annual addition of about 23,093 hectares, Table 4.1. The Land and Soil Environmental Accounts of NSCB estimated a total of 29,878 hectares in the uplands that were opened up for kaingin activities from 1988 to 2000. The results showed, however, that kaingin only contributed 10.8 percent to the total increase in agricultural land area for the twelve-year period.
Table 1. Physical Asset Account of Land Resources Devoted to Forest Uses,
1988-1997
AREA IN THOUSAND HECTARES
1988 1989 1990 1991 1992 1993 1994 1995 1996 1997
OPENING AREA1/ 6,789.6 6,460.6 6,307.4 6,158.86,015.45,900.25,787.55,686.1 5,590.25,493.1
OTHER ACCUMULATION (24.4) 50.4 107.3 164.8 101.3 82.9 109.7 124.8 104.0 117.3
a. Deforestation
Kaingin (-) (2.9) (4.7) - (0.8) (0.1) (0.1) (1.5) (0.4) (0.1) (4.7)
Illegal logging (-) (4.5) (1.7) - (0.1) - - (0.1) (0.0) (0.0) (0.1)
b. Reforestation (+) 2/ 64.2 131.4 191.7 93.0 40.6 19.2 49.6 65.2 46.1 66.2
c. Forest area converted to
non-forest use (-)3/ (65.2) (60.0) (76.9) 77.8 66.0 63.8 61.8 60.0 58.0 55.8
d. Damage from logging (-)4/ (15.9) (14.6) (7.5) (5.3) (5.3) - - - - -
OTHER VOLUME CHANGES (2.9) (6.2) - (6.4) 9.6 4.6 (8.7) (23.7) (5.1) (17.6)
Lahar covered areas (-) - - - - 22.3 22.3 - - - -
Forest fire (-) (0.4) (0.7) - (5.9) (12.7) (15.3) (7.7) (10.3) (4.6) (1.0)
Others (infestation, typhoons) (-) (2.4) (5.5) - (0.5) - (2.4) (1.0) (13.4) (0.5) (16.6)
ADJUSTMENT (S.D.)5/ (301.8) (197.4) (255.9) (301.8)(226.1) (200.2) (203.4)(210.4) (196.5)(217.7)
Net Change in Area6/ (329.0) (153.2) (148.6) (143.4)(115.2) (112.7) (101.4) (95.9) (97.0)(101.4)
CLOSING AREA 6,460.6 6,307.4 6,158.8 6,015.45,900.25,787.55,686.15,590.2 5,493.15,391.7 Sources of basic data: Philippine Forestry Statistics, Forestry Management Bureau (FMB) Philippine St atistical Yearbook, National Statistical Coordination Board (NSCB) Bureau of Soils and Water Management (BSWM), Philippine Master plan for Forestry Development, 1990, FMB
On the other hand, forest land (with adequate vegetation cover) posted a
reduction of 5.4 million in 1997 from 6.8 million hectares in 1988 which translated to a yearly decline in stock of about 140,000 hectares. Thus the area under forestland use was decreasing at a rate of 2.1 percent per year or a total of 20.6 percent for the period covered (1988 to 1997). The reduction in forestland was attributed to deforestation activities such as logging, forest conversion, and kaingin activities. If this trend continues and with a slow rate of regeneration and reforestation, there would be no more land left for forest use in about of 50 years.

Land and Soil
Compendium of Philippine Environment Statistics 2004 4-2
The construction of residential buildings in the Philippines increased to 7,910 in 2001 from 7,258 in 2000. However, in terms of floor area, the residential buildings constructed in 2001 occupied only 480 thousand square meters compared to 489 thousand square meters in 2000. From 2000 to 2001, majority of the constructions were found in the island of Luzon with Region 4 reporting the highest number. In terms of floor area, it was also Luzon which posted the largest residential construction with Region 4 again reporting the largest share (see Table 1).
Table 2. Number and Floor Area of Residential Building Constructed 1992 – 2001 (area in ‘000 sq. m)
1992 1993 1994 1995 1996 1997 1998 1999 2000 2001
Region
No. Fl. Area
No. Fl. Area
No. Fl. Area
No. Fl. Area
No. Fl. Area
No. Fl. Area
No. Fl. Area
No. Fl. Area
No. Fl. Area
No. Fl. Area
Philippines 3,728 260 7,509 271 7,274 460 14,355 1,036 7,546 715 12,241 592 7,155 1,897 9,848 565 7,258 489 7,910 480
LUZON 2,522 165 6,323 203 5,184 311 9,663 544 2,590 216 8,312 317 3,314 233 5,336 251 3,275 250 4,489 254
NCR 169 11 31 2 4 5 1,658 295 670 54 669 77 16 26 198 31 96 11 4 7
CAR 59 1 199 9 102 2 122 5 31 2 4 0.05 49 1 39 1 95 7 73 3
Region 1 118 5 173 10 244 11 338 20 214 15 522 42 667 36 773 62 862 55 1168 78
Region 2 176 6 76 1 378 27 153 16 160 15 219 16 170 10 205 14 246 30 299 17
Region 3 761 49 595 36 467 56 5,634 177 1,020 67 6,061 163 1390 84 449 40 662 76 649 50
Region 4 1,383 102 5,208 140 3,941 212 2,899 261 637 56 1,387 85 822 59 3435 92 1221 65 2125 94
Region 5 25 2 72 7 52 3 517 65 528 61 119 11 200 15 237 11 93 6 171 5
VISAYAS 258 16 498 36 1,313 105 1,205 80 1,576 256 1,440 98 2227 138 2639 181 1,465 94 1832 129
Region 6 52 5 241 14 221 16 197 17 357 20 307 19 479 32 395 24 387 24 329 20
Region 7 49 2 130 8 798 64 578 32 948 217 863 52 998 60 1448 72 816 48 1101 76
Region 8 157 9 127 14 294 25 430 31 271 19 270 27 750 46 796 85 262 21 402 34
MINDANAO 779 68 657 32 773 38 1,829 118 2,710 190 1,820 100 1614 0 1873 133 2,518 145 1260 81
Region 9 15 2 185 9 293 8 671 29 695 48 580 36 573 40 444 30 689 39 172 11
Region 10 237 7 276 13 197 12 549 48 643 39 760 39 607 45 732 60 763 47 594 35
Region 11 53 1 64 4 186 12 411 32 606 59 361 20 381 16 630 34 784 37 165 11
Region 12 474 58 132 6 97 6 198 9 766 44 54 3 15 3 59 8 231 10 301 22
Caraga 329 16.108
ARMM 0 0 0 0 65 2 38 3 8 0.3 51.0 12.0 28.0 1.7
On the other hand, the construction of national public roads by surface type
expanded steadily from 1992 to 2001 but slightly went down in 2002. In 2001, construction of national roads reached a total of 31,988 kilometers. Concrete roads and gravel type roads accounted for 35.4 percent and 34.8 percent, respectively of the surface area of national public roads. The rest were asphalt roads (31.3 percent) and earth-based (8.5 percent) roads. In 2002, construction of national public roads went down to 30,030 kilometer for the concrete, asphalt, gravel, and earth surface roads. The concrete type of road surface accounted for 39.7 percent of all types of roads while the gravel type accounted for 34.4 percent of all types of surface roads, Table 4.4.
As of end of 2002, length of local roads constructed by type of surface reached a total of 171,770.8 kilometers slightly shorter than the 171,980.7 kilometers reported in 2000, (Tables 4.5 A, B, and C). In the three-year span, 2000 to 2002, Region IV maintained 10 percent share of the total local road constructed while the National Capital Region accounted for only 2.2 percent.

Land and Soil
Compendium of Philippine Environment Statistics 2004 4-3
Land Conversion
Figure 1. Land Use Conversion. 1988 - 2000
-
1.0
2.0
3.0
4.0
5.0
6.0
7.0
1988 1989 1990 1991 1992 1993 1994 1995 1996 1997 1998 1999 2000
Year
Hec
tare
(in
000
)
Based on the Land and Soil Environmental Accounts released by NSCB, a total 34,207 hectares were converted from agricultural to other uses from 1988 to 2000 or an average of 2,831 hectares per year. All through the accounting period, conversion peaked in 1991, 1994 and 1998. The year 1998 recorded the highest agricultural land conversion where accounted for 17 percent of the total lands converted to other uses. Of the16 regions in the country, Region 4 was the most vulnerable to land conversion. (see Figure 1 and Table 4.16).
Use of Fertilizer The production and importation of fertilizer produc ts (and consequently, their
corresponding plant nutrients) decreased from 1995 to 2002. The average annual production of fertilizer products amounted to 1,281.6 thousand metric tons, declining annually on the average by 0.6 percent. Importation of fertilizer products on the other hand, posted an average annual amount of 1,108.5 thousand metric tons which translates into an average annual growth of –3.8 percent. Table 4.4B. Natural Calamities
In 2001, five major tropical storms wrecked havoc to the country. The estimated cost of destruction totaled P6.9 billion. This affected about 758,928 families or 3.67 million people all over the country. In 2002, six typhoons visited the country which affected 499,966 families or 3.35 million people. There were other natural calamities i.e. earthquake, flashflood/flooding, etc. that struck the country in 2002 which affected 11,327 families or 53,960 people all over the country. These calamities contributed also to erosion of the soil.

Land and Soil
Compendium of Philippine Environment Statistics 2004 4-4
Environmental Impacts of Activities and Events
Physical land degradation and nutritional loss were observed while various
natural calamities changed the landscape of large areas in selected regions of the country. The creeping urbanization led to the massive conversion of agricultural land to other economic uses. Agricultural land which have been given up for residential, commercial and industrial purposes displaced lowland farmers resulting to upland migration. Hence, along with the increase in agricultural land conversion, an increasing trend in areas used for kaingin purposes was noted in the uplands.
The change in soil quality expressed in terms of eroded soil from lowland and
upland agriculture (i.e. involving farming activities in the upland, hilly and highland pedo-ecological zones) is shown in Table 4.3. Soil erosion from agricultural areas including kaingin was estimated at about 338 million metric tons in 1988 and 347 million metric tons in 2000 for a given area of 9.9 million hectares of the total land area for temporary and permanent crops. This indicates that approximately 342,498 metric tons of soil was being eroded annually (NSCB, 2003). Policies on Land and Soil Resources
A total of 8 policy issuances (Republic Act, DENR Administrative Orders, Memorandum Circulars, and Memorandum Orders) affecting land and soil resources were approved and passed by the government from 2001 to 2002. The most important policy issued is Republic Act 9003, an Act Providing for an Ecological Solid Waste Management Program, Creating the Necessary Institutional Mechanisms and Incentives, Declaring Certain Acts Prohibited and Providing Penalties, Appropriating Funds thereof, and for other Purposes.
The Ecological Solid Waste Management Act of 2000 set guidelines and targets
for solid waste avoidance and volume reduction through source reduction and waste minimization measures, including composting, recycling, re-use, recovery, green charcoal process, and others, before collection, treatment and disposal in appropriate and environmentally sound solid waste management facilities in accordance with ecologically sustainable development principles. It also ensured the proper segregation, collection, transport, storage, treatment and disposal of solid waste through the formulation and adoption of the best environmental practice in ecological waste management excluding incineration. And lastly, it strengthened the integration of ecological solid waste management and resource conservation and recovery topics into the academic curricula of forma l and non-formal education in order to promote environmental awareness and action among the citizenry.

Land and Soil
Compendium of Philippine Environment Statistics 2004
Statistical Tables

TABLE. 4.1. PHYSICAL AREA OF LAND, BY UTILIZATION, 1988-2000
Area in Thousand Hectares Type of Farm 1988 1989 1990 1991 1992 1993 1994 1995 1996 1997 1998 1999 2000
1. Homelot 71 69 66 63 60 58 55 53 50 48 46 44 42
2. Arable
Under Temporary Crops 5,160 5,223 5,280 5,333 5,381 5,425 5,466 5,504 5,540 5,573 5,605 5,635 5,663Temporarily fallow 114 97 83 71 60 51 43 37 31 26 22 19 16
3. Under Permanent Crops 4,061 4,102 4,140 4,173 4,202 4,228 4,252 4,274 4,293 4,310 4,326 4,341 4,355
4. Under Temporary
Meadows and Pastures 136 116 98 84 71 60 51 43 37 31 26 22 19
5. Under Permanent
Meadows and Pastures 196 172 150 131 114 100 87 76 66 57 50 43 38
6. Woodland and Forest 110 95 82 70 60 52 44 38 33 28 24 20 18
7. All Other Lands 58 56 53 51 49 47 45 43 41 39 37 36 34
Total 9,906 9,929 9,952 9,975 9,998 10,021 10,044 10,067 10,091 10,114 10,137 10,161 10,184
Source of basic data: Census of Agriculture (1991), NSO
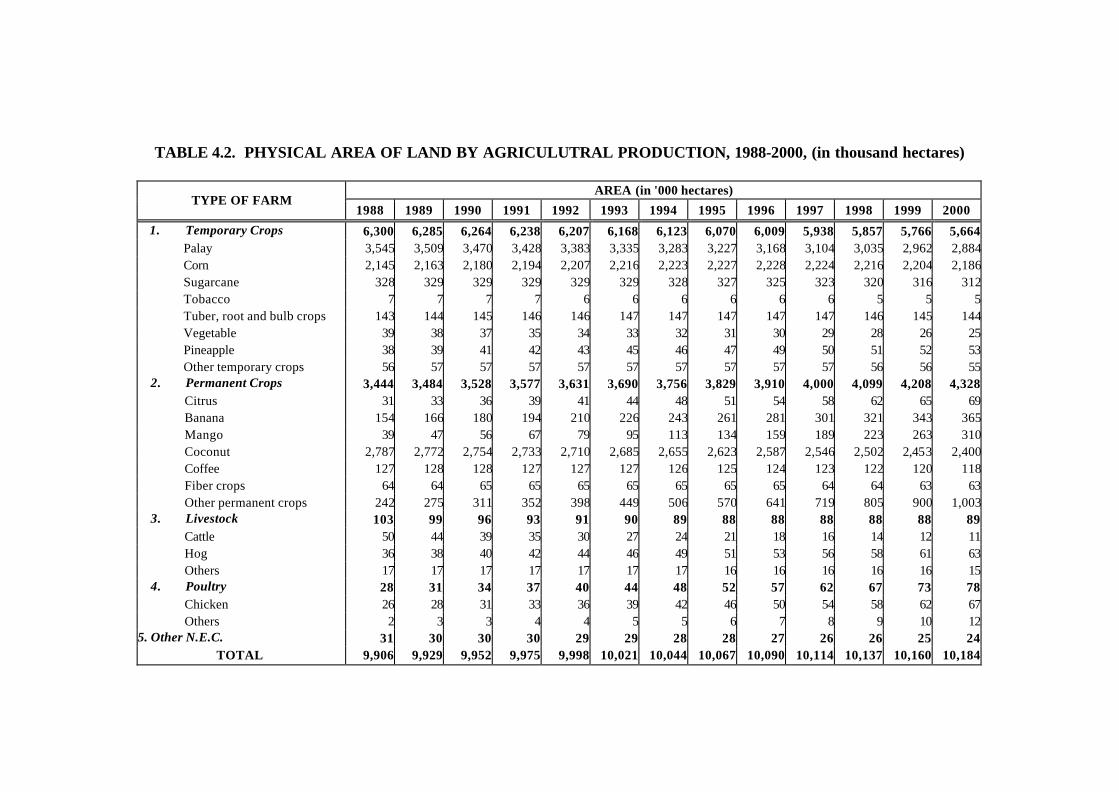
TABLE 4.2. PHYSICAL AREA OF LAND BY AGRICULUTRAL PRODUCTION, 1988-2000, (in thousand hectares)
AREA (in '000 hectares) TYPE OF FARM
1988 1989 1990 1991 1992 1993 1994 1995 1996 1997 1998 1999 2000
1. Temporary Crops 6,300 6,285 6,264 6,238 6,207 6,168 6,123 6,070 6,009 5,938 5,857 5,766 5,664Palay 3,545 3,509 3,470 3,428 3,383 3,335 3,283 3,227 3,168 3,104 3,035 2,962 2,884Corn 2,145 2,163 2,180 2,194 2,207 2,216 2,223 2,227 2,228 2,224 2,216 2,204 2,186Sugarcane 328 329 329 329 329 329 328 327 325 323 320 316 312Tobacco 7 7 7 7 6 6 6 6 6 6 5 5 5Tuber, root and bulb crops 143 144 145 146 146 147 147 147 147 147 146 145 144Vegetable 39 38 37 35 34 33 32 31 30 29 28 26 25Pineapple 38 39 41 42 43 45 46 47 49 50 51 52 53Other temporary crops 56 57 57 57 57 57 57 57 57 57 56 56 55
2. Permanent Crops 3,444 3,484 3,528 3,577 3,631 3,690 3,756 3,829 3,910 4,000 4,099 4,208 4,328Citrus 31 33 36 39 41 44 48 51 54 58 62 65 69Banana 154 166 180 194 210 226 243 261 281 301 321 343 365Mango 39 47 56 67 79 95 113 134 159 189 223 263 310Coconut 2,787 2,772 2,754 2,733 2,710 2,685 2,655 2,623 2,587 2,546 2,502 2,453 2,400Coffee 127 128 128 127 127 127 126 125 124 123 122 120 118Fiber crops 64 64 65 65 65 65 65 65 65 64 64 63 63Other permanent crops 242 275 311 352 398 449 506 570 641 719 805 900 1,003
3. Livestock 103 99 96 93 91 90 89 88 88 88 88 88 89Cattle 50 44 39 35 30 27 24 21 18 16 14 12 11Hog 36 38 40 42 44 46 49 51 53 56 58 61 63Others 17 17 17 17 17 17 17 16 16 16 16 16 15
4. Poultry 28 31 34 37 40 44 48 52 57 62 67 73 78Chicken 26 28 31 33 36 39 42 46 50 54 58 62 67Others 2 3 3 4 4 5 5 6 7 8 9 10 12
5. Other N.E.C. 31 30 30 30 29 29 28 28 27 26 26 25 24TOTAL 9,906 9,929 9,952 9,975 9,998 10,021 10,044 10,067 10,090 10,114 10,137 10,160 10,184

TABLE 4.3. PHYSICAL AGRICULTURAL SOIL RESOURCE ACCOUNTS, 1988-2000
Volume ('000 Metric Tons) CHANGES IN QUALITY 1988 1989 1990 1991 1992 1993 1994 1995 1996 1997 1998 1999 2000
Soil Eroded 1/ 337,704 338,679 339,251 340,067 340,822 341,608 342,461 343,201 343,978 344,977 346,207 346,366 347,163
Sediment 2/ 67,541 67,736 67,850 68,013 68,164 68,322 68,492 68,640 68,796 68,995 69,241 69,273 69,433 Nutrient Loss 3/
(Fertilizer Equivalent)
N (21-0-0) 192.5 193.0 193.4 193.8 194.3 194.7 195.2 195.6 196.1 196.6 197.3 197.4 197.9 P (0-20-0) 4.1 4.1 4.1 4.1 4.1 4.1 4.1 4.1 4.1 4.1 4.2 4.2 4.2 K (0-0-60) 29.7 29.8 29.9 29.9 30.0 30.1 30.1 30.2 30.3 30.4 30.5 30.5 30.6
Source of Data: 1/ Francisco and David (1987) studies. Using the BSWM data, the lowland was estimated to be 46.6 percent and the upland was 53.4 percent. 2/ Sediment delivery rate was established at 20 percent (adopted from Francisco) 3/ The equivalent fertilizer loss in agriculture is 2.85 kg/mt of N (45-0-0); 0.06 kg/mt of P (0-20-0);
and 0.44 kg.mt of K (0-0-60) based on the study of Francisco, 1994.

TABLE 4.4. NUMBER AND FLOOR AREA/LENGTH OF LOCAL GOVERNMENT CONSTRUCTION BY TYPE OF CONSTRUCTION, 1992 to 2001 (area in 000 square kilometers)
1992 1993 1994 1995 1996 1997 1998 1999 2000 2001 Island Group/Region/Type of
Construction No. Fl.
Area No. Fl. Area No. Fl.
Area No. Fl. Area No. Fl.
Area No. Fl. Area No. Fl.
Area No. Fl. Area No. Fl.
Area No. Fl. Area
PHILIPPINES 41,060 57,313 61,553 77,535 69,227 73,522 67,671 59,893 3,516 74,292 4,861.68 73,509 4,615Residential buildings ( sq. m.) 3,728 260 7,509 271 7,274 460 14,355 1,036 7,546 715 12,241 592 7,155 1,897 9,848 565 7,258 489 7,910 480Public buildings (sq. m.) 7,618 693 9,018 826 10,057 1,252 10,368 1,573 9,596 1,129 9,091 900 7,961 778 8,310 795 10,801 1,241 9,438 1,157Educational buildings (sq. m.) 3,223 284 4,928 397 6,118 560 6,612 611 7,293 567 6,486 556 5,496 534 6,208 635 8,684 947 9,321 856Hospital and others (sq. m.) 637 36 1,153 71 1,639 92 1,545 105 1,612 78 1,534 183 1,345 107 1,503 138 2,082 163 1,737 106Streets and bridges (l.m.) 7,873 1,119 13,018 1,440 13,878 2,079 14,953 2,313 12,802 1,656 15,977 2,172 12,445 1,539 11,768 1,384 16,112 2,022 16,432 2,015Water supply system 10,228 9,963 10,750 15,035 10,269 12,552 16,696 9,477 11,300 12,700Other projects 7,753 11,724 11,837 14,667 20,109 15,641 16,573 12,779 18,055 15,971
LUZON 21,597 28,914 33,126 43,036 36,980 42,388 36,976 36,035 40,728 45,634Residential buildings ( sq. m.) 2,522 165 6,323 203 5,184 311 9,663 544 2,590 216 8,312 317 3,314 233 5,336 251 3,275 250 4,489 254Public buildings (sq. m.) 3,633 289 3,762 310 4,243 643 4,733 504 4,351 408 4,648 409 4,341 434 4,208 449 4,920 629 5,150 562Educational buildings (sq. m.) 1,515 82 2,480 148 3,105 177 3,101 180 3,567 237 3,614 246 3,243 382 3,735 501 5,005 537 5,681 633Hospital and others (sq. m.) 286 15 534 25 665 28 707 38 701 43 830 85 690 68 772 90 1,088 95 851 61Streets and bridges (l.m.) 4,266 543 5,614 660 7,261 869 7,769 1,048 6,377 715 9,802 1,068 8,185 1,010 8,744 965 9,582 1,207 10,859 1,303Water supply system 5,613 5,154 6,291 8,775 5,392 6,871 8,529 - 4,899 - 6,699 - 7,565 -Other projects 3,762 5,047 6,377 8,288 14,002 8,311 8,674 - 8,341 - 10,159 - 11,039 -
National Capital Region 2,109 3,138 3,494 4,034 2,743 4,981 2663 1680 2701 2261Residential buildings ( sq. m.) 169 11 31 2 4 5 1,658 295 670 54 669 77 16 26 198 31 96 11 4 7Public buildings (sq. m.) 201 130 269 131 334 84 438 291 238 115 283 78 243 74 139 74 276 89 252 172Educational buildings (sq. m.) 393 102 146 105 306 186 261 192 239 119 241 134 278 217 130 297 337 186 335 267Hospital and others (sq. m.) 46 2 35 18 38 11 37 7 63 4 43 55 48 29 39 16 58 12 62 17Streets and bridges (l.m.) 786 127 2,427 227 1,862 475 1,031 272 1,039 333 1,411 297 1141 214 759 127 837 310 718 104Water supply system 131 76 485 329 155 115 530 74 302 356Other projects 383 154 465 280 339 2,219 407 341 795 534
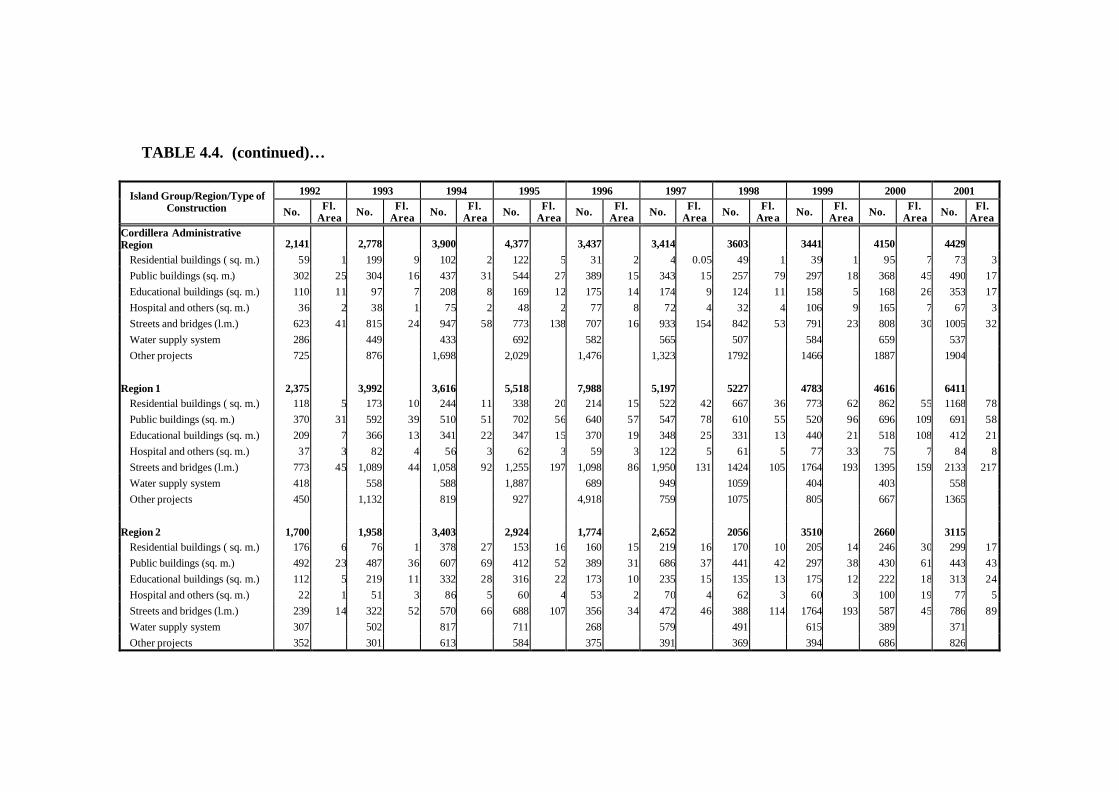
TABLE 4.4. (continued)…
1992 1993 1994 1995 1996 1997 1998 1999 2000 2001 Island Group/Region/Type of Construction No. Fl.
Area No. Fl. Area No. Fl.
Area No. Fl. Area No. Fl.
Area No. Fl. Area No. Fl.
Area No. Fl. Area No. Fl.
Area No. Fl. Area
Cordillera Administrative Region 2,141 2,778 3,900 4,377 3,437 3,414 3603 3441 4150 4429
Residential buildings ( sq. m.) 59 1 199 9 102 2 122 5 31 2 4 0.05 49 1 39 1 95 7 73 3 Public buildings (sq. m.) 302 25 304 16 437 31 544 27 389 15 343 15 257 79 297 18 368 45 490 17 Educational buildings (sq. m.) 110 11 97 7 208 8 169 12 175 14 174 9 124 11 158 5 168 26 353 17 Hospital and others (sq. m.) 36 2 38 1 75 2 48 2 77 8 72 4 32 4 106 9 165 7 67 3 Streets and bridges (l.m.) 623 41 815 24 947 58 773 138 707 16 933 154 842 53 791 23 808 30 1005 32 Water supply system 286 449 433 692 582 565 507 584 659 537 Other projects 725 876 1,698 2,029 1,476 1,323 1792 1466 1887 1904
Region 1 2,375 3,992 3,616 5,518 7,988 5,197 5227 4783 4616 6411 Residential buildings ( sq. m.) 118 5 173 10 244 11 338 20 214 15 522 42 667 36 773 62 862 55 1168 78 Public buildings (sq. m.) 370 31 592 39 510 51 702 56 640 57 547 78 610 55 520 96 696 109 691 58 Educational buildings (sq. m.) 209 7 366 13 341 22 347 15 370 19 348 25 331 13 440 21 518 108 412 21 Hospital and others (sq. m.) 37 3 82 4 56 3 62 3 59 3 122 5 61 5 77 33 75 7 84 8 Streets and bridges (l.m.) 773 45 1,089 44 1,058 92 1,255 197 1,098 86 1,950 131 1424 105 1764 193 1395 159 2133 217 Water supply system 418 558 588 1,887 689 949 1059 404 403 558 Other projects 450 1,132 819 927 4,918 759 1075 805 667 1365
Region 2 1,700 1,958 3,403 2,924 1,774 2,652 2056 3510 2660 3115 Residential buildings ( sq. m.) 176 6 76 1 378 27 153 16 160 15 219 16 170 10 205 14 246 30 299 17 Public buildings (sq. m.) 492 23 487 36 607 69 412 52 389 31 686 37 441 42 297 38 430 61 443 43 Educational buildings (sq. m.) 112 5 219 11 332 28 316 22 173 10 235 15 135 13 175 12 222 18 313 24 Hospital and others (sq. m.) 22 1 51 3 86 5 60 4 53 2 70 4 62 3 60 3 100 19 77 5 Streets and bridges (l.m.) 239 14 322 52 570 66 688 107 356 34 472 46 388 114 1764 193 587 45 786 89 Water supply system 307 502 817 711 268 579 491 615 389 371 Other projects 352 301 613 584 375 391 369 394 686 826

TABLE 4.4. (continued)…
1992 1993 1994 1995 1996 1997 1998 1999 2000 2001 Island Group/Region/Type of Construction No. Fl.
Area No. Fl. AreaNo. Fl.
Area No. Fl. Area No. Fl.
Area No. Fl. Area No. Fl.
Area No. Fl. Area No. Fl.
Area No. Fl. Area
Region 3 4,214 5,062 5,422 11,908 6,468 418 13,268 7350 4257 7322 7832 Residential buildings ( sq. m.) 761 49 595 36 467 56 5,634 177 1,020 67 6,061 163 1390 84 449 40 662 76 649 50Public buildings (sq. m.) 983 64 666 70 665 101 837 118 837 124 802 55 784 46 603 46 640 136 740 90Educational buildings (sq. m.) 259 19 436 44 578 36 705 39 750 92 696 37 565 39 745 58 1057 67 1480 90Hospital and others (sq. m.) 65 5 96 7 138 6 108 7 150 5 117 51 163 10 96 10 220 27 135 14Streets and bridges (l.m.) 641 162 827 173 1,146 270 1,198 152 1,140 130 2,120 123 1143 119 483 34 1312 182 1497 228Water supply system 854 1,470 1,816 2,218 1,264 1,998 1888 889 1724 1784 Other projects 651 972 612 1,208 1,307 1,474 1417 992 1707 1547
Region 4 8,204 12,452 13,468 14,015 13,781 13,909 12503 13202 15096 17,704 Residential buildings ( sq. m.) 1,383 102 5,208 140 3,941 212 2,899 261 637 56 1,387 85 822 59 3435 92 1221 65 2125 94Public buildings (sq. m.) 1,193 125 1,273 113 1,437 318 1,650 210 1,563 138 1,747 181 1484 109 1788 148 1900 150 2015 158Educational buildings (sq. m.) 780 30 973 52 1,378 68 1,332 77 1,840 90 1,708 146 1587 80 1761 85 2391 110 2372 193Hospital and others (sq. m.) 110 4 207 8 245 10 296 9 254 21 315 17 259 13 327 17 360 19 327 12Streets and bridges (l.m.) 1,518 242 1,855 317 2,396 322 2,959 335 2,409 379 3,216 549 2319 350 859 120 3666 386 3642 509Water supply system 2,148 1,739 2,289 2,901 2,305 2,290 3437 2023 1963 3582 Other projects 1,072 1,197 1,782 1,978 4,773 3,246 2595 3009 3595 3641
Region 5 2,963 2,672 3,317 4,294 3,532 3,948 3574 5162 4183 3882 Residential buildings ( sq. m.) 25 2 72 7 52 3 517 65 528 61 119 11 200 15 237 11 93 6 171 5Public buildings (sq. m.) 293 21 440 36 587 73 588 41 533 43 523 42 522 29 564 30 610 40 519 24Educational buildings (sq. m.) 45 10 389 21 268 15 232 15 259 12 453 13 223 8 326 22 312 21 416 21Hospital and others (sq. m.) 16 - 60 2 65 2 133 13 108 4 134 4 65 2 67 2 110 4 99 2Streets and bridges (l.m.) 472 39 706 50 1,144 61 896 119 667 70 1,111 65 928 54 2324 275 977 95 1078 123Water supply system 1,600 436 348 366 284 490 617 310 1259 377 Other projects 512 569 853 1,562 1,153 1,118 1019 1334 822 1222

TABLE 4.4. (continued)…
1992 1993 1994 1995 1996 1997 1998 1999 2000 2001 Island Group/Region/Type of Construction No. Fl.
Area No. Fl. Area No. Fl.
Area No. Fl. Area No. Fl.
Area No. Fl. Area No. Fl.
Area No. Fl. Area No. Fl.
Area No. Fl. Area
VISAYAS 8,836 14,820 11,984 16,667 15,995 15,096 20036 13801 17,548 15931 Residential buildings ( sq. m.) 258 16 498 36 1,313 105 1,205 80 1,576 256 1,440 98 2227 138 2639 181 1,465 94 1832 129Public buildings (sq. m.) 1,700 118 2,341 177 2,223 218 2,371 246 2,130 199 2,357 226 1816 196 2112 0 2,377 180 2315 191Educational buildings (sq. m.) 547 32 1,115 63 1,160 82 1,473 100 1,781 113 1,426 97 1189 94 1303 0 2,059 49 1661 95Hospital and others (sq. m.) 140 12 319 17 328 27 392 23 450 12 339 17 287 17 345 0 389 24 456 22Streets and bridges (l.m.) 1,407 281 2,945 274 2,110 201 3,676 523 3,355 262 2,434 285 2236 233 2102 236 3,573 408 3147 299Water supply system 2,425 3,166 2,176 3,830 3,494 4,099 6670 0 2875 0 3,178 0 3398 0Other projects 2,359 4,436 2,674 3,720 3,209 3,001 5611 0 2425 0 4,507 0 3122 0
Region 6 4,824 8,916 4,681 7,391 6,648 7,761 11623 6136 8,950 7,671 Residential buildings ( sq. m.) 52 5 241 14 221 16 197 17 357 20 307 19 479 32 395 24 387 24 329 20Public buildings (sq. m.) 899 54 1,184 96 970 83 1,030 76 848 77 1,003 99 869 67 876 61 1,421 174.43 977 131Educational buildings (sq. m.) 357 20 696 42 667 38 779 50 960 67 779 37 640 34 782 32 1,118 5 993 57Hospital and others (sq. m.) 72 8 158 9 152 10 205 13 161 8 155 7 100 5 152 10 142 11 162 8Streets and bridges (l.m.) 740 70 1,693 113 968 98 1,253 234 906 148 1,023 90 862 53 773 60 1,628 194 1287 92Water supply system 1,243 2,038 590 2,231 1,924 3,071 5232 2086 2,016 2488 Other projects 1,461 2,906 1,113 1,696 1,492 1,423 3441 1072 2,238 1435
Region 7 2,116 2,667 3,915 4,053 6,131 4,455 4066 4431 4,778 4,502 Residential buildings ( sq. m.) 49 2 130 8 798 64 578 32 948 217 863 52 998 60 1448 72 816 48 1101 76Public buildings (sq. m.) 429 27 474 44 575 85 736 100 730 61 885 65 518 84 724 85.5 914 78.0 716.0 68.6Educational buildings (sq. m.) 103 7 198 9 287 27 434 33 537 30 429 42 283 45 314 30.4 502 26.2 321.0 18.6Hospital and others (sq. m.) 39 2 60 3 95 6 86 7 185 1 125 7 113 5 100 4.8 156 8.8 206.0 7.9Streets and bridges (l.m.) 264 194 582 75 540 35 751 67 1,733 53 810 122 725 72 738 121 888 78 883 72Water supply system 710 637 1,113 827 1,183 647 640 406 505 397 Other projects 522 586 507 641 815 696 789 701 997 878

TABLE 4.4. (continued)…
1992 1993 1994 1995 1996 1997 1998 1999 2000 2001 Island Group/Region/Type of Construction No. Fl.
Area No. Fl. Area No. Fl.
Area No. Fl. Area No. Fl.
Area No. Fl. Area No. Fl.
Area No. Fl. Area No. Fl.
Area No. Fl. Area
Region 8 1,896 3,237 3,388 5,223 3,216 2,880 4347 3234 4,425 3,634 Residential buildings ( sq. m.) 157 9 127 14 294 25 430 31 271 19 270 27 750 46 796 85 262 21 402 34Public buildings (sq. m.) 372 37 683 37 678 50 605 70 552 61 469 63 429 46 512 55 647 54 498 47Educational buildings (sq. m.) 87 5 221 12 206 17 260 17 284 16 218 18 266 14 207 10 439 17 347 19Hospital and others (sq. m.) 29 2 101 5 81 11 101 3 104 3 59 3 74 7 93 4 91 4 88 6Streets and bridges (l.m.) 403 17 670 86 602 68 1,672 222 716 61 601 74 649 108 591 55 1,057 136 977 135Water supply system 472 491 473 772 387 381 798 383 657 513 Other projects 376 944 1,054 1,383 902 882 1381 652 1,272 809
MINDANAO 8,518 10,441 12,949 13,798 13,509 15,460 10,659 11,159 669 15,411 10,194 Residential buildings ( sq. m.) 779 68 657 32 773 38 1,829 118 2,710 190 1,820 100 1614 0 1873 133 2,518 145 1260 81Public buildings (sq. m.) 2,084 159 2,646 209 3,257 310 2,826 529 2,877 407 1,803 187 1804 0 1990 145 2,899 305 1753 237Educational buildings (sq. m.) 768 68 1,187 83 1,547 114 1,777 139 1,706 99 1,205 79 1064 0 1170 62 1,620 544 1545 92Hospital and others (sq. m.) 165 7 265 10 608 27 409 38 398 16 322 26 368 0 386 29 605 45 372 20Streets and bridges (l.m.) 1,414 170 2,032 277 2,645 534 2,477 471 2,031 346 6,730 522 2024 0 2024 301 2,957 407 2327 385Water supply system 2,059 1,567 1,798 2,101 1,228 1,467 1497 1703 1,860 1432 Other projects 1,249 2,087 2,321 2,379 2,559 2,113 2288 2013 2,952 1505
Region 9 1,160 1,934 2,272 2,604 2,106 1,942 2099 2420 2794 2175 Residential buildings ( sq. m.) 15 2 185 9 293 8 671 29 695 48 580 36 573 40 444 30 689 39 172 11Public buildings (sq. m.) 361 23 471 47 513 40 411 119 493 64 280 36 263 26 278 21 431 45 439 44Educational buildings (sq. m.) 62 6 222 31 228 30 488 38 180 16 143 17 180 10 156 11 185 15 322 21Hospital and others (sq. m.) 13 1 46 2 131 3 120 7 69 3 55 2 40 1 151 16 143 17 68 5Streets and bridges (l.m.) 246 63 473 103 640 83 455 40 290 17 366 54 534 32 363 38 643 101 543 102Water supply system 351 299 251 231 121 253 264 769 313 303 Other projects 112 238 216 228 258 265 245 259 390 328

TABLE 4.4. (continued)…
1992 1993 1994 1995 1996 1997 1998 1999 2000 2001 Island Group/Region/Type of Construction No. Fl.
Area No. Fl. Area No. Fl.
Area No. Fl. Area No. Fl.
Area No. Fl. Area No. Fl.
Area No. Fl. Area No. Fl.
Area No. Fl. Area
Region 10 2,801 3,674 5,062 4,284 4,044 3,760 3334 3420 4190 2825 Residential buildings ( sq. m.) 237 7 276 13 197 12 549 48 643 39 760 39 607 45 732 60 763 47 594 35Public buildings (sq. m.) 741 40 1,090 63 1,695 94 1,076 149 776 80 564 81 462 56 527 60 679 113 468 131Educational buildings (sq. m.) 255 9 451 27 678 35 603 43 549 33 533 28 258 14 526 23 621 258 528 35Hospital and others (sq. m.) 53 2 115 4 221 18 127 18 106 6 104 17 76 7 63 4 184 5 100 5Streets and bridges (l.m.) 448 71 689 122 962 262 751 168 516 183 749 120 477 94 673 154 923 116 547 137Water supply system 713 460 567 507 437 377 408 339 401 243 Other projects 354 593 742 671 1,017 673 1046 560 619 345
Region 11 3,181 3,490 3,889 4,998 4,352 3,619 3666 4149 5735 3313 Residential buildings ( sq. m.) 53 1 64 4 186 12 411 32 606 59 361 20 381 16 630 34 784 37 165 11Public buildings (sq. m.) 804 63 827 57 694 101 1,067 202 982 96 644 45 811 50 935 49 1524 109 578 37Educational buildings (sq. m.) 345 42 393 19 444 41 509 31 709 17 398 17 408 17 356 16 613 28 433 22Hospital and others (sq. m.) 51 3 84 3 193 4 120 9 138 4 124 5 137 5 119 7 206 9 124 7Streets and bridges (l.m.) 525 25 497 30 704 103 975 161 559 76 646 239 596 87 700 72 928 103 761 84Water supply system 705 620 726 734 462 597 568 385 854 675 Other projects 698 1,005 942 1,182 896 849 765 1024 826 577
Region 12 1,376 1,343 1,726 1,338 2,491 5,849 1218 932 2124 1636 Residential buildings ( sq. m.) 474 58 132 6 97 6 198 9 766 44 54 3 15 3 59 8 231 10 301 22Public buildings (sq. m.) 178 33 258 42 355 75 192 44 472 151 252 21 223 14 200 12 182 25 206 13Educational buildings (sq. m.) 106 11 121 6 197 8 153 23 194 29 109 14 163 14 87 7 131 234 243 12Hospital and others (sq. m.) 48 1 20 1 63 2 37 4 65 2 34 2 75 7 35 1 40 3 69 3Streets and bridges (l.m.) 195 11 373 22 339 86 218 69 474 33 4,884 92 351 66 209 25 303 18 411 38Water supply system 290 188 254 276 177 223 220 180 239 190 Other projects 85 251 421 264 343 293 171 162 998 216

TABLE 4.4. (continued)…
1992 1993 1994 1995 1996 1997 1998 1999 2000 2001 Island Group/Region/Type of Construction No. Fl.
Area No. Fl. Area No. Fl.
Area No. Fl. Area No. Fl.
Area No. Fl. Area No. Fl.
Area No. Fl. Area No. Fl.
Area No. Fl. Area
Caraga 2,054 Residential buildings ( sq. m.) 32916.108Public buildings (sq. m.) 344111.20Educational buildings (sq. m.) 434 36.48Hospital and others (sq. m.) 58 3.79Streets and bridges (l.m.) 279 28.22Water supply system 305 Other projects 305
ARRM 574 516 290 342 238 568.0 245.0 Residential buildings ( sq. m.) 0 0 0 0 65 2 38 3 8 0.3 51.0 12.0 28.0 1.7Public buildings (sq. m.) 80 15 154 16 63 5 45 2 50 3 83 14 62 12Educational buildings (sq. m.) 24 4 74 4 22 3 55 4 45 4 70 9 19 2Hospital and others (sq. m.) 5 - 20 1 5 0.32 40 3 18 0.8 32.0 10.5 11.0 0.2Streets and bridges (l.m.) 78 33 192 37 85 18 66 16 79 11 160 67 65 23Water supply system 353 31 17 37 30 53 21
Other projects 34 45 33 61 8 119 39 Note: - less than 500 Source: NSO

TABLE 4.5. LENGTH OF NATIONAL ROADS BY TYPE OF SURFACE, 1992 to 1998 and 2000 to 2002
Island Group/Region 1987 1990 1991 1992 1993 1994 1995 1996 1997 1998 2,000 2001 2002
PHILIPPINES 26,082 26,272 26,422 26,554 26,593 26,659 26,721 27,370 27,750 27,895 29,732 31,988 30,030 Concrete 6,180 6,731 7,055 7,250 7,270 7,447 7,574 8,349 8,800 9,294 10,611 11,312.94 11,911 Asphalt 5,794 6,011 6,371 6,379 6,388 6,375 6,395 6,806 6,894 6,735 6,636 6817.14 7,048 Gravel 13,400 13,321 12,770 12,709 12,719 12,623 12,623 11,862 11,675 11,486 11,875 11,135.84 10,335 Earth 708 209 226 216 216 214 129 353 381 380 610 2,722.07 736
LUZON 12,350 12,338 12,405 12,404 12,435 12,539 12,612 12,849 13,013 13,166 11,394 14,205 14,074
Concrete 3,060 3,191 3,256 3,360 3,380 3,571 3,652 3,927 4,145 4,315 4,832 5,084 4,641 Asphalt 3,061 3,131 3,372 3,210 3,218 3,043 3,182 3,294 3,376 3,329 2,598 3,420 4,172 Gravel 5,967 5,974 5,715 5,798 5,799 5,858 5,746 5,454 5,256 5,265 3,670 5,259 4,797 Earth 262 42 62 36 38 67 32 174 236 257 293 441 465
NCR 882.00 888.00 902.00 952.00 977.00 888.00 904.00 867.00 867.00 867.00 893 890.98 891
Concrete 447 513 550 579 580 540 510 597 597 606 644 639.73 641
Asphalt 421 368 348 369 393 344 390 270 270 261 249 251.25 249
Gravel 14 7 4 4 4 4 4 - - - - - -
Earth - - - - - - - - - - - - 1.08 CAR 1,613 1,603 1,595 1,586 1,589 1,596 1,596 1,759 1,819 1,820 1,880 1,949 1,863
Concrete 101 86 129 150 150 157 157 243 304 319 372 393.56 451 Asphalt 294 280 227 203 204 206 206 144 125 119 92 97.01 98 Gravel 1,174 1,237 1,239 1,233 1,235 1,233 1,233 1,372 1,366 1,358 1,311 1,340.07 1,189 Earth 44 - - - - - - - 24 24 105 118.56 125
Region 1 1,429 1,454 1,495 1,489 1,489 1,499 1,493 1,493 1,488 1,483.00 1,612 1,610.87 1,691 Concrete 402 492 425 443 443 494 513 581 623 638 731 723.05 788 Asphalt 636 615 749 679 679 660 637 575 573 560 573 569.82 586 Gravel 357 315 296 367 367 336 334 244 196 187 205 206.45 201 Earth 34 32 25 - - 9 9 93 96 98 104 111.55 116

TABLE 4.5. (continued)….
Island Group/Region 1987 1990 1991 1992 1993 1994 1995 1996 1997 1998 2,000 2001 2002
Region 2 1,650 1,655 1,678 1,705 1,707 1,709 1,709 1,733 1,733 1,736 1,833 1,860 1,897
Concrete 545 568 571 607 607 632 658 654 723 733 814 822.37 839Asphalt 98 77 120 79 79 65 117 166 174 174 218 221.38 273Gravel 954 1,010 987 1,019 1,019 1,010 934 913 836 804 773 761.23 712Earth 53 - - - 2 2 - - - 25 29 54.94 72
Region 3 1,693 1,701 1,698 1,698 1,698 1,705 1,654 1,669 1,683 1,683 1,742 1,841 1,997Concrete 797 815 821 821 821 830 850 824 798 824 891 972.93 905Asphalt 504 527 545 545 545 546 642 667 735 715 688 716.96 760Gravel 392 359 332 332 332 329 162 178 127 123 127 114.52 304Earth - - - - - - - - 23 21 37 36.58 29
Region 4 4,029 3,946 3,963 3,950 3,957 4,022 4,162 4,188 4,293 4,331 2,102 4,740 4,527Concrete 567 598 653 663 682 736 762 812 897 988 1,130 1231.86 1,386Asphalt 1,192 1,238 1,350 1,352 1,359 1,270 1,284 1,381 1,443 1,437 645 1410.1 1,424Gravel 2,181 2,110 1,942 1,918 1,899 1,970 2,103 1,924 1,870 1,819 309 1982.37 1,610Earth 89 - 18 17 17 46 13 71 83 87 18 115.69 107
Region 5 1,936 1,979 1,976 1,976 1,995 2,008 1,998 2,007 1,997 2,113 2,224 2,204 2,227Concrete 648 632 657 676 677 722 712 813 800 813 894 940.56 838Asphalt 337 394 381 352 352 296 296 361 326 324 383 405.03 592Gravel 909 943 919 929 947 980 980 823 861 974 947 854.03 782Earth 42 10 19 19 19 10 10 10 10 2 - 4.03

TABLE 4.5. (continued)…
Island Group/Region 1987 1990 1991 1992 1993 1994 1995 1996 1997 1998 2,000 2001 2002
VISAYAS 6,263 6,390 6,425 6,469 6,455 6,479 6,481 6,649 6,774 6,784 7,067 7,224 7,123Concrete 1,134 1,384 1,474 1,506 1,506 1,510 1,627 1,851 1,935 2,086 2,495 2,855 2,959Asphalt 1,523 1,556 1,608 1,718 1,695 1,771 1,613 2,025 2,091 2,004 1,941 2,066 1,987Gravel 3,507 3,427 3,335 3,237 3,246 3,168 3,211 2,711 2,634 2,575 2,557 2,217 2,087Earth 99 23 8 8 8 30 30 62 114 119 74 87 91
Region 6 2,633 2,671 2,671 2,670 2,670 2,671 2,712 2,843 2,842 2,866 2,932 2,950 2,923Concrete 307 332 358 384 384 383 406 539 563 573 699 838.3 882Asphalt 789 708 730 733 733 727 703 941 983 982 949 1,005.23 979Gravel 1,534 1,612 1,579 1,549 1,549 1,551 1,593 1,333 1,266 1,268 1,253 1,070.13 1,026Earth 3 19 4 4 4 10 10 30 30 43 31 36.23 36
Region 7 1,667 1,663 1,659 1,696 1,682 1,703 1,664 1,677 1,676 1,677 1,808 1,907 1,877Concrete 165 178 211 211 211 207 301 240 276 400 592 688.57 700Asphalt 677 648 675 783 760 846 712 875 890 817 768 852.52 797Gravel 821 833 769 698 707 640 641 558 504 454 443 361.94 372Earth 4 4 4 4 4 10 10 4 6 6 5 4.4 8
Region 8 1,963 2,056 2,095 2,103 2,103 2,105 2,105 2,129 2,256 2,241 2,327 2,367 2,324Concrete 662 874 905 911 911 920 920 1,072 1,096 1,113 1,204 1,327.83 1,377Asphalt 57 200 203 202 202 198 198 209 218 205 223 207.8 211Gravel 1,152 982 987 990 990 977 977 820 864 853 861 784.74 689Earth 92 - - - - 10 10 28 78 70 38 46.2 47

TABLE 4.5. (continued)…
Island Group/Region 1987 1990 1991 1992 1993 1994 1995 1996 1997 1998 2000 2001 2002
MINDANAO 6,588 6,652 6,690 6,729 6,729 6,754 6,724 7,004 7,104 7,110 7,739 9,668 7,815
Concrete 1,540 1,642 1,778 1,805 1,806 1,828 1,786 1,974 2,122 2,285 2,608 2,734 3,105Asphalt 789 954 1,042 1,083 1,082 1,216 1,209 1,217 1,217 1,143 1,058 1,080 1,079Gravel 3,912 3,912 3,715 3,670 3,670 3,592 3,662 3,697 3,684 3,647 3,927 3,660 3,451Earth 347 144 155 171 171 118 67 116 81 35 147 2,194 179
Region 9 1,020 1,062 1,079 1,092 864 1,086 858 1,006 1,008 1,008 1,165 1,141 1,052Concrete 53 78 80 136 94 137 111 137 171 191 238 239.45 236Asphalt 313 329 344 301 274 293 287 369 339 317 290 288.13 292Gravel 654 655 655 655 496 656 460 500 498 495 632 607.92 520Earth - - - - - - - - - 5 5 5.31 5
Region 10 2,152 2,194 2,201 2,202 2,202 2,227 1,335 1,315 1,317 1,332 1,387 1,377 1,615Concrete 635 673 648 659 659 661 263 314 358 382 437 459.18 640Asphalt 317 427 462 511 511 641 481 391 361 363 348 332.89 348Gravel 1,200 1,081 1,090 1,031 1,031 925 591 610 598 587 593 575.59 617Earth - 13 1 1 1 - - - - - 10 9.7 10
Region 11 1,954 1,967 1,978 1,997 1,997 1,996 1,804 1,707 1,823 1,789 1,977 1,841 1,466Concrete 455 474 622 589 589 612 567 549 601 637 714 624.99 628Asphalt 130 159 143 177 177 191 319 318 367 321 301 325.35 132Gravel 1,224 1,229 1,090 1,091 1,091 1,092 890 776 827 810 900 826.2 676Earth 145 105 123 140 140 101 28 64 28 21 62 64.95 30
Region 12 1,462 1,429 1,432 1,438 948 1,445 777 974 975 973 1,092 1,093 1,387Concrete 397 417 428 421 265 418 201 288 294 351 402 390.08 477Asphalt 29 39 93 94 94 91 89 114 122 112 99 99.91 257Gravel 834 947 880 893 559 919 448 520 506 503 523 534.44 528Earth 202 26 31 30 30 17 39 52 53 7 68 68.39 125

TABLE 4.5. (continued)…
Island Group/Region 1987 1990 1991 1992 1993 1994 1995 1996 1997 1998 2,000 2001 2,002
Region 13 - - - - - - 1,225 1,277 1,256 1,283 1,382 3,415 1,362
Concrete - - - - - - 436 478 490 516 540 547.18 623Asphalt - - - - - - 13 5 8 10 13 13.82 27Gravel - - - - - - 776 794 758 755 828 816.13 710Earth - - - - - - - - - 2 2 2038.26 1
ARRM - - - - 718 - 725 725 725 725 736 801 932Concrete - - - - 199 - 208 208 208 208 277 473.3 502Asphalt - - - - 26 - 20 20 20 20 7 19.94 23Gravel - - - - 493 - 497 497 497 497 451 300.08 400Earth - - - - - - - - - - - 7.28 7
Note: a/ Includes the North Luzon Expressway (84 kms) and the South Luzon Expressway (43 kms) Source(s): Bureau of Maintenance (Inventory and Statistics Division) and Planning Service
(Infrastructure Planning, Research and Statistics Division), DPWH

TABLE 4.6a. LENGTH OF LOCAL ROADS BY TYPE OF SURFACE 2000 and 2001 (in kilometers)
2000 2001
Type of Surface Type of Surface
Concrete Asphalt Gravel Earth Concrete Asphalt Gravel Earth Region
Length Length Length Length
Total
Length Length Length Length
Total
N. C. R. 1,838.01 1,790.06 25.96 69.33 3,723.36 1838.01 1790.056 29.955 69.334 3727.355C. A. R. 425.37 91.65 2,289.86 4,375.51 7,182.38 425.365 91.648 2289.856 4375.508 7182.377Region I 2,316.83 898.24 8,215.61 1,735.65 13,166.33 2316.834 898.237 8215.609 1735.654 13166.334Region II 565.10 203.57 7,843.82 4,423.18 13,035.66 565.096 203.567 7784.686 4423.181 12976.53Region III 3,028.92 723.67 7,139.00 2,590.16 13,481.74 3028.919 723.669 7139 2590.155 13481.743Region IV 3,259.12 565.82 7,972.39 5,966.19 17,763.52 3259.123 565.823 7972.393 5966.185 17763.524Region V 962.08 451.49 2,990.81 2,595.82 7,000.20 962.078 451.491 2990.809 2595.82 7000.198Region VI 1,512.33 207.87 8,980.53 4,115.52 14,816.25 1512.325 207.874 8980.529 4115.517 14816.245Region VII 991.21 616.64 7,522.48 4,563.76 13,694.09 991.214 616.642 7522.477 4563.759 13694.092Region VIII 732.32 40.97 4,241.72 2,327.52 7,342.52 732.315 40.967 4241.72 2327.517 7342.519Region IX 585.57 88.05 5,474.73 3,454.77 9,603.12 579.188 74.054 5351.741 3438.706 9442.818Region X 580.60 143.67 5,332.73 7,614.52 13,671.51 580.603 143.67 5332.725 7614.516 13671.514Region XI 370.75 683.11 9,190.72 5,560.66 15,805.24 370.75 683.106 9190.719 5560.661 15805.236Region XII* 224.63 19.13 3,674.47 4,609.36 8,527.59 224.631 19.134 3674.469 4609.356 8527.59A. R. M. M. 109.13 53.99 5,745.87 679.88 6,588.87 180.677 54.229 5812.653 733.793 6781.352Caraga 440.29 14.86 4,254.17 1,567.62 6,276.94 440.292 14.864 4254.171 1567.615 6276.942 Philippines 18,059.21 6,594.00 91,024.11 56,303.34 171,980.66 18,059.21 6,593.997 90,963.983 56,303.344 171,925.534
* Excludes data on Cotabato and Marawi Cities Source: The Countryside in Figures, 2001 Edition, NSCB

TABLE 4.6b. LENGTH OF LOCAL ROADS BY TYPE OF SURFACE (as of December 2002) in kilometers
Type of Surface
Concrete Asphalt Gravel Earth Region
Length Length Length Length
Total
N. C. R. 1,838.01 1,790.06 25.96 69.33 3,723.36C. A. R. 425.37 91.65 2,289.86 4,375.51 7,182.38Region I 2,250.78 884.45 8,215.61 1,735.65 13,086.50Region II 561.50 195.53 7,784.69 4,423.18 12,964.89Region III 3,089.75 738.17 7,907.83 2,775.95 14,511.70Region IV 3,167.43 546.15 7,198.40 5,780.39 16,692.38
CALABARZON 2,722.45 450.18 2,693.71 3,314.51 9,180.85MIMAROPA 444.98 95.98 4,504.69 2,465.88 7,511.53
Region V 962.08 451.49 2,990.81 2,595.82 7,000.20Region VI 1,512.33 207.87 8,980.53 415.52 14,816.25Region VII 991.21 606.64 7,522.48 4,563.76 13,694.09Region VIII 732.32 40,967.00 4,241.72 2,327.52 7,342.52Region IX 566.97 79.55 4,967.76 3,174.95 8,789.22Region X 687.73 153.67 6,273.57 8,627.60 15,742.57Region XI 226.58 630.05 5,449.19 3,488.82 9,794.64Region XII 307.08 63.16 6,537.64 5,668.12 12,576.00A. R. M. M. 199.28 62.73 6,301.52 1,013.62 7,577.15Caraga 440.29 14.86 4,254.17 1,567.62 6,276.94 Philippines 17,958.70 6,567.00 90,941.73 56,303.35 171,770.77
Source: Countryside in Figures

TABLE 4.7a. PRODUCTION, IMPORTATION AND CONSUMPTION OF FERTILIZERS 1995 to 2000 (In thousand metric tons)
Plant Nutrients Fertilizer Products Year
Total Nitrogen Phosphorous Potassium Total Urea Ammosul NP & P NPK Potash Others
Production 1995 575.8 215.3 264.4 96.1 1,389.7 - 19.5 502.2 861.0 7.0 - 1996 637.9 255.7 273.4 108.8 1,600.6 - 185.6 489.5 917.5 8.0 - 1997 522.4 213.0 217.1 92.3 1,321.9 - 172.7 357.3 777.0 8.6 6.31998 464.4 184.6 192.7 87.1 1,180.6 - 113.2 320.4 731.6 14.5 0.91999 445.7 186.2 180.8 78.8 1,163.4 - 215.3 388.8 542.6 15.1 1.62000 400.8 168.2 150.1 82.5 1,064.9 - 176.3 269.4 597.9 15.4 5.9
Importation
1995 528.4 383.5 37.4 107.5 1,237.5 651.9 282.1 84.7 - 179.2 39.61996 557.5 368.1 65.9 123.5 1,190.3 660.1 166.3 143.4 - 205.5 15.01997 545.5 369.6 39.1 136.8 1,235.6 640.5 240.9 87.5 6.20 226.3 34.21998 331.7 293.9 15.3 22.5 785.6 550.7 162.8 33.2 - 35.9 3.01999 545.8 381.9 51.4 112.5 1,222.4 682.0 217.5 110.0 5.0 186.2 21.72000 548.0 364.5 79.3 104.3 1,259.9 577.7 294.3 192.0 16.0 172.3 7.6
Consumption
1995 595.0 394.7 129.1 71.2 1,469.4 544.3 182.9 310.4 394.7 25.4 11.71996 601.6 383.5 145.7 72.4 1,626.2 568.7 224.5 333.5 447.5 40.0 12.01997 809.2 548.5 148.3 112.4 2,032.3 742.3 413.3 324.6 453.9 80.7 17.51998 622.4 400.9 121.1 100.4 1,518.2 561.5 208.0 285.1 373.0 77.2 13.41999 744.3 480.6 142.8 120.9 1,864.0 639.5 360.4 324.0 413.2 105.4 21.62000 733.2 488.0 124.1 121.1 1,840.1 667.8 366.8 261.4 423.9 103.3 16.9
Note: Totals may not add up due to rounding off. Source: Fertilizer and Pesticide Authority

TABLE 4.7b. PRODUCTION AND IMPORTATION OF FERTILIZERS 2001 to 2002 (in thousand metric tons)
Production Importation Grade
2001 2002 Grade
2001 2002 Total 1,202,397.4 1,329,468.7 Total 1,030,118.0 906,736.3
21-0-0 187,613.0 187,124.6 Urea 522,679.9 429,133.9 16-20-0 378,871.0 319,335.8 15.5-0-0 164.3 75.8 17-42-0 25,767.0 1,014.0 21-0-0 227,164.8 193,318.2 18-46-0 - 52,668.0 16-20-0 66,950.0 25,300.0 20-10-0 7,475.0 3,939.1 18-46-0 92,043.8 112,718.1 0-18-0 781.0 1,984.8 25-0-0 3,468.0 64.5 17-0-17 5,521.0 5,485.1 14-14-14 5,500.0 45,745.0 6-9-15 - 2,589.7 0-0-60 102,629.9 73,051.7 8-20-14 - 6,314.0 CUSO4 - 1,413.0 10.5-15-15 10,388.0 7,533.0 FeSO4 418.0 892.0 10-10-20 1,096.0 704.4 ZnSO4 842.0 790.1 10-15-20 - 639.5 NaNO3 319.1 168.6 12-0-20 - 69.3 NHNO3 264.0 19,029.1 12-12-12 2,746.0 1,478.5 KNO3 7,674.3 4,856.3 14-14-14 457,287.0 440,928.6 Ammo NO3 - 180.0 16-8-8 - 37,150.0 16-16-8 104,710.0 241,439.0 17-7-17 - 2,398.7 0-0-50 14,994.3 15,077.2 0-0-60 3,888.8 - Kieserite 1,259.3 1,595.5
Source: FPA

Table 4.8. INVENTORY OF LAND AREA RECLAIMED NATIONWIDE, Prior to 1988, 1993 to 2001 (in hectares)
Reclaimed Areas
Name of Project Status Areas to be Reclaimed Prior to
1988 1993 1994 1995 1996 1997 1998 1999 2000 2001 Total
Areas Still to be
Reclaimed (As of
December 1998)
I. National Capital Region 1. CCP/Financial Center Area completed 154 154 154- 2. Central Business Park I- Island A incomplete 200 141 10 43 5 199 1 3. Central Business Park I- Islands B and C incomplete 204 20 25 19 95 179 185 19 4. Central Business Park II, original completed 43 43 43 - 5. Central Business Park II, seaside channel completed 4 4 4 - 6. Asiaworld, original completed 173 173 173 - 7. Asiaworld, Inland Channel Reclamation completed 11 11 11 - 8. Cyber Bay City incomplete 750 157 157 593 9. Manila-Cavite Coastal Road ROW completed 36 36 36 - 10. Smokey Mountain Reclamation/NHA completed 79 40 39 79 - 11. Odessa Fishing completed 1 1 1 -
Sub-Total 1,655 704 60 65 19 116 64 9 5 - - 1,042 613 II. Region I
1. Badoc, Ilocos Norte unauthorized 3 3 3 - 2. Suan, Pangasinan unauthorized 42 42 42 -
Sub-Total 45 - - - - 3 42- - - - 45 - III. Region III
1. Tarlac Reclamation completed 15 15 15 - Sub-Total 15 - 15 - - - -- - - - 15

Table 4.8. (continued)…
Reclaimed Areas
Name of Project Status Areas to be Reclaimed Prior to
1988 1993 1994 1995 1996 1997 1998 1999 2000 2001 Total
Areas Still to be
Reclaimed (as of
December 1998)
Region IV 1. Farmix Bulk Terminal/Mabini, Batangas unauthorized 9 9 9 - 2. Pagbilao Power Plant (NPC) unauthorized 34 34 34 - 3. Cavite City Public Market (Phase 1) completed 19 19 19 - 4. JG Summit Petrochem, Batangas unauthorized 5 5 5 - 5. Cavite City, Villa Porta Vaga completed 12 12 12 - 6. Batangas/JG Summit unauthorized 5 5 5 -
Sub-Total 84 12 19 - - 10 - - 34 - 9 84 - V. Region V
1. Naga City, Tinaan/Apo Cement completed 5 5 5 - Sub-Total 5 - 5 - - - - - - - - 5 - VI. Region VI
1. BREDCO on-going 250 125 60 185 65 2. GD Fishing, Bacolod City, Negros
Occidental unauthorized 1 1 1 - 3. San Carlos City, Negros unauthorized 18 18 18 -
Sub-Total 269 126 - 18 - - - - - - 60 204 65

Table 4.8. (continued)…..
Reclaimed Areas
Name of Project Status Areas to be Reclaimed Prior to
1988 1993 1994 1995 1996 1997 1998 1999 2000 2001 Total
Areas Still to be
Reclaimed (As of
December 1998)
VII. Region VII 1. Cebu Po rt Centre completed 169 169 169 - 2. Bogo, Cebu unauthorized 5 5 5 - 3. Ubay Commercial Mix. Bohol unauthorized 5 5 5 - 4. Talibon Public Market Expansion/Bohol unauthorized 1 1 1 - Sub-Total 180 174 - - - - 5 - - 1 - 180 -
VIII. Region IX to XII
1. Zamboanga City/Cawit Port Facility unauthorized 2 2 2 - Sub-Total 2 - - - - 2 - - - - - 2 -
GRAND TOTAL 2,255 1,016 99 83 19 131 111 9 39 1 69 1,577 678
Source: PEA

TABLE 4.9. HAZARDOUS WASTE GENERATION, AMOUNT BY TYPE OF HAZARDOUS WASTE (as of year 2000)
HW Code Generation Amount (tons/year) Rate
A. Plating wastes 11,233 4 B. Acid Wastes 26,900 9.7 C. Alkali Wastes 56,099 20.2 D. Inorganic Chemical Wastes 68,103 24.5 E. Reactive chemical Wastes 14,769 5.3 F. Organic solvents 2,216 0.8 G. Putrescible /organic wastes 30,588 11 H. Textile 81 0 I. Oil 22,549 8.1 J. Containers 34,99 1.3 K. immobilized wastes 516 0.2 L. Organic chemicals 16,226 5.8 M. Miscellaneous wastes 25,614 9.2
Total 278,393 100 Source: Ex Corporation Kokusai Kogyo Co. Ktd. 2001. Final Report (Phase I): The Study on hazardous Waste
Management in the Republic of the Philippines.

TABLE 4.10. HAZARDOUS WASTE GENERATION AMOUNT BY TYPE AND INDUSTRIAL CATEGORY
(Unit: tons/year) As of year 2000
PSIC CODE HW1 37 31 32 33 35 37 38 39 41 62
TOTAL
A 282 7 2 1,010 1,300 6%B 73 965 4 231 178 525 360 2,336 10.70%C 112 2 284 402 316 1,116 5.10%D 2,153 226 45 106 0 430 1 4410 7,372 33.80%E 139 2,105 330 267 636 35 3,511 16.10%F 4 104 0 3 112 0.50%G 9 2 1 12 0.10%H 1 1 0.00%I 1,507 67 425 48 1,144 2 21 3,214 14.85J 26 194 0 53 9 282 1.30%K 246 274 3 523 2.40%L 18 4 14 36 0.20%M 0 24 15 1,814 80 1933 8.90%
2,226 3,270 2,597 330 1,822 452 5,593 61 5036 360 21,747 100%TOTAL 10.20% 15.00% 11.09% 1.50% 8.40% 2.10% 25.70% 0.30% 23.20% 1.70% 100.00% 0.00%
PSIC code (1977): 31 - Manufacture of Food, Beverages and Tobacco 32 - Textile, Wearing apparel and Leather Industry 33 - Manufacture of Wood and Wood Products, including Furniture and Fixtures 35 - Manufacture of Chemicals and Chemical, Petroleum, Coal, Rubber and Plastic Products 37 - Basic Metal Industries 38 - Manufacture of Fabricated Metal Products, Machinery and Equipment 39 - Other Manufacturing Industries 41 - Electricity, Gas and Water 62 - Retail Trade
Source: Ex Corporation Kokusai Kogyo Co. Ktd. 2001. Final Report (Phase I): The Study on hazardous Waste Management in the Republic of the Philippines.

TABLE 4.11. REGIONAL DISTRIBUTION OF HW GENERATION AMOUNT BY TYPE OF HW (as of year 2000)
Region A B C D E F G H I J K L M Total
1 249 126 160 2,965 432 5 3,937 2 - - - 3 - 195 531 79 16 7,434 2,083 4 8,596 1 18,939 4 393 17,627 4,701 11,244 2,467 1,225 9 3 7,117 541 479 71 10,735 56,612 5 2 65 3 1 27 98 6 2 2,982 77 855 2,434 50 - 810 7,210 7 1,446 638 164 106 526 283 2,636 11 3,085 2 11 5 8,913 8 321 10,816 - 185 - 11,322 9 60 60 10 - 451 4,846 1,706 - 34 378 13 3 6,726 21 14,178 11 45 4 412 11 74 2,384 1,366 1,222 - 2,253 7,771 12 6 53 286 6,402 10,027 8 1 447 118 4 20 17,372
CARAGA - 31 7 - 4 1 43 ARMM 10 10 CAR 116 27 436 1 13 30 623 NCR 9,228 7,808 41,559 37,046 1,595 671 14,271 65 4,890 1,549 33 812 11,768 131,295
Total 11,234 26,892 56,100 68,103 14,769 2,216 30,588 80 22,548 3,499 515 16,225 25,614 278,383 % 4.0 9.7 20.2 24.5 5.3 0.8 11.0 0.0 8.1 1.3 0.2 5.8 9.2 100.0
A. Plating wastes B. Acid Wastes C. Alkali Wastes D. Inorganic Chemical Wastes E. Reactive chemical Wastes F. Organic solvents G. Putrescible /organic wastes H. Textile I. Oil J. Containers K. immobilized wastes L. Organic chemicals M. Miscellaneous wastes
Source: Ex Corporation Kokusai Kogyo Co. Ktd. 2001. Final Report (Phase I): The Study on hazardous Waste Management in the Republic of the Philippines.

TABLE 4.12. DAMAGES CAUSED BY MAJOR NATURAL DISASTERS, 1990 to 2002
Population Affected Casualties Houses Damaged Value of Damages Year Type of Disaster Date of Occurrence Areas Affected
Families Persons Dead Injured Missing Total Partial (million pesos)
1990Drought Jan-Apr Regions 1-12 220,269 1,189,309 - - - - - 3,386.0
Earthquake Feb 8 Region 7 (Bohol) 10,931 54,059 10 273 - 199 2,949 122.0 Jul 16 Regions 1 to 4, CAR, & NCR 227,918 1,255,248 1,283 2,786 - 25,207 77,249 12,200.0 Flashflood Jun 12 Region 9 (Zamboanga del Sur) 1,534 8,108 36 - - 168 163 40.0 Typhoon Aug 28-30 Regions 1-4, CAR & NCR 130,219 568,675 50 53 - 684 1,961 1,520.0 Nov 10-14 Regions 4-12 1,010,004 5,498,290 508 1,278 - 22,026 630,885 10,846.0
1991Mt. Pinatubo Jun 12-16 Region 3 (6 provinces) 249,371 1,180,132 850 184 - 40,867 67,862 10,424.0 Lahar I Jul to Sep Region 3 (6 provinces) 33,479 161,545 16 9 - 2,378 444 494.0 Drought Jan-Apr Regions 6, 9-12 - - - - - - - 1,631.0 Typhoon Nov 2-6 Region 6 & 8 (Ormoc 43,397 223,985 5,101 292 - 5,232 25,272 1,044.8 City - badly affected) Oct 23-30 Regions 1-2 & CAR 105,317 534,307 82 55 - 8,070 58,305 3,469.3
1992Earthquake Mar 19 Baguio City, - - 1 1 - - - 182.0 Mt. Province, Kalinga
Apayao, Abra Mt. Pinatubo Jul 9 to 21 Region 3 19,932 96,102 6 7 - 1,712 - 551.0 Flashflood Dec 28-30 Region 11 11,430 58,093 17 - - 27 20 134.0 Jul 9-21 Region 3 144,476 707,807 22 - - 1,569 3,137 681.0 Red tide Jun-Dec Regions 3-4 & NCR 6,416 38,500 10 67 - - - - Typhoon Jul 9-12 Regions 2-3 1,027 5,135 3 - - 5 15 21.0 Jul 17-21 Regions 3 & NCR 27,902 134,417 36 77 - 478 1,305 471.0 Aug 16-18 Regions 3-4 & NCR 148,049 725,956 22 - - 1,428 3,072 1,347.0 Aug 26-31 Regions 1-2 & CAR 23,677 114,084 19 1 - 214 197 173.0 Aug 26-Sep Regions 1-2 & CAR 31,787 171,603 10 1 - 393 145 903.0 Sep 18-23 Regions 1-3 & CAR 113,686 570,136 27 13 - 785 3,272 2,155.0
1993 Mt. Mayon Feb 2 Region 5 (8 Mun. of 21,600 106,917 80 9 - - - 73.0 Volcano Albay & Legaspi City)

TABLE 4.12. (continued)…..
Population Affected Casualties Houses Damaged Value of Damages Year Type of Disaster Date of Occurrence Areas Affected
Families Persons Dead Injured Missing Total Partial (million pesos) 1994 Earthquake May 14 Pagadian City 128 729 4 - - 31 92 1.0
Earthquake Jul 5 Southern Leyte - - - 2 - - - 2.7 Lahar III Sept Pampanga 11,805 55,951 20 1 2 1,648 37 10.4 (Bacolor and Porac) 404.2
1996 Earthquake Bohol Earthquake Eastern Samar 2 1.1 1997 Big waves Davao Oriental 132 22 0.2 Flashflood Bukidnon 651 6 4 3 4 0.4 Davao del Norte 2,400 Davao Oriental 10,950 3 18 13 2.9 South Cotabato 150 2 99.0 Zamboanga del Sur 3,600 Flood Agusan del Norte 18,925 213 17.2 Agusan del Sur 9,877 10 16 98 56.0 Bukidnon 190 3 0.5 Butuan City 89,503 2 3 20.4 Davao del Norte 106,339 9 2 22 8 160.8 Davao Oriental 20,942 1 6 27 25.3 Surigao del Norte 44,904 6.3 Surigao del Sur 14,525 10 3 1 21.8 Zamboanga del Norte 11.1 Landslide Agusan del Sur 79 6 8 Bukidnon 265 6 1 0.1 Catanduanes 15 4 3 280.0 Cebu City 327 16 5 20 10 0.3

TABLE 4.12. (continued)…
Population Affected Casualties Houses Damaged Value of Damages Year Type of Disaster Date of Occurrence Areas Affected
Families Persons Dead Injured Missing Total Partial (million pesos) Tornado Antique 21 1 5 0.4 Davao Oriental 488 1 1 11 9 0.2 South Cotabato 31 5 3 Zambales 553 6 16 14 0.3 Zamboanga del Sur 25 5 3 0.2 Typhoon Antique 4.0 Bulacan 145,658 4 25.3 Cagayan 154,149 13 7 2 911 11,078 280.0 Iloilo 11,425 45 59 78.7 Negros Occidental 5,383 2 2 1 1 4.6 Pampanga 115,237 11 1 2 2 136.4
Quezon City 15,000 3 Zambales 66,772 14 22 10 50 13.0
2000 Typhoon Biring May 18-22, 2000 59,404 235,885 12 4 - 55 kph Metro Manila, Pampanga, Bulacan, Bataan, Nueva Ecija Typhoon Edeng July 3-8, 2000 320 1,483,310 66 11 9 95 kph Metro Manila, Tarlac, Bataan, N. Ecija, Bataan Bulacan, Apayao, Kalinga Rizal, Batangas, La Union Ilocos Sur and Norte
Isang Aug. 19-23, 2000 Batanes 2,338 11,690 55 kph Maring Sept. 2-7, 2000 Metro Manila 1,302 6,508 5

TABLE 4.12. (continued)…
Population Affected Casualties Houses Damaged Value of Damages Year Type of Disaster Date of Occurrence Areas Affected
Families Persons Dead Injured Missing Total Partial (million pesos) Ningning & Osang Sept. 5-12, 2000 13,784 83,284 3 3 4 Cagayan, Batanes Mt. Province, Benguet Reming Oct. 26 - Nov. 01, 2000 486,416 2,435,942 114 314 40 Metro Manila. La Union Ilocos Sur and Norte Pangasinan, Isabela, Quirino Cagayan, Nueva Vizcaya Bataan, Bulacan, Tarlac, N. Ecija, Pampanga, Zambales, Batangas, Rizal, Cavite, Laguna, Marinduque, Quezon, Albay, Camarines Norte Sorsogon, Catanduanes Iloilo, N. Samar, E. Samar, Benguet, Kalinga Abra, Apayao, Ifugao Seniang 368,552 1,747,872 61 0 33 Nov. 1 5, 2000 Metro Manila, Bataan, Bulacan Tarlac, N. Ecija, Pampanga, Zambales, Batangas, Rizal Marinduque, Quezon Mindoro Provinces, Cavite, Laguna, Camarines Provinces Albay, Catanduanes Abra, Kalinga Toyang 29 Nov. Dec. 2, 2000 34,439 191,705 45 39 18 Surigao Del Norte Agusan del Norte Camiguin, Misamis Oriental Leyte, S. Leyte, E. Samar Cebu, Bohol, Iloilo, Capiz
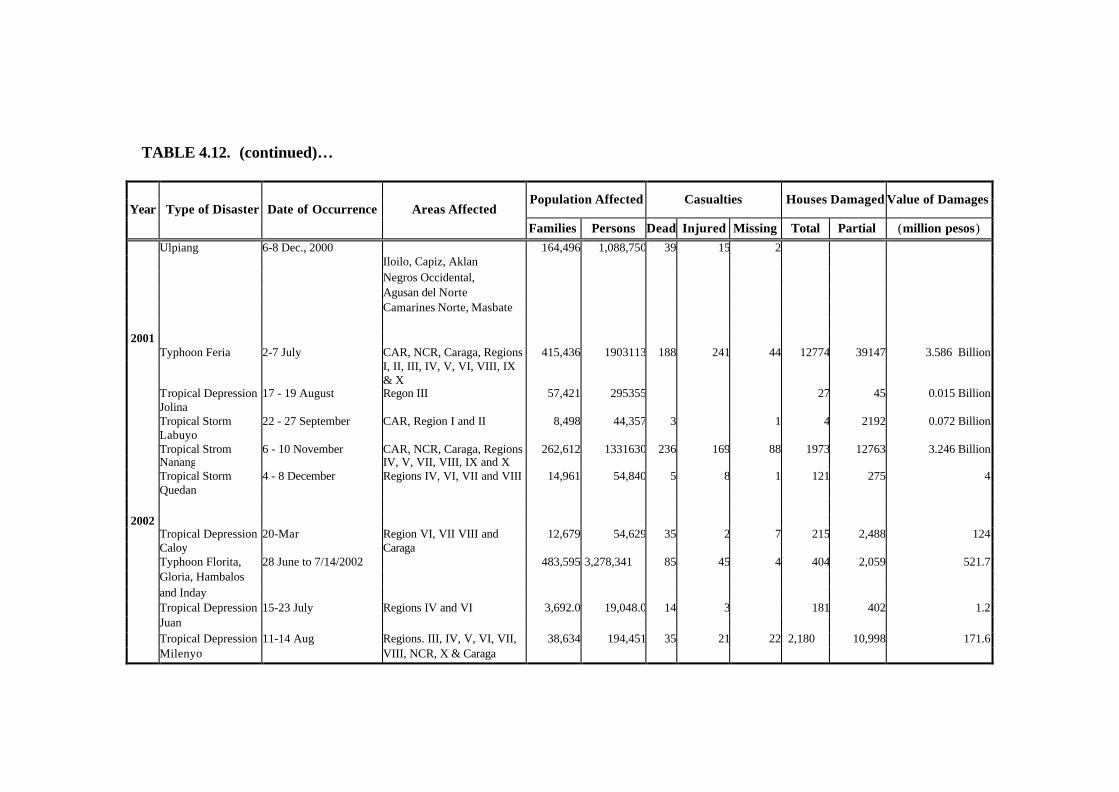
TABLE 4.12. (continued)…
Population Affected Casualties Houses Damaged Value of Damages Year Type of Disaster Date of Occurrence Areas Affected
Families Persons Dead Injured Missing Total Partial (million pesos)
Ulpiang 6-8 Dec., 2000 164,496 1,088,750 39 15 2 Iloilo, Capiz, Aklan Negros Occidental, Agusan del Norte Camarines Norte, Masbate 2001 Typhoon Feria 2-7 July CAR, NCR, Caraga, Regions 415,436 1903113 188 241 44 12774 39147 3.586 Billion I, II, III, IV, V, VI, VIII, IX & X Tropical Depression 17 - 19 August Regon III 57,421 295355 27 45 0.015 Billion Jolina Tropical Storm 22 - 27 September CAR, Region I and II 8,498 44,357 3 1 4 2192 0.072 Billion Labuyo Tropical Strom 6 - 10 November CAR, NCR, Caraga, Regions 262,612 1331630 236 169 88 1973 12763 3.246 Billion Nanang IV, V, VII, VIII, IX and X Tropical Storm 4 - 8 December Regions IV, VI, VII and VIII 14,961 54,840 5 8 1 121 275 4 Quedan 2002 Tropical Depression 20-Mar Region VI, VII VIII and 12,679 54,629 35 2 7 215 2,488 124 Caloy Caraga Typhoon Florita, 28 June to 7/14/2002 483,595 3,278,341 85 45 4 404 2,059 521.7 Gloria, Hambalos and Inday Tropical Depression 15-23 July Regions IV and VI 3,692.0 19,048.0 14 3 181 402 1.2 Juan Tropical Depression 11-14 Aug Regions. III, IV, V, VI, VII, 38,634 194,451 35 21 22 2,180 10,998 171.6 Milenyo VIII, NCR, X & Caraga

TABLE 4.12. (continued)…
Population Affected Casualties Houses Damaged Value of Damages Year Type of Disaster Date of Occurrence Areas Affected
Families Persons Dead Injured Missing Total Partial (million pesos)
Ulpiang 6-8 Dec., 2000 164,496 1,088,750 39 15 2 Flashflood/Flooding 272924 1268792 44 27 10 1032 5024 1,511 Earthquake 8619 40073 - - - 113 647 19 Landslide - - 17 11 2 1 3 - Whirlwind 22 110 - - - 6 - - Drought 1296 6480 - - - - - 40 Tornado 348 1842 - 1 - 3 22 3 Heavy Rainfall 1017 5395 - 2 - 14 - 3 Soil Erosion - - - 5 - - - - Lightning - - 6 9 - - - - Bigwaves 25 60 - - - - 12 -
Source: NDCC, DND

TABLE 4.13. IRRIGATED LAND BY TYPE OF IRRIGATION, 1993 to 2002 (in hectare)
1993 1994 1995 Island Group/Region Total National Communal Private Total National Communal Private Total National Communal Private
PHILIPPINES 1,246,607 646,519 434,671 165,417 1,251,188 634,573 442,006 174,609 1,306,794 651,812 472,865 182,117 LUZON 844,408 432,541 278,126 133,741 849,453 428,292 278,342 142,819 890,979 445,531 299,672 145,776
CAR 42,676 14,470 28,206 62,519 17,551 16,314 28,654 65,546 17,551 18,874 29,121Region 1 154,054 45,386 76,974 31,694 154,301 44,546 78,092 31,663 154,891 44,546 79,881 30,464Region 2 182,881 138,187 31,014 13,680 172,659 119,714 29,850 23,095 189,898 136,953 29,850 23,095Region 3 250,926 172,064 61,446 17,416 245,379 170,841 58,242 16,296 251,028 170,841 63,625 16,562Region 4 120,342 56,681 39,846 23,815 117,478 52,228 41,468 23,782 120,062 52,228 44,010 23,824Region 5 93,529 20,223 54,376 18,930 97,117 23,412 54,376 19,329 109,554 23,412 63,432 22,710
VISAYAS 141,209 69,133 60,071 12,005 143,683 68,077 62,587 13,019 145,362 68,077 64,333 12,952
Region 6 75,828 53,500 18,594 3,734 76,711 52,235 18,977 5,499 76,711 52,235 18,977 5,499Region 7 17,130 14,545 2,585 18,639 16,040 2,599 19,066 16,544 2,522Region 8 48,251 15,633 26,932 5,686 48,333 15,842 27,570 4,921 49,585 15,842 28,812 4,931
MINDANAO 260,990 144,845 96,474 19,671 258,052 138,204 101,077 18,771 270,453 138,204 108,860 23,389
Region 9 29,760 14,578 13,330 1,852 32,227 15,162 15,213 1,852 33,556 15,162 16,422 1,972Region 10 57,767 29,948 25,252 2,567 57,130 28,660 25,813 2,657 62,885 28,660 28,344 5,881Region 11 98,169 61,176 25,472 11,521 87,846 49,684 27,631 10,531 88,056 49,684 27,841 10,531Region 12 75,294 39,143 32,420 3,731 80,849 44,698 32,420 3,731 85,956 44,698 36,253 5,005Region 13 ARRM
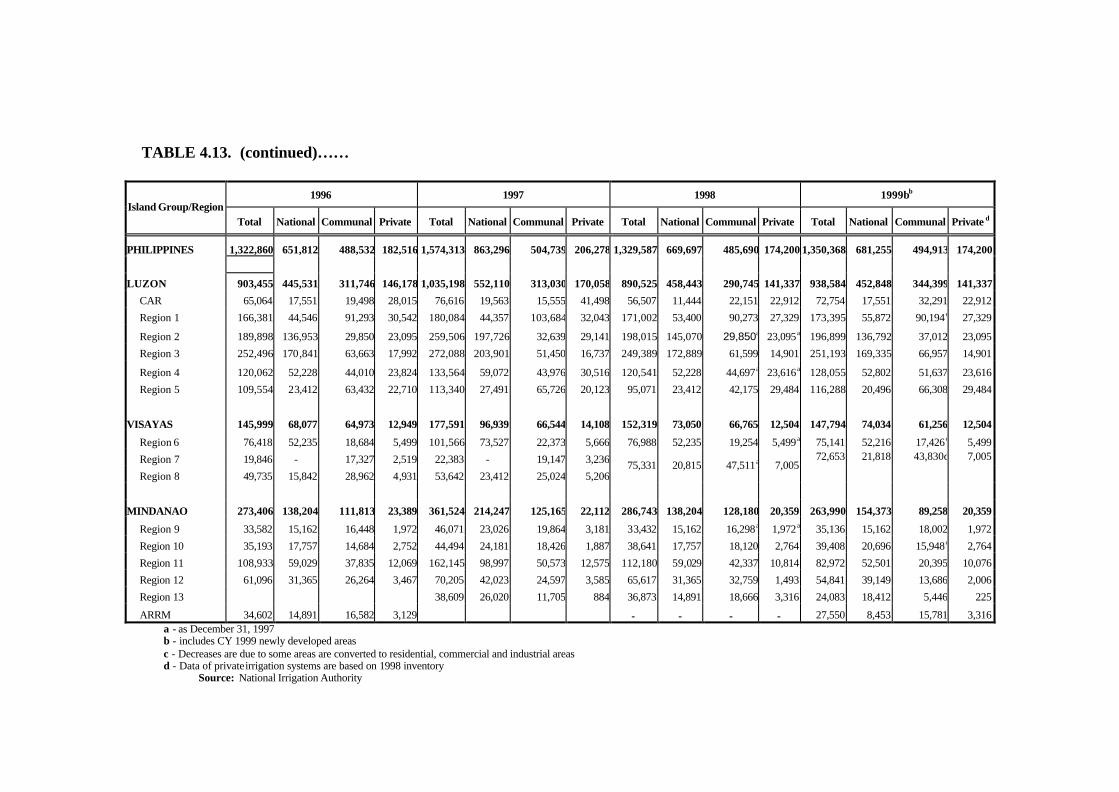
TABLE 4.13. (continued)……
1996 1997 1998 1999bb Island Group/Region
Total National Communal Private Total National Communal Private Total National Communal Private Total National Communal Private d
PHILIPPINES 1,322,860 651,812 488,532 182,516 1,574,313 863,296 504,739 206,278 1,329,587 669,697 485,690 174,200 1,350,368 681,255 494,913 174,200
LUZON 903,455 445,531 311,746 146,178 1,035,198 552,110 313,030 170,058 890,525 458,443 290,745 141,337 938,584 452,848 344,399 141,337
CAR 65,064 17,551 19,498 28,015 76,616 19,563 15,555 41,498 56,507 11,444 22,151 22,912 72,754 17,551 32,291 22,912
Region 1 166,381 44,546 91,293 30,542 180,084 44,357 103,684 32,043 171,002 53,400 90,273 27,329 173,395 55,872 90,194c 27,329
Region 2 189,898 136,953 29,850 23,095 259,506 197,726 32,639 29,141 198,015 145,070 29,850a 23,095a 196,899 136,792 37,012 23,095
Region 3 252,496 170,841 63,663 17,992 272,088 203,901 51,450 16,737 249,389 172,889 61,599 14,901 251,193 169,335 66,957 14,901
Region 4 120,062 52,228 44,010 23,824 133,564 59,072 43,976 30,516 120,541 52,228 44,697a 23,616a 128,055 52,802 51,637 23,616
Region 5 109,554 23,412 63,432 22,710 113,340 27,491 65,726 20,123 95,071 23,412 42,175 29,484 116,288 20,496 66,308 29,484
VISAYAS 145,999 68,077 64,973 12,949 177,591 96,939 66,544 14,108 152,319 73,050 66,765 12,504 147,794 74,034 61,256 12,504
Region 6 76,418 52,235 18,684 5,499 101,566 73,527 22,373 5,666 76,988 52,235 19,254 5,499a 75,141 52,216 17,426c 5,499
Region 7 19,846 - 17,327 2,519 22,383 - 19,147 3,236 72,653 21,818 43,830c 7,005
Region 8 49,735 15,842 28,962 4,931 53,642 23,412 25,024 5,20675,331 20,815 47,511a 7,005
MINDANAO 273,406 138,204 111,813 23,389 361,524 214,247 125,165 22,112 286,743 138,204 128,180 20,359 263,990 154,373 89,258 20,359
Region 9 33,582 15,162 16,448 1,972 46,071 23,026 19,864 3,181 33,432 15,162 16,298a 1,972a 35,136 15,162 18,002 1,972
Region 10 35,193 17,757 14,684 2,752 44,494 24,181 18,426 1,887 38,641 17,757 18,120 2,764 39,408 20,696 15,948c 2,764
Region 11 108,933 59,029 37,835 12,069 162,145 98,997 50,573 12,575 112,180 59,029 42,337 10,814 82,972 52,501 20,395 10,076
Region 12 61,096 31,365 26,264 3,467 70,205 42,023 24,597 3,585 65,617 31,365 32,759 1,493 54,841 39,149 13,686 2,006
Region 13 38,609 26,020 11,705 884 36,873 14,891 18,666 3,316 24,083 18,412 5,446 225
ARRM 34,602 14,891 16,582 3,129 - - - - 27,550 8,453 15,781 3,316 a - as December 31, 1997 b - includes CY 1999 newly developed areas c - Decreases are due to some areas are converted to residential, commercial and industrial areas d - Data of private irrigation systems are based on 1998 inventory
Source: National Irrigation Authority

TABLE 4.13. (continued)….
2000 2001 2002 Island Group/Region
Total National Communal Privatea Total National Communal Privatea Total National Communal Privatea
PHILIPPINES 1,361,454 685,812 501,442 174,2001,373,62
7 689,010 510,417 174,200 1,387,236 689,113 523,923 174,200 LUZON 945,721 455,429 348,955 141,337 948,812 452,752 354,723 141,337 955,585 452,752 361,496 141,337
CAR 72,921 17,551 32,458 22,912 73,215 17,551 32,752 22912 73,343 17,551 32,880 22,912
Region 1 174,024 55,872 90,823 27,329 174,963 55,872 91,762 27329 176,933 55,872 93,732 27,329Region 2 197,841 136,792 37,954 23,095 198,524 136,792 38,637 23095 199,909 136,792 40,022 23,095Region 3 254,195 171,783 67,511 14,901 253,663 169,335 69,427 14901 254,791 169,335 70,555 14,901Region 4 129,692 52,935 53,141 23,616 130,748 52,706 54,426 23616 132,068 52,706 55,746 23,616Region 5 117,048 20,496 67,068 29,484 117,699 20,496 67,719 29484 118,541 20,496 68,561 29,484
VISAYAS 148,661 74,034 62,123 12,504 149,967 73,861 63,602 12,504 152,702 73,964 66,234 12,504
Region 6 75,419 52,216 17,704 5,499 75,507 52,216 17,792 5499 75,766 52,216 18,051 5,499Region 7 26,428 5,823 18,066 2,539 25,875 4,973 18,363 2539 27,318 5,512 19,267 2,539Region 8 46,814 15,995 26,353 4,466 48,585 16,672 27,447 4466 49,618 16,236b 28,916 4,466
MINDANAO 267,072 156,349 90,364 20,359 274,848 162,397 92,092 20,359 278949 162,397 96,193 20,359
Region 9 35,238 15,162 18,104 1,972 35,271 15,162 18,137 1972 35,910 15,162 18,776 1,972Region 10 39,716 20,696 16,256 2,764 39,845 20,696 16,385 2764 40,598 20,696 17,138 2,764Region 11 83,325 52,501 20,748 10,076 83,822 52,486 21,260 10076 85,321 52,486 22,759 10,076Region 12 55,038 39,149 13,883 2,006 55,813 39,576 14,231 2006 56,009 39,576 14,427 2,006ARRM 15,806 10,114 5,467 225 21,661 16,065 5,371 225 21,944 16,065 5,654 225
Caraga 37,949 18,727 15,906 3,316 38,436 18,412 16,708 3316 39,167 18,412 17,439 3,316a - Data of Private Irrigation Systems are based on CY 1998 inventory b – Firmed up service area
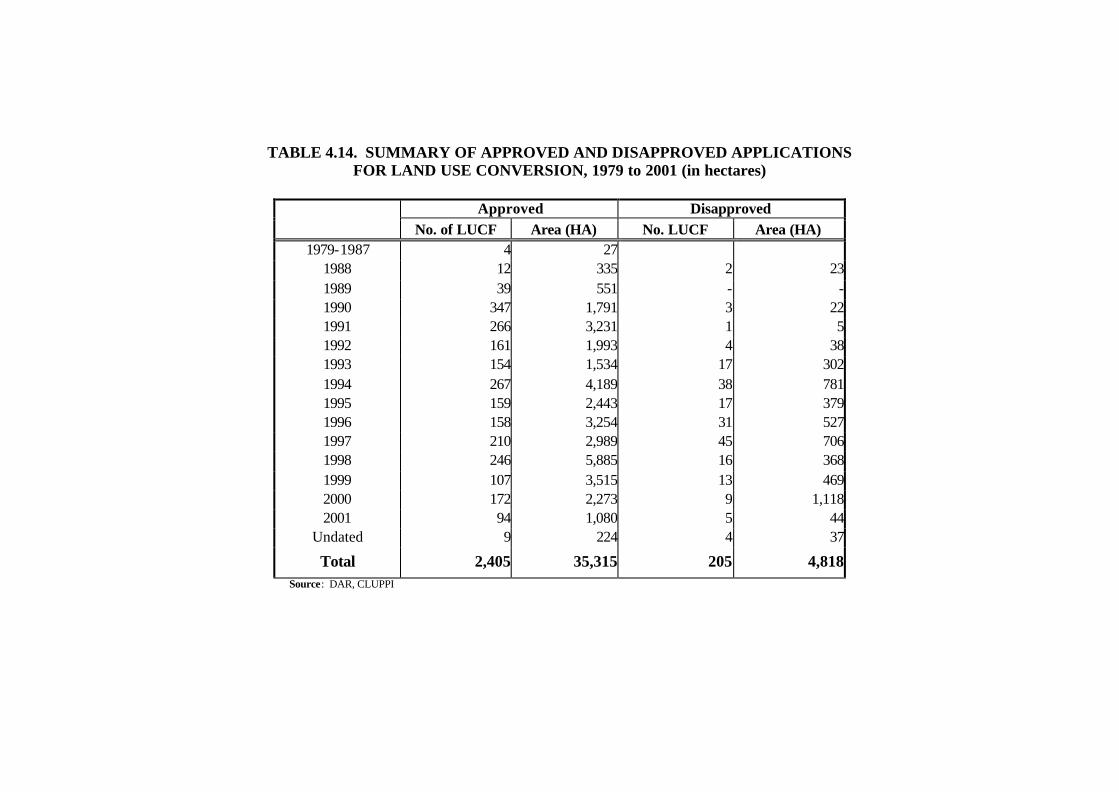
TABLE 4.14. SUMMARY OF APPROVED AND DISAPPROVED APPLICATIONS FOR LAND USE CONVERSION, 1979 to 2001 (in hectares)
Approved Disapproved
No. of LUCF Area (HA) No. LUCF Area (HA) 1979-1987 4 27
1988 12 335 2 231989 39 551 - -1990 347 1,791 3 221991 266 3,231 1 51992 161 1,993 4 381993 154 1,534 17 3021994 267 4,189 38 7811995 159 2,443 17 3791996 158 3,254 31 5271997 210 2,989 45 7061998 246 5,885 16 3681999 107 3,515 13 4692000 172 2,273 9 1,1182001 94 1,080 5 44
Undated 9 224 4 37
Total 2,405 35,315 205 4,818Source: DAR, CLUPPI
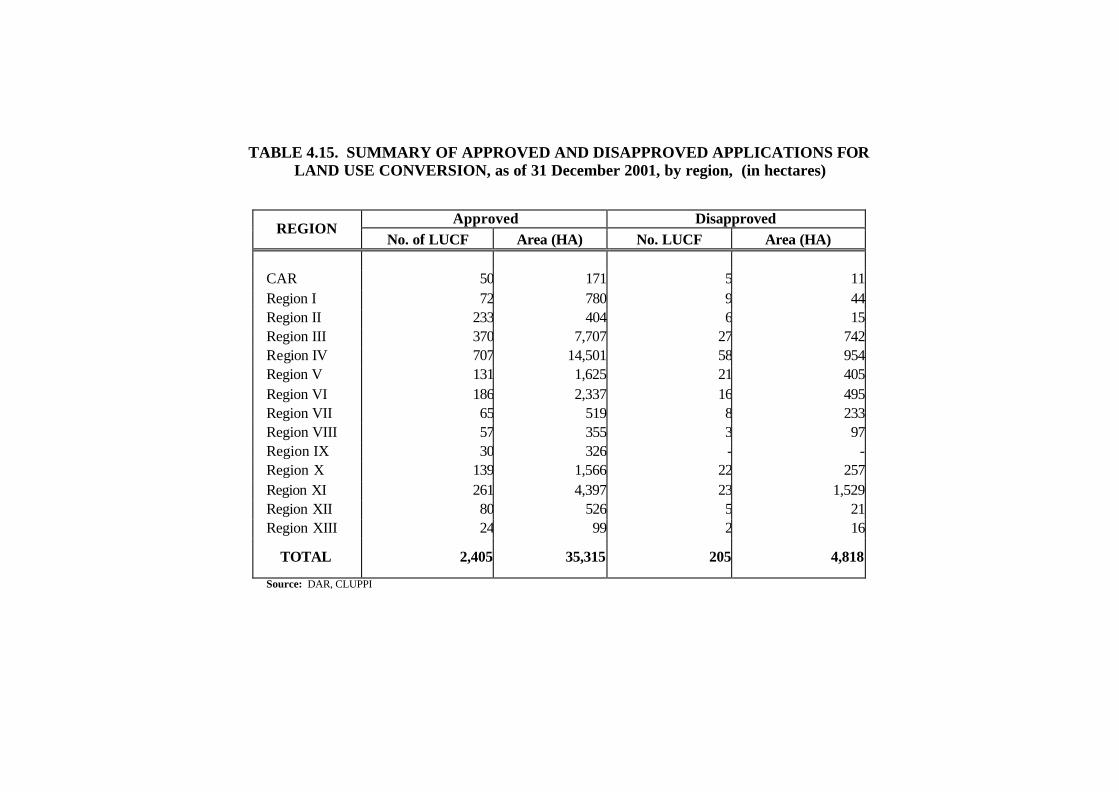
TABLE 4.15. SUMMARY OF APPROVED AND DISAPPROVED APPLICATIONS FOR LAND USE CONVERSION, as of 31 December 2001, by region, (in hectares)
Approved Disapproved REGION
No. of LUCF Area (HA) No. LUCF Area (HA)
CAR 50 171 5 11Region I 72 780 9 44Region II 233 404 6 15Region III 370 7,707 27 742Region IV 707 14,501 58 954Region V 131 1,625 21 405Region VI 186 2,337 16 495Region VII 65 519 8 233Region VIII 57 355 3 97Region IX 30 326 - -Region X 139 1,566 22 257Region XI 261 4,397 23 1,529Region XII 80 526 5 21Region XIII 24 99 2 16
TOTAL 2,405 35,315 205 4,818
Source: DAR, CLUPPI

TABLE 4.16. PHYSICAL ASSET ACCOUNT OF THE LAND AND SOIL RESOURCES DEVOTED TO AGRICULTURAL USES 1988-2000
Land Area (in '000 hectares) 1988 1989 1990 1991 1992 1993 1994 1995 1996 1997 1998 1999 2000
OPENING STOCK 9,883.3 9,906.1 9,929.0 9,951.9 9,974.9 9,997.9 10,020.9 10,044.1 10,067.2 10,090.5 10,113.7 10,137.1 10,160.5 Other Accumulation
Land Use Conversion (0.3) (0.6) (1.8) (3.2) (2.0) (1.5) (4.2) (2.4) (3.3) (3.0) (5.9) (3.5) (2.3)Kaingin 2.9 4.7 - 0.8 0.1 0.1 1.5 0.4 0.1 4.7 14.4 0.1 0.1
Other Accumulation
Lahar areas - - - - (13.6) (25.6) - - - - - - - Adjustments 20.2 18.7 24.7 25.4 38.5 50.1 25.8 25.2 26.4 21.6 14.8 26.8 25.6 CLOSING STOCK 9,906.1 9,929.0 9,951.9 9,974.9 9,997.9 10,020.9 10,044.1 10,067.2 10,090.5 10,113.7 10,137.1 10,160.5 10,183.9
1/ Land area derived from the projected physical farm area in the CA, NSO using the average annual growth (geometric) rate formula by type of crop. 2/ CLUPPI (1988-1993 data) and Presidential Agrarian Reform Council (1988-2000), DAR. 3/ Planning and Policy Service, DENR (Philippine Statistical Yearbook 2001, NSCB). 4/ Bureau of Soil and Water Management (BSWM). 5/ Balancing item = CS-[OS+OAa+(-Oab)+( -OVCa)] (-) means no data

TABLE 4.17. PHYSICAL ASSET ACCOUNT OF (Environmental) LAND RESOURCES DEVOTED TO FOREST USES
1988-1997
AREA IN THOUSAND HECTARES 1988 1989 1990 1991 1992 1993 1994 1995 1996 1997
OPENING AREA 1/ - - - 1,242.00 1,230.10 1,344.80 2,135.50 2,121.20 2,107.30 2,094.40 OTHER ACCUMULATION 1,225.40 106.90 774.30 (29.00) (27.60) - - -
a. Forest area converted to non-forest uses 2/ - - (16.60) (22.30) (30.60) (29.00) (27.60)
b. Transfer from economic to - - 1,242.00 129.20 804.90 - - - - -
environmental land 3/ ADJUSTMENT 4/ - - 16.60 (118.80) (659.60) 819.70 13.30 (13.90) (12.90) (12.90) Net Change in Area 5/ - - 1,242.00 (11.90) 114.70 790.70 (14.30) (13.90) (12.90) (12.90) CLOSING AREA - - 1,242.00 1,230.10 1,344.80 2,135.50 2,121.20 2,107.30 2,094.40 2,081.50
Note: 1/ Considered environmental forest lands include old growth dipterocarp (1992-1994 only), closed pine, mangrove and mossy forest. 2/ Adopted from the Philippine Forestry Master plan, Appendix 8(1990-1994 data): for 1988, covers only closed pine; 1990-91, covers only mangrove, mossy, and closed pine; for 1992-1994, coverage includes old growth dipterocarp, mangrove, closed pine and mossy. 3/ Transfer from economic to environmental land covers old growth dipterocarp only following the log ban in old growth forests. 4/ Adjustment formula: CS - [-/+ (OS + OA)] 5/ Closing Stock - Opening Stock (-) - means no data
Sources of data: Philippine Forestry Statistics, Forest Management Bureau (FMB) Master plan for Forestry Development, 1990, FMB

TABLE 4.18. PHYSICAL ASSET ACCOUNT OF (ECONOMIC) LAND RESOURCES DEVOTED TO FOREST USES 1988-2000
AREA IN THOUSAND HECTARES
1988 1989 1990 1991 1992 1993 1994 1995 1996 1997
OPENING AREA1/ 6,789.6 6,460.6 6,307.4 4,916.8 4,656.1 3,750.5 3,652.0 3,564.9 3,482.9 3,398.7OTHER ACCUMULATION (152.7) (212.4) (1,518.1) (306.1) (908.8) (76.2) (107.1) (120.8) (100.4) (124.1)
a. Deforestation (-) Kaingin (2.9) (4.7) - (0.8) (0.1) (0.1) (1.5) (0.4) (0.1) (4.7)Illegal logging (4.5) (1.7) - (0.1) - - (0.1) (0.0) (0.0) (0.1)
b. Reforestation (+)2/ (64.2) (131.4) (191.7) (93.0) (40.6) (19.2) (49.6) (65.2) (46.1) (66.2)c. Forest area converted to
non-forest uses (-) 3/ (65.2) (60.0) (76.9) (77.8) (58.0) (56.9) (55.9) (55.1) (54.2) (53.1)d. Damage from logging (-) 4/ (15.9) (14.6) (7.5) (5.3) (5.3) - - - - -e. Transfer from economic to - - (1,242.0) (129.2) (804.9) - - - - -
environmental land (-) 5/ OTHER VOLUME CHANGES (2.9) (6.2) - (6.4) (35.1) (40.1) (8.7) (23.7) (5.1) (17.6)
a. Lahar Covered Areas (-) - - - - (22.3) (22.3) - - - -b. Forest Fire (-) (0.4) (0.7) - (5.9) (12.7) (15.3) (7.7) (10.3) (4.6) (1.0)c. Others (infestation, typhoon) (-) (2.4) (5.5) - (0.5) - (2.4) (1.0) (13.4) (0.5) (16.6)
ADJUSTMENT 6/ (173.5) 65.4 127.5 51.8 38.3 17.8 27.7 49.1 20.8 36.6Net Change in Area 7/ (329.0) (153.2) (1,390.6) (260.7) (905.6) (98.5) (87.1) (82.0) (84.1) (88.5)CLOSING AREA 6,460.6 6,307.4 4,916.8 4,656.1 3,750.5 3,652.0 3,564.9 3,482.9 3,398.7 3,310.2
Sources of data: Philippine Forestry Statistics, Forest Management Bureau (FMB), Philippine Statistical Yearbook, National Statistical Coordination Board, Bureau of Soils and Water Management and Philippine Master plan for Forestry Development, 1990, FMB.
Note: 1/ Opening stock is adjusted (forest land) to include old growth dipterocarp (1988-1991 only), residual dipterocarp, open pine and sub-marginal areas. 2/ Based on area reforested by government and the private sectors as reported in the PSY. 3/ Adopted from the Philippine Forestry Master plan, Appendix 8(1990-1997 data) & Table 9 of Balangue's paper: covers only conversions from open pine, old growth, second growth and marginal forests lands. However, since 1992 with the total log ban it was assumed that no conversions of old growth forest land had taken place. 4/ Adopted from Appendix Table B-2 of NSCB's paper (1996). Equivalent to 15% of the total logged area in previous year, for log landings, roads, skidding/yarding trails. It was assumed that in 1992, there was no more damage due to logging because of the log ban of 1991. 5/ Areas proclaimed for protection use. It was based from the DAO 1991 (total log ban - old growth dipterocarp) proclaimed as protected areas. 6/ Adjustment formula: CS - [OS +/- (OA + OVC)] 7/ Closing Stock - Opening Stock (-) - means no data

TABLE 4.19. PHYSICAL ASSET ACCOUNT OF BRUSHLAND RESOURCES, 1988-1997
AREA IN THOUSAND HECTARES 1988 1989 1990 1991 1992 1993 1994 1995 1996 1997
OPENING AREA 1/ 3,085.2 2,525.1 2,490.1 2,455.6 2,421.8 2,388.7 2,356.2 2,324.5 2,293.0 2,262.5 OTHER ACCUMULATION
Brushland Conversion - - - - - - - - - - OTHER VOLUME CHANGES
Lahar covered areas (-) 2/ - - - - (38.2) (3.9) - - - - ADJUSTMENT (S.D.) 3/ (560.1) (35.0) (34.5) (33.8) (33.1) (32.5) (31.7) (31.5) (30.5) (30.2) Net Change in Area 4/ (560.1) (35.0) (34.5) (33.8) (33.1) (32.5) (31.7) (31.5) (30.5) (30.2) CLOSING AREA 2,525.1 2,490.1 2,455.6 2,421.8 2,388.7 2,356.2 2,324.5 2,293.0 2,262.5 2,232.3
Note: 1/ Source of data: FMB 2/ Source of data: BSWM 3/ Closing Stock - Opening Stock 4/ Adjustment formula: CS - [OS +/- (OA + OVC)] (-) - means no data
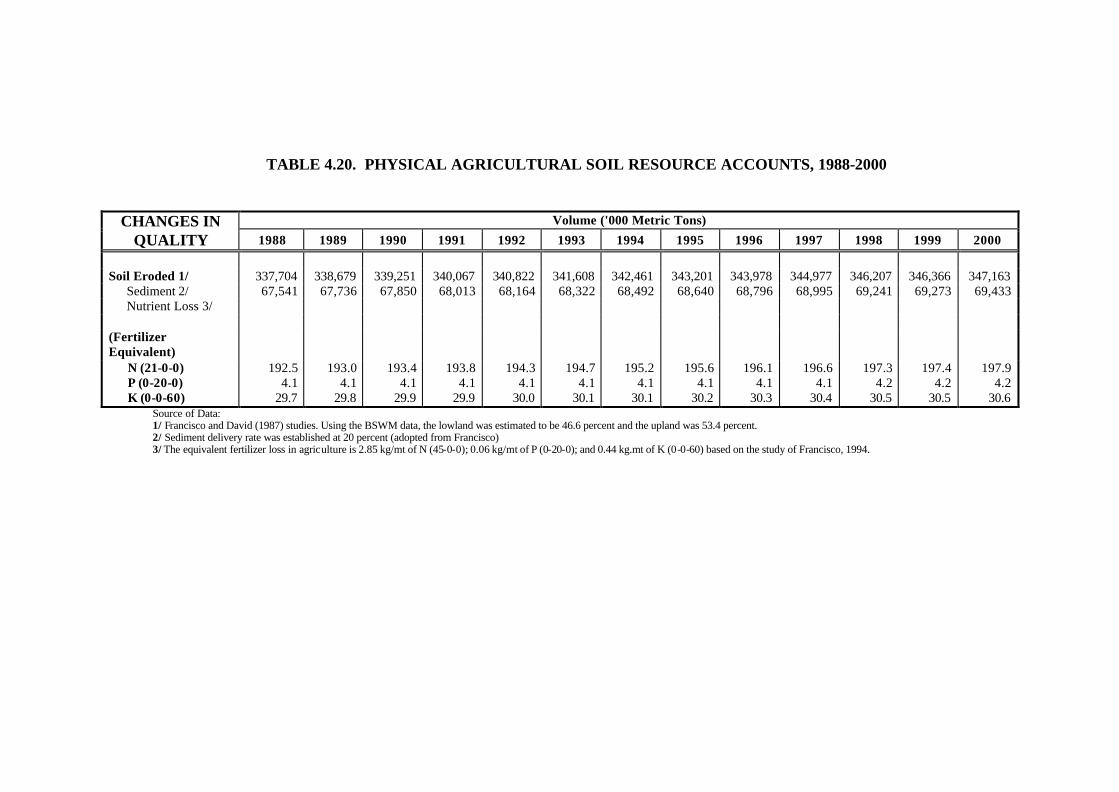
TABLE 4.20. PHYSICAL AGRICULTURAL SOIL RESOURCE ACCOUNTS, 1988-2000
Volume ('000 Metric Tons) CHANGES IN QUALITY 1988 1989 1990 1991 1992 1993 1994 1995 1996 1997 1998 1999 2000
Soil Eroded 1/ 337,704 338,679 339,251 340,067 340,822 341,608 342,461 343,201 343,978 344,977 346,207 346,366 347,163
Sediment 2/ 67,541 67,736 67,850 68,013 68,164 68,322 68,492 68,640 68,796 68,995 69,241 69,273 69,433 Nutrient Loss 3/
(Fertilizer Equivalent)
N (21-0-0) 192.5 193.0 193.4 193.8 194.3 194.7 195.2 195.6 196.1 196.6 197.3 197.4 197.9 P (0-20-0) 4.1 4.1 4.1 4.1 4.1 4.1 4.1 4.1 4.1 4.1 4.2 4.2 4.2 K (0-0-60) 29.7 29.8 29.9 29.9 30.0 30.1 30.1 30.2 30.3 30.4 30.5 30.5 30.6
Source of Data: 1/ Francisco and David (1987) studies. Using the BSWM data, the lowland was estimated to be 46.6 percent and the upland was 53.4 percent. 2/ Sediment delivery rate was established at 20 percent (adopted from Francisco) 3/ The equivalent fertilizer loss in agriculture is 2.85 kg/mt of N (45-0-0); 0.06 kg/mt of P (0-20-0); and 0.44 kg.mt of K (0-0-60) based on the study of Francisco, 1994.

TABLE 4.21. LIST OF POLICY ISSUANCES FOR THE LANDS SECTOR, 1996-2002
Number Title
1996
Administrative Orders 96-34 Guidelines on the Management of Certified Ancestral Domain Claims.
1997
Administrative Orders 97-41 Structural Reorganization of the Lands Management Bureau (LMB) Amending for the Purpose DENR Administrative Order
(DAO) No. 01, Series of 1988. Memorandum Circulars
97-02 Requirements in the Issuance of Proclamations/Reservations
97-04 Adopting Sections 1 to 4, Article IV of the Implementing Rules and Regulations (IRR) of R.A. No. 4374, Regarding the Junior Geodetic Engineering Practices in the DENR Lands Management Services and Providing Guidelines for its Implementations
1998 Administrative Orders 98-04 Amendment to Department Administrative Order No. 03, Series of 1993 Providing for Supplementary Guidelines in the Disposition
of Pindangan Estate (The Estate), Alcala, Pangasinan. 98-12 Revised Manual of Land Surveying Regulations in the Philippines Manual of
98-20 Revised Rules and Regulations on the Conduct of Appraisal of Public Lands and Other Patrimonial Properties of the Government. 98-48 Redefining the Program Thrusts of the Field Network Survey Parties.
98-53 Transferring the Supervision of the Lands Management Bureau Under the Office of the Assistant Secretary for Legislative and Local Government Affairs.
1999
Administrative Orders 99-13 Preparation of Land Use Maps.
99-22 DENR Jurisdiction Over All Alienable and Disposable (A & D) Lands of the Public Domain.

TABLE 4.21. (continued)…..
Number Title
2000
Administrative Orders 2000-62 Revised Guidelines On Land Disposition And Records Management
2000-67 Prescribing New Guidelines, Application Form And Standards For Public Land Application And Records Management Memorandum Circulars
2000-06 Guidelines In The Disposition Of Cases Of Fake And Illegal Titles
2000-16 Guidelines For Strict Compliance Of Sections 379 And 586 Of The Revised Manual Of Land Surveying Regulations In The Philippines
Memorandum Orders 2000-06 Instructing The Submission Of Land Titles To The DENR, Diliman Quezon City, For The Secretary’s Approval Whenever
Necessary. 2001
Administrative Orders 2001-23 Amending the Guidelines Set forth in DENR Administrative order No. 30, Series of 1992 and Providing for this purpose the Return
to the DENR of Devolved Survey Functions Memorandum Circulars
2001-15 Issuance of Certificate of allocation for Processed Public Land Applications and Submission of CARP-CSW Reports
Republic Act
9003, April 9, 2001 An Act Providing For An Ecological Solid Waste Management Program, Creating The Necessary Institutional Mechanisms And Incentives, Declaring Certain Acts Prohibited And Providing Penalties, Appropriating Funds Thereof, And For Other Purposes.
2002 Administrative Orders No.2002-13, June24, 2002 Removal of Gender Bias in the Acceptance and Processing of Homestead Patent Application and Other Public Land Applications No.2002-14, July 9, 2002 Proposed Revision to Forestland and Category of an Area Declared as Alienable and Disposable for Fishpond Development
Located in Barangay Binulousan, Municipality of Infanta, Province of Quezon No. 2002-32 December 3, 2002 Revised Lands Management Bureau Survey Forms for Transverse and Lot Data Computation

TABLE 4.21. (continued)…
Number Title
No. 2002-36 December 9, 2002 Implementing Rules and Regulations (IRR) of Republic Act No. 9176, Extending the Period until December 31, 2020 for the filing of Applications for Administrative Legalization (from patent) and Judicial Confirmation of Imperfect and Incomplete Titles
Republic Act 9176, July 22, 2002 A N Act Extending The Period Until December 31, 2002 For The Filling Of Applications For Administrative Legalization (Free
Patent) And Judicial Confirmation Of Imperfect And Incomplete Titles To Alienable And Disposable Lands Of The Public Domain, Amending For The Purpose, Commonwealth Act Numbered 141, As Amended, Otherwise Known As The Public Land Act
Source: Policy Studies Division, Planning and Policy Studies Office, DENR
Mineral and Energy
Compendium of Philippine Environment Statistics 2004
MMMiiinnneeerrraaalll aaannnddd EEEnnneeerrrgggyyy
5 C
hapt
er

Mineral and Energy
Compendium of Philippine Environment Statistics 2004 5-1
MINERAL AND ENERGY RESOURCES Highlights of Results
Mining as an industry is vital to both the national and regional economy. Minerals provide the basic materials for manufacturing metallic and non-metallic goods, and are a source of foreign exchange earnings.
a. Social and Economic Activities and Natural Events
The Philippine metallic mineral production, particularly copper production
continued to drop from a high of 525.2 thousand dry metric tons (DMT) in 1993 to 79.2 thousand DMT in 2002, which trans lates to an annual decline of 15.3 percent. Silver production reported a contraction, from 32.8 thousand kilograms in 1992 to 8.8 thousand kilograms in 2002 or an annual drop of 11.3 percent. This was offset by the continued expansion in gold production which registered an annual average growth of 3.1 percent from 1992 to 2002. (Figure 1)
Figure 1. Production of Selected Metallic Mineral, 1992 to 2002
0.00
100.00
200.00
300.00
400.00
500.00
600.00
1992 1993 1994 1995 1996 1997 1998 1999 2000 2001 2002
Year
GOLD (in Kg.)
SILVER (inKg.)
COPPER (inDMT)
On the other hand, the production of non-metallic mineral resources particularly sand and gravel and limestone, used for cement manufacturing, posted an annual average growth of 8.3 percent and 5.6 percent, respectively, from 1992 to 2002. These type of minerals are essential to the construction industry since they provide the materials required by the various construction projects of both the government and private sectors, Table 1.
Conversely, coal production continued to show improvements in production
starting 1997 to 2002, except in 2001 where it posted a slower production. In 2002, coal production registered the highest production growth since 1993 with a total production of 1,645.7 thousand metric tons (see Table 1 and Figure 2).

Mineral and Energy
Compendium of Philippine Environment Statistics 2004 5-2
Table 1. Production of Selected Non-Metallic Minerals, 1992 to 2002
(in thousand metric tons)
NON-METALLIC MINERAL 1992 1993 1994 1995 1996 1997 1998 1999 2000 2001 2002
COAL 1,665.20 1,581.87 1,345.56 1,265.73 955.63 1,078.65 1,157.20 1,204.98 1,353.45 1,229.82 1,645.66
SAND & GRAVEL 15,786.59 16,692.72 16,477.85 28,155.09 37,446.27 40,030.06 34,707.05 32,420.35 30,248.18 35,257.88 37,773.86LIMESTONE FOR CEMENT MFTR 10,225.14 5,355.72 19,945.18 6,680.86 6,709.77 10,216.34 27,713.71 13,379.45 20,426.84 19,826.58 18,626.23
Figure 2. Selected Non-Metallic Mineral Production, 1992 to 2002 (in thousand metric tons)
0.00
5,000.00
10,000.00
15,000.00
20,000.00
25,000.00
30,000.00
35,000.00
40,000.00
45,000.00
1992 1993 1994 1995 1996 1997 1998 1999 2000 2001 2002
Year
in m
illio
n m
etri
c to
ns
COAL SAND & GRAVEL LIMESTONE FOR CEMENT MFTR
Figure 3. Installed Generating Capacity, 1992 to 2002 (in megawatts)
0
1,000
2,000
3,000
4,000
5,000
6,000
7,000
1992 1993 1994 1995 1996 1997 1998 1999 2000 2001 2002
Year
in m
egaw
atts
Hydro Coal Geothermal Diesel/Oil Natural Gas

Mineral and Energy
Compendium of Philippine Environment Statistics 2004 5-3
With regards to the Philippine energy resources, the generating capacity of power plants had been steadily increasing from 1992 to 2002 posting an average annual growth of 7.4 percent. It is important to note that, the use of natural gas to produce energy which began in 1998 jumped significantly from 3 megawatts in 1998 to 1,063 megawatts in 2001 and 2,763 megawatts in 2002. On the other hand, energy generation using diesel/oil slowed down in 2002 with 3,527 megawatts (24 percent of the total installed generating capacity) compared to 5,201 megawatts (70 percent) in 2000 (see Table 2 and Figure 3). The increase in the use of natural gas for electricity generation can be attributed to the discovery of natural gas in Palawan.
Table 2. Installed Generating Capacity, 1992 to 2002 (in megawatts)
Plant Type 1992 1993 1994 1995 1996 1997 1998 1999 2000 2001 2002
TOTAL 6,695 8,014 9,212 9,696 11,190 11,752 12,068 12,541 13,196 13,380 14,702
Hydro 2,257 2,259 2,254 2,258 2,300 2,300 2,304 2,304 2,304 2,518 2,518
Coal 405 441 550 850 1,600 1,600 2,200 3,355 3,825 3,963 3,963
Geothermal 888 1,018 1,073 1,163 2,971 1,886 1,907 1,863 1,863 1,931 1,931
Diesel/Oil 3,145 4,296 5,335 5,425 4,319 5,966 5,654 5,016 5,201 3,905 3,527
Non-Conventional - - - - - - - - - - -
Natural gas - - - - - - 3 3 3 1,063 2,763
Meanwhile, hydro, coal and geothermal sources of energy maintained their shares in 2002 with installed generating capacity remaining the same as that of 2001 with 2,518, 3,963 and 1,931 megawatts, respectively, Table 2.
Figure 4. Electric Energy Consumption by Sector (million Kilowatt hour). 2002
37%
27%
36%
ResidentialCommercialIndustrial
Energy generated is primarily consumed by the residential, industrial and commercial sectors. As of 2002, the biggest consumer of energy was the residential sector with 37 percent of the total consumption of 48,468 million kilowatt hour,

Mineral and Energy
Compendium of Philippine Environment Statistics 2004 5-4
followed closely by the industrial sector with 36 percent and commercial with 27 percent (see Figure 4). b. Environmental Impacts of Activities and Events
In polishing off mineral and energy raw materials for commercial use, further processing is required. This procedure emits toxic wastes. These chemical wastes create adverse effects on the environment such as: siltation, chemical pollution, land degradation, contamination of domestic water supply, ground subsidence, and encroachment of ancestral lands and domains.
In 2002, Region XIII reported 174,854 metric tons of mine wastes produced
and contained from metallic mineral mining. On the other hand, the mil tailings produced and contained coming from Region XIII and CAR totaled 78,375 metric tons.
On the other hand, based on the report of three non-metallic mining companies
to the Mines and Geosciences Bureau, these companies produced and contained 48,936 metric tons and 1,321.8 metric tons of mine wastes and mil tailings, respectively.
Figure 5. Mining Accidents Incidence and Frequency Rates, 1994 to 2002
13.9413.36
14.7415.16
14.54 14.32
11.16
8.447.79 7.55
6.18
3.644.37
3.11
0.00
2.00
4.00
6.00
8.00
10.00
12.00
14.00
16.00
94 - '95 95 - '96 96 - '97 97 - '98 99 - '00 00 -'01 01 - '02
Year Incidence RateFrequency Rate
Linear (Incidence Rate)
Linear (Frequency Rate)
Exploration activities for both mineral and energy resources demand highly skilled manpower vis-a-vis hazards brought by the job. The risks that accompanied the nature of work resulted to unavoidable situations such as: injuries, deaths, contaminations, and alike. As shown in Figure 5, mining accidents incidence rate showed improvement from 1999 to 2002 after a continued increase in 1995 to 1998. The slow down in the frequency rate of mining accidents from 1994 to 2002 resulted from the improvement of safety measures adopted by the mining industry.
Mineral and Energy
Compendium of Philippine Environment Statistics 2004 5-5
c. Responses to Environmental Impacts
A total of 6 policy issuances (Executive Orders, DENR Administrative Orders, Memorandum Circulars, Memorandum Orders and Joint DENR DOE Administrative order) affecting the mines sector were added to the approved policies issued from 1996 to 2000. d. Stocks and Inventory
As of 2002, the Mines and Geosciences Bureau estimated that the Philippine stock of metallic mineral resources were as follows: 1,4391.61 million metric tons of copper reserve (updated), 533.51 million metric tons of nickel reserve (updated), and 794.9 million metric of gold reserve (updated) as compared to the 1992 stock levels of 3,951.9 million metric tons of copper, 150.7 million metric tons of gold and 1,172.9 million metric tons of nickel.
On the non-metallic minerals, limestone and the related type of minerals as well as aggregated non-metallic mineral (andesites, basalt etc.) dominated the reserves.

Mineral and Energy
Compendium of Philippine Environment Statistics 2004
Statistical Tables

TABLE 5.1. METALLIC MINERAL PRODUCTION, 1992 to 2002
(volume: in thousand units; value: in million pesos)
1992 1993 1994 1995 1996 1997 1998 1999 2000 2001 2002 METALLICS: MINERAL/MINERAL
PRODUCT
UNIT
USED Volume Value Volume Value Volume Value Volume Value Volume Value Volume Value Volume Value Volume Value Volume Value Volume Value Volume Value
GOLD KG 25.61 7,189.01 24.92 7,926.15 27.31 8,965.55 27.02 8,484.01 30.18 9,855.31 32.67 9,909.03 34.04 12,763.37 31.05 10,725.00 36.541 13,764.45 33.84 14,382.03 35.848 18,008.98
SILVER KG 32.78 102.79 32.04 116.27 29.96 123.71 28.48 114.58 23.99 103.73 20.74 91.19 18.22 124.80 18.21 114.00 23.569 158.11 29.59 196.93 8.811 67.86
COPPER CONCENTRATE DMT 491.75 6,641.47 526.22 6,261.90 435.31 5,521.40 398.95 5,786.38 256.52 3,364.29 187.64 2,792.22 177.87 2,753.49 151.22 2,146.95 129.758 2,336.04 95.98 1,568.54 79.21 1,493.09
NICKEL BENEFICIATED ORE DMT 593.94 595.94 346.86 350.77 429.00 376.18 647.27 598.13 656.72 479.64 814.31 514.08 959.95 793.22 625.29 582.95 1,023.38 1,144.46 12,584.00 1,518.58 1,200.20 1,318.37
ZINC CONCENTRATE DMT 0.00 0.00 0.00 0.00 0.00 0.00 0.00 0.00 0.00 0.00 0.00 0.00 0.00 0.00 0.00 0.00 - METALLURGICAL CHROMITE CONCENTRATE DMT 14.02 14.62 4.23 4.03 1.05 1.13 13.32 22.47 31.52 52.53 26.89 49.80 12.56 30.34 14.39 28.86 0 0 0.00 4.36 17.258 26.82
METALLURGICAL CHROMITE ORE DMT 30.92 39.14 9.72 16.31 10.88 23.54 21.96 45.35 18.52 44.87 16.99 48.87 9.94 33.76 3.14 9.08 0.301 0.90 26.00 - - -
CHEMICAL CHROMITE GRADE DMT 9.99 19.27 1.60 0.96 0.00 0.00 0.00 0.00 0.00 0.00 0.00 0.00 0.00 0.00 0.00 0.00 - 2.30 - -
REFRACTORY CHROMITE ORE DMT 39.30 61.92 49.53 80.05 64.08 115.24 66.81 175.00 67.94 179.71 54.21 188.38 19.72 99.94 0.00 0.00 20.619 72.53 93.78 4.74 24.93
IRON ORE DMT 7.35 0.44 0.00 0.00 0.00 0.00 0.00 0.00 0.00 0.00 11.80 0.35 0.00 0.00 0.00 0.00 6.404 0.57 4.31 0.45 2.802 0.29
MANGANESE ORE DMT 13.80 7.42 1.23 0.59 0.00 0.00 0.00 0.00 0.00 0.00 0.00 0.00 0.00 0.00 0.00 0.00 -
Total Metallics 14,672.02 14,757.03 15,126.75 15,225.92 14,080.07 13,593.92 16,598.92 13,606.83 17,477.07 17,764.67 20,940.33 ** Nickel metal equivalent of beneficiated ore produced. Note: Details may not add-up to totals due to rounding. Source: MGB, DENR

TABLE 5.2. NON-METALLIC MINERAL PRODUCTION, 1992- 2002 (volume in thousand units, value: in million pesos)
UNIT 1992 1993 1994 1995 1996 1997 1998 1999 2000 2001 2002 NON-METALLIC
MINERAL/MINERAL PRODUCT USED Vol Value Vol Value Vol Value Vol Value Vol Value Vol Value Vol Value Vol Value Vol Value Volume Value Volume Value
COAL MT 1,665.20 1,828.39 1,581.87 1,581.87 1,345.56 1,297.85 1,265.73 1,265.73 955.63 955.63 1,078.65 1,186.52 1,157.20 1,272.92 1,204.98 1,204.98 1,353.45 1218.11 1,229.82 983.86 1,645.66 1,481.09
SALT (from sea water) MT 495.82 2,193.99 535.48 3,128.14 530.77 3,541.92 612.86 3,850.66 618.48 6,078.19 686.51 7,250.25 727.75 8,074.08 704.35 5,980.00 589.53 3,892.00 236.987 2,305.88 460.98 3,226.88
SILICA SAND MT 744.54 57.06 102.97 17.02 130.24 26.68 117.94 14.74 30.73 4.27 20.51 2.75 16.11 1.89 64.18 6.55 70.60 7.57 60.41 9.31 155.71 18.47
SAND & GRAVEL CU.M 15,786.59 2,399.56 16,692.72 3,389.09 16,477.85 4,050.10 28,155.09 6,600.68 37,446.27 8,733.08 40,030.06 10,061.71 34,707.05 8,945.37 32,20.35 8,139.99 30,248.18 5,625.86 35,257.88 5,608.12 37,773.86 6,075.93
CEMENT RAW MATERIALS:
LIMESTONE FOR CEMENT MFTR
MT 10,225.14 750.91 5,355.72 267.64 19,945.18 243.23 6,680.86 459.18 6,709.77 645.41 10,216.34 705.62 27,713.71 2,405.24 13,379.45 849.88 20426.84 1,320.78 19,826.58 1,300.11 18,626.23 1,090.09
SHALE CLAY MT 1,496.77 78.76 647.46 23.29 802.54 29.49 823.73 30.16 997.83 69.77 1,125.97 66.64 917.91 50.75 1,074..81 54.14 1,263.07 63.09 1366.08 71.06 1,523.24 96.63
SILICA SAND MT 1,141.96 102.70 225.74 30.79 192.93 24.57 127.24 14.52 299.86 46.21 212.27 37.22 317.61 44.37 264.11 22.46 573.96 78.90 342.444 70.90 374.98 64.71
OTHERS 2,580.49 244.62 245.49 539.10 466.61 175.30 335.49 1068.12 1,273.77 854.63 2,200.85
CEMENT BAGS 313,938.10 (21,836.23) 298,975.38 (23,379.82) 284,458.22 (29,060.25) 334,915.45 (31,937.54)
Total Non-Metallic 9,991.86 8,682.46 9,459.33 12,774.77 16,999.17 19,486.02 21,130.11 17,325.12 13,480.10 11,203.88 14,254.65
Source: MGB, DENR

TABLE 5.3. ACCIDENT STATISTICS, FY 1994 to 2002
LTA Methods / Commodity NLTA
Non-Fatal Fatal Days Lost Man hours
Worked Frequency
Rate Severity
Rate Combined FR
& SR Incidence
Rate
FY 2001-2002
(48 companies considered) 266 98 5 34,704.00 33,074,623.54 3.11 1,021.61 1,590.74* 11.16
Underground Operations 155 24 4 26,816.00 6,174,835.00 4.53 4,342.79 9,846.26 29.64 Surface Operations 24 1 0 5.00 4,680,076.19 0.21 1.07 0.11 5.34 Block Caving Mines 13 33 0 914.00 8,382,553.00 3.94 109.04 214.62 5.49 Quarry/Rock Operations 5 12 0 182.00 2,294,630.97 5.23 79.32 207.39 7.41 Cement Plant 82 61 1 6,787.00 11,542,528.38 5.37 587.96 1,579.09 12.48 FY 2000-2001 (46 Companies considered)
405 165 13 83747 40,722,495.00 4.37 2,056.52 4,494.57 14.32
Underground Operations 14 29 7 44,135 6,545,085.00 5.5 6743.23 18,544.92 7.64 Surface Operations 49 7 0 564 7,028,415.44 1.0 80.25 39.96 7.97 Block Caving Mines 161 53 4 24,975 11,988,880.00 4.75 2,083.18 4,952.14 18.18 Quarry/Rock Operations 4 3 0 37 2,259,135.45 1.33 16.38 10.87 3.1 Cement Plant 177 73 2 14036 12,900,979.00 5.81 1087.94 3,162.38 19.53 FY 1999-2000
(46 Companies Considered) 500 161 6 38,545.00 45,871,872.30 3.64 840.27 1,529.53 14.54
Underground Operations 172 31 1 6,446.00 8,467,450.00 3.78 761.27 1,438.48 24.09 Surface Operations 38 16 1 6,291 8,224,503.43 2.07 764.91 790.53 6.69 Block Caving Mines 137 17 4 24,295 9,937,231.00 2.11 244.85 5,583.30 15.9 Quarry Operations 19 6 0 36 2,004,645.69 2.99 17.96 28.87 12.47 Cement Plant 134 91 0 1,477 17,238,042.18 5.28 85.67 226.13 13.05 FY 1997-1998 (45 Companies Considered)
478 319 10 68158 53,215,694.94 6.18 1,280.78 3,959.12 15.16
Underground Operations 178 73 5 35,159 17,261,266.50 4.52 2,036.87 4,602.10 14.83 Surface Operations 29 37 0 666 10,458,272.30 3.54 63.68 112.65 6.31 Combined Operations 49 1 1 6,031 2,648,185.00 0.76 2,277.41 859.99 19.26 Quarry Operations 10 1 0 64 2,133,508.09 0.47 30.00 7.03 5.16 Cement Plant 212 207 4 26,238 20,714,463.05 10.19 1,266.63 6,450.94 20.42

TABLE 5.3. (continued)…..
LTA Methods / Commodity NLTA
Non-Fatal Fatal Days Lost Man hours
Worked Frequency
Rate Severity
Rate Combined FR
& SR Incidence
Rate
FY 1996-1997 (41 Companies Considered)
410 417 14 94,547 57,051,443.00 7.55 1,657.22 6,259.82 14.74
Underground Operations 186 148 9 58,595 19,377,965.45 8.10 3,023.80 12,249.37 17.70 Surface Operations 68 37 0 2,156 11,348,880.85 3.26 189.97 309.68 9.25 Combined Operations 36 2 0 297 2,334,114.00 0.86 127.24 54.51 16.28 Quarry Operations 11 5 1 6,137 2,324,147.70 2.58 2,640.54 3,408.40 7.31 Cement Plant 109 225 4 27,362 21,666,335.00 10.57 1,262.88 6,673.94 15.60 FY 1995-1996 (42 Companies Considered)
323 437 15 100,995 58,007,385.05 7.79 1,741.07 6,783.31 13.36
Underground Operations 107 135 7 49,312 20,522,993.64 6.92 2,402.77 8,312.46 12.13 Surface Operations 32 44 5 30,529 14,492,853.30 3.38 2,106.49 3,560.99 5.59 Combined Operations 22 4 1 6,038 1,487,457.00 3.36 4,059.28 6,822.51 18.15 Quarry Operations 20 7 0 180 1,806,122.36 3.88 99.66 193.13 14.95 Cement Plant 142 247 2 14,936 19,697,958.75 12.64 758.25 1,492.49 19.85 FY 1994-1995 (40 Companies Considered)
332 495 15 99,145 60,412,230.60 8.44 1,641.14 9,627.26 13.94
Underground Operations 102 105 12 78,562 21,557,140.50 5.43 3,644.36 9,889.77 10.16 Surface Operations 127 165 1 6,685 18,328,417.50 9.06 364.73 1,651.69 15.99 Combined Operations No Operating Company Quarry Operations 35 12 0 206 1,637,271.07 7.33 125.82 461.08 28.71 Cement Plant 68 213 2 13,692 18,889,401.53 11.38 724.85 4,125.14 14.98 NLTA - non-life tailings accident LTA - life tailings accident * companies with incomplete data Source: MGB, DENR
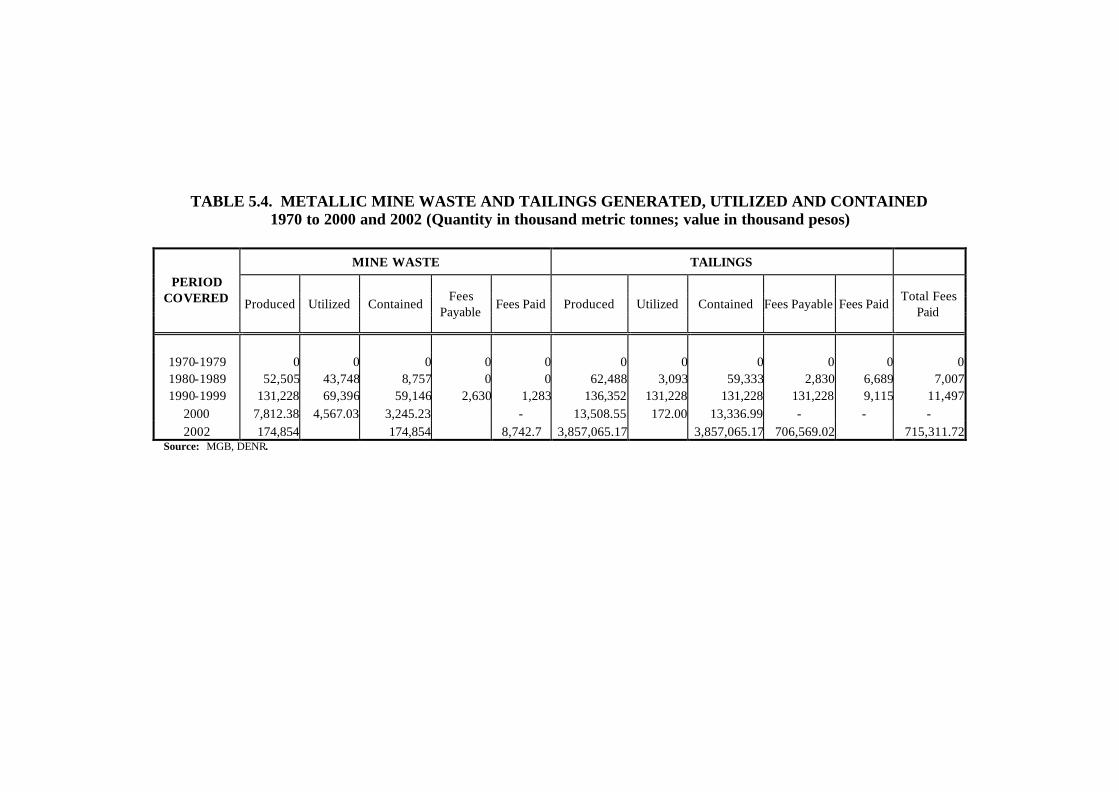
TABLE 5.4. METALLIC MINE WASTE AND TAILINGS GENERATED, UTILIZED AND CONTAINED 1970 to 2000 and 2002 (Quantity in thousand metric tonnes; value in thousand pesos)
MINE WASTE TAILINGS
PERIOD COVERED Produced Utilized Contained
Fees Payable
Fees Paid Produced Utilized Contained Fees Payable Fees Paid Total Fees
Paid
1970-1979 0 0 0 0 0 0 0 0 0 0 0 1980-1989 52,505 43,748 8,757 0 0 62,488 3,093 59,333 2,830 6,689 7,007 1990-1999 131,228 69,396 59,146 2,630 1,283 136,352 131,228 131,228 131,228 9,115 11,497
2000 7,812.38 4,567.03 3,245.23 - 13,508.55 172.00 13,336.99 - - - 2002 174,854 174,854 8,742.7 3,857,065.17 3,857,065.17 706,569.02 715,311.72
Source: MGB, DENR.

TABLE 5.5a. METALLIC MINE WASTE AND TAILINGS GENERATION (by region), 2000
Mine Waste (in MT) Mil Tailings (in MT)
Region Produced Utilized Contained Produced Utilized Contained
CAR 444,009.00 414,949.00 29,060.00 8,324,681.55 162,131.00 8,163,000.55 Region III 224.00 0.00 224.00 13,734.00 8,844.00 4,890.00 Region IV 936,131.00 400,168.00 535,963.00 0.00 0.00 0.00 Region V 2,229.00 791.00 1,438.00 692.00 0.00 692.00 Region VI 784,592.75 718,194.75 66,398.00 3,511,579.24 0.00 3,511,579.24 Region XI 1,290.00 1,290.00 0.00 0.00 0.00 0.00 Region XIII 5,643,907.00 3,031,639.00 2,612,152.00 1,657,862.00 1,026.00 1,656,836.00
Total 7,812,382.75 4,567,031.75 3,245,235.00 13,508,548.79 172,001.00 13,336,997.79 Source: MGB, DENR
TABLE 5.5b. METALLIC MINE WASTE AND TAILINGS GENERATION (by region), 2002
Mine Waste (in MT) Mil Tailings (in MT) Region
Produced Utilized Contained Produced Utilized Contained CAR - - - - - 3,778,690.17CAR - - - - - - Region III - - - - - - Region IV - - - - - - Region V - - - - - - Region VI - - - - - - Region VI - - - - - - Region XI - - - - - - Region XIII - - - - - - Region XIII - - 174,854.00 - - 78,375.00
Total - - 174,854.00 - -- 3,857,065.17 Source: MGB, DENR

Table 5.6. NON-METALLIC MINE WASTE AND TAILINGS GENERATED, UTILIZED AND CONTAINED 1970 to 2000, and 2002 (quantity in thousand metric tonnes; value in thousand pesos)
MINE WASTE TAILINGS PERIOD
COVERED Produced Utilized Contained Fees Payable Fees Paid Produced Utilized Contained Fees Payable Fees Paid
Total Fees Paid
1970 - 1979 1.08 1.08 0.00 0.00 0.00 0.00 0.00 0.00 0.00 0.00 0.00
1980 - 1989 1,214.74 1,047.65 145.43 7.16 0.55 5.66 0.00 5.66 0.57 0.57 1.21
1990 - 1999 5,881.71 3,937.12 1,975.03 107.74 84.56 188.32 84.09 104.23 10.42 9.49 93.78
2000 2,318.91 1,531.60 723.10 - - 274.66 175.83 98.86 - -
2002 48,936 2,446.16 1,321.83 132.18 2,578.34Source: MGB, DENR
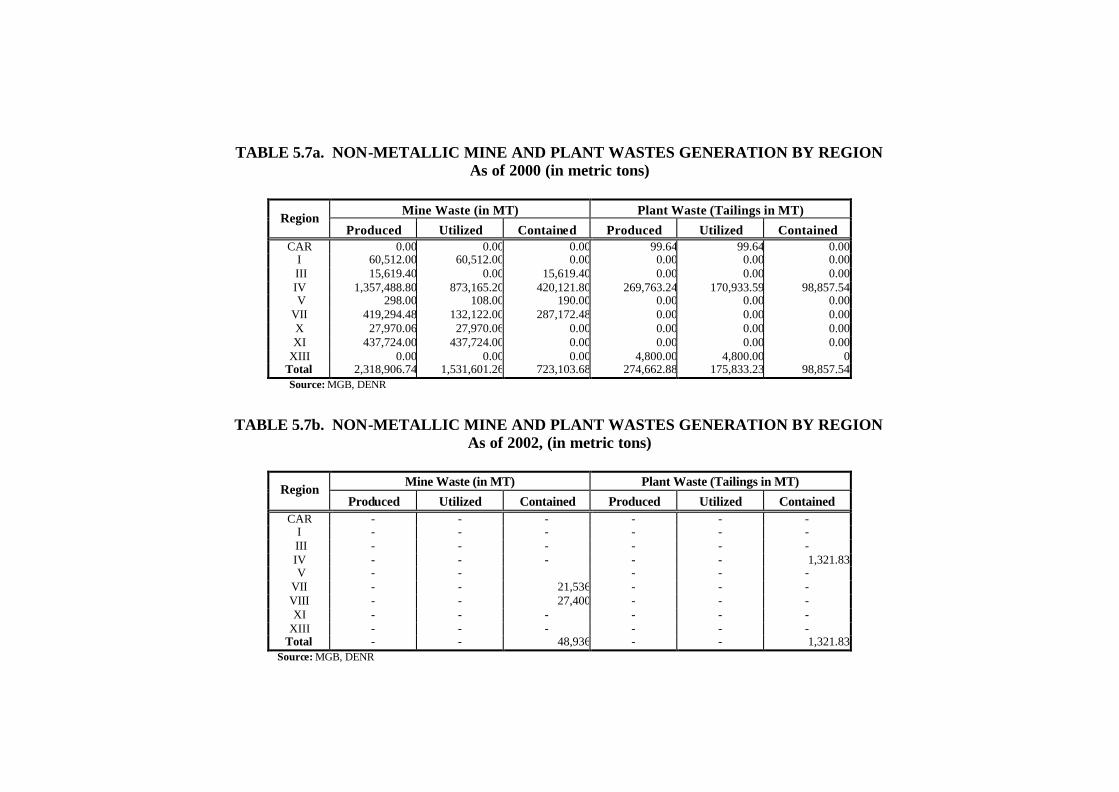
TABLE 5.7a. NON-METALLIC MINE AND PLANT WASTES GENERATION BY REGION As of 2000 (in metric tons)
Mine Waste (in MT) Plant Waste (Tailings in MT)
Region Produced Utilized Contained Produced Utilized Contained
CAR 0.00 0.00 0.00 99.64 99.64 0.00 I 60,512.00 60,512.00 0.00 0.00 0.00 0.00
III 15,619.40 0.00 15,619.40 0.00 0.00 0.00 IV 1,357,488.80 873,165.20 420,121.80 269,763.24 170,933.59 98,857.54 V 298.00 108.00 190.00 0.00 0.00 0.00 VII 419,294.48 132,122.00 287,172.48 0.00 0.00 0.00 X 27,970.06 27,970.06 0.00 0.00 0.00 0.00 XI 437,724.00 437,724.00 0.00 0.00 0.00 0.00
XIII 0.00 0.00 0.00 4,800.00 4,800.00 0 Total 2,318,906.74 1,531,601.26 723,103.68 274,662.88 175,833.23 98,857.54 Source: MGB, DENR
TABLE 5.7b. NON-METALLIC MINE AND PLANT WASTES GENERATION BY REGION
As of 2002, (in metric tons)
Mine Waste (in MT) Plant Waste (Tailings in MT) Region
Produced Utilized Contained Produced Utilized Contained CAR - - - - - -
I - - - - - - III - - - - - - IV - - - - - 1,321.83 V - - - - - VII - - 21,536 - - - VIII - - 27,400 - - - XI - - - - - -
XIII - - - - - - Total - - 48,936 - - 1,321.83
Source: MGB, DENR

TABLE 5.8a. SUMMARY OF PHILIPPINE METALLIC MINERAL RESOURCE AND
RESERVE INVENTORY BY COMMODITY, as of year 2000
Updated Unupdated Commodity Tonnage WAG Tonnage WAG
Chromite Chromite 4,966,619 34.561 % Cr2O4 Chromite (Chemical) 2,791,430 43.522 % Cr2O4 Chromite (Lateritic) 930,750 7.880 % Cr2O4 Chromite (Lode Ore) 447,755 21.520 % Cr2O4
Chromite (Metallurgical) 24,051,560 22.004 % Cr2O4 Chromie (Refractory) 3,998,030 31.020 % Cr2O4
Copper 2,848,342,746 0.541 % Cu Gold 266,739,650 2.773 gpt Au Iron 526,804,000 47.101 % Fe Lead 80,291 Manganese 3,411,710 35.037 % Mn Mercury 17,466,400 6.405 % lb Molybdenum 306,081,200 0.080 % Mo Nickel 672,955,296 1.436 % Ni Zinc 229,873 1.650 % % Zn
Notes: 1. In an attempt to take into account previously reported resource and reserve data, the 1996 Philippine Metallic Reserves
(the latest available set of data previous to 2000) have been considered. Thus, the Report on 2000 Philippine Metallic Mineral Resources and Reserve Inventory has two (2) Sections: Updated and Unupdated Sections
2. Updated - is a compilation of reports on mineral resource/ore reserve during the last three (3) years 3. Unupdated - include projects previously reported but whose status of development and operations and quantity and quality
of mineral reserves have not been updated for more than three (3) years. Source: MGB, DENR

TABLE 5.8b. SUMMARY OF PHILIPPINE METALLIC MINERAL RESOURCE AND
RESERVE INVENTORY BY COMMODITY, as of year 2002
Updated Unupdated Commodity Tonnage WAG Tonnage WAG
Chromite 9,295,305 41,127,690 Chromite 7,227,200 22.57 % Cr2O4 11,974,040 27.29 % Cr2O5 Chromite (Lateritic) 930,750 7.88 % Cr2O5 Chromite (Lode Orde) 447,755 21.52 % Cr2O6 Chromite (Metallurgical) 689,600 38.4 % Cr2O7 23,730,810 21.39 % Cr2O8 Chromite (Chemical) 2,791,430 43.52 % Cr2O9 Chromite (Refractory) 2,631,410 30.78 % Cr2O10
Copper 1,439,160,656 0.46 % Cu 3,228,132,920 0.43 % Cu Gold 794,858,016 1.59 gpt Au 123,597,900 1.35 gpt Au Iron 2,309,000 15 % Fe 515,196,310 38.03 % Fe Lead 80,291 408,780 0.46 % Pb Manganese 248,500 44.32 % Mn 2,596,190 45.41 % Mn Mercury 18,284,020 6.21 lb Molybdenum 306,081,200 0.08 % Mo Nickel 533,512,570 102.46 % Ni 2,796,912,810 1.38 % Ni Zinc 229,873 1.65 % Zn
Grand Total Metallic 2,779,694,211 7,032,337,820 Note:
UPDATED - Contains the list of mining companies whose mineral reserves had been obtained from a specific host of source (MGB Form 29-19), audited annual company reports, fieldwork reports, and other reliable documentary sources available and updated during the last Three (3) years
UNUPDATED - Contains lists of mining companies/operators/claim owners whose mineral reserve estimates within respective mining projects/mineral properties together with their status of operations, remained unchanged/unupdated for the last four (4) years.
Source: MGB, DENR

TABLE 5.9a. SUMMARY PHILIPPINE NON-METALLIC MINERAL RESOURCE AND RESERVE INVENTORY BY COMMODITY, as of year 2000
Updated Unupdated Commodity
Tonnage Average Grade Tonnage Average Grade Aggregates
Andesites 25,486,353 Basalt 37,286,882 Pebbles 22,557,020 Pumice and Pumicites 21,653,720 Rock Aggregates 131,792,158 Tuff 152,207,650 60.806
Asbestos Asbestos 5,810,920 11.386
Bauxite Bauxite 116,230,230 40.802
Ceramics Diatomaceous Earth 4,725,300 Feldspar 10,000 White Clay 60,000
Clay Barite 163,320 86.400 Bentonite 50,000 Clay 70,000,000 Clay Ball 200,000 Clay -Bentonite 1,070,560 Clay - Feldspathic 5,087,165 68.410 Clay - Fire
Source: MGB, DENR

TABLE 5.9a. (continued)…..
Updated Unupdated Commodity Tonnage Average Grade Tonnage Average Grade
Caly Kalinitic 1,331,000 Clay - Siliceous 120,827,140 Perite 172,364 69.475 Talc 257,250 Guano
Guano 298,090 24.316 Gypsum Gypsum 2,437,910 24.316
Limestone Limestone 10,937,619,841 90.126 Limestone - Dolomitic 214,492,955 34.160 Limestone - Lime 503,600,000 98.000 Marble 9,400,000
Magnesium Magnesite 675,166 44.510
Phosphate Rock Phosphate 513,070 25.871
Sand and Gravel Sand and Gravel 383,805,617
Shale Shale 401,395,264 47.206
Silica Silica 20,519,407 80.000 Silica - Sand
Source: MGB, DENR

TABLE 5.9a. (continued)…..
Updated Unupdated Commodity
Tonnage Average Grade Tonnage Average Grade Silica - Siliceous Rock mass 1,358,864,270 75.697 Silica Chert 20,519,407 80.000 Silica Quartz 43,031,790 97.753
Sulphur Pyrite 14,195,170 37.806
Sulphur 48,877,260 14.624 Notes: 1. In an attempt top take into account of previously reported resource and reserve data, the 1996 Philippine Reserves
(the latest available set of data previous to year 2000) have been considered. Thus, the Report on 2000 Philippine Non-Metallic Mineral Resources and Reserve Inventory has two (2) sections: Updated and Unupdated Sections
2. Updated - is a compilation of reports on mineral resource/ore reserve during the last three (30 years 3. Unupdated - include project reported but whose status of development and operations and quantity and quality of
mineral reserves have not been updated for more than three (3) years Source: MGB, DENR

TABLE 5.9b. SUMMARY PHILIPPINE NON-METALLIC MINERAL RESOURCE AND RESERVE INVENTORY BY COMMODITY, as of year 2002
Updated Unupdated
Commodity Tonnage WAG Tonnage WAG
Aggregates 739,023,042 7,973,642,326 Andesites 21,897,780 0.00 Basalt 467,624,308 0.00 Pebbles 22,557,020 0.00 Pumice and Pumicites 23,759,760 0.00 Rock Aggregates 249,500,954 0.00 7,775,117,896 0.00 Tuff 152,207,650 60.81 SiO2
Asbestos 5,815,920 11.38 % Yield Bauxite 116,230,230 40.8 % Al2O3 292,010,410 21.03 % Al2O3 Ceramics 1,378,500 38,344,530.00
Diatomaceous Earth 4,725,300 Feldspar 20,000 0 33,119,230 63.58% SiO2 White Clay 1,358,500 23.9 % SiO2 500,000 80.0 % SiO2
Clay 10,591,029 507,381,990 Barite 163,320 29.10%BaSO4 Bentonite 1,056,900 0.00 6,647,650 0.00 Clay 8,013,100 0.00 Clay Ball 200,000 64,799,950 0.00 Clay - Feldspathic 5,087,165 11,592,690 0.00 Clay - Fire 269,103,810 0.00 Caly Kalinitic 1,526,000 20,763,780 0.00 Clay - Siliceous 120,827,140 0.00 Perite 2,720,964 4,958,900 71.60 %SiO2 Talc 511,650 0.00

TABLE 5.9b. (continued)…..
Updated Unupdated Commodity
Tonnage WAG Tonnage WAG
Gypsum 2,437,910 84.92%CaSO4 Limestone 9,768,463,035 59,520,551,721
Limestone 8,638,163,115 71.2%CaCO327,710,664,691 73.09% CaCO3
Limestone Cement 951,825,310 88.93% CaCO4
Limestone - Dolomitic 426,520,073 18.47%MgO 430,605,670 16.83% MgO
Limestone - Lime 505,379,847 97.93% CaCO31,194,647,950 95.66% CaCO6
Limestone - marbelized 1,998,483,150 0.00
Marble 198,400,000 0.00 27,234,324,950 0.00
Magnesium 672,506 78,795,400 Magnesite 672,506 44.51% MgO 78,795,400 37.68% MgO
Phosphate 513,070 Rock Phosphate 513,070 25.78% P2O5
Sand and Gravel 5,685,507 0.00 213,594,555 0.00 Shale 501,378,874 34.68 % SiO2 2,049,914,010 51.1%SiO2 Silica 255,816,477 2,078,085,210
Silica 39,071,875 89.1% SiO2 Silica - Sand 3,238,500 78.83 % SiO3 591,689,110 80.94 %SiO2 Silica - Siliceous Rock mass 152,880,858 59.17 %SiO4 1,477,210,410 73.62 %SiO2 Silica Chert 17,593,454 80.0 % SiO5 Silica Quartz 43,031,790 97.75 % SiO6 9,185,690 97.59 % SiO2
Sulphur 125,064 63,072,430 Pyrite 14,195,170 37.81 % S Sulphur 125,064 0 48,877,260 14.62 % S
Grand Total 11,399,364,264 72,824,457,572 UPDATED - Contains the list of mining companies whose mineral reserves had been obtained from a specific host of source (MGB Form 29-19), audited
annual company reports, fieldwork reports, and other reliable documentary sources available and updated during the last Three (3) years UNUPDATED - Contains lists of mining companies/operators/claim owners whose mineral reserve estimates within respective mining projects/mineral properties together with their
status of operations, remained unchanged/unupdated for the last four (4) years. Source: MGB, DENR

TABLE 5.10. COAL PRODUCTION, BY MAJOR AREA, 1995 – 2002 (quantity at 10,000 BTU per pound)
Areas 1995 1996 1997 1998 1999 2000 2001 2002
Total 1,136,883 970,837 946,719 1,016,054 1,028,470 1,180,774 1,229,822 1,664,762 Cebu 128,250 89,951 69,860 63,845 23,930 19,919 22,348 20,388
Northen Cebu 38,882 31,823 25,642 20,294 2,546 - - 1,119 Central Cebu 19,423 6,515 1,782 2,963 481 - - - Southern Cebu 69,945 51,613 42,436 40,588 20,903 19,919 22,348 19,269
Bataan 5,964 9,332 4,819 3,839 4,886 4,072 1,954 - Surigao 144,734 133,025 165,932 112,092 65,796 5,080 - - Zamboanga 104,069 65,133 - 870 5,944 - - 102,329 Semirara 749,692 664,730 702,032 835,408 920,251 1,136,165 1,190,211 1,515,039 Polillo, Quezon 1,429 87 - - -- - - - Other Regions 2,745 8,579 4,076 0 7,663 15,538 15,309 27,006
Negros 2,745 8,579 4,076 - 7,663 7,700 8,537 10,685 Negros Small Scale - - - - - 7,838 5,887 8,915 Masbate - - - - - - 885 4,590 Albas, Batan Island - - - - - - - 2,816
Source: PY, NSO
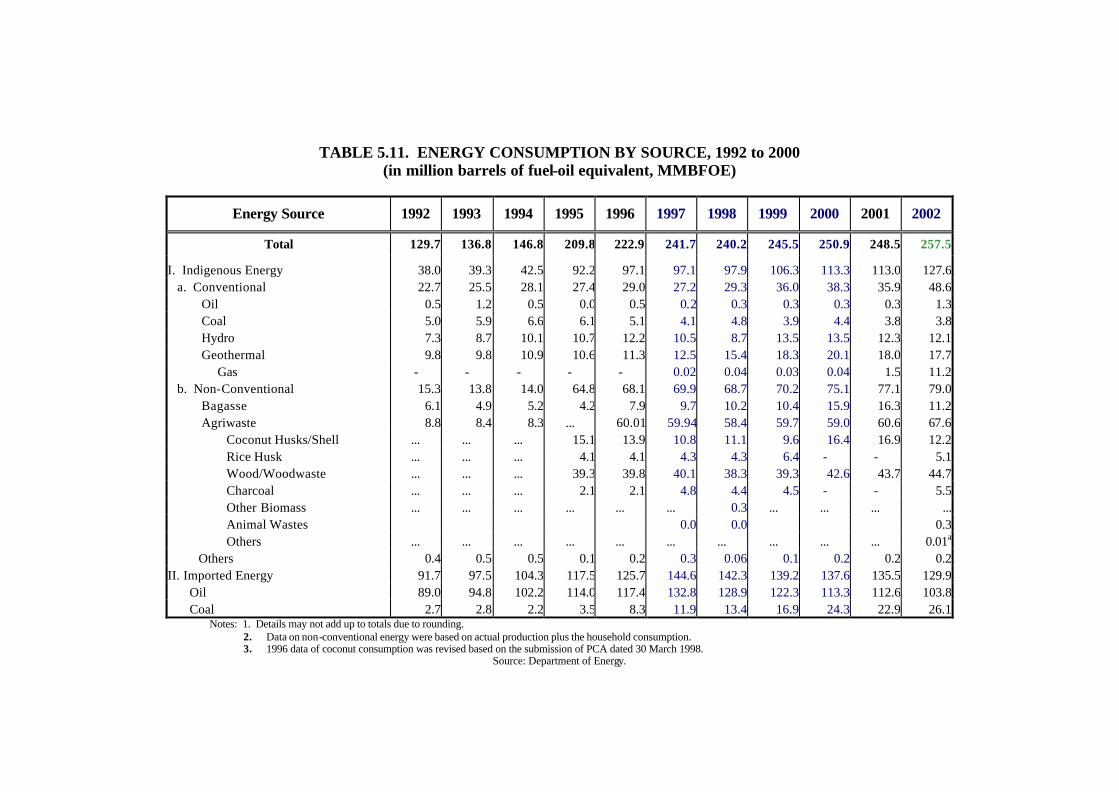
TABLE 5.11. ENERGY CONSUMPTION BY SOURCE, 1992 to 2000 (in million barrels of fuel-oil equivalent, MMBFOE)
Energy Source 1992 1993 1994 1995 1996 1997 1998 1999 2000 2001 2002
Total 129.7 136.8 146.8 209.8 222.9 241.7 240.2 245.5 250.9 248.5 257.5
I. Indigenous Energy 38.0 39.3 42.5 92.2 97.1 97.1 97.9 106.3 113.3 113.0 127.6 a. Conventional 22.7 25.5 28.1 27.4 29.0 27.2 29.3 36.0 38.3 35.9 48.6
Oil 0.5 1.2 0.5 0.0 0.5 0.2 0.3 0.3 0.3 0.3 1.3 Coal 5.0 5.9 6.6 6.1 5.1 4.1 4.8 3.9 4.4 3.8 3.8 Hydro 7.3 8.7 10.1 10.7 12.2 10.5 8.7 13.5 13.5 12.3 12.1 Geothermal 9.8 9.8 10.9 10.6 11.3 12.5 15.4 18.3 20.1 18.0 17.7
Gas - - - - - 0.02 0.04 0.03 0.04 1.5 11.2 b. Non-Conventional 15.3 13.8 14.0 64.8 68.1 69.9 68.7 70.2 75.1 77.1 79.0
Bagasse 6.1 4.9 5.2 4.2 7.9 9.7 10.2 10.4 15.9 16.3 11.2 Agriwaste 8.8 8.4 8.3 ... 60.01 59.94 58.4 59.7 59.0 60.6 67.6
Coconut Husks/Shell ... ... ... 15.1 13.9 10.8 11.1 9.6 16.4 16.9 12.2 Rice Husk ... ... ... 4.1 4.1 4.3 4.3 6.4 - - 5.1 Wood/Woodwaste ... ... ... 39.3 39.8 40.1 38.3 39.3 42.6 43.7 44.7 Charcoal ... ... ... 2.1 2.1 4.8 4.4 4.5 - - 5.5 Other Biomass ... ... ... ... ... ... 0.3 ... ... ... ...Animal Wastes 0.0 0.0 0.3 Others ... ... ... ... ... ... ... ... ... ... 0.01a
Others 0.4 0.5 0.5 0.1 0.2 0.3 0.06 0.1 0.2 0.2 0.2 II. Imported Energy 91.7 97.5 104.3 117.5 125.7 144.6 142.3 139.2 137.6 135.5 129.9
Oil 89.0 94.8 102.2 114.0 117.4 132.8 128.9 122.3 113.3 112.6 103.8 Coal 2.7 2.8 2.2 3.5 8.3 11.9 13.4 16.9 24.3 22.9 26.1
Notes: 1. Details may not add up to totals due to rounding. 2. Data on non-conventional energy were based on actual production plus the household consumption. 3. 1996 data of coconut consumption was revised based on the submission of PCA dated 30 March 1998.
Source: Department of Energy.

TABLE 5.12. COAL CONSUMPTION, by Major User, 1990 to 2002
(in metric tons)
Year Total Power Generation Cement Industrial Direct
Processes 1990 2,378,131 1,104,965 865,579 407,587 1991 2,833,343 1,364,172 1,091,663 377,508 1992 2,554,734 1,351,699 885,502 327,533 1993 2,847,233 1,489,418 1,028,719 329,096 1994 2,987,144 1,256,976 1,279,619 360,549 1995 3,115,653 1,420,972 1,342,289 352,392 1996 4,196,960 2,470,363 1,391,036 335,561 1997 4,876,836 3,275,721 1,553,741 47,374 1998 5,409,540 4,045,758 1,338,172 25,610 1999 6,181,704 4,882,889 1,266,257 32,558 2000 8,497,773 7,170,194 1,299,118 28,461 2001 7,902,959 6,995,997 888,484 18,478 2002 7,062,154 6,038,191 767,617 256,346
Source: PY, NSO
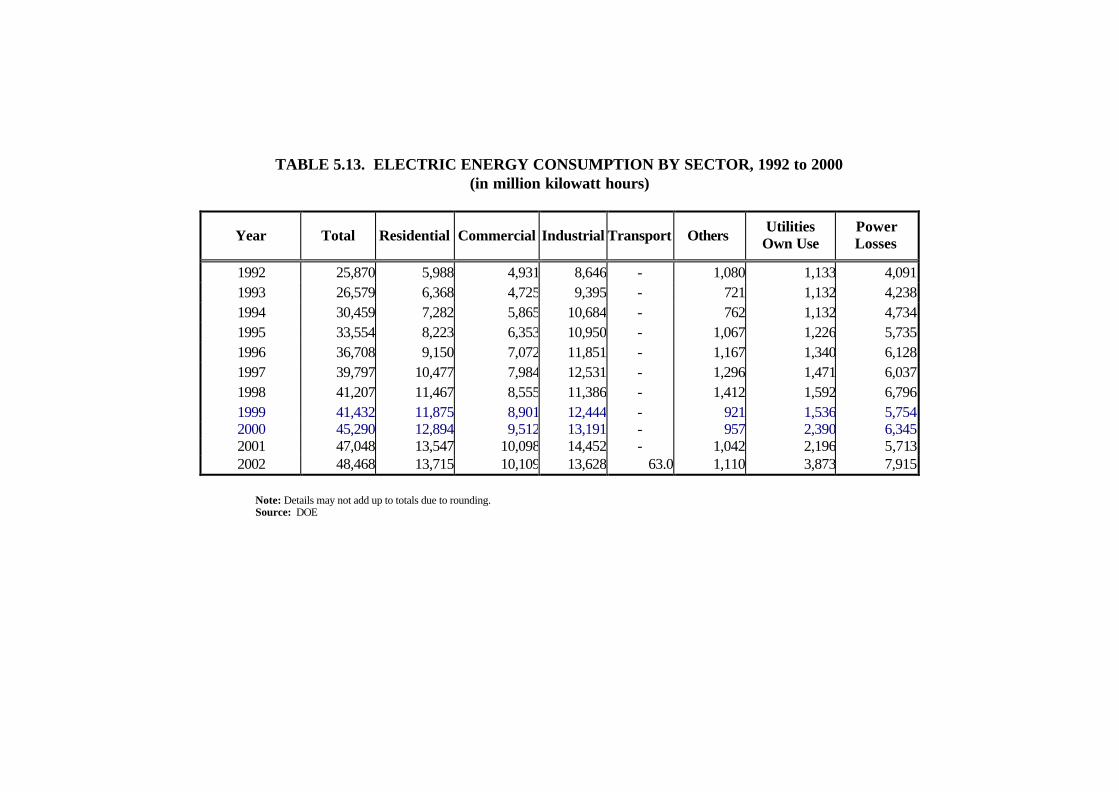
TABLE 5.13. ELECTRIC ENERGY CONSUMPTION BY SECTOR, 1992 to 2000
(in million kilowatt hours)
Year Total Residential Commercial Industrial Transport Others Utilities Own Use
Power Losses
1992 25,870 5,988 4,931 8,646 - 1,080 1,133 4,091 1993 26,579 6,368 4,725 9,395 - 721 1,132 4,238 1994 30,459 7,282 5,865 10,684 - 762 1,132 4,734 1995 33,554 8,223 6,353 10,950 - 1,067 1,226 5,735 1996 36,708 9,150 7,072 11,851 - 1,167 1,340 6,128 1997 39,797 10,477 7,984 12,531 - 1,296 1,471 6,037 1998 41,207 11,467 8,555 11,386 - 1,412 1,592 6,796 1999 41,432 11,875 8,901 12,444 - 921 1,536 5,754 2000 45,290 12,894 9,512 13,191 - 957 2,390 6,345 2001 47,048 13,547 10,098 14,452 - 1,042 2,196 5,713 2002 48,468 13,715 10,109 13,628 63.0 1,110 3,873 7,915
Note: Details may not add up to totals due to rounding. Source: DOE
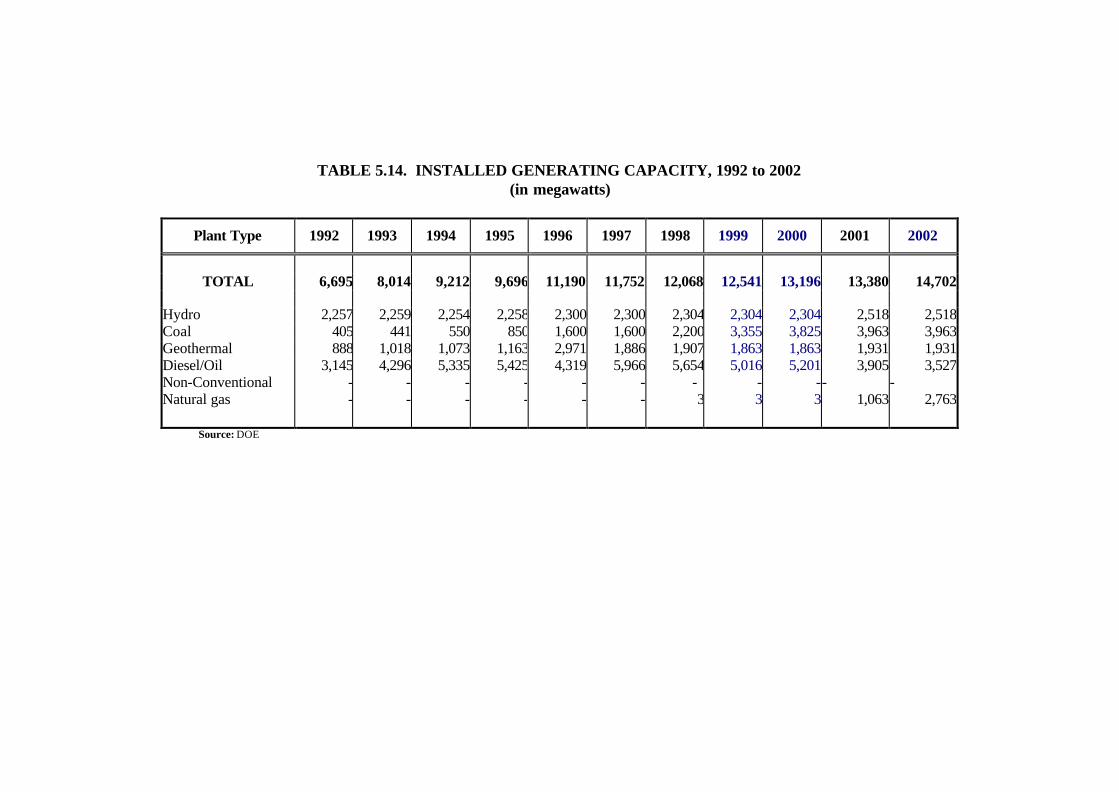
TABLE 5.14. INSTALLED GENERATING CAPACITY, 1992 to 2002
(in megawatts)
Plant Type 1992 1993 1994 1995 1996 1997 1998 1999 2000 2001 2002
TOTAL 6,695 8,014 9,212 9,696 11,190 11,752 12,068 12,541 13,196 13,380 14,702
Hydro 2,257 2,259 2,254 2,258 2,300 2,300 2,304 2,304 2,304 2,518 2,518 Coal 405 441 550 850 1,600 1,600 2,200 3,355 3,825 3,963 3,963 Geothermal 888 1,018 1,073 1,163 2,971 1,886 1,907 1,863 1,863 1,931 1,931 Diesel/Oil 3,145 4,296 5,335 5,425 4,319 5,966 5,654 5,016 5,201 3,905 3,527 Non-Conventional - - - - - - - - -- - Natural gas - - - - - - 3 3 3 1,063 2,763
Source: DOE

TABLE 5.15. POWER GENERATION BY UTILITY, 1992 to 2002
(in million kilowatt-hours)
Independent Power Producers
Year Total National Power
Corporation
National Power
Corporations
Rural Electric Companies
Private Utilities
Manila Electric
Company
Self-Generating Industries
1992 25,870 25,538 - 43 289 - 1993 26,579 26,421 - 40 118 - 1994 30,459 25,092 5,265 32 70 - - 1995 33,554 22,138 11,197 73 53 93 - 1996 36,708 23,816 11,788 93 138 872 - 1997 39,797 23,202 15,500 82 97 916 - 1998 41,578 24,541 15,143 273 766 857 - 1999 41,432 39,257 - 123 1,220 832 - 2000 45,290 40,978 - 73 1,026 3,213 - 2001 47,048 42,302 - 67 967 3,712 2002 48,468 - 38,269 78 1,075 9,046
Note: Details may not add up to totals due to rounding. Source: DOE

TABLE 5.16. LIST OF DENR POLICY ISSUANCES FOR THE MINES AND ENERGY SECTORS, 1996 to 2002)
Number Title
Administrative Order 1996 96-25 Amending Section 257 of the Implementing Rules and Regulations of R.A. 7942
96-25A Amendment to DAO 96-25, Series of 1996
96-40 Revised Implementing Rules and Regulations of Republic Act No. 7942, Otherwise Known as the “Philippine Mining Act of 1995”.
DENR Memorandum Orders 96-13 Requiring Mining/Quarrying Companies Nationwide to Display Billboards on their Operations, “So The People May Know” 96-14 Suspension of Acceptance of Applications for Various Mining Permits/Agreements 1997
Administrative Order 97-06 Prescribing a Uniform Rule for Area Clearance Fees of DENR Sectors Other Than the Mines and Geosciences Bureau for
Mining Rights Applications. 97-07 Authorizing the Director of Mines and Geosciences Bureau to Operationalized the Interim Organizational Units. 97-10 Standard Costs and Fees for Various Services of the Mines and Geosciences Bureau. 97-11 Providing for a Line Organization of the Mines and Geosciences Bureau and Other Purpose 97-30 Small Scale Mine Safety Rules and Regulations
DENR Memorandum Orders 97-03 Policy of Rationalizing the Diwalwal Gold Rush Mining Operations 97-07 Guidelines in the Implementation of the Mandatory September 15, 1997 Deadline for the Filing of Mineral Agreement
Applications by Holders of Valid and Existing Mining Claims and Lease/Quarry Applications and for Other Purposes. 97-30 Small Scale Mine Safety Rules and Regulations DAO Mining Safety 1997 98-08 Amending DENR Memorandum Order No.
98-06 Regarding the Moratorium on the Acceptance of All New Applications and the Approval of All Pending Applications for Small-Scale Mining Permits, Quarrying Permits, Mining Contracts, Agreements and Corresponding ECCs in the Municipality of Rodriguez, Province of Rizal.
DENR Memorandum Circulars 97-05 Procedural Guidelines in the Creation of Provincial /City Mining Regulatory Boards. 97-06 Issuances of Free Patents, Mining Concessions, Leases and Certificates of Stewardship in Areas Covered by the Cagayan
Economic Zone Authority (CEZA)

TABLE 16. (continued)…..
Number Title
1998 DENR Memorandum Orders
98-01 Moratorium on All Mining and Mining-Related Activities in the Diwalwal Gold Rush Area. 98-03 Guidelines in the Issuance of Area Status and Clearance or Consent for Mining Applications. 98-06 Moratorium on the Acceptance of All New Applications and the Approval of All Pending Applications for Small-Scale
Mining Permits, Quarrying Permits, Mining Contracts/ Agreements, and Corresponding ECCs, in the Municipality of Rodriguez (formerly Montalban), Province of Rizal.
98-08 Amending DENR Memorandum Order No. 98-06 Regarding the Moratorium on the Acceptance of All New Applications and Approval of All Pending Applications for Small-Scale Mining Permits, Quarrying Permits, Mining Contracts, Agreements and Corresponding ECCs in the Municipality of Rodriguez, Province of Rizal
98-11 Moratorium on the Acceptance of All New Application and the Approval Of All Pending Applications for Sand and Gravel Permits Along Lagnas River and Its Tributaries at Sariaya, Quezon.
98-19 Interim Authority to Transport Ores Already Extracted and Not Included in the Writ of Injunction Issued by the Court of Appeals in CA-G.R. SP No. 47293, Entitled Mt. Diwata Upper Ulip Tribal Association, Et. Al., Vs. Monkayo Integrated Small-Scale Miner’s Association (MISSMA).
98-20 Suspending DENR Memorandum Order No. 98-19 and Directing the Enforcement of the Presidential Memorandum of September 23, 1998 for the Stoppage of Illegal Mining Operations in Diwalwal.
DENR Memorandum Circulars 98-02 Interim Guidelines in the Processing of Mining Applications Consistent with Republic Act No. 8371. 98-11 Moratorium of Approval of FTAAs. 1999
DENR Administrative Orders 99-03 Guidelines Governing the Utilization and Disposition of the Sand and Lahar Materials in the Areas Declared as Mineral
Reservation Established Under Proclamation No. 66 and Other Lahar-Affected Areas in the Provinces of Pampanga, Tarlac and Zambales.
99-07 Amendment to Item No. 1.0 of DAO No. 97-10 re: Standard Cost and Fees for Various Services of the Mines and Geosciences Bureau Relative to Mining Rights.
99-56 Guidelines Establishing the Fiscal Regime of Financial or Technical Assistance Agreements.

TABLE 16. (continued)…..
Number Title
99-57 Amendments to Department Administrative Order No. 99-40 or the “Revised Implementing Rules and Regulations of Republic Act No. 7942, Otherwise Known as the ‘Philippine Mining Act of 1995’”.
DENR Memorandum Orders 99-03 Procedural Guidelines in the Processing and Issuance of Special Quarry Permit and Sand and Gravel Permit to Extract Sand
and Lahar Materials in the Mineral Reservation Established and Declared Under Proclamation No. 66 and Other Lahar Affected Areas in the Provinces of Pampanga, Tarlac and Zambales.
99-08 Rationalization of the Mining Quarrying Operations in Rodriguez and San Mateo Province of Rizal. 99-10 Guidelines in the Determination of Qualified Persons for Mining Applications and Mining Rights. 99-11 Amending Section 40 of Memorandum Order No. 99-03 the Procedural Guidelines in the Processing and Issuances of
Special Quarry Permit and Sand and Gravel Permit to Extract Sand and Lahar Materials in the Mineral Reservation Established and Declared Under Proclamation No. 66 and Other Lahar-Affected Areas in the Provinces of Pampanga, Tarlac, and Zambales.
99-34 Clarificatory Guidelines in the Implementation of DENR Administrative Order No. 96-40 or “Revised Implementing Rules and Regulations of Republic Act No. 7942 Otherwise Known as the ‘Philippine Mining Act of 1995’”.
2000 DENR Administrative Orders
2000-25 Implementing Rules and Regulations Of Executive Order No. 153 - "Authorizing the Utilization of Offshore Areas not Covered by Approved Mining Permits and Contracts as Sources of Dredgefill Materials for Government Reclamation Projects and for Other Purposes”.
2000-39 Rules and Regulations in the Issuance of Onshore Special Minerals Extraction Permits (SMEP) to Qualified Government Entities/Instrumentalities for Government Projects.
2000-61 Amendment to Department Adm1nistrative Order No. 99-57, Entitled “Amendments to DAO No. 96-40 or the Revised Implementing Rules and Regulations of Republic Act No. 7942, Otherwise Known as the ‘Philippine Mining Act of 1995’”.
2000-71 Standard Costs and Fees for Various Services of the Mines and Geosciences Bureau 2000-98 Mine Safety and Health Standard. 2000-99 Amendments to Sections 134-136 Of DENR Administrative Order No. 96-40, the Revised Implementing Rules and
Regulations of Republic Act No. 7942, Otherwise Known as the “Philippine Mining Act of 1995”. 2000-101 Amendments to the Rules and Regulations of the National Pollution Control Commission (1978) Incorporating Permit
Regulations Governing Mine Waste and Mill Tailings Storage Structures.

TABLE 16. (continued)…..
Number Title
DENR Memorandum Orders 2000-01 Compliance with the Transitory Provision Of DMO No. 99-10. 2000-03 Final Extension of Deadline for Compliance with the Transitory Provision Of DENR Memorandum Order NO. 99-10 and for
other Related Purposes. DENR Memorandum Circulars 2000-01 Errata to some Provisions of the DENR Memorandum Order No. 99-32 (DMO 99-32) on Policy Guidelines and Standards
for Mine Wastes and Mill Tailings Management Dated November 24, 1999. Executive Orders
200 Authorizing the Issuance of Onshore Special Minerals Extraction Permits to Qualified Government Entities/ Instrumentalities for Government Projects.
2001 Administrative Orders 2001-35, December 20, 2001
Guidelines in the Declaration and Establishment of Communal Extraction Area for Sand, Gravel, Ordinary Earth and/or Related Materials in Each Province or Highly Urbanized Independent Component City for Housing And/Or Other Personal Construction Needs.
2002 DENR Administrative Order No.2002-18, August 12, 2002
Declaring an Emergency Situation in the Diwalwal Gold Rush Area and Providing for Interim Guidelines to Address the Critical Environmental and Social Consequences Therein
No. 2002-34 December 3, 2002
Amending of DAO 98-67 to Expands its Section 7 to include Reporting of Salt Production, Sales and Employment
No. 2002-35 December 5, 2002
Guidelines Governing the Management of the Diwalwal Mining Areas and Vicinity as Mineral Reservation and Environmentally Critical Area Pursuant to Proclamation No. 297 and for other Purposes
Memorandum Orders 2002-09 Coverage of Administrative Order 2002-18 and the Diwalwal Gold Rush Area in Mt. Diwata, Monkayo, Compostela Valley
province Joint DENR-DOE Administrative Order 2002-01 Procedures for the Establishment of Energy Projects in Protected Areas
Source: Policy Studies Division, Planning and Policy Studies Office, DENR

Human Settlements
Compendium of Philippine Environment Statistics 2004
HHHuuummmaaannn SSSeeettttttllleeemmmeeennntttsss
6 C
hapt
er

Human Settlements
Compendium of Philippine Environment Statistics 2004 6-1
HUMAN SETTLEMENTS Highlights of Results
The Philippines continues to experience rapid increase in population which poses serious constraints on the environment as well as on the capability of the government to provide basic services. This is accompanied by growing urbanization. The continuous influx of migrants into premier cities and urban centers result in overcrowding and larger demand for housing, infrastructure and services which create greater environmental problems, such as pollution, poor sanitation, inadequate garbage collection and disposal, inadequate sewerage system, traffic congestion, and proliferation of slum and squatter settlements. Metro Manila, for instance, is faced with these environmental challenges at present.
Being prone to natural disasters, the Philippines is stricken by major
calamities, such as typhoons, earthquakes, floodings and landslides. The occurrences of these disasters bring about severe destruction of the environment as well as damages to life and property.
Population
Population of the Philippines in 1948 was counted at 19.2 million which almost doubled after 12 years at 36.6 million. Population continued to grow reaching 60.7 million in 1990, 68.6 million in 1995 and 76.5 million in 2000. The annual average growths of the total population for the periods 1980-1990 and 1990-2000 were 2.35 percent and 2.34 percent, respectively. Among the regions, the Autonomous Region of Muslim Mindanao and Southern Tagalog registered the highest population growth at 3.86 percent and 3.72 percent, respectively for 1995-2000, Table 6.1.
The problem in the country’s growing population is reflected in terms of
incidence of poor families. In 1997 and 2000, 31.8 percent and 33.7 percent of households were considered poor. Among the regions, the Autonomous Region of Muslim Mindanao showed the highest incidence of poor families with 57.3 percent and 66 percent in 1997 and 2000, respectively. The National Capital Region registered the lowest incidence of poor families with 6.4 percent and 8.7 percent for the same years.
Population and Energy Consumption Population growth contributes to more energy usage. From 1990 to 1995 consumption of energy increased at an annual average of 5.0 percent while population grew at 2.34 percent. Energy consumption from 1995 to 2000 went up farther to an annual average growth of 8 percent and a population which grew at 2.32 percent annually. With this trend, it may be safe to conclude that population growth is directly proportional to the consumption of energy.

Human Settlements
Compendium of Philippine Environment Statistics 2004 6-2
Table 1. Population of the Philippines and Energy Consumption
1990, 1995, 2000
Year Annual Population
Growth
Annual Average Growth in Energy
Consumption
1990 - 1995 2.32 5% 1995 -2000 2.32 8%
Housing and Infrastructure
With the growing population, the provision of housing becomes a major concern of the government. Through its National Shelter Program, households throughout the country were provided housing assistance at a combined value of P259.6 million for the period 1992 to 2002. Table 2 shows the number of shelter security units constructed, financed and/or administered by the different housing agencies of the country. It should be noted that the shelter security units provided by the NHA and HIGC which include resettlement, core hous ing units, slum upgrading, sites and services, etc. and guaranty programs, special projects and managed relocation projects, etc., respectively declined in 2001 and 2002.
Table 2. Number of Shelter Security Units Constructed, Financed and/or Administered by the Government 1992-2002
YEAR NHA1 NHMFC2 HDMF3 HIGC4 TOTAL
1992 27,492 29,097 14,222 13,967 84,778
1993 17,508 19,091 26,310 19,766 82,675
1994 22,454 25,845 27,170 36,174 111,643
1995 26,227 66,227 38,182 59,651 190,287
1996 27,828 14,688 69,265 71,898 183,679
1997 45,793 14,591 88,148 84,134 232,666
1998 32,875 11,102 52,670 48,962 145,609
1999 40,201 6,286 33,273 11,000 90,760
2000 42,807 6,088 23,944 75,282 148,121
2001 27,457 9,547 25,947 33,241 95,95
2002 22,683 12,331 19,125 28,651 82,790
Total 408,630 280,590 449,931 505,903 1,645,054 1 Includes resettlement, core housing units, slum upgrading, sites and services, emergency housing assistance
program, core housing, medium rise housing, apartment/dormitory 2 Community Mortgage Program and UHLP (1990-1996) 3 Number of constructed residential units financed under the Pag-IBIG Mortgage Financing Program, and
Institutional Loans 4 Guaranty Programs, special projects and managed relocation projects and MRBs, and self-aided housing
5 Shelter Security Units-refers to the number of lots, house and lot packages, or house only that were constructed/produced, financed or administered by the government
Source: Housing and Land Urban Development Coordinating Council
Aside from housing, other services of the government include provision of infrastructures, such as national roads and bridges, schools, and hospitals. In 2002, the
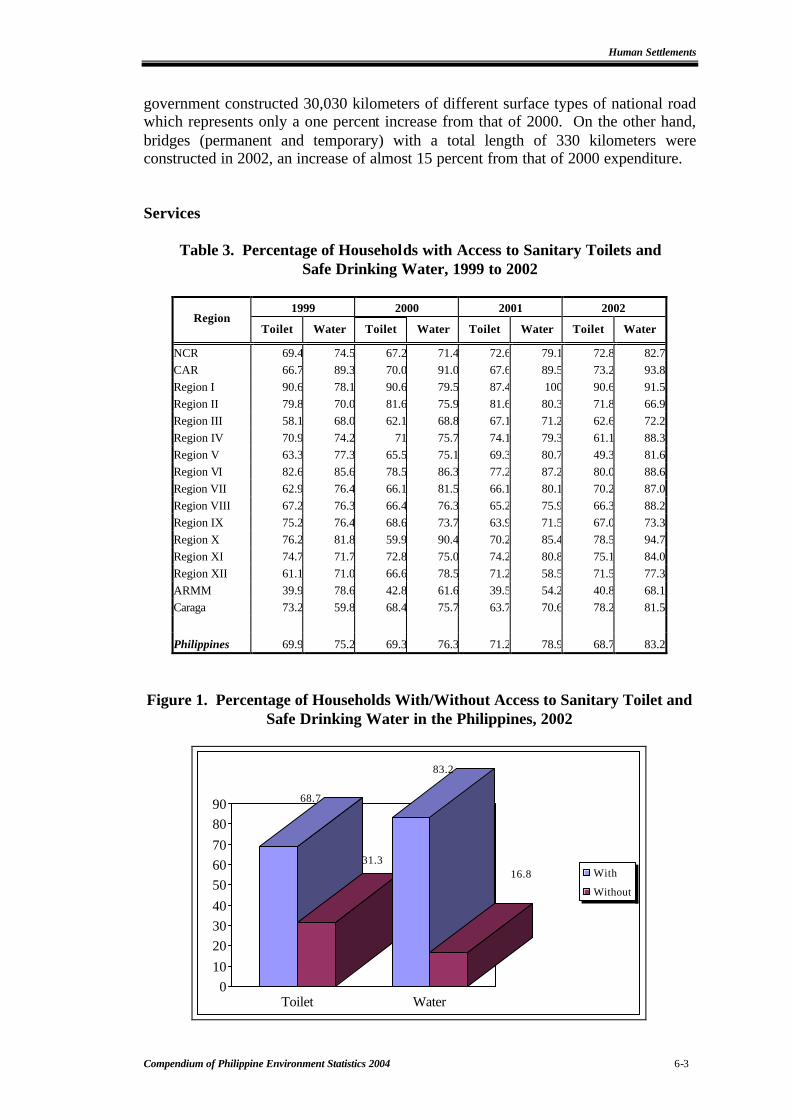
Human Settlements
Compendium of Philippine Environment Statistics 2004 6-3
government constructed 30,030 kilometers of different surface types of national road which represents only a one percent increase from that of 2000. On the other hand, bridges (permanent and temporary) with a total length of 330 kilometers were constructed in 2002, an increase of almost 15 percent from that of 2000 expenditure.
Services
Table 3. Percentage of Households with Access to Sanitary Toilets and Safe Drinking Water, 1999 to 2002
1999 2000 2001 2002
Region Toilet Water Toilet Water Toilet Water Toilet Water
NCR 69.4 74.5 67.2 71.4 72.6 79.1 72.8 82.7CAR 66.7 89.3 70.0 91.0 67.6 89.5 73.2 93.8Region I 90.6 78.1 90.6 79.5 87.4 100 90.6 91.5Region II 79.8 70.0 81.6 75.9 81.6 80.3 71.8 66.9Region III 58.1 68.0 62.1 68.8 67.1 71.2 62.6 72.2Region IV 70.9 74.2 71 75.7 74.1 79.3 61.1 88.3Region V 63.3 77.3 65.5 75.1 69.3 80.7 49.3 81.6Region VI 82.6 85.6 78.5 86.3 77.2 87.2 80.0 88.6Region VII 62.9 76.4 66.1 81.5 66.1 80.1 70.2 87.0Region VIII 67.2 76.3 66.4 76.3 65.2 75.9 66.3 88.2Region IX 75.2 76.4 68.6 73.7 63.9 71.5 67.0 73.3Region X 76.2 81.8 59.9 90.4 70.2 85.4 78.5 94.7Region XI 74.7 71.7 72.8 75.0 74.2 80.8 75.1 84.0Region XII 61.1 71.0 66.6 78.5 71.2 58.5 71.5 77.3ARMM 39.9 78.6 42.8 61.6 39.5 54.2 40.8 68.1Caraga 73.2 59.8 68.4 75.7 63.7 70.6 78.2 81.5
Philippines 69.9 75.2 69.3 76.3 71.2 78.9 68.7 83.2
Figure 1. Percentage of Households With/Without Access to Sanitary Toilet and Safe Drinking Water in the Philippines, 2002
68.7
31.3
83.2
16.8
0102030405060708090
Toilet Water
With
Without

Human Settlements
Compendium of Philippine Environment Statistics 2004 6-4
Of the total households in the country in 2000, 69.3 percent had access to sanitary toilet and 76.3 percent had access to safe drinking water. In 2002, total household with access to sanitary toilet went down to 68.7 percent while the total household with access to safe drinking water increased to 83.2 percent (Figure 1). Table 3 presents the percentage of households with access to safe drinking water and sanitary toilet by region.
The total health expenditures of the country in 2002 in current terms was
placed at P115.4 million. In real terms, however, the growth was placed at -4.0 percent (over 2000’s 5.0 percent) that is from a P34.9 million health spending in 2000 the country decreased it’s spending to P32.0 million in 2002.
Disasters
Disasters can be classified as natural and man-made. Table 4 and Figure 2 illustrate the details on the occurrences of disasters in the country.
Figure 2. Selected Disaster Occurrence, 1993 to 2002
0
50
100
150
200
250
300
Occ
uere
nce
Typhoo
n
Floodi
ngs
Earthq
uakes
Landsli
desTorn
ado
Disaster
Table 4. Selected Natural Disaster Occurrences, 1993 to 2002
Year Kind of Disaster
1993 1994 1995 1996 a/ 1997 1998 1999 2000 2001 2002
1. Typhoon 13 13 9 10 6 4 6 10 17 172. Floodings 26 32 34 21 28 10 38 45 27 193. Earthquakes 17 12 35 29 35 10 5 13 10 14. Landslides 7 6 13 12 8 3 12 17 7 95. Tornado 6 7 3 7 3 4 12 14 4 3
Source: Office of Civil Defense - National Disaster Coordinating Council a/ January - November only

Human Settlements
Compendium of Philippine Environment Statistics 2004 6-5
From 1993 to 2002, flooding was the number one natural disaster that occurred in the country. This was followed by earthquakes, destruc tive typhoons and landslide. In 2002, the total value of damages to property (agriculture, infrastructure and private property) as a result to natural disasters amounted to P1.8 billion. Damages due to floodings/flashfloods reached P912.8 million while damages due to destructive typhoons was estimated at P829.6 million (see Table 6.10h). The occurrence of floodings/flashfloods and landslides is due to the diminishing forest cover of the country.

Human Settlements
Compendium of Philippine Environment Statistics 2004
Statistical Tables

TABLE 6.1. POPULATION GROWTH RATE BY REGION AND PROVINCE, Census Years, 1980 to 2000 (in percent)
Annual Average Growth Rate Annual Average Growth Rate Annual Average Growth Rate Region and Province 1980-1990 1990-1995 1995-2000
Region and Province 1995-2000 1990-1995 1995-2000
Region and Province 1980-1990 1990-1995 1995-2000
NCR 2.98 3.30 1.06 Region IV Southern Tagalog 3.05 3.53 3.72 Region IX Western Mindanao 2.28 2.42 2.18Manila (0.18) 0.62 (0.97) Aurora 2.68 2.55 1.84 Basilan 1.70 4.12 2.58City of Mandaluyong 1.91 2.75 (0.63) Batangas 2.32 2.20 3.02 Zamboanga del Norte 1.42 2.46 1.42Marikina 3.90 2.68 1.96 Cavite 4.10 6.47 5.45 Zamboanga del Sur 2.70 2.28 1.97Pasig City 4.00 3.22 1.50 Laguna 3.48 3.32 4.08 Quezon City 3.66 3.34 1.92 Marinduque 0.66 1.41 1.81 Region X Northern Mindanao San Juan (0.25) (0.40) (1.15) Occidental Mindoro 2.42 3.50 2.48 2.28 2.32 2.19Kalookan City 5.02 5.64 3.06 Oriental Mindoro 2.10 1.91 2.46 Bukidnon 2.94 2.05 2.60Malabon 3.90 4.13 (0.54) Palawan 3.58 3.67 3.60 Camiguin 1.18 1.08 1.88Navotas 4.04 3.82 0.13 Quezon 1.97 2.15 1.90 Misamis Occidental 0.94 1.48 1.27Valenzuela 4.82 4.81 2.27 Rizal 5.81 5.67 5.79 Misamis Oriental 2.29 3.27 2.67Las Pinas 8.08 6.37 2.93 Romblon 1.65 1.36 1.67 City of Makati 1.98 1.25 (1.80) Region XI Southern Mindanao 2.28 2.72 2.6City of Muntinlupa 7.37 7.02 (1.12) Region V Bicol 1.18 1.91 1.68 Davao 3.83 2.28 2.22Paranaque 3.98 4.57 3.03 Albay 1.11 2.01 1.77 Davao del Sur 2.72 2.58 2.47Pasay City 2.50 1.96 (2.97) Camarines Norte 2.41 2.20 0.94 Davao Oriental 1.50 0.87 1.64Pateros 2.47 1.37 0.81 Camarines Sur 1.74 1.75 1.72 South Cotabato 3.37 4.16 2.30Tagig 7.11 6.93 4.45 Catanduanes 0.65 1.50 1.33 Sarangganic 4.98 2.43 Masbate 0.25 1.64 1.71 Compostela Valley c - 2.37CAR 2.28 1.71 1.82 Sorsogon 0.44 2.35 2.04 Abra 1.44 1.11 1.44 Region XII Central Mindanao 2.28 2.83 2.08Benguet 3.19 0.68 1.09 Region VI Western Visayas 1.77 1.30 1.56 Lanao del Norte 2.91 2.44 1.53 2.83 0.29 1.67 Aklan 1.60 1.43 2.05 Cotabato 3.07 2.30 2.29Kalinga 1.36 2.49 2.63 Antique 1.65 1.14 1.89 Cotabato City 2.28 2.74 2.38Mt,.Province 1.24 2.18 1.54 Capiz 1.73 1.26 1.00 Marawi City 2.28 4.18 2.96
Apayao - 2.14 3.25 Iloilo 1.58 1.22 2.10 Sultan Kudarat 3.68 3.44 2.52 Negros Occidental 2.10 1.52 1.08 Region I Ilocos 0.92 1.30 2.15 Guimaras 1.31 0.43 Caragaa/ 2.28 1.82 1.63Ilocos Norte 1.68 0.84 1.37 Agusan del Norte 1.60 2.24 1.42Ilocos Sur 1.60 0.90 1.85 Region VII Central Visayas 1.95 1.65 2.79 Agusan del Sur 1.82 3.85 1.79La Union 1.95 1.61 2.09 Bohol 1.64 0.89 2.92 Surigao del Norte 1.60 0.70 1.84 Pangasinan 2.13 1.42 2.41 Cebu 2.38 1.99 3.07 Surigao del Sur 1.82 0.78 1.35 Negros Oriental 1.22 1.94 2.03 Region II Cagayan Valley 1.31 1.51 2.25 Siquijor 0.50 (0.04) 2.19 ARMMb/ 2.28 1.80 3.86 Batanes 2.20 (1.08) 3.25 Lanao del Sur 4.01 2.24 3.42 Cagayan 1.55 1.43 2.26 Region VIII Eastern Visayas 0.88 1.84 1.51 Maguindanao 3.51 0.92 4.16Isabela 2.18 1.35 2.25 Sulu 2.68 2.50 3.15Nueva Vizcaya 2.22 2.01 1.97 Eastern Samar 0.27 1.80 0.79 Tawi-Tawi 1.6 1.78 5.53Quirino 3.21 2.63 2.71 Leyte 1.32 1.89 1.13 Northern Samar 0.13 3.21 2.11 Philippines Region III Central Luzon 2.58 2.12 3.20 Samar 0.63 1.87 1.82 Bataan 2.79 2.72 2.74 Southern Leyte 0.83 (0.26) 2.73 Source: National Statistics Office. Bulacan 3.22 3.24 4.93 Biliran 2.15 1.28 a/ Created into a region under RA No. 7901 dated Nueva Ecija 2.07 2.61 2.11 February 23, 1995, taken from Region X and Region XI. Pampanga 2.64 1.31 3.13 b/ Created into a region under RA No. 7864 dated Tarlac 2.25 1.80 2.65 November 26, 1989, taken from Region IX and Region XII. Zambales 2.40 0.98 2.32 c/ Created into a province under RA8470 dated March 7, 1998 taken from the province of Davao del Norte

TABLE 6.2. VOLUME OF CRUDE OIL IMPORTATIONS BY COUNTRY OF ORIGIN, 1992 to 2002 (in thousand barrels)
Volume
Country 1992 1993 1994 1995 1996 1997 1998 1999 2000 2001 2002
Middle East 72,891 71,015 78,865 110,760 119,044 120,236 110,281 110,811 107,650 105,008 88,658 Saudi Arabia 43,441 37,641 53,549 80,620 76,797 47,330 40,394 41,553 37,609 35,610 38,235Kuwait 4,997 11,655 3,765 1,034 -- - - - - - - Iran 9,467 7,289 4,904 9,070 16,801 42,504 36,727 35,320 27,391 28,859 19,432Iraq -- -- -- -- -- 774 2,744 1,817 - - - Abu Dhabi -- -- -- -- -- - - - - - - Qatar 2,568 999 -- -- 1,169 3,538 1,986 3,381 3,255 7,466 6,637Dubai -- -- -- -- -- - - - - - - Oman -- -- 2,240 6,303 12,083 14,480 17,991 9,540 6,585 10,472 6,328Neutral Zone -- -- -- -- -- - - - - - - United Arab Emirates 12,418 13,431 14,407 13,733 12,194 11,610 10,440 19,200 32,810 21,853 15,416Yemen 748 2,611
Other Regions 16,119 12,690 9,562 8,324 8,974 8,705 6,315 6,781 5,983 6,447 5,213Indonesia 1,631 2,542 2,742 2,399 1,363 2,452 1,014 420 641 1,456 410Malaysia 9,194 7,138 4,886 2,767 3,476 4,419 4,381 4,274 4,064 2,701 3,968Brunei 4,303 2,251 1,934 759 -- - - - - - 835China (PROC) 760 759 -- -- 3,186 891 - - - - - Mexico -- -- -- -- -- - - - - - - Australia 231 -- -- -- -- - - - 1,278 2,290 - Pakistan -- -- -- -- -- - - - - - - Nigeria -- -- -- 2,399 948 942 920 558 - - - United Kingdom 989 - - - Gabon 540 - - -
Total 89,010 83,705 88,427 119,084 128,018 128,941 116,596 117,592 113,633 111,455 93,871
Source: Department of Energy.

TABLE 6.3. ENERGY CONSUMPTION BY SOURCE, 1992 to 2002 (in million barrels of fuel-oil equivalent, MMBFOE)
Energy Source 1992 1993 1994 1995 1996 1997 1998 1999 2000 2001 2002
Indigenous Energy 38.02 39.28 42.18 41.80 288.59 97.11 97.9 106.26 111.89 113 127.61
I. Conventional 22.69 25.49 28.15 27.32 28.98 27.17 29.25 36.04 36.82 35.87 48.57Oil 0.54 1.19 0.55 0.03 0.454 0.16 0.27 0.34 0.32 0.32 1.27Coal 4.99 5.86 6.59 6.07 5.055 4.05 4.84 3.9 4.4 3.84 3.78Hydro 7.33 8.67 10.11 10.64 12.174 10.46 8.74 13.5 12.33 12.25 12.13Geothermal 9.83 9.77 10.90 10.58 11.297 12.48 15.37 18.3 19.73 18 17.66Gas - - - - - 0.02 0.04 0.03 0.04 1.46 11.2Condensate - - - - - - - - - - 2.53
II. Non-Conventional 15.33 13.79 14.03 14.48 259.606 81.48 68.65 70.22 75.08 77.13 79.04Bagasse 6.08 4.90 5.21 4.05 7.892 9.69 10.17 10.4 10.69 16.34 11.24Agriwaste 8.83 8.42 8.28 10.33 243.38 59.94 58.42 59.7 64.22 60.61 67.6Others 0.42 0.47 0.55 0.10 0.25 0.31 0.06 0.12 0.18 0.18 0.20
Imported Energy 91.66 97.54 104.35 117.73 125.734 144.61 142.33 139.23 137.57 135.45 129.87
Oil 88.97 94.79 102.19 113.98 117.395 132.76 128.93 122.3 113.3 112.56 103.76Coal 2.69 2.75 2.16 3.75 8.339 11.85 13.4 16.94 24.28 22.89 26.11
Source: Department of Energy.
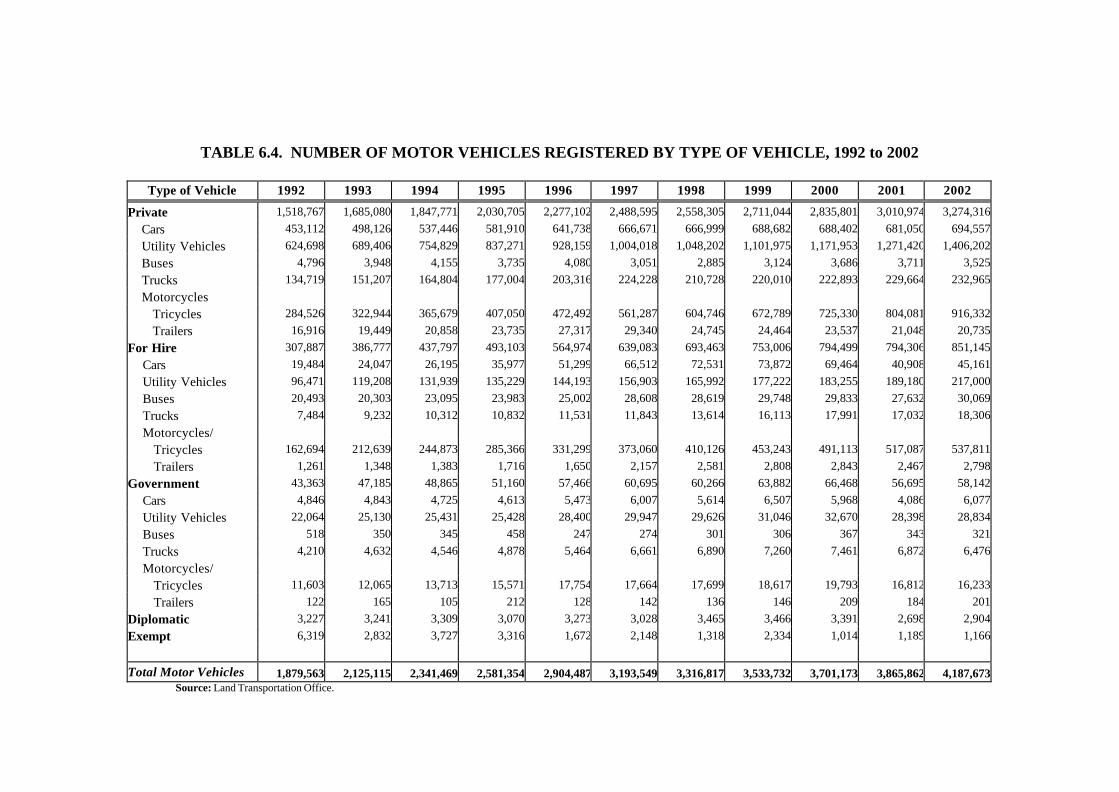
TABLE 6.4. NUMBER OF MOTOR VEHICLES REGISTERED BY TYPE OF VEHICLE, 1992 to 2002
Type of Vehicle 1992 1993 1994 1995 1996 1997 1998 1999 2000 2001 2002
Private 1,518,767 1,685,080 1,847,771 2,030,705 2,277,102 2,488,595 2,558,305 2,711,044 2,835,801 3,010,974 3,274,316Cars 453,112 498,126 537,446 581,910 641,738 666,671 666,999 688,682 688,402 681,050 694,557Utility Vehicles 624,698 689,406 754,829 837,271 928,159 1,004,018 1,048,202 1,101,975 1,171,953 1,271,420 1,406,202Buses 4,796 3,948 4,155 3,735 4,080 3,051 2,885 3,124 3,686 3,711 3,525Trucks 134,719 151,207 164,804 177,004 203,316 224,228 210,728 220,010 222,893 229,664 232,965Motorcycles
Tricycles 284,526 322,944 365,679 407,050 472,492 561,287 604,746 672,789 725,330 804,081 916,332Trailers 16,916 19,449 20,858 23,735 27,317 29,340 24,745 24,464 23,537 21,048 20,735
For Hire 307,887 386,777 437,797 493,103 564,974 639,083 693,463 753,006 794,499 794,306 851,145Cars 19,484 24,047 26,195 35,977 51,299 66,512 72,531 73,872 69,464 40,908 45,161Utility Vehicles 96,471 119,208 131,939 135,229 144,193 156,903 165,992 177,222 183,255 189,180 217,000Buses 20,493 20,303 23,095 23,983 25,002 28,608 28,619 29,748 29,833 27,632 30,069Trucks 7,484 9,232 10,312 10,832 11,531 11,843 13,614 16,113 17,991 17,032 18,306Motorcycles/
Tricycles 162,694 212,639 244,873 285,366 331,299 373,060 410,126 453,243 491,113 517,087 537,811Trailers 1,261 1,348 1,383 1,716 1,650 2,157 2,581 2,808 2,843 2,467 2,798
Government 43,363 47,185 48,865 51,160 57,466 60,695 60,266 63,882 66,468 56,695 58,142Cars 4,846 4,843 4,725 4,613 5,473 6,007 5,614 6,507 5,968 4,086 6,077Utility Vehicles 22,064 25,130 25,431 25,428 28,400 29,947 29,626 31,046 32,670 28,398 28,834Buses 518 350 345 458 247 274 301 306 367 343 321Trucks 4,210 4,632 4,546 4,878 5,464 6,661 6,890 7,260 7,461 6,872 6,476Motorcycles/
Tricycles 11,603 12,065 13,713 15,571 17,754 17,664 17,699 18,617 19,793 16,812 16,233Trailers 122 165 105 212 128 142 136 146 209 184 201
Diplomatic 3,227 3,241 3,309 3,070 3,273 3,028 3,465 3,466 3,391 2,698 2,904Exempt 6,319 2,832 3,727 3,316 1,672 2,148 1,318 2,334 1,014 1,189 1,166 Total Motor Vehicles 1,879,563 2,125,115 2,341,469 2,581,354 2,904,487 3,193,549 3,316,817 3,533,732 3,701,173 3,865,862 4,187,673
Source: Land Transportation Office.

TABLE 6.5. SUMMARY OF STATUS OF PREPARATION OF COMPREHENSIVE LAND USE PLANS OF CITIES/MUNICIPALITIES
by region, as of May 30, 2000
LGUS with Updated CLUPS
LGUS with CLUP's for Updating
LGUs without CLUP's Region No. of Cities/
Municipalities (a) (b) (c)
CAR 77 9 27 41 Region I 125 28 69 28 Region II 93 23 61 9 Region III 122 57 56 9 Region IV 149 77 52 20 ENCR 91 20 43 28 Region V 115 9 71 35 Region VI 133 32 93 8 Region VII 132 29 79 24 Region VIII 143 14 78 51 Region IX 78 29 34 15 Region X 70 34 33 3 Region XI 67 32 32 3 Region XII 55 13 26 16 Caraga 73 31 34 8 ARMM 85 5 32 48
1608 442 820 346 TOTAL
(100%) (27%) (51%) (22%) Note: (a) CLUPs approved in 1995 onward
(b) CLUPs approved in 1994 or earlier (c) Per LOI 729 and RA 7160, i.e., without HLURB or SP approval
Source: HLURB/DILG Regional Offices' Reports
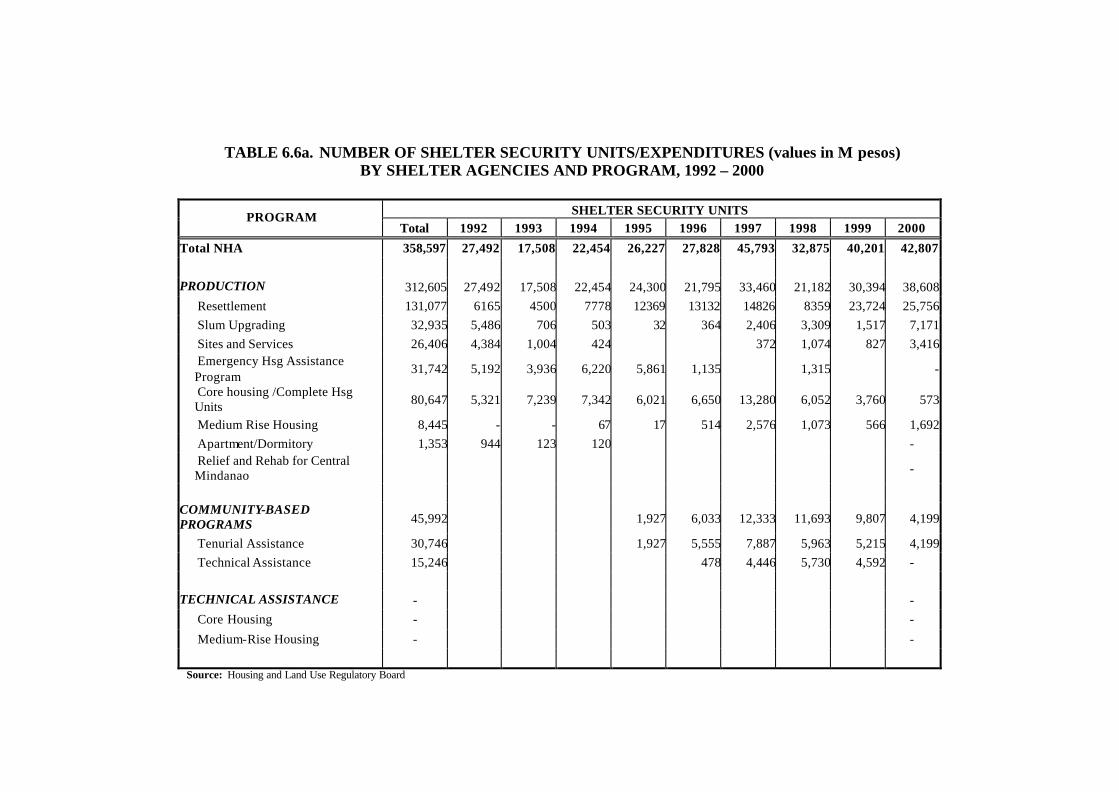
TABLE 6.6a. NUMBER OF SHELTER SECURITY UNITS/EXPENDITURES (values in M pesos) BY SHELTER AGENCIES AND PROGRAM, 1992 – 2000
SHELTER SECURITY UNITS PROGRAM
Total 1992 1993 1994 1995 1996 1997 1998 1999 2000
Total NHA 358,597 27,492 17,508 22,454 26,227 27,828 45,793 32,875 40,201 42,807 PRODUCTION 312,605 27,492 17,508 22,454 24,300 21,795 33,460 21,182 30,394 38,608
Resettlement 131,077 6165 4500 7778 12369 13132 14826 8359 23,724 25,756 Slum Upgrading 32,935 5,486 706 503 32 364 2,406 3,309 1,517 7,171 Sites and Services 26,406 4,384 1,004 424 372 1,074 827 3,416 Emergency Hsg Assistance Program
31,742 5,192 3,936 6,220 5,861 1,135 1,315 -
Core housing /Complete Hsg Units 80,647 5,321 7,239 7,342 6,021 6,650 13,280 6,052 3,760 573
Medium Rise Housing 8,445 - - 67 17 514 2,576 1,073 566 1,692 Apartment/Dormitory 1,353 944 123 120 - Relief and Rehab for Central Mindanao -
COMMUNITY-BASED PROGRAMS 45,992 1,927 6,033 12,333 11,693 9,807 4,199
Tenurial Assistance 30,746 1,927 5,555 7,887 5,963 5,215 4,199 Technical Assistance 15,246 478 4,446 5,730 4,592 -
TECHNICAL ASSISTANCE - -
Core Housing - -
Medium-Rise Housing - -
Source: Housing and Land Use Regulatory Board

TABLE 6.6a. (continued)…
SHELTERSECURITY UNITS
PROGRAM Total 1992 1993 1994 1995 1996 1997 1998 1999 2000
Total HGC 444,011 13,967 19,766 36,174 59,651 71,898 84,134 48,962 11,000 75,282 Guaranty Programs 402,358 9,575 16,577 30,362 57,228 68,012 78,810 39,443 10,640 75,282 Retail 158,865 6,675 7,182 15,433 21,230 23,924 30,528 31,275 9,802 4,651 Developmental 116,132 2,900 9,395 12,805 26,456 20,354 26,131 7,706 838 1,283 Securitization 127,361 2124 9,542 23,734 22,151 462 69,348 Apartment Construction 359 530 276 112 Speical Projects (Managed Relocation projects and MRBs) 17,309 201 1,032 4,298 469 1,266 4,057 5,400 360 0
Self-Aided Housing 24,344 4,191 2,157 1,514 1,954 2,620 1,267 4,119 0 0
Cooperative Housing 1,821 381 358 21 234 262 165 220 CMP 22,523 3,810 1,799 1493 1,720 2,358 1,102 3,899
Total HDMF 404,859 14,222 26,310 27,170 38,182 69,265 88,148 52,670 33,273 23,944 Mortgage Financing 338,161 10,784 20,262 17,597 26,475 58,784 77,741 49,905 32,114 23,485
Pag-IBIG I 10,830 21,972 50,018 45,458 30,504 22,674 Pag-IBIG II 184 114 64 38 14 1 Pag-IBIG Overseas 309 516 1,155 1,601 960 702 GLAD 3,398 1,266 3,399 365 590 108 UHLP 11,754 34,916 23,105 2,443 46 0
EHLP Source: Housing and Land Use Regulatory Board
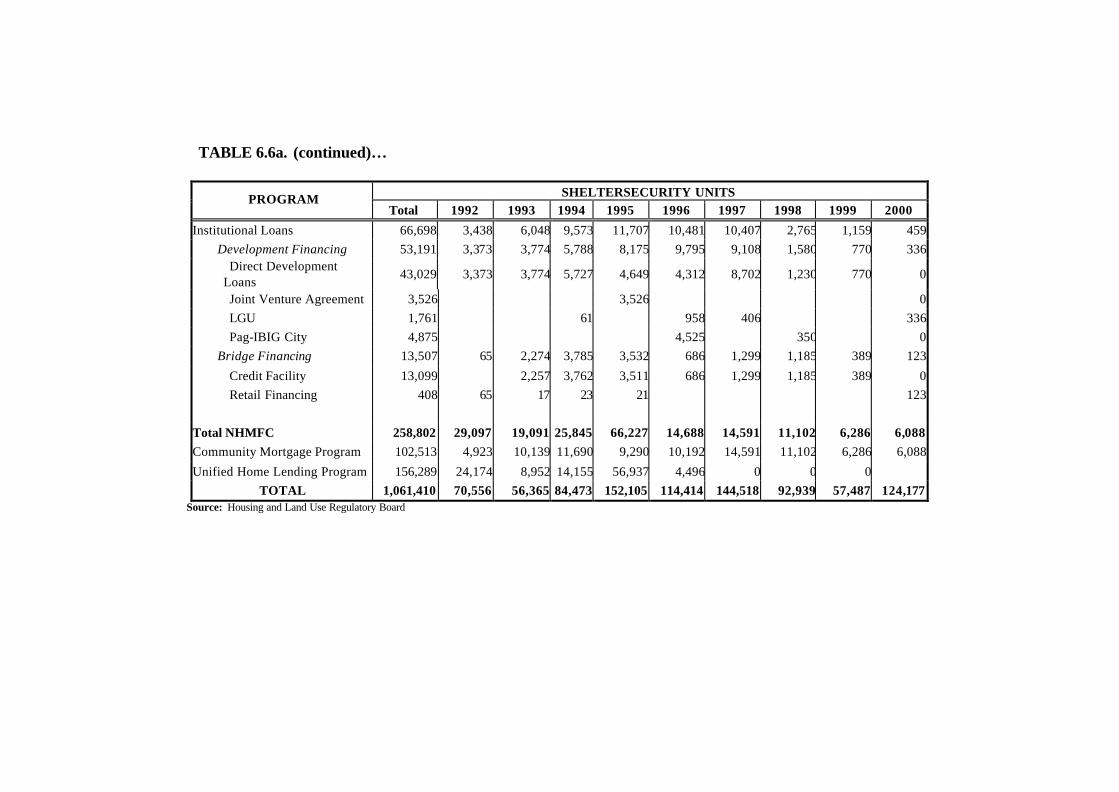
TABLE 6.6a. (continued)… SHELTERSECURITY UNITS PROGRAM
Total 1992 1993 1994 1995 1996 1997 1998 1999 2000
Institutional Loans 66,698 3,438 6,048 9,573 11,707 10,481 10,407 2,765 1,159 459 Development Financing 53,191 3,373 3,774 5,788 8,175 9,795 9,108 1,580 770 336
Direct Development Loans
43,029 3,373 3,774 5,727 4,649 4,312 8,702 1,230 770 0
Joint Venture Agreement 3,526 3,526 0 LGU 1,761 61 958 406 336 Pag-IBIG City 4,875 4,525 350 0
Bridge Financing 13,507 65 2,274 3,785 3,532 686 1,299 1,185 389 123
Credit Facility 13,099 2,257 3,762 3,511 686 1,299 1,185 389 0 Retail Financing 408 65 17 23 21 123
Total NHMFC 258,802 29,097 19,091 25,845 66,227 14,688 14,591 11,102 6,286 6,088 Community Mortgage Program 102,513 4,923 10,139 11,690 9,290 10,192 14,591 11,102 6,286 6,088
Unified Home Lending Program 156,289 24,174 8,952 14,155 56,937 4,496 0 0 0 TOTAL 1,061,410 70,556 56,365 84,473 152,105 114,414 144,518 92,939 57,487 124,177
Source: Housing and Land Use Regulatory Board

TABLE 6.6b. NUMBER OF SHELTER SECURITY UNITS/EXPENDITURES (values in M pesos) BY SHELTER AGENCIES AND PROGRAM, 1990 – 2000
VALUES IN MILLION PESOS
PROGRAM Total 1990 1991 1992 1993 1994 1995 1996 1997 1998 1999 2000
Total NHA 13,591.24 867.41 788.97 352.76 311.41 790.65 564.32 1,194.50 1,973.42 2,277.35 2,173.04 2,297.41 PRODUCTION 13,107.485 867.41 788.97 352.76 311.41 790.65 564.32 1,194.5 1,951.2 2,177.08 1,883.51 2,225.675
Resettlement 8,234.977 133.18 415.52 210.01 91.75 494.02 430.84 1,011.96 639.71 1,610.41 1,504.66 1,692.917
Slum Upgrading 557.2 317.59 51.47 32.69 4.53 12.73 31.79 26.57 7.23 11.3 8.37 52.93
Sites and Services 1,492.734 416.64 77.47 32.65 3.49 53.2 33.21 14.72 440.1 111.69 108.77 200.794
Emergency Hsg Assistance Program 353.65 174.42 141.65 35.58 2
Core housing /Complete Hsg Units 735.519 92.6 59.31 31.07 77.15 5.12 48.67 392.97 22.91 4.18 1.539
Medium Rise Housing 1,714.56 151.91 18.1 5.9 27.78 92.58 471.19 420.77 257.53 268.8
Apartment/Dormitory 12.15 6.15 6
Relief and Rehab for Central Mindanao 6.695 6.695
COMMUNITY-BASED PROGRAMS 4,83.751 22.22 100.27 289.53 71.731
Tenurial Assistance 474.391 12.86 100.27 289.53 71.731
Technical Assistance 9.36 9.36
TECHNICAL ASSISTANCE
Core Housing 0
Medium-Rise Housing 0
Total HGC 87,775.55 1,937 1,899 2,943 3,930.11 6,563.6 9,609.65 16,039.06 14,347.31 12,117.26 9,900.67 8,488.89
Guaranty Programs 8,5076.38 1,852 1,773 2,722 3,726.09 6,228.61 9,433.53 15,777.79 13,957.31 11,269.49 9,847.67 8,488.89
Retail 61,071.74 1,664 1,542 2,634 3,482.74 5,321 5,971 10,869.26 9,937 9,384.28 7,148.47 3,117.99
Developmental 5,855.21 188 231 88 223.3 473.61 527.53 1,991.31 1,361.31 529.55 98.2 143.4
Securitization 18149.43 20.05 434 2935 2,917.22 2659 1,355.66 2,601 5,227.5
Apartment Construction 36 48 62.72 35.01 27.46
Source: Housing and Land Use Regulatory Board

TABLE 6.6b. (continued)…
VALUES IN MILLION PESOS PROGRAM
Total 1990 1991 1992 1993 1994 1995 1996 1997 1998 1999 2000 Special Projects (Managed Relocation projects and MRBs)
1,699.26 52 48 109.19 278.24 41 132 317 668.83 53
Self-Aided Housing 999.91 85 74 173 94.83 56.75 135.12 129.27 73 178.94 0 0
Cooperative Housing 270.93 2 25 74 53.66 3.73 35 50.21 16 11.33 0
CMP 728.98 83 49 99 41.17 53.02 100.12 79.06 57 167.61 0
Mortgage Financing 67,161.514 979.068 1,235.457 1,449.897 1,797.426 3,528.103 7,732.577 12,330.335 15,874.059 10,906.787 7,005.023 4,322.782
Pag-IBIG I 1,789.422 4241.429 10,324.841 9,785.421 6,641.698 4,120.719
Pag-IBIG II 76.709 46.814 23.595 14.794 5.137
Pag-IBIG Overseas 81.609 137.627 333.101 525.502 295.039 196.844
GLAD 251.837 80.767 178.934 24.793 52.198 5.219
UHLP 5533 7,823.698 5,013.588 556.277 10.951
EHLP
Institutional Loans 4,936.069 113.95 467.42 158.02 541.99 844.33 1,332.668 705.065 451.999 192.986 110.774 16.867
Development Financing 2,865.632 113.95 461.12 147.53 151.05 232 706.078 572.371 336.138 107.735 37.66 0
Direct Development Loans 1,828.763 113.95 461.12 147.53 151.05 219.91 186.3 161.105 313.638 36.5 37.66
Joint Venture Agreement 519.778 519.778
LGU 79.124 12.09 44.534 22.5
Pag-IBIG City 437.967 366.732 71.235
Bridege Financing 2,070.437 0 6.3 10.49 390.94 612.33 626.59 132.694 115.861 85.251 73.114 16.867
Credit Facility 2,028.967 379.73 608.76 616.69 132.694 115.861 85.251 73.114 16.867
RetailFinancing 41.47 6.3 10.49 11.21 3.57 9.9
Community Mortgage Program 2896.91 235.7 121 126.82 241.23 283.33 283.01 311.99 495.32 397.31 201.91 199.29
Unified Home Lending Program 42,491.78 2974.34 4367.75 4834.33 8785.61 9096.54 11518.2 915.05
TOTAL 146,755 6,014 7,177 8,257 13,268 16,734 21,975 18,461 16,816 14,792 12,276 10,986 Source: Housing and Land Use Regulatory Board
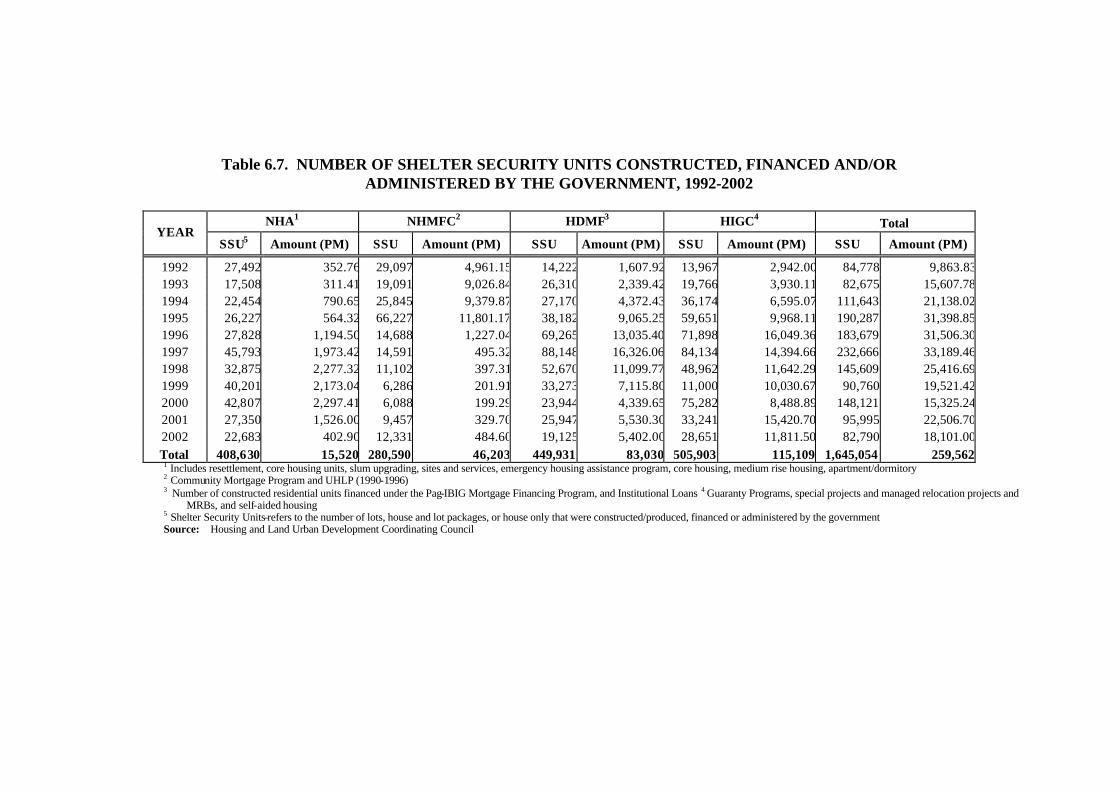
Table 6.7. NUMBER OF SHELTER SECURITY UNITS CONSTRUCTED, FINANCED AND/OR
ADMINISTERED BY THE GOVERNMENT, 1992-2002
NHA1 NHMFC2 HDMF3 HIGC4 Total YEAR
SSU5 Amount (PM) SSU Amount (PM) SSU Amount (PM) SSU Amount (PM) SSU Amount (PM)
1992 27,492 352.76 29,097 4,961.15 14,222 1,607.92 13,967 2,942.00 84,778 9,863.831993 17,508 311.41 19,091 9,026.84 26,310 2,339.42 19,766 3,930.11 82,675 15,607.781994 22,454 790.65 25,845 9,379.87 27,170 4,372.43 36,174 6,595.07 111,643 21,138.021995 26,227 564.32 66,227 11,801.17 38,182 9,065.25 59,651 9,968.11 190,287 31,398.851996 27,828 1,194.50 14,688 1,227.04 69,265 13,035.40 71,898 16,049.36 183,679 31,506.301997 45,793 1,973.42 14,591 495.32 88,148 16,326.06 84,134 14,394.66 232,666 33,189.461998 32,875 2,277.32 11,102 397.31 52,670 11,099.77 48,962 11,642.29 145,609 25,416.691999 40,201 2,173.04 6,286 201.91 33,273 7,115.80 11,000 10,030.67 90,760 19,521.422000 42,807 2,297.41 6,088 199.29 23,944 4,339.65 75,282 8,488.89 148,121 15,325.242001 27,350 1,526.00 9,457 329.70 25,947 5,530.30 33,241 15,420.70 95,995 22,506.702002 22,683 402.90 12,331 484.60 19,125 5,402.00 28,651 11,811.50 82,790 18,101.00Total 408,630 15,520 280,590 46,203 449,931 83,030 505,903 115,109 1,645,054 259,562
1 Includes resettlement, core housing units, slum upgrading, sites and services, emergency housing assistance program, core housing, medium rise housing, apartment/dormitory 2 Community Mortgage Program and UHLP (1990-1996) 3 Number of constructed residential units financed under the Pag-IBIG Mortgage Financing Program, and Institutional Loans 4 Guaranty Programs, special projects and managed relocation projects and
MRBs, and self-aided housing 5 Shelter Security Units-refers to the number of lots, house and lot packages, or house only that were constructed/produced, financed or administered by the government Source: Housing and Land Urban Development Coordinating Council

TABLE 6.8. SUBDIVISIONS/PROJECTS INVESTIGATED FOR VIOLATIONS, 1994 - 2002
Performance Indicators 1994 1995 1996 1997 1998 1999 2000 2001 2002
1. No. of field and non-field 10,564 14,025 14,576 15,848 17205 15323 17,926 15,508 16,027
investigations conducted 2. No. of violations found 3,914 6,109 4,864 4,654 8593 6873 8,744 9,515 9,415 3. No. of violations corrected 2,622 2,598 2,469 1,986 - - - 13,479** 7,871
** Includes previous violations found but were corrected/addressed only during the period source : Housing and Land Use Regulatory Board

TABLE 6.9. DISASTER OCCURRENCES, 1993 to 2002
Year
Kind of Disaster 1993 1994 1995 1996 a/ 1997 1998 1999 2000 2001 2002
Natural Disasters 1. Typhoon 13 13 9 10 6 4 6 10 17 172. Floodings 26 32 34 21 28 10 38 45 27 193. Earthquakes 17 12 35 29 35 10 5 13 10 14. Landslides 7 6 13 12 8 3 12 17 7 95. Tornado 6 7 3 7 3 4 12 14 4 36. Red Tide 6 8 5 5 5 1 - - 7. Locust/Rat Infestation 3 2 2 b/ b/ - 17 - 8 Pest Infestation 4 - 19 Drought 4 1 - 510 Heavy Rains 1 5 - 211 Big Waves 1 3 1 212 Whirlwind 213 River Swelling 4 214 Lightning 1 - 115 Mayon Volcano Eruption(phreatic) 1 1 1 a/ January - November only b/ No disaster incident occurred Source: Office of Civil Defense - National Disaster Coordinating Council.
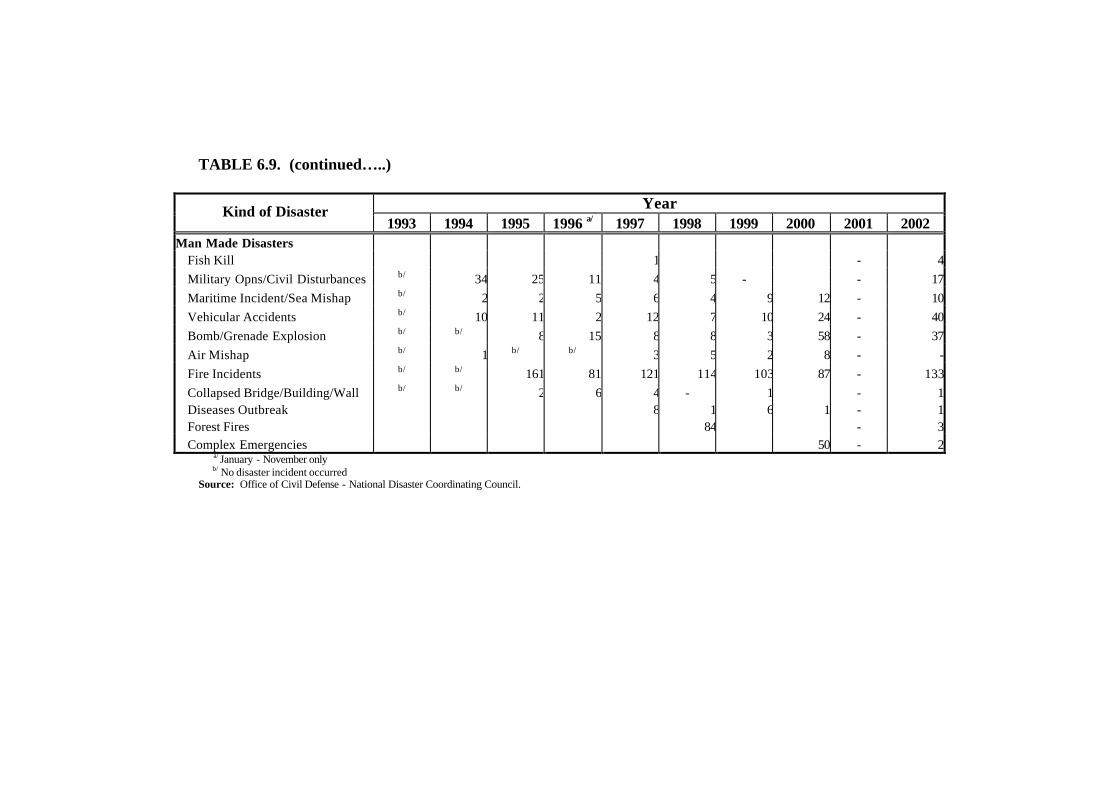
TABLE 6.9. (continued…..)
Year Kind of Disaster 1993 1994 1995 1996 a/ 1997 1998 1999 2000 2001 2002
Man Made Disasters Fish Kill 1 - 4Military Opns/Civil Disturbances b/ 34 25 11 4 5 - - 17Maritime Incident/Sea Mishap b/ 2 2 5 6 4 9 12 - 10Vehicular Accidents b/ 10 11 2 12 7 10 24 - 40Bomb/Grenade Explosion b/ b/ 8 15 8 8 3 58 - 37Air Mishap b/ 1 b/ b/ 3 5 2 8 - -Fire Incidents b/ b/ 161 81 121 114 103 87 - 133Collapsed Bridge/Building/Wall b/ b/ 2 6 4 - 1 - 1Diseases Outbreak 8 1 6 1 - 1Forest Fires 84 - 3Complex Emergencies 50 - 2
a/ January - November only b/ No disaster incident occurred Source: Office of Civil Defense - National Disaster Coordinating Council.

TABLE 6.10a. NATURAL DISASTER INCIDENTS, 1995
Casualties Affected Houses Damaged POP Served Assistance (P M) Cost of Damage (P M) Disaster Occurrences
Dead Injured Missing Families Persons Totally Partially Families Persons Relief Rehab Donation Agric. Infra Prvt Prop
1. Mt. Parker 1 34 - 23 12,381 60,853 410 287 9,199 48,237 4.012 67.000 5.168 659.500 59.000 -
2. Floodings 34 86 2 9 133,530 736,900 941 1,834 12,845 64,662 5.648 - - 356.558 229.316 0.338
3. Red Tide 5 - - - 11,980 56,237 - - - - - - - - - -
4. Locust Infestation 2 - - - - - - - - - - - - - - -
5. Landslide 13 20 5 3 522 2,191 15 - - - - - - - 0.092 -
6. Drought 4 - - - 66,665 332,953 - - - - - - - 562.464 - -
7. Tornado 3 - - - 145 734 5 - - - - - - - 0.175 -
8. F& M Disease 1 - - - - - - - - - - - - - - -
9. Earthquakes 35 - - 8 67 398 - - - - - - - - 26.500 -
10. Lahar Flows
Effects are incorporated with typhoons "Karing,
"Helming", "Naning" & "Rosing"
Total 98 140 7 43 225,290 1,190,266 1,371 2,121 22,044 112,899 9.660 67.000 5.168 1,578.522 315.083 0.338 Source: Office of Civil Defense, Department of National Defense.

TABLE 6.10b. NATURAL DISASTER INCIDENTS, 1996
Casualties Affected Houses Damaged Cost of Damage (P M) Disaster Occurrences
Dead Injured Missing Families Persons Totally Partially Agric Infrastructure Private Property
Total
Typhoons 10 124 90 50 260,581 1,255,289 2,690 17,559 1,854.205 962.612 17.378 2,834.195 Flooding 31 20 2 6 25,671 147,987 215 1,272 139.242 87.405 26.100 252.747 Landslides 12 13 8 20 71 330 49 56 0.200 0.118 0.845 1.163 Tornado 7 1 29 66 314 41 29 0.060 0.217 0.605 0.882 Earthquakes 29 6 3 15 0.470 0.375 0.845 Red Tide 5 6 96 0.000 North Easterly 1 402 2,412 0.000
Wind Flow Whirlwind 2 7 149 734 17 21 0.091 0.352 0.443 Total 97 170 232 76 286,943 1,407,081 3,012 18,937 1,994.268 1,050.727 45.280 3,090.275
Source: Office of Civil Defense, Department of National Defense

TABLE 6.10c. NATURAL DISASTER INCIDENTS, 1997
Casualties Affected Houses Damaged Cost of Damage (P M)
Disaster Occurrences Dead InjuredMissingFamiliesPersons Totally Partially Agric Infrastructure Private
Property Total
Flooding 28 46 4 0 75,882 370,934 590 630 848.779 257 2.480 1,107.940 Landslides 8 13 4 0 0 0 17 9 0 0.092 0 0.092 Tornado 3 0 0 0 145 734 5 0 0 0 0 0.175 Earthquakes 35 0 0 8 67 398 0 0 0 0 0 26.500 Red Tide 5 0 0 0 11,980 56,237 0 0 0 0 0 - Drought 4 0 0 0 66,665 332,953 0 0 0 0 0.000 562.464 Total 83 59 8 8 154,739 761,256 612 639 848.779 256.773 2.480 1,697.171
Source: Office of Civil Defense, Department of National Defense

TABLE 6.10d. NATURAL DISASTER INCIDENTS, 1998
Casualties Affected Houses Damaged Cost of Damage (P M)
Disaster Occurrences Dead Injured Missing Families Persons Totally Partially Agric. Infrastructure Private
Property Total
Destructive Typhoons 4 490 865 104 1,585,699 6,995,940 137,020 406,347 10.714 4.903 1.4 17,017 Floodings 10 59,663 286,828 140 59 0.055 0.005 0.060 Landslides 3 6 1 1 0 Tornado 4 2 98 582 154 11 0 Earthquakes 10 8 15 0.013 0.01 0.023 Drought 1 105,095 630,570 8 7.762 Heavy Rains 1 2 2 0.105 0.105 Red Tide 1 1 24 122 0.000 Total 34 499 874 105 1,750,579 7,914,042 137,316 406,434 18.636 4.921 1.410 24.967
Source: Office of Civil Defense, Department of National Defense

TABLE 6.10e. NATURAL DISASTER INCIDENTS, 1999
Areas Affected Affected Casualties Disaster No. of
Occurrence Prov Mun City Barangay Families Persons Dead Injured Missing Flooding/Flashfloods 38 31 284 12,387 672,638 3,376,121 282 69 32 Landslides 12 6 14 1 34 1,107 4,822 42 7 2 Heavy Downpour/Monsoon 5 3 87 1 694 3,127 16,672 Typhoons 6 31 189 6 959 319,831 1,455,511 64 74 14 Big waves 1 Earthquakes 5 3 3 3 87 356 5 40 Tornado 12 14 36 5 221 477 1,715 12 Lightning 1 2 2 6 Diseases Outbreak 6 3 3 3 163 10 287 Rat and Locust Infestations 17 1 17 271 27,793 Mayon Volcano Phreatic 1 1 3 1 9 1,097 5,986 Explosion
Source: Office of Civil Defense, Department of National Defense

TABLE 6.10f. NATURAL DISASTER INCIDENTS, 2000
Casualties Affected Damaged Houses Damage to Prop
Disaster No. of Occurrence Dead Injured Missing Families Persons Totally Partially (in Million Pesos)
Typhoons 10 345 386 106 1,450,773 7,284,946 24,295 196,465 7,469.411 Flooding/Flashfloods 45 49 27 13 168,678 766,306 587 1,755 1,673.066 Volcanic Eruption 1 14,114 68,426 89.864 Landslides 17 247 51 16 3,850 19,019 109 3 Tornado 14 74 1,341 5,605 131 196 16.701 Big waves 3 4,239 17,945 Whirlwind 1 Earthquakes 13 34 2,026 9,992 214 404 47.790
Total 104 641 576 135 1,645,021 8,172,239 25,336 198,823 9,296.832Source: Office of Civil Defense, Department of National Defense

TABLE 6.10g. NATURAL DISASTER INCIDENTS, 2001
Casualties Affected Damaged Houses Damage to Prop (in Million Pesos) Disaster No. of
Occurrence Dead Injured Missing Families Persons Totally Partially Agri Infra Pvt Prop. Total
Destructive Typhoons 5 431 418 134 756,938 3,629,295 14,899 54,422 2,963.998 3,562.330 397.204 6,923.532
Non-Destructive TCs 12 Flooding/Flashfloods 27 60 12 24 129,732 576,532 1,226 3,446 1,206.441 240.000 1,446.441 Volcanic Eruption 1 0 0 0 11,259 57,545 0 0 48.820 0.00 0.00 48.820 Landslides 7 8 17 1 113 588 13 1 0.00 0.00 0.00 Tornado 4 3 9 1 568 3,390 156 96 0.00 0.00 0.00 Big waves 1 9 16 68 340 5 21 0.00 0.00 0.00 River Swelling 4 0 0 0 440 1,831 89 276 0.00 0.00 0.00 Earthquakes 10 25 156 40 0.025 0.025
Total 71 511 472 160 899,143 4,269,677 16,393 58,302 4,219.259 3802.355 397.204 8,418.818 Source: Office of Civil Defense, Department of National Defense

TABLE 6.10h. NATURAL DISASTER INCIDENTS, 2002
Casualties Affected Damaged Houses Damage to Prop (in Million Pesos)Disaster No. of
Occurrence Dead Injured Missing Families Persons Totally Partially Agri Infra Pvt Prop. Total
Typhoons 7 169 71 33 538,600 3,546,469 1,176 4,157 480.504 339.305 9.7410 829.550
Non-Destructive TCs 10 Flooding/Flashfloods 19 27 26 10 265,841 1,245,602 1,009 5,094 527.151 317.067 68.620 912.838Volcanic Eruption Landslides 9 17 14 1 3 18 3 Tornado 3 6 23 0 166 830 3 22 3.292 Big waves 2 13 65 12 Whirlwind 2 34 170 0.052 0.052Earthquakes 1 8 39 0 8,619 40,073 113 647 0.335 10.989 7.314 18.638Drought 5 1,296 6,480 95.005 95.005Heavy Rains 2 2 1,017 5,395 14 3.340 0.015 3.355River Swelling 2 16 80 Blk Bug Infestation 1 2.100 2.1Lightning Incident 1 6 9
Total 64 233 184 44 815,605 4,845,182 2,327 9,920 1,108.435 670.361 89.034 1,861.538 Source: Office of Civil Defense, Department of National Defense
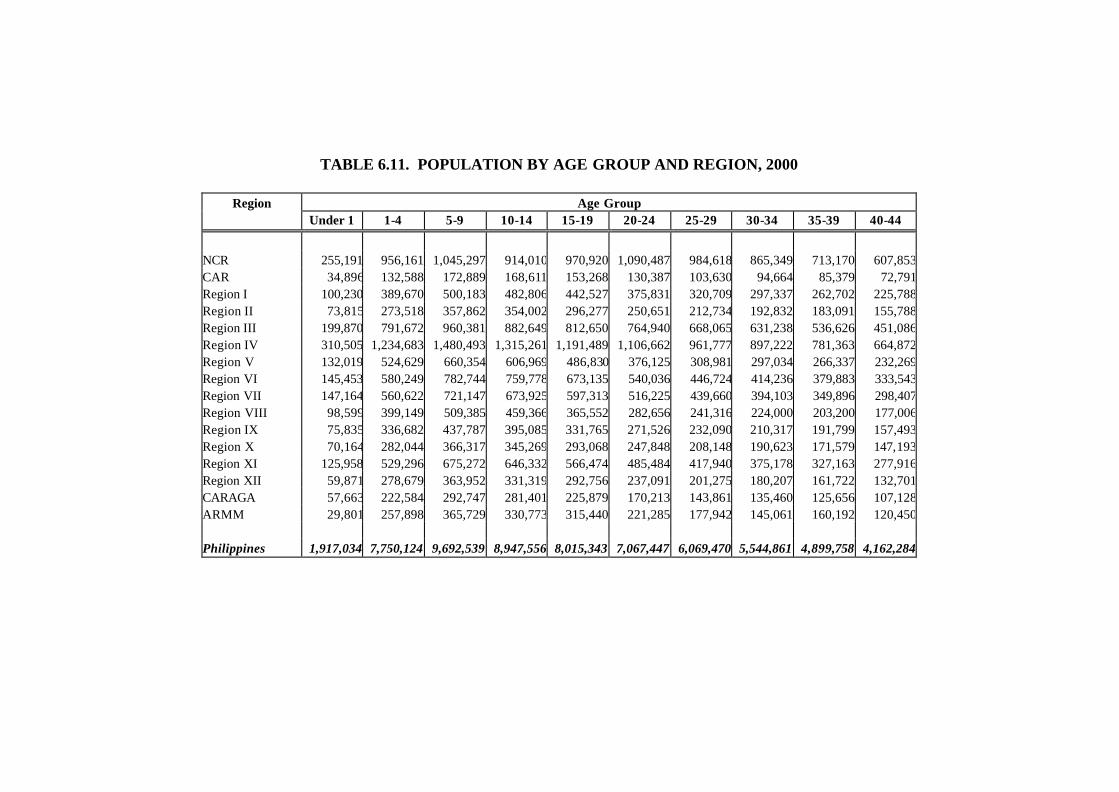
TABLE 6.11. POPULATION BY AGE GROUP AND REGION, 2000
Region Age Group Under 1 1-4 5-9 10-14 15-19 20-24 25-29 30-34 35-39 40-44
NCR 255,191 956,161 1,045,297 914,010 970,920 1,090,487 984,618 865,349 713,170 607,853 CAR 34,896 132,588 172,889 168,611 153,268 130,387 103,630 94,664 85,379 72,791 Region I 100,230 389,670 500,183 482,806 442,527 375,831 320,709 297,337 262,702 225,788 Region II 73,815 273,518 357,862 354,002 296,277 250,651 212,734 192,832 183,091 155,788 Region III 199,870 791,672 960,381 882,649 812,650 764,940 668,065 631,238 536,626 451,086 Region IV 310,505 1,234,683 1,480,493 1,315,261 1,191,489 1,106,662 961,777 897,222 781,363 664,872 Region V 132,019 524,629 660,354 606,969 486,830 376,125 308,981 297,034 266,337 232,269Region VI 145,453 580,249 782,744 759,778 673,135 540,036 446,724 414,236 379,883 333,543Region VII 147,164 560,622 721,147 673,925 597,313 516,225 439,660 394,103 349,896 298,407Region VIII 98,599 399,149 509,385 459,366 365,552 282,656 241,316 224,000 203,200 177,006Region IX 75,835 336,682 437,787 395,085 331,765 271,526 232,090 210,317 191,799 157,493 Region X 70,164 282,044 366,317 345,269 293,068 247,848 208,148 190,623 171,579 147,193 Region XI 125,958 529,296 675,272 646,332 566,474 485,484 417,940 375,178 327,163 277,916 Region XII 59,871 278,679 363,952 331,319 292,756 237,091 201,275 180,207 161,722 132,701 CARAGA 57,663 222,584 292,747 281,401 225,879 170,213 143,861 135,460 125,656 107,128 ARMM 29,801 257,898 365,729 330,773 315,440 221,285 177,942 145,061 160,192 120,450 Philippines 1,917,034 7,750,124 9,692,539 8,947,556 8,015,343 7,067,447 6,069,470 5,544,861 4,899,758 4,162,284

TABLE 6.11. (continued)…..
Age Group Region
45-49 50-54 55-59 60-64 65-69 70-74 75-79 80 up Total
NCR 474,156 367,402 219,070 182,938 118,975 78,102 45,707 43,154 9,932,560 CAR 55,492 42,274 31,802 30,174 21,831 15,357 9,793 9,586 1,365,412Region I 185,194 160,192 119,512 104,434 77,584 59,216 45,712 50,851 4,200,478Region II 122,795 92,913 67,226 63,400 44,511 30,635 20,842 20,267 2,813,159Region III 357,695 295,164 196,576 168,226 119,557 83,528 55,731 55,291 8,030,945Region IV 521,589 401,687 277,557 233,423 163,804 111,443 70,812 69,013 11,793,655Region V 191,499 161,159 128,933 108,721 78,394 59,045 34,926 32,445 4,686,669Region VI 278,504 220,755 182,246 162,501 116,129 82,471 56,751 55,900 6,211,038Region VII 245,671 195,133 157,896 138,859 101,940 74,395 47,865 46,732 5,706,953Region VIII 145,924 126,150 107,605 93,206 68,577 50,793 31,110 26,761 3,610,355Region IX 126,467 95,096 71,942 60,002 40,313 27,783 14,832 14,394 3,091,208Region X 116,825 87,610 65,624 58,306 39,727 26,876 16,032 14,332 2,747,585Region XI 220,420 163,877 118,492 99,098 65,347 44,589 26,334 24,165 5,189,335Region XII 105,462 77,457 55,293 46,737 30,454 20,543 11,492 11,199 2,598,210CARAGA 85,434 67,450 55,608 47,771 31,769 21,397 12,521 10,825 2,095,367ARMM 95,926 67,208 47,864 35,049 19,757 11,698 4,831 5,255 2,412,159 Philippines 3,329,053 2,621,527 1,903,246 1,632,845 1,138,669 797,871 505,291 490,170 76,485,088
Source: National Statistics Office
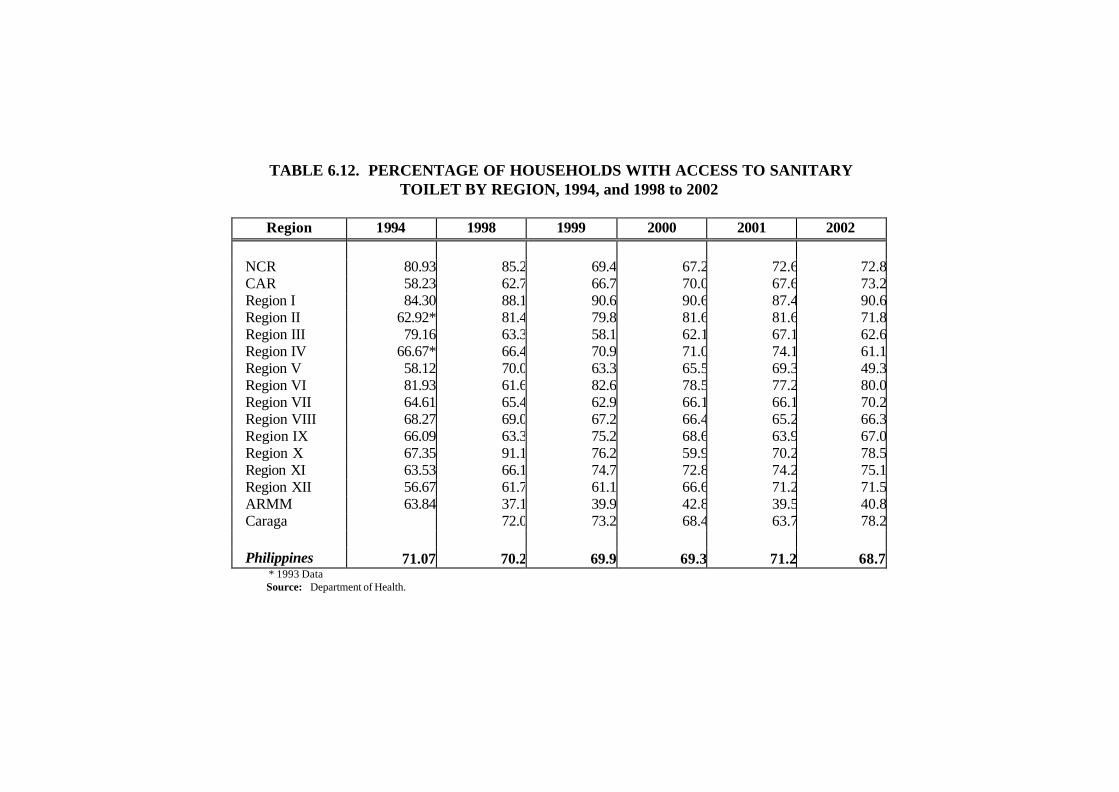
TABLE 6.12. PERCENTAGE OF HOUSEHOLDS WITH ACCESS TO SANITARY
TOILET BY REGION, 1994, and 1998 to 2002
Region 1994 1998 1999 2000 2001 2002
NCR 80.93 85.2 69.4 67.2 72.6 72.8CAR 58.23 62.7 66.7 70.0 67.6 73.2Region I 84.30 88.1 90.6 90.6 87.4 90.6Region II 62.92* 81.4 79.8 81.6 81.6 71.8Region III 79.16 63.3 58.1 62.1 67.1 62.6Region IV 66.67* 66.4 70.9 71.0 74.1 61.1Region V 58.12 70.0 63.3 65.5 69.3 49.3Region VI 81.93 61.6 82.6 78.5 77.2 80.0Region VII 64.61 65.4 62.9 66.1 66.1 70.2Region VIII 68.27 69.0 67.2 66.4 65.2 66.3Region IX 66.09 63.3 75.2 68.6 63.9 67.0Region X 67.35 91.1 76.2 59.9 70.2 78.5Region XI 63.53 66.1 74.7 72.8 74.2 75.1Region XII 56.67 61.7 61.1 66.6 71.2 71.5ARMM 63.84 37.1 39.9 42.8 39.5 40.8Caraga 72.0 73.2 68.4 63.7 78.2 Philippines 71.07 70.2 69.9 69.3 71.2 68.7
* 1993 Data Source: Department of Health.

TABLE 6.13. PERCENTAGE OF HOUSEHOLDS WITH ACCESS TO SAFE WATER SUPPLY BY REGION 1998 to 2002
1998 1999 2000 2001 2002
Region Number of Household
Household with Access to Safe Drinking Water Supply
Percent Number of Household
Household with Access to Safe Drinking Water
Supply
Percent Number of Household
Household with Access to Safe Drinking Water Supply
Percent Number of Household
Household with Access to Safe Drinking Water Supply
Percent Number of Household
Household with Access to Safe Drinking Water
Supply
Percent
NCR 1,814,383 1,624,413 89.5 1,874,865 1,396,280 74.5 1,964,408 1,403,245 71.4 2,002,619 1,584,463 79.1 2,122,274 1,754,279 82.7
CAR 246,916 211,656 85.7 254,276 227,192 89.3 261,275 237,748 91 267,051 238,999 89.5 268,811 252,158 93.8
Region I 669,849 557,415 83.2 654,608 511,389 78.1 659,919 524,427 79.5 778,740 778,740 100 751,481 687,434 91.5
Region II 516,509 371,874 72.0 539,972 377,721 70.0 538,427 408,669 75.9 558,375 448,615 80.3 673,152 450,535 66.9
Region III 1,005,231 699,423 69.6 1,379,497 938,265 68.0 1,481,033 1,018,911 68.8 1,510,987 1,075,597 71.2 1,498,928 1,081,665 72.2
Region IV 1,914,880 1,336,787 69.8 2,076,550 1,541,693 74.2 2,161,159 1,635,664 75.7 2,148,346 1,704,021 79.3 2,703,746 2,388,540 88.3
Region V 659,076 567,066 86.0 812,974 628,551 77.3 821,554 617,254 75.1 816,078 658,266 80.7 851,280 694,917 81.6
Region VI 1,097,313 991,475 90.4 1,165,939 998,591 85.6 1,198,738 1,034,797 86.3 1,225,884 1,069,089 87.2 1,259,159 1,115,813 88.6
Region VII 903,889 757,458 83.8 953,969 728,806 76.4 980,523 798,974 81.5 1,079,237 864,406 80.1 1,089,587 948,367 87
Region VIII 591,478 490,566 82.9 643,690 490,924 76.3 685,808 523,445 76.3 705,570 535,412 75.9 713,251 629,304 88.2
Region IX 502,044 339,683 67.7 510,602 389,885 76.4 535,908 395,102 73.7 567,560 405,624 71.5 536,484 392,994 73.3
Region X 366,612 379,429 103.5 454,183 371,567 81.8 488,192 441,149 90.4 489,912 418,497 85.4 530,545 502,235 94.7
Region XI 921,484 715,528 77.6 885,296 634,764 71.7 977,110 732,862 75 994,408 803,281 80.8 727,268 611,238 84
Region XII 442,032 324,762 73.5 462,573 328,530 71.0 423,406 332,341 78.5 410,196 239,869 58.5 460,597 356,120 77.3
ARMM 369,668 264,778 73.5 360,267 280,601 78.6 361,706 222,731 61.6 377,464 204,766 54.2 375,115 255,629 68.1
Caraga 360,416 206,340 55.8 357,188 215,475 59.8 384,101 290,592 75.7 415,791 293,593 70.6 381,945 311,377 81.5
Philippines 12,381,780 9,838,653 79.5 13,386,449 10,060,234 75.213,923,267 10,617,911 76.3 14,348,218 11,323,238 78.9 14,943,623 12,432,605 83.2Source: Modified Field Health Service Information System (MFHSIS), Health Intelligence Service (HIS), Department of Health

TABLE 6.14. NATIONAL ROADS BY SURFACE TYPE 1992 to 1996 and 2000 to 2002 (in kilometers)
Year Surface Type 1992 1993 1994 1995 1996 1997 1998 1999 2000 2001 2002
- Earth 216 216 214 129 353 381 380 - 610 674 736Gravel 12,709 12,719 12,623 12,623 11,862 11,675 11,486 - 11,875 11,060 10,335Asphalt 6,379 6,388 6,375 6,395 6,806 6,894 6,735 - 6,636 6,815 7,048Concrete 7,250 7,270 7,447 7,574 8,349 8,800 9,294 - 10,611 11,329 11,911 All Types 26,554 26,594 26,659 26,720 27,369 27,750 27,895 - 29,733 29,878 30,030
Source: Department of Public Works and Highways
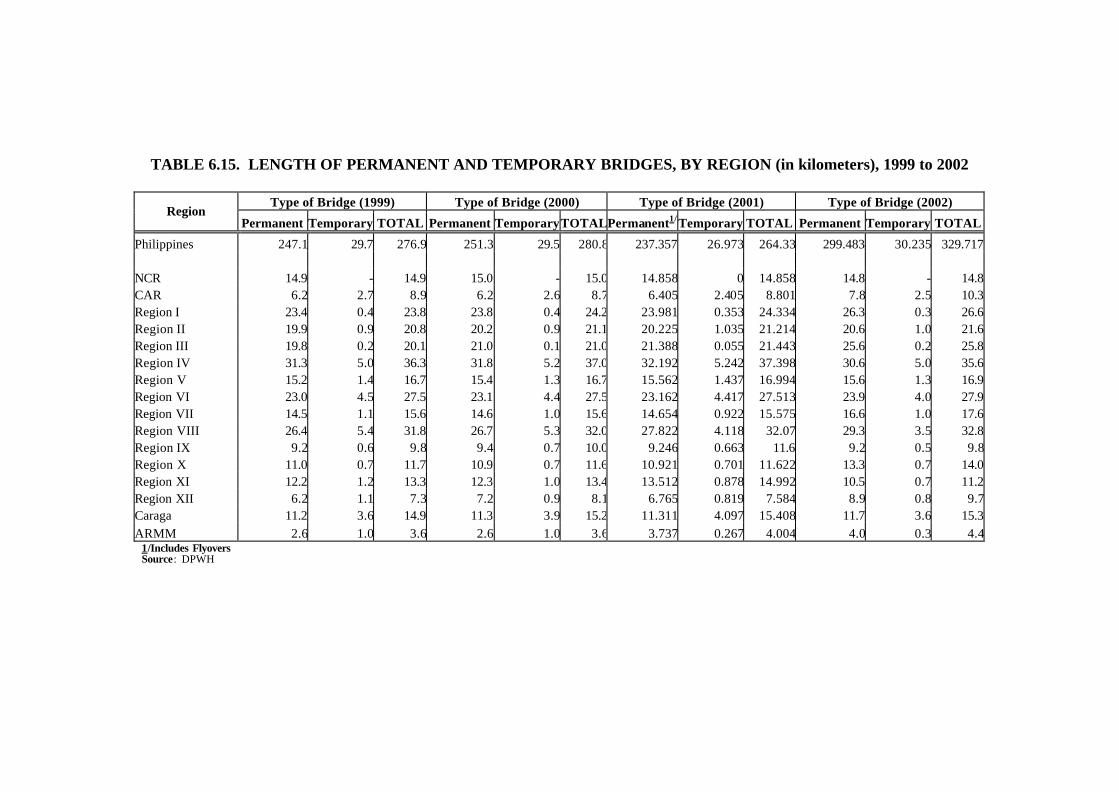
TABLE 6.15. LENGTH OF PERMANENT AND TEMPORARY BRIDGES, BY REGION (in kilometers), 1999 to 2002
Type of Bridge (1999) Type of Bridge (2000) Type of Bridge (2001) Type of Bridge (2002)
Region Permanent Temporary TOTAL Permanent Temporary TOTALPermanent1/ Temporary TOTAL Permanent Temporary TOTAL
Philippines 247.1 29.7 276.9 251.3 29.5 280.8 237.357 26.973 264.33 299.483 30.235 329.717 NCR 14.9 - 14.9 15.0 - 15.0 14.858 0 14.858 14.8 - 14.8CAR 6.2 2.7 8.9 6.2 2.6 8.7 6.405 2.405 8.801 7.8 2.5 10.3Region I 23.4 0.4 23.8 23.8 0.4 24.2 23.981 0.353 24.334 26.3 0.3 26.6Region II 19.9 0.9 20.8 20.2 0.9 21.1 20.225 1.035 21.214 20.6 1.0 21.6Region III 19.8 0.2 20.1 21.0 0.1 21.0 21.388 0.055 21.443 25.6 0.2 25.8Region IV 31.3 5.0 36.3 31.8 5.2 37.0 32.192 5.242 37.398 30.6 5.0 35.6Region V 15.2 1.4 16.7 15.4 1.3 16.7 15.562 1.437 16.994 15.6 1.3 16.9Region VI 23.0 4.5 27.5 23.1 4.4 27.5 23.162 4.417 27.513 23.9 4.0 27.9Region VII 14.5 1.1 15.6 14.6 1.0 15.6 14.654 0.922 15.575 16.6 1.0 17.6Region VIII 26.4 5.4 31.8 26.7 5.3 32.0 27.822 4.118 32.07 29.3 3.5 32.8Region IX 9.2 0.6 9.8 9.4 0.7 10.0 9.246 0.663 11.6 9.2 0.5 9.8Region X 11.0 0.7 11.7 10.9 0.7 11.6 10.921 0.701 11.622 13.3 0.7 14.0Region XI 12.2 1.2 13.3 12.3 1.0 13.4 13.512 0.878 14.992 10.5 0.7 11.2Region XII 6.2 1.1 7.3 7.2 0.9 8.1 6.765 0.819 7.584 8.9 0.8 9.7Caraga 11.2 3.6 14.9 11.3 3.9 15.2 11.311 4.097 15.408 11.7 3.6 15.3ARMM 2.6 1.0 3.6 2.6 1.0 3.6 3.737 0.267 4.004 4.0 0.3 4.4
1/Includes Flyovers Source: DPWH

TABLE 6.16a. LIST OF DISASTER PRONE AREAS BY TYPE OF DISASTER
(as of December 2000)
Region Province Region Province
DROUGHT EARTHQUAKE 2 Cagayan NCR Isabela CAR Benguet, Baguio City Nueva Vizcaya 1 Ilocos Norte, Ilocos Sur Quirino Pangasinan, La Union 3 Bataan 2 Batanes, Cagayan Bulacan 3 Zambales, Bulacan Nueva Ecija Bataan, Nueva Ecija Pampanga 4 Marinduque ,Mindoro Tarlac 5 Albay, Catanduanes Zambales
6 Antique 6 Antique, Iloilo Capiz West Panay Iloilo Negros Occidental Negros Occidental Negros Oriental 7 Cebu, Bohol 9 Zamboanga del Norte 8 Eastern Samar, Leyte Zamboanga del Sur Northern Samar
10 Bukidnon 9 Zamboanga del Norte and Sur
Misamis Oriental 10 Bikidnon 11 Davao del Sur 12 South Cotabato Davao Oriental ARMM Maguindanao
12 Maguindanao Sultan Kudarat North Cotabato CARAGA Surigao del Norte
ARMM Maguindanao Surigao del Sur Source: OCD, NDCC, DND

TABLE 6.16. (Continued)…..
Region Province Region Province
FLOOD NCR Navotas, Malabon 7 Cebu, Siquijor
Valenzuela City Negros Occidental Pateros, Taguig , Sn Juan 8 Leyte Las Piñas City Southern Leyte Parañaque City Northen Samar Marikina City Western Samar Quezon City, Manila Eastern Samar Mandaluyong City Samar, Biliran Muntinlupa City 9 Basilan
Pasig City, Makati City Zamboanga del Sur Caloocan City Zamboanga del Norte
1 Pangasinan, La Union 10 Bukidnon, Camiguin Ilocos Norte and Sur Misamis Orienta;l
2 Isabela, Nueva Vizcaya Misamis Occidental 3 Pampanga, Zambales 11 Davao del Norte Bataan, Aurora Davao del Sur Bulacan, Nueva Ecija Davao Oriental
4 Cavite, Quezon 12 South Cotabato Romblon, Laguna North Cotabato Rizal, Batangas General Santos City Occ. and Or. Mindoro CARAGA Agusan del Norte Palawan, Marinduque Agusan del Sur
5 Albay, Camarines Sur CAR Abra, kalinga 6 Antique, Capiz Ifugao Iloilo, Aklan, Guimaras Benguet and Baguio City Negros Occidental
Source: OCD, NDCC, DND

TABLE 6.16a. (Continued)…..
Region Province Region Province Region Province
TYPHOON VOLCANIC ERUPTION HAZARD PRONE AREAS
Metro Manila Region 3 Zambales 1 Ilocos Norte 7 Cebu, Bohol Pinatubo Pampanga Ilocos Sur Negros Oriental Tarlac Pangasinan, La Union 8 Biliran, Eastern Samar Region 4 Batangas
2 Batanes, Cagayan Southern Leyte Taal Isabela, Quirino Western Samar Region 5 Albay Nueva Vizcaya 10 Misamis Oriental Mayon
3 Pampanga, Zambales CARAGA Agusan del Norte Region 6 Negros Occidental Bataan, Tarlac Agusan del Sur Kanlaon Bulacan, Nueva Ecija Surigao del Norte
4 Cavite, Quezon CAR Benguet Batangas, Marinduque Kalinga
5 Albay Apayao Camarines Norte Mt. Province Camarines Sur Abra Catanduanes Ifugao Masbate, Sorsogon
6 Antique, Capiz Negros Occidental Iloilo, Aklan
Source: OCD, NDCC, DND

TABLE 6.16b. LIST OF DISASTER PRONE AREAS BY TYPE OF DISASTER (as of December 2002)
Type of Disaster Region Province Type of Disaster Region Province
DROUGHT 2 Cagayan EARTHQUAKE 2 Batanes Isabela Cagayan Nueva Vizcaya 3 Bataan Quirino Bulacan 3 Bataan Zambales Bulacan Nueva Ecija Nueva Ecija 4 Mindoro Pampanga Marinduque Tarlac 5 Albay Zambales Catanduanes 6 Antique 6 Antique Negros Occidental West Panay Iloilo Negros Occidental Capiz Iloilo 9 Zamboanga del Norte and Sur 7 Cebu 10 Bukidnon Bohol Misamis Occidental Negros Oriental 11 Davao Oriental 8 Eastern and Northern Samar Davao del Sur Leyte 12 South Cotabato 9 Zamboanga Provinces North Cotabato 10 Bukidnon ARMM Maguindanao 12 South Cotabato EARTHQUAKE NCR ARMM Maguindanao 1 Ilocos Provinces Sultan Kudarat Pangasinan Surigao Provinces La Union CAR Benguet Baguio City

TABLE 6.16b. (Continued)…..
Region Province Region Province Region Province
FLOOD Aurora 9 Basilan NCR Navotas Bulacan Zamboanga Norte and Sur
Marikina City Nueva Ecija 10 Bukidnon Malabon 4 Cavite Camiguin Quezon City Quezon Misamis Provinces Valenzuela City Romblon 11 Davao Provinces City of Manila Laguna 12 North and South Cotabato Pateros Rizal General Santos City Mandaluyong City Batangas ARMM Sultan Kudarat Taguig Mindoro Provinces Lanao del Norte Pasig City Palawan Maguindanao San Juan Marinduque CARAGA Agusan Provinces Makati City 5 Albay Surigao Provinces Las Pinas Camarines Sur CAR Abra Muntinlupa City 6 Antique Kalinga Parañaque City Aklan Ifugao Caloocan City Capiz Benguet
1 Pangasinan Guimaras Baguio City La Union Iloilo Ilocos Provinces Negros Occidental
2 Isabela 7 Cebu Nueva Vizcaya Negros Oriental
3 Pampanga Siquijor Zambales 8 Leyte Tarlac Southern Leyte Bataan Samar Provinces Biliran

TABLE 6.16b. (Continued)…..
Region Province Region Province
TYPHOON 1 Ilocos Provinces 6 Antique Pangasinan Negros Occidental La Union Iloilo
2 Batanes Aklan Cagayan Capiz Isabela 7 Cebu Nueva Vizcaya Bohol Quirino Negros Oriental
3 Bataan 8 Biliran Bulacan Eastern Samar Nueva Ecija Southern Leyte Pampanga Western Samar Tarlac 10 Misamis Oriental Zambales CARAGA Agusan Provinces
4 Quezon Surigao del Norte Cavite CAR Benguet Batangas Kalinga Marinduque Apayao
5 Albay Mt. Province Camarines Provinces Abra Catanduanes Ifugao Masbate Sorsogon
Source: OCD, NDCC, DND

TABLE 6.17. INFANT MORTALITY RATE BY REGION, 1990 to 1995; 1998 (per 1000 live births)
Region 1990 1991 1992 1993 1994 1995 1998
NCR 46 43 40 38 35 32 24 CAR 63 61 60 58 57 55 43 Region I 56 54 52 50 48 46 42 Region II 62 60 58 57 55 54 37 Region III 45 44 43 42 41 40 29 Region IV 53 52 50 48 47 45 35 Region V 64 63 62 60 59 58 31 Region VI 61 60 59 57 56 55 26 Region VII 55 54 52 50 49 47 24 Region VIII 76 74 72 69 67 64 61 Region IX 64 63 62 61 60 59 45 Region X 57 57 56 55 54 54 41 Region XI 56 55 54 53 53 52 41 Region XII 57 56 55 55 54 54 48 ARMM 74 72 70 68 66 63 55 Caraga - - - - - - 53
Philippines 57 55 54 52 50 49 36
Note "-" data not available Source: For 1990 - 1995 data, NSCB Technical Working Group on Maternal and Child Mortality.
For 1998 data, National Demographic and Health survey, NSO
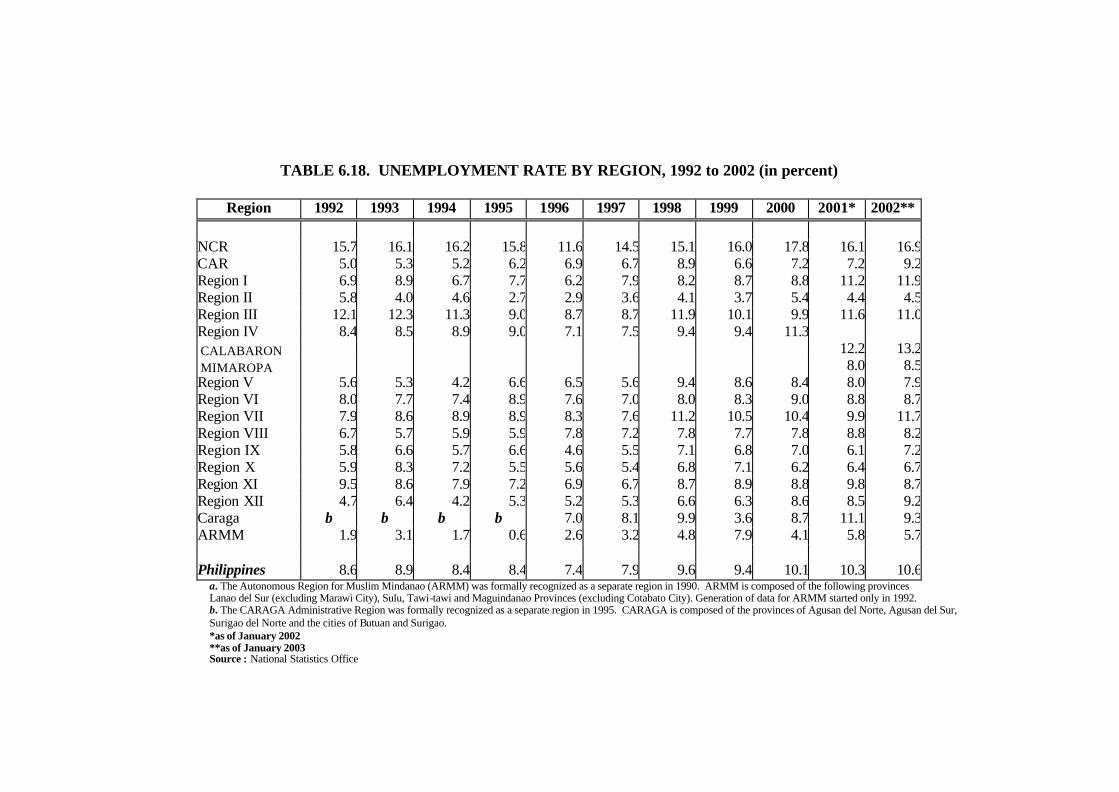
TABLE 6.18. UNEMPLOYMENT RATE BY REGION, 1992 to 2002 (in percent)
Region 1992 1993 1994 1995 1996 1997 1998 1999 2000 2001* 2002**
NCR 15.7 16.1 16.2 15.8 11.6 14.5 15.1 16.0 17.8 16.1 16.9 CAR 5.0 5.3 5.2 6.2 6.9 6.7 8.9 6.6 7.2 7.2 9.2 Region I 6.9 8.9 6.7 7.7 6.2 7.9 8.2 8.7 8.8 11.2 11.9 Region II 5.8 4.0 4.6 2.7 2.9 3.6 4.1 3.7 5.4 4.4 4.5 Region III 12.1 12.3 11.3 9.0 8.7 8.7 11.9 10.1 9.9 11.6 11.0 Region IV 8.4 8.5 8.9 9.0 7.1 7.5 9.4 9.4 11.3 CALABARON 12.2 13.2 MIMAROPA 8.0 8.5 Region V 5.6 5.3 4.2 6.6 6.5 5.6 9.4 8.6 8.4 8.0 7.9 Region VI 8.0 7.7 7.4 8.9 7.6 7.0 8.0 8.3 9.0 8.8 8.7 Region VII 7.9 8.6 8.9 8.9 8.3 7.6 11.2 10.5 10.4 9.9 11.7 Region VIII 6.7 5.7 5.9 5.9 7.8 7.2 7.8 7.7 7.8 8.8 8.2 Region IX 5.8 6.6 5.7 6.6 4.6 5.5 7.1 6.8 7.0 6.1 7.2 Region X 5.9 8.3 7.2 5.5 5.6 5.4 6.8 7.1 6.2 6.4 6.7 Region XI 9.5 8.6 7.9 7.2 6.9 6.7 8.7 8.9 8.8 9.8 8.7 Region XII 4.7 6.4 4.2 5.3 5.2 5.3 6.6 6.3 8.6 8.5 9.2 Caraga b b b b 7.0 8.1 9.9 3.6 8.7 11.1 9.3 ARMM 1.9 3.1 1.7 0.6 2.6 3.2 4.8 7.9 4.1 5.8 5.7 Philippines 8.6 8.9 8.4 8.4 7.4 7.9 9.6 9.4 10.1 10.3 10.6
a. The Autonomous Region for Muslim Mindanao (ARMM) was formally recognized as a separate region in 1990. ARMM is composed of the following provinces Lanao del Sur (excluding Marawi City), Sulu, Tawi-tawi and Maguindanao Provinces (excluding Cotabato City). Generation of data for ARMM started only in 1992. b. The CARAGA Administrative Region was formally recognized as a separate region in 1995. CARAGA is composed of the provinces of Agusan del Norte, Agusan del Sur, Surigao del Norte and the cities of Butuan and Surigao. *as of January 2002 **as of January 2003 Source : National Statistics Office

Glossary of Terms
Compendium of Philippine Environment Statistics 2004
GLOSSARY OF TERMS
Glossary of Terms
Compendium of Philippine Environment Statistics 2004 Appendix A-1
GLOSSARY OF TERMS Agricultural Land – lands including arable land, land under permanent crops and
land under permanent meadows and pastures. (BSWM) Agricultural Pollution – liquid and solid wastes from all types of farming activities,
including run-off from pesticide and fertilizer use, and from feedlots; erosion and dust from plowing animal manure and carcasses; and crop residues and debris. (UN Glossary of Environment Statistics)
Agricultural Waste – waste produced as a result of various agricultural operations. It
includes manure and other wastes from farms, poultry houses and slaughterhouses; harvest waste; fertilizer run-off from fields; pesticides that enter into water, air or soils; and silt drained from fields. (UN Glossary of Environment Statistics)
Agroforestry - land management which combines agricultural crops with tree crops
and forest plants and/or animals simultaneously or sequentially and applies management practices which are compatible with the cultural patterns of the local population.
Air Contaminant - see air pollutants Air Pollutants – substances in the air that could, at high enough concentrations, harm
human beings, animals, vegetation or material. Air pollutants may thus include forms of matter of almost any natural or artificial composition capable of being airborne. They may consist of solid particles, liquid droplets or of being airborne. They may consist of solid particles, liquid droplets or gases, or combinations of these forms. (UN Glossary of Environment Statistics)
Air Pollution - the presence of contaminant or pollutant substances in the air that do
not disperse properly and that interferes with human health or welfare, or produce other harmful environmental effects. (UN Glossary of Environment Statistics)
Air Pollution Control - steps taken to maintain a standard of purity of air for good
public health; for protection of plant and animal life, and property; for visibility; and for safe ground and air transportation. (UN Glossary of Environment Statistics)
Air Pollution Index - quantitative measure that describes ambient air quality. The
index is obtained by combining figures for various air pollutants into a single measurement. (UN Glossary of Environment Statistics)
Air Pollution Sources - activities that result in air pollution including agricultural
activities, combustion processes, dust producing processes, manufacturing activities, nuclear energy-related activities, spray-painting, printing, dry-cleaning and so on. (UN Glossary of Environment Statistics)
Glossary of Terms
Compendium of Philippine Environment Statistics 2004 Appendix A-2
Air Quality Criteria - levels of, and length of exposure to pollution resulting in adverse effects on human health and well being. (UN Glossary of Environment Statistics)
Air Quality Index - see air pollution index. Air Quality Standards - levels of air pollutants prescribed by regulations that may
not be exceeded during a specified time in a defined area. (UN Glossary of Environment Statistics)
Airborne Disease - disease that is generally transmitted by nasopharyngeal
discharges and by respiratory secretions, through coughing and sneezing, though it may also be conveyed through close contact. Respiratory diseases include the common childhood infections, measles, whooping cough, chickenpox, mumps, diphtheria and acute sore throat, as well as diseases of the respiratory tract, influenza and other acute viral infections, pneumonia, and pulmonary tuberculosis (WHO, 1992)
Alienable or Disposable Lands - refer to those lands of the public domain, which
have been the subject of the present system of classification and declared as not needed for forest purposes (PD 1559).
Allowable Cut - the volume of wood or quantity of forest products that is authorized
to be cut from a forest under a particular license during a given year. Almaciga Resin - sap exuded by almaciga trees (Agathis philippinensis) of the family
Araucariaceae. Also known commercially as Manila Copal. Alternative Fuels – any fuel used for vehicular sources other than standard gasoline
or diesel fuels. Alternative fuels include ethanol, methanol, compressed natural gas, liquefied petroleum gas and electricity. (EMB)
Ambient – surrounding environmental. (UN Glossary of Environment Statistics) Ambient Air – any portion of the troposphere that is not confined by a structure, i.e.,
outside air. (EMB) Ambient Air Quality Standard – concentrations of pollutants established by the
government, which are set to protect public health and welfare. (EMB) Ambient Concentration – measure of environmental quality indicating the amount
of pollutants found per unit volume in different environmental media. (UN Glossary of Environment Statistics)
Amphibia – a class of vertebrates which include toads, frogs, caecilians and
salamanders. They are characterized by having smooth, moist and scaleless skin that usually breathes by gills in young and by lungs in adults. (PAWB)
Animal Importation –the act of bringing into the country animals from another
country. (PAWB)

Glossary of Terms
Compendium of Philippine Environment Statistics 2004 Appendix A-3
Animal Population – see Inventory of Animals. Annual Average Daily Traffic – the volume of vehicular traffic for a particular road
section for one day computed as an average in a year cycle; the total yearly traffic volume divided by the number of days in the year. (DPWH and NEDA Glossary of Terms, 1985)
Annual Depletion Rate – average rate over a period of year at which withdrawals
deplete the storage in a groundwater reservoir. (UN Glossary of Environment Statistics)
Annual Log Requirement – the volume of log input needed to sustain the operation
of a sawmill at full or attainable capacity for a period of one year. Aquaculture – rearing or raising under controlled conditions of aquatic products such
as fish, oysters, seaweeds and other aquatic resources in sea, lakes, rivers and swamps and other bodies of water. Examples are fishpond, fishpen, and seaweed cultures. (IAC-Agriculture, Fishery and Forestry Statistics)
Aquatic Pollution – the introduction by human or machine, directly or indirectly, of
substances or energy to the aquatic environment which results or is likely to result in such deleterious effects as to harm living and non- living aquatic resources, hazard to human health, hindrance to aquatic activities such as fishing and navigation, including dumping/disposal of waste and other marine liters, discharge of petroleum or residual products of petroleum or carbonaceous materials/substances, and other radioactive, noxious or harmful liquid, gaseous or solid substances, from any water land or air transport or other human-made structure, deforestation, unsound agricultural practices such as the use of banned chemicals and excessive use of chemicals, intensive use of artificial fish feed, and wetland conversion, which cause similar hazards and deleterious effects shall also constitute aquatic pollution. (TWG-Fishery Statistics)
Aquifer – underground geologic formation, or group of formations, containing
groundwater that can supply wells and springs. (UN Glossary of Environment Statistics)
Area Source – source of non-natural air pollution released over a relatively small
area that cannot be classified as a point source. Such sources may include vehicles and other small fuel combustion engines. (UN Glossary of Environment Statistics)
Artesian Well – well tapping a confined or artesian aquifer in which the static water
level stands above the water table. (UN Glossary of Environment Statistics) Artificial Reefs – any structure of natural or man-made materials placed on a body of
water to serve as shelter and habitat, source of food, breeding areas for fishery species and shoreline protection. (TWG-Fishery Statistics)

Glossary of Terms
Compendium of Philippine Environment Statistics 2004 Appendix A-4
Artificial Water Impoundment – body of water impounded by a dam, used for the supply of drinking water, electricity generation, irrigation or animal husbandry. Watercourses serving as part of a reservoir system are included. (UN Glossary of Environment Statistics)
Asbestos – mineral fiber that can pollute air or water and cause cancer or asbestosis
when inhaled. (UN Glossary of Environment Statistics) Atmosphere – mass of air surrounding the earth, composed largely of oxygen and
nitrogen. (UN Glossary of Environment Statistics) Automobile Air Pollution – emissions form cars and other vehicular traffic
consisting chiefly of carbon monoxide, nitrogen oxide, unburned gasoline, carbon dioxide and lead. (UN Glossary of Environment Statistics)
Average Annual Population Growth Rate – measure of the annual growth rate of
the population stock caused by births and deaths and international migration using the censal years as reference period.
Average Annual Rainfall – specified for a place; it is the mean of the annual
amounts over the period for which rainfall statistics are available. (UN Glossary of Environment Statistics)
Aves – a class of vertebrate whose members are characterized by having feathers as a
body covering, forelimbs modified into wings and unique respiratory system. (PAWB)
Bacterial Count – public hygiene coefficient for water that defines the permissible
number of bacteria in a given volume of water according to the use of that water. (UN Glossary of Environment Statistics)
Bacterial Purity – term referring to the maximum number of permissible Escherichia
coli or other coliform bacteria in drinking water. (UN Glossary of Environment Statistics)
Bag Net – a box–like net operated from outriggers or booms of a boat with the aid of
light, effecting the capture of fish by its dipping and lifting motion. The net stimulates an inverted mosquito net under the boat during the operation. (BAS)
Barangay Health Station – the primary health care facility at the barangay level
where basic health services are delivered. (1998 Compendium of Health Statistics in the Philippines)
Beach Seine/Drag Seine – a drag net consisting of a bag or bunt and two long wings
flanked on both sides. Attached to the upper rim of the net is a headrope provided with wooden floats and to the lower rim is a ground rope provided with claystone or lead sinkers. The float and sinker lines are extended to the wing bridles to which are attached wooden brails. Pull ropes are tied to the brails and used to draw the net to the breach. (BAS)
Glossary of Terms
Compendium of Philippine Environment Statistics 2004 Appendix A-5
Biochemical Oxygen Demand (BOD) – dissolved oxygen required by organisms for the aerobic decomposition of organic matter present in water. (UN Glossary of Environment Statistics)
Biological Diversity – the variability among living organisms from all sources
including terrestrial, marine and other aquatic ecosystem and the ecological complexes of which they are part; this includes diversity within species, between species and of ecosystems. (PAWB)
Birds – group of animals representing class Aves. (PAWB) Boat, Fishing – a type of watercraft, such as banca, sailboat, motorboat, etc., either
licensed or not, used for fishing purposes. Boat used for the purpose of transporting fish in the course of fishing shall also be considered a fishing boat. (IAC-Agriculture, Fishery and Forestry Statistics)
Boats, Carrier – boat/vessel that carries or buys fish from the fishing ground and
brings them to the landing center. (BAS) Boats, Commercial – fishing boats more than three (3) gross tons. (BAS) Boats, Mother/Catcher – boat/vessel that catches fish from the fishing ground.
(BAS) Boats, Municipal – fishing boats that are three (3) gross tons or less. (BAS) Brackish Water – a mixture of seawater and fresh water, the salinity of which varies
with the tidal movements. Examples are mouth of rivers and swamps, where salt water enters. (IAC-Agriculture, Fishery and Forestry Statistics)
Brackish Water – water containing salts at a concentration significantly lower than
that of seawater. The concentration of total dissolved salts is usually in the range of 1,000-10,000 milligrams per liter (mg/l). (UN Glossary of Environment Statistics)
Bred-in-captivity – refers to offspring, including eggs, born or otherwise produced in
a controlled environment. (PAWB) Bridge – a structure across a waterway or other opening serving as a pathway and/or
roadway with a minimum clear span of six (6) meters. (NEDA Glossary of Terms, 1985)
Brushland – degraded or untimbered areas dominated by a discontinuous cover of
shrubby vegetation. Built-Up and Related Land – land under houses, roads, mines, quarries or any other
facilities including their auxiliary spaces, deliberately installed so that human activities may be pursued. Included also are certain types of open land (non-built-up land) that are closely connected with these activities, such as waste, derelict land in built-up areas, junkyards, city parks and gardens. Land
Glossary of Terms
Compendium of Philippine Environment Statistics 2004 Appendix A-6
occupied by scattered farm buildings, yards and their annexes are excluded. (HLURB)
Carabao – Philippine water buffalo or swamp buffalo, characterized by its heavy
built, low and wide body, raised primarily for work. (TWG-Livestock and Poultry Statistics)
Carbon Dioxide – colorless, odorless and non-poisonous gas that results from fossil
fuel combustion and is normally a part of ambient air. It is also produced in the respiration of living organisms (Plants and animals), and considered to be the main greenhouse gas, contributing to climate change. (UN Glossary of Environment Statistics)
Carbon Monoxide – colorless, odorless and poisonous gas produced by incomplete
fossil fuel combustion. Carbon monoxide combines with the hemoglobin of human beings, reducing its oxygen carrying capacity, with effects harmful to human beings. (UN Glossary of Environment Statistics)
Carrying Capacity – maximum number of animals of one or more species that can
be supported by a particular habitat or area through the most unfavorable period of the year. The carrying capacity is different for each species in habitat because of particular food, shelter, and social requirements and because of competition from other species that may have similar requirements. (PAWB)
Catalytic Converter – after-treatment device for exhaust emissions of gasoline-
powered motor vehicles. Shaped like a muffler and placed in the exhaust system in front of the muffler, it converts the exhaust pollutants hydrocarbons, (HC), carbon monoxide (CO) and nitrous oxide (NOx) to carbon dioxide and water. Catalytic converter requires the use of unleaded gasoline. (EMB)
Catchment Area – area from which rainwater drains into river systems, lakes and
seas. (UN Glossary of Environment Statistics) Cattle – General term for animals belonging to the bovine family, genus Bos. (TWG-
Livestock and Poultry Statistics) Cetacea – order of marine mammals including whales, dolphins and porpoises.
(BFAR) Change in Inventories – computed as the value of ending inventory less the value of
beginning inventory. Charcoal – solid product obtained from the destructive distillation and/or thermal
degradation of wood. Charcoal (M) – refers to mangrove charcoal or charcoal derived from mangrove
species. Charcoal (U) – refers to upland charcoal or charcoal derived from upland tree
species.

Glossary of Terms
Compendium of Philippine Environment Statistics 2004 Appendix A-7
Chemical Oxygen Demand – index of water pollution measuring the mass concentration of oxygen consumed by the chemical breakdown of organic and inorganic matter. (UN Glossary of Environment Statistics)
Chicken – a domestic fowl raised for meat, eggs and other by-products, genus Gallus.
(TWG-Livestock and Poultry Statistics) Chlorination – the application of chlorine to drinking water, sewage or industrial
waste in order to disinfect or oxidize undesirable compounds. (UN Glossary of Environment Statistics)
Chloro-fluorocarbons – inert, non-toxic and easily liquefied chemicals used in
refrigeration, air conditioning, packaging and insulation, or as solvents and aerosol propellants. Because CFCs are not destroyed in the lower atmosphere, they drift into the upper atmosphere where their chlorine components destroy ozone. They are also among the greenhouse gases that may affect climate change. (UN Glossary of Environment Statistics)
Cholera – intestinal disease generally caused by fecal contamination of water and
food. (UN Glossary of Environment Statistics) CITES – an acronym for the Convention on International Trade in Endangered
Species of Wild Fauna and Flora. It is an international treaty ratified by the Philippine Government purposely to regulate, control and prohibit the trade of wildlife. (PAWB)
CITES Appendix I – list of endangered fauna and flora prohibited by the contracting
states of CITES for commercial trade and/or export. Species listed in Appendix I could be exported only for educational and scientific purposes. (PAWB)
CITES Appendix II – list of endangered fauna and flora strictly regulated by the
contracting states of CITES for commercial trade and/or export. List of all species, although not necessarily threatened with extinction at present may become so unless trade in specimens of such species is subject to strict regulation in order to avoid utilization incompatible with their survival. (PAWB)
CITES Appendix lll – species listed under this appendix highly need local protection
set under national policies as determined by the country’s CITES Management Authority. (PAWB)
Civil Reservations - refers to forestland which have been proclaimed by the President
for a specific purpose such as town sites, resettlement areas, ancestral lands, etc.
Climate - condition of the atmosphere at a particular location (microclimate) or
region over a long period of time. It is the long-term summation of atmospheric elements – such as solar radiation, temperature, humidity, precipitation type (frequency and amount), atmospheric pressure and wind

Glossary of Terms
Compendium of Philippine Environment Statistics 2004 Appendix A-8
(speed and direction) - and their variations. (UN Glossary of Environment Statistics)
Climate Change - term frequently used in reference to global warming due to
greenhouse gas emissions from human activities. (UN Glossary of Environment Statistics)
Climatological Statistics - statistics dealing with long-term weather conditions. (UN
Glossary of Environment Statistics) Cloud Seeding - technique for promoting rainfall by the introduction of sea salt, dry
ice, zinc or silver iodine into the clouds. (UN Glossary of Environment Statistics)
Coast – general region of indefinite width that extends from the sea inland to the first
major change in terrain features. (IAC-Agriculture, Fishery and Forestry Statistics)
Coast Line – the imaginary line that forms the boundary between the land and the
sea. (IAC-Agriculture, Fishery and Forestry Statistics) Coke Oven Emissions - toxic emissions released at various stages in the production
and use of coke, and causing cancers in human beings. (UN Glossary of Environment Statistics)
Coliform Index – rating of water purity based on fecal bacteria count. (UN Glossary
of Environment Statistics) Collection – trapping, hunting, taking, amassing, gathering and/or owning through
any mode of acquisition any species of wildlife. (PAWB) Combustion - burning or rapid oxidation, accompanied by the release of energy in
the form of heat and light. It is also a basic cause of air pollution. (UN Glossary of Environment Statistics)
Commercial Fishing Boat License – a license authorizing a person (natural or
juridical) to engage in fishing operation. (BFAR) Common Name - vernacular name of animal or plant species (PAWB) Community Development Program – a program designed to develop and strengthen
communities and institutions as well as proper attitudes through a process which shall encourage local initiatives and active participation in undertaking development activities for a national socio-economic progress. (NEDA Glossary of Terms, 1985)
Community Mortgage Program – an innovative approach towards delivering social
housing finance. It is intended to reduce the development financing requirements of social housing projects and will be the primary instrument for land acquisition and payment in Areas for Priority Development (APDs) and
Glossary of Terms
Compendium of Philippine Environment Statistics 2004 Appendix A-9
other blighted areas where the target beneficiaries are already in place or in new settlements. (HUDCC)
Conservation Status – the sum of influences acting on species that affect its long-
term distribution and abundance (PAWB) Contaminant – any physical, chemical, biological or radiological substance or matter
that has an adverse effect on air, water, land/soil or biota. The term is frequently used synonymously with pollutant.
Cooperative Housing – a type of housing project in which an occupant purchases
stocks or shares in a corporation owning and operating a multi-unit housing project. (NEDA Glossary of Terms, 1985)
Coral Reef – a natural aggregation of coral skeleton, with or without living coral
polyps, occurring in inter-tidal and sub-tidal marine waters. (TWG-Fishery Statistics)
Cost - refers to all expenses incurred during the year whether paid or payable.
Valuation should be as market price including taxes and other charges, net of discounts, rebates, returns and allowances. Goods and services received by the establishment from other establishment of the same enterprise are valued as though purchased.
Criteria Pollutants – pollutants for which National Ambient Air Quality Standards
exist. The criteria pollutants include ozone, carbon monoxide, nitrogen dioxide, sulfur dioxide, lead, sulfates, hydrogen sulfide, and particulate matter with a diameter of 10 microns or less. (EMB)
Critically Endangered – a taxon that is facing an extremely high risk of extinction in
the wild in the immediate future (PAWB) Crude Oil – a mixture of hydrocarbons in liquid form found in natural underground
petroleum reservoirs. It has a heat content of 1.46 million calories/barrels and is the raw material from which most refined petroleum products are made. (ESI, 1991)
Crude Oil Importation – intends to measure the dependence on foreign sources for
the country’s crude oil supply. When disaggregated by geographical region and country of origin, they reflect the pattern of concentration of oil imports and monitor the extent of diversification of the source of oil supply for increased reliability and security. (ESI, 1991)
Crustaceans – group of mainly marine invertebrates, including lobsters, crabs and
shrimps, with hard shells. Daily Rated Capacity - the maximum volume of output that a mill can produce in
one shift of 8 hours based on actual performance of the machinery/equipment, sometimes referred to as true rated capacity.

Glossary of Terms
Compendium of Philippine Environment Statistics 2004 Appendix A-10
Deforestation - clearing of tree formations and their replacement by non-forest land uses. (UN Glossary of Environment Statistics)
Deforestation – clearing of tree formations and their replacement by non-forest land
uses. Depletion - for renewable resources, the part of the harvest, logging, catch and so
forth above the sustainable level of the resource stock; for non-renewable resources, the quantity of resources extracted. (UN Operations Manual on SEEA)
Dilution – method of disposing of industrial waste or plant effluent by discharge into
a stream or other body of water. (UN Glossary of Environment Statistics) Diplomatic Motor Vehicles – motor vehicles owned by foreign governments or by
their duly accredited diplomatic officials in the Philippines. The registration thereof must be supported by communications from the Department of Foreign Affairs. (NEDA Glossary of Terms, 1985)
Disaster/Calamity – a situation usually catastrophic in nature, in which a number of
persons are plunged into helplessness and suffering, and as a result may be in need of food, clothing, shelter, medical care and other basic necessities of life. (OCD/NDCC)
Discharge - release of substances (residuals of production and consumption) into
water or soil. (UN Glossary of Environment Statistics) Disposal of Waste - waste elimination techniques comprising landfills, containment,
underground disposal, dumping at sea and all other disposal methods. (UN Glossary of Environment Statistics)
Dissolved Oxygen (DO) – amount of gaseous oxygen (O2) actually present in water
expressed in terms either of its presence in the volume of water (milligrams of O2 per liter) or of its share in saturated water (percentage). (UN Glossary of Environment Statistics)
Dissolved Solids – disintegrated organic and inorganic material contained in water.
Excessive amounts make water unsuitable for drinking or for use in industrial processes. (UN Glossary of Environment Statistics)
Domestic Use of Water – use of water primarily for household purposes, the
watering of livestock, the irrigation of gardens, lawns, shrubbery, etc., surrounding a house or domicile. (UN Glossary of Environment Statistics)
Drainage Basin/Catchment Area/Watershed – area from which all precipitation
flows to a single stream or a set of streams. It is also called a catchment area or Drift Net Fishing – type of fishing involving very long nets that drift with the winds
and currents, thus creating a webbing curtain in which fish are enmeshed. It may result in: (a) commercially important species being unusable when landed

Glossary of Terms
Compendium of Philippine Environment Statistics 2004 Appendix A-11
owing to a long soak time or damaged by predators; and (b) incidental by-catch of non-targeted fish and other animals.
Drinking Water Standards – standards determining the quality of drinking water in
the context of prevailing environmental, social, economic and cultural conditions, with reference to the presence of suspended matter, excess salts, unpleasant taste and all harmful microbes. Meeting of those standards does not necessarily imply purity. (UN Glossary of Environment Statistics)
Drought – prolonged absence or marked deficiency of precipitation, which may
contribute to desertification. (UN Glossary of Environment Statistics) Duck – a general term for swimming birds with more or less depressed body of the
family Anatidae. It has short neck and legs, webbed feet, broad and flat bill with different plumage for male and female. (TWG-Livestock and Poultry Statistics)
Dump – site used to dispose of solid wastes without environmental controls. (UN
Glossary of Environment Statistics) Dumping – waste disposal in an uncontrolled manner. (UN Glossary of Environment
Statistics) Dumping at Sea – disposal of hazardous and non-hazardous substances in the open
sea. (UN Glossary of Environment Statistics) Earthquake – sudden shaking or trembling of the earth caused by faulting or
volcanic activity. Earthquakes – earth vibrations produced when the stability of rock masses under the
surface of the earth is disturbed. These disturbances usually occur along existing fault lines or zones of structural weaknesses. (OCD-NDCC)
Effluent – liquid waste product (whether treated or untreated) discharged from an
industrial process or human activity that is discharged into the environment. (UN Glossary of Environment Standards)
Effluent Standards – maximum amount of pollutants permitted in effluents. (UN
Glossary of Environment Statistics) Emission - discharge of pollutants into the atmosphere form stationary sources such
as smokestacks, other vents, surface areas of commercial or industrial facilities and mobile source, for example, motor vehicles, locomotives and aircraft. (UN Glossary of Environment Statistics)
Emission Damage - effects of (air) pollution on buildings, monuments, organisms
and ecosystems. (UN Glossary of Environment Statistics) Emission Factor - ratio between the amount of pollution generated and the amount of
a given raw material processed. The term may also refer to the ratio between

Glossary of Terms
Compendium of Philippine Environment Statistics 2004 Appendix A-12
the emissions generated and the outputs of production processes. (UN Glossary of Environment Statistics)
Emission Inventory – listing by source, type and quantity of pollutants actually or
potentially discharged. Such an inventory is used to establish and put forth emission standards. (UN Glossary of Environment Statistics)
Emission Standard - maximum amount of polluting discharge legally allowed from a
single source, mobile or stationary. (UN Glossary of Environment Statistics) Endangered – species and subspecies of wildlife whose populations are in danger of
extinction and whose survival is unlikely if the casual factors continue operating. (PAWB)
Endemic – species and/or sub-species of wildlife found only on a particular island or
on several islands of the Philippines and which are not found anywhere else outside its geographical boundaries. (PAWB)
Energy Resources – any substance by itself or in combination with others, or after
processing, refining, or application of technology, generates or causes the emanation or generation of energy such as, but not limited to petroleum products, coal, marsh, gas, methane gas, geothermal and hydroelectric sources of energy, uranium and other similar radioactive minerals, solar energy, tidal power, as well as non-conventional existing and potential resources (ESI, 1991)
Energy sources – all solid, liquid, and gaseous fuels; electricity, uranium; steam and
hot water; and the traditional fuels such as fuelwood, charcoal, vegetal and animal wastes.
Environment – the totality of all the external conditions affecting the life,
development and survival of an organism. Erosion – wearing away and transport of the soil by wind or running water, glaciers
or waves. Erosion occurs naturally but is often intensified by human land-clearing activities related to farming, residential or industrial development.
Evapotranspiration – combined loss of water by evaporation from the soil or surface
water and transpiration from plants and animals. (UN Glossary of Environment Statistics)
Exchange – the act whereby a party binds to give an animal or animals in
consideration of the other party’s promise to give another animal or animals. (PAWB)
Exclusive Economic Zone – an area beyond and adjacent to the territorial sea which
shall not extend beyond 200 nautical miles from the baseline from which the breadth of the territorial sea is measured. (TWG-Fishery Statistics)

Glossary of Terms
Compendium of Philippine Environment Statistics 2004 Appendix A-13
Exhaust Emissions – tailpipe emissions from vehicles operating on a “warmed up” operating mode. (EMB)
Exhaust Gases - gases produced by the burning of petrol (gasoline) in combustion
engines. Exhaust gases are harmful to human beings, plants and animals. (UN Glossary of Environment Statistics)
Exotic – species and/or sub-species of wildlife which are not native to the Philippines.
(PAWB) Extinct – species whose population no longer exist. (PAWB) Fauna – all species of animals in a given area. (PAWB) Feedlot - relatively small confined area for the controlled feeding of animals. It tends
to concentrate large amounts of animal wastes that cannot be absorbed by soil and hence may be carried to nearby streams or taken by rainfall run-off.
Fertilizers – organic or inorganic substances containing chemical elements that will
improve the growth of plants and the fertility of the soil. The percentage content of nutrients in organic fertilizers (manures) is relatively low. In inorganic or mineral fertilizers, the nutrients are inorganic salts, obtained by extraction and/or physical and chemical processes. The three primary plant nutrients are nitrogen, phosphorous and potassium.
Firewood or Fuelwood - wood used as fuel for household cooking and industrial
purposes (boiler fuel) derived either from mangrove or upland trees. Fish – includes all fishes and other aquatic animals such as crustaceans (crabs, prawn,
shrimps lobsters, etc.) and mollusks (clams, mussels, scallops, oysters, snails and other shellfish). (IAC-Agriculture, Fishery and Forestry Statistics)
Fish Cage – refers to an enclosure which is either stationary or floating, made up of
netting or screens sewer fastened together and installed in the water with opening at the surface or covered and held in place by wooden/bamboo posts or various types of anchors and floats. (TWG-Fishery Statistics)
Fish Coral – guiding barriers constructed of bamboo, brush or chicken wire, which
are set by means of regularly-spaced stakes or posts in tidal waters or along the natural paths of fish and which are of such shapes as to direct the voluntary movements of fish into a desired area. (BAS)
Fish Sanctuary – an area in the Philippine waters designated by the Bureau of
Fisheries and Aquatic Resources (BFAR) for the protection of fish or fishery/aquatic products. (IAC-Agriculture, Fishery and Forestry Statistics)
Fishery – the business of catching, taking, handling, marketing and preserving fish or
other fishery/aquatic products and the right to fish or take such products. (IAC-Agriculture, Fishery and Forestry Statistics)

Glossary of Terms
Compendium of Philippine Environment Statistics 2004 Appendix A-14
Fishery Management Area - a bay, gulf, lake or any other fishery area delineated for fishery resource management purposes. (TWG-Fishery Statistics)
Fishery Refuge and Sanctuaries – a designated area where fishing or other forms of
activities, which may damage the ecosystem of the area is prohibited and human access may be restricted. (TWG-Fishery Statistics)
Fishery Reserve – a designated area where activities are regulated and set aside for
educational and research purposes. (TWG-Fishery Statistics) Fishery Species – all aquatic flora and fauna including but not restricted to fish,
algae, coelenterates, mollusks, crustaceans, echinoderms and cetaceans. (TWG-Fishery Statistics)
Fishing – catching, gathering and culturing of fish, crustaceans, mollusks and all
other aquatic animals and plants in the sea or in inland waters. It also includes catching of fish and aquatic animals like turtles, gathering of clams, snails, shells and seaweeds; and culturing of fish and oysters. (NSO)
Fishing Establishment – a business or enterprise engaged in commercial fishing or
fishpond operation, has a fixed physical location, and is run by a single management control which, more or less, keeps records of its transactions. It includes all commercial fishing boat operations and all partnerships, corporations, cooperatives and other institutional enterprises registered for business with any government agency. (IAC-Agriculture, Fishery and Forestry Statistics)
Fishing Gear – apparatus, gadgets, implements and other paraphernalia used in
catching and ga thering of fish with or without the use of boats. (IAC-Agriculture, Fishery and Forestry Statistics)
Fishing Ground – seas, straits or seawater where actual fishing operations take place.
(TWG-Fishery Statistics) Fishing Vessel – any boat, ship or other watercraft equipped to be used for taking of
fishery species or aiding or assisting one (1) or more vessels in the performance of any activity relating to fishing including but not limited to preservation, supply storage, refrigeration, transportation and/or processing. (TWG-Fishery Statistics)
Fishing, Commercial – fishing for commercial purposes in waters more than 7
fathoms deep with the use of fishing boats of more than three (3) gross tons. (IAC-Agriculture, Fishery and Forestry Statistics)
Fishing, Household – a household in which one or more members are directly
engaged in fishing. (NEDA) Fishing, Inland Municipal – covers municipal fishing operation in inland waters.
(BAS)

Glossary of Terms
Compendium of Philippine Environment Statistics 2004 Appendix A-15
Fishing, Marine Municipal – covers municipal fishing operation in marine waters. (BAS)
Fishing, Municipal – fishing activity utilizing fishing boats of three (3) gross tons or
less, or using gear not requiring the use of boats, in municipal waters. (IAC-Agriculture, Fishery and Forestry Statistics)
Fishpen – a fish enclosure made of nylon screens or nets, or other similar materials
attached to poles staked to the bottom of fresh and/or salt-water areas, for the purpose of growing and/or culturing fish. (IAC-Agriculture, Fishery and Forestry Statistics)
Fishpond – a body of water (artificial or natural) where fish and other aquatic
products are cultured, raised or cultivated under controlled conditions. (IAC-Agriculture, Fishery and Forestry Statistics)
Fishpond, Brackish Water – fishpond with mixed sea water and fresh water. (IAC-
Agriculture, Fishery and Forestry Statistics) Fishpond, Freshwater – fishpond whose water is fresh. (IAC-Agriculture, Fishery
and Forestry Statistics) Flash Flood - flood of short duration with a relatively high peak discharge (UN
Glossary of Environment Statistics) Flocculation – process by which clumps of solids in water or sewage are made to
increase by biological or chemical action so that they can be separated from the water.
Flood – the condition that occurs when water overflows the natural or artificial
confines of a stream or body of water, or when run-off from heavy rainfall accumulates over low-lying areas. (OCD/NDCC)
Fluorocarbon - gas used as a propellant in aerosols. It contributes to the destruction
of the ozone layer in the stratosphere, thereby allowing harmful forms of solar radiation to reach the earth's surface. (UN Glossary of Environment Statistics)
For Hire Motor Vehicles – motor vehicles registered and authorized to be operated
as public utility by virtue of certificate of public convenience or provisional authority issued by the Department of Transportation and Communications (DOTC). (NEDA Glossary of Terms, 1985)
Forest - area of one hectare or more which is at least 10 percent stocked with forest
trees (including seedlings and saplings), wild palm, bamboo or brush. Narrow strips of land bearing forest must be at least 60 meters wide and one hectare in size to qualify as forest. Industrial tree plantations and tree farms one hectare or more in size are also included.
Forest Based Products - manufactured articles which mainly use raw materials
derived from forest.
Glossary of Terms
Compendium of Philippine Environment Statistics 2004 Appendix A-16
Forest Charges - is a levy being imposed by the government on naturally-growing timber and other forest products cut by the permittee/licensee and from plantations established in compliance with TLA reforestation obligations. The rate of which is provided under Section 70, 71 and 72 of RA 7161.
Forest Commercial - forest of commercial tree species in which the volume of trees
with 15 cm. and over in diameter at breast height and merchantable height of at least 5 meters measured from the base up to the first branch, is 40 cubic meters or more per hectare.
Forest Concession - refers to any tract of forestland under license agreement, lease or
permit. Forest Dipterocarp, Old Growth - tropical rain forest dominated by
Dipterocarpaceae without traces of commercial logging. Forest Product - all usable raw materials yielded by the forest including the
associated water, fish, game, scenic, historical, recreational and geologic resources.
Forest Reservation - refer to forestlands, which have been reserved by the President
of the Philippines for any specific purpose or purposes (PD 1559). Forest, Dipterocarp - forest stand dominated by trees of dipterocarp species such as
red and white lauan, tanguile, tiaong, almon, bagtikan and mayapis of the Philippine mahogany group, apitongs and yakals.
Forest, Dipterocarp Residual - tropical rain forest dominated by Dipterocarpaceae
with traces of commercial logging. Forest, Mangrove – the type of forest occurring on tidal flats along the sea coast
extending along the streams where the water is brackish and composed mainly of bakauan, pototan, langarai, api-api, nipa palm and the like.
Forestland – includes the public forest, the permanent forest or forest reserves, and
forest reservations. Framework for the Development of Environment Statistics – conceptual
framework that assists in the development, coordination and organization of environment statistics and related socio-economic and demographic statistics. It was developed by the United Nations Statistics Division in 1984, and is based on stress-response principles of environmental impacts. (UN Glossary of Environment Statistics)
Freshwater – (1) naturally occurring water having a low concentration of salts; it is
generally accepted as suitable for abstraction and treatment to produce potable water; (2) water without salt, such as generally found in lakes, rivers, canals, dams, reservoirs, paddy fields and swamps. (IAC-Agriculture, Fishery and Forestry Statistics)

Glossary of Terms
Compendium of Philippine Environment Statistics 2004 Appendix A-17
Game Refuge and Bird Sanctuary – refers to a forest land designated for the protection of game animals, birds and fish and closed to hunting and fishing in order that the excess population may flow and restock surrounding areas (PD 1559).
Geothermal Energy – energy resource obtained from trapped stream or hot water
within the earth’s crust. (ESI, 1991) Gill Net – a curtain- like net consisting of one or more pieces of rectangular nets in
which fish capture is effected by entanglement in the actual meshes of the net. (BAS)
Goat – an animal of genus Capra, family Bovidae, comprising of various agile,
hollow-horned ruminants closely related to the sheep. It is commonly known as the “poor man’s cow” because of its size and entails only a small risk of load. It is raised either for milk, meat, angora or kashmir fibers. (TWG-Livestock and Poultry Statistics)
Government Motor Vehicles – motor vehicles owned by the Government of the
Philippines or any of its political subdivisions. (NEDA Glossary of Terms, 1985)
Grazing Land - refers to that portion of the public domain which has been set aside,
in view of the suitability of its topography and vegetation, for raising of livestock (PD 1559).
Greenhouse Effect - warming of the earth's atmosphere cause by a build-up of
carbon dioxide and other greenhouse or trace gases that act like a pane of glass in a greenhouse, allowing sunlight to pass through and heat the earth but preventing a counterbalancing loss of heat radiation. (UN Glossary of Environment Statistics)
Greenhouse Gases - carbon dioxide, nitrous oxide, methane, ozone and choler-
fluorocarbons occurring naturally and resulting from human (production and consumption) activities, and contributing to the greenhouse effect (global warming). (UN Glossary of Environment Statistics)
Ground-Level Pollution - weight of a pollutant per unit volume in the region of the
air between the ground and a height of about two meters above it. (UN Glossary of Environment Statistics)
Groundwater – freshwater beneath the earth’s surface (usually in aquifers) supplying
wells and springs; because groundwater is a major source of drinking water, there is a growing concern over leaching of agricultural and industrial pollutants or substances from underground storage tanks. (UN Glossary of Environment Statistics)
Habitat – place where an organism or population (human, animal, plant,
microorganism) lives. (PAWB)
Glossary of Terms
Compendium of Philippine Environment Statistics 2004 Appendix A-18
Halogenated Hydrocarbon - compound formed when the hydrogen in a hydrocarbon molecule such as methane, is replaced by any of the halogens (fluorine, chlorine, bromine, and iodine). Their breakdown in the stratosphere releases chlorine and bromine, which take part actively in the destruction of stratospheric ozone. The best-known groups of halogenated hydrocarbons are the chlorofluorocarbons (CFCs). The brominated compounds are referred to as halons. (UN Glossary of Environment Statistics)
Halons - see halogenated hydrocarbons. Hard Water – alkaline water containing dissolved salts that interfere with some
industrial processes and prevent soap from lathering. Hazardous Air Pollutants - air pollutants that may reasonably be expected to cause
or contribute to irreversible illness or death. They include asbestos, beryllium, mercury, benzene, coke oven emissions, radionuclides and vinyl chloride. (UN Glossary of Environment Statistics)
Hazardous Substance – any substance that poses a threat to human health and the
environment. Hazardous substances are toxic, corrosive, ignitable, explosive or chemically reactive.
Hazardous Waste Treatment – two categories of treatment can be distinguished as
(a) physical hazardous waste treatment, an approach including phase separation such as through lagooning, filtration or centrifugation, and solidification into hard material allowing for landfill disposal; and (b) thermal hazardous waste treatment, high temperature oxidation of wastes that converts them into gases and solid residues.
Hazardous Wastes – wastes that, owing to their toxic, infectious, radioactive or
flammable properties pose a substantial actual or potential hazard to the health of humans and other living organisms and the environment.
Hog – a term used collectively for any of the stout-bodied, short-legged omnivorous
animals (family Suidae) with a long, mobile snout. (TWG-Livestock and Poultry Statistics)
Home Development Mutual Fund – the shelter agency charged with the
development of saving schemes for home acquisition by private and government employees and administers provident fund contributions collected from member employees and employers, utilizing funds not required for provident benefits for housing loans for members. (HUDCC)
Home Insurance and Guaranty Corporation – the shelter agency tasked to provide
incentives for greater private sector participation in both housing production and finance. This is done primarily through the provision of insurance and guaranties, which make bank loans to both developers and buyers risk-free. (HUDCC)

Glossary of Terms
Compendium of Philippine Environment Statistics 2004 Appendix A-19
Household – an aggregate of persons, generally but not necessarily bound by ties of kinship, which live together under same roof and eat together or share in common the household food. Members comprise the head of the household, relatives living with him, and other persons who share the community life for reasons of work or other consideration. A person who lives alone is considered a separate household. (NSO)
Household Waste – waste material usually generated in the residential environment.
Waste with similar characteristics may be generated in other economic activities and can thus be treated and disposed of together with household waste.
Household with Access to Safe Drinking Water – refers to households covered by
or have access to the following types of drinking water sources that conforms to the national standards for drinking water (i.e., free from bacterial, chemical, physical and other contaminant). (DOH)
Household with Sanitary Toilets – refers to households with flush and pour flush
toilets, sanitary pit privy, other types of sanitary toilets facilities such as aqua-privy, ventilated improved pit or chemical toilet. (DOH)
Housing and Land Use Regulatory Board – the shelter agency charged with
liberalizing housing standards to make shelter more affordable. (HUDCC) Housing Construction – the building of residential units by the government,
classified into: (1) Administered by the government – Construction of residential units undertaken by the National Housing Authority (NHA), and the National Home Mortgage Finance Corporation (NHMFC); and (2) Financed by the government – Construction of residential units financed through the Government Service Insurance System (GSIS), the Social Security System (SSS), the Home Development Mutual Fund (HDMF), or the Home Insurance Guaranty Corporation (HIGCC). (ESI, 1991)
Human Settlements - integrative concept that comprises (1) physical components of
shelter and infrastructure and (2) services to which the physical elements provide support, that is to say, community services such as education, health, culture welfare, recreation and nutrition. (UN Glossary of Environment Statistics)
Hydrocarbons - compounds of hydrogen and carbon in various combinations that are
present in petroleum products and natural gas. Some hydrocarbons are major air pollutants, some may be carcinogenic and others contribute to photochemical smog. (UN Glossary of Environment Statistics)
Hydrochlorofluorocarbons – compounds used as replacements for
chlorofluorocarbons (CFCs) in refrigeration because they are less active ozone depleters. (UN Glossary of Environment Statistics)
Hydrology – (1) science that deals with the waters above and below the land surfaces
of the earth, their occurrence, circulation and distribution, both in time and in

Glossary of Terms
Compendium of Philippine Environment Statistics 2004 Appendix A-20
space, their biological, chemical and physical properties, and their interaction with the environment including their relation to living things; (2) science that deals with the process governing the depletion and replenishment of water resources of the land areas of the earth, including the various phases of the hydrologic cycle. (UN Glossary of Environment Statistics)
Hydrolysis – decomposition by chemical reaction with water. (UN Glossary of
Environment Statistics) Hydropower – electricity generation using the power of falling water. (UN Glossary
of Environment Statistics) Impoundment – body of water formed through collection of water, as by a dam. (UN
Glossary of Environment Statistics) Incineration – controlled burning of solid, liquid or gaseous waste materials at high
temperature. (UN Glossary of Environment Statistics) Incinerator – furnace for burning wastes under controlled conditions. (UN Glossary
of Environment Statistics) Indeterminate – species and subspecies of wildlife whose populations are suspected
of belonging to either one of the endangered, vulnerable and rare categories of species but for which insufficient information is currently available to determine definite status. (PAWB)
Indoor Air Pollution – chemical, biological and physical contamination of indoor
air. It may result in adverse health effects. In developing countries, the main source of indoor air pollution is biomass smoke, which contains suspended particulate matter (SPM), nitrogen dioxide (NO2), sulfur dioxide (SO2), carbon monoxide (CO), formaldehyde and polycyclic aromatic hydrocarbons (PAHs). In industrialized countries, in addition to NO2, CO, and formaldehyde, radon, asbestos, mercury, human-made mineral fibers, volatile organic compounds, allergens, tobacco smoke, bacteria and viruses are the main contributors in indoor air pollution. (UN Glossary of Environment Statistics)
Industrial Forest Plantation Management Agreement – Agreement entered into by
DENR and a qualified person, to occupy and process, in consideration of a specified rental, any forest land of the public domain in order to establish an industrial forest plantation (ITP).
Industrial Tree Plantation – refers to any tract of forestland and other public and
private lands planted to timber producing species including rubber, and/or non-timber species such as rattan, bamboo primarily to supply the raw material requirements of existing or proposed forest-based industries, and energy-generating plants, and related industries, as well as for export.
Infant Mortality Rate – the number of deaths among children below one year old per
1000 live births. This indicator provides a measure of the accessibility and quality of medical care, immunization and disease control programs for

Glossary of Terms
Compendium of Philippine Environment Statistics 2004 Appendix A-21
children and mothers, and the quality and level of infant and maternal nutrition and environmental sanitation.
Infiltration – flow of water through the soil surface into a porous medium. (UN
Glossary of Environment Statistics) Inland Fishery – includes the freshwater fishery and brackish water fishponds.
(TWG-Fishery Statistics) Inland Water – a body of water within the shoreline which includes brackish water,
and fresh water such as the lakes, rivers dams and etc. (BAS) Insects – these are segmented, bilaterally symmetrical animals possessing a hard,
chitinous, exoskeleton and pairs of jointed appendages. They are distinguished from their relatives by the presence of three body divisions – head, thorax, abdomen - the thorax bearing three pairs of legs and usually two pairs of wings in the adult stage. (PAWB)
Introduced – species that have been deliberately translocated by man outside their
natural geographic range (PAWB) Inventory of Animals – the actual number of animals present in the farm as of a
specific reference date regardless of ownership. (TWG-Livestock and Poultry Statistics)
Inversion – atmospheric condition caused by a layer of warm air preventing the rise
of the cool air trapped beneath it. Inversion prevents the rise of pollutants that might otherwise be dispersed. See also Air Pollution Episode. (UN Glossary of Environment Statistics)
Invertebrate – animal that does not have backbone or spinal column. (PAWB) Irrigation – artificial application of water land to assist in the growing of crops and
pastures; it is carried out by spraying water under pressure (spray irrigation) or by pumping water onto the land (flood irrigation). (UN Glossary of Environment Statistics)
Kaingin – a portion of the forest land, whether occupied of not which is subjected to
shifting and/or permanent slash and burn cultivation having little or no provision to prevent soil erosion (PD 705)
Lahar – deposit formed by mudflow or water-saturated volcanic ash. Land Classification – land categories, reflecting quality classes, capability classes or
grade, depending upon the characteristics of the land and/or its potential for agricultural use.
Land Degradation – reduction or loss of the biological or economic productivity and
complexity of rain-fed cropland, irrigated cropland, or range, pasture, forest or woodlands resulting from natural processes, land uses or other human
Glossary of Terms
Compendium of Philippine Environment Statistics 2004 Appendix A-22
activities and habitation patterns such as land contamination, soil erosion and the destruction of the vegetation cover.
Land Improvement – alteration in the qualities of land that improves its potential for
land use. Land Reclamation – gain of land from the sea, or wetlands, or other water bodies,
and restoration of productivity or use to lands that have been degraded by human activities or impaired by natural phenomena.
Land Use – the employment of a site or holding so as to derive revenue or other benefits from it; the delineation by a governing authority of the utilization of the land within a particular jurisdiction so as to promote the most advantageous development of the community such as industrial, residential, commercial, recreational and other uses under a plan. (HUDCC)
Landfill – final placement of waste in or on the land in a controlled or uncontrolled
way according to different sanitary, environmental protection and other safety requirements.
Landing Center - the place where the fish catch and other aquatic products are
unloaded and traded. (BAS) Land Use Classification – classification providing information on land cover and the
types of human activity involved in land use. It may also facilitate the assessment of environmental impacts on, and potential or alternative uses of land. The classification consists of seven main categories, namely (a) agricultural land; (b) forest and other wooded land; (c) built-up and related land, excluding scattered farm buildings; (d) wet open land; (e) dry open land with special vegetation cover; (f) open land with or without insignificant vegetation cover; and (g) waters.
Leachate – liquid that results from water trickling through wastes, agricultural
pesticides, or fertilizers; leaching may occur in farm areas, feedlots and landfills, and may result in hazardous substances entering surface water, groundwater soil. (UN Glossary of Environment Statistics)
Lead – heavy metal whose compounds are highly poisonous to health. Its use in
gasoline, paints and plumbing compounds has been generally reduced. (UN Glossary of Environment Statistics)
Lease – a privilege granted by the State to a person to occupy and possess in
consideration of specified rental, any authorized activity therein (PD 1559). License – a privilege granted by the State to a person to utilize forest resources within
forest land, without any right of occupation and possession over the same, to the exclusion of others, or establish and operate a wood processing plant or conduct any activity involving the utilization of any forest resources (PD 1559)
License Agreement – a privilege granted by the State to a person to utilize forest
resources within any forest land with the right of possession and occupation

Glossary of Terms
Compendium of Philippine Environment Statistics 2004 Appendix A-23
thereof to the exclusion of others, except the government, but with the corresponding obligation to develop, protect and rehabilitate the same in accordance with the terms and conditions set forth in said agreement (PD 1559).
License Agreement, Pulpwood – similar to timber license agreement except that it is
primarily for the cutting of pulpwood. License Agreement, Timber – a long term license executed by and between the
Secretary of Environment and Natural Resources on behalf of the government and the grantee for the harvesting and removal from the public forest of timber, and in appropriate cases also of other forest products. It is drawn up by the Director of Forest Management Bureau and recommended to the Secretary of Environment and Natural Resources for final approva l. It is subject to review at least once every five (5) years to ascertain the terms for major policy changes.
License, Miner's Timber – a license issued by the Department of Environment and
Natural Resources for the cutting and utilization of timber for mining purposes. License, Non-Timber Forest Product – a license issued for the cutting and
utilization of any forest products other than timber within a public forest or forested land.
License, Ordinary Timber – a short-term commercial license for timber. License, Private Land Timber – a license issued for the cutting and commercial
utilization of timber in a private land, the title of which is not registered with the Bureau.
License, Provisional Timber – a short-term license issued by the Secretary of
Environment and natural Resources over area previously under ordinary license where field evaluation has not been undertaken or completed due to fortuitous events or where the area is covered by mining claim and the claimant does not need timber for mining purposes and commercializes it or waives his right to another who is qualified to acquire a timber license.
License, Softwood Timber – a license issued for the cutting within forestland of
selected timber species suitable and used solely for "bakya", matchsticks, carvings and similar purposes.
License, Special Timber – license issued for the utilization of a class of timber or
other forest products not otherwise authorized under an existing license, or for the cutting of timber and other forest products within alienable or disposable and private lands, or for the removal of timber and other forest products incident to researches in experimental forest, or for small sawmills to supply the needs of communities far from big sawmills.
Light Gauge Steel Section – a housing technology which consists of a structural
framing member with cement stucco plastered or sprayed unto expanded metal

Glossary of Terms
Compendium of Philippine Environment Statistics 2004 Appendix A-24
lath backed with felt paper or other backing materials on both exterior and interior walls or partition. (HUDCC)
Livestock – farm animals kept or raised for consumption, work or leisure. In general,
poultry are separated as a distinct group of farm animals. (TWG-Livestock and Poultry Statistics)
Loading – the quantity of polluting material discharged into a body of water. (UN
Glossary of Environment Statistics) Log – felled trees bucked into convenient length of at least 1.5 meters, with at least 15
cm. in diameter. It may either be poles, piles, pulpwood, sawlog or veneer log. Logging Operations – the cutting of timber and producing rough, round, hewn or
river forest or wood raw materials. Logging Waste – wood residues generated in the course of normal logging
operations. This includes treetops, branches, stumps, trimmings and knocked down trees not within the definition of merchantile logs.
Long line – an extremely long line with a large series of baited hooks, either set or
drifting and requiring only periodical attention at more or less fixed time intervals. (BAS)
Lower Risk – a taxon when evaluated does not satisfy the criteria for any of the
categories Critically endangered, endangered or vulnerable Lumber – solid wood not further manufactured other than sawing, resawing and
passing lengthwise through a standard planing machine cross-cut to length. Mammals – group of animals representing class Mammilla. (PAWB) Mammilla – a class of vertebrates which possesses mammary glands that produce
milk to feed the young. Other distinguishing characteristics of mammals are the possession of hairs and majority bears their young alive. (PAWB)
Mangrove – a term applied to the type of forest occurring on tidal flat along the
seacoast, extending along stream where the water is brackish. (PAWB) Mangrove Ecosystems – an ecosystem found in the inter-tidal zone directly under the
influence of high tides and low tides. It is a special type of land-sea interface ecosystem where the internal processes (i.e. energy fixations, production of organic matter, mineral cycling, etc.) are significantly influenced by external parameters such as regular supply of sea water, regular tidal regime and stability of the substratum. (IAC-Agriculture, Fishery and Forestry Statistics)
Mangrove Swamps – the brackish water coastal swamps or tropical and sub-tropical
areas that are usually dominated by shrubby salt –tolerant vegetation and are partly inundated by tidal flow. It is extended to area where the nature of the soil, although mangrove are identically of parallel origin and the ecological

Glossary of Terms
Compendium of Philippine Environment Statistics 2004 Appendix A-25
conditions therein are suited for aquaculture. (IAC-Agriculture, Fishery and Forestry Statistics)
Mariculture – the culture of fish, oysters, seaweeds and other aquatic resources in
marine or brackish water environment. (IAC-Agriculture, Fishery and Forestry Statistics)
Marine Park – any offshore area inhabited by rare and unique species of marine flora
and fauna. (PAWB) Marine Pollution – direct or indirect introduction by humans of substances or energy
into the marine environment (including estuaries), resulting in harm to living resources, hazards to human health, hindrances to marine activities including fishing, impairment of the quality of sea water and reduction of amenities. (UN Glossary of Environment Statistics)
Marine Water – sea water outside the coastal line. (IAC-Agriculture, Fishery and
Forestry Statistics) Mercury – heavy metal that can accumulate in the environment and is highly toxic if
breathed or swallowed. (UN Glossary of Environment Statistics) Methane – colorless, non-poisonous and flammable gaseous hydrocarbon created by
anaerobic decomposition of organic compounds. Methane is a potent greenhouse gas. (UN Glossary of Environment Statistics)
Migrant – species that winter in the Philippines on a seasonal basis or those that cross
transboundaries on several states Migratory Species – any fishery species which in the course of their life could travel
from freshwater to marine water or vice versa, or any marine species which travel over great distances in waters of the ocean as part of their behavioral adaptation for survival and speciation. (TWG-Fishery Statistics)
Military Reservation - refers to forest land which has been proclaimed by the
President for military purposes, such as Airbase, Campsite, Docks and Harbors, Firing Range, Naval Base, Target Range, Wharves, etc.
Mining Wastes – mining-related by-products of two types: (a) mining-and-quarrying
extraction wastes which are barren soils removed from mining and quarrying sites during the preparation for mining and quarrying and do not enter into the dressing and beneficiating processes; and (b) mining-and-quarrying dressing and beneficiating wastes which are obtained materials extracted during mining-and-quarrying activities. These wastes occupy valuable land and cause harm to stream life when they are deposited near the drainage area of the stream.
Mobile Source – moving source of air pollution such as cars, trucks, buses and
airplanes.
Glossary of Terms
Compendium of Philippine Environment Statistics 2004 Appendix A-26
Monitoring – continuous or frequent standardized measurement and observation of the environment (air, water, land/soil, biota) often used for warning and control. (UN Glossary of Environment Statistics)
Monitoring Station – facility to measure emissions or ambient concentrations of
pollutants. (UN Glossary of Environment Statistics) Motor Vehicle – any vehicle propelled by any power other than muscular power
using the public highways, but excepting road rollers, trolley cars, street sweepers, sprinklers, lawn mowers, bulldozers, graders, forklifts, amphibian trucks, and cranes if not used on public highways, vehicles which run only on rails or trucks and tractors, trailers and traction engines of all kinds used exclusively for agricultural purposes. Trailers having any number of wheels, when propelled or intended to be propelled by attachment to a motor vehicle, shall be classified as separate motor vehicle with no power rating. (NEDA Glossary of Terms, 1985)
Municipal Water – includes streams, lakes and tidal waters within the municipality,
not being the subject of private ownership and not comprised within national parks, public forests, timber lands, forest reserves or fishery reserves and marine waters included between two lines drawn perpendicular to the general coastline from points where the boundary lines of the municipality touch the sea at low tide and a third line parallel with the general coastline and three nautical miles from such coastline. Where two municipalities are so situated on the opposite shores that there is less than six nautical miles of marine waters between them, the third line shall be a line equidistant from the opposite shores of the respective municipalities. (IAC-Agriculture, Fishery and Forestry Statistics)
National Home Mortgage Finance Corporation – the main implementing agency of
the Unified Home Lending Program (UHLP). It is the major government home mortgage institution whose initial main function is to operate a viable home mortgage market, utilizing long-term funds principally provided by Social Security System (SSS), Government Service Insurance System (GSIS) and Home Development Mutual Fund (HDMF) as funding agencies for the purchase of mortgages originated by both private and public institutions based on government-approved guidelines. (HUDCC)
National Housing Authority – mandated as the sole government producer of shelter
for low and marginal income groups. Its activities are focused on housing solutions affordable to these beneficiaries: slum upgrading or on-site development, provision of new sites and services and resettlement projects. (HUDCC)
National Integrated Protected Areas System (NIPAS) – the classification and
administration of all designated protected areas to maintain essential ecological processes and life-support systems, to preserve genetic diversity, to ensure sustainable use of resources found therein, and to maintain their natural conditions to the greatest extent possible. (PAWB)

Glossary of Terms
Compendium of Philippine Environment Statistics 2004 Appendix A-27
National Park – a forest reservation essentially of natural wilderness character which has been withdrawn from settlement, occupancy or any form of exploitation except in conformity with approved management plan and set aside as such exclusively to conserve the area or preserve the scenery, the natural and historic objects, wild animals and plants therein and to provide enjoyment of these features in such areas. (PAWB)
National Shelter Program – a comprehensive program which provides the people
especially the lowest 30 percent with adequate housing facilities through affordable financing packages. (HUDCC)
Natural Biotic Area – an area set aside to allow the way of life of societies living in
harmony with the environment to adapt to modern technology at their pace. (PAWB)
Natural Disaster – sudden calamitous event as in the case of earthquakes, tsunamis,
floods, volcanic eruptions, cyclones and landslides, or ongoing misfortune as in conditions or processes such as drought and desertification. (UN Glossary of Environment Statistics)
Natural Monument/Landmark – a relatively small area focused on protection of
small features to protect or reserve nationally significant natural features on account of their special interest or unique characteristics (PAWB)
Natural Park – a relatively large area not materially altered by human activity where
extractive resource uses are not allowed and maintained to protect outstanding and natural and scenic areas of national or international significance for scientific, educational and recreational use. (PAWB)
Natural Pollutant – pollutant created by substances of natural origin such as volcanic
dust, sea salt particles, photochemically formed ozone, and products of forest fibers, among others. (UN Glossary of Environment Statistics)
Near Threatened – taxa which do not qualify for Conservation Dependent but which
are close to qualifying for Vulnerable (PAWB) Net Emissions – the actual emissions occurring from a new modified project after
actual on-site and off-site mitigation and other effective mitigation have been applied, as determined by the Air Pollution Control Officer. (EMB)
Nipa Sap – liquid extracted from the bud of nipa palm (Nypha fruticans) as a result of
tapping, used in the manufacture of wine and vinegar. Nipa Shingle – roofing material made from the fronds of nipa. Nitrate – nitrogen-containing compound that can exist in the atmosphere or as a
dissolved gas in water. It may produce harmful effects on humans and animals. (UN Glossary of Environment Statistics)

Glossary of Terms
Compendium of Philippine Environment Statistics 2004 Appendix A-28
Nitric Oxide – gas formed by combustion under high pressure and high temperature in an internal combustion engine. It changes into nitrogen dioxide in the ambient air and contributes to photochemical smog. (UN Glossary of Environment Statistics)
Nitrogen Oxide – product of combustion from transportation and stationary sources.
It is a major contributor to acid depositions and the formation of ground- level ozone in the troposphere. (UN Glossary of Environment Statistics)
Nitrous Oxide – relatively inert oxide of nitrogen produced as a result of microbial
action in the soil, use of fertilizers containing nitrogen, burning of timber, and so forth. This nitrogen compound may contribute to greenhouse and ozone-depleting effects. (UN Glossary of Environment Statistics)
Non-attainment – not achieving ambient air quality standards. (EMB) Non-Conventional Energy – a form of energy that includes direct solar energy
conversion, wind, biomass, wood, biogas, tidal energy and ocean thermal energy (ESI, 1991)
Non-Government Organization – private, non-stock, non-profit voluntary
organization that is committed to the task of socioeconomic and sustainable development and is established primarily for service. (PAWB)
Non-Renewable Natural Resources – exhaustible natural resources such as mineral
resources that cannot be regenerated after exploitation. Non-Timber Forest Product – includes all forest products except timber. Also
known as minor forest product. notably a reservoir. Orchids – either epiphytic, terrestrial or saprophytic perennial herbs with unique
floral arrangements and peculiar floral growth (PAWB) Organism – any living plant, animal or human being. (PAWB) Other Forestry Activities – the operation of tree nurseries, planting, replanting and
conservation of forests; gathering of uncultivated materials such as gums and resins, wild rubber, saps, barks, herbs, wild fruits and flowers, mosses, leaves, needles, reeds and roots; and the concentrating and distilling of sap and charcoal burning when carried on in the forest. Establishments primarily engaged in providing forestry services are included.
Other Industrial Roundwood – roundwood used for tanning, distillation,
matchblocks, poles, pilings, posts, etc. Other Paper and Paperboard – includes all sheets made of fibrous materials such as
household and sanitary paper, wrapping and packaging paper and paperboard. Other Printing and Writing Paper – paper except newsprint suitable for printing
and business papers writing, sketching, drawing, etc., made from a variety of

Glossary of Terms
Compendium of Philippine Environment Statistics 2004 Appendix A-29
pulp blends and with various finishes. Included are such papers as those for books and magazine, wall paper based stock, stationery, bank note, manifold, onion skin, typewriter, poster, etc.
Ozone – a secondary pollutant formed from the reaction of oxides of nitrogen and
reactive organic gases in the presence of sunlight. In the stratosphere, ozone provides a protective layer shielding the earth form the harmful effects of ultraviolet radiation on human beings and other biota. In the troposphere, it is a major component of photochemical smog, which seriously affects the human respiratory system. (EMB)
Ozone Depletion – destruction of ozone in the stratosphere, where it shields the earth
from harmful ultraviolet radiation. Its destruction is caused by chemical reactions in which oxides of hydrogen, nitrogen, chlorine and bromine act as catalysts. (UN Glossary of Environment Statistics)
Ozone Hole – seasonal decrease in the total ozone column, 15-20 kilometers above
the Antarctic. (UN Glossary of Environment Statistics) p.p.m./p.p.b./p.p.t. – parts per million/parts per billion/parts per trillion, measures of
the concentrations of pollutants in air, water, soil, human tissue, food or other products. (UN Glossary of Environment Statistics)
Particulates – fine liquid or solid particles, such as dust, smoke, mist, fumes or smog,
found in air or emissions. See also Suspended Particulate Matter. (UN Glossary of Environment Statistics)
Permanent Forest or Forest Reserve – refers to those lands of the public domain
which have been the subject of the present system of land classification declared as needed for forest purposes (PD 1559).
Permit – is a short term privilege or authority granted by the State to a person to
utilize any limited forest resources or undertake a limited activity within any forest land without any right of occupation and possession therein (PD 1559).
Permit to Operate – the written permission, with any specified conditions required,
that must be obtained from the Air Pollution Control Agency before any equipment that might produce air pollution is used. (EMB)
Permit, Special – a short term permit granted for the cutting, hauling and/or
transporting of forest products. Pesticide – any substance or mixture of substances that is used to prevent, destroy or
control pests, including vectors of human or animal disease, and unwanted species of plants or animals. Pesticides may cause harm during, or marketing of food, agricultural commodities, wood and wood products or animal feedstuffs or that may be administered to animals so as to control insects, arachnids or other pests in or on their bodies.
Glossary of Terms
Compendium of Philippine Environment Statistics 2004 Appendix A-30
Plywood – an assembled product made of layers of veneer held together by an adhesive, the chief characteristics of which is the alternate cross layers, distributing the longitudinal wood strength. It consists of three or more layers of veneer, firmly glued together with the grain direction of the middle layer at right angles to that of the two parallel outer layers.
Point Source – a facility, which emits a total of greater than ten tons per year of the
criteria pollutants. It covers stationary sources such as sewage treatment plants, power plants, other industrial establishments, and similar buildings and premises of small spatial extension. (EMB)
Poles and Piles – logs for use as electric post, pier piling, railroad ties, sleepers and
the like. Pollutant – (1) substance that is present in concentrations that may harm organisms
(humans, plants and animals) or exceed an environmental quality standard; the term is frequently used synonymously with contaminant; (UN Glossary of Environment Statistics); (2) presence of substances and heat in environmental media (air, water, land) whose nature, location, or quantity produces undesirable environmental effects; (3) activity that generates pollutants.
Population – total number of individuals in a territory or a locality living at a
specified moment of time with an agreed definition of residence; all the persons falling within the scope of a census or other inquiry. (NSO)
Population Growth Rate – rate of increase/decrease of the population over a given
year due to natural increase and net migration expressed as a percentage of the base population (ESI, 1993-1995)
Poultry – a collective term for all domestic birds of economic service to man; also
used to refer to the dressed carcass of fowls; includes chickens (native, gamefowl, layer and broiler) and ducks. (TWG-Livestock and Poultry Statistics)
Precipitation – (1) rains or snows falling from the atmosphere and deposited on land
and water surfaces; (2) forced removal of particles from flue gases or waste water. (UN Glossary of Environment Statistics)
Precursor – a pollutant, that when emitted into the atmosphere, may undergo either a
chemical or physical change which then produces another pollutant. (UN Glossary of Environment Statistics)
Private Motor Vehicles – motor vehicles registered not to be used for hire under any
circumstances. (NEDA Glossary of Terms, 1985) Processing Plant – any mechanical set-up, device, machine or combinations of
machines used for the conversion of logs and other forest raw materials into fiberboard, pulp, paper or other finished wood products (PD 1559).
Glossary of Terms
Compendium of Philippine Environment Statistics 2004 Appendix A-31
Production, Meat – aggregate volume of meat recovered from locally raised animals including the meat equivalent of imported fatteners/feeder stocks. (TWG-Livestock and Poultry Statistics)
Protected Area – a relatively large area where one or more types of ecosystems of
ecological significance are adequately conserved, where plant and animal species and habitats are not materially altered by human exploitation and/or occupation. (PAWB)
Protected Landscapes/Seascapes – areas of national significance which are
characterized by the harmonious interaction of man and land while providing opportunities for public enjoyment through the recreation and tourism within the normal lifestyle and economic activity of these areas. (PAWB)
Protection of Ambient Air – environmental protection activity involving the
erection, maintenance and operation of facilities for the reduction of emissions into ambient air, or of concentrations in the air, of air pollutants through the use of particulate emission collectors, gaseous emission control devices or other technical means. (UN Glossary of Environment Statistics)
Protection of Climate and the Ozone Layer - measures to control the emissions of
greenhouse gases and gases that adversely effect the stratospheric ozone layer (carbon dioxide, methane, nitrous oxide, chloro-fluorocarbons and halons). (UN Glossary of Environment Statistics)
Proved Reserves – such estimated quantities of mineral deposits, at a specific date, as
analysis of geologic engineering data demonstrates with reasonable certainty to be recoverable in the future under the same economic and operational conditions.
Provisional Timber Production Agreement - a temporary agreement entered into by
and between the DENR Secretary and an expired timber license holder for the continuity of its logging operation pending the issuance of a regular Timber Production Sharing Agreement (TPSA).
Pulpwood – any wood commercially used for the manufacture of any type of pulp. Purse Seine – a long, rectangular net held vertically in water by a line of floats above
and a line of lead sinkers below with a bunt at the center and pursing device along the middle half of the sinker line. (BAS)
Push Net – a triangular framed, collapsible net operated by one man. The capture of
fish is effected by a forward, horizontal motion along the bottom of shallow waters. (BAS)
Putrescible Waste – plant or animal residues that undergo quick degradation by
bacteriological action causing odors and attract flies. Quarry – an excavation or pit, usually open to the air, from which mineral deposits
are obtained by cutting, blasting, etc.

Glossary of Terms
Compendium of Philippine Environment Statistics 2004 Appendix A-32
Rainforest – luxuriant forest, generally composed of tall, broad-leaved evergreen trees, found in regions where annual rainfall exceeds 1,800 millimeters. (UN Glossary of Environment Statistics)
Rainwater – water that falls to earth as precipitation from atmospheric humidity. It
may contain undesirable quantities of nitrogen, sulfur and heavy metals which give rise to problems of “acid rain”. (UN Glossary of Environment Statistics)
Rare Species – species and subspecies of wildlife found only in one particular area or
only in a few areas in the Philippines in very highly specialized habitat types but occur only in very small numbers and are therefore, seldom met, even within their preferred habitat types. Their populations are not at present endangered or vulnerable but are at risk. (PAWB)
Rattan – refers to a group of cane-like climbing palm species such as the palasan and
the limuran belonging to the family Palmae generally found on moist tropical rain forest. May come in split or unsplit forms, which are used primarily in furniture and households fixtures.
Rattan Cutting Contracts – a contract entered into the Secretary of Environment and
Natural Resources and another party to cut, gather and transport rattan. Reactive Organic Gases – compounds of principally carbon and hydrogen that react
with nitrogen oxides to form ozone (also known as reactive hydrocarbons and reactive organic compounds). All organic gases are considered ROG except: methane, carbon monoxide, carbon dioxide, carbonic acid, metallic carbides or carbonates, ammonium carbonates, TCA, methylene chloride (dichloromethane, CFC-11, CFC-12, HCFC-22, FC-23, CFC-113, CFC-114, CFC-115, HCFC-134a, HCFC-141b, HCFC-142b. (EMB)
Recharge – process by which water is added from outside to the zone of saturation of
an aquifer. (UN Glossary of Environment Statistics) Recreation – an activity which refreshes the body, spirit, or mind undertaken during
leisure time in an outdoor or natural setting. (PAWB) Recreation Areas – forest land reservation which has been set aside for the
protection, reservation, development and public enjoyment of natural scenery, primitive or natural landscape, wildlife, natural phenomena and other natural attractions. (PAWB)
Recreation Facilities – structures or developments introduced within a protected area
for purposes of enhancing outdoor recreation activities, thereby making visitors better appreciate and enjoy nature. (PAWB)
Recreational Land – land used for purposes of recreation, for example, sports fields,
gymnasiums, playgrounds, public parks and green areas, public beaches and swimming pools, and camping sites.

Glossary of Terms
Compendium of Philippine Environment Statistics 2004 Appendix A-33
Red List of Threatened Animals - listing of animals threatened with extinction. The 1994 IUCN Red List, compiled by World Conservation Monitoring Center, includes more than 6,000 animal species known to be at risk. (PAWB)
Red Tide - proliferation of marine plankton that is toxic and often fatal to fish. This
natural phenomenon is stimulated by phosphorus and other nutrients that are discharges into waterways by human beings. The color of the tide can be red, yellow, green or brown. (UN Glossary of Environment Statistics)
Reforestation - the act of planting trees on bare or open land which is used to be
covered with forest growth. Reproduction Brush - forest predominantly stocked with trees of at least one meter
high but less than 15 cm. in diameter. Reptiles – vertebrate animals with tough skin, usually covered with scales in contrast
to amphibians with smooth, delicate skin. Snakes are typical examples of reptiles. Reptiles either lay eggs (oviparous) or bear their young alive. (PAWB)
Reptilia – scientific term referring to reptiles. (PAWB) Resettlement Program – involves the acquisition and development of large tracts of
raw land to generate serviced home lots for families displaced from sites earmarked for government infrastructure projects and from danger areas. The program is non-cost recoverable and relies on full subsidy support for land acquisition and site development. (HUDCC)
Resident - breed or suspected of breeding in the Philippines normally living there
throughout the year (PAWB) Resident Migrant – migratory species that have adapted to the condition in the
country and have established their population within a particular area/region in the Philippines (PAWB)
Residual Inventory - an activity which pertains to evaluating the result of tree
marking after logging operations whether or not the loggers exercised care in avoiding damages to mark trees, and to determine the condition, sizes, and number of healthy trees left.
Resin - translucent amber-colored to almost black brittle exudent obtained by
chemical means (e.g. oleoresin). Resource Reserve – an extensive and relatively isolated and uninhabited area
normally with difficult access designated as such to protect natural resources of the area for future use and prevent or contain development activities that could affect the resource pending the establishment of objectives which are based upon appropriate knowledge and planning. (PAWB)
Revenue - includes cash received and receivable for
products/crops/harvests/gatherings sold and agricultural, industrial and non-

Glossary of Terms
Compendium of Philippine Environment Statistics 2004 Appendix A-34
industrial services rendered to others. Valuation is at producer's prices (ex-establishment), net of discounts and allowances, including duties and taxes but excluding subsidies.
Ring Net – a truck seine, which, in structure, combines the features of the round haul
seine (which has the bunt at the center and is flanked by two wings) and the purse seine (which has a regular pursing device). (BAS)
River Basin – total land area drained by a river and its tributaries. (UN Glossary of
Environment Statistics) Roundwood - wood in its natural state as felled or otherwise harvested, with or
without bar, round, split roughly squared or other forms (e.g. roots, stumps). It may also be impregnated (e.g. telegraph poles) or roughly shaped or pointed. It comprises all wood obtained from the forest such as sawlogs/veneer logs, pulpwood, fuelwood and other industrial roundwood.
Run-Off – portion of rainfall, melted snow or irrigation water that flows across the
ground’s surface and is eventually returned to streams. Run-off can pick up pollutants from air or land and carry them to receiving waters. (UN Glossary of Environment Statistics)
Rural Health Units – health institutions located in rural areas, which provide medical
care and preventive health services, usually staffed by a multi-disciplinary team. (NEDA Glossary of Terms, 1985 and Compendium of Philippine Social Statistics, 1998)
Rural Water Supply (Level 1) – a source of water supply which could either be a
protected well or a developed spring with an outlet but without a distribution system, generally adaptable for rural areas where the houses are thinly scattered. A level 1 facility normally serves an average of 15 households. The farthest user of level 1 is not more than 250 meters from the point source. (DPWH)
Salinity – salt content of environmental media. (UN Glossary of Environment
Statistics) Salinization – increase in salt concentration in an environmental medium, notably
soil. (UN Glossary of Environment Statistics) Salt Water Intrusion – mixing of saltwater with freshwater. It can occur in either
surface water or groundwater bodies. (UN Glossary of Environment Statistics) Sanitary Sewage – domestic wastes from bathrooms, kitchen and so on. (UN
Glossary of Environment Statistics) Sanitary Toilet Facilities – refer to water carriage excreta disposal system, which
include septic tanks and water-scaled types. (NEDA Glossary of Terms, 1985)

Glossary of Terms
Compendium of Philippine Environment Statistics 2004 Appendix A-35
Sawmill – a wood processing plant used for the conversion of logs/timbers into lumber, which includes band or circular re-saws with carriage that are operated as independent units for re-sawing/ripping of lumber, slabs and other wood wastes into desired dimensions and forms and are not accessories to the head rig.
Schistosomiasis – disease contracted through exposure to water containing a species
of water snail that acts as host to flukes of the genus Schistosoma at their first larval stage. The disease leads to malfunctioning and deterioration of the liver, heart, spleen, bladder and kidneys. (UN Glossary of Environment Statistics)
Scientific Name – the formal nomenclature/name of specific plants and animals.
(PAWB) Sedimentation – settling of matter to the bottom of a liquid or water body. (UN
Glossary of Environment Statistics) Sedimentation Tank – holding area for waste water where floating wastes are
skimmed off and settled solids are pumped to incinerators, digesters, filters or other means of disposal. (UN Glossary of Environment Statistics)
Selective Logging – the systematic removal of the mature, over mature and defective
trees in such a manner as to leave adequate number and volume of healthy residual trees of the desired species necessary to assure a future crop of timber, and forest cover for the protection and conservation of soil, water and wildlife (PD 1559).
Septic Tank – underground tank receiving wastewater directly from the home.
Organic sewage/waste is decomposed by bacteria and settles down in the tank; effluents flow out of the tank into the ground; and the sludge is periodically pumped out. (UN Glossary of Environment Statistics)
Sewage – organic waste and wastewater produced by residential and commercial
establishments. (UN Glossary of Environment Statistics) Sewer – channel or conduit that carries wastewater, sewage and storm water from
their source to a treatment plant or receiving stream. A sanitary sewer conveys household and commercial wastes, a storm sewer transports rain run-off and a combined sewer is used for both purposes. (UN Glossary of Environment Statistics)
Shoreline – the line drawn along an area between the seawater and the land exposed
during the lowest tide. (IAC-Agriculture, Fishery and Forestry Statistics) Silt – fine particles of sand and rock that can be picked up by air or by water and
deposited as sediments. Sinking – controlling of oil spills through use of an agent to trap the oil and sink it to
the bottom of the body of water in which the agent and the oil are to be biodegraded. (UN Glossary of Environment Statistics)

Glossary of Terms
Compendium of Philippine Environment Statistics 2004 Appendix A-36
Smog Check - a vehicle inspection and maintenance examination. (EMB) Species – a group of organisms capable of interbreeding freely of each other but with
members of other species (PAWB) Specimen - any animal, whether dead or alive, or any recognizable part or derivative
thereof. (PAWB) Stationary Source – a pollution source that does not move, e.g., plant boilers, paint,
asphalt, and oil tanks. A second definition is a group of facilities at contiguous locations that are under common management and engaged in similar activity. (EMB)
Stationary Source Control Measures – a control measure designed to limit the kind
and amount of pollutants emitted from stationary sources. (EMB) Stewardship Agreement – is a contract entered into by and between a forest
occupant or community. Forest management association or cooperative and the Government, allowing the farmer land tenure and the right to peaceful occupation, development and management over a designated area.
Strict Nature Reserve – an area possessing some outstanding ecosystem features
and/or species of flora and fauna of national scientific importance maintained to protect nature and maintain processes in an undisturbed state in order to have ecologically representative examples of the natural environment available for scientific study, environmental monitoring, education and for the maintenance of genetic resources in a dynamic and evolutiona ry state. (PAWB)
Surface Water – all water naturally open to the atmosphere, including rivers, lakes,
reservoirs, streams, impoundments, seas, estuaries and so on. The term also covers springs, wells or other collectors of water that are directly influenced by surface waters. (UN Glossary of Environment Statistics)
Suspended Solids – small particles of solid pollutants in sewage that contribute to
turbidity and resist separation by conventional means. (UN Glossary of Environment Statistics)
Sustainability – refers to a) use of the biosphere by present generations while
maintaining its potential yield (benefit) for future generations; and/or b) non-declining trends of economic growth and development that might be impaired by natural resource depletion and environmental degradation.
Sustainable Use – means the use of components of biological diversity in a way that
a rate that does not lead to a long-term decline of biological diversity, thereby maintaining its potential to meet the needs and aspirations of present and future generations. (PAWB)
Tailings – wastes separated out during the processing of crops and mineral ores,
including residues of raw materials.

Glossary of Terms
Compendium of Philippine Environment Statistics 2004 Appendix A-37
Tanbark - a general term for tannin producing barks e.g. camachile and bakauan barks.
Threatened Wildlife Species– species and subspecies of wildlife whose population
throughout the islands where they are found have suffered high degree of depletion to the point of having their numbers reduced to the minimum below which said species or subspecies will totally become extinct. (PAWB)
Timber – the major product of the forest, the standing tree. Timber Stand Improvement – intermediate-tending operations past the sampling
stage to regulate the growth number of pre-selected crop trees by cleaning and liberation of a filling to be eventually harvested.
Timberland – refers to land of the public domain, which have been the subject of the
present system of land classification determined to be needed for forest purposes. Eventually these lands will be proclaimed as forest reserves by the President.
Topography – physical feature of a surface area, including its relief or relative
elevations, and the position of human-made and natural features. Total Energy Consumption – the quantity of energy consumed measured in barrels
of oil equivalent. It includes consumption of primary energy, i.e., oil, coal, hydroelectric, geothermal energy and non-conventional energy. (ESI, 1991)
Toxic Pollutants – materials contaminating the environment that cause death, disease
and/or birth defects in the organisms that ingest or absorb them. The quantities and length of exposure necessary to cause these effects can vary widely.
Translocation – the act or process of transferring or changing the location of an
animal or animals to an area stimulating the natural habitat. (PAWB) Trade – the act of engaging in the exchange, exportation or importation, purchase or
sale of wildlife, their derivatives or by-products, locally or internationally (PAWB)
Transpiration – the evaporation of water into the atmosphere from the surface of
plant leaves. (UN Glossary of Environment Statistics) Transport Permit - permit issued authorizing an individual to bring wildlife from
one place to another within the territorial jurisdiction of the Philippines (PAWB)
Transportation Control Measure – any strategy to reduce vehicle trips, vehicle use,
vehicle miles traveled, vehicle idling or traffic congestion for the purpose of reducing motor vehicle emissions. (EMB)
Trawl – an active fishing gear consisting of a bag-shaped net with or without otter
boards to open its opening which is dragged or towed along the bottom or

Glossary of Terms
Compendium of Philippine Environment Statistics 2004 Appendix A-38
through the water column to take fishery species by straining them from the water, including all variations and modifications of trawl (bottom, mid-water, and baby trawls) and tow nets. (BFAR)
Tree Farm – any small forestland or tract of land purposely planted to tree crops (PD
1559). Tree Marking – the identification and marking of trees to be cut and those to be left
as residuals, which will form the future crop of timber. Tsunami – translation of Japanese term meaning “storm wave”, giant ocean wave
produced by a seismic disturbances beneath the ocean floor. (UN Glossary of Environment Statistics)
Turbidity – hazy or cloudy condition of water due to the presence of suspended
particles. (UN Glossary of Environment Statistics) Type 1 IFMA Areas – IFMA Areas that do not contain any Residual Production
Forest and are for IFP establishment and management and protection forest, if any.
Type II IFMA Areas – IFMA Areas that contain Residual Production Forest and are
for Industrial Forest Plantation (IFP) establishment, sustainable management of the Residual Production Forest and protection of Protection Forest.
Unemployed – include all those who, during the reference period are 15 years old and
over as of their last birthday who have no job/business and actively looking for work. Also considered as unemployed are persons without a job or business who are reported not looking for work because of their belief that no work was available or because of temporary illness/disability, bad weather, pending job application or waiting for job interview. (NSO)
Unemployment Rate – the proportion in percent of the total number of unemployed
persons to the total number of persons in the labor force. (NSO) Universal Soil Loss Equation – equation used as an erosion index in which soil loss
(expressed in tons per acre) is defined as the mathematical product R K L S C P, where R is the rainfall erosivity index, K the soil erodibility factor, L the slope length factor, S the slope steepness factor, C the crop management factor and P the conservation factor.
Unpaid Family Workers – persons living in the household of any of the proprietors
and working in the establishment and non-industrial receipts. (NSO) Upland – highland; ground elevation above the lowlands along rivers or between
hills. Value of Livestock and Poultry – the value of the animal with reference to its farm
gate price. (TWG-Livestock and Poultry Statistics)

Glossary of Terms
Compendium of Philippine Environment Statistics 2004 Appendix A-39
Veneer – thin sheets of wood of uniform thickness, rotary cut, sliced or sawn for use in the manufacture of plywood.
Vulnerable – species or subspecies of wildlife whose populations are still sizeable
but are under threat from serious adverse factors throughout their range and are believed likely to move to the endangered category in the near future. (PAWB)
Waste – materials that are not prime products (that is, products produced for the
market) for which the generator has no further use in terms of his own purposes of production, transformation or consumption, and of which he wants to dispose. Wastes may be generated during the extraction of raw materials, the processing of raw materials into intermediate and final products, the consumption of final products, and other human activities. Residuals recycled or reused at the place of generation are excluded.
Waste Collection – collection and transport of waste to the place of treatment or
discharge by municipal services or similar institutions, or by public or private corporations, specialized enterprises or general government. Collection of municipal waste may be selective, that is to say, carried out for a specific type of product, or undifferentiated, in other words, covering all kinds of waste at the same time.
Waste Management – characteristic activities include (a) collection, transport,
treatment and disposal of waste; (b) control, monitoring and regulation of the production, collection, transport, treatment and disposal of waste; and (c) prevention of waste production through in-process modifications, reuse and recycling.
Wastepaper – paper and paperboard which has been used for its original purposes or
residues from paper conversion, which could be re-used as a raw material for the manufacture of paper, paperboard, panels, moulded products, etc. and for wrapping, packaging or other purpose with or without further processing.
Wastewater – used water, typically discharged into the sewage system. It contains
matter and bacteria in solution or suspension. (UN Glossary of Environment Statistics)
Water Abstraction – removal of water from any source, either permanently or
temporarily. Mine water and drainage water are included. Water abstractions from groundwater resources are defined as the difference between the total amount of water withdrawn from aquifers and the total amount charged artificially or injected to aquifers. (UN Glossary of Environment Statistics)
Water Conservation – preservation, control and development of water resources,
both surface and groundwater, and prevention of pollution. (UN Glossary of Environment Statistics)
Water Cycle – sequence of climatological events. The heat of the sun evaporates
water from land and water surfaces; vapor, being lighter than air, rises until it reaches the cooler upper air level where it condenses into clouds; further
Glossary of Terms
Compendium of Philippine Environment Statistics 2004 Appendix A-40
condensation produces precipitation that falls to earth as rain, sleet or snow; some of the water is retained by the soil and some run-off returns to rivers, lakes and oceans. (UN Glossary of Environment Statistics)
Water Mining – depletion (beyond replenishment) of water bodies, notably aquifers.
(UN Glossary of Environment Statistics) Water Pollution – presence in water of harmful and objectionable material –
obtained from sewers, industrial wastes and rainwater run-off – in sufficient concentrations to make it unfit for use. (UN Glossary of Environment Statistics)
Water Quality – physical, chemical, biological and organoleptic (taste-related) properties of water. (UN Glossary of Environment Statistics)
Water Quality Criteria – specific levels of water quality desired for identified uses,
including drinking, recreation, farming, fish production, propagation of other aquatic life, and agricultural and industrial processes. (UN Glossary of Environment Statistics)
Water Supply System – system for the collection, transmission, treatment, storage
and distribution of water from source to consumers, for example, homes, commercial establishment, industry, irrigation facilities and pub lic agencies for water-related activities. (UN Glossary of Environmental Statistics)
Water Table – level below which water-saturated soil is encountered. It is also
known as groundwater surface. (UN Glossary of Environmental Statistics) Water Treatment – (a) (prior to first use) process to render water withdrawn from
any source suitable for first use; (b) wastewater treatment by mechanical, biological and advanced procedures.
Water Use – use of water by agriculture, industry, energy production and households,
including in-stream uses such as fishing, recreation, transportation and waste disposal. (UN Glossary of Environment Statistics)
Waterborne Disease – disease that arises from infected water and is transmitted
when is used for drinking or cooking (fo r example, cholera or typhoid). It is to be distinguished from water-based and water-related diseases. Water-based diseases are those in which water provides the habitat for host organisms of parasites ingested (for example, schistosomiasis). Water-related diseases are those in which insect vectors rely on water as habitat but transmission is not through direct contact with water (for example, malaria or onchocerciasis). (UN Glossary of Environment Statistics)
Watershed – a land area drained by a stream or fixed body of water and its tributaries
having a common outlet for surface run-off (PD 1559). Watershed Reservation – a forest land reservation established to protect or improve
the conditions of the water yield thereof or reduce sedimentation (PD 1559).

Glossary of Terms
Compendium of Philippine Environment Statistics 2004 Appendix A-41
Watershed, Critical – a drainage area of a river system supporting existing and proposed hydroelectric power and irrigation water needing immediate rehabilitation as it is being subjected to a fast denudation causing accelerated erosion and destructive floods. It is closed from logging until it is rehabilitated.
Weather – day-to-day or sometimes even instantaneous changes of atmospheric
conditions over a given place or area. In contrast, climate encompasses the statistical ensemble of all weather conditions during a long period of time over that place or area. Atmospheric conditions are measured by the meteorological parameters of air temperature, barometric pressure, wind velocity, humidity, clouds and precipitation. (UN Glossary of Environment Statistics)
Wetland – area of low-lying land where the water table is at or near the surface most
of the time. Wetlands include swamps, bogs, fens, marshes and estuaries. (UN Glossary of Environment Statistics)
Wild Fauna By-Products – anything derived or produced directly or indirectly from
wild animals such as hides, antlers, fins, carapace and the like. (PAWB) Wilderness Area – land of public domain which have been reserved as such by law
to preserve its natural conditions, maintain its hydrologic quality and restrict public use in the interest of national welfare and security. This includes foreshore protection forests, mossy forests and mangrove forests essentially needed for foreshore protection and maintenance of estuarine and marine life including critical watershed reservations and special forest which are the exclusive habitat of rare and endangered Philippine Flora and Fauna. (PAWB)
Wildlife – non-domesticated flora and fauna. (PAWB) Wildlife Export – the conveyance of wildlife and its by-products from any place
within the territorial jurisdiction of the Philippines to another country. (PAWB) Wildlife Sanctuary – comprises an area, which assures the natural conditions
necessary to protect nationally significant species, groups of species, biotic communities or physical features of the environment where these may require specific human manipulations for their perpetuation. (PAWB)
Wildlife Trade – the act of purchasing, selling, offering or exposing for sale, or
having in possession for sale, live or dead, or any part of wildlife species. (PAWB)
Wood Processing Plant – a mechanical device, machine, combination of machines or
set-up used for the treatment of poles and piles or conversion of logs, and other wood raw materials into lumber, veneer, plywood, wallboard, blackboard, paperboard, pulp paper or other finished wood products.
Working Owners – proprietors and active business partners who are actually
engaged in the work of the establishment and are not applicable to any incorporated or similar enterprise the ownership of which is presented by equity shares. (NSO)

List of Acronyms and Abbreviations
Compendium of Philippine Environment Statistics Appendix B-1
Appendix B
LIST OF ACRTONYMS AND ABREVIATIONS ADB Asian Development Bank AFFLA Agro-Forestry Farm Lease Agreement A. O. Administrative Order ARMM Autonomous Region of Muslim Mindanao ASE Annual Survey of Establishment ATE Average Total Employment ATO Air Transportation Office BAI Bureau of Animal Industry BAS Bureau of Agricultural Statistics BFAR Bureau of Fisheries and Aquatic Resources BRS Bureau of Research and Standards BSWM Bureau of Soil and Water Management CA Census of Agriculture CAR Cordillera Administrative Region CENRO Community Environment and Natural Resources Officer CFBL Commercial Fishing Boat License CITES Convention of International Trade in Endangered Species COA Commission on Audit DA Department of Agriculture DAR Department of Agrarian Reform DBM Department of Budget and Management DENR` Department of Environment and Natural Resources DILG Department of Interior and Local Government
List of Acronyms and Abbreviations
Compendium of Philippine Environment Statistics Appendix B-2
DND Department of National Defense DOE Department of Energy DOH Department of Health DOLE Department of Labor and Employment DOT Department of Tourism DOTC Department of Transportation and Communication DPWH Department of Public Works and Highways DSWD Department of Social Welfare and Development DTI Department of Trade and Industry EIS Environmental Impact Statement EMB Environmental Management Bureau ENRA Environmental and Natural Resources Accounting ENRAP Environmental and Natural Resources Accounting Project E. O. Executive Order ERDB Ecosystems Research and Development Bureau FMB Forest Management Bureau FPA Fertilizer and Pesticides Authority HLURB Housing and Land Use Regulatory Board HUDCC Housing and Urban Development Coordinating Council IFAW International Fund for Animal Welfare IFMA Industrial Forest Plantation Management Agreement IUCN International Union for the Conservation of Nature and Natural
Resources LGU Local Government Unit LMB Land Management Bureau LRTA Light Rail Transit Authority

List of Acronyms and Abbreviations
Compendium of Philippine Environment Statistics Appendix B-3
LTO Land Transportation Office LWUA Local Water Utilities Administration MARINA Maritime Industry Authority MEIP Metropolitan Environmental Improvement Project MGB Mines and Geosciences Bureau MMDA Metro Manila Development Authority MOA Memorandum of Agreement MWSS Metropolitan Waterworks and Sewerage System NAMRIA National Mapping and Resource Information Agency NBSAP National Biodiversity Strategy and Action Plan NCR National Capital Region NDCC National Disaster Coordinating Center NEDA National Economic and Development Authority NEA National Electrification Authority NGO Non Government Organization NHA National Housing Authority NIA National Irrigation Authority NIPAS National Integrated Protected Areas NLUC National Land Use Council NSCB National Statistical Coordination Board NSO National Statistics Office NWRB National Water Resource Board OCD Office of Civil Defense PAGASA Philippine Atmospheric, Geophysical and Astronomical Services
Administration
List of Acronyms and Abbreviations
Compendium of Philippine Environment Statistics Appendix B-4
PAWB Philippine Areas and Wildlife Bureau PEA Philippine Estate Authority PEZA Philippine Economic Authority PFDA Philippine Fishery Development Authority PPA Philippine Ports Authority R. A. Republic Act SEC Securities and Exchange Commission TLA Timber License Agreement UN United Nations UNFDES United Nations Framework for the Development of Environment
Statistics WRs Water Rights BOD Biochemical Oxygen Demand CFC Chloro-flouro Carbon CO Carbon Monoxide cu. m. Cubic meters DO Dissolved Oxygen ECC Environmental Compliance Certificate has hectares kg Kilogram Km2 Kilometers lps liters per second m.cu.m. million cubic meters m.cu.m/y million cubic meters per year mg/l milligrams per liter mm/y millimetres per year

List of Acronyms and Abbreviations
Compendium of Philippine Environment Statistics Appendix B-5
MSLP Mean Sea Level Pressure m.t. metric tons NO Nitrogen monoxide NO2 Nitrogen Dioxide NOx Nitrogen Oxide O3 Ozone PM Particulate Matter SO2 Sulfur Dioixde SOI Southern Oscillation Index SOx Sulfur Oxide sq.m. Square meter SST Sea Surface Temperature TOG Total Organic Gases TSP Total Suspended Solids