comprehensive annual financial report - cherokee county cherokee county cafr.pdf · serve as a...
TRANSCRIPT

South Carolina
Comprehensive Annual Financial Report
YEAR ENDED JUNE 30, 2017

CHEROKEE COUNTY, SOUTH CAROLINA
COMPREHENSIVE ANNUAL FINANCIAL REPORT
YEAR ENDED JUNE 30, 2017
PREPARED BY FINANCE DEPARTMENT
J. HOLLAND BELUE, ADMINISTRATOR


CHEROKEE COUNTY, SOUTH CAROLINA COMPREHENSIVE ANNUAL FINANCIAL REPORT
YEAR ENDED JUNE 30, 2017
TABLE OF CONTENTS
Exhibit Page
INTRODUCTORY SECTION
Letter of Transmittal 1-4
List of Principal Officials 5
Organizational Chart 6
GFOA Certificate of Achievement for Excellence in Financial Reporting 7
FINANCIAL SECTION
Independent Auditor’s Report 8-9
Management’s Discussion and Analysis (Required Supplementary Information) 10-18
Basic Financial Statements
Government-wide Financial Statements:
Statement of Net Position A 19
Statement of Activities B 20
Fund Financial Statements:
Balance Sheet – Governmental Funds C 21
Reconciliation of the Total Governmental Funds Balance Sheet to the Statement of Net Position D 22
Statement of Revenues, Expenditures and Changes in Fund Balances – Governmental Funds E 23
Reconciliation of the Statement of Revenues, Expenditures and Changes in Fund Balances of Governmental Funds to the Statement of Activities F 24
Statement of Fiduciary Net Position – Agency Funds G 25

CHEROKEE COUNTY, SOUTH CAROLINA COMPREHENSIVE ANNUAL FINANCIAL REPORT
YEAR ENDED JUNE 30, 2017
TABLE OF CONTENTS – Continued
Exhibit Page
Notes to Financial Statements – Index 26
Notes to Financial Statements 27-58
Schedule Page
Required Supplementary Information:
Schedule of County’s Proportionate Share of the Net Pension Liability (SCRS) 1 59
Schedule of the County’s Contributions (SCRS) 2 59
Schedule of County’s Proportionate Share of the Net Pension Liability (PORS) 3 60
Schedule of the County’s Contributions (PORS) 4 60
Budgetary Comparison Schedule – General Fund 5 61-62
Schedule of Funding Progress and Employer Contributions for Retiree Health Plans 6 63
Combining and Individual Nonmajor Fund Financial Statements and Schedules:
Combining Balance Sheet – Nonmajor Governmental Funds 7 64-68
Combining Statement of Revenues, Expenditures and Changes in Fund Balances – Nonmajor Governmental Funds 8 69-73
Combining Statement of Fiduciary Net Position– Agency Funds 9 74-75
Combining Statement of Changes in Net Position – Agency Funds 10 76-78
Combining Balance Sheet – Fire Districts 11 79
Combining Statement of Revenues, Expenditures and Changes In Fund Balance – Fire Districts 12 80
Capital Assets Used in the Operation of Governmental Funds: Schedule by Function and Activity 13 81
Schedule of Changes by Function and Activity 14 82

CHEROKEE COUNTY, SOUTH CAROLINA COMPREHENSIVE ANNUAL FINANCIAL REPORT
YEAR ENDED JUNE 30, 2017
TABLE OF CONTENTS – Continued Table Page STATISTICAL SECTION 83 Financial Trends Information: Net Position by Component 1 84 Change in Net Position 2 85-86 Fund Balances of Governmental Funds 3 87 Changes in Fund Balances of Governmental Funds 4 88 Revenue Capacity Information: Assessed Value and Estimated Actual Value of Taxable Property 5 89 Direct and Overlapping Property Tax Rates 6 90 Principal Property Taxpayers 7 91 Property Tax Levies and Collections 8 92 Debt Capacity Information: Ratio of Outstanding Debt by Type 9 93 Direct and Overlapping Governmental Activities Debt 10 94 Legal Debt Margin Information 11 95 Ratios of General Bonded Debt Outstanding 12 96 Demographic and Economic Information: Demographic and Economic Statistics 13 97 Principal Employers 14 98 County Employees by Function 15 99 Operating Information: Operating Indicators by Function/Program 16 100 Capital Assets Statistics by Function/Program 17 101

CHEROKEE COUNTY, SOUTH CAROLINA COMPREHENSIVE ANNUAL FINANCIAL REPORT
YEAR ENDED JUNE 30, 2017
TABLE OF CONTENTS – Continued
Schedule Page
COMPLIANCE SECTION
Supplementary Information Required by State of South Carolina:
Summary Schedule of Court Fines, Assessments and Surcharges – Clerk of Court and Magistrate Court 15 102

INTRODUCTORY SECTION


(1)

(2)

(3)

(4)

CHEROKEE COUNTY, SOUTH CAROLINA List of Principal Officials
June 30, 2017
Council Meets – First and Third Monday, 5:00 PM County Seat – Gaffney Form of Government – Council/Administrator Zip Code – 29340 Method of Election – Single Member Population – 57,037
Members of County Council Tim Spencer County Council Chairman Quay Little County Council Vice Chairman Charles Mathis, Jr. County Council Tracy A. McDaniel County Council Mike Fowlkes County Council David Smith County Council Lyman Dawkins III County Council
Elected Officials Jackie Williams Treasurer Merv Bishop Auditor Brandy W. McBee Clerk of Court Steve Mueller Sheriff Dennis G. Fowler Coroner Joshua Queen Probate Judge Barry Barnette Solicitor
Appointed Official J. Holland Belue County Administrator
(5)
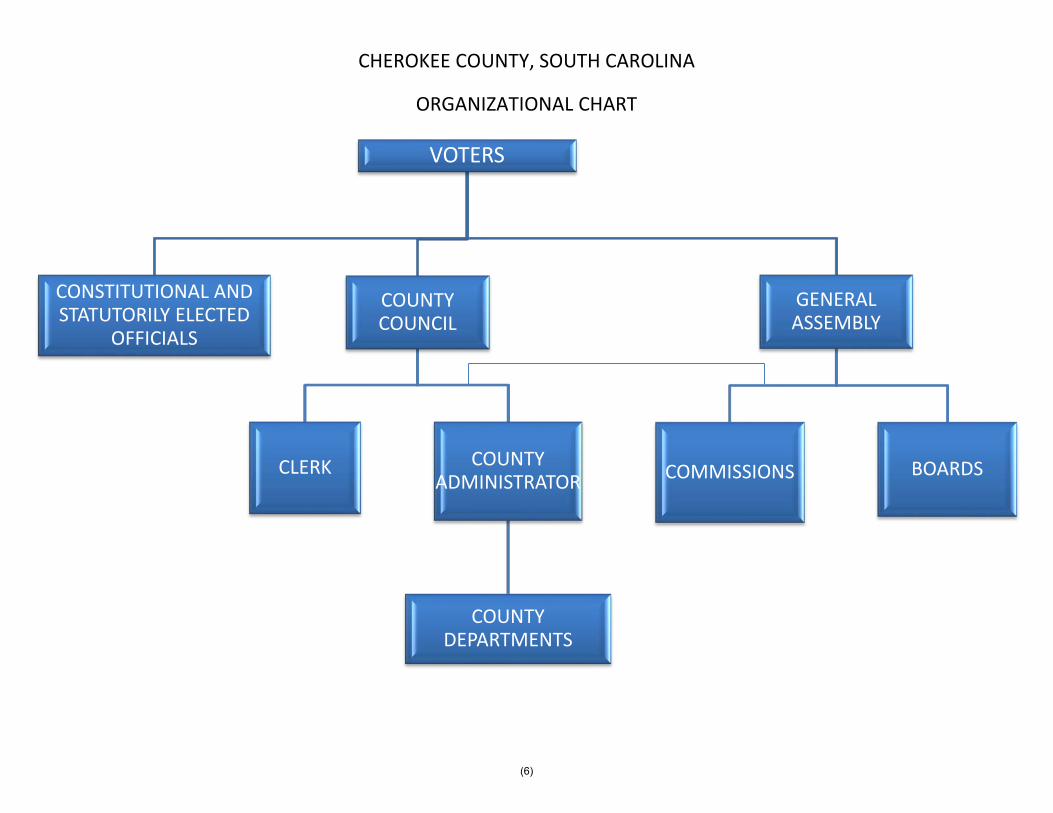
CHEROKEE COUNTY, SOUTH CAROLINA
ORGANIZATIONAL CHART
VOTERS
CONSTITUTIONAL AND STATUTORILY ELECTED
OFFICIALS
COUNTY COUNCIL
CLERK COUNTY ADMINISTRATOR
COUNTY DEPARTMENTS
GENERAL ASSEMBLY
COMMISSIONS BOARDS
(6)

(7)


FINANCIAL SECTION


To the Council and Finance Committee of Cherokee County, South Carolina
INDEPENDENT AUDITOR’S REPORT
Report on the Financial Statements
We have audited the accompanying financial statements of the governmental activities, each major fund, and the aggregate remaining fund information of Cherokee County, South Carolina as of and for the year ended June 30, 2017, and the related notes to the financial statements, which collectively comprise the County’s basic financial statements as listed in the table of contents.
Management’s Responsibility for the Financial Statements
Management is responsible for the preparation and fair presentation of these financial statements in accordance with accounting principles generally accepted in the United States of America; this includes the design, implementation, and maintenance of internal control relevant to the preparation and fair presentation of financial statements that are free from material misstatement, whether due to fraud or error.
Auditor’s Responsibility
Our responsibility is to express opinions on these financial statements based on our audit. We conducted our audit in accordance with auditing standards generally accepted in the United States of America. Those standards require that we plan and perform the audit to obtain reasonable assurance about whether the financial statements are free from material misstatement.
An audit involves performing procedures to obtain audit evidence about the amounts and disclosures in the financial statements. The procedures selected depend on the auditor’s judgment, including the assessment of the risks of material misstatement of the financial statements, whether due to fraud or error. In making those risk assessments, the auditor considers internal control relevant to the entity’s preparation and fair presentation of the financial statements in order to design audit procedures that are appropriate in the circumstances, but not for the purpose of expressing an opinion on the effectiveness of the entity’s internal control. Accordingly, we express no such opinion. An audit also includes evaluating the appropriateness of accounting principles used and the reasonableness of significant accounting estimates made by management, as well as evaluating the overall presentation of the financial statements.
We believe that the audit evidence we have obtained is sufficient and appropriate to provide a basis for our audit opinions.
Opinions
In our opinion, the financial statements referred to above present fairly, in all material respects, the respective financial position of the governmental activities, each major fund, and the aggregate remaining fund information of Cherokee County, South Carolina, as of June 30, 2017, and the respective changes in financial position for the year then ended in accordance with accounting principles generally accepted in the United States of America.
(8)

To the Council and Finance Committee of Cherokee County, South Carolina Page Two
Other Matters
Required Supplementary Information
Accounting principles generally accepted in the United States of America require that the management’s discussion and analysis and required supplementary information as listed in the table of contents be presented to supplement the basic financial statements. Such information, although not a part of the basic financial statements, is required by the Governmental Accounting Standards Board, who considers it to be an essential part of financial reporting for placing the basic financial statements in an appropriate operational, economic, or historical context. We have applied certain limited procedures to the required supplementary information in accordance with auditing standards generally accepted in the United States of America, which consisted of inquiries of management about the methods of preparing the information and comparing the information for consistency with management’s responses to our inquiries, the basic financial statements, and other knowledge we obtained during our audit of the basic financial statements. We do not express an opinion or provide any assurance on the information because the limited procedures do not provide us with sufficient evidence to express an opinion or provide any assurance.
Other Information
Our audit was conducted for the purpose of forming opinions on the financial statements that collectively comprise Cherokee County, South Carolina’s basic financial statements. The introductory section, combining and individual nonmajor fund financial statements and schedules, the statistical section, and the compliance section as listed in the table of contents, are presented for purposes of additional analysis and are not a required part of the basic financial statements.
The combining and individual nonmajor fund financial statements and schedules and the compliance section as listed in the table of contents are the responsibility of management and were derived from and relate directly to the underlying accounting and other records used to prepare the basic financial statements. Such information has been subjected to the auditing procedures applied in the audit of the basic financial statements and certain additional procedures, including comparing and reconciling such information directly to the underlying accounting and other records used to prepare the basic financial statements or to the basic financial statements themselves, and other additional procedures in accordance with auditing standards generally accepted in the United States of America. In our opinion, the combining and individual nonmajor fund financial statements and schedules and the compliance section as listed in the table of contents are fairly stated in all material respects in relation to the basic financial statements as a whole.
The introductory and statistical sections have not been subjected to the auditing procedures applied in the audit of the basic financial statements and, accordingly, we do not express an opinion or provide any assurance on them.
Spartanburg, South Carolina December 28, 2017
(9)

MANAGEMENT’S DISCUSSION AND ANALYSIS
Our discussion and analysis of Cherokee County’s financial performance provides an overview of the County’s financial activities for the year ended June 30, 2017. This section should be read in conjunction with the financial statements.
FINANCIAL HIGHLIGHTS
The following are key financial highlights for the fiscal year:
The assets of the County exceeded its liabilities at June 30, 2017 by $51,380,828 (net position).This amount is greater than net investment in capital assets by $13,810,218. Net positioncategories show the portion that must be spent for specific purposes.
The County’s total net position decreased by $1,360,918 from governmental activities. As of June 30, 2017, the County’s governmental funds reported combined ending fund balances
of $42,517,038, a decrease of $1,924,759 (including $4,271,959 from the affiliated EconomicDevelopment Corporation) from the prior year. Of the combined ending fund balances amount,$24,735,237 is available for use at the County’s discretion.
At June 30, 2017, unassigned fund balance for the General Fund was $24,735,237, orapproximately 106 percent of total general fund expenditures and transfers out.
The County’s total long-term debt (excluding landfill closure costs, unfunded OPEB costs andcompensated absences) decreased by $630,000, or 10.2 percent in County obligations during thefiscal year.
OVERVIEW OF THE FINANCIAL STATEMENTS
This discussion and analysis is intended to serve as an introduction to the County’s basic financial statements. The County’s basic financial statements comprise four components: government-wide financial statements; fund financial statements; notes to the financial statements, and required supplementary information. This report also contains other supplementary information in addition to the basic financial statements.
Government-wide Financial Statements
The government-wide financial statements are designed to provide readers with a broad overview of Cherokee County’s finances, in a manner similar to a private-sector business.
The statement of net position presents information on all of Cherokee County’s assets and liabilities, with the difference of the two reported as net position. Over time, increases or decreases in net position may serve as a useful indicator of whether the financial position of Cherokee County is improving or deteriorating. Net position shows restrictions on these assets.
The statement of activities presents information showing how the County’s net position changed during the most recent fiscal year. All changes in net position are reported as soon as the underlying event giving rise to the change occurs, regardless of the timing of related cash flows. Thus, revenues and expenses are reported in this statement for some items that will result in cash flows in future fiscal periods.
Both of the government-wide financial statements distinguish functions of the County that are principally supported by taxes and intergovernmental revenues (governmental activities) from other functions that are intended to recover all or a significant portion of their costs through user fees and charges (business-type activities). Activity during this fiscal year was from governmental activities of the County that is comprised of general government, public safety, transportation, health and human services, environmental and housing, culture and recreation, economic development initiatives, and other.
(10)

Fund Financial Statements
A fund is a grouping of related accounts that is used to maintain control over resources that have been segregated for specific activities or objectives. The County, like other state and local governments, uses fund accounting to ensure and demonstrate compliance with finance-related legal requirements. All of the funds of the County can be divided into three categories: governmental funds, proprietary funds, and fiduciary funds.
Governmental Funds - Governmental funds are used to account for essentially the same functions reported as governmental activities in the government-wide financial statements. However, unlike the government-wide financial statements, governmental fund financial statements focus on near-term inflows and outflows. Such information may be useful in evaluating a government’s near-term financing requirements.
Because the focus of governmental funds is narrower than that of the government-wide financial statements, it is useful to compare the information presented for governmental funds with similar information presented for governmental activities in the government-wide financial statements. By doing so, readers may better understand the long-term impact of the government’s near-term financing decisions. Both the governmental fund balance sheet and the governmental fund statement of revenues, expenditures, and changes in fund balances provide a reconciliation to facilitate comparison between governmental funds and governmental activities.
Cherokee County maintains fifty-five individual governmental funds. Information is presented separately in the governmental fund balance sheet and in the governmental fund statement of revenues, expenditures, and changes in fund balances for the general and capital projects funds and economic development corporation, which are considered to be major funds. Data from the other fifty governmental funds are combined into a single, aggregated presentation. Individual fund data for each of these non-major governmental funds is provided in the form of combining statements elsewhere in this report.
The County adopts an annual appropriated budget for its general fund. A budgetary comparison statement has been provided for the general fund to demonstrate compliance with these budgets.
Fiduciary Funds - Fiduciary funds are used to account for resources held for the benefit of parties outside the government. Fiduciary funds are not reflected in the government-wide financial statements because resources of those funds are not available to support the County’s own programs. The accounting used for fiduciary funds is much like that used for proprietary funds, no operations but rather assets equal liabilities. The County is responsible for ensuring that the assets reported in these funds are used for their intended purposes.
Notes to the Financial Statements
The notes provide additional information that is essential to a full understanding of the data provided in the government-wide and fund financial statements.
Other Information
In addition to the basic financial statements and accompanying notes, this report also presents certain required supplementary information containing budget to actual comparisons for the general fund and information concerning the County’s progress in funding its obligation to provide OPEB benefits to its employees. The combining statements referred to earlier in connection with nonmajor governmental funds, fiduciary fund data, and capital asset data are presented following the required supplementary information section.
(11)

GOVERNMENT-WIDE FINANCIAL ANALYSIS
Table 1 Cherokee County’s Net Position
TotalPercentChange
2017 2016 2017 2016 2016-2017
Current and Other Assets 47,846,939$ 48,743,380$ 47,846,939$ 48,743,380$ -1.8%Capital Assets 43,120,610 42,537,598 43,120,610 42,537,598 1.4%
Total Assets 90,967,549 91,280,978 90,967,549 91,280,978 -0.3%Deferred outflow of resources
Deferred amounts related to pensions 3,552,628 1,902,148 3,552,628 1,902,148 86.8%Total assets and deferred outflows of resources 94,520,177 93,183,126 94,520,177 93,183,126 1.4%
Current Liabilities 24,833,856 21,419,327 24,833,856 21,419,327 15.9%Long-term Liabilities 18,305,493 19,022,053 18,305,493 19,022,053 -3.8%
Total Liabilities 43,139,349 40,441,380 43,139,349 40,441,380 6.7%Deferred inflow of resources
Deferred amounts related to pensions - - - - *Total liabilities and deferred outflows of resources 43,139,349 40,441,380 43,139,349 40,441,380 6.7%
Net Position Net invetment in capital assets 37,570,610 36,357,598 37,570,610 36,357,598 3.3% Restricted 9,971,317 8,555,119 9,971,317 8,555,119 16.6% Unrestricted 3,838,901 7,829,029 3,838,901 7,829,029 -51.0%
Total Net Position 51,380,828 52,741,746 51,380,828 52,741,746 -2.6%
Total Liabilities and Net Position 94,520,177$ 93,183,126$ 94,520,177$ 93,183,126$ 1.4%
ActivitiesGovernmental
Total
Net position. As noted earlier, net position may serve over time as a useful indicator of a government’s financial position. In the case of the County, assets exceeded liabilities by $51,380,828, as of June 30, 2017. (See Table 1). The largest portion of the County’s net position reflects its investment in capital assets (e.g. land, buildings, machinery and equipment, infrastructure), less any related debt, to acquire those assets, still outstanding. These capital assets are used to provide services to citizens; consequently these assets are not available for future spending. It should be noted that the resources required to repay the related debt must be provided from other sources, since the capital assets themselves cannot be used to liquidate these liabilities.
An additional portion of the County’s net position represents resources that are subject to external restrictions on how they may be used. The remaining balance of unrestricted net position may be used to meet the County’s ongoing obligations to citizens and creditors. The net position decreased by $1,360,918. This decrease was partially due to government activities such as investment in infrastructure and governmental operating activities.
(12)

GOVERNMENT-WIDE FINANCIAL ANALYSIS – continued Table 2
Changes in Cherokee County’s Net Position Total
Governmental Business-type Percent
Act ivit ies Act ivit ies Total Change
2017 2016 2017 2016* 2017 2016 2016-2017
Revenues:
Program Revenues:
Charges for services 2,588,280$ 3,579,677$ -$ 3,795,758$ 2,588,280$ 7,375,435$ -64.9%
Operat ing grants and
contribut ions 3,796,009 7,386,396 - - 3,796,009 7,386,396 -48.6%
Capital grants and
contribut ions 552,225 425,506 - - 552,225 425,506 29.8%
General Revenues: -
Property taxes 19,668,355 19,085,374 - - 19,668,355 19,085,374 3.1%
Other taxes 471,106 475,177 - - 471,106 475,177 -0.9%
Other 3,284,324 2,437,565 - - 3,284,324 2,437,565 34.7%
Total Revenues 30,360,299 33,389,695 - 3,795,758 30,360,299 37,185,453 -18.4%
Expenses:
General government 9,075,414 9,659,016 - - 9,075,414 9,659,016 -6.0%
Public safety 12,549,976 11,471,822 - - 12,549,976 11,471,822 9.4%
Transportat ion 4,730,303 1,694,096 - - 4,730,303 1,694,096 179.2%
Health and human services 1,022,910 1,024,905 - - 1,022,910 1,024,905 -0.2%
Environmental and housing 2,823,167 2,969,547 - - 2,823,167 2,969,547 -4.9%
Culture and recreat ion 1,309,948 913,265 - - 1,309,948 913,265 43.4%
Economic development 2,949 241,728 - - 2,949 241,728 -98.8%
Unallocated interest expense 206,550 227,403 - - 206,550 227,403 -9.2%
Geriatrics - - - 4,333,885 - 4,333,885 -100.0%
Total Expenses 31,721,217 28,201,782 - 4,333,885 31,721,217 32,535,667 -2.5%
Increase (Decrease) in Net
Posit ion Before Transfers (1,360,918) 5,187,913 - (538,127) (1,360,918) 4,649,786 -129.3%
Special Item - Sale of Peachtree Centre - - 14,208,725 - 14,208,725 *
Transfers - 11,653,320 - (11,653,320) - - *
Change in Net Posit ion (1,360,918) 16,841,233 - 2,017,278 (1,360,918) 18,858,511 -107.2%
Beginning Net Posit ion 52,741,746 35,900,513 - (2,017,278) 52,741,746 33,883,235 55.7%
Ending Net Posit ion 51,380,828$ 52,741,746$ -$ -$ 51,380,828$ 52,741,746$ -2.6%
* Fiscal year 2016 amounts are for a part ial year f rom July 1, 2015 to November 30, 2015. The sale date of Peachtree Centre to M FI HC Group was ef fect ive
as of December 1, 2015.
Change in net position. The County’s total revenues decreased by 18.4 percent to approximately $30.4 million, primarily as a result of the sale of the property of Peachtree Centre effective December 1, 2015, lower charges for services, and lower grants and contributions, partially offset by an increase in property taxes and other revenues (See Table 2).
(13)

GOVERNMENT-WIDE FINANCIAL ANALYSIS – continued The County’s total cost of all programs and services had a decrease of 2.5 percent. This decrease is due primarily to partial year expenses in 2016 from the business-type activities as a result of the sale of the Peachtree Centre property effective December 1, 2015, partially offset by increases in payroll and benefits expense, transportation expenditures, land purchased for the site location of the proposed VA nursing home facility and site improvements at the recreation district facilities. Governmental Activities The County’s governmental activities had net (expense) revenue of ($24,784,703). However, these services are intended to be primarily funded by taxes, as opposed to charges for services and grants, and those taxes and other general revenues. Expenses did exceed total revenues by $1,360,918. Total revenues for the County’s governmental activities decreased by 9.1 percent, and total expenses increased 12.5 percent. Factors contributing to these results included:
Increases in property taxes, due primarily to increased valuations resulting from construction and property purchases.
Decreases in fines, capital and operating grants partially for infrastructure reimbursements. Increases in payroll and benefits costs across all functions.
Increases in expenditures for improvement of transportation, recreation and veterans facilities.
(14)
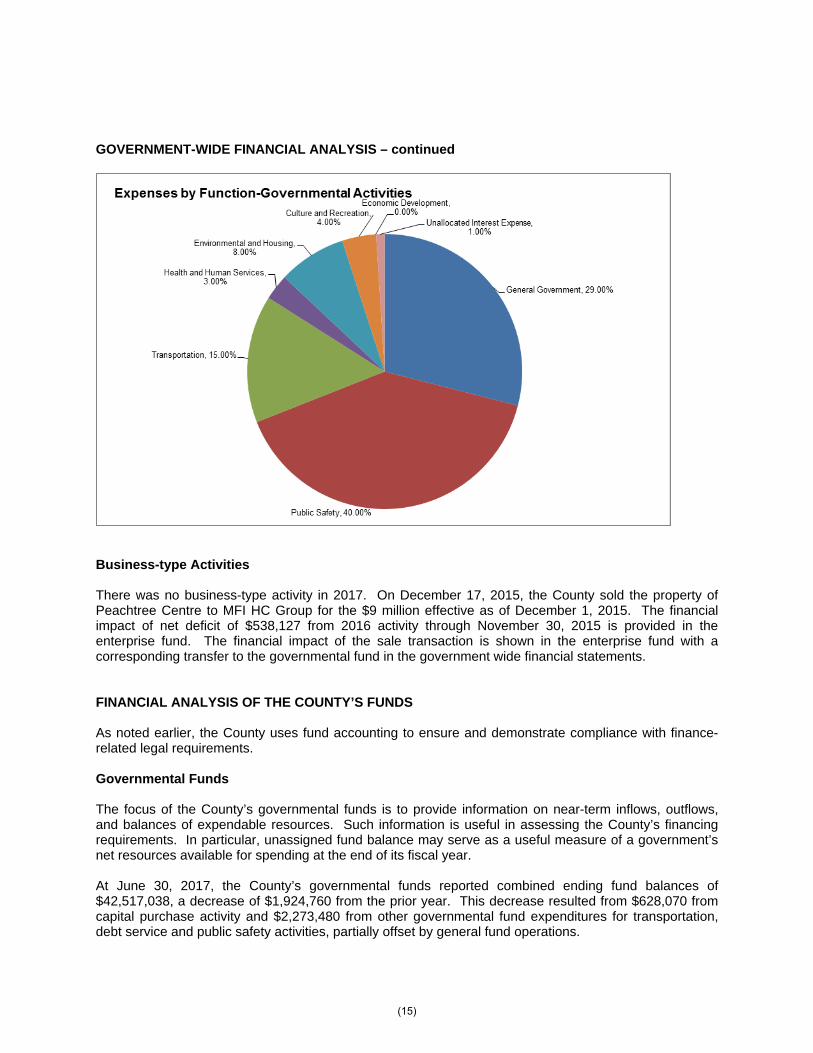
GOVERNMENT-WIDE FINANCIAL ANALYSIS – continued
Business-type Activities
There was no business-type activity in 2017. On December 17, 2015, the County sold the property of Peachtree Centre to MFI HC Group for the $9 million effective as of December 1, 2015. The financial impact of net deficit of $538,127 from 2016 activity through November 30, 2015 is provided in the enterprise fund. The financial impact of the sale transaction is shown in the enterprise fund with a corresponding transfer to the governmental fund in the government wide financial statements.
FINANCIAL ANALYSIS OF THE COUNTY’S FUNDS
As noted earlier, the County uses fund accounting to ensure and demonstrate compliance with finance-related legal requirements.
Governmental Funds
The focus of the County’s governmental funds is to provide information on near-term inflows, outflows, and balances of expendable resources. Such information is useful in assessing the County’s financing requirements. In particular, unassigned fund balance may serve as a useful measure of a government’s net resources available for spending at the end of its fiscal year.
At June 30, 2017, the County’s governmental funds reported combined ending fund balances of $42,517,038, a decrease of $1,924,760 from the prior year. This decrease resulted from $628,070 from capital purchase activity and $2,273,480 from other governmental fund expenditures for transportation, debt service and public safety activities, partially offset by general fund operations.
(15)

FINANCIAL ANALYSIS OF THE COUNTY’S FUNDS – continued Approximately 58 percent of the combined fund balances ($24,735,237) constitute unassigned fund balance, which is available for spending at the County’s discretion. Seventeen percent of the combined fund balances ($7,397,846) is assigned for various types of cultural, administrative and capital projects. The majority of the remaining balance is restricted ($9,970,065) to indicate that it is not available for new spending because it has constraints established by parties outside the government or by enabling legislation. The remainder of the balance is nonspendable; which is comprised of prepaids ($413,890). The general fund is the chief operating fund of the County. At June 30, 2017, unassigned fund balance of the general fund was $24,735,237 and total fund balance was $30,027,510. As a measure of the general fund’s liquidity, the unassigned fund balance represents approximately 107 percent of total general fund expenditures and transfers out. The capital fund has a total fund balance of $743,317, all of which is assigned for capital projects. The net decrease in fund balance during the current fiscal year was $628,070. Funds were primarily spent for capital assets and infrastructure improvements. Proprietary Funds The County’s proprietary funds provide the same type of information found in the government-wide financial statements but in more detail. On December 17, 2015, the County sold the property of Peachtree Centre, but the impact of activity from July 1 through November 30 2015 is provided in the enterprise fund in fiscal year 2016. The financial impact of the sale transaction is shown in the enterprise fund with a corresponding transfer to the governmental fund in the government wide financial statements. GENERAL FUND BUDGETARY HIGHLIGHTS A budget and actual comparison schedule for the General Fund is provided in the Required Supplementary Information. The schedule shows the original adopted budget, the final budget, the actual results on GAAP basis, and the variance between budget and actual. After the original budget is approved, it may be revised for a variety of reasons such as unforeseen circumstances, new bond or loan proceeds, new grant awards, or other unanticipated revenues. Actual revenues were higher than the projected amounts by $994,747 primarily due to increased charges for services and tax revenues. Actual expenditures were under budget by $92,808 due to the continued implementation of cost control measures in the general government, environmental and housing and transportation (roads and bridges), partially offset by increases in salary and related employee benefit costs, primarily due to the implementation of a compensation adjustment based on years of service that resulted in an overall increase in salary and related benefit expense, and expenditures for the upgrade of 911 (communications) equipment and services, infrastructure for the recreation facilities and land for the proposed VA Nursing Home. Certain expenditures for the 911 upgrade are qualified for reimbursement from funds in other government funds and recorded as a transfer in to offset the funds expended by the General Fund.
(16)

CAPITAL ASSET AND DEBT ADMINISTRATION
Capital Assets
At the end of June 30, 2017, the County had $77,851,411 invested in capital assets including police and fire equipment, buildings, infrastructure, etc. (See following table). Capital assets for government activities increased by of $3,793,317 or 5.1 percent, over last year.
Governmental Activities Totals Total Percent Change2017 2016 2017 2016 2016-2017
Land 1,688,895$ 1,688,895$ 1,688,895$ 1,688,895$ 0.0%Construction in Progress 497,845 - 497,845 - 0.0%Buildings 26,893,076 26,888,211 26,893,076 26,888,211 0.0%Other Improvements 625,303 547,760 625,303 547,760 14.2%Equipment 16,307,575 15,237,212 16,307,575 15,237,212 7.0%Infrastructure 30,734,984 28,650,816 30,734,984 28,650,816 7.3%Books 1,103,732 1,045,197 1,103,732 1,045,197 5.6%
Total Capital Assets 77,851,410$ 74,058,091$ 77,851,410$ 74,058,091$ 5.1%
Additional information on the County’s capital assets can be found in Note 3(C) to the financial statements.
Long-term Debt
At year-end, the County had $5,550,000 in outstanding general obligation bonds and capital leases, compared to $6,180,000 last year. That is a decrease of 10 percent as shown in the following table.
TotalPercentChange
2 017 2 016 20 17 20 16 2 017 2 016 20 16-2017
General Ob ligatio n Bond s 5,550 ,00 0$ 6 ,180 ,0 00$ -$ -$ 5,550 ,00 0$ 6 ,180 ,00 0$ -10 .2%
Total Lo ng -term Deb t 5,550 ,00 0$ 6 ,180 ,0 00$ -$ -$ 5,550 ,00 0$ 6 ,180 ,00 0$ -10 .2%
Go vernmental Bus iness-typeActivit ies Activit ies To tal
More detailed information about the County’s long-term liabilities is presented in Note 3(F) to the financial statements. Also, included in Note 3(F) is information related to the $4 million long-term loan payable of the affiliated Economic Development Corporation.
Other obligations of the County include accrued compensated absences, other post-employment benefits and landfill closure and post closure costs.
The state limit for amount of general obligation debt the County can issue is 8 percent of the assessed value of all taxable property within the County’s legal limits. Outstanding debt is below this limit – which is currently $13.81 million.
ECONOMIC FACTORS AND NEXT YEAR’S BUDGETS AND RATES
Local, national and international economic factors influence the County’s revenues. Positive economic growth is correlated with increased revenues from property taxes, sales taxes, charges for services, as well as state and federal grants. Economic growth in the local economy may be measured by a variety of indicators such as employment growth, unemployment, new construction and assessed valuation.
(17)

ECONOMIC FACTORS AND NEXT YEAR’S BUDGETS AND RATES – continued
One major factor is that, although it has declined, the unemployment rate for the County is currently 4.4%. This was higher than the unemployment rate for the state of South Carolina (3.9%) and higher than the national unemployment rate (4.1%).
All of these factors were considered in the approval of the County’s millage rate total property millage rate of 91.6 mills for 2016 and 2017. There was no millage increase in the 2018 approved budget.
Budgeted 2018 operations expenditures (excluding capital budgeted expenditures) are expected to increase by $1,870,074, which is 8.5 percent over the final 2017 budget. This increase is primarily due to the approval of a compensation increase based on years of service, additional positions, and increased health care premium and retirement cost increases for County employees. The County has added no major new programs or initiatives to the 2018 budget.
CONTACTING THE COUNTY’S FINANCIAL MANAGEMENT
This financial report is designed to provide our citizens, taxpayers, customers, and creditors with a general overview of the County’s finances and to show the County’s accountability for the money it receives. If you have questions about this report or need additional financial information, contact the County Administrator at 110 Railroad Avenue, Gaffney, South Carolina.
(18)


BASIC FINANCIAL STATEMENTS

GOVERNMENT-WIDE FINANCIAL STATEMENTS

Exhibit A
STATEMENT OF NET POSITIONJUNE 30, 2017
GovernmentalActivities
AssetsCash and cash equivalents 33,834,123$ Investments 7,584,769 Accounts receivable (net) 1,238,428 Taxes receivable (net) 1,227,213 Due from State 518,118 Assets held for sale 2,700,595 Prepaid items 412,439 Due from Recreation District 331,254 Capital assets - not being depreciated 2,186,740 Capital assets - net of accumulated depreciation 40,933,870
Total assets 90,967,549
Deferred Outflows of ResourcesDeferred amounts related to pensions 3,552,628
LiabilitiesAccounts payable 877,957 Accrued liabilities 461,379 Local option sales tax - property tax relief 3,415,155 Unearned revenue 117,189 Accrued interest payable 32,091 Noncurrent liabilities
Due within one year 1,458,628 Due in more than one year 18,305,493 Net pension liability 18,471,457
Total liabilities 43,139,349
Deferred Inflows of ResourcesDeferred amounts related to pensions -
Net PositionNet investment in capital assets 37,570,610 Restricted for
Transportation 812,863 Public safety 3,000,966 Economic development 4,271,759 Health and human services 325,557 Debt service 1,520,524 Cultural and recreation
Expendable 38,396 Nonexpendable 1,252
Unrestricted (deficit) 3,838,901
Total net position (deficit) 51,380,828$
The accompanying notes are an integral part of the financial statements.
CHEROKEE COUNTY, SOUTH CAROLINA
(19)
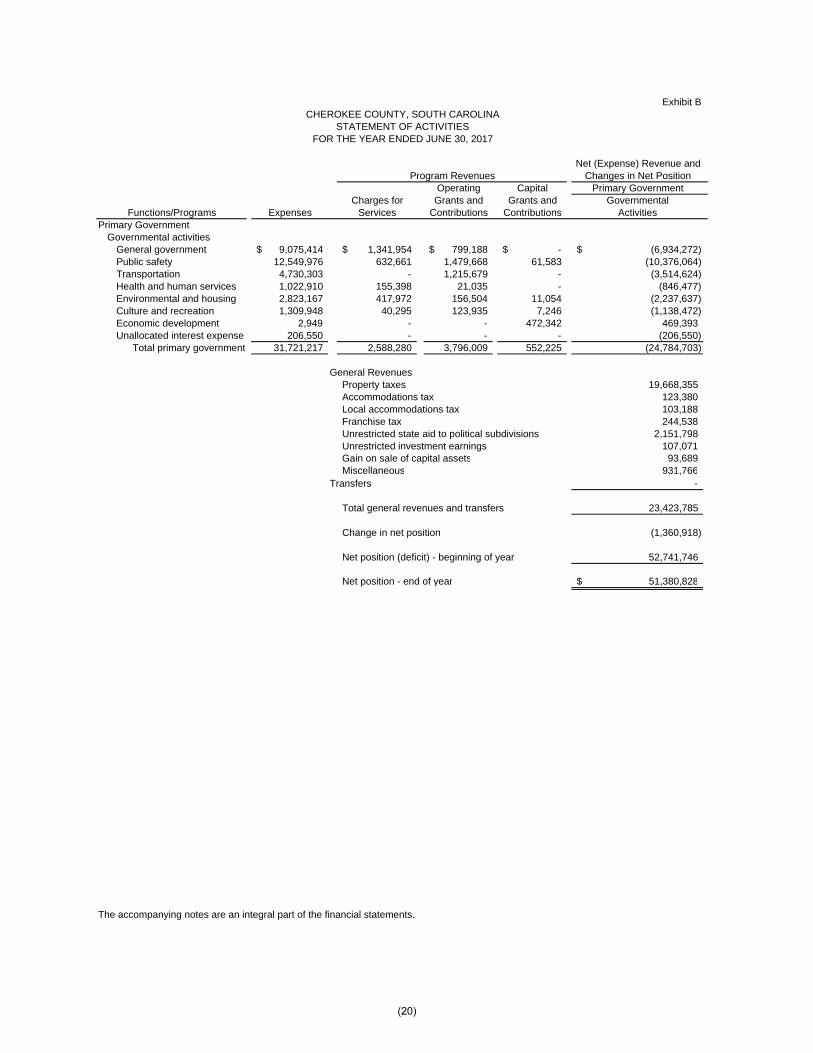
Exhibit B
STATEMENT OF ACTIVITIESFOR THE YEAR ENDED JUNE 30, 2017
Net (Expense) Revenue andProgram Revenues Changes in Net Position
Operating Capital Primary GovernmentCharges for Grants and Grants and Governmental
Functions/Programs Expenses Services Contributions Contributions ActivitiesPrimary Government
Governmental activitiesGeneral government 9,075,414$ 1,341,954$ 799,188$ -$ (6,934,272)$ Public safety 12,549,976 632,661 1,479,668 61,583 (10,376,064) Transportation 4,730,303 - 1,215,679 - (3,514,624) Health and human services 1,022,910 155,398 21,035 - (846,477) Environmental and housing 2,823,167 417,972 156,504 11,054 (2,237,637) Culture and recreation 1,309,948 40,295 123,935 7,246 (1,138,472) Economic development 2,949 - - 472,342 469,393 Unallocated interest expense 206,550 - - - (206,550)
Total primary government 31,721,217 2,588,280 3,796,009 552,225 (24,784,703)
General RevenuesProperty taxes 19,668,355 Accommodations tax 123,380 Local accommodations tax 103,188 Franchise tax 244,538 Unrestricted state aid to political subdivisions 2,151,798 Unrestricted investment earnings 107,071 Gain on sale of capital assets 93,689Miscellaneous 931,766
Transfers -
Total general revenues and transfers 23,423,785
Change in net position (1,360,918)
Net position (deficit) - beginning of year 52,741,746
Net position - end of year 51,380,828$
The accompanying notes are an integral part of the financial statements.
CHEROKEE COUNTY, SOUTH CAROLINA
(20)

FUND FINANCIAL STATEMENTS


Exhibit C
BALANCE SHEETGOVERNMENTAL FUNDS
JUNE 30, 2017
Capital Economic Other TotalProjects Development Governmental Governmental
Assets General Fund Corporation Funds FundsCash 27,105,381$ 3,162,113$ 1,679,825$ 9,471,573$ 41,418,892$ Taxes receivable (net) 1,080,105 35,745 - 111,364 1,227,214 Other receivables (net) 644,606 - - 593,822 1,238,428 Due from other funds 5,989,098 - - 789,487 6,778,585 Due from State 518,118 - - - 518,118 Prepaid items 399,912 - 200 12,527 412,639 Due from Recreation District - 331,254 - - 331,254 Assets held for resale - - 2,700,595 - 2,700,595
Total assets 35,737,220$ 3,529,112$ 4,380,620$ 10,978,773$ 54,625,725$
LiabilitiesAccounts payable 730,071$ -$ -$ 26,834$ 756,905$ Due to other funds 683,669 2,756,701 108,661 3,229,554 6,778,585 Accrued expenditures 431,634 - - 29,745 461,379 Other liabilities 117,176 - - - 117,176 Local option sales tax - property tax relief 3,415,155 - - - 3,415,155 Unearned revenue - - - 117,189 117,189
Total liabilities 5,377,705 2,756,701 108,661 3,403,322 11,646,389
Deferred Inflows of ResourcesUnavailable revenues - property taxes 332,005 29,094 - 101,199 462,298
Fund BalancesNonspendable
Prepaids 399,912 - 200 13,778 413,890 Restricted for:
Library activities - - - - - Emergency communications - - - 1,855,406 1,855,406 Law enforcement - - - 290,107 290,107 Health and welfare - - - 59,284 59,284 Road surface repairs - - - 812,863 812,863 Culture and recreation - - - 38,396 38,396 Social services - - - 266,273 266,273 Public safety - - - 104,935 104,935 Economic development - - 4,271,759 - 4,271,759 Solicitor - - - 739,360 739,360 Other purposes - - - 11,158 11,158 Debt service - - - 1,520,524 1,520,524
AssignedUnfunded OPEB 2,669,536 - - - 2,669,536 Road surface repairs 1,422,446 - - - 1,422,446 County buildings - 331,254 - 331,254 Airport - 255,102 - 255,102 Capital projects - 156,961 - - 156,961 Administration 20,250 - 141,938 162,188 GIS mapping - - - - Emergency communications - - - 28,721 28,721 C&D landfill 25,000 - - - 25,000 Matching Grant 400,000 400,000 Scholarship SCC 55,129 - - - 55,129 Public safety - - - 382,570 382,570 Economic development 300,000 - - - 300,000 Library - - - 1,208,939 1,208,939
Unassigned 24,735,237 - - - 24,735,237 Total fund balance 30,027,510 743,317 4,271,959 7,474,252 42,517,038
Total liabilities, deferred inflows of resources and fund balances 35,737,220$ 3,529,112$ 4,380,620$ 10,978,773$ 54,625,725$
The accompanying notes are an integral part of the financial statements.
CHEROKEE COUNTY, SOUTH CAROLINA
(21)

Exhibit DCHEROKEE COUNTY, SOUTH CAROLINA
RECONCILIATION OF THE TOTAL GOVERNMENTAL FUNDS BALANCE SHEET TOTHE STATEMENT OF NET POSITION
JUNE 30, 2017
Fund Balances - Total Governmental Funds 42,517,038$
Amounts reported for governmental activities in the statement of netposition are different because:
Capital assets used in governmental activities are not financial resources and, therefore, are not reported in the governmental funds. 43,120,610
Resources received but reflected as unearned revenues in fund statements. 458,223
Long-term liabilities, including bonds payable, are not due and payable in the current period and therefore not reported in the governmental funds.
Other post employment benefits (2,342,800) General obligation bonds (5,550,000) Loan payable (4,000,000) Compensated absences (407,941) Accrual for landfill closure (7,463,382) Accrued interest payable (32,091) (19,796,214)
Pension related deferred outflows 3,552,628
Net Pension Liability (18,471,457)
Net Position of Governmental Activities 51,380,828$
The accompanying notes are an integral part of the financial statements.
(22)

Exhibit E
STATEMENT OF REVENUES, EXPENDITURES AND CHANGES IN FUND BALANCESGOVERNMENTAL FUNDS
FOR THE YEAR ENDED JUNE 30, 2017
Capital Economic Other TotalProjects Development Governmental Governmental
General Fund Corporation Funds FundsRevenues
Taxes 14,333,258$ 1,109,063$ -$ 3,282,011$ 18,724,332$ Licenses and permits 246,684 - - - 246,684Intergovernmental 3,560,717 - - 3,695,647 7,256,364Charges for services 888,316 - - 38,016 926,332Fines 598,771 - - - 598,771Contributions - - 472,004 - 472,004Interest 92,996 14,061 338 33 107,428Miscellaneous 932,504 - 1,099,202 2,031,706
20,653,246 1,123,124 472,342 8,114,909 30,363,621
ExpendituresCurrent
General government 7,171,255 - - 624,658 7,795,913Public safety 10,208,411 - - 2,175,116 12,383,527Transportation 943,044 - - 4,736,428 5,679,472Health and human services 870,894 - - 116,548 987,442Environmental and housing 3,177,126 - - 13,716 3,190,842Culture and recreation 333,733 - - 879,702 1,213,435Economic development - - 2,949 - 2,949
Capital outlay - 1,777 - 292,003 293,780Debt service
Principal retirement - - - 630,000 630,000Interest and fiscal charges - - - 210,120 210,120
22,704,463 1,777 2,949 9,678,291 32,387,480
Excess (Deficiency) of Revenues Over Expenditures (2,051,217) 1,121,347 469,393 (1,563,382) (2,023,859)
Other Financing Sources (Uses)Sale of capital assets 99,098 - - - 99,098Transfers in 3,295,516 - - 836,792 4,132,308Transfers out (557,000) (1,749,417) (279,000) (1,546,890) (4,132,307)
2,837,614 (1,749,417) (279,000) (710,098) 99,099
Net Change in Fund Balances 786,397 (628,070) 190,393 (2,273,480) (1,924,760)
Fund Balances - Beginning of Year 29,241,113 1,371,387 4,081,566 9,747,732 44,441,798
Fund Balances - End of Year 30,027,510$ 743,317$ 4,271,959$ 7,474,252$ 42,517,038$
The accompanying notes are an integral part of the financial statements.
CHEROKEE COUNTY, SOUTH CAROLINA
(23)

Exhibit F
Net Change in Fund Balance - Total Governmental Funds (1,924,760)$
Amounts reported for governmental activities in the statement of activitiesare different because:
Governmental funds report capital outlay as expenditures. However, in the statement of activities, the cost of those assets is allocated over their estimated useful lives and reported as depreciation expense. This is the amount by which capital outlay exceeded depreciation in the current period.
Capital outlay 4,153,936 Depreciation expense (3,565,514) 588,422
In the statement of activities, only the gain on the sale of assets is reported whereas in the governmental funds, the proceeds from the sale increase financial resources. Thus, the change in net position differs from the change in fund balances by the net book value of the assets sold or contributed:
Net book value of asset dispositions (5,410)
Revenues in the statement of activities that do not provide current financial resources are not reported as revenues in the funds.
Property taxes 39,819
Repayment of debt principal is an expenditure in the governmental funds, but the repayment reduces long-term liabilities in the statement of net position. Principal repayments: General obligation bonds 630,000
Some expenses recorded in the statement of activities do not require the use of current financial resources and, therefore, are not reported as expenditures in governmental funds.
Change in accrued interest payable 3,570 Change in compensated absences (15,504) Change in unfunded OPEB costs (109,100) Change in landfill closure/post closure costs 167,921 46,887
The cost of pension benefits earned net of employee contributions isreported in the Statement of Activities as an element of pension expense. The fund financial statements report pension contributions as expenditures. (735,876)
Change in Net Position of Governmental Activities (1,360,918)$
The accompanying notes are an integral part of the financial statements.
TO THE STATEMENT OF ACTIVITIESFOR THE YEAR ENDED JUNE 30, 2017
CHEROKEE COUNTY, SOUTH CAROLINARECONCILIATION OF THE STATEMENT OF REVENUES, EXPENDITURES
AND CHANGES IN FUND BALANCES OF GOVERNMENTAL FUNDS
(24)

Exhibit GCHEROKEE COUNTY, SOUTH CAROLINA
STATEMENT OF FIDUCIARY NET POSITIONAGENCY FUNDS
JUNE 30, 2017
Assets
Cash 36,423,570$ Other receivables 30,467 Taxes receivable (net) 1,344,722
Total Assets 37,798,759$
Liabilities
Due to designated recipients 37,798,759$
Total Liabilities 37,798,759$
The accompanying notes are an integral part of the financial statements.
(25)


CHEROKEE COUNTY, SOUTH CAROLINA NOTES TO FINANCIAL STATEMENTS
JUNE 30, 2017
INDEX
Page 1 – Summary of Significant Accounting Policies A. Reporting Entity 27 B. Basis of Presentation 27-29 C. Measurement Focus and Basis of Accounting 29-32 D. Assets, Liabilities Deferred Outflows/Inflows of Resources and Net Position Or Equity 32-36 2 – Stewardship, Compliance and Accountability
A. Budgets and Budgetary Accounting 37 B. Encumbrances 37
C. Excess of Expenditures Over Appropriations 37-38
3 – Detailed Notes On Government-wide and Fund Financial Statements
A. Cash Deposits and Investments 38-39 B. Taxes Receivable 39-40
C. Capital Assets 41
D. Interfund Receivables, Payables and Transfers 42
E. Operating Lease Commitments 43 F. Long-term Debt 43-44
G. Landfill Closure and Post Closure Care Costs 45
4 – Other Information
A. Risk Management 45 B. Commitments and Contingencies 46
C. Deferred Compensation Plans 46
D. Pension Plans 57-54
E. Post Employment Health Insurance Benefits 55-56
5 – Tax Abatements 67-58 6 – Subsequent Events 58
(26)


CHEROKEE COUNTY, SOUTH CAROLINA NOTES TO FINANCIAL STATEMENTS
JUNE 30, 2017
NOTE 1 - SUMMARY OF SIGNIFICANT ACCOUNTING POLICIES A. Reporting Entity Cherokee County, South Carolina (the County) operates under Home Rule legislation effective July 1,
1976. The County operates under a Council-Administrator form of government and provides the following services as authorized by its charter: Public safety (police and fire), highway and street maintenance, sanitation, health and social services, culture-recreation, public improvements, and general administration services.
Cherokee County is a corporate government entity incorporated under the South Carolina Home Rule
Act and is governed by an elected seven member County Council. These financial statements present the government as required by accounting principles generally accepted in the United States of America. As required by U.S. generally accepted accounting principles, these basic financial statements present the government and its component units, entities for which the government is considered to be financially accountable. A blended component unit, although a legally separate entity is, in substance, part of the County’s operations, and data from the units are presented in the capital projects funds and economic development corporation entity within the County’s governmental activities. The County has no discretely presented component units. The following entity is presented as a blended component unit:
Cherokee County Economic Development Corporation – The Corporation is a non-profit corporation established under State law, of which the County is the sole corporate member as identified in the corporation’s bylaws. The Corporation is organized to develop and implement, for the specific benefit of the County, economic development strategies for commercial, industrial, residential and other development.
The County’s comprehensive annual financial report includes the accounts of all County operations.
The financial statements of Cherokee County, South Carolina, have been prepared in conformity with U.S. generally accepted accounting principles (GAAP) as applied to governmental units. The Governmental Accounting Standards Board (GASB) is the accepted standard-setting body for establishing governmental accounting and financial reporting principles. The more significant of the government's accounting policies are described below.
B. Basis of Presentation The County’s financial statements consist of government-wide statements, including a statement of
net position and a statement of activities, and fund financial statements, which provide a more detailed level of financial information. The accounts of the County are organized and operated on the basis of funds. A fund is an independent fiscal and accounting entity with a self-balancing set of accounts. Fund accounting segregates funds according to their intended purpose and is used to aid management in demonstrating compliance with finance-related legal and contractual provisions. There are three categories of funds: governmental, proprietary and fiduciary.
Government-wide Financial Statements:
The statement of net position and the statement of activities display information about the County as a whole. These statements include the financial activities of the primary government, except for fiduciary funds. The statements distinguish between those activities of the County that are governmental and those that are considered business-type activities.
(27)

CHEROKEE COUNTY, SOUTH CAROLINA NOTES TO FINANCIAL STATEMENTS - CONTINUED
JUNE 30, 2017
NOTE 1 - SUMMARY OF SIGNIFICANT ACCOUNTING POLICIES - Continued B. Basis of Presentation - Continued Government-wide Financial Statements: - Continued
The statement of net position presents the financial condition of the governmental activities for the County at year end. The statement of activities presents a comparison between direct expenses and program revenues for each program and function of the County’s governmental activities. Direct expenses are those that are specifically associated with a service, program or department and therefore clearly identifiable to a particular function. Program revenues include charges paid by the recipient for the goods and services offered by the program, grants and contributions that are restricted to meeting the operational or capital requirements of a particular program, and the interest earned on grants that is required to be used to support a particular program. Revenues, which are not classified as program revenues, and all taxes, are presented as general revenues of the County, with certain limited exceptions. The comparison of direct expenses with program revenues identifies the extent to which each business segment or governmental function is self-financing or draws from the general revenues of the County.
Fund Financial Statements: The County segregates transactions related to certain County functions or activities in separate funds
in order to aid financial management and to demonstrate legal compliance. Fund financial statements are designed to present financial information of the County at this more detailed level. The focus of governmental and enterprise fund financial statements is on major funds. Each major fund is presented in a single column. Non-major funds are aggregated and presented in a single column. Fiduciary funds are reported by type.
The County reports the following governmental fund types:
General Fund - The General Fund is the general operating fund of the County. It is used to account for all financial resources except those required to be accounted for in another fund.
Special Revenue Funds - The special revenue funds are used to account for and report the proceeds of specific revenue sources that are restricted or committed to expenditures for specified purposes other than debt service or capital projects. The term “proceeds of specific revenue sources” establishes that one or more specific restricted or committed revenues should be the foundation for a special revenue fund.
Debt Service Funds - The debt service funds are used to account for and report financial resources that are restricted, committed, or assigned to expenditure for principal and interest.
Capital Projects Funds - The capital projects funds are used to account for and report financial resources that are restricted, committed, or assigned to expenditure for capital outlays, including the acquisition or construction of capital facilities and other capital assets. Capital projects funds exclude those types of capital related outflows financed by proprietary funds or for assets that will be held in trust for individuals, private organizations or other governments.
(28)

CHEROKEE COUNTY, SOUTH CAROLINA NOTES TO FINANCIAL STATEMENTS - CONTINUED
JUNE 30, 2017
NOTE 1 - SUMMARY OF SIGNIFICANT ACCOUNTING POLICIES - Continued B. Basis of Presentation - Continued
Fund Financial Statements: - Continued
The County has the following major capital projects funds:
1. Capital Projects Fund – is used to account for funds to be used for the acquisition or construction of capital facilities and other capital assets.
2. Economic Development Corporation Fund – is used to account for the acquisition and
construction of facilities or infrastructure for the promotion of economic development within the County.
Additionally, the County reports the following fund type:
Fiduciary Fund - Fiduciary fund reporting focuses on net position and changes in net position. The fiduciary fund category is split into four classifications: pension trust funds, investment trust funds, private-purpose trust funds and agency funds. The agency fund is custodial in nature (assets equals liabilities) and does not involve measurement of results of operations. The County’s fiduciary fund category includes agency funds for education, clerk of court, family court, property taxes, magistrates, and others.
C. Measurement Focus and Basis of Accounting
The accounting and financial reporting treatment applied to a fund is determined by its measurement focus. Basis of accounting determines when transactions are recorded in the financial records and reported on the financial statements. Government-wide financial statements are prepared using the accrual basis of accounting. Governmental funds use the modified accrual basis of accounting. Proprietary and fiduciary funds also use the accrual basis of accounting. Differences in the accrual and the modified accrual basis of accounting arise in the recognition of revenue, the recording of unearned revenue, and in the presentation of expenses versus expenditures. Government-wide Financial Statements The government-wide financial statements are reported using the economic resources management focus and the accrual basis of accounting, as are the proprietary fund and fiduciary fund financial statements. Revenues are recorded when earned and expenses are recorded when a liability is incurred, regardless of the timing of related cash flows. Property taxes are recognized as revenues in the year for which they are levied. Grants and similar items are recognized as revenue as soon as all eligibility requirements imposed by the provider have been met. All assets and liabilities associated with the operation of the County are included on the statement of net position.
(29)

CHEROKEE COUNTY, SOUTH CAROLINA NOTES TO FINANCIAL STATEMENTS - CONTINUED
JUNE 30, 2017
NOTE 1 - SUMMARY OF SIGNIFICANT ACCOUNTING POLICIES - Continued C. Measurement Focus and Basis of Accounting – Continued
Government-wide Financial Statements – continued As a general rule the effect of interfund activity has been eliminated from the government-wide financial statements. Exceptions to this general rule are charges between the government's enterprise funds functions and various other functions of the government. Elimination of these charges would distort the direct costs and program revenues reported for the various functions concerned. Amounts reported as program revenues include (1) charges to customers or applicants for goods, services, or privileges provided, (2) operating grants and contributions, and (3) capital grants and contributions. Internally dedicated resources are reported as general revenues rather than as program revenues. Likewise, general revenues include all taxes.
Fund Financial Statements
All governmental funds are accounted for using a flow of current financial resources measurement focus and the modified accrual basis of accounting. Revenues are recognized when they are both measurable and available. Revenues are considered to be available when they are collectible within the current period or soon enough thereafter to pay liabilities of the current period. For this purpose, the government considers revenues to be available if they are collected within sixty days of the end of the current fiscal period. Expenditures generally are recorded when a liability is incurred, as under accrual accounting. However, debt service expenditures, as well as expenditures related to compensated absences and claims and judgments, are recorded only when payment is due.
Property taxes, licenses, and interest are susceptible to accrual. Taxes collected and held by the state at year end on behalf of the County are also recognized as revenue. Other receipts and taxes become measurable and available when cash is received by the County and are recognized as revenue at that time.
With this measurement focus, only current assets and current liabilities generally are included on the balance sheet. The statement of revenues, expenditures and changes in fund balances reports on the sources (i.e., revenues and other financing sources) and uses (i.e., expenditures and other financing uses) of current financial resources. This approach differs from the manner in which the governmental activities of the government-wide financial statements are prepared. Governmental fund financial statements therefore include a reconciliation with brief explanations to better identify the relationship between the government-wide statements and the statements for governmental funds. Like the government-wide statements, all proprietary fund types are accounted for on a flow of economic resources measurement focus. All assets and all liabilities associated with the operation of these funds are included on the statement of net position. The statement of changes in fund net position presents increases (i.e., revenues) and decreases (i.e., expenses) in net total assets. The statement of cash flows provides information about how the County finances and meets the cash flow needs of its proprietary activities.
(30)

CHEROKEE COUNTY, SOUTH CAROLINA NOTES TO FINANCIAL STATEMENTS - CONTINUED
JUNE 30, 2017
NOTE 1 - SUMMARY OF SIGNIFICANT ACCOUNTING POLICIES - Continued C. Measurement Focus and Basis of Accounting - Continued
Fund Financial Statements - continued
Proprietary funds distinguish operating revenues and expenses from nonoperating items. Operating revenues and expenses generally result from providing services and producing and delivering goods in connection with a proprietary fund's principal ongoing operations. The principal operating revenues of the County enterprise funds are charges to customers for sales and services. Operating expenses for enterprise funds include the cost of sales and services, administrative expenses, and depreciation on capital assets. All revenues and expenses not meeting this definition are reported as nonoperating revenues and expenses. Agency funds have no measurement focus, but rather are custodial in nature (assets equal liabilities). Revenue - Exchange and Non-exchange Transactions
Revenue resulting from exchange transactions, in which each party gives and receives essentially equal value, is recorded on the accrual basis when the exchange takes place. On a modified accrual basis, revenue is recorded in the fiscal year in which the resources are measurable and become available. Available means that the resources will be collected within the current fiscal year or are expected to be collected soon enough thereafter to be used to pay liabilities of the current fiscal year. For the County, available means expected to be received within sixty days of fiscal year-end. Non-exchange transactions, in which the County receives value without directly giving equal value in return, include property taxes, grants, entitlements and donations. On an accrual basis, revenue from property taxes is recognized in the fiscal year for which the taxes are levied. Revenue from grants, entitlements and donations is recognized in the fiscal year in which all eligibility requirements have been satisfied. Eligibility requirements include timing requirements, which specify the year when the resources are required to be used or the year when use is first permitted, matching requirements, in which the County must provide local resources to be used for a specified purpose, and expenditure requirements, in which the resources are provided to the County on a reimbursement basis. On a modified accrual basis, revenue from non-exchange transactions must also be available before it can be recognized. Under the modified accrual basis, the following revenue sources are considered to be both measurable and available at year-end: delinquent taxes, sales tax, grants, interest, fees and charges for services. Revenue resulting from exchange transactions, in which each party gives and receives essentially equal value, is recorded on the accrual basis when the exchange takes place. On a modified accrual basis, revenue is recorded in the fiscal year in which the resources are measurable and become available. Available means that the resources will be collected within the current fiscal year or are expected to be collected soon enough thereafter to be used to pay liabilities of the current fiscal year. For the County, available means expected to be received within sixty days of fiscal year-end.
(31)

CHEROKEE COUNTY, SOUTH CAROLINA NOTES TO FINANCIAL STATEMENTS - CONTINUED
JUNE 30, 2017
NOTE 1 - SUMMARY OF SIGNIFICANT ACCOUNTING POLICIES - Continued C. Measurement Focus and Basis of Accounting - Continued Unearned Revenue
The County reports unearned revenue on its statement of net position and governmental funds balance sheet. In both the government-wide and governmental fund statements, resources received that are “intended to finance” a future period are reported as unearned revenue. In subsequent periods, the liability for unearned revenue is removed from the statement of net position and governmental funds balance sheet and revenue is recognized.
Expenses/Expenditures
On the accrual basis of accounting, expenses are recognized at the time they are incurred. The measurement focus of governmental fund accounting is on decreases in net financial resources (expenditures) rather than expenses. Expenditures are generally recognized in the accounting period in which the related fund liability is incurred, if measurable. Allocations of cost, such as depreciation and amortization, are not recognized in the governmental funds.
D. Assets, Liabilities, Deferred Outflows/Inflows of Resources and Net Position or Equity Cash and Investments
The County pools the cash of substantially all special revenue funds into an internal cash pool that is available for use by all special revenue funds. Each individual fund’s portion of the pool is displayed on the combined balance sheet as cash. The Cherokee County Public Library and the Cherokee County Development Board maintain separate cash and investment accounts, generally in the form of cash in the bank and certificates of deposit. Investments with a readily determined fair value are stated at fair value which approximates cost. State statutes authorize the County to invest in obligations of the United States and its agencies, general obligations (not revenue obligations) of the State of South Carolina and its political subdivisions, savings and loan associations to the extent of federal insurance, certificates of deposits collaterally secured, repurchase agreements secured by the foregoing obligations, and the State Treasurer’s Investment Pool
Receivables
All trade and property taxes receivable are shown net of an allowance for uncollectibles.
(32)

CHEROKEE COUNTY, SOUTH CAROLINA NOTES TO FINANCIAL STATEMENTS - CONTINUED
JUNE 30, 2017
NOTE 1 - SUMMARY OF SIGNIFICANT ACCOUNTING POLICIES - Continued
D. Assets, Liabilities, Deferred Outflows/Inflows of Resources and Net Position or Equity -
Continued Intergovernmental Receivable
Amounts due from federal grants represent reimbursable costs, which have been incurred by the County but have not been reimbursed by the grantor agency. Costs under grant programs are recognized as expenditures in the period in which they are incurred by the County.
Prepaid Items
Certain payments to vendors reflect costs applicable to future accounting periods and are recorded as prepaid items. Reported prepaid items in the Governmental Fund Types are equally offset by a fund balance reserve which indicates that they do not constitute “available spendable resources” even though they are a component of net current assets.
Capital Assets
Capital assets, which include property, plant, equipment, and infrastructure assets (e.g. roads, bridges, sidewalks, and similar items), are reported in the applicable governmental columns in the government-wide financial statements. The County defines capital assets as assets with an initial, individual cost of more than $5,000 and an estimated useful life in excess of two years. Such assets are recorded at historical cost or estimated historical cost if purchased or constructed. Donated capital assets, donated works of art and similar items, and capital assets received in a service concession arrangement should be reported at acquisition value rather than fair value. The costs of normal maintenance and repairs that do not add to the value of the asset or materially extend an asset’s life are not capitalized by governmental. Major outlays for capital assets and improvements are capitalized as projects are constructed. The amount of interest to be capitalized is calculated by offsetting interest expense incurred from the date of the borrowing until completion of the project with interest earned on invested proceeds over the same period. All reported capital assets except land are depreciated. Improvements are depreciated over the remaining useful lives of the related capital assets. Depreciation is computed using the straight-line method over the following useful lives:
AssetsBuildings 40 - 45Improvements other than buildings 5 - 10Machinery and equipment 3 - 15Infrastructure 20 - 40Books 5 - 10
Years
(33)

CHEROKEE COUNTY, SOUTH CAROLINA NOTES TO FINANCIAL STATEMENTS - CONTINUED
JUNE 30, 2017
NOTE 1 - SUMMARY OF SIGNIFICANT ACCOUNTING POLICIES - Continued
D. Assets, Liabilities, Deferred Outflows/Inflows of Resources and Net Position or Equity -
Continued Deferred Inflows/Outflows of Resources
In addition to assets, the statement of financial position includes a separate section for deferred outflows of resources. This separate financial statement element, deferred outflows of resources, represents a consumption of net position that applies to a future period(s) and so will not be recognized as an outflow of resources (expense/expenditure) until then. The County’s only deferred outflows of resources are related to pensions.
In addition to liabilities, the statement of financial position includes a separate section for deferred
inflows of resources. This separate financial statement element, deferred inflows of resources, represents an acquisition of net position that applies to a future period(s) and so will not be recognized as an inflow of resources (revenue) until then. The County has two types of items that qualify for reporting in this category. The net property taxes receivable estimated to be collectible in more than 60 days subsequent to June 30, 2017 and deferred amounts related to pensions are reported as deferred inflows of resources.
Compensated Absences The County’s annual leave policy allows accumulation, with supervisor approval, of a maximum of
four weeks vacation to be paid to employees upon termination. Sick leave can be accumulated, up to a maximum of sixty days, but it is not paid upon termination. There is no liability for unpaid accumulated sick leave since the County does not have a policy to pay any amounts when employees separate from service with the County. All vacation pay is recorded when accrued by the employee in the government-wide financial statements. The general fund is typically used to liquidate the liability for compensated absences.
Long-term Obligations In the government-wide financial statements, long-term debt and other long-term obligations are
reported as liabilities in the statement of net position. Bond premiums and discounts are deferred and amortized over the life of the bonds using the effective interest method. Bonds payable are reported net of the applicable bond premium or discount. In the fund financial statements, governmental fund types recognize bond premiums and discounts, as well as bond issuance costs, during the current period. The face amount of the debt is reported as other financing sources. Premiums received on debt issuances are reported as other financing sources while discounts on debt issuances are reported as other financing uses. Issuance costs, whether or not withheld from the actual debt proceeds received, are reported as debt service expenditures.
Net Position and Fund Balances
The governmental fund financial statements present fund balances based on classifications that comprise a hierarchy that is based primarily on the extent to which the County is bound to honor constraints on the specific purposes for which amounts in the respective governmental funds can be spent.
(34)

CHEROKEE COUNTY, SOUTH CAROLINA NOTES TO FINANCIAL STATEMENTS - CONTINUED
JUNE 30, 2017
NOTE 1 - SUMMARY OF SIGNIFICANT ACCOUNTING POLICIES - Continued
D. Assets, Liabilities, Deferred Outflows/Inflows of Resources and Net Position or Equity -
Continued Net Position and Fund Balances – continued
The classifications used in the governmental fund financial statements are as follows:
Nonspendable – This classification includes amounts that cannot be spent because they are either a) not in spendable form or b) are legally or contractually required to be maintained intact. The County has classified assets held for resale, inventories, prepaid items, and long-term portions of receivables and advances as being nonspendable as these items are not expected to be converted to cash or are not expected to be converted to cash within the next current fiscal year.
Restricted - This classification includes amounts for which constraints have been placed on the use of the resources through either a) externally imposed by creditors (such as through a debt covenant), grantors, contributors, or laws or regulations of other governments or b) imposed by law through constitutional provisions or enabling legislation.
Committed - This classification includes amounts that can only be used for specific purposes pursuant to constraints determined by a formal action of the government’s highest level of decision making authority. County Council is the highest level of decision–making authority for the government that can, by adoption of an ordinance, commit fund balance. Once adopted, the limitation imposed by the ordinance remains in place until a similar action is taken (the adoption of another ordinance) to remove or revise the limitation. This classification also includes contractual obligations to the extent that existing resources have been specifically committed for use in satisfying those contractual requirements. Assigned - This classification includes amounts that are constrained by the County’s intent to be used for a specific purpose but are neither restricted nor committed. This intent can be expressed by the County Council or by an official or body to which the County Council delegates authority. County Council has delegated this authority to the Assistant County Administrator. This classification captures fund balance held to meet anticipated expenditures of budget carryforwards, except where other external constraints or Council ordinances require that the fund balance be classified as restricted or committed. Unassigned - This classification includes the residual fund balance for the General Fund. The unassigned classification also includes negative residual fund balances of any other governmental fund that cannot be eliminated by the offsetting of assigned fund balance amounts.
The County first applies restricted resources when an expense is incurred for purposes for which both
restricted and unrestricted net position is available.
The County would typically use restricted fund balances first, followed by committed resources and then assigned resources, as appropriate opportunities arise, but reserves the right to selectively spend unassigned resources first and to defer the use of those other classified funds.
Proprietary fund equity is classified the same as in the government-wide statements.
(35)

CHEROKEE COUNTY, SOUTH CAROLINA NOTES TO FINANCIAL STATEMENTS - CONTINUED
JUNE 30, 2017
NOTE 1 - SUMMARY OF SIGNIFICANT ACCOUNTING POLICIES - Continued D. Assets, Liabilities, Deferred Outflows/Inflows of Resources and Net Position or Equity -
Continued Net Position
The County’s total assets and deferred outflows of resources less total liabilities and deferred inflows of resources represent net position. Net investment in capital assets consists of capital assets, net of accumulated depreciation, reduced by the outstanding balances of any borrowing used for the acquisition, construction or improvements of those assets. Net position is reported as restricted when there are limitations imposed on their use either through the enabling legislation adopted by the County or through external restrictions imposed by creditors, grantors, laws, or regulations of other governments.
Accounting Estimates
The financial statements include estimates and assumptions that affect the reported amounts of assets and liabilities, disclosure of contingent assets and liabilities, and the reported amounts of revenues and expenditures. Actual results could differ from these estimates.
Reclassifications
Certain amounts presented in prior year data have been reclassified in order to be consistent with the current year’s presentation.
Interfund Transactions Transactions which constitute reimbursements to a fund for expenditures initially made from it which are properly applicable to another fund are recorded as expenditures in the reimbursing fund and as reductions of expenditures in the reimbursed fund. Transactions, which constitute the transfer of resources from a fund receiving revenues to a fund through which the revenues are to be expended, are separately reported in the respective fund's operating statements. Activity between funds that are representative of lending/borrowing arrangements at the end of the fiscal year are referred to as "due to/from other funds" in the fund financial statements.
(36)

CHEROKEE COUNTY, SOUTH CAROLINA NOTES TO FINANCIAL STATEMENTS - CONTINUED
JUNE 30, 2017
NOTE 2 - STEWARDSHIP, COMPLIANCE AND ACCOUNTABILITY A. Budgets and Budgetary Accounting
Annual budgets are adopted for the general fund on the modified accrual basis.
The County Council follows these procedures in establishing the budget data reflected in the financial statements: Prior to June 1, the Administrator submits to the County Council a proposed operating budget for the fiscal year commencing the following July 1. The operating budget includes expenditures and the means of financing them for the upcoming year. Public hearings are conducted at the County Administration Building to obtain taxpayer comment. Prior to June 30, the budget is legally enacted through passage of an ordinance. The County Administrator is authorized to transfer budget amounts within departments in the general fund. The County Administrator may transfer funds between departments with the approval of County Council. The legal level of control is the department level. Formal budgetary integration is employed as a management control device during the year. The County Council may authorize supplemental appropriations during the year.
B. Encumbrances
Under encumbrance accounting, outstanding purchase orders, if any, are recorded in order to reserve that portion of the applicable appropriation in the governmental fund types. Encumbrances outstanding at year end are carried forward and are reported as committed fund balance.
C. Excess of Expenditures Over Appropriations For the year ended June 30, 2017, expenditures exceeded appropriations in the following
departments: General Government
Central Purchasing 18,100$ Human Resources 1,831 Courthouse 34,323 Addressing 18,030 GIS/Mapping 24 Election Commission 911 Poll Workers 81,798 Magistrate - Gaffney 4,882 Voter Registration 496 Probate Court 2,147 Register of Deeds 2,020 Circuit Solicitor 9,184
Public SafetyCode Enforcement 5,350 Communications 548,587 Animal Shelter 207 Enhanced Communications/911 26,590
(37)

CHEROKEE COUNTY, SOUTH CAROLINA NOTES TO FINANCIAL STATEMENTS - CONTINUED
JUNE 30, 2017
NOTE 2 - STEWARDSHIP, COMPLIANCE AND ACCOUNTABILITY - Continued C. Excess of Expenditures Over Appropriations - Continued
Coroner 1,024 Law Enforcement Center 12,316 Sheriff 7,209 Detention Center 161,785
Environmental and HousingSolid Waste Disposal 24,327
Health and Human ServicesAlcohol and Drug Abuse 5,000 Indigent Care 18,035
Culture and RecreationLibrary 510 Recreation District 331,919$
NOTE 3 - DETAILED NOTES ON GOVERNMENT-WIDE AND FUND FINANCIAL STATEMENTS A. Cash Deposits and Investments Deposits
Statutes authorize the County to invest in obligations of the United States and its agencies, general obligations (not revenue obligations) of the State of South Carolina and its subdivisions, savings and loan associations to the extent of federal insurance, certificates of deposit collaterally secured, repurchase agreements secured by the foregoing obligations, and the State Treasurer’s Investment Pool. The County has not adopted a formal deposit or investment policy. The State Treasurer’s Investment Pool is a 2a7-like pool, which is not registered with the Securities and Exchange Commission (SEC), but has a policy that it will operate in a manner consistent with the SEC’s Rule 2a7 of the Investment Company Act of 1940.
Custodial Credit Risk – Deposits Custodial credit risk is the risk that in the event of a bank failure, the County’s deposits may not be
returned to it. The County does not have a deposit policy for custodial credit risk. All of the County’s deposits at June 30, 2017 were covered by federal depository insurance or by collateral held in the pledging financial institution’s trust department in the County’s name.
Investments
Investments measured and reported at fair value are classified according to the following hierarchy: Level 1 – Investments reflect prices quoted in active markets.
Level 2 – Investments reflect prices that are based on similar observable assets either directly or indirectly, which may include markets that are not considered to be active.
Level 3 – Investments reflect prices based upon unobservable sources.
(38)

CHEROKEE COUNTY, SOUTH CAROLINA NOTES TO FINANCIAL STATEMENTS - CONTINUED
JUNE 30, 2017
NOTE 3 - DETAILED NOTES ON GOVERNMENT-WIDE AND FUND FINANCIAL STATEMENTS - Continued A. Cash Deposits and Investments - Continued
The categorization of investments within the hierarchy is based upon the pricing transparency of the instrument and should not be perceived as the particular investment’s risk. Money market mutual funds classified in Level 1 of the fair value hierarchy are valued directly from a predetermined primary external pricing vendor. Assets classified in Level 2 are subject to pricing by an alternative pricing source due to lack of information available by the primary vendor.
South Carolina Local Government Investment Pool investments are invested with the South Carolina State Treasurer’s Office, which established the South Carolina Pool pursuant to Section 6-6-10 of the South Carolina Code. The pool is an investment trust fund, in which public monies in excess of current needs, which are under the custody of any city treasurer or any governing body of a political subdivision of the State, may be deposited. In accordance with GASB Statement No. 31 “Accounting and Financial Reporting for Certain Investment and for External Investment Pools”, investments are carried at fair value determined annually based upon quoted market prices for identical or similar investments. The total fair value of the Pool is apportioned to the entities with funds invested on an equal basis for each share owned, which are acquired at a cost of $1. Funds may be deposited by Pool participants at any time and may be withdrawn upon 24 hours’ notice. Financial statements for the Pool may be obtained by writing the Office of State Treasurer, Local Government Investment Pool, Post Office Box 11778, Columbia, South Carolina 29211-1950.
Interest rate risk – The County does not have an investment policy for interest rate risk.
At June 30, 2017, the County had the following investments:
Fair ValueInvestment Type Value Maturity Rating Hierarchy
Local Government Investment Pool 7,584,769$ Daily N/A N/A
B. Taxes Receivable
Property Tax Receivable
The County property tax is levied each fall (except automobiles which are annually assessed on the first day of the month the automobiles are registered) on the assessed valuations of property located in the County as of the preceding January 1. The books are open for collection September 30 with the first penalty, three percent, applicable to payments made after January 15, the due date. An additional seven percent penalty is added to payments made after February 1, and an additional 5 percent penalty plus costs is added after March 16. Property taxes attach as an enforceable lien, and are considered delinquent if not paid by March 16.
(39)

CHEROKEE COUNTY, SOUTH CAROLINA NOTES TO FINANCIAL STATEMENTS - CONTINUED
JUNE 30, 2017
NOTE 3 - DETAILED NOTES ON GOVERNMENT-WIDE AND FUND FINANCIAL STATEMENTS
- Continued
B. Taxes Receivable - Continued Property taxes on vehicles are billed by the 15th day of the month preceding the expiration date of
South Carolina vehicle licenses, and are due by the last day of that month.
Assessed values for real estate are established annually by the County Tax Assessor at 4% of market value for legal residence and 6% of market value for rental and other real property. Real property in the County for the 2017 levy was assessed at $109,176,390, representing 5% of estimated market value. Assessed values for personal property are established by the County Auditor and the South Carolina Department of Revenue at 10.5% of the estimated market value. The 2017 assessed value for personal property was $70,167,449. The County tax rate is currently 71.60 mills. The following is a schedule of current and net delinquent taxes receivable by fund:
Gross Delinquent Taxes Receivable
Allowance for Uncollectibles
Net Delinquent Taxes Receivable
Current Taxes Receivable
Taxes Receivable (Net)
Governmental FundsGeneral fund 468,009$ 136,003$ 332,006$ 748,099$ 1,080,105$ Capital fund 41,012 11,918 29,094 6,651 35,745 Debt service fund 41,176 11,966 29,210 6,109 35,319 Library fund 21,649 10,007 11,642 16,456 28,098 Fire districts funds 56,128 16,310 39,818 8,128 47,946
627,974 186,204 441,770 785,443 1,227,213
Agency Funds 1,553,683 451,500 1,102,183 242,541 1,344,724
2,181,657$ 637,704$ 1,543,953$ 1,027,984$ 2,571,937$
Local Option Sales Tax - Property Tax Relief In 2008, the Cherokee County voters approved a referendum to impose a one percent local option sales tax. This tax was imposed beginning May 2009. Of the revenues collected from this tax, 29% is available to the County to fund capital projects and 71% is being used as a credit against ad valorem taxes and vehicle taxes. This credit first appeared on ad valorem tax notices mailed in October 2009 and on vehicle tax notices beginning with those notices for January 2010. The County has established a Local Option Sales Tax – Property Tax Relief account to account for the liability of local option sales tax collections in excess of local option sales tax credits applied on property tax notices. As of June 30, 2017 the balance in this account, included in the general fund, was $3,418,212.
(40)

CHEROKEE COUNTY, SOUTH CAROLINA NOTES TO FINANCIAL STATEMENTS - CONTINUED
JUNE 30, 2017
NOTE 3 - DETAILED NOTES ON GOVERNMENT-WIDE AND FUND FINANCIAL STATEMENTS - Continued C. Capital Assets Primary government capital asset activity for the year ended June 30, 2017 was as follows:
Balance BalanceJune 30, 2016 Additions Deletions June 30, 2017
Governmental ActivitiesCapital Assets Not Being Depreciated: Land 1,688,895$ -$ -$ 1,688,895$
Construction in progress - 497,845 - 497,845 1,688,895 497,845 - 2,186,740
Capital Assets Being Depreciated:Buildings 26,888,212 4,864 - 26,893,076 Improvements other than buildings 547,760 77,543 - 625,303 Machinery and equipment 15,237,212 1,430,983 360,620 16,307,575 Infrastructure 28,650,816 2,084,168 - 30,734,984 Books 1,045,199 58,533 - 1,103,732
72,369,199 3,656,091 360,620 75,664,670 Less Accumulated Depreciation:
Buildings 9,446,304 596,469 - 10,042,773 Improvements other than buildings 326,674 34,707 - 361,381 Machinery and equipment 9,941,295 1,702,280 355,210 11,288,364 Infrastructure 10,972,103 1,173,780 - 12,145,883 Books 834,120 58,279 - 892,399
31,520,496 3,565,515 355,210 34,730,800
Total Capital Assets Being Depreciated, Net 40,848,703 90,577 5,410 40,933,870
Total Capital Assets, Net 42,537,598$ 588,422$ 5,410$ 43,120,610$
Depreciation expense was charged to functions of the primary government as follows:
Governmental Activities
General government 780,702$ Public safety 908,350 Health and human services 16,278 Environmental and housing 477,710 Transportation 1,242,516 Culture and recreation 139,958
Total 3,565,515$
(41)

CHEROKEE COUNTY, SOUTH CAROLINA NOTES TO FINANCIAL STATEMENTS - CONTINUED
JUNE 30, 2017
NOTE 3 - DETAILED NOTES ON GOVERNMENT-WIDE AND FUND FINANCIAL STATEMENTS - Continued D. Interfund Receivables, Payables and Transfers During the course of its operations, the County has numerous transactions between funds, including
expenditures and transfers of resources to provide services, construct assets, and service debt. The accompanying financial statements generally reflect such transactions as transfers.
Operating subsidies are also recorded as transfers. The classification of amounts recorded as
subsidies, advances or equity contributions is determined by County management. To the extent that certain transactions between funds had not been paid or received as of year-end, balances of interfund amounts receivable or payable have been recorded.
The outstanding balances between funds result mainly from the time lag between the dates that (1)
interfund goods and services are provided or reimbursable expenditures occur, (2) transactions are recorded in the accounting system, and (3) payments between funds are made.
The following is a summary of interfund receivables and payables at June 30, 2017:
Receivable PayableInterfund:General Fund 5,989,094$ 683,669$ Capital Projects Fund - 2,756,701 Nonmajor Special Revenue Funds 105,822 3,229,554 Economic Development Corporation - 108,661 Debt Service Fund 683,669 -
6,778,585$ 6,778,585$
The following is a summary of interfund transfers for the year ended June 30, 2017:
Transfers In Transfers Out
Major Governmental Funds: General Fund 3,295,516$ 557,000$ Capital Projects Fund - 1,749,417 Economic Development Corporation - 279,000 Non-Major Special Revenue Funds 836,792 1,546,891
4,132,308$ 4,132,308$
During the year, transfers were used to 1) move funds from the Capital Projects Fund to the General Fund as approved in the 2017-2018 Budget, 2) for routine transfers of funds to and from other funds, such as covering of certain expenditures from special revenue grants.
(42)

CHEROKEE COUNTY, SOUTH CAROLINA NOTES TO FINANCIAL STATEMENTS - CONTINUED
JUNE 30, 2017
NOTE 3 - DETAILED NOTES ON GOVERNMENT-WIDE AND FUND FINANCIAL STATEMENTS - Continued E. Operating Lease Commitments
The County has operating leases for computer, copier and fax equipment as well as land and office spaces that are not cancelable. Commitments for rental expenses under these leases, expiring between 2018 and 2021 are as follows:
Year Ending June 30,
2018 310,030$ 2019 304,105 2020 292,000 2021 121,667
1,027,802$
Total lease expense, including lease payments based on usage, for the year ended June 30, 2017
was $362,587. F. Long-term Debt
The following is a summary of debt transactions for the County for the year ended June 30, 2017:
Balance Balance Due WithinGovernmental Activities June 30, 2016 Additions Reductions June 30, 2017 One YearGeneral Obligation Bonds 6,180,000$ -$ 630,000$ 5,550,000$ 650,000$ Loan Payable 4,000,000 - - 4,000,000 - Landfill Closure and - -
Post Closure Liability 7,631,302 21,000 188,922 7,463,380 721,850 Net OPEB Obligation 2,233,700 221,100 112,000 2,342,800 - Compensated Absences 392,438 407,941 392,438 407,941 86,778
20,437,440$ 650,041$ 1,323,360$ 19,764,121$ 1,458,628$
General Obligation Bonds
The County issued general obligation bond series 2011 through SunTrust Bank for the construction of an administration building. Annual installments of $500,000 to $795,000 plus interest at 3.40% are to be paid through May of 2025.
Future principal and interest payments of the General Obligation Bonds are as follows:
Fiscal Year Principal Interest Total2018 650,000 188,700 838,700 2019 670,000 166,600 836,600 2020 695,000 143,820 838,820 2021 720,000 120,190 840,190
2022-2025 2,815,000 227,460 3,042,460
$ 5,550,000 $ 846,770 $ 6,396,770
General Obligation Bonds
(43)

CHEROKEE COUNTY, SOUTH CAROLINA NOTES TO FINANCIAL STATEMENTS - CONTINUED
JUNE 30, 2017
NOTE 3 - DETAILED NOTES ON GOVERNMENT-WIDE AND FUND FINANCIAL STATEMENTS - Continued F. Long-term Debt - continued Loan Payable
During the year ended June 30, 2015, The Cherokee County Economic Development Corporation entered into a loan agreement with the South Carolina Public Service Authority to finance the purchase of land and designing and constructing an industrial speculative building in the Spartanburg-Cherokee Industrial Park. The loan is collateralized by real estate. The term of the loan is for 10 years concluding on June 16, 2025, with annual principal payments of $571,429 beginning in 2019. The loan shall bear interest at 0% for the first three years. At or upon June 17, 2018, the interest rate is to be determined (TBD) based on the following:
Fiscal Year Principal Interest Total
2018 -$ - - 2019 571,429 TBD (1)2020 571,429 TBD (1)2021 571,429 TBD (2)
2022-2025 2,285,713 TBD (2)
$ 4,000,000
(1) On June 17, 2018, the interest rate will be adjusted to 1/2 of thethen-current 10-year MMD index and again on June 17, 2019.
(2) On June 17, 2020, and on each subsequent June 17, the interestrate for any outstanding principal balance shall be adjusted to thethen-current 10-year US Treasury rate through final payment of theloan.
Conduit Debt Obligations
Industrial Revenue Bonds are issued to provide financial assistance to private-sector entities for the acquisition and construction of industrial and commercial facilities deemed to be in the public interest. Such bonds are secured by the property financed and are payable solely from payments received on the underlying mortgage loans. Upon repayment of the bonds, ownership of the acquired facilities transfers to the private-sector entity served by the bond issuance. Neither Cherokee County, the State nor any political subdivision thereof is obligated in any manner for repayment of the bonds. Accordingly, the bonds are not reported as liabilities in the accompanying financial statements. No Industrial Revenue Bonds were issued by the County in fiscal years 2003 through 2017. The aggregate principal amount payable or the aggregate original issued amount for issues prior to July 1, 2002 could not be determined.
(44)

CHEROKEE COUNTY, SOUTH CAROLINA NOTES TO FINANCIAL STATEMENTS - CONTINUED
JUNE 30, 2017
NOTE 3 - DETAILED NOTES ON GOVERNMENT-WIDE AND FUND FINANCIAL STATEMENTS - Continued G. Landfill Closure and Post Closure Care Costs
State and federal laws and regulations require the County to place a final cover on its landfill sites when the sites stop accepting waste, and to perform certain maintenance and monitoring functions at the sites for thirty years after closing.
The County has recorded a liability in the government-wide statement of net position for the total
estimated closure and post-closure care costs for the portion of the landfills filled at June 30, 2017, calculated as follows:
C&D
MSW Cells A, B & C Total
Total estimated current closure and post closurecare cost 5,057,380$ 2,406,000$
Percentage of landfill capacity used to date 100% 100%
Reported liability for closure and post closurecare cost 5,057,380$ 2,406,000$ 7,463,380$
Total estimated current closure and post closurecare cost remaining to be recognized -$ -$
Landfill's approximate remaining life in years - -
The estimated total current cost of the landfill closure and post closure care is based on the amount
that would be paid if all equipment, facilities, and services required to close, monitor, and maintain the landfills were acquired as of June 30, 2017. However, the actual cost of closure and post closure care may be higher due to inflation, changes in technology, or changes in landfill laws and regulations.
NOTE 4 - OTHER INFORMATION A. Risk Management
The County is exposed to various risks of loss related to torts; theft of, damage to and destruction of assets; errors and omissions; and natural disasters for which the County carries insurance through the State Budget and Control Board Office of Insurance Reserve Fund. The County pays premiums to the Fund for its general insurance coverage. The agreement for formation of the Fund provides that the Fund will be self-sustaining through member premiums and will reinsure through commercial companies for each insured event. Additionally, the County participates in a self-funded program to provide workers' compensation insurance through the South Carolina Association of Counties, which works in a similar way as the Insurance Reserve Fund.
The County continues to carry commercial insurance for all other risks of loss. Settled claims resulting
from these risks have not exceeded commercial insurance coverage in any of the past three years.
(45)

CHEROKEE COUNTY, SOUTH CAROLINA NOTES TO FINANCIAL STATEMENTS - CONTINUED
JUNE 30, 2017
NOTE 4 - OTHER INFORMATION - Continued B. Commitments and Contingencies
Grant Programs
The County participates in a number of federal and state assisted grant programs. These programs are subject to audits by grantors or their representatives. The audits of these programs for or including the year ended June 30, 2017, have not yet been conducted. Therefore, the County's compliance with applicable grant requirements will be established at some future date. The amount, if any, of expenditures which may be disallowed cannot be determined at this time although the County expects such amounts, if any, to be immaterial.
Library Services and Construction Act, Title II
The County received monies in the year 2000 from a federal grant to assist for payment of the construction costs for a new addition to the main library. These funds were received under the Library Services and Construction Act, Title II (LSCAII). The total amount of the award was $200,000. Per Section 770.42 of (CAFR 34) of the Federal Register, if within 20 years of the receipt of this grant the County ceases to use the facility as a library, or the Library itself were to cease to be a public library, the amount the County may be obligated to repay is the amount that equals the funds received from the United States Government, or the fair market value of the facility allocated proportionally between the United States Government funds received and the local funds received.
Litigation
The County is party to a number of lawsuits arising in the course of operations. It is the opinion of management, in consultation with legal counsel, that it cannot be determined whether resolution of the other pending cases will have a material adverse effect on the financial condition of the County.
C. Deferred Compensation Plans
Several optional deferred compensation plans are available to the County’s employees. The multiple-employer plans, created under Internal Revenue Code Sections 457, 401(k) and 403(b) are accounted for by the State of South Carolina. Employees may withdraw the current value of their contributions when they terminate employment. With approval of the State’s Deferred Compensation Commission, employees may also withdraw the current value of their contributions prior to termination of employment if they meet certain requirements. These requirements differ among the three plans. Compensation deferred under the Section 457, 401(k) and 403(b) plans is placed in trust for the contributing employees. Neither the State nor the County has any liability for losses under the plans.
(46)

CHEROKEE COUNTY, SOUTH CAROLINA NOTES TO FINANCIAL STATEMENTS - CONTINUED
JUNE 30, 2017
NOTE 4 - OTHER INFORMATION - Continued
D. Pension Plans
a. South Carolina Retirement System
Plan Description - The County, as the employer, participates in the South Carolina Retirement System (SCRS) Plan - a cost-sharing multiple-employer defined benefit pension plan administered by the Retirement Division of the South Carolina Public Employee Benefit Authority (PEBA). PEBA issues a Comprehensive Annual Financial Report (CAFR) that is publicly available on the Retirement Benefits’ link on PEBA’s website at www.peba.sc.gov.
Benefits Provided - SCRS provides retirement and disability benefits, and an incidental death benefit is available to beneficiaries of active and retired members of employers who participate in the death benefit program. Benefit terms are prescribed in Title 9 of the South Carolina Code of Laws, and PEBA does not have the authority to establish or amend benefit terms without a change in the code of laws. Generally, all employees of covered employers are required to participate in and contribute to the system as a condition of employment. Key elements of the benefit calculation include the benefit multiplier, years of service, and average final compensation/current annual salary.
An employee member of the system with an effective date of membership prior to July 1, 2012, is a Class Two member. A Class Two member who has separated from service with at least five or more years of earned service is eligible for a monthly pension at age 65 or with 28 years credited service regardless of age. A member may elect early retirement with reduced pension benefits payable at age 55 with 25 years of service credit.
An employee member of the system with an effective date of membership on or after July 1, 2012, is a Class Three member. A Class Three member who has separated from service with at least eight or more years of earned service is eligible for a monthly pension upon satisfying the Rule of 90 requirement that the total of the member’s age and the member’s creditable service equals at least 90 years. Both Class Two and Class Three members are eligible to receive a reduced deferred annuity at age 60 if they satisfy the five- or eight-year earned service requirement, respectively.
Benefits Provided - The annual retirement allowance of eligible retirees or their surviving annuitants is increased by the lesser of 1% or $500 every July 1. Only those annuitants in receipt of a benefit on July 1 of the preceding year are eligible to receive the increase. Members who retire under the early retirement provisions at age 55 with 25 years of service are not eligible for the benefit adjustment until the second July 1 after reaching age 60 or the second July 1 after the date they would have had 28 years of service credit had they not retired.
(47)

CHEROKEE COUNTY, SOUTH CAROLINA NOTES TO FINANCIAL STATEMENTS - CONTINUED
JUNE 30, 2017
NOTE 4 - OTHER INFORMATION - Continued D. Pension Plans - Continued
a. South Carolina Retirement System - continued Contributions - Contributions requirements of the Plan are prescribed in Title 9 of the South Carolina Code of Laws. The PEBA Board may increase the employer and employee contribution rates on the basis of the actuarial valuations, but any such increase may not result in a differential between the employee and employer contribution rate that exceeds 2.9% of earnable compensation. Employees and employers (both Class II and III) are required to contribute 8.66% and 11.41%, respectively, of earnable compensation for the year ended June 30, 2017. Employers also contribute an additional .15% of earnable compensation, if participating in the death benefit program. Contributions to the Plan from the County were $627,224. Pension Liabilities, Pension Expense, and Deferred Outflows of Resources and Deferred Inflows of Resources Related to Pensions - At June 30, 2017, the County reported a net pension liability of $10,788,221 for its proportionate share of the total net pension liability. The net pension liability was measured as of June 30, 2016. The total pension liability used to calculate the net pension liability was determined by an actuarial valuation as of July 1, 2015, using membership data as of July 1, 2015 projected forward to the end of the fiscal year, and financial information of the pension trust funds as of June 30, 2016, using generally accepted actuarial procedures. The County’s proportion of the net pension liability was based on the County’s contributions received by the pension plan relative to the total contributions received by the pension plan for all participating employers as of June 30, 2016. Based upon this information, the County’s proportion was .050507%.
For the year ended June 30, 2017, the County recognized pension expense of $1,055,227. At June 30, 2017, the County reported deferred outflows of resources and deferred inflows of resources related to the pension from the following sources:
Deferred Outflows of Deferred Inflows of
Resources Resources
Differences between expected and actual experience 634,081$ -$
Changes in assumptions - -
Net difference between projected and actual
earnings on pension plan investments 608,298 -
Changes in proportion and differences between
County contributions and proportionate share
of contributions - -
County contributions subsequent to the measurement date 627,224 -
Total 1,869,603$ -$
(48)
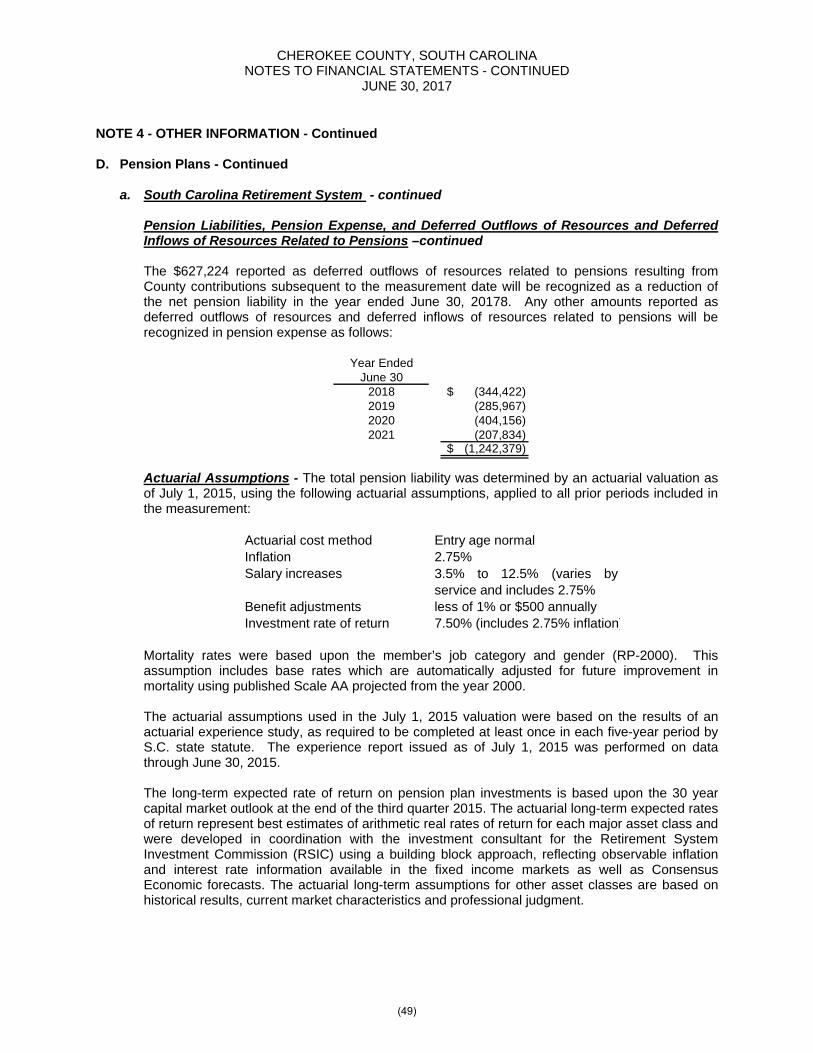
CHEROKEE COUNTY, SOUTH CAROLINA NOTES TO FINANCIAL STATEMENTS - CONTINUED
JUNE 30, 2017
NOTE 4 - OTHER INFORMATION - Continued D. Pension Plans - Continued
a. South Carolina Retirement System - continued
Pension Liabilities, Pension Expense, and Deferred Outflows of Resources and Deferred Inflows of Resources Related to Pensions –continued The $627,224 reported as deferred outflows of resources related to pensions resulting from County contributions subsequent to the measurement date will be recognized as a reduction of the net pension liability in the year ended June 30, 20178. Any other amounts reported as deferred outflows of resources and deferred inflows of resources related to pensions will be recognized in pension expense as follows:
Year EndedJune 30
2018 (344,422)$ 2019 (285,967) 2020 (404,156) 2021 (207,834)
(1,242,379)$
Actuarial Assumptions - The total pension liability was determined by an actuarial valuation as of July 1, 2015, using the following actuarial assumptions, applied to all prior periods included in the measurement:
Actuarial cost method Entry age normalInflation 2.75%Salary increases
Benefit adjustments less of 1% or $500 annuallyInvestment rate of return 7.50% (includes 2.75% inflation)
3.5% to 12.5% (varies byservice and includes 2.75%
Mortality rates were based upon the member’s job category and gender (RP-2000). This assumption includes base rates which are automatically adjusted for future improvement in mortality using published Scale AA projected from the year 2000.
The actuarial assumptions used in the July 1, 2015 valuation were based on the results of an actuarial experience study, as required to be completed at least once in each five-year period by S.C. state statute. The experience report issued as of July 1, 2015 was performed on data through June 30, 2015.
The long-term expected rate of return on pension plan investments is based upon the 30 year capital market outlook at the end of the third quarter 2015. The actuarial long-term expected rates of return represent best estimates of arithmetic real rates of return for each major asset class and were developed in coordination with the investment consultant for the Retirement System Investment Commission (RSIC) using a building block approach, reflecting observable inflation and interest rate information available in the fixed income markets as well as Consensus Economic forecasts. The actuarial long-term assumptions for other asset classes are based on historical results, current market characteristics and professional judgment.
(49)
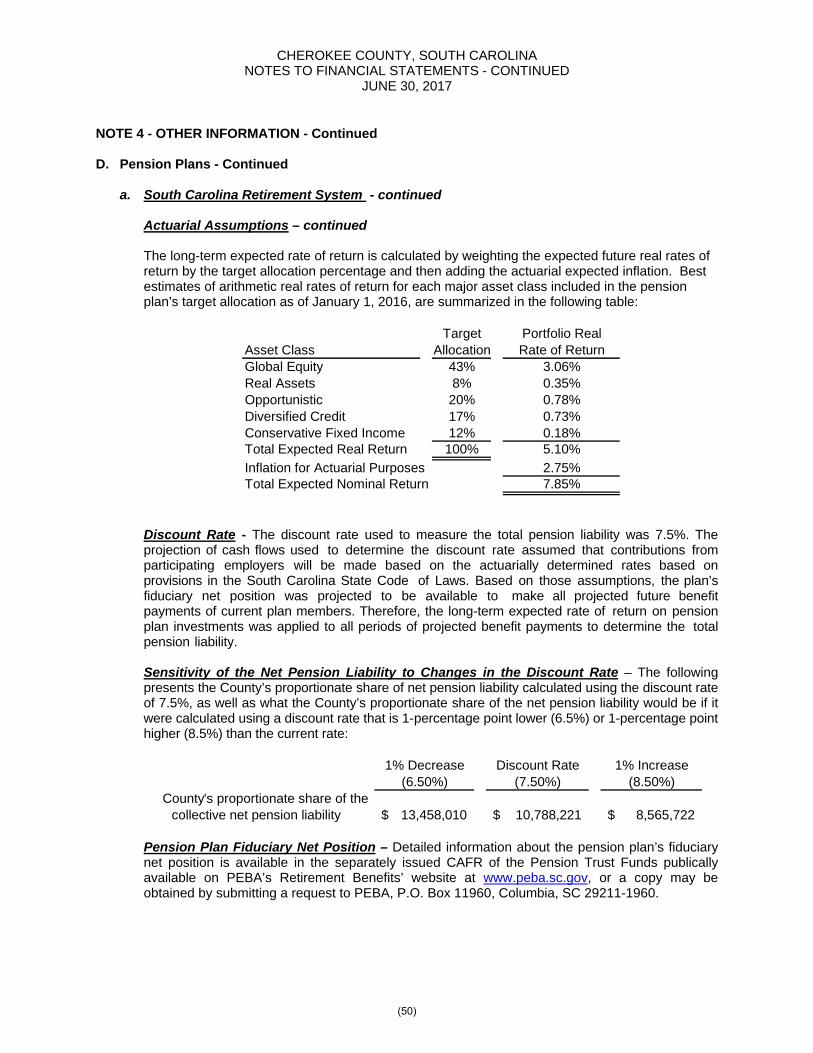
CHEROKEE COUNTY, SOUTH CAROLINA NOTES TO FINANCIAL STATEMENTS - CONTINUED
JUNE 30, 2017
NOTE 4 - OTHER INFORMATION - Continued D. Pension Plans - Continued
a. South Carolina Retirement System - continued Actuarial Assumptions – continued The long-term expected rate of return is calculated by weighting the expected future real rates of return by the target allocation percentage and then adding the actuarial expected inflation. Best estimates of arithmetic real rates of return for each major asset class included in the pension plan’s target allocation as of January 1, 2016, are summarized in the following table:
Target Portfolio RealAsset Class Allocation Rate of ReturnGlobal Equity 43% 3.06%Real Assets 8% 0.35%Opportunistic 20% 0.78%Diversified Credit 17% 0.73%Conservative Fixed Income 12% 0.18%Total Expected Real Return 100% 5.10%
Inflation for Actuarial Purposes 2.75%Total Expected Nominal Return 7.85%
Discount Rate - The discount rate used to measure the total pension liability was 7.5%. The projection of cash flows used to determine the discount rate assumed that contributions from participating employers will be made based on the actuarially determined rates based on provisions in the South Carolina State Code of Laws. Based on those assumptions, the plan’s fiduciary net position was projected to be available to make all projected future benefit payments of current plan members. Therefore, the long-term expected rate of return on pension plan investments was applied to all periods of projected benefit payments to determine the total pension liability.
Sensitivity of the Net Pension Liability to Changes in the Discount Rate – The following presents the County’s proportionate share of net pension liability calculated using the discount rate of 7.5%, as well as what the County’s proportionate share of the net pension liability would be if it were calculated using a discount rate that is 1-percentage point lower (6.5%) or 1-percentage point higher (8.5%) than the current rate:
1% Decrease Discount Rate 1% Increase
(6.50%) (7.50%) (8.50%)County's proportionate share of the
collective net pension liability 13,458,010$ 10,788,221$ 8,565,722$
Pension Plan Fiduciary Net Position – Detailed information about the pension plan’s fiduciary net position is available in the separately issued CAFR of the Pension Trust Funds publically available on PEBA’s Retirement Benefits’ website at www.peba.sc.gov, or a copy may be obtained by submitting a request to PEBA, P.O. Box 11960, Columbia, SC 29211-1960.
(50)

CHEROKEE COUNTY, SOUTH CAROLINA NOTES TO FINANCIAL STATEMENTS - CONTINUED
JUNE 30, 2017
NOTE 4 - OTHER INFORMATION - Continued D. Pension Plans - Continued
b. South Carolina Police Officers Retirement System
Plan Description - The County, as the employer, participates in the South Carolina Police Officers Retirement System (PORS) Plan - a cost-sharing multiple-employer defined benefit pension plan administered by the Retirement Division of the South Carolina Public Employee Benefit Authority (PEBA). PEBA issues a Comprehensive Annual Financial Report (CAFR) that is publicly available on the Retirement Benefits’ link on PEBA’s website at www.peba.sc.gov.
Benefits Provided - PORS provides retirement and disability benefits, accidental death benefits, and an incidental death benefit is available to beneficiaries of active and retired members of employers who participate in the death benefit program. Benefit terms are prescribed in Title 9 of the South Carolina Code of Laws, and PEBA does not have the authority to establish or amend benefit terms without a change in the code of laws. To be eligible for PORS membership, an employee must be required by the terms of his employment, by election or appointment, to preserve public order, protect life and property, and detect crimes in the state; to prevent and control property destruction by fire; or to serve as a peace officer employed by the Department of Corrections, the Department of Juvenile Justice, or the Department of Mental Health. Probate judges and coroners may elect membership in PORS. Magistrates are required to participate in PORS for service as a magistrate. PORS members, other than magistrates and probate judges, must also earn at least $2,000 per year and devote at least 1,600 hours per year to this work, unless exempted by statute. Key elements of the benefit calculation include the benefit multiplier, years of service, and average final compensation/current annual salary.
An employee member of the system with an effective date of membership prior to July 1, 2012, is a Class Two member. A Class Two member who has separated from service with at least five or more years of earned service is eligible for a monthly pension at age 55 or with 25 years of service regardless of age.
An employee member of the system with an effective date of membership on or after July 1, 2012, is a Class Three member. A Class Three member who has separated from service with at least eight or more years of earned service is eligible for a monthly pension at age 55 or with 27 years of service regardless of age.
Both Class Two and Class Three members are eligible to receive a deferred annuity at age 55 with five or eight years of earned service, respectively.
The annual retirement allowance of eligible retirees or their surviving annuitants is increased by the lesser of 1% or $500 every July 1. Only those annuitants in receipt of a benefit on July 1 of the preceding year are eligible to receive the increase.
Contributions - Contributions requirements of the Plan are prescribed in Title 9 of the South Carolina Code of Laws. The PEBA Board may increase the employer and employee contribution rates on the basis of the actuarial valuations, but any such increase may not result in a differential between the employee and employer contribution rate that exceeds 5.0% of earnable compensation.
(51)

CHEROKEE COUNTY, SOUTH CAROLINA NOTES TO FINANCIAL STATEMENTS - CONTINUED
JUNE 30, 2017
NOTE 4 - OTHER INFORMATION - Continued D. Pension Plans - Continued
b. South Carolina Police Officers Retirement System - continued
Contributions – continued - Employees and employers (both Class II and III) are required to contribute 9.24% and 13.84%, respectively, of earnable compensation for the year ended June 30, 2017. Employers also contribute an additional .20% of earnable compensation for the accidental death program and an additional .20% of earnable compensation, if participating in the incidental death benefit program. Contributions to the Plan from the County were $570,369.
Pension Liabilities, Pension Expense, and Deferred Outflows of Resources and Deferred Inflows of Resources Related to Pensions - At June 30, 2017, the County reported a net pension liability of $7,683,236 for its proportionate share of the total net pension liability. The net pension liability was measured as of June 30, 2016. The total pension liability used to calculate the net pension liability was determined by an actuarial valuation as of July 1, 2015, using membership data as of July 1, 2015 projected forward to the end of the fiscal year, and financial information of the pension trust funds as of June 30, 2016, using generally accepted actuarial procedures. The County’s proportion of the net pension liability was based on the County’s contributions received by the pension plan relative to the total contributions received by the pension plan for all participating employers as of June 30, 2016. Based upon this information, the County’s proportion was .30291%.
For the year ended June 30, 2017, the County recognized pension expense of $878,243. At June 30, 2017, the County reported deferred outflows of resources and deferred inflows of resources related to the pension from the following sources:
Deferred Outflows of Deferred Inflows of
Resources Resources
Differences between expected and actual experience 571,512$ -$
Changes in assumptions - -
Net difference between projected and actual
earnings on pension plan investments 541,144 -
Changes in proportion and differences between
County contributions and proportionate share
of contributions - -
County contributions subsequent to the measurement date 570,369 -
Total 1,683,025$ -$
(52)

CHEROKEE COUNTY, SOUTH CAROLINA NOTES TO FINANCIAL STATEMENTS - CONTINUED
JUNE 30, 2017
NOTE 4 - OTHER INFORMATION - Continued D. Pension Plans - Continued
b. South Carolina Police Officers Retirement System - continued Pension Liabilities, Pension Expense, and Deferred Outflows of Resources and Deferred Inflows of Resources Related to Pensions – continued: The $570,369 reported as deferred outflows of resources related to pensions resulting from County contributions subsequent to the measurement date will be recognized as a reduction of the net pension liability in the year ended June 30, 2017. Any other amounts reported as deferred outflows of resources and deferred inflows of resources related to pensions will be recognized in pension expense as follows:
Year Ended
June 302018 (270,058)$ 2019 (264,279) 2020 (385,219) 2021 (193,100)
(1,112,656)$
Actuarial Assumptions - The total pension liability was determined by an actuarial valuation as of July 1, 2015, using the following actuarial assumptions, applied to all prior periods included in the measurement:
Actuarial cost method Entry age normalInflation 2.75%Salary increases
Benefit adjustments less of 1% or $500 annuallyInvestment rate of return 7.50% (includes 2.75% inflation)
4.0% to 10.0% (varies byservice and includes 2.75%
Mortality rates were based upon the member’s job category and gender (RP-2000). This assumption includes base rates which are automatically adjusted for future improvement in mortality using published Scale AA projected from the year 2000.
The actuarial assumptions used in the July 1, 2015 valuation were based on the results of an actuarial experience study, as required to be completed at least once in each five-year period by S.C. state statute. The experience report issued as of July 1, 2015 was performed on data through June 30, 2015.
The long-term expected rate of return on pension plan investments is based upon the 30 year capital market outlook at the end of the fourth quarter 2015. The actuarial long-term expected rates of return represent best estimates of arithmetic real rates of return for each major asset class and were developed in coordination with the investment consultant for the Retirement System Investment Commission (RSIC) using a building block approach, reflecting observable inflation and interest rate information available in the fixed income markets as well as Consensus Economic forecasts. The actuarial long-term assumptions for other asset classes are based on historical results, current market characteristics and professional judgment.
(53)

CHEROKEE COUNTY, SOUTH CAROLINA NOTES TO FINANCIAL STATEMENTS - CONTINUED
JUNE 30, 2017
NOTE 4 - OTHER INFORMATION - Continued D. Pension Plans - Continued
b. South Carolina Police Officers Retirement System - continued Actuarial Assumptions –continued - The long-term expected rate of return is calculated by weighting the expected future real rates of return by the target allocation percentage and then adding the actuarial expected inflation. Best estimates of arithmetic real rates of return for each major asset class included in the pension plan’s target allocation as of January 1, 2016, are summarized in the following table:
Target Portfolio Real
Asset Class Allocation Rate of ReturnGlobal Equity 43% 3.06%Real Assets 8% 0.35%Opportunistic 20% 0.78%Diversified Credit 17% 0.73%Conservative Fixed Income 12% 0.18%Total Expected Real Return 100% 5.10%
Inflation for Actuarial Purposes 2.75%Total Expected Nominal Return 7.85%
Discount Rate - The discount rate used to measure the total pension liability was 7.5%. The projection of cash flows used to determine the discount rate assumed that contributions from participating employers will be made based on the actuarially determined rates based on provisions in the South Carolina State Code of Laws. Based on those assumptions, the plan’s fiduciary net position was projected to be available to make all projected future benefit payments of current plan members. Therefore, the long-term expected rate of return on pension plan investments was applied to all periods of projected benefit payments to determine the total pension liability.
Sensitivity of the Net Pension Liability to Changes in the Discount Rate - The following presents the County’s proportionate share of net pension liability calculated using the discount rate of 7.5%, as well as what the County’s proportionate share of the net pension liability would be if it were calculated using a discount rate that is 1-percentage point lower (6.5%) or 1-percentage point higher (8.5%) than the current rate:
1% Decrease Discount Rate 1% Increase
(6.50%) (7.50%) (8.50%)County's proportionate share of the
collective net pension liability 10,069,538$ 7,683,236$ 5,538,695$
Pension Plan Fiduciary Net Position – Detailed information about the pension plan’s fiduciary net position is available in the separately issued CAFR of the Pension Trust Funds publically available on PEBA’s Retirement Benefits’ website at www.peba.sc.gov, or a copy may be obtained by submitting a request to PEBA, P.O. Box 11960, Columbia, SC 29211-1960.
(54)

CHEROKEE COUNTY, SOUTH CAROLINA NOTES TO FINANCIAL STATEMENTS - CONTINUED
JUNE 30, 2017
NOTE 4 - OTHER INFORMATION - Continued E. Post Employment Health Insurance Benefits
Plan Description - Single-employer defined benefit. The County pays a portion (up to $200 per month) of the cost of the Medicare supplemental care premium for its retirees who meet the eligibility requirements. In order to qualify, an employee must have at least ten years of employment credit with Cherokee County and the last five years must be consecutive in a full time permanent position with Cherokee County. The retirees are required to pay the remaining amount for the insurance. The plan does not issue a financial report. Funding Policy - As of the year-end, forty-nine retirees are taking advantage of the program. The program was initiated by County Council resolution. These costs are funded on a pay-as-you-go basis. Current year expenditures recognized in the general fund amounted to $69,797. Annual Other Post - Employment Benefits (OPEB) Cost and Net OPEB Obligation - The County’s annual OPEB cost (expense) is calculated based on the annual required contribution (ARC) of the County, an amount actuarially determined. The ARC represents a level of funding that, if paid on an ongoing basis is projected to cover normal costs each year and amortize any unfunded actuarial liabilities over a period not to exceed thirty years. The following table shows the components of the County’s annual OPEB costs for the year, the amount actuarially contributed to the plan, and changes in the County’s net OPEB obligation for the post-employment health insurance benefits:
General Government
Annual Required Contribution 224,800$ Interest on OPEB Obligation 89,300 Adjustment to Annual Required Contribution (93,000) Annual OPEB Costs 221,100 Contributions Made (112,000) Increase in Net OPEB Obligation 109,100 Net OPEB Obligation - Beginning of Year 2,233,700
Net OPEB Obligation - End of Year 2,342,800$
The County’s annual OPEB cost, the percentage of annual OPEB cost contributed to the plan, and the net OPEB obligation for 2017 and the two preceding years are as follows:
For the Year Ended June 30
Annual OPEB Cost
Employer Amount Contributed
Percentage of Annual OPEB
Cost ContributedNet OPEB Obligation
2017 221,100$ 112,000$ 50.66% 2,342,800$ 2016 238,300 111,700 46.87% 2,233,700 2015 261,000 104,900 40.19% 2,107,100
(55)

CHEROKEE COUNTY, SOUTH CAROLINA NOTES TO FINANCIAL STATEMENTS - CONTINUED
JUNE 30, 2017
NOTE 4 - OTHER INFORMATION - Continued E. Post Employment Health Insurance Benefits - Continued
Funding Status and Progress - As of July 1, 2016, the most recent actuarial valuation date, the plan was not funded. The actuarial accrued liability for benefits and, thus, the unfunded actuarial accrued liability (UAAL) was $2,801,800. The covered payroll (annual payroll of active employees covered by the plan) was $4,811,000, and the ratio of the unfunded actuarial accrued liability to the covered payroll was 58.24%.
Actuarial valuations of an ongoing plan involve estimates of reported amounts and assumptions about the probability of occurrence of events far into the future. Examples include assumptions about future employment, mortality, and healthcare trends. Amounts determined regarding the funded status of the plan and the annual required contributions of the employer are subject to continual revision as actual results are compared with past expectations and new estimates are made about the future.
The schedule of funding progress, presented as required supplementary information following the notes to the financial statements, presents multiyear trend information about whether the actuarial value of the plan assets is increasing or decreasing over time relative to the actuarial accrued liabilities for benefits.
Actuarial Methods and Assumptions - Projections of benefits for financial reporting purposes are based upon the substantive plan (the plan as understood by the employer and plan members) and include the types of benefits provided at the time of each valuation and historical pattern of sharing benefit costs between the employer and plan members at that point. The actuarial methods and assumptions used include techniques that are designed to reduce the short-term volatility in actuarial accrued liabilities and the actuarial value assets, consistent with the long-term perspective of the calculations.
In the July 2016 actuarial valuation, the projected unit credit cost method was used. The actuarial assumptions included a 4.00% investment rate of return, projected salary increases of 2.50%, inflation rate of 2.50% and the healthcare cost trend rate to be 6.84%. The UAAL is being amortized as a level percentage of projected payroll on an open basis over a 30 year period. A copy of the complete actuarial report is available at our county offices located at 110 Railroad Avenue, Gaffney, SC 29340.
(56)

CHEROKEE COUNTY, SOUTH CAROLINA NOTES TO FINANCIAL STATEMENTS - CONTINUED
JUNE 30, 2017
NOTE 5 – TAX ABATEMENTS
The county utilizes an economic development program to attract businesses and industry to the County for the purposes of expanding and diversifying the local economy and creating jobs. This is the only program under which taxes are abated at the County. South Carolina law allows two primary mechanisms that the County may employ in order to improve its competitiveness with other jurisdictions, both in-state and out-of-state, and incentivize new or additional investment in the County. These mechanisms effectively allow the County to reduce the amount of ad valorem property taxes that will be paid on new business investments. These two mechanisms include: Fee in Lieu of Tax (FILOT) agreements and Special Source Revenue Credits (SSRC).
While these two mechanisms do not totally level the playing field, they do position the County to have its other attributes, geographic location, labor qualify, etc. to be better evaluated in a company’s decision process. These two mechanisms are key in making Cherokee County competitive with our neighboring states for qualify economic development projects.
Companies that are located in South Carolina and classified as manufacturing facilities are subject to ad valorem taxes. The fair market value is multiplied by the assessment ratio, generally equal to 10.5%, to produce the assessed value and then multiplied by the millage rate. Cherokee County provides certain tax reductions through the following programs:
1. Fee in Lieu of Ad Valorem Tax 2. Special Source Revenue Credit
The Fee in Lieu of Ad Valorem Tax program is intended to encourage commercial and industrial investment in South Carolina. The property tax reduction is granted pursuant to Chapter 44 of Title 12 of the South Carolina Code of Laws of South Carolina 1976 as amended. Taxpayers are eligible to receive a reduction in property taxes, through reduced assessed values and locked millage rates, if they enter into an agreement with Cherokee County and invest at least $2.5 million in taxable property (or some other negotiated investment floor) in Cherokee County within a 5 year period. Under the Fee in Lieu of Ad Valorem Tax program, if a taxpayer does not make the required investment within the 5 year period, then the reduced property taxes terminate and the taxpayer must repay Cherokee County the difference between the abated taxes received and what the taxpayer would have paid had it not had the benefit of the Fee in Lieu of Ad Valorem Tax program.
Cherokee County has twenty-two (22) taxpayers that have entered into an agreement with Cherokee County under the Fee in Lieu of Ad Valorem Tax program. In the aggregate, these taxpayers, without the benefit of the program would pay $3,095,662 to Cherokee County in ad valorem tax. However, due to the benefit provided by the Fee in Lieu of Ad Valorem Tax program, the taxpayers paid an aggregate of $2,244,871 to Cherokee County in the most recent fiscal year.
The Special Source Revenue Credit program is intended to encourage investment into infrastructure serving Cherokee County or infrastructure serving a commercial or manufacturing enterprise in Cherokee County. The property tax reduction is granted pursuant to Chapter 1 of Title 4 of the South Carolina Code of Laws of South Carolina 1976, as amended. All property that is located in an MCIP, Multi-County Industrial Park, is exempt from property taxes, but property owners must pay an amount equivalent to the property taxes that would otherwise be due. The companies that make an agreement with the county based on this option are based on infrastructure credits or credits based on investments /money spent to improve a facility. Taxpayers are eligible to receive a percentage reduction off their total property tax liability if the taxpayer is located in a multicounty park, enters into an agreement with Cherokee County and agrees to make an investment in taxable property in Cherokee County and create jobs. If the taxpayer does not meet its investment or job commitments, the taxpayer must repay a portion of the reduction.
(57)

CHEROKEE COUNTY, SOUTH CAROLINA NOTES TO FINANCIAL STATEMENTS - CONTINUED
JUNE 30, 2017
NOTE 5 – TAX ABATEMENTS - Continued
Cherokee County has three (3) taxpayers that have entered into an agreement with Cherokee County under the Special Source Revenue Credit program. In the aggregate, these taxpayers, without the benefits of the program would pay $35,341 to Cherokee County in ad valorem tax in the most recent fiscal year. However, due to the benefit provided by the Special Source Revenue Credit program, the taxpayers pay an aggregate of $21,833 to Cherokee County.
NOTE 6 - SUBSEQUENT EVENTS
Management has evaluated subsequent events through December 28, 2017, the date the financial statements were available to be issued.
(58)

REQUIRED SUPPLEMENTARY INFORMATION

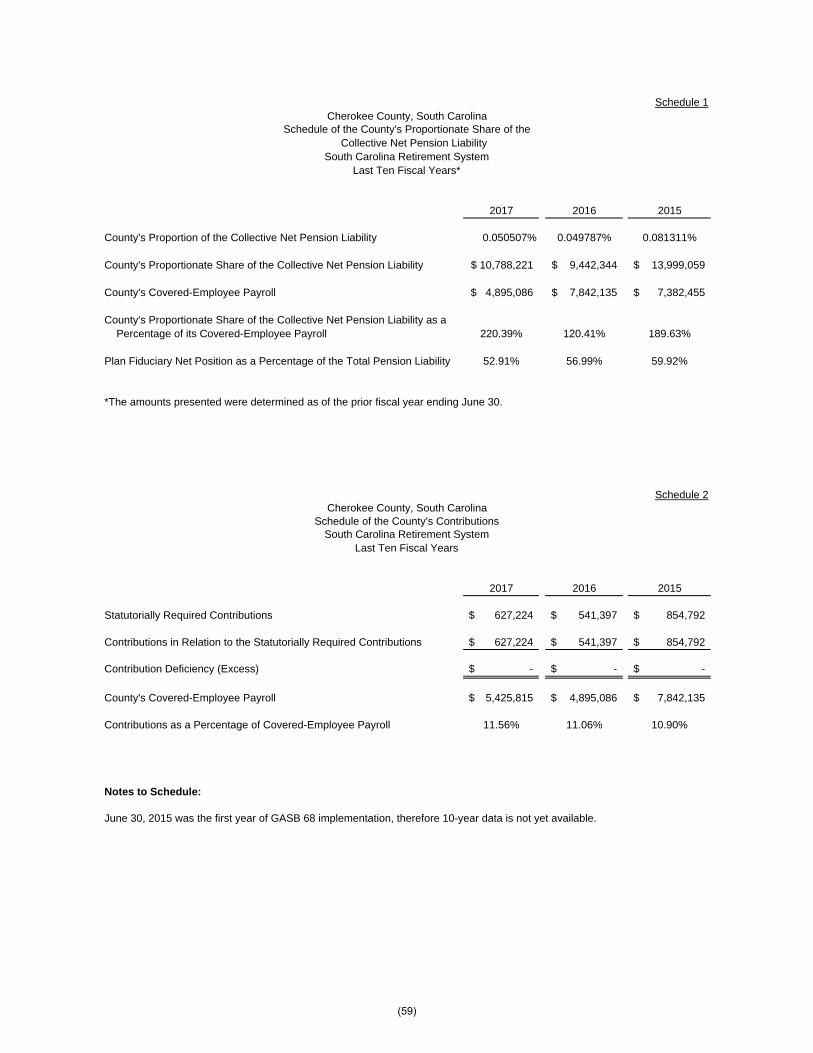
Schedule 1Cherokee County, South Carolina
Schedule of the County's Proportionate Share of theCollective Net Pension Liability
South Carolina Retirement SystemLast Ten Fiscal Years*
2017 2016 2015
County's Proportion of the Collective Net Pension Liability 0.050507% 0.049787% 0.081311%
County's Proportionate Share of the Collective Net Pension Liability 10,788,221$ 9,442,344$ 13,999,059$
County's Covered-Employee Payroll 4,895,086$ 7,842,135$ 7,382,455$
County's Proportionate Share of the Collective Net Pension Liability as a Percentage of its Covered-Employee Payroll 220.39% 120.41% 189.63%
Plan Fiduciary Net Position as a Percentage of the Total Pension Liability 52.91% 56.99% 59.92%
Schedule 2Cherokee County, South Carolina
Schedule of the County's ContributionsSouth Carolina Retirement System
Last Ten Fiscal Years
2017 2016 2015
Statutorially Required Contributions 627,224$ 541,397$ 854,792$
Contributions in Relation to the Statutorially Required Contributions 627,224$ 541,397$ 854,792$
Contribution Deficiency (Excess) -$ -$ -$
County's Covered-Employee Payroll 5,425,815$ 4,895,086$ 7,842,135$
Contributions as a Percentage of Covered-Employee Payroll 11.56% 11.06% 10.90%
Notes to Schedule:
June 30, 2015 was the first year of GASB 68 implementation, therefore 10-year data is not yet available.
*The amounts presented were determined as of the prior fiscal year ending June 30.
(59)

Schedule 3Cherokee County, South Carolina
Schedule of the County's Proportionate Share of theCollective Net Pension Liability
South Carolina Police Officers Retirement SystemLast Ten Fiscal Years*
2017 2016 2015
County's Proportion of the Collective Net Pension Liability 0.302910% 0.304780% 0.291680%
County's Proportionate Share of the Collective Net Pension Liability 7,683,236$ 6,642,756$ 5,583,983$
County's Covered-Employee Payroll 3,861,673$ 3,775,721$ 3,507,756$
County's Proportionate Share of the Collective Net Pension Liability as a Percentage of its Covered-Employee Payroll 198.96% 175.93% 159.19%
Plan Fiduciary Net Position as a Percentage of the Total Pension Liability 60.44% 64.57% 67.55%
Schedule 4Cherokee County, South Carolina
Schedule of the County's ContributionsSouth Carolina Police Officers Retirement System
Last Ten Fiscal Years
2017 2016 2015
Statutorially Required Contributions 570,369$ 530,594$ 506,342$
Contributions in Relation to the Statutorially Required Contributions 570,369$ 530,594$ 506,342$
Contribution Deficiency (Excess) -$ -$ -$
County's Covered-Employee Payroll 4,005,403 3,861,673 3,775,721$
Contributions as a Percentage of Covered-Employee Payroll 14.24% 13.74% 13.41%
Notes to Schedules:
June 30, 2015 was the first year of GASB 68 implementation, therefore 10-year data is not yet available.
*The amounts presented were determined as of the prior fiscal year ending June 30.
(60)
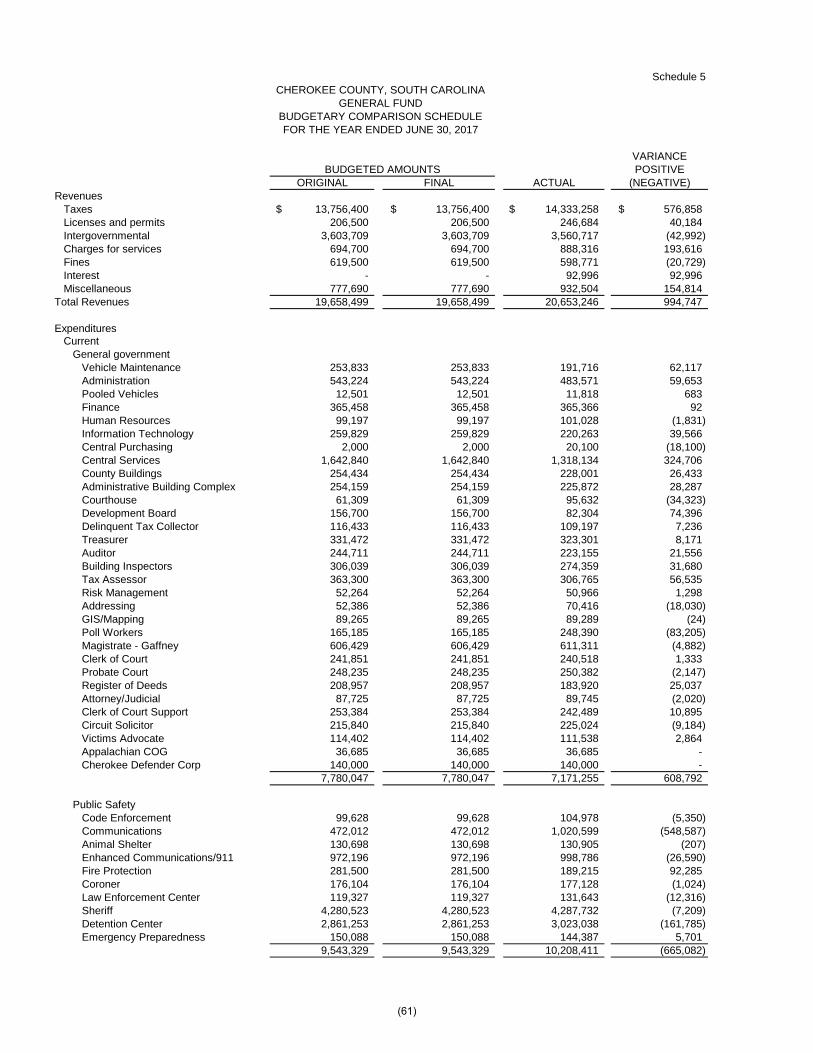
Schedule 5
VARIANCEPOSITIVE
ORIGINAL FINAL ACTUAL (NEGATIVE)Revenues
Taxes 13,756,400$ 13,756,400$ 14,333,258$ 576,858$ Licenses and permits 206,500 206,500 246,684 40,184 Intergovernmental 3,603,709 3,603,709 3,560,717 (42,992) Charges for services 694,700 694,700 888,316 193,616 Fines 619,500 619,500 598,771 (20,729) Interest - - 92,996 92,996 Miscellaneous 777,690 777,690 932,504 154,814
Total Revenues 19,658,499 19,658,499 20,653,246 994,747
Expenditures Current
General government Vehicle Maintenance 253,833 253,833 191,716 62,117 Administration 543,224 543,224 483,571 59,653 Pooled Vehicles 12,501 12,501 11,818 683 Finance 365,458 365,458 365,366 92 Human Resources 99,197 99,197 101,028 (1,831) Information Technology 259,829 259,829 220,263 39,566 Central Purchasing 2,000 2,000 20,100 (18,100) Central Services 1,642,840 1,642,840 1,318,134 324,706 County Buildings 254,434 254,434 228,001 26,433 Administrative Building Complex 254,159 254,159 225,872 28,287 Courthouse 61,309 61,309 95,632 (34,323) Development Board 156,700 156,700 82,304 74,396 Delinquent Tax Collector 116,433 116,433 109,197 7,236 Treasurer 331,472 331,472 323,301 8,171 Auditor 244,711 244,711 223,155 21,556 Building Inspectors 306,039 306,039 274,359 31,680 Tax Assessor 363,300 363,300 306,765 56,535 Risk Management 52,264 52,264 50,966 1,298 Addressing 52,386 52,386 70,416 (18,030) GIS/Mapping 89,265 89,265 89,289 (24) Poll Workers 165,185 165,185 248,390 (83,205) Magistrate - Gaffney 606,429 606,429 611,311 (4,882) Clerk of Court 241,851 241,851 240,518 1,333 Probate Court 248,235 248,235 250,382 (2,147) Register of Deeds 208,957 208,957 183,920 25,037 Attorney/Judicial 87,725 87,725 89,745 (2,020) Clerk of Court Support 253,384 253,384 242,489 10,895 Circuit Solicitor 215,840 215,840 225,024 (9,184) Victims Advocate 114,402 114,402 111,538 2,864 Appalachian COG 36,685 36,685 36,685 - Cherokee Defender Corp 140,000 140,000 140,000 -
7,780,047 7,780,047 7,171,255 608,792
Public SafetyCode Enforcement 99,628 99,628 104,978 (5,350) Communications 472,012 472,012 1,020,599 (548,587) Animal Shelter 130,698 130,698 130,905 (207) Enhanced Communications/911 972,196 972,196 998,786 (26,590) Fire Protection 281,500 281,500 189,215 92,285 Coroner 176,104 176,104 177,128 (1,024) Law Enforcement Center 119,327 119,327 131,643 (12,316) Sheriff 4,280,523 4,280,523 4,287,732 (7,209) Detention Center 2,861,253 2,861,253 3,023,038 (161,785) Emergency Preparedness 150,088 150,088 144,387 5,701
9,543,329 9,543,329 10,208,411 (665,082)
CHEROKEE COUNTY, SOUTH CAROLINAGENERAL FUND
BUDGETARY COMPARISON SCHEDULEFOR THE YEAR ENDED JUNE 30, 2017
BUDGETED AMOUNTS
(61)

Schedule 5 - Continued
VARIANCEPOSITIVE
ORIGINAL FINAL ACTUAL (NEGATIVE)Environmental and Housing
Department of Public Works 129,591 129,591 93,791 35,800 Solid Waste Collections 1,932,803 1,932,803 1,766,719 166,084 C and D Landfill 536,134 536,134 512,704 23,430 Solid Waste Disposal 79,142 79,142 103,469 (24,327) Recycling Center 671,602 671,602 654,823 16,779 Clemson Ext Service 27,720 27,720 27,720 - Thicketty Creek Project 8,900 8,900 8,900 - USDA Soil Conservation 9,000 9,000 9,000 -
3,394,892 3,394,892 3,177,126 217,766
Health and Human ServicesVeterans Office 176,153 176,153 155,698 20,455 Alcohol and Drug Abuse 7,500 7,500 12,500 (5,000) Health Department 33,760 33,760 33,760 - Indigent Care 196,924 196,924 214,959 (18,035) County Health and Human Services 292,096 292,096 292,096 - Social Services 29,200 29,200 26,881 2,319 Habilitation Services 50,000 50,000 50,000 - Service to Aging 35,000 35,000 35,000 - Regional Mental Health 35,000 35,000 35,000 - Piedmont Community Acts - - - - Literacy Association 15,000 15,000 15,000 -
870,633 870,633 870,894 (261)
TransportationRoads and Bridges 1,207,066 1,207,066 943,044 264,022
1,207,066 1,207,066 943,044 264,022
Culture and RecreationLibrary - - 510 (510) Recreation district 1,304 1,304 333,223 (331,919)
1,304 1,304 333,733 (332,429)
Total Expenditures 22,797,271 22,797,271 22,704,463 92,808
Excess (Deficiency) of Revenues Over Expenditures (3,138,772) (3,138,772) (2,051,217) 1,087,555
Other Financing Sources (Uses)Sale of capital assets 15,000 15,000 99,098 84,098 Transfers in 4,681,334 4,681,334 3,295,516 (1,385,818) Transfers out (557,000) (557,000) (557,000) -
Total Other Financing Sources (Uses) 4,139,334 4,139,334 2,837,614 (1,301,720)
Net Change in Fund Balance 1,000,562 1,000,562 786,397 (214,165)
Fund Balance - Beginning of Year 9,987,084 9,987,084 29,241,113 19,254,029
Fund Balance - End of Year 10,987,646$ 10,987,646$ 30,027,510$ 19,039,864$
Note: The budget is prepared and monitored on a U.S. generally accepted accounting principles (GAAP) basis of accounting.
BUDGETED AMOUNTS
GENERAL FUNDCHEROKEE COUNTY, SOUTH CAROLINA
BUDGETARY COMPARISON SCHEDULEFOR THE YEAR ENDED JUNE 30, 2017
(62)

Schedule 6
Schedule of Funding Progress
UAAL asActuarial Actuarial Actuarial Unfunded a PercentageValuation Value of Accrued Accrued Funded Covered of Covered
Date Assets Liability Liability Ratio Payroll PayrollJuly 1, 2012 - 3,482,000 3,482,000 0% 10,600,100 32.85%July 1, 2014 - 3,510,800 3,510,800 0% 5,779,400 60.75%July 1, 2016 - 2,801,800 2,801,800 0% 4,811,000 58.24%
Schedule of Employer Contributions
PercentFunded
21.3%25.6%28.4%39.0%46.0%50.7%
Contribution 446,400
June 30, 2016 241,700 111,700June 30, 2015 264,600 104,900
CHEROKEE COUNTY, SOUTH CAROLINASCHEDULE OF FUNDING PROGRESS AND EMPLOYER CONTRIBUTIONS
FOR THE YEAR ENDED JUNE 30, 2017FOR RETIREE HEALTH PLANS
Fiscal EstimatedAnnual
June 30, 2017 224,800 112,000
314,500
YearEnd
95,200 80,500
EmployerContribution
June 30, 2014 331,000 94,100
June 30, 2012June 30, 2013
Required
(63)


COMBINING AND INDIVIDUAL NONMAJOR FUND
FINANCIAL STATEMENTS AND SCHEDULES

Schedule 7
Carolina Over Mtn Rural 911 E911 Drug Enforce Sheriff Seized Used Waste Victim
Thread Trail Endowment Infrastructure Telephone Surcharge Agent Gambling Monies Oil Tire Assistance
AssetsCash 692$ 6,674$ 291,602$ 719,414$ 3,353,417$ 36,183$ 3,277$ (1,307)$ 102,487$ 150,103$ Taxes receivable (net) - - - - - - - - - - Other receivables - - - - 289,138$ - - 3,373 13,756 - Due from other funds - - - - - - - - - - Prepaid expenses - - - - - - - - - -
692$ 6,674$ 291,602$ 719,414$ 3,642,555$ 36,183$ 3,277$ 2,066$ 116,243$ 150,103$
LiabilitiesAccounts payable -$ -$ -$ -$ -$ -$ -$ 2,066$ -$ -$ Due to other funds - - - 690,693 1,789,149 36,183 - - 116,243 150,103 Accrued expenses - - - - - - - - - - Unearned revenue - - - - - - - - - -
- - - 690,693 1,789,149 36,183 - 2,066 116,243 150,103
Deferred Inflows of ResourcesUnavailable revenues - property taxes - - - - - - - - - -
Fund Balances Restricted 692 6,674 291,602 - 1,853,406 - 3,277 - - - Assigned - - - 28,721 - - - - - - Unassigned - - - - - - - -
692 6,674 291,602 28,721 1,853,406 - 3,277 - - -
692$ 6,674$ 291,602$ 719,414$ 3,642,555$ 36,183$ 3,277$ 2,066$ 116,243$ 150,103$
Special Revenue Funds
CHEROKEE COUNTY, SOUTH CAROLINANONMAJOR GOVERNMENTAL FUNDS
COMBINING BALANCE SHEETJUNE 30, 2017
(64)
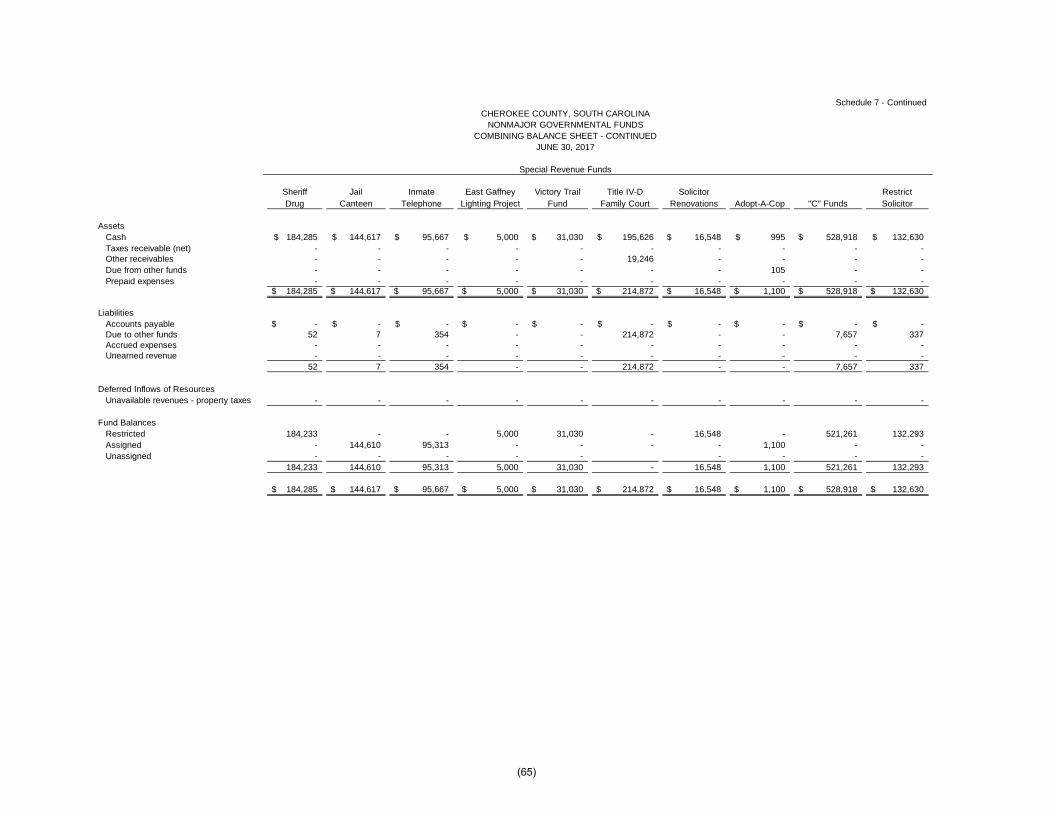
AssetsCashTaxes receivable (net)Other receivablesDue from other fundsPrepaid expenses
LiabilitiesAccounts payableDue to other fundsAccrued expensesUnearned revenue
Deferred Inflows of ResourcesUnavailable revenues - property taxes
Fund BalancesRestrictedAssignedUnassigned
Schedule 7 - Continued
Sheriff Jail Inmate East Gaffney Victory Trail Title IV-D Solicitor RestrictDrug Canteen Telephone Lighting Project Fund Family Court Renovations Adopt-A-Cop "C" Funds Solicitor
184,285$ 144,617$ 95,667$ 5,000$ 31,030$ 195,626$ 16,548$ 995$ 528,918$ 132,630$ - - - - - - - - - - - - - - - 19,246 - - - - - - - - - - - 105 - - - - - - - - - - - -
184,285$ 144,617$ 95,667$ 5,000$ 31,030$ 214,872$ 16,548$ 1,100$ 528,918$ 132,630$
-$ -$ -$ -$ -$ -$ -$ -$ -$ -$ 52 7 354 - - 214,872 - - 7,657 337
- - - - - - - - - - - - - - - - - - - -
52 7 354 - - 214,872 - - 7,657 337
- - - - - - - - - -
184,233 - - 5,000 31,030 - 16,548 - 521,261 132,293
- 144,610 95,313 - - - - 1,100 - - - - - - - - - - -
184,233 144,610 95,313 5,000 31,030 - 16,548 1,100 521,261 132,293
184,285$ 144,617$ 95,667$ 5,000$ 31,030$ 214,872$ 16,548$ 1,100$ 528,918$ 132,630$
CHEROKEE COUNTY, SOUTH CAROLINANONMAJOR GOVERNMENTAL FUNDS
COMBINING BALANCE SHEET - CONTINUEDJUNE 30, 2017
Special Revenue Funds
(65)

AssetsCashTaxes receivable (net)Other receivablesDue from other fundsPrepaid expenses
LiabilitiesAccounts payableDue to other fundsAccrued expensesUnearned revenue
Deferred Inflows of ResourcesUnavailable revenues - property taxes
Fund BalancesRestrictedAssignedUnassigned
Schedule 7 - Continued
Estreated Weekend Sex Fire Sheriff Sheriff Federal Title IV-DBonds Jail Offender EPD Insurance Hardship DSS Drug Incentives
16,267$ 55,373$ 51,789$ 59,236$ -$ 9,807$ 22,190$ 51,077$ 238,706$ - - - - - - - - - - - 1,885 - 104,935 - 1,997 - 3,398 - - - - - - - 5,350 - - - - - - - - - -
16,267$ 55,373$ 53,674$ 59,236$ 104,935$ 9,807$ 24,187$ 56,427$ 242,104$
-$ -$ 2,601$ -$ -$ -$ -$ 5,056$ -$ - - 176 - - - - 32,579 18 - - - - - - - - - - - - - - - - - - - - 2,777 - - - - 37,635 18
- - - - - - - - -
16,267 - 50,897 59,236 104,935 9,807 24,187 18,792 242,086
- 55,373 - - - - - - - - - - - - - - - -
16,267 55,373 50,897 59,236 104,935 9,807 24,187 18,792 242,086
16,267$ 55,373$ 53,674$ 59,236$ 104,935$ 9,807$ 24,187$ 56,427$ 242,104$
CHEROKEE COUNTY, SOUTH CAROLINANONMAJOR GOVERNMENTAL FUNDS
COMBINING BALANCE SHEET - CONTINUEDJUNE 30, 2017
Special Revenue Funds
(66)

AssetsCashTaxes receivable (net)Other receivablesDue from other fundsPrepaid expenses
LiabilitiesAccounts payableDue to other fundsAccrued expensesUnearned revenue
Deferred Inflows of ResourcesUnavailable revenues - property taxes
Fund BalancesRestrictedAssignedUnassigned
Schedule 7 - Continued
Bulletproof Emergency Development Fire SC DHECVests Solicitor Management Library Board Districts LETC Hazmat HPP Grant
7,800$ 27,408$ 8,855$ 1,147,886$ 149,782$ -$ 1,452$ 48$ (12,809)$ - - - 28,098 - 47,946 - - - - - 41,380 101,896 - - - - 12,818 - - - - - 80,077 - - - - - - 12,527 - - - - -
7,800$ 27,408$ 50,235$ 1,290,407$ 149,782$ 128,023$ 1,452$ 48$ 9$
-$ -$ -$ 17,111$ -$ -$ -$ -$ -$ 5,350 - 50,235 - - - - - -
- - - 21,892 7,853 - - - - - - - - - - - -
5,350 - 50,235 39,003 7,853 - - - -
- - - 28,687 - 43,301 - - -
2,450 27,408 - 13,778 - - - 48 -
- - - 1,208,939$ 141,929$ 84,722 1,452 - 9 - - - - - - - -
2,450 27,408 - 1,222,717 141,929 84,722 1,452 48 9
7,800$ 27,408$ 50,235$ 1,290,407$ 149,782$ 128,023$ 1,452$ 48$ 9$
CHEROKEE COUNTY, SOUTH CAROLINANONMAJOR GOVERNMENTAL FUNDS
COMBINING BALANCE SHEET - CONTINUEDJUNE 30, 2017
Special Revenue Funds
(67)

AssetsCashTaxes receivable (net)Other receivablesDue from other fundsPrepaid expenses
LiabilitiesAccounts payableDue to other fundsAccrued expensesUnearned revenue
Deferred Inflows of ResourcesUnavailable revenues - property taxes
Fund BalancesRestrictedAssignedUnassigned
Schedule 7 - Continued
DebtSheriff Electonic 7th Circuit Emergency Service
Confiscated Funds Restitution Dare Monitoring Solicitor - Gambling Mgmt/CoGen Others Fund Totals
125,905$ 2,296$ 23,106$ 103,826$ 546,844$ 2,000$ 4,125$ 830,746$ 9,471,573$ - - - - - - - 35,320 111,364 - - - - - - - - 593,822
151 - - - - - 20,135 683,669 789,487 - - - - - - - - 12,527
126,056$ 2,296$ 23,106$ 103,826$ 546,844$ 2,000$ 24,260$ 1,549,735$ 10,978,773$
-$ -$ -$ -$ -$ -$ -$ -$ 26,834$ 8,867 - 2,455 103,826 - - 20,398 - 3,229,554
- - - - - - - - 29,745 117,189 - - - - - - 117,189 126,056 - 2,455 103,826 - - 20,398 - 3,403,322
- - - - - - - 29,211 101,199
- 2,296 20,651 - 546,844 2,000 3,862 1,520,524 5,712,084 - - - - - - - - 1,762,168 - - - - - - - - - - 2,296 20,651 - 546,844 2,000 3,862 1,520,524 7,474,252
126,056$ 2,296$ 23,106$ 103,826$ 546,844$ 2,000$ 24,260$ 1,549,735$ 10,978,773$
-$
Special Revenue Funds
CHEROKEE COUNTY, SOUTH CAROLINANONMAJOR GOVERNMENTAL FUNDS
COMBINING BALANCE SHEETJUNE 30, 2017
(68)

Schedule 8
Carolina Over Mtn Rural 911 E911 Drug Enforce Sheriff Seized Used Waste EMS Victim Sheriff JailThread Trail Endowment Infrastructure Telephone Surcharge Agent Gambling Monies Oil Tire Grant Assistance Drug Canteen
Revenues
Taxes -$ -$ -$ -$ -$ -$ -$ -$ -$ -$ -$ -$ -$ Intergovernmental - - - 167,072 933,824 - - 10,875 60,629 9,039 - - - Interest - 5 - - - - - - - - - - - Charges for services - - - - - - - - - - - - - Confiscated money - - - - - - - - - - - - - Miscellaneous - - 35,000 - - - - - - - 71,516 196,657 88,559
- 5 35,000 167,072 933,824 - - 10,875 60,629 9,039 71,516 196,657 88,559
ExpendituresCurrent General government - - 102,398 - - - - - - - - - - Public safety - - - 33 - - - - - - - 16,064 11,631 Transportation - - - - - - - - - - - - - Health and human services - - - - - - - - - 9,039 - - - Environmental and housing - - - - - - - 11,616 2,100 - - - - Culture and recreation - - - - - - - - - - - - -
Capital outlay - - - - - - - - - - - 13,549 - Debt service Principal retirement - - - - - - - - - - - - - Interest and fiscal charges - - - - - - - - - - - - -
- - 102,398 33 - - - 11,616 2,100 9,039 - 29,613 11,631
Excess (Deficiency) of RevenuesOver (Under) Expenditures - 5 (67,398) 167,039 933,824 - - (741) 58,529 - 71,516 167,044 76,928
Other Financing Sources (Uses)Transfers in - - 279,000 - - - - 741 - - - - - Transfers out - - - (138,318) (1,068,810) - - - (58,529) - (71,516) (51) -
Total other financing sources (uses) - - 279,000 (138,318) (1,068,810) - - 741 (58,529) - (71,516) (51) -
Net Change in Fund Balances - 5 211,602 28,721 (134,986) - - - - - - 166,993 76,928
Fund Balances - Beginning of Year 692 6,669 80,000 - 1,988,392 - 3,277 - - - - 17,240 67,682
Fund Balances - End of Year 692$ 6,674$ 291,602$ 28,721$ 1,853,406$ -$ 3,277$ -$ -$ -$ -$ 184,233$ 144,610$
Special Revenue Funds
CHEROKEE COUNTY, SOUTH CAROLINANONMAJOR GOVERNMENTAL FUNDS
COMBINING STATEMENT OF REVENUES, EXPENDITURES ANDCHANGES IN FUND BALANCES
FOR THE YEAR ENDED JUNE 30, 2017
(69)

RevenuesTaxesIntergovernmentalInterestCharges for servicesConfiscated moneyMiscellaneous
ExpendituresCurrent General government Public safety Transportation Health and human services Environmental and housing Culture and recreation
Capital outlay Debt service Principal retirement Interest and fiscal charges
Excess (Deficiency) of RevenuesOver (Under) Expenditures
Other Financing Sources (Uses)Transfers inTransfers out
Total other financing sources (uses)
Net Change in Fund Balances
Fund Balances - Beginning of Year
Fund Balances - End of Year
Schedule 8 - Continued
Inmate East Gaffney Regional Victory Trail Title IV-D Solicitor Restrict Estreated Weekend SexTelephone Lighting Project Planning Fund Family Court Renovations Adopt-A-Cop "C" Funds Solicitor Bonds Jail Offender
-$ -$ -$ -$ -$ -$ -$ -$ -$ -$ -$ -$ - - 50,000 - 107,240 - - 1,900,679 - - - - - - - - - - - - - - - - - - - - - - - - - - - - - - - - - - - - - - - -
35,082 - - - - - - - 60,000 4,847 11,763 21,420 35,082 - 50,000 - 107,240 - - 1,900,679 60,000 4,847 11,763 21,420
- - 50,000 - - - - - 129,554 1,643 - - 23,232 - - - - - - - - - 6,979 1,505
- - - - - - - 4,736,428 - - - - - - - - 3,295 - - - - - - - - - - - - - - - - - - - - - - - - - - - - - - -
4,962 - - - 28,774 1,523 - - - - - -
- - - - - - - - - - - - - - - - - - - - - - - -
28,194 - 50,000 - 32,069 1,523 - 4,736,428 129,554 1,643 6,979 1,505
6,888 - - - 75,171 (1,523) - (2,835,749) (69,554) 3,204 4,784 19,915
- - - - - - - - - - - - - - - - (75,171) - - - - - - - - - - - (75,171) - - - - - - -
6,888 - - - - (1,523) - (2,835,749) (69,554) 3,204 4,784 19,915
88,425 5,000 - 31,030 - 18,071 1,100 3,357,010 201,847 13,063 50,589 30,982
95,313$ 5,000$ -$ 31,030$ -$ 16,548$ 1,100$ 521,261$ 132,293$ 16,267$ 55,373$ 50,897$
Special Revenue Funds
CHEROKEE COUNTY, SOUTH CAROLINANONMAJOR GOVERNMENTAL FUNDS
CHANGES IN FUND BALANCES - CONTINUEDCOMBINING STATEMENT OF REVENUES, EXPENDITURES AND
FOR THE YEAR ENDED JUNE 30, 2017
(70)

RevenuesTaxesIntergovernmentalInterestCharges for servicesConfiscated moneyMiscellaneous
ExpendituresCurrent General government Public safety Transportation Health and human services Environmental and housing Culture and recreation
Capital outlay Debt service Principal retirement Interest and fiscal charges
Excess (Deficiency) of RevenuesOver (Under) Expenditures
Other Financing Sources (Uses)Transfers inTransfers out
Total other financing sources (uses)
Net Change in Fund Balances
Fund Balances - Beginning of Year
Fund Balances - End of Year
Schedule 8 - Continued
Fire Sheriff Sheriff Federal Title IV-D Bulletproof Emergency DevelopmentEPD Insurance Hardship DSS Drug Incentives Vests Solicitor Management Library Board
-$ -$ -$ -$ -$ -$ -$ -$ -$ 803,367$ -$ - 104,935 - 11,995 - 42,787 - - 61,583 123,935 - - - - - - - - - - - 28 - - - - - - - - - 38,016 - - - - - 304,993 - - 40,113 - - -
15,000 - - - - - 125 - - 9,525 27,000 15,000 104,935 - 11,995 304,993 42,787 125 40,113 61,583 974,843 27,028
- - - - - - - 20,030 14,050 - 205,733 4,329 - - 8,162 182,765 - - - - - -
- - - - - - - - - - - - 102,408 - - - 1,806 - - - - - - - - - - - - - - - - - - - - - - - - - 879,702 -
3,636 - - - 159,699 2,150 - - 66,280 - -
- - - - - - - - - - - - - - - - - - - - - -
7,965 102,408 - 8,162 342,464 3,956 - 20,030 80,330 879,702 205,733
7,035 2,527 - 3,833 (37,471) 38,831 125 20,083 (18,747) 95,141 (178,705)
- - - - - - - - - - 170,000 - - - - - - - (30,669) - - - - - - - - - - (30,669) - 170,000
7,035 2,527 - 3,833 (37,471) 38,831 125 20,083 (49,416) 95,141 (8,705)
52,201 102,408 9,807 20,354 56,263 203,255 2,325 7,325 49,416 1,127,576 150,634
59,236$ 104,935$ 9,807$ 24,187$ 18,792$ 242,086$ 2,450$ 27,408$ -$ 1,222,717$ 141,929$
Special Revenue Funds
CHEROKEE COUNTY, SOUTH CAROLINANONMAJOR GOVERNMENTAL FUNDS
COMBINING STATEMENT OF REVENUES, EXPENDITURES ANDCHANGES IN FUND BALANCES - CONTINUED
FOR THE YEAR ENDED JUNE 30, 2017
(71)
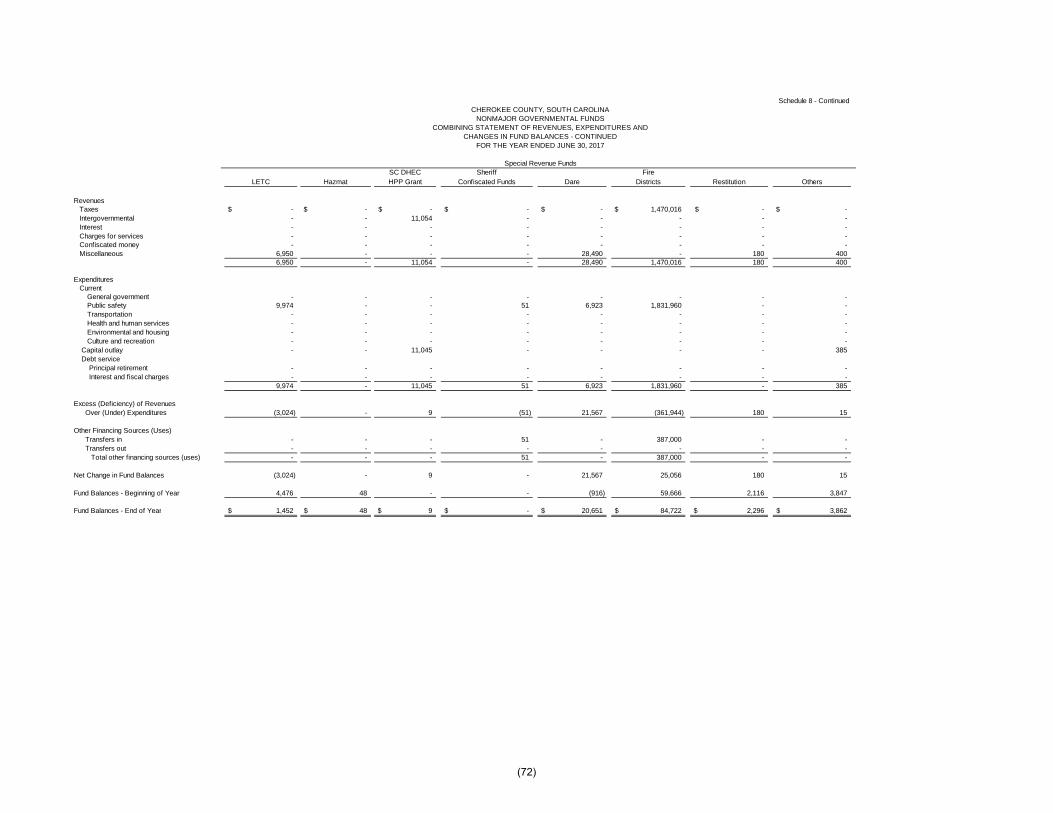
RevenuesTaxesIntergovernmentalInterestCharges for servicesConfiscated moneyMiscellaneous
ExpendituresCurrent General government Public safety Transportation Health and human services Environmental and housing Culture and recreation
Capital outlay Debt service Principal retirement Interest and fiscal charges
Excess (Deficiency) of RevenuesOver (Under) Expenditures
Other Financing Sources (Uses)Transfers inTransfers out
Total other financing sources (uses)
Net Change in Fund Balances
Fund Balances - Beginning of Year
Fund Balances - End of Year
Schedule 8 - Continued
SC DHEC Sheriff Fire LETC Hazmat HPP Grant Confiscated Funds Dare Districts Restitution Others
-$ -$ -$ -$ -$ 1,470,016$ -$ -$ - - 11,054 - - - - - - - - - - - - - - - - - - - - - - - - - - - - -
6,950 - - - 28,490 - 180 400 6,950 - 11,054 - 28,490 1,470,016 180 400
- - - - - - - - 9,974 - - 51 6,923 1,831,960 - -
- - - - - - - - - - - - - - - - - - - - - - - - - - - - - - - - - - 11,045 - - - - 385
- - - - - - - - - - - - - - - -
9,974 - 11,045 51 6,923 1,831,960 - 385
(3,024) - 9 (51) 21,567 (361,944) 180 15
- - - 51 - 387,000 - - - - - - - - - - - - - 51 - 387,000 - -
(3,024) - 9 - 21,567 25,056 180 15
4,476 48 - - (916) 59,666 2,116 3,847
1,452$ 48$ 9$ -$ 20,651$ 84,722$ 2,296$ 3,862$
Special Revenue Funds
CHEROKEE COUNTY, SOUTH CAROLINANONMAJOR GOVERNMENTAL FUNDS
COMBINING STATEMENT OF REVENUES, EXPENDITURES ANDCHANGES IN FUND BALANCES - CONTINUED
FOR THE YEAR ENDED JUNE 30, 2017
(72)

RevenuesTaxesIntergovernmentalInterestCharges for servicesConfiscated moneyMiscellaneous
ExpendituresCurrent General government Public safety Transportation Health and human services Environmental and housing Culture and recreation
Capital outlay Debt service Principal retirement Interest and fiscal charges
Excess (Deficiency) of RevenuesOver (Under) Expenditures
Other Financing Sources (Uses)Transfers inTransfers out
Total other financing sources (uses)
Net Change in Fund Balances
Fund Balances - Beginning of Year
Fund Balances - End of Year
Schedule 8 - Continued
Debt7th Circ. Emergency Electronic Service
Re-Con Group Solicitor Gambling Mgmt/Co-Gen Monitoring Fund Totals
-$ -$ -$ -$ 1,008,628$ 3,282,011$ 100,000.00 - - - - 3,695,647
- - - - - 33 - - - - - 38,016 - 2,028 - - - 347,134 - - - 139,554 - 752,068
100,000 2,028 - 139,554 1,008,628 8,114,909
100,000 1,250 - - - 624,658
- - - 71,508 - 2,175,116 - - - - - 4,736,428 - - - - - 116,548 - - - - - 13,716 - - - - - 879,702 - - - - - 292,003
- - - - 630,000 630,000 - - - - 210,120 210,120
100,000 1,250 - 71,508 840,120 9,678,291
- 778 - 68,046 168,508 (1,563,382)
- - - - - 836,792 - - - (103,826) - (1,546,890)
- - (103,826) - (710,098)
- 778 - (35,780) 168,508 (2,273,480)
546,066 2,000 35,780 1,352,016 9,747,732
-$ 546,844$ 2,000$ -$ 1,520,524$ 7,474,252$
Special Revenue Funds
CHEROKEE COUNTY, SOUTH CAROLINANONMAJOR GOVERNMENTAL FUNDS
COMBINING STATEMENT OF REVENUES, EXPENDITURES ANDCHANGES IN FUND BALANCES - CONTINUED
FOR THE YEAR ENDED JUNE 30, 2017
(73)

Schedule 9
Out of
Cherokee Spartanburg Support Town Finance Magistrates TaxNo. 1 No. 2 Office Surety Bonds Bondsmen Officer Cash Bonds Collector
Assets
Cash 35,315,681$ -$ 50,431$ 2,552$ 75,838$ 80,932$ 183,709$ 640,740$ Other receivables - - - - - - - - Taxes receivable (net) 1,098,275 174,678 - - - - - -
36,413,956$ 174,678$ 50,431$ 2,552$ 75,838$ 80,932$ 183,709$ 640,740$
Liabilities
Due to other designated recipients 36,413,956$ 174,678$ 50,431$ 2,552$ 75,838$ 80,932$ 183,709$ 640,740$
36,413,956$ 174,678$ 50,431$ 2,552$ 75,838$ 80,932$ 183,709$ 640,740$
School District
CHEROKEE COUNTY, SOUTH CAROLINAAGENCY FUNDS
COMBINING STATEMENT OF FIDUCIARY NET POSITIONJUNE 30, 2017
Clerk of Court
(74)

Assets
CashOther receivablesTaxes receivable (net)
Liabilities
Due to other designated recipients
Schedule 9 - Continued
InmateCherokee City of Sheriff's Trust Recreation CCCADA - Town of
Tech Chesnee Drug Fund Funds District Mini Bottle Tax Blacksburg Macedonia Total
-$ -$ 51,171$ 6,540$ -$ 15,976$ -$ -$ 36,423,570$ - - - - - 30,467 - - 30,467
16,239 385 - - 24,340 - 26,366 4,439 1,344,722
16,239$ 385$ 51,171$ 6,540$ 24,340$ 46,443$ 26,366$ 4,439$ 37,798,759$
16,239$ 385$ 51,171$ 6,540$ 24,340$ 46,443$ 26,366$ 4,439$ 37,798,759$
16,239$ 385$ 51,171$ 6,540$ 24,340$ 46,443$ 26,366$ 4,439$ 37,798,759$
CHEROKEE COUNTY, SOUTH CAROLINAAGENCY FUNDS
COMBINING STATEMENT OF FIDUCIARY NET POSITIONJUNE 30, 2017
(75)

Schedule 10CHEROKEE COUNTY, SOUTH CAROLINA
AGENCY FUNDSCOMBINING STATEMENT OF CHANGES IN FIDUCIARY NET POSITION
FOR THE YEAR ENDED JUNE 30, 2017
Balance BalanceJuly 1, 2016 Additions Deductions June 30, 2017
School District - Cherokee No. 1AssetsCash 26,929,548$ 107,253,336$ 98,867,203$ 35,315,681$ Taxes receivable (net) 1,082,719 1,098,275 1,082,719 1,098,275
28,012,267$ 108,351,611$ 99,949,922$ 36,413,956$
LiabilitiesDue to other designated recipients 28,012,267$ 108,351,611$ 99,949,922$ 36,413,956$
28,012,267$ 108,351,611$ 99,949,922$ 36,413,956$
School District - Sptbg. No. 2AssetsTaxes receivable (net) 75,527$ 1,056,959$ 957,808$ 174,678$
LiabilitiesDue to other designated recipients 75,527$ 1,056,959$ 957,808$ 174,678$
Support OfficeAssetsCash 48,996$ 5,749,021$ 5,747,586$ 50,431$
LiabilitiesDue to other designated recipients 48,996$ 5,749,021$ 5,747,586$ 50,431$
Clerk of Court - Out of Town Surety BondsAssetsCash 3,528$ 4,590$ 5,566$ 2,552$
LiabilitiesDue to other designated recipients 3,528$ 4,590$ 5,566$ 2,552$
Clerk of Court - BondsmenAssetsCash 75,816$ 22$ -$ 75,838$
LiabilitiesDue to other designated recipients 75,816$ 22$ -$ 75,838$
Clerk of Court - Finance OfficerAssetsCash 81,655$ 200$ 923$ 80,932$
LiabilitiesDue to other designated recipients 81,655$ 200$ 923$ 80,932$
(76)

Schedule 10 - ContinuedCHEROKEE COUNTY, SOUTH CAROLINA
AGENCY FUNDSCOMBINING STATEMENT OF CHANGES IN FIDUCIARY
NET POSITION - CONTINUEDFOR THE YEAR ENDED JUNE 30, 2017
Balance BalanceJuly 1, 2016 Additions Deductions June 30, 2017
Magistrate Cash BondsAssetsCash 189,996$ 1,160,819$ 1,167,106$ 183,709$
LiabilitiesDue to other designated recipients 189,996$ 1,160,819$ 1,167,106$ 183,709$
Tax CollectorAssetsCash 729,181$ 3,773,825$ 3,862,266$ 640,740$
LiabilitiesDue to other designated recipients 729,181$ 3,773,825$ 3,862,266$ 640,740$
Cherokee TechAssetsTaxes receivable (net) 14,726$ 524,649$ 523,136$ 16,239$
Liabilities Due to other designated recipients 14,726$ 524,649$ 523,136$ 16,239$
City of ChesneeAssetsTaxes receivable (net) 472$ 39,520$ 39,607$ 385$
LiabilitiesDue to other designated recipients 472$ 39,520$ 39,607$ 385$
Sheriff's Drug FundAssetsCash 51,171$ -$ -$ 51,171$
LiabilitiesDue to other designated recipients 51,171$ -$ -$ 51,171$
Inmate Trust FundAssetsCash 26,397$ 329,492$ 349,349$ 6,540$
Liabilities Due to other designated recipients 26,397$ 329,492$ 349,349$ 6,540$
(77)

Schedule 10 - ContinuedCHEROKEE COUNTY, SOUTH CAROLINA
AGENCY FUNDSCOMBINING STATEMENT OF CHANGES IN FIDUCIARY
NET POSITION - CONTINUEDFOR THE YEAR ENDED JUNE 30, 2017
Balance BalanceJuly 1, 2016 Additions Deductions June 30, 2017
Recreation DistrictAssetsTaxes receivable (net) 22,831$ 688,505$ 686,996$ 24,340$
LiabilitiesDue to other designated recipients 22,831$ 688,505$ 686,996$ 24,340$
CCCADA - Mini Bottle TaxAssetsCash 15,976$ 85,197$ 85,197$ 15,976$ Other receivables 30,467 30,467$ 30,467$ 30,467
46,443$ 115,664$ 115,664$ 46,443$
LiabilitiesDue to other designated recipients 46,443$ 115,664$ 115,664$ 46,443$
Town of Blacksburg - BondsAssetsCash -$ 51,296$ 51,296$ -$
LiabilitiesDue to other designated recipients -$ 51,296$ 51,296$ -$
Town of Blacksburg - BondsAssetsTaxes receivable (net) -$ 26,366$ -$ 26,366$
LiabilitiesDue to other designated recipients -$ 26,366$ -$ 26,366$
MacedoniaAssetsTaxes receivable (net) 3,876$ 155,869$ 155,306$ 4,439$
LiabilitiesDue to other designated recipients 3,876$ 155,869$ 155,306$ 4,439$
Total - All Agency FundsAssetsCash 28,152,264$ 118,407,798$ 110,136,492$ 36,423,570$ Other receivables 30,467 30,467 30,467 30,467 Taxes receivable (net) 1,200,151 3,590,143 3,445,572 1,344,722
29,382,882$ 122,028,408$ 113,612,531$ 37,798,759$ LiabilitiesDue to other designated recipients 29,382,882$ 122,028,408$ 113,612,531$ 37,798,759$
29,382,882$ 122,028,408$ 113,612,531$ 37,798,759$
(78)

Schedule 11CHEROKEE COUNTY, SOUTH CAROLINA
SPECIAL REVENUE FUNDS - FIRE DISTRICTSCOMBINING BALANCE SHEET
JUNE 30, 2017
GoucherBuffalo Antioch Cherokee Creek Corinth Gaffney Area CKC Grassy Pond DMW White Plains
Fire District Fire District Fire District Fire District Fire District Fire District Fire District Fire District Fire District Totals
AssetsTaxes receivable (net) 5,845$ 2,537$ 13,691$ 2,726$ 11,154$ 4,162$ 4,252$ 1,326$ 2,253$ 47,946$ Due from other funds 4,159 2,601 17,602 10,249 15,880 7,780 7,147 5,320 9,339 80,077
10,004$ 5,138$ 31,293$ 12,975$ 27,034$ 11,942$ 11,399$ 6,646$ 11,592$ 128,023$
LiabilitiesDue to other funds -$ -$ -$ -$ -$ -$ -$ -$ -$ -$
Deferred Inflows of ResourcesUnavailable revenues - property taxes 5,729 1,914 13,197 2,275 10,053 3,750 2,804 1,326 2,253 43,301
Fund BalancesFund balances 4,273 3,225 18,096 10,701 16,981 8,191 8,596 5,320 9,339 84,722
10,002$ 5,139$ 31,293$ 12,976$ 27,034$ 11,941$ 11,400$ 6,646$ 11,592$ 128,023$
(79)

Schedule 12CHEROKEE COUNTY, SOUTH CAROLINA
SPECIAL REVENUE FUNDS - FIRE DISTRICTSCOMBINING STATEMENT OF REVENUES, EXPENDITURES AND CHANGES IN FUND BALANCE
FOR THE YEAR ENDED JUNE 30, 2017
Goucher Buffalo Antioch Cherokee Creek Corinth Gaffney Area CKC Grassy Pond DMW White Plains
Fire District Fire District Fire District Fire District Fire District Fire District Fire District Fire District Fire District Totals
RevenuesTaxes 67,982$ 99,830$ 223,378$ 85,747$ 614,799$ 76,092$ 160,016$ 39,415$ 102,757$ 1,470,016$
ExpendituresCurrent
Public safety 97,463 146,872 266,511 135,932 632,225 130,517 201,927 80,595 139,918 1,831,960
Excess (Deficiency) of Revenues OverExpenditures (29,481) (47,042) (43,133) (50,185) (17,426) (54,425) (41,911) (41,180) (37,161) (361,944)
Other Financing SourcesTransfers in 46,500 46,500 46,500 46,500 15,000 46,500 46,500 46,500 46,500 387,000
Net Change in Fund Balance 17,019 (542) 3,367 (3,685) (2,426) (7,925) 4,589 5,320 9,339 25,056
Fund Balance - Beginning of Year (12,746) 3,767 14,729 14,386 19,407 16,116 4,007 - - 59,666
Fund Balance - End of Year 4,273$ 3,225$ 18,096$ 10,701$ 16,981$ 8,191$ 8,596$ 5,320$ 9,339$ 84,722$
(80)

Schedule 13CHEROKEE COUNTY, SOUTH CAROLINA
CAPITAL ASSETS USED IN THE OPERATION OF GOVERNMENTAL FUNDSSCHEDULE BY FUNCTION AND ACTIVITY
JUNE 30, 2017
Construction ImprovementsIn Other than Machinery
Function and Activity Progress Land Buildings Buildings and Equipment Infrastructure Books Total
General government -$ 395,885$ 12,757,402$ 38,960$ 3,321,348$ 115,728$ -$ 16,629,323$ Public safety 497,845 254,958 9,724,052 23,332 6,486,859 - - 16,987,046 Transportation - - 139,221 - 1,523,085 30,619,256 - 32,281,562 Health and human services - 107,500 877,803 7,145 164,446 - - 1,156,894 Environmental and housing - 715,026 694,679 123,681 4,318,499 - - 5,851,885 Culture and recreation - 215,526 2,699,915 48,310 877,218 - 1,103,732 4,944,701
Total 497,845$ 1,688,895$ 26,893,072$ 241,428$ 16,691,455$ 30,734,984$ 1,103,732$ 77,851,411$
(81)
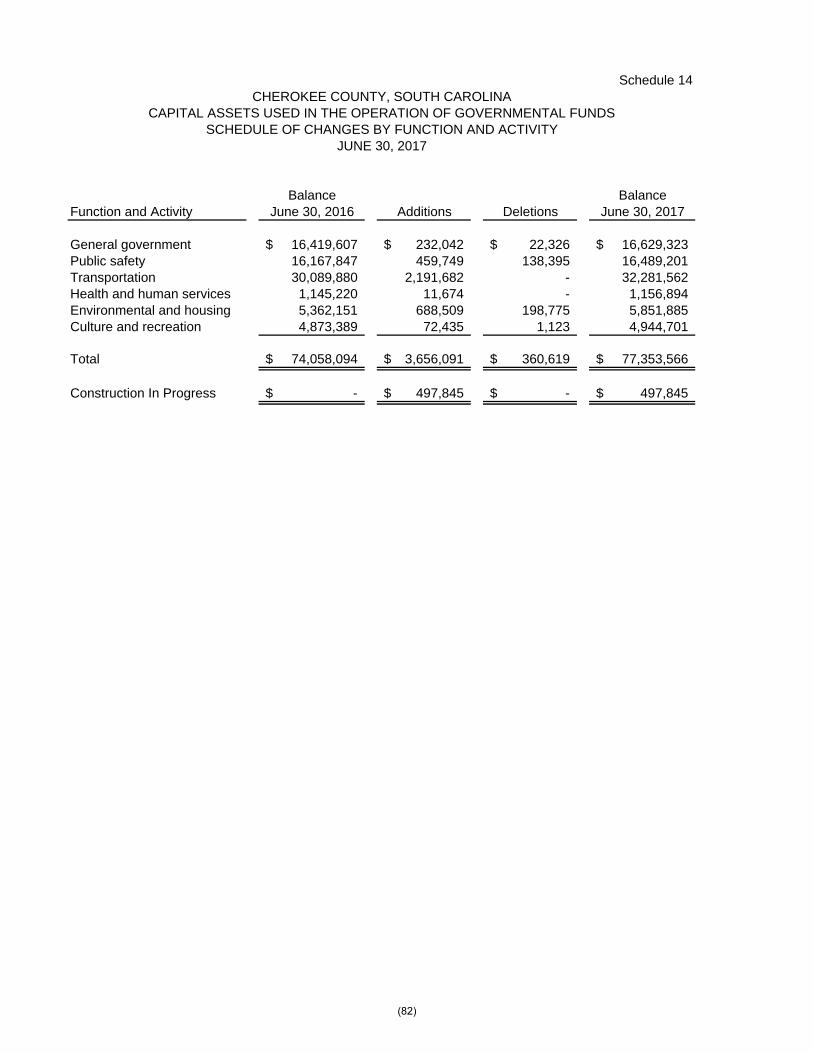
Schedule 14
Balance BalanceFunction and Activity June 30, 2016 Additions Deletions June 30, 2017
General government 16,419,607$ 232,042$ 22,326$ 16,629,323$ Public safety 16,167,847 459,749 138,395 16,489,201 Transportation 30,089,880 2,191,682 - 32,281,562 Health and human services 1,145,220 11,674 - 1,156,894 Environmental and housing 5,362,151 688,509 198,775 5,851,885 Culture and recreation 4,873,389 72,435 1,123 4,944,701
Total 74,058,094$ 3,656,091$ 360,619$ 77,353,566$
Construction In Progress -$ 497,845$ -$ 497,845$
CHEROKEE COUNTY, SOUTH CAROLINACAPITAL ASSETS USED IN THE OPERATION OF GOVERNMENTAL FUNDS
SCHEDULE OF CHANGES BY FUNCTION AND ACTIVITYJUNE 30, 2017
(82)

STATISTICAL SECTION


STATISTICAL SECTION
This part of Cherokee County’s comprehensive annual financial report presents detailed information as a context for understanding what the information in the financial statements, note disclosures, and required supplementary information says about the government’s overall financial health.
Contents Page Financial Trends Information 84-88 These schedules contain trend information to help the reader understand how the
County’s financial performance and well-being have changed over time. Revenue Capacity Information 89-92 These schedules contain information to help the reader assess the County’s most
significant local revenue source, the property tax. Debt Capacity Information 93-96 These schedules present information to help the reader assess the affordability of
the County’s current levels of outstanding debt and the County’s ability to issue additional debt in the future.
Demographic and Economic Information 97-99 These schedules offer demographic and economic indicators to help the reader
understand the environment within which the County’s financial activities take place and to help make comparisons over time and with other governments.
Operating Information 100-101 These schedules contain information about the County’s operations and resources
to help the reader understand how the County’s financial information relates to the services the County provides and the activities it performs.
(83)

Table 1
2017 2016 2015 2014 2013 2012 2011 2010 2009 2008Governmental Activities
Net investment in capital assets 37,570,610$ 36,357,598$ 35,801,839$ $34,273,755 $33,495,461 27,349,580$ 26,430,868$ 25,331,374$ 23,674,676$ 21,610,643$ Restricted 9,971,317 8,555,119 7,370,241 4,080,442 3,280,976 4,542,499 4,979,719 1,234,126 1,440,463 1,245,124 Unrestricted 3,838,901 7,829,029 (7,271,567) 8,162,509 6,556,049 9,300,952 8,970,730 11,747,627 10,978,978 11,151,706
Total Governmental Activities Net Position 51,380,828 52,741,746 35,900,513 46,516,706 43,332,486 41,193,031 40,381,317 38,313,127 36,094,117 34,007,473
Business-type ActivitiesNet investment in capital assets - - 500,757 554,905 533,959 599,338 657,557 907,982 922,608 922,608 Unrestricted - - (2,518,035) 2,303,871 2,097,497 1,751,849 827,393 398,351 388,277 388,277
Total Business-type Activities Net Position - - (2,017,278) 2,858,776 2,631,456 2,351,187 1,484,950 1,306,333 1,310,885 1,310,885
Primary GovernmentNet investment in capital assets 37,570,610 36,357,598 36,302,596 34,828,660 34,029,420 27,948,918 27,088,425 26,239,356 24,597,284 22,533,251 Restricted 9,971,317 8,555,119 7,370,241 4,080,442 3,280,976 4,542,499 4,979,719 1,234,126 1,440,463 1,245,124 Unrestricted 3,838,901 7,829,029 (9,789,602) 10,466,380 8,653,546 11,052,801 9,798,123 12,145,978 11,367,255 11,539,983
Total Primary Government Net Position 51,380,828$ $52,741,746 $33,883,235 49,375,482$ 45,963,942$ 43,544,218$ 41,866,267$ 39,619,460$ 37,405,002$ 35,318,358$
As of 2008, the Library, Development Board and Fire Districts are included in Governmental Activities.
Net Position by ComponentCherokee County, South Carolina
Last Ten Fiscal Years(accrual basis of accounting)
Fiscal Year
(84)

Table 2
2017 2016 2015 2014 2013 2012 2011 2010 2009 2008ExpensesGovernmental Activities:
General government 9,075,414$ 9,659,016$ 7,403,422$ $6,931,010 7,212,409$ 6,260,382$ 8,155,844$ 8,654,626$ 9,040,423$ 7,806,099$ Public safety 12,549,976 11,471,822 10,819,767 10,614,321 10,100,465 9,605,722 7,936,240 7,740,260 7,908,278 7,844,863 Transportation 4,730,303 1,694,096 1,603,765 1,771,970 1,084,307 1,824,343 1,358,602 1,581,692 1,651,157 2,012,355 Health and human services 1,022,910 1,024,905 1,014,252 993,175 1,052,832 981,740 1,075,896 1,077,063 1,107,409 1,061,283 Environmental and housing 2,823,167 2,969,547 2,197,796 2,944,477 2,800,475 2,999,695 2,733,472 1,853,376 1,768,879 3,959,027 Cultural and recreation 1,309,948 913,265 932,229 940,887 923,610 1,000,711 995,656 989,499 988,793 979,020 Economic Development - 241,728 Other 2,949 - - - - - - - - - Unallocated interest expense 206,550 227,403 247,521 428,632 297,181 338,050 118,486 106,411 149,342 190,665
Total Governmental Activities Expenses 31,721,217 28,201,782 24,218,752 24,624,472 23,471,279 23,010,643 22,374,196 22,002,927 22,614,281 23,853,312
Business-type Activities:Geriatrics - 4,333,885 7,971,637 7,535,056 7,665,950 7,464,039 8,027,865 8,360,746 7,787,638 7,736,866
Total Business-type Activities Expense - 4,333,885 7,971,637 7,535,056 7,665,950 7,464,039 8,027,865 8,360,746 7,787,638 7,736,866
Total Primary Government Expenses 31,721,217 32,535,667 32,190,389 32,159,528 31,137,229 30,474,682 30,402,061 30,363,673 30,401,919 31,590,178
Program RevenuesGovernmental Activities:
Charges for services General government 1,341,954 2,448,663 1,713,215 1,390,996 1,431,702 1,423,421 1,657,508 1,543,497 1,876,439 1,971,794 Public safety 632,661 587,388 618,777 582,832 559,290 557,972 639,776 687,036 1,201,382 872,959 Transportation - - - - - - - 83 131 - Health and human services 155,398 185,027 210,268 210,274 201,636 233,170 239,331 193,361 207,674 127,279 Environmental and housing 417,972 312,837 342,482 280,138 262,387 582,765 513,058 406,528 185,596 260,938 Cultural and recreation 40,295 45,762 38,212 35,544 40,521 44,212 43,677 - - - Other - - - - - - - 42,460 41,021 37,378
Operating grants and contributions 3,796,009 7,386,396 2,835,655 3,098,229 2,373,406 2,042,486 1,863,193 2,675,538 1,909,316 2,252,470 Capital grants and contributions 552,225 425,506 607,976 485,757 1,316,162 873,927 1,083,180 625,121 1,026,399 2,020,221
Total Governmental Activities Program Revenues 6,936,514$ 11,391,579$ 6,366,585$ 6,083,770$ 6,185,104$ 5,757,953$ 7,543,039$ 6,173,624$ 6,447,958$ 7,543,039$
Business-type Activities:Charges for services
Geriatrics -$ 3,795,758$ 8,687,868$ 8,566,325$ 8,336,570$ 8,114,108$ 8,207,671$ 8,158,560$ 7,320,992$ 7,685,471$ Total Business-type Activities Program Revenues - 3,795,758 8,687,868 8,566,325 8,336,570 8,114,108 7,685,471 8,158,560 7,320,992 7,685,471
Total Primary Government Program Revenues 6,936,514 15,187,337 15,054,453 14,650,095 14,332,184 13,872,061 15,228,510 14,332,184 13,768,950 15,228,510
Net (Expense) RevenueGovernmental Activities (24,784,703) (16,810,203) (17,852,167) (18,540,702) (17,286,175) (17,252,690) (16,334,473) (15,829,303) (16,166,323) (16,310,273) Business-type Activities - (538,127) 716,231 1,031,269 670,620 650,069 179,806 (202,186) (466,646) (51,395)
Total Primary Government (24,784,703)$ (17,348,330)$ (17,135,936)$ (17,509,433)$ (16,615,555)$ (16,602,621)$ (16,154,667)$ (16,031,489)$ (16,632,969)$ (16,361,668)$
Cherokee County, South CarolinaChange in Net PositionLast Ten Fiscal Years
(accrual basis of accounting)
Fiscal Year
(85)

Table 2 - Continued
2017 2016 2015 2014 2013 2012 2011 2010 2009 2008General Revenues and Other
Changes in Net PositionGovernmental Activities:
Taxes 20,139,461$ 19,560,551$ 18,855,548$ 18,616,303$ 17,028,528$ 16,577,172$ 15,981,345$ 15,587,679$ 15,072,161$ 15,192,856$ Unrestricted state aid to political subdivisions 2,151,798 2,056,682 1,812,111 2,048,934 2,037,763 1,717,699 1,968,973 2,410,742 2,887,564 3,027,933 Unrestricted investment earnings 107,071 40,150 37,695 36,492 14,893 49,000 86,089 102,750 152,621 504,601 Miscellaneous 1,025,455 340,733 369,861 219,243 112,555 86,699 196,524 144,776 177,816 111,843 Special item - forgiveness of advance - - - 591,850 - - - - - - Transfers - 11,653,320 - 212,100 (1,068) (216,168) 1,189 (197,634) (163,157) (166,944)
Total Governmental Activities 23,423,785 33,651,436 21,075,215 21,724,922 19,192,671 18,214,402 18,234,120 18,048,313 18,127,005 18,670,289
Business-type Activities:Special item - 14,208,725 - (591,850) - - - - - - Transfers - (11,653,320) - (212,100) 1,068 (1,189) 197,634 187,444 166,944 182,726
Total Business-type Activities - 2,555,405 - (212,100) 1,068 (1,189) 197,634 187,444 166,944 182,726
Total Primary Government 23,423,785 36,206,841 21,075,215 21,512,822 19,193,739 18,213,213 18,431,754 18,235,757 18,293,949 18,853,015
Change in Net PositionGovernmental Activities (1,360,918) 16,841,233 3,223,048 3,184,220 1,906,496 1,899,647 2,219,010 1,960,682 2,360,016 2,360,016 Business-type Activities - 2,017,278 716,231 227,319 671,688 178,617 (4,552) (279,202) 115,549 131,331
Total Primary Government (1,360,918)$ 18,858,511$ 3,939,279$ 3,411,539$ 2,578,184$ 2,078,264$ 2,214,458$ 1,681,480$ 2,475,565$ 2,491,347$
As of 2008, the Library, Development Board and Fire Districts are included in Governmental Activities.
Cherokee County, South CarolinaChange in Net Position - Continued
Last Ten Fiscal Years(accrual basis of accounting)
Fiscal Year
(86)

Table 3Cherokee County, South Carolina
Fund Balances of Governmental FundsLast Ten Fiscal Years
(modified accrual basis of accounting)
2017 2016 2015 2014 2013 2012 2011 (1) 2010 2009 2008General Fund
Reserved -$ -$ -$ -$ -$ -$ -$ 829,019$ 936,322$ 723,348$ Unreserved - - - - - - - 10,371,760 10,510,800 11,600,545 Nonspendable 399,912 216,120 282,997 209,952 312,223 183,018 181,869 - - - Restricted - - - - - - - - - - Committed - - - - - - 1,937,136 - - - Assigned 4,892,361 4,470,846 3,600,135 2,793,932 2,793,722 2,561,859 2,263,498 - - - Unassigned 24,735,237 24,554,144 11,422,304 10,421,313 8,398,736 9,225,466 7,291,827 - - -
Total General Fund 30,027,510 29,241,110 15,305,436 13,425,197 11,504,681 11,970,343 11,674,330 11,200,779 11,447,122 12,323,893
All Other Governmental FundsReserved
Debt service - - - - - - - 1,180,984 1,379,643 1,202,248 Other reserves - - - - - - - 25,439 19,962 18,223
Unreserved, reported in:Capital projects - - - - - - - 5,053,873 4,652,669 5,096,517 Special revenue funds - - - - - - - 4,012,393 2,770,969 2,644,447
Nonspendable 13,978 2,870,261 1,113,592 389,581 277,843 11,478 11,456 - - - Restricted 9,970,065 8,553,867 7,370,241 4,079,190 3,279,724 5,264,163 13,256,724 - - - Assigned 2,505,485 3,666,376 3,389,294 3,743,750 3,890,692 6,641,502 6,297,072 - - - Unassigned - 110,183 31,398 16,527 (1,241) (39,471) (21,967) - - -
Total All Other Governmental Funds 12,489,528 15,200,687 11,904,525 8,229,048 7,447,018 11,877,672 19,543,285 10,272,689 8,823,243 8,961,435
Total Governmental Fund Balance 42,517,038$ 44,441,797$ 27,209,961$ 21,654,245$ 18,951,699$ 23,848,015$ 31,217,615$ 21,473,468$ 20,270,365$ 21,285,328$
Note: As of 2008, the Library, Development Board and Fire Districts are included in Governmental Funds.
(1) The presentation of fund balance changed in 2011 as a result of the implementation of GASB 54.
Fiscal Year
(87)

Table 4Cherokee County, South Carolina
Changes in Fund Balances of Governmental FundsLast Ten Fiscal Years
(modified accrual basis of accounting)
2017 2016 2015 2014 2013 2012 2011 2010 2009 2008Revenues
Taxes 18,724,332$ 18,121,264$ 18,370,356$ 18,083,828$ 16,666,948$ 16,305,696$ 15,620,801$ 15,452,837$ 14,505,754$ 14,867,165$ Licenses and permits 246,684 553,357 201,238 146,092 152,487 162,036 177,446 155,091 152,132 236,839 Intergovernmental 7,256,364 11,197,349 5,291,837 5,301,159 5,451,215 4,902,304 4,745,559 5,543,031 6,183,958 7,131,797 Charges for services 926,332 846,448 880,891 716,515 747,521 974,003 1,052,764 909,095 844,946 836,715 Contributions 472,004 50,000 306,733 - - - - - - - Fines 598,771 618,700 628,046 657,793 605,233 596,815 666,618 642,414 823,834 864,270 Interest 107,428 40,176 37,696 36,493 14,893 49,001 86,149 102,979 162,608 547,607 Miscellaneous 2,031,706 1,975,599 1,663,718 1,956,973 1,395,663 1,320,760 1,454,862 1,820,842 1,674,086 1,653,043
Total Revenues 30,363,621 33,402,893 27,380,515 26,898,853 25,033,960 24,310,615 23,804,199 24,626,289 24,347,318 26,137,436
ExpendituresGeneral government 7,795,913 8,189,120 6,555,334 6,317,302 6,120,364 5,806,677 7,692,259 8,103,748 8,389,977 7,605,395 Public safety 12,383,527 10,841,788 10,476,019 9,839,655 9,518,997 8,803,348 7,192,714 7,069,961 7,216,186 7,106,831 Transportation 5,679,472 2,452,642 2,625,908 2,302,642 2,047,932 2,238,318 1,835,937 2,174,070 2,325,960 2,099,379 Health and human services 987,442 968,801 972,716 951,177 1,045,886 970,910 1,034,326 1,054,423 1,014,173 1,038,232 Environmental and housing 3,190,842 2,779,699 2,515,825 2,356,312 3,268,715 2,635,579 2,072,358 1,849,208 1,946,850 3,339,914 Culture and recreation 1,213,435 838,001 862,880 852,811 824,456 877,576 878,156 874,088 863,909 888,363 Other 2,949 241,728 33,750 - - - - - - - Capital outlay 293,780 614,600 1,039,395 1,554,217 6,186,197 8,869,332 1,420,490 1,504,421 1,901,007 881,965 Debt service
Interest 210,120 230,860 250,920 268,066 301,142 352,670 62,044 111,398 154,425 195,537 Principal 630,000 610,000 601,388 584,724 564,875 807,004 1,041,500 984,236 862,350 826,750
Total Expenditures 32,387,480 27,767,239 25,934,135 25,026,906 29,878,564 31,361,414 23,229,784 23,725,553 24,674,837 23,982,366
Excess of Revenues Over(Under) Expenditures (2,023,859) 5,635,654 1,446,380 1,871,947 (4,844,604) (7,050,799) 574,415 900,736 (327,519) 2,155,070
Other Financing Sources (Uses)Proceeds from capital lease - - - - - 47,366 - - - - Proceeds from bond issuance - - - - - - 9,000,000 - - - Transfers in (out) 99,099 11,596,183 4,109,335 238,750 106,748 (216,168) 1,189 (197,633) (187,444) (166,944)
Total Other Financing Sources (Uses) 99,099 11,596,183 4,109,335 238,750 106,748 (168,802) 9,001,189 (197,633) (187,444) (166,944)
Special Item Forgiveness of advance due to
Enterprise Fund - - - 591,850 - - - - - -
Net Change in Fund Balance (1,924,760)$ 17,231,837$ 5,555,715$ 2,702,547$ (4,737,856)$ (7,219,601)$ 9,575,604$ 703,103$ (514,963)$ 1,988,126$
Debt Service as a Percentage ofNoncapital Expenditures 2.98% 3.43% 3.91% 3.89% 5.46% 5.37% 5.15% 4.73% 4.57% 5.64%
Note: As of 2008, the Library, Development Board and Fire Districts are included in Governmental Funds.
Fiscal Year
(88)

Table 5Cherokee County, South Carolina
Assessed Value and Estimated Actual Value of Taxable PropertyLast Ten Fiscal Years
Taxable AssessedEstimated Value as a
Fiscal Year Total Taxable Total Actual PercentageEnded Tax Real Personal Less: Assessed Direct Taxable of Actual
June 30, Year Property Property Exemptions Value Tax Rate Value Taxable Value2008 2007 96,118,820 55,969,098 (4,691,040) 147,396,878 83.49 2,734,714,572 5.39%2009 2008 95,407,370 59,002,431 (5,638,960) 148,770,841 85.60 2,741,983,618 5.43%2010 2009 97,894,570 55,714,625 (6,586,260) 147,022,935 83.10 2,853,165,847 5.15%2011 2010 98,877,410 58,298,587 (6,842,660) 150,333,337 83.10 2,794,465,662 5.38%2012 2011 99,412,030 62,396,712 (8,328,260) 153,480,482 83.10 2,824,136,664 5.43%2013 2012 99,849,060 63,667,275 (8,117,490) 155,398,845 83.10 2,735,699,735 5.68%2014 2013 104,916,740 66,392,368 (7,878,110) 163,430,998 88.40 2,862,170,731 5.71%2015 2014 103,986,030 68,281,320 (7,774,990) 164,492,360 88.40 2,916,290,005 5.64%2016 2015 106,497,930 67,371,827 (7,498,250) 166,371,507 91.60 2,936,587,863 5.67%2017 2016 109,176,390 70,167,449 (6,665,250) 172,678,589 91.60 3,034,419,669 5.69%
Source: County Auditor's Office
(89)

Table 6Cherokee County, South Carolina
Direct and Overlapping Property Tax Rates Last Ten Fiscal Years
(rate per $1,000 of assessed value)
2017 2016 2015 2014 2013 2012 2011 2010 2009 2008County Wide Tax Rates
Operating 70.90 70.90 69.90 69.90 64.50 64.50 64.50 64.50 66.40 64.34Library 4.20 4.20 4.20 4.20 4.20 4.20 4.20 4.20 4.30 4.30Recreation 3.40 3.40 3.40 3.40 3.40 3.40 3.40 3.40 3.50 3.50Cherokee Tech 2.60 2.60 1.70 1.70 1.70 1.70 1.70 1.70 1.80 1.75Capital Fund 5.50 5.50 4.00 4.00 4.00 4.00 4.00 4.00 4.15 4.40Debt Service 5.00 5.00 5.00 5.00 5.10 5.10 5.10 5.10 5.20 5.20Airport Funds 0.00 0.20 0.20 0.20 0.20 0.20 0.20 0.20 0.25 0.25
City Rates 120.80 120.80 120.80 120.80 115.00 115.00 115.00 115.00 119.90 119.90Town of Blacksburg 175.00 179.00 162.10 159.80 156.10 206.50 206.50 156.20 171.20 0.00
School District Rate 168.90 168.90 168.90 168.90 166.90 166.90 166.90 166.90 166.90 161.77
Special District Rates CKC 13.00 13.00 12.00 12.00 12.00 12.00 12.00 12.30 12.00 12.00 Buffalo 14.00 14.00 13.50 14.00 13.00 13.00 13.00 15.00 13.00 13.00 Antioch 7.90 7.90 8.00 7.90 8.00 8.00 8.00 7.90 8.00 8.00 Corinth 14.50 14.50 15.00 14.50 15.00 15.00 15.00 15.00 15.00 15.00
Cherokee Creek 18.00 12.00 10.90 10.60 10.90 10.80 10.90 10.90 10.80 10.80Greater Gaffney 12.00 12.00 12.00 12.00 12.00 12.00 12.00 11.20 12.00 12.00Macedonia 8.00 8.00 8.00 8.00 7.90 7.90 7.90 7.90 8.00 8.00Grassy Pond 8.00 8.00 8.00 8.00 8.00 8.00 8.00 8.00 8.00 8.00Goucher 15.00 - - - - - - - - - DMW Dire 15.00 - - - - - - - - -
Source: County Treasurer's Office
(90)

Table 7
2017 2008Percentage of Percentage of
Taxable Total Taxable Taxable Total TaxableAssessed Assessed Assessed Assessed
Taxpayer Value Rank Value Value Rank Value
Duke Energy 14,446,299$ 1 8.68% 4,050,520 2 2.76%
Nestle 7,374,355 2 4.43% 3,869,990 3 2.64%
Milliken 6,714,269 3 4.04% 4,207,360 1 2.87%
Timken 4,149,600 4 2.49% 3,082,860 4 2.10%
Kapstone 3,398,520 5 2.04%
PFP Venture 3,039,491 6 1.83%
Broad River Energy 2,748,830 7 1.65%
Broad River Electric 2,637,536 8 1.59% 2,111,280 6 1.44%
Colonial Pipeline Co 2,579,580 9 1.55% 1,554,350 9 1.06%
Parkdale America LLC 1,928,423 10 1.16%
Lin Pac, Inc 2,210,869 5 1.51%
Bic Corporation 1,649,680 8 1.13%
BellSouth Telecommunications 1,992,960 7 1.36%
Hamricks, INC 1,212,970 10 0.83%
Total top ten taxpayers 49,016,903$ 29.46% 25,942,839$ 17.70%
Source: County Treasurer's Office
Cherokee County, South CarolinaPrincipal Property Taxpayers
June 30, 2017 and 2008
(91)

Table 8Cherokee County, South Carolina
Property Tax Levies and CollectionsLast Ten Fiscal Years
Fiscal Year Taxes Levied Collections
Ended for the Percentage in Subsequent PercentageJune 30, Fiscal Year Amount of Levy Tax Years Amount of Levy
2008 10,106,082$ 9,405,464$ 93.07% 658,700$ 10,064,164$ 99.59%2009 10,560,123 9,402,618 89.04% 907,390 10,310,008 97.63%2010 8,968,005 8,239,772 91.88% 614,532 8,854,304 98.73%2011 8,965,448 8,195,547 91.41% 600,578 8,796,125 98.11%2012 7,235,683 6,698,138 92.57% 485,902 7,184,040 99.29%2013 8,003,178 7,425,271 92.78% 478,148 7,903,419 98.75%2014 10,138,794 9,405,238 92.76% 395,080 9,800,318 96.66%2015 10,298,791 9,612,499 93.34% 379,462 9,991,961 97.02%2016 10,530,223 9,787,892 92.95% 628,975 10,416,867 98.92%2017 11,003,284 10,309,737 93.70% - 10,309,737 0.00%
Source: County Treasurer's Office
Levy and collections recorded at net of exemptions and penalties beginning in 2007.
Collected within theTax Year of the Levy Tax Collections to Date
(92)

Table 9
Governmental ActivitiesFiscal Year General Certificates Certificates Total Percentage
Ended Obligation of Capital Loan of Notes Primary of Personal PerJune 30 Bonds Participation Lease Payable Participation Payable Government Income (1) Capita (1)
2008 2,055,000$ 1,134,200$ - - 1,005,800$ - 4,195,000$ 0.3% 78 2009 1,455,000 871,850 - - 773,150 - 3,100,000 0.2% 57 2010 750,000 593,600 - - 526,400 - 1,870,000 0.1% 34 2011 9,000,000 302,100 - - 267,900 - 9,570,000 0.7% 173 2012 8,500,000 - 42,461 - - - 8,542,461 0.6% 154 2013 7,950,000 - 28,525 - - - 7,978,525 0.5% 143 2014 7,380,000 - 11,174 - - - 7,391,174 0.5% 131 2015 6,790,000 - - 4,000,000 - - 10,790,000 0.7% 192 2016 6,180,000 - - 4,000,000 - - 10,180,000 0.6% 179 2017 5,550,000 - - 4,000,000 - - 9,550,000 0.6% 167
Notes:(1) See the "Demographic and Economic Statistics" table (Table 13) for personal income and population data.
Cherokee County, South CarolinaRatio of Outstanding Debt by Type
Last Ten Fiscal Years
Business-type Activities
(93)

Table 10Cherokee County, South Carolina
Direct and Overlapping Governmental Activities DebtAs of June 30, 2017
EstimatedEstimated Share of
Debt Percent Direct andJurisdiction Outstanding Applicable (1) Overlapping Debt
Direct Debt: Cherokee County 9,550,000$ 100.00% 9,550,000$
Overlapping Debt: City of Gaffney 2,050,979 100.00% 2,050,979 Town of Blacksburg 254,616 100.00% 254,616 Cherokee County School District No. 1 74,392,002 100.00% 74,392,002 SCAGO Education Facilities (on behalf of CCSD#1) 26,905,000 100.00% 26,905,000
Total Overlapping Debt 103,602,597
Total Direct and Overlapping Debt 113,152,597$
(1) For debt repaid with property taxes the percentage of overlapping debt applicable is estimated using taxableassessed property values. Applicable percentages were estimated by determining the portion of anothergovernmental unit's taxable assessed value that is within the County's boundaries and dividing it by each unit'stotal taxable assessed value.
(94)
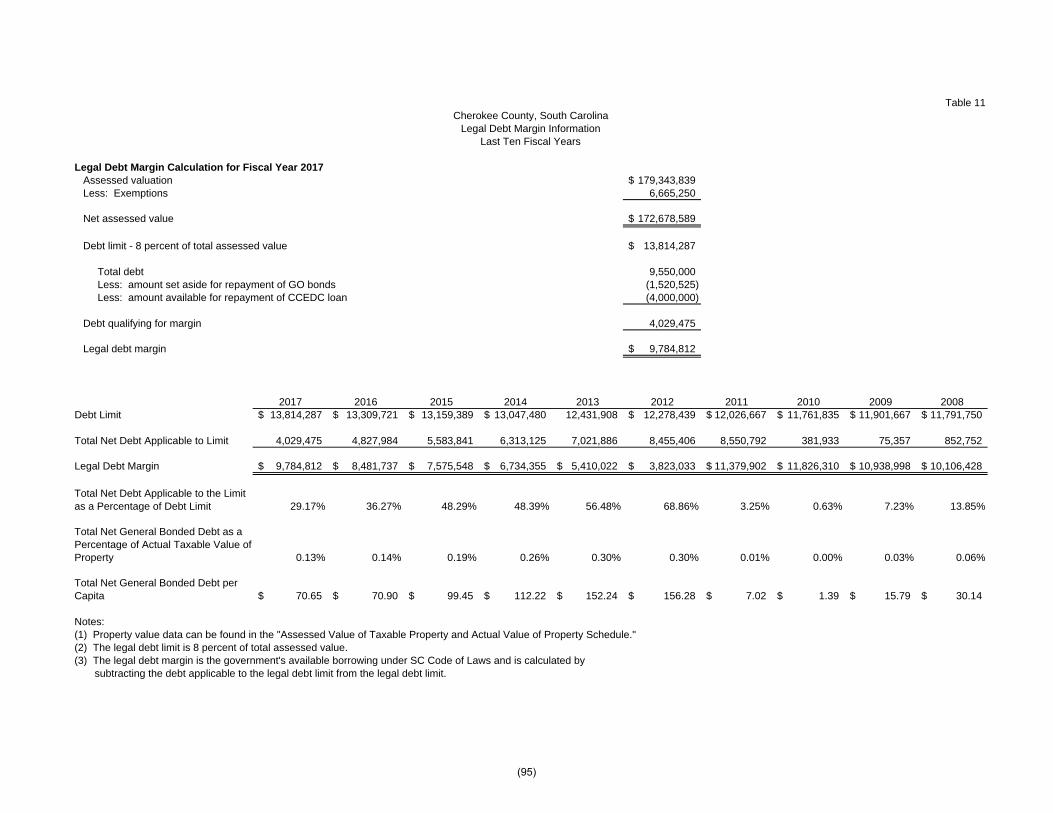
Table 11Cherokee County, South Carolina
Legal Debt Margin InformationLast Ten Fiscal Years
Legal Debt Margin Calculation for Fiscal Year 2017Assessed valuation 179,343,839$ Less: Exemptions 6,665,250
Net assessed value 172,678,589$
Debt limit - 8 percent of total assessed value 13,814,287$
Total debt 9,550,000 Less: amount set aside for repayment of GO bonds (1,520,525) Less: amount available for repayment of CCEDC loan (4,000,000)
Debt qualifying for margin 4,029,475
Legal debt margin 9,784,812$
2017 2016 2015 2014 2013 2012 2011 2010 2009 2008Debt Limit 13,814,287$ 13,309,721$ 13,159,389$ 13,047,480$ 12,431,908 12,278,439$ 12,026,667$ 11,761,835$ 11,901,667$ 11,791,750$
Total Net Debt Applicable to Limit 4,029,475 4,827,984 5,583,841 6,313,125 7,021,886 8,455,406 8,550,792 381,933 75,357 852,752
Legal Debt Margin 9,784,812$ 8,481,737$ 7,575,548$ 6,734,355$ 5,410,022$ 3,823,033$ 11,379,902$ 11,826,310$ 10,938,998$ 10,106,428$
29.17% 36.27% 48.29% 48.39% 56.48% 68.86% 3.25% 0.63% 7.23% 13.85%
0.13% 0.14% 0.19% 0.26% 0.30% 0.30% 0.01% 0.00% 0.03% 0.06%
70.65$ 70.90$ 99.45$ 112.22$ 152.24$ 156.28$ 7.02$ 1.39$ 15.79$ 30.14$
Notes:(1) Property value data can be found in the "Assessed Value of Taxable Property and Actual Value of Property Schedule."(2) The legal debt limit is 8 percent of total assessed value.(3) The legal debt margin is the government's available borrowing under SC Code of Laws and is calculated by
subtracting the debt applicable to the legal debt limit from the legal debt limit.
Total Net Debt Applicable to the Limit as a Percentage of Debt Limit
Total Net General Bonded Debt as a Percentage of Actual Taxable Value of Property
Total Net General Bonded Debt per Capita
(95)
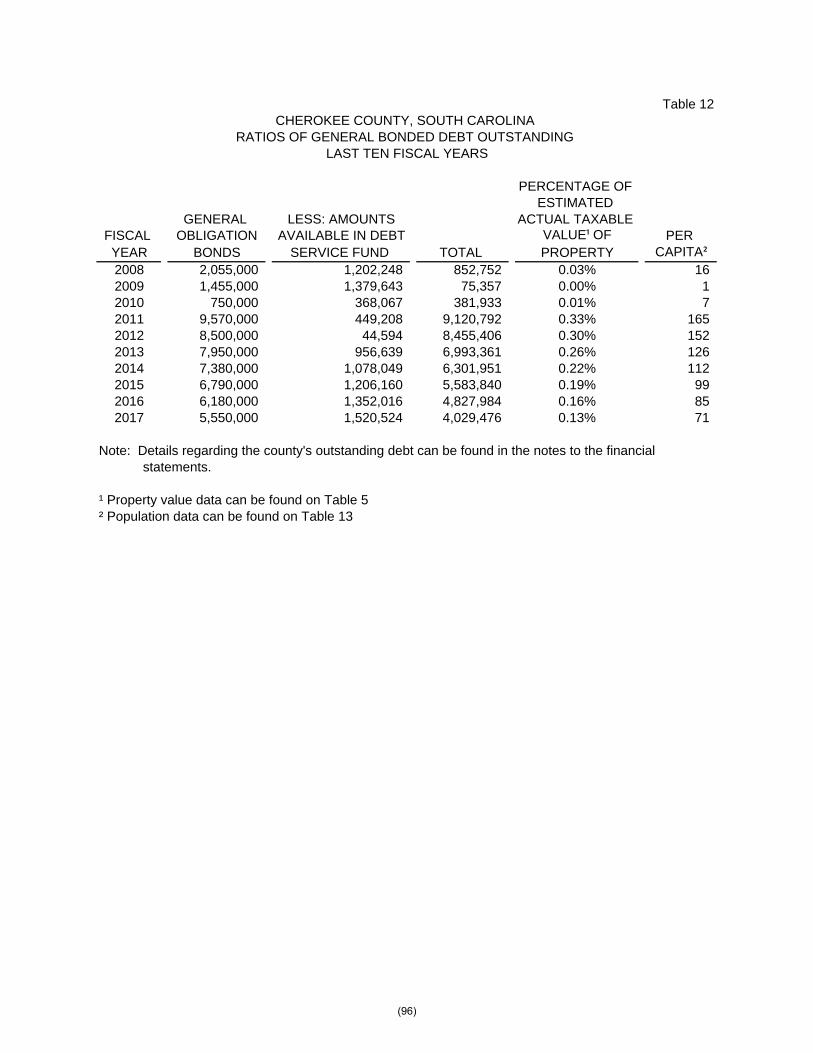
Table 12
PERCENTAGE OF ESTIMATED
GENERAL LESS: AMOUNTS ACTUAL TAXABLE FISCAL OBLIGATION AVAILABLE IN DEBT VALUE¹ OF PER YEAR BONDS SERVICE FUND TOTAL PROPERTY CAPITA²2008 2,055,000 1,202,248 852,752 0.03% 16 2009 1,455,000 1,379,643 75,357 0.00% 1 2010 750,000 368,067 381,933 0.01% 7 2011 9,570,000 449,208 9,120,792 0.33% 165 2012 8,500,000 44,594 8,455,406 0.30% 152 2013 7,950,000 956,639 6,993,361 0.26% 126 2014 7,380,000 1,078,049 6,301,951 0.22% 112 2015 6,790,000 1,206,160 5,583,840 0.19% 99 2016 6,180,000 1,352,016 4,827,984 0.16% 85 2017 5,550,000 1,520,524 4,029,476 0.13% 71
Note: Details regarding the county's outstanding debt can be found in the notes to the financialstatements.
¹ Property value data can be found on Table 5² Population data can be found on Table 13
CHEROKEE COUNTY, SOUTH CAROLINA RATIOS OF GENERAL BONDED DEBT OUTSTANDING
LAST TEN FISCAL YEARS
(96)

Table 13Cherokee County, South Carolina
Demographic and Economic StatisticsLast Ten Years
Per CapitaPersonal Personal School Unemployment
Year (1) Population (2) Income (2) Income (2) Enrollment (2) Rate (2)2008 54,015 1,274,828,000 23,682 9,099 7.10%2009 54,394 1,337,188,000 24,794 9,308 9.50%2010 54,714 1,420,437,000 26,002 9,356 8.50%2011 55,342 1,420,437,000 26,002 8,797 14.30%2012 55,540 1,470,297,000 26,532 9,088 12.60%2013 55,662 1,491,556,000 26,856 8,816 10.20%2014 56,256 1,613,626,000 28,990 8,664 9.50%2015 56,150 1,643,091,000 29,401 9,104 8.30%2016 56,832 1,651,760,000 29,064 8,694 5.30%2017 57,037 1,700,836,000 29,820 9,024 4.40%
Notes:(1) Calendar Year(2) Provided by SC Appalachian Council of Governments
(97)

Table 14Cherokee County, South Carolina
Principal EmployersJune 30, 2017 and 2008
Percent of Percent ofCompany or Number of Total County Number of Total CountyOrganization Employees Rank Employment Employees Rank Employment
Nestle 1,350 1 5.73% 1,500 1 5.10%
School District of Cherokee County 1,250 2 5.43% 1,150 2 7.26%
Hamrick Mills 450 3 3.75% 2.77%
The Timken Company 1,000 4 3.09% 1,100 3 6.23%
Freightliner 909 5 2.20% 640 4 4.05%
Milliken & Co. Magnolia Finishing Plant 989 7 1.77% 2.80%
Jetline 225 8 0.99%
Brown Packing Co. Inc 350 9 0.88% 350 8 2.18%
ADS Logistics 300 10 1.87%
Springfield 246 10 0.75%
Parkdale Mills 145 11 0.64%
Ply Gem Siding Group 145 12 0.64%
Carolina Cotton Works 140 13 0.62%
Boyd Corp 125 14 0.55%
Kapstone 110 15 0.49%
Magnolia Finishing 500 5 3.11%
Upstate Carolina Medical Center 400 6 2.49%
Walmart 389 7 2.42%
Sanders Bros 300 9 1.87%
Alcoa Building Products 250 11 1.56%
Limestone 250 12 1.56%
June 30, 2008June 30, 2017
(98)

Table 15Cherokee County, South Carolina
County Employees by FunctionLast Ten Fiscal Years
Function 2017* 2016* 2015* 2014* 2013* 2012* 2011* 2010* 2009* 2008*General government 141 113 106 103 103 94 88 99 102 100 Public safety 135 133 135 131 138 131 123 131 137 137 Transportation 6 10 7 8 12 11 11 15 16 16 Health and human services 23 19 19 21 21 22 26 34 49 49
Total full-time equivalent 305 275 267 263 274 258 248 279 304 302 employees
Source: County Finance Office
* Includes General Fund employees only
(99)

Table 16Cherokee County, South Carolina
Operating Indicators by Function/ProgramLast Ten Fiscal Years
Function/Program 2017 2016 2015 2014 2013 2012 2011 2010 2009 2008Sheriff
Incident Reports Filed** 10,174 5,786 6,993 5,568 4,901 4,550 5,048 3,877 4,087 4,601 DARE Graduates 3,465 569** 3,437 762 837 702 753 678 727 761
Detention CenterPersons Arrested and Booked 3,364 3,689 3,747 3,844 3,997 3,502 4,147 4,272 4,346 4,875
E911 Calls Dispatched to Sheriff Department 23,061 33,973 33,375 30,099 29,853 30,059 24,381 20,377 22,056 21,234
Victims Advocate DivisionVictims Assisted 4715 1058 896 884 4,000 3,690 3,545 3,245 3,800 3,601
Landfill/Transfer StationSolid Waste Disposal - Tonnage 37,912 38,666 42,889 46,613 47,788 47,713 48,182 48,406 44,749 46,016
Recycle CenterRecycle - Tonnage 138,638 126,400 127,625 125,812 119,102 114,216 112,318 83,134 83,977 93,185
Public Works
Roads (miles) 405.65 402 402 333 401 362 366 366 365 365
Public Library Registered Borrowers 32,155 43,514 41,995 39,782 38,974 37,803 36,109 28,150 32,276 29,320 Circulation 94,484 145,672 131,013 156,057 163,855 169,239 178,705 199,272 197,147 177,878
Building Inspection Single Family Dwelling Permits 111 89 109 71 73 73 72 83 68 119
Source: County Treasurer's Office.** Per Sheriff's Office, these numbers are considerably higher because procedures are being conducted on a case to case basis.
Fiscal Year
(100)

Table 17
Function/Program 2017 2016 2015 2014 2013 2012 2011 2010 2009 2008General Government
Vehicles 32 41 46 41 41 36 36 36 36 35
Law Enforcement CenterBuildings 1 1 1 1 1 1 1 1 1 1Vehicles 80 70 70 70 61 68 67 65 63 64Equipment 2 2 2 2 2 2 2 2 2 2
Detention CenterBuildings 1 1 1 1 1 1 1 1 1 1Vehicles 6 5 4 4 3 4 4 4 4 4Equipment 4 4 4 4 3 4 4 4 4 4
Landfill/Transfer StationBuildings 4 4 4 4 4 5 5 5 5 5Vehicles 3 3 3 3 3 4 4 4 6 8Equipment 5 7 7 7 9 10 10 9 9 9
Recycle CenterBuildings 5 5 5 5 5 4 4 4 4 4Vehicles 7 7 7 8 8 8 8 8 8 10Equipment 9 9 7 8 9 8 8 8 10 9Drop off Stations 7 7 7 7 7 7 7 7 7 6
Road and BridgesBuildings 2 2 2 2 2 2 2 2 2 2Vehicles 19 15 18 16 15 18 18 20 19 20Equipment 21 25 25 26 26 26 26 26 26 26
Solid Waste CollectionsBuildings 2 2 2 2 2 2 2 2 2 2Vehicles 19 17 20 16 14 15 18 17 15 14
Emergency ManagementVehicles 1 1 1 4 4 4 4 4 4 4
N/A Not AvailableSource: County Finance Office
Cherokee County, South CarolinaCapital Assets Statistics by Function/Program
Last Ten Fiscal Years
Fiscal Year
(101)


COMPLIANCE SECTION


SUPPLEMENTARY INFORMATION REQUIRED
BY STATE OF SOUTH CAROLINA

Schedule 15CHEROKEE COUNTY, SOUTH CAROLINA
SUMMARY SCHEDULE OF COURT FINES, ASSESSMENTS AND SURCHARGES
Amount Remitted Amount Remitted Amountto County to State Allocated to
Collections (2),(3) Treasurer Treasurer(1) Victims' ServicesClerk of Court:Fines and Fees 481,795$ 182,065$ 299,730$ -$ Assessments 20,445 13,248 7,197 Surcharges 33,328 15,942 17,386 Pullouts 1,208 1,208 - Total 536,776$ 182,065$ 330,128$ 24,583$
Magistrate Court:Fines and Fees 339,694$ 339,694$ -$ -$ Assessments 354,282 319,654 34,628 Surcharges 160,600 148,295 12,305 Pullouts 17,800 17,800 - Total 872,376$ 339,694$ 485,749$ 46,933$
Victim Assistance:Amount reserved for victim assistance, 6/30/16 -$ Plus: Amounts allocated for victim assistance, 7/1/16 - 6/30/17 Assessments and surcharges 71,516
Less: Amounts spent for victim assistance in fiscal year 2017 from assessments and surcharges Salaries and benefits - 2017 71,516
Balance reserved for victim assistance, 6/30/16 143,032$
1 Includes payments forwarded for Public Defender of $14,141.2 Does not include civil fees collected of $196,918 retained by county treasurer.3 Does not include Indigent Defense amounts of $33,514 sent directly to Indigent Defense.
CLERK OF COURT AND MAGISTRATE COURTJUNE 30, 2017
(102)

Page intentionally left blank