conference call – 2q 2012 results -...
TRANSCRIPT

August 27, 2012
Conference call – 2Q 2012 results

Contents
• Highlights 2Q 2012
• Market outlook
– Floaters
– Jack-ups
– Tender rigs
• Contract backlog
• 2Q 2012 accounts
– Seadrill
– North Atlantic Drilling
• Q&A session

Highlights – Second quarter 2012
§ Seadrill generates second quarter 2012 EBITDA of US$634 million
§ Seadrill reports second quarter 2012 net income of US$554 million and earnings per share of US$1.12
§ Continued strong operational performance
§ Since 1st quarter reporting, Seadrill has secured new contracts and commitments totaling US$7.6 billion
§ Seadrill increases regular quarterly cash dividend per share from US$0.82 to US$0.84
Dividend distribution per share
Quarterly EBITDA

Signi!cant part of our jack-up "eet has been on the move
Global Operational Footprint
4
24 units * (+2-2) - 2 Semis - 4 Semi-tenders - 9 Tender rigs - 9 Jack-ups
8 units (-2) Gulf of Mexico - 3 Semis
- 1 HE jack-up - 4 BE jack-ups
South America - 3 Semis - 1 Jack-up - 1 Semi-tender
- 6 Drillships - 2 HE Semis
6 units - 3 Semis - 2 Jack-ups - 1 Drillship
- 4 Tender Rigs - 1 Semi-tender
Newbuilds 18 units
North Atlantic Americas
Africa-Middle East
Asia Pacific
10 units (+2) - 3 Drillships - 1 semi - 2 Semi-tenders - 4 Jack-ups
*Includes !ve tender rigs owned by Varia Perdana

Market outlook Floaters
Demand outpacing supply … limited rig availability
Historical dayrates for Ultra-deepwater rigs
0
100
200
300
400
500
600
700
May-0
0
May-0
1
May-0
2
May-0
3
May-0
4
May-0
5
May-0
6
May-0
7
May-0
8
May-0
9
May-1
0
May-1
1
May-1
2
US
Dk/
day
Low/High range Average
Historical daily rates for ultra-deepwater rigs § Market more or less sold out for 2013, limited
availability in 2014
§ Daily rates are approaching the previous high level seen in 2008
§ More customers are re-contracting rigs
§ Development drilling programs are materializing – activity expected to increase
§ 70% of ultra-deepwater !eet performing exploration drilling
§ Emphasis from customers on quality equipment and track-record of operations
§ Harsh environment: signi"cant discoveries, ageing !eet and barriers to entry; all catering for additional demand for newbuilds
Ultra-deepwater supply/demand
Source: Fearnleys

§ Daily rates improving § Near term availability decreasing
§ Bifuraction between premium and standard jack-ups continuing
§ Strong demand from Middle East and SE Asia
§ Slight increase in newbuild prices and reduction in newbuild orders
§ Decrease in number of stacked jack-ups, but not many left to reactive
60
65
70
75
80
85
90
95
100
Jan-01 Jan-03 Jan-05 Jan-07 Jan-09 Jan-11
%
WDR > 350ft WDR < 350ft
Market improving – newbuilds from 2010 & 2011 absorbing demand
Market development - Jack-ups
6
Utilization for jack-up rigs
0
50 000
100 000
150 000
200 000
250 000
300 000
Jan-01 Jan-03 Jan-05 Jan-07 Jan-09 Jan-11 WDR > 350ft WDR < 350ft
Source: ODS Petrodata
136’ 120’
Jack-up dayrates
95%
78%

Quality equipment required for enhanced reservoir recovery
Tender rig market development
§ Daily rates improving with long-term contracts § West Africa is increasingly attracted to this concept
§ New rigs replacing an ageing !eet
§ Seadrill has 54% of the market, customers increasingly value track-record
§ Seadrill is driving the market and has the technological know-how
7
15 %
7 %
7 %
2 %
69 %
Shell BP Hess Murphy Chevron
Customers
Unit Dayrate Term Area
West Setia US$223,000 2.0yr West Africa
West Esperanza US$235,000 1.5yr Equatorial Guinea
T11 US$127,500 4.0yr Thailand
T17 US$118,000 5.0yr Thailand
Recent Fixtures

Floaters - US$15.5 billion contract backlog
Sold out 2013…prime position with newbuilds in 2014
Unit Customer
West Tellus -‐ Newbuild
West Neptune -‐ Newbuild
West Saturn -‐ Newbuild
West Navigator 1, 4 Shell US$609,000 US$590,000West Jupiter -‐ Newbuild
West Capella Total US$544,000 US$627,500 04.2017West Gemini Total US$447,000 US$640,000 09.2017West Polaris ExxonMobil US$617,000 US$642,000 10.2017West Auriga -‐ Newbuild Transit US$565,000 09.2020West Vela -‐ Newbuild Transit US$565,000 12.2020
West Sirius BP US$474,000West Mira -‐ Newbuild
West Phoenix Total US$452,000West Taurus 2, 3 Petrobras US$655,000West Rigel 4 -‐ Newbuild
West Eminence 2, 3 Petrobras US$615,500West Venture 1, 4 Statoil US$440,000West Leo Tullow Oil Transit US$510-‐570,000 US$625,000West Orion 2, 3 Petrobras US$615,500West Pegasus PEMEX US$465,000 Market rateWest Alpha 1, 4 BG Consortium / ExxonMobil US$501,000 US$480,000 US$548,000West Aquarius ExxonMobil US$526,000 Transit US$530,000 US$530,000 06.2017West Hercules 1, 3 Husky / Statoil US$495' Transit US$496,000 491'West Capricorn BP Transit US$487,000 Se
Contract Option Yard plus transit period
1 Dayrate is partly in Norwegian kroner (USD /NOK 5.90)2 Dayrate is partly in Brazilian Real and includes five percent performance incentive as well as estimated compensation for tax. 3 Dayrate will in the accounts be booked partly net of service tax.4 Ownership 73%
20161Q 2Q 3Q 4Q4Q2Q 3Q 4Q 3Q
20142012 20132Q 3Q 4Q1Q 2Q 1Q1Q
20151Q 2Q 3Q 4Q
Drillships
Semi-‐sub
mersibles

Jack-ups - US$2.6 billion contract backlog
Diverse portfolio of short and long-term contracts
Unit Customer
West Epsilon 1,2 Statoil US$286,500 US$286,500 12.2016
West Elara 1,2 Statoil US$362,000 03.2017
West Linus 1,2 ConocoPhillips Newbuild Transit US$365,000 04.2019
West Vigilant BHP US$140'West Tucana -‐ Newbuild
West Telesto -‐ Newbuild
West Mischief Anadarko / Equion 120' US$172,000 172'West Prospero Vietsopetro US$129,000West Ariel Vietsopetro US$129,000West Courageous Shell US$134,500West Oberon -‐ Newbuild
West Castor -‐ Newbuild
West Freedom KJO US$185,000 US$155,000West Intrepid KJO US$180,000West Leda PTTEP / ExxonMobil 130' US$133,500 US$138,000West Cressida PTTEP US$129,500West Callisto Total/Saudi Aramco US$120' $135' US$150,000West Triton CPOC / KJO 120' US$145,000 US$145,000West Resolute KJO 135' US$140,000 US$140'West Defender Shell US$131 US$133,000 06.2016
Contract Option Yard plus transit period1 Ownerhsip 73%2 Dayrate is partly in Norwegian kroner (USD/NOK 5.90)
HE Ja
ck-‐ups
4Q 1Q 2Q 3Q 4Q2Q 3Q
BE-‐Jack-‐up
s2014
1Q 2Q 3Q 4Q 1Q2012 2013
2Q 3Q 4Q2015
1Q
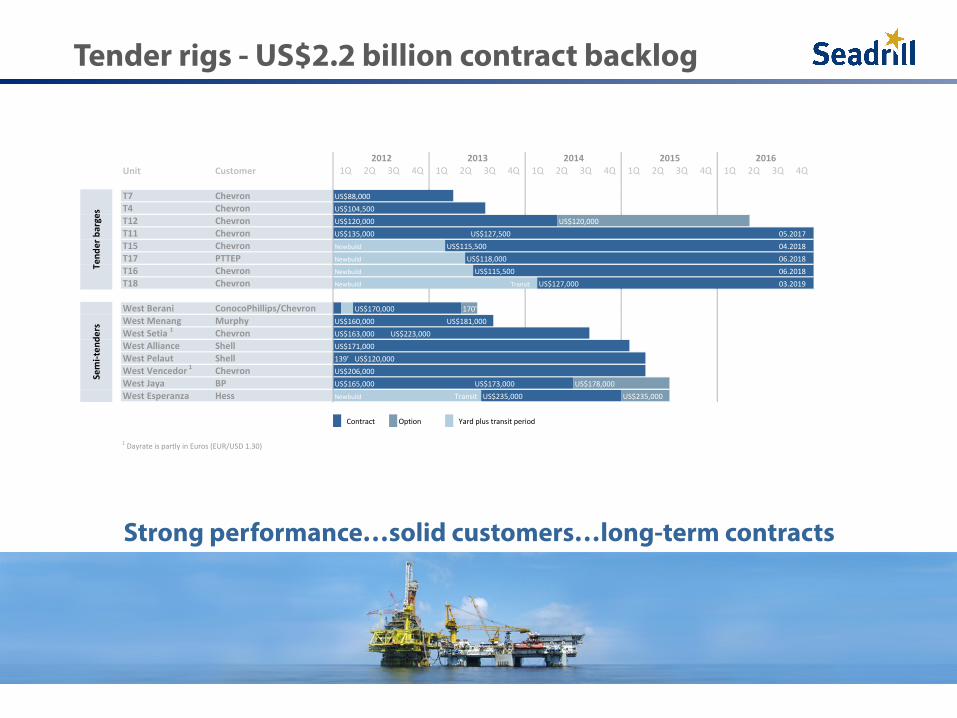
Tender rigs - US$2.2 billion contract backlog
Strong performance…solid customers…long-term contracts
Unit Customer
T7 Chevron US$88,000T4 Chevron US$104,500T12 Chevron US$120,000 US$120,000T11 Chevron US$135,000 US$127,500 05.2017T15 Chevron Newbuild US$115,500 04.2018T17 PTTEP Newbuild US$118,000 06.2018T16 Chevron Newbuild US$115,500 06.2018T18 Chevron Newbuild Transit US$127,000 03.2019
West Berani ConocoPhillips/Chevron US$170,000 170'West Menang Murphy US$160,000 US$181,000West Setia 1 Chevron US$163,000 US$223,000West Alliance Shell US$171,000West Pelaut Shell 139' US$120,000West Vencedor 1 Chevron US$206,000West Jaya BP US$165,000 US$173,000 US$178,000West Esperanza Hess Newbuild Transit US$235,000 US$235,000
Contract Option Yard plus transit period
1 Dayrate is partly in Euros (EUR/USD 1.30)
4Q
Semi-‐ten
ders
20161Q 2Q 3Q1Q1Q 2Q 3Q 4Q 4Q1Q 2Q 3Q 4Q 2Q 3Q
20142012 2013
Tend
er barges
20151Q 2Q 3Q 4Q

Attractive backlog…..quality customers…superb visibility
US$20.3 billion contract backlog
11
Quality customers …. superb visibility
BP
Total
Exxon
Petrobras
Statoil
Chevron
Shell
Others
26%
13%
12%
11%
10%
7%
5%
16%

Seadrill in pole position
• Strong operational performance
• Record high revenue backlog and earnings visibility
• US$6 billion investment program in the best market seen in the last 10 years
• US$4 billion EBITDA target still remains
• Advanced discussions to fund the newbuilding program, ECA "nacing, bonds, strong support from commercial banks
• Shareholder return still paramount
Positioned to deliver shareholder return

Financial performance highlights
13

Financial performance highlights
14
This quarter Previous quarter
EBITDA US$634 m US$595 m
Earnings per share US$1.12 US$0.89
Operating profit US$483 m US$456 m
Financial items US$114 m US$24 m
Cash flow from operating activities US$482 m US$454 m
Dividend declared per share Extraordinary dividend per share
US$0.84 -
US$0.82 US$ 0.15

EBITDA contribution
15

Operating Income - Floaters
Unaudited accounts in USD millions 2Q12 1Q12 4Q11 3Q11
Operating revenues 718 656 674 673
Reimbursables 11 9 14 18
Other revenues 0 0 2 2
Total operating revenues 728 665 690 693
Gain on sale of assets - - - -
Vessel and rig operating expenses 247 212 218 205
Reimbursable expenses 9 8 13 17
Depreciation and amortisation 101 94 94 89
General and administrative expenses 26 33 37 34
Total operating expenses 383 347 362 345
Net operating income 346 318 328 349
16

Operating Income – Jack-up rigs
Unaudited accounts in USD millions 2Q12 1Q12 4Q11 3Q11
Operating revenues 186 199 199 188
Reimbursables 16 11 5 4
Other revenues (3) (3) (6) (6)
Total operating revenues 199 207 198 186
Gain on sale of assets 0 0 (1) 23
Vessel and rig operating expenses 73 88 114 95
Reimbursable expenses 16 10 4 3
Depreciation and amortisation 36 32 33 31
General and administrative expenses 15 10 10 9
Total operating expenses 140 140 161 138
Net operating income 59 67 36 71
17

Operating Income – Tender rigs
Unaudited accounts in USD millions 2Q12 1Q12 4Q11 3Q11
Operating revenues 183 169 167 146
Reimbursables 10 6 3 2
Other revenues 2 3 0 0
Total operating revenues 195 178 170 148
Gain on sale of assets 0 0 (1) 23
Vessel and rig operating expenses 85 79 74 68
Reimbursable expenses 9 6 3 1
Depreciation and amortisation 14 13 12 12
General and administrative expenses 8 9 9 7
Total operating expenses 117 107 99 88
Net operating income 78 71 72 60
18

Operating Income – Total Seadrill Limited
Unaudited accounts in USD millions 2Q12 1Q12 4Q11 3Q11
Operating revenues 1087 1025 1040 1007
Reimbursables 37 25 22 24
Other revenues (1) 0 (3) (2)
Total operating revenues 1122 1050 1059 1029
Gain on sale of assets 0 0 (1) 23
Vessel and rig operating expenses 404 381 406 367
Reimbursable expenses 34 23 21 22
Depreciation and amortisation 151 139 139 132
General and administrative expenses 50 51 56 51
Total operating expenses 639 594 622 572
Net operating income 483 456 436 480
19

Net Income – Total Seadrill Limited
20
Unaudited accounts in USD millions 2Q12 1Q12 4Q11 3Q11
Net operating income 483 456 436 480
Financial items
Interest income 4 4 4 5
Interest expense (76) (71) (75) (64)
Share in results from associated companies 15 18 (482) 26
Gain/(Loss) in "nancial derivatives (96) 91 33 (330)
Foreign exchange gain/(loss) 12 (20) 14 (4)
Realization of marketable securities 85 0 0 0
Gain on decline in ownership interest 169 0 0 0
Other "nancial items 1 2 5 (6)
Total !nancial items 114 24 (501) (372)
Income/(loss) before income taxes 597 480 (65) 108
Income taxes (43) (41) (41) (50)
Net income/(loss) 554 439 (106) 58
Earnings/(loss) per share (US$) 1.12 0.89 (0.28) 0.07

Balance sheet - Assets
21
Unaudited accounts in USD millions June
30, 2012 March
31, 2012
Current assets
Cash and cash equivalents 276 445
Restricted cash 162 134
Marketable securities 227 20
Accounts receivables, net 866 806
Amount due from related party 190 234
Other current assets 251 304
Total current assets 1972 1943
Non-current assets
Investment in associated companies 700 753
Newbuildings 1404 2518
Drilling units 13011 11630
Goodwill 1320 1320
Restricted cash 227 255
Deferred tax assets 21 31
Equipment 33 30
Other non-current assets 245 222
Total non-current assets 16962 16759
Total assets 18934 18702
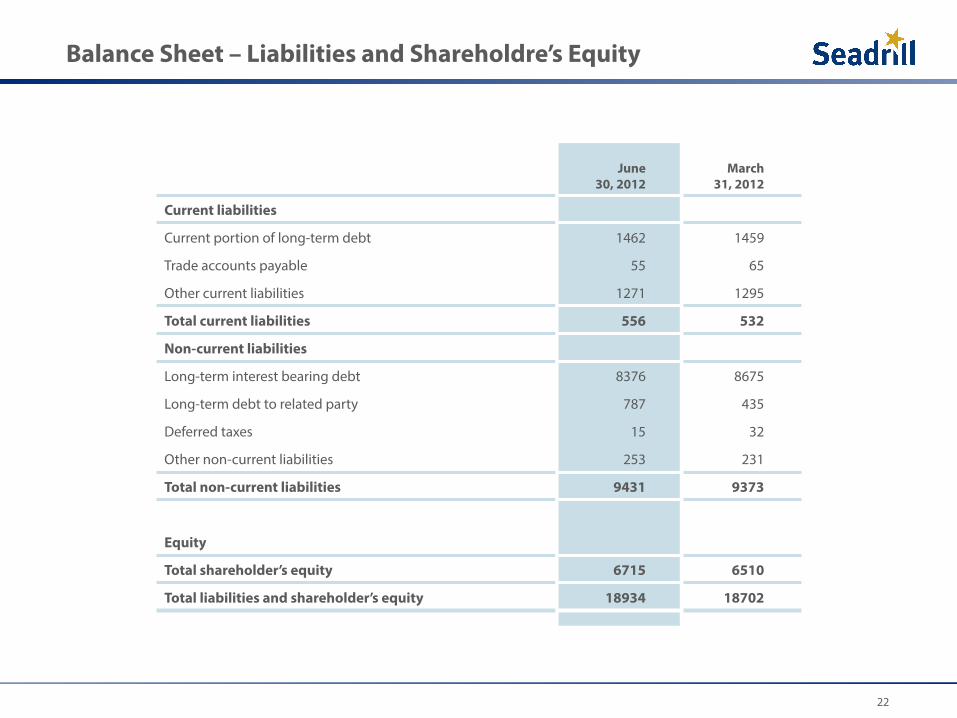
Balance Sheet – Liabilities and Shareholdre’s Equity
22
June 30, 2012
March 31, 2012
Current liabilities
Current portion of long-term debt 1462 1459
Trade accounts payable 55 65
Other current liabilities 1271 1295
Total current liabilities 556 532
Non-current liabilities
Long-term interest bearing debt 8376 8675
Long-term debt to related party 787 435
Deferred taxes 15 32
Other non-current liabilities 253 231
Total non-current liabilities 9431 9373
Equity
Total shareholder’s equity 6715 6510
Total liabilities and shareholder’s equity 18934 18702

North Atlantic Drilling Non-!nancial highlights
• West Elara completes its "rst full quarter of operations under 5 year contract with Statoil at close to 100% economical utilization
• Two year contract extension for West Alpha with ExxonMobil with an estimated revenue value of US$410 million
• Order backlog of more than US$3.6 billion
• Several prospects for West Rigel – high interest from clients
23

North Atlantic Drilling Financial reporting highlights
24
This quarter Previous quarter
EBITDA US$156 m US$123 m
Earnings per share US$0.062 US$0.051
Operating profit US$114 m US$86 m
Financial items US$(33) m US$(28) m
Cash flow from operating activities US$106 m US$102 m
Dividend declared per share US$0.045 US$0.045

North Atlantic Drilling Operating Income - Total
Unaudited accounts in USD millions 2Q12 1Q12 4Q11
Operating revenues 251 219 226
Reimbursables 16 14 7
Other revenues 0 0 3
Total operating revenues 267 233 235
Vessel and rig operating expenses 86 86 83
Reimbursable expenses 15 13 6
Depreciation and amortisation 42 37 37
General and administrative expenses 11 11 11
Total operating expenses 153 147 137
Net operating income 114 86 99
25

North Atlantic Drilling Net Income - Total
Unaudited accounts in USD millions 2Q12 1Q12 4Q11
Net operating income 114 86 99
Financial items
Interest expense -20 -22 -23
Gain on derivatives -21 6 -1
Other "nancial items 8 -13 0
Total !nancial items -33 -28 -22
Income before income taxes 81 58 77
Income taxes -10 -7 -29
Net income 71 51 48
Earnings per share (US$) 0.062 0.051 0.048
26

North Atlantic Drilling Balance Sheet- Assets
June 30, 2012
March 31, 2012
Current assets
Cash and cash equivalents 107 179
Restricted cash 19 7
Accounts receivables, net 172 167
Related party receivables 175 -
Deferred tax assets 10 10
Other current assets 32 53
Total current assets 515 416
Non-current assets
Newbuildings 225 105
Drilling units 2448 2499
Goodwill 481 481
Deferred tax assets 22 25
Other non-current assets 144 148
Total non-current assets 3321 3258
Total assets 3836 3674
27

North Atlantic Drilling Balance Sheet- Liabilities and Shareholders Equity
June 30, 2012
March 31, 2012
Current liabilities
Current portion of long-term debt 167 167
Related party transaction 63 14
Tax payable 145 166
Deferred taxes 11 12
Other current liabilities 171 173
Total current liabilities 556 532
Non-current liabilities
Long-term interest bearing debt 1667 1708
Related party liability 660 500
Deferred taxes 18 21
Pension liabilities 36 36
Other non-current liabilities 49 46
Total non-current liabilities 2430 2312
Equity
Total shareholder’s equity 850 830
Total liabilities and shareholder’s equity 3836 3674
28
Seadrill Uniquely Positioned
29
Seadrill selectively growing its already modern "eet
at attractive rig prices