connecting reasoning and spatial abilities to …
TRANSCRIPT
CONNECTING REASONING AND SPATIAL ABILITIES TO ACADEMIC
PERFORMANCE IN CONSTRUCTION SURVEYING COURSEWORK
A Thesis
by
ANDREW JACOB ANDERSON
Submitted to the Office of Graduate and Professional Studies of
Texas A&M University
in partial fulfillment of the requirements for the degree of
MASTER OF SCIENCE
Chair of Committee, Kenneth C. Williamson, III
Committee Members, Ben F. Bigelow
Vickie M. Williamson
Head of Department, Patrick Suermann
December 2017
Major Subject: Construction Management
Copyright 2017 Andrew Jacob Anderson
ii
ABSTRACT
Cognitive tests measuring reasoning ability have been well established as a
means of predicting academic success in STEM (Science, Technology, Engineering, and
Math) coursework. Cognitive tests measuring spatial ability have garnered recent
attention and have also been established as predictors of academic success in the
“traditional sciences” (i.e., Chemistry, Biology, Physics, etc.). Instructors may use these
cognitive tests as a means of predicting student achievement or adapting instruction.
This study examined the relationship between scores on the Test of Logical Thinking
(TOLT); a spatial test battery consisting of the Paper Folding Test (PFT), Hidden
Patterns Test (HPT), Mental Rotations Test (MRT), and Purdue Visualization of
Rotations Test (ROT); and multiple academic achievement measures (Lab Points, View
Points, Exam Points, and Total Grade Points) in an upper-level undergraduate
construction surveying course.
The TOLT and the spatial test battery were administered to 277 construction
science students. The scores on the TOLT and scores on all spatial battery tests were
found to be significantly correlated. Additionally, significant differences utilizing an
Analysis of Variance (ANOVA) were found between the TOLT groups and exam points.
Further, significant differences were discovered, using an ANOVA, between all the
spatial ability test battery groups and achievement points in exams, and a significant
difference was also discovered between the ROT groups and view points. Based on these
findings, educators and researchers in construction science would benefit by using these

iii
cognitive tests to assess student reasoning and spatial abilities. These tools would assist
them in better understanding their students’ logical thinking and spatial visualization
skills, which should encourage instructors to modify instructional strategies and
curriculum design to match or enhance their students’ cognitive abilities.

iv
DEDICATION
I dedicate this research to my baby girl Evelyn; may knowledge be a lifelong
pursuit for you.

v
ACKNOWLEDGEMENTS
I would like to thank my committee chair, Dr. Ken Williamson, and my
committee members, Dr. Ben Bigelow, and Dr. Vickie Williamson, for their guidance
and support throughout the course of this research.
Thanks also go to Daniel Wheeler, my other friends and colleagues, and the
department faculty and staff for keeping me on track and making my time at Texas
A&M University a great experience.
Also, thanks to my mother and father for their encouragement and support in all
my life endeavors. Finally, thank to my wife Ashley, daughter Evelyn, and Athena for
their patience and love.

vi
CONTRIBUTORS AND FUNDING SOURCES
Contributors
This work was supervised by a thesis committee consisting of Dr. Ken
Williamson [advisor] and Dr. Ben Bigelow of the Department of Construction Science
and Dr. Vickie Williamson of the Department of Chemistry.
The data collection and compilation were provided by Dr. Ken Williamson. All
other work conducted for the thesis was completed by the student independently.
Funding Sources
There are no outside funding contributions to acknowledge related to the research
and compilation of this document.
vii
NOMENCLATURE
ABET Accreditation Board for Engineering and Technology
ACCE American Council for Construction Education
ACT American College Testing
ANOVA Analysis of Variance
GPS Global Positioning System
HPT Hidden Patterns Test
ILS Index of Learning Styles
IBM International Business Machines
MRT Mental Rotations Test
PFT Paper Folding Test
PSVT Purdue Spatial Visualization Test
ROT Purdue Visualization of Rotations Test
SAT Scholastic Assessment Test
SPSS Statistical Package for the Social Sciences
STEM Science Technology Engineering Math
TOLT Test of Logical Thinking
viii
TABLE OF CONTENTS
Page
ABSTRACT .......................................................................................................................ii
DEDICATION .................................................................................................................. iv
ACKNOWLEDGEMENTS ............................................................................................... v
CONTRIBUTORS AND FUNDING SOURCES ............................................................. vi
NOMENCLATURE .........................................................................................................vii
TABLE OF CONTENTS ............................................................................................... viii
LIST OF FIGURES ............................................................................................................ x
LIST OF TABLES ............................................................................................................ xi
INTRODUCTION .............................................................................................................. 1
Rationale ..................................................................................................................... 3
LITERATURE REVIEW ................................................................................................... 9
Construction Surveying .............................................................................................. 9
Reasoning Ability ..................................................................................................... 11 Spatial Ability ........................................................................................................... 14 Semester Length ....................................................................................................... 21
Research Questions and Limitations ........................................................................ 25
METHOD ......................................................................................................................... 27
Population ................................................................................................................. 27 Testing Instruments .................................................................................................. 28 Procedure .................................................................................................................. 34
RESULTS ......................................................................................................................... 37
Limitations ................................................................................................................ 55
CONCLUSIONS .............................................................................................................. 57

ix
REFERENCES ................................................................................................................. 63

x
LIST OF FIGURES
Page
Figure 1. Sample Question from the MRT ....................................................................... 31
Figure 2. Sample Question from the ROT ....................................................................... 32
Figure 3. Sample Question from the PFT ........................................................................ 33
Figure 4. Sample Question from the HPT ........................................................................ 33

xi
LIST OF TABLES
Page
Table 1. Summary of Literature Review Pertaining to the TOLT as a Predictor of
Success. ............................................................................................................. 14
Table 2. Internal Consistency of Testing Instruments. ..................................................... 16
Table 3. Descriptive Statistics .......................................................................................... 38
Table 4. Assessment Measures ANOVA by Semester Group ......................................... 39
Table 5. Pearson's Correlation Between Assessment Measures with Associated p-
values (N = 277) ............................................................................................... 41
Table 6. Pearson's Correlation Between Spatial Ability Measures with Associated p-
values (N = 277) ............................................................................................... 42
Table 7. Pearson's Correlation Between TOLT and Spatial Ability Scores with
Associated p-values (N = 277) ......................................................................... 43
Table 8. Pearson's Correlation Between Assessment and Spatial Ability Measures
with Associated p-values (N = 277) ................................................................. 44
Table 9. ANOVA of Assessment Scores by TOLT Groups............................................. 45
Table 10. Post Hoc Test Between TOLT Groups and Exam Points ................................ 46
Table 11. Descriptive Statistics for Spatial Ability Scores (N = 277) ............................. 47
Table 12. Frequency Distribution of Ordinal Groups for Spatial Abilities (N = 277) ..... 47
Table 13. ANOVA of Assessment Scores by PFT Groups .............................................. 48
Table 14. ANOVA of Assessment Scores by HPT Groups ............................................. 49
Table 15. ANOVA of Assessment Scores by MRT Groups ............................................ 49
Table 16. ANOVA of Assessment Scores by ROT Groups ............................................. 49
Table 17. ANOVA of Assessment Scores by Spatial Battery z-Score Groups ................ 50
Table 18. Post Hoc Tests Between Spatial Groups and Exam Points .............................. 52

xii
Table 19. ANOVA of Spatial Ability Scores by TOLT Groups ...................................... 53
Table 20. Post Hoc Tests Between TOLT Groups and Spatial Test Scores .................... 55

1
INTRODUCTION
Reasoning and spatial abilities are just two of the myriad of cognitive skills that
are crucial to success in construction education, as well as in the construction profession.
Logical reasoning is a higher order and systematic process that an individual utilizes to
draw conclusions or inferences from information. It is a cognitive process of thinking
about something in a logical way, in order to form a logical conclusion or judgment.
Reasoning refers to the mechanisms, mental activities, and skills used to perform tasks
such as learning, computation, observation, understanding, remembering, identifying,
paying attention, problem solving, and generating alternatives (Powers & Dwyer, 2004).
Spatial reasoning is also a higher order cognitive process involving the acquisition of
knowledge and understanding of the environment through rational thought, practical
experience, and visual perception. More specifically, it is the mental ability to
understand, create, transform, transition, manipulate, and remember visual images and
mental models (Mohler, 2008). Finally, cognitive and psychometric research has long
held that the constructs of reasoning and spatial abilities overlap and are somewhat
consistent over time (Wai, Lubinski & Benbow, 2009).
On a daily basis, the construction process relies on both the reasoning and spatial
abilities of its practitioners when they are making logical decisions based upon their
experience, interpretation, and analyses of project data within the built environment.
Thus, it is imperative to gain insight into the reasoning and spatial abilities of the next
generation of construction professionals; specifically, this study investigates these

2
abilities in an undergraduate construction science surveying course. Professional
performance in the construction industry and academic performance in the construction
science classroom is likely affected by one’s cognitive ability as measured by both
reasoning and spatial ability. As previous research has linked reasoning and spatial
ability (Pribyl & Bodner, 1987), this study aims to also correlate the two constructs in a
construction science educational setting. As the accrediting body for construction
education, the American Council for Construction Education (ACCE), recognizes both
construction science and construction management degrees when evaluating
baccalaureate programs for accreditation (American Council for Construction Education,
2016). Thus, this research does not make any distinction between these two similar
degree programs and uses the terms interchangeably throughout this paper.
Additionally, this research will determine if reasoning and/or spatial abilities are
effective predictors of success for undergraduate construction surveying students. The
results of this research will allow educators and industry professionals to better
understand the cognitive reasoning and spatial abilities of future construction industry
professionals and the necessary cognitive skills that help predict their academic and
eventual professional success.
First, a rational is provided to build the foundation of research in construction
and to introduce the two cognitive abilities pertinent to this study. Additionally, an in-
depth literature review is conducted to further delve into construction surveying
education and to show how reasoning and spatial abilities have predicted academic
success in multiple fields, both in those fields which are closely aligned with

3
construction science as well as those in other disciplines. Then, the methodology used in
this study will be explained, and the different instruments used to measure construction
surveying student’s cognitive abilities will be described along with the academic
performance measures of success used in the data analysis. Lastly, the presentation of
data collected and findings will be discussed. Both reasoning and spatial abilities are
important in the construction industry (Egbu, 1999; Ahmed, Yaris, Farooqui, & Saqib,
2014); this study hopes to identify a correlation between these abilities and their effect
upon a construction science student’s academic success.
Rationale
In today’s complex project environment, multifaceted skillsets are desired of
construction managers. Egbu (1999) identified 75 types of management skills most
important to the construction industry, and the work describes decision making as one of
the six most important construction management skills. Ahmed et al. (2014) also
identified attention to detail as being the most desirable trait, out of ninety-three
different traits of construction students entering the workforce. The construction industry
requires individuals to have a diverse set of skills; Ahmed et al. (2014) surveyed 46
construction companies to discover what positions construction management students
were hired for, as well as the desired traits of those students. Most new construction
management students were hired as project managers, schedulers, and estimators. These
authors also found the most important attributes and ranked them in order of importance;
those attributes that draw on reasoning and spatial abilities (with its corresponding rank

4
order of importance) are: comprehension ability (8), planning and goal setting (15),
problem solving/ analytical skills (17), decision- making skills (20), plan interpretation/
blueprint reading/ understand construction & shop drawings (25), scheduling (30),
estimating (32), and understanding procedural issues (62). Each of these listed traits
draw heavily upon a student’s reasoning and spatial ability, and the authors call upon
academia to focus their curricular strategies upon preparing their graduates to succeed in
these skill areas. However, are these desired traits adequately reflected in the current
construction management curriculum and instructional design method to better prepare
construction management students for the workforce? Felder and Silverman (1988)
propose that the learning styles of engineering students and the teaching styles of the
instructor often times do not mesh. Most engineering students have visual, sensing,
inductive, and active learning styles while traditional teaching styles in this field are
auditory and abstract. In more current research, Holt, Chasek, Shaurette, and Cox (2017)
also used the Index of Learning Styles (ILS) to assess the learning styles of
undergraduate construction management students and found that 79% (N = 1,069) were
visual, active, sensing, and sequential learners. The authors also provide necessary
course curriculum design changes, assessment changes, and instructional strategies
associated with each of these learning style dimensions. Additionally, Farrow, Liu, and
Tatum (2011) held focus groups and found construction management students desired
learning that was experiential with less textbook use and more interaction with the
instructor. Much of the current literature in construction relates to the teaching and
learning styles of construction students; however, little research has been done to assess
5
the cognitive abilities of those students. This study provides an extensive review of
literature concerning students’ cognitive abilities and how those abilities may affect their
learning and academic performance.
Inhelder and Piaget (1958) provide the foundational work on cognitive
development. They propose 4 stages of cognitive development throughout childhood that
are well accepted within the scientific community; these stages include sensorimotor
from birth to about 2 years of age, through the preoperational and concrete operational
stages, and to the final stage of formal operational thought prevalent in children over 11
years old as discovered in their study population. Arlin (1975) expands on the work of
Inhelder and Piaget to propose an additional fifth stage that has received much scrutiny
in the scientific community, but is worth noting. Arlin (1975) suggests cognition goes
beyond just formal operational thought to an expanded fifth, two-part stage: the
problem-solving stage and the problem-finding stage of formal operational thought. In
more recent work, Demick and Andreoletti (2003) define four postformal operational
hierarchical stages as first identified by Commons, Richards, and Armon (1984) as: (a)
systematic order, (b) metasystematic order, (c) paradigmatic order, and (d)
crossparadigmatic order. Most recently, Kallio (2011) critiques the various verbiage
used to define postformal operational thought and contends that integrative thinking
should be used as the standard nomenclature for the final stage of cognitive
development. There is a vast array of cognitive abilities prevalent in adults; however,
this research will focus on reasoning and spatial abilities as described in the subsequent
paragraphs.

6
Tobin and Capie (1981) developed the Test of Logical Thinking (TOLT) as a
reliable means of assessing a student’s formal reasoning ability. In “Cognitive
Psychology and Cognitive Neuroscience/Reasoning and Decision Making,” (Wikibooks,
2017) the author stated that, “It is important to keep in mind that reasoning and decision
making are closely connected to each other: Decision making in many cases happens
with a previous process of reasoning.” The TOLT has been used in multiple disciplines
closely aligned with construction science and was found to be a strong predictor of
academic success. However, existing literature in construction science does not compare
reasoning, as assessed by the TOLT, to other cognitive abilities. As previous research in
other disciplines has confirmed a correlation between reasoning and spatial abilities, one
of the primary objectives of this research is to correlate these two cognitive abilities for
construction science students. Just as this paragraph has introduced and defined
reasoning ability, the following paragraph will also discuss spatial ability.
Trindade, Fiolhais, and Almeida (2002) provide that spatial understanding stems
from the ability to construct mental images from verbal or written directions and linked
spatial abilities with comprehension. These authors tied conceptual understanding and
comprehension capability to a student’s spatial ability in chemistry and physics. They
also reference multiple previous works citing that spatial aptitude can be tied to
academic success in the fields of science, physics, and chemistry. However, an
exhaustive review of literature does not yield any results relating academic success in
construction science to a student’s spatial ability.

7
There is a gap in the existing body of knowledge on whether or not reasoning or
spatial abilities, as measured by the TOLT and spatial ability test battery respectively,
can also be used as an effective assessment tool to predict the success of construction
science students. As decision making has been regarded as a key component of
construction management, this research analyzes the success of construction
management undergraduate students based on their cognitive abilities. In general,
cognitive reasoning abilities, as measured by the TOLT, have long been regarded as an
acceptable predictor of student success in academia. However, in spite of its importance
in assessing students’ success and their learning outcomes, very little is known about the
impact that cognitive reasoning abilities have on student performance, specifically for
construction science higher education. After an exhaustive review of literature, only
three studies linking cognitive reasoning ability to academic performance for
construction science was found. Additionally, to date, no research has been conducted
assessing spatial abilities and performance of construction science students. To further
advance reasoning and spatial ability performance assessment in the pedagogical
practice of construction management in an attempt to fill the gaps, the major objective of
this study will investigate the effect both reasoning and spatial abilities have on
academic performance of construction science students taking a construction surveying
course. Further, this study will explore whether the effect of spatial abilities is moderated
by a student’s reasoning ability. This study will be the first of its kind to assess both
reasoning and spatial abilities of construction surveying students and investigate any
affects these may have on performance.

8
Further assessment of academic performance for construction science students
regarding their reasoning and spatial abilities will significantly contribute to curriculum
development and assessment of construction management students. The subsequent
literature review will outline previous research conducted in construction surveying
education and identify research linking both reasoning abilities and spatial abilities to
academic performance across multiple fields of study. Additional explanation of
reasoning abilities and spatial abilities will be provided in the methodology where each
test measuring the aforementioned abilities to be used in this study will be explained.
The general research design of this study will include three semesters of undergraduate
construction surveying students with an approximate population of 320 total participants.
These three semesters of students will be administered standard tests of reasoning and
spatial abilities; measures of academic success and additional demographic data will also
be collected on these students to be used in the data analysis. The results of this study
may allow researchers and instructors to predict success or identify potential needs for
curriculum adaptation in construction science undergraduate coursework.

9
LITERATURE REVIEW
Construction Surveying
The construction surveying practice has evolved over the past few decades as a
result of technological advancement and innovation (Greenfeld & Potts, 2008).
Greenfeld and Potts (2008) identify 15 body-of-knowledge outcomes in surveying
education, 11 of which were taken from the Accreditation Board for Engineering and
Technology (ABET) criteria 2000 model. They grouped these body-of-knowledge
outcomes into three categories: technical, professional, and practice; they describe the
technical outcomes as the “keystone of professional practice.” Further, the ACCE
stresses the need for surveying in undergraduate degree programs by requiring graduates
to, “Apply basic surveying techniques for construction layout and control” (ACCE,
2016). Additionally, multiple requirements for accreditation under the ACCE are
directly related to reasoning and spatial abilities. For example, regarding both measures
of cognitive ability, graduates in accredited programs are required to analyze both
professional decisions and to read and interpret construction documents. However,
although the word professional is used throughout this paragraph describing surveying
practice, it is important to note that surveying in itself does not require any professional
licensing like that of the engineering profession.
Construction surveying is defined by Williamson and Anderson (2017) as, “the
spatial science and technology of determining the location and three-dimensional
characteristics of the natural and built environment on the surface of the earth.”

10
Surveying utilizes both measurement and computation to determine areas, volumes,
distances, angles, grades, and elevations in the construction sector. It is important to note
the difference between construction surveying and land surveying in the context of this
research; land surveying typically requires professional licensing and is often used for
legal purposes to establish boundaries, easements, and mapping (Dib & Adamo-Villani,
2014). Two modes of surveying exist: plane and geodetic; plane surveying is the method
predominately used in construction surveying and assumes the curvature of the earth is
negligible. However, both of these modes share similar tools and technology to create
survey data. In taking accurate distances and angles in both the horizontal and vertical
slope, levels, theodolites, and total stations are used. Total stations are the most
advanced technological tool used in surveying and incorporate computer programming,
global positioning systems (GPS), lasers, and often cloud-based communication
capabilities. Other forms of low-technology tools are also present in the industry and are
heavily used in the classroom to form a baseline understanding of the trade; these tools
include: tapes, chains, string line, plumb bobs, gammon reels, grade rods, and
sight/bubble levels (Williamson & Anderson, 2017).
Wong, Wong, and Hui (2007) found that the fluctuating market and changing
needs for the construction sector requires that education in surveying to be more focused
on the accentuation and reinforcement of practical skills. El-Mowafy, Kuhn, and Snow
(2013) call for a blended approach in surveying education to not only learn theoretical
principles but also apply technical skills. The Employment Development Department for
the State of California (2003) highlights the need for both reasoning ability and spatial

11
ability in construction surveying by stating, “Surveyors use mathematical reasoning
ability to visualize objects, measure distances, size, and other abstract forms.”
Surveyor’s in the 21st century not only have foundational knowledge in math, physics,
engineering, and law, but also have proficiency in collecting, processing, analyzing, and
presenting spatial data (El-Mowafy, Kuhn, & Snow, 2013). As a subject matter expert in
surveying, Enemark (2002) calls for a focus of surveying education on spatial
information management. An extensive review of literature by Dib, Adamo-Villani, and
Garver (2014) identified conflicting viewpoints on whether schematic or realistic
visualizations are better suited for learning surveying. Their own research found no
significant statistical difference in the two methods, but reported that students rated the
effectiveness of realistic simulations higher in their understanding of surveying
instrument set-up. However, although extensive research has been conducted on the use
of visualizations and importance of spatial data in construction surveying, no research
has been published on the actual spatial abilities of construction surveying students.
Reasoning Ability
Reasoning ability is a logical and systematic process used to draw conclusions or
make inferences from information that may not be readily available (Markman &
Gentner, 2001). It is a cognitive process of thinking through something in a logical way
to reach a decision or conclusion (Northrop, 1977). Lohman and Hagen (2001) maintain
that cognitive processes are essential to effective reasoning and classifies these processes
as selective encoding, selective comparison, and strategic combination. The authors also

12
assert that reasoning is the most essential and most general of all cognitive abilities with
regards to academic learning. Reasoning ability allows an individual to perform tasks
and processes such as: forming arguments, perceive relevance, see commonalities and
differences, evaluate, and abstract (Powers & Dryer, 2003).
Kirk and Mulligan (1996) contend that many construction programs focus on
subject matter that is solely left-brain to process verbal, mathematical, and science
information. However, the authors propose that in order to be more effective problem
solvers and critical thinkers, educators should also provide right-brain exercises that
promote imagination, holistic awareness, and spatial recognition. Further, Hartman,
Dorée, and Martin (2010) propose a constructivist teaching approach with role-play
based scenarios to successfully develop critical thinking skills in a research methods
construction management course.
TOLT
A clinical interview process used by Inhelder and Piaget (1955) to determine the
formal reasoning abilities of students serves as the foundational knowledge for much of
the cognitive work conducted today. However, a typical classroom setting and time
constraints often prohibit the use of one-on-one interviews. Thus, Tobin and Capie
(1981) developed the Test of Logical Thinking (TOLT) in response to these research
limitations. The TOLT measures five modes of formal reasoning and is able to be
administered to a large population of students concurrently. Cognitive reasoning abilities
have long been linked to student performance across multidisciplinary pedagogical

13
practices through the use of the TOLT, but is mainly supported by research in the
traditional sciences. Table 1 shows pertinent literature used to validate reasoning ability
as measured by the TOLT as a reliable means of predicting student performance and the
corresponding field of study. Bhat (2016) discovered that the main predictor of success
for high school students was their reasoning ability. It was also concluded that academic
success of undergraduate chemistry students was determined by both the initial TOLT
score and entrance SAT scores, with neither being significantly more of a statistical
predictor of performance (Lewis & Lewis, 2007). Vazquez and Difabio de Anglat (2009)
found a significant relationship between first year engineering student’s academic
performance and reasoning ability using the TOLT. Additionally, in determining at-risk
pharmacy students, Etzler and Madden (2014) found the TOLT to be a strong predictor
of success in first-year pharmacy students. Overall, performance of a construction
management student’s cognitive reasoning abilities remains mostly unmeasured.
However, research by Lee, Lee, and Koval (2016) has shown that instructional method
most significantly impacted the success of academically weak students and that there
was no significant impact of instructional method on academically strong students in
construction management coursework.

14
Table 1. Summary of Literature Review Pertaining to the TOLT as a Predictor of
Success. Author (year) Subject
Discipline
Results
Bousquet (1982) Agriculture The TOLT was second only to prior knowledge in predicting
success on a post-test in an introductory undergraduate
natural resources course.
Szabo, Atkinson, &
Spooner (1985)
Sociology The TOLT was used to identify weak formal thinkers and
tailor instruction to meet the students’ need.
Trifone (1987) Biology The TOLT score of students is tied to their academic growth.
Wilson (1988) Geology Those scoring higher on the TOLT performed better
academically.
Schoenfeld-Tacher,
Persichitte, & Jones
(2000)
Biochemistry The TOLT was a significant predictor of success in a goal-
based scenario lesson on DNA in biochemistry.
Oliva (2003) Science
Education
Those with higher formal thought, as measured by the
TOLT, were able to better grasp concepts in a high school
science course.
BouJaoude, Salloum, &
Abd-El-Khalick (2004)
Chemistry The TOLT was a significant predictor of success for
conceptual chemistry problems but not a strong predictor of
success for algorithmic problems in high school chemistry.
Lewis & Lewis (2007) Chemistry Both SAT scores and the TOLT were good predictors of
academic success in chemistry with neither being superior.
Vázquez & de Anglat
(2009)
Engineering TOLT had good internal consistency and construct validity
in predicting success across four engineering related courses.
Doymus, Simsek, &
Karacop (2009)
Chemistry The TOLT was a strong predictor of success on a micro-
level States of Matter Test in undergraduate chemistry
students.
Sadi & Çakiroglu (2014) Medicine Reasoning ability, as measured by the TOLT was nearly
three times more successful at predicting success for high
school students on the Human Circulatory System
Achievement Test than any other measure.
Kılıç & Sağlam (2014) Biological
Education
Reasoning ability, as measured by the TOLT was the most
significant predictor of understanding fundamental genetic
concepts in eleventh graders.
Etzler & Madden (2014) Pharmacy There was a correlation between a student’s TOLT score and
their academic performance in courses requiring quantitative
reasoning ability.
Spatial Ability
Dennis and Tapsfield (2013) define spatial ability as “the ability to generate,
retain, retrieve, and transform well-structured visual images.” They highlight two

15
contrasting modes of thinking regarding spatial abilities; (1) that spatial abilities are
correlated with creativity and higher levels of thinking, and (2) that spatial abilities are
implicated with lower level concrete thinking. Regardless the mode of thinking, spatial
abilities have been tied to success in a multitude of studies. Harle and Towns (2011)
links the success of STEM fields, and in particular chemistry, to spatial abilities. Also,
they found that through the development of spatial abilities, retention rates and success
of students in science can be increased. Specifically, Harle and Towns (2011) suggest
direct instruction on the transformation of 2-D and 3-D molecular formulas and also
suggest students use a visualization tutorial to better practice and understand 3-D
molecular structures. Wu and Shah (2004) cited multiple studies correlating academic
achievement and spatial abilities and provided curriculum design principles to assist
spatial understanding. These curriculum design principles include: multiple descriptions,
visible links, dynamic and interactive presentations, 2-D to 3-D transformation, and
integrated information. However, Hinze et al. (2013) discovered that spatial abilities can
be used in both effective and ineffective ways towards solving chemistry problems.
When subjects were presented with pre-study tasks that focused on limited subsets of
information, the students used spatial skills ineffectively. Conversely, the author also
reports, “Pre-study tasks often help individuals more effectively comprehend
information, particularly when the tasks elicit knowledge or strategies that align with the
processes or activities necessary for successful performance.”
A multitude of spatial ability tests exist. Ekstrom, French, and Harmon (1976)
compiled 72 cognitive tests assessing 23 cognitive factors. All of these tests have been
16
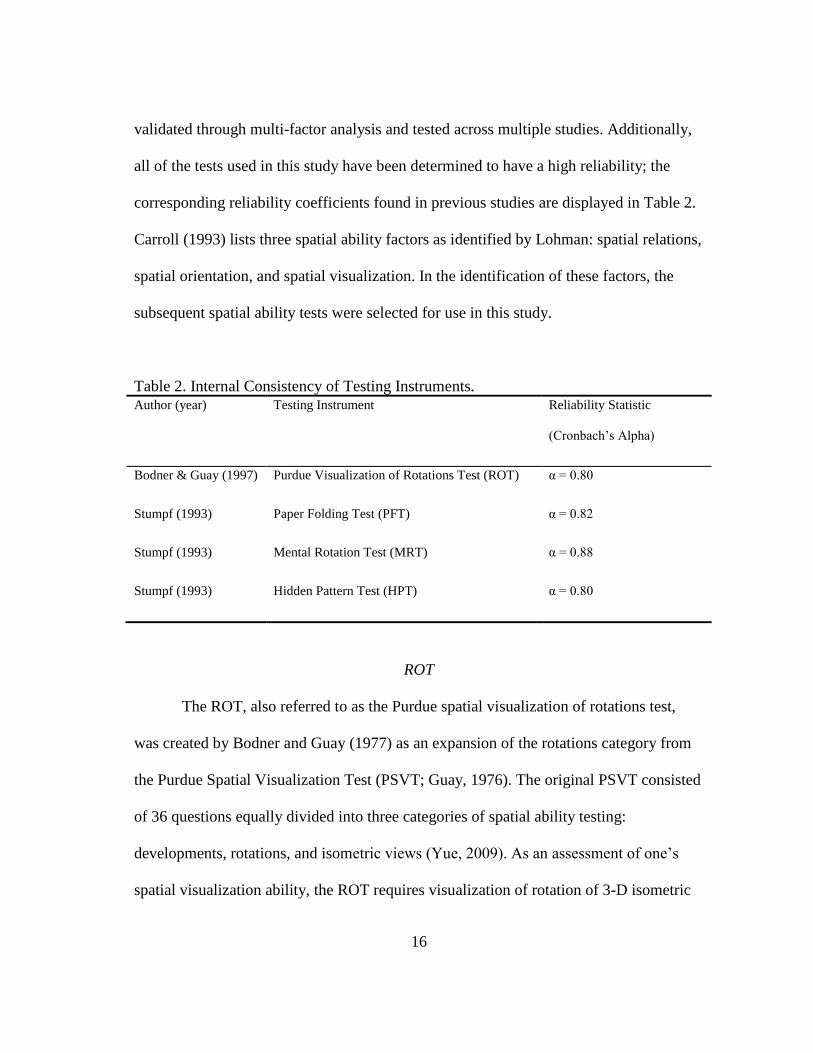
validated through multi-factor analysis and tested across multiple studies. Additionally,
all of the tests used in this study have been determined to have a high reliability; the
corresponding reliability coefficients found in previous studies are displayed in Table 2.
Carroll (1993) lists three spatial ability factors as identified by Lohman: spatial relations,
spatial orientation, and spatial visualization. In the identification of these factors, the
subsequent spatial ability tests were selected for use in this study.
Table 2. Internal Consistency of Testing Instruments. Author (year) Testing Instrument Reliability Statistic
(Cronbach’s Alpha)
Bodner & Guay (1997) Purdue Visualization of Rotations Test (ROT) α = 0.80
Stumpf (1993) Paper Folding Test (PFT) α = 0.82
Stumpf (1993) Mental Rotation Test (MRT) α = 0.88
Stumpf (1993) Hidden Pattern Test (HPT) α = 0.80
ROT
The ROT, also referred to as the Purdue spatial visualization of rotations test,
was created by Bodner and Guay (1977) as an expansion of the rotations category from
the Purdue Spatial Visualization Test (PSVT; Guay, 1976). The original PSVT consisted
of 36 questions equally divided into three categories of spatial ability testing:
developments, rotations, and isometric views (Yue, 2009). As an assessment of one’s
spatial visualization ability, the ROT requires visualization of rotation of 3-D isometric

17
shapes in both the horizontal and vertical planes. The ROT has been tested and validated
as a reliable means of predicting academic success across multiple disciplines, many of
which are closely aligned to construction science. Guidera (2010) administered the ROT
to 68 students in a first-year undergraduate design foundations course, 22 of which were
construction management students and the rest were either architecture or interior design
majors. The ROT was determined to be a reliable predictor of academic success in their
research. Further, Guidera (2010) did not find any statistically significant difference in
spatial ability between the students in different academic majors that were participating
in the course. Branoff and Dobelis (2012) investigated whether spatial ability, as
measured by the ROT, had any relation to an engineering student’s ability to read and
interpret engineering drawings as measured by a modeling test. Their analysis
discovered a significant correlation between spatial ability and scores on the modeling
test. Visualization, as defined by Lohman (1993) is the “ability in manipulating visual
patterns.” Visualization has been attributed to the interpretation and creation of design
drawings, a crucial task that is assessed in a construction surveying course. Thus, spatial
visualization, as measured by the ROT, is one critical factor in understanding a
construction surveying students’ overall spatial ability.
PFT
Spatial ability visualization is also assessed by the Paper Folding Test (PFT) as
created by Ekstrom et al. (1976). They highlight the research of Carroll (1974) that
claims spatial visualization, as assessed by the PFT, requires performing serial

18
operations while mentally manipulating a folded object; an additional step beyond just
spatial orientation. Visualization, as measured by the PFT, is less researched than the
previous visualization test; however, it has been correlated with academic success, but
some conflicting results arise throughout different academic disciplines. Turgut and
Yilmaz (2012) utilized the PFT and another visualization test, the surface development
test, to correlate spatial ability to academic success in high school mathematics students.
However, another study conducted with high school students by Liner (2012) did not
find a correlation between academic success and this spatial ability in physics students.
Further, Liner (2012) conducted a pre-test and post-test PFT with the high school
students and found no significant increase in this spatial ability; the author attributed
these results to a lack of spatial visualization required in the high-school physics course.
Lastly, Baker and Talley (2012) linked spatial visualization to academic ability, as
measured by the American College Testing (ACT) scores; but they found less of a
correlation between spatial visualization and academic success in freshman level
undergraduate chemistry students. Conflicting results from the PFT, as administered in
previous research, highlights how the importance of spatial visualization differs across
academic discipline and poses the question of whether spatial visualization is a key
spatial ability component for construction science undergraduate students.
MRT
To assess Lohman’s (Carroll, 1993) spatial ability component of spatial relation,
the Mental Rotation Test (MRT) was created by Vandenberg and Kuse (1978). The

19
MRT requires visualization of rotations of 3-D shapes about the horizontal axis. Spatial
relation has been linked to academic success across multiple disciplines; Rohde and
Thompson (2007) identified such a link in undergraduate psychology students.
Additionally, Furnham and Chamorro-Premuzic (2004) correlated spatial relation, as
measured by a rotations test similar to the MRT, with exam scores in an undergraduate
statistics course. In an undergraduate functional anatomy course, Guillot, Champely,
Batier, Thiriet, and Collet (2007) identified a strong correlation between the MRT and
the group embedded figures test to academic success. The group embedded figures test
is similar to that of the Hidden Patterns Test (HPT); the HPT is discussed in the
following section. Peters et al. (1995) researched the influence academic major had on a
student’s spatial ability using the MRT; they found that Bachelor of Science majors
significantly outperformed their Bachelor of Arts counterparts. Further, Peters,
Lehmann, Takahira, Takeuchi, and Jordan (2006) found similar results when comparing
those in traditional science majors versus social science majors using data from four
universities across diverse cultural areas. Lastly, Chamorro-Premuzic, Furnham, and
Ackerman (2006) recognized confounding results relating academic performance with
spatial relation ability; significant correlations were found between spatial relation and
academic performance for exams and essays, but not for the final project or continuous
assessment of undergraduate psychology students. Will these confounding results be
present when assessing the different academic performance measures and spatial
abilities with undergraduate construction science students?

20
HPT
The final spatial ability assessment test in the spatial battery, the HPT, measures
spatial orientation as described by Carroll (1993). The HPT requires spatial object
recognition and visual detection of embedded features. Prior research conducted utilizing
the HPT is mainly focused on gender differences; however, some research has linked the
HPT to both academic performance and practical life skills. Liben, Myers, and
Christensen (2010) found a link between the practical life skill of mapping performance
and three spatial ability tests (HPT, MRT, and PFT) with undergraduate psychology
students. Additionally, Lin (2016) found a significant difference in spatial ability
performance, specifically for spatial visualization and spatial orientation of
undergraduate students majoring in design disciplines compared to those in non-design
majors. Further, no significant difference was found between the two groups in terms of
spatial relations performance as measured by the HPT. Williamson, Williamson, and
Hinze (2016) found a significant difference in scores between undergraduate chemistry
students taking an online version of the HPT versus a paper-and-pencil version, whereas
there was no significant difference found in the other five cognitive tests researched.
However, the authors attributed this finding to an error in translating the paper-and-
pencil version to an online format. Thus, this study must carefully examine the multiple
cognitive ability tests used and ensure the instrument translation mirrors the paper-and-
pencil versions to the greatest extent possible.

21
Spatial Battery z-Score
As described above in the rationale and literature review, both industry and
academia require a multitude of spatial skills. Ahmed et al. (2014) identified 93 different
traits that were important to industry regarding construction students. As one of those
skills, plan interpretation/ blueprint reading/ understanding construction and shop
drawings utilizes a multitude of spatial skills. Academia also recognizes the importance
of reading and interpreting shop drawings by employing multiple spatial skills as the
ACCE (2016) lists this as one of the core competencies of accreditation. Since the skills
required of a construction student often go beyond just a single measure of spatial
ability, a composite spatial ability score will be coalesced from the previous four spatial
ability tests. This composite spatial battery z-score provides a more holistic view of a
student’s overall spatial ability and be an additional measure of spatial ability to be used
in statistical analysis. A mathematical z-score is computed by taking the difference
between a sample value and the mean and dividing it by the standard deviation. Thus,
this study will utilize a summation of each student’s z-score on the PFT, HPT, MRT, and
ROT to calculate a composite spatial battery z-score which will be used for analysis of a
student’s overall spatial ability.
Semester Length
Shortened semesters and intensive modes of delivery in the educational setting
are more common now than ever before as Universities aim to meet the needs of their
students in a changing world; however, this change is not founded on good pedagogy

22
and is rather a mode of convenience for students (Davies, 2006). Yet, this does not mean
that compressed courses cannot provide an adequate learning experience, and Davies
(2006) states, “In short, there is nothing in the research to indicate that intensive teaching
need not be a successful and effective mode of delivery. Intensive modes of delivery
may result in considerable advantages for students when used by effective teachers in
appropriate subjects.” Two modes of compression are present in the educational setting:
1) reduction of total contact hours and 2) no reduction in total contact hours. Williamson
(2017) researched the former type of compression in his study on the achievement of
construction management students. Due to the similarities of this study, the research by
Williamson (2017) is of particular interest to this study. Williamson (2017) discovered
that students taking a shortened (mini) semester scored better on lab activities, reading
quizzes, and total course points. However, exam grades were found to be significantly
better in the mini-mester course than the full-semester offering. On the contrary, further
analysis by Williamson (in-press) discovered no significant differences in academic
achievement between the min-mester course and the full-semester offering. Investigation
into this discrepancy reveals that the original publication by Williamson (2017) utilized
random selection of students from the full-semester offering to yield equal sample sizes.
However, when the full data set was used by Williamson (in-press) and unequal cell
sizes were considered for, no significant findings were yielded. This contradictory
research is just one instance of the many contradictory findings that are present in the
abundant research on this topic.

23
Although the literature varies on its definition of a compressed semester, research
regarding compression generally provides that classes offered during a four-week period
or less to be compressed and that 15 or 16-week courses are described as traditional. In
fact, Austin and Gustafson (2006) found that “intensive courses do result in higher
grades than traditional 16-week semester length courses and that this benefit peaks at
about 4 weeks.” Additionally, the authors attributed these higher grades to actual
knowledge gain and not resultant of “lowering the bar” for the compressed course
format. Daniel (2000) also supports this claim, and research from a comprehensive
literature review discovered that any course, regardless of discipline, can effectively
implement compressed courses without sacrificing a student’s learning experience.
Some advantages of compressed courses listed by Daniel (2000) include: convenience,
higher scores, stimulated discussion, and creative teaching techniques; some of the
disadvantages include: fatigue, stress, lack of preparation time, and lack of time to study.
An abundance of literature on compressed course formats are tied to spacing
effect theory and how variations in the frequency and timing of instruction affect a
student’s learning. A meta-analysis of 63 studies was conducted by Donovan and
Radosevich (1999) and compared massed practice conditions to spaced practice
conditions. Donovan and Radosevich (1999) defined each of these conditions as follows:
“Massed practice conditions are those in which individuals practice a task continuously
without rest, while spaced practice conditions are those in which individuals are given
rest intervals within the practice session.” The authors found a significant performance
increase in spaced practice conditions; however, the authors also claim the appropriate

24
interval spacing between instruction varies by task difficulty. In support of these
findings, research by Petrowsky (1996) found that the compressed course students
performed better on the first test requiring simple recall of information while the
traditional course performed better on the second test involving comprehension,
application, and analysis. While some research supports an increase in performance for
students taking compressed courses versus the traditional format (Austin & Gustafson,
2006; Bentley, 2006; Gallo & Odu, 2009; Logan & Geltner, 2000; Van Scyoc &
Gleason, 1993), other research show an increase in failure rates with decreased
performance (Doggrell & Schaffer, 2016; Donovan & Radosevich, 1999), and some
research discovered no significant difference in performance between the two groups
(Anastasi, 2007; Carrington, 2010; Ewer, Greer, Bridges, & Lewis, 2002).
Overall success of compressed courses requires certain attributes as described by
Scott (2003): instructor characteristics, teaching methods, classroom environment, and
evaluation methods. Workload requirements of compressed courses were investigated by
Lutes and Davies (2013) and found a significant difference between compressed and
traditional courses using surveys of over 29,000 undergraduate students; their research
concluded that traditional course students spent an average of 17 minutes more per credit
per week than their compressed counterparts. This means that a student in a traditional
three credit course would spend an average of 51 more minutes per week on their
coursework than a student in a compressed semester format.

25
Research Questions and Limitations
Although there are many courses in the undergraduate construction science
degree program, this research is limited to students taking the upper-level, undergraduate
surveying course. A multitude of cognitive reasoning and spatial ability tests exist; but,
this study does not assess all possible cognitive reasoning and spatial abilities.
Additionally, overall student performance is measured by combined points in major
graded areas, not on an item-by-item basis. Finally, a construction surveying student’s
laboratory grade points are a result of group-graded events; the effect of this group
scoring was not investigated in this study and would be a viable topic for further
research.
To produce foundational research on the spatial abilities of construction science
students as mentioned in the previously stated objectives, this research first examines
how cognitive reasoning and spatial abilities are correlated with a student’s academic
performance. It is hypothesized that students with high reasoning ability will
academically perform better than students with low reasoning ability in a construction
surveying course. Additionally, students with high spatial ability will academically
perform better than students with low spatial ability in a construction surveying course.
Further, it is hypothesized that students with both high reasoning and high spatial
abilities perform better academically than those students with both low reasoning and
low spatial abilities in a construction surveying course. In an attempt to fill gaps in the
current construction science body of knowledge, the research in this study will attempt
to answer the following research questions:

26
• Are the reasoning abilities and spatial abilities of construction surveying students
correlated as it has been found in other disciplines?
• Is there a correlation between a student’s academic performance in a construction
surveying course and their reasoning or spatial abilities?
• Is reasoning ability alone or spatial ability alone sufficient as a predictor of a
student’s academic performance in the construction surveying course, or are both
cognitive abilities required?

27
METHOD
Population
Three semesters (Fall 2016, Spring 2017, and Summer 2017) of construction
surveying courses taught by the same instructor at a large, south-central university in the
United States were used for this study. Four sections limited to 30 students each are
offered each semester; approximately 360 students were invited to take part in this study.
Construction surveying is a 300-level undergraduate course with most students
registering during their senior year; however, some sophomore and junior students also
take this course and were included in the study. As approved by the institutional review
board, students gave written permission prior to their data being used in this research.
Additionally, those students voluntarily declining to participate in either the reasoning
ability instrument or spatial ability instruments were not evaluated as part of the data set.
Furthermore, any students taking an unusually high or low time on the TOLT, are
considered outliers and removed from the study. Outliers were identified as those
performing greater than two standard deviations from the mean, relating to their timing
on the TOLT, as calculated during data analysis. Lastly, any students electing to drop or
withdraw from the course were excluded from this study.

28
Testing Instruments
Reasoning Ability Instrument- TOLT
The TOLT was developed by Tobin and Capie (1981) to assess cognitive
reasoning ability based on the foundational work of Inhelder and Piaget (1955, 1958).
Through the use of this assessment, Tobin and Capie were able to measure, with high
consistency, the formal thinking ability of students in grade levels six through college.
Trifone (1987) dissected the test into each of its measured formal reasoning abilities
including: proportional reasoning, controlling variables, probabilistic reasoning,
correlational reasoning, and combinatorial reasoning. Proportional reasoning was
described as crucial in the comprehension of the quantitative aspects of science.
Controlling variables is an important reasoning ability used in experimental situations
and allows a student an understanding of manipulating both independent and dependent
variables. Experimental understanding is an important factor related to probabilistic
reasoning, and one of the TOLT’s aims is to determine if a student has the ability to
think in terms of probability and the need for repetition in research trials. The
relationship between variables within a data set is described by a student’s correlational
reasoning ability. Lastly, the combinatorial reasoning ability questions on the TOLT
determine a whether a student can list all possible outcomes of a solution set. Each of
these abilities is tested equally among the TOLT and broken down by a subset of two
questions each.
The TOLT consists of eight multiple choice and two exhaustive solution listing
questions, which prior research has found the test to take approximately 40 minutes.

29
Two questions are asked for each of the first four measures of formal reasoning. These
eight questions require the student to select the correct answer along with the correct
justification for selecting that answer. Correct responses require both the correct answer
and reasoning to receive a score for that question. The last measure of formal reasoning,
combinatorial reasoning, is measured by two questions requiring the student to list all
possible combinations from a set of items. A response on these last two questions require
every possible combination, without replication, to be scored as correct. For all 10
questions, a correct response receives a score of one, and an incorrect response is scored
as a zero; the maximum score on the TOLT is 10 points. In their foundational research,
Tobin and Capie (1981) measured the reliability of the TOLT to be α=0.85. The
following is a sample question from the TOLT as created by Tobin and Capie (1981):
“Four large oranges are squeezed to make six glasses of juice. How much juice can be
made from six oranges?” This question assesses proportional reasoning where the
correct answer would be 9 oranges; the correct corresponding reasoning answer would
be, “The number of glasses compared to the number of oranges will always be in the
ratio 3 to 2.”
As a validated means of assessing cognitive reasoning ability, the TOLT will be
used in this study to assess a construction surveying student’s reasoning ability. To this
end, the TOLT will ensure the different class sections have similar cognitive functions
and can be treated as a single population for data analysis.

30
Spatial Battery
As a robust measure of spatial ability, four tests of spatial aptitude will be used in
this study. Two of the tests will assess spatial orientation abilities and the other two will
assess spatial visualization abilities. The Mental Rotation Test (MRT), created by
Vandenberg and Kuse (1978), measures spatial orientation of rotated three-dimensional
objects. Additionally, a spatial orientation test that measures more complex rotations and
hidden parts will be used, the Purdue Visualization of Rotations Test (ROT). The first of
the two visualization tests is the Paper Folding Test (PFT) created by Ekstrom et al.
(1976); this test measures the ability to mentally restructure a folded two-dimensional
piece of paper. Lastly, Ekstrom et al. (1976) created the Hidden Patterns Test (HPT) to
measure spatial visualization and flexibility by requiring the identification of a given
figure within a “distracting perceptual field.”
MRT
The MRT requires students to spatially orient mentally rotated images.
Consisting of 20 questions, the test is divided into two parts, each constrained to a time
limit of three minutes. Each question identifies a subject figure and four alternative
rotations to select from. Two of these alternatives will be correct rotations while the
other two are either mirrored rotations of the subject image or altogether different
subject images that are rotated; these incorrect rotated figures are referred to as
“distractors” by Vandenberg and Kuse (1978). Vandenberg and Kuse (1978) required
the selection of both correct answers for a correct response to prevent unreliable results

31
from simply guessing the answer. Figure 1 shows a sample question from the MRT in
which the first image is the subject figure and both the second and fourth images are
correct responses. Correct responses are scored as one point while incorrect or no
response is scored as zero points. Total scores on the MRT range from zero to 40 points.
Figure 1. Sample Question from the MRT
ROT
Purdue created the visualization of rotations test (ROT) as another spatial ability
instrument to measure spatial orientation. Similar to the MRT, the ROT requires
mentally manipulating an object but Bodner and Guay (1997) claim there are multiple
differences. The ROT, unlike the MRT, uses the natural axis of the object, contains
questions where parts of the subject object are hidden, and allows rotation of the object
about more than one axis. The ROT is a 20-item test restricted to 10 minutes. For each
question, three rows of images are provided. The top row consists of two images; one
displays a sample image and the other shows the desired rotation. On the second row,
students are given the subject image and then required to select the proper image of
desired rotation from five possible images in the third row. A correct response receives a
score of one and an incorrect response receives a score of zero; the maximum score on

32
the ROT is 20 points. Figure 2 shows an example question from the ROT where image D
is the correct answer.
Figure 2. Sample Question from the ROT
PFT
The PFT is the first of two visualization tests that require mental manipulation of
a folded object. Two sets of ten questions each are provided in this test; each set has a
time limit of three minutes. Unlike the scoring in the previous tests, students will be
given one point for each correct answer, zero points for an unanswered question, and a
negative score of 0.2 for each incorrect answer. However, the minimum score for the test
is set at zero and the maximum possible points is 20 points. Each question provides a
square piece of paper sequentially folded up to three times with a hole punched through
it. The student is required to mentally reconstruct the paper to determine the position of
the holes when unfolded. Five images of square paper with holes are provided with each
sequentially folded question set; the student must select the unfolded square piece of
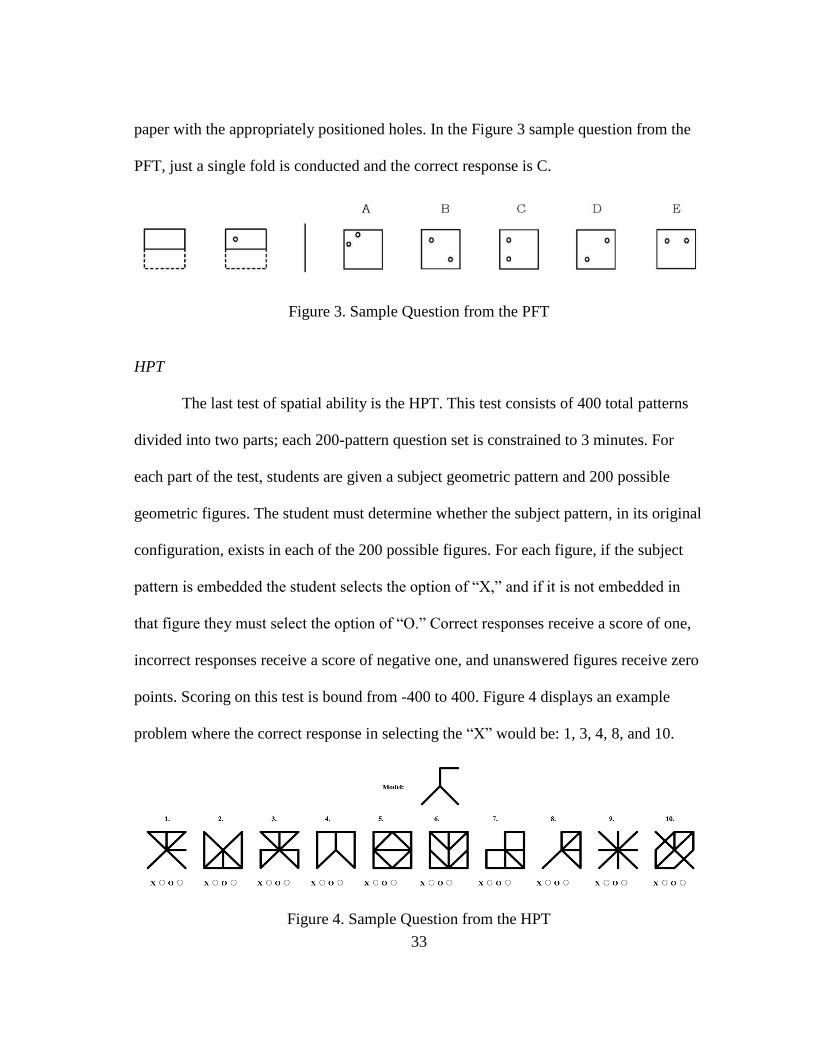
33
paper with the appropriately positioned holes. In the Figure 3 sample question from the
PFT, just a single fold is conducted and the correct response is C.
Figure 3. Sample Question from the PFT
HPT
The last test of spatial ability is the HPT. This test consists of 400 total patterns
divided into two parts; each 200-pattern question set is constrained to 3 minutes. For
each part of the test, students are given a subject geometric pattern and 200 possible
geometric figures. The student must determine whether the subject pattern, in its original
configuration, exists in each of the 200 possible figures. For each figure, if the subject
pattern is embedded the student selects the option of “X,” and if it is not embedded in
that figure they must select the option of “O.” Correct responses receive a score of one,
incorrect responses receive a score of negative one, and unanswered figures receive zero
points. Scoring on this test is bound from -400 to 400. Figure 4 displays an example
problem where the correct response in selecting the “X” would be: 1, 3, 4, 8, and 10.
Figure 4. Sample Question from the HPT

34
Procedure
Construction surveying is an online hybrid course offering web-based materials,
in-class recitation, and surveying laboratory fieldwork. The web-based materials include
videos explaining and illustrating surveying fieldwork and additional pdf documents to
supplement student learning outcomes. Specified viewing times are required to receive
points for accessing the web-based materials; a total of 100 points are possible for
accessing the web-based materials. A one-hour per week voluntary recitation period is
offered in the evening to discuss weekly activities, demonstrate equipment usage, and
answer student questions related to course material; the recitation period is not scored,
and students do not receive any grade points for attendance. Surveying laboratory
fieldwork comprises the majority of course points and consists of a dedicated four-hour
laboratory activity each week. Laboratory scoring includes nine fieldwork activities with
associated data analysis worth 70 points each; 630 total points are available for this
graded course objective. Lastly, two equally weighted exams worth a total of 270 points
are provided during the semester to assess student learning outcomes. 1,000 total grade
points are available in the construction surveying course. An additional 20 grade points
will be provided to students participating in this study but will not be considered in the
data analysis of student academic performance. The TOLT will be assigned during the
second recitation period and will be taken online in an unproctored environment. Spatial
ability tests will be assigned later in the semester and will also be taken online in an
unproctored environment. To be included in this study, students must, as approved by
the Institutional Review Board:

35
• Voluntarily take the reasoning ability instrument, the TOLT; and spatial ability
instruments, the MRT, ROT, PFT, and HPT;
• and give, in writing, permission to use their background information and
academic performance data.
Students were provided consent forms at the beginning of the study; these forms
were collected and stored until the semester was completed and grades were tabulated.
Once final grades were posted, the consent forms were reviewed to identify those
students that have or have not given permission to participate in the study. As approved
by the Institutional Review Board, only those students giving permission were included
in the data analysis for this study.
Prior to conducting statistical analysis, the data was analyzed for any potential
outliers as defined in the methodology. Outliers in this study were determined by any
student performing two standard deviations from the population mean on the reasoning
ability instrument (the TOLT) with regards to time elapsed. Once the outliers were
removed from the data, appropriate descriptive and statistical analysis was conducted
with the three semester groups of students in regards to both the reasoning ability and
spatial ability instruments. Initial data analysis, as defined in the methodology, was done
to establish whether all three groups have statistically similar levels of cognitive
maturation and can be combined into a single data set population. Each academic
performance measure was analyzed independently in correlation with each spatial ability
instrument. Further exploratory data analysis was conducted to identify any correlations
in academic performance and cognitive abilities. The following assumptions were

36
considered valid when analyzing the data after all outliers have been removed from the
study:
• It is assumed that all students taking the reasoning ability test and spatial ability
tests in an unproctored online environment are doing so with integrity.
• It is assumed that all students taking the reasoning ability test and spatial ability
tests put forth their best effort in that their scores are representative of their actual
cognitive abilities.
• It is assumed that the order in which a student takes the cognitive test battery will
not significantly affect any of their test scores.
• It is assumed that a student’s progression through the undergraduate Construction
Science program will not significantly affect their cognitive or spatial ability
scores.

37
RESULTS
Of the initial 329 participants, 39 students were excluded due to either not
finishing the course and/or not taking the all of the reasoning and spatial tests.
Additionally, 13 students were excluded as outliers. An outlier for this study was
identified when a student’s TOLT duration was shorter or longer than two standard
deviations from the population mean (M = 20.77, SD = 7.66). Upon excluding these
students, the final sample size was 277 subjects; fall 2016 (n = 101), spring 2017 (n =
86), and summer 2017 (n = 90). The participants consisted of 33 female and 244 male
students with ages ranging from 19.71 to 44.65 (M = 22.80, SD = 2.44). The high ratio
of males to females in this study is representative of the entire construction science
student population at this university as well as in the construction industry’s workforce.
One student was a freshman, one was a sophomore, 42 were juniors, and 233 were
seniors. For this analysis, all possible grade points were considered. The average grade
points in the course was a low “B” (M = 807.85, SD = 54.69). The distribution of letter
grades were: A = 9, B = 162, C = 98, and D = 8. Descriptive statistics for the variables of
interest are provided in Table 3.

38
Table 3. Descriptive Statistics Assessment (possible points) N Minimum Maximum Mean Std. Deviation
All Lab Points (630 pts) 277 408.34 584.12 520.82 37.53
All Lab View Points (100 pts) 277 10 100 88.09 11.82
All Exam Points (270 pts) 277 113.91 262.85 198.94 27.64
Total Grade Points (1000 pts) 277 656.45 922.02 807.85 54.69
To determine if any differences existed between the semester groups, a one-way
analysis of variance (ANOVA) was conducted on the TOLT scores using SPSS for
Windows (IBM, 2017). No significant differences were identified between the students’
reasoning ability for the three semesters, as measured by the TOLT, thus indicating the
three semester groups could be pooled into a single sample set for analysis. Descriptive
variables were also analyzed using an ANOVA to identify any differences present in the
assessment measures by age, gender, grade level, and semester. No significant
differences were identified for age and grade level between the assessment measures.
Males performed significantly better on the exams (F(3,028) = 4.01, p = .046) than their
female counterparts but no other assessment measures yielded significant differences for
gender. Significant differences in all assessment measures were present between
semester groups as shown in Table 4.

39
Table 4. Assessment Measures ANOVA by Semester Group Assessment F Sig. Post hoc (Games-Howell)
Lab Points F(55,258) = 22.70 p = .000 Summer > Fall** & Spring**
View Points F(1,142) = 4.18 p = .016 Summer > Spring*
Exam Points F(13,556) = 9.41 p = .000 Spring > Fall*; Summer > Fall**
Total Grade Points F(110,156) = 21.10 p = .000 Summer > Fall** & Spring**
** Post hoc p-value is significant at the 0.01 level (2-tailed).
* Post hoc p-value is significant at the 0.05 level (2-tailed).
A Post Hoc analysis utilizing Games-Howell to account for unequal cell sizes
regarding semester groups and lab points revealed that the Summer 2017 (M = 540.79,
SD = 25.64) group was significantly better than the Fall 2016 (M = 514.30, SD = 33.83)
at the p = .000 level. Additionally, the Summer 2017 (M = 540.79, SD = 25.64) group
performed significantly better than the Spring 2017 (M = 507.58, SD = 43.46) group in
lab points at the p = .000 level. The Summer 2017 (M = 90.00, SD = 7.20) group
performed significantly better than the Spring 2017 (M = 85.14, SD = 15.22) group in
view points at the p = .022 level. Regarding exam points, the Spring 2017 (M = 202.43,
SD = 25.81) group significantly outperformed the Fall 2016 (M = 189.88, SD = 27.95)
group at the p = .005 level. Further, the Summer 2017 (M = 205.78, SD = 26.51) group
performed significantly better than the Fall 2016 (M = 189.88, SD = 27.95) group for
exam points at the p = .000. Finally, in total grade points, the Summer 2017 (M =
836.57, SD = 43.57) group performed significantly better than the Fall 2016 (M =

40
793.07, SD = 49.81) group and the Spring 2017 (M = 795.15, SD = 59.24) group at the p
= .000 level for both. These point differences are unresolved; no differences in course
content or administration differed between the three semester offerings.
The next analysis conducted was into how well correlated the assessment
measures, reasoning ability test, and spatial ability tests were. A correlation is a
statistical measure that quantifies the degree of relationship between variables. The data
were analyzed for bivariate correlations between each asessment measure (Table 5) and
each spatial ability measure (Table 6). As one would expect, there was a significant
correlation between each of the assessment measures with Pearson’s correlation values
ranging from .134 to .830. Additionally, as expected, all spatial ability measures and the
cummulative spatial ability z-score were significantly correlated at the p = .01 level with
Pearson’s correlation values ranging from .376 to .798.

41
Table 5. Pearson's Correlation Between Assessment Measures with Associated p-values
(N = 277) 1 2 3 4
1 Lab Points 1
2 View Points
p-value
.232**
.000
1
3 Exam Points
p-values
.186**
.002
.134*
.025
1
4 Total Grade Points
p-values
.830**
.000
.443**
.000
.662**
.000
1
** Correlation is significant at the 0.01 level (2-tailed).
* Correlation is significant at the 0.05 level (2-tailed).

42
Table 6. Pearson's Correlation Between Spatial Ability Measures with Associated p-
values (N = 277) 1 2 3 4 5
1 PFT Score 1
2 HPT Score
p-value
.476**
.000
1
3 MRT Score
p-values
.540**
.000
.442**
.000
1
4 ROT Score
p-values
.449**
.000
.376**
.000
.425**
.000
1
5 Spatial Battery z-Score
p-values
.803**
.000
.748**
.000
.784**
.000
.733**
.000
1
** Correlation is significant at the 0.01 level (2-tailed).
* Correlation is significant at the 0.05 level (2-tailed).
The first objective of this study was to determine whether, like in other
disciplines found in the literature review, spatial abilities and reasoning abilities of
construction surveying students were correlated. To do this, a bivariate correlation
analyzing the relevant relationship between the TOLT and each spatial ability measure
was conducted (Table 7). Similar to the findings in other fields of study, the TOLT was
found to have a significant positive relationship at the p = .01 level with each of the
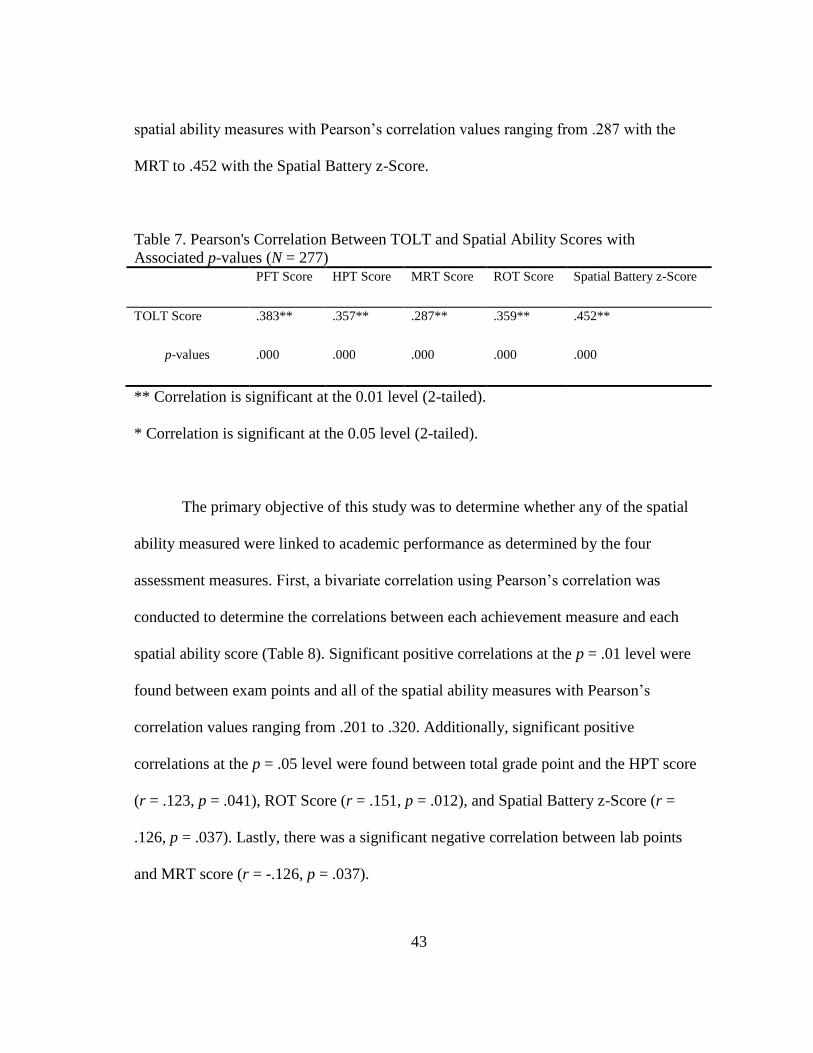
43
spatial ability measures with Pearson’s correlation values ranging from .287 with the
MRT to .452 with the Spatial Battery z-Score.
Table 7. Pearson's Correlation Between TOLT and Spatial Ability Scores with
Associated p-values (N = 277) PFT Score HPT Score MRT Score ROT Score Spatial Battery z-Score
TOLT Score
p-values
.383**
.000
.357**
.000
.287**
.000
.359**
.000
.452**
.000
** Correlation is significant at the 0.01 level (2-tailed).
* Correlation is significant at the 0.05 level (2-tailed).
The primary objective of this study was to determine whether any of the spatial
ability measured were linked to academic performance as determined by the four
assessment measures. First, a bivariate correlation using Pearson’s correlation was
conducted to determine the correlations between each achievement measure and each
spatial ability score (Table 8). Significant positive correlations at the p = .01 level were
found between exam points and all of the spatial ability measures with Pearson’s
correlation values ranging from .201 to .320. Additionally, significant positive
correlations at the p = .05 level were found between total grade point and the HPT score
(r = .123, p = .041), ROT Score (r = .151, p = .012), and Spatial Battery z-Score (r =
.126, p = .037). Lastly, there was a significant negative correlation between lab points
and MRT score (r = -.126, p = .037).

44
Table 8. Pearson's Correlation Between Assessment and Spatial Ability Measures with
Associated p-values (N = 277) PFT Score HPT Score MRT Score ROT Score Spatial Battery z-Score
Lab Points
p-values
-.024
.695
.008
.899
-.126*
.037
-.006
.914
-.048
.424
View Points
p-values
-.066
.276
.018
.761
-.012
.841
.017
.783
-.014
.817
Exam Points
p-values
.201**
.001
.224**
.000
.256**
.000
.300**
.000
.320**
.000
Total Grade Points
p-values
.071
.238
.123*
.041
.041
.500
.151*
.012
.126*
.037
** Correlation is significant at the 0.01 level (2-tailed).
* Correlation is significant at the 0.05 level (2-tailed).
To analyze the hypothesis of whether students with a high reasoning ability will
academically perform better than students with low reasoning ability, the TOLT scores
first had to be categorized into ordinal groups. To do this, the TOLT scores were sorted
in ascending order and placed into three ordinal groups: low, medium, and high.
Traditionally, TOLT scores have a mean of seven with a standard deviation of two
(Williamson & Anderson, 2017); thus, low scores were grouped as those scoring less
than five, medium scores were grouped as those scoring five through eight, and high
scores were grouped as those scoring a nine or ten. This led to the creation of three
ordinal groups of low (N = 50), medium (N = 161), and high (N = 66) to be used as the

45
independent variable in this analysis. Another sort was fit to the data to accommodate
four ordinal groups in which very low was defined as scores four and below; moderate
low was scores of five or six; moderate high consisted of scores seven, eight, and nine;
and very high was defined by a score of ten. There were differing rationales for each of
these splits, but each yielded analysis with the same significant findings. Therefore, the
traditional split of low, medium, and high for the TOLT groups will be reported here in
this research. An ANOVA was conducted between the assessment measures and the
three TOLT groups (Table 10). A significance level of .05 was used for all analyses. The
Levene test for equality of variances was found to be not significant for view points,
exam points, or total grade points, indicating the assumption underlying the application
of ANOVA was met for these tests. However, the Levene test for equality of variances
was violated for lab points. Thus, the Welch value for significance was used to account
for inequality of variances and is denoted below Table 9 appropriately.
Table 9. ANOVA of Assessment Scores by TOLT Groups Assessment SS df MS F Sig.
Lab Points 7490.48 2 3745.24 2.69 .1361
View Points 115.81 2 57.91 .41 .662
Exam Points 8444.89 2 4222.44 5.72 .004**
Total Grade Points 917.36 2 458.68 .15 .859
** The mean difference is significant at the 0.01 level (2-tailed)
1 Robust Test for Equality of Means Welch statistic used.

46
A significant difference at the p = .01 level was found between the exam points
and the TOLT (F(8,445) = 5.72, p = .004). A post hoc test to examine where these
differences existed was conducted and provided in Table 10. This analysis only
examined where the ANOVA showed significant differences within the in-group means.
A Games-Howell post hoc test was used because it accomodates unequal cell sizes as
well as unequal variances that were present in lab points of the prior analysis. Only
results relating to exam points were investigated with the Games-Howell, as they were
the only assessment measure that yielded significant ANOVA findings. A significant
difference at the p = .01 level indicated that the high TOLT group significantly
outperformed the low TOLT group in exam points.
Table 10. Post Hoc Test Between TOLT Groups and Exam Points (I) TOLT (J) TOLT Mean Difference (I-J) Std. Error Sig.
Low High -17.23 5.22 .004**
** The mean difference is significant at the 0.01 level (2-tailed)
Next, prior to conducting an ANOVA between the assessment measures and
spatial ability measures, each of the spatial ability scores had to be sorted into ascending
order and categorized into four ordinal groups: very low, moderate low, moderate high,
very high. Very low scores were defined as those below one standard deviation from the
mean, moderate low scores were defined as those within one standard deviation below
the mean, moderate high scores were defined as those within one standard deviation

47
above the mean, and very high scores were defined as those more than one standard
deviation from the mean. Since scoring on these spatial ability tests traditionally yield an
integer value or a value with one single decimal point, none of the values fell directly on
a standard deviation or the mean. Descriptive characteristics for each of the spatial
ability scores are provided in Table 11 and frequencies for the ordinal groups of interest
are provided in Tables 12.
Table 11. Descriptive Statistics for Spatial Ability Scores (N = 277) Spatial Test (possible scoring) M SD
PFT Score (0 to 20 pts) 9.96 4.08
HPT Score (-400 to 400 pts) 70.82 34.32
MRT Score (0 to 40 pts) 16.30 8.93
ROT Score (0 to 20 pts) 11.52 4.35
Spatial Battery z-Score 0.0016 3.07
Table 12. Frequency Distribution of Ordinal Groups for Spatial Abilities (N = 277) Very Low Moderate Low Moderate High Very High
PFT Score 51 76 110 40
HPT Score 52 56 135 34
MRT Score 47 107 70 53
ROT Score 50 82 89 56
Spatial Battery z-Score 46 85 102 44

48
Then, an ANOVA was conducted on the assessment measures by spatial ability
test groups (Tables 13-17). An alpha of .05 was used for all analyses. The Levene test for
equality of variances was found not to be significant in the PFT (Table 13), HPT (Table
14), and MRT (Table 15), indicating the assumption underlying the application of
ANOVA was met for these tests. However, the Levene test for equality of variances was
violated for both view points and exam points in the ROT (Table 16) and Spatial Battery
z-Score test (Table 17). Thus, in both these instances, the Welch value for significance
was used to account for inequality of variances and is denoted below the Tables 14 and
15 appropriately.
Table 13. ANOVA of Assessment Scores by PFT Groups Assessment SS df MS F Sig.
Lab Points 2502.51 3 834.17 .59 .622
View Points 328.43 3 109.48 .78 .505
Exam Points 6427.24 3 2142.41 2.86 .037*
Total Grade Points 6484.82 3 2161.61 .72 .540
* The mean difference is significant at the 0.05 level (2-tailed)

49
Table 14. ANOVA of Assessment Scores by HPT Groups Assessment SS df MS F Sig.
Lab Points 2230.20 3 743.40 .53 .665
View Points 175.83 3 58.61 .42 .741
Exam Points 8227.96 3 2742.65 3.70 .012*
Total Grade Points 9666.17 3 3222.06 1.08 .359
* The mean difference is significant at the 0.05 level (2-tailed)
Table 15. ANOVA of Assessment Scores by MRT Groups Assessment SS df MS F Sig.
Lab Points 9117.76 3 3039.25 2.19 .090
View Points 459.74 3 153.25 1.10 .350
Exam Points 13816.63 3 4605.54 6.38 .000**
Total Grade Points 2002.53 3 667.51 .22 .882
** The mean difference is significant at the 0.01 level (2-tailed)
Table 16. ANOVA of Assessment Scores by ROT Groups Assessment SS df MS F Sig.
Lab Points 1086.49 3 362.17 .26 .858
View Points 1321.28 3 440.43 3.23 .0451*
Exam Points 20332.74 3 6777.58 9.71 .0001**
Total Grade Points 18333.18 3 6111.06 2.07 .105
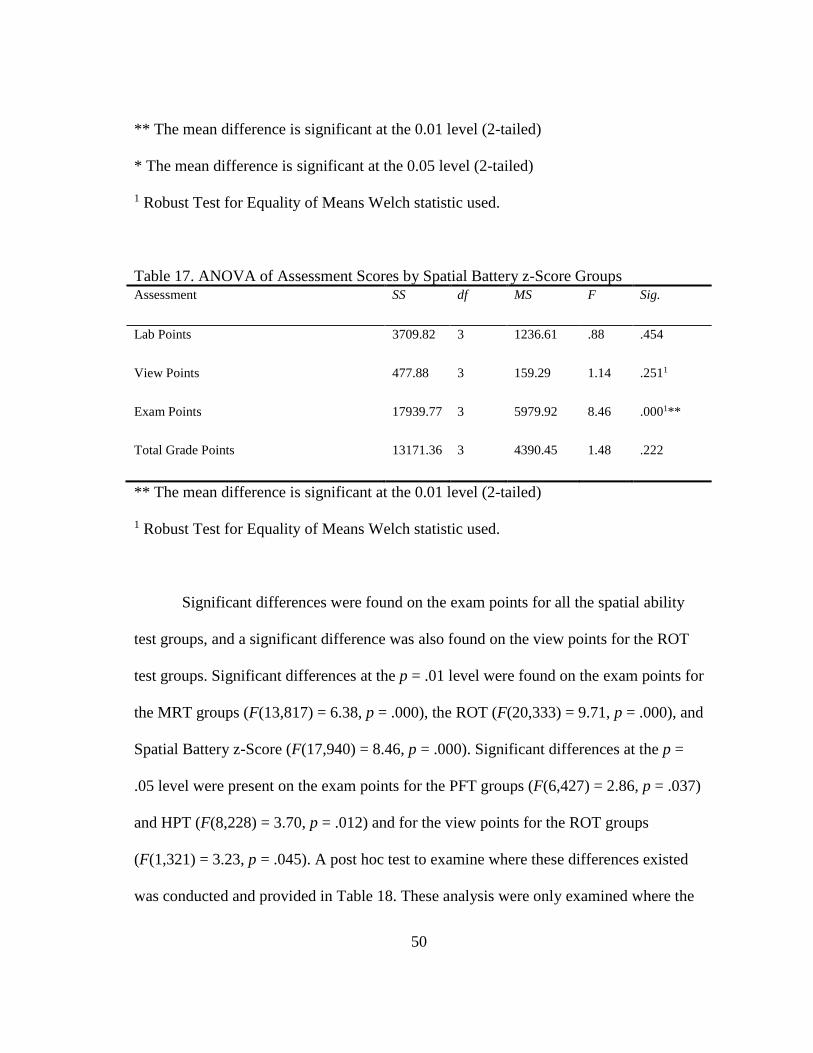
50
** The mean difference is significant at the 0.01 level (2-tailed)
* The mean difference is significant at the 0.05 level (2-tailed)
1 Robust Test for Equality of Means Welch statistic used.
Table 17. ANOVA of Assessment Scores by Spatial Battery z-Score Groups Assessment SS df MS F Sig.
Lab Points 3709.82 3 1236.61 .88 .454
View Points 477.88 3 159.29 1.14 .2511
Exam Points 17939.77 3 5979.92 8.46 .0001**
Total Grade Points 13171.36 3 4390.45 1.48 .222
** The mean difference is significant at the 0.01 level (2-tailed)
1 Robust Test for Equality of Means Welch statistic used.
Significant differences were found on the exam points for all the spatial ability
test groups, and a significant difference was also found on the view points for the ROT
test groups. Significant differences at the p = .01 level were found on the exam points for
the MRT groups (F(13,817) = 6.38, p = .000), the ROT (F(20,333) = 9.71, p = .000), and
Spatial Battery z-Score (F(17,940) = 8.46, p = .000). Significant differences at the p =
.05 level were present on the exam points for the PFT groups (F(6,427) = 2.86, p = .037)
and HPT (F(8,228) = 3.70, p = .012) and for the view points for the ROT groups
(F(1,321) = 3.23, p = .045). A post hoc test to examine where these differences existed
was conducted and provided in Table 18. These analysis were only examined where the

51
ANOVA or Levene test showed significant differences within the in-group means. A
Games-Howell post hoc test was used because it accomodates unequal variances that
were present in four instances of the prior analysis. Only results relating to view points
and exam points were investigated with the post hoc test and only where they previously
yielded significant findings. No significant differences were found in the post hoc tests
between the PFT score groups and exam points or the ROT score groups and view
points. Significant differences at the p = .01 level indicated that the very high group
performed significantly better in exam points than the very low group for the HPT,
MRT, ROT, and Spatial Battery z-Score.

52
Table 18. Post Hoc Tests Between Spatial Groups and Exam Points (I) Group (J) Group Mean Difference (I-J) Std. Error Sig.
HPT Very Low Very High -19.21 5.61 .006**
MRT Very Low
Moderate Low
Very High
Very High
-21.83
-15.84
4.91
3.91
.000**
.000*
ROT Very Low
Very Low
Very Low
Moderate Low
Moderate High
Moderate Low
Moderate High
Very High
Very High
Very High
-14.08
-15.90
-27.64
-13.56
-11.73
4.59
4.78
4.56
4.04
4.26
.014*
.006**
.000**
.006**
.033*
z-Score Very Low
Very Low
Moderate Low
Moderate High
Moderate High
Very High
Very High
Very High
-13.73
-24.74
-20.06
-11.01
5.19
5.08
3.83
4.08
.046*
.000**
.000**
.039*
** The mean difference is significant at the 0.01 level (2-tailed)
* The mean difference is significant at the 0.05 level (2-tailed)
The final investigation was into whether any spatial abilities were moderated by
reasoning ability. To determine whether any spatial abilities were moderated by
reasoning ability, an ANOVA was conducted using the independent value of the TOLT
groups on each of the spatial ability measures (Table 19). A significance level of .05 was
used for all analyses. The Levene test for equality of variances was found not to be

53
significant in the PFT, MRT, and Spatial Battery z-Score, indicating the assumption
underlying the application of ANOVA was met for these tests. However, the Levene test
for equality of variances was violated for both the HPT Score and ROT Score. Thus, in
both these instances, the Welch value for significance was used to account for inequality
of variances and is denoted below Table 19 appropriately. Significant differences at the
p = .01 level were present for the TOLT groups on all spatial ability scores.
Table 19. ANOVA of Spatial Ability Scores by TOLT Groups SS df MS F Sig.
PFT Score 523.43 2 261.71 17.74 .000**
HPT Score 29449.57 2 14724.78 13.65 .0001**
MRT Score 1070.86 2 535.43 7.01 .001**
ROT Score 581.22 2 290.61 17.16 .0001**
Spatial Battery z-Score 390.23 2 195.11 24.21 .000**
** The mean difference is significant at the 0.01 level (2-tailed)
1 Robust Test for Equality of Means Welch statistic used.
A post hoc test to examine where these differences existed was conducted and
provided in Table 20. Once again, a Games-Howell post hoc test was used because it
accomodates unequal variances that were present in two instances of the prior analysis.
Significant differences at the p = .01 level were found between the low TOLT group and
both the medium and high TOLT groups for each spatial ability score in all but one

54
instance; this one instance is the MRT score where the low TOLT group and the medium
TOLT group were found to be significant at the p = .05 level. Additionally, siginificant
differences at the p = .05 level were found between the medium TOLT group and high
TOLT group for the PFT score and ROT score. Lastly, significant differences at the p =
.01 level were discovered between the medium and high TOLT groups for the Spatial
Battery z-Score.

55
Table 20. Post Hoc Tests Between TOLT Groups and Spatial Test Scores (I) TOLT (J) TOLT Mean Difference (I-J) Std. Error Sig.
PFT Score Low
Low
Medium
Medium
High
High
-2.91
-4.22
-1.31
.59
.67
.55
.000**
.000**
.047*
HPT Score Low
Low
Medium
High
-22.85
-31.20
6.71
6.85
.003**
.000**
MRT Score Low
Low
Medium
High
-3.58
-6.13
1.36
1.57
.028*
.000**
ROT Score Low
Low
Medium
Medium
High
High
-2.88
-4.49
-1.61
.64
.69
.56
.000**
.000**
.012*
z-Score Low
Low
Medium
Medium
High
High
-2.44
-3.66
-1.22
.48
.51
.37
.000**
.000**
.004**
** The mean difference is significant at the 0.01 level (2-tailed)
* The mean difference is significant at the 0.05 level (2-tailed)
Limitations
Although construction science programs are discussed throughout this research,
this study was limited to three semesters of students taking an upper-level undergraduate
surveying course at Texas A&M University. Further, while a variety of reasoning and

56
spatial abilities were measured, not all possible measures of these cognitive abilities
were assessed. Additionally, academic achievement was measured by a composite score
in four major graded areas but not broken down into an item-by-item basis for
evaluation. Finally, although gender and semester differences in academic achievement
measures were discovered, these findings remain unresolved as they were not the
primary objective of this research. Additional research would be needed to further
investigate these differences.

57
CONCLUSIONS
The spatial test battery used in this research has been well established as a
reliable means of assessing students’ spatial abilities across multiple disciplines; yet, this
is the first study of its kind to assess spatial abilities of construction science students.
This study will provide construction researchers and educators with a validated means of
predicting success in construction science students. As the first of its kind in
construction science research, this study provides a baseline of spatial ability scores
present in a population of 277 undergraduate students in construction surveying.
Additionally, this study provides additional insight on the cognitive reasoning abilities of
these students and will add to the already existing body of knowledge in this area.
In analyzing the descriptive statistics, two major findings were discovered. First,
males performed significantly better than females on the exams. This result is similar to
findings of other research; however, since gender was not a specific focus of this study,
the population was not specifically analyzed regarding this measure. Further analysis
and research would be required to determine if there truly is a significant gender
difference regarding exam points. The second major finding was within the semester
groups; in all assessments measures, the summer performed significantly better than
either the spring or fall. These findings are in agreement with the previous conference
proceeding findings of Williamson (2017) but conflict with the findings of Williamson
(in-press). The author of this study would conclude that the summer semester overall
performs better than the traditional fall or spring semester as found in this study and by

58
other researchers. The author proposes that the better summer performance could be
resultant of student course load; students registering for the summer course of
construction surveying are not allowed to enroll for any other courses for that term. This
allows a student to be completely immersed in the course and have less distractions
leading to better academic performance.
Although not unexpected, all assessment measures were found to be significantly
positively correlated. Additionally, all the spatial measures had significant positive
correlations. Since this specific battery of spatial tests is well recognized in the academic
community, these results were expected. Spatial ability is one measure of intelligence,
and since this battery of tests analyzes different subcomponents of a student’s overall
spatial ability, it is not surprising that there were significant positive correlations
between all the tests. Further, in response to the first research question, a significant
positive correlation was found between the TOLT and all spatial ability test measures.
As both spatial and reasoning abilities are a function of a student’s intelligence and were
found to be positively correlated in this study, it is concluded that students with a high
reasoning ability tend to have a high spatial ability.
As to the second research question, it was discovered that significant positive
correlations existed between the all spatial test measures and the exam points and
between the HPT, ROT, and Spatial Battery z-Score with total points. Additionally, a
significant negative correlation was discovered with the MRT and lab points. The author
offers no explanation as to why a negative correlation exists with the MRT; future
research is needed to further investigate this finding. Hegarty (2017) performed two

59
studies (N = 97) related to the strategies used to solve items on the MRT. It was
discovered that utilizing a mental rotation strategy was not correlated with success on the
MRT and students implemented multiple strategies to solve items including: perspective
taking, counting cubes, local turns, and global shapes. Since solving the MRT does not
solely rely on spatial strategies and this research has shown a significant negative
correlation between the MRT and one of the assessment measures, the author suggests
removing this spatial ability test from the current spatial battery for future research.
Additionally, the ROT has been researched as a reliable means of assessing a student’s
spatial ability of 3-D object rotation and has also had significant positive correlations in
this current study. Using the MRT as an additional test of 3-D rotational spatial ability is
unnecessary, especially with evidence provided against its validity in assessing spatial
ability.
When analyzing the data using an ANOVA on academic achievement scores for
the different spatial ability groups (HTP, PFT, ROT, MRT, and Spatial Battery z-Score
groups), significant differences were found for exam scores on all measures. Further
investigation using the post hoc analysis determined that the very high spatial groups
scored significantly better on exam scores than the very low spatial groups for all spatial
ability measures except the PFT. There was also a significant finding using an ANOVA
comparing view points by the ROT groups but the post hoc did not determine any
significance between the groups. It must be recognized that the PFT did not have a
positive correlation with total grade points and also did not uncover any significant
findings in the Games Howell post hoc regarding exam score by PFT groups. The author

60
suggests that the current course curriculum does not challenge students’ serial spatial
operations as much as the other spatial visualization aspects of spatial ability. Since the
literature review deems serial spatial operations as an important attribute for
construction, it would be suggested that the instructor revisit the assessment measures
and curriculum design to potentially adapt the course design to include aspects that
challenge the student in this regard.
As for reasoning ability groups, an ANOVA discovered that grouping by this
cognitive ability also had significant differences in the achievement measure of exam
points. A post hoc analysis determined that the high TOLT group was significantly
better on exams than the low TOLT group. The author believes that the overwhelming
significance and correlation between the reasoning and spatial ability tests and exam
points stems from the fact that exams are purely an individual effort. In the construction
surveying course analyzed in this research, lab points and total grade points are
confounded by issues of group work and collaboration which may negate any individual
reasoning or spatial ability differences present in students. Additionally, the view points
are not a true measure of reasoning or spatial ability and are merely a result of effort on
the student’s part to read the assigned material. The author suggests the instructor
revisits the assessment measure of view points and potentially alter the curriculum to
ensure students cognitive abilities, and therefore intelligence and effort in the course are
adequately assessed.
For the final investigation of this research, an ANOVA on the spatial ability test
measures split by TOLT groups was conducted. It was determined that all cognitive

61
measures were statistically significant. The post hoc analysis showed that those students
with a high reasoning ability performed significantly better than students with a low
reasoning ability on every spatial ability test measure. These findings confirm those
found in the literature review that reasoning and spatial abilities are linked and that
students with a high reasoning ability will also have a high spatial ability. Educators
would benefit from taking note of these significant findings and be aware that both
reasoning and spatial abilities can be effective predictors of success in construction
science coursework if the course and curriculum design appropriately challenge the
students.
In conclusion, exam points were the only true measure of academic achievement
that was consistently significant in relation to both cognitive reasoning and spatial
abilities. As discussed above, exam points are the only achievement measure provided in
this construction surveying course that is purely individual effort. Additionally, due to
the relatively low point value of exams (270 out of 1,000 points), exam points were not
able to significantly alter a student’s total grade points. It is suggested that the
instructional design of this construction surveying course, as well as other construction
science courses, be better constructed to truly assess a student’s reasoning and spatial
ability and to have a grading system that recognizes these individual differences in
intelligence. This study’s findings and correlations between reasoning and spatial
abilities will assist educators in adapting curriculum to adequately educate, and
ultimately assess their students. Further, this study will help to identify potential at-risk
students in construction science according to their reasoning or spatial abilities.

62
However, further research will need to be conducted to assess how curriculum
development or instructional strategies could assist at-risk students or provide the best
learning environment for those students identified as either high or low performers with
regards to their cognitive abilities.

63
REFERENCES
Ahmed, S. M., Yaris, C., Farooqui, R. U., & Saqib, M. (2014). Key attributes and skills
for curriculum improvement for undergraduate construction management
programs. International Journal of Construction Education and Research, 10(4),
240-254. doi: 10.1080/15578771.2014.900833
American Council for Construction Education. (2016). Standards and Criteria for
Accreditation of Postsecondary Construction Education Degree Programs.
Document 103, 1-27.
Anastasi, J. S. (2007). Full-semester and abbreviated summer courses: An evaluation of
student performance. Teaching of Psychology, 34(1), 19-22. doi:
10.1080/00986280709336643
Arlin, P. K. (1975). Cognitive development in adulthood: A fifth stage? Developmental
psychology, 11(5), 602. http://dx.doi.org/10.1037/0012-1649.11.5.602
Austin, A. M., & Gustafson, L. (2006). Impact of course length on student learning.
Journal of Economics and Finance Education, 5(1), 26-37. Retrieved from
http://www.afa-srjc.org/senate_AustinGustafson.pdf
Baker, S. R., & Talley, L. (1972). The relationship of visualization skills to
achievements in freshman chemistry. Journal of Chemistry Education, 49(11),
775-776. doi: 10.1021/ed049p775

64
Bentley, R. (2006). Comparison of traditional and accelerated baccalaureate nursing
graduates. Nurse Educator, 31(2), 79-83. doi:
10.1097/01.NCN.0000336450.77906.3e
Bhat, M. A. (2016, January). The Predictive Power of Reasoning Ability on Academic
Achievement. International Journal of Learning, Teaching and Educational
Research, 15(1), 79-88. Retrieved from
https://www.researchgate.net/profile/Mehraj_Bhat7/publication/309321901_The
_Predictive_Power_of_Reasoning_Ability_on_Academic_Achievement/links/58
09f8d508ae3a04d624f5b1.pdf
Bodner, G. M., Guay, R. B. (1997) The Purdue visualization of rotations test. Journal of
Chemistry Education, 2(4), 1-17. https://doi.org/10.1007/s00897970138a
BouJaoude S., Salloum, S. & Abd-El-Khalick, F. (2004). Relationships between
selective cognitive variables and students’ ability to solve chemistry problems.
International Journal of Science Education, 26(1), 63-84. doi:
10.1080/0950069032000070315
Bousquet, W. S. (1982). An application of Ausubel's learning theory to environmental
education: A study of concept mapping in a college natural resources
management course (Doctoral dissertation). Retrieved from
http://files.eric.ed.gov/fulltext/ED216900.pdf
Branoff, T. J., & Dobelis, M. (2012). The relationship between spatial visualization
ability and students’ ability to model 3D objects from engineering assembly
drawings. Engineering Design Graphics Journal, 76(3), 37-43. Retrieved from

65
https://s3.amazonaws.com/academia.edu.documents/33245941/2012_BranoffDo
belis_RelationshipBetweenSpatial_EDGraphicsJournal2012_76_3.pdf?AWSAcc
essKeyId=AKIAIWOWYYGZ2Y53UL3A&Expires=1506711610&Signature=a
9Qht73BQPjLPOJDlOnL4Rhn3fA%3D&response-content-
disposition=inline%3B%20filename%3DThe_Relationship_between_Spatial_Vi
suali.pdf
Carrington, L. G. (2010). The impact of course scheduling on student success in
intermediate accounting. American Journal of Business Education, 3(4), 51-60.
doi: 10.19030/ajbe.v3i4.413
Carroll, J. B. (1974). Psychometric Tests as Cognitive Tasks: A New 'Structure of
Intellect' (No. ETS-RB-74-16). Educational Testing Service. Princeton, NJ.
Carroll, J. B. Human cognitive abilities: A survey of factor-analytic studies. Cambridge
University Press: Cambridge, England, 1993; pp 304-363.
Chamorro-Premuzic, T., Furnham, A., & Ackerman, P. L. (2006). Incremental validity
of the typical intellectual engagement scale as predictor of different academic
performance measures. Journal of Personality Assessment, 87(3), 261-268. doi:
10.1207/s15327752jpa8703_07
Commons, M. L., Richards, F. A., & Armon, C. (1984). Beyond formal operations: Late
adolescent and adult cognitive development (Vol. 1). Praeger Publishers.
Daniel, E. L. (2000). A review of time-shortened courses across disciplines. College
Student Journal, 34(2). 298-308. Retrieved from
http://web.a.ebscohost.com/ehost/detail/detail?vid=0&sid=408e91a7-9b07-48e4-

66
b433-
3fef6a0979b3%40sessionmgr4010&bdata=JnNpdGU9ZWhvc3QtbGl2ZQ%3d%
3d#AN=3452562&db=s3h
Davies, W. M. (2006). Intensive teaching formats: A review. Issues in Educational
Research, 16(1), 1-20. Retrieved from
https://pdfs.semanticscholar.org/2086/7b1b9907248139d9b513336f8ac929275e6
f.pdf
Demick, J., & Andreoletti, C. (2003). Handbook of adult development. Edited by Jack
Demick and Carrie Andreoletti. New York: Springer, 2003.
Dennis, I., & Tapsfield, P. (2013). Human Abilities: Their Nature and Measurement.
Taylor & Francis.
Dib, H., Adamo-Villani, N., & Garver, S. (2014). Realistic versus Schematic Interactive
Visualizations for Learning Surveying Practices: A Comparative Study.
International Journal of Information and Communication Technology Education,
10(2), 62-74. doi: 10.1002/cae.20580
Doggrell, S. A., & Schaffer, S. (2016). Reduced withdrawal and failure rates of
accelerated nursing students enrolled in pharmacology is associated with a
supportive intervention. BMC medical education, 16(1), 40.
https://doi.org/10.1186/s12909-016-0570-z
Donovan, J. J., & Radosevich, D. J. (1999). A meta-analytic review of the distribution of
practice effect: Now you see it, now you don't. Journal of Applied Psychology,
84(1), 795-805. http://dx.doi.org/10.1037/0021-9010.84.5.795

67
Doymus, K., Simsek, U., & Karacop, A. (2009). The effects of computer animations and
cooperative learning methods in micro, macro and symbolic level learning of
states of matter. Eurasian Journal of Educational Research, 36(1), 109-128.
Retrieved from
http://web.a.ebscohost.com/ehost/pdfviewer/pdfviewer?vid=2&sid=df562254-
f120-43c9-b387-0ab9eab62d90%40sessionmgr4010
Egbu, C. O. (1999). Skills, knowledge and competencies for managing construction
refurbishment works. Construction Management and Economics, 17(1), 29-43.
doi: 10.1080/014461999371808
Ekstrom R.B., French J.W., Harmon H.H. (1976). Manual for kit of factor referenced
cognitive tests. Educational Testing Service, Princeton. Retrieved from
http://www.ets.org/Media/Research/pdf/Manual_for_Kit_of_Factor-
Referenced_Cognitive_Tests.pdf
El-Mowafy, A., Kuhn, M., & Snow, T. (2013). Blended learning in higher education:
Current and future challenges in surveying education. Issues in Educational
Research, 23(2), 132-150. Retrieved from http://iier.org.au/iier23/el-mowafy.pdf
Enemark, S. (2002, April). International Trends in Surveying Education. Proceedings of
the FIG XXII International Congress, the International Federation of Surveyors,
Washington, DC, USA, 19-26 April.
Etzler, F. M., & Madden, M. (2014). The Test of Logical Thinking as a Predictor of
First-Year Pharmacy Students’ Performance in Required First-Year Courses.

68
American Journal of Pharmaceutical Education, 78(6), 121.
https://doi.org/10.5688/ajpe786121
Ewer, S., Greer, O., Bridges, W., & Lewis, B. (2002). Class length and student
performance: An extended study. International Advances in Economic Research,
8(2), 160-168. Retrieved from
http://eds.b.ebscohost.com/eds/pdfviewer/pdfviewer?vid=1&sid=a7216925-
bb41-40f1-9b26-09ab5126811b%40sessionmgr103
Farrow, C. B., Liu, J., & Tatum, M. C. (2011). Curriculum Delivery and Assessment for
Net Generation Construction Students. International Journal of Construction
Education and Research, 7(2), 109-125. doi: 10.1080/15578771.2011.575440
Felder, R., & Silverman, L. (1988) Learning and teaching styles in engineering
education. Journal of Engineering Education, 78(7), 674–681. Retrieved from
https://s3.amazonaws.com/academia.edu.documents/31039406/LS-
1988.pdf?AWSAccessKeyId=AKIAIWOWYYGZ2Y53UL3A&Expires=150671
4623&Signature=a%2FYkDWclJz6BbXJ9hmKLIKfWPuo%3D&response-
content-
disposition=inline%3B%20filename%3DLearning_and_teaching_styles_in_engi
neer.pdf
Furnham, A., & Chamorro-Premuzic, T. (2004). Personality and intelligence as
predictors of statistics examination grades. Personality and Individual
Differences, 37(5), 943-955. doi: 10.1016/j.paid.2003.10.016

69
Gallo, M. A., & Odu, M. (2009). Examining the relationship between class scheduling
and student achievement in college algebra. Community College Review, 36(4),
299-325. Retrieved from
http://journals.sagepub.com/doi/pdf/10.1177/0091552108330902
Greenfeld, J., & Potts, L. (2008). Surveying body of knowledge - Preparing professional
surveyors for the 21st century. Surveying and Land Information Science, 68(3),
133-143. Retrieved from
http://web.a.ebscohost.com/ehost/pdfviewer/pdfviewer?vid=1&sid=0c515b82-
a10e-43d2-a6e1-4f04c811cf0e%40sessionmgr4010
Guay, R. (1976). Purdue Spatial Visualization Test. Educational testing service.
Guidera, S. (2010, June). Spatial skill assessment as a predictor of student performance
in a first-year design foundations course. Proceedings from the 2010 American
Society for Engineering Education Annual Conference, Louisville, KY, 20-23
June.
Guillot, A., Champely, S., Batier, C., Thiriet, P., & Collet, C. (2007). Relationship
between spatial abilities, mental rotation and functional anatomy learning.
Advances in Health Sciences Education, 12(4), 491-507. doi: 10.1007/s10459-
006-9021-7
Harle, M., & Towns, M. (2011) A review of spatial ability literature, its connection to
chemistry, and implications for instruction. Journal of Chemistry Education
88(3), 351–360. doi: 10.1021/ed900003n

70
Hartmann, A., Dorée, A. & Martin, L. (2010). A constructivist approach for teaching
research methodology in construction management. International Journal of
Construction Education and Research, 6(4), 253-270. doi:
10.1080/15578771.2010.527181
Hegarty, M. (2017). Ability and sex differences in spatial thinking: what does the mental
rotation test really measure? Psychonomic Bulletin & Review, 1-8. Advance
online publication. doi: 10.3758/s13423-017-1347-z
Hinze, S. R., Williamson V. M., Shultz, M. J., Williamson, K. C., Deslongchamps, G., &
Rapp, D. N. (2013) When do spatial abilities support student comprehension of
STEM visualizations? Cognitive Process Internal Cognition Science, 14(2):129-
142. doi: 10.1007/s10339-013-0539-3
Holt, E. A., Chasek, C., Shaurette, M., & Cox, R. (2017). The Learning Styles of
Undergraduate Students in CM Bachelor’s Degree Programs in the US.
International Journal of Construction Education and Research, 1-18. Advance
online publication. doi: 10.1080/15578771.2017.1342718
Inhelder, B., & Piaget, G. (1955). The growth of logical thinking from childhood to
adolescence (A. Parsons & S. Seagrim, trans.).
Inhelder, B., & Piaget, J. (1958). The growth of logical thinking from childhood to
adolescence: an essay on the construction of formal operational structures. Bärbel
Inhelder and Jean Piaget. Translated by Anne Parsons and Stanley Milgram.
[New York]: Basic Books, [1958].

71
Kallio, E. (2011). Integrative thinking is the key: An evaluation of current research into
the development of adult thinking. Theory & Psychology, 21(6), 785-801. doi:
10.1177/0959354310388344
Kılıç, D. & Sağlam, N. (2014). Students’ understanding of genetics concepts: The effect
of reasoning ability and learning approaches. Journal of Biological Education,
48(2), 63-70. doi: 10.1080/00219266.2013.837402
Kirk, W. M. & Mulligan, D. (1996). Teaching right-brain thinking in a construction
curriculum. Journal of Construction Education, 1(1), 11-22. Retrieved from
http://citeseerx.ist.psu.edu/viewdoc/download?doi=10.1.1.484.8321&rep=rep1&t
ype=pdf
Lee, N., Lee, L. W., & Kovel, J. (2016, March 15). An Experimental Study of
Instructional Pedagogies to Teach Math-Related Content Knowledge in
Construction Management Education. International Journal of Construction
Education and Research, 12(4), 255-269. doi: 10.1080/15578771.2016.1141440
Lewis, S. E., & Lewis, J. E. (2007). Predicting at-risk students in general chemistry:
comparing formal thought to a general achievement measure. Chemistry
Education Research Practice, 8(1), 32-51. doi: 10.1039/B6RP90018F
Liben, L. S., Myers, L. J., & Christensen, A. E. (2010). Identifying locations and
directions on field and representational mapping tasks: Predictors of success.
Spatial Cognition & Computation, 10(2-3), 105-134. doi:
10.1080/13875860903568550

72
Lin, H. (2016). Influence of design training and spatial solution strategies on spatial
ability performance. International Journal of Technology and Design Education,
26(1), 123-131. doi: 10.1007/s10798-015-9302-7
Liner, M. S. (2012). Spatial Ability and Achievement in High School Physics (Doctoral
dissertation, Faculty of the Louisiana State University and Agricultural and
Mechanical College in partial fulfillment of the requirements for the degree of
Masters of Natural Science in The Interdepartmental Program in Natural
Sciences by Michael Shawn Liner BS, Louisiana State University).
Logan, R., & Geltner, P. (2000). The influence of session length on student success.
Report for Santa Monica College.
Lohman, D. F. (1993, July). Spatial Ability and G. Paper presented at the first Spearman
Seminar, Plymouth, UK, 21 July. Plymouth, UK: University of Plymouth.
Lohman, D. F., & Hagen, E. P. (2001). Cognitive Abilities Test (Form 6): Interpretive
guide for teachers and counselors. Itasca, IL: Riverside.
Lutes, L., & Davies, R. (2013). Comparing the rigor of compressed format courses to
their regular semester counterparts. Innovative Higher Education, 38(1), 19-29.
doi: 10.1007/s10755-012-9226-z
Markman, A. B., & Gentner, D. (2001). Thinking. Annual Review of Psychology, 52(1),
223-247. https://doi.org/10.1146/annurev.psych.52.1.223
Mohler, J. L. (2008). A review of spatial ability research. Engineering Design Graphics
Journal, 72(3), 19-30. Retrieved from
http://www.edgj.org/index.php/EDGJ/article/viewFile/49/48

73
Northrop, L. C. (1977). The Definition and Measurement of Reasoning (as cited in
Powers & Dwyer, 2003). Washington, DC: U.S. Civil Service Commission.
Peters, M., Laeng, B., Latham, K., Jackson, M., Zaiyouna, R., & Richardson, C. (1995).
A redrawn Vandenberg and Kuse mental rotations test- different versions and
factors that affect performance. Brain and Cognition, 28(1), 39-58.
https://doi.org/10.1006/brcg.1995.1032
Peters, M., Lehmann, W., Takahira, S., Takeuchi, Y., & Jordan, K. (2006). Mental
rotation test performance in four cross-cultural samples (N= 3367): overall sex
differences and the role of academic program in performance. Cortex, 42(7),
1005-1014. https://doi.org/10.1016/S0010-9452(08)70206-5
Petrowsky, M. C. (1996, July 8). The Two Week Summer Macroeconomics Course:
Success or Failure? Retrieved from
http://files.eric.ed.gov/fulltext/ED396779.pdf
Powers, D. E., & Dwyer, C. A. (2003). Toward specifying a construct of reasoning
[Research Memorandum RM-03-01]. Princeton, NJ: Educational Testing
Service. Retrieved from http://www.ets.org/Media/Research/pdf/RM-03-01-
Powers.pdf
Pribyl, J. R., & Bodner, G. M. (1987). Spatial ability and its role in organic chemistry: A
study of four organic courses. Journal of research in science teaching, 24(3),
229-240. doi: 10.1002/tea.3660240304
Rohde, T. E., & Thompson, L. A. (2007). Predicting academic achievement with
cognitive ability. Intelligence, 35(1), 83-92. doi: 10.1016/j.intell.2006.05.004

74
Sadi, Ö. & Çakiroglu, J. (2014). Relations of cognitive and motivational variables with
students’ human circulatory system achievement in traditional and learning cycle
classrooms. Educational Sciences: Theory and Practice, 14(5), 1997-2012. doi:
10.12738/estp.2014.5.2037
Schoenfeld-Tacher, R., Persichitte, K. A., & Jones, L. L. (2000). Relation of student
characteristics to learning of basic biochemistry concepts from a multimedia
goal-based scenario. Paper presented at the Annual Meeting of the American
Educational Research Association, New Orleans, LA, April 24-28.; (ERIC
Document Number: ED440875).
Scott, P. A. (2003). Attributes of high‐quality intensive courses. New directions for adult
and continuing education, 2003(97), 29-38. doi: 10.1002/ace.86
Shepard, R. N., & Feng, C. (1972). A chronometric study of mental paper folding.
Cognitive Psychology, 3(2), 228-243. https://doi.org/10.1016/0010-
0285(72)90005-9
State of California Employment Development Department. (2003). California
Operational Guides: Surveyors. Number 106. Retrieved from
http://surveypath.org/files/PDFs/EDD%20Occupational%20Guide.pdf
Stumpf, H. (1993). Performance factors and gender-related differences in spatial ability:
Another assessment. Memory & Cognition, 21(6), 828-836.
https://doi.org/10.3758/BF03202750

75
Szabo, S., Atkinson, M., & Spooner, W. (1985). Teaching abstract concepts in
sociology. Teaching Sociology, 13(1), 95-106. Retrieved from
http://www.jstor.org/stable/1318415
Tobin, K. G., & Capie, W. (1981). The Development and Validation of a Group Test of
Logical Thinking. Educational and Psychological Measurement, 41, 413-423.
doi: 10.1177/001316448104100220
Trifone, J. D. (1987, November/December). The Test of Logical Thinking. The
American Biology Teacher, 49(8), 411-416. doi: 10.2307/4448601
Trindade, J., Fiolhais, C., & Almeida, L. (2002). Science learning in virtual
environments: a descriptive study. British Journal of Educational Technology,
33(4), 471-488. doi: 10.1111/1467-8535.00283
Turgut, M., & Yilmaz, S. (2012). Relationships among Preservice Primary Mathematics
Teachers' Gender, Academic Success and Spatial Ability. Online Submission,
5(2), 5-20. Retrieved from http://files.eric.ed.gov/fulltext/ED533781.pdf
Van Scyoc, L. J., & Gleason, J. (1993). Traditional or intensive course lengths? A
comparison of outcomes in economics learning. The Journal of Economic
Education, 24(1), 15-22. http://dx.doi.org/10.1080/00220485.1993.10844775
Vandenberg, S. G., Kuse, A. R. (1978) Mental rotations, a group test of three-
dimensional spatial visualization. Perceptual Motor Skills 47(2), 599–604. doi:
10.2466/pms.1978.47.2.599
Vazquez, S. M., & de Anglat, G. D. (2009). Academic achievement and formal thought
in engineering students. Electronic Journal of Research in Educational

76
Psychology, 7(2), 653-672. Retrieved from
https://s3.amazonaws.com/academia.edu.documents/32006514/Art_18_307.pdf?
AWSAccessKeyId=AKIAIWOWYYGZ2Y53UL3A&Expires=1506722333&Sig
nature=OEeGRvieaHrwu6H3bXl26tTMrYM%3D&response-content-
disposition=inline%3B%20filename%3DAcademic_achievement_and_formal_th
ought.pdf
Wai, J., Lubinski, D., & Benbow, C. P. (2009). Spatial ability for STEM domains:
Aligning over 50 years of cumulative psychological knowledge solidifies its
importance. Journal of Educational Psychology, 101(4), 817-835. doi:
10.1037/a0016127
Wikibooks. (2017, July 4). Cognitive psychology and cognitive neuroscience/reasoning
and decision making. In Wikibooks, The Free Textbook Project. Retrieved
August 29, 2017 from
https://en.wikibooks.org/w/index.php?title=Cognitive_Psychology_and_Cognitiv
e_Neuroscience/Reasoning_and_Decision_Making&oldid=3241259.
Williamson III, K. C. (2017, April). A comparison between mini-mester and full
semester achievement in a construction surveying course. In T. Sulbaran & C.
Sterling (Eds.), Proceedings of the Associated Schools of Construction, 53rd
Annual International Conference, Seattle, Washington, 5-7 April, (pp. 217-227).
Seattle, WA: The University of Washington.
Williamson III, K. C. & Anderson, A. J. (2017). Reasoning ability as a predictor of
success in a construction surveying course. International Journal of Construction

77
Education and Research. (MS Construction Management Graduate Student)
(2017). Taylor & Francis. doi: 10.1080/15578771.2017.1380733
Williamson III, K. C. (2017). The effect of course time compression on academic
performance in construction surveying. International Journal of Construction
Education and Research. Taylor & Francis. Advance online publication. doi:
10.1080/15578771.2017.1365783
Williamson, K. C., Williamson, V. M., & Hinze, S. R. (2016). Administering Spatial and
Cognitive Instruments In-class and On-line: Are These Equivalent? Journal of
Science Education and Technology, 1-12. doi: 10.1007/s10956-016-9645-1
Wilson, A. H. (1988). Logical reasoning ability in Papua New Guinea tertiary science‐as
measured by the test of logical thinking. International Journal of Science
Education, 10(5), 589-593. doi: 10.1080/0950069880100512
Wong, J. M., Wong, F. K., & Hui, E. C. (2007). A study to improve higher education for
surveying professionals in Hong Kong. Journal for Education in the Built
Environment, 2(1), 76-89. http://dx.doi.org/10.11120/jebe.2007.02010076
Wu, H., & Shah, P. (2004) Exploring visuospatial thinking in chemistry learning.
Science Education, 88(3), 465–492. doi: 10.1002/sce.10126
Yue, J. (2009). Spatial visualization by realistic 3D views. Engineering Design Graphics
Journal, 72(1), 28-38. Retrieved from
http://www.edgj.org/index.php/EDGJ/article/viewFile/12/11