consolidated financial results for the year ended march 31, 2013
TRANSCRIPT

SHARP CORPORATION
Stock exchange listings: Tokyo, Osaka
Code number: 6753
URL: http://www.sharp.co.jp/
Representative: Takashi Okuda, President
Contact person: Kohji Aoyama, Unit General Manager
Accounting and Control Unit, Corporate Management Group
Tel. +81 6 6621 1221
Scheduled date of the Ordinary
General Meeting of Shareholders: June 25, 2013
Scheduled dividend payment date: -
Supplementary material: Yes
Financial results meeting: Yes (targeted at institutional investors and analysts)
(Monetary amounts are rounded to the nearest million yen.)
1. Results for the Year Ended March 31, 2013
(1) Financial Results
(The percentage figures represent the percentage of increase or decrease against the previous year.) Millions of Yen
Net SalesPercent
ChangeOperating Loss
Percent
ChangeNet Loss
Percent
Change
( ) ( )
( ) ( )
[Reference] Comprehensive income: March 31, 2013 ; (507,878) million yen ― %
[Reference] Comprehensive income: March 31, 2012 ; (384,880) million yen ― %
Net Loss
per Share (Yen)
Fully Diluted Net Income
per Share (Yen)Net Loss to Equity
Operating Loss
to Net Sales
( )
( )
[Reference] Equity in net income of non-consolidated subsidiaries and affiliates : March 31, 2013 ; (1,313) million yen
[Reference] Equity in net income of non-consolidated subsidiaries and affiliates : March 31, 2012 ; 737 million yen
(2) Financial Position Millions of Yen
Total Assets Net Assets Equity RatioNet Assets
per Share (Yen)
[Reference] Equity : March 31, 2013 ; 124,671 million yen
[Reference] Equity : March 31, 2012 ; 625,894 million yen
(3) Cash Flows Millions of Yen
Cash Flows from
Operating Activities
Cash Flows from
Investing Activities
Cash Flows from
Financing Activities
Cash and Cash Equivalents
at End of Year
( )
( ) ( )
Year Ended
March 31, 2013
Year Ended
March 31, 2012
2,478,586
2,455,850
Consolidated Financial Results for the Year Ended March 31, 2013
+0.9%
-18.7%
-
-
-
-
146,266
37,552
545,347
376,076
-145.3% -5.9%Year Ended
March 31, 2013
Year Ended
March 31, 2012
489.83
341.78 -
-
As of
March 31, 20132,087,763 134,837 6.0% 106.90
-45.5% -1.5%
187,866
As of
March 31, 20122,614,135 645,120 23.9% 568.83
May 14, 2013
Year Ended
March 31, 2012143,302 159,557 256,381 193,772
Year Ended
March 31, 201381,075 7,110 51,637
- 1 -

2. Dividends
Dividends per Share (Yen)
1st Quarter 2nd Quarter 3rd Quarter Year-End Annual
Note: Forecast of dividends has yet to be determined.
3. Forecast of Financial Results for the Year Ending March 31, 2014
(The percentage figures represent the percentage of increase or decrease against the same period of the previous year.) Millions of Yen
Net SalesPercent
ChangeOperating Income
Percent
Change
Net Income
(Loss)
Percent
Change
Net Income (Loss)
per Share (Yen)
( ) ( )
4. Other Information
(1) Changes in significant consolidated subsidiaries (Changes in specified subsidiaries involving changes in
( 1)scope of consolidation): Yes
Excluded : Sakai Display Products Corporation
Note: Sakai Display Products Corporation (its corporate name was changed from Sharp Display Products Corporation
on July 17, 2012) is no longer included in the scope of consolidation from the second quarter ended September 30, 2012,
as Sharp’s ownership decreased due to the stock transfer to SIO International Holdings Limited and business integration
(simplified absorption-type company split) of LCD color filter business operated by Toppan Printing Co., Ltd.,
Dai Nippon Printing Co., Ltd and DNP Color Techno Sakai Co., Ltd. at Sakai Plant into the company.
(2) Changes in accounting policies and accounting estimates, and restatement
1. Changes in accounting policies arising from revision of accounting standards: Yes
2. Changes arising from other factors: None
3. Changes in accounting estimates: Yes
4. Restatement: None
Note: Effective for the year ended March 31, 2013, Sharp Corporation and its domestic consolidated subsidiaries have
changed the depreciation method. Such changes fall under "Changes in accounting policies that are difficult to
distinguish from changes in accounting estimates." For more details, please refer to "(7) Changes in accounting
policies and accounting estimates, and restatement" of "3. Consolidated Financial Statements" on page 15.
(3) Number of shares outstanding (ordinary shares)
1. Number of shares outstanding (including treasury stock) as of March 31, 2013 ; 1,176,623,887 shares
1. Number of shares outstanding (including treasury stock) as of March 31, 2012 ; 1,110,699,887 shares
2. Number of shares of treasury stock as of March 31, 2013 ; 10,399,220 shares
2. Number of shares of treasury stock as of March 31, 2012 ; 10,375,562 shares
3. Average number of shares outstanding during the year ended March 31, 2013 ; 1,113,337,377 shares
3. Average number of shares outstanding during the year ended March 31, 2012 ; 1,100,335,416 shares
1.3%
-Year Ended
March 31, 2013
Total Dividend
Payment
(Millions of Yen)
Pay-out Ratio
(Consolidated)
Dividend to
Net Assets
(Consolidated)
-
-
5.00 -
Year Ending
March 31, 2014
Six Months Ending
September 30, 2013
11,003
0
1,270,000
2,700,000
+15.0%
5,000
Year Ending
March 31, 2014-
-
-
5.00 10.00Year Ended
March 31, 2012
0.00 - 0.00 0.00
17.15
4.29
-
-+8.9%
-
-
15,000
80,000
20,000
0.00 - 0.00 0.00 -
(The information for the year ended March 31, 2007 is unaudited)
- 2 -

Notes:
1. This financial release is not subject to audit procedures based on the Financial Instruments and Exchange
Law in Japan. At the time of disclosure, audit procedures of financial statements based on the Financial
Instruments and Exchange Law have not been completed.
2. This financial release contains certain statements about the future, which are based on information available
and deemed reasonable to the Sharp Group at the time of announcement and are not the commitments
made by the Sharp Group. Actual operating results may differ materially from the forecast due to various factors.
For the assumptions and other related matters concerning financial results forecast, please refer to "(1) Analysis
of Financial Results" of "1. Financial Results" on page 5.
3. Sharp will hold a financial results meeting on May 14, 2013. Financial materials distributed at the meeting
will be posted on its website immediately after the meeting.
4. The accompanying consolidated financial statements are a translation of the consolidated financial statements
of the Sharp Group, which were prepared in accordance with accounting principles and practices generally
accepted in Japan. In preparing the accompanying consolidated financial statements, certain reclassifications
have been made in the consolidated financial statements issued domestically, in order to present them in a
form which is more familiar to readers outside Japan.
- 3 -
1. Financial Results (1) Analysis of Financial Results
ⅰFinancial Results for fiscal 2012
During the year ended March 31, 2013, the Japanese economy showed signs of a partial recovery toward the end
of the fiscal year, in the form of a rebound in stock prices and an improvement in export business environment
due to the yen’s depreciation. However, overall conditions remained severe, with prolonged deflation, weak
business investment and stagnant employment situation.
Overseas, economies remained deeply uncertain with a European financial crisis and a slowdown in the
growth of China and emerging countries, although the U.S. economy continued to be in a moderate recovery
phase.
Amid these circumstances, the Sharp Group has worked to create distinctive devices and original products
that meet our customers’ needs. Efforts include reinforcing mass-production of IGZO*1
LCDs, launching
smartphones and tablet terminals equipped with IGZO LCDs, and enhancing sales of Black Solar high-
efficiency solar cells. In addition, new shares were issued by third party allotment under the “Capital/Business
Alliance Agreement with Qualcomm Incorporated for the Joint Development of Next Generation MEMS*2
Display” and “Strengthening of Alliance with Samsung Electronics for Liquid Crystal Business”. We have also
taken measures to reinforce our business foundations on a company-wide basis, including reductions in
inventories, as well as slashing fixed costs centering on labor costs through such measures as a voluntary
retirement program.
As a result, consolidated financial results for the fiscal year recorded net sales of 2,478.5 billion yen, an
increase of 0.9% compared to the last year, while operating loss was 146.2 billion yen, due mainly to decreased
gross margin rate caused by intensified competition and additional inventory reduction. We posted net loss of
545.3 billion yen, due mainly to write-down of noncurrent assets, restructuring charges recorded as an
extraordinary item in Other Expenses and a reversal of deferred tax assets.
Consolidated financial results for the six months ended March 31, 2013, on the other hand, recorded net sales
of 1,374.4 billion yen, up 20.4% compared to the same period in the previous year and returned to profitability
of 22.6 billion yen at the operating level, which is an improvement of 93.7 billion yen from the loss of 71.1
billion yen in the same period last year.
Operating results by product group are as follows:
Consumer/Information Products
Sales of Audio-Visual and Communication Equipment for the year ended March 31, 2013, were 732.0 billion
yen, down 31.0% compared to the previous year. Sales of LCD TVs fell drastically below the last year. This was
due mainly to sluggish demand in Japan and a sales decline in China owing to worsening Japan-China relations,
which was slightly offset by a healthy sales volume in ASEAN and other emerging countries. Mobile phone
sales also declined, due mainly to supply shortages of key components in the first half of this fiscal year and
severe competition with overseas manufacturers.
Sales of Health and Environmental Equipment were 309.6 billion yen, up 6.0%, due mainly to increased sales
of air conditioners and air purifiers.
Sales of Information Equipment were 296.7 billion yen, up 6.9% compared to the previous year. This was
due mainly to robust sales of color MFPs for the Japanese market and of information displays.
As a result, sales of these three product groups comprising Consumer/Information Products were 1,338.4
billion yen, down 17.9%.
Electronic Components
Sales of LCDs were 650.8 billion yen, up 54.9% from the previous year. This was due mainly to increased sales
of small- and medium-size LCDs for smartphones and tablet terminals, as well as healthy sales of large-size
LCDs.
Sales of Solar Cells were 259.8 billion yen, up 16.1%. This was due mainly to a sales increase in Japan
centering on residential use, as well as industrial use, such as mega-solar power generation projects, which was
slightly offset by sales decline overseas notably in Europe.
Sales of Other Electronic Devices were 229.4 billion yen, up 26.6%. This was due mainly to a sales increase
in LEDs and in camera modules for smartphones and tablet terminals.
As a result, sales of these three product groups comprising Electronic Components were 1,140.1 billion yen,
up 38.2%.
- 4 -

ⅱ. Forecast for fiscal 2013
As for the future outlook, we anticipate the overall business environment will remain unpredictable. The
Japanese economy is expected to pick up with a favorable turn such as an improvement in business confidence
and consumer sentiment, supported by economic policies aimed at correction of the yen appreciation and
overcoming of deflation under the new administration. Nevertheless, global economic prospects are clouded
with concerns, including a possible resurgence of European debt problem as well as slowdown in the growth in
China and emerging countries.
To respond to such a situation, on April 1, 2013, the Sharp Group implemented a reform of company-wide
organization and embarked on a new initiative, realizing a “lean and smart headquarters” as well as a Business
Group system aiming for quick response to customer needs and management according to the business
characteristics of each product and device.
As a corporate strategy for “recovery and growth,” as described in 2. Management Policy, we have developed
a Medium-Term Management Plan covering from fiscal 2013 to 2015.
Through steady implementation of the Medium-Term Management Plan and other measures, we will improve
our financial position, while at the same time striving with all-out effort to achieve a turnaround at the net level
in fiscal 2013.
The following is the forecast of financial results for the year ending March 31, 2014.
(The percentage figures represent the percentage of increase or decrease against the same period of the previous year.) Billions of Yen
Six months
ending September
31, 2013
Increase
Decrease
Six months
ending March
31, 2014
Increase
Decrease
Year ending
March 31, 2014
Increase
Decrease
Net sales
Operating income
Net income
1,270.0
15.0
-20.0
+15.0%
-
-
1,430.0
65.0
25.0
+4.0%
+187.2%
-
2,700.0
80.0
5.0
+8.9%
-
-
The above figures are based on an exchange rate of ¥95=US$1.00 for fiscal 2013.
Note: The above estimates of financial results are based on information available and deemed reasonable to the Sharp Group at the time
of announcement and are not the commitments made by the Sharp Group. Actual operating results may differ materially from the
forecast due to various factors. The factors that may influence the figures for final reported business results include, but are not
limited to:
・The economic situation in which the Sharp Group operates
・Sudden, rapid fluctuations in demand for products and services, as well as intense price competition
・Changes in exchange rates (particularly between the yen and the U.S. dollar, the euro and other currencies)
・Regulations such as trade restrictions in other countries
・The progress of collaborations and alliances with other companies
・Litigation and other legal proceedings against the Sharp Group
・Rapid technological changes in products and services, etc.
(2) Analysis of financial position
Total assets as of March 31, 2013 were 2,087.7 billion yen, down 526.3 billion yen from March 31, 2012. This
was due mainly to a decrease of inventories, and of plant and equipment, as a result of exclusion of Sakai
Display Products Corporation (its corporate name was changed from Sharp Display Products Corporation on
July 17, 2012) from the consolidated scope. Total liabilities were 1,952.9 billion yen, down 16.0 billion yen.
Total net assets were 134.8 billion yen, down 510.2 billion yen. This was due mainly to a decrease in retained
earnings stemming from recording of net loss.
- 5 -

(3) Basic policy on distribution of earnings and dividends for fiscal 2012/2013 Sharp Corporation considers distributing profits to shareholders to be one of management’s top priorities.
While maintaining consistently stable dividend pay-outs, and while carefully considering our consolidated
business performance, financial situation and future business development in a comprehensive manner, we had
been implementing a set of measures to return profits to our shareholders.
For fiscal 2012, we regrettably do not plan to pay a dividend, as we recorded net loss and loss of retained
earnings carried forward.
For fiscal 2013 as well, we do not plan to pay a dividend, taking account of our forecast of financial results
and current financial situation.
*1 An oxide comprising indium, gallium, and zinc. A thin-film transistor using this material has been developed by Sharp in collaboration
with Semiconductor Energy Laboratory Co., Ltd. (a company based in Kanagawa, Japan, and led by President Shunpei Yamazaki).
*2 MEMS: Micro Electro Mechanical Systems
(4) Outline of material events relating to assumed going concern
The operating results for the six months ended March 31, 2013, turned positive due to development of
distinctive devices and products such as smartphones and tablet terminals with IGZO LCDs as well as Black
Solar high-efficiency solar cells. Also, company-wide measures including reductions in inventories and slashing
total costs primarily focused on labor costs through such scheme as a voluntary retirement program, has largely
contributed to the turnaround.
Continuing from the previous fiscal year, consolidated financial performance for fiscal 2012 resulted in an
operating and net losses, as well as negative cash flows from operating activities. In addition, concerns have
been expressed that Sharp might face difficulties in redemption of the unsecured convertible bonds with
subscription rights to shares, due on September 30, 2013. However, due to implementation of various measures
as described below, we believe that these conditions will not cast a material uncertainty about Sharp’s ability to
continue as a going concern and no further disclosure under the “(5) Going Concern Assumption” on page 14 is
necessary. Sharp has received continued support and cooperation from financial institutions such as the extension of
syndicated loan of 360.0 billion yen due in June, 2013, as well as additional borrowing facility of 150.0 billion
yen, both with informal consent from main banks, Mizuho Corporate Bank, Ltd. and The Bank of Tokyo-
Mitsubishi UFJ, Ltd. As for the extension of syndicated loan, discussions with other participating banks are
progressing. Accordingly, there is no problem with the redemption of the bond above.
As a corporate strategy for “recovery and growth,” Sharp has developed Medium-term Management Plan
incorporating five core strategies:
-Restructuring Business Portfolio
-Improving Profitability of LCD Business
-Expanding Overseas Businesses Focusing on the ASEAN Market
-Reducing Fixed Costs by Reformation of Cost Structure
-Improving Financial Position
Also, in order to strengthen headquarters control and governance function, as well as action forces to
complete the Medium-Term Management Plan, Sharp newly set up the “Corporate Management Group” and
“Structural Reform Group.”
Through steady implementation of the Medium-Term Management Plan and financial arrangements, we aim
to improve financial position, while at the same time reinforcing management foundation, to realize sustainable
growth and stable profitability.
- 6 -
2. Management Policy (1) Basic management policy The Sharp Group’s business creed is based on the principles of “Sincerity and Creativity.” Our aim is to inspire
all our daily work with these principles so that we can earn the appreciation of people everywhere, and make a
valuable contribution to society. Our corporate philosophy expresses our desire to grow in mutual prosperity
with all stakeholders in the business, including shareholders, business partners, and employees.
(2) Mid- and Long-Term Business Strategy and Issues the Company Needs to Face Faced by the deterioration in financial performance and balance sheet due to rapidly changing business
environment, the Sharp Group has been taking strong action to reduce fixed costs on a company-wide basis,
including voluntary retirement program and reduction in salary and bonus. At the same time, we have worked on
creation and sales activities of distinctive devices and products. These efforts largely contributed to a turnaround
at the operating level in the second half of fiscal 2012. We have developed a “Medium-Term Management
Plan,” aiming to become a “new Sharp” that steadily implements restructuring of our business portfolio in fiscal
2013 onward, and achieves stable growth in profits and steady cash generation, with such turnaround in the
second half of fiscal 2012 as a stepping stone. Under the “Medium-Term Management Plan,” we define fiscal
2013, the first year, as a “Restructuring stage” and fiscal 2014 and 2015 as a “Re-growth stage,” where we step
up effort to full-scale growth, thus realizing “recovery and growth.”
In order to accomplish the target, we will press forward the three basic strategies below. 1. Shift to “advantageous markets and fields”
2. Exit closed innovation and aggressively utilize alliances
3. Enforce executions by innovating governance system
To be specific, we will push ahead with several strategic measures including “Restructuring Business
Portfolio,” “Improving Profitability of LCD Business,” “Expanding Overseas Businesses Focusing on the
ASEAN Market,” “Reducing Fixed Costs by Reformation of Cost Structure,” and “Improving Financial
Position,” thus raising our corporate value going forward.
- 7 -

Millions of Yen
ASSETS
Current Assets:
Cash, time deposits, and short-term investments 195,325 191,941
Notes and accounts receivable,
less allowance for doubtful receivables 435,896 486,266
Inventories 527,483 310,709
Other current assets 262,421 232,919
Total current assets 1,421,125 1,221,835
Plant and Equipment,
Less Accumulated Depreciation 872,442 563,699
Investments and Other Assets 318,454 301,619
Deferred Assets 2,114 610
Total assets 2,614,135 2,087,763
LIABILITIES
Current Liabilities:
Short-term borrowings, including
current portion of long-term debt 597,997 924,113
Notes and accounts payable 436,573 405,624
Other current liabilities 356,510 337,796
Total current liabilities 1,391,080 1,667,533
Long-term Liabilities 577,935 285,393
Total liabilities 1,969,015 1,952,926
NET ASSETS
Owners' Equity:
Common stock 204,676 212,337
Capital surplus 268,528 276,179
Retained earnings 259,937 ( 290,912 )
Less cost of treasury stock ( 13,876 ) ( 13,872 )
Total owners' equity 719,265 183,732
Accumulated Other Comprehensive Income:
Net unrealized holding gains (losses) on securities 5,610 6,062
Deferred gains (losses) on hedges ( 5,749 ) ( 25 )
Foreign currency translation adjustments ( 90,305 ) ( 61,467 )
Pension liability adjustment of foreign subsidiaries ( 2,927 ) ( 3,631 )
Total accumulated other comprehensive income ( 93,371 ) ( 59,061 )
Minority Interests 19,226 10,166
Total net assets 645,120 134,837
Total liabilities and net assets 2,614,135 2,087,763
3. Consolidated Financial Statements
(1) Consolidated Balance Sheets
As of March 31, 2012 As of March 31, 2013
- 8 -

(2) Consolidated Statements of Income / Consolidated Statements of Comprehensive Income
- Consolidated Statements of IncomeMillions of Yen
Net Sales 2,455,850 2,478,586
Cost of Sales 2,043,842 2,218,003
Gross profit 412,008 260,583
Selling, General and Administrative Expenses 449,560 406,849
Operating loss ( 37,552 ) ( 146,266 )
Other Income (Expenses)
Interest income 1,477 1,095
Rent income on noncurrent assets 8,945 4,051
Subsidy income 12,306 2,625
Gain on sales of noncurrent assets 2,968 4,268
Gain on sales of investment securities 0 728
Interest expense ( 8,254 ) ( 12,885 )
Interest on commercial papers ( 392 ) ( 285 )
Equity in losses of affiliates 0 ( 1,313 )
Lease fee for suspended facilities ( 632 ) ( 8,430 )
Loss on sales and retirement of noncurrent assets ( 5,950 ) ( 15,612 )
Impairment loss ( 6,656 ) ( 47,396 )
Loss on valuation of investment securities 0 ( 3,782 )
Loss on sales of stocks of subsidiaries and affiliates - ( 3,583 )
Loss on quality compensation ( 11,500 ) 0
Loss on suspension of large-size LCD plant operation ( 25,887 ) 0
Restructuring charges ( 117,110 ) ( 143,397 )
Settlement package ( 18,857 ) ( 17,899 )
Provision for loss on litigation - ( 32,321 )
Loss on change in equity - ( 705 )
Other, net ( 31,335 ) ( 45,080 )
( 200,877 ) ( 319,921 )
Loss before income taxes and minority interests ( 238,429 ) ( 466,187 )
Income Taxes
Current 19,617 17,607
Deferred 115,523 59,972
135,140 77,579
Loss before minority interests ( 373,569 ) ( 543,766 )
Minority Interests in Income of Consolidated Subsidiaries ( 2,507 ) ( 1,581 )
Net loss ( 376,076 ) ( 545,347 )
Year Ended
March 31, 2013
Year Ended
March 31, 2012
- 9 -
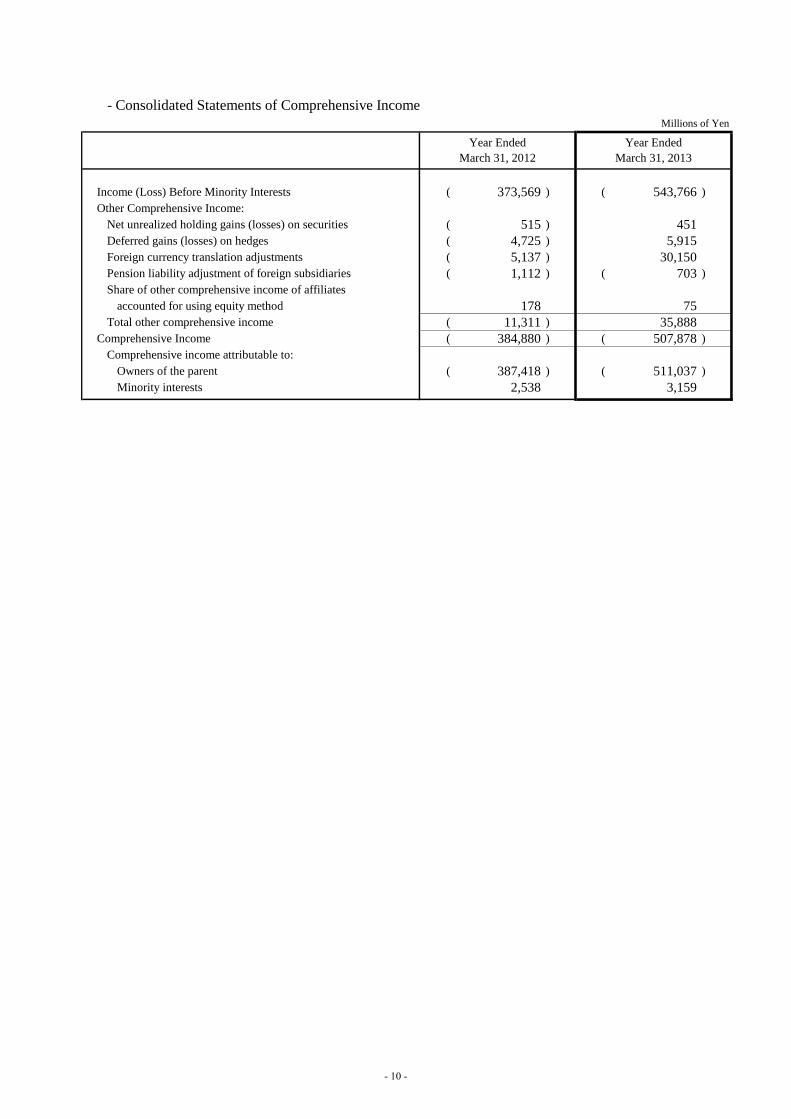
- Consolidated Statements of Comprehensive Income
Millions of Yen
Income (Loss) Before Minority Interests ( 373,569 ) ( 543,766 )
Other Comprehensive Income:
Net unrealized holding gains (losses) on securities ( 515 ) 451
Deferred gains (losses) on hedges ( 4,725 ) 5,915
Foreign currency translation adjustments ( 5,137 ) 30,150
Pension liability adjustment of foreign subsidiaries ( 1,112 ) ( 703 )
Share of other comprehensive income of affiliates
accounted for using equity method 178 75
Total other comprehensive income ( 11,311 ) 35,888
Comprehensive Income ( 384,880 ) ( 507,878 )
Comprehensive income attributable to:
Owners of the parent ( 387,418 ) ( 511,037 )
Minority interests 2,538 3,159
Year Ended
March 31, 2012
Year Ended
March 31, 2013
- 10 -
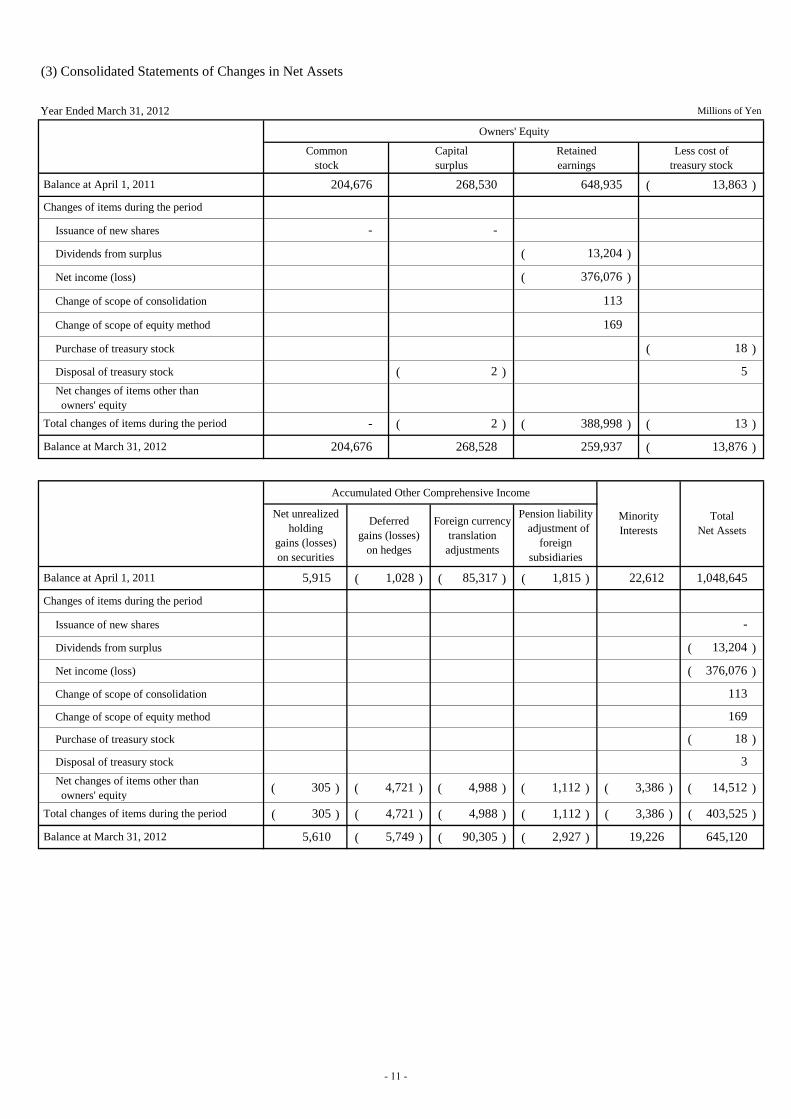
(3) Consolidated Statements of Changes in Net Assets
Year Ended March 31, 2012 Millions of Yen
Owners' Equity
Common
stock
Capital
surplus
Retained
earnings
Less cost of
treasury stock
( )
Issuance of new shares
Dividends from surplus ( )
Net income (loss) ( )
Change of scope of consolidation
Change of scope of equity method
Purchase of treasury stock ( )
Disposal of treasury stock ( )
Net changes of items other than
owners' equity
( ) ( ) ( )
( )
Accumulated Other Comprehensive Income
Net unrealized
holding
gains (losses)
on securities
Deferred
gains (losses)
on hedges
Foreign currency
translation
adjustments
Pension liability
adjustment of
foreign
subsidiaries
( ) ( ) ( )
Issuance of new shares
Dividends from surplus ( )
Net income (loss) ( )
Change of scope of consolidation
Change of scope of equity method
Purchase of treasury stock ( )
Disposal of treasury stock
Net changes of items other than
owners' equity( ) ( ) ( ) ( ) ( ) ( )
( ) ( ) ( ) ( ) ( ) ( )
( ) ( ) ( )
Minority
Interests
90,305 2,927 19,226
-
403,525
645,120
Total changes of items during the period 305 4,721 4,988 1,112 3,386
Balance at March 31, 2012 5,610 5,749
305 4,721 4,988 1,112 3,386 14,512
3
18
169
113
376,076
13,204
Changes of items during the period
Total
Net Assets
Balance at April 1, 2011 5,915 1,028 85,317 1,815 22,612 1,048,645
Total changes of items during the period - 2 388,998 13
Balance at March 31, 2012 204,676 268,528 259,937 13,876
2 5
18
-
169
113
376,076
Changes of items during the period
13,204
-
Balance at April 1, 2011 204,676 268,530 648,935 13,863
- 11 -

Year Ended March 31, 2013 Millions of Yen
Owners' Equity
Common
stock
Capital
surplus
Retained
earnings
Less cost of
treasury stock
( )
Issuance of new shares
Dividends from surplus ( )
Net income (loss) ( )
Change of scope of consolidation
Change of scope of equity method
Purchase of treasury stock ( )
Disposal of treasury stock ( )
Net changes of items other than
owners' equity
( )
( ) ( )
Accumulated Other Comprehensive Income
Net unrealized
holding
gains (losses)
on securities
Deferred
gains (losses)
on hedges
Foreign currency
translation
adjustments
Pension liability
adjustment of
foreign
subsidiaries
( ) ( ) ( )
Issuance of new shares
Dividends from surplus ( )
Net income (loss) ( )
Change of scope of consolidation
Change of scope of equity method
Purchase of treasury stock ( )
Disposal of treasury stock
Net changes of items other than
owners' equity( ) ( )
( ) ( ) ( )
( ) ( ) ( )
15,322
Balance at April 1, 2012 204,676 268,528 259,937 13,876
Changes of items during the period
5,502
7,661
545,347
0
0
10
7,661
10 14
Total changes of items during the period 7,661 7,651 550,849 4
Balance at March 31, 2013 212,337 276,179 290,912 13,872
Minority
Interests
Total
Net Assets
Balance at April 1, 2012 5,610 5,749 90,305 2,927 19,226 645,120
Changes of items during the period
5,502
545,347
0
0
10
25,250
4
5,724 28,838 704 9,060
452 5,724 28,838 704 9,060
510,283
Balance at March 31, 2013 6,062 25 61,467 3,631 10,166 134,837
Total changes of items during the period 452
- 12 -
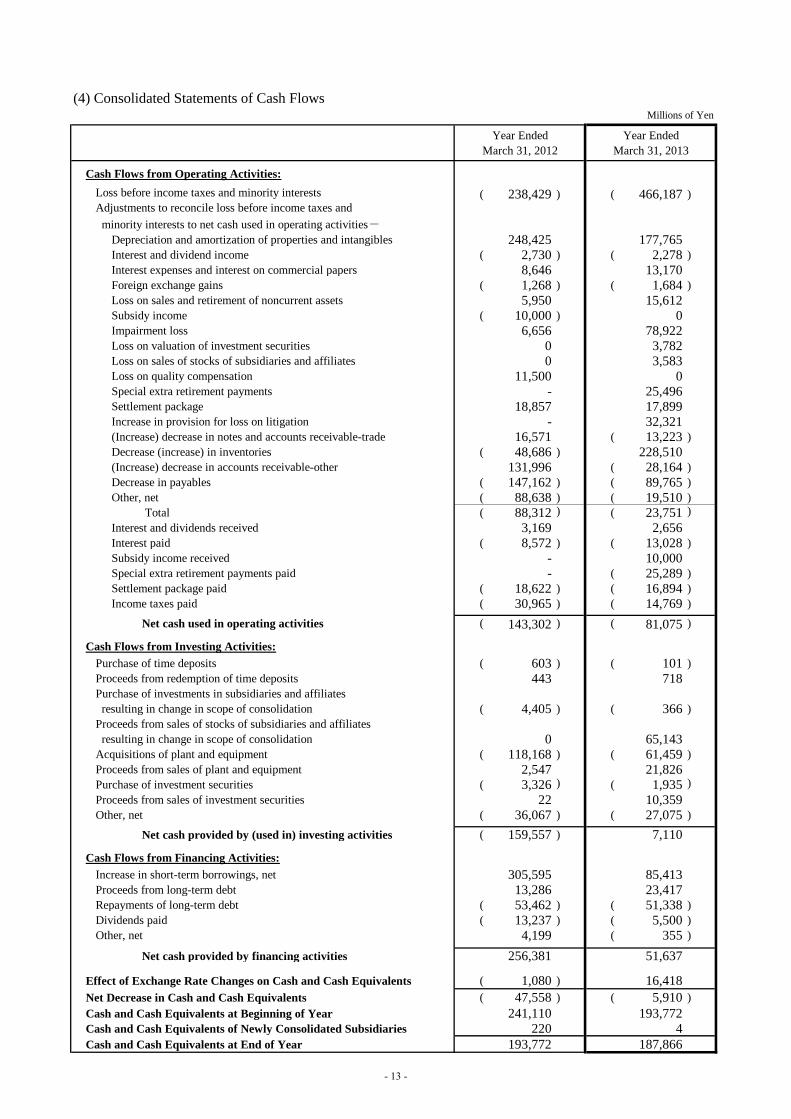
(4) Consolidated Statements of Cash FlowsMillions of Yen
Year Ended
March 31, 2012
Year Ended
March 31, 2013
Cash Flows from Operating Activities:
Loss before income taxes and minority interests ( 238,429 ) ( 466,187 )
minority interests to net cash used in operating activities-
Depreciation and amortization of properties and intangibles 248,425 177,765 Interest and dividend income ( 2,730 ) ( 2,278 )
Interest expenses and interest on commercial papers 8,646 13,170 Foreign exchange gains ( 1,268 ) ( 1,684 )
Loss on sales and retirement of noncurrent assets 5,950 15,612 Subsidy income ( 10,000 ) 0 Impairment loss 6,656 78,922 Loss on valuation of investment securities 0 3,782 Loss on sales of stocks of subsidiaries and affiliates 0 3,583 Loss on quality compensation 11,500 0 Special extra retirement payments - 25,496 Settlement package 18,857 17,899 Increase in provision for loss on litigation - 32,321 (Increase) decrease in notes and accounts receivable-trade 16,571 ( 13,223 )
Decrease (increase) in inventories ( 48,686 ) 228,510 (Increase) decrease in accounts receivable-other 131,996 ( 28,164 )
Decrease in payables ( 147,162 ) ( 89,765 )
Other, net ( 88,638 ) ( 19,510 )
Total ( 88,312 ) ( 23,751 )
Interest and dividends received 3,169 2,656 Interest paid ( 8,572 ) ( 13,028 )
Subsidy income received - 10,000 Special extra retirement payments paid - ( 25,289 )
Settlement package paid ( 18,622 ) ( 16,894 )
Income taxes paid ( 30,965 ) ( 14,769 )
Net cash used in operating activities ( 143,302 ) ( 81,075 )
Cash Flows from Investing Activities:
Purchase of time deposits ( 603 ) ( 101 )
Proceeds from redemption of time deposits 443 718Purchase of investments in subsidiaries and affiliates
resulting in change in scope of consolidation ( 4,405 ) ( 366 )
Proceeds from sales of stocks of subsidiaries and affiliates
resulting in change in scope of consolidation 0 65,143Acquisitions of plant and equipment ( 118,168 ) ( 61,459 )
Proceeds from sales of plant and equipment 2,547 21,826Purchase of investment securities ( 3,326 ) ( 1,935 )
Proceeds from sales of investment securities 22 10,359Other, net ( 36,067 ) ( 27,075 )
Net cash provided by (used in) investing activities ( 159,557 ) 7,110
Cash Flows from Financing Activities:
Increase in short-term borrowings, net 305,595 85,413Proceeds from long-term debt 13,286 23,417Repayments of long-term debt ( 53,462 ) ( 51,338 )
Dividends paid ( 13,237 ) ( 5,500 )
Other, net 4,199 ( 355 )
Net cash provided by financing activities 256,381 51,637
Effect of Exchange Rate Changes on Cash and Cash Equivalents ( 1,080 ) 16,418
Net Decrease in Cash and Cash Equivalents ( 47,558 ) ( 5,910 )
Cash and Cash Equivalents at Beginning of Year 241,110 193,772Cash and Cash Equivalents of Newly Consolidated Subsidiaries 220 4
Cash and Cash Equivalents at End of Year 193,772 187,866
Adjustments to reconcile loss before income taxes and
- 13 -

(5) Going Concern Assumption
None
(6) Important Matters on Presenting Consolidated Financial Statements
Matters Related to Accounting Procedure Standards
1) Valuation Standards and Methods for Securities
Other Securities
-Securities with available fair market values:
Primarily, stated at fair market value based on average of market price during the last month of the
fiscal year (valuation differences are disposed using the direct net asset adjustment method and the
cost of securities sold is calculated using the average cost method).
-Securities with no available fair market value:
Primarily, stated at average cost.
2) Valuation Standards and Methods for Inventories
Inventories held by Sharp (“the Company”) and its domestic consolidated subsidiaries are primarily stated
at moving average cost (for the book value of inventories on the balance sheets, by writing inventories
down based on their decrease in profitability of assets).
For overseas consolidated subsidiaries, inventories are stated at the lower of moving average cost or
market.
3) Method of Depreciation for Property, Plant and Equipment (Except for Lease Assets)
For the Company and its domestic consolidated subsidiaries, depreciation is based on the declining-balance
method, except for machinery and equipment at LCD plants in Mie and Kameyama, and buildings
(excluding attached structure) acquired on and after April 1, 1998, which are depreciated on the
straight-line method.
Overseas consolidated subsidiaries use the straight-line method.
4) Method of Amortization for Intangible Assets (Except for Lease Assets)
Amortization is based on the straight-line method.
Software used by the Company is amortized by the straight-line method over an estimated useful life of
principally five years, however, software embedded in products is amortized over the forecasted sales
quantity.
5) Method of Depreciation for Lease Assets
Finance leases that do not transfer ownership
Depreciation is based on the straight-line method that takes the lease period as the depreciable life and
the residual value as zero.
Regarding finance leases of the Company and its domestic consolidated subsidiaries that do not transfer
ownership, for which the starting date for the lease transaction is prior to March 31, 2008, lease
payments are recognized as expenses.
6) Method of Amortization for Deferred Assets
Bond issue cost is amortized under the straight-line method over the redemption period.
7) Method of Appropriation for Allowance for Doubtful Receivables
The estimated amounts of allowance for general receivables are primarily determined based on the past
loss experience. For particular receivables, including those from debtors at risk of bankruptcy, the
allowance is provided for individually estimated unrecoverable amounts. This procedure is made against
possible credit loss.
8) Method of Appropriation for Accrued Bonuses
The reserve for payment of employees’ bonuses is set aside based on estimated amounts to be paid in the
subsequent period. This procedure is made against possible payment of employee’s bonuses.
9) Method of Appropriation for Warranty Reserve
Estimated amounts of warranty are accrued based on the past experience. This procedure is made against
expense for after-sales service within the warranty period.
- 14 -

10) Method of Appropriation for Provision for Loss on Litigation
Out of possible future loss on litigation, the amount to be considered necessary is estimated.
11) Method of Appropriation for Severance and Pension Benefits
To provide for employees’ severance and pension benefits, reserves are set aside based on the estimated
amounts of projected benefit obligation and the fair value of plan assets at the end of the current
consolidated fiscal year.
Prior service costs are amortized over the average of the estimated remaining service lives (16 years).
Actuarial losses are recognized primarily in expenses over the average of estimated remaining services
lives (16 years) commencing with the following consolidated fiscal year.
12) Method and Period of Amortization for Goodwill
Goodwill for which the effective term is possible to be estimated is amortized evenly over the estimated
terms, while the other is amortized evenly over five years. However, if the amount is minor, the entire
amount is amortized during the period of occurrence.
13) Scope of Cash and Cash Equivalents in Consolidated Statements of Cash Flows
Cash and cash equivalents in Consolidated Statements of Cash Flows include cash on hand, deposits on
demand placed with banks and highly liquid investments with insignificant risk of changes in value which
have maturities of three months or less when purchased.
14) Accounting for Consumption Taxes, etc.
The tax exclusion method is applied.
15) Adoption of Consolidated Tax Return System
The consolidated tax return system is adopted.
(7) Changes in accounting policies and accounting estimates, and restatement
(Changes in accounting policies that are difficult to distinguish from changes in accounting estimates)
In accordance with the amendment of the Corporation Tax Law, effective from the year ended March 31,
2013, the Company and its domestic consolidated subsidiaries have changed the depreciation method for
those plant and equipment acquired on or after April 1, 2012.
This change had an immaterial impact on financial statements.
- 15 -
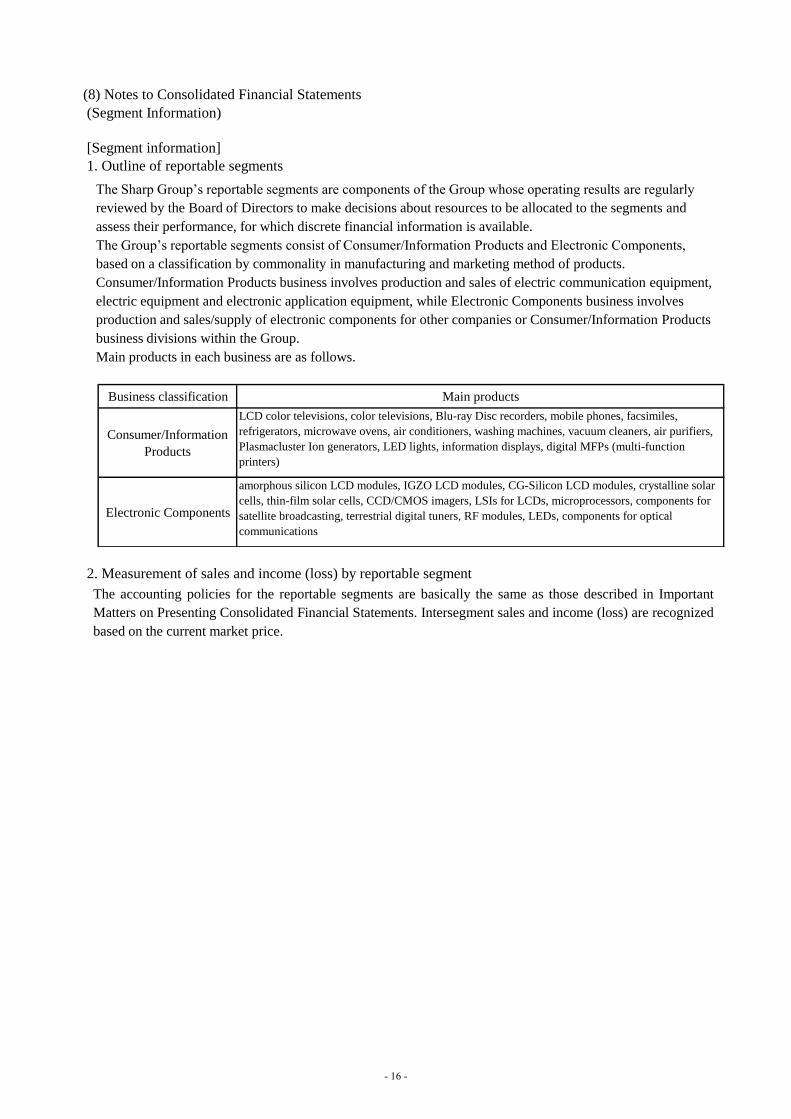
(Segment Information)
[Segment information]
1. Outline of reportable segments
2. Measurement of sales and income (loss) by reportable segment
(8) Notes to Consolidated Financial Statements
The Sharp Group’s reportable segments are components of the Group whose operating results are regularly
reviewed by the Board of Directors to make decisions about resources to be allocated to the segments and
assess their performance, for which discrete financial information is available.
The Group’s reportable segments consist of Consumer/Information Products and Electronic Components,
based on a classification by commonality in manufacturing and marketing method of products.
Consumer/Information Products business involves production and sales of electric communication equipment,
electric equipment and electronic application equipment, while Electronic Components business involves
production and sales/supply of electronic components for other companies or Consumer/Information Products
business divisions within the Group.
Main products in each business are as follows.
The accounting policies for the reportable segments are basically the same as those described in Important
Matters on Presenting Consolidated Financial Statements. Intersegment sales and income (loss) are recognized
based on the current market price.
Business classification Main products
Consumer/Information
Products
LCD color televisions, color televisions, Blu-ray Disc recorders, mobile phones, facsimiles,
refrigerators, microwave ovens, air conditioners, washing machines, vacuum cleaners, air purifiers,
Plasmacluster Ion generators, LED lights, information displays, digital MFPs (multi-function
printers)
Electronic Components
amorphous silicon LCD modules, IGZO LCD modules, CG-Silicon LCD modules, crystalline solar
cells, thin-film solar cells, CCD/CMOS imagers, LSIs for LCDs, microprocessors, components for
satellite broadcasting, terrestrial digital tuners, RF modules, LEDs, components for optical
communications
- 16 -
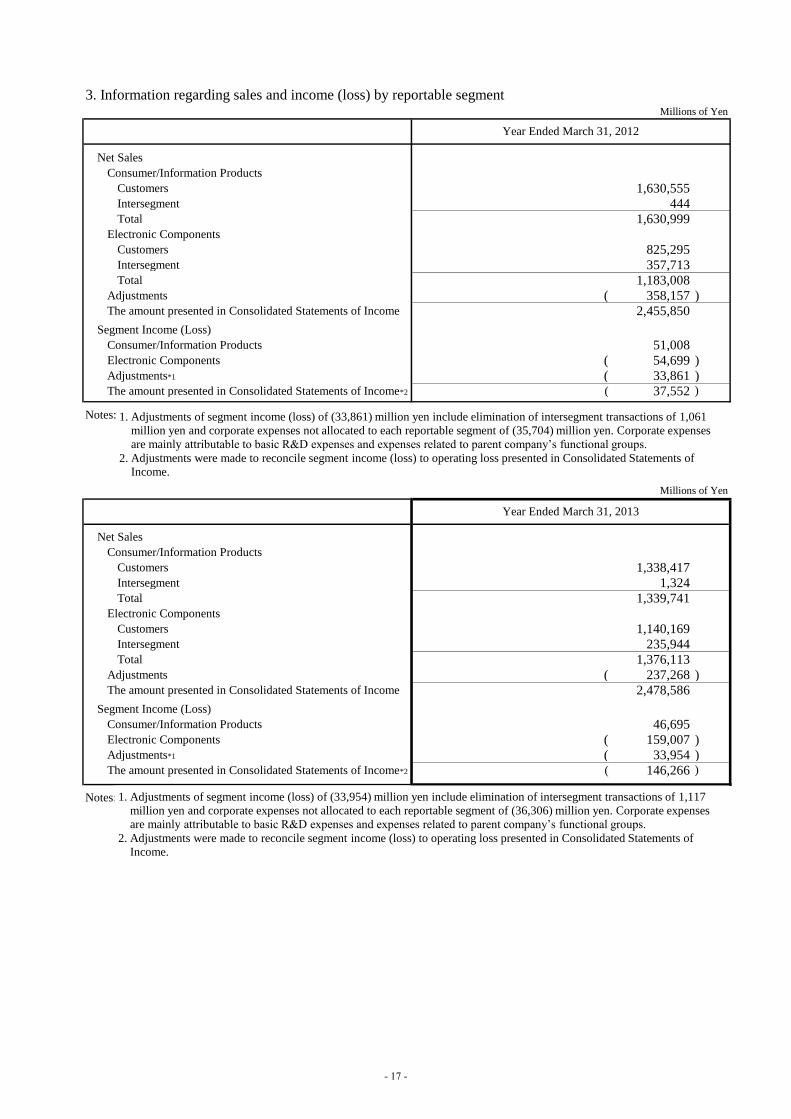
3. Information regarding sales and income (loss) by reportable segmentMillions of Yen
Net Sales
Consumer/Information Products
Customers 1,630,555Intersegment 444Total 1,630,999
Electronic Components
Customers 825,295Intersegment 357,713Total 1,183,008
Adjustments ( 358,157 )The amount presented in Consolidated Statements of Income 2,455,850
Segment Income (Loss)
Consumer/Information Products 51,008Electronic Components ( 54,699 )Adjustments*1 ( 33,861 )The amount presented in Consolidated Statements of Income*2 ( 37,552 )
Notes:
Millions of Yen
Net Sales
Consumer/Information Products
Customers 1,338,417Intersegment 1,324Total 1,339,741
Electronic Components
Customers 1,140,169Intersegment 235,944Total 1,376,113
Adjustments ( 237,268 )The amount presented in Consolidated Statements of Income 2,478,586
Segment Income (Loss)
Consumer/Information Products 46,695Electronic Components ( 159,007 )Adjustments*1 ( 33,954 )The amount presented in Consolidated Statements of Income*2 ( 146,266 )Total Assets
Notes:
Year Ended March 31, 2012
Year Ended March 31, 2013
1. Adjustments of segment income (loss) of (33,954) million yen include elimination of intersegment transactions of 1,117
million yen and corporate expenses not allocated to each reportable segment of (36,306) million yen. Corporate expenses
are mainly attributable to basic R&D expenses and expenses related to parent company’s functional groups.
2. Adjustments were made to reconcile segment income (loss) to operating loss presented in Consolidated Statements of
Income.
1. Adjustments of segment income (loss) of (33,861) million yen include elimination of intersegment transactions of 1,061
million yen and corporate expenses not allocated to each reportable segment of (35,704) million yen. Corporate expenses
are mainly attributable to basic R&D expenses and expenses related to parent company’s functional groups.
2. Adjustments were made to reconcile segment income (loss) to operating loss presented in Consolidated Statements of
Income.
- 17 -

[Related information]
Year ended March 31, 2012
1. Information by product/service Millions of Yen
LCDs LCD Color TVs Others
Sales to Outside Customers
2. Information by region/country
1) Sales Millions of Yen
Note: Sales are classified according to regions or countries where customers are located.
2) Plant and equipment, less accumulated depreciation Millions of Yen
Japan Overseas Total
Year ended March 31, 2013
1. Information by product/service Millions of Yen
LCDs LCD Color TVs Others
Sales to Outside Customers
2. Information by region/country
1) Sales Millions of Yen
Note: Sales are classified according to regions or countries where customers are located.
2) Plant and equipment, less accumulated depreciation Millions of Yen
Japan Overseas Total
[Information regarding impairment loss on noncurrent assets by reportable segment]
Year ended March 31, 2012 Millions of Yen
Consumer/Information
ProductsElectronic Components Elimination Total
Impairment Loss
Year ended March 31, 2013 Millions of Yen
Consumer/Information
ProductsElectronic Components Elimination Total
Impairment Loss
Note: The amount of "Elimination" is on buildings and others which do not belong to reportable segment.
78,922
872,44292,046
13,374 65,039 509
542
2,478,586
102,160
6,114
461,539
1,181,168 483,298
2,455,850
388,436 1,439,303650,847
420,226
Total
Japan
- 6,656
563,699
780,396
2,478,586
1,007,264 667,933 263,777 539,612
Total
Japan China U.S.A. Others
240,668 550,716
China U.S.A. Others Total
Total
581,357 1,454,267
2,455,850
- 18 -

(Business Combination)
Business Divestiture
Sharp Corporation “The Company” entered into an agreement to execute capital and business alliance with four
companies of the Hon Hai Group on March 27, 2012.
In association with the above capital and business alliance, the Company has transferred a part of shares of its owned
subsidiary, Sharp Display Products Corporation (“SDP”), to SIO International Holdings Limited, an investment
company of Mr. Terry Tai-Ming Gou, the representative of Hon Hai Precision Industry Co., Ltd (“Hon Hai”).
Furthermore, the Company, Toppan Printing Co., Ltd. (“Toppan”) and Dai Nippon Printing Co., Ltd. (“DNP”) executed
a basic agreement on April 10, 2012, with regard to the business integration of the LCD color filter businesses operated
by Toppan, DNP and DNP’s wholly owned subsidiary, DNP Color Techno Sakai Co., Ltd. (“DNP Color Techno Sakai”)
at the Sakai Plant, into SDP, and conducted deliberations on concrete issues.
The Company resolved at its board of directors meeting held on May 24, 2012 to execute business integration
agreements with Toppan and DNP respectively and transfer the LCD color filter businesses at the Sakai Plant operated
by Toppan, DNP and DNP Color Techno Sakai, to SDP in the manner of a simplified absorption-type company split. In
August 11, the simplified absorption-type company split came into effect.
1. Outline of business divestitures
(1) Name of parties who succeed the divested business
SIO International Holdings Limited, Toppan Printing Co., Ltd., Dai Nippon Printing Co., Ltd and DNP Color
Techno Sakai Co., Ltd.
(2) Nature of divested business
Development, production and sales of LCD panels
(3) Aim of business divestiture
With the efforts such as 1) promotion of the enhancement of cost competitiveness and profit performance through
maintaining a high facility operation rate of SDP by making practical use of Hon Hai’s purchasing power and 2)
integration of the LCD color filter businesses, the Company is seeking to promote further efficiency of the large-size
LCD business including the businesses of color filters, the primary component of LCD panels, as well as to achieve
improvement of the competitiveness of such businesses.
(4) Date of business divestiture
[1] Transfer of shares July 12, 2012
[2] Simplified absorption-type company split August 11, 2012
(5) Other items with regard to outline of transactions which include description of legal form
[1] Transfer of shares
The Company will receive only assets such as cash as consideration for the transfer of shares.
[2] Absorption-type company split
The method to be employed is a simplified absorption-type company split which designates Toppan,
DNP and DNP Color Techno Sakai as split companies and SDP as their succeeding company.
- 19 -

2. Outline of accounting method
(1) Transfer profit and loss
-Loss on sales of stocks of subsidiaries and affiliates 3,346 million yen
-Loss on change in equity 705 million yen
(2) Appropriate book value of the assets and liabilities transferred and its main items
-Current assets 43,461 million yen
-Noncurrent assets 177,915 million yen
-Deferred assets 590 million yen
-Total assets 221,966 million yen
-Current liabilities 77,297 million yen
-Long-term liabilities 5,941 million yen
-Total liabilities 83,238 million yen
(3) Accounting method
The difference between the amount received as a value of transferred business and the amount of owner’s equity
regarding the transferred business is recognized as transfer profit or loss. This accounting method is assuming that
the investment regarding transferred business of development, production and sales of LCD panels, is liquidated.
3. The name of reportable segment in which transferred business was included
Electronic Components segment
4. Estimated amount of profit and loss regarding divested business, which was recorded in consolidated financial results for
the year ended March 31, 2013
-Net sales ― million yen
-Operating income 107 million yen
5. Outline of ongoing commitment
-Purchase of LCD displays from SDP and temporary transfer of employees to SDP
As of July 17, 2012, Sharp Display Products Corporation has changed its corporate name to Sakai Display Products
Corporation.
- 20 -

(Per Share Information)
Yen
Net assets per share 568.83 106.90
Net loss per share ( 341.78 ) ( 489.83 )
Fully diluted net income (loss) per share - -
Note: Net loss per share was calculated on the following basis.
Net income loss per share
Net loss (millions of yen) ( 376,076 ) ( 545,347 )
- -
( 376,076 ) ( 545,347 )
1,100,335 1,113,337
- -
Net loss allocated to ordinary shares
(millions of yen)
Average number of ordinary shares outstanding
during each year (thousands of shares)
Residual securities which do not dilute
net income per share
Year Ended March 31, 2012 Year Ended March 31, 2013
Fully diluted net income per share is not
presented, because although residual
securities exist, the Sharp Group posted net
loss.
Same as on the left.
Year Ended March 31, 2012 Year Ended March 31, 2013
Amounts not allocated to ordinary shares
(millions of yen)
- 21 -
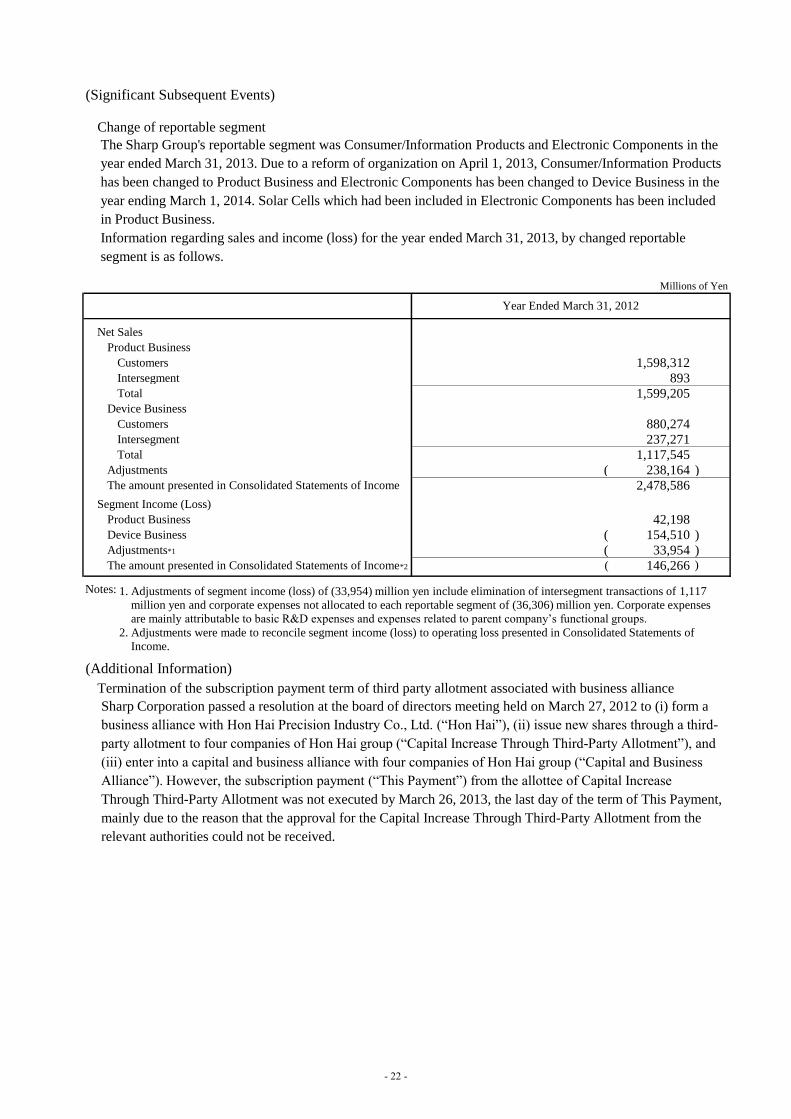
(Significant Subsequent Events)
Change of reportable segment
Millions of Yen
Net Sales
Product Business
Customers 1,598,312Intersegment 893Total 1,599,205
Device Business
Customers 880,274Intersegment 237,271Total 1,117,545
Adjustments ( 238,164 )The amount presented in Consolidated Statements of Income 2,478,586
Segment Income (Loss)
Product Business 42,198Device Business ( 154,510 )Adjustments*1 ( 33,954 )The amount presented in Consolidated Statements of Income*2 ( 146,266 )
Notes:
(Additional Information)
Termination of the subscription payment term of third party allotment associated with business alliance
Year Ended March 31, 2012
1. Adjustments of segment income (loss) of (33,954) million yen include elimination of intersegment transactions of 1,117
million yen and corporate expenses not allocated to each reportable segment of (36,306) million yen. Corporate expenses
are mainly attributable to basic R&D expenses and expenses related to parent company’s functional groups.
2. Adjustments were made to reconcile segment income (loss) to operating loss presented in Consolidated Statements of
Income.
The Sharp Group's reportable segment was Consumer/Information Products and Electronic Components in the
year ended March 31, 2013. Due to a reform of organization on April 1, 2013, Consumer/Information Products
has been changed to Product Business and Electronic Components has been changed to Device Business in the
year ending March 1, 2014. Solar Cells which had been included in Electronic Components has been included
in Product Business.
Information regarding sales and income (loss) for the year ended March 31, 2013, by changed reportable
segment is as follows.
Sharp Corporation passed a resolution at the board of directors meeting held on March 27, 2012 to (i) form a
business alliance with Hon Hai Precision Industry Co., Ltd. (“Hon Hai”), (ii) issue new shares through a third-
party allotment to four companies of Hon Hai group (“Capital Increase Through Third-Party Allotment”), and
(iii) enter into a capital and business alliance with four companies of Hon Hai group (“Capital and Business
Alliance”). However, the subscription payment (“This Payment”) from the allottee of Capital Increase
Through Third-Party Allotment was not executed by March 26, 2013, the last day of the term of This Payment,
mainly due to the reason that the approval for the Capital Increase Through Third-Party Allotment from the
relevant authorities could not be received.
- 22 -

Millions of Yen
Year Ended
March 31, 2012
Year Ended
March 31, 2013 Percent
Amount Ratio Amount RatioChange
% % %
Audio - Visual and
Communication
Equipment
1,060,770 43.2 732,017 29.5 - 328,753 -31.0
Health and
Environmental
Equipment
292,224 11.9 309,613 12.5 + 17,389 +6.0
Information Equipment 277,561 11.3 296,787 12.0 + 19,226 +6.9
1,630,555 66.4 1,338,417 54.0 - 292,138 -17.9
LCDs 420,226 17.1 650,847 26.3 + 230,621 +54.9
Solar Cells 223,869 9.1 259,895 10.5 + 36,026 +16.1
Other Electronic Devices 181,200 7.4 229,427 9.2 + 48,227 +26.6
825,295 33.6 1,140,169 46.0 + 314,874 +38.2
2,455,850 100.0 2,478,586 100.0 + 22,736 +0.9
1,181,168 48.1 1,007,264 40.6 - 173,904 -14.7
1,274,682 51.9 1,471,322 59.4 + 196,640 +15.4
Note: The above figures indicate sales to outside customers.
4. Supplementary Data
(1) Consolidated Sales by Product Group
Domestic
Overseas
Decrease
Increase
Total
Consumer/Information
Products
Electronic Components
- 23 -

(2) Information by Product Group
〈Net Sales〉 Millions of Yen
Year ended Year ended
March 31, 2012 March 31, 2013
Amount Ratio Amount Ratio
% % %
Audio - Visual and
Communication Equipment
Health and Environmental
Equipment
Information Equipment
Consumer/Information
Products
LCDs
Solar Cells
Other Electronic Devices
Electronic Components
Sub Total
Adjustments ( ) ( )
Total
〈Operating Income〉 Millions of Yen
Year ended Year ended
March 31, 2012 March 31, 2013
Amount Ratio Amount Ratio
% % %
Audio - Visual and
Communication Equipment( ) ( )
Health and Environmental
Equipment
Information Equipment
Consumer/Information
Products
LCDs ( ) ( )
Solar Cells ( ) ( )
Other Electronic Devices ( )
Electronic Components ( ) ( )
Sub Total ( ) ( )
Adjustments ( ) ( )
Total ( ) ( )
(3) Changes in Board of Directors
Please refer another release.
33,861 - 33,954 - -
37,552 - 146,266 - -
54,699 - 159,007 - -
3,691 - 112,312 - -
21,982 - 4,497 - -
9,519 - 15,519 - -
51,008 - 46,695 - -8.5
42,236 - 138,991 - -
29,460 - 32,210 - +9.3
27,742 - 24,343 - -12.3
Percent
Change
6,194 - 9,858 - -
358,157 -14.6 237,268 -9.6 -
2,455,850 100.0 2,478,586 100.0 +0.9
1,183,008 48.2 1,376,113 55.5 +16.3
2,814,007 114.6 2,715,854 109.6 -3.5
223,916 9.1 259,916 10.5 +16.1
238,114 9.7 269,481 10.9 +13.2
1,630,999 66.4 1,339,741 54.1 -17.9
720,978 29.4 846,716 34.1 +17.4
292,303 11.9 309,673 12.5 +5.9
277,604 11.3 297,417 12.0 +7.1
Percent
Change
1,061,092 43.2 732,651 29.6 -31.0
The breakdown of the reportable segments, which consist of Consumer/Information Products and Electronic Components, is
presented for reference. Sales of each product group include internal sales between segments (Consumer/Information Products and
Electronic Components).
- 24 -