controlling metamaterials with radiation and controlling ...home.iitk.ac.in › ~sar › theses ›...
TRANSCRIPT
Controlling Metamaterials with Radiation and
Controlling Radiation with Metamaterials
A Thesis Submitted
in Partial Fulfilment of the Requirements
for the Degree of
Doctor of Philosophy
by
Sangeeta Chakrabarti
to the
DEPARTMENT OF PHYSICS
INDIAN INSTITUTE OF TECHNOLOGY KANPUR
May, 2010

SYNOPSIS
Name of the student: Sangeeta Chakrabarti Roll Number: Y5209067
Degree for which submitted: Doctor of Philosophy
Thesis Title: Controlling metamaterials with radiation and controlling
radiation with metamaterials
Department: Physics
Thesis Supervisors: Dr. S. Anantha Ramakrishna,
Dr. H. Wanare
Month and Year of Thesis Submission: May 2010
Metamaterials are a class of artificial structured composite media typically structured
at length scales much smaller than the wavelength of the incident radiation. Unlike nat-
urally occurring substances that depend on atomic and molecular resonances for their
properties, the electromagnetic response of metamaterials is governed by the geometric
resonances of the underlying structure. They effectively behave like homogeneous media
when the incident wavelength is much larger compared to the size of the inclusions and
can be described by effective medium parameters like an effective permittivity and an
effective permeability at almost any frequency. Metamaterials can be designed to have
a resonant electric, magnetic or even a chiral and bianisotropic response. The large dis-
persion of the material parameters near the resonance frequencies enables metamaterials
to have properties not usually found in nature. They have paved the way for developing
media with a negative index of refraction, super-lenses and electromagnetic cloaks, etc.
Their resonant response, however, limits their applicability due to the intrinsically high
ii

iii
levels of dissipation associated with them. In addition, the question of the applicability
of effective medium theories to metamaterials, particularly those at optical frequencies,
is very important because the strength of the resonances are found to become weaker
in metallic structures at high frequencies. Thus, metamaterials need to be designed
appropriately in order to be homogenizable. Metamaterials for future applications will
be required to have controllable responses with low levels of losses.
In this thesis, the properties of metamaterials, particularly their behaviour at opti-
cal frequencies, has been studied and a new paradigm for controlling their response has
been presented. It is a well-known fact that metamaterials can be designed to operate at
a predetermined frequency. While the low frequency behaviour of metamaterials (when
they can be treated as effectively homogeneous media) is comparatively easier to explain
theoretically and demonstrate practically, their high frequency response is much more
complicated. This is due to the departure of the constituent metal from the Ohmic
conductor-like behaviour and the deviations of metamaterials from effective medium
theories. The work presented here proposes to increase the versatility of metamateri-
als by making their properties amenable to control by applied fields as well as reduce
the optical losses. The thesis can broadly be divided into two parts. The first part
deals with metamaterial behaviour at optical frequencies and schemes using coherent
optical processes like coherent absorption, Electromagnetically Induced Transparency
or Raman processes of imbedded atomic/ molecular materials for controlling the meta-
material response. Control schemes have been proposed for the magnetic response of
two classes of metamaterials, viz., the conventional Split Ring Resonator (SRR)-based
metamaterials at infra-red frequencies as well as those consisting of plasmonic loop in-
clusions at optical frequencies. The case of a plasma-like wire mesh metamaterial and
the possibility of dynamically opening pass-bands below the plasma frequency has also
been investigated. The second part deals with the transformation of the fields in the
electromagnetic response of superstructures of negative and positive index media built
up from both electric and magnetic metamaterials. Here, the novel electromagnetic
response of checkerboards of positive and negative index media has been analysed from

iv
the point of view of the complementary medium theorem, revealing how it is possible
to tailor the transmission of radiation (ideally at any frequency, and for any angle of
incidence) across these structures. The large local field enhancements in the system are
notable.
The first chapter is introductory, where the ideas of negative refractive index and
metamaterials with independent electric and magnetic responses have been explained.
A discussion on effective medium theories and the procedures for homogenizing meta-
material structures to define effective medium parameters is included. In addition,
phenomena such as the bianisotropic response of SRRs and the dispersion of surface
plasmons, have been critically discussed. The concepts behind various atomic/molecular
phenomena such as coherent control, electromagnetically induced transparency and Ra-
man processes, which have been used later in this thesis as a means of manipulating the
response of metamaterials, have also been explained in detail.
In the second chapter, a discussion of the behaviour of metallic metamaterials
which may possess negative material parameters with the aim of optimizing their per-
formance at high (optical and NIR) frequencies has been presented. This includes a
theoretical study of the behaviour of Split Ring Resonator (SRR) based metamaterials
and the gradual weakening and eventual breakdown of effective medium theories used
to describe these media with increase in frequency. It has been shown that even when
the metamaterial is treated as a reasonably effective medium and described by effective
medium parameters, the homogenization theories show distinct signs of breaking down.
The electric field of the incident radiation begins to interact with the individual struc-
tures, affecting the retrieved effective material (dielectric and magnetic) parameters of
the SRRs. Next, it is shown that a medium consisting of arrays of split ring resonators
in vacuum can have negative phase velocity (suggesting a negative index of refraction)
for specific polarizations of the incident field at optical frequencies. The size of the SRR
is comparable to the wavelength of the incident radiation and thus, the length scales of
this system are such that effective medium theories can no longer be applied. The elec-
tric fields interact strongly with the symmetric SRRs at these frequencies. The negative
v
phase velocity is found to arise from plasmonic excitations of the SRR and it can no
longer be explained by invoking the negative permittivity and the negative permeability
of the metamaterial. The focussing of light by arrays of SRR (both ordered and disor-
dered), in the manner of the Veselago lens, has also been demonstrated. These results
show that the focussing properties and the negative phase velocity arise primarily from
excitations of localized resonances and cannot be attributed to purely band structure
effects like the all-angle negative refraction. These results have been published in S.
Chakrabarti and S.A. Ramakrishna, JNOPM, 14, 143 (2007) and S. Chakrabarti et. al.
arXiv:physics/0703003.
In the third chapter, a scheme for parametrically controlling the magnetic response
of homogenizable SRR-based metamaterials has been proposed and studied in detail.
The control scheme consists of using coherent optical fields for driving the resonant
permittivity of an embedding dielectric medium. This results in being able to tune
the capacitance of the SRR dynamically using an external control field. The response
of composite (SRR + resonant dielectric) medium has been studied both analytically
as well as numerically. The effect of embedding the metamaterial in the frequency-
dispersive background (either Lorentz-type or EIT-like) is manifested in the splitting
of the negative permeability band and a modified (frequency-dependent) filling fraction
and dissipation factor. The modified material parameters are strongly dependent upon
the resonant frequencies and the line width of the embedding medium, while for an em-
bedding medium exhibiting Electromagnetically Induced Transparency (EIT), they also
depend on the strength of the coupling field via the Rabi frequency and its detuning.
The changes in the magnetic response are found to occur over narrow frequency inter-
vals, which makes them suitable for narrow band applications. However, it is found that
the narrow band effects survive the broadening effects of disorder and structural imper-
fections due to an increase in the filling fraction at resonance. The results are also found
to be stable against the large levels of dissipation associated with mesoscopic metallic
structures. These results are published in S. Chakrabarti et. al., Optics Express, 16,
19504 (2008) and S. Chakrabarti et. al., arXiv:1003.2932.

vi
The fourth chapter deals with the behaviour and the control of the response of
plasmonic metamaterials at optical frequencies. These media have the added advantage
of a greater ease of fabrication by self-organization methods compared to SRR-based
metamaterials. The behaviour of a plasmonic metamaterial composed of silver nanorods
arranged on circular loops has been studied in detail, for both the cases when the
magnetic field or when the electric field of the incident radiation is oriented along the axis
of the nanorods. In the former case, the loop shows a magnetic resonance arising from
the collective plasmonic response of the nanorods. Control over the magnetic response
is demonstrated numerically by embedding the loops in a Raman-active medium (CS2)
and using the Inverse Raman Effect. There is a splitting of the magnetic resonance,
resulting in the formation of propagating bands within the band gap region of the
‘bare’ metamaterial. Due to the highly dissipative nature of the effective medium, the
new band formed results in a sharp decrease in reflectivity. In the latter case, when the
electric field of the incident radiation is aligned along the nanorod axes, the metamaterial
is seen to behave like an effective dilute plasma, whose plasma frequency is determined
solely by the filling fraction of the metal. We theoretically demonstrate the control of
this plasma-like effective response of the metamaterial by making it transmittive in the
forbidden frequency region below its plasma frequency by embedding it in a coherent
atomic/molecular medium. This provides a large positive dielectric permittivity in the
vicinity of the resonance, and renders the effective permittivity positive over a narrow
range of frequencies. Processes such as EIT can provide additional control to switch and
tune the new transmission bands. This has been demonstrated using Raman processes
in sodium vapour infused into the array, and subsequently, the formation of switchable
transmission bands has been numerically demonstrated using EIT in the same medium.
This has been published in S. Chakrabarti et. al., Optics Letters, 34, 3728 (2009).
In the fifth chapter, a study of the electromagnetic response of 2-D checkerboards
of negative refractive index materials has been presented from the viewpoint of the
generalized perfect lens theorem or the complementary media theorem. The comple-
mentary medium theorem of Pendry and Ramakrishna states that any medium can be

vii
optically cancelled by an equal thickness of material constructed to be an inverted mir-
ror image of the medium, with ǫ and µ reversed in sign. Checkerboards can be arranged
in two complementary layers, in which case the transmittance predicted by this exact
result is unity. However, these systems are extremely singular and are very sensitive
to numerical errors. The ray picture often predicts a result opposite to the full wave
solutions of Maxwell’s equations and is useless to predict the properties of these sys-
tems with very large localized modes. Thus, calculations need to be carried out with
very fine levels of discretization in order to get rid of the spurious plasmonic resonances
arising due to inadequate discretization and such spurious resonances can obscure the
actual behaviour of the system. The focussing effects in 2-D checkerboards of dissipa-
tive but homogeneous negative refractive index have been discussed. The results show
that the subwavelength focussing is still retained to a large extent, even for high levels
of dissipation. These results have also been compared with those obtained for silver
checkerboards, where only one parameter (the permittivity) is negative. Imaging by
checkerboard structures with small finite extents has also been studied and presented
here. These results have been published in S. Chakrabarti et. al., Optics Express, 14,
12950 (2006), S. Guenneau et. al., PNFA, 5, 63 (2007) and S. Chakrabarti et. al. (to
be submitted).

ACKNOWLEDGEMENTS
At the very beginning, I would like express gratitude and appreciation for the people
who have been closely associated with me and particularly with the writing of this thesis.
First of all I would like to thank my thesis supervisors Dr. S. Anantha Ramakrishna
and Dr. Harshawardhan Wanare for their guidance and criticism. Working with them
has been a very enriching and enjoyable experience.
I am grateful to Dr. Amit Dutta and Dr. Sreerup Raychaudhuri for their advice
and help whenever I needed it.
I shall always cherish the memories of the days at I spent with my friends Joyoshi,
Purbasha, Srirupa, Tirtha, Samriddhi, Jayashis and Sandip, who made life at Presidency
College and during M.Sc. at IIT Kanpur enjoyable with their pranks and liveliness.
Arpana, Rajni, Richa, Dibyendu, Subhayan-da, Ashok-da, Victor, Lipsa and Uma are
some of the people who made ‘Ph.D. life’ memorable and fun with their company.
I thank my parents Dr. S.K. Chakrabarti and Mrs. Swagata Chakrabarti, and my
brother, Saurav, for their unwavering support to me all throughout my academic career.
I owe everything to their encouragement and guidance and words are inadequate to
express my indebtedness to them. My extended family also deserves a special mention
— our dogs, cats, birds and fishes — without whom life would have been drab and
monotonous.
Finally, I thank my fiance, Karthick for his support, help and criticism of my work.
viii

ix

PUBLICATIONS
1. Finite checkerboards of dissipative negative refractive index,
Sangeeta Chakrabarti, S. Anantha Ramakrishna and S. Guenneau
Optics Express, 14, 12950 (2006)
2. Cloaking and imaging effects in plasmonic checkerboards of negative ǫ
and and µ and dielectric photonic crystal checkerboards,
S. Guenneau, S. Anantha Ramakrishna, S. Enoch, Sangeeta Chakrabarti, G. Tayeb
and B. Gralak
Photonics and Nanostructures Fundamentals and Applications, 5, 63 (2007)
3. Negative refractive index of metamaterials at optical frequencies,
S. Anantha Ramakrishna and Sangeeta Chakrabarti
MRS 2006 Fall , Paper: 0964R0102
4. Metamaterials with negative refractive index at optical frequencies,
S. Anantha Ramakrishna, Sangeeta Chakrabarti and Olivier J.F. Martin
arxiv.org/abs/physics/0703003
5. Design of metallic metamaterial structures at high frequencies,
Sangeeta Chakrabarti and S. Anantha Ramakrishna
Journal of Nonlinear Optics and Photonic Materials, 17, 143 (2008)
6. Coherently Controlling Metamaterials,
Sangeeta Chakrabarti, S. Anantha Ramakrishna and Harshawardhan Wanare
Optics Express, 16, 19504 (2008)
7. Switching a Plasmalike Metamaterial via Embedded Resonant Atoms
Exhibiting Electromagnetically Induced Transparency,
Sangeeta Chakrabarti, S. Anantha Ramakrishna and Harshawardhan Wanare
Optics Letters, 34, 3728 (2009)
x
xi
8. Coherent control of metamaterials,
Sangeeta Chakrabarti, S. Anantha Ramakrishna and H. Wanare
Proc. SPIE, Vol. 7392, 73921S (2009)
9. Coherently Controlling Metamaterial Resonances with Light,
Sangeeta Chakrabarti, S. Anantha Ramakrishna and Harshawardhan Wanare
(submitted to Phys. Rev. A, 2010)
10. Visible Transmission of Light Through Gold Nano-checkerboards: The-
ory and Experiments,
Sangeeta Chakrabarti, N. Shukla, S. Anantha Ramakrishna, S. Dhamodharan,
V. N. Kulkarni, S. Guenneau, Fanny Guenneau and Stefan Enoch
(in preparation, 2010)
NOTATION
SRR - Split Ring Resonator
MG-theory - Maxwell Garnet theory
NRM - Negative Refractive Index Medium
EIT - Electromagnetically Induced Transparency
ωS - Stokes frequency
ωAS - Anti-Stokes frequency
NIR - Near Infrared
TMM - Transfer Matrix Method
PML - Perfectly Matched Layers
FEM - Finite Element Method
xii

Contents
1 Introduction 1
1.1 The Perfect Lens . . . . . . . . . . . . . . . . . . . . . . . . . . . . . . . 5
1.2 Homogenization of Metamaterials . . . . . . . . . . . . . . . . . . . . . . 6
1.2.1 Effective medium theories . . . . . . . . . . . . . . . . . . . . . . 7
1.2.2 Homogenization theories . . . . . . . . . . . . . . . . . . . . . . . 9
1.2.3 Limitations of the effective medium approach . . . . . . . . . . . 12
1.3 Negative Material Parameters . . . . . . . . . . . . . . . . . . . . . . . . 13
1.3.1 Negative Permittivity . . . . . . . . . . . . . . . . . . . . . . . . . 13
1.3.2 Negative Permeability . . . . . . . . . . . . . . . . . . . . . . . . 17
1.3.3 SRRs and scaling . . . . . . . . . . . . . . . . . . . . . . . . . . . 21
1.3.4 Scaling to high frequencies . . . . . . . . . . . . . . . . . . . . . . 21
1.4 Surface Plasmons . . . . . . . . . . . . . . . . . . . . . . . . . . . . . . . 27
1.4.1 The role of surface plasmons in the perfect lens . . . . . . . . . . 28
1.4.2 Plasmon resonances in small particles . . . . . . . . . . . . . . . . 29
1.5 Coherent optical effects in atomic and molecular media . . . . . . . . . . 30
1.5.1 Coherent control . . . . . . . . . . . . . . . . . . . . . . . . . . . 30
1.5.2 Electromagnetically Induced Transparency . . . . . . . . . . . . . 31
xiii

xiv Contents
1.5.3 Raman Scattering . . . . . . . . . . . . . . . . . . . . . . . . . . . 34
1.5.4 The Inverse Raman Effect . . . . . . . . . . . . . . . . . . . . . . 35
2 Behaviour of Split-Ring Resonator Metamaterials at High Frequencies 39
2.1 The SRR embedded in a dielectric background . . . . . . . . . . . . . . . 40
2.2 The SRR in vacuum . . . . . . . . . . . . . . . . . . . . . . . . . . . . . 46
2.2.1 Focussing and imaging with slabs of negative phase velocity meta-
materials . . . . . . . . . . . . . . . . . . . . . . . . . . . . . . . . 53
2.3 Evolution of the magnetic response . . . . . . . . . . . . . . . . . . . . . 57
2.4 Conclusion . . . . . . . . . . . . . . . . . . . . . . . . . . . . . . . . . . . 66
3 Coherently Controlled Metamaterials at Optical Frequencies 69
3.1 Analytical description . . . . . . . . . . . . . . . . . . . . . . . . . . . . 71
3.2 Numerical Simulation of the SRR metamaterial at mid-IR frequencies . . 77
3.3 Simulation of the optical SRR metamaterial . . . . . . . . . . . . . . . . 81
3.4 Robustness of the control scheme . . . . . . . . . . . . . . . . . . . . . . 88
3.5 Conclusion . . . . . . . . . . . . . . . . . . . . . . . . . . . . . . . . . . . 91
4 Coherently Controlling Plasmonic Metamaterials at Optical Frequen-
cies 93
4.1 The magnetic response of plasmonic metamaterials: theory . . . . . . . . 94
4.2 Numerical calculations of the response of a plasmonic nanorod metama-
terial . . . . . . . . . . . . . . . . . . . . . . . . . . . . . . . . . . . . . 98
4.3 Control scheme for the plasmonic metamaterial . . . . . . . . . . . . . . 103
4.3.1 Controlling the magnetic response . . . . . . . . . . . . . . . . . . 104
4.4 Dilute plasma-like behaviour . . . . . . . . . . . . . . . . . . . . . . . . . 106
Contents xv
4.5 Switching a dilute plasma-like metamaterial . . . . . . . . . . . . . . . . 111
4.6 Conclusion . . . . . . . . . . . . . . . . . . . . . . . . . . . . . . . . . . . 115
5 Checkerboards of Dissipative Negative Refractive Index Media 119
5.1 Complementary Media and the Generalized Lens Theorem . . . . . . . . 120
5.2 Limitations of real materials and imperfect NRMs . . . . . . . . . . . . . 123
5.2.1 Limitations of FDTD analysis for a perfect lens imaging system . 124
5.3 Checkerboard systems . . . . . . . . . . . . . . . . . . . . . . . . . . . . 125
5.3.1 Transfer matrix analysis of transmission properties of ideal and
complementary checkerboard layers . . . . . . . . . . . . . . . . . 126
5.4 Dissipative Checkerboards of Finite Extent . . . . . . . . . . . . . . . . . 130
5.4.1 The electromagnetic response of dissipative checkerboards . . . . 131
5.5 Off-resonance checkerboards . . . . . . . . . . . . . . . . . . . . . . . . . 133
5.6 Some Other Checkerboard Structures . . . . . . . . . . . . . . . . . . . . 135
5.6.1 FEM calculations . . . . . . . . . . . . . . . . . . . . . . . . . . . 137
5.7 Conclusion . . . . . . . . . . . . . . . . . . . . . . . . . . . . . . . . . . . 141
6 Future Directions 143

List of Figures
1.1 (a) Schematic representation of refraction occurring at the interface of a
medium whose n > 0 and one whose n < 0. The energy flow and the
wave vectors are oppositely directed in the n < 0 medium.
(b) Diagram illustrating the difference between positive and negative re-
fraction. In the case of negative refraction, the refracted ray lies on the
same side of the normal as the incident ray. . . . . . . . . . . . . . . . . 3
1.2 The action of the Perfect Lens proposed by Pendry. Characterized by unit
transmittivity, this lens focusses the propagating as well as the evanes-
cent modes from an object. The resulting image, which contains the
subwavelength features of the object, is ‘perfect’. The distance at which
the image is formed is z = d2 − d1. . . . . . . . . . . . . . . . . . . . . . 5
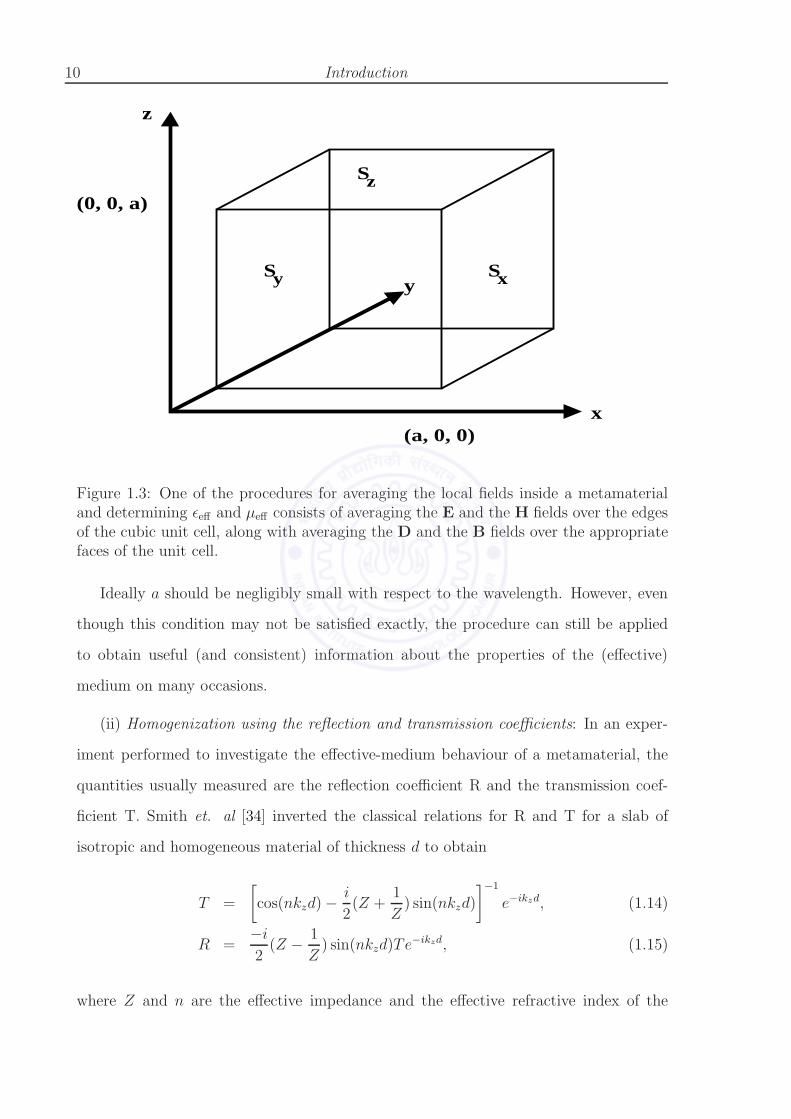
1.3 One of the procedures for averaging the local fields inside a metamaterial
and determining ǫeff and µeff consists of averaging the E and the H fields
over the edges of the cubic unit cell, along with averaging the D and the
B fields over the appropriate faces of the unit cell. . . . . . . . . . . . . . 10
1.4 Schematic representation of the wire-array metamaterial which behaves
like an effective plasma when the electric field of the incident radiation is
aligned along the wire axes. The response is, however, anisotropic as the
wires are along one direction only. . . . . . . . . . . . . . . . . . . . . . . 14
xvi

List of Figures xvii
1.5 Schematic diagram of a wire array metamaterial consisiting of a three-
dimensional lattice of connected wires which behaves like an effective,
isotropic artificial plasma. In the case of a similar configuration of un-
connected wire, spatial dispersion becomes an important issue. . . . . . . 15
1.6 Schematic diagram of the cut-wire metamaterial whose response is akin
to an array of periodically-placed electric dipoles.The metamaterial has
an effective Lorentz permittivity with a negative permittivity band. . . . 16
1.7 An array of metallic cylinders which effectively has a diamagnetic mag-
netic response, but cannot possess a negative permeability. . . . . . . . . 18
1.8 Schematic diagram of a typical SRR showing the direction of the currents
induced by the magnetic field of the incident radiation. This magnetic
field can drive a resonant LC circuit through the inductance, resulting in
a dispersive effective permeabilty. . . . . . . . . . . . . . . . . . . . . . . 19
1.9 A pictorial depiction of a SRR-based metamaterial showing the arrange-
ment of the SRR, periodically in the horizontal plane and stacked up in
the vertical direction. The medium displays uniaxial magnetic activity
and a negative magnetic permeability when the magnetic field is oriented
along the (common) cylindrical axis of the SRRs. . . . . . . . . . . . . . 20
1.10 The equivalent ring model for the SRR used to study its magnetic re-
sponse at high frequencies. This model is used to get an insight into the
lack of high frequency scaling in SRRs. . . . . . . . . . . . . . . . . . . 22
1.11 (a) and (b): Bianisotropic SRRs of square cross-section showing the pos-
sibility of the development of a net electric dipole moment even when
the systems are driven by a magnetic field. The symmetric SRR in (c) is
not bianisotropic due to the cancellation of the dipoles arising due to the
charge distribution. . . . . . . . . . . . . . . . . . . . . . . . . . . . . . . 25

xviii List of Figures
1.12 A surface plasmon at the interface between positive and negative dielec-
tric media, showing the exponential decay of the fields perpendicular to
the interface between the two media. The surface plasmon mode itself
propagates along the interface. . . . . . . . . . . . . . . . . . . . . . . . . 28
1.13 The level scheme for observing EIT in a three-level Λ system. Fig. (a)
shows the Λ scheme for EIT in a three-level system when a strong control
field is applied. Fig. (b) is the dressed state picture for the same scheme. 32
1.14 The ladder and the vee level schemes for EIT in three-level systems.
These are hindered by the lack of a metastable state. . . . . . . . . . . . 33
1.15 The level scheme for Raman Effect showing the emission of Stokes radia-
tion at νS or anti-Stokes radiation at νAS with the absorption of radiation
at νL. . . . . . . . . . . . . . . . . . . . . . . . . . . . . . . . . . . . . . 34
1.16 The proposed level scheme for Inverse Raman Effect using two molecular
levels in CS2. A strong pump field applied at a frequency ν0 enables the
resonant absorption of the probe field at an anti-Stokes frequency ν0 + νR. 35
2.1 Schematic diagram showing the constructions of the unit cells of the SRRs
embedded in a the lossless dielectric of ǫ = 4.0. Arrays of such SRR
exhibit a negative-µ stop band around a wavelength of 1.5µm. The unit
cell is a square whose side a = 300 nm. . . . . . . . . . . . . . . . . . . 41
2.2 (a) - (c) The band structures for each of the SRRs shown in Fig. 2.1 (a)
- (c) respectively. The band gaps are seen to occur at slightly different
frequencies in each case.
(d) - (f) The reflectivity and the transmittivity corresponding to the band
structures shown in (a) - (c) respectively, for individual slabs consisting
of four layers of SRRs (a), (b) and (c) respectively. Additional peaks due
to Fabry Perot resonances are also observed. . . . . . . . . . . . . . . . . 43

List of Figures xix
2.3 (a) - (c): The effective impedance Z for each individual slabs of the
SRRs shown in Fig. 2.1 (a) - (c). The peak indicates the location of the
magnetic resonance.
(d) - (f): The retrieved permeability for corresponding to (a), (b) and
(c), respectively. In each case, µeff takes up negative values but the exact
resonance frequencies and the strengths of the resonances are different,
even though the three structures are electrically similar. . . . . . . . . . 45
2.4 Schematic diagram for the SRRs whose electromagnetic response has been
investigated in this section. The SRRs are in vacuum and the unit cell
in each case is a square whose side is a = 300 nm. . . . . . . . . . . . . . 46
2.5 The band structures corresponding to the SRR structures shown in Fig. 2.4
(a), (b), (c) and (d), respectively. The striking difference between the re-
sponse of each of these structures is noteworthy. The solid circles indicate
the real parts of the wave vector while the hollow circles denote the imag-
inary parts. The same colour (red or black) has been used for the real and
imaginary parts of the eigenvalues with positive or negative real parts.
The opposite signs of the real and imaginary parts indicate negative phase
velocity for SRR (a), (c) and (d). The unit cell size is a = 300 nm. . . . . 48
2.6 The reflectivity and the transmittivity for the for slabs consisting of four
layers of the SRRs shown in Fig. 2.4 (a), (b), (c) and (d), respectively.
These calculations confirm the result of the band structure calculations
for each SRR. The transmission spectra show the additional peaks due
to the Fabry-Perot resonances occuring as a result of multiple reflections
from the edges of the slab. . . . . . . . . . . . . . . . . . . . . . . . . . . 49
2.7 Band structures for the SRR(a) in Fig. 2.4 after the gaps have been
redistributed. Note that in each case, E can interact with the charge
distributions formed across two of the gaps, just as in the case of SRR
(a). The band structures obtained are identical in every respect. As
before, the unit cell size is a = 300 nm. . . . . . . . . . . . . . . . . . . 50

xx List of Figures
2.8 The electric (top) and the magnetic (bottom) field maps calculated using
FEMLAB for an array of SRRs of the type (c) in Fig. 2.4. The electric
fields are concentrated within the capacitive gaps while the magnetic
fields are confined within the rings, highlighting the magnetic nature of
the resonance. . . . . . . . . . . . . . . . . . . . . . . . . . . . . . . . . 52
2.9 Left: The focussing action by an array of SRRs of type (b) (Fig. 2.4) in
the form of a Veselago lens. A line source is placed on the left-hand side
of the slab. An image is clearly formed on the right-hand side as seen
from the field map.
Right: The energy streamlines also converge in the transverse direction
indicating the focussing. The transmittivity of the slab is very low due
to the band gap and a faint image is formed. . . . . . . . . . . . . . . . . 54
2.10 Left: The focussing action by an array of SRRs of type (c) (shown in
Fig. 2.4) in the form of a Veselago lens.
Right: A line source is placed on the left-hand side of the slab. The image,
clearly formed on the right-hand side, can be seen on the field map. The
energy streamlines also converge in the transverse direction indicating
the focussing. In this case, the transmission by the slab is considerably
higher the frequencies lie in a propagating band and the image formed is
much brighter. . . . . . . . . . . . . . . . . . . . . . . . . . . . . . . . . . 55
2.11 Focussing by a disordered, finite-sized array of SRR of type (c) in Fig. 2.4.
This figure clearly indicates that imaging effects are not due to band-
dispersion effects but rather a consequence of the localized resonances of
the system. A single SRR in the array is missing, as shown. The positions
of the two sources and their corresponding images have been indicated in
the figure. The figure shows the field map for the electric field normal to
the plane of the array. . . . . . . . . . . . . . . . . . . . . . . . . . . . . 56

List of Figures xxi
2.12 Schematic diagram for the SRRs whose electromagnetic response with
varying d has been studied in this section. The unit cell is a = 300 nm,
while the sides of the SRR are 180 nm long. . . . . . . . . . . . . . . . . 58
2.13 Left: Band structures for the SRR shown in Fig. 2.12 as the gap width
increases from 0 to 4 nm. A negative permeability band gap due to a
magnetic resonance appears when d = 4 nm.
Middle: The reflectivity and the transmittivity for a slab consisting of
two layers of SRRs, whose capacitive gaps correspond to d = 0 nm and
d = 4 nm, respectively.
Right: The calculated impedance Z for the gap widths of 0 and 4 nm,
respectively. . . . . . . . . . . . . . . . . . . . . . . . . . . . . . . . . . . 59
2.14 Left: Band structures for the SRR shown in Fig. 2.12 as the gap width
is increased to 12 nm and 20 nm. The negative permeability band gap
moves towards higher frequencies.
Middle: The reflectivity and the transmittivity for a slab consisting of
two layers of SRRs, whose capacitive gaps correspond to d = 12 nm and
d = 20 nm, respectively.
Right: The calculated impedance Z for the gap widths of 12 and 20 nm,
respectively. . . . . . . . . . . . . . . . . . . . . . . . . . . . . . . . . . 61
2.15 Left: Band structures for the SRR shown in Fig. 2.12 as the gap width
increases to 44 nm and 60 nm. The negative permeability band narrows
and moves upwards with increasing gap width d.
Middle: The reflectivity and the transmittivity for a slab consisting of
two layers of SRRs, whose capacitive gaps correspond to d = 44 nm and
d = 60 nm, respectively.
Right: The calculated impedance Z for the gap widths of 44 and 60 nm,
respectively. . . . . . . . . . . . . . . . . . . . . . . . . . . . . . . . . . . 62

xxii List of Figures
2.16 Band structures for the SRR shown in Fig. 2.12 as the gap width in-
creases to 76 nm and 124 nm. The negative permeability band gradually
disappears with increasing gap width.
Middle: The reflectivity and the transmittivity for a slab consisting of
two layers of SRRs, whose capacitive gaps correspond to d = 76 nm and
d = 124 nm, respectively.
Right: The calculated impedance Z for the gap widths of 76 and 124 nm,
respectively. . . . . . . . . . . . . . . . . . . . . . . . . . . . . . . . . . . 64
3.1 Schematic diagram for the SRR used for studying the effect of a frequency-
dispersive permittivity on the magnetic response. The dimensions of the
SRR are as follows: a = 600 nm, b = 312 nm, L = 144 nm, D = 24
nm, d = 24 nm. The dark (red) area indicates the metallic region while
the lighter (yellow) region represents the capacitive gaps where an ap-
propriate medium can be embedded. A slab of SRR such as this is truly
homogenizable (∼ λ/10) at the frequencies of interest. . . . . . . . . . . 70
3.2 A section through a SRR-based metamaterial showing the periodic ar-
rangement of the SRRs, embedded in a host medium with a dispersive
permittivity, indicated by the grey region in the figure. . . . . . . . . . . 72
3.3 (a): The frequency dependent µeff and (b): Γeff and filling fraction feff
(obtained analytically) for the SRR metamaterial in the presence of a
embedding dielectric medium displaying EIT.
(c) and (d): The same quantities for the SRR metamaterial embedded
in a medium which has a resonant Lorentz permittivity. In this case, the
magnetic resonance occurs at 74.9 THz and the dielectric resonance is at
73.6 THz . . . . . . . . . . . . . . . . . . . . . . . . . . . . . . . . . . . . 74

List of Figures xxiii
3.4 (a): The computed band structures for the bare SRR (red circles) and the
composite metamaterial embedded in a Raman medium (black squares)
under the condition ωe = ωm. The blue lines represent the dispersion
predicted by the analytic formula. The band gaps due to µeff < 0 are in-
dicated by the cross-hatched region on the right (for the bare SRR whose
ωm = 74.9THz) and the the two hatched regions on the the left (for the
band gaps resulting from the inclusion of the resonant Raman medium).
(b): The reflectivity and the transmittivity for a calculated for a slab
consisting of a single layer of SRR. Note the presence of two stop bands
(low |T |2) corresponding to the band gap frequencies in (a) and the new
transmittive band that develops within the original band gap.
(c): The effective impedance Z(ν) of the composite metamaterial show-
ing the presence of two resonances.
(d): The µeff , for a slab of the SRR metamaterial with an embedded
resonant medium, retrieved using the computed reflection and the trans-
mission coefficients. Note the existence of two frequency ranges where
µeff < 0. The grey dotted line represents the zero level. . . . . . . . . . . 78
3.5 The band structures and (|T |2, |R|2) for the composite metamaterial when
ωm 6= ωe. (a): Band structure of the composite metamaterial when ωe
= 79.69 THz. The resulting gaps are blue-shifted with respect to those
obtained when ωe = ωm.
(b): Band structure of the composite metamaterial when ωe = 70.03
THz. In this case, the resulting gaps are red-shifted with respect to those
obtained when ωe = ωm.
(c) & (d): Reflectivity and transmittivity calculated for a slab consisting
of four layers of unit cells. The minima in |T |2 correspond to the new
band gaps. . . . . . . . . . . . . . . . . . . . . . . . . . . . . . . . . . . 80
xxiv List of Figures
3.6 (a)-(d) The effective impedance (Z) of the composite metamaterial when
the magnetic resonance frequency and the resonance frequency of the
dielectric medium are different. The plots of Z(ν) for the dielectric reso-
nances at 70.03 THz, 73.65 THz, 76.06 THz and 79.69 THz respectively
(away from ωm at 74.9 THz), shows the presence of two peaks, signifying
the occurrence of two magnetic resonances. . . . . . . . . . . . . . . . . 81
3.7 Left: The level structure diagram of the relevant levels involved in EIT
for metastable helium.
Right: The cross-section and dimensions of the SRR used to demon-
strate coherent control of SRR-based metamaterials at NIR and optical
frequencies. . . . . . . . . . . . . . . . . . . . . . . . . . . . . . . . . . . 82
3.8 Band structure of the SRR metamaterial(unit cell shown) when it is im-
mersed in He gas (a) with the control field switched off and (b) under the
action of a control field Ωc = 10γ21.
(c) and (d) represent the reflectivity and the transmittivity of a single-
layered slab of the metamaterial under the conditions in (a) and (b)
respectively. . . . . . . . . . . . . . . . . . . . . . . . . . . . . . . . . . 83
3.9 The reflectance (Red) and transmittance (black) across four layers of
unit cells of SRR metamaterials immersed in metastable helium gas with:
(left) zero control field and (right) control field corresponding to Ωc = 10γ21. 85
3.10 (a): The band structure for a metamaterial composed of SRR with similar
structural dimensions but with four capacitive gaps. The band gap due
to the negative permeability band at 287 THz can be clearly identified.
(b): The reflectance (red) and transmittance (black) across four layers of
unit cells of the SRR medium. . . . . . . . . . . . . . . . . . . . . . . . 86

List of Figures xxv
3.11 Band structure of a metamaterial consisting of SRR having four splits
when it is immersed in He gas (a) with the control field switched off
and (b) under the action of a control field Ωc = 10γ21. (c) and (d)
represent the reflectivity and the transmittivity of a single-layered slab of
the metamaterial under the conditions specified in (a) and (b) respectively. 87
3.12 The reflectivity and the transmittivity for the composite medium when
the dissipation in the silver SRR is increased: (a) and (c): two times, (b)
and (d): two and a half times. . . . . . . . . . . . . . . . . . . . . . . . 89
3.13 (a): The effective permeability of the metamaterial for different widths of
the distribution of the magnetic resonance frequency. The resonant µeff
is washed out when the imperfections lead to σ ∼ ωm.
(b): The broadened Im(µeff) of the metamaterial in the presence of a back-
ground medium which exhibits EIT, for σ = ωm/100. The inset shows
the details of the central part of the figure where the narrow features are
seen to survive inspite of the broadening of the overall response. . . . . 90
4.1 Schematic representation of the plasmonic metamaterial proposed by En-
gheta et. al. in Opt. Exp., 14, 1557 (2006). The shaded circles represent
the nanospheres and the black arrows indicate the electric dipole mo-
ment induced on each particle. A circulating ‘displacement’ current is
generated leading to a magnetic resonance. . . . . . . . . . . . . . . . . . 95
4.2 Schematic diagram of a metamaterial consisting of an array of plasmonic
loop inclusions. Such an array may also be embedded in a host dielectric
medium. The direction of the induced currents has been indicated by
curved arrows. . . . . . . . . . . . . . . . . . . . . . . . . . . . . . . . . . 97

xxvi List of Figures
4.3 (a): A cross-sectional view of a typical unit cell of the plasmonic loop
metamaterial, showing the nanorods placed on the circumference of a
circle. In the figure, a = 120 nm, b = 25 nm and R = 26 nm.
(b): The magnetic response of an isolated loop inclusion illustrating the
concentration of the magnetic field inside the loop at resonance, when
excited by means of a line source. The magnetic resonance of this single,
isolated loop inclusion was found to occur at 652 THz. . . . . . . . . . . 98
4.4 Left: A single plasmonic loop inclusion consisting of circular nanorods at
its magnetic resonance, showing the magnetic field strongly concentrated
inside the loop. Four point sources are located at four corners around the
loop inclusion. The radius of the loop is R = 26 nm, the diameter of the
circular nanorod is 25 nm and each side of the unit cell is a = 120 nm.
The magnetic resonance occurs at 650 THz.
Middle: A single plasmonic loop inclusion made up of square nanorods
at its magnetic resonance frequency (652 THz) with a single point source
placed outside at the lower right-hand corner. The magnetic field is
confined within the loop.
Right: The single plasmonic loop inclusion at a frequency of 667 THz
(above its magnetic resonance frequency). A single point source is placed
outside the loop at the lower right-hand corner. No confinement of the
magnetic field inside the loop can be observed. The dimensions of the
loop, the nanorods and the unit cell in the middle and the right panels
are the same as those in Fig. 4.3. . . . . . . . . . . . . . . . . . . . . . . 99
4.5 (a) The band structure and (b), the transmittivity for four layers of unit
cells of the plasmonic metamaterial. The additional peaks are the Fabry-
Perot resonances occuring due to multiple scattering between the inter-
face of the medium and vacuum. . . . . . . . . . . . . . . . . . . . . . . 100
List of Figures xxvii
4.6 (a) The band structure and (b), the transmittivity for four layers of unit
cells of the plasmonic metamaterial when the unit cell size is reduced and
the loop radius increased, keeping the cross-sectional size of the nanorods
constant . As before, the additional peaks are the Fabry-Perot resonances
occuring due to multiple scattering between the interface of the medium
and vacuum. . . . . . . . . . . . . . . . . . . . . . . . . . . . . . . . . . 101
4.7 Schematic representation of the plasmonic metamaterial consisting of four
rods per unit cell showing the alternative pathways by means of which
plasmonic loops may be formed. Such loops may support weaker sec-
ondary magnetic resonances leading to difficulties in identifying the pri-
mary magnetic resonance due to the rods in the unit cell. . . . . . . . . . 102
4.8 (a) & (b) The new band formed and the modified reflectivity of the plas-
monic metamaterial in the neighbourhood of a Raman transition in CS2
at 416.54 THz. The band gap of the original metamaterial occurred be-
tween ∼ 415 THz and 420 THz, as seen in Fig. 4.5. . . . . . . . . . . . . 105
4.9 Schematic pictures of an aligned nanorod array with subwavelength pe-
riodicity and grown vertically on a substrate that behaves as a plasma
for linearly polarized radiation with the electric field along the wire axes.
Left: The nanorods are arranged regularly in rows.
Right: The nanorods lie on the circumference of a circular loop, just like
the plasmonic metamaterial described earlier in this chapter, except that
they respond to the electric field of the incident radiation. . . . . . . . . 107

xxviii List of Figures
4.10 Top panels: (a) Band structure of the silver nanorod metamaterial and
(b) Transmittance from an array containing four layers of nanorods,
for various filling fractions of silver calculated using the transfer matrix
method. The Re(ǫeff) and transmittance calculated for a homogeneous
slab of effective medium as given by Eq. (4.9) are also shown by thin lines
in (a) and (b) respectively.
Bottom panels: The electric fields (in arbitrary units) within the rod ar-
ray for a plane wave incident from the bottom. Left: ω < ωp, Middle:
ω = ωp, Right: ω > ωp The radiation does not penetrate for frequencies
below the plasma frequency (ωp = 650 THz) while it propagates across
for higher frequencies. Each nanorod has a diameter of 25 nm and the
unit cell size is 120 nm. . . . . . . . . . . . . . . . . . . . . . . . . . . . . 108
4.11 (a) and (c): Band structure for s-polarized light with the metamaterial
immersed in atomic sodium showing the new transmission band that
develops below ωp, for the D1 and D2 lines respectively.
(b) and (d): The transmittivity corresponding to the band structure in
(a) and (c) respectively. . . . . . . . . . . . . . . . . . . . . . . . . . . . 113
4.12 (a): Band structure for s-polarized light with the metamaterial immersed
in atomic sodium showing the new transmission band that develops below
ωp, for the D1 and D2 lines respectively. An additional switchable band
develops under the action of a control field.
(b): The transmittivity corresponding to the band structure in (a). . . . 114
4.13 (a) and (b): Band structure for s-polarized light with the metamaterial
immersed in barium vapour showing the new transmission band that
develops below ωp, for the in the presence and in the absence of the
control field, respectively.
(c) and (d): The transmittivity and the reflectivity corresponding to the
band structures shown in (a) and (b) respectively. . . . . . . . . . . . . . 115

List of Figures xxix
4.14 The band structure for an array of nanorods arranged (a): at the corners
of a square and (b): symmetrically about the cirumference of a circular
loop for filling fractions 8.7 %, 13 % and 17.4 %. In each case, the effective
plasma frequency remains the same. . . . . . . . . . . . . . . . . . . . . 117
5.1 The perfect lens (consisting of a slab of negatively refracting medium
with n = −1) proposed by Pendry in Phys. Rev. Lett., 85, 3966 (2000),
and an equal thickness of vacuum (with n = 1) is the complementary
medium of the negatively refracting slab with n = −1. . . . . . . . . . . 120
5.2 A corner reflector (left) can be mapped into a series of slabs where every
fourth slab in the series is complementary to the other three (right). The
point source is included in every fourth layer so that the entire system is
periodic in the direction. . . . . . . . . . . . . . . . . . . . . . . . . . . 122
5.3 Schematic representation of an infinite checkerboard consisting of alter-
nating cells of positive and negative index media. A source of radiation
placed in one cell of such an infinite checkerboard will form an image in
every other cell. . . . . . . . . . . . . . . . . . . . . . . . . . . . . . . . . 125
5.4 A checkerboard of width L illustrating the conflict between the ray pic-
ture and the wave picture. According to the ray analysis, a ray may be
transmitted or retro-reflected while the full wave solutions of Maxwell’s
equations validate the results of the generalized lens theorem that unit
(complete) transmission occurs for all wave vectors. . . . . . . . . . . . . 127

xxx List of Figures
5.5 The perfect checkerboard characterized by ǫ− = −1, µ− = −1, ǫ+ =
+1, µ+ = +1. These plots illustrate the importance of the fineness
of the numerical grid in achieving accurate numerical results. (a) and
(b): The response of the same system as calculated using a numerical
grid containing 202 points. A resonance (actually a numerical artefact),
occurs at kx ≃ k0, for better discretization, this shifts to kx ≃ 3k0.
(c) and (d): The response of the ‘perfect checkerboard’ as calculated
using a fine numerical grid consisting of 262 points. The transmittivity
is nearly zero and the phase change of the transmitted component (φT )
is nearly zero throughout. . . . . . . . . . . . . . . . . . . . . . . . . . . 128
5.6 A checkerboard of finite width such as those studied in this section. It has
been shown to obey the generalized lens theorem and exhibits unit trans-
mittivity and zero reflectivity for all wave-vectors, both the propagating
as well as the evanescent. . . . . . . . . . . . . . . . . . . . . . . . . . . . 131
5.7 (a) & (c): The transmission properties of dissipative checkerboards whose
Im(ǫ) and Im(µ) are 0.0001 and 0.001 respectively.
(b) & (d): The phase change of the transmitted component for both
polarizations of light and for the same levels of dissipation in (a) & (c),
respectively. . . . . . . . . . . . . . . . . . . . . . . . . . . . . . . . . . 132
5.8 (a) & (c): The transmission properties of dissipative checkerboards whose
Im(ǫ) and Im(µ) are somewhat higher, being 0.01 and 0.1 respectively.
(b) & (d): The phase change of the transmitted component for both
polarizations of light and for the same levels of dissipation in (a) & (c),
respectively. . . . . . . . . . . . . . . . . . . . . . . . . . . . . . . . . . . 133

List of Figures xxxi
5.9 The transmission properties of a checkerboard of silver (ǫ = −1+i0.4 and
µ = +1), as shown in the left panel. The resonant excitation of surface
plasmon modes for p-polarized light only, is observed. The behaviour of
this system may be compared to the transmission properties of checker-
boards of dissipative NRM, having similar levels of dissipation (shown in
the right panel). . . . . . . . . . . . . . . . . . . . . . . . . . . . . . . . . 134
5.10 The response of off-resonance checkerboard structures (dissipative and
non-dissipative). The permittivity and the permeability of these checker-
boards have the generic forms ǫ+ = +1, µ+ = +1, ǫ− = −1+αe+iδe, µ− =
−1+αm+iδm. When the mismatch ∼ 0.1, perfect transmission is obtained
upto kx ≃ k0 for the lossless case. For dissipative checkerboards with a
higher degree of mismatch, the transmission is considerably lower for
propagating waves. Numerical artefacts also start appearing for kx > k0. 135
5.11 Left: An example of the unit cell of a modified checkerboard medium
studied in this section. The shaded regions correspond to the negative
refractive index regions. Locally enhanced fields occur near the central
point (P) and these fields increase as the inner regions of negative/positive
index media are increased in size. Right: The reflectivity and the trans-
mittivity of such a checkerboard. . . . . . . . . . . . . . . . . . . . . . . 136
5.12 Left panel: The P-polarized eigenfield associated with a line source whose
wavelength is 0.5d (d is about 9µm) placed at a distance 0.2d from a silver
checkerboard slab consisting of 30 cells of side length 0.1d, alternating air
and weakly dissipative silver cells (ǫ = −1+ i0.01 andµ = +1). The scale
on the right is in arbitrary units. (a) 2D plot of the field; (c) Profile of
the field computed along a vertical segment with end points (0,1)d and
(0,-1)d.
Right panel: Same with two pairs of complementary checkerboard layers
(60 cells); (b) 2D plot of the field; (d) 3D plot of the field. . . . . . . . . 137

xxxii List of Figures
5.13 A modified checkerboard (of finite extent) of the kind studied in Sec. 5.6.
Locally enhanced fields occur near the central point and these fields in-
crease as the inner regions of negative/positive index media are increased
in size. . . . . . . . . . . . . . . . . . . . . . . . . . . . . . . . . . . . . 139
5.14 A modified checkerboard (of infinite extent) of the kind studied in Sec. 5.6.
The locally enhanced fields occuring near the central point increase in
intensity as the inner regions of negative/positive index media are in-
creased in size. The fields at the central regions (white) exceed those in
the neighbouring regions by several orders of magnitude as the inner re-
gions of negative/positive index media increase in size (Bottom, left and
right panels). . . . . . . . . . . . . . . . . . . . . . . . . . . . . . . . . . 140
6.1 Schematic representation of the PHOTON code based on the Transfer
Matrix Method. The details of the subroutines (named in capitals), can
be found in Ref. [137]. . . . . . . . . . . . . . . . . . . . . . . . . . . . . 146

List of Tables
2.1 The changing nature of the response of the SRR whose structure has been
shown in Fig. 2.12 as the gap width d varies. . . . . . . . . . . . . . . . . 65
xxxiii

Chapter 1
Introduction
The idea of negatively refracting or ‘left handed’ media had its genesis more than four
decades ago in a speculative paper by V. Veselago [1]. According to him, the vectors E
(electric field), H (magnetic field) and k (wave vector) of an electromagnetic wave would
form a left-handed triad during their propagation through a medium whose material
parameters, the permittivity ǫ and permeability µ are both negative. These vectors
form a right-handed triad for electromagnetic wave propagation through most isotropic
media for which both ǫ and µ are positive. The refractive index of such media would
thus be negative, as one could infer from considerations of the wave-vector, k. However,
the Poynting vector, S = E×H, still points along the forward direction (Fig 1.1). The
S and k are antiparallel and hence, materials with a negative refractive index can be
thought of as media that have a negative phase velocity. Media with a negative index
of refraction permit the propagation of waves with a reversed wave vector, leading them
to be also termed as backward wave media. Negative index media can be thought of as
extreme cases of anisotropic media (like crystals) which do not usually have S and k
parallel although the media considered here are isotropic. The reversal of the direction
of k results in several interesting consequences for wave propagation such as a modified
Snell’s law of refraction for such media, a negative angle for Cerenkov radiation and a
reversed Goos-Hanchen shift [2, 3, 4, 5, 6, 7, 8].
Negatively refracting media would also necessarily have to be dispersive and dissipa-
1
2 Introduction
tive in order to conform to the conservation of energy. Otherwise, negative dispersionless
material parameters ǫ and µ would imply that the energy density
W =ǫ0ǫ
2E2 +
µ0µ
2H2 < 0 (incorrect). (1.1)
This implies that the permittivity and the permeability must be complex-valued func-
tions of the frequency. The material parameters of causal negatively refracting media
must satisfy the famous Kramers-Kronig relations [9]
Re[ǫ(ω)] − 1 =1
πP
∫ ∞
−∞
Im[ǫ(ω′)] dω′
ω′ − ω, (1.2)
Im[ǫ(ω)] = −1
πP
∫ ∞
−∞
Re[ǫ(ω′)] − 1 dω′
ω′ − ω, (1.3)
Re[µ(ω)] − 1 = −1
πP
∫ ∞
−∞
Im[µ(ω′)] dω′
ω′ − ω, (1.4)
Im[µ(ω)] =1
πP
∫ ∞
−∞
Re[µ(ω′)] − 1 dω′
ω′ − ω(1.5)
(where P is the Cauchy principal value), for causality to hold. The resonant forms of
the dispersive permittivity or the permeability of resonant dielectric or magnetic media
obtained for generic modes [9, 10] constituting the negative refractive index medium
satisfy the above Kramers-Kronig relations. However, since the integrals in these rela-
tions involve frequencies extending upto infinity (as effective medium theories become
inapplicable at high frequencies), the Kramers-Kronig relations must be applied to meta-
materials carefully.
In the absence of naturally occuring media which could display negative material pa-
rameters, Veselago’s predictions were regarded as academic curiosities. While naturally
occuring materials can possess ǫ < 0 (such as metals below their plasma frequencies),
the magnetic response of most media die out at low frequencies (in the GHz range).
Veselago’s ideas were revitalized in 2000 when Sir John Pendry published his seminal
paper about a perfect lens [11] consisting of a slab of material whose refractive index is
negative. He showed theoretically that such a slab of material whose refractive index
n = -1 has the power to focus all the Fourier components associated with an image,

3
Wave vectors Energy flow
(a)
n > 0
n < 0
(b)
Refraction
NegativeRefraction
Positive
Figure 1.1: (a) Schematic representation of refraction occurring at the interface of amedium whose n > 0 and one whose n < 0. The energy flow and the wave vectors areoppositely directed in the n < 0 medium.(b) Diagram illustrating the difference between positive and negative refraction. In thecase of negative refraction, the refracted ray lies on the same side of the normal as theincident ray.
including all the evanescent ones. Hence, unlike a conventional lens, it is not limited
by the wavelength of radiation, and has been called the ‘perfect lens’. In the same
year, Smith et. al. gave the first experimental demonstration of media displaying neg-
ative index of refraction [12, 2]. Since then, it is in the context of designing materials
with negative material parameters that metamaterials have come to play a decisive role.
Here, it is to be noted that simply embedding a negative magnetic medium within a
negative dielectric medium does not produce negative refractive index [13]. There are
issues of inhomogeneous fields which have to be taken care of [14] before a negative
index of refraction can be generated.
Metamaterials, which are essentially structured composite materials exhibiting novel
electromagnetic behaviour, is an actively researched subject today [15, 16, 17, 18]. These
materials contain structural inhomogeneities which are much smaller compared to the
wavelength of incident radiation, and yet much larger than atomic/molecular length-
scales. The radiation responds to the macroscopic resonances of these geometric struc-
4 Introduction
tures while not being able to resolve their geometric details, enabling their characteriza-
tion by effective material parameters ǫeff and µeff , much like in the case of homogeneous
media. In the case of metamaterials, the periodicity of the structure is not particularly
important and their response is mainly due to single scatterer localized resonances. This
is to be contrasted with the behaviour of periodically arranged dielectric structures in
photonic crystals where stop bands and band gaps arise due to Bragg scattering [19, 20]
caused by the periodic arrangement. Here, the periodicity of the structure, which is
comparable to the wavelength of the impinging radiation, rules out a homogenized de-
scription of the medium.
In this thesis, the behaviour and control of metamaterials at optical frequencies
has been studied. Schemes for controlling the effective magnetic or electric response
of metamaterials using coherent optical processes have been presented in this thesis.
The inaccuracies in using a homogenization approach for characterizing the behaviour
of magnetic metamaterials at near infrared and optical frequencies has been investi-
gated (Chap. 2). In Chap. 3, parametric control over the effective magnetic response of
SRR-based metamaterials, using coherent optical processes has been studied in detail.
Chap. 4 contains a study of plasmonic metamaterials and schemes for controlling their
magnetic and electric response. All the metamaterials studied in this thesis are metallic.
Silver has been considered as the constituent metal as it is one of the least dissipative
metals. Finally, in Chap. 5, the transmission properties of checkerboard structures of
alternating positive and negative index media have been investigated. In the sections
of this chapter that follow, a selection of the basic ideas regarding metamaterials and
coherent control processes for the optical control of atomic/ molecular transitions has
been presented. This selection is presented with a view to facilitate understanding the
effects and phenomena described in the subsequent chapters of this thesis.

The Perfect Lens 5
d1
d2
z
O I
Figure 1.2: The action of the Perfect Lens proposed by Pendry. Characterized by unittransmittivity, this lens focusses the propagating as well as the evanescent modes froman object. The resulting image, which contains the subwavelength features of the object,is ‘perfect’. The distance at which the image is formed is z = d2 − d1.
1.1 The Perfect Lens
Pendry’s proposal for a perfect lens [11] that would overcome the Diffraction Limit
for conventional lenses and focus even subwavelength features of an object, is a direct
consequence of Veselago’s idea of a negatively refracting medium. A perfect lens is
simply a slab of NRM perfectly impedance-matched to its surroundings so that there
is no reflection at the interfaces for a wave incident at any angle or for any transverse
wave vector. The figure (Fig. 1.2) shows that an object placed a distance d1 away from
a NRM slab of thickness d2 comes to a second focus when z = d2 − d1. The lens is
characterized by perfect transmittivity, for both the propagating and the evanescent
waves and all waves are focussed by it at the frequency when n = −1. The perfect
refocussing of light occurs as the NRM cancels the phase acquired or amplifies the
amplitude lost by the waves in travelling across an equal thickness of vacuum. The
focussing of the evanescent waves occurs via surface plasmon modes at the interfaces
with vacuum. The slab of NRM cancels the decay of evanescent waves and they emerge

6 Introduction
from the slab amplified by the transmission process. This process, by itself, does not
violate any energy conservation laws simply because purely evanescent waves do not
transport energy in non-dissipative media! It only implies a local field enhancement in
the system. Thus, in the perfect lens, both the propagating as well as the evanescent
modes contribute to the image and the resolution of the image formed is only limited by
the degree of imperfection in the lens (deviation from the condition ǫ = −1, µ = −1). In
the limit of large wave-vectors (kx → ∞), the amplification of the evanescent waves leads
to a divergence in the electromagnetic energy due to the absence of a large wave vector
cut-off [21]. In principle, however, there is always a cut-off wave-vector ∼ 1/a, where a
is a length scale set by the underlying structure of the metamaterial. The unphysical
divergences go away when ǫ = µ = −1 are understood to be ǫ = −1+ iδe, µ = −1+ iδm,
i.e., the media are taken to be slightly dissipative [22].
Using the technique of co-ordinate transformation [23, 22, 24], it has been shown
that it is possible to have perfect lenses in geometries other than the planar slab lens.
Perfect lenses having a curved geometry possess the greater advantage of producing a
magnified image which contains both the far-field as well as the near-field information.
Perfect lenses have been proposed for spherical [25] and cylindrical geometries, as well
as perfect corner reflectors consisting of slabs of NRM [26].
1.2 Homogenization of Metamaterials
The interaction of structurally isotropic and non-chiral metamaterials with electromag-
netic radiation may be described by two complex parameters ǫeff and µeff provided that
the radiation has a wavelength (λ) that is much larger compared to the size (a) of the
inclusions, i.e., λ≫ a. The effective material parameters are thus derived from a coarse-
grained spatial averaging of the properties of the individual constituent structures. Two
levels of averaging are implicit here. First, it is assumed that the inclusions are large
enough on a molecular scale to be described by the bulk material parameters of the
constituent materials. Second, they are small compared to the lengths over which the

Homogenization of Metamaterials 7
applied fields vary and retardation effects can be neglected. One is able to distinguish
only a few average quantities, such as the dipolar, or in some cases, the quadrupolar
fields. Thus, we have
〈D〉 = ǫ0ǫeff · 〈E〉, 〈B〉 = µ0µeff · 〈H〉, (1.6)
which define the effective permittivity ǫeff and the effective permeability µeff of the
metamaterial. In general, both ǫeff and µeff are tensors. There are, in essence, two
approaches which are used for homogenization. The first one involves averaging the
fields internal to the structure while the second one makes use of the emergent quantities
like the reflection and the transmission coefficients, and obtaining an equivalent effective
medium. In order to homogenize the metamaterial, slabs of it which are of finite extent
along the direction of propagation of the wave and infinite along the two other directions,
are considered. Here we discuss a few techniques for homogenizing metamaterials and
assigning effective material parameters to them.
1.2.1 Effective medium theories
(i) Maxwell-Garnett effective medium theory: The Maxwell-Garnett theory [27] has very
successfully described the properties of dilute composite dielectric media. The compos-
ite medium is assumed to consist of small particles (radius a ≪ λ, filling fraction f)
of permittivity ǫi embedded in a host medium whose permittivity is ǫh. This theory
incorporates the electromagnetic field distortions due to the dipole fields, yielding an
effective permittivity given by
ǫeff = ǫh + 3fǫhǫi − ǫhǫi + 2ǫh
. (1.7)
The size parameter of the particles (defined as x = 2πa√ǫi/λ) is ≪ 1, justifying the
assumption of a spatially uniform field over the region of the particle. In the case of a
8 Introduction
denser composite, the effective dielectric permittivity is found to be
ǫeff = ǫhǫi(1 + 2f) + 2ǫh(1 − f)
ǫi(1 − f) + ǫh(2 + f), (1.8)
assuming the inclusions to be point particles.
The Maxwell-Garnett theory can be extended to account for the finite size of the
particles. This is essential in order to have better agreement of theoretical predictions
with experimentally obtained results. Ruppin [28] has presented a comparative study of
such extended Maxwell-Garnett theories. Among these, Doyle’s approach [29], utilizing
the Mie scattering technique, has been found to be the most successful. An effective
permittvity
ǫeff = ǫhx3 + 3ifa1
x3 − 3ifa1, (1.9)
is obtained, where a1 describes the electric dipole within the framework of the Mie
theory. Similarly, an effective magnetic permeability
µeff = µhx3 + 3ifb1x3 − 3ifb1
, (1.10)
where b1 is the magnetic dipole, should also be possible. This implies that an appropri-
ate configuration of non-magnetic dielectric particles can possess a non-unit µeff if the
magnetic Mie scattering contributes significantly. It is to be noted that the extended
MG theories always yield a complex ǫeff , where the imaginary part represents radiation
losses rather than absorption. However, Bohren [30] has pointed out that unlike the
original MG theory, the extended theories do not always obey the scaling law, in the
sense that ǫi → αǫi, ǫh → αǫh does not necessarily lead to ǫeff → αǫeff , except when
x→ 0, warranting a certain degree of caution in their usage. All the extended versions
of the MG theory tend to the correct limit as the size parameter x → 0. Lamb et.
al. [31] have shown that MG theories are appreciably affected for filling fractions larger
than 0.3 - 0.5 in a periodic simple cubic structure or an aperiodic structure.

Homogenization of Metamaterials 9
(ii) Bruggeman theory: The Bruggeman theory is conceptually somewhat different
from the MG theory. A typical element of the two phase medium is assumed to be
embedded in an effective medium whose properties are to be determined self-consistently.
A self-consistent solution is obtained by solving for the local field around the element
and demanding that the fluctuations of the local field around its effective value should
average to zero. The following relation [32] defines the effective permittivity in this case:
fǫi − ǫeffǫi + 2ǫeff
+ (1 − f)ǫh − ǫeffǫh − ǫeff
= 0 (1.11)
Both these theories, in their original form, neglect the role of the distorted near field
for the particles as well as their retarded induced polarization. These effects may become
significant for higher filling fractions [32]. In essence, these theories are quasistatic
theories whose applicability is limited to grain sizes ≪ λ.
1.2.2 Homogenization theories
(i) Homogenization by field averaging methods: Here, we discuss a method which was
used by Pendry et. al. [10, 33] in deriving the effective medium properties of periodic
artificial magnetic structures. This technique is based on averaging the local fields
according to
H ieff =
1
a
∫
H · dxi, Eieff =
1
a
∫
E · dxi, (1.12)
Dieff =
1
a2
∫
D · dSi, Bieff =
1
a2
∫
B · dSi. (1.13)
Eeff and Heff are defined by averaging E and H along the sides of the unit cell, while
Deff and Beff are defined by averaging D and B over the appropriate faces of the unit
cell (Fig. 1.3). These quantities represent a set of averaged fields which may replace the
local fields that vary throughout the unit cell. The unit cell should not intersect any
of the structures contained within it, in order to preserve the continuity of the parallel
components of Eeff and Heff .
10 Introduction
y
(a, 0, 0)
(0, 0, a)
x
z
S
S S
z
xy
Figure 1.3: One of the procedures for averaging the local fields inside a metamaterialand determining ǫeff and µeff consists of averaging the E and the H fields over the edgesof the cubic unit cell, along with averaging the D and the B fields over the appropriatefaces of the unit cell.
Ideally a should be negligibly small with respect to the wavelength. However, even
though this condition may not be satisfied exactly, the procedure can still be applied
to obtain useful (and consistent) information about the properties of the (effective)
medium on many occasions.
(ii) Homogenization using the reflection and transmission coefficients: In an exper-
iment performed to investigate the effective-medium behaviour of a metamaterial, the
quantities usually measured are the reflection coefficient R and the transmission coef-
ficient T. Smith et. al [34] inverted the classical relations for R and T for a slab of
isotropic and homogeneous material of thickness d to obtain
T =
[
cos(nkzd) −i
2(Z +
1
Z) sin(nkzd)
]−1
e−ikzd, (1.14)
R =−i2
(Z − 1
Z) sin(nkzd)Te
−ikzd, (1.15)
where Z and n are the effective impedance and the effective refractive index of the

Homogenization of Metamaterials 11
medium, respectively. Further, inverting the above relations, they obtained:
n = ± arccos(1 − r2 − t2
2t), (1.16)
Z = ±[
(1 + r)2 − t2
(1 − r)2 − t2
]1/2
. (1.17)
Here, r = R and t = T exp(ikzd). Finally, ǫeff and µeff can be obtained as:
ǫeff =n
Z, µeff = nZ. (1.18)
Since n and Z are complex functions with multiple branches, their values have an in-
herent ambiguity. This is resolved by determining them for several slab thicknesses and
requiring a continuous function for epsiloneff and µeff with frequency. Any other ambi-
guity is usually resolved by demanding that Re(Z) > 0 and Im(n) > 0 for absorptive,
causal media. However, there remains an ambiguity in the phase factor for reflected
waves due to the choice of an appropriate reference plane. Another interesting feature
that crops up is the appearance of Im(µeff) < 0 with Re(ǫeff) < 0 or Im(ǫeff) < 0 with
Re(µeff) < 0 for negative permittivity and negative permeability metamaterials respec-
tively. According to Soukoulis et. al., this antiresonant behaviour [35] appears to be
an intrinsic property of the retrieved parameters of a metamaterial, occuring because of
finite spatial periodicity, which also sets a maximal wave number kmax = π/a (assum-
ing the periodicity to be a). This sets an upper bound on the value of n the effective
medium can have. Although surprising, antiresonant behaviour does not violate any
physical principle as long as the total energy dissipated inside the medium
W =1
4π
∫
dω ω[
Im[ǫeff(ω)]|E(ω)|2 + Im[µeff(ω)]|H|2]
> 0. (1.19)
This condition does not require Im[ǫeff(ω)] and Im[µeff(ω)] to be simultaneously positive.
However, it should be noted that many other factors such as anisotropy and bianisotropy
are usually neglected in the above retrieval procedure and this affects the retrieved
parameters.
12 Introduction
Chen et. al [36] have suggested an improved method for determining the effective
medium parameters using the S-parameters for a metamaterial slab. As the method pro-
posed by Smith and others may not yield unambiguous results if the effective boundaries
of the slab have not been determined correctly, they proposed the use of an optimization
procedure for determining these. While the unit cell boundaries may be considered to be
the effective slab boundaries for 1-D metamaterials, the optimization procedure yields
better results for 2-D metamaterials or asymmetric unit cells. Further, they have also
stated that in certain cases, it is not possible to use the criterion Re(Z) ≥ 0 directly. In
such cases, the sign of Z has to be determined from the corresponding n by demanding
that Im(n) ≥ 0 for a passive metamaterial.
However, it is to be noted that in the case of the homogenizable metamaterials
studied in this thesis, the method of Smith et. al. was usually found to be adequate.
The situations where effective medium parameters were not retrieved have more to do
with the breakdown of the homogenization approach itself, rather than the inadequacy of
the procedure adopted. In such cases, information regarding the response of the system
was extracted from the band structures, the reflectivity-transmittivity spectra and/or
the field maps of the electric/magnetic fields.
1.2.3 Limitations of the effective medium approach
The effective medium theories detailed above have their own limitations. They have to
be applied carefully to the systems under consideration, keeping in mind the fact that
a blind implementation of the procedures may not lead to consistent physical results.
We list some of the major limitations of effective medium theories.
(i) Effective medium theories become invalid when the underlying metallic inclusions
are not much smaller than the effective wavelength in the medium. Examples of such
systems include metamaterials whose unit cells are significantly large at the frequencies
of interest and photonic crystals. In some cases, the periodicity of the structure may
also affect the retrieved values of µeff and ǫeff .
(ii) Further, homogenization cannot be carried out if the wave propagation inside the

Negative Material Parameters 13
medium cannot be described by a single propagating mode.
Failure to comply with these two conditions may result in the formation of unphysical
numerical artifacts such as the antiresonant behaviour [35], which has been attributed
to the periodicity of the underlying structure. Most metamaterials demonstrated have
a structural size of ∼ λ/6, although conservative estimates demand them to be much
smaller.
For consistency, the retrieved parameters themselves may be verified by compar-
ing results obtained using several retrieval methods. This is particularly true for the
retrieval methods which use quantities like R and T and those utilizing the internal
fields. In the former case, the retrieved parameters should be independent of the angle
of incidence while in the latter case, they must be independent of the volume element
considered. Even in the cases where the medium is not strictly homogenizable, a set of
restricted equivalent medium parameters may be defined for specific angles of incidence.
However, these quantities cannot be used for consistently calculating other properties
of the medium such as the heating rate. The extended MG theories are examples of
restricted effective medium theories [28]. Spatial dispersion may also occur in the long
wavelength limit for wire array metamaterials for radiation incident obliquely. In such
cases, it has been argued that the spatial dispersion should be incorporated into the
effective medium model [37].
1.3 Negative Material Parameters
1.3.1 Negative Permittivity
At optical frequencies, many metals have a negative permittivity, as the conduction
electrons can be assumed to be free against a background of static positive ions. This
is responsible for the plasma-like behaviour of metals and the associated negative per-
mittivity at frequencies below the plasma frequency. Upto the plasma frequency, the
plasma prevents electromagnetic radiation from penetrating into the metal. The Drude
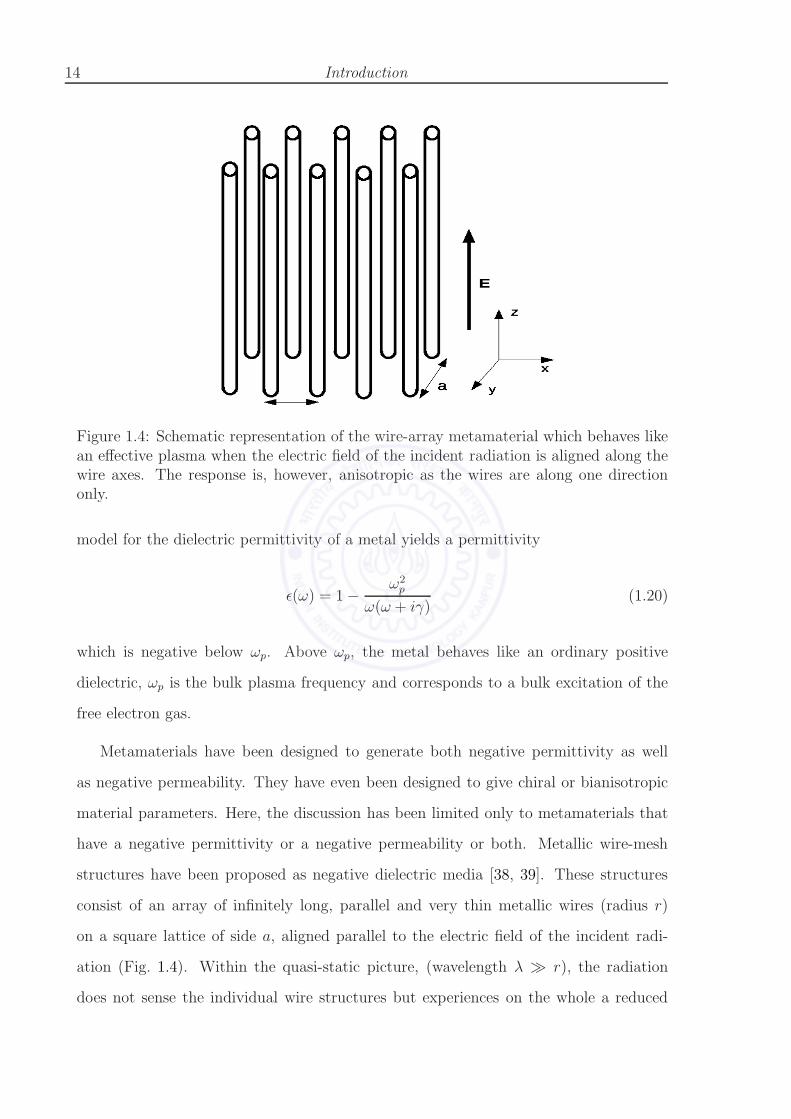
14 Introduction
Figure 1.4: Schematic representation of the wire-array metamaterial which behaves likean effective plasma when the electric field of the incident radiation is aligned along thewire axes. The response is, however, anisotropic as the wires are along one directiononly.
model for the dielectric permittivity of a metal yields a permittivity
ǫ(ω) = 1 −ω2
p
ω(ω + iγ)(1.20)
which is negative below ωp. Above ωp, the metal behaves like an ordinary positive
dielectric, ωp is the bulk plasma frequency and corresponds to a bulk excitation of the
free electron gas.
Metamaterials have been designed to generate both negative permittivity as well
as negative permeability. They have even been designed to give chiral or bianisotropic
material parameters. Here, the discussion has been limited only to metamaterials that
have a negative permittivity or a negative permeability or both. Metallic wire-mesh
structures have been proposed as negative dielectric media [38, 39]. These structures
consist of an array of infinitely long, parallel and very thin metallic wires (radius r)
on a square lattice of side a, aligned parallel to the electric field of the incident radi-
ation (Fig. 1.4). Within the quasi-static picture, (wavelength λ ≫ r), the radiation
does not sense the individual wire structures but experiences on the whole a reduced

Negative Material Parameters 15
Figure 1.5: Schematic diagram of a wire array metamaterial consisiting of a three-dimensional lattice of connected wires which behaves like an effective, isotropic artificialplasma. In the case of a similar configuration of unconnected wire, spatial dispersionbecomes an important issue.
average charge density. In addition, the large inductance of the thin wires for the cur-
rents induced makes it appear as though the electrons have acquired a large effective
mass. These two effects result in an effective plasma-like response with a much lower
plasma frequency. Neglecting the effect of the finite conductivity of the wires (and hence
dissipative losses), one obtains [15]
ǫ(ω) = 1 − 2πc2
ω2a2 ln(a/r)(1.21)
where the plasma frequency ω2p = 2πc2/a2 ln(a/r). Assuming the wires to have a finite
conductivity σ, the preceding expression gets modified to yield [15]
ǫ(ω) = 1 −ω2
p
ω2 + i(ǫ0a2ω2p/πr
2σ)ω(1.22)
This medium is anisotropic with negative permittivity only for waves with the electric
field aligned parallel to the wires. To achieve a reasonably isotropic response, meshes of
wires oriented along all the three orthogonal directions are required (Fig. 1.5). Connec-

16 Introduction
Figure 1.6: Schematic diagram of the cut-wire metamaterial whose response is akin to anarray of periodically-placed electric dipoles.The metamaterial has an effective Lorentzpermittivity with a negative permittivity band.
tivity of the wires in the three directions is required to form a truly three-dimensional
low frequency plasma. The effects of the connectivity of the wires has also been in-
vestigated by several researchers, with the issues of strong spatial dispersion playing
a more important role for meshes made of unconnected wires [39, 37]. However, the
fabrication of three-dimensional connected wires is difficult and this poses a barrier for
mass production. The polarization induced in the direction orthogonal to the wires is
also small and can be neglected for very thin wires (r ≪ λ). The waves, which sense
only the wires parallel to the electric field, thus have a longitudinal mode. Schurig et.
al. have proposed an inductive capacitive resonator with a strong electric response, as
an alternative to wire media [40].
Instead of having extremely long (‘infinite’) wires, one can also have arrays of dis-
continuous conducting wire segments (‘cut wires’), as shown in Fig. 1.6. The main
difference between this configuration and the previous one is due to the capacitance
between adjacent wire segments. Neglecting the thickness of the wires and their self
capacitance, assuming that the length of each segment, ℓ ≫ d, the distance between
adjacent segments, the following expression for the effective permittivity may be ob-
tained [41]:
ǫ(ω) = 1 +ω2
p
ω20 − ω2 − iΓω
. (1.23)

Negative Material Parameters 17
Here, ω0, the resonance frequency and Γ, the dissipation factor, are given by
ω0 =
√
2πc2d
ǫhA(ℓ + d) ln(a/r), (1.24)
Γ =a2ǫ0ω
2p
πr2σ, (1.25)
respectively. In the preceding expression, ǫh and A denote the permittivity of the
medium in the capacitive gaps while A is the cross-sectional area of each cut face of the
wire segment. Thus, the ‘cut wire’ metamaterial exhibits a Lorentz-type permittivity
with a negative permittivity band over the frequency interval[
ω0,√
ω20 + ω2
p
]
. Since
dipole moments can be formed across the gaps between the segments, the response of
the medium is akin to an array of periodically placed dipoles.
1.3.2 Negative Permeability
The magnetic response of most natural materials begins to tail off at frequencies in the
GHz range. Further, materials such as ferrites, which remain moderately active upto
frequencies of about 100 GHz, are often heavy and do not have suitable mechanical
properties. Thus, while it is extremely difficult to even obtain a magnetic response at
microwave frequencies, obtaining a negative permeability is much more so. Landau and
Lifshitz [42] have shown how the magnetic activity arising due to orbital currents at
optical frequencies should be negligible. It is to be noted, however, that their treatment
neglects the polarization currents in the system.
Metamaterials have come to play an important role in this context. Structured
materials with considerable magnetic activity (both paramagnetic and diamagnetic)
can be designed for operation at a desired frequency. Pendry et. al. [10] have shown
that is possible to generate a resonant magnetic response and hence, a negative effective
permeability µeff , by means of appropriately designed metamaterials. In the case of these
structured media, the magnetic moments of the induced real and displacement current
distributions contributes to an effective magnetization, if the electric polarizability of

18 Introduction
Figure 1.7: An array of metallic cylinders which effectively has a diamagnetic magneticresponse, but cannot possess a negative permeability.
the medium is low.
An Array of Metal Cylinders: While most materials tend to be diamagnetic
naturally as a consequence of Lenz’s law, an array of metallic cylinders can be used to
produce an effective diamagnetic response [10]. The model is shown in Fig. 1.7. The
magnetic field along the cylinder axes induces circumferential surface currents which
generate an opposing magnetization. Assuming a uniform depolarizing field and fre-
quencies low enough so that the skin effect is small, the effective relative permeability
of the medium is [10]
µeff(ω) = 1 − πr2/a2
1 + i(2ρ/µ0ωr). (1.26)
Here ρ is the resistance per unit length of the cylinder. Thus, the response of this medium
is diamagnetic. But it is not sufficient to generate negative magnetic permeability. The
limitations of this structure were overcome by including capacitive elements into this
structure, as discussed below.
The Split Ring Resonator (SRR): Split Ring Resonators form the structural and
functional unit of most of the metamaterials that exhibit negative permeability today.
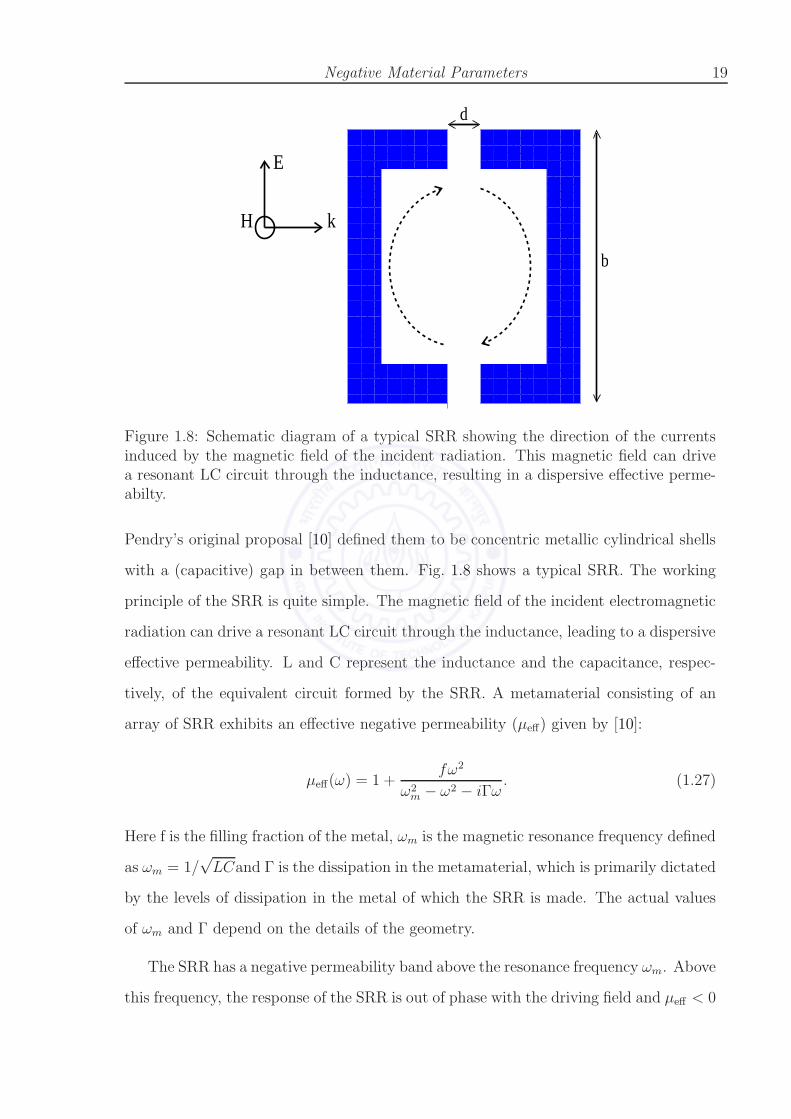
Negative Material Parameters 19
E
k H
b
d
Figure 1.8: Schematic diagram of a typical SRR showing the direction of the currentsinduced by the magnetic field of the incident radiation. This magnetic field can drivea resonant LC circuit through the inductance, resulting in a dispersive effective perme-abilty.
Pendry’s original proposal [10] defined them to be concentric metallic cylindrical shells
with a (capacitive) gap in between them. Fig. 1.8 shows a typical SRR. The working
principle of the SRR is quite simple. The magnetic field of the incident electromagnetic
radiation can drive a resonant LC circuit through the inductance, leading to a dispersive
effective permeability. L and C represent the inductance and the capacitance, respec-
tively, of the equivalent circuit formed by the SRR. A metamaterial consisting of an
array of SRR exhibits an effective negative permeability (µeff) given by [10]:
µeff(ω) = 1 +fω2
ω2m − ω2 − iΓω
. (1.27)
Here f is the filling fraction of the metal, ωm is the magnetic resonance frequency defined
as ωm = 1/√LCand Γ is the dissipation in the metamaterial, which is primarily dictated
by the levels of dissipation in the metal of which the SRR is made. The actual values
of ωm and Γ depend on the details of the geometry.
The SRR has a negative permeability band above the resonance frequency ωm. Above
this frequency, the response of the SRR is out of phase with the driving field and µeff < 0

20 Introduction
Figure 1.9: A pictorial depiction of a SRR-based metamaterial showing the arrangementof the SRR, periodically in the horizontal plane and stacked up in the vertical direction.The medium displays uniaxial magnetic activity and a negative magnetic permeabilitywhen the magnetic field is oriented along the (common) cylindrical axis of the SRRs.
up to a magnetic plasma frequency ωmp. This leads to a gap in the dispersion relation for
ωm < ω < ωmp. The appearance of the bulk longitudinal magnetic plasma mode at ωmp
(due to the induced currents), mimics the presence of free magnetic poles. The nature
of the resonance depends upon the metal used for fabricating the SRR. The resistivity
of the metal, in general, broadens the resonance, while for extremely resisitive materials,
the resonance may be so highly damped that the region of negative µeff can disappear
altogether. The SRR-based metamaterials (as shown schematically in Fig. 1.9) produce
a uniaxial magnetic response when the magnetic field of the radiation is oriented along
the axis of the SRR. Thus, the magnetic response in the other directions is nearly zero.
This highly anisotropic response was sought to be rectified by interleaved orthogonal
planes of planar SRRs [10]. Balmaz and Martin [43] proposed a novel configuration
consisting of two orthogonal intersecting SRR. This has a reasonably isotropic response
for any wave incident on it normal to the plane of the rings.

Negative Material Parameters 21
1.3.3 SRRs and scaling
The SRR forms an almost model system for studying the origin and the nature of
the magnetic response of metamaterials. Circuit models in the quasi-static limit have
been developed to explain the resonant magnetic nature of their response to incident
radiation and their behaviour at microwave frequencies is in remarkable agreement with
these theoretical models. As described earlier, their resonant behaviour can be ascribed
to an internal inductance (L) and capacitance (C) within each element and they exhibit
a resonant magnetic permeability of the form of Eq. 1.27. As mentioned earlier, the
width of the resonance and the modulation extent of the negative µ band are primarily
determined by the intrinsic levels of dissipation in metal.
SRRs can be suitably designed for operating at any desired frequency. Maxwell’s
equations appear to suggest that one can increase the operating frequencies by merely
scaling down the size of the structures. As an example, one can consider the case
where the structural dimensions are halved as the unit cell becomes smaller. If the SRR
is considered to be a series LC circuit, the resonance frequency is expected to double
every time. However, this does not happen at high frequencies and in fact, the resonance
frequency begins to saturate as the structural dimensions are reduced [44].
1.3.4 Scaling to high frequencies
The behaviour of SRR-based magnetic metamaterials at high frequencies shows sig-
nificant deviations from their behaviour at lower frequencies. The simplistic idea of
reducing the length-scales involved for obtaining a magnetic resonance at high frequen-
cies does not work. The main problem is due to the fact that at high frequencies, metals
no longer behave as perfect conductors and electromagnetic fields begin to penetrate
into the metal. At these frequencies, the dispersive nature of the metal itself needs to
be taken into account. The deviations from the ideal behaviour may be explained by
means of a simple model [15, 44] considering the circular metallic resonator shown in
Fig. 1.10.
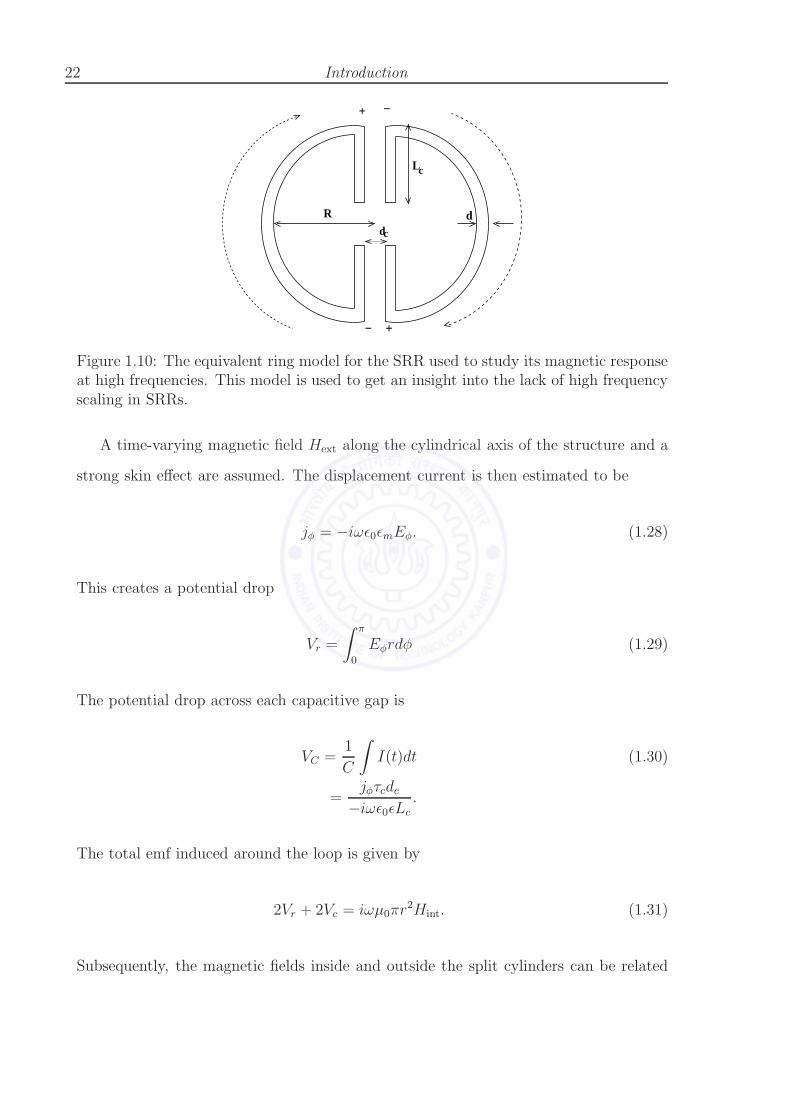
22 Introduction
dc
L
R
c
+ −
− +
d
Figure 1.10: The equivalent ring model for the SRR used to study its magnetic responseat high frequencies. This model is used to get an insight into the lack of high frequencyscaling in SRRs.
A time-varying magnetic field Hext along the cylindrical axis of the structure and a
strong skin effect are assumed. The displacement current is then estimated to be
jφ = −iωǫ0ǫmEφ. (1.28)
This creates a potential drop
Vr =
∫ π
0
Eφrdφ (1.29)
The potential drop across each capacitive gap is
VC =1
C
∫
I(t)dt (1.30)
=jφτcdc
−iωǫ0ǫLc.
The total emf induced around the loop is given by
2Vr + 2Vc = iωµ0πr2Hint. (1.31)
Subsequently, the magnetic fields inside and outside the split cylinders can be related

Negative Material Parameters 23
to each other as:
Hext
Hint= 1 − µ0ǫ0ω
2πr2τc(2πr/ǫm + 2τcdc/ǫLc)
(1.32)
Next, considering the averaged magnetic induction
Beff = µ0Hint + (1 − f)µ0Hext (1.33)
and the effective magnetic field
Heff = Hext, (1.34)
the following expression for the effective permeability is obtained:
µeff =Beff
µ0Heff(1.35)
= 1 +fµ0ǫ0ω
2πr2
[(2πr/ǫmτc) + 2dc/ǫLc] − ǫ0µ0ω2πr2τc
Most metals have a plasma-like dispersion at high frequencies. One can safely approxi-
mate the dielectric permittivity of the metal by
ǫm(ω) ≃ −ω2
p
ω(ω + iγ). (1.36)
when the frequency is small compared to ωp and the magnitude of the background
permittivity is small in comparison. Defining two new quantities, viz., the inertial and
the geometric inductance given by the expressions
Li =2πr
ǫ0τcω2p
, (1.37)
Lg = µ0πr2, (1.38)

24 Introduction
the effective permeability can be written as [44]
µeff = 1 − f ′ω2
ω2 − ω20 + iΓ′ω
. (1.39)
Here, f ′, ω0 and Γ′ are the quantities:
ω0 =1
√
(Li + Lg)C(1.40)
Γ′ =Li
Li + Lgγ (1.41)
f ′ =Lg
Li + Lgf. (1.42)
The inertial inductance arises solely due to the electronic mass since ω2p = Ne2/mǫ0,
where N and m are the electron density and the electron mass, respectively. In addition,
the effective damping factor also increases and resistive losses become more effective,
resulting in the broadening of the response. Thus, even if the size of the SRR unit is
reduced, the inertial inductance would still be present, preventing scaling of the oper-
ating frequencies beyond a certain limit, while the accompanying increase in damping
may cause the region of negative permeability to vanish altogether. However, it is still
possible to salvage the situation to some extent by adding more capacitive gaps to the
SRR. It is to be noted that although the ring model accounts for the lack of scaling
in SRR, it does not take into consideration the stray capacitance in the system which
causes the resonance frequency to be lower than than the value predicted by circuit
theory. Further, there is always the chance that unless designed carefully, the size of the
unit cell may become comparable to the free space wavelength at resonance, resulting
in the breakdown of effective medium theories.
Bianisotropy in SRR media
A bianisotropic medium is one characterised by constitutive relations of the form
D(x, ω) = ǫ · E(x, ω) + α · B(x, ω), (1.43)
H(x, ω) = β · E(x, ω) + ˜µ−1 ·B(x, ω). (1.44)

Negative Material Parameters 25
(b) (c)(a) + + + +− − − − + + + + + + + +
+ + + +
− − − − − − − −
− − − −
+ + + + − − − −
Figure 1.11: (a) and (b): Bianisotropic SRRs of square cross-section showing the pos-sibility of the development of a net electric dipole moment even when the systems aredriven by a magnetic field. The symmetric SRR in (c) is not bianisotropic due to thecancellation of the dipoles arising due to the charge distribution.
Here, ǫ is the permittivity dyadic, µ is the permeability dyadic, while α and β are the
magnetoelectric dyadics. A bianisotropic medium provides cross-coupling between elec-
tric and magnetic fields. When placed in an electric or a magnetic field, a bianisotropic
medium becomes both polarized and magnetized simultaneously.
A split-ring resonator with a single split is bianisotropic as a large electric dipole
moment is generated across the capacitive gap. This could very well overshadow the
weaker magnetic response of the SRR. As a result, a low electrical polarizability of the
ring is preferred. Symmetric SRRs with two splits are not bianisotropic as the dipole
moments across opposite ends cancel each other leaving behind only a weaker electric
quadrupole moment (See Fig. 1.11). The original SRR proposed by Pendry [10], is also
bianisotropic as it develops an electric polarization (which can also be driven by the
electric field) in between the two split rings.
The electric dipole moments formed in the single split rings can be nullified by
rotating adjacent SRRs in the arrays by 180 degrees. However, this results in doubling
the unit cell size. Thus, bianisotropy in SRRs can be minimized by either a single
symmetric SRR or by arranging SRRs symmetrically within the array so that the net
dipole moment cancels out. At high frequencies, when the SRR unit cell size becomes
comparable to the wavelength, some of the responses of symmetric SRRs appear similar
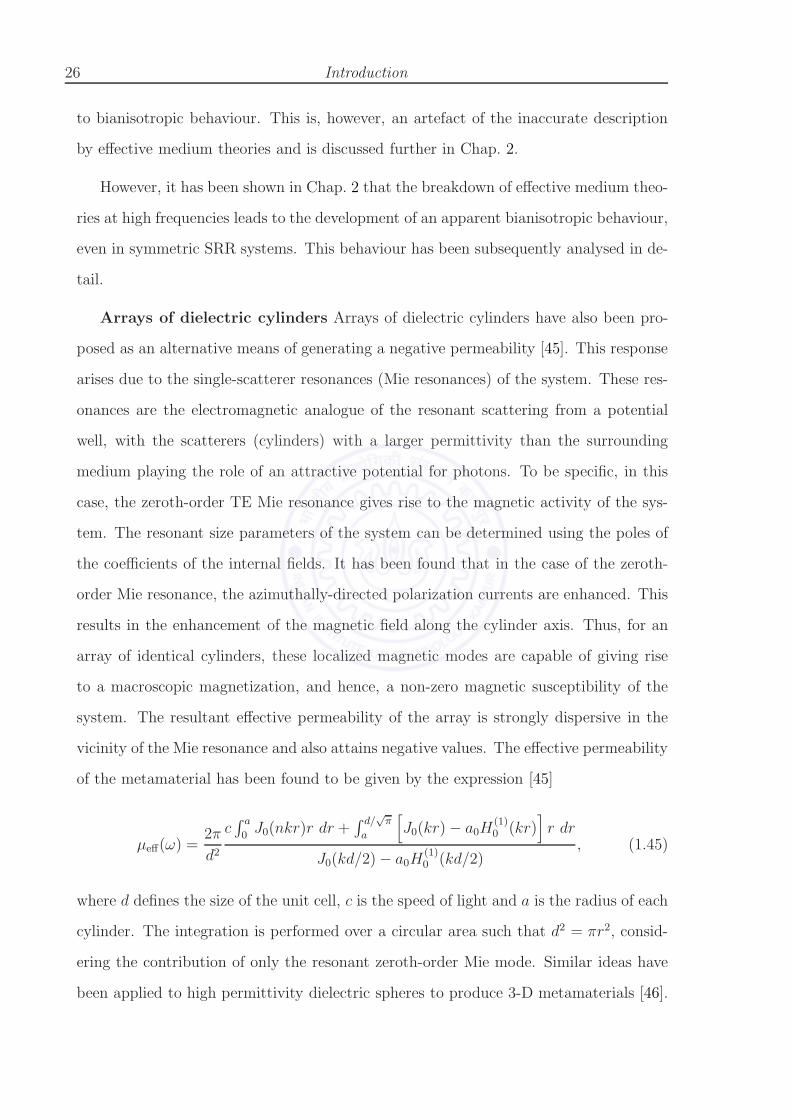
26 Introduction
to bianisotropic behaviour. This is, however, an artefact of the inaccurate description
by effective medium theories and is discussed further in Chap. 2.
However, it has been shown in Chap. 2 that the breakdown of effective medium theo-
ries at high frequencies leads to the development of an apparent bianisotropic behaviour,
even in symmetric SRR systems. This behaviour has been subsequently analysed in de-
tail.
Arrays of dielectric cylinders Arrays of dielectric cylinders have also been pro-
posed as an alternative means of generating a negative permeability [45]. This response
arises due to the single-scatterer resonances (Mie resonances) of the system. These res-
onances are the electromagnetic analogue of the resonant scattering from a potential
well, with the scatterers (cylinders) with a larger permittivity than the surrounding
medium playing the role of an attractive potential for photons. To be specific, in this
case, the zeroth-order TE Mie resonance gives rise to the magnetic activity of the sys-
tem. The resonant size parameters of the system can be determined using the poles of
the coefficients of the internal fields. It has been found that in the case of the zeroth-
order Mie resonance, the azimuthally-directed polarization currents are enhanced. This
results in the enhancement of the magnetic field along the cylinder axis. Thus, for an
array of identical cylinders, these localized magnetic modes are capable of giving rise
to a macroscopic magnetization, and hence, a non-zero magnetic susceptibility of the
system. The resultant effective permeability of the array is strongly dispersive in the
vicinity of the Mie resonance and also attains negative values. The effective permeability
of the metamaterial has been found to be given by the expression [45]
µeff(ω) =2π
d2
c∫ a
0J0(nkr)r dr +
∫ d/√
π
a
[
J0(kr) − a0H(1)0 (kr)
]
r dr
J0(kd/2) − a0H(1)0 (kd/2)
, (1.45)
where d defines the size of the unit cell, c is the speed of light and a is the radius of each
cylinder. The integration is performed over a circular area such that d2 = πr2, consid-
ering the contribution of only the resonant zeroth-order Mie mode. Similar ideas have
been applied to high permittivity dielectric spheres to produce 3-D metamaterials [46].
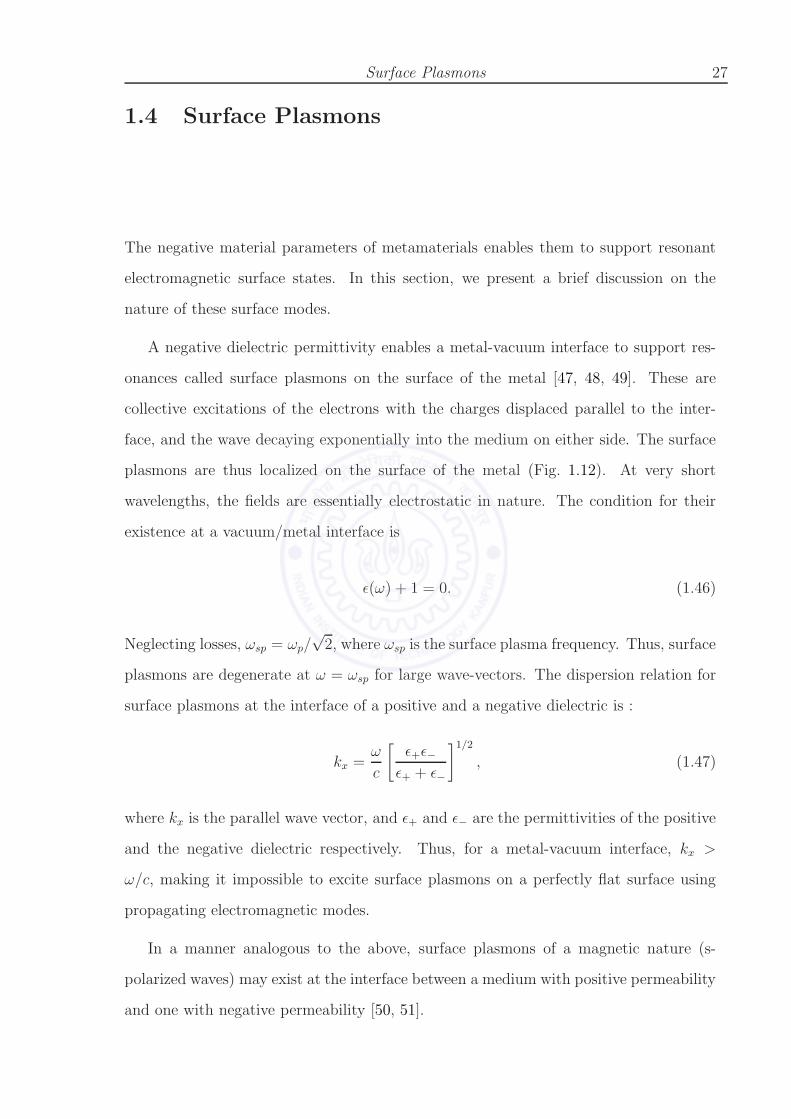
Surface Plasmons 27
1.4 Surface Plasmons
The negative material parameters of metamaterials enables them to support resonant
electromagnetic surface states. In this section, we present a brief discussion on the
nature of these surface modes.
A negative dielectric permittivity enables a metal-vacuum interface to support res-
onances called surface plasmons on the surface of the metal [47, 48, 49]. These are
collective excitations of the electrons with the charges displaced parallel to the inter-
face, and the wave decaying exponentially into the medium on either side. The surface
plasmons are thus localized on the surface of the metal (Fig. 1.12). At very short
wavelengths, the fields are essentially electrostatic in nature. The condition for their
existence at a vacuum/metal interface is
ǫ(ω) + 1 = 0. (1.46)
Neglecting losses, ωsp = ωp/√
2, where ωsp is the surface plasma frequency. Thus, surface
plasmons are degenerate at ω = ωsp for large wave-vectors. The dispersion relation for
surface plasmons at the interface of a positive and a negative dielectric is :
kx =ω
c
[
ǫ+ǫ−ǫ+ + ǫ−
]1/2
, (1.47)
where kx is the parallel wave vector, and ǫ+ and ǫ− are the permittivities of the positive
and the negative dielectric respectively. Thus, for a metal-vacuum interface, kx >
ω/c, making it impossible to excite surface plasmons on a perfectly flat surface using
propagating electromagnetic modes.
In a manner analogous to the above, surface plasmons of a magnetic nature (s-
polarized waves) may exist at the interface between a medium with positive permeability
and one with negative permeability [50, 51].

28 Introduction
+ − − + + − − + +
x k x
Κ +
Κ −
−k
y z
x
Figure 1.12: A surface plasmon at the interface between positive and negative dielectricmedia, showing the exponential decay of the fields perpendicular to the interface betweenthe two media. The surface plasmon mode itself propagates along the interface.
1.4.1 The role of surface plasmons in the perfect lens
Surface plasmon modes play a crucial role in the subwavelength focussing action of a
perfect lens. As already mentioned, the amplification of evanescent waves occurs by
means of these modes. The conditions satisfied in the perfect lens, viz., ǫ+ = ǫ−, µ+ =
−µ−, are ideal for the excitation of surface plasmons of electric or magnetic nature, for
the incident p-polarized or s-polarized waves, respectively. When these conditions are
satisfied simultaneously at a single frequency ω, we have:
(k2x − ǫ+µ+k
20)
1/2
ǫ++
(k2x − ǫ−µ−k
20)
1/2
ǫ−= 0, (1.48)
(k2x − ǫ+µ+k
20)
1/2
µ++
(k2x − ǫ−µ−k
20)
1/2
µ−= 0, (1.49)
where k0 = ω/c.
These relations are satisfied for all kx and thus, the plasmon modes (of both kinds)
become degenerate. The presence of the second interface detunes the plasmons on each
interface so that that the fields of the surface plasmon exactly cancel the incident field
just after the first boundary of the slab, while the fields of the two surface plasmons

Surface Plasmons 29
again cancel exactly just before the slab (for zero reflectivity). This coherent action
of the surface plasmon fields results in the perfect lens action (see [15] and references
therein).
1.4.2 Plasmon resonances in small particles
Plasmonic resonances in small particles are examples of highly localized surface plas-
mons, which give rise to interesting absorption spectra very different from the behaviour
of the bulk material. In the case of metallic particles, the deviations from the behaviour
of the bulk metal are even more distinct. The intense shape-dependent absorption spec-
tra can be described adequately using classical electromagnetic theory [52]. Mie theory
predicts the existence of certain complex frequencies at which the scattering coefficient
diverges [53]. The modes associated with these frequencies are thus virtual. Neverthe-
less, at real frequencies close to these complex frequencies, the scattering coefficients
are large. The modes associated with these frequencies are the surface modes and they
occur at specific frequencies for particles of specific shapes. The lowest frequency mode
is known as the Frohlich mode. For example, in the case of spherical particles, a surface
mode exists when the condition [53, 52]
ǫm + 2ǫb = 0, (1.50)
where ǫm = ǫ′m+iǫ′′m is the permittivity of the metal (adequately described by the Drude
theory) and ǫb is the permittivity of the background medium. Thus, the condition for
the existence of the surface mode is
Re[ǫm] + 2ǫb = 0, Im[ǫm] ≃ 0. (1.51)
Similarly, for cylindrical particles, a surface mode exists when [53, 52]
ǫm + ǫb = 0. (1.52)
30 Introduction
These conditions can also be obtained in a simpler manner using electrostatics [52].
1.5 Coherent optical effects in atomic and molecular
media
One of the primary aims of this thesis is to propose controlling the metamaterial response
at optical and NIR frequencies by embedding them in resonant dielectric media. Thus,
one uses effects like coherent control, Electromagnetically Induced Transparency and
Raman processes, which are explained purely from the standpoint of quantum mechan-
ics, to actively control the resonant behaviour of metamaterials, which are geometric in
origin and can be treated classically within the framework of Maxwell’s equations. Some
of these phenomena, which have been used in subsequent chapters, have been described
in this section.
1.5.1 Coherent control
Quantum mechanical transitions naturally permit a picture akin to wave phenomena
which can be subject to constructive and destructive interferences. This is a consequence
of the fundamental principle of superposition of quantum states. Thus, in principle,
quantum phenomena of any kind are amenable to control by coherent optical radiation.
The theoretical possibilities that have been presented for coherent control are quite
spectacular. In fact, calculations have suggested and experiments have demonstrated
that appropriate laser pulses or pulse sequences can be used to break strong bonds,
force molecules to climb anharmonic ladders, change reaction pathways, transform local
modes into energy eigenstates, etc [54]. A variety of control schemes with multiple lasers
have been suggested. These involve the manipulation of competing interfering pathways
to a final state resulting in either a constructive or destructive interference leading to the
enhancement or the suppresion of the transition [55]. Typically, the two pathways may
differ by accessing different intermediate states, requiring the use of several control fields

Coherent optical effects in atomic and molecular media 31
coherently phase-locked together. For simple systems with a relatively lesser number
of isolated intermediate and final states, this scheme is an attractive one for practical
implementation. However, the situation is greatly complicated in the case of polyatomic
molecules which can have a great many potentially different interfering pathways.
The essential process for achieving control within the framework of quantum mechan-
ics consists of the active manipulation of the probability amplitudes of the transition
pathways resulting in constructive or destructive interference. The final state itself may
be a coherent superposition of several eigenstates. It should be noted that successful
control over these processes will be determined by the delicate destructive and construc-
tive interference of the multiple pathways. In order to observe these interferences, the
pathways must have a definite phase relationship, i.e., they must be driven to coher-
ence. However, the presence of collisions and other mechanisms tend to destroy the
coherence. Historically, the first proposed scheme for coherent control was based on the
interference between several excitation paths leading to the same final state [56, 57].
One path is excited by a multiphoton transition, while the other is excited by a one-
photon transition, with the latter photons being harmonically generated from the first
ones. This ensures that the final state reached by both the paths have the same energy.
In addition, the coherence relationship between the electric fields is well-defined [58].
Coherent control may be used to produce remarkable changes in the optical properties
of atomic/molecular media. Among other effects, it has led to the demonstration of
the phenomena of Electromagnetically Induced Transparency (EIT) [59, 60], superlumi-
nal [61] and subluminal [62] propagation of light, stopped light [63, 64], enhanced index
of refraction [65, 66], etc.
1.5.2 Electromagnetically Induced Transparency
The linear response of an atom to light at a resonant frequency is described by the first
order susceptibility χ(1). The imaginary part of this quantity defines the absorption in
the medium while the real part determines the refractive index. The optical response
of an atomic/molecular medium can be modified by the laser-induced coherence of the

32 Introduction
ωp
|2>
|3>
Γ32
ωc
∆
|1>
∆1
Γ31
(b)(a)
|1>
2
Probe
Γd
(−)Γ (+)
d
|a >
|a >
(−)
(+)
Probe Pump
Figure 1.13: The level scheme for observing EIT in a three-level Λ system. Fig. (a)shows the Λ scheme for EIT in a three-level system when a strong control field is applied.Fig. (b) is the dressed state picture for the same scheme.
atomic states which leads to a quantum interference of excitation pathways that control
the optical response. Electromagnetically Induced Transparency uses this scheme to
eliminate the absorption and the refraction of light at a resonant frequency of a tran-
sition. Electromagnetically Induced (EIT) was proposed by Harris in 1989 [59]. The
essence of this phenomenon lies in the effect known as Coherent Population Trapping
(CPT), which was discovered by Alzetta et. al. [67] in 1976. The first experimental
demonstration of EIT was carried out by Boller et. al. [60] using optically opaque
strontium vapour with an atomic density of ∼ 5 × 1015cm−3. Fig. 1.13 and Fig. 1.14
illustrate the possible schemes for EIT to occur in an optically thick medium. Of these,
the first (the Λ configuration) is the most useful involving two ground states coupled
to an excited state, while the other two are of limited utility, due to the absence of a
metastable state [68].
The Λ configuration offers a pedagogic model for explaining the occurrence of EIT.
Let us consider the Λ scheme in some detail. The |1〉 → |2〉 transition is assumed to be
dipole forbidden. The idea of laser-dressed eigenstates of the three-level atom provides
a means of illustrating the connection between EIT and maximal coherence. Within
the dipole approximation, the atom-laser interaction is expressed in terms of the Rabi
frequency [69]
Ωc =~µ · Ec
~, (1.53)

Coherent optical effects in atomic and molecular media 33
|1>
|2>
|3>
|1>
|3>
|2>
(a) (b)
Pump
Probe
Probe
Pump
Figure 1.14: The ladder and the vee level schemes for EIT in three-level systems. Theseare hindered by the lack of a metastable state.
where Ec is the coupling electric field having a frequency ωc and ~µ is the transition
electric dipole moment across the |1〉 → |2〉 transition. The eigenstates of the total
Hamiltonian which includes this interaction are the dressed states [68]. One of these
states has the form |ψ0〉 = α|1〉 − β|2〉, the dark state, which contains no amplitude
of the state |3〉 and is effectively decoupled from the light fields. The occurrence of
EIT can be explained as the result of the system moving into the dark state |ψ0〉 under
the action of two laser fields satisfying the two-photon resonance condition and assisted
by the incoherent decays from the excited state. As the population is trapped in the
ground states |1〉 and |2〉, no absorption takes place. Thus, the population in the state
|3〉 is zero and there is no spontaneous emission or light scattering. For a weak probe,
the dark state |ψ0〉 tends towards the state |1〉 which is immune to any further probe
absorption. An alternative way to view this is as follows. The atomic system has two
ways of reaching the dissipative state |3〉. It can do so directly by the |1〉 → |3〉 transition
or via the path |1〉 → |3〉 → |2〉 → |3〉. Since Ωc is strong, the two paths are comparable
in amplitude and thus, they can exhibit strong quantum interference.
In actual atomic systems, the dephasing rate of the forbidden transition is non-zero
due to atomic collisions. All the important features of EIT remain observable inspite
of this as long as the control Rabi frequency is sufficiently large [68]. EIT effects can
be observed in dense atomic gases or even solids [70, 71], as long as their exists a
metastable transition with a dephasing rate much longer than that of the levels between
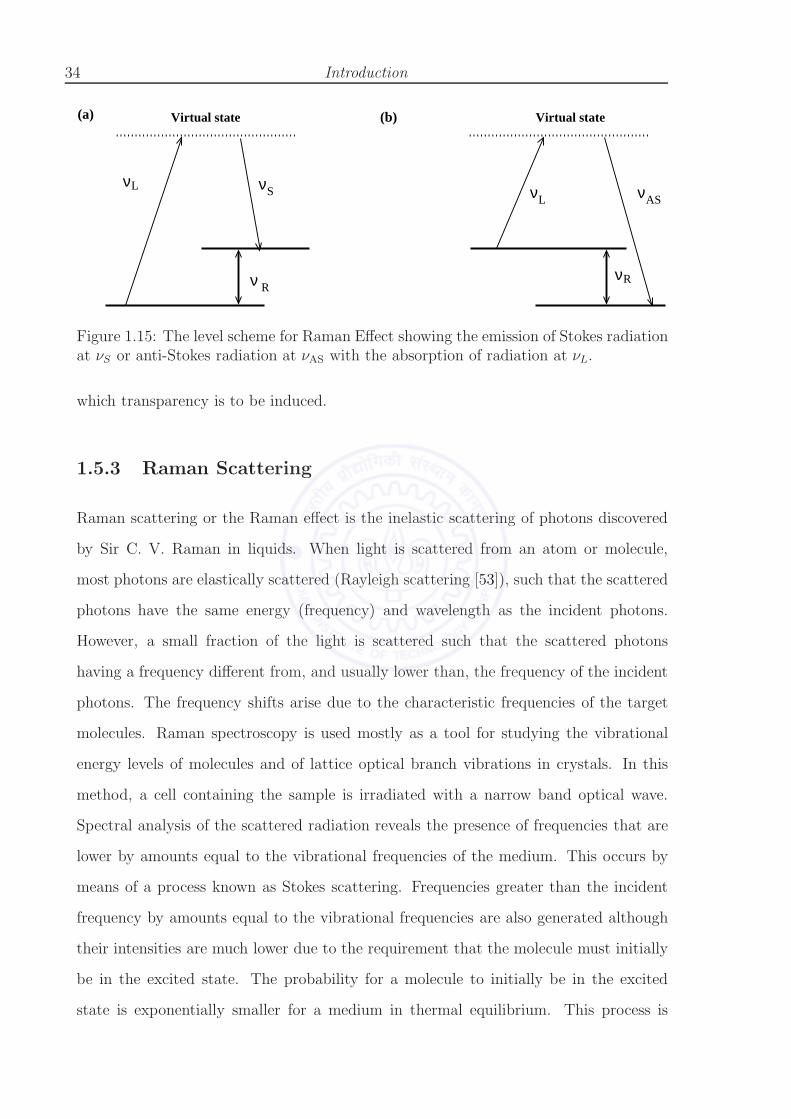
34 Introduction
(a) (b)
ν ν ν ν
ν
L
ν R
L AS
R
S
Virtual state Virtual state
Figure 1.15: The level scheme for Raman Effect showing the emission of Stokes radiationat νS or anti-Stokes radiation at νAS with the absorption of radiation at νL.
which transparency is to be induced.
1.5.3 Raman Scattering
Raman scattering or the Raman effect is the inelastic scattering of photons discovered
by Sir C. V. Raman in liquids. When light is scattered from an atom or molecule,
most photons are elastically scattered (Rayleigh scattering [53]), such that the scattered
photons have the same energy (frequency) and wavelength as the incident photons.
However, a small fraction of the light is scattered such that the scattered photons
having a frequency different from, and usually lower than, the frequency of the incident
photons. The frequency shifts arise due to the characteristic frequencies of the target
molecules. Raman spectroscopy is used mostly as a tool for studying the vibrational
energy levels of molecules and of lattice optical branch vibrations in crystals. In this
method, a cell containing the sample is irradiated with a narrow band optical wave.
Spectral analysis of the scattered radiation reveals the presence of frequencies that are
lower by amounts equal to the vibrational frequencies of the medium. This occurs by
means of a process known as Stokes scattering. Frequencies greater than the incident
frequency by amounts equal to the vibrational frequencies are also generated although
their intensities are much lower due to the requirement that the molecule must initially
be in the excited state. The probability for a molecule to initially be in the excited
state is exponentially smaller for a medium in thermal equilibrium. This process is
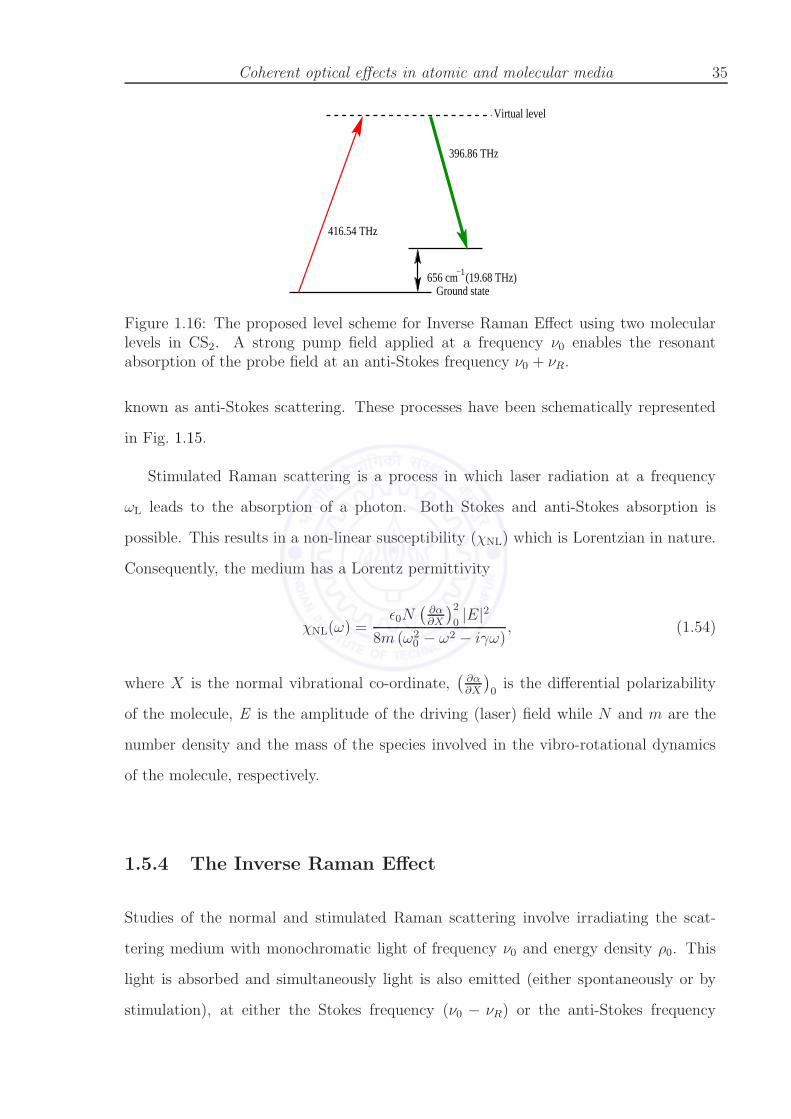
Coherent optical effects in atomic and molecular media 35
656 cm −1(19.68 THz)
Virtual level
Ground state
416.54 THz
396.86 THz
Figure 1.16: The proposed level scheme for Inverse Raman Effect using two molecularlevels in CS2. A strong pump field applied at a frequency ν0 enables the resonantabsorption of the probe field at an anti-Stokes frequency ν0 + νR.
known as anti-Stokes scattering. These processes have been schematically represented
in Fig. 1.15.
Stimulated Raman scattering is a process in which laser radiation at a frequency
ωL leads to the absorption of a photon. Both Stokes and anti-Stokes absorption is
possible. This results in a non-linear susceptibility (χNL) which is Lorentzian in nature.
Consequently, the medium has a Lorentz permittivity
χNL(ω) =ǫ0N
(
∂α∂X
)2
0|E|2
8m (ω20 − ω2 − iγω)
, (1.54)
where X is the normal vibrational co-ordinate,(
∂α∂X
)
0is the differential polarizability
of the molecule, E is the amplitude of the driving (laser) field while N and m are the
number density and the mass of the species involved in the vibro-rotational dynamics
of the molecule, respectively.
1.5.4 The Inverse Raman Effect
Studies of the normal and stimulated Raman scattering involve irradiating the scat-
tering medium with monochromatic light of frequency ν0 and energy density ρ0. This
light is absorbed and simultaneously light is also emitted (either spontaneously or by
stimulation), at either the Stokes frequency (ν0 − νR) or the anti-Stokes frequency

36 Introduction
(ν0 + νR) [72, 73], together with a change in the energy states of the atoms or the
molecules. Here, νR is the molecular level spacing of the medium. Jones and Stoich-
eff, [72], irradiated the scattering medium simultaneously with intense monochromatic
light of frequency ν0 and an intense continuum. They observed sharp and strong ab-
sorption lines at a frequency ν0 + νR (anti-Stokes) in the spectrum of the continuum
after it traversed the medium. This absorption, arising from stimulated Raman scat-
tering, has been called the ‘Inverse Raman Effect’ (Fig. 1.16). It is thus essentially
a competing process in which light at the anti-Stokes wavelength is attenuated in the
presence of an intense pump, as opposed to the Stokes gain in Raman amplification.
The Inverse Raman Effect and stimulated Raman scattering are corollary processes,
with similar spectral characteristics. The semiclassical theory of radiation can be used
to describe stimulated Raman scattering and the associated Inverse Raman effect by
using second-order perturbation methods [73].
A part of this thesis has been devoted to the study of the electromagnetic response
of composite metamaterials. The composite metamaterials investigate combine the at-
tributes of EIT and metamaterials, raising the possibility of dynamic control over their
behaviour. One simple design involves immersing the metamaterial in a dilute atomic
gas whose frequency-selective absorption can be exploited to manipulate the metamate-
rial response. Furthermore, a combination of light fields accords extra control over the
metamaterial via the absorption and dispersion of the atomic gas through the atomic co-
herence (quantum) route, based on effects like EIT. However, working at near-resonant
conditions necessarily involves a large dispersion with frequency accompanied by high
levels of dissipation. In this context, it has been shown that EIT-based control, which
exploits the large frequency-dispersion, provides substantially decreased loss which is
even lower than the metallic losses in a narrow-bandwidth regime. The large variation
of the refractive index of the EIT medium results in the freezing of currents in the
metallic inclusions of the metamaterial, thereby lowering loss. It has also been shown
to be of use in generating narrow switchable propagating bands in metamaterials which
behave like a dilute plasma. However, it must also be recognized that experimentally

Coherent optical effects in atomic and molecular media 37
implementing this scheme for controlling the response of metamaterials carries its own
challenges. In addition to the accurate fabrication of an appropriately designed meta-
material at the desired frequency, the limiting effects of the metallic inclusions on the
quantum phenomena must be overcome.


Chapter 2
Behaviour of Split-Ring Resonator
Metamaterials at High Frequencies
The possibility of obtaining a metamaterial with a resonant magnetic response and
negative refractive index at optical frequencies is a very exciting one. Most natural
materials have a relative magnetic permeability that is approximately unity at optical
frequencies, the same as vacuum, although their relative dielectric permittivity can
be considerably different from unity. The reason for this is the weak coupling of the
magnetic field of the light to the atoms in the medium. Landau and Lifshitz stated
that the magnetic susceptibility ceases to hold any physical significance at relatively
low frequencies and that accounting for the deviations of the permeability from unity
is an over-refinement [42]. In addition, they state that in the optical frequency range
and upwards, the magnetic susceptibility is no longer a meaningful quantity and one
must put µ = 1. As discussed in Sec. 1.3.3, designing metamaterials with an effective
magnetic response at high (optical) frequencies is quite difficult. At optical frequencies,
the permittivity of the metallic inclusions may become comparable in magnitude to the
permittivity of the host medium, leading to the formation of surface plasmons at their
interface. These surface plasmon resonances may however be used to realize alternative
schemes for generating a negative permeability.
The electromagnetic response of slabs of Split Ring Resonators (SRR) at high (op-
39

40 Behaviour of Split-Ring Resonator Metamaterials at High Frequencies
tical and NIR) frequencies has been studied in this chapter. At these frequencies, effec-
tive medium descriptions gradually become inaccurate, finally resulting in the situation
where the effective medium approach can no longer be applied. The retrieved parame-
ters for the SRR metamaterials, when treated as reasonably effective media, themselves
provide a few clues to the weakening of homogenization approaches. At optical fre-
quencies, the metamaterials studied can no longer be homogenized and their response
at optical frequencies has been studied using their band structures, reflectivity profiles
and field maps. The negative phase velocity that these media can exhibit under suitable
conditions is explained on the basis of localized plasmonic resonances, rather than the
LC-resonance of an effective electric circuit driven by the magnetic field of the incident
radiation. The electric field of the incident radiation is shown to be able to resonantly
drive the SRR. Finally, the response of a series of SRRs, differing from each other only
in the width of their capacitive gaps, has been investigated in detail. This allows us to
study the gradual evolution of the magnetic resonance of the SRR, beyond the point
where effective medium theories break down and finally when the SRR units are λ/2 —
the photonic crystal limit.
2.1 The SRR embedded in a dielectric background
O’Brien et.al. [74] have described a split-ring resonator that is magnetically active at
near-infra-red frequencies. Scaling to NIR frequencies was made possible by using a
symmetric SRR with multiple capacitive gaps, which increased the capacitances ‘con-
nected’ in series with each other. This, however, increases the size to wavelength ratio
and makes the application of effective medium theories to a slab of such SRRs question-
able. However, embedding the SRR in an appropriate dielectric medium reduces the
size to wavelength ratio, by increasing the net capacitance of the SRR. The additional
gaps need to be placed symmetrically to avoid bianisotropy, which has already been
discussed in Chap. 1, Sec. 1.3.4.
An array of the SRRs they studied (Fig. 2.1 (a)) exhibited a negative permeabil-
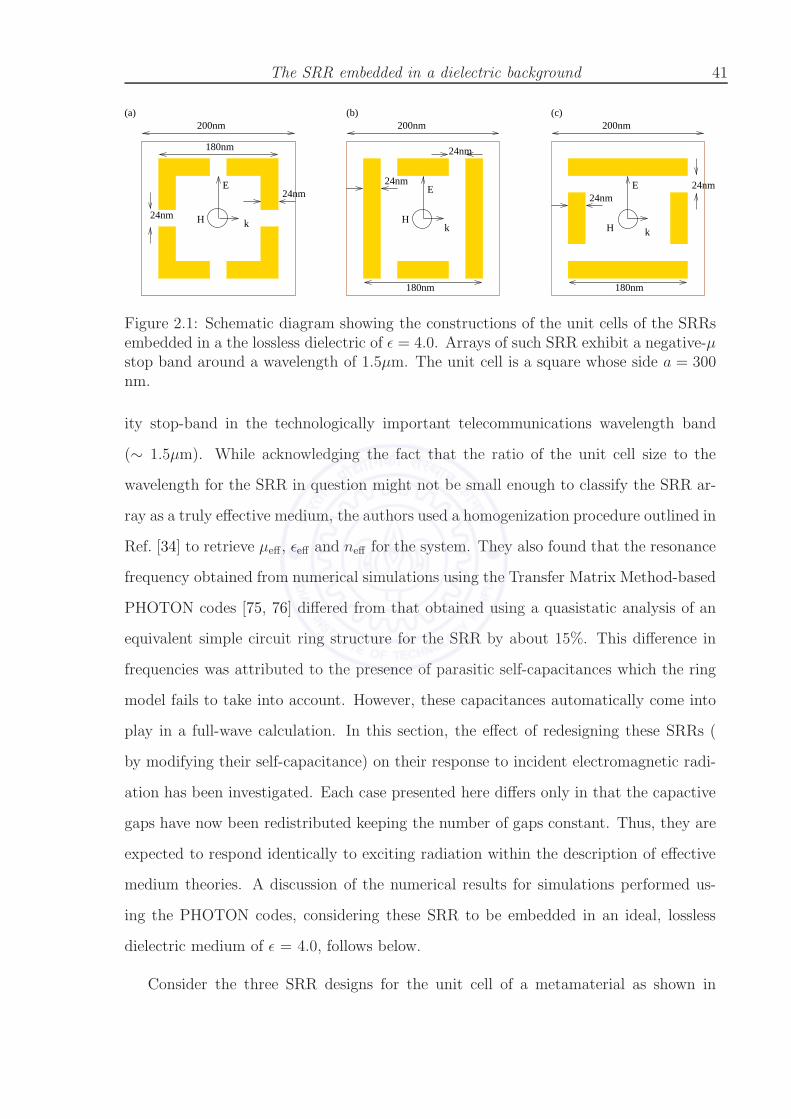
The SRR embedded in a dielectric background 41
E
H k kH
kH24nm
24nm 24nm24nm
EE
180nm
24nm
180nm 180nm
24nm
200nm200nm200nm(a) (b) (c)
Figure 2.1: Schematic diagram showing the constructions of the unit cells of the SRRsembedded in a the lossless dielectric of ǫ = 4.0. Arrays of such SRR exhibit a negative-µstop band around a wavelength of 1.5µm. The unit cell is a square whose side a = 300nm.
ity stop-band in the technologically important telecommunications wavelength band
(∼ 1.5µm). While acknowledging the fact that the ratio of the unit cell size to the
wavelength for the SRR in question might not be small enough to classify the SRR ar-
ray as a truly effective medium, the authors used a homogenization procedure outlined in
Ref. [34] to retrieve µeff , ǫeff and neff for the system. They also found that the resonance
frequency obtained from numerical simulations using the Transfer Matrix Method-based
PHOTON codes [75, 76] differed from that obtained using a quasistatic analysis of an
equivalent simple circuit ring structure for the SRR by about 15%. This difference in
frequencies was attributed to the presence of parasitic self-capacitances which the ring
model fails to take into account. However, these capacitances automatically come into
play in a full-wave calculation. In this section, the effect of redesigning these SRRs (
by modifying their self-capacitance) on their response to incident electromagnetic radi-
ation has been investigated. Each case presented here differs only in that the capactive
gaps have now been redistributed keeping the number of gaps constant. Thus, they are
expected to respond identically to exciting radiation within the description of effective
medium theories. A discussion of the numerical results for simulations performed us-
ing the PHOTON codes, considering these SRR to be embedded in an ideal, lossless
dielectric medium of ǫ = 4.0, follows below.
Consider the three SRR designs for the unit cell of a metamaterial as shown in

42 Behaviour of Split-Ring Resonator Metamaterials at High Frequencies
Fig. 2.1. The SRRs are considered to lie in the x− z plane and assumed to be invariant
along the y direction. The polarization of the incident radiation has been indicated
in the diagram (Fig. 2.1). The usual SRR mechanism can be invoked to explain the
functioning of these SRRs. The SRR shown in Fig. 2.1 (b) and Fig. 2.1 (c) are expected
to have a lower resonance frequency owing to the increased self-capacitance across the
shorter stubs. The metal itself was modelled as having a permittivity given by the
Drude form:
ǫ(ω) = ǫ∞ −ω2
p
ω(ω + iγm). (2.1)
where ǫ∞ represents the ‘static’ permittivity of the metal, ωp is its plasma frequency
and γm is the dissipation factor. Experimentally observed values for the permittivity
of silver [77] were used in these calculations. The values of the constants in the above
equation can be approximated as follows: ǫ∞ = 5.7, ωp = 9.013 eV (2176 THz) and
γ = 0.018 eV (4.3 THz).
Band-gaps (indicative of a negative permeability band) were found to occur above
the magnetic resonance frequencies of 186 THz, 184 THz and 179 THz for SRRs (a),
(b) and (c) respectively as shown in Fig. 2.2 (a) - (c) and further corroborated by the
reflectivity and the transmittivity plotted in Fig. 2.2 (d) - (f). At these frequencies, the
unit cell size (a = 300nm), is ∼ λ/6. The length-scales of the present set of SRRs enable
the application of reasonably effective medium theories to them and allow them to be
described by an effective ǫ and an effective µ. The effective medium parameters (µeff)
extracted using the complex reflection and transmission coefficients [34] are shown in
Fig. 2.3. Fig. 2.3 (a) - (c) show the effective impedance (Z) for each of the structures in
Fig. 2.1 (a) - (c), respectively, and in each case, the peak in Z that is associated with the
magnetic resonance can be clearly identified. Fig. 2.3 (d) - (f) represent the retrieved
permeability for the structures shown in Fig. 2.1 (a) - (c), respectively. Thus, it is
seen that in each case, the origin of the band gap for arrays of the SRR metamaterials
in each of these cases can be traced to a magnetic resonance resulting in a negative
permeability band. The same retrieval procedure also yields the effective permittivity
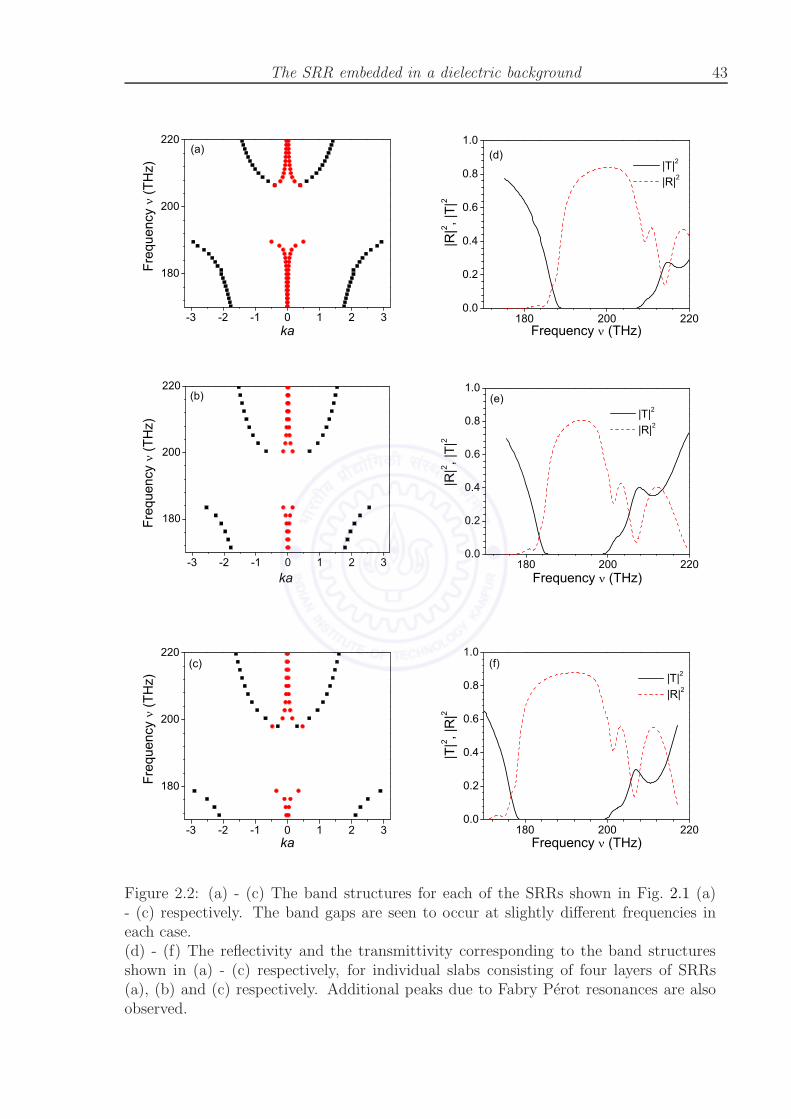
The SRR embedded in a dielectric background 43
180
200
220
-3 -2 -1 0 1 2 3
ka
Freq
uenc
y (T
Hz)
(a)
180 200 2200.0
0.2
0.4
0.6
0.8
1.0
|R|2 , |
T|2
Frequency (THz)
|T|2
|R|2
(d)
180
200
220
-3 -2 -1 0 1 2 3
ka
Freq
uenc
y (T
Hz)
(b)
180 200 2200.0
0.2
0.4
0.6
0.8
1.0
|R|2 , |
T|2
Frequency (THz)
|T|2
|R|2
(e)
180
200
220
-3 -2 -1 0 1 2 3
ka
Freq
uenc
y (T
Hz)
(c)
180 200 2200.0
0.2
0.4
0.6
0.8
1.0
|T|2 , |
R|2
Frequency (THz)
|T|2
|R|2
(f)
Figure 2.2: (a) - (c) The band structures for each of the SRRs shown in Fig. 2.1 (a)- (c) respectively. The band gaps are seen to occur at slightly different frequencies ineach case.(d) - (f) The reflectivity and the transmittivity corresponding to the band structuresshown in (a) - (c) respectively, for individual slabs consisting of four layers of SRRs(a), (b) and (c) respectively. Additional peaks due to Fabry Perot resonances are alsoobserved.

44 Behaviour of Split-Ring Resonator Metamaterials at High Frequencies
of a slab consisting of such SRRs. As described in Chap. 1, ǫeff exhibits antiresonant
behaviour, a fact which has been explained to be the result of the finite periodicity of
the system [35].
Had the structures (a), (b) and (c) been truly homogenizable, they would have
exhibited very similar electromagnetic behaviour as they have roughly the same total
inductance and total capacitance. Their resonance frequencies could vary slightly due to
their different capacitances. However, as the band structures and the retrieved perme-
abilities illustrate, a detailed look at their responses throws up a number of differences.
The differences that one notes immediately are: (i) There is a shift in the resonance
frequency from structure to structure. (ii) The bandwith of the negative µ band gap
changes considerably. (iii) There is also a change in the strength of the µ resonance(the
magnitude of the modulation of the µ in the negative permeability band).
The differences in the electromagnetic response of each of these SRRs can be under-
stood as follows. Structures (b) and (c) which have lower resonance frequencies, possess
a slightly higher capacitance due to the increased self-capacitance of the shorter middle
stubs. The orientation of these SRR with respect to the electric field of the incident
electromagnetic radiation also appears to play an important role. The electric field of
the incident radiation is seen to be able to interact with two, none and four of the
(charged) capacitive gaps in the cases of (a), (b) and (c) respectively. The effect of this
interaction is manifested in the strength of the resonance that is observed in each case.
It is to be noted that had the SRRs considered here been truly homogenizable (in the
strictest sense of the term), their magnetic response would have been independent of
their orientation with respect to the electric field of the incident radiation. This is so
because these SRR are not bianisotropic due to their symmetric structure and in the
quasi-static approximation, the dipole moments formed in the ring due to the accumu-
lation of charge across the gaps cancel out. Further, it can be easily seen that structures
(b) and (c) can be obtained from one another by means of a simple rotation by π/2
about the y-axis, an operation which should not affect their magnetic response along y.
Thus, one can conclude that at length-scales and frequencies such as the ones considered

The SRR embedded in a dielectric background 45
180 200 2200.0
0.5
1.0
1.5
2.0
R
e[z(
)], Im
[z(
)]
Frequency (THz)
Re[z( )] Im[z( )]
(a)
180 200 220
-2
0
2
4
6
8
Re( eff) Im( eff)
Re(
eff),
Im(
eff)
Frequency (THz)
(d)
180 200 2200.0
0.5
1.0
1.5
2.0
Re(
z), I
m(z
)
Frequency (THz)
Re(z) Im(z)
(b)
180 200 220
-2
0
2
4
6
8
Re( eff) Im( eff)
Re(
eff),
Im(
eff)
Frequency (THz)
(e)
180 200 2200.0
0.5
1.0
1.5
2.0
2.5
Re[
z()],
Im[z
()]
Frequency (THz)
Re[z( )] Im[z( )]
(c)
180 200 220-4
-2
0
2
4
6
8
Re( eff) Im( eff)
Re(
eff),
Im(
eff)
Frequency (THz)
(f)
Figure 2.3: (a) - (c): The effective impedance Z for each individual slabs of the SRRsshown in Fig. 2.1 (a) - (c). The peak indicates the location of the magnetic resonance.(d) - (f): The retrieved permeability for corresponding to (a), (b) and (c), respectively.In each case, µeff takes up negative values but the exact resonance frequencies and thestrengths of the resonances are different, even though the three structures are electricallysimilar.
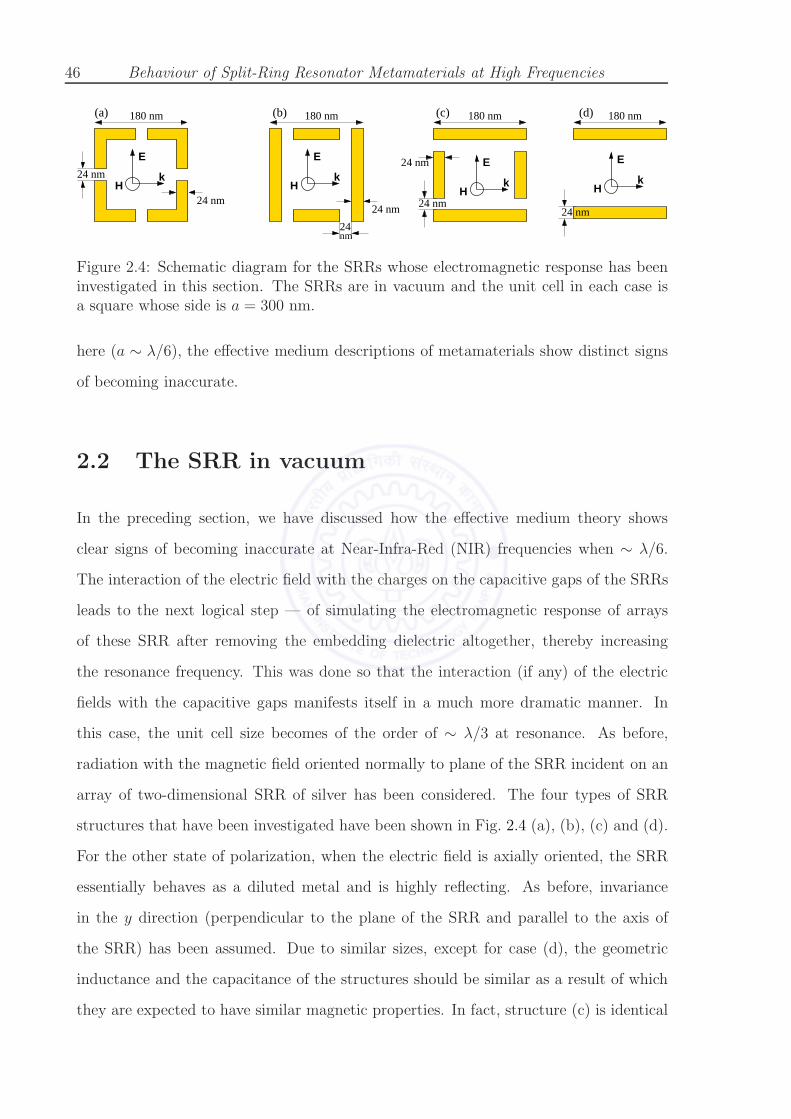
46 Behaviour of Split-Ring Resonator Metamaterials at High Frequencies
24 nm
180 nm
24 nm
180 nm 180 nm
E
kH
E
kH
180 nm
24 nm
24 nm24 nm
E
kH
E
kH
24nm
(a) (b) (c)
24 nm
(d)
Figure 2.4: Schematic diagram for the SRRs whose electromagnetic response has beeninvestigated in this section. The SRRs are in vacuum and the unit cell in each case isa square whose side is a = 300 nm.
here (a ∼ λ/6), the effective medium descriptions of metamaterials show distinct signs
of becoming inaccurate.
2.2 The SRR in vacuum
In the preceding section, we have discussed how the effective medium theory shows
clear signs of becoming inaccurate at Near-Infra-Red (NIR) frequencies when ∼ λ/6.
The interaction of the electric field with the charges on the capacitive gaps of the SRRs
leads to the next logical step — of simulating the electromagnetic response of arrays
of these SRR after removing the embedding dielectric altogether, thereby increasing
the resonance frequency. This was done so that the interaction (if any) of the electric
fields with the capacitive gaps manifests itself in a much more dramatic manner. In
this case, the unit cell size becomes of the order of ∼ λ/3 at resonance. As before,
radiation with the magnetic field oriented normally to plane of the SRR incident on an
array of two-dimensional SRR of silver has been considered. The four types of SRR
structures that have been investigated have been shown in Fig. 2.4 (a), (b), (c) and (d).
For the other state of polarization, when the electric field is axially oriented, the SRR
essentially behaves as a diluted metal and is highly reflecting. As before, invariance
in the y direction (perpendicular to the plane of the SRR and parallel to the axis of
the SRR) has been assumed. Due to similar sizes, except for case (d), the geometric
inductance and the capacitance of the structures should be similar as a result of which
they are expected to have similar magnetic properties. In fact, structure (c) is identical

The SRR in vacuum 47
to structure (b) but only rotated by π/2. Similarly, structure (d), the typical plate
pairs of [78] is the same as structure (c) but with the shorter legs absent. Fig. 2.5 (a),
(b), (c) and (d) illustrate the band structure diagrams in which both the real (solid
squares) and imaginary parts (hollow circles) of the wave-vector at normal incidence
have been shown. We have used the same colour (black or red) for the real and imag-
inary parts of a particular eigenvalue. The code computes a pair of eigenvectors for
each frequency, one corresponding to a forward-propagating and one corresponding to
a backward-propagating wave. These would have a positive and a negative imaginary
component of the wave vector corresponding to a wave that decays in the forward di-
rection (the direction in which energy is transported) or a wave that decays in the
negative direction. The real parts of the wave vector usually have the same signs as the
imaginary parts. The eigenvalues were chosen in such a manner that the solutions in
the dissipative medium corresponded to a wave decaying in intensity along the forward
direction (along the Poynting vector). Fig. 2.6 (a), (b), (c) and (d) show the transmit-
tivity and the reflectivity for a slab composed of four layers of such SRRs respectively.
These simulations were carried out using a refined version of the PHOTON codes based
on the Transfer Matrix Method(TMM) [75, 76]. The additional peaks observed in the
transmission spectra are the Fabry-Perot resonances that occur as a result of multiple
scattering from the edges of the slab. This indicates that the dissipation in the system
is not very large and the wave can scatter multiply between the interfaces thereby inter-
fering to create the Fabry-Perot resonances. As before, experimentally obtained values
for the dielectric permittivty of silver [77] were used in all the calculations.
The band structures of these structures and the corresponding reflectivity and the
transmittivity shown in Fig. 2.5 and Fig. 2.6 highlight the completely different behaviour
obtained in each of the three cases. Surprisingly, structure (b) and structure (c) (which
is just the SRR in (b) reoriented) were found to behave very differently from each other.
The most interesting new feature that is observed is that structure (a), structure (c) and
structure (d) exhibit a negative refractive index in the second and third bands. This
can be seen from the fact that waves with positive real part of the wave number have a

48 Behaviour of Split-Ring Resonator Metamaterials at High Frequencies
250
300
350
400
-3 -2 -1 0 1 2 3
ka
Freq
uenc
y (T
Hz)
(a)250
300
350
400
-3 -2 -1 0 1 2 3
ka
Freq
uenc
y (T
Hz)
(b)
250
300
350
400
-3 -2 -1 0 1 2 3
ka
Freq
uenc
y (T
Hz)
(c)250
300
350
400
-3 -2 -1 0 1 2 3
ka
Freq
uenc
y (T
Hz)
(d)
Figure 2.5: The band structures corresponding to the SRR structures shown in Fig. 2.4(a), (b), (c) and (d), respectively. The striking difference between the response of eachof these structures is noteworthy. The solid circles indicate the real parts of the wavevector while the hollow circles denote the imaginary parts. The same colour (red orblack) has been used for the real and imaginary parts of the eigenvalues with positive ornegative real parts. The opposite signs of the real and imaginary parts indicate negativephase velocity for SRR (a), (c) and (d). The unit cell size is a = 300 nm.
negative imaginary part of the wave number. The second band also has negative group
velocity which is not separated from the higher positive group velocity band by a band
gap. In the case (a), both these bands are very flat and almost dispersionless. In case
(b), only a bandgap with an avoided crossing with the next higher band occurs. It is
interesting to note that one obtains a nearly gapless dispersion with a negative phase
velocity over a large band in case (d). Negative phase velocity bands are obtained in
the case of (a), (c) and (d) as the fact that the real and imaginary parts of the wave-
vector have opposite signs indicates. Thus, the existence of both the negative phase
velocity - negative group velocity as well as negative phase velocity - positive group

The SRR in vacuum 49
250 300 350 4000.0
0.2
0.4
0.6
0.8
1.0
|R|2 , |
T|2
Frequency (THz)
|T|2
|R|2
(a)
250 300 350 4000.0
0.2
0.4
0.6
0.8
1.0
|R|2 , |
T|2
Frequency (THz)
|T|2
|R|2
(b)
250 300 350 4000.0
0.2
0.4
0.6
0.8
1.0
|R|2 , |
T|2
Frequency (THz)
|T|2
|R|2(c)
250 300 350 4000.0
0.2
0.4
0.6
0.8
1.0
|R|2 , |
T|2
Frequency (Thz)
|T|2
|R|2
(d)
Figure 2.6: The reflectivity and the transmittivity for the for slabs consisting of fourlayers of the SRRs shown in Fig. 2.4 (a), (b), (c) and (d), respectively. These calculationsconfirm the result of the band structure calculations for each SRR. The transmissionspectra show the additional peaks due to the Fabry-Perot resonances occuring as a resultof multiple reflections from the edges of the slab.
velocity bands that were reported in an experiment on metamaterials [79], is confirmed
at the optical frequencies (338 THz ∼ 882 nm) considered here. At these frequencies,
the free space wavelength of the light is about thrice the size of the unit cell and only
one transmitted and reflected beam is obtained from a slab of such SRRs as all other
higher-order diffracted beams are evanescent. Interestingly, the band structure for the
plate pairs in Fig. 2.4 rotated by π/2 (shown in Fig. 2.16, in the next section) is again
completely different.
The only identifiable difference between first three systems lies in the number of
capacitive gaps (and consequently the charge distributions) that the electric field of the
incident radiation can interact with. Evidently, the electric field can interact with the

50 Behaviour of Split-Ring Resonator Metamaterials at High Frequencies
charge distributions formed across two, nil or four capacitive gaps in the SRRs (a), (b)
and (c) respectively. The enhanced interaction of the electric field of the incident wave
with the SRR is clearly manifested in the response of each of these SRRs. In fact, the
band structure of each SRR depends crucially on the number of capacitive gaps across
which the electric field can interact with the charge distribution. This was verified by
redistributing the gaps in SRR (a) so that the electric field of the incident radiation
interacts with the charge distibutions formed across two capacitive gaps in each case as
shown in Fig. 2.7. Evidently, the band structures are almost identical in the two cases.
180nm180nm
24nm
24nm
24nm24nm
E E
kk HH
(a) (b)
250
300
350
400
-3 -2 -1 0 1 2 3
ka
Freq
uenc
y (T
Hz)
(c)250
300
350
400
-3 -2 -1 0 1 2 3
ka
Freq
uenc
y (T
Hz)
(d)
Figure 2.7: Band structures for the SRR(a) in Fig. 2.4 after the gaps have been redis-tributed. Note that in each case, E can interact with the charge distributions formedacross two of the gaps, just as in the case of SRR (a). The band structures obtainedare identical in every respect. As before, the unit cell size is a = 300 nm.
At these high frequencies, the usual SRR mechanism of an equivalent resonant series
LC circuit cannot be used to explain the functioning of the SRR [74]. In addition, there
exist significant phase differences across a single SRR of either type (b) or type (c),
whose size (∼ λ/3) becomes a significant fraction of the wavelength at the bandgaps.
This enables the transient building up of charge densities at various points on the SRR

The SRR in vacuum 51
with which the electric field interacts, due to retardation. The dipoles are not completely
screened out. This was corroborated by computing the spectral problem for a small (3
X 4) array of SRR of type (c) using the COMSOLTM FEMLAB software with perfectly
matched boundary layers (PML) placed at least more than 1000 nm away. There is a
mismatch of about 5 THz between the results obtained from COMSOLTM and those
obtained using the Transfer Matrix Method. The COMSOLTM results give a frequency
about 5 THz larger than the TMM codes, which could be due to the differences in
the discretization methods or the finite array size effects and PML conditons in the
COMSOLTM calculations. For typical eigensolutions near 340 THz, the magnetic fields
were concentrated inside the SRRs as in the case of the classical SRR, but pointed in
opposite directions in adjacent layers (See Fig. 2.8). Similarly, the electric fields were
found to be concentrated in the capacitive gaps with large dipole-like fields in the gaps
whose signs reversed across the SRR. The displacement fields were found to ‘circulate’
around the SRR similar to a current. These observations lead one to conclude that
the electric field is exciting the anti-symmetric plasmon modes [80] in the vertical legs
across the SRR with opposing currents (displacement and real) in the two legs. Such
effects have been studied in pairs of nanowires as described below.
The resonant response of wire pairs: The resonances in an isolated nanowire of
finite length can be related to the excitation of surface plasmon polariton modes on the
metal-vacuum interface. When two nanowires are positioned close to each other, their
plasmon modes interact. When the electric field of the incident plane wave is parallel to
the wires and the magnetic field is perpendicular to their (common) plane, two different
kinds of plasmon polariton waves (differing in symmetry) can be excited [80]. The
symmetric combination of the two polariton waves leads to the symmetric excitation of
the electric dipole moments in both the wires. Parallel currents are resonantly excited.
The antisymmetric combination corresponds to the excitation of antiparallel currents in
the wire pair, by the magnetic field of the incident wave. Along with the displacement
current in between the wires, it appears as if there is a resonant excitation of the
magnetic dipole moment of the system. For the systems under study, the interaction

52 Behaviour of Split-Ring Resonator Metamaterials at High Frequencies
Figure 2.8: The electric (top) and the magnetic (bottom) field maps calculated usingFEMLAB for an array of SRRs of the type (c) in Fig. 2.4. The electric fields areconcentrated within the capacitive gaps while the magnetic fields are confined withinthe rings, highlighting the magnetic nature of the resonance.

The SRR in vacuum 53
with the dipoles in the capacitive gaps is crucial for the excitation of the anti-symmetric
mode. Thus, under suitable conditions, the electric fields can contribute to reinforcing
the effects of the magnetic fields which leads to a large magnetic dipole moment.
2.2.1 Focussing and imaging with slabs of negative phase ve-
locity metamaterials
The focussing of a line source at a frequency of 340 THz by a finite flat slab composed
of an array of SRR in the form of a Veselago lens [81], was simulated. This frequency
is where the ‘light line’ (ω = kc) intersects the negative phase and group velocity band
for the SRR (c) corresponds to the condition n = −1. The orientation of the SRR (b)
or (c) turns out to be crucial although an image is formed in both the cases. The field
maps for the imaging of a line source by 2-D SRR slabs have been shown in Fig. 2.9 and
Fig. 2.10 (left panels). In either case, the Poynting vector streamlines (right panels),
depicting the energy flow in the system, converge in the transverse direction to a small
region, indicating the position of the image formed. In the case of SRR (b), the slab
transmits very little due to the bandgap and a faint image is formed on the other side.
In the case of SRR (c), a brighter image is formed as it is located within a transmittive
band. While the focussing action of the slab consisting of SRR (b) is due to negative
dielectric permittivity, that occuring in the case of the slab of SRR (c) is due to negative
phase velocity, suggestive of a negative index of refraction [81].
Therefore, it can be concluded that the behaviour of an array of SRR (b) is similar
to a stack of cut-wires (plates), with the electric field of the incident radiation directed
along the plates (wires). This medium is known to behave like a plasma and exhibit
negative dielectric permittivity [38]. The capacitive gaps within the SRR do not play
much of a role in the phenomena observed in this case. This was again verified by
closing the capacitive gaps whereby it was found that the weak imaging effect remained
essentially unchanged with hollow square cylinders. The band structure calculation for
the hollow square cylinders shows a wide band-gap in the frequency range considered

54 Behaviour of Split-Ring Resonator Metamaterials at High Frequencies
Figure 2.9: Left: The focussing action by an array of SRRs of type (b) (Fig. 2.4) in theform of a Veselago lens. A line source is placed on the left-hand side of the slab. Animage is clearly formed on the right-hand side as seen from the field map.Right: The energy streamlines also converge in the transverse direction indicating thefocussing. The transmittivity of the slab is very low due to the band gap and a faintimage is formed.
here (See Fig. 2.13). The entire system thus behaves effectively as a diluted metal and
the focussing of light is due to a negative dielectric permittivity over a wide range of
frequencies [82]. The focussing effect has been verified over a reasonably wide range of
frequencies — 338 THz to nearly 355 THz, while the best resolution is obtained at ∼ 348
THz. Due to the finite size and numbers of the SRRs used and the dissipation present in
the system, no claims about the extent of the sub-wavelength resolution possible here,
are made. In the case of SRR (a) as well, a negative phase velocity band and hence,
imaging as a Veselago lens, is possible.
Comparison with All-angle Negative Refraction (AANR): All-angle negative
refraction is a phenomenon observed in photonic crystals [83]. It does not require a
negative index of refraction and a few simple criteria are sufficient to achieve this effect.
All-angle negative refraction is a purely band structure-dependent effect, depending only
on the convexity of the equifrequency surfaces and a negative effective photonic mass.
Luo et. al. [83] have identified three key factors which guarantee single beam AANR.

The SRR in vacuum 55
Figure 2.10: Left: The focussing action by an array of SRRs of type (c) (shown inFig. 2.4) in the form of a Veselago lens.Right: A line source is placed on the left-hand side of the slab. The image, clearlyformed on the right-hand side, can be seen on the field map. The energy streamlinesalso converge in the transverse direction indicating the focussing. In this case, thetransmission by the slab is considerably higher the frequencies lie in a propagating bandand the image formed is much brighter.
They are:
(i) The equifrequency contour of the photonic crystal should be convex with a negative
effective photonic mass.
(ii) All the incident wave vectors at such frequencies lie within the constant frequency
contour of the photonic crystal.
(iii) The frequency must lie below 0.5×2πc/as, (where as is the surface parallel period)
in order to avoid diffraction. In photonic crystals exhibiting negative refraction, the
group velocity is never directed opposite to the phase velocity, confirming that one is
operating within a regime of positive refractive index.
In comparison, the systems we have studied may exhibit a negative phase velocity when
oriented appropriately with respect to the electric field, suggestive of a negative index
of refraction, even though the length scales involved do not permit homogenization.
The focussing effect was confirmed by shifting the source around and putting in

56 Behaviour of Split-Ring Resonator Metamaterials at High Frequencies
Figure 2.11: Focussing by a disordered, finite-sized array of SRR of type (c) in Fig. 2.4.This figure clearly indicates that imaging effects are not due to band-dispersion effectsbut rather a consequence of the localized resonances of the system. A single SRR in thearray is missing, as shown. The positions of the two sources and their correspondingimages have been indicated in the figure. The figure shows the field map for the electricfield normal to the plane of the array.
multiple sources. It was also found to remain unaffected if the periodicity of the array
was disturbed (Fig. 2.11). Subwavelength focussing effects by evanescent waves were
not considered as the wavelength is comparable to the length scales of the structure.
The fact that the imaging effects were not a consequence of band-dispersion effects such
as the all angle negative refraction (AANR) was verified by disordering the positions of
the SRRs to upto 10% of the lattice and also by removing some SRRs in the array. The
images survived with some marginal changes in the fields. This confirms the fact that
the imaging effects have their origin in the localized resonances of the system and the
periodicity of the array is not an essential requirement for the focussing effects.
The occurrence of the negative phase velocity bands can be explained by considering
the enhanced interaction of the electric field with the individual inclusions. The large
phase shifts for the radiation across a single unit cell implies that the electric dipole
moments formed across the capacitive gaps are not screened out effectively. In the case
of SRR (c), the electric field can also drive the currents around the loop by interacting
Evolution of the magnetic response 57
with the dipole moments across the capacitive gaps. This in turn reinforces the inductive
effect due to the varying magnetic field. In case (b), the electric dipole response of the
finite wires (plates) dominates because the wires (plates) in the adjacent cells along the
x-axis can couple through the electric field. In case (c), the longer wires (plates) are
along the z−direction and the coupling along x is much lesser. Thus, the magnetic action
is reinforced in this case, compared to the plasma-like action in the case of SRR (b). It
is thus possible explain the negative phase velocity (suggestive of a negative refractive
index) in case (c) and the band gap suggestive of a negative dielectric permittivity in
case (b) on the basis of these. The system has localized plasmonic resonances of electric
and magnetic character respectively, giving rise to the band gaps on either side of the
negative phase velocity band. In case (d), the two plasmonic resonances are apparently
degenerate, resulting in an almost gapless dispersion.
Defining homogeneous effective medium parameters such as ǫeff and µeff does not
make sense here as the process of homogenisation itself is questionable when the unit
cell size is a significant fraction of the free space wavelength at resonance (in this case,
a ∼ λ/3). Hence the discussion here has been confined to the negative phase velocity
(suggestive of a negative refractive index) and its possible origin based on the physical
aspects of the systems, and no attempt at defining ǫeff and µeff for the shown incidences
has been made.
2.3 Evolution of the magnetic response
The equivalent circuit model of the SRR shows that the capacitive gaps in the structure
are of the greatest importance in determining its resonance frequency. Indeed, at these
high frequencies, it is much easier to vary the resonance frequency of the SRR by altering
the gap width (and hence, the capacitance), than it is by altering the inductance. The
sensitivity of SRRs to varying gap widths and its effect on the effective medium response
has been presented here. The electromagnetic response of a variety of metamaterial
structures were simulated and the gradual change with geometric structure in their
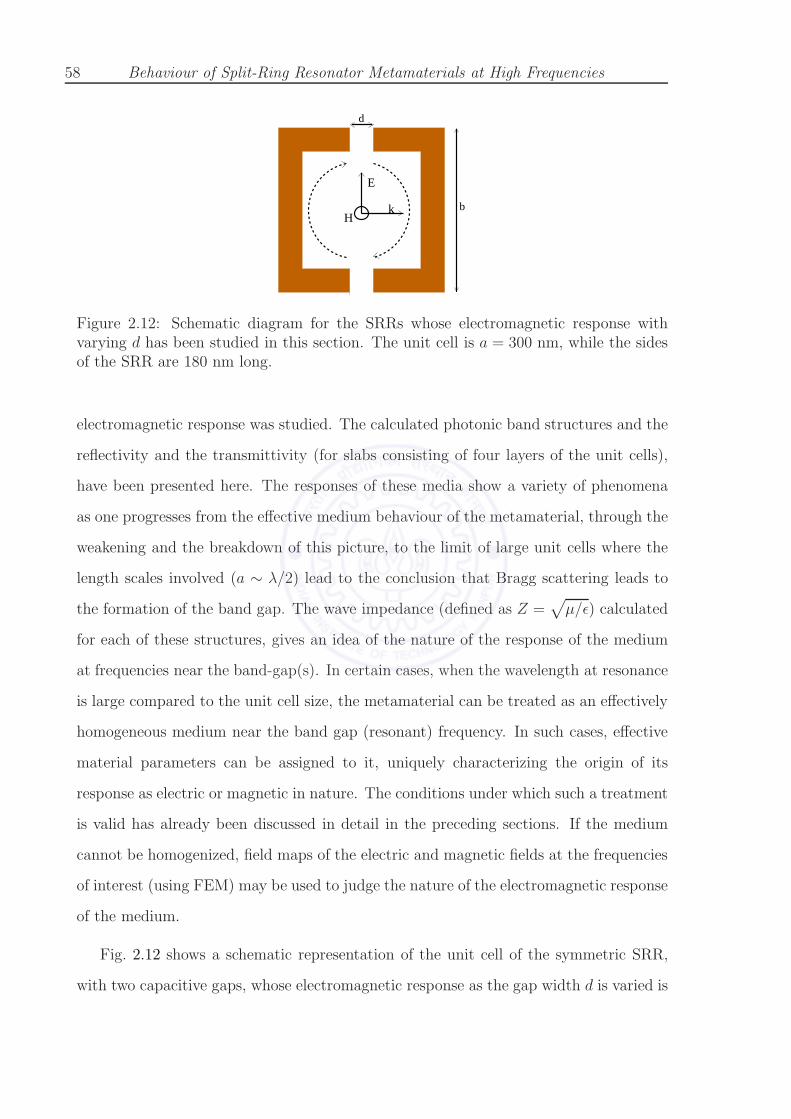
58 Behaviour of Split-Ring Resonator Metamaterials at High Frequencies
E
d
b H
k
Figure 2.12: Schematic diagram for the SRRs whose electromagnetic response withvarying d has been studied in this section. The unit cell is a = 300 nm, while the sidesof the SRR are 180 nm long.
electromagnetic response was studied. The calculated photonic band structures and the
reflectivity and the transmittivity (for slabs consisting of four layers of the unit cells),
have been presented here. The responses of these media show a variety of phenomena
as one progresses from the effective medium behaviour of the metamaterial, through the
weakening and the breakdown of this picture, to the limit of large unit cells where the
length scales involved (a ∼ λ/2) lead to the conclusion that Bragg scattering leads to
the formation of the band gap. The wave impedance (defined as Z =√
µ/ǫ) calculated
for each of these structures, gives an idea of the nature of the response of the medium
at frequencies near the band-gap(s). In certain cases, when the wavelength at resonance
is large compared to the unit cell size, the metamaterial can be treated as an effectively
homogeneous medium near the band gap (resonant) frequency. In such cases, effective
material parameters can be assigned to it, uniquely characterizing the origin of its
response as electric or magnetic in nature. The conditions under which such a treatment
is valid has already been discussed in detail in the preceding sections. If the medium
cannot be homogenized, field maps of the electric and magnetic fields at the frequencies
of interest (using FEM) may be used to judge the nature of the electromagnetic response
of the medium.
Fig. 2.12 shows a schematic representation of the unit cell of the symmetric SRR,
with two capacitive gaps, whose electromagnetic response as the gap width d is varied is

Evolution of the magnetic response 59
100
150
200
250
300
350
400
450
500
-3 -2 -1 0 1 2 3
ka
Freq
uenc
y (T
Hz)
(a) d = 0100 200 300 400 500
0.0
0.2
0.4
0.6
0.8
1.0
|R|2 , |
T|2
Frequency (THz)
|T|2
|R|2
d = 0 nm
100 200 300 400 500-1
0
1
2
3
Re(
z), I
m(z
)
Frequency (THz)
Re(z) Im(z)
d = 0
100
200
300
400
500
-3 -2 -1 0 1 2 3
ka
Freq
uenc
y (T
Hz)
(b) d = 4nm
100 200 300 400 5000.0
0.2
0.4
0.6
0.8
1.0
|R|2 , |
T|2
Frequency (THz)
|T|2
|R|2
d = 4 nm
120 130 140 150 160-0.5
0.0
0.5
1.0
1.5
2.0
Re(
z), I
m(z
)
Frequency (THz)
Re(z) Im(z)
d = 4 nm
Figure 2.13: Left: Band structures for the SRR shown in Fig. 2.12 as the gap widthincreases from 0 to 4 nm. A negative permeability band gap due to a magnetic resonanceappears when d = 4 nm.Middle: The reflectivity and the transmittivity for a slab consisting of two layers ofSRRs, whose capacitive gaps correspond to d = 0 nm and d = 4 nm, respectively.Right: The calculated impedance Z for the gap widths of 0 and 4 nm, respectively.
presented in this section. The unit cell considered in our calculations is square with side
a = 300 nm in each case. The width of each of these SRR structures is 24 nm across. The
length of the sides is b = 180 nm. Eight different situations have been studied, beginning
with hollow square cylindrical structures to plate pairs oriented perpendicular to the
electric field of the incident radiation. The evolution of the SRR response with changing
capacitance is presented. As before, the response of these systems has been calculated
using the PHOTON codes [75, 76]. These calculations are essentially two-dimensional
with the magnetic field being aligned along the axis of invariance of the system (the
y-axis), normal to the plane of the SRRs.
(i). The first case considered is the response of an array of hollow square cylinders.
This system may have a net diamagnetic response with µeff taking up values which are
positive but < 1. This is simply the analogue of the array of cylinders which shows a net
diamagnetic response, but with a square rather than a circular cross-section. Although
the array exhibits a single large band gap extending from 290 THz to 483THz, this band

60 Behaviour of Split-Ring Resonator Metamaterials at High Frequencies
gap cannot be attributed to a negative effective permeability. A plot of the spectrum
of the reflectivity and the transmittivity of the system (for two layers of unit cells)
(Fig. 2.13, top panel) shows that the transmittivity drops to nearly zero from about 80%
at approximately 299 THz and remains at this level upto frequencies of 483 THz before
rising again to levels of 70%. As expected in the case of multilayered systems, Fabry
Perot resonances occurring as a result of multiple scattering from the edges of the layers,
are seen both below and above this band gap. The effective impedance of this structure
shows a region of low impedance near the lower band edge, suggesting that the effective
permittivity of the medium is high and an associated dielectric resonance for this system.
However, since the wavelength at this point is nearly λ/3, the effective medium approach
cannot be applied and we do not attribute an effective permittivity. However, due to the
subwavelength size, Bragg scattering is also not expected to dominate. The focussing of
p-polarized light by an array of such hollow cylinders (discussed in Sec. 2.2.1) suggests
a negative dielectric permittivity for this system. The negative permittivity probably
arises due to the coupling of the electric dipoles formed in adjacent unit cells by the
electric field, in a behaviour akin to the cut-wire system [35].
(ii). Next, the response of a slab consisting of split ring with two splits opposite each
other ( where each split is 4 nm wide), is presented (Fig. 2.13, bottom panel). The band
structure of this medium shows the occurrence of two band gaps, one around 121 THz
and the other at ∼ 289 THz. The lower (narrower) gap in this case is easily identified
as the negative permeability band gap of the SRR (due to the classical LC resonance in
the ring) while the one at higher frequencies is the same as the band gap encountered
in case (i). The transmittivity of the slab drops nearly to zero from about 85% near 132
THz and remains nearly zero till 152 THz when it rises, exhibits a series of Fabry-Perot
resonances and then again shows a region of very low transmittivity from 289 THz to 483
THz, just like the one observed in the case of the hollow structure. The first stop band
is a region where the impedance of the system is high, as compared to the second stop
band where the effective impedance is low. This high impedance is typical of the SRR-
based metamaterials, which have a high magnetic permeability at resonance. At the

Evolution of the magnetic response 61
100
200
300
400
500
-3 -2 -1 0 1 2 3
ka
Freq
uenc
y (T
Hz)
(a) d = 12 nm
100 200 300 400 5000.0
0.2
0.4
0.6
0.8
1.0
|R|2 , |
T|2
Frequency (THz)
|T|2
|R|2
d = 12 nm
180 190 200 210 2200.0
0.5
1.0
1.5
2.0
2.5
Re(
z), I
m(z
)
Frequency (THz)
Re(z) Im(z)
d = 12 nm
100
200
300
400
500
-3 -2 -1 0 1 2 3
ka
Freq
uenc
y (T
Hz)
(b) d = 20 nm
100 200 300 400 5000.0
0.2
0.4
0.6
0.8
1.0
|R|2 , |
T|2
Frequency (THz)
|T|2
|R|2
d = 20 nm
220 230 240 250 260 270
0
1
2
Re(
z), I
m(z
)
Frequency (THz)
Re(z) Im(z)
d = 20 nm
Figure 2.14: Left: Band structures for the SRR shown in Fig. 2.12 as the gap widthis increased to 12 nm and 20 nm. The negative permeability band gap moves towardshigher frequencies.Middle: The reflectivity and the transmittivity for a slab consisting of two layers ofSRRs, whose capacitive gaps correspond to d = 12 nm and d = 20 nm, respectively.Right: The calculated impedance Z for the gap widths of 12 and 20 nm, respectively.
frequency where the first band gap is formed, the medium is homogenizable (a ∼ λ/8)
and effective parameters can be extracted. The retrieved permeability shows a negative
µ band at the location of the first gap.
(iii). In the third case, the widths of the capacitive gaps of the SRR are increased
to d = 12 nm. Once again, two band gaps are seen (shown in Fig. 2.14, top panel).
The first band gap now occurs at a higher frequency (due to the reduced capacitance
of the SRR) while the second band gap too shifts upwards and narrows down as well.
The upper edge of the second band gap, however, remains at 483 THz. The lower gap is
the narrower of the two. The reflectivity-transmittivity profile of this system is similar
to the previous one with two stop bands where the first narrow band is the usual SRR
negative µ-band while the second is the same stop band seen in (i) and (ii). The lower
edge of the second stop band also shows a slight upward shift. The effective permeability
in the first gap (where a ∼ λ/7) is negative, confirming that it arises due to the LC
resonance of the SRR.

62 Behaviour of Split-Ring Resonator Metamaterials at High Frequencies
100
200
300
400
500
-3 -2 -1 0 1 2 3
ka
Freq
uenc
y (T
Hz)
(a) d = 44 nm
100 200 300 400 5000.0
0.2
0.4
0.6
0.8
1.0
|R|2 , |
T|2
Frequency (THz)
|T|2
|R|2
d = 44 nm
290 300 310 320 330
-4
-2
0
2
4
6
Re(
z), I
m(z
)
Frequency (THz)
Re(z) Im(z)
d = 44 nm
100
200
300
400
500
-3 -2 -1 0 1 2 3
ka
Freq
uenc
y (T
Hz)
(b) d = 60 nm
100 200 300 400 5000.0
0.2
0.4
0.6
0.8
1.0
|R|2 , |
T|2
Frequency (THz)
|T|2
|R|2
d = 60 nm
320 330 340 350 360
0
1
Re(
z), I
m(z
)
Frequency (THz)
Re(z) Im(z)
d = 60 nm
Figure 2.15: Left: Band structures for the SRR shown in Fig. 2.12 as the gap widthincreases to 44 nm and 60 nm. The negative permeability band narrows and movesupwards with increasing gap width d.Middle: The reflectivity and the transmittivity for a slab consisting of two layers ofSRRs, whose capacitive gaps correspond to d = 44 nm and d = 60 nm, respectively.Right: The calculated impedance Z for the gap widths of 44 and 60 nm, respectively.
(iv). In this case, the capacitive gap width of the SRR is increased to 20 nm.
The response of an array such SRRs has been shown in Fig. 2.14, bottom panel. The
calculated band structure for an array of such SRR shows two bands as before, with the
first one progressively having moved upwards in frequency and the band width narrowing
in extent. The second one also shifts upward in frequency but its upper edge remains
remains unaltered at 483 THz. The reflectivity-transmittivity spectrum for a double
layered slab of these SRR is qualitatively similar to those obtained in the case of (ii)
and (iii). The negative permeability band is at a higher frequency as the capacitance is
lowered again while the second stop band is not much altered. The unit cell is a ∼ λ/4 at
the resonance. At these length scales, the interaction of the electric field of the incident
radiation with the SRR itself is expected to strongly affect the retrieved parameters, and
this is the frequency regime where the effective medium theories weaken considerably.
(v). The fifth case we present consists of SRRs whose capacitive gaps have a width
of 44 nm each. In this case, the net capacitance of the structure is reduced substantially

Evolution of the magnetic response 63
and the first band gap is pushed high up in frequency such that a is only slightly greater
than λ/3 (see Fig. 2.15, top panel). The lower stop band narrows down to the verge
of disappearing due to the weakening of the SRR resonance. The large capacitive gap
prevents strong capacitive coupling between the two parts of the SRR. Homogenization
becomes truly problematic here. The second gap occurring at higher frequencies is
still prominent although it, too, narrows down. The plots of the reflectivity and the
transmittivity of a double-layer of unit cells still shows the considerably weakened SRR
stop-band. In the region of the second stop band, the transmittivity drops to around
30%, as compared to the near zero values obtained in the earlier cases. A comparison of
the reflectivity and the transmittivity spectra shows that the behaviour of the system
has changed considerably from that seen in (ii), (iii) and (iv).
(vi). In the sixth SRR, the widths of the capacitive gaps, d = 60 nm. From the
band structure, it is evident that the lower band due to the magnetic resonance and the
upper bands nearly intersect (Fig. 2.15, bottom panel) . The second gap also narrows
further, leading one to suspect that the physical phenomena responsible for the original
gap formation, such as the coupling between adjacent cells, are ceasing to be dominant.
This reflectivity and the transmittivity for two layers of unit cells of the SRR show
a clearer manifestation of this phenomenon. The first stop band is weaker while the
second one changes considerably in character. Instead of another stop-band, we find
that both the reflectivity and the transmittivity drop to about 50%. Evidently, the
phenomena which influenced the response of the system earlier are now being replaced
by another set. The two band frequencies are now close to each other and we are
gradually approaching the limit where Bragg scattering begins to dominate (i.e., when
a ∼ λ/2).
(vii). In the next stage, the gaps are further increased to 76 nm. Due to the lowered
capacitance of the structure, the lower band is pushed further upwards, resulting in
the disappearance of the first band gap. The higher band gap narrows as well. The
reflectivity-transmittivity profile changes completely, with only one narrow stop band
being seen at the point where both the band frequencies overlap (Fig. 2.16, top panel) .

64 Behaviour of Split-Ring Resonator Metamaterials at High Frequencies
100
200
300
400
500
-3 -2 -1 0 1 2 3
Y Axis Title
Freq
uenc
y (T
Hz)
(a) d = 76 nm
100 200 300 400 5000.0
0.2
0.4
0.6
0.8
1.0
|R|2 , |
T|2
Frequency (THz)
|R|2
|T|2
d = 76 nm
350 360 370 380 390 400
0.0
0.2
0.4
0.6
0.8
1.0
1.2
Re(
z), I
m(z
)
Frequency (THz)
Re(z) Im(z)
d = 76 nm
100
200
300
400
500
-3 -2 -1 0 1 2 3
ka
Freq
uenc
y (T
Hz)
(b) d = 124 nm
100 200 300 400 5000.0
0.2
0.4
0.6
0.8
1.0
|R
|2 , |T|
2
Frequency (THz)
|T|2
|R|2
d = 124 nm
440 460 480 500 520
-2
-1
0
1
2
3
Re(
z), I
m(z
)
Frequency (THz)
Re(z) Im(z)
d = 124 nm
Figure 2.16: Band structures for the SRR shown in Fig. 2.12 as the gap width increasesto 76 nm and 124 nm. The negative permeability band gradually disappears withincreasing gap width.Middle: The reflectivity and the transmittivity for a slab consisting of two layers ofSRRs, whose capacitive gaps correspond to d = 76 nm and d = 124 nm, respectively.Right: The calculated impedance Z for the gap widths of 76 and 124 nm, respectively.
(viii). Finally, the SRR system is reduced to a pair of plates parallel to each other.
These plates are 124 nm apart and are aligned parallel to the electric field of the incident
radiation. The bands for this structure actually intersect at ∼ 459 THz. The plots
of the reflectivity and the transmitivity are completely featureless, except for a drop
in transmission and an accompanying increase in reflection at ∼ 483 THz (Fig. 2.16,
bottom panel) . This frequency corresponds to a ∼ λ/2. Here, the only effect expected to
dominate is Bragg scattering. All other resonant effects, whether it is the LC resonance
seen in SRR systems due to their geometric structure, or those arising from plasmonic
effects, are completely wiped out. This band structure is again totally different from
that exhibited by the plate pairs in the previous section. The plate pairs shown here
are highly transmittive in the frequency range around ∼ 435 THz. This is in sharp
contrast with the behaviour of the structure shown in Fig. 2.4 (d). Moreover, the plates
are aligned parallel to the electric field of the incident radiation which can allow them
to behave like the cut wire media described earlier.

Evolution of the magnetic response 65
The results obtained in this section have been summarized in Table. 2.1.
Table 2.1: The changing nature of the response of the SRR whose structure has beenshown in Fig. 2.12 as the gap width d varies.
SRR Fig. no. Gap width (nm) Resonance (1) Resonance (2) Nature of(THz) (THz) resonance
i Fig. 2.13 0 None 300 (1) None(2)Electric
ii Fig. 2.13 4 138 326 (1)Magnetic,(2)Scattering
iii Fig. 2.14 12 204 350 (1)Magnetic,(2)Scattering
iv Fig. 2.14 20 238 370 (1)Magnetic,(2)Scattering
v Fig. 2.15 44 304 400 (1)Magnetic,(2)Scattering
vi Fig. 2.15 60 340 420 (1)Magnetic,(2)Scattering
vii Fig. 2.16 76 370 447 (1)None,(2)Electric
viii Fig. 2.16 124 None 466 (2)None,(2)Electric

66 Behaviour of Split-Ring Resonator Metamaterials at High Frequencies
2.4 Conclusion
To summarize, the response of SRR-based metamaterials at high frequencies when the
unit cell size becomes a significant fraction of the wavelength and effective medium the-
ories gradually become inaccurate and finally become inapplicable, has been studied.
Even in the case of SRRs which can be treated as reasonably effective media and de-
scribed by means of an effective permeability at telecommunications wavelengths, there
are definite signs that the electric field of the applied radiation begins to interact with
the capacitive gaps of the SRRs. This leads to small but significant variations in the
strength and the width of the magnetic resonance. Further, we have shown that sym-
metric SRRs in vacuum can have negative phase velocity (negative refractive index) at
optical frequencies if oriented such that the electric fields can drive the dipoles formed
across the capacitive gaps. In the orthogonal orientation, they behave like cut-wire
media with a negative dielectric permittivity band gap. The simple paradigm of a neg-
ative µeff due to a L-C resonance in the SRR driven by the magnetic field alone breaks
down and the negative phase velocity (negative refractive index) that arises in the lim-
its when homogenization becomes problematic has its origin in the localized plasmonic
resonances of the system. Our theoretical work is a confirmation of the measurements
of different combinations of positive and negative group velocity and negative phase
velocity reported in Ref. [79]. A slab consisting of these SRRs functions as a Veselago
lens, a phenomenon which continues to persist even if the periodic arrangement of SRRs
in the slab is disordered to about 10 %. The effect is thus completely different from the
all angle negative refraction occurring in photonic crystals. Finally, a systematic study
of the evolution of the magnetic response with decreasing capacitance of the SRR has
been presented. The appearance of the negative permeability gap and its final disap-
pearance with the dominance of scattering processes and the increased interaction of the
fields with the structure as the photonic crystal limit of the structure is approached has
been traced out. It has been shown that one can retrieve effective medium parameters
only up to a certain limit for decreasing capacitance of the same structure. Beyond it,
the L-C resonance paradigm of the SRR breaks down and finally the band gap narrows

Conclusion 67
down to the point of disappearance. Along with this, scattering processes gradually gain
importance until the limiting case of a ∼ λ/2, where it is expected to be the dominant
effect. In this case, however, the metamaterial can also behave like the cut-wire media.
As far as the length scales of the system at the frequencies of interest are concerned, it is
to be noted that here a ∼ λ/2, the regime where Bragg scattering can play a dominant
role in a periodic system. Therefore, in this case, the system can no longer be termed
as a ‘metamaterial’ and certainly cannot be described by effective medium theories.

Chapter 3
Coherently Controlled
Metamaterials at Optical
Frequencies
Metamaterials have undoubtedly altered our perception of the interaction of electro-
magnetic waves with matter within the framework of Maxwell’s equations. A couple of
decades ago, the ideas of coherent control [54] of quantum systems via quantum inter-
ference [84] revolutionized light-matter interaction, exemplified by the demonstration
of phenomena like Electromagnetically Induced Transparency (EIT) [59, 60], sublumi-
nal (slow light) [62] and superluminal propagation of light [61], lasing without inver-
sion [85, 86] etc. Metamaterials, on the other hand, hold out the possibility of negative
refraction [12, 2], perfect lenses [11], invisibility cloaks [87, 88], etc, at frequencies de-
termined solely by their underlying geometric structure. The design and the fabrication
metamaterials of that operate at optical frequencies is a difficult, although not an im-
possible task [89]. This is due to the breakdown of effective medium theories and the
deviation of metals from perfect conductor-like behaviour at high frequencies.
Metamaterials need to be controllable, low-loss and possibly even reconfigurable for
future applications. A few methods for the control of their response, both passive [90, 91]
as well as dynamical, have already been demonstrated. Dynamical methods of control
69

70 Coherently Controlled Metamaterials at Optical Frequencies
L
d
D
b
a
H k
− Silver
− Dielectric
E
Figure 3.1: Schematic diagram for the SRR used for studying the effect of a frequency-dispersive permittivity on the magnetic response. The dimensions of the SRR are asfollows: a = 600 nm, b = 312 nm, L = 144 nm, D = 24 nm, d = 24 nm. The dark(red) area indicates the metallic region while the lighter (yellow) region represents thecapacitive gaps where an appropriate medium can be embedded. A slab of SRR suchas this is truly homogenizable (∼ λ/10) at the frequencies of interest.
include using photoconductive semiconductor inclusions [92, 93], liquid crystal inclu-
sions [94], magnetostrictive effects [95], Kerr nonlinearities [74], adding fixed quanti-
ties silicon-nanosphere/ethanol solution [96] and optical gain [97] in the metamaterial
structures. In this chapter, schemes for manipulating and switching the response of
SRR-based metamaterials that show resonant magnetic effects, using coherent opti-
cal phenomena like EIT have been demonstrated. This is achieved by actively tun-
ing the capacitance of the structures via an appropriate resonant, frequency-dispersive
dielectric background. The proposed scheme involves the interaction of the narrow
atomic/molecular resonance with the broader structural resonance of the metamate-
rial. We use a quantum mechanical phenomenon to parametrically control the purely
classical metamaterial resonance.

Analytical description 71
3.1 Analytical description
In this section we study the magnetic response of SRR-based metamaterials when they
are embedded in a frequency-dispersive dielectric background. We consider a metama-
terial consisting of arrays of symmetric SRR (usually of metals such as gold or silver), as
shown in Fig. 3.1. These arrays lie in the horizontal plane and are stacked up vertically.
The size of the individual inclusions (∼ λ/10) makes it possible to describe the array
as an effective medium at the frequencies of interest. Metamaterials composed of such
SRR have been shown to possess a resonant magnetic response for H threading the loop
of the SRR and the effective permeability, µbare of the SRR array, is given by [44]:
µbare(ω) = 1 +fmω
2
ω2m − ω2 − iΓmω
, (3.1)
as has also been discussed in Sec. 1.3.2. Here, the magnetic resonance frequency
ωm = 1√LC
, where L and C are the total inductance and the total capacitance of the
structure [44], fm is the filling fraction while the factor Γm, which governs the effective
dissipation present in the SRR medium, is related to the intrinsic dissipation in the
metal defined according to the Drude model for the dielectric permittivity. A medium
of such SRRs has already been shown to exhibit a negative permeability that gives rise
to a band gap in a frequency range above ωm if Γm is small enough.
An array of such SRRs is embedded in a medium having a frequency-dispersive
dielectric permittivity. This may either be a resonant Lorentz-type dispersion, or EIT-
like under the application of a pair of coherent control and probe fields. As already
discussed, in the first case, the relative permittivity of the medium is given by the
expression
ǫ(ω) = 1 +f 2
e
ω2e − ω2 − iγeω
, (3.2)
where f 2e = Ne2/mǫ0 (N is the number density of (atomic) oscillators, ǫ0 is the permit-
tivity of free space while e and m are the electronic charge and mass, respectively), ωe

72 Coherently Controlled Metamaterials at Optical Frequencies
Figure 3.2: A section through a SRR-based metamaterial showing the periodic arrange-ment of the SRRs, embedded in a host medium with a dispersive permittivity, indicatedby the grey region in the figure.
is the dielectric resonance frequency and γe is the dissipation factor. Such a dispersion
can be realized by using for example, resonant quantum dots or choosing a Raman tran-
sition [98] with a strong pump field ensuring that the resonant Raman probe frequency
is close to the magnetic resonance frequency of the metamaterial, ωm. The dependence
of the level spacing in quantum dots upon their size and their tunability makes them
suitable for this purpose.
In the second case, when the medium exhibits EIT, the permittivity for the probe
field is given by [69]
ǫEIT
(ω) = 1 +κ(ω1 − ω)
(ω1 − ω)2 − Ω2c
4− iγ13(ω1 − ω)
. (3.3)
Here ω1 = E1−E3
~(as shown in Fig. 1.13), Ωc is the Rabi frequency of the control field
defined as Ωc =~d12· ~E
~, κ = (Na|〈d13〉|2)/(ǫ0~) is the strength of the transition, Na is the
atomic density, γ13 and d13 represent the decay rate and the dipole moment, respectively,
between the atomic levels |1〉 and |3〉 while d12 represents the dipole moment between
levels |1〉 and |2〉 (see Fig. 1.13). It should be noted that in the absence of the control

Analytical description 73
field, the dispersion obtained is the same as in the case of the Lorentz permittivity.
In the presence of the embedding medium, the capacitance per unit length of indi-
vidual SRR units becomes strongly frequency-dependent as
Ceff(ω) =ǫ(ω)L
d. (3.4)
This makes the resonance frequency of the composite medium (ωeff) appear frequency
dispersive as ωeff = ωm√ǫ(ω)
. Thus, the effective permeability of the composite metamate-
rial now formally becomes:
µeff(ω) = 1 +fmω
2
ω2eff − ω2 − iΓmω
. (3.5)
The sharply resonant nature of ǫ(ω) results in the SRR medium showing a resonant
magnetic response at multiple frequencies. These predominantly occur above and below
ωm, depending on whether the frequency of the incident wave is greater than or lesser
than ωe, respectively. The proximity of the two resonances to each other determines the
extent of the modulation produced in µeff . It is to be noted that the frequency-dispersive
resonance frequency (ωeff) is a complex quantity. The new resonance frequencies are the
solutions of the transcendental equation
Re[
ω2m/ǫ(ω)
]
− ω2 = 0, (3.6)
while Im[ω2m/ǫ(ω)] quantifies the dissipation in the effective medium. Essentially, the
presence of the dispersive dielectric permittivity of the embedding medium turns the
SRR into a resonantly driven, actively tuned LC-circuit. The capacitance of the LC-
circuit becomes frequency dependent, allowing the satisfaction of the resonance condi-
tions Eq. (3.6) at multiple frequencies. The corresponding negative-µ band gap of the
‘bare’ SRR splits into two or more band gaps.
In the presence of ǫ(ω), the filling fraction feff and the dissipation parameter of
the composite metamaterial can be viewed as effective frequency dependent quantities

74 Coherently Controlled Metamaterials at Optical Frequencies
50 60 70 80 90
-2
0
2
4
6
Re(eff
) Im(
eff)
Frequency (THz)
(a)
70 75 801E-61E-51E-41E-30.010.11101001000
eff
feff
(b)
Frequency (THz)
50 60 70 80 90
-2
0
2
4
6
Re(eff
) Im(
eff)
(c)
Frequency (THz)70 75 80
1E-61E-51E-41E-30.010.11101001000
eff
feff
(d)
Frequency (THz)
Figure 3.3: (a): The frequency dependent µeff and (b): Γeff and filling fraction feff (ob-tained analytically) for the SRR metamaterial in the presence of a embedding dielectricmedium displaying EIT.(c) and (d): The same quantities for the SRR metamaterial embedded in a mediumwhich has a resonant Lorentz permittivity. In this case, the magnetic resonance occursat 74.9 THz and the dielectric resonance is at 73.6 THz
whose behaviours are completely transformed by the resonant background. The effective
filling fraction feff and the effective dissipation parameter Γeff have the following generic
forms in the presence of a frequency-dispersive background:
feff(ω) = fm
[
Re [ǫ(ω)]2 + Im [ǫ(ω)]2]
, (3.7)
Γeff(ω) = ω2m
Im [ǫ(ω)]
ω+ ΓmRe [ǫ(ω)]2 + ΓmIm [ǫ(ω)]2. (3.8)
A detailed analysis of properties of a composite metamaterial where the embedded
dielectric has a Lorentz or EIT dispersion is now presented. If the background dielectric

Analytical description 75
medium has a Lorentz-type dispersion, the following expressions for feff and Γeff are
obtained:
feff = fm
[
1 +f 2
e (2(ω2e − ω2) + f 2
e )
(ω2e − ω2)2 + (γeω)2
]
, (3.9)
Γeff = Γm +Γmf
2e (2(ω2
e − ω2) + f 2e ) + ω2
mf2e γe
(ω2e − ω2)2 + (γeω)2
. (3.10)
Along with the two new magnetic resonance frequencies and a split in the negative
µ-band, a region with significantly reduced absorption is observed between the two
resonances (Fig. 3.3). In fact, the Im[µeff ] is observed to pass through a minimum at
the resonant frequency of the bare SRR if ωm = ωe (Fig. 3.3 (c)). There is also a
significant change in the nature of feff and Γeff around the frequency ωe (Fig. 3.3 (d)).
The large values of feff at ωe is due to the resonant enhancement of the cross-section
of the SRR structural unit: the SRR appear much larger to radiation at resonance
than they actually are. The reduction in absorption at ωe is due to the vanishing of the
currents in the SRR. This results from an interplay of two currents giving rise to different
charge densities. The first of these is due to the current induced in the SRR unit by the
magnetic field of the incident radiation. The second arises due to the fluctuating electric
polarization of the embedding dielectric background by the electric field of the incident
light. At resonance, the two are out of phase with each other leading to the freezing of
currents in the SRR. The proximity of ωe to ωm determines the extent of modulation
of the µeff response. In other words, the interaction between the electric and magnetic
resonances is the strongest when ωe lies in the vicinity of ωm, (ωm ± Γm). Otherwise,
the two resonances are virtually uncoupled.
The magnetic response of the composite metamaterial embedded in an EIT medium
exhibits multiple magnetic resonances as seen in Fig. 3.3 (a). This is again accompanied
by substantially reduced absorption within two frequency bands. The strength and the
detuning of the control field can both be used to shift the positions, widths, slopes and
dissipation associated with the various resonances in µeff . In fact, this scheme is more
amenable to control as compared to the one described earlier because the detunings of

76 Coherently Controlled Metamaterials at Optical Frequencies
the probe and the control beams (both positive and negative) can be used to shift the
EIT line centre and hence, the frequencies at which the absorption in the metamaterial
is reduced. Again, the effective filling fraction and the modified dissipation parameter
are given by
feff = fm
[
1 +κ∆(2(∆2 − Ω2
c/4) + κ∆)
(∆2 − Ω2c/4)2 + (γ12∆)2
]
, (3.11)
Γeff = Γm +Γmκ∆(2(∆2 − Ω2
c/4) + κ∆) + ω2m/ωκ∆
2γ12
(∆2 − Ω2c/4)2 + (γ12∆)2
, (3.12)
where ∆ = ω1 − ω.
From the preceding expressions, we find that the new filling fraction feff increases
close to the resonant frequency while Γeff exhibits sub-classical (Γeff ≪ Γm) values
around the atomic resonances (Fig. 3.3 (b)). At the EIT line centre frequency (ω1),
feff and Γeff are found to have the same values as the bare SRR medium. Thus, when
∆c = 0 (∆c is the detuning of the control field) and the separation between the dressed
states (See Chap. 1, Sec. 1.5.2) is the separation between the Autler-Townes doublet,
namely ∆ = ±Ωc
2[99], Γeff = Γm. As noted before, the reduction in absorption is
a manifestation of the vanishing currents in the SRR loops. It is interesting to note
that the losses are reduced significantly only for the regions where Re [µeff ] > 0, (see
Fig. 3.3), in agreement with the speculations of Stockman that a non-dissipative negative
parameter regime does not manifest for any metamaterial [100].
If the metamaterial has been designed to exhibit a resonant response at the frequency
of the EIT line centre in the absence of medium, the resonant magnetic response of the
composite metamaterial is found to be such that Re [µeff ] → 1 (with an associated
imaginary part) exactly at the EIT line centre. However, if ωm 6= ω1, the response
of the composite at the EIT line centre is simply the value of µbare at the frequency
ω1. It should be emphasized that since we are dealing with a resonant system with
a highly dispersive lineshape, changes of the control parameter (ǫL or ǫEIT) can lead
to large-scale changes in response (µeff) at a given frequency, due to the shift in the
effective resonance frequency. All these theoretical deductions have been confirmed by

Numerical Simulation of the SRR metamaterial at mid-IR frequencies 77
the numerical studies on these systems that have been presented in the next section.
3.2 Numerical Simulation of the SRR metamaterial
at mid-IR frequencies
Numerical simulations using the PHOTON codes based on the Transfer Matrix Method
(TMM) [75, 76] were carried out to verify our theoretical predictions. We present two
examples, the first being the canonical example of subwavelength-sized SRR made of
silver at mid-infrared (mid-IR) frequencies. The structures were modelled as being em-
bedded in a resonant background. The second example we present is that of silver SRR
at near-infrared frequencies infused with metastable helium gas. We have used experi-
mentally obtained parameters for silver [77] in our calculations. All metallic inclusions
investigated in this chapter, as well as in subsequent chapters, are considered to be made
of silver.
As mentioned earlier, the metamaterial shows magnetic activity for applied radiation
polarized with the magnetic field along the (out of plane) SRR axis. The cross-section of
the (cylindrical) SRR that we considered in this case is shown in Fig. 3.1. Seventy-five
grid points along each direction were used for computing the band structure as well as
the reflection and the transmission coefficients. This number is found to be optimum for
the unit cell sizes considered as far as the convergence of the results and the restrictions
on the number of grid points imposed by the code [101] itself are concerned.
Invariance along the cylindrical axis is assumed. The bare SRR in this case has a
magnetic resonance frequency of 74.9 THz. This metamaterial containing a Lorentz-
type dielectric within its capacitive gaps is modelled using the following parameters:
fe = 24.1 THz, ωe = 74.9 THz and γe = 2.4THz.
As predicted in the preceding section, it is seen that the negative µ band splits
in the presence of the embedding dielectric medium. The frequencies at which the
new band gaps are formed are consistent with the predicted values. The mismatch

78 Coherently Controlled Metamaterials at Optical Frequencies
50
60
70
80
90
100
-3 -2 -1 0 1 2 3
Re(ka)
Freq
uenc
y (T
Hz)
(a)
50 60 70 80 90 1000.0
0.2
0.4
0.6
0.8
1.0
|T|2 , |
R|2
(b)
Frequency (THz)
50 60 70 80 90 100
0
1
2(c)
Re[
z eff(
)], Im
[zef
f()]
Frequency (THz)50 60 70 80 90 100
0
2
4
6
8
Re[
eff(
)], Im
[ef
f()](d)
Frequency (THz)
Figure 3.4: (a): The computed band structures for the bare SRR (red circles) andthe composite metamaterial embedded in a Raman medium (black squares) under thecondition ωe = ωm. The blue lines represent the dispersion predicted by the analyticformula. The band gaps due to µeff < 0 are indicated by the cross-hatched region on theright (for the bare SRR whose ωm = 74.9THz) and the the two hatched regions on thethe left (for the band gaps resulting from the inclusion of the resonant Raman medium).(b): The reflectivity and the transmittivity for a calculated for a slab consisting of asingle layer of SRR. Note the presence of two stop bands (low |T |2) corresponding tothe band gap frequencies in (a) and the new transmittive band that develops within theoriginal band gap.(c): The effective impedance Z(ν) of the composite metamaterial showing the presenceof two resonances.(d): The µeff , for a slab of the SRR metamaterial with an embedded resonant medium,retrieved using the computed reflection and the transmission coefficients. Note theexistence of two frequency ranges where µeff < 0. The grey dotted line represents thezero level.

Numerical Simulation of the SRR metamaterial at mid-IR frequencies 79
between the results of the TMM calculation and the analytic formula can be attributed
to the presence of parasitic capacitances in the SRR. These capacitances, which were
neglected in the theoretical model used to describe the functioning of the SRR [44], are
automatically taken into account in the TMM simulation.
The results of the band structure calculation and the reflectivity and the transmit-
tivity of the composite medium were compared with the same quantities calculated for
a slab consisting of a single layer of the SRR. A new propagating band (further con-
firmed by a peak in the transmittivity) is found to occur within the stop band region
of the bare SRR medium. The frequency intervals corresponding to the new band gaps
(regions of high reflectivity and low transmittivity) were found to be consistent with
the band structure calculations. To illustrate the splitting of the negative permeability
band, the effective material parameters for a slab consisting of four unit cell layers of the
SRR-dielectric composite were determined using a retrieval procedure that utilizes the
complex reflection and transmission coefficients [34]. Since these SRR are well subwave-
length (a ∼ λ/10) at these frequencies, the SRR medium can be thought to constitute
an effective medium and it is expected that the metamaterial can be homogenized. The
splitting of the negative permeability band is made evident by the large reflectivity
at frequencies in the band gap between these bands. This splitting of the negative µ
band is found to be consistent with the values predicted by the analytic model (Fig.
3.4 (d)) and also with the simulated band structure as well as the reflectivity and the
transmittivity plots. In addition, Fig. 3.4 (c) shows the effective impedance Z(ν) of the
metamaterial, with two resonances at the same frequencies as the negative permeability
bands, in contrast with the single peak in Z(ν) observed for the bare SRR medium [44]
.
Fig. 3.5 illustrates the response of the metamaterial when the dielectric and the
magnetic resonances do not coincide, i.e., ωe 6= ωm. The negative permeability band
splits as before, but the new resonances are either red-shifted or blue-shifted (with
respect to those obtained when ωe = ωm), depending on whether ωe < ωm or ωe > ωm.
A study of the reflection and transmission coefficients for a slab consisting of four unit

80 Coherently Controlled Metamaterials at Optical Frequencies
50
60
70
80
90
100
-3 -2 -1 0 1 2 3
Re(ka)
Freq
uenc
y (T
Hz)
(a)
e = 79.69THz
-3 -2 -1 0 1 2 3
e = 70.03THz
Re(ka)
(b)
50 60 70 80 90 1000.0
0.2
0.4
0.6
0.8
1.0
e = 79.69THz
|T|2 , |
R|2
Frequency (THz)
(c)
50 60 70 80 90 100
e = 70.03THz
Frequency (THz)
(d)
Figure 3.5: The band structures and (|T |2, |R|2) for the composite metamaterial whenωm 6= ωe. (a): Band structure of the composite metamaterial when ωe = 79.69 THz.The resulting gaps are blue-shifted with respect to those obtained when ωe = ωm.(b): Band structure of the composite metamaterial when ωe = 70.03 THz. In this case,the resulting gaps are red-shifted with respect to those obtained when ωe = ωm.(c) & (d): Reflectivity and transmittivity calculated for a slab consisting of four layersof unit cells. The minima in |T |2 correspond to the new band gaps.
cell layers of the SRR further confirms this behaviour. As seen in the case when ωm = ωe,
two regions of enhanced reflectivity (corresponding to the band gaps) separated by a
transmittive region (corresponding to the additional propagating band that develops) are
observed. For multiple layers, additional peaks due to Fabry-Perot resonances (arising
as a result of multiple scattering) are observed. In each case, the calculated effective
impedance (Z(ν)) of the structure (shown in Fig. 3.6) reveals the presence of two peaks,
signifying the occurrence of two magnetic resonances. However, the effect of the resonant
Lorentz medium weakens considerably when the two resonances are far apart.
In the next section, we describe how appropriately designed metamaterials with SRR
structures, embedded in resonant atomic media, can be shown to behave in a similar

Simulation of the optical SRR metamaterial 81
50 60 70 80 90 1000
1
2 e = 70.03THz Re[z( )]
Im[z( )]
Re[
z()],
Im[z
()]
Re[
z()],
Im[z
()]
Re[
z()],
Im[z
()]
X Axis Title
(a)
50 60 70 80 90 1000
1
2
3
e = 73.65 THz
Re[z( )] Im[z( )]
X Axis Title
(b)
50 60 70 80 90 1000
1
2
3
e = 76.06 THz
Re[z( )] Im[z( )]
Re[
z()],
Im[z
()]
X Axis Title
(c)
50 60 70 80 90 1000
1
2
3
4
e = 79.69THz
Re[z( )] Im[z( )]
X Axis Title
(d)
Figure 3.6: (a)-(d) The effective impedance (Z) of the composite metamaterial whenthe magnetic resonance frequency and the resonance frequency of the dielectric mediumare different. The plots of Z(ν) for the dielectric resonances at 70.03 THz, 73.65 THz,76.06 THz and 79.69 THz respectively (away from ωm at 74.9 THz), shows the presenceof two peaks, signifying the occurrence of two magnetic resonances.
manner at NIR/optical frequencies [102].
3.3 Simulation of the optical SRR metamaterial
In this section, we demonstrate numerically the coherent control of SRR-based metama-
terials at optical (NIR) frequencies. The dimensions and cross-section of the SRR are
shown in the right panel of Fig. 3.7. These simulations were also carried out using the
PHOTON codes. This SRR metamaterial has a resonant frequency of about 272 THz
and a band-gap of about 1.5 THz, corresponding to µ < 0, is obtained above the reso-

82 Coherently Controlled Metamaterials at Optical Frequencies
Control field
Probe field1083 nm
2 S13
13 S3
32 P
|2>
|1>
|3>
τ ~ 8000 s
706 nm
21
0
~ 100nsτ
28 nm
20 nm
164 nm
240 nm
E
k
B
Figure 3.7: Left: The level structure diagram of the relevant levels involved in EIT formetastable helium.Right: The cross-section and dimensions of the SRR used to demonstrate coherentcontrol of SRR-based metamaterials at NIR and optical frequencies.
nance frequency. A dielectric medium, resonant at frequencies close to this, can now be
introduced into this metamaterial in order to investigate how its response is modified.
For example, metastable helium has an EIT transition at 276.97 THz, (or λ = 1083
nm) [103] with the control field applied at 424.75 THz (706 nm) lying in a (higher)
pass band. The level structure of the system has been shown in Fig. 3.7. Metastable
helium can be produced in an electric discharge and has a long lifetime of about 8000
seconds [104]. After excitation in a discharge it can be introduced into the metamaterial
structure by infusing it into an evacuated chamber in which the metamaterial structure
has been placed. Paraffin coatings may be utilized to prevent collisional de-excitation
of the metastable helium.
Fig. 3.8 (a) and (b) show the modified band structure of this metamaterial. As before,
invariance along the SRR (cylindrical) axis is assumed and the calculation is essentially
two dimensional. Infusion of metastable helium gas into the metamaterial results in
a resonant response and the resultant formation of a band gap as it is equivalent to
introducing a Lorentzian resonance at 1083 nm. The band structure of the metamaterial
shows the development of additional propagating bands within the bandgap of the bare
SRR medium after the infusion of the helium gas into it. In the absence of the control
field, there are two broad propagating bands, with a bandgap between 276.958 THz and
276.996 THz, that arise due to the absorptive resonance of the metastable helium. An
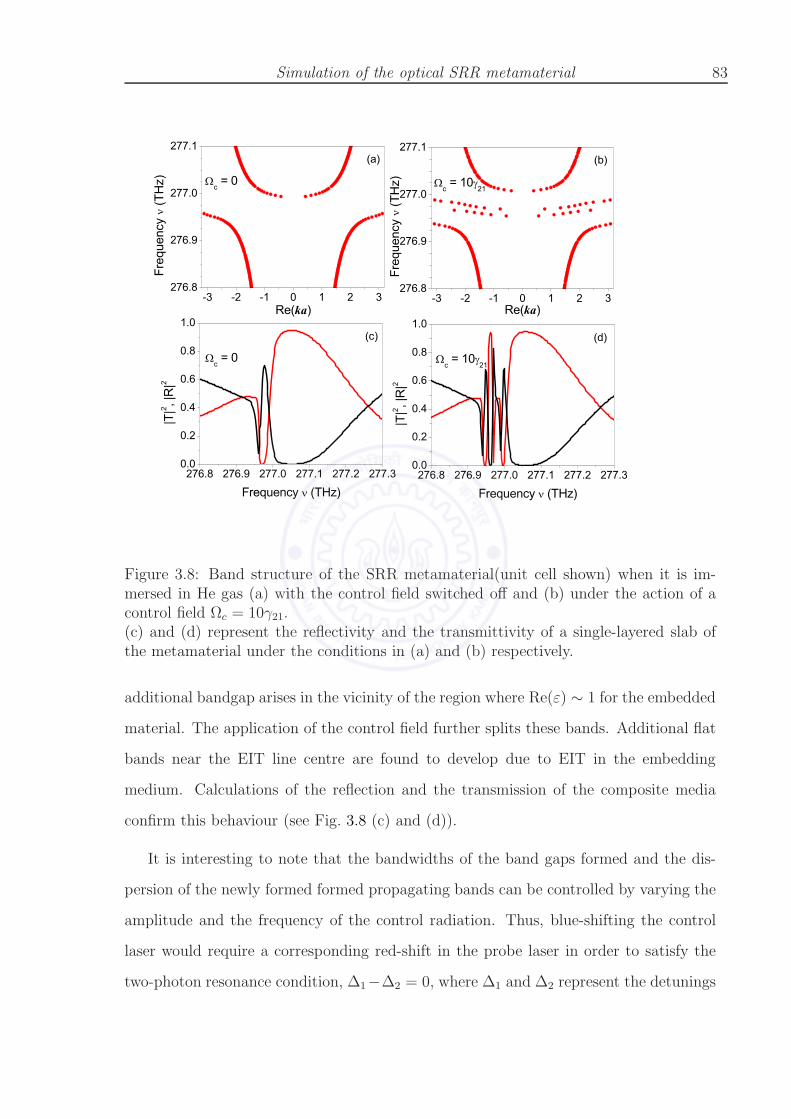
Simulation of the optical SRR metamaterial 83
276.8
276.9
277.0
277.1
-3 -2 -1 0 1 2 3
c = 0
c = 0
(d)(c)
(b)(a)
Re(ka)
Freq
uenc
y (T
Hz)
276.8
276.9
277.0
277.1
-3 -2 -1 0 1 2 3
c = 10 21
Re(ka)
Freq
uenc
y (T
Hz)
276.8 276.9 277.0 277.1 277.2 277.30.0
0.2
0.4
0.6
0.8
1.0
|T|2 , |
R|2
Frequency (THz)276.8 276.9 277.0 277.1 277.2 277.3
0.0
0.2
0.4
0.6
0.8
1.0
c = 10 21
|T|2 , |
R|2
Frequency (THz)
Figure 3.8: Band structure of the SRR metamaterial(unit cell shown) when it is im-mersed in He gas (a) with the control field switched off and (b) under the action of acontrol field Ωc = 10γ21.(c) and (d) represent the reflectivity and the transmittivity of a single-layered slab ofthe metamaterial under the conditions in (a) and (b) respectively.
additional bandgap arises in the vicinity of the region where Re(ε) ∼ 1 for the embedded
material. The application of the control field further splits these bands. Additional flat
bands near the EIT line centre are found to develop due to EIT in the embedding
medium. Calculations of the reflection and the transmission of the composite media
confirm this behaviour (see Fig. 3.8 (c) and (d)).
It is interesting to note that the bandwidths of the band gaps formed and the dis-
persion of the newly formed formed propagating bands can be controlled by varying the
amplitude and the frequency of the control radiation. Thus, blue-shifting the control
laser would require a corresponding red-shift in the probe laser in order to satisfy the
two-photon resonance condition, ∆1−∆2 = 0, where ∆1 and ∆2 represent the detunings

84 Coherently Controlled Metamaterials at Optical Frequencies
of the probe and the control fields, respectively (See Fig. 1.13). This ensures the pos-
sibility of aligning the EIT resonance at a desired frequency in/around the band gaps.
In Fig 3.8 (c) and (d), we show the reflectivity and the transmittivity of light incident
on a slab of SRR medium composed of a single unit cell layer, with and without the
EIT control field. Sharp switching of the reflectivity and the transmittivity at specific
frequencies that are entirely governed by the control field parameters, are observed.
In particular, around 277 THz, the transmittivity drops dramatically from nearly 95%
to a few percent within a bandwidth of ∼10 GHz indicating its potential for use as a
narrow-band spectral filter.
We note that non-resonant rescaling of the capacitance resulting in the tuning of the
resonance frequency by upto 20% has been recently demonstrated at about 1THz [92].
However, there are differences between their approach and the present proposal, even
though both schemes involve external optical control over the metamaterial response.
In their paper, Padilla et. al have demonstrated the tuning of the effective permittivity
of split ring resonators [40, 105, 106] via their resonance frequency by incorporating
semiconductors into critical regions of the SRR. Using capacitor plates made out of
semiconducting materials, they were able to control the conductivity response and hence,
the resonance frequency by means of photoexcitation of charge carriers. Compared to
the approach adopted in [93, 107, 108], the capacitance is not shorted out, but results
only in a monotonic lowering of the resonance frequency. A tuning range of ∼ 20 % was
observed. Similarly if the inductance of the SRRs is increased, the resonance frequency
increases by around 15% to 40% [92].
In Fig. 3.9, we show the reflectivity and transmittivity for a thicker stack of four
layers of SRR metamaterial in the absence and the presence of the control field, in
the case of normal incidence. In the absence of the control field, the dispersion of
the medium reduces to the Lorentz-type. We remark that the control field parameters
used in all these simulations are Ωc = 10 γ21 = 24 GHz (typically experiments use
Ωc = γ21 to Ωc = 3γ21 ). For example, Pavone [103] shows the occurrence of complete
transparency at 1083 nm for the 23S1 → 23P0 component, with He pressure 80 mTorr,

Simulation of the optical SRR metamaterial 85
276.6 276.8 277.0 277.2 0.0
0.2
0.4
0.6
0.8
|T| 2 , |
R| 2
Frequency (THz)
276.6 276.8 277.0 277.2 0.0
0.2
0.4
0.6
0.8
|T| 2 , |
R| 2
Frequency (THz)
Figure 3.9: The reflectance (Red) and transmittance (black) across four layers of unitcells of SRR metamaterials immersed in metastable helium gas with: (left) zero controlfield and (right) control field corresponding to Ωc = 10γ21.
discharge current 150 mA, and dressing laser power 350 mW focused with a 400µm
beam diameter. In the case of the SRR, due to the large electromagnetic local field
enhancements that are possible in the capacitive gaps, this is a very representative
value of the control field. The presence of the control field causes narrow transmission
resonances to crop up within the bandgap between the two propagating bands. We
note that the location and width of the transmission peaks can be shifted in frequency
by changing Ωc via the amplitude or the detuning of the control laser field. Thus,
the control field can enable switching the transmission from literally zero to a large
value of about 80% at any desired frequency within the bandgap. When multiple layers
of unit cells are considered, (four in this case), one can additionally see fine features
in the behaviour of the transmission and the reflection. These arise from the Fabry-
Perot resonances of the slab, due to multiple scattering. These coupled with the control
via EIT can lead to extremely narrow transmission peaks that suggests the use of such
materials as candidates for switchable narrow band filters and cavity tuners in the optics
of metamaterials.
Once again, we would like to emphasize that the band-widths of the gaps and the dis-
persion of the propagating bands formed can all be controlled dynamically by changing
the amplitude and the frequency of the control radiation and it is possible to posi-
tion the EIT line centre at any desired location in/near the band gap, as long as the
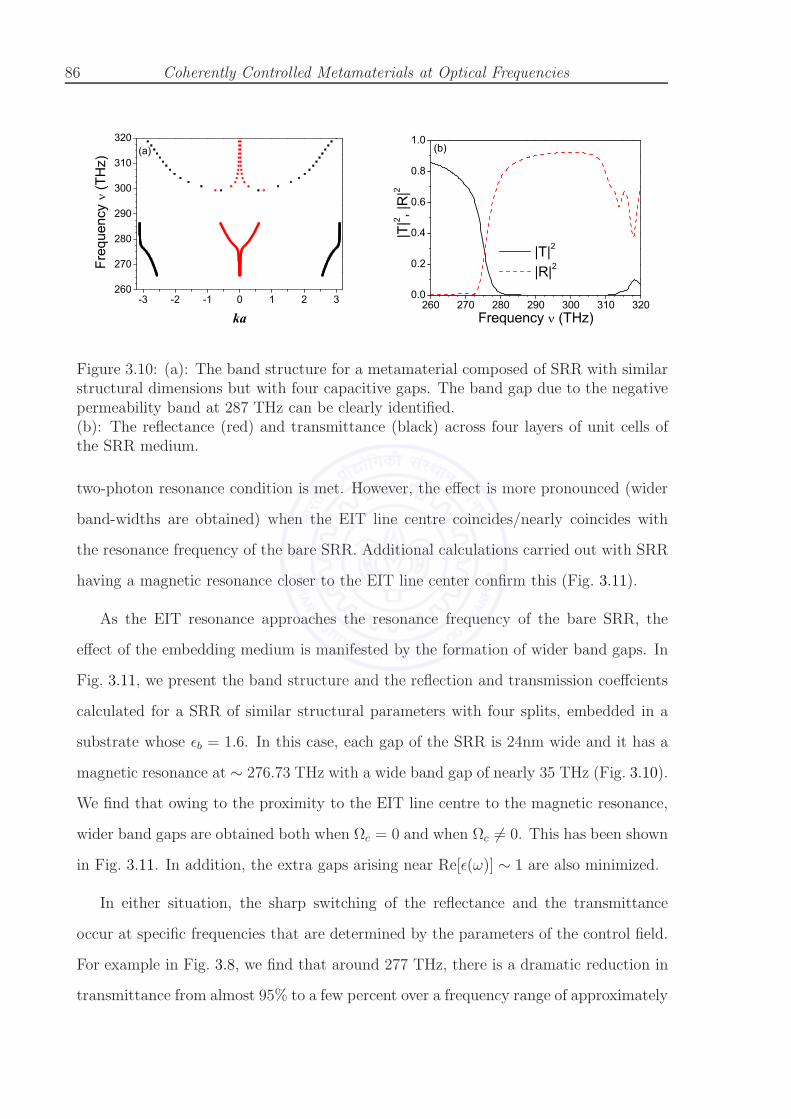
86 Coherently Controlled Metamaterials at Optical Frequencies
260
270
280
290
300
310
320
-3 -2 -1 0 1 2 3
ka
Freq
uenc
y (T
Hz)
(a)
260 270 280 290 300 310 3200.0
0.2
0.4
0.6
0.8
1.0
|T|2
|R|2
|T|2 , |
R|2
Frequency (THz)
(b)
Figure 3.10: (a): The band structure for a metamaterial composed of SRR with similarstructural dimensions but with four capacitive gaps. The band gap due to the negativepermeability band at 287 THz can be clearly identified.(b): The reflectance (red) and transmittance (black) across four layers of unit cells ofthe SRR medium.
two-photon resonance condition is met. However, the effect is more pronounced (wider
band-widths are obtained) when the EIT line centre coincides/nearly coincides with
the resonance frequency of the bare SRR. Additional calculations carried out with SRR
having a magnetic resonance closer to the EIT line center confirm this (Fig. 3.11).
As the EIT resonance approaches the resonance frequency of the bare SRR, the
effect of the embedding medium is manifested by the formation of wider band gaps. In
Fig. 3.11, we present the band structure and the reflection and transmission coeffcients
calculated for a SRR of similar structural parameters with four splits, embedded in a
substrate whose ǫb = 1.6. In this case, each gap of the SRR is 24nm wide and it has a
magnetic resonance at ∼ 276.73 THz with a wide band gap of nearly 35 THz (Fig. 3.10).
We find that owing to the proximity to the EIT line centre to the magnetic resonance,
wider band gaps are obtained both when Ωc = 0 and when Ωc 6= 0. This has been shown
in Fig. 3.11. In addition, the extra gaps arising near Re[ǫ(ω)] ∼ 1 are also minimized.
In either situation, the sharp switching of the reflectance and the transmittance
occur at specific frequencies that are determined by the parameters of the control field.
For example in Fig. 3.8, we find that around 277 THz, there is a dramatic reduction in
transmittance from almost 95% to a few percent over a frequency range of approximately

Simulation of the optical SRR metamaterial 87
276.6
276.8
277.0
277.2
-4 -3 -2 -1 0 1 2 3 4
c = 0
c = 0
(d)(c)
(b)(a)
Re(ka)
Freq
uenc
y (T
Hz)
276.6
276.8
277.0
277.2
-4 -3 -2 -1 0 1 2 3 4
c = 10 21
Re(ka)
Freq
uenc
y (T
Hz)
276.6 276.8 277.0 277.20.0
0.2
0.4
0.6
0.8
1.0
|T|2 , |
R|2
Frequency (THz)276.6 276.8 277.0 277.2
0.0
0.2
0.4
0.6
0.8
1.0
c = 10 21
|T|2 ,|R
|2
Frequency (THz)
Figure 3.11: Band structure of a metamaterial consisting of SRR having four splits whenit is immersed in He gas (a) with the control field switched off and (b) under the actionof a control field Ωc = 10γ21. (c) and (d) represent the reflectivity and the transmittivityof a single-layered slab of the metamaterial under the conditions specified in (a) and (b)respectively.
10 GHz. Such dramatic changes in the transmission properties highlight its potential
for extremely narrow-band switching applications.
The following points are to be noted. First of all, we have assumed that the EIT
effect is itself not hampered by the metamaterial. This assumption is justified as we
have chosen the EIT control field to lie within a propagating band and well within
the first Brillouin zone, hence the control field would be expected to be uniform across
the medium. It is also expected that the introduction of the metastable atomic gas
within the metamaterial structure will not affect the atomic decay rates significantly.
Second, we have not attempted to homogenize this structure since it is only slightly less
88 Coherently Controlled Metamaterials at Optical Frequencies
than a quarter of the free space wavelength. At length scales such as this, the effective
medium parameters are considerably influenced by the electric field of the incident radia-
tion. Thus, in view of this, only the photonic bandstructure and transmission/reflection
properties of this metamaterial (such as those presented in Fig. 3.8 and elsewhere) have
been used to characterize the nature of their electromagnetic response. However, it is to
be noted that the impedance (Z(ν)) calculated (but not shown here) for this composite
metamaterial continues to have a multiple-peaked nature characteristic of the splitting
of the magnetic resonance.
3.4 Robustness of the control scheme
Although it is often seen that light interacting with mesoscopic metallic structures ex-
perience much higher dissipation than the bulk metal itself, we have found that our
results remain unaffected even if the intrinsic dissipation of the metal (silver, in this
case) is increased. This was verified by calculating the response of the composite meta-
material after artificially increasing the dissipation in the metal by two, two and a half
and three times. In each case, the response of the system did not change significantly,
as illustrated by Fig. 3.12.
There is another aspect of these structures that needs to be taken into account.
The resonance frequency of these metamaterials depends crucially on the accuracy with
which they can be fabricated. Thus, in practice, each metamaterial unit will be different
from the rest due to the inevitable inaccuracies that come up during fabrication, leading
to a distribution of resonance frequencies rather than a single resonance frequency. It
is possible that the consequent broadening of the magnetic resonance could wipe out
the narrow band effects predicted. Fortunately, the switching and control effects were
found to be rather robust against such inhomogeneous broadening.
The effects of disorder were modelled by taking into consideration the different res-
onance frequencies of the SRRs arising from imperfections in fabrication. Typically,
this would result in a random distribution of resonance frequencies. We consider the
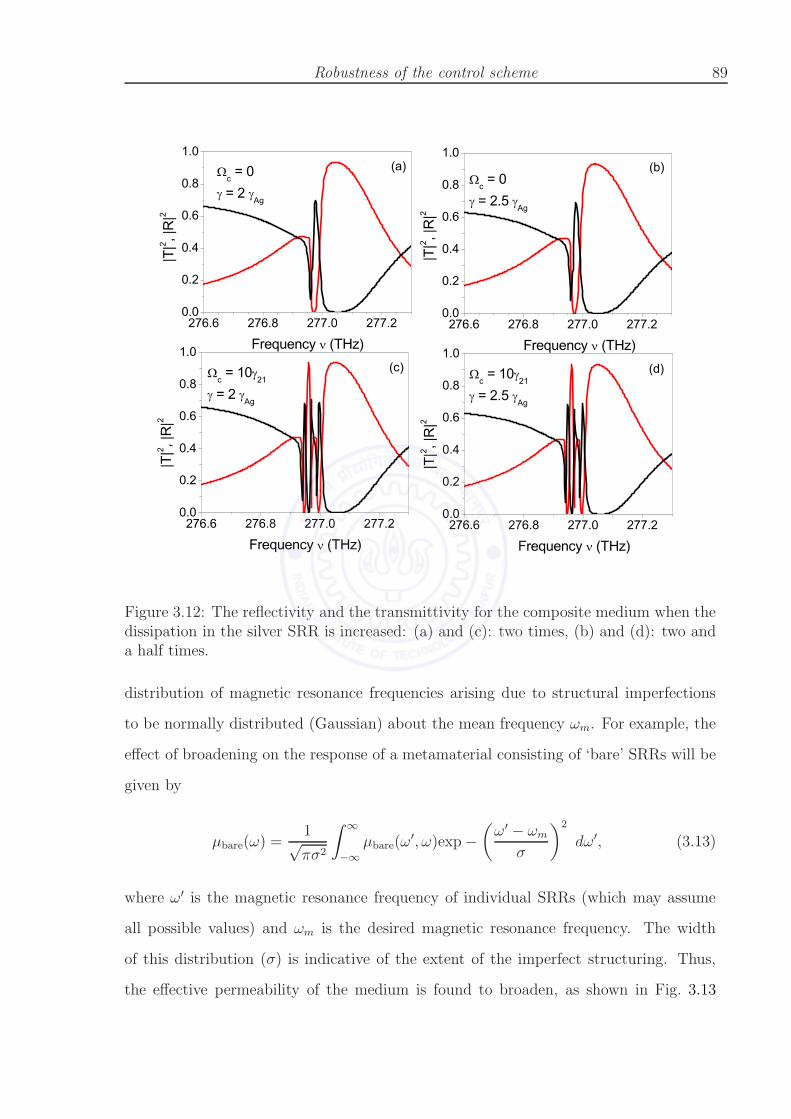
Robustness of the control scheme 89
276.6 276.8 277.0 277.20.0
0.2
0.4
0.6
0.8
1.0
c = 10 21
= 2 Ag
c = 0 = 2 Ag
(d)(c)
(b)(a)
|T|2 , |
R|2
Frequency (THz)276.6 276.8 277.0 277.2
0.0
0.2
0.4
0.6
0.8
1.0
c = 0 = 2.5 Ag
|T|2 , |
R|2
Frequency (THz)
276.6 276.8 277.0 277.20.0
0.2
0.4
0.6
0.8
1.0
|T|2 , |
R|2
Frequency (THz)276.6 276.8 277.0 277.2
0.0
0.2
0.4
0.6
0.8
1.0
c = 10 21
= 2.5 Ag
|T|2 , |
R|2
Frequency (THz)
Figure 3.12: The reflectivity and the transmittivity for the composite medium when thedissipation in the silver SRR is increased: (a) and (c): two times, (b) and (d): two anda half times.
distribution of magnetic resonance frequencies arising due to structural imperfections
to be normally distributed (Gaussian) about the mean frequency ωm. For example, the
effect of broadening on the response of a metamaterial consisting of ‘bare’ SRRs will be
given by
µbare(ω) =1√πσ2
∫ ∞
−∞µbare(ω
′, ω)exp −(
ω′ − ωm
σ
)2
dω′, (3.13)
where ω′ is the magnetic resonance frequency of individual SRRs (which may assume
all possible values) and ωm is the desired magnetic resonance frequency. The width
of this distribution (σ) is indicative of the extent of the imperfect structuring. Thus,
the effective permeability of the medium is found to broaden, as shown in Fig. 3.13

90 Coherently Controlled Metamaterials at Optical Frequencies
60 70 80 90-2
-1
0
1
2
3
4
= m/100 = m/10 = m
Re
[bare(
)]
in THz
(a)
65 70 75 80 850
1
2
3
4
5
6
Im(
eff)
Frequency (THz)
Broadened Unbroadened
(b)
Figure 3.13: (a): The effective permeability of the metamaterial for different widths ofthe distribution of the magnetic resonance frequency. The resonant µeff is washed outwhen the imperfections lead to σ ∼ ωm.(b): The broadened Im(µeff) of the metamaterial in the presence of a background mediumwhich exhibits EIT, for σ = ωm/100. The inset shows the details of the central part ofthe figure where the narrow features are seen to survive inspite of the broadening of theoverall response.
(a). Adopting a similar procedure for the other quantities and averaging over this
distribution, the following expressions were obtained:
〈ω2eff〉 = ω2
eff +ǫRσ
2
ǫ2R + ǫ2I(3.14)
〈Γeff〉 = Γeff +ǫIσ
2
ǫ2R + ǫ2I(3.15)
〈feff〉 = feff (3.16)
The effective filling fraction (feff) remains unaltered as it is independent of ωm.
For values of σ ∼ Γm, we find that the narrow band effects arising due to the presence
of ǫ(ω) survive (See Fig. 3.13 (b)). While the strength of the resonance decreases on the
whole due to the larger Γeff , the regions of reduced absorption between the resonances
remain nearly unaltered. The ‘increased’ filling fraction that remains unaffected by the
inhomogeneous broadening compensates for the effect of the imperfections. In other
words, the few resonant SRR units exhibit a large enough absorption cross-section such
that the reduced number of participating SRRs due to the inhomogeneous broadening
does not adversely affect the response on an average. Although accuracy in fabrication
Conclusion 91
still remains an important issue, we note that the controllable effects discussed here
are robust and generic to many metamaterials that depend upon resonances for their
electromagnetic properties.
Similar schemes for controlling the response of wire-like metamaterials that rely on
plasmonic resonances for their dielectric or magnetic response is also possible. This has
been discussed at length in the next chapter (Chap. 4). Collections of silver or gold
nanorods can be accurately fabricated with little size dispersion and consequently such
metamaterials will be less prone to the effects of inhomogeneous broadening.
3.5 Conclusion
Thus, we have demonstrated here a new paradigm for the parametric control of meta-
materials. The metamaterial response is completely transformed by incorporating co-
herently controllable resonant media into the design. This is marked by the occurrence
of multiple magnetic resonances and the consequent splitting of the negative perme-
ability band, accompanied by a redefinition of the filling fraction and the dissipation
in the SRR medium. The presence of the resonant dielectric background converts both
these parameters into frequency-dispersive quantities whose behaviours closely follow
the resonant nature of the dielectric. This results in a sharp increase in the effective
filling fraction near resonance of the dielectric. This has been attributed to the large
cross-section of the SRR at the resonance (of the order of the incident wavelength it-
self). Γeff may also assume sub-classical values around the same frequencies, owing to
the ‘freezing’ of currents in the SRR, even though the original SRR medium, as well
as the embedding dielectric are both dissipative. These effects have been studied for a
variety of background media such as dielectric media that have a Lorentz permittivity
as well as media that display Electromagnetically Induced Transparency. Our results
provide a new mechanism for reducing the dissipation inherent to metamaterials, which
has been the main hindrance thus far in developing applications.
The splitting of the negative-µ band of the SRR medium was verified by numerical

92 Coherently Controlled Metamaterials at Optical Frequencies
simulations at mid-IR and NIR frequencies. The numerical simulations of homogenizable
SRR media in the presence of a dispersive Lorentz permittivty at mid-IR frequencies
yields negative permeability bands over two frequency ranges, confirming the occurrence
of two magnetic resonances in place of the earlier single magnetic resonance. Similar
calculations at NIR frequencies with the SRR medium infused with metastable He gas,
in which EIT occurs close to the resonance frequency of the bare SRR medium, reveals
the occurrence of multiple transmission bands within the frequency regime spanned by
the original band gap. The frequencies and the widths of these bands may be controlled
via the strength of the EIT control field, highlighting the possibility of utilizing of
such metamaterials for developing switchable filters. The control scheme presented here
is also quite robust, both against the enhanced levels of dissipation associated with
mesoscopic metallic structures, as well the inhomogeneous broadening of the magnetic
resonance due to structural imperfections. Both these effects have the potential have
the potential to wipe out the narrow band effects predicted. However, our calculations
show that the narrow band effects survive, largely due to the increased feff at resonance
that nullifies the effects of structural defects of the SRRs.
Despite the control scheme being inherently dispersive, it results in a completely
tunable metamaterial that can be used effectively for a variety of narrow band applica-
tions. The robustness of this scheme towards structural imperfections and the fact that
the modified response obtained is generic to all resonant metamaterials only increases
its usefulness. It also highlights the possibility of developing controllable and reconfig-
urable metamaterials, the reconfigurability in this case being implemented by choosing
a slightly different resonance frequency for the (gaseous) background medium. There-
fore, our results bring together two powerful, yet very different ideas of metamaterials
and coherent control phenomena to manipulate the electromagnetic response of such
composite materials.

Chapter 4
Coherently Controlling Plasmonic
Metamaterials at Optical
Frequencies
The magnetic response of metamaterials, particularly the (SRR-based) metamaterials,
has been theoretically studied extensively at low frequencies (long wavelengths) when
effective medium theories are valid. At these frequencies, the medium can be described
in terms of the effective material parameters ǫeff and µeff as noted earlier in Chap. 1. Ex-
perimentally, many of the metamaterials realized are not truly homogenizable with the
unit cell sizes ranging from λ/20 to λ/4 [109], even at terahertz and mid-IR frequencies.
At higher frequencies, notably from the near-IR upwards, even designing metamate-
rials that behave as true effective media becomes a challenging proposition. It is indeed a
very difficult task to design metamaterials that have resonances at optical freqencies, but
it is nevertheless possible [110]. The possibility of inducing magnetic activity in optical
metamaterials has led to vigorous activity by researchers in this field. Several approaches
to this end have been proposed. These include metal nanoclusters [111, 112, 113, 114],
high permittivity inclusions [115], pairs of plasmonic particles [116, 117, 78], fishnet
structures [118, 119], etc. However, these metamaterials can have their own drawbacks,
such as significant losses as well as having anisotropic and polarization sensitive re-
93
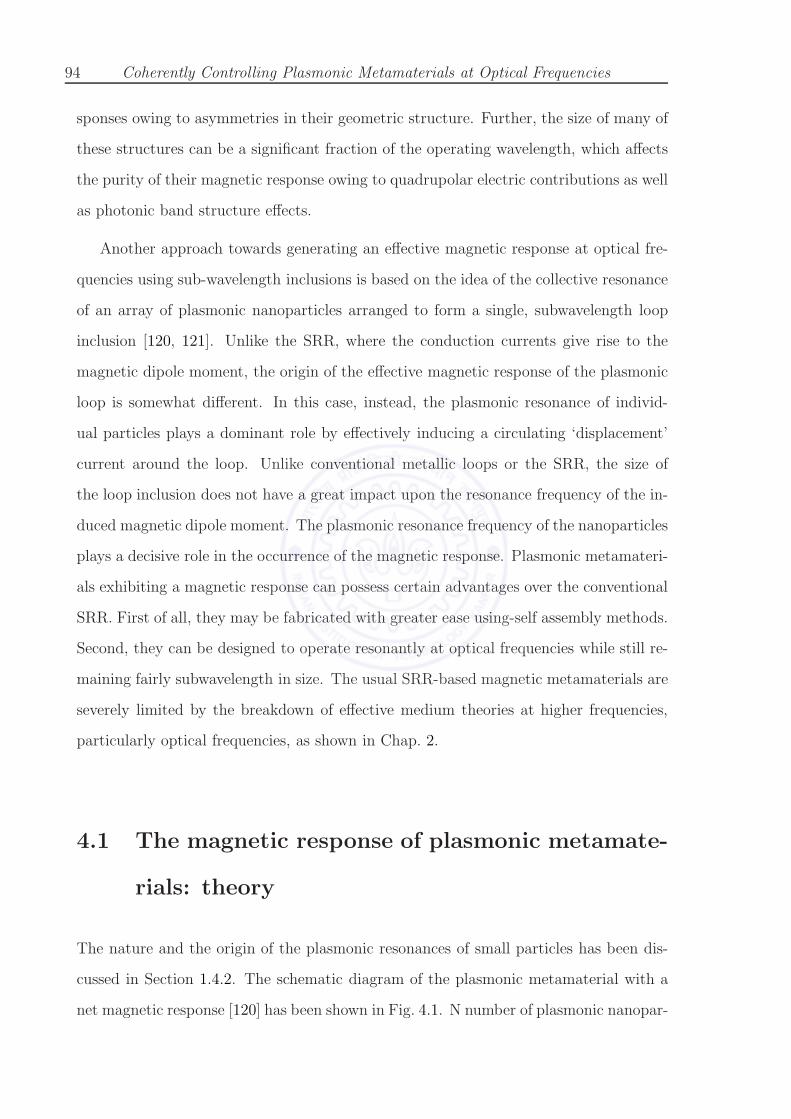
94 Coherently Controlling Plasmonic Metamaterials at Optical Frequencies
sponses owing to asymmetries in their geometric structure. Further, the size of many of
these structures can be a significant fraction of the operating wavelength, which affects
the purity of their magnetic response owing to quadrupolar electric contributions as well
as photonic band structure effects.
Another approach towards generating an effective magnetic response at optical fre-
quencies using sub-wavelength inclusions is based on the idea of the collective resonance
of an array of plasmonic nanoparticles arranged to form a single, subwavelength loop
inclusion [120, 121]. Unlike the SRR, where the conduction currents give rise to the
magnetic dipole moment, the origin of the effective magnetic response of the plasmonic
loop is somewhat different. In this case, instead, the plasmonic resonance of individ-
ual particles plays a dominant role by effectively inducing a circulating ‘displacement’
current around the loop. Unlike conventional metallic loops or the SRR, the size of
the loop inclusion does not have a great impact upon the resonance frequency of the in-
duced magnetic dipole moment. The plasmonic resonance frequency of the nanoparticles
plays a decisive role in the occurrence of the magnetic response. Plasmonic metamateri-
als exhibiting a magnetic response can possess certain advantages over the conventional
SRR. First of all, they may be fabricated with greater ease using-self assembly methods.
Second, they can be designed to operate resonantly at optical frequencies while still re-
maining fairly subwavelength in size. The usual SRR-based magnetic metamaterials are
severely limited by the breakdown of effective medium theories at higher frequencies,
particularly optical frequencies, as shown in Chap. 2.
4.1 The magnetic response of plasmonic metamate-
rials: theory
The nature and the origin of the plasmonic resonances of small particles has been dis-
cussed in Section 1.4.2. The schematic diagram of the plasmonic metamaterial with a
net magnetic response [120] has been shown in Fig. 4.1. N number of plasmonic nanopar-
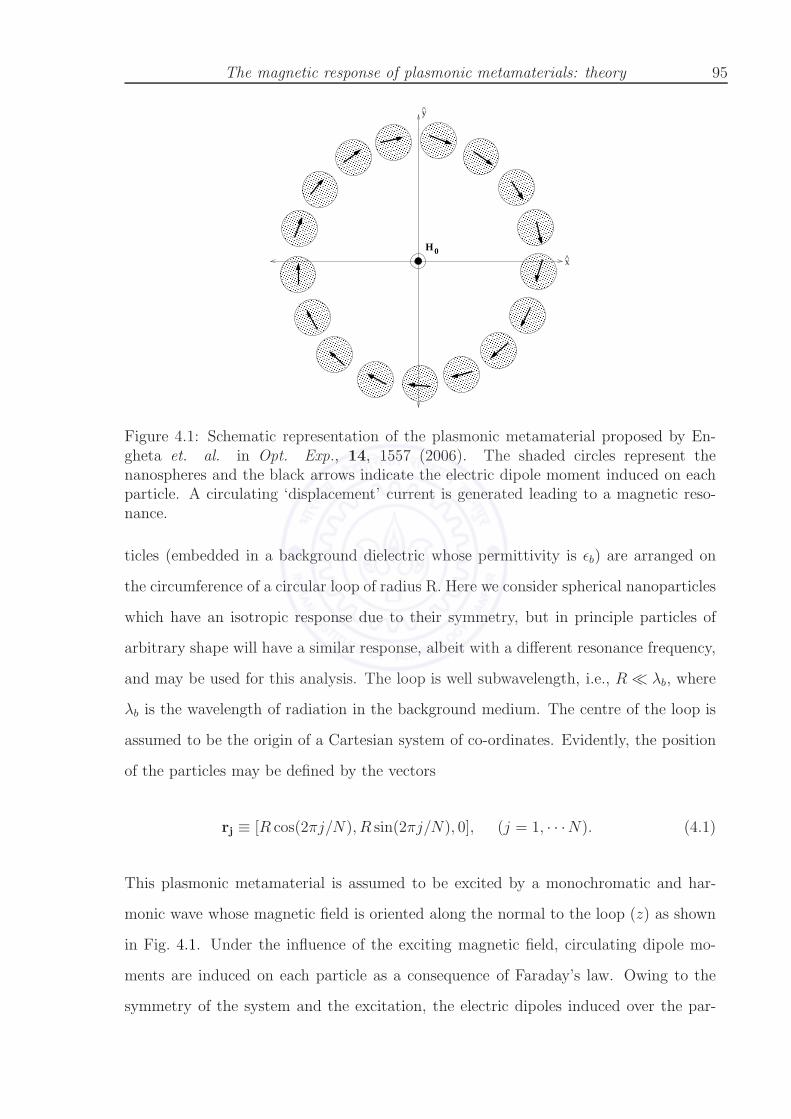
The magnetic response of plasmonic metamaterials: theory 95
H 0x
y
^
Figure 4.1: Schematic representation of the plasmonic metamaterial proposed by En-gheta et. al. in Opt. Exp., 14, 1557 (2006). The shaded circles represent thenanospheres and the black arrows indicate the electric dipole moment induced on eachparticle. A circulating ‘displacement’ current is generated leading to a magnetic reso-nance.
ticles (embedded in a background dielectric whose permittivity is ǫb) are arranged on
the circumference of a circular loop of radius R. Here we consider spherical nanoparticles
which have an isotropic response due to their symmetry, but in principle particles of
arbitrary shape will have a similar response, albeit with a different resonance frequency,
and may be used for this analysis. The loop is well subwavelength, i.e., R ≪ λb, where
λb is the wavelength of radiation in the background medium. The centre of the loop is
assumed to be the origin of a Cartesian system of co-ordinates. Evidently, the position
of the particles may be defined by the vectors
rj ≡ [R cos(2πj/N), R sin(2πj/N), 0], (j = 1, · · ·N). (4.1)
This plasmonic metamaterial is assumed to be excited by a monochromatic and har-
monic wave whose magnetic field is oriented along the normal to the loop (z) as shown
in Fig. 4.1. Under the influence of the exciting magnetic field, circulating dipole mo-
ments are induced on each particle as a consequence of Faraday’s law. Owing to the
symmetry of the system and the excitation, the electric dipoles induced over the par-
96 Coherently Controlling Plasmonic Metamaterials at Optical Frequencies
ticles are directed along φ, as indicated by the black arrows in the figure. A detailed
analysis [121] leads to the following results. First, any configuration with three or more
identical nanoparticles displaced symmetrically around the origin shows a net zero elec-
tric dipole moment in response to a uniform magnetic excitation. A pair of metal plates
has also been shown to have a zero electric dipole moment and a net magnetic moment.
However, the electric quadrupole moment is non-negligible and is of the same order
as the magnetic dipole moment. The higher the number of particles, the greater the
number of electric multipoles cancelled. Thus, its response is ‘impure’ as compared to
the response of this metamaterial. Next, the magnetic dipole moment associated with
the loop is
mH =−iωpNR
2z, (4.2)
for each plasmonic particle represented by an effective dipole moment p = pφ and a
current density J = −iωp∑N−1
j=0 φ(rj)δ(r − rj). Thus, as the number of particles in the
loop becomes large, the magnitude of the electric multipoles become negligible and for a
sufficiently small loop, the magnetic dipole moment alone dominates the electromagnetic
response. The effective relative magnetic permeability of the metamaterial consisting of
such plasmonic loop units is given by the expression [121]
µeff = 1 +1
N−1d [α−1
m + i(k3b/6π) − 1/3]
, (4.3)
where Nd is the number density of loop inclusions, αm is the magnetic polarizability (as
defined in Ref. [121]) and kb is the wave vector in the background dielectric medium.
The magnetic resonance occurs when the condition
Re[
α−1m
]
= 0 (4.4)
is satisfied. This itself depends on the electric polarizability and occurs near the reso-
nance frequency of each nanoparticle, but is slightly shifted due to the coupling between
them. It is important to note that the permeability includes a radiation loss factor [122],
Numerical calculations of the response of a plasmonic nanorod metamaterial 97
H0 H 0
Figure 4.2: Schematic diagram of a metamaterial consisting of an array of plasmonicloop inclusions. Such an array may also be embedded in a host dielectric medium. Thedirection of the induced currents has been indicated by curved arrows.
even if the particles themselves are lossless. As long as the loop radius satisfies R ≪ λ,
many such loops may be embedded in a host medium (Fig. 4.2) to produce a ho-
mogeneous metamaterial with resonant magnetic properties at optical frequencies. In
addition, the effect of the Ohmic losses of each particle on the effective loss in the loop
can be shown to be reduced by a factor of N [121].
This approach can be applied to various types of plasmonic particles. The plasmonic
resonances of metallic nanoparticles (of gold and silver) lie in the visible region of the
electromagnetic spectrum and they have been used for ornamental purposes (such as
in stained-glass windows) for hundreds of years. Metallic nanoparticles are thus ideal
candidates which may be incorporated into the scheme just described for generating a
magnetic response at optical frequencies. In the next section, we describe the magnetic
response at optical frequencies of a metamaterial consisting of plasmonic loops of silver
nanorods and control schemes for manipulating it.

98 Coherently Controlling Plasmonic Metamaterials at Optical Frequencies
H k
E
a
R
b
Figure 4.3: (a): A cross-sectional view of a typical unit cell of the plasmonic loopmetamaterial, showing the nanorods placed on the circumference of a circle. In thefigure, a = 120 nm, b = 25 nm and R = 26 nm.(b): The magnetic response of an isolated loop inclusion illustrating the concentration ofthe magnetic field inside the loop at resonance, when excited by means of a line source.The magnetic resonance of this single, isolated loop inclusion was found to occur at 652THz.
4.2 Numerical calculations of the response of a plas-
monic nanorod metamaterial
In this section, we discuss the response and the control of a metamaterial consisting of
loop inclusions composed of plasmonic nanorods. Arrays of small resonant plasmonic
spheres arranged on subwavelength-sized loops have been shown to exhibit a magnetic
response in Ref. [120]. Plasmonic resonances of inclusions of metallic (silver) nanorods
arranged on the circumference of a circle (Fig. 4.3 (a)) are considered here. The magnetic
field of the incident radiation is assumed to be oriented along the axis of the rods
and the problem becomes essentially two-dimensional. As discussed earlier, the loop
exhibits a magnetic resonance that stems from an interaction driven by the individual
plasmonic resonance of each nanorod. Each resonant nanoparticle induces a circulating
displacement current around this loop and the electric dipole moments (perpendicular to
the axis) align along the circumference of the ring when driven at the plasmon resonance
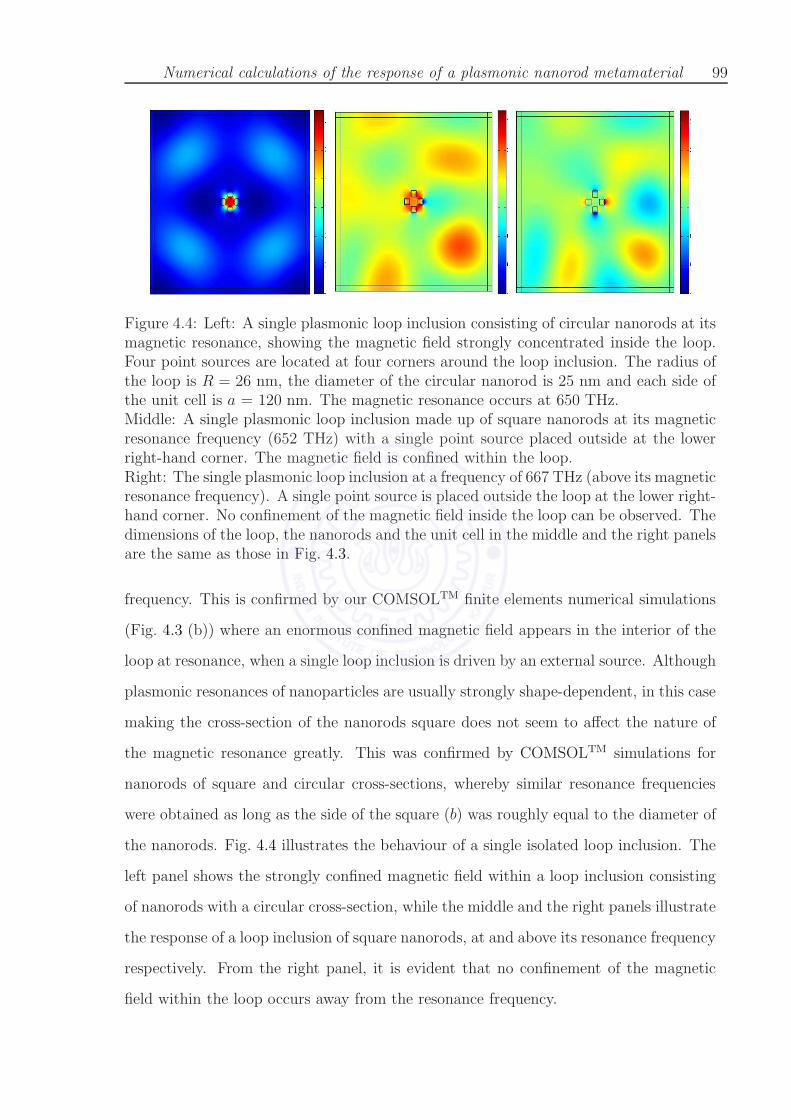
Numerical calculations of the response of a plasmonic nanorod metamaterial 99
Figure 4.4: Left: A single plasmonic loop inclusion consisting of circular nanorods at itsmagnetic resonance, showing the magnetic field strongly concentrated inside the loop.Four point sources are located at four corners around the loop inclusion. The radius ofthe loop is R = 26 nm, the diameter of the circular nanorod is 25 nm and each side ofthe unit cell is a = 120 nm. The magnetic resonance occurs at 650 THz.Middle: A single plasmonic loop inclusion made up of square nanorods at its magneticresonance frequency (652 THz) with a single point source placed outside at the lowerright-hand corner. The magnetic field is confined within the loop.Right: The single plasmonic loop inclusion at a frequency of 667 THz (above its magneticresonance frequency). A single point source is placed outside the loop at the lower right-hand corner. No confinement of the magnetic field inside the loop can be observed. Thedimensions of the loop, the nanorods and the unit cell in the middle and the right panelsare the same as those in Fig. 4.3.
frequency. This is confirmed by our COMSOLTM finite elements numerical simulations
(Fig. 4.3 (b)) where an enormous confined magnetic field appears in the interior of the
loop at resonance, when a single loop inclusion is driven by an external source. Although
plasmonic resonances of nanoparticles are usually strongly shape-dependent, in this case
making the cross-section of the nanorods square does not seem to affect the nature of
the magnetic resonance greatly. This was confirmed by COMSOLTM simulations for
nanorods of square and circular cross-sections, whereby similar resonance frequencies
were obtained as long as the side of the square (b) was roughly equal to the diameter of
the nanorods. Fig. 4.4 illustrates the behaviour of a single isolated loop inclusion. The
left panel shows the strongly confined magnetic field within a loop inclusion consisting
of nanorods with a circular cross-section, while the middle and the right panels illustrate
the response of a loop inclusion of square nanorods, at and above its resonance frequency
respectively. From the right panel, it is evident that no confinement of the magnetic
field within the loop occurs away from the resonance frequency.
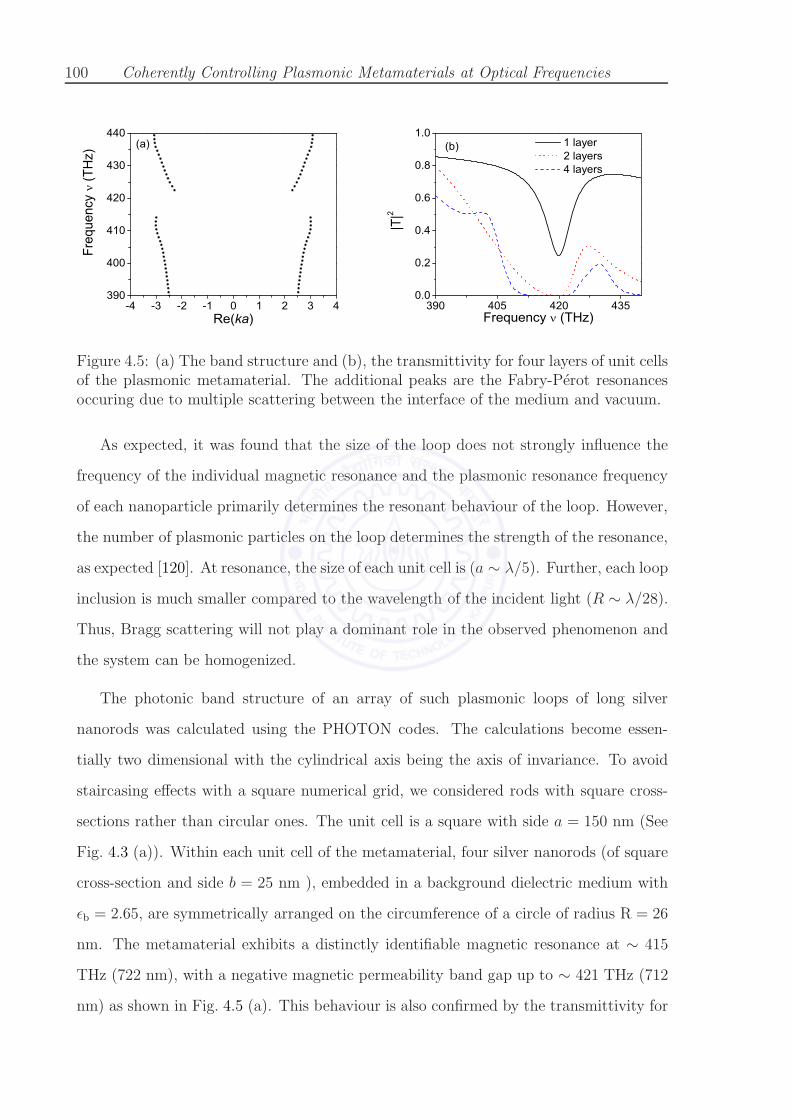
100 Coherently Controlling Plasmonic Metamaterials at Optical Frequencies
390
400
410
420
430
440
-4 -3 -2 -1 0 1 2 3 4
Freq
uenc
y (T
Hz)
Re(ka)
(a)
390 405 420 4350.0
0.2
0.4
0.6
0.8
1.0(b) 1 layer
2 layers 4 layers
|T|2
Frequency (THz)
Figure 4.5: (a) The band structure and (b), the transmittivity for four layers of unit cellsof the plasmonic metamaterial. The additional peaks are the Fabry-Perot resonancesoccuring due to multiple scattering between the interface of the medium and vacuum.
As expected, it was found that the size of the loop does not strongly influence the
frequency of the individual magnetic resonance and the plasmonic resonance frequency
of each nanoparticle primarily determines the resonant behaviour of the loop. However,
the number of plasmonic particles on the loop determines the strength of the resonance,
as expected [120]. At resonance, the size of each unit cell is (a ∼ λ/5). Further, each loop
inclusion is much smaller compared to the wavelength of the incident light (R ∼ λ/28).
Thus, Bragg scattering will not play a dominant role in the observed phenomenon and
the system can be homogenized.
The photonic band structure of an array of such plasmonic loops of long silver
nanorods was calculated using the PHOTON codes. The calculations become essen-
tially two dimensional with the cylindrical axis being the axis of invariance. To avoid
staircasing effects with a square numerical grid, we considered rods with square cross-
sections rather than circular ones. The unit cell is a square with side a = 150 nm (See
Fig. 4.3 (a)). Within each unit cell of the metamaterial, four silver nanorods (of square
cross-section and side b = 25 nm ), embedded in a background dielectric medium with
ǫb = 2.65, are symmetrically arranged on the circumference of a circle of radius R = 26
nm. The metamaterial exhibits a distinctly identifiable magnetic resonance at ∼ 415
THz (722 nm), with a negative magnetic permeability band gap up to ∼ 421 THz (712
nm) as shown in Fig. 4.5 (a). This behaviour is also confirmed by the transmittivity for
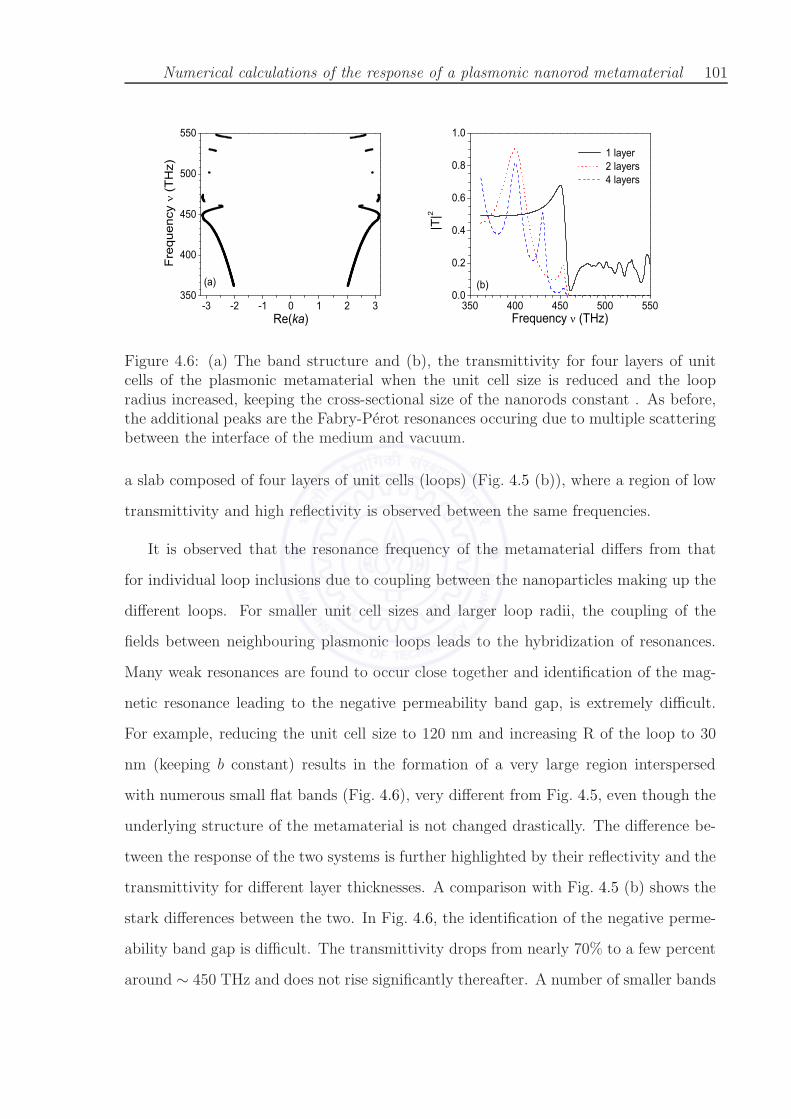
Numerical calculations of the response of a plasmonic nanorod metamaterial 101
350
400
450
500
550
-3 -2 -1 0 1 2 3
(a)
Re(ka)
Fre
quen
cy
(T
Hz)
350 400 450 500 5500.0
0.2
0.4
0.6
0.8
1.0
1 layer 2 layers 4 layers
|T|2
Frequency (THz)
(b)
Figure 4.6: (a) The band structure and (b), the transmittivity for four layers of unitcells of the plasmonic metamaterial when the unit cell size is reduced and the loopradius increased, keeping the cross-sectional size of the nanorods constant . As before,the additional peaks are the Fabry-Perot resonances occuring due to multiple scatteringbetween the interface of the medium and vacuum.
a slab composed of four layers of unit cells (loops) (Fig. 4.5 (b)), where a region of low
transmittivity and high reflectivity is observed between the same frequencies.
It is observed that the resonance frequency of the metamaterial differs from that
for individual loop inclusions due to coupling between the nanoparticles making up the
different loops. For smaller unit cell sizes and larger loop radii, the coupling of the
fields between neighbouring plasmonic loops leads to the hybridization of resonances.
Many weak resonances are found to occur close together and identification of the mag-
netic resonance leading to the negative permeability band gap, is extremely difficult.
For example, reducing the unit cell size to 120 nm and increasing R of the loop to 30
nm (keeping b constant) results in the formation of a very large region interspersed
with numerous small flat bands (Fig. 4.6), very different from Fig. 4.5, even though the
underlying structure of the metamaterial is not changed drastically. The difference be-
tween the response of the two systems is further highlighted by their reflectivity and the
transmittivity for different layer thicknesses. A comparison with Fig. 4.5 (b) shows the
stark differences between the two. In Fig. 4.6, the identification of the negative perme-
ability band gap is difficult. The transmittivity drops from nearly 70% to a few percent
around ∼ 450 THz and does not rise significantly thereafter. A number of smaller bands
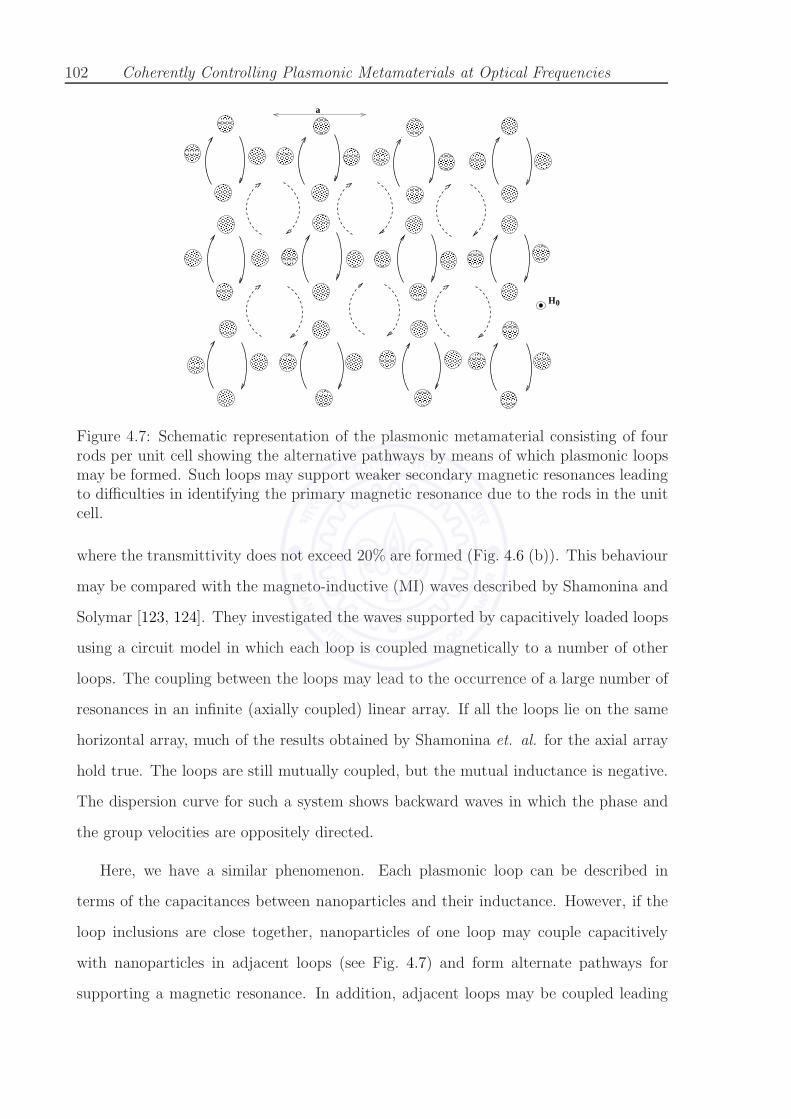
102 Coherently Controlling Plasmonic Metamaterials at Optical Frequencies
H0
a
Figure 4.7: Schematic representation of the plasmonic metamaterial consisting of fourrods per unit cell showing the alternative pathways by means of which plasmonic loopsmay be formed. Such loops may support weaker secondary magnetic resonances leadingto difficulties in identifying the primary magnetic resonance due to the rods in the unitcell.
where the transmittivity does not exceed 20% are formed (Fig. 4.6 (b)). This behaviour
may be compared with the magneto-inductive (MI) waves described by Shamonina and
Solymar [123, 124]. They investigated the waves supported by capacitively loaded loops
using a circuit model in which each loop is coupled magnetically to a number of other
loops. The coupling between the loops may lead to the occurrence of a large number of
resonances in an infinite (axially coupled) linear array. If all the loops lie on the same
horizontal array, much of the results obtained by Shamonina et. al. for the axial array
hold true. The loops are still mutually coupled, but the mutual inductance is negative.
The dispersion curve for such a system shows backward waves in which the phase and
the group velocities are oppositely directed.
Here, we have a similar phenomenon. Each plasmonic loop can be described in
terms of the capacitances between nanoparticles and their inductance. However, if the
loop inclusions are close together, nanoparticles of one loop may couple capacitively
with nanoparticles in adjacent loops (see Fig. 4.7) and form alternate pathways for
supporting a magnetic resonance. In addition, adjacent loops may be coupled leading

Control scheme for the plasmonic metamaterial 103
to the formation of multiple resonances.
4.3 Control scheme for the plasmonic metamaterial
The plasmonic resonance of a metallic nanoparticle is highly sensitive to the dielectric
permittivity of the surrounding media (ǫb). In the case of a cylindrical nanoparticle, the
localized surface plasmon resonance occurs when the condition
Re[ǫb + ǫm] = 0, (4.5)
is satisfied [52]. Using a Drude form for the permittivity of the metal (ǫm), the plasmon
resonance frequency of a metallic cylinder may be written as:
ωr = ωp
[
1
ǫb + ǫ∞− γ2
ω2p
]1/2
(4.6)
where ωr is the plasmon resonance frequency for the nanoparticle, ωp and γ define
the bulk plasma frequency and the bulk dissipation of the metal, while ǫ∞ is its ‘static’
permittivity. Hence, even a small change in ǫb can shift the plasmon resonance frequency
of the nanorod and by extension, the magnetic loop resonance frequency arising out of
the circulating displacement current around the loop. For example, if ǫb → ǫb + δ,
leading to a shift in the resonance frequency from ωr → ω′
r, we have
ω2r − ω
′2r =
ω2pδ
2
ǫb + ǫ∞. (4.7)
A subtle difference between the SRR and the plasmonic metamaterial that may affect
the efficiency with which their magnetic response is manipulated is to be noted. In the
case of the SRR, the electric fields and the displacement currents are highly confined to
the region within the capacitive gaps of the SRR. In this case of the plasmonic particle
loops, however, the displacement current is between adjacent nanoparticles, and is more
spatially delocalized. A more closely packed loop would, in principle, enable a higher

104 Coherently Controlling Plasmonic Metamaterials at Optical Frequencies
degree of localization of the fields and the currents and make possible a stronger resonant
response.
It is proposed to effect control over the magnetic resonance via the Inverse Raman
Effect in CS2, which gives rise to a permittivity having an absorptive Lorentz lineshape.
As already described in Sec. 1.5.4, the Inverse Raman Effect in CS2 refers to the ab-
sorption of a probe field at an anti-Stokes (ν0 +νR) frequency when a strong pump laser
at a frequency ν0 is applied. The energy difference between the ground and the excited
levels in CS2 is 656cm−1 or 19.68 THz, and the probe beam is strongly attenuated at
a correspondingly higher frequency. Other substances like a-Si, which also exhibit the
Inverse Raman Effect [125] can also be used for such purposes. However, a liquid like
CS2, can be easily infiltrated into the metamaterial, while incorporating a solid medium
like a-Si into the loop inclusions would need to be carried out at the stage of fabrication
itself.
4.3.1 Controlling the magnetic response
Control of ǫb by an applied electromagnetic radiation is the key to the present scheme for
controllling composite metamaterial itself. In order to demonstrate parametric control
over the magnetic resonance, an atomic/molecular system exhibiting a resonance in the
neighbourhood of the band gap frequency is essential. Raman transitions that provide
such resonances can be effectively used in a very flexible manner because the Raman
resonance frequency can be easily tuned by the choice of the pump laser frequency. We
present the calculated results for such a stimulated Raman absorption process (Fig. 1.16)
at 416.54 THz in CS2 with ground state vibrational level spacing of 656 cm−1 (19.68
THz). Experimentally obtained values for the parameters of CS2 [126] were used, cor-
responding to the non-resonant χ(3) response. We use peak pump powers of the order
of 100 GW/cm2 and a typical linewidth of 0.5 cm−1 (15 GHz). Our estimates for the
nonlinearity are overtly conservative as the resonant Raman process would be expected
to enhance the χ(3) response. The inverse Raman absorption of about -15dB has been
reported in amorphous silicon with much lower pump powers of about 10 GW/cm2 [125].

Control scheme for the plasmonic metamaterial 105
416.5400416.5405416.5410416.5415416.5420416.5425416.5430416.5435416.5440416.5445
-3 -2 -1 0 1 2 3
Re(ka)
(a)
Freq
uenc
y (T
Hz)
0.0 0.1 0.2 0.3 0.4
416.536
416.540
416.544
416.548
Composite Bare
|R|2
(b)
Figure 4.8: (a) & (b) The new band formed and the modified reflectivity of the plasmonicmetamaterial in the neighbourhood of a Raman transition in CS2 at 416.54 THz. Theband gap of the original metamaterial occurred between ∼ 415 THz and 420 THz, asseen in Fig. 4.5.
Our calculations were performed assuming a pump laser field at 396.86 THz which lies
within the propagating band of the metamaterial (Fig. 4.5(a)).
A new propagating band develops within the band gap region seen in Fig. 4.5, The
region where this new propagating band is formed has been expanded in Fig. 4.8. The
formation of a (dissipative) propagating band is manifested by a sharp drop of (∼ 20%)
in the reflectivity of the medium. The transmittivity of the composite metamaterial
is reasonable when compared to that for the ‘bare’ metamaterial, but is completely
overshadowed by the large change in the reflectivity. The new band formed is quite
dissipative and this prevents a large change in the transmittivity in comparison with
the change in reflectivity. While it is possible to numerically demonstrate dramatic en-
hancement of the transmittivity by several orders of magnitude by using higher pump
intensities, a resonantly enhanced nonlinear coefficient will significantly improve the
response of the composite metamaterial. Thus, the effect of the introduction of the res-
onant Raman medium results in a sharp reduction in the reflectivity of the composite
metamaterial over a narrow frequency band (∼ 5 GHz). The linewidth of the Raman
pump laser dictates the linewidth of the induced absorption, which in turn determines
the change in the reflectivity. The number of propagating bands that are formed are also
strongly dependent on the resonant nature of the background medium. For example,

106 Coherently Controlling Plasmonic Metamaterials at Optical Frequencies
in the case of EIT, the permittivity of the medium is resonant at frequencies ω1 ±Ωc/2
about the EIT line center ω1 under the influence of the control field Ωc. Thus, by in-
corporating a dielectric material that can be rendered transparent electromagnetically
into the metamaterial, the effective permittivity can be driven to positive values over
two frequency ranges. Thus, additional propagating bands will be formed in the trans-
mittivity spectrum of the composite metamaterial under the action of the control field
(when EIT is observed) as compared to those formed when the control field is turned
off (Lorentz dispersion). In the case of EIT-based control, the additional bands formed
in the presence of a control field Ωc [102] switch rapidly between states of high and low
transmission and this behaviour may be controlled by varying Ωc.
4.4 Dilute plasma-like behaviour
In this section, the response of a periodic array of parallel metallic nanorods with sub-
wavelength periodicity is considered when the electric field of the radiation is parallel
to the nanorods. This state of polarization of light is orthogonal to that considered
in the previous section. The medium effectively behaves like a plasma at optical and
near infra-red (NIR) frequencies for the radiation with the electric field aligned along
the rods as shown in Fig. 4.9. When embedded in an appropriate resonant medium,
the plasma-like response of this metamaterial can be switched and a transmission band
opens up below the cut-off (plasma) frequency. Resonant processes such as EIT may be
used to further tailor the properties of this transmission band.
The use of sparse, conducting sub-wavelength thin wire meshes for generating a low
frequency anisotropic plasma-like response was first proposed by Pendry et. al. [38].
Such a response arises due to (i) a lowered effective electron density (Neff) as the con-
ducting medium is sparse, and (ii) an enhanced effective electronic mass (meff) due
to the large inductance of the thin wires. The resulting effective plasma frequency
ω2p = (Neffe
2)/(ǫ0meff) can range from a few gigahertz to a hundred terahertz depend-
ing on the geometry. The use of such metallic wire meshes as effective anisotropic
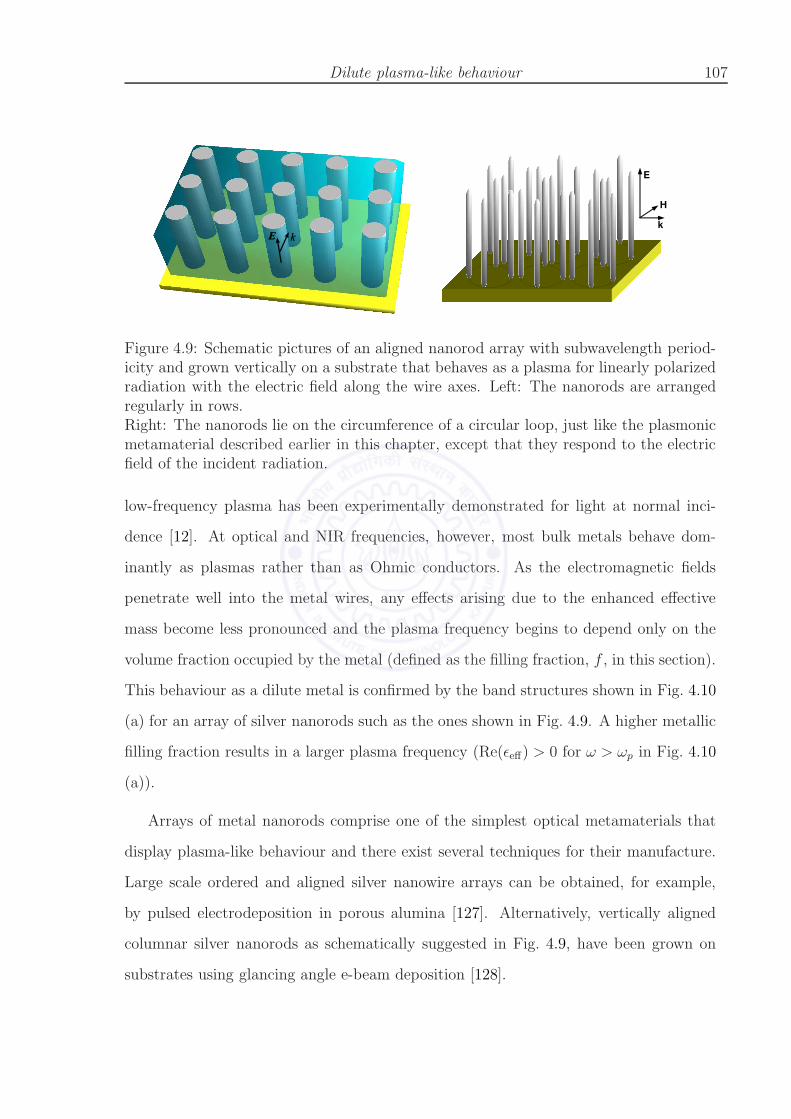
Dilute plasma-like behaviour 107
Figure 4.9: Schematic pictures of an aligned nanorod array with subwavelength period-icity and grown vertically on a substrate that behaves as a plasma for linearly polarizedradiation with the electric field along the wire axes. Left: The nanorods are arrangedregularly in rows.Right: The nanorods lie on the circumference of a circular loop, just like the plasmonicmetamaterial described earlier in this chapter, except that they respond to the electricfield of the incident radiation.
low-frequency plasma has been experimentally demonstrated for light at normal inci-
dence [12]. At optical and NIR frequencies, however, most bulk metals behave dom-
inantly as plasmas rather than as Ohmic conductors. As the electromagnetic fields
penetrate well into the metal wires, any effects arising due to the enhanced effective
mass become less pronounced and the plasma frequency begins to depend only on the
volume fraction occupied by the metal (defined as the filling fraction, f , in this section).
This behaviour as a dilute metal is confirmed by the band structures shown in Fig. 4.10
(a) for an array of silver nanorods such as the ones shown in Fig. 4.9. A higher metallic
filling fraction results in a larger plasma frequency (Re(ǫeff) > 0 for ω > ωp in Fig. 4.10
(a)).
Arrays of metal nanorods comprise one of the simplest optical metamaterials that
display plasma-like behaviour and there exist several techniques for their manufacture.
Large scale ordered and aligned silver nanowire arrays can be obtained, for example,
by pulsed electrodeposition in porous alumina [127]. Alternatively, vertically aligned
columnar silver nanorods as schematically suggested in Fig. 4.9, have been grown on
substrates using glancing angle e-beam deposition [128].

108 Coherently Controlling Plasmonic Metamaterials at Optical Frequencies
450
500
550
600
650
700
750
-2 -1 0 1 2
Re(ka)
Freq
uenc
y (T
Hz)
0.0 0.2 0.4 0.6 0.8 1.0
(b)
17.4% Eq.(4.9) 17.4% 13% 8.7%
|T|2
(a)
-2 -1 0 1 2
Re( eff)
Figure 4.10: Top panels: (a) Band structure of the silver nanorod metamaterial and(b) Transmittance from an array containing four layers of nanorods, for various fillingfractions of silver calculated using the transfer matrix method. The Re(ǫeff) and trans-mittance calculated for a homogeneous slab of effective medium as given by Eq. (4.9)are also shown by thin lines in (a) and (b) respectively.Bottom panels: The electric fields (in arbitrary units) within the rod array for a planewave incident from the bottom. Left: ω < ωp, Middle: ω = ωp, Right: ω > ωp Theradiation does not penetrate for frequencies below the plasma frequency (ωp = 650 THz)while it propagates across for higher frequencies. Each nanorod has a diameter of 25nm and the unit cell size is 120 nm.
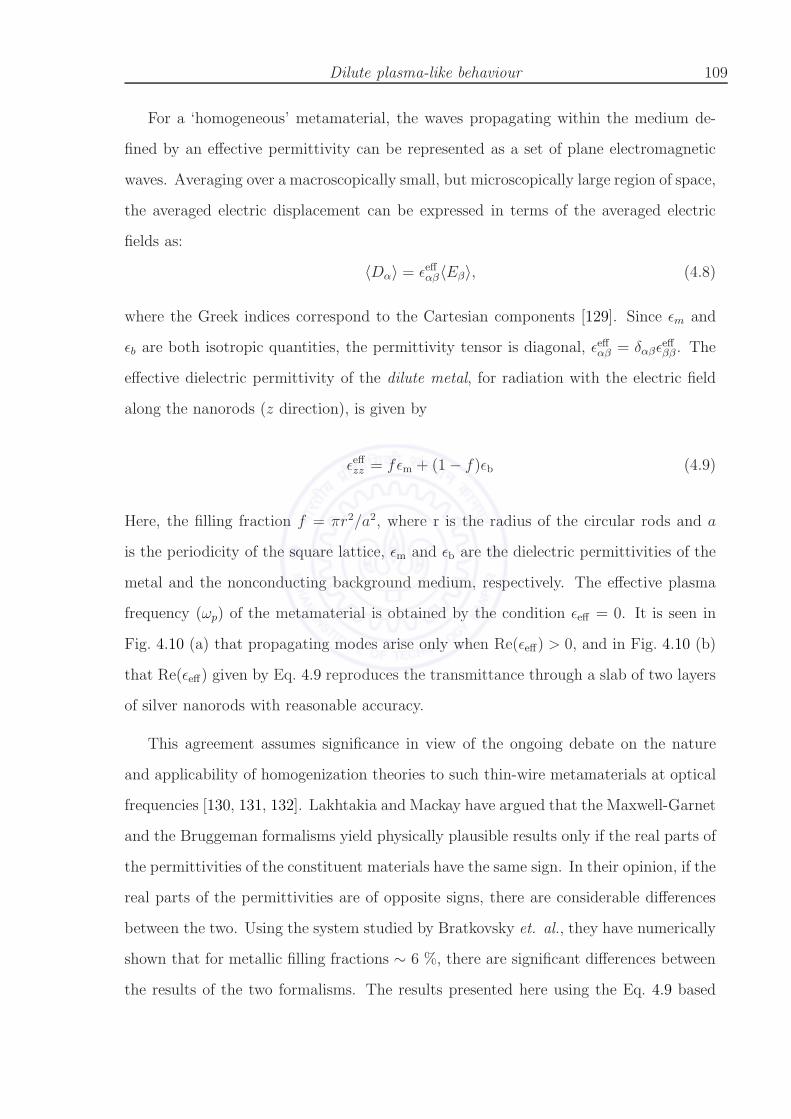
Dilute plasma-like behaviour 109
For a ‘homogeneous’ metamaterial, the waves propagating within the medium de-
fined by an effective permittivity can be represented as a set of plane electromagnetic
waves. Averaging over a macroscopically small, but microscopically large region of space,
the averaged electric displacement can be expressed in terms of the averaged electric
fields as:
〈Dα〉 = ǫeffαβ〈Eβ〉, (4.8)
where the Greek indices correspond to the Cartesian components [129]. Since ǫm and
ǫb are both isotropic quantities, the permittivity tensor is diagonal, ǫeffαβ = δαβǫeffββ . The
effective dielectric permittivity of the dilute metal, for radiation with the electric field
along the nanorods (z direction), is given by
ǫeffzz = fǫm + (1 − f)ǫb (4.9)
Here, the filling fraction f = πr2/a2, where r is the radius of the circular rods and a
is the periodicity of the square lattice, ǫm and ǫb are the dielectric permittivities of the
metal and the nonconducting background medium, respectively. The effective plasma
frequency (ωp) of the metamaterial is obtained by the condition ǫeff = 0. It is seen in
Fig. 4.10 (a) that propagating modes arise only when Re(ǫeff) > 0, and in Fig. 4.10 (b)
that Re(ǫeff) given by Eq. 4.9 reproduces the transmittance through a slab of two layers
of silver nanorods with reasonable accuracy.
This agreement assumes significance in view of the ongoing debate on the nature
and applicability of homogenization theories to such thin-wire metamaterials at optical
frequencies [130, 131, 132]. Lakhtakia and Mackay have argued that the Maxwell-Garnet
and the Bruggeman formalisms yield physically plausible results only if the real parts of
the permittivities of the constituent materials have the same sign. In their opinion, if the
real parts of the permittivities are of opposite signs, there are considerable differences
between the two. Using the system studied by Bratkovsky et. al., they have numerically
shown that for metallic filling fractions ∼ 6 %, there are significant differences between
the results of the two formalisms. The results presented here using the Eq. 4.9 based
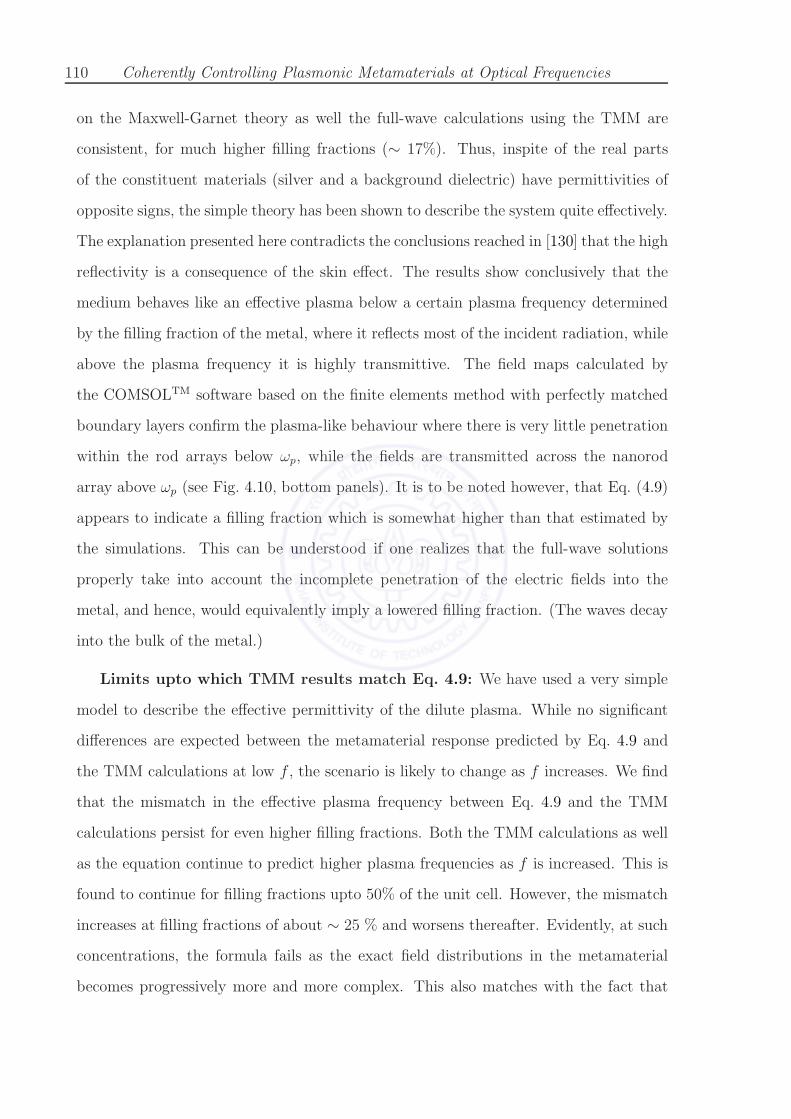
110 Coherently Controlling Plasmonic Metamaterials at Optical Frequencies
on the Maxwell-Garnet theory as well the full-wave calculations using the TMM are
consistent, for much higher filling fractions (∼ 17%). Thus, inspite of the real parts
of the constituent materials (silver and a background dielectric) have permittivities of
opposite signs, the simple theory has been shown to describe the system quite effectively.
The explanation presented here contradicts the conclusions reached in [130] that the high
reflectivity is a consequence of the skin effect. The results show conclusively that the
medium behaves like an effective plasma below a certain plasma frequency determined
by the filling fraction of the metal, where it reflects most of the incident radiation, while
above the plasma frequency it is highly transmittive. The field maps calculated by
the COMSOLTM software based on the finite elements method with perfectly matched
boundary layers confirm the plasma-like behaviour where there is very little penetration
within the rod arrays below ωp, while the fields are transmitted across the nanorod
array above ωp (see Fig. 4.10, bottom panels). It is to be noted however, that Eq. (4.9)
appears to indicate a filling fraction which is somewhat higher than that estimated by
the simulations. This can be understood if one realizes that the full-wave solutions
properly take into account the incomplete penetration of the electric fields into the
metal, and hence, would equivalently imply a lowered filling fraction. (The waves decay
into the bulk of the metal.)
Limits upto which TMM results match Eq. 4.9: We have used a very simple
model to describe the effective permittivity of the dilute plasma. While no significant
differences are expected between the metamaterial response predicted by Eq. 4.9 and
the TMM calculations at low f , the scenario is likely to change as f increases. We find
that the mismatch in the effective plasma frequency between Eq. 4.9 and the TMM
calculations persist for even higher filling fractions. Both the TMM calculations as well
as the equation continue to predict higher plasma frequencies as f is increased. This is
found to continue for filling fractions upto 50% of the unit cell. However, the mismatch
increases at filling fractions of about ∼ 25 % and worsens thereafter. Evidently, at such
concentrations, the formula fails as the exact field distributions in the metamaterial
becomes progressively more and more complex. This also matches with the fact that

Switching a dilute plasma-like metamaterial 111
the MG effective medium approach is consistent for f ∼ 0.3−0.5, as already mentioned
in Chap. 1.
4.5 Switching a dilute plasma-like metamaterial
Usually Re(ǫm) is a negative number with a large magnitude at optical and NIR fre-
quencies. A small filling fraction of the metal is therefore sufficient to render ǫeff < 0,
as can be deduced from Eq. 4.9. If the embedding medium, however, had a resonance
below the effective plasma frequency, the resonant enhancement of the Re(ǫb) in the
positive regime could offset the negative contribution of the metal. The metamaterial
as a whole would then act as a positive dielectric medium and display a transmission
band at frequencies within the width of the resonance below the resonance frequency.
This new transmission band occurs below the plasma frequency of the bare plasma
metamaterial. It is, indeed, counter-intuitive that introduction of a lossy resonance can
induce the medium to be more transmittive.
Resonant enhancement of the positive permittivity of the background material can
be achieved by various means including Raman transitions, simple resonant absorption
and coherent processes like EIT. We consider here a specific and realistic case of silver
nanorods submerged in a background of atomic sodium gas that is readily accomplished
by placing the nanorod array within a vacuum cell infused with sodium vapor. For
the frequencies of the D1 − D2 lines of sodium, we construct a dilute metal (nanorod
array) with a plasma frequency ωp > ωD1, D2. A filling fraction of f = 0.174 is used,
for which we consider a metamaterial with four square silver nanorods (side b = 25
nm) in a square unit cell of a = 120 nm (to avoid staircasing effects of circular rods
on a square computational grid). It is estimated that one can achieve a maximum
of ǫb ∼ 2.2 near the resonance for pressure broadened sodium with a number density
of ∼ 1 × 1017cm−3 [133]. Using such a background medium, our formula predicts a
maximum of ǫeff ∼ 0.86, leading to a positive dielectric permittivity band below ωp.
Alternative proposals for the creation of a transmission band below the plasma fre-
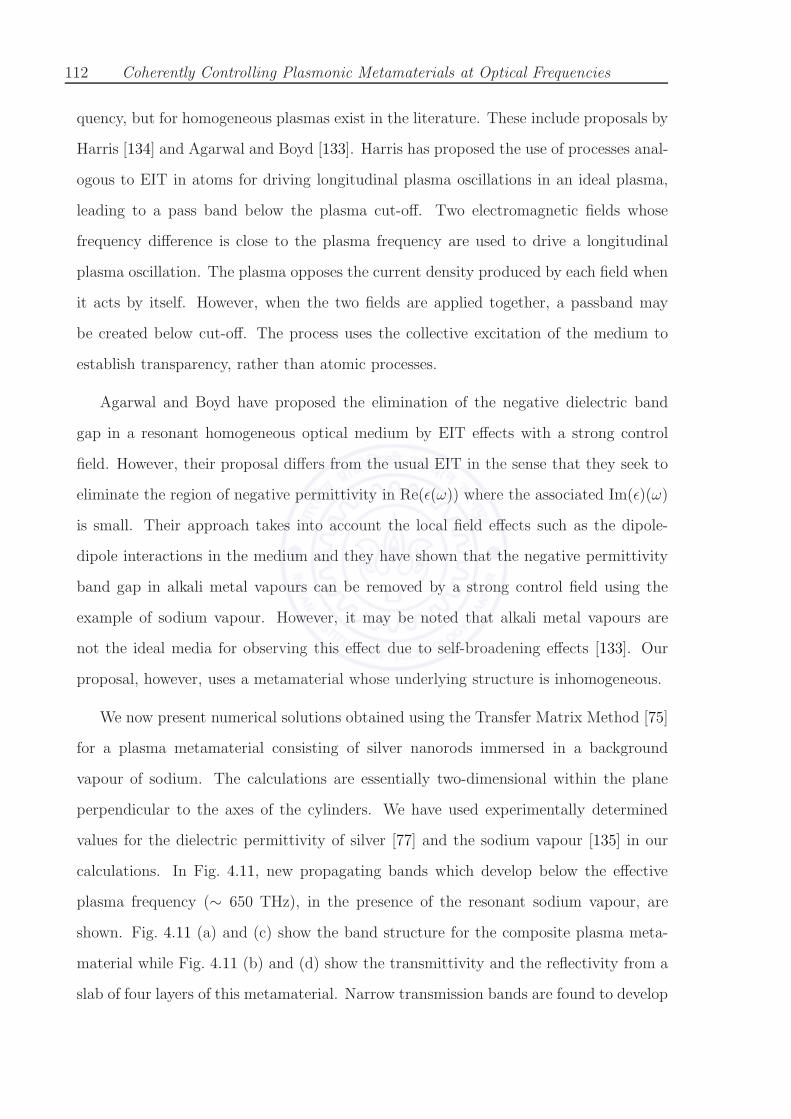
112 Coherently Controlling Plasmonic Metamaterials at Optical Frequencies
quency, but for homogeneous plasmas exist in the literature. These include proposals by
Harris [134] and Agarwal and Boyd [133]. Harris has proposed the use of processes anal-
ogous to EIT in atoms for driving longitudinal plasma oscillations in an ideal plasma,
leading to a pass band below the plasma cut-off. Two electromagnetic fields whose
frequency difference is close to the plasma frequency are used to drive a longitudinal
plasma oscillation. The plasma opposes the current density produced by each field when
it acts by itself. However, when the two fields are applied together, a passband may
be created below cut-off. The process uses the collective excitation of the medium to
establish transparency, rather than atomic processes.
Agarwal and Boyd have proposed the elimination of the negative dielectric band
gap in a resonant homogeneous optical medium by EIT effects with a strong control
field. However, their proposal differs from the usual EIT in the sense that they seek to
eliminate the region of negative permittivity in Re(ǫ(ω)) where the associated Im(ǫ)(ω)
is small. Their approach takes into account the local field effects such as the dipole-
dipole interactions in the medium and they have shown that the negative permittivity
band gap in alkali metal vapours can be removed by a strong control field using the
example of sodium vapour. However, it may be noted that alkali metal vapours are
not the ideal media for observing this effect due to self-broadening effects [133]. Our
proposal, however, uses a metamaterial whose underlying structure is inhomogeneous.
We now present numerical solutions obtained using the Transfer Matrix Method [75]
for a plasma metamaterial consisting of silver nanorods immersed in a background
vapour of sodium. The calculations are essentially two-dimensional within the plane
perpendicular to the axes of the cylinders. We have used experimentally determined
values for the dielectric permittivity of silver [77] and the sodium vapour [135] in our
calculations. In Fig. 4.11, new propagating bands which develop below the effective
plasma frequency (∼ 650 THz), in the presence of the resonant sodium vapour, are
shown. Fig. 4.11 (a) and (c) show the band structure for the composite plasma meta-
material while Fig. 4.11 (b) and (d) show the transmittivity and the reflectivity from a
slab of four layers of this metamaterial. Narrow transmission bands are found to develop

Switching a dilute plasma-like metamaterial 113
509.330
509.335
509.340
509.345
-3 -2 -1 0 1 2 3
Re(ka)
Freq
uenc
y (T
Hz)
(a)
0.0 0.2 0.4 0.6 0.8 1.0
|T|2
|R|2
|T|2, |R|2
(b)
508.800
508.805
508.810
508.815
-3 -2 -1 0 1 2 3
Re(ka)
Freq
uenc
y (T
Hz)
(c)
0.0 0.2 0.4 0.6 0.8 1.0
|T|2
|R|2
|T|2, |R|2
(d)
Figure 4.11: (a) and (c): Band structure for s-polarized light with the metamaterialimmersed in atomic sodium showing the new transmission band that develops below ωp,for the D1 and D2 lines respectively.(b) and (d): The transmittivity corresponding to the band structure in (a) and (c)respectively.
at ∼ 508.805 THz and 509.335 THz corresponding to the frequencies of the D1 and D2
lines of sodium respectively.
The application of another control radiation field can dramatically transform the
dielectric response and the dispersion of the sodium lines through the occurrence of
coherent processes like EIT. The control field for EIT, that either propagates along the
nanorod axis or co-propagates with the probe field but with the magnetic field oriented
along the nanorod axis, can be readily applied in the scheme Fig. 4.9. The application
of an appropriate control field with a Rabi frequency Ωc = 10γ is shown to tune and
switch the transmittive bands of the D1 or the D2 lines in Fig. 4.12 (a) and Fig. 4.12
(b).
A similar effect can be demonstrated by introducing atomic barium vapour (which
exhibits EIT) into the array. The results of this numerical simulation have been pre-
sented in Fig. 4.13. New propagating bands are formed below the effective plasma

114 Coherently Controlling Plasmonic Metamaterials at Optical Frequencies
508.8025
508.8050
508.8075
509.3325
509.3350
509.3375
509.3400
-2 -1 0 1 2
D2
Fre
quency
(
TH
z)
Re(ka)
(a)D1508.8025
508.8050
508.8075
509.3325
509.3350
509.3375
509.3400
0.0 0.1 0.2 0.3 0.4 0.5
D1
D2
|T|2
(b)
Figure 4.12: (a): Band structure for s-polarized light with the metamaterial immersedin atomic sodium showing the new transmission band that develops below ωp, for theD1 and D2 lines respectively. An additional switchable band develops under the actionof a control field.(b): The transmittivity corresponding to the band structure in (a).
frequency, as before and the strength of the EIT control field may be used as a param-
eter for switching the transmittive bands. The intensity of the control field is used as a
control parameter to switch the transmission. For example, the additional propagating
band may be ‘turned off’ by reducing the control field strength to zero. We find that
the observed effects are reasonably independent of the exact location and distribution of
the nanorods in the unit cell, as long as the filling fraction remains unaltered. We also
note that plasma-like metallic metamaterials with even larger filling fractions can be
also switched using a coherently enhanced refractive index for the background atomic
gas [65]. The refractive index of a metallic vapour (for example, rubidium [136]) may
be enhanced, with very low dissipation, by means of quantum coherence effects. Fi-
nally and crucially, we also would point out that the present proposal for switching the
plasma metamaterial depends on making the effective permittivity positive through a
bulk volume averaging process. The effectiveness of this method depends on whether the
positive permittivity of the resonantly enhanced background is able to counteract the
negative permittivity of the metallic part. Thus, for higher metallic filling fractions, con-
siderable resonant enhancement of the permittivity of the background dielectric medium

Conclusion 115
will be necessary to generate an overall positive permittivity over frequency ranges lying
below the effective plasma frequency of the metamaterial. This is very different from
the previous work [102] on parametrically transforming the resonances of the metama-
terial units via coherent processes. The difference lies in the fact that in the former
case, the resonant magnetic response of the metamaterial is itself transformed by the
effect of a resonant background dielectric, along with a modified metallic filling fraction
and dissipation of the metamaterial. The results presented in this section, on the other
hand, do not involve any metamaterial resonances.
365.342
365.344
365.346
365.348
365.350
365.352
-3 -2 -1 0 1 2 3
Re(ka)
Freq
uenc
y (T
Hz)
(a)c = 10
365.342
365.344
365.346
365.348
365.350
365.352
-3 -2 -1 0 1 2 3
c = 0(b)
Re(ka)
365.344 365.348 365.3520.0
0.2
0.4
0.6
0.8
1.0
c = 10(c)
|T|2 , |
R|2
Frequency (THz)365.344 365.348 365.352
0.0
0.2
0.4
0.6
0.8
1.0
c = 0(d)
Frequency (THz)
Figure 4.13: (a) and (b): Band structure for s-polarized light with the metamaterialimmersed in barium vapour showing the new transmission band that develops below ωp,for the in the presence and in the absence of the control field, respectively.(c) and (d): The transmittivity and the reflectivity corresponding to the band structuresshown in (a) and (b) respectively.
4.6 Conclusion
To summarize, we have studied the response of an array of silver nanorods when exposed
to both light of both the states of polarizations: first, when the magnetic field is per-
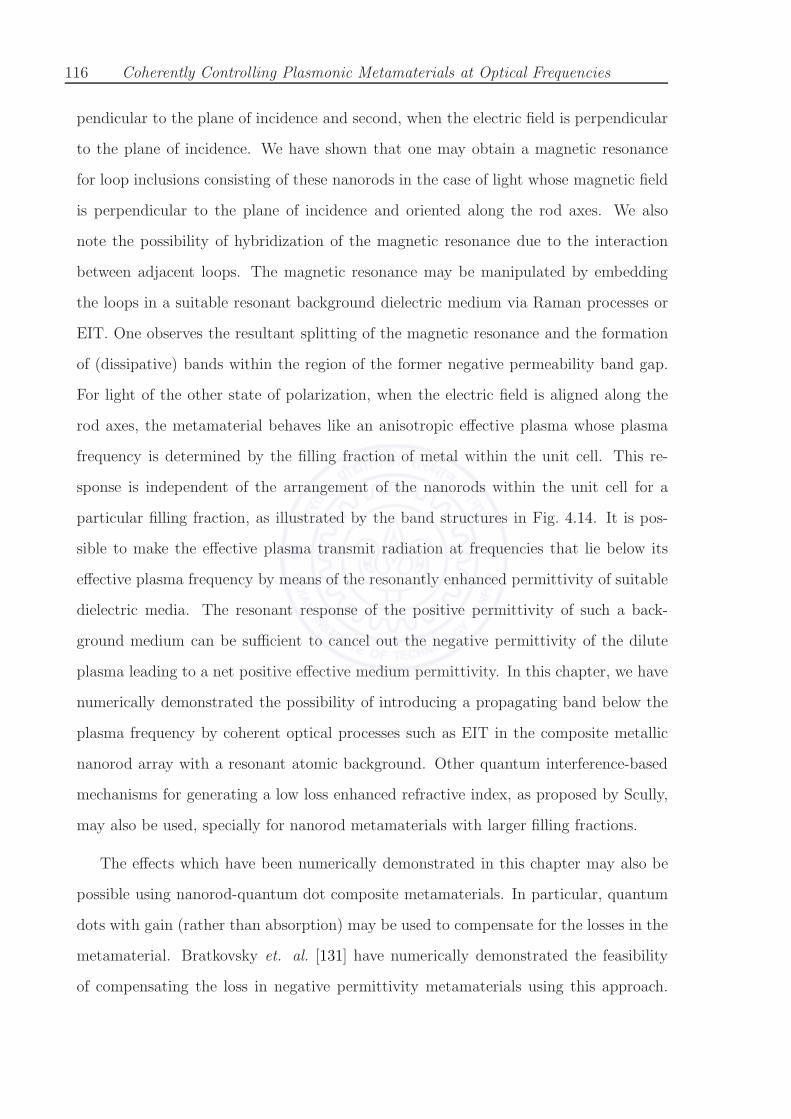
116 Coherently Controlling Plasmonic Metamaterials at Optical Frequencies
pendicular to the plane of incidence and second, when the electric field is perpendicular
to the plane of incidence. We have shown that one may obtain a magnetic resonance
for loop inclusions consisting of these nanorods in the case of light whose magnetic field
is perpendicular to the plane of incidence and oriented along the rod axes. We also
note the possibility of hybridization of the magnetic resonance due to the interaction
between adjacent loops. The magnetic resonance may be manipulated by embedding
the loops in a suitable resonant background dielectric medium via Raman processes or
EIT. One observes the resultant splitting of the magnetic resonance and the formation
of (dissipative) bands within the region of the former negative permeability band gap.
For light of the other state of polarization, when the electric field is aligned along the
rod axes, the metamaterial behaves like an anisotropic effective plasma whose plasma
frequency is determined by the filling fraction of metal within the unit cell. This re-
sponse is independent of the arrangement of the nanorods within the unit cell for a
particular filling fraction, as illustrated by the band structures in Fig. 4.14. It is pos-
sible to make the effective plasma transmit radiation at frequencies that lie below its
effective plasma frequency by means of the resonantly enhanced permittivity of suitable
dielectric media. The resonant response of the positive permittivity of such a back-
ground medium can be sufficient to cancel out the negative permittivity of the dilute
plasma leading to a net positive effective medium permittivity. In this chapter, we have
numerically demonstrated the possibility of introducing a propagating band below the
plasma frequency by coherent optical processes such as EIT in the composite metallic
nanorod array with a resonant atomic background. Other quantum interference-based
mechanisms for generating a low loss enhanced refractive index, as proposed by Scully,
may also be used, specially for nanorod metamaterials with larger filling fractions.
The effects which have been numerically demonstrated in this chapter may also be
possible using nanorod-quantum dot composite metamaterials. In particular, quantum
dots with gain (rather than absorption) may be used to compensate for the losses in the
metamaterial. Bratkovsky et. al. [131] have numerically demonstrated the feasibility
of compensating the loss in negative permittivity metamaterials using this approach.

Conclusion 117
350
400
450
500
550
-2 -1 0 1 2
17.4 % 13 % 8.7 %
Re(ka)
Freq
uenc
y (T
Hz)
(a)
350
400
450
500
550
-2 -1 0 1 2
17.4 % 13 % 8.7 %
Re(ka)
Freq
uenc
y (T
Hz)
(b)
Figure 4.14: The band structure for an array of nanorods arranged (a): at the cornersof a square and (b): symmetrically about the cirumference of a circular loop for fillingfractions 8.7 %, 13 % and 17.4 %. In each case, the effective plasma frequency remainsthe same.
However, since the dielectric permittivity of quantum dots is given by
ǫQD = ǫB +a
ω − ω0 + iγ, (4.10)
(where ǫB is the background dielectric constant, γ is the broadening parameter and a is
a constant which involves the oscillator strength), they exhibit a resonant permittivity.
This can be used to generate a propagating band below the effective plasma frequency.
Since the size of the quantum dots determines the frequency at which they respond
maximally, they can be manufactured according to the frequency at which a propagat-
ing band is required, below the plasma frequency, thereby increasing the flexibility of
this scheme. The nanorods needed to successfully implement this scheme can also be
manufactured to a high degree of accuracy. For example, highly ordered monocrystalline
silver nanowire arrays have been prepared using pulsed electrodeposition in self-ordered
porous alumina templates by Sauer et. al. [127], as mentioned earlier in this chapter. In
this technique, homogeneous filling of all the pores of the alumina template is achieved,
overcoming the difficulties arising due to the instabilities during growth of the nanowires.
Arrays of aligned single crystalline silver nanorods were grown on planar Si substrates
using the glancing angle deposition (GLAD) technique, at substrate temperatures lower
than the room temperature [128]. The major factors influencing the growth morphology
118 Coherently Controlling Plasmonic Metamaterials at Optical Frequencies
in this case are the direction of the depositing beam flux, the temperature and the move-
ment of the substrate and the deposition rate. Well-separated, aligned silver nanorods
∼ 800 nm long and 20 - 30 nm in diameter have been grown using this technique [128].
Thus, the use of such composite metamaterials for switching the dilute plasma appears
to be feasible experimentally. The success of the scheme for controlling the magnetic
response of loop inclusions consisting of silver nanorods will depend largely upon the
growth of such rods to form loop inclusions, the dispersive background medium used
remaining the same. It is worth noting that while the loop inclusion has an effective
magnetic response when the magnetic field of the incident radiation is axially oriented,
it behaves like an effective plasma when the electric field is axially oriented. Thus,
in principle, the same metamaterial can be used to generate an effective magnetic or
electric response depending upon the polarization of the impinging radiation.

Chapter 5
Checkerboards of Dissipative
Negative Refractive Index Media
In this chapter, a study of the electromagnetic properties of checkerboard structures of
negative and positive refractive index has been presented. It is shown that such struc-
tures have novel and sometimes counterintuitive properties. The negative refractive
index media can be generated by a suitable metamaterial: for example, a composite
structure of appropriately sized and oriented metallic split ring resonators and thin
wires can produce negative magnetic permeability and negative dielectric permittiv-
ity in a required range of frequencies (See the discussion in Sec. 1.3). It is found that
checkerboard structures of positive and negative refractive index media have very singu-
lar properties resulting in very large local field enhancements and large local density of
modes, both of which, in principle, can diverge for an infinite checkerboard lattice made
up with dissipationless media. As a consequence, it is very difficult to accurately numer-
ically simulate the properties of these systems. In this chapter, a study of checkerboard
structures from the viewpoint of the complementarity theorem proposed by Pendry and
Ramakrishna [22], has been presented. This chapter is organized as follows: First,
the ideas of complementary media and the generalized lens theorem [22] have been de-
scribed. The ideas of complementary media are useful for understanding the behaviour
of checkerboards of positive and negative refractive index media. Next, a transfer ma-
119
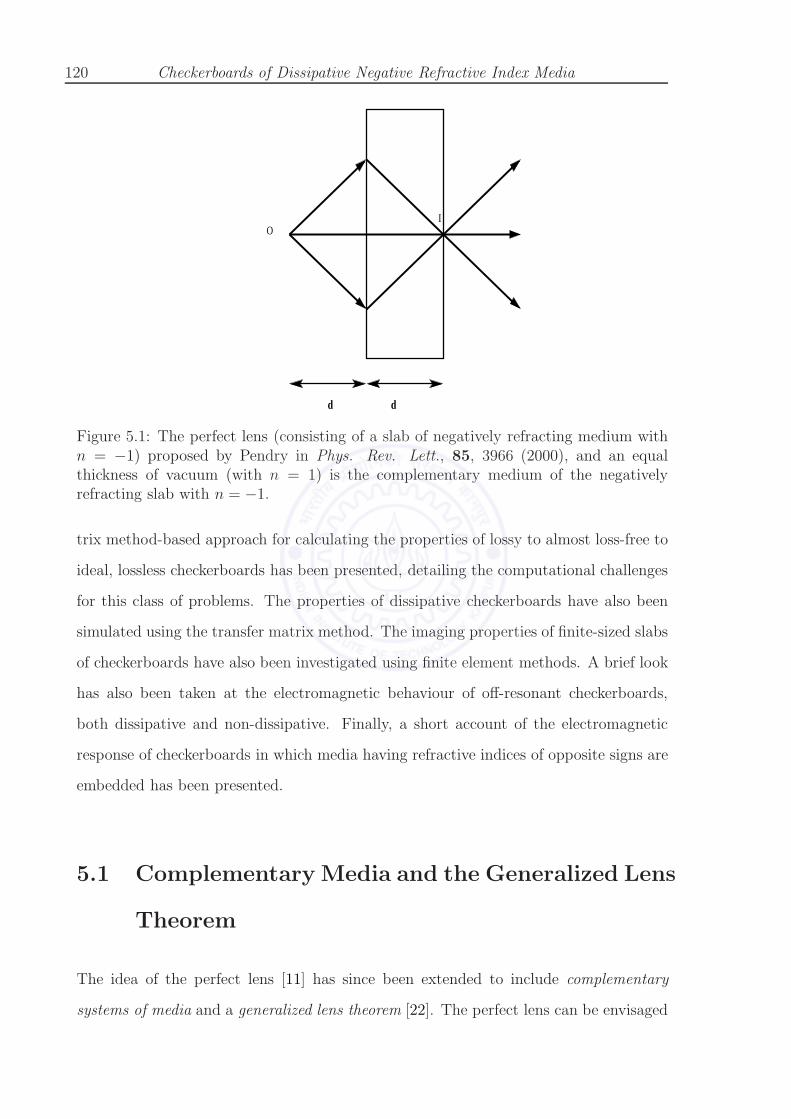
120 Checkerboards of Dissipative Negative Refractive Index Media
I
d d
O
Figure 5.1: The perfect lens (consisting of a slab of negatively refracting medium withn = −1) proposed by Pendry in Phys. Rev. Lett., 85, 3966 (2000), and an equalthickness of vacuum (with n = 1) is the complementary medium of the negativelyrefracting slab with n = −1.
trix method-based approach for calculating the properties of lossy to almost loss-free to
ideal, lossless checkerboards has been presented, detailing the computational challenges
for this class of problems. The properties of dissipative checkerboards have also been
simulated using the transfer matrix method. The imaging properties of finite-sized slabs
of checkerboards have also been investigated using finite element methods. A brief look
has also been taken at the electromagnetic behaviour of off-resonant checkerboards,
both dissipative and non-dissipative. Finally, a short account of the electromagnetic
response of checkerboards in which media having refractive indices of opposite signs are
embedded has been presented.
5.1 Complementary Media and the Generalized Lens
Theorem
The idea of the perfect lens [11] has since been extended to include complementary
systems of media and a generalized lens theorem [22]. The perfect lens can be envisaged

Complementary Media and the Generalized Lens Theorem 121
to behave akin to ‘optical antimatter’ for light in the sense that the effects suffered by
radiation in traversing a certain thickness of positive index medium are cancelled out
when the radiation subsequently traverses an equal thickness of negative index medium.
To an observer on the right-hand side in Fig. 5.1, it is as if the entire thickness 2d never
existed. However, in general, it is not necessary that the negatively refracting medium
be homogeneous for focussing. Any set of complementary media whose thicknesses are
equal and satisfying the condition [22]
ǫ1 = +ǫ(x, y), µ1 = +µ(x, y), ∀0 < z < d, (5.1)
ǫ1 = −ǫ(x, y), µ1 = −µ(x, y), ∀d < z < 2d (5.2)
where ǫ(x, y), µ(x, y) may have arbitrary forms, will focus in a manner similar to the
perfect lens. Further, any region that is mirror-antisymmetric about a given plane (z
= constant) has an optical sum equal to zero and sets of complementary media can
be eliminated from a system in a pairwise fashion [22]. Complementary media are
characterized by the following properties:
T = 1, (5.3)
R = 0 (5.4)
(5.5)
where T and R are the complex transmission and reflection coefficients. This is true for
all wave-vectors, viz., kx/k0 < 1 (propagating waves) and kx/k0 > 1 (evanescent waves).
However, there are small deviations when kx/k0 ≈ 1. As mentioned earlier, this can be
proved for any functional form of ǫ(x, y) and µ(x, y) and was numerically demonstrated
by simulations carried out by means of the Transfer Matrix Method-based PHOTON
codes [75, 76, 137] in Ref. [22].
It was further shown that a corner lens constructed out of NRM could be mapped
(using a co-ordinate transformation [23]) into a stack of slabs where every fourth slab
in the stack is complementary to the other three [22] (see Fig. 5.2). Notomi [26] showed

122 Checkerboards of Dissipative Negative Refractive Index Media
4
0
π2
π
Figure 5.2: A corner reflector (left) can be mapped into a series of slabs where everyfourth slab in the series is complementary to the other three (right). The point sourceis included in every fourth layer so that the entire system is periodic in the direction.
that two negative corners bend light around a loop and return the rays to exactly the
same state from which they started. An exact realization of the condition n = −1 would
ensure that the light would circulate for ever. In this case, the system can be mapped
into a stack of slabs with sources in alternate layers where every slab is complementary
to the next. The system is seen to exhibit perfect lensing. However, the fields inside
are extremely singular, literally infinite in the limit of zero absorption [138]. In the
electrostatic limit, Apell et. al. [139] have proved a theorem for surface plasmons. For
a plasma with a plasma frequency ωp,
ω2sp1 + ω2
sp2 = ω2p. (5.6)
Here, ωsp1 are the surface of a given system and ωsp2 are the modes of a second system
in which the regions of plasma and dielectric are exchanged. This can be used to define
the plasma modes. For systems that map onto themselves, one has
ωsp1 = ωsp2. (5.7)
Thus, in the electrostatic limit, all the plasma modes of the system are degenerate at
ωsp =ωp√
2. (5.8)
Limitations of real materials and imperfect NRMs 123
At this frequency, the density of states becomes infinite. Thus, the local density of
states near any of the surfaces becomes extremely high, particularly at the corners of
the system.
5.2 Limitations of real materials and imperfect NRMs
For a perfect lens made of real metamaterials, the inherent large momentum cut-off set
by the underlying structures of the metamaterial makes infinite resolution impossible. In
addition to this, several other factors are expected to limit the performance of a perfect
lens. Smith et. al. [140] studied the sensitivity of subwavength resolution on the slab
properties and periodicity and its link with the surface plasmon modes. They concluded
that the resolution of a LHM depends logarithmically on the deviation of ǫ and µ from
-1, and inversely on the width of the slab. Deviations in either Re(ǫ) or Re(µ) affect the
image in the same way, depending upon the polarization of the incident radiation. Thus,
p-polarized radiation will be more severely affected by deviations in ǫ from -1, while s-
polarized light is affected by the deviation of µ from the ideal conditions. However,
deviations in µ from -1 also sets a limit for the maximum resolution possible with
p-polarized light, even if ǫ has the ideal theoretical values and is non-dissipative. The
periodicity of the metamaterial may limit the resolution by affecting the recovery of non-
propagating components with a large wave number. Merlin [141] also concluded that the
resolution of a slab of lossless LHM (whose n = −√
(1 − σ)) depends logarithmically
on |σ|, where σ is the deviation of the LHM from the perfect lens condition. The
FDTD calculations of Ziolkowsky and Heyman [142] suggested that the perfect lens
effect could only be observed under the exact restrictive condition ǫ = −1, µ = −1,
and is not realizable with any realistic metamaterial. This has since been explained
in [143]. It has been pointed out [143] that the resonant surface plasmon modes at
the interfaces for n = −1 are always excited by any causal incident wave or pulse with
finite bandwidth. In a FDTD calculation, these resonances remain active indefinitely.
Thus, some amount of dissipation in the material parameters has to be introduced

124 Checkerboards of Dissipative Negative Refractive Index Media
to enable the calculations to reach a steady state within a reasonable period of time.
FDTD simulations thus effectively never reach a steady state with any lossless NRM.
For a slab with a finite transverse extent, though some propagating waves at large
angles may be lost, there is no loss of evanescent components and hence, all the near
field information is preserved [144]. However, plasmons on the slab surface can form
standing waves and significantly distort the image. These effects are limited in the
presence of absorption. In Ref. [138], the spatial oscillations of plasmons at interfaces
were shown to have a logarithmic dependence on the absorption. As mentioned earlier,
the imaging properties of perfect lenses and hence, checkerboards depend upon the
amount of dissipation, dispersion and imperfections in the metamaterial. In fact, it is
well known that dissipation affects the sub-wavelength resolution badly and the singular
density of modes at the corners are expected to worsen it.
5.2.1 Limitations of FDTD analysis for a perfect lens imaging
system
As mentioned earlier, FDTD techniques were unsuccessful during prior attempts at
solving the checkerboard problem. The reasons behind this can be analysed as follows.
Owing to the frequency-dispersive nature of the medium and the time discretization,
there exists an inherent mismatch between the constitutive parameters of the slab and
its surrounding medium. This mismatch in the real part of ǫ and µ is found to be
of the same order of magnitude as the losses typically used in numerical calculations.
Thus, when the LHM slab is lossless, this mismatch contributes the most to the loss
of resolution of the image [145]. This is because the resolution of a subwavelength
imaging system is critically dependent on the reconstruction of evanescent waves by
the LHM slab. The reconstruction again depends on the constitutive parameters of the
slab and even a slight mismatch (∼ 0.03%) in Re(ǫ) or Re(µ) significantly affects the
imaging properties of the LHM slab. This small perturbation in Re(ǫ) or Re(µ) are often
overlooked and imaginary parts with a value in the same order are typically considered
to be the main factor for limiting the image resolution.

Checkerboard systems 125
d
dz
xy
+
+++
+ + +
+ + +−−
− − − −
−−
− − −
−−
−
−
− − −
−
Figure 5.3: Schematic representation of an infinite checkerboard consisting of alternatingcells of positive and negative index media. A source of radiation placed in one cell ofsuch an infinite checkerboard will form an image in every other cell.
The checkerboard systems studied in this chapter have a finite transverse extent and
have finite levels of dissipation associated with them as well. Their imaging properties
may be hindered by the loss of propagating waves at large angles or the distortion of the
image by the standing waves formed by the plasmons on the slab surface. The resolution
of a perfect lens is also known to be dependent (logarithmically) on the absorption in
the medium [141, 140]. Thus, it important to investigate the effect of the finiteness of
the system and the levels of dissipation in it on its transmission and imaging properties,
in the light of the fact that an experimental study of checkerboards will involve finite
sizes and finite dissipation.
5.3 Checkerboard systems
In this section, the electromagnetic response of checkerboard systems in which every cell
is complementary to the other in the x − y (horizontal) plane, has been investigated.
The system is invariant along the z direction. An infinite checkerboard consisting of
optically complementary cells produces an image of the source in every other cell of the
lattice [146] (Fig. 5.3). This is true for both homogeneous isotropic checkerboards as well
as inhomogeneous anisotropic ones as long as they are mirror antisymmetric along the
principal axes of the system. The local density of states becomes infinite at the corners
for the limiting case of infinitely large-sized lattices of non-dissipative checkerboards.
For finite-sized checkerboards, only leaky modes are present in the system, irrespective
126 Checkerboards of Dissipative Negative Refractive Index Media
of whether the medium is dissipative or non-dissipative.
The singularity of the system and the diverging density of modes at the corners makes
it extremely difficult to predict the physical behaviour of checkerboard systems. These
systems are highly susceptible to showing numerical artifacts if numerical modelling is
not done carefully. Consequently, numerical calculations are carried out in a manner
such that the results remain consistent with the complementarity theorem, which is the
only analytical result which is available for predicting the behaviour of these systems.
This can be used to differentiate between numerical artifacts, such as spurious resonances
and the actual physical behaviour of these systems. In addition, accurate numerical
modelling of these systems necessitates the use of a fine numerical grid.
The behaviour of this system (as dictated by the generalized lens theorem)is quite
counterintuitive. As shown in Fig. 5.4, a ray analysis shows that the incident rays
can either be transmitted or retro-reflected. However, the wave analysis predicts full
transmission. The ray analysis which is essentially an approximation, is highly inade-
quate for checkerboard systems due to the large localized fields at the corners which it
cannot describe. This is automatically taken care of in a full-wave calculation, which
consequently provides the correct picture for the transmission of electromagnetic waves
across such singular systems. A similar phenomenon was demonstrated in Ref. [147] for
triangular checkerboards.
5.3.1 Transfer matrix analysis of transmission properties of
ideal and complementary checkerboard layers
The numerical solution of the problem of ideal checkerboards is non-trivial. Initial
attempts to solve the problem using FDTD methods did not succeed due to the di-
vergences arising in the calculations which were later traced to finite differencing ef-
fects [148, 149, 8, 145]. The numerical solutions to this problem, obtained using a refined
version of the PHOTON codes based on the Transfer Matrix Method are presented here.
The checkerboard regions were sliced into thin layers along z with thicknesses consisting

Checkerboard systems 127
+ −
+
+
+
−
−
−
−+
L
d/2
x
z
y L
Figure 5.4: A checkerboard of width L illustrating the conflict between the ray pictureand the wave picture. According to the ray analysis, a ray may be transmitted or retro-reflected while the full wave solutions of Maxwell’s equations validate the results of thegeneralized lens theorem that unit (complete) transmission occurs for all wave vectors.
of only 7 to 11 mesh points to avoid numerical instabilities [137]. The transfer matrix
across each of these thin layers was calculated by propagating Maxwell’s equations along
the z-axis using a finite differencing scheme. The transfer matrices for these layers were
then combined using a multiple scattering formalism [76] to yield the final transfer ma-
trix for the entire system. A free space wavelength of = 4.53µm, together with periodic
boundary conditions along x (with a period of d = 1.11µm or 2.22µm) and a typical
layer thickness of L = 0.45µm (λ/10 were used. It should be noted that the period along
x is irrelevant to the effects discussed in this chapter. It was ensured that the position
of the numerical grid with respect to the checkerboard boundaries is such that the aver-
aged values of ǫ and µ at any grid point do not become zero (singular) [148]. The other
numerical approximations used are those inherent in the PHOTON codes [75, 137].
In Fig. 5.5, the transmission and reflection coefficients for a plane wave incident on
this ideal checkerboard slab as a function of the parallel wave-vector kx have been pre-
sented. In the top panels (a) and (b), the results obtained using 202 mesh points across
period d have been shown. It is found that although the transmission is approximately
one for the propagating waves (kx < k0 = ω/c), the reflectivity and the phase (φT ) of

128 Checkerboards of Dissipative Negative Refractive Index Media
0.0 0.2 0.4 0.6 0.8 1.0 1.2 1.4 1.6 1.80
1
2
3
|T|2 (p-pol) |T|2 (s-pol) |R|2 (p-pol) |R|2 (s-pol)
|R|2 , |T
|2
kx/k0
(a)
0.0 0.2 0.4 0.6 0.8 1.0 1.2 1.4 1.6 1.8
-0.4
-0.2
0.0
0.2
0.4
T (p-pol)
T (s-pol)
T
kx/k0
(b)
0.0 0.4 0.8 1.2 1.6 2.00.0
0.2
0.4
0.6
0.8
1.0
1.2
|T|2 (p-pol) |T|2 (s-pol) |R|2 (p-pol) |R|2 (s-pol)
|R|2 , |T
|2
kx/k0
(c)
0.0 0.4 0.8 1.2 1.6 2.0-0.4
-0.2
0.0
0.2
0.4
T (p-pol)
T (s-pol)
T
kx/k0
(d)
Figure 5.5: The perfect checkerboard characterized by ǫ− = −1, µ− = −1, ǫ+ =+1, µ+ = +1. These plots illustrate the importance of the fineness of the numericalgrid in achieving accurate numerical results. (a) and (b): The response of the same sys-tem as calculated using a numerical grid containing 202 points. A resonance (actually anumerical artefact), occurs at kx ≃ k0, for better discretization, this shifts to kx ≃ 3k0.(c) and (d): The response of the ‘perfect checkerboard’ as calculated using a fine nu-merical grid consisting of 262 points. The transmittivity is nearly zero and the phasechange of the transmitted component (φT ) is nearly zero throughout.
the transmission are non-zero (for both p- and s-polarized light ). The transmission
coefficient also becomes very large for subwavelength kx > k0. One also observes the
appearance of a resonant response of a slab polariton at subwavelength wave-vectors
whereas the generalised lens theorem predicts that no resonance will be excited for any
finite value of kx for ǫ = µ = ±1. This spurious resonance shifts to larger values of kx
as the numerical mesh size is decreased. In the lower panels (c) and (d), the response
obtained for better discretization (262 points across d), has been plotted. The spurious
resonance now shifts to a point beyond kx = 3k0 and the transmittivity becomes closer
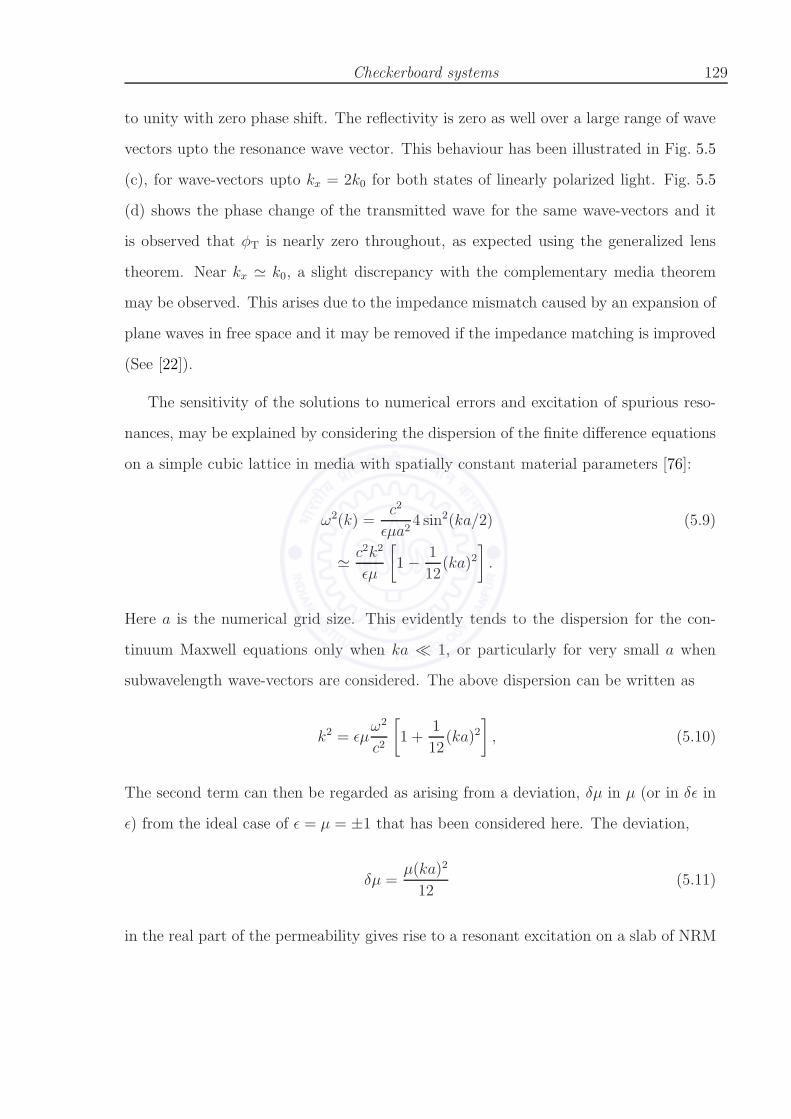
Checkerboard systems 129
to unity with zero phase shift. The reflectivity is zero as well over a large range of wave
vectors upto the resonance wave vector. This behaviour has been illustrated in Fig. 5.5
(c), for wave-vectors upto kx = 2k0 for both states of linearly polarized light. Fig. 5.5
(d) shows the phase change of the transmitted wave for the same wave-vectors and it
is observed that φT is nearly zero throughout, as expected using the generalized lens
theorem. Near kx ≃ k0, a slight discrepancy with the complementary media theorem
may be observed. This arises due to the impedance mismatch caused by an expansion of
plane waves in free space and it may be removed if the impedance matching is improved
(See [22]).
The sensitivity of the solutions to numerical errors and excitation of spurious reso-
nances, may be explained by considering the dispersion of the finite difference equations
on a simple cubic lattice in media with spatially constant material parameters [76]:
ω2(k) =c2
ǫµa24 sin2(ka/2) (5.9)
≃ c2k2
ǫµ
[
1 − 1
12(ka)2
]
.
Here a is the numerical grid size. This evidently tends to the dispersion for the con-
tinuum Maxwell equations only when ka ≪ 1, or particularly for very small a when
subwavelength wave-vectors are considered. The above dispersion can be written as
k2 = ǫµω2
c2
[
1 +1
12(ka)2
]
, (5.10)
The second term can then be regarded as arising from a deviation, δµ in µ (or in δǫ in
ǫ) from the ideal case of ǫ = µ = ±1 that has been considered here. The deviation,
δµ =µ(ka)2
12(5.11)
in the real part of the permeability gives rise to a resonant excitation on a slab of NRM

130 Checkerboards of Dissipative Negative Refractive Index Media
of thickness t with a parallel wave-vector (kx) [140],
kxd = − ln(δµ
2) = − ln(
k2xa
2
24) (5.12)
in the limit of large parallel wave-vector kx ≫ k0 .
In the limit kxa ≪ 1, the parallel wave-vector for this spurious resonance induced
by the discretization will be kx ∼ (a large number)/d. In the ideal continuum limit of
a→ 0, we have kx → ∞, as expected from the continuum equations. Thus, at any level
of discretization, a spurious resonance of the system (s) for some finite kx will always be
excited in a numerical calculation. The value of the the parallel wave-vector k(s)x for the
spurious resonance gives the range of kx significantly smaller than the k(s)x for which the
calculations would have converged. In our problem of the checkerboard, d can be taken
to be the larger dimension of the checkerboard cell. In that case, the expression above
in the long wavelength limit gives k(s)x ∼ 3k0 for d ∼ λ/2 and k
(s)x ∼ 8k0 for d ∼ λ/4.
This approximate estimate is in reasonable agreement with the numerical calculations
where retardation effects also play a role and the geometry is also more complicated
than a simple slab.
The other significant deviation, mainly at kx ∼ k0 , can be attributed to the numer-
ically approximate impedance matching at the interfaces. Thus, within the accuracy of
our numerical scheme, the generalised lens theorem for this system has been verified for
kx < 2.5k0 .
5.4 Dissipative Checkerboards of Finite Extent
The properties of finite two-dimensional (2-D) checkerboards of dissipative but homo-
geneous NRM have been discussed in this section. A layer of a 2-D checkerboard in the
x− z plane and of thickness L along z, along with its complementary checkerboard (of
the same thickness), embedded in vacuum (Fig 5.6), is considered. Invariance along the
y axis is assumed. The response of this system for the ideal lossless values of the per-

Dissipative Checkerboards of Finite Extent 131
+
− + + +
+++−
− − −
−−
x
z
yd
d
Figure 5.6: A checkerboard of finite width such as those studied in this section. It hasbeen shown to obey the generalized lens theorem and exhibits unit transmittivity andzero reflectivity for all wave-vectors, both the propagating as well as the evanescent.
mittivity and the permeability, ǫ = ±1 and µ = ±1, were calculated and have already
been presented in the previous section.
5.4.1 The electromagnetic response of dissipative checkerboards
The response of checkerboards was calculated for various levels of dissipation. In this
section, the checkerboards studied may be described as ǫ+ = (1, 0), ǫ− = (−1, αe), µ+ =
(1, 0) and µ+ = (−1, αm). αe and αm range between 10−4 to 0.1. In the results presented
here, the same levels of dissipation are associated with both the dielectric and the
magnetic properties under consideration, i.e., αe = αm. This analysis also tests the
robustness of the focussing effects against dissipation. In Fig. 5.7 and Fig. 5.8, the
transmission and reflection coefficients for dissipative checkerboards have been plotted.
When the imaginary parts of ǫ and µ are nearly 10−4 , the results were not very different
from that of the lossless system (Fig. 5.7 (a) and (b)). Even with larger values of 0.1
for both Im(ǫ) and Im(µ) (Fig. 5.8), it can be seen that although the transmission is
not total, it is clearly very flat as a function of kx even for sub-wavelength wavevectors
(Fig. 5.8 (c) and (d)). Thus, one can infer that the focussing effects in the system will
be robust against dissipation, probably as robust as in the single slab lens. This is
surprising in view of the divergences in the local density of modes at the corners. The
gradual evolution of the checkerboard response for different levels of dissipation has been
shown in Fig. 5.7 and Fig. 5.8. The transmittivity indicates that a considerable amount
of subwavelength information can still be transferred, inspite of the dissipation in the
system. The results for the checkerboards with realistic levels of dissipation indicate that

132 Checkerboards of Dissipative Negative Refractive Index Media
0.0 0.2 0.4 0.6 0.8 1.0 1.2 1.4
0.0
0.2
0.4
0.6
0.8
1.0
|T|2(p-pol) |T|2(s-pol) |R|2(p-pol) |R|2(s-pol)
e = 0.0001,
m = 0.0001
|T|2 , |R
|2
kx/k0
(a)
0.0 0.2 0.4 0.6 0.8 1.0 1.2 1.4-0.4
-0.2
0.0
0.2
0.4
T (p-pol)
T (s-pol)
e = 0.0001,
m = 0.0001
T
kx/k0
(b)
0.0 0.2 0.4 0.6 0.8 1.0 1.2 1.4
0.0
0.2
0.4
0.6
0.8
1.0
|T|2(p-pol) |T|2(s-pol) |R|2(p-pol) |R|2(s-pol)
e = 0.001,
m = 0.001
|T|2 , |R
|2
kx/k0
(c)
0.0 0.2 0.4 0.6 0.8 1.0 1.2 1.4-0.4
-0.2
0.0
0.2
0.4
e = 0.001,
m = 0.001
T (p-pol)
T (s-pol)
T
kx/k0
(d)
Figure 5.7: (a) & (c): The transmission properties of dissipative checkerboards whoseIm(ǫ) and Im(µ) are 0.0001 and 0.001 respectively.(b) & (d): The phase change of the transmitted component for both polarizations oflight and for the same levels of dissipation in (a) & (c), respectively.
if practically implemented, these structures would continue to replicate subwavelength
features of the object.
It should be noted that the dissipation here is comparable to that in silver which has
been suggested and used as a near-field lens. We have also calculated the response of a
silver-vacuum checkerboard with ǫ = −1+i0.4 and µ = +1 (Fig. 5.9). The transmittivity
and reflectivity for dissipative checkerboard systems with ǫ = µ = −1+i0.1 (right panel)
and a silver checkerboard with ǫ = −1+i0.4 and µ = +1 everywhere (left panel). can be
compared. In the case of the silver checkerboard, resonant excitation of surface plasmon
modes at subwavelength kx for p-polarized waves only, can be seen.

Off-resonance checkerboards 133
0.0 0.2 0.4 0.6 0.8 1.0 1.2 1.4
0.0
0.2
0.4
0.6
0.8
1.0
|T|2(p-pol) |T|2(s-pol) |R|2(p-pol) |R|2(s-pol)
|T|2 , |R
|2
kx/k0
e = 0.01,
m = 0.01
(a)
0.0 0.2 0.4 0.6 0.8 1.0 1.2 1.4
-0.4
-0.2
0.0
0.2
0.4
e = 0.01,
m = 0.01
T (p-pol)
T (s-pol)
T
kx/k0
(b)
0.0 0.2 0.4 0.6 0.8 1.0 1.2 1.4
0.0
0.2
0.4
0.6
0.8
1.0
|T|2(p-pol) |T|2(s-pol) |R|2(p-pol)|R|2(s-pol)
e = 0.1,
m = 0.1
|R|2 , |T
|2
kx/k0
(c)
0.0 0.2 0.4 0.6 0.8 1.0 1.2 1.4
-0.4
-0.2
0.0
0.2
0.4
T (p-pol)
T (s-pol)
e = 0.1,
m = 0.1
T
kx/k0
(d)
Figure 5.8: (a) & (c): The transmission properties of dissipative checkerboards whoseIm(ǫ) and Im(µ) are somewhat higher, being 0.01 and 0.1 respectively.(b) & (d): The phase change of the transmitted component for both polarizations oflight and for the same levels of dissipation in (a) & (c), respectively.
5.5 Off-resonance checkerboards
In the spirit of the preceding sections, the behaviour of checkerboard systems where the
permittivity and the permittivity in adjacent cells are not complementary to each other
has been briefly studied here. Such off-resonant checkerboards assume importance in
the light of the fact that the highly singular condition ǫ = −1, µ = −1 is difficult to
achieve at a single frequency. Here the checkerboard has the following configuration:
ǫ+ = +1, µ+ = +1, ǫ− = −1 + αe + iδe, µ− = −1 + αm + iδm. αe and αm represent
the deviation of the checkerboard from the ideal condition in the real parts while δe
and δm represent the dissipation. Thus, the condition of degeneracy of the surface
plasmons is lifted. Together with the dissipation in the system, the deviation from the
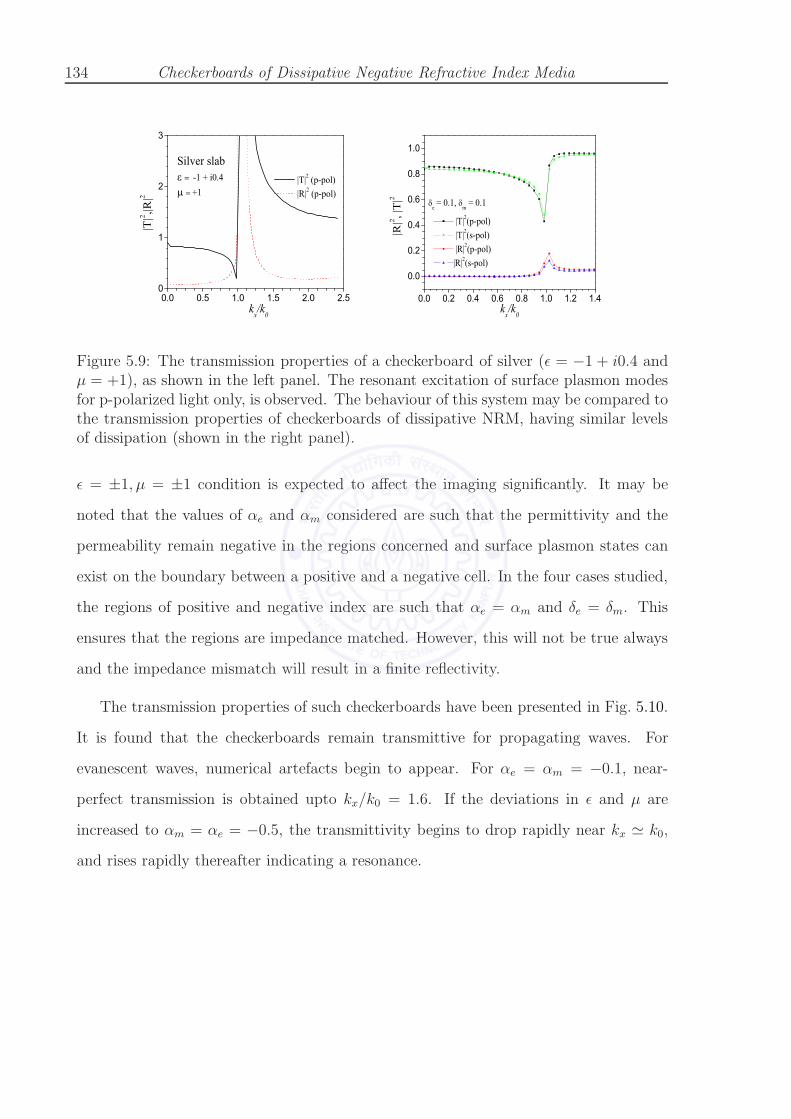
134 Checkerboards of Dissipative Negative Refractive Index Media
0.0 0.5 1.0 1.5 2.0 2.50
1
2
3
|T|2 (p-pol) |R|2 (p-pol)
|T|2 ,|
R|2
kx/k0
Silver slab-1 + i0.4+1
0.0 0.2 0.4 0.6 0.8 1.0 1.2 1.4
0.0
0.2
0.4
0.6
0.8
1.0
|T|2(p-pol) |T|2(s-pol) |R|2(p-pol)|R|2(s-pol)
e = 0.1,
m = 0.1
|R|2 , |
T|2
kx/k0
Figure 5.9: The transmission properties of a checkerboard of silver (ǫ = −1 + i0.4 andµ = +1), as shown in the left panel. The resonant excitation of surface plasmon modesfor p-polarized light only, is observed. The behaviour of this system may be compared tothe transmission properties of checkerboards of dissipative NRM, having similar levelsof dissipation (shown in the right panel).
ǫ = ±1, µ = ±1 condition is expected to affect the imaging significantly. It may be
noted that the values of αe and αm considered are such that the permittivity and the
permeability remain negative in the regions concerned and surface plasmon states can
exist on the boundary between a positive and a negative cell. In the four cases studied,
the regions of positive and negative index are such that αe = αm and δe = δm. This
ensures that the regions are impedance matched. However, this will not be true always
and the impedance mismatch will result in a finite reflectivity.
The transmission properties of such checkerboards have been presented in Fig. 5.10.
It is found that the checkerboards remain transmittive for propagating waves. For
evanescent waves, numerical artefacts begin to appear. For αe = αm = −0.1, near-
perfect transmission is obtained upto kx/k0 = 1.6. If the deviations in ǫ and µ are
increased to αm = αe = −0.5, the transmittivity begins to drop rapidly near kx ≃ k0,
and rises rapidly thereafter indicating a resonance.

Some Other Checkerboard Structures 135
0.0 0.2 0.4 0.6 0.8 1.0 1.2 1.4
0.0
0.2
0.4
0.6
0.8
1.0
1.2
1.4
|T|2 (p-pol) |R|2 (p-pol) |T|2 (s-pol) |R|2 (s-pol)
|R|2 , |
T|2
kx/k0
e =
m = 0.1
e =
m = 0
(a)
0.0 0.2 0.4 0.6 0.8 1.0 1.2 1.4
0.0
0.2
0.4
0.6
0.8
1.0
1.2
1.4 (b)
e =
m = 0.1
e =
m = 0.001
|T|2 (p-pol) |R|2 (p-pol) |T|2 (s-pol) |R|2 (s-pol)
|R|2 , |
T|2
kx/k0
0.0 0.2 0.4 0.6 0.8 1.0 1.2 1.4
0.0
0.2
0.4
0.6
0.8
1.0
|T|2 (p-pol) |R|2 (p-pol) |T|2 (s-pol) |R|2 (s-pol)
|R|2 , |
T|2
kx/k0
e =
m = - 0.1
e =
m = 0.001
(c)
0.0 0.2 0.4 0.6 0.8 1.0 1.2 1.4
0.0
0.2
0.4
0.6
0.8
1.0
e =
m = - 0.5
e =
m = 0.001
|R|2 , |
T|2
kx/k0
|T|2 (p-pol) |R|2 (p-pol) |T|2 (s-pol) |R|2 (s-pol)
(d)
Figure 5.10: The response of off-resonance checkerboard structures (dissipative andnon-dissipative). The permittivity and the permeability of these checkerboards havethe generic forms ǫ+ = +1, µ+ = +1, ǫ− = −1 + αe + iδe, µ− = −1 + αm + iδm. Whenthe mismatch ∼ 0.1, perfect transmission is obtained upto kx ≃ k0 for the lossless case.For dissipative checkerboards with a higher degree of mismatch, the transmission isconsiderably lower for propagating waves. Numerical artefacts also start appearing forkx > k0.
5.6 Some Other Checkerboard Structures
Other structures similar to the checkerboard structures such as the one shown in Fig. 5.11
are also expected to have similar behaviour as well as follow the perfect lens theorem as
long as the generalized lens theorem is obeyed. Such a checkerboard slab expected to
display unit transmission for all waves as long as the different sections of checkerboard
are optically complementary to each other. It is found that, as expected, these media
exhibit nearly unit transmittivity and zero reflectivity even for sub-wavelength wave

136 Checkerboards of Dissipative Negative Refractive Index Media
+
+
+
+
−
−
−
−
P
0.0 0.5 1.0 1.5 2.0 2.5
0.0
0.2
0.4
0.6
0.8
1.0
|T|2 (p-pol) |R|2 (p-pol) |T|2 (s-pol) |T|2 (s-pol)
|R|2 , |
T|2
kx/k0
Figure 5.11: Left: An example of the unit cell of a modified checkerboard mediumstudied in this section. The shaded regions correspond to the negative refractive indexregions. Locally enhanced fields occur near the central point (P) and these fields increaseas the inner regions of negative/positive index media are increased in size. Right: Thereflectivity and the transmittivity of such a checkerboard.
vectors. There are large enhancements of the electric field near the boundaries of the
positive and the negative index media. The results [150] of calculations for checker-
board structures with the embedded ‘defect’ regions having three different thicknesses
have been presented in Fig. 5.11. The transmittivity indicates that the system behaves
as predicted. As seen in the earlier cases, the accuracy of the numerical grid is very
important. Any small mismatches in the widths of the regions results in the appearance
of numerical artifacts. The electric field distribution in the system for an incident plane
wave, calculated using FEM (COMSOLTM) have also been presented. Surface plasmon
modes are seen to be excited on the boundaries between the positive and the negative
index regions. The fields are found to be strongly confined about the central point in
Fig. 5.11. The larger the inner rectangular ‘defect’ regions, the higher is the electric
field in the thin bridges formed out of media with refractive indices of opposite signs. As
the inner regions with the opposite indices become smaller, concentration of the electric
fields in the central bridging region reduces but nevertheless the fields there are higher

Some Other Checkerboard Structures 137
compared to those in the other regions.
5.6.1 FEM calculations
Figure 5.12: Left panel: The P-polarized eigenfield associated with a line source whosewavelength is 0.5d (d is about 9µm) placed at a distance 0.2d from a silver checkerboardslab consisting of 30 cells of side length 0.1d, alternating air and weakly dissipative silvercells (ǫ = −1 + i0.01 andµ = +1). The scale on the right is in arbitrary units. (a) 2Dplot of the field; (c) Profile of the field computed along a vertical segment with endpoints (0,1)d and (0,-1)d.Right panel: Same with two pairs of complementary checkerboard layers (60 cells); (b)2D plot of the field; (d) 3D plot of the field.
In this section, the behaviour of a silver checkerboard lens of finite transverse size
has been discussed first. Fig. 5.12 depicts the response of a small, slightly dissipative
checkerboard system consisting of thirty cells with ǫ = −1 + i0.01 and µ = +1, for
a line source placed at point (0, 0.6) for the p-polarization. The numerical problem
was set using the weak form of Maxwell’s system and discretising it with test functions
138 Checkerboards of Dissipative Negative Refractive Index Media
(Whitney 1-forms, or Nedelec edge elements) defined as
we = λi∇λj − λj∇λi (5.13)
on the edges between vertices i and j of the triangle of the mesh with barycentric co-
ordinates λi (the FEM mesh generator is a grid-based Delauney triangulation). Such
vector fields are known to have a continuous tangential component across interfaces
between different media (hence exhibiting two anti-parallel wave-vectors at both sides
of interfaces between complementary media). The use of such curl-confirming elements
avoids the generation of spurious modes [151] and is particularly well suited for high-
contrast media and left-handed materials. The use of nodal elements is problematic
as the ‘penalty term’ or the ’stiffness’ term involved in the weak formulation of the
problem itself vanishes for left-handed media. The continuity of the normal components
of the fields on the boundary between elements has to be enforced for the nodal ele-
ment formulation, while no such condition is forcefully implemented in the edge-element
approach. The (hypo) ellipticity of Maxwell’s system is ensured by the small dissipa-
tion, and existence and uniqueness of the solution is a consequence of outgoing-wave
conditions enforced with Perfectly Matched Layers [152] which provides a reflectionless
interface between the region of interest (large middle square containing the line source
and the checkerboard on Fig. 5.13, for example), and the PML (four elongated rectan-
gles and four small squares) at all incident angles. The use of Nedelec edge elements is
particularly well suited for implementation of PML as this can be seen as a geometric
transform for which differential forms are well suited (pull-back properties). Numerical
simulations have been carried out with an adaptive mesh of upto 91780 finite elements to
check the convergence of the finite element method (implemented in COMSOLTM which
uses robust ARPACK solvers). One can clearly see that the source is reproduced in the
focal plane of the checkerboard lens on upper left panel of Fig. 5.12 (a). Fig. 5.12 (c),
represents the profile of the p-polarized eigenfield computed along a vertical segment
running from point (0, 1)d to point (0, -1)d. An anti-symmetric plasmon mode excited
at the upper interface between positive and negative index media (upper boundary of
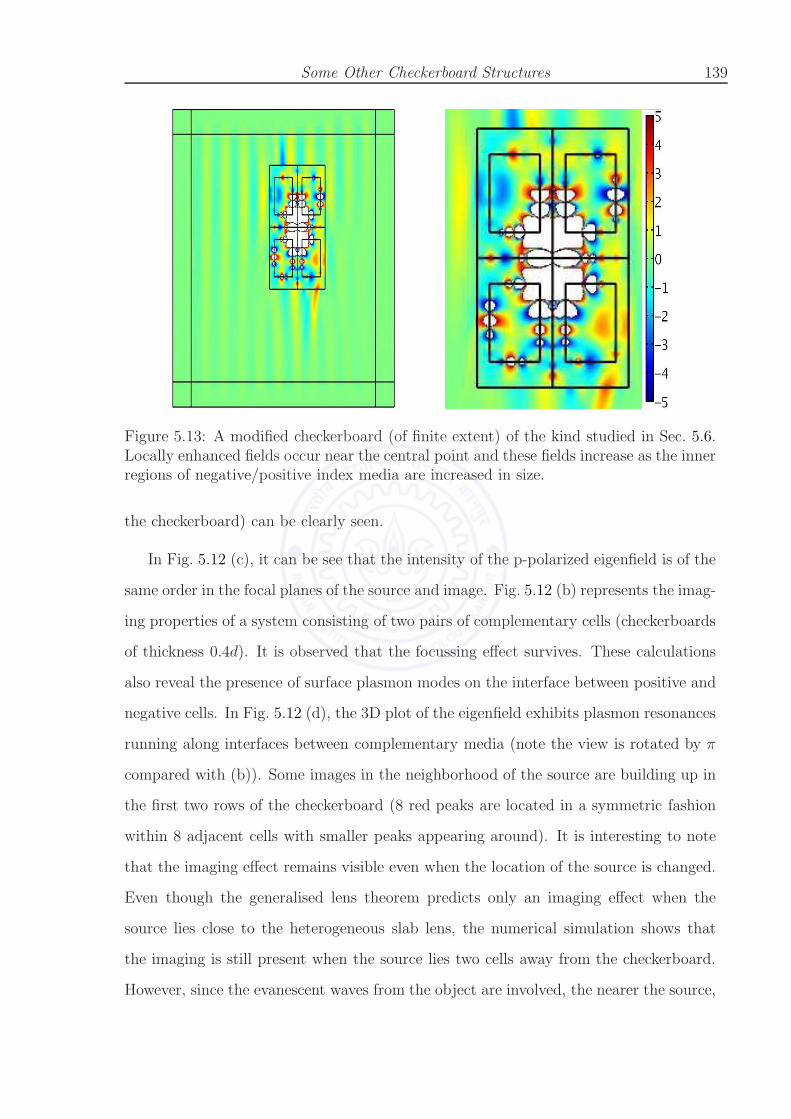
Some Other Checkerboard Structures 139
Figure 5.13: A modified checkerboard (of finite extent) of the kind studied in Sec. 5.6.Locally enhanced fields occur near the central point and these fields increase as the innerregions of negative/positive index media are increased in size.
the checkerboard) can be clearly seen.
In Fig. 5.12 (c), it can be see that the intensity of the p-polarized eigenfield is of the
same order in the focal planes of the source and image. Fig. 5.12 (b) represents the imag-
ing properties of a system consisting of two pairs of complementary cells (checkerboards
of thickness 0.4d). It is observed that the focussing effect survives. These calculations
also reveal the presence of surface plasmon modes on the interface between positive and
negative cells. In Fig. 5.12 (d), the 3D plot of the eigenfield exhibits plasmon resonances
running along interfaces between complementary media (note the view is rotated by π
compared with (b)). Some images in the neighborhood of the source are building up in
the first two rows of the checkerboard (8 red peaks are located in a symmetric fashion
within 8 adjacent cells with smaller peaks appearing around). It is interesting to note
that the imaging effect remains visible even when the location of the source is changed.
Even though the generalised lens theorem predicts only an imaging effect when the
source lies close to the heterogeneous slab lens, the numerical simulation shows that
the imaging is still present when the source lies two cells away from the checkerboard.
However, since the evanescent waves from the object are involved, the nearer the source,

140 Checkerboards of Dissipative Negative Refractive Index Media
the better is the imaging expected to be. Fig. 5.12 (b) shows that the image is slightly
closer to the checkerboard slab than the image. In addition, when we increase the size
of the checkerboard, the imaging process is found to be robust against dissipation.
Figure 5.14: A modified checkerboard (of infinite extent) of the kind studied in Sec. 5.6.The locally enhanced fields occuring near the central point increase in intensity as theinner regions of negative/positive index media are increased in size. The fields at thecentral regions (white) exceed those in the neighbouring regions by several orders ofmagnitude as the inner regions of negative/positive index media increase in size (Bottom,left and right panels).

Conclusion 141
In Fig. 5.13 and Fig. 5.14, the results of finite element calculations of the checker-
boards described in Sec. 5.6 carried out using COMSOLTM have been presented. Fig. 5.13
illustrates the response of a finite checkerboard of this type when illuminated by a plane
wave. The wave propagates across the medium, with large fields building up in the cen-
tral part of the checkerboard. The excitation of surface plasmon modes at the interfaces
between the positive and the negative index media can also be observed. The surface
plasmon modes also give rise to the strongly localized fields. The distortion in the fields
at the boundary of the checkerboard is due to its finite size.
Similar calculations were carried out for such infinite checkerboards of with embedded
regions of media with opposite indices of refraction. The effects of the finite size of the
checkerboard are seen to go away. Large localized fields, whose magnitudes exceed
those in other regions by several orders of magnitude, occur at the central region of
the checkerboard. These fields increase in magnitude as the embedded regions become
larger. The local density of states in these regions is very high.
5.7 Conclusion
In this chapter, the ideas of the generalized lens theorem have been extended to com-
plementary checkerboards of positive and negative index media. Checkerboards of both
lossless as well as dissipative NRM have been dealt with. The behaviour of this system
is quite counterintuitive and ray analyses are shown to contradict the predictions of the
generalized lens theorem. It has been shown that the numerical solution of this problem
is a non-trivial issue that is highly susceptible to numerical artifacts that stem from dis-
cretization issues. Using TMM-based methods with an appropriate level of discretization
for the numerical grid, the behaviour of ‘perfect’ checkerboards was adequately simu-
lated from the viewpoint of the generalized lens theorem. The transmittivity was shown
to be nearly unity both for the propagating as well as subwavelength wave-vectors along
with zero phase change for the transmitted component upto kx ≃ 3k0. A spurious res-
onance which formerly occurred at kx ≃ k0 for inadequate discretization was shown to

142 Checkerboards of Dissipative Negative Refractive Index Media
get pushed beyond kx ≃ 3k0 when finer levels of discretization were used.
Similar calculations were carried out for dissipative checkerboards. In the case of dis-
sipative checkerboards, the imaging effects are seen to be preserved even for reasonably
high levels of dissipation. Although the overall transmission is lowered, a considerable
amount of subwavelength information may still be transferred for realistic levels of dis-
sipation, comparable to that in silver which has been proposed and used as a near-field
lens. The response of a silver checkerboard calculated similarly has also been compared
to a dissipative checkerboard with similar loss. These calculations illustrate the fact
that within the accuracy of the numerical calculations presented, focussing effects in
checkerboards of NRM are reasonably robust against dissipation, at least as robust as
in slabs of negative index media. This is surprising in the face of the expectation that
dissipation in such singularly degenerate systems should have wiped out all such effects.
Similar calculations were performed for checkerboards whose material properties
deviated by small amount from the highly singular condition ǫ = ±1, µ = ±1. In all the
cases, transmission is nearly unity for the propagating waves, while for the evanescent
waves, spurious resonances crop up.
The electromagnetic response of checkerboards with embedded regions of media
with indices of opposite signs was studied using the transfer matrix method as well
as COMSOLTM. These checkerboards are found to obey the generalized lens theorem
and exhibit perfect transmission in the absence of losses in the checkerboards. Finite
element calculations reveal the presence of localized and enhanced fields in the central
region of the checkerboard. The enhanced fields and the local density of states in this
region increase greatly as the embedded regions of opposite index become larger in size.
Chapter 6
Future Directions
So far, the behaviour of metamaterials at optical frequencies, leading to the breakdown
of effective medium behaviour and schemes for controlling metamaterial responses at
optical frequencies have been examined. In addition, the electromagnetic response of
checkerboard structures of negative and positive index media and its sensitivity to the
numerical modelling involved has also been studied. These ideas can, however, be ex-
tended further and can be implemented in numerous applications in a versatile manner.
The breakdown of the homogenization approach is one aspect which can be further
studied. The effective parameters also start showing spatial dispersion as the unit
cell size of the metamaterial becomes comparable to the wavelength at resonance. In
such cases, a set of restricted spatially dispersive equivalent medium parameters may
be used to model the response of the metamaterial. Most material implementations
are somewhere at the range of this breakdown and hence, such modelling owuld be
tremendously useful to develop applications and devices.
The control scheme using coherent optical effects has been implemented here with
some simplifications. These calculations may be improved by including the modulation
of the incident field by the dispersive permittivity of the medium. The effect of disorder
may also be modelled by defining a super-cell which contains non-identical metamate-
rial units and then applying periodic boundary conditions using the Transfer Matrix
143
144 Future Directions
Method. Further in our treatment the coherent effects all over the metamaterial are
assumed to develop from a homogeneous pump field. A rigorous calculation of the in-
homogeneous pump field and incorporation of this inhomogeneity into the modelling
of coherent effects would be necessary for a full description of this effect. Additionally
effects that are nonlinear in the probe field also required to be modelled. Similarly,
the plasma-like behaviour, which has already been shown to be independent of the
distribution of nanoparticles in the unit cell, can be further investigated to model the
variations of the effective plasma frequency beyond the simple bulk averaging used in
this thesis. For higher filling fractions, deviations from this model are expected, upto
the percolation threshold.
Checkerboard structures of negative and positive index media can be built in dif-
ferent configurations. As long as they are optically complementary to each other, they
are expected to be perfectly transmittive for all propagating and evanescent waves. In
three dimensions, checkerboards present a much richer set of physical phenomena. The
behaviour of three dimensional systems may be studied numerically. One may also in-
vestigate them in non-Euclidean geometries. Checkerboards give rise to very singular
fields (large local field enhancements) as well as very singular density of states (large
changes to emission probabilities). Investigation of these effects for various configura-
tions of checkerboards can result in myriad applications like control and enhancement of
fluorescence emission, surface enhanced Raman scatterings (SERS) and other plasmonic
effects with checkerboard systems.

Appendix: Transfer Matrix Method
The PHOTON code, based on the Transfer Matrix Method was developed by Sir
John Pendry et. al. at the Imperial College, London. The method works on a fairly
simple principle: If one knows the electric and the magnetic fields in the x− y plane at
z = 0, then Maxwell’s equations may be used to determine the electric and the magnetic
fields at z = c in the x− y plane. In mathematical terms, this may be represented as:
F(z = c) = T(c, 0)F(z = 0), (6.1)
where T is the transfer matrix and F may represent either the electric or the magnetic
fields. The transfer matrix thus defines the propagation of wavefields across a slab
of material and so it is also useful in determining the reflection and the transmission
coefficients of the slab. If one considers an infinite medium formed by repeating the slab
periodically, the Bloch condition can be applied:.
exp(iKc)F(z = 0) = F(z = c) = T(c, 0)F(z = 0), (6.2)
and determine the dispersion K(ω) from the eigenvalues of the T matrix.
A discrete form of Maxwell’s equations on a lattice is employed in the numerical
implementation of this computational scheme [76]. The various algorithms employed
in the code have been described in detail in Ref. [137]. In Fig. 6.1, we present a dia-
grammatic representation of the various steps involved in numerically solving Maxwell’s
equations on a lattice to determine either the band-structure or the transmission and
the reflection coefficients of the medium.
Maxwell’s equations are solved according to the scheme outlined in Fig. 6.1 to ob-
tain the band structure or the reflection and the transmission coefficients. In order to
determine the reflection and and transmission properties of a slab consisting of multiple
layers, the transmission and reflection coefficients are determined for each layer and
145
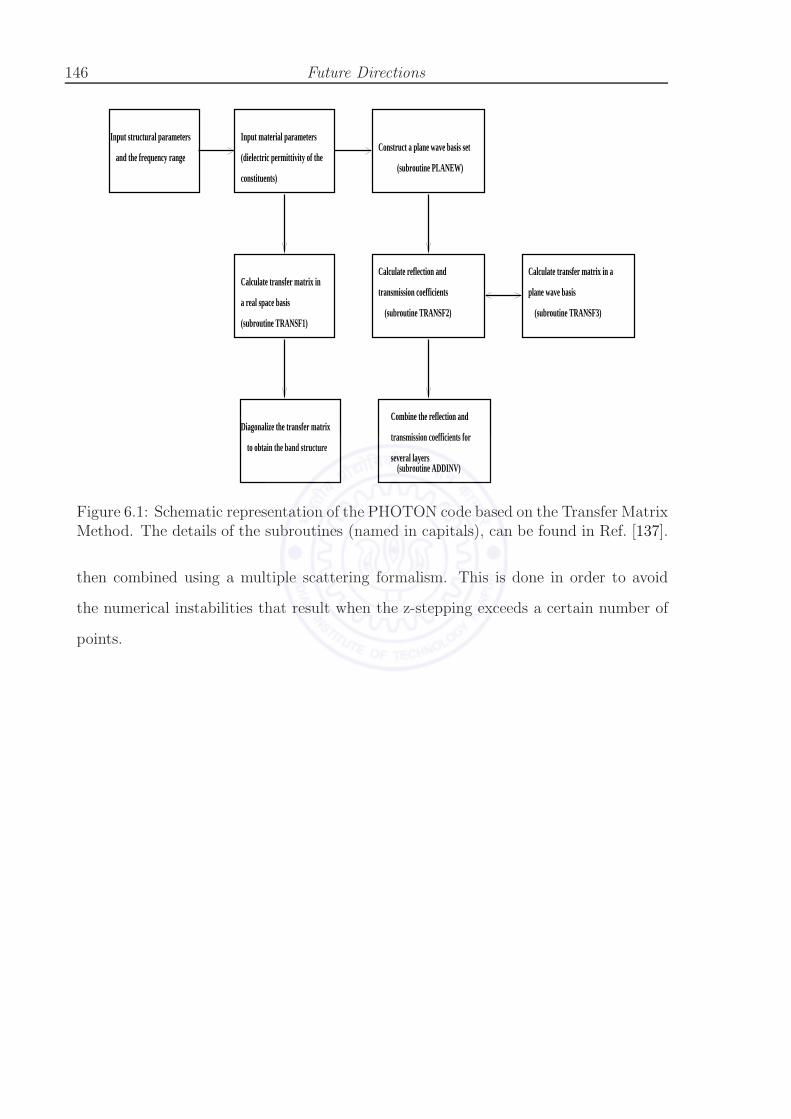
146 Future Directions
(subroutine TRANSF3)
plane wave basis
Calculate transfer matrix in a
(subroutine ADDINV)several layers
transmission coefficients for
Combine the reflection and
to obtain the band structure
Diagonalize the transfer matrix
(subroutine TRANSF2)
transmission coefficients
Calculate reflection and
(subroutine TRANSF1)
a real space basis
Calculate transfer matrix in
(subroutine PLANEW)
Construct a plane wave basis set(dielectric permittivity of the
constituents)
Input material parameters Input structural parameters
and the frequency range
Figure 6.1: Schematic representation of the PHOTON code based on the Transfer MatrixMethod. The details of the subroutines (named in capitals), can be found in Ref. [137].
then combined using a multiple scattering formalism. This is done in order to avoid
the numerical instabilities that result when the z-stepping exceeds a certain number of
points.
Bibliography
[1] V. G. Veselago. The Electrodynamics of Substances with Simultaneously Negative
Values of ǫ and µ. Soviet Physics Uspekhi, 10:509–514, 1968.
[2] R. A. Shelby, D.R. Smith, and S. Schultz. Experimental Verification of a Negative
Index of Refraction. Science, 292:77–79, 2001.
[3] C. G. Parazzoli, R. B. Greegor, K. Li, B. E. C. Koltenbah, and M. Tanielian.
Experimental Verification and Simulation of Negative Index of Refraction Using
Snell’s Law. Phys. Rev. Lett., 90:107401–107404, 2003.
[4] Jie Lu, Tomasz Grzegorczyk, Yan Zhang, Joe Pacheco Jr., Bae-Ian Wu, Jin Kong,
and Min Chen. Cerenkov radiation in materials with negative permittivity and
permeability. Opt. Express, 11:723–734, 2003.
[5] Chiyan Luo, Mihai Ibanescu, Steven G. Johnson, and J. D. Joannopoulos.
Cerenkov Radiation in Photonic Crystals. Science, 299:368–371, 2003.
[6] Jin Au Kong, Bae-Ian Wu, and Yan Zhang. Lateral displacement of a Gaussian
beam reflected from a grounded slab with negative permittivity and permeability.
Applied Physics Letters, 80:2084–2086, 2002.
[7] P. R. Berman. Goos-Hanchen shift in negatively refractive media. Phys. Rev. E,
66:067603 – 067605, 2002.
[8] R. W. Ziolkowski. Pulsed and CW Gaussian beam interactions with double negative
metamaterial slabs. Optics Express, 11:662–681, 2003.
147

148 Bibliography
[9] J. D. Jackson. Classical Electrodynamics. John Wiley, 1988.
[10] J. B. Pendry, A. J. Holden, D. J. Robbins, and W. J. Stewart. Magnetism from
conductors and enhanced nonlinear phenomena. IEEE Transactions on Microwave
Theory and Techniques, 47:2075–2084, 1999.
[11] J. B. Pendry. Negative Refraction makes a Perfect Lens. Physical Review Letters,
85:3966–3969, 2000.
[12] D. R. Smith, Willie J. Padilla, D. C. Vier, S. C. Nemat-Nasser, and S. Schultz.
Composite Medium with Simultaneously Negative Permeability and Permittivity.
Phys. Rev. Lett., 84:4184–4187, 2000.
[13] A. L. Pokrovsky and A. L. Efros. Electrodynamics of Metallic Photonic Crystals
and the Problem of Left-Handed Materials. Phys. Rev. Lett., 89:093901, 2002.
[14] R. Marques and D. R. Smith. Comment on “Electrodynamics of Metallic Photonic
Crystals and the Problem of Left-Handed Materials”. Phys. Rev. Lett., 92:059401,
2004.
[15] S. A. Ramakrishna. Physics of negative refractive index materials. Reports on
Progress in Physics, 68:449–521, 2005.
[16] S. A. Ramakrishna and T. M. Grzegorczyk. Physics and Applications of Negative
Refractive Index Materials. CRC Press, Boca Raton, U. S. A. , 2009.
[17] Nader Engheta and Richard W. Ziolkowski. Metamaterials: Physics and Engi-
neering Explorations. Wiley-IEEE Press, New York, U.S.A., 2006.
[18] G. V. Eleftheriades and K. G. Balmain. Negative-Refraction Metamaterials: Fun-
damental Principles and Applications. Wiley-IEEE Press, 2006.
[19] J. D. Joannopoulos, S. G. Johnson, J. N. Winn, and R. D. Meade. Photonic
Crystals: Molding the Flow of Light. Princeton University Press, Cambridge,
U.S.A. 185 p., 1995.

Bibliography 149
[20] K. Sakoda. Optical Properties of Photonic Crystals. Springer, Berlin, First Edi-
tion, 2001.
[21] F. D. M. Haldane. Electromagnetic Surface Modes at Interfaces with Negative
Refractive Index make a “Not-Quite-Perfect” Lens. arXiv:cond-mat/0206420v3.
[22] J. B. Pendry and S. A. Ramakrishna. Focussing Light using Negative Refraction.
J. Phys. Cond. Matter, 15:6345–6364, 2003.
[23] A. J. Ward and J. B. Pendry. Refraction and geometry in Maxwell’s equations.
Journal of Modern Optics, 43:773–793, 1996.
[24] J. B. Pendry and S. A. Ramakrishna. Near field lenses in two dimensions . J.
Phys. Cond. Matter, 14:8463–8479, 2002.
[25] S. Anantha Ramakrishna and J. B. Pendry. Spherical perfect lens: Solutions of
Maxwell’s equations for spherical geometry. Phys. Rev. B, 69:115115–115121, 2004.
[26] M. Notomi. Negative refraction in photonic crystals. Optical and Quantum Elec-
tronics, 34:133–143, 2002.
[27] J. C. Maxwell Garnett. Colours in metal glasses and in metallic films. Phil. Trans.
R. Soc. London, 203:385–420, 1904.
[28] R. Ruppin. Evaluation of extended Maxwell-Garnett theories. Optics Communi-
cations, 182:273–279, 2000.
[29] William T. Doyle. Optical properties of a suspension of metal spheres. Phys. Rev.
B, 39:9852–9858, 1989.
[30] Craig F. Bohren. Do extended effective-medium formulas scale properly? Journal
of Nanophotonics, 3:039501–039503, 2009.
[31] W. Lamb, D. M. Wood, and N. W. Ashcroft. Long-wavelength electromagnetic
propagation in heterogeneous media. Phys. Rev. B, 21:2248–2266, 1980.

150 Bibliography
[32] C. G. Granqvist and O. Hunderi. Optical properties of Ag-SiO2 Cermet films: A
comparison of effective-medium theories. Phys. Rev. B, 18:2897–2906, 1978.
[33] David R. Smith and John B. Pendry. Homogenization of Metamaterials by Field
Averaging (Invited Paper). J. Opt. Soc. Am. B, 23:391–403, 2006.
[34] D. R. Smith, S. Schultz, P. Markos, and C. M. Soukoulis. Determination of Effec-
tive Permittivity and Permeability of Metamaterials from Reflection and Trans-
mission Coefficients. Phys. Rev. B, 65:195104–195108, 2002.
[35] T. Koschny, P. Markos, D. R. Smith, and C. M. Soukoulis. Resonant and Antires-
onant Frequency Dependence of the Effective Parameters of Metamaterials. Phys.
Rev. E, 68:065602–065605, 2003.
[36] Xudong Chen, Tomasz M. Grzegorczyk, Bae-Ian Wu, Joe Pacheco, and Jin Au
Kong. Robust method to retrieve the constitutive effective parameters of metama-
terials. Phys. Rev. E, 70:016608–016614, 2004.
[37] P. A. Belov, R. Marques, S. I. Maslovski, I. S. Nefedov, M. Silveirinha, C. R.
Simovski, and S. A. Tretyakov. Strong spatial dispersion in wire media in the very
large wavelength limit. Physical Review B, 67:113103–113106, 2003.
[38] J. B. Pendry, A. J. Holden, W. J. Stewart, and I. Youngs. Extremely Low Frequency
Plasmons in Metallic Mesostructures. Phys. Rev. Lett., 76:4773–4776, 1996.
[39] J. B. Pendry, A. J. Holden, D. J. Robbins, and W. J. Stewart. Low frequency
plasmons in thin-wire structures. Journal of Physics-Condensed Matter, 10:4785–
4809, 1998.
[40] D. Schurig, J. J. Mock, and D. R. Smith. Electric-field-coupled resonators for
negative permittivity metamaterials. Applied Physics Letters, 88 - 90:041109, 2006.
[41] Sangeeta Chakrabarti and S. Anantha Ramakrishna. Design of metallic meta-
material structures at high frequencies. Journal of Nonlinear Optical Physics &
Materials, 17:143–158, 2008.

Bibliography 151
[42] L. D. Landau and E. M. Lifshitz. Electrodynamics of Continuous Media. Pergamon
Press, 460 p., 1960.
[43] P Gay-Balmaz and O. J. F. Martin. Efficient Isotropic Magnetic Resonators.
Applied Physics Letters, 81:939–941, 2002.
[44] S. O’Brien and J. B. Pendry. Magnetic activity at infrared frequencies in structured
metallic photonic crystals. Journal of Physics-Condensed Matter, 14:6383–6394,
2002.
[45] S. O’Brien and J. B. Pendry. Photonic band-gap effects and magnetic activity in
dielectric composites. Journal of Physics-Condensed Matter, 14:4035–4044, 2002.
[46] V. Yannopapas and A. Moroz. Negative refractive index metamaterials from in-
herently non-magnetic materials for deep infrared to terahertz frequency ranges.
Journal of Physics-Condensed Matter, 17:3717–3734, 2005.
[47] R. H. Ritchie. Plasma Losses by Fast Electrons in Thin Films. Phys. Rev., 106:874–
881, 1957.
[48] E. A. Stern and R. A. Ferrell. Surface Plasma Oscillations of a Degenerate Electron
Gas. Phys. Rev., 120:130–136, 1960.
[49] H. Raether. Surface-Plasmons on Smooth and Rough Surfaces and on Gratings.
Springer Tracts in Modern Physics, 111:1–133, 1988.
[50] R. Ruppin. Surface polaritons of a left-handed medium. Physics Letters A, 277:61–
64, 2000.
[51] S. A. Darmanyan, M. Neviere, and A. A. Zakhidov. Surface modes at the inter-
face of conventional and left-handed media. Optics Communications, 225:233–240,
2003.
[52] L. Novotny and B. Hecht. Principles of Nano-Optics. Cambridge University Press,
2006.

152 Bibliography
[53] C. F. Bohren and D. R. Huffman. Absorption and Scattering of Light by Small
Particles. John Wiley, New York, 1983.
[54] W. S. Warren, H. Rabitz, and M. Dahleh. Coherent control of quantum dynamics
- the dream is alive. Science, 259:1581–1589, 1993.
[55] G. S. Agarwal and W. Harshawardhan. Inhibition and Enhancement of Two Pho-
ton Absorption. Physical Review Letters, 77:1039–1042, 1996.
[56] M. Shapiro and P. Brumer. Coherent and incoherent laser control of photochemical
reactions . Int. Rev. Phys. Chem, 13:187–229, 1994.
[57] M. Shapiro, J. W. Hepburn, and P. Brumer. Simplified laser control of unimolec-
ular reactions: Simultaneous (ω1, ω3) excitation. Chem. Phys. Lett., 149:451–454,
1988.
[58] Claude Rulliere (Ed.). Femtosecond Laser Pulses: Principles and Experiments .
Springer, Second Edition, 2005.
[59] S. E. Harris, J. E. Field, and A. Imamoglu. Nonlinear optical processes using
electromagnetically induced transparency. Phys. Rev. Lett., 64:1107–1110, 1990.
[60] K. J. Boller, A. Imamolu, and S. E. Harris. Observation of electromagnetically
induced transparency. Phys. Rev. Lett., 66:2593–2596, 1991.
[61] L. J. Wang, A. Kuzmich, and A. Dogariu. Gain-assisted superluminal light prop-
agation. Nature, 406:277–279, 2000.
[62] L. V. Hau, S. E. Harris, Z. Dutton, and C. H. Behroozi. Light speed reduction to
17 metres per second in an ultracold atomic gas. Nature, 397:594–598, 1999.
[63] C. Liu, Z. Dutton, C. H. Behroozi, and L. V. Hau. Observation of coherent
optical information storage in an atomic medium using halted light pulses. Nature,
409:490–493, 2001.
[64] D. F. Phillips, A. Fleischhauer, A. Mair, R. L. Walsworth, and M. D. Lukin.
Storage of light in atomic vapor. Phys. Rev. Lett., 86:783–786, 2001.

Bibliography 153
[65] Marlan O. Scully. Enhancement of the index of refraction via quantum coherence.
Phys. Rev. Lett., 67:1855–1858, 1991.
[66] A. S. Zibrov, M. D. Lukin, L. Hollberg, D. E. Nikonov, M. O. Scully, H. G.
Robinson, and V. L. Velichansky. Experimental demonstration of enhanced index
of refraction via quantum coherence in Rb. Phys. Rev. Lett., 76:3935–3938, 1996.
[67] G. Alzetta, A. Gozzini, L. Moi, and G Orriols. Experimental-Method for Observa-
tion of RF Transitions and Laser Beat Resonances in Oriented Na Vapour. Nuovo
Cimento Della Societa Italiana Di Fisica B-General Physics Relativity Astronomy
and Mathematical Physics and Methods, 36:5–20, 1976.
[68] Michael Fleischhauer, Atac Imamoglu, and Jonathan P. Marangos. Electromagnet-
ically induced transparency: Optics in coherent media. Rev. Mod. Phys., 77:633–
673, 2005.
[69] M. O. Scully and M. S. Zubairy. Quantum Optics. Cambridge University Press,
1997.
[70] R. A. Akhmedzhanov, A. A. Bondartsev, L. A. Gushchin, N. A. Zharova, and
A. G. Petrosyan. Electromagnetically induced transparency on Zeeman sublevels
in Nd3+:LaF3 crystals. JETP Letters, 85:389–392, 2007.
[71] Rinat Akhmedzhanov, Lev Gushin, Elena Kuznetsova, Alexander Litvak, Victor
Yasenkov, and Nina Zharova. Experimental observation of electromagnetically
induced transparency in Pr3+ : LaF3. Journal of Modern Optics, 53:2449–2458,
2006. 36th Winter Colloquium on Physics of Quantum Electronics, Snowbird, UT,
JAN 02-06, 2006.
[72] W. J. Jones and B. P. Stoicheff. Inverse Raman Spectra: Induced Absorption at
Optical Frequencies. Phys. Rev. Lett., 13:657–659, 1964.
[73] A. D. Buckingham. Theory of the Stimulated Raman and Related Effects. The
Journal of Chemical Physics, 43:25–31, 1965.

154 Bibliography
[74] S. O’Brien, D. McPeake, S. A. Ramakrishna, and J. B. Pendry. Near-infrared pho-
tonic band gaps and nonlinear effects in negative magnetic metamaterials. Physical
Review B, 69:241101–241104, 2004.
[75] J. B. Pendry and A. MacKinnon. Calculation of photon dispersion relations. Phys.
Rev. Lett., 69:2772–2775, 1992.
[76] J. B. Pendry. Photonic Band Structures. Journal of Modern Optics, 41:209–229,
1994.
[77] P. B. Johnson and R. W. Christy. Optical Constants of the Noble Metals. Phys.
Rev. B, 6:4370–4379, 1972.
[78] G. Dolling, C. Enkrich, M. Wegener, J. F. Zhou, C. M. Soukoulis, and S. Linden.
Cut-wire pairs and plate pairs as magnetic atoms for optical metamaterials. Optics
Letters, 30:3198–3200, 2005.
[79] G. Dolling, C. Enkrich, M. Wegener, C. M. Soukoulis, and S. Linden. Simultaneous
negative phase and group velocity of light in a metamaterial. Science, 312:892–894,
2006.
[80] V. A. Podolskiy, A. K. Sarychev, E. E. Narimanov, and V. M. Shalaev. Resonant
light interaction with plasmonic nanowire systems. Journal of Optics A-Pure and
Applied Optics, 7:S32–S37, 2005.
[81] S. Anantha Ramakrishna, Sangeeta Chakrabarti, and Olivier J. F. Mar-
tin. Metamaterials with negative refractive index at optical frequencies.
arXiv.org:physics/0703003, 2007.
[82] S. A. Ramakrishna and J. B. Pendry. The asymmetric lossy near-perfect lens.
Journal of Modern Optics, 49:1747–1762, 2002.
[83] Chiyan Luo, Steven G. Johnson, J. D. Joannopoulos, and J. B. Pendry. All-angle
negative refraction without negative effective index. Phys. Rev. B, 65:201104–
201107, 2002.

Bibliography 155
[84] S. E. Harris. Electromagnetically induced transparency. Physics Today, 50:36–42,
1997.
[85] G. G. Padmabandu, G. R. Welch, I. N. Shubin, E. S. Fry, D. E. Nikonov, M. D.
Lukin, and M. O. Scully. Laser oscillation without population inversion in a sodium
atomic beam. Physical Review Letters, 76:2053–2056, 1996.
[86] M. O. Scully, S. Y. Zhu, and A. Gavrielides. Degenerate quantum-beat laser: Lasing
without inversion and inversion without lasing. Phys. Rev. Lett., 62:2813–2816,
1989.
[87] J. B. Pendry, D. Schurig, and D. R. Smith. Controlling electromagnetic fields.
Science, 312:1780–1782, 2006.
[88] D. Schurig, J. J. Mock, B. J. Justice, S. A. Cummer, J. B. Pendry, A. F. Starr,
and D. R. Smith. Metamaterial electromagnetic cloak at microwave frequencies.
Science, 314:977–980, 2006.
[89] Vladimir M. Shalaev. Optical negative-index metamaterials. Nature Photonics,
1:41–48, 2007.
[90] Zhongyan Sheng and Vasundara V. Varadan. Tuning the effective properties of
metamaterials by changing the substrate properties. Journal of Applied Physics,
101:014909 – 014915, 2007.
[91] V. J. Logeeswaran, A. N. Stameroff, M. Saif Islam, W. Wu, A. M. Bratkovsky,
P. J. Kuekes, S. Y. Wang, and R. S. Williams. Switching between positive and neg-
ative permeability by photoconductive coupling for modulation of electromagnetic
radiation. Applied Physics A-Materials Science & Processing, 87:209–216, 2007.
[92] Hou-Tong Chen, John F. O’Hara, Abul K. Azad, Antoinette J. Taylor, Richard D.
Averitt, David B. Shrekenhamer, and Willie J. Padilla. Experimental demon-
stration of frequency-agile terahertz metamaterials. Nature Photonics, 2:295–298,
2008.
156 Bibliography
[93] W. J. Padilla, A. J. Taylor, C. Highstrete, Mark Lee, and R. D. Averitt. Dynamical
Electric and Magnetic Metamaterial Response at Terahertz Frequencies. Phys.
Rev. Lett., 96:107401–107404, 2006.
[94] Douglas H. Werner, Do-Hoon Kwon, Iam-Choon Khoo, Alexander V. Kildishev,
and Vladimir M. Shalaev. Liquid crystal clad near-infrared metamaterials with
tunable negative-zero-positive refractive indices. Opt. Express, 15:3342–3347, 2007.
[95] Jiaguang Han, Akhlesh Lakhtakia, and Cheng-Wei Qiu. Terahertz metamateri-
als with semiconductor split-ring resonators for magnetostatic tunability. Opt.
Express, 16:14390–14396, 2008.
[96] T. Driscoll, G. O. Andreev, D. N. Basov, S. Palit, S. Y. Cho, N. M. Jokerst, and
D. R. Smith. Tuned permeability in terahertz split-ring resonators for devices and
sensors. Applied Physics Letters, 91:062511–062513, 2007.
[97] Thomas A. Klar, Alexander V. Kildishev, Vladimir P. Drachev, and Vladimir M.
Shalaev. Negative-index metamaterials: Going optical. IEEE Journal of Selected
Topics in Quantum Electronics, 12:1106–1115, 2006.
[98] Nikolai G. Kalugin and Yuri V. Rostovtsev. Efficient generation of short terahertz
pulses via stimulated Raman adiabatic passage. Optics Letters, 31:969–971, 2006.
[99] S. H. Autler and C. H. Townes. Stark Effect in Rapidly Varying Fields. Phys.
Rev., 100:703–722, 1955.
[100] Mark I. Stockman. Criterion for Negative Refraction with Low Optical Losses
from a Fundamental Principle of Causality. Phys. Rev. Lett., 98:177404–177407,
2007.
[101] J. B. Pendry and P. M. Bell. Transfer Matrix Techniques for Electromagnetic
Waves. NATO ASI Series E: Applied Sciences, 315:203, 1996.
[102] Sangeeta Chakrabarti, S. Anantha Ramakrishna, and Harshawardhan Wanare.
Coherently controlling metamaterials. Optics Express, 16:19504–19511, 2008.

Bibliography 157
[103] F. S. Pavone, G. Bianchini, F. S. Cataliotti, T. W. Hansch, and M. Inguscio.
Birefringence in electromagnetically induced transparency. Opt. Lett., 22:736–738,
1997.
[104] W. Vassen. Laser cooling and trapping of metastable helium: towards Bose-
Einstein condensation. Comptes Rendus de l Academie Des Sciences Serie IV
Physique Astrophysique, 2:613–618, 2001.
[105] Hou-Tong Chen, John F. O’Hara, Antoinette J. Taylor, Richard D. Averitt,
C. Highstrete, Mark Lee, and Willie J. Padilla. Complementary planar terahertz
metamaterials. Optics Express, 15:1084–1095, 2007.
[106] W. J. Padilla, M. T. Aronsson, C. Highstrete, Mark Lee, A. J. Taylor, and R. D.
Averitt. Electrically resonant terahertz metamaterials: Theoretical and experi-
mental investigations. Phys. Rev. B, 75:041102, 2007.
[107] Hou-Tong Chen, Willie J. Padilla, Joshua M. O. Zide, Seth R. Bank, Arthur C.
Gossard, Antoinette J. Taylor, and Richard D. Averitt. Ultrafast optical switch-
ing of terahertz metamaterials fabricated on ErAs/GaAs nanoisland superlattices.
Opt. Lett., 32:1620–1622, 2007.
[108] Hou-Tong Chen, Willie J. Padilla, Joshua M. O. Zide, Arthur C. Gossard, An-
toinette J. Taylor, and Richard D. Averitt. Active terahertz metamaterial devices.
Nature, 444:597–600, 2006.
[109] Michael S. Rill, Christine Plet, Michael Thiel, Isabelle Staude, Georg Von Frey-
mann, Stefan Linden, and Martin Wegener. Photonic metamaterials by direct
laser writing and silver chemical vapour deposition. Nature Materials, 7:543–546,
2008.
[110] V. M. Shalaev. Optical negative index materials. Nature Photonics, 1:41–48, 2006.
[111] Yaroslav A. Urzhumov, Gennady Shvets, Jonathan Fan, Federico Capasso, Daniel
Brandl, and Peter Nordlander. Plasmonic nanoclusters: a path towards negative-
index metafluids. Optics Express, 15:14129–14145, 2007.
158 Bibliography
[112] Carsten Rockstuhl, Falk Lederer, Christoph Etrich, Thomas Pertsch, and Toralf
Scharf. Design of an Artificial Three-Dimensional Composite Metamaterial with
Magnetic Resonances in the Visible Range of the Electromagnetic Spectrum. Phys.
Rev. Lett., 99:017401–017404, 2007.
[113] D. A. Genov, A. K. Sarychev, V. M. Shalaev, and A. Wei. Resonant field enhance-
ments from metal nanoparticle arrays. Nano Letters, 4:153–158, 2004.
[114] Qi Wu and Wounjhang Park. Negative index materials based on metal nanoclus-
ters. Applied Physics Letters, 92:153114–153116, 2008.
[115] Roberto Merlin. Metamaterials and the Landau-Lifshitz permeability argument:
Large permittivity begets high-frequency magnetism. Proceedings of the National
Academy of Sciences of the United States of America, 106:1693–1698, 2009.
[116] V. A. Podolskiy, A. K. Sarychev, and V. M. Shalaev. Plasmon modes in metal
nanowires and left-handed materials. Journal of Nonlinear Optical Physics &
Materials, 11:65–74, 2002.
[117] V. M. Shalaev, W. S. Cai, U. K. Chettiar, H. K. Yuan, A. K. Sarychev, V. P.
Drachev, and A. V. Kildishev. Negative index of refraction in optical metamate-
rials. Optics Letters, 30:3356–3358, 2005.
[118] Shuang Zhang, Wenjun Fan, N. C. Panoiu, K. J. Malloy, R. M. Osgood, and
S. R. J. Brueck. Experimental Demonstration of Near-Infrared Negative-Index
Metamaterials. Phys. Rev. Lett., 95:137404–137407, 2005.
[119] Wenshan Cai, Uday K. Chettiar, Hsiao-Kuan Yuan, Vashista C. de Silva, Alexan-
der V. Kildishev, Vladimir P. Drachev, and Vladimir M. Shalaev. Metamagnetics
with rainbow colors. Optics Express, 15:3333–3341, MAR 19 2007.
[120] A. Alu, A. Salandrino, and N. Engheta. Negative effective permeability and left-
handed materials at optical frequencies. Optics Express, 14:1557–1567, 2006.

Bibliography 159
[121] Andrea Alu and Nader Engheta. Dynamical theory of artificial optical magnetism
produced by rings of plasmonic nanoparticles. Phys. Rev. B, 78:085112–085121,
2008.
[122] S. Tretyakov. Analytical Modelling in Applied Electromagnetics. Artech House,
2003.
[123] E. Shamonina, V. A. Kalinin, K. H. Ringhofer, and L. Solymar. Magnetoinductive
waves in one, two, and three dimensions. Journal of Applied Physics, 92:6252–
6261, 2002.
[124] E. Shamonina, V. A. Kalinin, K. H. Ringhofer, and L. Solymar. Magneto-inductive
waveguide. Electron. Lett., 38:371–373, 2002.
[125] D. R. Solli, P. Koonath, and B. Jalali. Inverse Raman scattering in silicon: A
free-carrier enhanced effect. Phys. Rev. A, 79:053853–053856, 2009.
[126] A. Yariv. Quantum Electronics. John Wiley and Sons Inc., 1989.
[127] G. Sauer, G. Brehm, S. Schneider, K. Nielsch, R. B. Wehrspohn, J. Choi,
H. Hofmeister, and U. Gosele. Highly ordered monocrystalline silver nanowire
arrays. Journal of Applied Physics, 91:3243–3247, 2002.
[128] Q. Zhou, Z. Li, Y. Yang, and Z. Zhang. Arrays of aligned, single crystalline silver
nanorods for trace amount detection. J. Phys. D:Appl. Phys., 41:152007, 2008.
[129] Justin Elser, Robyn Wangberg, Viktor A. Podolskiy, and Evgenii E. Narimanov.
Nanowire metamaterials with extreme optical anisotropy. Applied Physics Letters,
89:261102 – 261104, 2006.
[130] A. I. Rahachou and I. V. Zozoulenko. Light propagation in nanorod arrays. J.
Opt. A: Pure Appl. Phys., 9:265–270, 2007.
[131] A. Bratkovsky, E. Ponizovskaya, S. Y. Wang, P. Holmstrom, L. Thylen, Y. Fu,
and H. Agren. A metal-wire /quantum-dot composite metamaterial with negative
ǫ and compensated optical loss. Appl. Phys. Lett., 93:193106–193108, 2008.
160 Bibliography
[132] T. G. Mackay and A. Lakhtakia. On the application of homogenization formalisms
to active dielectric composite metamaterials. Opt. Commun., 282:2470–2475, 2009.
[133] G. S. Agarwal and Robert W. Boyd. Elimination of the band gap of a reso-
nant optical material by electromagnetically induced transparency. Phys. Rev. A,
60:R2681–R2684, 1999.
[134] S. E. Harris. Electromagnetically induced transparency in an ideal plasma. Phys.
Rev. Lett., 77:5357–5360, 1996.
[135] G. Blendstrup, D. Bershader, and P. W. Langhoff. Resonance refractivity studies
of sodium vapor for enhanced flow visualization. AIAA Journal, 16:1106–1108,
1978.
[136] A. S. Zibrov, M. D. Lukin, L. Hollberg, D. E. Nikonov, M. O. Scully, H. G.
Robinson, and V. L. Velichansky. Experimental Demonstration of Enhanced Index
of Refraction via Quantum Coherence in Rb. Phys. Rev. Lett., 76:3935–3938, 1996.
[137] P. M. Bell, J. B. Pendry, L. M. Moreno, and A. J. Ward. A Program for Calculating
Photonic Band Structures and Transmission Coefficients of Complex Structures.
Computer Physics Communications, 85:306–322, 1995.
[138] S. Guenneau, B. Gralak, and J. B. Pendry. Perfect corner reflector. Optics Letters,
30:1204–1206, 2005.
[139] S. P. Apell, P. M. Echenique, and R. H. Ritchie. Sum rules for surface plasmon
frequencies. Ultramicroscopy, 65:53–60, 1996.
[140] D. R. Smith, D. Schurig, M. Rosenbluth, S. Schultz, S. A. Ramakrishna, and J. B.
Pendry. Limitations on subdiffraction imaging with a negative refractive index
slab. Applied Physics Letters, 82:1506–1508, 2003.
[141] R. Merlin. Analytical solution of the almost-perfect-lens problem. Applied Physics
Letters, 84:1290–1292, 2004.
Bibliography 161
[142] Richard W. Ziolkowski and Ehud Heyman. Wave propagation in media having
negative permittivity and permeability. Phys. Rev. E, 64:056625–056639, 2001.
[143] S. A. Cummer. Simulated causal subwavelength focusing by a negative refractive
index slab. Applied Physics Letters, 82:1503–1505, 2003.
[144] Sebastien Guenneau and S. Anantha Ramakrishna. Negative refractive index,
perfect lenses and checkerboards: Trapping and imaging effects in folded optical
spaces. Comptes Rendus Physique, 10:352–378, 2009.
[145] Jianbing J. Chen, T. M. Grzegorczyk, B. I. Wu, and J. A. Kong. Limitation of
FDTD in simulation of a perfect lens imaging system. Optics Express, 13:10840–
10845, 2005.
[146] S. Guenneau, A. C. Vutha, and S. A. Ramakrishna. Negative refraction in 2D
checkerboards related by mirror antisymmetry and 3D corner lenses. New Journal
of Physics, 7:164–172, 2005.
[147] S. Anantha Ramakrishna, S. Guenneau, S. Enoch, G. Tayeb, and B. Gralak. Con-
fining light with negative refraction in checkerboard metamaterials and photonic
crystals. Phys. Rev. A, 75:063830–063835, 2007.
[148] A. A. Sukhorukov, I. V. Shadrivov, and Y. S. Kivshar. Wave scattering by meta-
material wedges and interfaces. International Journal of Numerical Modelling-
Electronic Networks Devices and Fields, 19:105–117, 2006.
[149] X. S. Rao and C. K. Ong. Subwavelength imaging by a left-handed material su-
perlens. Phys. Rev. E, 68:067601–067603, 2003.
[150] Sangeeta Chakrabarti, N. Shukla, S. Anantha Ramakrishna, S. Dhamodharan,
V. N. Kulkarni, S. Guenneau, Fanny Guenneau, and Stefan Enoch. Visible trans-
mission of light through gold nano-checkerboards: Theory and experiments. Cur-
rent Science (in preparation), 2010.

162 Bibliography
[151] A. Bossavit. Solving Maxwell Equations in a Closed Cavity, and the Question of
Spurious Modes. IEEE Transactions on Magnetics, 26:702–705, 1990.
[152] J. P. Berenger. A Perfectly Matched Layer for the Absorption of Electromagnetic
Waves. Journal of Computational Physics, 114:185–200, 1994.