coordinated pre-preemption of traffic signals to enhance ... · coordinated pre-preemption of...
TRANSCRIPT

Coordinated Pre-Preemption of Traffic Signals
to Enhance Railroad Grade Crossing Safety in Urban Areas and Estimation of Train Impacts
to Arterial Travel Time Delay
Final Report (Revised)
January 2014
PROJECT NO.
BDK85 977-44
PREPARED FOR
Florida Department of Transportation

Coordinated Pre-Preemption of Traffic Signals to Enhance Railroad Grade Crossing Safety
in Urban Areas and Estimation of Train Impacts to Arterial Travel Time Delay
BDK85 977-44
Final Report (Revised)
Prepared for:
Florida Department of Transportation
Melissa Ackert, P.E., Project Manager
Prepared by:
USF Center for Urban Transportation Research
Pei-Sung Lin, Ph.D., P.E., PTOE, FITE, Program Director Zhenyu Wang, Ph.D., Research Associate
Rui Guo, Graduate Research Assistant Qing Wang, Graduate Research Assistant
Texas A&M Transportation Institute Srinivasa Sunkari, P.E. Research Engineer
Praprut Songchitruksa, Ph.D., P.E., Associate Research Engineer
FIU Lehman Center for Transportation Research Xunawu Chen, Graduate Assistant
Yan Xiao, Ph.D., P.E., Research Associate Mohammed Hadi, Ph.D., P.E., Associate Professor
January 2014

ii
DISCLAIMER
The contents of this report reflect the views of the authors, who are responsible for the facts
and the accuracy of the information presented herein. This document is disseminated under
the sponsorship of the Department of Transportation University Transportation Centers
Program and the Florida Department of Transportation, in the interest of information
exchange. The U.S. Government and the Florida Department of Transportation assume no
liability for the contents or use thereof.
The opinions, findings, and conclusions expressed in this publication are those of the
authors and not necessarily those of the State of Florida Department of Transportation.

iii
METRIC CONVERSION
SYMBOL WHEN YOU KNOW MULTIPLY BY TO FIND SYMBOL
LENGTH
in inches 25.4 millimeters mm
ft feet 0.305 meters m
yd yards 0.914 meters m
mi miles 1.61 kilometers km
VOLUME
fl oz fluid ounces 29.57 milliliters mL
gal gallons 3.785 liters L
ft3 cubic feet 0.028 cubic meters m3
yd3 cubic yards 0.765 cubic meters m3
NOTE: volumes greater than 1000 L shall be shown in m3
MASS
oz ounces 28.35 grams g
lb pounds 0.454 kilograms kg
T short tons (2000 lb) 0.907 megagrams
(or "metric ton") Mg (or "t")
TEMPERATURE (exact degrees)
oF Fahrenheit 5 (F-32)/9
or (F-32)/1.8 Celsius oC

iv
TECHNICAL REPORT DOCUMENTATION
1. Report No. 2. Government Accession No. 3. Recipient's Catalog No.
4. Title and Subtitle
Coordinated Pre-Preemption of Traffic Signals to Enhance Railroad Grade
Crossing Safety in Urban Areas and
Estimation of Train Impacts to Arterial Travel Time Delay
5. Report Date
January 2014
6. Performing Organization Code
7. Author(s)
Pei-Sung Lin, Zhenyu Wang, Rui Guo, Qing Wang (CUTR) Srinivasa Sunkari, Praprut Songchitruksa (TTI)
Xuanwu Chen, Yan Xiao, Mohammed Hadi (LCTR)
8. Performing Organization Report No.
9. Performing Organization Name and Address
Center for Urban Transportation Research
University of South Florida
4202 East Fowler Avenue, CUT100
Tampa, FL 33620-5375
10. Work Unit No. (TRAIS)
11. Contract or Grant No.
FDOT BDK85 977-44
12. Sponsoring Agency Name and Address
Florida Department of Transportation
605 Suwannee Street, MS 30
Tallahassee, FL 32399-0450
13. Type of Report and Period Covered
Final Report (Revised)
June 2012 – November 2013
14. Sponsoring Agency Code
15. Supplementary Notes
16. Abstract
This research project investigated the potential for using advanced features of traffic signal system software platforms
(ATMS.now), prevalent in Florida, to alleviate safety and mobility problems at highway-railroad at-grade crossings and
adjacent arterials. Pre-preemption phasing was developed in this study to provide “extra” green time to the movements
blocked by a train before the train’s arrival at the crossing in order to (1) mitigate congestion on the arterials near
railways and (2) reduce the conflicts of train-vehicle and/or vehicle-vehicle adjacent to at-grade crossings. This study
explored the technologies for implementing key functions of a pre-preemption system, including train detection, train
arrival prediction, and pre-preemption control algorithms, and the capabilities of ATMS.now system. VISSIM-based
simulation models were developed in this study based on three control sections along two railway corridors (FEC and
CSX) in Broward County, Florida, to test the proposed pre-preemption strategies. A series of comparisons before-after
implementing pre-preemption strategies was conducted to validate the effectiveness of pre-preemption strategies. The
major findings and recommendations for implementation from this study are provided below.
Upstream preemption signals (activation or release) are suggested for triggering pre-preemptions at downstream
intersections along the railroad corridor. The Estimated Time of Arrival (ETA) is predicted based on the logs of two
or more preemptions at upstream crossings with ideal space less than 0.5 miles.
The coordinated pre-preemption strategy developed in this study aims to clear the through traffic at several
intersections along an arterial as much as possible before train’s arrival. All pre-preemption phases are pre-timed;
coordinated pre-preemption is easy to be implemented on existing traffic controllers.
Based on the simulation results, the coordinated pre-preemption strategy can effectively reduce average delay,
average stops, and average queue length of the arterials near a railroad crossing. The performance pattern is
sensitive to site features and strategy configurations. Considering its applicability and corridor-level effectiveness,
coordinated pre-preemption is suggested when through traffic volume is higher than 500 vehicles per hour per lane
(vphpl) and train block duration is longer than 100 seconds.
A generic pre-preemption plan was developed in this study to provide guidance on implementation of the pre-
preemption strategy using the ATMS.now system in Florida.
17. Key Words
Pre-preemption, preemption, traffic signal, highway-railroad at-
grade crossing, traffic simulation, VISSIM
18. Distribution Statement
19. Security Classification
(of this report)
Unclassified
20. Security Classification
(of this page)
Unclassified
21. No. of Pages
157
22. Price

v
GLOSSARY OF TERMS AND ACRONYMS
Advance Preemption
Traffic signal controllers receive notification of an approaching train earlier than railroad
active warning devices.
At-grade Railroad Crossing
An intersection where a roadway crosses railroad tracks at the same level or grade.
ATMS.now
A central management system that brings traffic network data into a single repository for a
real-time, integrated view of traffic operations.
AWT
Advance Warning Time.
Congestion Clearance Phase
The “extra” green-time is assigned one or more vehicle movement(s) along a roadway
corridor before train’s arrival. The purpose of congestion clearance phase is to clear
congested vehicle traffic in advance. It may be followed by a Track Clearance Phase.
Coordinated Congestion Clearance Phase
This congestion clearance phase operates coordinately in the intersections near an at-grade
crossing along a roadway corridor. Usually, the coordinated congestion clearance phases are
assigned to through movement(s) on major approaches at the direction of commuter.
Coordinated Pre-preemption
This strategy assigns “extra” green time to movements at several intersections along a
roadway corridor at a coordinated manner before train’s arrival.
Coordinated Pre-preemption Phase
See “Coordinated Congestion Clearance Phase.”
Control Section
A railroad corridor and its adjacent urban arterials containing signalized intersections in
which the coordinated pre-preemption strategy is implemented.

vi
CWT
Constant Warning Time, usually 20-25 sec.
DMS
Dynamic Message Sign.
Dwell Phase
A preemption hold interval that permits vehicle movements that do not cross the tracks;
occurs after track clearance interval until train has left detection zone.
ETA
Estimated Time of Arrival of a train.
ETD
Estimated Time of Departure of a train.
EWS
Early Warning System, a pre-timed early-preemption system.
Exit Phase
Once the train vacates the crossing, the traffic signal must transition back to its normal
mode of operation. The first phase implemented is based on the minimum delay.
FDOT
Florida Department of Transportation
FRA
Federal Railroad Administration.
Full Pre-preemption Phases
A pre-preemption phase sequence containing congestion clearance phases (coordinated
and/or non-coordinated), track clearance phases, dwell phases, and exit phases. Usually,
the full pre-preemption phases are implemented in the intersections next to an at-grade
railroad crossing.
ITPS
Improved Transitional Preemption Strategy, a dynamic traffic signal model prior to
preemption.

vii
LOS
Level of Service.
Modified ITPS
A modification of the ITPS algorithm to provide extra green times to the phases that suffer
from higher delays during normal operations, as determined based on historical data,
simulation model results, or in accordance with a priority provided by the user.
MOE
Measures of Effectiveness.
MUTCD
Manual on Uniform Traffic Control Devices.
NEMA
National Electrical Manufacturers Association.
Non-coordinated Pre-preemption Phases
This congestion clearance phase operates at a non-coordinated manner. Usually, the non-
coordinated congestion clearance phases are assigned to turning movements on major
approaches or minor movements where congestions occur.
Non-preempted Intersection
Intersection near an at-grade railroad crossing but has no a rail preemption mode. In
Florida, the distance between a non-preempted intersection and an at-grade railroad
crossing is larger than 200 feet.
Partial Pre-preemption Phases
A pre-preemption phase sequence containing congestion clearance phases only. Usually, the
partial pre-preemption phases are implemented in the intersections near, but not next to,
an at-grade railroad crossing.
Preempted Intersection
Intersection with a rail preemption mode. In Florida, the distance between a preempted
intersection and an at-grade railroad crossing is equal to or less than 200 feet.

viii
Preemption
Traffic signal preemption is operated as a special mode to give the right-of-way to trains
over vehicle traffic at highway intersections near highway-rail crossings.
Pre-preemption
A special traffic mode that uses advance (early) train warning time to clear congested
vehicle traffic before train’s arrival at a at-grade railroad crossing. Pre-preemption may
work cooperately with or independent of preemption.
SID
Seamless Image Database.
Simultaneous Preemption
A traffic signal controller and railroad active warning devices receive notification of an
approaching train simultaneously.
SQL
Structured Query Language.
TMC
Traffic Management Center.
Track Clearance Phase
A special green-time in the preemption sequences to clear vehicles that may be queued
over the track.
TSM&O
Transportation Systems Management and Operations
v/c Ratios
Volume ÷ Capacity.
VAP
Vehicle Actuated Programming, a traffic signal programming module integrated in VISSIM.
VISSIM
A microscopic multimodal traffic flow simulation software package developed by PTV
Planung Transport Verkehr AG in Karlsruhe, Germany.

ix
VisVAP
An easy-to-use tool for defining the program logic of VAP signal controllers as a flow chart.

x
ACKNOWLEDGMENTS
The CUTR research team is grateful for the guidance, coordination, and advice provided by
Mr. Mark Plass, District Traffic Operations Engineer; Ms. Melissa Ackert, Transportation
Systems Management and Operations (TSM&O) Project Manager; and her staff in the Traffic
Operations Office of District 4, Florida Department of Transportation. The authors also thank
Mr. Charlie Zhu, Mr. Hector Hartmann, Mr. Dan Saile, Dr. Hongyun Chen, Mr. Edward
Bryant, Ms. Annette Lapkowski, and Mr. Vince Picardi for their contributions in technical
support. The research team gratefully acknowledges the contribution of the Texas
Transportation Institute team led by Mr. Srinivasa Sunkari and Dr. Praprut Songchitruksa in
reviewing the ATMS.now manual and preparing the generic pre-preemption plan. Sincere
thanks go to the team at Florida International University led by Dr. Mohammed Hadi and his
researchers Dr. Yan Xiao and Mr. Xuanwu Chen for their invaluable work in data collection
and simulation development. We are also very grateful to all other administrators, faculty,
staff, and students at the Center for Urban Transportation Research (CUTR) at the
University of South Florida who supported our efforts in this project.

xi
EXECUTIVE SUMMARY
INTRODUCTION
A highway-railroad at-grade crossing is an intersection at which a roadway intersects a
railroad on the same grade. It causes a right-of-way conflict between train traffic and
vehicle traffic. The right-of-way at the crossing is always assigned to the train traffic. Once
a train enters an at-grade crossing area, vehicle traffic must stop until the train leaves the
crossing. Depending on train speed, train length, and traffic control type, this process may
take a few minutes or much longer. During this period, both through movements at
adjacent intersections and turning movements heading to the crossing are blocked. When
the traffic volume is high at nearby intersections during peak periods, congestion will form
at the adjacent intersections of the highway-railroad crossing.
If vehicles cannot be cleared from the track before train’s arrival, severe collisions may
occur between a train and the vehicles trapped on the track. On the other hand, the queue
length may be longer than the storage length of the adjacent roadway intersection and
extend back a considerable distance to the next access points and/or intersections, thus
perhaps causing vehicle collisions. This problem is exacerbated if a second train passes
before the queue from the first train clears. If at-grade crossings are near a freeway
interchange, long queues may exceed ramps and intrude into freeway mainlines, thus likely
inducing serious traffic accidents. In that case, an elongated queue will not only block the
traffic at nearby intersections but also can result in the slowdown or full termination of the
mobility of the intersection or even the entire roadway network in proximity to the railroad.
Severe congestion and consequential delay may cause a failure of roadway system
operations and increase negative environmental impacts.
To improve the safety and mobility of at-grade railroad crossings, the Manual on Uniform
Traffic Control Devices (MUTCD) suggests implementation of preemption operations at
signalized intersections within a distance of 200 feet of an at-grade crossing to clear
vehicles from rail track areas before train’s arrival. The major objective of preemption is to
increase safety at these intersections by clearing vehicles from the path of trains and
prevent vehicle-train accidents in railroad track areas. The track clearance time of
preemption is often too short to provide “enough” clearance time for high vehicle volumes
before train’s arrival along an arterial intersecting rail tracks during peak periods. The
impact of preemption controls on improving arterial mobility and safety in larger urban

xii
areas during peak periods is limited. On the other hand, advance warning time for an
approaching train in modern traffic control systems provides the potential for implementing
new traffic control logics to mitigate the negative impact of train blockage on vehicle traffic.
Therefore, it is necessary to use modern traffic control systems and develop effective traffic
control strategies to alleviate the existing safety and mobility problems at at-grade railroad
crossings and adjacent arterials in urban areas, especially during peak-hour periods.
RESEARCH OBJECTIVE
The major objective of this research project was to investigate the potential and assess the
benefits of using the advance features of the traffic signal system software platform
ATMS.now, used prevalently in Florida, to alleviate safety and mobility problems at
highway-railroad at-grade crossings and adjacent arterials.
This research aimed to develop “pre-preemption” phasing in a coordinated manner at
signalized intersections along a railroad corridor. This phasing would be triggered by
detection of a train entering the control section and would provide additional green time for
clearance of vehicles away from grade crossings downstream from the approaching train.
The additional clearance can reduce the potential for vehicle-train conflicts, especially during
periods of congested arterial traffic. The concept to be considered in this research project
does not require any physical or other interfaces with railroad signaling or control systems;
it resides in and is implemented entirely through traffic signal system software.
This research intended to develop a generic plan that describes the process through which
coordinated pre-preemption is implemented via the ATMS.now platform given the “trigger”
or preemption detection at a control section “entry point.” The plan contains, but is not
limited to, criteria for implementing the pre-preemption, selection of train detection
technologies, estimation of train’s arrival time variance, method of phasing design and
optimization, and configuration in ATMS.now and NAZTEC 2070 controllers.
PRE-PREEMPTION SYSTEM
Functionally, a typical pre-preemption system has three components: detection, prediction,
and control strategy.
The detection subsystem detects an approaching train at a much longer distance upstream
from a railroad at-grade crossing than the classic train detection system. Many technologies

xiii
have been developed to detect an approaching train. Instead of installing train detectors,
activation or deactivation of existing preemptions at upstream intersections along a railway
corridor can be used as the trigger of pre-preemptions at the target intersections. This
method becomes an attractive alternative for train detection because it does not require the
installation of new devices or the application of new permissions from rail companies.
Once the detection system perceives an approaching train, the prediction subsystem starts
to predict the train’s arrival time at the target railroad at-grade crossing in order to activate
pre-preemption at a proper time. The accuracy (error) of the train’s arrival time is
determined by the following factors: (1) train detection system, (2) prediction algorithm, (3)
upstream detection location with respect to the target railroad crossing, and (4) train speed
variance. If two or more preemptions are available at upstream crossings, the Estimated
Time of Arrival (ETA) can be predicted based on the preemption logs of the upstream
crossings.
The operation of the control subsystem is activated when the ETA is equal to or less than a
critical value. Once the control subsystem is initialized, the normal phases at target
intersections will be interrupted, and one or more pre-preemption phases will be conducted,
including the following:
Before Train’s arrival (Required) – The pre-preemption system provides “extra”
green time (pre-preemption phases) to critical movements at signalized
intersections near the crossing before train’s arrival. The “extra” green time could
help clear the traffic potentially blocked during a train-passing the crossing in order
to mitigate congestion during train blockage. The special phases are assigned as
“conflicting” movements or a subset of them based on the optimization objectives of
the pre-preemption strategy.
During Train Blockage (Optional) – During the period of a train passing the crossing,
the “conflicting” movements are blocked by a train. Thus, the general strategy is to
assign green time to the movements that do not have conflicts with the train during
this period.
After Train Blockage (Optional) – After the train leaves the railroad crossing, the
general strategy is to assign green time to the movements blocked by train
movement for dissipating the queues that occurred in the train passing duration as
soon as possible.

xiv
COORDINATED PRE-PREEMPTION STRATEGY
The basic idea of the coordinated pre-preemption strategy is to assign “extra” green time to
movements at several intersections along a roadway corridor that intersects a railroad
before train’s arrival. The “extra” green time (congestion clearance phase) allows through
traffic to be cleared on the arterial before train’s arrival. To maximize the opportunity, the
“extra” green time should be coordinated at the intersections along the roadway corridor.
The pre-preemption phases work at a pre-timed mode because (1) it is a requirement of
coordination and (2) it can easily be coded into existing traffic controllers. Except for the
coordinated pre-preemption phase, the coordinated pre-preemption strategy may provide
non-coordinated pre-preemption phases for clearing other movements before train’s arrival
if there is a potential for congestion due to train blockage. The phases of track clearance,
dwell phases, and exit phases should be considered at the intersection next to the crossing
if the storage space between the intersection and the crossing is short, even if the
intersection is not preempted. An example of coordinated pre-preemption strategy is as
follows:
When pre-preemption is triggered by detecting a train approaching, the coordinated
pre-preemption phase (Phase 2-6) is activated at Intersection A after a system delay.
After a given offset (Offset A-B), the coordinated pre-preemption phase (Phase 2-6)
starts at Intersection B.
After a given offset (Offset A-C), the coordinated pre-preemption (Phase 2-6) starts
at Intersection C.
When the coordinated pre-preemption phase is completed, traffic signals at
Intersections A and C go back to normal phases. When the preemption is triggered
at Intersection B, the coordinated pre-preemption phase (Phase 2-6) is terminated,
and the track clearance phase (Phase 1-6) is activated.
When the train arrives at the crossing, the track clearance phase is terminated, and
the dwell phases start at Intersection B at a sequence of Phase 3-7 -> Phase 4-8 ->
Phase 5. Dwell phases work in an actuated manner.
When the train leaves the crossing, dwell clearance phases are terminated, and exit
phases start at Intersection B at a sequence of Phase 1-5 -> Phase 2-6.
After the exit phase, the traffic signal at Intersection B goes back to normal phase.

xv
Figure ES-1 Example of Coordinated Pre-preemption Phases
Start Phase 2-6
Receive Pre-preemption Trigger
End Phase 2-6
Start Phase 2-6
End Phase 2-6 Start Phase 1-6
Start Phase 2-6
End Phase 2-6
End Phase 1-6 Start Phase 3-7
End Phase 5Start Phase 1-5
End Phase 2-6
Coord
inated
Pre
-pre
em
ptio
nP
ha
ses
No
rma
l Ph
ase
s
System DelayNo
rma
l Ph
ase
sC
oord
inated
Pre
-pre
em
ptio
nP
ha
ses
Track
Cle
ara
nce
Ph
ase
Dw
ell P
hases (3
-7 >
4-8
> 5
)E
xit P
hase
s (1-5
> 2
-6)
Norm
al
Ph
ase
s
Co
ord
ina
ted
Pre-p
reem
ptio
nP
hases
Norm
al P
hase
sN
orm
al P
hase
s
Receive Preemption Trigger
Train Leaves the Crossing
Train Arrives at the Crossing
Offset A
-B
Offse
t A-C
Intersection AIntersection BIntersection C
Tim
e Lin
e
Western Bound (Commuter Traffic Direction)
Befo
re T
ra
in A
rriv
al
(Ad
va
nced
Wa
rn
ing T
ime)
Du
rin
g T
ra
in B
lock
ag
e
(Du
ra
tion
of T
rain
Blo
ck
ag
e)
Afte
r T
ra
in
Blo
ck
ag
e

xvi
EVALUATION METHODOLOGY
VISSIM-based traffic simulation models were used to test the safety and operational
performance of the proposed pre-preemption strategies. The simulation models were
developed based on three control sections and were selected from the road network in
Broward County, Florida. Figure ES-2 illustrates the procedure of the VISSIM-based
simulation model development. In this study, all traffic signal controllers (gate controller at
railroad crossings and traffic signal controller at intersections) were coded in Vehicle
Actuated Programming (VAP) using the VisVAP tool. Simulation scenarios considered the
factors of vehicle traffic volume, train speed (train blockage duration), and pre-preemption
strategies.
VISSIM
Basic
Inputs
Static Data
Dynamic Data
Different input
VISSIM Model DevelopmentCorridor
(multi-intersections)
Setting & scaling a background image
Drawing links & connectors
Vehicle inputs & routing decisions
Speed limits & reduced speed areas
Priority rules & traffic control data
Pre-preemption
Strategy coded in
VAP
Multi-run
Before
Measure of Effectiveness (MOEs)
Network Performance (.npe) Selected
VISSIM
Outputs Table of Travel Times (.rsz)
Queue Length Record (.stz)
Table of Delay (.vlz)
Network Performance (.npe)
Table of Travel Times (.rsz)
Queue Length Record (.stz)
Table of Delay (.vlz)
Compare
After
Train Speed & PT lines for Train
Figure ES-2 VISSIM Model-Based Development

xvii
This study evaluated the safety and operational performance of the proposed pre-
preemption strategy at the corridor level through a series of before-after comparisons.
Average delay of the roadway corridor was used to evaluate the operational performance of
the pre-preemption strategy; average stops along the corridor were used to assess the
traffic smoothness, the risk of vehicle-vehicle conflicts, and environmental impacts; and
averaged queue length was used to assess the congestion level of the corridor.
CONCLUSIONS
Based on a comprehensive study of traffic signal pre-preemptions, close examinations of the
ATMS.now software functionalities, and in-depth evaluations of various scenarios via
intensive VISSIM microscopic simulation runs on two developed pre-preemption strategies,
the following conclusions were obtained:
Upstream preemption signals (activation or release) are suggested for triggering pre-
preemptions at downstream intersections along the railroad corridor. The advantage
of this technology is to eliminate the needs of retrieving train information from train
companies or installing new train detectors. However, the technology is restricted by
the availability of preemptions along the railroad corridors.
The prediction of ETA is the key factor in implementation of pre-preemptions, which
is the function of train speed and location of upstream preemptions. It can be
estimated using ETA (in sec) = Distance between train and target (in ft) ÷ Train
speed (in ft/sec). The accuracy of estimation of ETA is decided by the distance
between train and target and the variability train travel. The variability of ETA can be
estimated: the standard deviation of ETA = the distance between train and target (ft)
× standard deviation of train travel rate (sec/ft). To reduce the estimation variability,
two or more preemptions are expected at upstream crossings, and the ideal space
between the two crossings is less than 0.5 miles.
ATMS.now can produce numerous reports available for determining the impact of
pre-preemption on traffic conditions, including vehicle travel time, real-time
congestion, and level of service (LOS). All these reports are obtained from the LOS
Hourly Day Graph. Thus, the minimum time span in ATMS.now is one hour.
Two pre-preemption strategies were developed and tested in this study: coordinated
pre-preemption and Improved Transitional Preemption Strategy (ITPS)-based pre-

xviii
preemption. Coordination pre-preemption aims to clear the through traffic along an
arterial as much as possible before train’s arrival. A coordinated phase should be
included in its phase sequence. Since all pre-preemption phases are pre-timed,
coordination pre-preemption is easy to implement on existing traffic controllers (e.g.,
NAZTEC 2070N). The ITPS-based strategy aims to reduce the number of minimum
green-time abbreviations at a preempted intersection in a fully-actuated manner.
Because of the complex logic of the ITPS-based strategy, its implementation may
require additional logic modules.
Based on the simulation results, the coordinated strategy can effectively improve
mobility on the arterials near a railroad crossing.
o The strategy can reduce traffic delay along the arterials by 4–60 percent,
according to geometric and traffic conditions.
The coordinated strategy can effectively improve safety on the arterials near a
railroad crossing.
o The strategy can reduce average stops along the arterials by 10–45 percent,
according to geometric and traffic conditions. Lower average stop numbers
can smooth traffic and reduce the risk of rear-end crashes.
o The strategy can reduce average queue length along the commuting direction
on the arterials by up to 100 percent, according to geometric and traffic
conditions. Shorter queue length can reduce the risk of a queue intruding into
the next intersection.
The performance pattern of the coordinated pre-preemptions is sensitive to site
features and strategy configurations.
Considering the applicability and corridor-level performance of the pre-preemption
strategy, coordinated pre-preemption is suggested when traffic volume is higher
than 500 vehicles per hour per lane (vphpl) and train block duration is longer than
100 seconds.
A generic pre-preemption plan was developed in this study to provide guidance on
implementation of the pre-preemption strategy using the ATMS.now system in
Florida. The generic plan provides the procedure to (1) identify the needs of pre-
preemptions, (2) activate pre-preemptions using upstream preemption signals, (3)
predict ETA using upstream preemptions, and (4) configure ATMS.now to implement
the pre-preemption strategy.

xix
RECOMMENDATIONS FOR IMPLEMENTATIONS
Based on the conclusions, the recommendations for implementing the coordinated pre-
preemption strategy in Florida are given as follows.
Train Detection and Pre-preemption Trigger
As a cost-effective alternative to train detection and pre-preemption trigger, upstream
preemptions (hereafter, along the railway corridor) are suggested if the following conditions
are satisfied:
No other train detectors are available in the control section.
The signalized intersections in the control section are connected to a traffic
management system (such as ATMS.now).
No train stations or other roadway facilities that interrupt train operations exist in the
control section.
At least one preempted intersection is available in the upstream from the target
intersection.
One upstream preemption signal can be used for a pre-preemption trigger in the
target intersection if:
o Train speed is nearly constant in the control station at the same time of a day,
and
o Train speed pattern can be obtained from railway companies.
Two or more upstream preempted intersections are required if:
o Train speed variety is significant in the control section.
o Train speed pattern is unknown.
o Distance between the two preempted intersections is not greater than 0.5
miles.
The distance between the upstream preempted intersection used as the pre-
preemption trigger and the target intersection should be less a reasonable value. The
value, which is the function of train speed and its variance, can be estimated using
the algorithm described in the generic pre-preemption plan.
If these criteria cannot be satisfied, roadside train detectors are suggested.
xx
Traveler Information
ETA/ETD information can be provided to vehicle drivers through a Dynamic Message Signs
(DMS).
Two messages can be provided: the remaining time before train’s arrival and the
roadway blockage duration.
The message should be given in a format of time intervals. For example, “Train will
arrive in 2 – 3 minutes.”
Information can be disseminated to travelers through the FDOT SunGuide system.
o A connection between the FDOT SunGuide and the ATMS.now is required.
o The estimation of ETD/ETA can be developed as a new module of the FDOT
SunGuide or imported from a third-party application into the SunGuide.
Implementation of Pre-preemption Strategy
The coordinated pre-preemption strategy is suggested to be implemented if the following
criteria are satisfied:
Significant congestion and long queues can be observed along the urban arterial
intersecting the railroad corridor.
Train blockage duration is greater than 100 sec.
Vehicle volume on the arterial is higher than 500 vphpl.
Pre-preemption triggers are available in the control section.
Pre-preemption Timing
The signalized intersections along the intersecting arterial impacted by train blockage
should be considered in the scope of pre-preemption coordination. The impact can be
observed in the field, calculated using the queue theory, or simulated.
The coordinated pre-preemption phase should be assigned to the commuting
through-movements along the arterial.
The non-coordinated pre-preemption phases should be considered if congestion
occurs in turning movements or minor movements.
The timing parameters (phase sequence, phase length, and phase offset) should be
optimized based on traffic demand and ETA.

xxi
Implementation of Pre-preemption using ATMS.now
Preempt 1 in a NAZTEC 2070 controller, which has the highest priority, should be
reserved for preemption operations. Preempts 3–6 can be used for pre-preemption
purposes.
The current version of ATMS.now cannot estimate ETA/ETD. Secondary software (an
external process) is needed to estimate ETA and/or ETD.
The secondary software should be allowed to access the ATMS.now database to
retrieve preemption logs and write incident triggers in the ATMS.now SQL database:
o A READ permission is required for retrieving preemption logs and monitoring
Upstream Preemption (Controller Alarm #49). This access will not change any
information in the database.
o A WRITE permission is required for writing an incident trigger in Incident
Trigger Table, as the trigger of pre-preemption.
The secondary software may be developed through three ways:
o NAZTEC will develop an internal module to implement the ETA/ETD logic in
ATMS.now.
o FDOT or its contractors will develop a third-party application, which is
independent to ATMS.now, to implement the ETA/ETD logic.
o FDOT or its contractors will develop and integrate the ETA/ETD logic in the
FDOT SunGuide system.
Estimation of Traffic Delay using ATMS.now
To use ATMS.now to evaluate the performance of pre-preemption strategy, traffic counts at
target intersections should be imported into the ATMS.now system.
RECOMMENDATIONS FOR FUTURE STUDY
The performance of coordinated pre-preemptions is sensitive to site features and
pre-preemption parameters. It is necessary to develop a simulation-based
optimization procedure for optimizing pre-preemption parameters (phase types,
phase sequence, phase time, and offset time) for special scenarios.

xxii
More factors, except traffic volume and train blockage duration, should be considered
in future simulations to identify the impact of these factors (e.g., distance of
intersection from railroad crossing, train speed variance) on the performance of the
pre-preemptions. The results can be used to improve the criteria for implementing
pre-preemption in the generic plan.
Hardware-in-loop (HIL) traffic simulation uses real traffic signal controller hardware
to control simulated traffic. This simulation is done by interfacing a traffic simulation
model with one or more traffic signal controllers. The traffic simulation model is a
computer model of the interaction of vehicles with each other, vehicles with the
roadway, and vehicles with the traffic control system. In most traffic simulation
models, the traffic control system is emulated in software, but with HIL simulation,
the emulated traffic control system is replaced with real traffic control hardware. In
the future, an HIL system integrating ATMS.now is suggested for testing and
demonstrating the performance of the pre-preemptions in an actual environment.
A pilot project is suggested. The purposes of the pilot project are to: (1) validate the
technical feasibility and maturity for implementing pre-preemptions using ATMS.now;
(2) demonstrate the implementation of pre-preemption strategies in a selected site;
and (3) accumulate experience for implementing the pre-preemption strategies
widely. The pilot project is suggested to include, but not limit to, the following tasks:
o Develop the ETA/ETD estimation process (an internal module in ATMS.now, a
third-party software developed a contractor, or an additional module in FDOT
SunGuide)
o Select a railway corridor which meets the pre-preemption implementation
criteria.
o Develop a site-specific pre-preemption phase timing
o Implement a pre-preemption strategy in the selected railway corridor
o Update the generic pre-preemption plan based on the experience collected in
the pilot project.
o Collect performance measures and evaluate the implementation of the pre-
preemption strategy.

xxiii
Table of Contents
Disclaimer ............................................................................................................... ii
Metric Conversion .................................................................................................... iii
Technical Report Documentation ................................................................................ iv
Glossary of Terms and Acronyms ............................................................................... v
Acknowledgments .................................................................................................... x
Executive Summary ................................................................................................. xi
List of Figures ...................................................................................................... xxvi
List of Tables ....................................................................................................... xxix
1 Introduction ........................................................................................................ 1
1.1 Background ................................................................................................... 1
1.2 Current Implemented Rail Preemption Strategies in Florida .................................. 2
1.3 Problems at Highway Railroad Crossings ............................................................ 5
1.3.1 Safety Problems ...................................................................................... 5
1.3.2 Mobility Problems .................................................................................... 6
1.3.3 Motivation .............................................................................................. 6
1.4 Research Objectives ....................................................................................... 7
1.5 Report Organization ....................................................................................... 9
2 Literature Review ............................................................................................... 10
2.1 Traffic Signal Preemption .............................................................................. 10
2.1.1 Overview of Traffic Signal Preemption....................................................... 10
2.1.2 Preemption Sequences ........................................................................... 10
2.2 Traffic Signal Treatments Prior to Preemption ................................................... 13
2.2.1 Early Warning System ............................................................................ 14
2.2.2 Improved Transition Preemption Strategy ................................................. 16
2.3 Highway-Rail Grade Crossing Safety Action Plan ............................................... 17
3 Generic Pre-preemption Plan ................................................................................ 21
3.1 Overview .................................................................................................... 21
3.2 Traffic Signal Pre-preemptions and Preemptions ............................................... 21
3.3 Data Requirements for Implementing Pre-preemption ....................................... 22
3.3.1 Railroad Lines and Signal Preemption Information ...................................... 22
3.3.2 Railroad System-Related Information ....................................................... 23
3.3.3 Second Software ................................................................................... 23
3.3.4 Detectors ............................................................................................. 23
3.4 Methods to Trigger Traffic Signal Pre-preemptions ............................................ 23
3.4.1 Preemption Trigger ................................................................................ 23
3.4.2 Pre-preemption Using Upstream Preemption as the Trigger ......................... 24

xxiv
3.5 Procedure for Development of a Coordinated Pre-Preemption Plan ....................... 25
3.5.1 Applicability of Signal Pre-preemptions ..................................................... 25
3.5.2 Calculation of ETA and ETD at Target Crossings ......................................... 26
3.5.3 Train Direction ...................................................................................... 26
3.5.4 Train Speed .......................................................................................... 27
3.5.5 Train Length ......................................................................................... 30
3.5.6 Train Location ....................................................................................... 31
3.5.7 Estimated Time of Arrival ........................................................................ 31
3.5.8 Accuracy of Field Measurements .............................................................. 32
3.6 Use of ATMS.now to Implement Pre-preemption ............................................... 33
3.6.1 Procedure ............................................................................................. 33
3.6.2 Limitations ........................................................................................... 41
3.7 Identification of Criteria for Implementing Signal Pre-preemption ....................... 43
3.7.1 Connection to ATMS.now ........................................................................ 43
3.7.2 Gate-Down Duration .............................................................................. 43
3.7.3 Traffic Characteristics ............................................................................. 43
3.7.4 Expected Train Characteristics ................................................................. 44
3.7.5 Presence of Preemption Settings at Intersections ....................................... 44
3.7.6 Distance of Intersection from Railroad Crossing ......................................... 44
3.7.7 Intersection Mode of Operation: Coordinated, Actuated, or Pre-Timed ........... 45
3.8 Optimization of Pre-preemptions .................................................................... 45
4 Developing the Method for Using ATMS.now to Report and Archive Train Delay .......... 46
4.1 Congestion Levels ........................................................................................ 46
4.2 Incident Triggers .......................................................................................... 48
4.3 Summary of Report Types ............................................................................. 48
5 Development of Coordinated Pre-preemption Strategy ............................................. 50
5.1 Overview .................................................................................................... 50
5.2 Detection Subsystem .................................................................................... 51
5.3 Prediction Subsystem ................................................................................... 53
5.4 Control Subsystem ....................................................................................... 56
5.5 Coordinated Pre-preemption Strategy ............................................................. 58
5.6 Comparison ................................................................................................. 64
6 Development of Simulation Model ......................................................................... 65
6.1 Site Selection .............................................................................................. 65
6.1.1 Selection Criteria ................................................................................... 65
6.1.2 Selected Control Sections ....................................................................... 65
6.2 Data Collection ............................................................................................ 69
6.2.1 Site Geometries .................................................................................... 69
xxv
6.2.2 Traffic Data .......................................................................................... 70
6.2.3 Traffic Signal Data ................................................................................. 70
6.2.4 Train Traffic Data................................................................................... 73
6.3 Simulation Model Development ...................................................................... 74
6.3.1 Selection of Traffic Simulation Package ..................................................... 74
6.3.2 Procedure for Simulation Model Development ............................................ 75
6.3.3 Coding Network ..................................................................................... 76
6.3.4 Coding Controllers ................................................................................. 77
6.3.5 Create Scenarios ................................................................................... 81
6.3.6 Configuring Simulation Parameters .......................................................... 82
6.3.7 Measures of Effectiveness ....................................................................... 82
6.3.8 Before-After Analysis ............................................................................. 84
7 Simulation Results and Discussions ....................................................................... 85
7.1 Section I ..................................................................................................... 85
7.1.1 Site Description and Scenarios ................................................................ 85
7.1.2 Simulation Results ................................................................................. 90
7.1.3 Discussion ............................................................................................ 92
7.2 Section II .................................................................................................... 93
7.2.1 Site Description and Scenarios ................................................................ 93
7.2.2 Simulation Results ................................................................................ 101
7.2.3 Discussion ........................................................................................... 104
7.3 Section III ................................................................................................. 106
7.3.1 Site and Scenarios ................................................................................ 106
7.3.2 Simulation Results ................................................................................ 114
7.4 Summary ................................................................................................... 117
8 Conclusions and Recommendations ...................................................................... 119
8.1 Summary and Conclusions............................................................................ 119
8.2 Recommendations for Implementation ........................................................... 121
8.3 Recommendations for Future Study ............................................................... 123
Bibliography ......................................................................................................... 126
Appendix: Case Study to Predict Onset and Removal of Preemptions .......................... 127

xxvi
LIST OF FIGURES
Figure ES-1 Example of Coordinated Pre-preemption Phases ...................................... xv
Figure ES-2 VISSIM Model-Based Development ....................................................... xvi
Figure 1-1 Florida Rail Network .............................................................................. 2
Figure 1-2 Vehicle Delay Due to Train Blockage ....................................................... 3
Figure 1-3 Example of Simultaneous Preemption and Advance Preemption Time Line for Same Railroad Gate Crossing ................................................................. 5
Figure 2-1 Preemption Sequence ......................................................................... 11
Figure 2-2 Early Warning System Phases and Sequence .......................................... 15
Figure 2-3 ITPS Logic Sequence........................................................................... 18
Figure 2-4 Countermeasures of Railroad Crossing Crashes from Highway-Rail Grade
Crossing Safety Action Plan ................................................................. 20
Figure 3-1 Sample Rail and Highway Corridor ........................................................ 27
Figure 3-2 Train Average Speed Calculation .......................................................... 28
Figure 3-3 Continuation of Average Speed Calculation ............................................ 29
Figure 3-4 Average Speed Calculation Using Release of Preemption at Successive Grade
Crossings .......................................................................................... 30
Figure 3-5 Calculation of Train Length .................................................................. 31
Figure 3-6 Flow Chart for Use of ATMS.now to Implement Pre-Preemption Strategies . 35
Figure 3-7 View of Max-out Counter ..................................................................... 36
Figure 3-8 Process to Select Viewing Controller Status ............................................ 36
Figure 3-9 Creation of Alarm to Monitor Preempt 1 in ATMS.now .............................. 37
Figure 3-10 Designation of Preempts for Different Objectives .................................... 38
Figure 3-11 Creation of a Pre-Preemption Trigger .................................................... 39
Figure 3-12 Programming Preempts (Part 1) ........................................................... 40
Figure 3-13 Programming Preempts (Part 2) ........................................................... 40
Figure 4-1 Congestion Level Definitions in ATMS.now .............................................. 47
Figure 4-2 Real-Time Congestion Data Report ........................................................ 49
Figure 5-1 Pre-preemption System Architecture ..................................................... 51
Figure 5-2 Train Speed Calculation Based on Two Upstream Preemptions .................. 54
Figure 5-3 Calculation of Available Time for Pre-preemption .................................... 55
Figure 5-4 Train Length Calculation Based on Upstream Preemptions ........................ 56
Figure 5-5 Example Site for Pre-preemption Strategy ............................................. 60
Figure 5-6 Pre-preemption Timeline (one coordinated pre-preemption phase at Intersection B) ................................................................................... 61
Figure 5-7 Pre-preemption Time Line (two coordinated pre-preemption phases at
Intersection B) ................................................................................... 62

xxvii
Figure 5-8 Pre-preemption Timeline (one non-coordinated phase and one coordinated
phase at Intersection B) ...................................................................... 63
Figure 6-1 Control Sections in Broward County, Florida ........................................... 67
Figure 6-2 Example of Intersection Movement Counts ............................................. 71
Figure 6-3 Example of Actuated Traffic Signal Timing Form ...................................... 72
Figure 6-4 Example of Coordination Timing Form ................................................... 73
Figure 6-5 Example of Preemption Log ................................................................. 74
Figure 6-6 Procedure of VISSIM-Based Simulation Model Development ..................... 75
Figure 6-7 Logic of Crossing Gate Controller in VISSIM ........................................... 78
Figure 6-8 Pre-preemption Logic for Preempted Intersection Coded in VISSIM ............ 79
Figure 6-9 Pre-preemption Logic for Non-Preempted Intersection Next to a Crossing Coded in VISSIM ................................................................................ 80
Figure 6-10 Pre-preemption Logic for Intersection Not Next to a Crossing Coded in
VISSIM ............................................................................................. 81
Figure 7-1 Tested Intersections in Section I ........................................................... 86
Figure 7-2 Timeline of Pre-preemption Strategy I (After 1) ...................................... 87
Figure 7-3 Timeline of Pre-preemption Strategy I (After 2) ...................................... 88
Figure 7-4 Average Delay in Section I ................................................................... 90
Figure 7-5 Average Stops in Section I ................................................................... 91
Figure 7-6 Average Delay Reduction after Implementing Pre-preemption (After 1) ..... 92
Figure 7-7 Average Stops Reduction after Implementing Pre-preemption Strategy (After 1) .................................................................................................... 93
Figure 7-8 Layout of Tested Intersections in Section II ............................................ 94
Figure 7-9 Pre-preemption Strategy - After 1 ........................................................ 96
Figure 7-10 Pre-preemption Strategy - After 2 ........................................................ 97
Figure 7-11 Pre-preemption Strategy - After 3 ........................................................ 98
Figure 7-12 Pre-preemption Strategy - After 4 ........................................................ 99
Figure 7-13 Average Delay in Section II ................................................................ 101
Figure 7-14 Average Stops in Section II ................................................................ 102
Figure 7-15 Average Queue Length along Oakland Park Blvd (Westbound) ................. 103
Figure 7-16 Average Delay Reduction along Oakland Park Blvd (Westbound) .............. 104
Figure 7-17 Average Stops Reduction along Oakland Park Blvd (Westbound) .............. 105
Figure 7-18 Average Queue Length Reduction along Oakland Park Blvd (Westbound) .. 105
Figure 7-19 Layout of W. Commercial Boulevard with CSX Rail Corridor ..................... 106
Figure 7-20 Phasing Diagram of I-95 Interchange at W. Commercial Boulevard ........... 107
Figure 7-21 Locations of Two Upstream Intersections along CSX Rail Corridor Relative to Target Intersection ............................................................................ 108
Figure 7-22 Current Delays by Approaches at Target Intersection .............................. 109

xxviii
Figure 7-23 Logic Algorithm of Modified ITPS Pre-Preemption Strategy When Current
Phase Is Phase 1 ............................................................................... 111
Figure 7-24 Logic Algorithm of Modified ITPS Pre-Preemption Strategy When Current
Phase Is Phase 12 ............................................................................. 112
Figure 7-25 Logic Algorithm of Modified ITPS Pre-Preemption Strategy When Current Phase Is Phase 3, 4, 5, or 6 ................................................................ 112
Figure 7-26 Signal Phase Logic of Potential Simplified Pre-Preemption Strategies ......... 113
Figure 7-27 Average Intersection Delays by Scenarios ............................................. 116

xxix
LIST OF TABLES
Table 2-1 Florida Crossing Incidents .................................................................... 19
Table 5-1 Train Detection Technologies ............................................................... 52
Table 5-2 Summary of Pre-preemption Strategies ................................................. 64
Table 6-1 Summary of Control Section I .............................................................. 66
Table 6-2 Summary of Control Section II ............................................................. 68
Table 6-3 Summary of Control Section III ............................................................ 69
Table 6-4 Data Collection at Control Sections ....................................................... 70
Table 6-5 Traffic Controllers Coded in VISSIM ....................................................... 78
Table 6-6 Selected MOEs in Simulation ................................................................ 83
Table 6-7 Example of a MOE Output Table (Average Delay, seconds per vehicle) ...... 83
Table 7-1 Vehicle Traffic Volume on W Broward Blvd (Westbound) .......................... 89
Table 7-2 Levels of Train Duration (Train Speed) on W Broward .............................. 89
Table 7-3 Commuter Vehicle Traffic Volume on Oakland Park Blvd .......................... 100
Table 7-4 Levels of Train Duration (Train Speed) in Section II ................................ 100
Table 7-5 Departure Time of NB Trains ............................................................... 115
Table 7-6 Number of Average Minimum Green-Time Abbreviations for 10 Runs* ....... 116
Table 7-7 Comparison of Pre-preemption Strategies ............................................. 118
Table A-1 Median Preemption and Link Travel Time for Northbound Direction for SFR
Corridor ........................................................................................... 127
Table A-2 Example of Preemption Activity for Northbound Train in SFR Corridor ....... 127
Table A-3 Example of Prediction of Preemption Activities Based on Historical Data and Corrections Based on Real-Time Data ................................................... 128

1
1 INTRODUCTION
1.1 Background
According to statistics compiled by the Federal Railroad Administration (FRA), Florida
experienced a high number of train-vehicle crashes between 2006 and 2008 in comparison
with other states. FRA required Florida to submit a Highway-Rail Grade Crossing Safety
Action Plan for reducing crashes at railroad crossings by increasing public awareness,
constructing roadway overpasses, increasing the number of lights and gates at crossings
throughout the state, and implementing other means.
In South Florida, two major rail lines (South Florida Rail Corridor and Florida East Coast
Railway) stretch across the region, impacting every minor and major east-west arterial, as
shown in Figure 1-1. The South Florida Rail Corridor includes three types of rail traffic—
commuter rail (Tri-Rail), intercity passenger rail (Amtrak), and freight rail operations (CSX)—
while the Florida East Coast (FEC) Railway is exclusively freight rail operations. Although
some information about their safety impacts is known, their mobility impacts are not
measured or tracked regularly. The Florida Department of Transportation (FDOT) District 4’s
Transportation System Management and Operation (TSM&O) pilot network (initial
deployments in Fort Lauderdale and southern Broward County) will use technology to
measure, report, and use network performance measures to enhance mobility on the
TSM&O network. To understand and develop solutions that enhance the network’s
performance, TSM&O operators must understand the causes of delay and develop strategies
that include operational improvements and information dissemination to users that allows
them to make better decisions on which route or mode to take on the network. Reliable and
real-time performance measures relating to train crossing delays will give operators
opportunities to develop and implement strategies that minimize congestion resulting from
at-grade highway-railroad crossings.

2
Source: FDOT Website
Figure 1-1 Florida Rail Network
1.2 Current Implemented Rail Preemption Strategies in Florida
Florida rail transportation, consisting of more than 2,700 miles of track routes, serves as an
important transportation system in Florida, with its continuing population growth and
rapidly-diversifying economy. Railroad preemption is an important strategy to provide safe
vehicular, pedestrian, and train movements and to complement these three modes. The
Manual of Uniform Traffic Control Devices (MUTCD) (Federal Highway Administration, 2009)
states that
where a signalized highway intersection exists in close proximity to a railroad
crossing, the railroad signal control equipment and the traffic signal control
equipment should be interconnected, and the normal operation of the traffic

3
signals controlling the intersection should be preempted to operate in a
special control mode when trains are approaching.
The MUTCD suggests that a traffic control signal should be provided with preemption when
a highway-rail grade crossing is equipped with a flashing-light signal system and is located
within 200 feet of an intersection or midblock location controlled by a traffic control signal.
Florida recommends signal preemptions at intersections located 200–500 feet upstream of
the railroad grade crossing with warning devices (Long, 2002).
Traffic signal preemption is the transfer of the normal operation of a traffic control signal to
a special control mode of operation. Preemption at at-grade rail crossings has a significant
impact on safety and mobility, as it may cause significant vehicle delays at the railroad
crossing or the adjacent intersections, as shown in Figure 1-2. A pre-preemption strategy
might help reduce the delay by quickly clearing the vehicles before the track clearance.
Figure 1-2 Vehicle Delay Due to Train Blockage
Simultaneous preemption and advance preemption are two types of railroad preemptions in
practice. Simultaneous preemption is designed so that the traffic signal controller unit and
the railroad active warning devices (flashing lights and gates) receive the notification of an
approaching train simultaneously. Simultaneous preemption is typically used where the
minimum warning time needed for the operation of the railroad active warning devices is

4
sufficiently long enough to clear stationary vehicles safely out of the crossing. By law
(Traffic Engineering Council Committee, 2003), railroad companies are required to provide
traffic agencies with at least 20 seconds of advance warning of the train’s impending arrival
at the grade crossing. However, most railroads try to provide traffic agencies with
approximately 25 seconds of advance warning for simultaneous preemption. Additional
warning time (i.e., more than the required 20 seconds) can be requested from the railroad
to provide advance preemption; however, because of costs, this is not done at most
highway-grade crossings.
When the signal controller unit needs to receive notification earlier than the activation of
railroad warning devices, advance preemption is used. According to an Institute of
Transportation Engineers’ (ITE) recommendation, advance simulations should be used if the
simultaneous preemption does not have enough delay and clearance time between the
lowering of the gates and the movement of vehicles within the minimum track clearance
distance (Venglar et al., 2000). Figure 1-3 shows an example of the timelines for the 20-
second warning for both simultaneous railroad preemption and advance railroad preemption
(Ruback et al., 2007). The timeline includes total warning time, light flashing time, gate
action time, signal time, and queue clearance time. These two types of preemption require
different traffic signal control plans, schedules, and applicable situations. As shown in Figure
1-3, advance preemption has longer maximum right-of-way transfer time (RTT) than the
simultaneous preemption plan for the signal plan. RTT is the maximum amount of time
needed prior to display of the clear-track green interval. This time includes the remaining
time of the active green phase, pedestrian walk and clearance, and yellow change and red
clearance interval for opposing movements.

5
A. Simultaneous Preemption B. Advanced Preemption
Figure 1-3 Example of Simultaneous Preemption and Advance Preemption Time Line for Same Railroad Gate Crossing
1.3 Problems at Highway Railroad Crossings
1.3.1 Safety Problems
A highway-railroad at-grade crossing is an intersection at which a roadway intersects a
railroad at the same grade. It causes a right-of-way conflict between train traffic and vehicle
traffic. Since it is difficult for a train to fully stop and accelerate again to leave the crossing,
the right-of-way at a crossing is always assigned to the train traffic. The railroad company is
responsible for sensing the approaching train and activating the warning devices to prevent
vehicles from entering into the crossing area during a train passing the crossing. Highway
traffic control operations are independent of railway control operations. When a roadway
intersection is closed at the crossing, vehicles approaching the intersection from the
crossing may face a red signal, and a queue may back up across the at-grade railroad
crossing. If vehicle traffic at the crossing area is not cleared from the track before train’s
arrival, severe injuries and even fatalities of vehicle drivers and passengers can result from
collisions between the train and a vehicle.
When at-grade railroad crossings are located on an urban arterial, which usually serves as a
daily commuting route with high vehicle traffic volume during peak periods, a train passing
the crossing will block the vehicle traffic and cause the formation of a long vehicle queue
along the arterial. If train blockage duration is sufficiently long, the queue length may be
longer than the storage length of the adjacent roadway intersection and extend back a

6
considerable distance to the next access points and/or intersections, thus slowing all
movement, blocking traffic, and perhaps causing vehicle collisions. This problem is
exacerbated if a second train passes before the queue from the first train clears. If at-grade
crossings are near a freeway interchange, long queues may exceed ramps and intrude into
freeway mainlines, thus inducing serious traffic accidents.
1.3.2 Mobility Problems
Once a train enters an at-grade crossing area, the right-of-way of the crossing is given to
the train. Vehicle traffic must stop until the train leaves the crossing. Depending on train
speed, train length, and traffic control type, this process may take a few minutes or much
longer. During this period, both through movements at adjacent intersections are blocked,
as are turning movements heading to the crossing. When the traffic volume is high at
nearby intersections during peak periods, long queues will form at adjacent intersections,
and vehicles do not have sufficient time to get through the crossing and must wait in the
queue until the train leaves. In that case, an elongated queue will not only block the traffic
at nearby intersections, but also will result in the slowdown or full termination of the
mobility of the intersection, or even the entire roadway network in proximity to the railroad.
Severe congestion and consequential delay may cause a failure of roadway system
operations and increase negative environmental impacts.
1.3.3 Motivation
To improve the safety and mobility of at-grade railroad crossings, the MUTCD suggests
implementation of preemption operations at signalized intersections within 200 feet of an
at-grade crossing to clear vehicles from rail track areas before train’s arrival. However, the
major objective of preemption is to prevent vehicle-train accidents in railroad track areas.
Preemption’s track clearance time is much shorter for clearing high vehicle volumes along
an arterial intersecting rail tracks during peak periods. The impact of preemption controls on
improving arterial mobility and safety in larger urban areas during peak periods is limited.
On the other hand, advance warning time for a train approaching in modern traffic control
systems provides the potential for implementing new traffic control logics to mitigate the
negative impact of train blockage on vehicle traffic. Therefore, it is desirable to develop an
effective traffic control strategy for resolving the existing safety and mobility problems at
at-grade railroad crossings and adjacent arterials in urban areas, especially during peak
periods.

7
1.4 Research Objectives
The major objective of this research project was to investigate the potential for and assess
the benefits of using advance features of a traffic signal system software platform
(ATMS.now), use of which is prevalent in Florida, to alleviate safety and mobility problems
at highway-railroad at-grade crossings and adjacent arterials.
This research developed “pre-preemption” phasing in a coordinated manner at signalized
intersections along a railroad corridor. This phasing would be triggered by detection of a
train entering the control section and would provide additional green time for clearance of
vehicles away from grade crossings downstream from the approaching train. The additional
clearance can reduce the potential for vehicle-train conflicts, especially during periods of
congested arterial traffic. The concept considered in this research project does not require
any physical or other interfaces with railroad signaling or control systems; it resides in and
is implemented entirely through traffic signal system software. The research also took into
consideration the impacts of diverse rail operations.
This research investigated the use of signal system software to estimate the location of
trains, train speed, and impacts on travel time or the predicted delay an incoming train will
have on intersecting arterials.
Additionally, this research provides guidance on how TSM&O operators should use this
information to develop signal timing patterns that optimize travel times on parallel routes or
potential detour routes the users may take to avoid the delay.
The following tasks and activities were conducted in this study:
Understanding Current Implemented Rail Preemption Strategies in Florida
The understanding and knowledge of current implemented railroad preemption types
helped to determine the prevailing railroad preemption type, the advantages and
disadvantages of each type, the applicable conditions, and how this project could be
compatible with regional and state railroad preemption plans. In addition, due to
different traffic signal software platforms used in different regions in Florida, how the
developed strategy can be applicable to these software packages can help other
regional agencies to potentially implement the railroad pre-preemption strategy.

8
Development of a Coordinated Pre-Preemption Plan for Implementation via
the ATMS.now Platform
This research developed a plan that describes the process through which coordinated
pre-preemption is implemented via the ATMS.now platform given the “trigger” or
preemption detection at a control section “entry point.” The plan contains but is not
limited to criteria for implementing pre-preemption, selection of train detection
technologies, estimation of train’s arrival time variance, method of phasing design
and optimization, and configuration in ATMS.now and NAZTEC 2070 controllers.
Development of Strategies for Optimizing Signal Operations for
Adjacent Arterials
This study developed a strategy for optimizing signal operations before, during, and
after a train passing a highway-railroad at-grade crossing at intersections along
intersecting arterials at a coordinated manner to maximize network performance. To
develop strategies for optimizing signal operations, signal timing and phasing
parameters were selected based on a full understanding of the mobility and safety
issues at each location for each time of day. Three phases were included for
developing the strategies: prior to train’s arrival, during train passing, and after train.
Developing and Implementing a Method to Predict Train Performance
This research investigated the use of the ATMS.now software and any other existing
FDOT resources to estimate train performance, including train speed, train length,
train delay, train activities, etc.
Development of a Method for Estimating the Strategy-related Mobility and
Safety Impacts within the Identified Control Section
To evaluate the effectiveness of the proposed strategies developed from this
research project, a methodology was developed for estimating the strategy-related
mobility and safety impacts within the identified control section, including at
signalized intersections adjacent to the signalized intersections at the control
section’s grade crossings. Adjacent intersections include the signalized intersections
impacted by the railroad crossing along the arterials intersecting the railroad. The
methodology allows comparison of different strategies on the basis of their effect on
overall delay within the network consisting of the grade crossing and adjacent
signalized intersections. Using this methodology, researchers were able to evaluate
and report the estimated mobility and safety impacts to the adjacent intersections.

9
1.5 Report Organization
The report is organized as follows: Chapter 2 is a summary of the literature review. A
comprehensive plan to guide implementation of the pre-preemption is described in Chapter
3. Chapter 4 provides the method to report train delay using ATMS.now. Chapter 5
describes the pre-preemption strategy developed in this study. Chapter 6 illustrates the
simulation experiment, including selection of control sections, data collection, controller
development, and simulation procedure. The simulation result is presented and discussed in
Chapter 7. Chapter 8 summarizes the findings of this study, the recommendations for
implementations, and the recommendations for future study. The Appendix demonstrates a
case study to predict the onset and removal of preemptions.

10
2 LITERATURE REVIEW
This chapter summarizes previous studies and existing technologies related to traffic signal
operations at intersections adjacent to highway-railroad crossings. The following are
included:
Traffic Signal Preemption
Existing Signal Treatment Prior to Preemption
Train Detector Technologies
Microscopic Traffic Simulation Models
Highway-Rail Grade Crossing Safety Action Plan
2.1 Traffic Signal Preemption
2.1.1 Overview of Traffic Signal Preemption
Traffic signal preemption is operated at a special mode to give the right-of-way to trains
over vehicle traffic at highway intersections near highway-rail crossings. It is commonly
used to clear vehicles that may be in danger of being hit by a train before it arrives at a
crossing. A properly-designed traffic signal preemption system aims to increase the safety
and mobility of arterials (Federal Highway Administration, 2009).
The need for preemption at signalized roadway intersections that were close to a highway-
railroad intersection was raised in “Preemption of Traffic Signals At or Near Railroad Grade
Crossings with Active Warning Devices: A Recommended Practice,” published by ITE in 1979
and updated in 1997. The MUTCD provides guidance and standards for the preemption of
traffic control signals and how to transition into and out of preemption. The key signal
aspect requires that at a signalized intersection that is located within 200 feet of a highway-
rail grade crossing (measured from the edge of the track to the edge of the roadway, where
the intersection traffic control signals are preempted by the approach of a train), all existing
turning movements toward the highway-rail grade crossing should be prohibited during the
signal preemption sequences.
2.1.2 Preemption Sequences
Figure 2-1 shows a typical preemption sequence: right-of-way transfer, track clearance,
dwell phase, and exit phase.

11
Figure 2-1 Preemption Sequence
10
32
54
76
98
11
10
13
12
15
14
17
16
19
18
21
20
23
22
24
Rai
l E
quip
men
t
Res
ponse
Tim
e
Rai
l E
quip
men
t
Res
ponse
Tim
e
Rig
ht-
of-
Way
Tra
nsf
erR
ight-
of-
Way
Tra
nsf
erT
rack
Cle
aran
ceT
rack
Cle
aran
ce
Beg
in R
igh
t-of-
Way
Tra
nsf
er
Tra
in S
hu
nts
Tra
ck
Cir
cuit
Rec
eive
Pre
emp
tion
Tri
gger
Beg
in T
rack
Cle
ara
nce
Act
ive
Fla
shin
g
Lig
ht
Sig
nals
Const
ant
War
nin
g T
ime
Const
ant
War
nin
g T
ime
Beg
in L
ow
erin
g
Gate
Gate
is
Low
ered
Cro
ssin
g G
ate
Op
erati
on
Tra
ffic
Sig
nal
Op
erati
on
Del
ay
1

12
Figure 2-1 (cont’d) Preemption Sequence
25
27
26
29
28
31
30
33
32
35
34
37
36
40
38
Dw
ell
Ph
ases
Ex
it P
has
eE
xit
Ph
ase
41
43
42
45
44
46
48
47
50
49
Beg
in D
wel
l P
hase
s B
egin
Exis
t P
hase
s
Tra
in A
rriv
es a
t
Cro
ssin
gT
rain
Lea
ves
Cro
ssin
gTra
in B
lock
age
Tim
eT
rain
Blo
ckag
e T
ime
Beg
in R
ais
ing G
ate
Gate
is
Up
Cro
ssin
g G
ate
Op
erati
on
Tra
ffic
Sig
nal
Op
erati
on
1

13
Right-of-Way Transfer
The initiation of preemption is triggered upon the detection of an approaching train. In some
circumstances, a pre-determined delay is programmed into the preemption sequence that
allows controllers to postpone the initiation of the preemption plan after detecting the
incoming train. The transition of preemption can occur at any point in a traffic signal’s
normal cycle of operation. Therefore, before entering into the track clearance phase,
enough time must be provided to terminate any active phase at any point in the cycle;
otherwise, the current phase must be extended to terminate the active phase safely. In this
case, minimum green times, vehicle change and clearance times (yellow + all red), and
pedestrian clearance times must all be considered.
Track Clearance
After the normal operation phase has been terminated safely, a track clearance time is
provided to clear the remaining traffic that may be queued over the track or is in danger of
being hit by the train before the train arrives at the crossing. The track clearance time must
be long enough to clear all vehicles within the limits of the crossing and is associated with
vehicle characteristics, geometry of the crossing, and the distance between the intersection
and the crossing.
Dwell Phase
A dwell phase is provided after the track clearance phase when the train is near or in the
crossing. It must be kept active until the train has left the detection area and cleared the
crossing. During this time, no other traffic can cross the track and must stop within the
limits of the crossing. The MUTCD suggests that certain vehicle movements that do not
cross the track are permitted. Alternatively, vehicle movements that do not conflict with the
train movement can be operated during the dwell phase.
Exit Phase
After the train leaves the crossing and exits the detection zone, the traffic signal needs to
transition out of preemption and back into the normal operation cycle. Usually, green
signals are assigned to the movements blocked by trains before entering the normal signal
sequence.
2.2 Traffic Signal Treatments Prior to Preemption
With the development of train detection technologies, modern traffic control systems may
provide advance warning time, which is much earlier than a normal warning time (20–25 s)

14
for an approaching train. Advance warning time allows the potential to optimize traffic signal
operations at the intersections near at-grade railroad crossings before preemption to reduce
congestion and make phase transition smooth. Currently, two major traffic control
strategies have been developed: Early Warning System and Transition Preemption Strategy.
2.2.1 Early Warning System
The Early Warning System (EWS) was designed to address taking action before a train
arrives at a highway-railroad crossing to mitigate the congestion after the train passes
(Roberts and Brown-Esplain, 2005). Its basic idea is to assign “additional” green time to
traffic movements conflicting with train passing before train’s arrival, taking time from other
movements. The EWS concept has the following features (Roberts and Brown-Esplain,
2005):
Simple and inexpensive to design, build, and install
Capable of being maintained by existing maintenance technicians with little or no
new training required
Controlled by the highway agency without need for any changes to the railroad
control system
Able to maintain the time-tested safety aspects of current at-grade crossing highway
and railroad control schemes
A typical EWS has the following components (Roberts and Brown-Esplain, 2005):
Detection – The EWS detects an approaching train at a much longer distance from
the target at-grade railroad crossing. The selectable detection technologies include
Rader Detection and Time Domain Reflectometry Detection.
Prediction – The EWS predicts the time that the train would arrive at the crossing
and the time interval before clearing the crossing based on data collected by the
detection system. The prediction algorithm can be simple (assuming constant train
speed) or sophisticated (train speed in variance).
Traffic Control – The EWS interrupts the normal traffic signal cycle and allocates
green time to the movements that would be blocked by a train passing the crossing
before the train arrives. The “additional” green time is “borrowed” from the
movements that will not be blocked by the train. As the result, this strategy reduces
the delay and minimizes accidents for movements that receive “additional” green
time, but the delay may be increased for the movements from which the green time
is “borrowed.”

15
A major advantage of the EWS is that this logic can be coded into prevailing traffic signal
controllers, such as NEMA TS-2 or 2070. Modern controllers provide six or more standard
preemptions with different priorities. The highest preemption (Preemption 1) is always
linked to the standard preemption operation. The EWS algorithm assigns lower preemptions
to each leg that conflicts train traffic. As shown in Figure 2-2, a four-leg intersection
requires three preemptions to implement the EWS. The EWS triggers one of them
(Preemption 6) to start the EWS for one leg at a pre-timed operation. When this preemption
has completed, the next lower preemption will be called for the next leg. This step continues
until the last leg is timed.
R R
N
1
2
3
1 EB LT & TH – Preemption 6
2 SB LT & TH – Preemption 5
3 NB LT & TH –Preemption 4
EWS SequenceNon-EWS
Movements
44
NB LT & TH –Preemption 1
(Standard Preemption Operation)
Figure 2-2 Early Warning System Phases and Sequence
Regardless of the status of the EWS, a train arriving at a crossing will trigger the standard
preemption operation (Preemption 1) immediately. If the train arrives at the crossing earlier
than the predicted time, the standard preemption aborts the current EWS phase and enters
the track clearance time. If the train arrives at the crossing later than the predicted time,
the last EWS phase, which is usually the phase for track clearance, will continue until the
standard preemption is triggered.
However, the improvement of the Measure of Effectiveness (MOEs) with EWS was found to
not be significant in the studied case. The effectiveness of the EWS is highly dependent on

16
site geometry and vehicle/train volume. The EWS is designed to work at an individual
intersection next to a railroad crossing. No coordinated operations are considered for the
upstream or downstream intersections along a roadway corridor. Isolated operation limits
the performance of the EWS to clear through movements along the whole corridor before
train’s arrival.
2.2.2 Improved Transition Preemption Strategy
The Transition Preemption Strategy (TPS) algorithm (S. Venglar, 2000) was originally
developed by the Texas Transportation Institute (TTI) to serve the purpose of avoiding the
abbreviation of the necessary signal interval length. According to this approach, at the
upstream of the track circuitry used for the constant warning time (CWT) system, the train
is detected with an advance preemption warning time (APWT) detection system. The APWT
detection system includes several upstream Doppler radar sensors, providing the train
speed information and thus allowing the TPS algorithm to predict the train’s ETA. The TPS
algorithm begins affecting signal operations once the ETA is equal to the preset threshold
until the onset of the regular railroad crossing preemption.
In the study of the TPS, it was found that approximately 30 seconds could be used by the
algorithm, based on the location of the Doppler radar sensors. At every second of running
the TPS, the algorithm tested if the minimum green time of the current phase, the current
“Do Not Walk” (FDW) pedestrian interval, and the minimum green time of the next phase
would be satisfied by the remaining time before the onset of preemption. If the minimum
green times of both the current and next phase were not able to be served within the
remaining time, TPS omitted all other vehicular and pedestrian phases. The TPS logic was
straightforward and reduced the vehicular minimum phase abbreviations and the shortening
or omission of pedestrian FDW intervals, as confirmed in the micro-simulation environment.
A later study (Cho and Rilett, 2007) reported that one disadvantage of the TPS algorithm
was that it resulted in providing more green time than what should normally be provided to
the phases, which became the dwell phases during preemption. Since these dwell phases
are served again during train crossings, the TPS may provide excessive green time to those
phases and induce higher average intersection delays. Due to the variation of train speeds,
the preemption may start earlier or later than TPS predictions. If the preemption is
activated earlier than TPS predictions, the minimum green time of the running non-track
clearance phase according to the TPS can be violated. In such cases, the pedestrian FDW
interval is more likely to be abbreviated since it is usually longer than the minimum green
time of the vehicular phases. On the other hand, if the preemption starts later than the

17
prediction, the green time of the track clearance phase may be excessive and thus increase
the average intersection delays.
To improve mobility and safety, an Improved Transitional Preemption Strategy (ITPS) was
proposed (Cho and Rilett, 2007). The ITPS algorithm added more logic tests to the TPS
algorithm to provide more green time to the conflicting phases with train crossing (i.e., non-
dwell phases). The results showed that the ITPS improved average intersection delays
compared to the scenarios with the TPS or without any pre-preemption strategy. To
eliminate the abbreviation of the pedestrian FDW interval, ITPS simply forbade any
conflicting pedestrian movements, thereby preventing the violation on the FDW intervals.
The ITPS aims to optimize traffic signal operations at an individual intersection rather than
the whole roadway corridor. Unlike the EWS logic, the ITPS strategy works in a fully-
actuated manner—vehicle arrival detection devices at the intersection are needed to start,
extend, or terminate an ITPS phase. The logic of the ITPS strategy contains a series of
logical comparisons and judgments that may beyond the capability of standard traffic
controllers. Thus, additional calculation modules may be needed to implement the ITPS. The
ITPS logic is shown in Figure 2-3. (Source: Cho and Rilett
Figure 2-3
2.3 Highway-Rail Grade Crossing Safety Action Plan
Between 2000 and 2007, the number of highway-rail crossing crashes in Florida increased
steadily to about 100 crashes per year. Although the total number of railroad crossing
crashes began to drop in 2008, the percentage of fatal and injury crashes was still higher
than the national level. In 2010, there were 67 highway-crossing crashes in Florida, with 12
(25.5%) fatalities and 40 (59.7%) injuries. Overall in the U.S., a total of 2,004 highway-rail
crossing crashes occurred, with 261 (13.0%) fatalities and 810 (40.4%) injuries.
Table 2-1 shows the number of Florida crossing incidents for both public and private
crossing by injury severity.

18
Source: Cho and Rilett
Figure 2-3 ITPS Logic Sequence

19
Table 2-1 Florida Crossing Incidents
2000 2001 2002 2003 2004 2005 2006 2007 2008 2009 2010
Incidents 86 114 99 99 108 103 118 90 75 50 67
Fatalities 15 15 16 14 19 17 10 20 25 10 12
Injuries 67 36 32 36 35 21 35 66 30 24 40
The recently-submitted Highway-Rail Grade Crossing Safety Action Plan is a key module for
FDOT and other transportation partners to follow as an effective, efficient, and systematic
way to enhance railroad crossing safety (Florida Department of Transportation, 2011). The
plan addresses the challengeable issues in the Florida rail system and proposes the feasible
remedies under different crash types or physical conditions, as listed in Figure 2-4. Between
2006 and 2008, the majority (84%) of highway-rail crossing crashes were those occurring
at urban crossings with congested arterials. Among all the strategies, research on
coordinated preemption for urbanized areas is proposed as an important component to
enhance urban rail crossing safety as a system wide approach rather than by individual
crossings (highlighted in Figure 2-4).
Coordinated preemption will allow for communication between the traffic signals parallel to
the rail corridor and adjacent to the crossing gate. Thus, using a preemption strategy would
help create more time for downstream vehicles to clear the railroad crossing and reduce
conflicting vehicular movements that may occur at or near the crossing gates. However, to
apply this strategy on future regional and statewide corridors, research on how to
accommodate different speeds, types of trains, train locations, lengths, and impacts on the
traffic network is essential.

20
Figure 2-4 Countermeasures of Railroad Crossing Crashes from
Highway-Rail Grade Crossing Safety Action Plan

21
3 GENERIC PRE-PREEMPTION PLAN
3.1 Overview
Coordinated pre-preemption for urbanized areas is an important component for enhancing
urban rail crossing safety and mobility as a system-wide approach rather than by individual
crossings. Coordinated pre-preemption will allow for communication between the traffic
signals adjacent to the crossing gates. Thus, using a coordinated pre-preemption strategy
would help create more time for downstream vehicles to clear the railroad crossing and
reduce conflicting vehicular movements that may occur at or near the crossing gates.
One of major purposes of this project was to develop a coordinated pre-preemption plan
and recommendations for implementation via the ATMS.now platform considering various
factors and conditions. Thus, a generic coordinated pre-preemption plan based on different
scenarios is expected. State and local traffic agencies should be able to use the generic
coordinated pre-preemption plan developed from this project as a guide to implement
coordinated pre-preemptions at signals near railroad crossings. This document describes
how this generic coordinated pre-preemption plan can be applied to initiate pre-preemption
strategies at target signalized intersections in selected sections of a railroad corridor.
This chapter provides the necessary information, illustrations, and procedures for
developing a generic coordinated pre-preemption plan for implementation via ATMS.now
and other platforms. The following major sections are included:
Timeline for Traffic Signal Pre-Preemptions
Data Requirements for Implementing Pre-Preemptions
Methods to Trigger Traffic Signal Pre-Preemptions
Procedure for Development of a Coordinated Pre-Preemption Plan
Use of ATMS.now for Implementing a Coordinated Preemption Plan
Identification of Criteria for Implementing Signal Pre-preemption
Optimization of Pre-preemptions
3.2 Traffic Signal Pre-preemptions and Preemptions
A coordinated pre-preemption strategy suggests “extra” green time before train’s arrival to
through traffic along a roadway corridor intersecting a railroad. The pre-preemption
operation for through movements should work at the intersections along the roadway
corridor in a coordinated manner. If the traffic demands of other movements that are
blocked by a train are close to or higher than capacity, “extra time” should be considered for

22
assignment to these movements before train’s arrival. However, the number of pre-
preemption phases is restricted by the length of Advance Warning Time (AWT).
The coordinated pre-preemption strategy can be implemented at both preempted
intersections and non-preempted intersections. At non-preempted intersections, the
strategy will perform pre-preemption phases (coordinated phases for through movements
and/or non-coordinated phases for other movements) only. At preempted intersections, the
pre-preemption phases start first and can be terminated by a preemption that has the
highest priority.
3.3 Data Requirements for Implementing Pre-preemption
Before developing coordinated pre-preemption plans, a traffic agency must first identify and
obtain information on railroad corridors for implementing coordinated pre-preemptions and
traffic signals with preemption settings within signal system network and near the corridors.
For this project, the interests were the CSX and FEC railroad corridors and traffic signals
with preemption settings within ATMS.now network and near the railroad corridors.
3.3.1 Railroad Lines and Signal Preemption Information
The two rail lines of interest are the South Florida Rail Corridor, which is a CSX property,
and the FEC line east of I-95 and running mostly parallel to US Highway 1. The FEC line
runs through the urban central business district of the communities in the region and has
many preempted intersections along its route, as well as several zones with high
preemption concentration.
Conversely, the CSX line has relatively few preemption intersections along its line and few
zones of concentrated preemption. This is likely due to decisions made during the rebuilding
of I-95 to build many overpasses and an emphasis on removing at-grade intersections on
the passenger line.
The FEC line has many more preempted intersections in this zone than the CSX line. There
are similar zones in Pompano Beach and Deerfield Beach that have a high density of closely-
spaced preempted intersections. This is an example for the area where the preemption
strategies will have the excellent chance of being successful.
The design approach defined does include any devices requiring direct contact with railroad
infrastructure. The FEC line has many more preemption intersections than the CSX line.
Given a sufficient grouping of nearby preemptions, trains can be monitored in the corridor.
Train monitoring can include assignment of direction, estimated average speed, estimated

23
train lengths (given a long-enough monitored corridor), and an estimated location. This
train information is sufficient to generate ETAs and estimated times of departure (ETDs) at
downstream locations.
3.3.2 Railroad System-Related Information
Train approach directions, average speeds, train lengths, and locations are all the important
components. The research team estimated all these metrics since the railroad system
supplies only a relay closure when a train has a defined arrival time at an intersection.
3.3.3 Second Software
The research team considered the feasibility of using a second software system that could
extract the preemption information from ATMS.now and generate ETAs and ETDs for
downstream intersections. The software could also initiate pre-preemption at these
downstream intersections, giving extra time for vehicles to clear the grade crossing and
potentially generating traveler information messages for corridor DMS. The ATMS.now
software could be configured to log preemption times and generate reports depicting delay
times at the grade crossing. If the ATMS.now software was unable to provide this feedback,
the external software system could.
3.3.4 Detectors
Radar detectors would supplement the preemption detection and would not interface with
any railroad equipment or be on the railroad’s right-of-way. The detectors would be solar-
powered and provide non-vital advance train’s arrival information.
3.4 Methods to Trigger Traffic Signal Pre-preemptions
3.4.1 Preemption Trigger
The railroad preemption circuit provided by railway companies in a signal controller cabinet
at a signalized intersection to trigger the signal preemption is currently the only way to
detect a train in the rail corridor. This signal preemption can be monitored by the closed-
loop software ATMS.now and can be used to trigger a pre-preemption plan at traffic signals
downstream of the grade crossing where the train is detected using the preemption circuit.
Therefore, if a traffic signal does not have a railroad preemption circuit, it will not be
possible to provide train’s arrival information to trigger pre-preemption at the target
intersection(s).
Generally speaking, a signal pre-preemption can be triggered by one of the following inputs:

24
Upstream railroad preemption circuit
Upstream train detection sensors
Gate-down detection at upstream railroad crossings
Train GPS information obtained from train companies or a third party
This project focused mainly on the use of existing devices for signal preemptions, so more
consideration was given to using the trigger from the preemption circuit to determine the
presence of the train. Other pre-preemption triggers are briefly described.
Traffic signals located within a distance of 200 feet of highway-rail grade crossings will
always have preemption settings. For the purposes of this generic plan, using only the
trigger from the preemption circuit to determine the presence of the train was considered.
The usual preemption circuit uses constant warning-type circuit logic to trigger the
preemption to provide a constant warning time before the arrival of the train at grade
crossings. The constant warning time will be approximately 20–25 seconds in the case of
simultaneous preemption or a fixed interval longer in the case of advance preemption.
However, the railroad preemption circuit provides only the time of onset of preemption and
the time of release of preemption.
In some deployments, train detection devices (usually off the railroad right-of-way) have
been used. These devices provide the presence of the train, direction the train is traveling,
and train speed. These sensors are strategically located either at at-grade crossings or at
strategic locations between grade crossings. Gate-down sensors are also an option to
identify a specific action during the preemption sequence. However, even this technique
indicates only the instant the gate is down just before the arrival of the train and the instant
the train has left the grade crossing. Finally, it might be possible to obtain the train location
and speed by continuously monitoring the train location using GPS information from the
train companies. It is, however, very unlikely that train companies would provide this
information.
3.4.2 Pre-preemption Using Upstream Preemption as the Trigger
In all the algorithms discussed (other than direction), speed was a critical number.
Unfortunately, speed is never directly measured using the preemption system as data
inputs, and there will be relatively few preemption data points to use in the calculations.
Compounding that, train speeds can vary for many reasons, even when the railroad is
operating normally. Train speed is so critical that a method to measure the speed more
frequently is highly encouraged. The preemption solution requires at least two intersections

25
to derive any useful information, and the information does not become available until the
train arrives at the second intersection.
For a system using preemption to be effective:
There should be numerous preempted intersections in a linear corridor, with
intersection spacing at around ½ mile.
Along with the multitude of active intersections, the operations on the railroad line
need to be very consistent.
Trains need to maintain a more consistent, even speed and have very few reasons to
stop or exhibit erratic moves.
Areas near a railroad yard, crew change point, or an industrial area with spur tracks
that serve businesses will be problematic.
Choosing a corridor that contains a railroad passing siding will also prove
problematic, as most trains will pass through but some will stop and wait for an
opposing train in the passing siding.
For lines hosting commuter rail, a passenger station will create routine slowing,
accelerating, and waiting for commuter trains.
A double track can also complicate the procedure, where the second preempt may
initiate before the release of the first preempt.
An enhancement to the preemption-based concept could be considered. The enhancement
would use right-of-way Doppler radar detectors to directly measure the train’s direction and
speed and also to get a more precise measure of the train’s length and location. The
location is updated when the train enters the radar system’s detection area. Systems using
this approach have been deployed and are operable in Garland and Sugar Land, Texas.
3.5 Procedure for Development of a Coordinated Pre-Preemption
Plan
3.5.1 Applicability of Signal Pre-preemptions
Pre-preemption strategies can be applied when ETA is much larger than constant warning
time (CWT). The desired time gap between ETA and CWT depends on the strategies.

26
3.5.2 Calculation of ETA and ETD at Target Crossings
Simultaneous preemption and advance preemption are two types of railroad preemptions
currently in practice. Simultaneous preemption is designed when the traffic signal controller
unit and the railroad active warning devices receive notification of an approaching train
simultaneously. Simultaneous preemption is typically used where the minimum warning
time needed for the operation of the railroad active warning devices (flashing lights and
gates) is sufficiently long enough to clear stationary vehicles safely out of the crossing.
When the signal controller unit needs to receive the notification earlier than the activation of
railroad warning devices and traffic signal preemption, an advance preemption is used.
By law, railroad companies are required to provide traffic agencies with at least 20 seconds
advance warning of the train’s impending arrival at the grade crossing. However, most
railroads try to provide traffic agencies with approximately 25 seconds advance warning for
simultaneous preemption. Additional warning time (i.e., more than the required 20 seconds)
can be requested from the railroad to provide advance preemption. The usual preemption
circuit uses constant warning type circuit logic to trigger the preemption to provide a CWT
before the arrival of the train at the grade crossings. The CWT will be approximately
between 20–25 seconds.
To effectively track a train through a rail corridor, the following four characteristics of the
train need to be known:
Train direction
Train speed
Train length
Train location
If a train can successfully be tracked in the corridor, predictions can be made to estimate
the position of the train in the corridor at a future time. This prediction can generate an
estimated time of arrival of the train at a location downstream, the time a train will occupy
a grade crossing, and the time at which the crossing will be clear of the train.
3.5.3 Train Direction
For example, consider the following basic rail corridor with four grade crossings equipped
with preemption, as shown in Figure 3-1.

27
Figure 3-1 Sample Rail and Highway Corridor
The direction of the train can be determined by examining the time sequence of
preemptions. If the corridor has been dormant (no preemptions seen for a defined
extended period of time) and a preemption is seen at 1st St., the assumption can be made
that an eastbound train is arriving at 1st St. Conversely, if preemption is first seen at 4th St.
after a dormant period, a westbound train can be assumed to be arriving. Downstream
intersections will preempt in sequence to further confirm the train’s direction.
Although the logic is somewhat obvious, complications can arise due to railroad
maintenance of intersections, railroad track inspectors “high railing” (inspecting the track
via a pickup truck with special wheels to match rail width), and general railroad track
maintenance machines. In each of these cases, the railroad equipment can prematurely
activate a grade crossing and/or activate the crossing after the equipment has departed.
The situation is an anomaly, and any prediction solution must take unexpected inputs into
account and have a defined response when confusing data are detected.
3.5.4 Train Speed
The current preemption system that is accessible by the highway authority does not report
train speed. Railroads will post a maximum authorized speed for every segment of the
railroad, although a train may not travel at this speed. Additional rules reduce speed in
areas due to a variety of issues, including current condition of the railroad’s physical plant,
the commodity the train is carrying, particular equipment in a train, etc. Trains should not
exceed the maximum, but there are no rulings about traveling under the maximum. In
regions where train movement is governed by a line-side signal system (typically called
Centralized Traffic Control or CTC), the line-side signals convey movement instructions to
train crews, including speed restrictions based upon signal indication.
In the absence of an external train speed measuring device, the train speed can be
estimated as an average speed between grade crossings. A review of grade crossing design

28
documents will reveal the railroad’s grade crossing warning system (lights and gates) start
time (CWT) ahead of the train. For instance, FRA mandates a minimum of 20 seconds of
intersection activation time in the traffic signal controller before the arrival of the train. It is
very common for the railroad to add a buffer time to the mandated minimum, yielding a
warning time closer to 25 seconds. Intersections configured in this manner are said to have
simultaneous preemption. If the warning time provided is longer than the FRA minimum,
then the intersection most likely has advance preemption. Advance preemption is used at
at-grade crossings where there is a need for additional time to safely clear an intersection
ahead of the train’s arrival.
If the grade crossings in the corridor are all configured for simultaneous preemption, then
preemption in the traffic signal controller should happen approximately 25 seconds prior to
the train entering the intersection, regardless of the train’s speed. Consider the example in
Figure 3-2.
Figure 3-2 Train Average Speed Calculation
It is important to note that the beginning of preemption does not define where the train is
physically located in the corridor; rather, it defines the train’s position from the grade
crossing from a time point of view. A fast-moving train will be further away from the grade
crossing than a slow moving train at the beginning of preemption.
In the example illustrated in Figure 3-2, the train has preempted 1st St. and is occupying 1st
St. The time of activation of the preempt at the 1st St. is known and recorded. When the
train triggers the preemption at 2nd St., a second onset of preempt time will be recorded.
Again, assuming a constant train speed, the train speed estimate can be determined by
dividing the distance between the two intersections by the time differential between the two

29
preemption starts. In this example, the distance between intersections is 1 mile, and the
time differential between the onsets of preempts is 2 minutes, resulting in an average and
constant speed of 30 mph.
Figure 3-3 Continuation of Average Speed Calculation
This approach gives an average speed, but it requires the train to traverse two preempted
intersections before the initial speed is recovered. The average speed of the train can then
be updated as it passes each new preempted intersection. This is a rather crude method,
but it can deliver a speed estimate. The assumption that the train will maintain a constant
speed can be tested by reviewing a long-term record of preempt start times and
determining the likelihood that a train will follow an expected speed profile. Additionally,
the intersections need to be spaced at a reasonable distance to update the train’s speed
often. One-half-mile spacing is a good rule of thumb.
A second read on the train’s speed can be achieved by calculating the speed of the rear of
the train. As the train departs an intersection, the preempt releases. Capturing the
preempt release time at two adjacent intersections and finding the time the end of the train
took to travel from the first intersection to the second can be used in the same calculation,
as previously mentioned.

30
Figure 3-4 Average Speed Calculation Using Release of Preemption
at Successive Grade Crossings
Using this approach, each intersection pair yields two speed readings per train passage.
Another way to view this is that every intersection in the corridor, other than the first
intersection the train preempts, will provide a pair of speed readings. The first reading
comes at the start of preemption when the train is at the constant warning time start point
(e.g., 25 seconds from the intersection); the second speed data come as the end of the
train clears the intersection and preemption releases.
3.5.5 Train Length
The length of the train can be calculated by capturing the amount of preemption time the
train creates. The constant warning start time will need to be subtracted from the total
time, which yields an approximation of the time the train physically occupied the
intersection. Employing the constant speed calculated from preemption a train length can
be derived.
Train length (in ft) = (Preemption time – CWT in sec)
x (Train speed in ft/sec) (3-1)
As before, this approach relies on the train maintaining a constant speed, the grade crossing
CWT being stable, and the preemption release happening quickly after train departure.
Since there are numerous opportunities for errors to creep into the calculation the train
length should be considered a general estimate and not highly accurate.
Knowledge of the train’s length coupled with the train’s speed (or anticipated future speed
based on past history) yields expected delay durations at downstream intersections.
Train Delay Time = CWT + [(Train length in ft)
÷ (Train speed in ft/sec)] (3-2)

31
Figure 3-5 Calculation of Train Length
3.5.6 Train Location
The train’s location can be plotted by using the preempt starts to locate the train at the
CWT (typically around 25 seconds) before the intersection. Knowing the train’s speed
estimate, the train’s position upstream of the intersection can be estimated.
Train location at the onset of preemption (in ft) = CWT (in sec)
x Train speed (in ft/sec) (3-3)
A simple linear estimation process can be used to estimate the train’s location after
preemption. This solution is essentially dead reckoning until another positive location
(preemption) is detected. Using a constant speed assumption, the distance downstream is
calculated as.
Distance downstream (ft) = [(Current time – Preempt start time) – CWT]
x Train speed (in ft/sec) (3-4)
A negative result indicates the distance the train is before the preempted intersection and
will only occur if the current time is less than the preempt start time + CWT.
3.5.7 Estimated Time of Arrival
The algorithms discussed should all be continually updated as new data (preemptions) are
logged. The fresh data will generate new train speed, length, and location estimates which
can be used by other processes. For example, an ETA can be calculated by determining the
distance the train is away from the target intersection and dividing that by the train’s speed.
ETA (in sec) = Distance between train and target (in ft)
÷ Train speed (in ft/sec) (3-5)

32
This ETA calculation is for the train’s arrival in the intersection. Subtracting the downstream
intersection’s CWT yields the estimate when preemption will begin at the target intersection.
As shown in Eq. 3-5, the ETA is a function of train speed and distance. Therefore, the
accuracy of ETA is also a function of distance and speed variability (or travel time). It can
be shown that the standard deviation of ETA can be computed as:
ETA TD (3-6)
where ETA = standard deviation of ETA (s), D = distance between train and target (ft), T
= standard deviation of train travel rate (s/ft).
The travel rate is a reciprocal of train travel speed. This equation indicates that the
variability in ETA increases with the increase in distance and the variability of travel rate
(i.e., 1/travel speed).
T can be computed directly from historical data such as ATMS preemption logs. It is
recommended that the T is computed for conditions where the trains are expected to
share similar characteristics (e.g., weekday, weekend, peak, off-peak).
For example, consider the prediction of the ETA for a train at an intersection one mile
downstream of the current location. Assume that from historical data logs we have five valid
observations of travel time for this particular condition as 52, 65, 70, 45, and 58 s/mi.
Then, using standard deviation formula, T is computed to be 0.0019 s/ft. Therefore, we
can compute the standard deviation of ETA as ETA = 5280 ft × 0.0019 s/ft = 10.0 s.
With the ETA estimated, the confidence interval of ETA can be constructed by assuming
that the ETA follows a normal distribution with the mean equals to the current ETA estimate
and the standard deviation equals to the estimated ETA . For instance, using the same
example, if the current ETA is predicted to be 60 seconds, then the 95% confidence interval
of the ETA is equivalent to 60 ± 1.96( ETA ) = 60 ± 1.96(10) = 40.4 to 79.6 seconds.
3.5.8 Accuracy of Field Measurements
Train direction, speed, length, and location can be estimated based on historical data as well
as initial observations of preemption activity in the corridor. However, as mentioned earlier,
the accuracy of these estimates is based on numerous assumptions, some of which may not
be valid all the time. It is also not possible to verify the accuracy of the measurements of

33
train speed and length. Hence, predicting events that can be verified more accurately may
be warranted. The only events that can be logged as they occur are the onset of preemption
and the removal of preemption. Predicting the onset and removal of preemption can be
observed and verified directly, and, if necessary, the prediction for future events can be
fine-tuned. These events are also important because controllers employing preemption
enter into a special mode at the onset of preemption and, thus, close the window to
implement any pre-preemption strategies. Thus, knowledge of the estimated onset of
preemption and the removal of preemption is more beneficial in a pre-preemption system
using only preemption as the trigger.
3.6 Use of ATMS.now to Implement Pre-preemption
3.6.1 Procedure
This section provides guidance in the use of ATMS.now for the application of pre-preemption
at intersections being influenced by rail preemption activities. The objective is to monitor
the onset of preemption at signalized intersections near highway-railroad grade crossings to
develop and implement appropriate strategies to improve traffic operations downstream of
this grade crossing. The following procedure will need to be followed to achieve this
objective:
1. Use ATMS.now to monitor the onset of preemption in a signal controller cabinet
having preemption.
2. Send a message to the traffic management center (TMC) about the onset of
preemption using ATMS.now.
3. Continue to monitor further preemption activities along the corridor using ATMS.now.
Note that the next activity may either be a preemption OFF at the intersection where
preemption was ON, or a preemption ON at a downstream grade crossing, or a
preemption ON for a train traveling in the opposite direction (in the case of more
than one track in the corridor) at the grade crossing at the other end of the corridor.
4. Determine the estimated onset and release of preemption at downstream grade
crossings using a rail monitoring algorithm.
5. Use the strategy selection logic to determine if a pre-preemption strategy should be
applied at downstream traffic signals.
6. Continue to monitor the progress of the train at downstream signals to adjust the
estimated onset and release of preemption at downstream grade crossings.

34
7. Use ATMS.now to implement pre-preemption at downstream traffic signals.
8. Return to normal operations once it is determined that the train has left the grade
crossing.
ATMS.now has the necessary capabilities to facilitate the implementation of the pre-
preemption. Following are the steps necessary to configure ATMS.now to implement pre-
preemption. The ATMS.now server at the TMC polls the local controller to obtain status
updates. The frequency of the polling will depend on the quality of communication between
the local controller and the TMC. Factors influencing the quality include the type of
communication, fiber, twisted pair, wireless, and number of intersections on each
communication segment among others. The optimum polling is done at a frequency of one
second. However, the polling frequency can be as high as once every 6–7 seconds.
Monitoring the countdown of the offset counter or the max-out counter at the ATMS.now
server for a local intersection is a quick way to obtain the polling frequency. Figure 3-6 is a
flow chart of the use of ATMS.now to implement pre-preemption strategies using only
preemption as the trigger.
Step 1: The ATMS.now server at the TMC polls the local controller to obtain status
updates. The frequency of the polling will depend on the quality of communication
between the local controller and the TMC. Factors influencing the quality include the type
of communication, fiber, twisted pair, wireless, and number of intersections on each
communication segment, among others. The optimum polling is done at a frequency of
one second. However, the polling frequency can be as high as once every 6–7 seconds.
Monitoring the countdown of the offset counter or the max-out counter at the ATMS.now
server for a local intersection is a quick way to obtain the polling frequency. Figure 3-7
illustrates the Intersection Status Screen where the max-out timer can be monitored to
determine the frequency of polling the controller. The counter is displayed from the
Home menu and Real-Time Sub-menu and by selecting Scanning, as illustrated in Figure
3-8.
Step 2: Configure a controller alarm to monitor Preempt 1. This alarm will monitor the
onset and release of Preempt 1, which is usually reserved for rail preemption. ATMS.now
currently uses Alarm #49 (Preempt 1 Input) to monitor Railroad Preempt 1 (ATMS.now
Manual, Section 6.2.2, p. 6-148). This is done under the Definitions menu by selecting
the Alarm Notifications sub-menu and creating an alarm by selecting the particular
alarm to be enabled for notification. As illustrated, Alarm #49 is configured to monitor
Preempt 1.

35
Poll the local controllers to detect a preemption using
ATMS.now
Train Detected?
No
Train detected at first crossing?
Yes
Develop ETAs and ETDs at the rest of the
downstream grade crossings using historical data
Yes
Historical Data
Update ETAs and ETDs at the rest of the grade
crossings using real-time data
Implement Pre-Preemption Strategies using ATMS.now at downstream
intersections
Train detected at the last crossing?
No
No
Yes
Resume normal operations
Select Pre-Preemption Strategies to deploy?
Yes
No
Figure 3-6 Flow Chart for Use of ATMS.now to Implement
Pre-Preemption Strategies

36
Figure 3-7 View of Max-out Counter
Figure 3-8 Process to Select Viewing Controller Status

37
Figure 3-9 Creation of Alarm to Monitor Preempt 1 in ATMS.now
Step 3: Once a change in the status of the controller alarm is detected, the local
controller is polled to get the status of the controller alarm to determine if preemption
has occurred at the local controller. This polling will be updated in the SQL database in
the ATMS.now server at the TMC. Poll the SQL database in the ATMS.now to monitor any
change in the status of the controller alarm.
Step 4: Use controller alarm #49 to estimate the ETA and ETD of the train at the
downstream grade crossings using a rail monitoring algorithm (an external process).
Step 5: Create a list of Incident triggers in ATMS.now for various strategies that are
feasible to be deployed at downstream intersections (ATMS.now Manual, Section 6-15,
p. 6-207). Select the appropriate incident trigger and implement the trigger. Usually, the
trigger is a preempt to initiate a certain desired action. Figure 3-10 illustrates the
designation of preempts in a signal controller for various objectives and shows that
Preempt 1 is designated for Rail and Preempt 3 is designated for Emergency Service.

38
Figure 3-10 Designation of Preempts for Different Objectives
Step 6: A trigger is created in ATMS.now under the Definitions menu by selecting
Create Incident Trigger and configuring a particular trigger, as illustrated in Figure 3-11.
In this case, the trigger is to call Preempt 3, which can be configured to function as a
Pre-Preemption strategy.
This trigger is applied at different intersections by applying different values of delays to
achieve a cascading effect of the desired outcome (i.e., a pre-preemption strategy is
implemented at the intersection nearest the intersection under preemption first and then
at the subsequent intersections). This delay values are incorporated when configuring
the preemption as a pre-preemption strategy.

39
Figure 3-11 Creation of a Pre-Preemption Trigger
Step 7: Programming preempts are illustrated in Figure 3-12 and Figure 3-13. These
two screens show how to program a preempt when a pre-preemption strategy calls for
extended service for Phase 8. However, this strategy needs to be implemented about
30 seconds after a preempt is detected in adjacent intersection. Once a preempt is
detected in the adjacent intersection, a pre-preemption strategy (Preempt 3) is applied
at this intersection. The controller responds to Preempt 3 after 30 seconds and dwells in
Phase 8 until Preempt 1, which is designated for “rail is active.” Such a pre-preemption
strategy is used when a phase such as Phase 8 is severely affected due to rail
preemption.

40
Figure 3-12 Programming Preempts (Part 1)
Figure 3-13 Programming Preempts (Part 2)

41
3.6.2 Limitations
The use of the pre-preemption triggers has the following impacts on the application of pre-
preemption strategies:
A pre-preemption strategy can be applied only after a train is detected in the
preempt circuit at the first grade crossings. Thus, no strategies can be applied at the
grade crossing where the train is first detected.
Thus, for a pre-preemption trigger and a prediction using only historical data, one
upstream preemption is required. However, if accuracy in prediction is required, at
least two upstream preemptions are required to get a more accurate train speed.
If the capability to log the preemption activities is not available, historical data are
no longer available for the purpose of implementing pre-preemption. In such cases,
train characteristics observed for each train will need to be applied to estimate the
arrival and departure of that particular train. Thus, a train preemption needs to be
observed at two grade consecutive crossings using preemption to determine the
speed and the length of the train to estimate the ETAs and ETDs at downstream
grade crossings. If, however, a more capable pre-preemption system is desired,
radar detectors and a suitable communication system can be installed off the railroad
right-of-way. The communication system can transmit the train data to the TMC to
calculate the ETAs and ETDs of the train at each downstream grade crossing.
Distance between the upstream grade crossing and the target crossing where
preemption will be implemented is critical. The distance should be large enough so
that a pre-preemption strategy can be effectively implemented. Thus, traffic
engineers should have a good idea of how much time is required to effectively
implement a strategy. However, if the distance of the upstream grade crossing is too
large, errors can be made in the estimated time of arrival of the train at the target
intersection. Based on average train speeds and the typical pre-preemption
strategies, a distance of 0.5 miles between the upstream grade crossing and the
target grade crossing is recommended. However, if the train speeds and lengths are
fairly uniform, this distance may be as high as 1–2 miles.
Pre-preemption strategies can be applied at downstream intersections having rail
preemption only when the time gap between ETA and the current time is larger than
the designated CWT for that grade crossing. Thus, if two grade crossings are very

42
close to each other and preemption usually sets in simultaneously, a pre-preemption
strategy may not be possible at the downstream grade crossing.
However, at intersections that do not employ preemption, pre-preemption strategies
can be implemented before the arrival of the train can affect the intersection
operations.
The time between the detection of the train at the first grade crossings (current
time) and the ETA of the train (or impacts of the train) at downstream signals
influences the selection of preemption strategies. If the time available is a few
seconds, then tactical strategies such as phase omit, phase hold, or low priority
preempt can be deployed. Strategies such as implementation of a new signal timing
plan potentially can be implemented at an intersection near grade crossings when
more than a few minutes are available between the detection of a train and the ETA
of the train at the grade crossing near the intersection.
The duration of the preemption (preemption time)—i.e., time between start of
preempt and the end of preempt—has an impact on the type of strategies to be
implemented. If the preemption time is short (less than a minute), the impact on
traffic operations at intersections affected by rail preemption is minimal. Thus, the
necessity to implement pre-preemption is also limited. However, if the preemption
time is long (multiple minutes), appropriate pre-preemption strategies may be
applied.
The uniformity of the preemption duration also has an impact on the strategy
selection. Commuter rail systems are generally more predictable than freight rail
systems and thus make it relatively easier to predict the duration at downstream
intersections.
The strategy should not be applied when trains are arriving from both directions
concurrently on a double-tracked rail. The preemption events, in this case, can be
triggered by a train from either direction and, therefore, it is difficult to accurately
predict the ETA and ETD at the intersections.

43
3.7 Identification of Criteria for Implementing
Signal Pre-preemption
The need for a pre-preemption is decided based on traffic engineers’ judgment and different
combinations of train speeds, train lengths, traffic conditions, and the types of strategies to
be considered for pre-preemption.
3.7.1 Connection to ATMS.now
FDOT intends to use Naztec’s ATMS.now software in its complete capability. The project is
designed to use ATMS.now to obtain the information regarding the presence of a train in the
corridor as well as implementation of pre-preemption strategies. Hence, an essential
requirement is that the intersections that are being considered for pre-preemption must be
connected to the ATMS.now system.
3.7.2 Gate-Down Duration
The duration of preemption directly impacts traffic operations in the vicinity of grade
crossings. Fast-moving commuter trains with only a few coaches occupy the grade crossings
for a very short time. Such events may not warrant the implementation of pre-preemption.
However, slow-moving freight trains may occupy the grade crossings for multiple minutes.
Such trains cause greater disruption when an arterial intersects the railroad tracks, and
there are multiple traffic signals along the arterial that either have rail preemption or are
affected by train movements. Such rail movements in a densely-developed area, such as
downtown Fort Lauderdale, can cause significant hardship to motorists.
Based on simulation results, if the duration is longer than 100 seconds, the coordinated pre-
preemption strategy is suggested.
3.7.3 Traffic Characteristics
As mentioned earlier, the duration of preemption has a direct impact on traffic operations in
the vicinity of grade crossings. Larger preemption times negatively affect traffic operations
more than short preemption times. This effect is particularly noticeable more during peak
periods than off-peak periods. Thus, engineering judgment must be applied whether to
implement any pre-preemption strategies during off-peak periods, especially late at night.
Pre-preemption may result in more inefficient operations under low volume or off-peak
conditions. Similarly, preemption activity near locations experiencing special events can
cause significant disruptions when these events are in progress. However, these disruptions
may not be particularly severe when special events are not in progress. Hence, pre-

44
preemption strategies may be combined with special event planning to improve traffic
operations by minimizing the negative effects of rail preemption.
Based on simulation results, if through traffic volume along a roadway corridor is larger than
500 vehicles per lane per hour, the coordinated pre-preemption strategy is suggested.
3.7.4 Expected Train Characteristics
The type of train or characteristics of train behavior have a significant impact on the ability
to accurately predict the ETA and ETD of trains at grade crossings and, thus, the success of
any pre-preemption activities. Train behavior depends on the characteristics of the corridor.
A corridor with stations can have a significant variability in train speeds in the vicinity of
stations. Similarly, the presence of rail yards can affect trains speeds—the more consistent
the train speeds, the greater the accuracy in the prediction of the ETA and ETD of trains at-
grade crossings.
3.7.5 Presence of Preemption Settings at Intersections
Intersections that use preemption to clear vehicles off the track before the arrival of a train
always use the highest priority for rail preemption. Rail preemption preempts all existing
operations of the traffic signal controller, including any pre-preemption strategies. When
simultaneous preemption is being used, rail preemption starts anywhere between 20–25
seconds before the arrival of the train. When advance preemption is used, rail preemption
can start 30–45 seconds before the arrival of the train. Thus, the presence of rail
preemption at an intersection can reduce the time available for some preemption strategies.
On the other hand, intersections that are in the vicinity of grade crossings but that do not
use rail preemption do not have the time constraint to implement and operate the pre-
preemption strategy. This constraint has an impact on the type of pre-preemption strategy
to be employed.
3.7.6 Distance of Intersection from Railroad Crossing
The characteristics of a highway-rail grade crossing have an impact on the selection of pre-
preemption strategies. This is the case not only when the railroad tracks are very close to
the intersection and use rail preemption, but also at intersections where the tracks are
much further away and rail preemption is not warranted and not used. In such cases,
queuing studies are necessary to evaluate if queues will back up not only onto the railroad
tracks, which is very dangerous, but also into the intersection when the gates are down for

45
a long period of time. Such intersections require a special type of pre-preemption strategies
to maintain railroad safety as well as improve intersection efficiency.
3.7.7 Intersection Mode of Operation: Coordinated, Actuated, or Pre-Timed
The mode of operation of the intersection has an effect on the selection as well as the
effectiveness of pre-preemption strategies. A pre-preemption strategy will most likely
disrupt the coordinated intersections. Once the pre-preemption strategy is removed, the
traffic signal controller may take anywhere from 2–6 minutes to regain coordination.
Selection of pre-preemption strategies must be made judiciously so as to minimize the
negative effects of losing coordination during the application of the pre-preemption strategy.
3.8 Optimization of Pre-preemptions
Based on the simulation results, coordinated pre-preemptions are site-specific strategies.
The impacts of the strategies are significant at some sites for some criteria (MOEs). But at
other sites, the impacts may be not significant and may even be negative. The effectiveness
of pre-preemptions is decided by the parameters (phase type, phase sequence, phase time,
and offset time) optimized for special scenarios. Inappropriate parameters may result in
ineffective impacts on traffic operations in the roadway network.
Current traffic signal optimization packages (Transyt 7F or Synchro) do not consider special
requirements for pre-preemptions. A simulation-based optimization procedure is suggested
to optimize the parameters of pre-preemptions for various traffic scenarios before
implementing the pre-preemptions.

46
4 DEVELOPING THE METHOD FOR USING ATMS.NOW
TO REPORT AND ARCHIVE TRAIN DELAY
The research team identified the data required to determine train delay performance
measures. These data included train data, traffic data, geometric data, and signal timing
data and had to be obtained from various sources. The objective was to determine the
performance measures being generated by ATMS.now software. The following list provides
additional details of the data required:
Corridor Characteristics
o Length of the corridor
o Number of grade crossings
o Spacing between grade crossings
o Locations of train stations
o Information regarding train movements including train characteristics
Intersection Control
o Signal timing information
o Pedestrian phases
o Preemption phase sequence
o Detector information
o Mode of operation
Traffic Characteristics
o Traffic patterns along the corridor (e.g., volumes, peak-period directions, off-
peak patterns)
o Traffic composition (e.g. passenger cars, trucks, school buses)
A review of Chapters 6 and 7 of the ATMS.now Manual provided the following information.
4.1 Congestion Levels
ATMS.now determines and displays congestion levels on a GIS map. An external detector
mapping mechanism uses Wavetronix Smart Sensor HD to determine the Congestion Levels
in a segment. The Wavetronix integration provides GIS map interface for real-time “hover”
status providing volume, occupancy, and speed information to each corresponding icon on
the GIS map.
The segment editor is the tool that defines how ATMS.now collects and displays the
incoming Volume, Occupancy, and Speed data and displays them on a GIS map. Congestion

47
is displayed by drawing segment lines and associating them with approaches. Congestion at
an intersection is determined by the configuration on the Congestion tab. The user can
define and edit an intersection’s congestion level definitions for the purposes of proper
display on the Congestion layer of the GIS map, as illustrated in Figure 4-1. This section
determines the congestion levels based on the volume and occupancy as measured by the
assigned detectors. A maximum of six detectors can be assigned to each approach. Based
on these criteria, ATMS.now can assign congestion levels for an intersection into three
levels—Low (displayed in green), Medium (displayed in yellow), and High (displayed in red).
Congestion levels are also displayed for each approach as Low, Medium, and High.
Figure 4-1 Congestion Level Definitions in ATMS.now

48
4.2 Incident Triggers
ATMS.now includes incident triggers that can cause pre-programmed reactions in other
controllers. For example, the onset of a certain event in a certain controller can trigger a
well-defined sequence of events in other signal controllers specified by the user. Events
such as power-up alarm, certain patterns, congestion levels, and preemption can trigger
other controllers to behave a in a certain manner.
4.3 Summary of Report Types
ATMS.now includes numerous reports available to the user. Some of the available reports
that are applicable for this project include:
Vehicle Travel Time Report
Preemption
Real-Time Congestion Data
LOS Average by Day
LOS Hourly Day Graph
LOS Multi day Graph
Turning Movement Volume/Occupancy Report
Volume In/Out per Day
The report most applicable for determining the impact of preemption on traffic conditions is
obtained from the LOS Hourly Day Graph, as illustrated in Figure 4-2.

49
Figure 4-2 Real-Time Congestion Data Report

50
5 DEVELOPMENT OF COORDINATED PRE-PREEMPTION
STRATEGY
This chapter describes the algorithm of the coordinated pre-preemption strategy developed
in this study. The first section provides an overview on the pre-preemption system, and the
second section describes the logic of the coordinated pre-preemption strategy. A brief
comparison of the coordinated pre-preemption strategy and other pre-preemption strategies
is given in the last section.
5.1 Overview
The major purpose of this study was to develop a pre-preemption system that would
conceptually have following features (Roberts and Brown-Esplain, 2005):
Capability to detect a train approaching a railroad at-grade crossing
Capability to confidently predict the time that train arrive at the crossing
Ability to mitigate congestion caused by a train passing the crossing along the
corridor intersecting railroads
Ability to minimize the probability of vehicle-train and vehicle-vehicle collisions near
the crossing
Compatibility with existing traffic controllers and traffic management system
No need for any changes to railroad control systems
Easy and inexpensive to design, build, implement, and maintain
Functionally, a typical pre-preemption system has three components: detection, prediction,
and control strategy. The system architecture is shown in Figure 5-1.

51
Detection
Subsystem
Prediction SubsystemPrediction SubsystemTraffic
Control
Subsystem
Train Information:
Speed, Length, ...
Train
Arrival
Time
Phas
e Trigg
er
R R
Figure 5-1 Pre-preemption System Architecture
5.2 Detection Subsystem
The detection subsystem detects an approaching train at a much longer distance from a
railroad at-grade crossing than the classic train detection system. The information related to
train detection, including train speed, train length, and train location, is used by the
prediction subsystem for estimating the time of train’s arrival at the crossing. Many
technologies have been developed to detect an approaching train. The available
technologies are summarized in Table 5-1. Each technology has its advantages and
disadvantages. The selection of technology should consider the following factors:
Requirement of advance warning time
Reliability and accuracy of technologies
Implementation cost
Policy restrictions from rail companies and highway agencies

52
Table 5-1 Train Detection Technologies
Technology Location Operated
by Advantages Disadvantages
Track Circuit Rail Tracks Rail
Company
Mature technology
Reliable
Permission from rail
companies required
GPS In Train Rail Company
Track train in a continuous manner
Robust to speed
variance High accuracy
Permission from rail companies required
Radar Detector
Roadside Highway Agency
Independent of rail system
High accuracy
Collect train length and speed
Cannot provide continuous train track information
Accuracy of predicting train’s
arrival time impacted by train speed variance and detector location/number
High installation and service cost
Video Detector
Roadside Highway Agency
Independent of rail system
Collect train length and speed
Cannot provide continuous train track information
Accuracy of predicting train’s arrival time impacted by train speed variance and detector location/number
High installation and service cost
Impacted by environment
conditions
Upstream
Preemption Trigger
Traffic
Management System
Highway
Agency
No additional
permission from rail company needed
Low installation and
service cost
Cannot provide continuous
train track information Accuracy of predicting train’s
arrival time impacted by
train speed variance, upstream preemption distance, and presence of
train stations, etc. Availability of upstream
preemption trigger cannot be guaranteed
The most common existing train detection technology is the track circuitry-based warning
system, including fixed distance and CWT systems (Datta et al., 2013; Korve, 1999). A
track circuit can provide train information (speed, length, etc.) when a train enters the
range of circuit loops; however, this signal must be retrieved from the railroad control
system. In practice, it is difficult to install a communication link with railroad companies that
have the primary responsibility for operating track circuits. A GPS in-train system can
provide more accurate information of train track through a wireless network in real time;
however, this technology has the same problem as the track circuit system in practice.

53
Roadside train detection technologies (radar or video) have been used in traffic control
systems. The major advantage of these technologies is that their installation or operations
are fully independent of the railroad control system. However, due to the needs of installing
new devices in field, their initial and service costs are expensive.
Instead of installing train detectors, activations or deactivations of the preemptions at
upstream intersections along the railway corridor can be used as an indication of an
approaching train and the trigger of pre-preemptions at the target intersections. ETA can be
calculated based on the distance between the two upstream preempted intersections and
the time differences between their preemptions. Such strategies are particularly feasible if
the central signal control software can receive notices of preemption activations and
deactivations from the local controllers.
This method becomes an attractive alternative for train detection because it does not need
to install new devices or apply new permissions from rail companies. In this study, this
methodology is adopted. However, some limitations should be considered:
This method relies on the availability of preemption trigger signals at upstream
signalized intersections along railroads. In Florida, setup of preemption follows the
standards defined in the MUTCD (within the range of 200 ft to railroad crossings).
Thus, the number of preempted intersections is very limited.
Even if upstream preempted intersections are available, with an increase in the
distance between the upstream intersections and the downstream target intersection,
the accuracy of ETA decreases due to the variance of train speed.
5.3 Prediction Subsystem
Once the detection system perceives a train approaching, the prediction subsystem starts to
predict the train’s arrival time at the target railroad at-grade crossing in order to activate
pre-preemption at a proper time. The accuracy (error) of the train’s arrival time is decided
by the following factors:
Detector technology
Prediction algorithm
Detector location with respect to target railroad crossing
Train speed variance
CWT systems, assuming that train speed remains constant, are widely used to predict
train’s arrival time for traffic signal control at at-grade crossings. However, the predicted
time is always subject to error due to train speed variance. With an increase in the distance

54
of the detector to the target crossing, the accuracy tends to decrease. The accuracy of
train’s arrival time forecast can be improved by selecting robust detector technologies
(continue detection, multi-point detection, etc.) or an advance prediction algorithm
(regression, Artificial Neural Networks, etc.). These advance technologies or prediction
algorithms may need additional devices and increase implementation cost.
In this study, the prediction logic of ETA based on upstream preemption triggers is
described using an example, as shown in Figure 5-2.
Figure 5-2 Train Speed Calculation Based on Two Upstream Preemptions
Assuming the pre-preemption at intersection 3 is triggered by the deactivation of the
intersection 2 preemption, the train speed can be calculated as follows:
(5-1)
where is the speed of an approaching train and is the distance between intersections
1 and 2, and in Equation 5-1 equals the time difference between the deactivations of
preemptions at intersections 1 and 2.
As shown in Figure 5-3, the available time (Tppe) for the pre-preemption at intersection 3
equals the time difference between the preemption deactivation at intersection 2 and the
preemption activation at intersection 3. Therefore, the following relationship can be
established:
( ) (5-2)
Preemption 1
Deactivation Preemption 2
Deactivation
Intersection 1 Intersection 2 Intersection 3
L1-2
Train Moving Direction

55
where is the distance between intersection 2 and 3; represents the available time
that can be used to serve the pre-preemption strategies; is the constant warning time
duration at intersection 3; equals the width of intersection 3; and is the train length.
Figure 5-3 Calculation of Available Time for Pre-preemption
As shown in Figure 5-4, the train length can be extracted based on the time difference
between the activation and deactivation of preemption at intersection 2. The equation to
calculate the train length is presented below:
( ) (5-3)
where is the preemption time duration at intersection 2; indicates the constant
warning time duration at intersection 2; and equals the width of intersection 2.
Preemption 2
Deactivation Preemption 3
Deactivation
Intersection 1 Intersection 2 Intersection 3
L2-3
CWT 3
Deactivation
Preemption 3 &
CWT 3 Activation
Tppe×Vt
CWT3×Vt
Train Moving Direction
Lt
Lw3

56
Figure 5-4 Train Length Calculation Based on Upstream Preemptions
Combining Equations 5-1, 5-2, and 5-3, the available time for pre-preemption can be
calculated by Equation 5-4:
( )
(5-4)
Although the theory that available time can also be calculated using the relationship
between the activations of upstream preemptions, instead of using the deactivations at the
two intersections as it used in the equations above, the uncertainty of the train position at
the time of preemption activations due to the variation of the train speeds makes it difficult
to obtain a reliable outcome.
5.4 Control Subsystem
The control subsystem is the core module of the pre-preemption system. The operation of
the control subsystem is activated when the predicted train’s arrival time (ETA) is equal to
or less than a critical value (up to the advance warning time). Once the control subsystem is
initialized, the normal phases at target intersections will be interrupted, and one or more
pre-preemption phases will be conducted, including:
Before Train’s arrival – The pre-preemption system provides “extra” green time
before train’s arrival to special movements. The “extra” green time could clear the
traffic volumes blocked during train passing the crossing in order to mitigate
congestion during train blockage. In this report, the “extra” green time is referred to
as congestion-clearance or pre-preemption phases. These special phases are
Train Moving Direction
Preemption 2
Deactivation
Intersection 1 Intersection 3
Preemption 2
& CWT 2
Activation
CWT 2
Deactivation
Tp2×Vt
CWT2×Vt
Intersection 2
Lw2
Lt

57
assigned to the “conflicting” movements or a subset of them based on the
optimization objectives of the pre-preemption strategy.
During Train Blockage – During the period of a train passing a crossing, the
“conflicting” movements are blocked by a train. Thus, the general strategy is to
assign green time to the movements that do not conflict with the train during this
period. If the intersection is far from the crossing, the traffic signal may operate in a
normal mode since the storage space between the crossing and the intersection is
large enough.
After Train Blockage – After the train leaves the railroad crossing, the general
strategy is to assign green time to the movements blocked by the train movement
for dissipating the queues that occurred in the train passing duration as soon as
possible.
At the preempted intersections, the pre-preemption strategy is an extension of the
traditional preemption strategy. In general, the two operations (pre-preemption and
preemption) have independent triggers: the preemption operation is always assigned the
highest priority, followed by the pre-preemption operation. The pre-preemption operation
starts earlier than the preemption operation; the preemption operation terminates the pre-
preemption operation at any time when the traffic controller receives a preemption trigger
signal. Afterwards, the preemption operation conducts the track clearance phase (before
train’s arrival), dwell phases (during train blockage), and exit phases (after train blockage),
respectively.
At a non-preempted intersection next to a crossing, the pre-preemption strategy can be
operated individually. The congestion-clearance phases (pre-preemption phases) are
triggered and operated in the same manner as at the preempted intersection. The following
phases (track clearance, dwell, and exit) are optional phases, according to traffic and
geometric conditions. They can be triggered by the release of the pre-preemption phases or
disabled at this intersection.
At the intersections that are close to but not next to a crossing, the pre-preemption strategy
is used for coordinated congestion clearance purposes. Thus, the pre-preemption strategy
includes the “extra” green time assigned to the coordinated phase only.
As summarized in Chapter 2, two ideas have been developed for optimizing signal
operations before preemption at the intersections adjacent to a railroad crossing: pre-timed
(EWS) or dynamic (ITPS). Both of these algorithms do not consider coordination in clearing

58
congestion along a roadway corridor. In this study, a coordination-based pre-preemption
strategy was developed to optimize the safety and operational performance of a roadway
corridor intersecting railroad.
5.5 Coordinated Pre-preemption Strategy
The basic idea of the coordinated pre-preemption strategy is to assign “extra” green time to
the movements at several intersections along a roadway corridor that intersects a railroad
before train’s arrival. The “extra” green time (congestion clearance phase) allows through
traffic to be cleared on the arterial before train’s arrival. To maximize the opportunity, the
“extra” green time should be coordinated at intersections along the roadway corridor. The
pre-preemption phases work at a pre-timed mode because (1) it is the requirement of
coordination and (2) it can easily be coded into existing traffic controllers. Except for the
coordinated pre-preemption phase, the coordinated pre-preemption strategy may provide
non-coordinated phases for clearing other movements before train’s arrival if there is a
potential for congestion due to train blockage. The phases of track clearance, dwell phases,
and exit phases should be considered at the intersection next to the crossing if the storage
space between the intersection and the crossing is short, even if the intersection is not
preempted.
Examples of the coordinated pre-preemption strategy are shown in Figure 5-5, Figure
5-6,Figure 5-4Figure 5-7, and Figure 5-8.
As shown in Figure 5-5, a railroad intersects an arterial that carries heavy vehicle
traffic on westbound (WB). Severe congestion and long queues may occur along this
direction, caused by a train passing the crossings during peak hours.
Three signalized intersections (Intersections A, B, and C) along the arterial are
impacted by the crossing. All the three intersections have standard NEMA 8 phases.
Intersection B is a preempted intersection, and the distance between this
intersection and the crossing is less than 200 feet. The track clearance phase is
Phase 1-6. Dwell phases are 3-8, 4-8, and 5 in an actuated manner. The exit phases
are 1-6 and 2-6.
The coordinated pre-preemption strategy provides “extra” green time for the through
movement at the three intersections before train’s arrival. The congestion clearance
phase is 2-6 in a coordinated manner: Phase 2-6 starts at the sequence of
Intersection A –> Intersection B –> Intersection C.

59
The sequence of the coordinated pre-preemption is as follows (as shown in Figure
5-6) :
o When pre-preemption is triggered by detecting a train approaching, the
coordinated pre-preemption phase (Phase 2-6) is activated at Intersection A
after a system delay.
o After a given offset (Offset A-B), the coordinated pre-preemption phase
(Phase 2-6) starts at Intersection B.
o After a given offset (Offset A-C), the coordinated pre-preemption (Phase 2-6)
starts at Intersection C.
o When the coordinated pre-preemption phase is completed, traffic signals at
Intersections A and C go back to normal phases.
o When the preemption is triggered at Intersection B, the coordinated pre-
preemption phase (Phase 2-6) is terminated and the track clearances phase
(Phase 1-6) is activated.
o When the train arrives at the crossing, the track clearance phase is
terminated and the dwell phases start at Intersection B at a sequence of
Phase 3-7 -> Phase 4-8 -> Phase 5. Dwell phases work in an actuated
manner.
o When the train leaves the crossing, dwell clearance phases are terminated
and exit phases start at Intersection B at a sequence of Phase 1-5 -> Phase
2-6.
o After the exit phases, the traffic signal at Intersection B goes back to a
normal phase.
If the left-turn demand on westbound Intersection B is too high and exceeds the left
bay during the period of congestion clearance, Phase 2-5 for clearing this traffic will
be added as a coordinated pre-preemption phase before Phase 2-6, as shown in
Figure 5-7.
If traffic demand for the movements on minor roads (e.g., the left-turn movement on
northbound Intersection B, as shown in Figure 5-5) is high, a clearance phase (Phase 3-7 or
Phase 4-7) may be provided as the first pre-preemption phase (non-coordinated) before the
coordinated pre-preemption phases, as shown in Figure 5-8.

60
R R
Intersection CIntersection B
(Preempted) Intersection A
521
6
38
7 4
Commuter Traffic Direction
Legend
Arterial Minor Roads
Signalized
IntersectionR R
At-grade Railroad
Crossing
5
2STD 8
Phases
STD 8
Phases
521
6
38
7 4
521
6
38
7 4
Figure 5-5 Example Site for Pre-preemption Strategy

61
Start Phase 2-6
Receive Pre-preemption Trigger
End Phase 2-6
Start Phase 2-6
End Phase 2-6
Start Phase 1-6
Start Phase 2-6
End Phase 2-6
End Phase 1-6
Start Phase 3-7
End Phase 5
Start Phase 1-5
End Phase 2-6
Con
gestio
n C
leara
nce P
hases
Norm
al P
hases
System DelayNorm
al P
hases
Con
gestio
n C
leara
nce P
hases
Tra
ck
Clea
ran
ce
Ph
ase
Dw
ell Ph
ases (3
-7 >
4-8
> 5
)E
xit P
hases (1
-5 >
2-6
)
Norm
al
Ph
ases
Con
gestio
n C
leara
nce P
hases
Norm
al P
hases
Norm
al P
hases
Receive Preemption Trigger
Train Leaves the Crossing
Train Arrives at the Crossing
Offset A
-B
Offset A
-C
Intersection AIntersection BIntersection C
Tim
e Lin
e
Western Bound (Commuter Traffic Direction)B
efore T
rain
Arriv
al
(Ad
van
ced W
arn
ing T
ime)
Du
ring
Tra
in B
lock
ag
e
(Du
ratio
n o
f Tra
in B
lock
ag
e)
After T
rain
Blo
cka
ge
Figure 5-6 Pre-preemption Timeline
(one coordinated pre-preemption phase at Intersection B)

62
Start Phase 2-6
Receive Pre-preemption Trigger
End Phase 2-6
Start Phase 2-5
End Phase 2-6
Start Phase 1-6
Start Phase 2-6
End Phase 2-6
End Phase 1-6
Start Phase 3-7
End Phase 5
Start Phase 1-5
End Phase 2-6
Co
ord
ina
ted C
on
gestio
n C
leara
nce P
ha
sesN
orm
al P
ha
ses
System DelayNo
rma
l Ph
ases
Co
ord
ina
ted C
on
gestio
n C
leara
nce P
ha
ses
Tra
ck
Clea
ran
ce
Ph
ase
Dw
ell Ph
ases (3
-7 >
4-8
> 5
)E
xit P
ha
ses (1-5
> 2
-6)
No
rma
l
Ph
ases
Co
ord
ina
ted C
on
gestio
n C
leara
nce P
ha
sesN
orm
al P
hases
No
rma
l Ph
ases
Receive Preemption Trigger
Train Leaves the Crossing
Train Arrives at the Crossing
Offset A
-B
Offset A
-C
Intersection AIntersection BIntersection C
Tim
e Lin
e
West Bound (Commuter Traffic Direction)
Befo
re Tra
in A
rriva
l
(Ad
va
nced
Wa
rnin
g T
ime)
Du
ring
Tra
in B
lock
ag
e
(Du
ratio
n o
f Tra
in B
lock
ag
e)
After T
rain
Blo
cka
ge
End Phase 2-5
Start Phase 2-6
Figure 5-7 Pre-preemption Time Line
(two coordinated pre-preemption phases at Intersection B)

63
Start Phase 2-6
Receive Pre-preemption Trigger
End Phase 2-6
End Phase 3-7
Start Phase 2-6
End Phase 2-6
Start Phase 1-6
Start Phase 2-6
End Phase 2-6
End Phase 1-6
Start Phase 3-7
End Phase 5
Start Phase 1-5
End Phase 2-6
Co
ord
ina
ted C
on
gestio
n C
leara
nce P
ha
sesN
orm
al P
ha
ses
System Delay No
rma
l
Ph
ases
Co
ord
ina
ted C
on
gestio
n C
leara
nce P
ha
ses
Tra
ck
Clea
ran
ce
Ph
ase
Dw
ell Ph
ases (3
-7 >
4-8
> 5
)E
xit P
ha
ses (1-5
> 2
-6)
No
rma
l
Ph
ases
Co
ord
ina
ted C
on
gestio
n C
leara
nce P
ha
sesN
orm
al P
ha
sesN
orm
al P
ha
ses
Receive Preemption Trigger
Train Leaves the Crossing
Train Arrives at the Crossing
Offset A
-B
Offset A
-C
Intersection AIntersection BIntersection C
Tim
e Lin
e
Western Bound (Commuter Traffic Direction)
Befo
re Tra
in A
rriva
l
(Ad
va
nced
Wa
rnin
g T
ime)
Du
ring
Tra
in B
lock
ag
e
(Du
ratio
n o
f Tra
in B
lock
ag
e)
After T
rain
Blo
cka
ge
Start Phase 3-7
Non
-Coord
inated
Con
gestio
n
Clea
ran
ce Ph
ase
Figure 5-8 Pre-preemption Timeline
(one non-coordinated phase and one coordinated phase at Intersection B)

64
The design of pre-preemption strategy should consider the following elements:
length of coordinated congestion clearance phase
offset of coordinated congestion clearance phase
number and sequence of coordinated and non-coordinated clearance phases at the
preempted intersection
The sum of offset, congestion clearance phases (coordinated and non-coordinated), and
track clearance phase cannot exceed the advance warning time (AWT). The optimization of
the congestion clearance phases (number, length, offset, and sequence) should considering
commuter traffic demand, traffic demand of minor movements blocked by train, site
geometry, and duration of train blockage.
5.6 Comparison
A comparison between the coordination pre-preemption strategy and other pre-preemption
strategies is shown in Table 5-2.
Table 5-2 Summary of Pre-preemption Strategies
Strategy Logic Required
Preemption
Control
Type
Arterial
Coordination
Compatibility with
Standard Traffic
Controller
Effectiveness
ITPS-based Complex Yes Actuated No
Poor (additional
logic module may be needed)
Good at
individual intersection
EWS Simple Yes Pre-
timed No Excellent Unproved
Coordinated Pre-
preemption Simple No
Pre-timed
Yes Excellent Good for
arterial and network

65
6 DEVELOPMENT OF SIMULATION MODEL
This chapter describes the VISSIM-based simulation model developed in this study for
evaluating safety and operational performance of the coordinated pre-preemption strategy.
The first section introduces three control sections for model development. The second
section explains the procedure of data collection and data reduction. The procedure of
model development is described in Section 3; the last section illustrates the methodology of
data analysis.
6.1 Site Selection
6.1.1 Selection Criteria
The research objective of this study requires a set of sites with different geometric and
traffic conditions to testify the coordinated pre-preemption strategy. A careful selection of
study sites (control sections) along the railroad corridors in south Florida area was made
according to the following criteria:
Each control section contains one railroad corridor.
Roadway corridors (arterials) intersect the railroad corridor at at-grade railroad
crossings.
Roadway corridors have high traffic volume during peak periods.
Roadway corridors and adjacent signalized intersections are impacted by the at-
grade railroad crossings.
Preempted intersections are available in the control section.
The ATMS.now system is available at the sites.
Traffic volume on the roadway corridor had to be sufficiently high to evaluate the
performance measures before and after the coordinated pre-preemption strategy. Corridors
with low traffic volume were not considered potential sites because of their relatively low
congestion level and minor impact from the pre-preemption strategy. In this study,
upstream preemptions were required as the trigger for pre-preemption. Therefore, one of
the main requirements of selecting sites was to make sure that the upstream preemption
was available. Also, the selected sites had to be under the coverage of the ATMS.now
system.
6.1.2 Selected Control Sections
Based on these criteria, three control sections were selected from the road network in
Broward County, Florida. Section I contains six at-grade railroad crossings along the FEC

66
Railway. Six arterials intersecting the FEC rail corridor at these crossings, from SW 24th St
(South) to NE 13th St (North). In total, 18 signalized intersections next to or impacted by
the crossings were included in this section, and one was preempted (W Sunrise Blvd @ N
Flagler Dr). Table 6-1 summarizes the configuration of Section I. Figure 6-1 shows the
control sections.
Table 6-1 Summary of Control Section I
FDOT Crossing
ID
Crossing Road
Intersection
Distance to
Crossing
(ft)
Intersection ID
Preempted (Y/N)
Coordinated (Y/N)
272567 SE 24th St
S Andrew Ave @
SE 24th St 570 2129 N Y
SW 4th Ave @ SW 24th St
1562 2142 N Y
272564 SE 17th St
S Andrew Ave @ SE 17th St
269 2060 N Y
SW 4th Ave @ SW 17th St
1140 2099 N Y
272562 Davie
Blvd
S Andrew Ave @ Davie Blvd
710 2095 N Y
SW 4th Ave @ Davie Blvd
1000 2089 N Y
272556
W
Broward
Blvd
Brickell Ave @ W Broward Blvd
285 2133 N Y
S Andrew Ave @
W Broward Blvd 660 2054 N Y
NW 5th Ave @ W Broward Ave
992 2288 N Y
NW 7th Ave @ W Broward Ave
1600 2071 N Y
272549 W Sunrise
Blvd
N Flagler Dr @ W Sunrise Blvd
185 2101 Y Y
N Federal Hwy @ W Sunrise Blvd
876 2027 N Y
NE 9th Ave @
W Sunrise Blvd 1330 2208 N Y
NE 10th Ave @ W Sunrise Blvd
1636 2209 N Y
NE 4th Ave @ W Sunrise Blvd
491 2138 N Y
272548 NE 13th
St
NE 15th Ave @ NE 13th St
1436 2032 N N/A
NE 7th Ave @ NE 13th Ave
1140 2167 N N/A

67
Figure 6-1 Control Sections in Broward County, Florida
Section III
Section II
Section I

68
Section II contains two at-grade railroad crossings along the FEC corridor. Two arterials (NE
26th St and Oakland Park Blvd) intersect the railroad corridor at the two crossings. Four
signalized intersections are included in this control section. Table 6-2 gives the
configuration of Section II.
Table 6-2 Summary of Control Section II
Crossing ID
Crossing Road
Intersection
Distance to
Crossing
(ft)
Intersection ID
Preemption (Y/N)
Coordinated (Y/N)
272545 NE 26th St
NE 15th/16th
Ave @ NE 26th St
1440 2204 N N/A
N Dixie Hwy @ NE 26th St
279 2201 N N/A
272544 E Oakland Park Blvd
NE 16th Ave @ E Oakland Park
Blvd
1737 1112 N Y
N Dixie Hwy @ E Oakland Park
Blvd
84 1113 Y Y
The summary of Section III is given in Table 6-3. Three at-grade crossings are contained in
this section from Oakland Park Blvd (South) to Commercial Blvd (North). The rail corridor is
parallel to an interstate (I-95), and two preempted intersections connect ramps of I-95 at E
Oakland Park Blvd and Commercial Blvd. Another preempted intersection is NW 9th Ave at
W Prospect Rd.

69
Table 6-3 Summary of Control Section III
Crossing ID
Crossing Road
Intersection
Distance to
Crossing
(ft)
Intersection ID
Preemption (Y/N)
Coordinated (Y/N)
628191 E Oakland Park Blvd
I-95 EXIT 31 SB OFF Ramp @
E Oakland Park Blvd
311 1089 Y Y
I-95 EXIT 31 NB OFF Ramp @
E Oakland Park
Blvd
855 1089 N Y
I-95 EXIT 31 NB ON Ramp @
E Oakland Park Blvd
1367 1089 N Y
NW 18th Ave @ E Oakland Park
Blvd 1642 1193 N N/A
628188
W
Prospect Rd
NW 9th Ave @ W Prospect Rd
200 1105 Y Y
NW 10th Ave @ W Prospect Rd
526 1545 N Y
628186
W Commerci
al Blvd
I-95 EXIT 32 SB Ramps @
W Commercial
Blvd
200 1088 Y Y
I-95 EXIT 32 NB
Ramps @ W Commercial
Blvd
654 1088 N Y
NW 9th Ave @ W Commercial
Blvd 644 1132 N Y
6.2 Data Collection
Various data were collected for the selected control sections, including site geometries,
vehicle traffic, train information, etc.
6.2.1 Site Geometries
Geometric information was collected for each control section at three levels: railway, arterial,
and intersection. Researchers reviewed FDOT GIS maps and high quality aerial photos to
retrieve the geometric information. Collected data and associated data sources are listed in
Table 6-4.

70
Table 6-4 Data Collection at Control Sections
Object Collected Data Source
Railway Number of tracks Aerial Photo
Track width Aerial Photo
Distance between at-grade crossings along railroad corridor FDOT GIS Map
Arterial Number of lanes FDOT GIS Map
Lane width FDOT GIS Map
Speed limit FDOT GIS Map
Distance between intersections along arterial FDOT GIS Map
Length of arterial FDOT GIS Map
Intersection Lane configuration Aerial Photo
Length of storage bay Aerial Photo
Location of traffic signal Aerial Photo
Location of loop Aerial Photo
Distance to railroad crossing FDOT GIS Map
6.2.2 Traffic Data
To build simulation models, the counts of turning movements at the selected intersections
were needed in this study. Due to time and budget limitations, data collection in the field
was not conducted in this study. Researchers retrieved the intersection turning movement
counts from existing data sources, such as from FDOT, Broward County, and others. All
traffic data were collected during peak hours (7:00–9:00 AM, 11:00 AM–1:00 PM, and 4:00–
6:00 pm) for three days. The time span was four years (2009, 2010, 2011, and 2012).
Figure 6-2 is an example of the traffic count form.
6.2.3 Traffic Signal Data
Traffic signal information for each selected intersection was extracted from the Broward
County traffic engineering database. Figure 6-3 shows an example of actuated traffic signal
timing sheet. Each timing sheet contains the following information:
Identification Information – intersection ID, controller type, intersection name
Vehicle Phase Information – minimum green time, yellow clearance, all red clearance,
vehicle extension, maximum green time
Pedestrian Phase Information – walk time, pedestrian clearance
Preemption Information – enable or not; preemption sequence, phase timing
The coordination timing data for the coordinated intersections were retrieved from the
Broward County Traffic Engineering database, including coordinated phase number, cycle
length, and offset time. Figure 6-4 gives an example of the coordination time table.

71
Figure 6-2 Example of Intersection Movement Counts

72
Figure 6-3 Example of Actuated Traffic Signal Timing Form

73
Figure 6-4 Example of Coordination Timing Form
6.2.4 Train Traffic Data
In additional to vehicle traffic information, the following train traffic information was needed
to evaluate the performance of the proposed pre-preemption strategy:
Duration of a train passing an at-grade railroad crossing
Headway between successive trains
Speed distribution of trains
Train length
However, the information was difficult to obtain from the railroad companies (FEC, CSX).
Therefore, preemption logs retrieved from the Broward County ATMS.now system were used
to estimate train traffic data. The methodology was introduced in Chapter 4. Figure 6-5 is
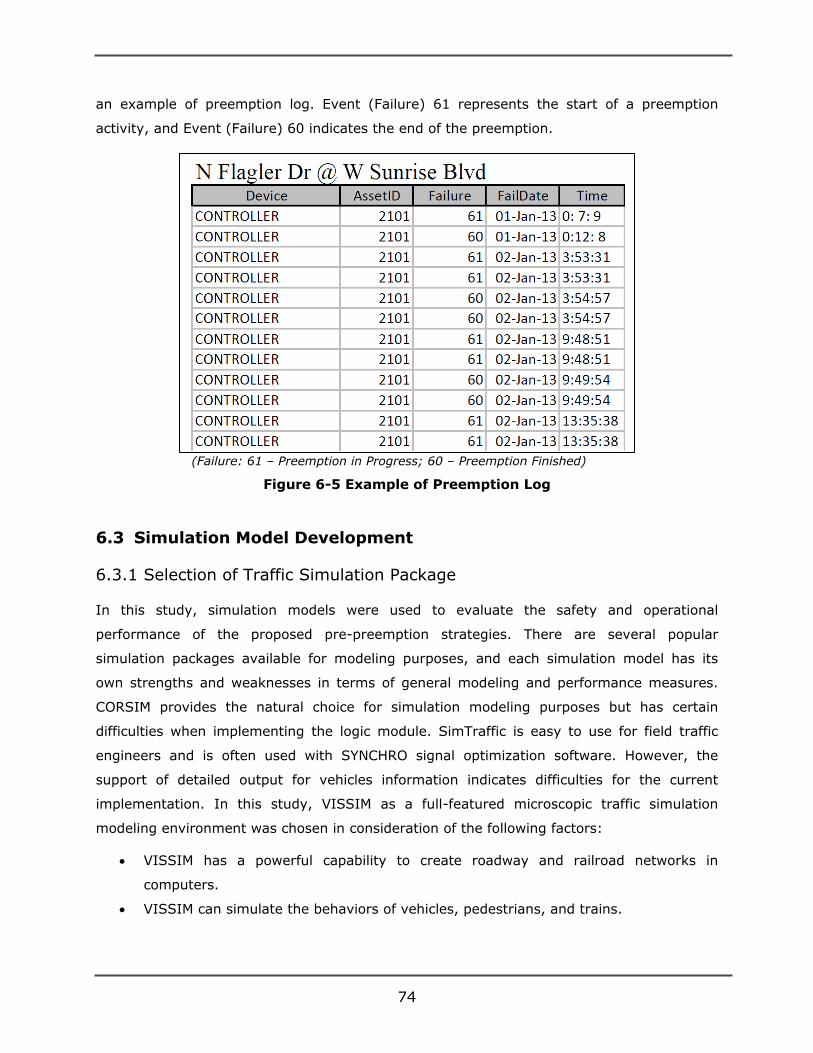
74
an example of preemption log. Event (Failure) 61 represents the start of a preemption
activity, and Event (Failure) 60 indicates the end of the preemption.
(Failure: 61 – Preemption in Progress; 60 – Preemption Finished)
Figure 6-5 Example of Preemption Log
6.3 Simulation Model Development
6.3.1 Selection of Traffic Simulation Package
In this study, simulation models were used to evaluate the safety and operational
performance of the proposed pre-preemption strategies. There are several popular
simulation packages available for modeling purposes, and each simulation model has its
own strengths and weaknesses in terms of general modeling and performance measures.
CORSIM provides the natural choice for simulation modeling purposes but has certain
difficulties when implementing the logic module. SimTraffic is easy to use for field traffic
engineers and is often used with SYNCHRO signal optimization software. However, the
support of detailed output for vehicles information indicates difficulties for the current
implementation. In this study, VISSIM as a full-featured microscopic traffic simulation
modeling environment was chosen in consideration of the following factors:
VISSIM has a powerful capability to create roadway and railroad networks in
computers.
VISSIM can simulate the behaviors of vehicles, pedestrians, and trains.

75
VISSIM supports many functions of traffic signal operations, including traffic
controllers, display traffic signals, vehicle/train detectors, and feedback mechanisms.
VISSIM can develop user-defined traffic signal logics using the Vehicle Actuated
Programming (VAP) module. This feature is very important to study non-standard
traffic signal controls, such as pre-preemption strategies.
6.3.2 Procedure for Simulation Model Development
Micro-simulation models generate a significant amount of detail on network-wide and
corridor-wide performance that are critical for conducting a before and after study. In this
study, the VISSIM-based simulation models were developed to evaluate the safety and
mobility impacts of the “pre-preemption” strategy. Three control sections in Broward County
were selected for data collection and calibration. VAP language was used to code the “pre-
preemption” algorithms using the VisVAP tool. Figure 6-6 illustrates the procedure of
VISSIM-based model development.
VISSIM
Basic
Inputs
Static Data
Dynamic Data
Different input
VISSIM Model DevelopmentCorridor
(multi-intersections)
Setting & scaling a background image
Drawing links & connectors
Vehicle inputs & routing decisions
Speed limits & reduced speed areas
Priority rules & traffic control data
Pre-preemption
Strategy coded in
VAP
Multi-run
Before
Measure of Effectiveness (MOEs)
Network Performance (.npe) Selected
VISSIM
Outputs Table of Travel Times (.rsz)
Queue Length Record (.stz)
Table of Delay (.vlz)
Network Performance (.npe)
Table of Travel Times (.rsz)
Queue Length Record (.stz)
Table of Delay (.vlz)
Compare
After
Train Speed & PT lines for Train
Figure 6-6 Procedure of VISSIM-Based Simulation Model Development

76
The accuracy of a traffic simulation model is mainly dependent on the quality of the vehicle
modeling, such as the methodology of moving vehicles through the network. There are two
kinds of data required for establishing a VISSIM network: (1) static data, representing the
roadway infrastructure, which include links with start and end points, link length, width,
grade, lane number, and location of stop lines, etc., and (2) dynamic data, required for
traffic simulation applications, which includes traffic volumes for all links entering the
network, and traffic volumes entering and for different turn directions at each intersection;
vehicle routing, departure times and dwell times; and priority rules and signal timing plans
at intersections, etc. The details of VISSIM data inputs for both static and dynamic data are
discussed in the following subsections.
6.3.3 Coding Network
In this study, a high-resolution digital map (aerial photo) of Broward County in the
Seamless Image Database (SID) format was imported and scaled into VISSIM as a
background image. Researchers traced the roadway lanes and railroad tracks on the map to
sketch the roadway network and railroad network by links and connectors. The properties of
links and connectors, such as unique identifier, name/label, number of lanes, link length,
behavior type, display type, and direction of traffic, were input by researchers.
Traffic volumes were coded for each link and each time interval in vehicles per hour, even if
the time intervals were different by one hour. If the defined traffic volume exceeded the link
capacity, the vehicles were stacked outside the network until space was available again.
Besides the traffic volumes, the routing decisions were coded for turning movement counts
in the VISSIM network. In this study, the static routes were used to define the percentages
for different turning movements (i.e., left-turn, through, and right-turn) at intersections
along the corridor.
In this study, the collected speed limits were assigned to each approach by using desired
speed decisions. For turning vehicles, their speeds were reduced to 15 mph for left-turn and
9 mph (by defining reduced speed arrears on the turning connectors) for right-turn
movements.
“Train” was coded as a new type of vehicle in the Vehicle Types window in VISSIM. Desired
speed distributions were configured as minimum and maximum values for the desired train
speed. A PT line was then used in VISSIM to model the train movement on a dedicated
route, which served a fixed sequence according to a timetable time.

77
6.3.4 Coding Controllers
In this study, all traffic signal controllers (gate controller at railroad crossings and traffic
signal controller at intersections) were coded in VAP using the VisVAP tool. The railroad
crossing gate controller represents the operation of a crossing gate in the real world. A
train-in detector was located at an upstream location 4,000 feet from the crossing. Once a
train head is detected by the detector, the arrival time estimation module starts to judge if
the ETA is equal to or less than the CWT (25 seconds). If answer is “yes,” the crossing gate
controller displays blockage phase (red signal to vehicle traffics at the crossing) to simulate
“gate down.” Once the train end is detected by a train-out detector located at the crossing,
the signal returns to normal status (green signal to vehicle traffic at the crossing) to
represent “gate up.” The logic of the crossing gate controller is given in Figure 6-7.
Traffic signal controllers were coded in VISSIM for the combination of two different
intersection types and three logic modes, as shown in Table 6-5. Normal mode represents
the logic of a controller working at a normal status. For each selected intersection, the
normal logic was coded according to the traffic timing table and/or coordination table
collected in Broward County. The preempted mode, adding a preempted logic on a normal
mode, represents the logic of a traffic controller working at preemption status. Only the
intersections next to a crossing are valid for coding preempted logic.
At a preempted intersection, the pre-preemption logic is activated by the trigger signal from
an upstream train-in detector after a given coordination offset time. The pre-preemption
logic can be terminated by the activation of the preemption logic or the exhaustion of the
predefined phase time and followed by the track clearance phase, dwell phase(s), and exit
phase(s). A detailed description of the pre-preemption logic can be found in Figure 6-8.
For a non-preempted intersection next to a crossing (e.g., distance to the crossing ≥ 200ft),
the pre-preemption mode adds the pre-preemption logic on the normal signal logic, as
shown in Figure 6-9. The track clearance phase, dwell phase(s), and exit phase(s) are
automatically activated after the pre-preemption phases, if these phases are applicable.
For an intersection adjacent to, but not next to, a crossing, the pre-preemption logic
includes the coordinated pre-preemption phase only (Figure 6-10). Once the coordination
phase is finished, the controller will return to normal status.

78
ETA = Distance of Train-In Detector / Train Speed
ETA <= CWT (25s)?
Blockage Phase
(Red to Vehicle Traffic at Crossing)
YES
NO
Normal Phases
(Green to Vehicle Traffic at Crossing)
Detect A Train Approaching ?
YES
NO
Detect a Train Leaving?
YES
NO
Figure 6-7 Logic of Crossing Gate Controller in VISSIM
Table 6-5 Traffic Controllers Coded in VISSIM
Intersection Next to
a Crossing
Intersection Near but Not Next to
a Crossing
Normal × ×
Preempted × N/A
Pre-preempted × ×*
* Coordinated pre-preemption phase only

79
ETA = Distance of Train-In Detector / Train Speed
ETA<=CWT?
Start Track Clearance Phase
YES
ETA<=AWT-OFFSET?NO
NO
Start Coordinated Pre-Preempted Phase
YES
Start Dwell Phases
Detect Train Leave?
Start Exit Phases
Normal Phases
Detect A Train Approaching?
YES
NO
Start Non-Coordinated Pre-Preempted Phases
If Applicable
Figure 6-8 Pre-preemption Logic for Preempted Intersection Coded in VISSIM

80
ETA = Distance of Train-In Detector / Train Speed
Start Track Clearance Phase
ETA<=AWT-OFFSET?
Start Coordinated Pre-Preempted Phase
Start Dwell Phases
Detect Train Leave?
Start Exit Phases
Normal Phases
Detect A Train Approaching?
YES
NO
Start Non-Coordinated Pre-Preempted Phases
(If Applicable)
Figure 6-9 Pre-preemption Logic for Non-Preempted Intersection
Next to a Crossing Coded in VISSIM

81
ETA = Distance of Train-In Detector / Train Speed
ETA<=AWT-OFFSET?
Start Coordinated Pre-Preempted Phase
Normal Phases
Detect A Train Approaching?
YES
NO
Figure 6-10 Pre-preemption Logic for Intersection
Not Next to a Crossing Coded in VISSIM
6.3.5 Create Scenarios
The following factors were considered in creating simulation scenarios:
Vehicle Traffic – Vehicle traffic volume along the roadway corridor is the most
significant factor, resulting in congestion and long queues on the corridor. Although
actual peak-hour volumes at the three control sections were available, this study
extended the range of vehicle traffic volumes for assessing the effectiveness of the
pre-preemption with different traffic volumes. Based on the collected peak-hour
volumes, the corridor volume was changed from 0.1 (V/C ratio) to 0.9 (V/C ratio) at
several levels.
Train Speed – Train blockage duration is another significant factor causing
congestion along a roadway corridor. Usually, the duration is decided by train length

82
and train speed. For convenience purposes, this study fixed train length and changed
train speed to get various blockage durations.
Control Strategy – The original traffic control strategy was coded in the simulation
models to represent the scenarios before implementing the pre-preemption. Different
pre-preemption strategies were coded in the simulation models to test the
effectiveness of different pre-preemption logics by comparing to the original logics.
6.3.6 Configuring Simulation Parameters
Due to the stochastic nature of traffic flow and driving behaviors, it was necessary to run
VISSIM multiple times while varying the random number seeds to gain an accurate
reflection of the study corridor performance. To address this issue, multiple VISSIM
simulation runs were adopted. In this study, 10 replications were considered and compared
for each scenario to reflect different driver behaviors.
In the process of building the study VISSIM networks used in this research, a few simulation
parameters were predetermined: traffic regulation (e.g., right-side traffic), period (e.g.,
1800 simulation seconds), simulation resolution (5 time steps/Sim.sec), simulation speed
and simulation warm-up time, etc. The warm-up time initializes simulation network
conditions before beginning the collection of network performance and varies depending on
the size of the network and congestion levels. As such, this study used a warm-up time of
900 seconds to give enough time for the network to achieve stable simulation conditions.
6.3.7 Measures of Effectiveness
This study evaluated the safety and operational performance of the proposed pre-
preemption strategy at the corridor level. Average delay on the roadway corridor was used
to evaluate the operational performance of the pre-preemption strategy; average stops
along the corridor were used to assess the traffic smoothness, the risk of vehicle-vehicle
conflicts, and environmental impacts; and averaged queue length was used to assess the
congestion level of the corridor. Table 6-6 lists the MOEs used in this study.

83
Table 6-6 Selected MOEs in Simulation
MOE Definition Purpose Output
File
Average Delay
Average delay per vehicle(s) = Total delay time /
(active +arrived vehicles) for the whole corridor; delay time of a vehicle is calculated by subtracting quotient of actual distance traveled in this time
step and desired speed from length of time step.
Evaluate network-wide mobility
(congestion level)
.NPE
Average Number of Stops
Average number of stops per vehicle = Total
number of stops/( active + arrived vehicles) for whole corridor; a stop is counted if speed of vehicle was greater than zero at end of previous time step and is zero at end of current time step.
Evaluate mobility in network and risk
of vehicle-vehicle conflicts; also related to environmental
impacts (fuel consumption and emissions)
.NPE
Average Queue Length
Current queue length measured upstream every time step. From these values, arithmetical average
is computed for every time interval; queues are counted from location of queue counter on link or connector upstream to final vehicle in queue
condition.
Evaluate congestion level in
corridor
.STZ
For each scenario, 10 simulations were conducted, and a series of output files was produced.
These output files were read by the codes developed in this study to retrieve MOEs into a
project database. Finally, the MOE data were organized into a series of two-dimensional
tables. Each table contains the output data of 10 simulations for one MOE over different
preemption strategies. These tables were used in before-after data analysis. An example of
the table is shown in Table 6-7.
Table 6-7 Example of a MOE Output Table (Average Delay, seconds per vehicle)
Simulation Times
Before Pre-preemption
PP _1* PP _2* PP _3* PP _4* PP _5*
1 123 81 102 102 102 84
2 121 89 100 101 102 89
3 130 103 118 118 134 101
4 118 86 104 104 101 89
5 150 114 131 131 140 114
6 123 89 107 108 113 89
7 143 110 125 128 129 113
8 130 106 120 120 121 106
9 145 109 129 129 127 109
10 130 97 111 111 118 97
* PP_x – Pre-preemption Strategy X

84
6.3.8 Before-After Analysis
To assess the effectiveness of the pre-preemption strategy under prevailing conditions, a
series of comparisons between the scenarios before implementing pre-preemptions and
those after implementing pre-preemptions were conducted on each MOE. At the same time,
these comparisons were also conducted between different pre-preemption strategies to
select a proper strategy with the best performance. The average values of a MOE were
compared between original control strategies and different pre-preemption strategies. The
following equation was used to calculate the average MOE value:
( ) ∑
(6-1)
where ( ) is the average value of a given MOE; is the number of simulation times
( =10 in this study).

85
7 SIMULATION RESULTS AND DISCUSSIONS
This chapter describes simulation scenarios, simulation results, and discussions for the three
control sections. The coordinated pre-preemption strategies were tested in Sections I and II.
As a comparison, ITPS strategy was also tested in the two sections. In Section III, an
improved ITPS strategy was tested and compared to ITPS strategy and EWS strategy.
7.1 Section I
7.1.1 Site Description and Scenarios
As shown in Figure 6-1, Section I contains six railroad crossings along the FEC railroad
corridor and 18 signalized intersections adjacent to the crossings along six roadway
corridors. The roadway corridor of W Broward Blvd with four signalized intersections was
selected to test the pre-preemption strategy individually (without pre-preemption). The
geometry of the corridor is given in Figure 7-1. The following factors were considered in
creating the simulation model of Section I:
The preemption trigger signal at the intersection of N Flagler Dr @ W Sunrise Blvd
was used as the trigger for the pre-preemption operations at the target corridor. The
train approaching direction was configured as from Sunrise Blvd (North) to Broward
Blvd (South).
Because only one preempted intersection was available at the upstream (north) of
the target crossing along the FEC railroad, the ETA could be calculated based on the
preemption logs at two successive intersections. Thus, the train speed was assumed
as a constant value between Sunrise Blvd and Broward Blvd. The ETA was calculated
as the distance between the two corridors along the FEC railroad divided by the train
speed.
The commuter traffic direction on Broward Blvd is westbound. Thus, the coordination
direction of pre-preemption phases is Phase 2 (westbound).
The original signal plans of the four target intersections have no preemption mode.
Thus, their pre-preemption phases contain the coordinated congestion clearance
phase (Phase 2-6) only, as shown in Figure 7-2.
Considering the vehicle storage space between Intersection 2133 and the crossing is
short (285 ft), an alternative pre-preemption timing at Intersection 2133 was
designed as coordinated congestion clearance phase (Phase 2-5) followed by a track
clearance (Phase 6), as shown in Figure 7-3.

86
Figure 7-1 Tested Intersections in Section I

87
Start Phase 2-6
Receive Pre-preemption
Trigger from
N Flagler Dr @W
Sunrise Blvd
End Phase 2-6
Start Normal Phases
Start Phase 2-6
End Phase 2-6
Start Normal Phases
Start Phase 2-6
End Phase 2-6
Start Normal Phases
Coord
inated
Pre-p
reemp
tion
Ph
ase
(ϕ2 &
ϕ6)
No
rmal P
ha
ses
System DelayNorm
al P
hases
Coord
inated
Pre-p
reemp
tion
Ph
ase
(ϕ2 &
ϕ6)
No
rmal P
ha
ses
Coord
inated
Pre-p
reemp
tion
Ph
ase
(ϕ2 &
ϕ6)
Norm
al P
hases
No
rmal P
ha
ses
Train Leaves the Crossing
Train Arrives
at the Crossing
Offset 2
133
Offset 2
288
Start Phase 2-6
End Phase 2-6
Start Normal Phases
Coord
inated
Pre-p
reemp
tion
Ph
ase
(ϕ2 &
ϕ6)
Norm
al P
hases
No
rmal P
ha
ses
Offset 2
071
Tim
e Lin
e
2054S Andrew Ave @ W
Broward Blvd
2133Brickell Ave @ W
Broward Blvd
2288NW 5th Ave @
W Broward Ave
Westbound (Commuter Traffic Direction on Broward Blvd)
2071NW 7
th Ave @
W Broward Ave
ϕ5
ϕ2
ϕ4
ϕ6
ϕ8
ϕ5
ϕ2
ϕ4
ϕ6
ϕ8
ϕ1
ϕ6
ϕ3ϕ8
ϕ7 ϕ4
ϕ2ϕ5
ϕ2 ϕ1
ϕ6
ϕ3ϕ8
ϕ7 ϕ4
Figure 7-2 Timeline of Pre-preemption Strategy I (After 1)

88
Start Phase 2-6
Receive Pre-preemption
Trigger from
N Flagler Dr @W
Sunrise Blvd
End Phase 2-6
Start Normal Phases
Start Phase 2-5
End Phase 2-5
Start Phase 6
Start Phase 2-6
End Phase 2-6
Start Normal Phases
Coord
inated
Pre-p
reemp
tion
Ph
ase
(ϕ2 &
ϕ6)
Norm
al P
hases
System DelayNorm
al P
hases
Coord
inated
Pre-p
reemp
tion
Ph
ase
(ϕ2 &
ϕ5)
Norm
al P
hases
Coord
inated
Pre-p
reemp
tion
Ph
ase
(ϕ2 &
ϕ6)
Norm
al P
hases
Norm
al P
hases
Train Leaves the Crossing
Train Arrives
at the Crossing
Offset 2
133
Offset 2
288
2054S Andrew Ave @ W
Broward Blvd
2133Brickell Ave @ W
Broward Blvd
2288NW 5th Ave @
W Broward Ave
Westbound (Commuter Traffic Direction on Broward Blvd)
Start Phase 2-6
End Phase 2-6
Start Normal Phases
Coord
inated
Pre-p
reemp
tion
Ph
ase
(ϕ2 &
ϕ6)
Norm
al P
hases
Norm
al P
hases
2071NW 7
th Ave @
W Broward Ave
Offset 2
071
Tim
e Lin
e
Tra
ck
Clea
ran
ce
(ϕ6)
End Phase 6
Start Normal Phase
ϕ5
ϕ2
ϕ4
ϕ6
ϕ8
ϕ5
ϕ2
ϕ4
ϕ6
ϕ8
ϕ1
ϕ6
ϕ3ϕ8
ϕ7 ϕ4
ϕ2ϕ5
ϕ2 ϕ1
ϕ6
ϕ3ϕ8
ϕ7 ϕ4
Figure 7-3 Timeline of Pre-preemption Strategy I (After 2)

89
The pre-preemption phase time and offset time were optimized using Transyt-7F for
each traffic scenario. The optimization object is to maximize the progressive along
the coordination direction (westbound).
In Section I, 30 scenarios (5 volume levels × 6 train durations) for each pre-
preemption strategy (including before pre-preemption) were generated. Five levels
of vehicle volume were generated based on different v/c ratios from low to high and
six levels of train durations are generated based on train speeds from 10–85 mph. A
total of 10 runs were conducted for each scenario. The vehicle volume levels and
train duration levels are given in Table 7-1 and Table 7-2, respectively.
Table 7-1 Vehicle Traffic Volume on W Broward Blvd (Westbound)
Level 1 Level 2 Level 3 Level 4 Level 5
v/s 0.1 0.15 0.25 0.3 0.35
volume 403 605 1009 1210 1412
volume/lane 202 303 505 605 706
Table 7-2 Levels of Train Duration (Train Speed) on W Broward
Scenarios Train Speed (mph) Duration (Sec)
1 10 273
2 25 109
3 40 68
4 55 50
5 70 39
6 85 32
The pre-preemption strategies were evaluated at network level for Section I,
including average delay and average stops along the arterial (W Broward Blvd).

90
7.1.2 Simulation Results
Figure 7-4 Average Delay in Section I
0
50
100
150
200
250
300
1 2 3 4 5
Av
erag
e D
elay
(s/v
eh)
Vehicle Volume Level
Average Delay for 10MPH Train Speed
Before After1 After2
0
50
100
150
200
250
300
1 2 3 4 5
Av
erag
e D
elay
(s/v
eh)
Vehicle Volume Level
Average Delay for 25MPH Train Speed
Before After1 After2
0
50
100
150
200
250
300
1 2 3 4 5
Av
erag
e D
elay
(s/v
eh)
Vehicle Volume Level
Average Delay for 40MPH Train Speed
Before After1 After2
0
50
100
150
200
250
300
1 2 3 4 5
Av
erag
e D
elay
(s/v
eh)
Vehicle Volume Level
Average Delay for 55MPH Train Speed
Before After1 After2
0
50
100
150
200
250
300
1 2 3 4 5
Av
erag
e D
elay
(s/v
eh)
Vehicle Volume Level
Average Delay for 70MPH Train Speed
Before After1 After2
0
50
100
150
200
250
300
1 2 3 4 5
Av
erag
e D
elay
(s/v
eh)
Vehicle Volume Level
Average Delay for 85MPH Train Speed
Before After1 After2

91
Figure 7-5 Average Stops in Section I
0
0.5
1
1.5
2
2.5
3
3.5
4
4.5
1 2 3 4 5
Av
erag
e N
um
ber
of
Sto
ps
Vehicle Volume Level
Average Stops for 10MPH Train Speed
Before After1 After2
0
0.5
1
1.5
2
2.5
3
3.5
4
4.5
1 2 3 4 5
Av
erag
e N
um
ber
of
Sto
ps
Vehicle Volume Level
Average Stops for 25MPH Train Speed
Before After1 After2
0
0.5
1
1.5
2
2.5
3
3.5
4
4.5
1 2 3 4 5
Av
erag
e N
um
ber
of
Sto
ps
Vehicle Volume Level
Average Stops for 40MPH Train Speed
Before After1 After2
0
0.5
1
1.5
2
2.5
3
3.5
4
4.5
1 2 3 4 5
Av
erag
e N
um
ber
of
Sto
ps
Vehicle Volume Level
Average Stops for 55MPH Train Speed
Before After1 After2
0
0.5
1
1.5
2
2.5
3
3.5
4
4.5
1 2 3 4 5
Av
erag
e N
um
ber
of
Sto
ps
Vehicle Volume Level
Average Stops for 70MPH Train Speed
Before After1 After2
0
0.5
1
1.5
2
2.5
3
3.5
4
4.5
1 2 3 4 5
Av
erag
e N
um
ber
of
Sto
ps
Vehicle Volume Level
Average Stops for 85MPH Train Speed
Before After1 After2

92
7.1.3 Discussion
Average delay can be used to evaluate the mobility and congestion levels of a roadway
network. A smaller value indicates a better operation performance and less congestion of
the network. Figure 7-4 shows that the average delay after implementing pre-preemption
strategies (After 1 or After 2) is less than that before implementing the strategies with high
traffic volumes (volume level ≥ 3) and long train duration (≥ 100 sec). Under a low traffic
volume (volume level < 3), the pre-preemption may result in a negative impact. If traffic
volume is high and blockage duration is low, the impact of pre-preemption on network
average delay is positive but reduction after pre-preemption is small. Figure 7-6 shows the
percentage of average delay reduction after implementing the pre-preemption strategy
(After 1). With high traffic volume and long duration, the pre-preemption strategy (After 1)
may reduce average delay at network level by 4–8 percent.
Figure 7-6 Average Delay Reduction after Implementing Pre-preemption (After 1)
Average stops in a roadway network are an indicator of traffic smoothness. Fewer stops
represent more smooth traffic operations and lower risks of collisions. Figure 7-5 indicates
that pre-preemption strategies can significantly reduce the average stops under high traffic
volume for either long or short blockage durations. The reduction percentage by
implementing the pre-preemption strategy (After 1) is around 10–25 percent with high
traffic volumes, as shown in Figure 7-7.
-90%
-80%
-70%
-60%
-50%
-40%
-30%
-20%
-10%
0%
10%
20%
1 2 3 4 5
% R
edu
ctio
n
Vehicle Volume Levels
% Reduction of After1(Phase26) over Base about Average Delay
Train10MPH
Train25MPH
Train40MPH
Train55MPH
Train70MPH
Train85MPH

93
Figure 7-7 Average Stops Reduction after Implementing
Pre-preemption Strategy (After 1)
7.2 Section II
7.2.1 Site Description and Scenarios
Section II contains two railroad crossings along the FEC railroad corridor and four signalized
intersections near the crossings along roadway corridors. In this study, Section II was used
to test the pre-preemption strategy integrating preemption operations. The roadway
corridor of Oakland Park Blvd with two signalized intersections (preemption available at N
Dixie Hwy at E Oakland Park Blvd) was selected as the simulation objective, as shown in
Figure 7-8. The following factors were considered in creating the simulation model of
Section II:
Because no upstream preemption is available for triggering the pre-preemption at
the target crossing in Section II, roadside train detectors were assumed to be
installed on the upstream (both north and south). The detectors could provide
enough advance warning time for the pre-preemption operations at the target
crossing.
The train speed was assumed to be a constant value between the roadway detectors
and the target crossing. The ETA was calculated as the distance of detectors from
the target crossing along the FEC railroad divided by train speed.
-30%
-20%
-10%
0%
10%
20%
30%
1 2 3 4 5
% R
edu
ctio
n
Vehicle Volume Levels
% Reduction of After1(Phase26) over Base about Stops
Train10MPH
Train25MPH
Train40MPH
Train55MPH
Train70MPH
Train85MPH

94
Figure 7-8 Layout of Tested Intersections in Section II

95
The commuter traffic direction on Oakland Park Blvd is westbound. Thus, the
coordination direction of pre-preemption phases is Phase 2 (westbound). The non-
preempted intersection (NE 16th Ave at E Oakland Park Blvd) is located upstream
from the preempted intersection (N Dixie Hwy at E Oakland Park Blvd) along the
coordination direction on the roadway corridor.
The non-preempted intersection (NE 16th Ave at E Oakland Park Blvd) has only a
coordinated pre-preemption phase (Phase 2-6) for clearing through traffic along
Oakland Park Blvd before train’s arrival.
The preempted intersection (N Dixie Hwy at E Oakland Park Blvd) activates the pre-
preemption operation following its upstream intersection (NE 16th Ave at E Oakland
Park Blvd) after a given offset. The pre-preemption is terminated by its preemption
trigger.
Several pre-preemption strategies at the preempted intersection (N Dixie Hwy at E
Oakland Park Blvd) were tested:
o After 1: This strategy has only the coordination phase (Phase 2-6), as shown
in Figure 7-9.
o After 2: This strategy provides “extra” green time for the left-turn movements
on the major road (Phase 1-5) before starting the coordination phase (Phase
2-6), as shown in Figure 7-10.
o After 3: This strategy set the coordination phase as Phase 2-5 and provides a
non-coordinated pre-preemption phase (Phase 1-6) before the coordination
phase. The purpose of this strategy is to clear left-turning and through
movements along the roadway corridor. The timeline is given in Figure 7-11.
o After 4: This strategy gives “extra” green time to all the movements blocked
by train passing the crossing before train’s arrival. The coordination phase is
Phase 2-5, as shown in Figure 7-12.
The ITPS-based strategy was also tested in Section II as a comparison. The ITPS
strategy is a fully-actuated phase set implemented at the pre-preempted intersection
(N Dixie Hwy at E Oakland Park Blvd) only. No coordination phase was considered in
the ITPS strategy. (See Figure 2-4 for the ITPS flow chart.)
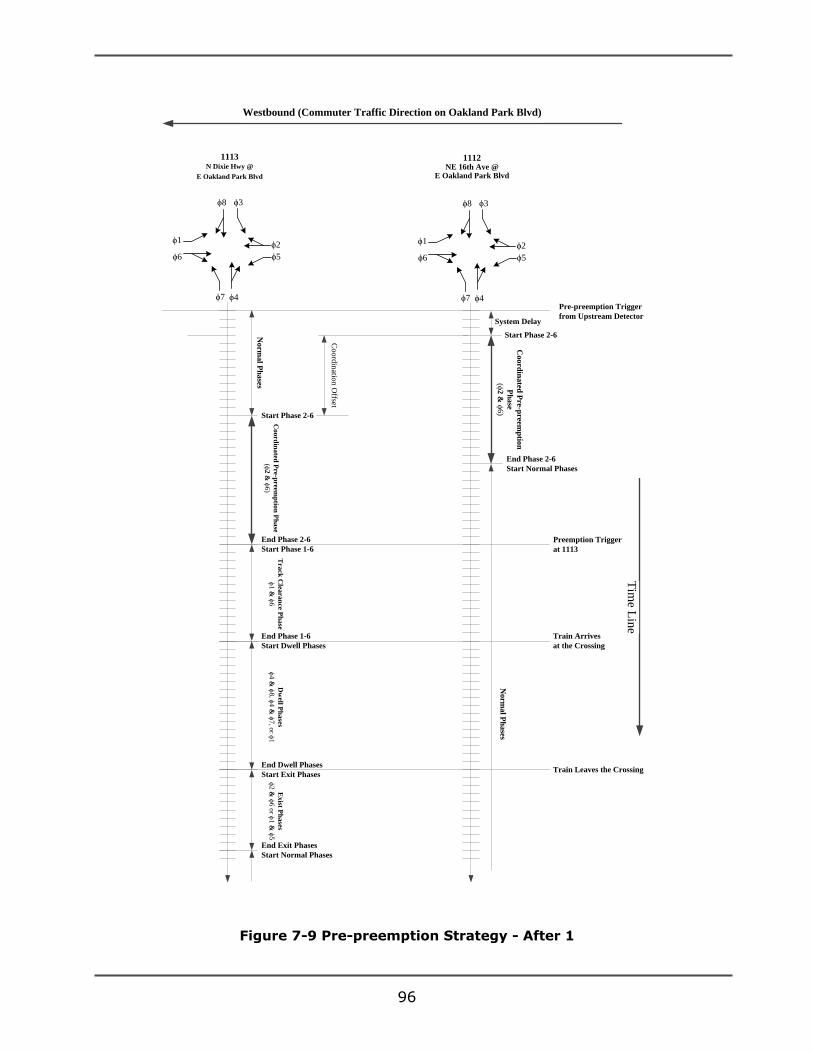
96
Start Phase 2-6
Pre-preemption Trigger
from Upstream Detector
End Phase 2-6
Start Normal Phases
Start Phase 2-6
End Phase 2-6
Start Phase 1-6
Co
ord
ina
ted P
re-preem
ptio
n
Ph
ase
(ϕ2
& ϕ
6)
No
rma
l Ph
ases
System Delay
Coo
rdin
ated
Pre-p
reemp
tion
Ph
ase
(ϕ2 &
ϕ6)
No
rma
l Ph
ases
Tra
ck C
leara
nce P
hase
ϕ1 &
ϕ6
Co
ord
inatio
n O
ffset
Tim
e Lin
e
1112NE 16th Ave @
E Oakland Park Blvd
1113N Dixie Hwy @
E Oakland Park Blvd
Westbound (Commuter Traffic Direction on Oakland Park Blvd)
ϕ5
ϕ2 ϕ1
ϕ6
ϕ3ϕ8
ϕ7 ϕ4
ϕ5
ϕ2 ϕ1
ϕ6
ϕ3ϕ8
ϕ7 ϕ4
Preemption Trigger
at 1113
End Phase 1-6
Start Dwell Phases
Train Arrives
at the Crossing
Dw
ell Ph
ases
ϕ4 &
ϕ8, ϕ
4 &
ϕ7, o
r ϕ1
End Dwell Phases
Start Exit PhasesTrain Leaves the Crossing
End Exit Phases
Start Normal Phases
Ex
ist Ph
ases
ϕ2 &
ϕ6
or ϕ
1 &
ϕ5
Figure 7-9 Pre-preemption Strategy - After 1

97
Start Phase 2-6
Pre-preemption Trigger
from Upstream Detector
End Phase 2-6
Start Normal Phases
End Phase 1-5
Start Phase 2-6
End Phase 2-6
Start Phase 1-6
Co
ord
ina
ted P
re-preem
ptio
n
Ph
ase
(ϕ2
& ϕ
6)
No
rma
l Ph
ases
System Delay
Co
ord
ina
ted P
re-preem
ptio
n P
hase
(ϕ2 &
ϕ6)
No
n-co
ord
inated
Pre-
preem
ptio
n P
hase
Tra
ck C
leara
nce P
hase
ϕ1 &
ϕ6
Co
ord
inatio
n O
ffset
Tim
e Lin
e
1112NE 16th Ave @
E Oakland Park Blvd
1113N Dixie Hwy @
E Oakland Park Blvd
Westbound (Commuter Traffic Direction on Oakland Park Blvd)
ϕ5
ϕ2 ϕ1
ϕ6
ϕ3ϕ8
ϕ7 ϕ4
ϕ5
ϕ2 ϕ1
ϕ6
ϕ3ϕ8
ϕ7 ϕ4
Preemption Trigger
at 1113
End Phase 1-6
Start Dwell Phases
Train Arrives
at the Crossing
Dw
ell Ph
ases
ϕ4 &
ϕ8, ϕ
4 &
ϕ7, o
r ϕ1
End Dwell Phases
Start Exit PhasesTrain Leaves the Crossing
End Exit Phases
Start Normal Phases
Exist P
hases
ϕ2 &
ϕ6
or ϕ
1 &
ϕ5
Start Phase 1-5
Figure 7-10 Pre-preemption Strategy - After 2

98
Start Phase 2-6
Pre-preemption Trigger
from Upstream Detector
End Phase 2-6
Start Normal Phases
End Phase 1-6
Start Phase 2-5
End Phase 2-5
Start Phase 1-6
Co
ord
ina
ted P
re-preem
ptio
n
Ph
ase
(ϕ2
& ϕ
6)
No
rma
l Ph
ases
System Delay
Coo
rdin
ated
Pre-p
reemp
tion
Ph
ase
(ϕ2 &
ϕ6)
Non
-coo
rdin
ated P
re-
preem
ptio
n P
hase
Tra
ck C
leara
nce P
hase
ϕ1 &
ϕ6
Co
ord
inatio
n O
ffset
Tim
e Lin
e
1112NE 16th Ave @
E Oakland Park Blvd
1113N Dixie Hwy @
E Oakland Park Blvd
Westbound (Commuter Traffic Direction on Oakland Park Blvd)
ϕ5
ϕ2 ϕ1
ϕ6
ϕ3ϕ8
ϕ7 ϕ4
ϕ5
ϕ2 ϕ1
ϕ6
ϕ3ϕ8
ϕ7 ϕ4
Preemption Trigger
at 1113
End Phase 1-6
Start Dwell Phases
Train Arrives
at the Crossing
Dw
ell Ph
ases
ϕ4 &
ϕ8, ϕ
4 &
ϕ7, o
r ϕ1
End Dwell Phases
Start Exit PhasesTrain Leaves the Crossing
End Exit Phases
Start Normal Phases
Ex
ist Ph
ases
ϕ2 &
ϕ6
or ϕ
1 &
ϕ5
Start Phase 1-6
Figure 7-11 Pre-preemption Strategy - After 3

99
Start Phase 2-6
Pre-preemption Trigger
from Upstream Detector
End Phase 2-6
Start Normal Phases
End Phase 1-6
Start Phase 2-5
End Phase 2-5
Start Phase 1-6
Coo
rdin
ated
Pre-p
reemp
tion
Ph
ase
(ϕ2
& ϕ
6)
Norm
al P
hases
Predefined delay
Co
ord
ina
ted P
re-preem
ptio
n P
ha
seN
on
-coo
rdin
ated P
re-preem
ptio
n P
hase
Tra
ck C
leara
nce P
ha
se
ϕ1
& ϕ
6
Co
ord
inatio
n O
ffset
Tim
e Lin
e
1112NE 16th Ave @
E Oakland Park Blvd
1113N Dixie Hwy @
E Oakland Park Blvd
Westbound (Commuter Traffic Direction on Oakland Park Blvd)
ϕ5
ϕ2 ϕ1
ϕ6
ϕ3ϕ8
ϕ7 ϕ4
ϕ5
ϕ2 ϕ1
ϕ6
ϕ3ϕ8
ϕ7 ϕ4
Preemption Trigger
at 1113
End Phase 1-6
Start Dwell Phases
Train Arrives
at the Crossing
Dw
ell Ph
ases
ϕ4
& ϕ
8, ϕ
4 &
ϕ7
, or ϕ
1
End Dwell Phases
Start Exit PhasesTrain Leaves the Crossing
End Exit Phases
Start Normal Phases
Ex
ist Ph
ases
ϕ2
& ϕ
6 o
r ϕ1
& ϕ
5
Start Phase 3-8
End Phase 3-8
Start Phase 1-6
Figure 7-12 Pre-preemption Strategy - After 4

100
The coordinated pre-preemption phase time and offset time were calculated using
Transyt-7F for each traffic scenario. The optimization objective is to maximize the
progressive along the coordination direction (westbound).
In Section II, 60 scenarios (10 volume levels × 6 train durations) for each pre-
preemption strategy were generated. A total of 10 levels of vehicle volume along the
commuter direction on Oakland Park Blvd were generated based on different v/c
ratios from low to high, and 6 levels of train durations are generated based on train
speeds from 10 mph to 85 mph. A total of 10 runs were conducted for each scenario.
The vehicle volume levels and train duration levels are shown in Table 7-3 and Table
7-4, respectively.
MOEs included average delay, average stops, average queue length, and maximum
queue length along the roadway corridor (Oakland Park Blvd).
Table 7-3 Commuter Vehicle Traffic Volume on Oakland Park Blvd
Section II Level
1 Level
2 Level
3 Level
4 Level
5 Level
6 Level
7 Level
8 Level
9 Level
10
v/s 0.05 0.1 0.15 0.2 0.25 0.3 0.35 0.4 0.45 0.5
volume 202 403 605 807 1009 1210 1412 1614 1816 2017
volume/lane 101 202 303 404 505 605 706 807 908 1009
Table 7-4 Levels of Train Duration (Train Speed) in Section II
Scenarios Train Speed
(mph) Duration (s)
1 10 273
2 25 109
3 40 68
4 55 50
5 70 39
6 85 32

101
7.2.2 Simulation Results
Figure 7-13 Average Delay in Section II
0
50
100
150
200
250
300
350
400
1 2 3 4 5 6 7 8 9 10
Av
erag
e D
elay
(s/v
eh)
Vehicle Volume Level
Average Delay for 10MPH Train Speed
Before After1 After2 After3 After4 After_ITPS
0
50
100
150
200
250
300
350
400
1 2 3 4 5 6 7 8 9 10
Av
erag
e D
elay
(s/v
eh)
Vehicle Volume Level
Average Delay for 25MPH Train Speed
Before After1 After2 After3 After4 After_ITPS
0
50
100
150
200
250
300
350
1 2 3 4 5 6 7 8 9 10
Av
erag
e D
elay
(s/v
eh)
Vehicle Volume Level
Average Delay for 40MPH Train Speed
Before After1 After2 After3 After4 After_ITPS
0
50
100
150
200
250
300
350
1 2 3 4 5 6 7 8 9 10
Av
erag
e D
elay
(s/v
eh)
Vehicle Volume Level
Average Delay for 55MPH Train Speed
Before After1 After2 After3 After4 After_ITPS
0
50
100
150
200
250
300
350
1 2 3 4 5 6 7 8 9 10
Av
era
ge
Del
ay
(s/v
eh)
Vehicle Volume Level
Average Delay for 70MPH Train Speed
Before After1 After2 After3 After4 After_ITPS
0
50
100
150
200
250
300
350
1 2 3 4 5 6 7 8 9 10
Av
era
ge
Del
ay
(s/v
eh)
Vehicle Volume Level
Average Delay for 85MPH Train Speed
Before After1 After2 After3 After4 After_ITPS

102
Figure 7-14 Average Stops in Section II
0
0.5
1
1.5
2
2.5
3
3.5
1 2 3 4 5 6 7 8 9 10
Av
erag
e N
um
ber
of
Sto
ps
Vehicle Volume Level
Average Stops for 10MPH Train Speed
Before After1 After2 After3 After4 After_ITPS
0
0.5
1
1.5
2
2.5
3
3.5
4
1 2 3 4 5 6 7 8 9 10
Av
erag
e N
um
ber
of
Sto
ps
Vehicle Volume Level
Average Stops for 25MPH Train Speed
Before After1 After2 After3 After4 After_ITPS
0
0.5
1
1.5
2
2.5
3
3.5
1 2 3 4 5 6 7 8 9 10
Av
erag
e N
um
ber
of
Sto
ps
Vehicle Volume Level
Average Stops for 40MPH Train Speed
Before After1 After2 After3 After4 After_ITPS
0
0.5
1
1.5
2
2.5
3
3.5
4
1 2 3 4 5 6 7 8 9 10
Av
erag
e N
um
ber
o
f S
top
s
Vehicle Volume Level
Average Stops for 55MPH Train Speed
Before After1 After2 After3 After4 After_ITPS
0
0.5
1
1.5
2
2.5
3
3.5
1 2 3 4 5 6 7 8 9 10
Av
erag
e N
um
ber
o
f S
top
s
Vehicle Volume Level
Average Stops for 70MPH Train Speed
Before After1 After2 After3 After4 After_ITPS
0
0.5
1
1.5
2
2.5
3
3.5
1 2 3 4 5 6 7 8 9 10
Av
era
ge
Nu
mb
er o
f S
top
s
Vehicle Volume Level
Average Stops for 85MPH Train Speed
Before After1 After2 After3 After4 After_ITPS

103
Figure 7-15 Average Queue Length along Oakland Park Blvd (Westbound)
0
10
20
30
40
50
60
1 2 3 4 5 6 7 8 9 10
Qu
eue
Len
gth
Vehicle Volume Level
Ave. Queue Length for 10MPH Train
Speed
Before After1 After2 After3 After4 After_ITPS
0
10
20
30
40
50
1 2 3 4 5 6 7 8 9 10
Qu
eue
Len
gth
Vehicle Volume Level
Avg. Queue Length for 25MPH Train
Speed
Before After1 After2 After3 After4 After_ITPS
0
5
10
15
20
25
30
35
40
45
1 2 3 4 5 6 7 8 9 10
Qu
eue
Len
gth
Vehicle Volume Level
Avg. Queue Length for 40MPH Train
Speed
Before After1 After2 After3 After4 After_ITPS
0
10
20
30
40
50
60
1 2 3 4 5 6 7 8 9 10
Qu
eue
Len
gth
Vehicle Volume Level
Avg. Queue Length for 55MPH Train
Speed
Before After1 After2 After3 After4 After_ITPS
0
10
20
30
40
50
1 2 3 4 5 6 7 8 9 10
Qu
eue
Len
gth
Vehicle Volume Level
Avg. Queue Length for 70MPH Train
Speed
Before After1 After2 After3 After4 After_ITPS
0
10
20
30
40
50
60
1 2 3 4 5 6 7 8 9 10
Qu
eue
Len
gth
Vehicle Volume Level
Avg. Queue Length for 85MPH Train
Speed
Before After1 After2 After3 After4 After_ITPS

104
7.2.3 Discussion
The pre-preemption strategies can significantly reduce the average delay on the roadway
corridor for each scenario. However, different pre-preemption strategies have different
performances. After 4 (three pre-preemption phases) experiences the worst performance
compared to other strategies. In most scenarios, the performance of the ITPS-based
strategy (After_ITPS) is lower than three coordinated pre-preemption strategies (After 1,
After 2, and After 3). The performance difference among the three coordinated pre-
preemption strategies is small. As shown in Figure 7-16, the pre-preemption strategy (After
1) reduces the average delay up to 60 percent.
Figure 7-16 Average Delay Reduction along Oakland Park Blvd (Westbound)
In most scenarios, pre-preemption may reduce the average stops. The three-phase pre-
preemption strategy (After 4) and the ITPS strategy experience lower performance than
other strategies. As shown in Figure 7-17, the pre-preemption strategy (After 1) can reduce
the average stops up to 45 percent. The performance is more significant when the traffic
volume is lower than Level 3.
The coordinated pre-preemption strategies can reduce average queue length along the
roadway corridor in the scenarios of long duration and high volume. However, the
performance pattern is complex. Different coordinated strategies have different performance
in different scenarios. The ITPS-based strategy, which optimizes traffic operations at
individual intersection, tends to increase the average queue length in most scenarios.
0%
10%
20%
30%
40%
50%
60%
70%
1 2 3 4 5 6 7 8 9 10
% R
edu
ctio
n
Vehicle Volume Levels
% Reduction of After1(Phase26) over Base about Average Delay
Train10MPH
Train25MPH
Train40MPH
Train55MPH
Train70MPH
Train85MPH

105
Figure 7-17 Average Stops Reduction along Oakland Park Blvd (Westbound)
Figure 7-18 Average Queue Length Reduction along
Oakland Park Blvd (Westbound)
-30%
-20%
-10%
0%
10%
20%
30%
40%
50%
1 2 3 4 5 6 7 8 9 10
% R
edu
ctio
n
Vehicle Volume Levels
% Reduction of After1(Phase26) over Base about Stops
Train10MPH
Train25MPH
Train40MPH
Train55MPH
Train70MPH
Train85MPH
-300%
-250%
-200%
-150%
-100%
-50%
0%
50%
100%
150%
1 2 3 4 5 6 7 8 9 10
% R
edu
ctio
n
Vehicle Volume Levels
% Reduction of After1(Phase26) over Base about Avg. Queue Length #12
Train10MPH
Train25MPH
Train40MPH
Train55MPH
Train70MPH
Train85MPH

106
7.3 Section III
7.3.1 Site and Scenarios
In Section III, various ITPS-based pre-preemption strategies were evaluated at the
intersection level. Instead of using a simple three- or four-legged intersection in the
assessment, as was done in previous studies on the subject (Cho and Rilett, 2007) (Roberts
and Brown-Esplain, 2005), a signalized intersection at a six-legged diamond interchange
was selected for the testing in this study. As shown in Figure 7-19, the investigated I-95
interchange at W Commercial Blvd has six legs:
I-95 off-ramp northbound (NB)
W. Commercial Boulevard westbound (WB)
I-95 on-ramp northbound (NB)
I-95 off-ramp southbound (SB)
W Commercial Blvd eastbound (EB), and
I-95 on-ramp southbound (SB)
Figure 7-19 Layout of W. Commercial Boulevard with CSX Rail Corridor
There are three movements in the segment that is connecting the two ramp terminals
underneath I-95: 1) W Commercial Blvd EB through, 2) W Commercial Blvd EB left-turn to
I-95 on-ramp NB, and 3) W Commercial Blvd WB through. A north-south railroad corridor
(CSX corridor) intersects W Commercial Blvd in Fort Lauderdale. The CSX corridor is used
by commuter rail (Tri-Rail), long-distance rail (Amtrak), and a commercial freight rail
service. The interchange is approximately 150 feet east of the CSX railroad. A simultaneous
preemption is currently implemented at the intersection, which is activated by a CWT
system that provides train’s arrival signals 28 seconds before train’s arrival. As can been
seem from Figure 7-20, the target intersection in this project is different from the previous
studies; not only are there more legs within the intersection, but also the Track Clearance
(TC) phase is different from the normal signal phases.

107
Figure 7-20 Phasing Diagram of I-95 Interchange at W. Commercial Boulevard
The activation of the pre-preemption strategies proposed in this study requires two
upstream intersections with preemptions on the train’s path. As illustrated in Figure 7-21,
the two upstream intersections with implemented preemptions in this study are Powerline
Rd at W Prospect Rd, and I-95 at Oakland Park Blvd. These two intersections are located
approximately 2,600 feet and 6,100 feet, respectively, to the south of the target
intersection (I-95 at W Commercial Blvd). Since there is no station between the I-95/W
Commercial Blvd intersection and I-95/Oakland Park Blvd intersection, the trains are not
expected to stop in between. This study evaluates pre-preemption strategies at the
intersection of I-95 interchange at W Commercial Blvd, based on the NB train deactivations

108
of the two upstream intersection preemptions. Since the upstream preemption information
to the north of the target intersection was not available, no pre-preemption strategy was
investigated for the SB trains.
Figure 7-21 Locations of Two Upstream Intersections along CSX Rail Corridor Relative to Target Intersection
The study period in this research was the PM peak period, specifically from 4:00–6:00 PM.
During this two-hour period, five SB Tri-Rail trains and four NB Tri-Rail trains pass the
intersection according to the train schedule, which was confirmed by a recorded video of the
train operations. To assess the pre-preemption strategies, the network, including the five
intersections highlighted in Figure 7-21, was coded in the VISSIM micro-simulation model
(version 5.40-06). Based on a previous report, the average speed of Tri-Rail trains is 38
mph. Thus, the base model simulated all trains at an average speed of 40 mph with the
default speed distribution in VISSIM. Turning movement counts at the intersection of
Powerline Rd at W Commercial Blvd were collected by Broward County on Tuesday,

109
December 11, 2012. Turning movement data at the intersection of N. Andrews Ave at W
Commercial Blvd were collected by the County on Wednesday, December 12, 2012. The
turning movements at the target intersection of I-95 interchange at W Commercial Blvd
were videotaped and extracted by the researchers on Thursday, April 18, 2013. Signal
Operating Plans (SOPs) were provided by Broward County, as shown in Figure 7-20. During
the PM peak hours, the intersections of Powerline Rd at W Commercial Blvd and N. Andrews
Ave at W Commercial Blvd operate under coordination. All phases at the target intersection
of I-95 interchange at W Commercial Blvd are flagged as Max Recall during the PM peak
hours. In other words, the target intersection operates in a fixed-time mode during normal
operations in the PM peak.
All signal plans, including actuated control, signal preemption, and pre-preemption
strategies, as discussed below, were coded in an add-on signal control module using the
VAP facility in VISSIM. The base model with no preemption was calibrated based on
observed traffic conditions, including volumes, signal control, and queue lengths at the
subject intersection. Figure 7-22 shows the variation of the average delays for different
approaches at the target intersection during the PM peak period. This figure can be used in
justifying and providing priorities for movements (based on delays) as part of the pre-
preemption strategies.
Figure 7-22 Current Delays by Approaches at Target Intersection
Three types of pre-preemption strategies were investigated in this paper. These strategies
are implemented prior to the normal preemption operation to avoid interference once this
operation begins.
0
20
40
60
80
100
120
900 1800 2700 3600 4500 5400 6300 7200 8100
Ave
rage
De
lay
(s/v
eh
)
Time Period (s)
Current Delay by Approaches
WB Approach
EB Approach
NB Approach
SB Approach

110
ITPS
The first investigated strategy applies the same logic as the ITPS introduced by Cho (Cho
and Rilett 2007) except that the train’s ETA is calculated based on the relationship between
the preemption deactivations at two upstream intersections instead of information collected
from point infrastructure detectors.
Modified ITPS
The second strategy involves a modification of the ITPS algorithm to provide extra green
times to the phases that suffer from higher delays during normal operations, as determined
based on historical data, simulation model results, or in accordance with a priority provided
by the user. For example, as shown in Figure 7-22, which is based on simulation model
results, it seems beneficial to serve Phases 1, then 2, and/or 3, representing the NB, WB,
and EB phases, respectively, during the pre-preemption period. Unlike the ITPS, which
does not change the pre-defined phase sequence, the Modified ITPS jumps to the desired
phase(s) during the pre-preemption based on the established priorities.
The logic algorithms of the Modified ITPS are shown in Figure 7-23, Figure 7-24, and Figure
7-25. As shown in Figure 7-23, if Phase 1 is being served at the time the pre-preemption
Strategy is activated, the Modified ITPS transfers the right-of-way to either Phase 2 or
Phase 3, according to the calls after either gap-out or max-out of Phase 1. Phase 2 is given
higher priority than Phase 3 in this pre-preemption strategy since the WB approach suffers
higher delays than the EB approach in the base model. In the case that no call is placed for
both Phase 2 and 3, the controller will keep Phase 1 active until the end of the pre-
preemption strategy (i.e., the activation of the regular preemption strategy).
Similarly, as can be seen from Figure 7-24, if Phase 2 is the active phase when the pre-
preemption strategy is triggered, only Phase 3 will be served if there is a call after either
gap-out or max-out of Phase 2. If there is no call from Phase 3, the controller will not
terminate Phase 2 until the end of the pre-preemption strategy. Phase 1 will not be served
in this case because it has been just served before Phase 2 is being served. It is out of
drivers’ expectation to serve Phase 1 again immediately after serving Phase 2. As a result,
Phase 1 is not given any green time during this pre-preemption strategy though it suffered
the highest delays.
In addition, in reference to Figure 7-25, if any one of Phase 3, 4, 5, or 6 is being served at
the beginning of the pre-preemption strategy, the controller will safely transfer the right-of-
way to either Phase 1 or Phase 2 depending on the calls. Again, Phase 1 is considered prior

111
to Phase 2 since Phase 1 suffered the highest delay in the base model. If there is no call
from both phases, the controller will keep the current phase active until either the pre-
preemption strategy is ended or the call from Phase 1 or Phase 2 is received.
Before transferring the right-of-way to the desired phase in any conditions discussed above,
the logic algorithms test whether the ETA (i.e., time difference between the now and the
activation of the regular preemption strategy) is long enough to serve the yellow + all red
time and the minimum green time of the next phase. The phase will be changed only if the
above criteria are satisfied. Moreover, Phase 4 and 5 are not considered to be served by
the Modified ITPS during pre-preemption because the I-95 SB Off-Ramp will be served
during the dwell phase. Phase 6 is not served by the pre-preemption strategy because its
movements are also served in Phase 2.
Figure 7-23 Logic Algorithm of Modified ITPS Pre-Preemption Strategy
When Current Phase Is Phase 1

112
Figure 7-24 Logic Algorithm of Modified ITPS Pre-Preemption Strategy
When Current Phase Is Phase 12
Figure 7-25 Logic Algorithm of Modified ITPS Pre-Preemption Strategy When Current Phase Is Phase 3, 4, 5, or 6

113
Simplified Strategies
Even though previous studies showed that the ITPS is an effective pre-preemption strategy,
it cannot be easily implemented in current signal control software and firmware. This study
proposed a set of simplified pre-preemption strategies that are similar to the EWS strategy,
which is implemented by using the low priority preemption features built into the controllers
(Roberts and Brown-Esplain, 2005). Since these pre-preemption strategies use the build-in
preemption function inside the signal controller, there is no abbreviation of the minimum
green time allowed by the controller during the pre-preemption. However, unlike the EWS
strategy, which considers only the phases during the pre-preemption, the simplified
strategies proposed in this study also take the returning phase sequence into account.
Figure 7-26 Signal Phase Logic of Potential Simplified Pre-Preemption Strategies
Upstream Preemption Deactivation
Phase 1
Phase 1-2-3-4-5-6 Phase 1-2-3-4-5-6-1
Phase 2-3-4-5-6 Phase 1-2-3-4-5-6-1
Phase 2-1-3-4-5-6 Phase 1-2-3-4-5-6-1
Phase 1(MIN) - Phase 2
Phase 1-2-3-4-5-6 Phase 1-2-3-4-5-6-1
Phase 3-4-5-6-1 Phase 1-2-3-4-5-6-1
Phase 1-3-4-5-6 Phase 1-2-3-4-5-6-1
Phase 2 Phase 1-2-3-4-5-6 Phase 1-2-3-4-5-6-1
Phase 2(MIN) - Phase 1
Phase 1-2-3-4-5-6 Phase 1-2-3-4-5-6-1
Phase 2-3-4-5-6 Phase 1-2-3-4-5-6-1
Phase 3-4-5-6 Phase 1-2-3-4-5-6-1
Phase 1(MIN) - Phase 2(MIN) - Phase 4
Phase 1-2-3-4-5-6 Phase 1-2-3-4-5-6-1
Pre-preemption
Activation
Pre-preemption
Phases
Returning Phase
Sequence
Normal Phase
Sequence
1a
1b
1c
1d
1e
1f
2b
2c
2d
3a
2a
Name

114
7.3.2 Simulation Results
The 13 strategies proposed in the previous sections were coded and tested in the VISSIM
model. However, the results were found to be not significantly different from the base
model without pre-preemption strategies. The reason is that the distance between the
target intersection of I-95 interchange at W Commercial Blvd and the first upstream
intersection of Powerline Rd at W Prospect Rd is too short to execute the proposed pre-
preemption strategies. In the most cases, the regular preemption and CWT started before
the activation of the pre-preemption strategies. Another problem in the models with base
conditions was the confusion of the SB trains, since the abbreviations of the minimum green
time and extra delays may be caused by the SB trains instead of NB trains. It is not
straightforward to test the benefit of the pre-preemption strategies, as there is no such
strategy developed for the SB trains because upstream preemption information for the SB
trains was not available in this study. Although the abbreviations of minimum green time
and delays caused by the SB trains can be differentiated from those caused by the NB trains
by analyzing the signal/detector records, the SB trains were excluded in the later models
just to simplify the case. The variation of the train speed in the simulation also made the
analysis more complex. Therefore, the train speed was simulated to be constant in the later
scenarios.
Based on the findings from the models with base conditions, the first upstream intersection
of Powerline Rd at W Prospect Rd was moved along with the second upstream intersection
of I-95 interchange at Oakland Park Blvd to a location approximately 5,000 feet from the
target intersection of I-95 interchange at W Commercial Blvd. The distance between the
first and the second upstream intersections remains the same as the existing condition (i.e.,
6,100 feet). The SB trains were removed from the model and the train speed was set as
fixed. In addition, for the purpose of testing, the NB trains are increased from 4 trains to
10 trains during the PM peak hours. The new train schedule is shown in Table 7-5 after
increasing the frequency. The bold-face times in the table indicate the original departure
times in the current condition. The pre-preemption strategies are coded in VAP and tested
with train speeds at 30, 40, 50, and 60 mph, respectively. Each scenario was run 10 times
with different random seeds.

115
Table 7-5 Departure Time of NB Trains
Train No. Departure time from
Fort Lauderdale Station
1 3:59:00 PM
2 4:10:00 PM
3 4:22:00 PM
4 4:33:00 PM
5 4:47:00 PM
6 4:58:00 PM
7 5:08:00 PM
8 5:17:00 PM
9 5:37:00 PM
10 5:48:00 PM
Safety Results
The number of minimum green time abbreviations due to passing trains is shown in Table
7-6. After initial testing, it was found that some of the simplified strategies did not show
improvements to the average intersection delays, and thus they were excluded from the
comparison in Table 7-6. As can be seen from the table, the number of the minimum green
time abbreviations in the scenarios with base conditions without a pre-preemption strategy
(Column 2) becomes higher as the number of trains increases, as expected. The results
also show that the number of minimum green time abbreviations do not have a correlation
with the train speed for the base conditions. Simplified strategies 1d, 1e, and 2c performed
well when the train speed was slower than 50 mph but resulted in minimum green time
violations at high speeds. This may be because the available time for pre-preemption
decreases with the increase in train speed, and, according to Figure 7-26, this available time
may not be sufficient to serve the minimum green times of the two phases they were
designed to serve during the pre-preemption. Pre-preemption strategy 3a violated the
minimum green time, even when the trains were traveling at 40 mph (since this strategy is
set to serve three phases during the pre-preemption). Based on the results, it can be
concluded that the more phases a strategy tries to serve, the more likely the minimum
green time will be violated. Based on the results from Table 7-6, only the ITPS, Modified
ITPS, and simplified strategies 1b and 2a successfully avoided the abbreviation of minimum
green times.

116
Table 7-6 Number of Average Minimum Green-Time Abbreviations for 10 Runs*
Scenario/ Strategy
Base ITPS Modified
ITPS
Simplified Strategies
1a 1b 1c 1d 1e 1f 2a 2b 2c 2d 3a
40MPH4T 1 0 0 0 0 0 0 0 0 0 0 0 0 0
30MPH10T 2 0 0 - 0 - 0 0 - 0 - 0 - -
40MPH10T 2 0 0 0 0 0 0 0 0 0 0 0 0 2
50MPH10T 3 0 0 - 0 - 1 3 - 0 - 1 - -
60MPH10T 2 0 0 - 0 - 4 6 - 0 - 1 - - * In Column 1, 40MPH4T, for example, means four trains traveling at 40 mph.
Delay Results
The average intersection delays extracted from different scenarios are shown in Figure 7-27.
It should be mentioned that the delays were extracted for each train, from the time that the
pre-preemption was activated (i.e., when the immediate upstream preemption was
deactivated) to three minutes after the deactivation of the target intersection preemption,
with the purpose of avoiding the dilution of delays if including delays during normal signal
operations. Three minutes afterward, the preemption deactivation was selected to ensure
the collection of the delays of at least one cycle length following the end of the preemption,
so as to test the effects of different returning phase sequences.
(Note: On the x-axis, 40MPH4T, for example, means four trains traveling at 40 mph)
Figure 7-27 Average Intersection Delays by Scenarios
0.0
10.0
20.0
30.0
40.0
50.0
60.0
70.0
40MPH4T 30MPH10T 40MPH10T 50MPH10T 60MPH10T
De
lay
(s/v
eh
)
Scenario
Average Intersection Delay by Scenarios
Base
ITPS
Modified ITPS
1b
1d
1e
2a
2c

117
It is noted that the ITPS, as shown in Figure 7-27, has the lowest delays in all scenarios
found among the seven tested pre-preemption strategies. The Modified ITPS improved
delays compared well to the base scenario when the train speed was not higher than 40
mph. Other pre-preemption strategies that guaranteed no violation of minimum green time
are strategy 1b and strategy 2a, as mentioned earlier. While strategy 1b induced a higher
delay than the base scenario, strategy 2a showed delay improvements only in the scenario
with 4 trains traveling at 40 mph. Both strategy 1b and 2a increased the delays when the
train speed was 30 mph. Since the two strategies served only one phase during the pre-
preemption period, the green time of the served phase might be more than what should be
provided if the train slowed down. Strategy 1d and 2c improved the delays only when the
train speed was 40 mph. Strategy 1e lowered the delays, as long as the trains were
travelling at or below 40 mph.
It is also worth mentioning that the queues back to the train track from the Powerline
Rd/Commercial Blvd intersection, which is west of the target intersection, were observed
multiple times in simulation with the implementation of strategy 1d when the approaching
train was traveling at 30 mph. The queue includes the traffic from the NB left turn and WB
through movements at the I-95/Commercial Blvd intersection. The green time for those
two movements provided by strategy 1d during the pre-preemption might be excessive, as
the train was traveling at a low speed, and thus the demand of those vehicles was not
satisfied by the existing signal plan at the intersection of Powerline Rd at Commercial Blvd.
7.4 Summary
This study tested various pre-preemption strategies using VISSIM simulation in the three
control sections. Selected findings are as follows:
Coordinated pre-preemption strategies can effectively reduce average delay along an
arterial during the period of train blockage. However, the performance is sensitive to
site configurations and pre-preemption parameters. Summarily, the coordinated pre-
preemption strategies can guarantee positive performance in terms of reducing
average delay in scenarios of high traffic volumes (Volume Level ≥ 3) and long train
duration (≥ 100 sec).
The performance of the coordinated strategies in terms of average stops is also
sensitive to site configurations. In Section I, the coordinated pre-preemptions are
more likely to reduce the average stops under high traffic volumes (volume level ≥
3). In Section II, the performance pattern is complex but still effective in most
scenarios.

118
The configuration of pre-preemption phases, including phase number, phase
sequence, phase time, and offset, also impacts the performance of the strategies.
Inappropriate parameters may lower the effectiveness of strategies and even worsen
roadway operations in some scenarios. Thus, an optimization procedure is necessary
to be developed for finding ideal parameters.
It was found that the more complex algorithms, such as ITPS and Modified ITPS,
which require the estimation of a train’s arrival time, successfully eliminate the
abbreviation of the minimum green times. In terms of delays at individual
intersections, ITPS produced the best results among the seven non-coordinated pre-
preemption strategies in all scenarios. However, ITPS-based strategy experiences
lower performance for the whole corridor comparing to coordinated pre-preemption.
Considering applicability and effectiveness at corridor level (as shown in Table 7-7),
the coordinated pre-preemption strategy is suggested for implementation in Florida.
A comparison of the tested pre-preemption strategies is given in Table 7-7.
Table 7-7 Comparison of Pre-preemption Strategies
Coordinated
Pre-preemption ITPS Modified ITPS
Optimization
Objective Whole corridor Individual intersection
Individual
intersection
Phase Mode Pre-timed Actuated Actuated
Coordination? Yes No No
Algorithm Complexity
Simple Complex Complex
Device Requirement
Standard NEMA Controller Additional Logic Module Additional Logic Module
Applicability High Low Low
Major
Advantages
Reduce delay Reduce stops
Reduce queue length
Eliminate abbreviation of minimum green
times Reduce delay
Eliminate abbreviation of minimum green
times
Offline
Optimization Required No No

119
8 CONCLUSIONS AND RECOMMENDATIONS
8.1 Summary and Conclusions
This research project investigated the potential for using advance features of traffic signal
system software platforms (ATMS.now), which is prevalently used in Florida, to alleviate
safety and mobility problems at highway-railroad at-grade crossings and adjacent arterials.
Pre-preemption phasing was developed in this study to provide “extra” green time to the
movements blocked by a train before it arrives at a crossing in order to (1) mitigate
congestion on the arterials nearby railways and (2) reduce conflicts of train-vehicle and/or
vehicle-vehicle adjacent to at-grade crossings. This study explored the technologies for
implementing key functions of a pre-preemption system, including train detection, train’s
arrival prediction, pre-preemption control algorithms, and the capabilities of ATMS.now
system. VISSIM-based simulation models were developed in this study based on three
control sections along two railway corridors (FEC and CSX) in Broward County, Florida, to
test the proposed pre-preemption strategies. A series of comparisons before-after
implementing pre-preemption strategies were conducted to validate the effectiveness of
pre-preemption strategies. Based on a comprehensive study of traffic signal pre-
preemptions, close examinations of the ATMS.now software functionalities, and in-depth
evaluations of various scenarios via intensive VISSIM microscopic simulation runs on two
developed pre-preemption strategies, the following conclusions were obtained:
Upstream preemption signals (activation or release) are suggested for triggering pre-
preemptions at downstream intersections along a railroad corridor. The advantage of
this technology is to eliminate the needs of retrieving train information from train
companies or installing new train detectors. However, the technology is restricted by
the availability of preemptions along the railroad corridors.
The prediction of ETA is the key factor in the implementation of pre-preemptions and
is the function of train speed and location of upstream preemptions. Due to the
speed variance of trains, two or more preemptions are expected at upstream
crossings, and the ideal space between the two crossings is less than 0.5 miles. An
algorithm was developed in this study to predict ETA based on the preemption logs
of the two crossings.
Two pre-preemption strategies were developed and tested in this study: coordinated
pre-preemption and ITPS-based pre-preemption. Coordinated pre-preemption aims
to clear the through traffic along an arterial as much as possible before train’s arrival.

120
A coordinated phase should be included in its phase sequence. Since all pre-
preemption phases are pre-timed, coordination pre-preemption is easy to implement
on existing traffic controllers (e.g., NAZTEC 2070N). The ITPS-based strategy aims
to reduce the number of minimum green time abbreviations at a preempted
intersection in a fully-actuated manner. Because of the complex logic of the ITPS-
based strategy, its implementation may require additional logic modules.
Based on the simulation results, the coordinated strategy can effectively improve
mobility on the arterials near a railroad crossing.
o The strategy can reduce traffic delay along the arterials by 4–60 percent,
according to geometric and traffic conditions.
The coordinated strategy can effectively improve safety on the arterials near a
railroad crossing.
o The strategy can reduce average stops along the arterials by 10–45 percent,
according to geometric and traffic conditions. Lower average stop numbers
can smooth traffic and reduce the risk of rear-end crashes.
o The strategy can reduce average queue length along the commuting direction
on the arterials by up to 100 percent, according to geometric and traffic
conditions. Shorter queue length can reduce the risk of a queue intruding into
the next intersection.
The performance pattern of the coordinated pre-preemptions is sensitive to site
features and strategy configurations.
ITPS-based pre-preemption strategies can reduce average delay and the number of
minimum green time abbreviations at individual intersections. Considering the
applicability and corridor-level performance of the two pre-preemption strategies,
coordinated pre-preemption is suggested when traffic volume is higher than 500
vphpl and train block duration is longer than 100 seconds.
A generic pre-preemption plan was developed in this study to provide guidance on
implementation of the pre-preemption strategy using ATMS.now system in Florida.
The generic plan details the procedure to (1) identify the needs of pre-preemptions;
(2) activate pre-preemptions using upstream preemption signals; (3) predict ETA
using upstream preemptions; and (4) configure ATMS.now to implement the pre-
preemption strategy.

121
8.2 Recommendations for Implementation
Based on the conclusions, the recommendations for implementing the coordinated pre-
preemption strategy in Florida are given as follows.
Train Detection and Pre-preemption Trigger
As a cost-effective alternative to train detection and pre-preemption trigger, upstream
preemptions (hereafter, along the railway corridor) are suggested if the following conditions
are satisfied:
No other train detectors are available in the control section.
The signalized intersections in the control section are connected to a traffic
management system (such as ATMS.now).
No train stations or other roadway facilities that interrupt train operations exist in the
control section.
At least one preempted intersection is available in the upstream from the target
intersection.
One upstream preemption signal can be used for pre-preemption trigger in the target
intersection if:
o Train speed is nearly constant in the control station at the same time of a day,
and
o Train speed pattern can be obtained from railway companies.
Two or more upstream preempted intersections are required if:
o Train speed variety is significant in the control section.
o Train speed pattern is unknown.
(Note: Train speed variety can be estimated using Eq. 3-6 based on historical
preemption logs)
o The distance between the two preempted intersections is not greater than 0.5
miles.
The distance between the upstream preempted intersection used as the pre-
preemption trigger and the target intersection should be less a reasonable value. The
value, which is the function of train speed and its variance, can be estimated using
Eqs. 3-1 to 3-6.

122
If these criteria cannot be satisfied, roadside train detectors are suggested.
Traveler Information
ETA/ETD information can be provided to vehicle drivers through a Dynamic Message Signs
(DMS).
Two messages can be provided: the remaining time before train’s arrival and the
roadway blockage duration.
The message should be given in a format of time intervals. For example, “Train will
arrive in 2 – 3 minutes.”
Information can be disseminated to travelers through the FDOT SunGuide system.
o A connection between the FDOT SunGuide and the ATMS.now is required.
o The estimation of ETD/ETA can be developed as a new module of the FDOT
SunGuide or imported from a third-party application into the SunGuide.
Implementation of Pre-preemption Strategy
The coordinated pre-preemption strategy is suggested to be implemented if the following
criterions are satisfied:
Significant congestion and long queues can be observed along the urban arterial
intersecting the railroad corridor.
Train blockage duration is greater than 100 sec.
Vehicle volume on the arterial is higher than 500 vphpl.
Pre-preemption triggers are available in the control section.
Pre-preemption Timing
The signalized intersections along the intersecting arterial impacted by train blockage
should be considered in the scope of pre-preemption coordination. The impact can be
observed in the field, calculated using the queue theory, or simulated.
The coordinated pre-preemption phase should be assigned to the commuting
through-movements along the arterial.
The non-coordinated pre-preemption phases should be considered if congestion
occurs in turning movements or minor movements.

123
The timing parameters (phase sequence, phase length, and phase offset) should be
optimized based on traffic demand and ETA.
Implementation of Pre-preemption using ATMS.now
Preempt 1 in a NAZTEC 2070 controller, which has the highest priority, should be
reserved for preemption operations. Preempts 3–6 can be used for pre-preemption
purposes.
The current version of ATMS.now cannot estimate ETA/ETD due to its closed system
structure. Secondary software (an external process) is needed to estimate ETA
and/or ETD.
The secondary software should be allowed to access the ATMS.now database to
retrieve preemption logs and write incident triggers in the ATMS.now SQL database:
o A READ permission is required for retrieving preemption logs and monitoring
Upstream Preemption (Controller Alarm #49). This access will not change any
information in the database.
o A WRITE permission is required for writing an incident trigger in Incident
Trigger Table, as the trigger of pre-preemption.
The secondary software may be developed through three ways:
o NAZTEC will develop an internal module to implement the ETA/ETD logic in
ATMS.now.
o FDOT or its contractors will develop a third-party application, which is
independent to ATMS.now, to implement the ETA/ETD logic.
o FDOT or its contractors will develop and integrate the ETA/ETD logic in the
FDOT SunGuide system.
Estimation of Traffic Delay using ATMS.now
To use ATMS.now to evaluate the performance of pre-preemption strategy, traffic counts at
target intersections should be imported into the ATMS.now system.
8.3 Recommendations for Future Study
Selected recommendations for future study include the following:
The performance of coordinated pre-preemptions is sensitive to site features and
pre-preemption parameters. It is necessary to develop a simulation-based

124
optimization procedure for optimizing pre-preemption parameters (phase types,
phase sequence, phase time, and offset time) for special scenarios.
More factors, except for traffic volume and train blockage duration, should be
considered in future simulations to identify the impact of these factors (e.g., distance
of the intersection from railroad crossing, train speed variance) on the performance
of the pre-preemptions. The results can be used to improve the criteria for
implementing pre-preemption in the generic plan.
The pre-preemption strategy should be upgraded considering the following factors:
o If a pedestrian movement is being serviced, its phase will not be truncated by
a pre-preemption phase.
o Blank-out signs for right-turn and left-turn movements onto railroad tracks
should be used.
o Consecutive preemptions from two separate trains in opposite direction at the
grade crossings with two tracks should be considered cautiously.
Hardware-in-loop (HIL) traffic simulation uses real traffic signal controller hardware
to control simulated traffic. This simulation is done by interfacing a traffic simulation
model with one or more traffic signal controllers. The traffic simulation model is a
computer model of the interaction of vehicles with each other, vehicles with the
roadway, and vehicles with the traffic control system. In most traffic simulation
models, the traffic control system is emulated in software, but with HIL simulation,
the emulated traffic control system is replaced with real traffic control hardware. In
future, an HIL system that integrates ATMS.now is suggested to test and
demonstrate the performance of the pre-preemptions in an actual environment.
A pilot project is suggested. The purposes of the pilot project are to: (1) validate the
technical feasibility and maturity for implementing pre-preemptions using ATMS.now;
(2) demonstrate the implementation of pre-preemption strategies in a selected site;
and (3) accumulate experience for implementing the pre-preemption strategies
widely. The pilot project is suggested to include, but not limit to, the following tasks:
o Develop the ETA/ETD estimation process (an internal module in ATMS.now, a
third-party software developed a contractor, or an additional module in FDOT
SunGuide)

125
o Select a railway corridor which meets the pre-preemption implementation
criteria.
o Develop a site-specific pre-preemption phase timing
o Implement a pre-preemption strategy in the selected railway corridor
o Update the generic pre-preemption plan based on the experience collected in
the pilot project.
o Collect performance measures and evaluate the implementation of the pre-
preemption strategy.

126
BIBLIOGRAPHY
1. Code of Federal Regulations. Title 49, Part 234.225. Activation of Warning Systems.
2011.
2. Cho, Hanseon, and Laurence R. Rilett. Improved Transition Preemption Strategy for
Signalized Intersections near At-Grade Railway Grade Crossing. Journal of
Transportation Engineering 133(8) (2007): 443-454.
3. Datta, T., Gates, T. J., Savolainen, P. T., Fawaz, A., & Chaudhry, A. Timing Issues for
Traffic Signals Interconnected with Highway-Railroad Grade Crossings. Final Report #
RC-1578, Michigan Department of Transportation, Lansing, MI, 2013.
4. Federal Highway Administration (FHWA). Manual on Uniform Traffic Control Devices.
Washington, DC, 2009.
5. Florida Department of Transportation. Highway‐Rail Grade Crossing Safety Action Plan.
Florida Department of Transportation, Tallahassee, FL, 2011.
6. Korve, H. NCHRP Synthesis of Highway Practice 271: Traffic Signal Operations near
Highway-Rail Grade Crossings. Washington, DC: TRB, National Research Council, 1999.
7. Long, G. Clearance Time Requirements at Railroad-Preempted Traffic Signals. Florida
Department of Transportation, Tallahassee, FL, 2002.
8. Roberts, Craig A., and Jamie Brown-Esplain. Congestion Mitigation at Railroad-Highway
At-Grade Crossings. Research Report, Arizona Department of Transportation, Casa
Grande, AZ, 2005.
9. Ruback, Leonard G., Kevin Balke, and Roelof Engelbrecht. Non-Vital Advance Rail
Preemption of Signalized Intersections Near Highway-Rail Grade Crossings. Texas
Department of Transportation, Austin, TX, 2007.
10. Traffic Engineering Council Committee. Preemption of Traffic Signals Near Railroad
Crossings. Institute of Transportation Engineers (ITE), 2003.
11. Venglar, P.S., M.S. Jacobson, S.R. Sunkari, R.J. Engelbrecht, and T. Urbanik. Guide for
Traffic Signal Preemption near Railroad Grade Grossing. Texas Department of
Transportation, Austin, TX, 2000.
12. Venglar, Steven. Advanced Intersection Controller Response to Railroad Preemption.
Texas Transportation Institute, Texas A&M University, College Station, TX, 2000.

127
APPENDIX: CASE STUDY TO PREDICT ONSET AND
REMOVAL OF PREEMPTIONS
The methodology to predict the onset and removal of preemption using only historical data
and real time data is illustrated in this case study.
Step 1: As discussed earlier, at least one of historical preemption activity data needs to be
collected and analyzed to generate median preemption times (duration of preemption at
each grade crossing) and median travel times (time differential between the removals of
preemptions for two successive grade crossings). Based on the data collected in the South
Florida Rail (SFR) Corridor, Table A-1 illustrates the median preemption times and median
travel times for the AM peak, off peak, and PM peak.
Table A-1 Median Preemption and Link Travel Time for Northbound Direction for
SFR Corridor
Step 2: Take an example of a preemption activity in the SFR corridor. Table A-2 illustrates
the preemption activity for a train at about 7:00 AM on January 10, 2013.
Table A-2 Example of Preemption Activity for Northbound Train in SFR Corridor
Preemption ON Preemption OFF
W Oakland Park Blvd 7:10:21 7:11:05
Prospect Rd 7:11:02 7:12:03
Commercial Blvd 7:11:41 7:12:29
Step 3: The objective now is to use the historical data in Table A-2 and real-time data to
predict the onset of preemption events. Since we are relying only on the activation of the
first preemption to know that a train is in the corridor, the first prediction will rely
completely on historical data when preemption is activated at Oakland Park Blvd, which is
designated as Event 1. Hence, at Event 1, the remaining events (Events 2–6) are predicted
based on historical data in Table A-2. At subsequent events, for example, at Event 2, the
remaining events are corrected by the error observed at Event 2. In this case, Event 2 was
Grade Crossing Name AM Off PM All AM Off PM All
Grade Crossing 1 W Oakland Park Blvd 0:00:48 0:00:57 0:00:57 0:00:57
Grade Crossing 2 Prospect Road 0:01:00 0:01:03 0:01:01 0:01:02 5966 0:00:42 0:00:49 0:00:42 0:00:45
Grade Crossing 3 Commercial Blvd 0:00:56 0:00:49 0:00:48 0:00:49 2748 0:00:24 0:00:26 0:00:25 0:00:25
Grade Crossing 4
Grade Crossing 5
Median Link Travel TimeMedian Preemption Duration
Link Length

128
predicted to occur at 7:11:03. However, it actually occurred at 7:11:02, an error of 1
second. Hence, at Event 2, the remaining events are corrected by 1 second. The errors in
the prediction for each event at various stages are illustrated in parenthesis in Table A-3.
Table A-3 Example of Prediction of Preemption Activities Based on Historical Data
and Corrections Based on Real-Time Data
Event # Stage Predictions
at Event 1
Predictions
at Event 2
Predictions
at Event 3
Predictions
at Event 4
Predictions
at Event 5
2
Onset of
preemption at Prospect Rd
7:11:03
(+0:00:01) - - - -
3
Release of
preemption at W Oakland Park Blvd
7:11:09 (+0:00:04)
7:11:08 (+0:00:03)
- - -
4 Onset of preemption at
Commercial Blvd
7:11:27 (-0:00:14)
7:11:26 (-0:00:15)
7:11:23 (-0:00:18)
- -
5
Release of
preemption at Prospect Rd
7:12:03
(0:00:00)
7:12:02
(-0:00:01)
7:11:59
(-0:00:04)
7:12:17
(+0:00:14) -
6
Release of
preemption at Commercial Blvd
7:12:23 (-0:00:06)
7:12:22 (-0:00:07)
7:12:19 (-0:00:10)
7:12:37 (+0:00:08)
7:12:22 (-0:00:07)
The exercise of predicting the onset of preemption activities using only historical data and
real-time preemption data can show mixed results, as illustrated in Table A-3. Prediction of
some preemption activities are more accurate than others and depend on the behavior of
the train. However, the train behavior is not observed until the train activates a minimum of
2–3 events. Hence, such a methodology is still effective to implement pre-preemption
strategies that can be deployed reasonably quickly and that can tolerate some errors in the
prediction of preemption events.