cope-smarter - a decision support system for analysing the
TRANSCRIPT

General rights Copyright and moral rights for the publications made accessible in the public portal are retained by the authors and/or other copyright owners and it is a condition of accessing publications that users recognise and abide by the legal requirements associated with these rights.
Users may download and print one copy of any publication from the public portal for the purpose of private study or research.
You may not further distribute the material or use it for any profit-making activity or commercial gain
You may freely distribute the URL identifying the publication in the public portal If you believe that this document breaches copyright please contact us providing details, and we will remove access to the work immediately and investigate your claim.
Downloaded from orbit.dtu.dk on: Mar 13, 2022
COPE-SMARTER - A decision support system for analysing the challenges,opportunities and policy initiatives: A case study of electric commercial vehiclesmarket diffusion in Denmark
Barfod, Michael Bruhn; Kaplan, Sigal; Frenzel, Ina; Klauenberg, Jens
Published in:Research in Transportation Economics
Link to article, DOI:10.1016/j.retrec.2016.04.005
Publication date:2016
Document VersionPeer reviewed version
Link back to DTU Orbit
Citation (APA):Barfod, M. B., Kaplan, S., Frenzel, I., & Klauenberg, J. (2016). COPE-SMARTER - A decision support system foranalysing the challenges, opportunities and policy initiatives: A case study of electric commercial vehiclesmarket diffusion in Denmark. Research in Transportation Economics, 55, 3-11.https://doi.org/10.1016/j.retrec.2016.04.005
COPE-SMARTER – A decision support system for analysing the challenges,
opportunities and policy measures: A case study of electric commercial
vehicles market diffusion in Denmark
Michael B. Barfoda, Sigal KAPLAN
a,b*, Ina Frenzel
c, Jens KLAUENBERG
c
aTechnical University of Denmark, Department of Transport
bFaculty of Traffic Sciences, TU Dresden, 01062 Dresden, Germany
cGerman Aerospace Center (DLR), Institute of Transport Research
* corresponding author
Department of Transport, Technical University of Denmark
Bygningstorvet 116B, 2800 Kgs. Lyngby, Denmark
Tel: + 45.4525.6559, Fax: +45.4593.6533, Email: [email protected]
2
Abstract
Stakeholder’s strategies in encouraging wide-scale market penetration depend on their
perceptions. This study focuses on perceptions of Danish practitioners in policy-making
organizations regarding the perceived challenges, opportunities and policy measures for the
majority-market adoption of electric commercial vehicles (ECVs) in commercial sector in
Denmark. We propose a new four-step expert-based technique, named COPE-SMARTER, for
evaluating the market diffusion of environmental friendly technologies by combining a private
case of SWOT analysis and Multi-criteria decision analysis (MCDA) methods. We focus on the
perceptions regarding: (i) the potential promotional strength of motivators for ECV market
penetration, (ii) the severity of the technological, financial, physical and operational challenges,
(iii) the efficiency of policy initiatives in encouraging the market diffusion of ECVs, (iv) the
expected market penetration rates by target year. The results show the strength of the COPE-
SMARTER technique in generating a clear, coherent, and tractable evaluation. Severe challenges
are financial, operational and technological, with high purchase prices being by far the most
severe. The opportunities are financial and environmental, with overall savings in the long-term
as the opportunity with the highest promotional strength. Effective policy-measures are low
registration fee for ECVs, state subsidies for the purchase or use of ECVs, and emission-based
taxes.
Key words: commercial vehicles; electric vehicles; decision makers; focus group;
MCDA; SWOT.
3
1. Introduction
Urban freight and commercial vehicles make up about 10% of the share of vehicle-
kilometre travelled, but they account for 50% of the COX emissions and 90% of the NOX and
PM emissions (Feng and Figliozzi, 2013). The stress imposed by commercial vehicles on urban
systems in terms of air pollution and noise is expected to increase, due to the fast growth of
commercial vehicle activity (Feng and Figliozzi, 2012). A possible technology-oriented solution
are electric commercial vehicles (ECVs) that, along with improvements in vehicle routing
efficiency, can lead to mitigating the effect of commercial vehicles in urban areas without radical
activity reduction (Feng and Figliozzi, 2013; Bakker et al., 2014).
The feasibility of ECVs as a possible solution depends on their wide-scale adoption in the
commercial sector which depends on various stakeholders: consumers, planners, car
manufacturers, and policy-making organizations. So far, studies have tried to shed light on the
consumers’ side by exploring the motivations and challenges for the introduction of ECVs and
other alternative fuel vehicles (AFVs). Haller et al. (2007) focused on cost effectiveness and
emission reductions based on an interim assessment of a local government’s ten-year plan for
converting from conventional fuel to AFVs. Bae et al. (2011) explored the likely effects of
technological developments and instruments (i.e., technology, efficiency, fuel costs, emission
regulations, tax rates, adaptation costs) on the adoption of AFVs by firms. Sierzchula et al.
(2014) investigated the role of financial incentives, charging infrastructure, and local presence of
production facilities on the market penetration of ECVs. Wikström et al. (2014) examined the
relationship between ECVs’ user satisfaction and confidence and ECVs’ usage patterns and
practical experience. Kirk et al. (2014) found that possible challenges for ECVs’ adoption among
fleet managers were fuel costs, recharging infrastructure, vehicle purchase costs and residual
4
value, lack of knowledge and vehicle weight. Sierzchula (2014) found that American and Dutch
organizations that adopted ECVs were interested in testing new technologies, receiving
government grants, and improving the organization’s public image. Kaplan et al. (2015)
established a linkage between ECVs’ procurement intentions and the theory of planned behavior,
namely positive attitudes and subjective norms towards ECVs, familiarity with ECVs and
perceived operational ease.
We sheds light on the perceptions of Danish practitioners in policy-making organizations
as stakeholders in the process of ECVs’ market adoption in Denmark. Previous studies
addressing such stakeholders for exploring the market penetration of ECVs consulted policy-
makers within expert panels for assessing the importance of decision criteria to evaluate the
suitability of AFVs via multi-criteria decision analysis, as means for overcoming the uncertainty
involved with new technologies by reflecting upon the consumer choice. For the choice of ECVs
in the commercial sector, Tzeng et al. (2005) requested bus manufacturers, researchers and bus
operators to assess the importance of vehicle attributes related to costs, benefits, maintenance
and operation for choosing the most suitable alternative fuel bus for public transport in urban
areas in Taiwan. Yavuz et al. (2015) used an expert evaluation of multiple vehicle features,
including energy efficiency, air pollution, maintenance costs, and comfort, for multi-criteria
decision analysis aimed at choosing AFVs’ selection of a home health-care service provider in
the US. Nevertheless, in addition to the consumers’ perspective, the perceptions of practitioners
in policy-making organizations as stakeholders in the process of market adoption have a stand-
alone merit because the stakeholder’s strategies are dependent on their interests, perceptions and
expectations. In fact, the gap between the objective overview of challenges, motivations and
policy measures and their stakeholders’ perceptions can be staggering. Based on a conceptual

5
analysis, Browne et al. (2012) provided a long list of financial, technical, institutional and legal
barriers that are hypothesized to be relevant to EVs’ market diffusion, and suggested an equally
wide range of economic, communication, infrastructure development and regulatory policies.
Nevertheless, both the study of Bakker et al. (2014) and Kirk et al. (2014) showed that
stakeholders have a much narrower perspective of policy measures in mind, depending on their
interests and expectations.
We focus on the perceived challenges, opportunities and policy measures for majority-
market adoption of ECVs in commercial vehicle fleets in Denmark. According to the Rogers’
market diffusion model, which is relevant for technological innovation (see, e.g., Rogers, 2004),
majority-market diffusion is achieved upon arriving to a critical mass of adopters from which
market diffusion is self-sustaining. Thus, while early-market penetration depends on facilitating
ECVs’ adoption by innovating pioneers through pilot projects and financial incentives, majority-
market adoption occurs when a certain threshold is reached in terms of alleviated challenges and
policy incentives. Thus, we focus on the perceptions of practitioners in policy-making
organizations regarding: (i) the potential promotional strength of motivators for ECVs’ market
penetration; (ii) the severity of the technological, financial, physical and operational challenges;
(iii) the efficiency of policy initiatives in encouraging ECVs’ market diffusion; (iv) the expected
market penetration rates by target year.
The remainder of the paper is structured as follows. Section 2 introduces the research
methods in terms of collected data and analysis. Then, results are presented and discussed in
section 3. Last, conclusions and policy implications are drawn in Section 4.

6
2. Methods
In this study, we propose a new expert-based technique for evaluating the possibility of
market diffusion of new environmental friendly technologies by combining a private case of
SWOT analysis for identifying strengths, weaknesses, opportunities and threats with Multi-
Criteria Decision Analysis (MCDA) methods based on the decomposition approach, namely the
divide-and-conquer (DAC) principle. The method, which we name COPE-SMARTER, is aimed
at identifying challenges, opportunities, and policies for promoting innovative environmental
technology solutions, by using a combination of the SMARTER (Simple Multi-Attribute Rating
Technique Exploiting Ranks) technique with Swing-Weights with a new importance-impact
interpretation. In this study, the method is applied in the transport planning context, but it can be
readily transferable for evaluating new technologies and action-protocols in other fields such as
energy, water, environment, health-care, epidemiology, food and education.
The method requires a panel of stakeholders, which can be elicited by applying standard
procedures (see, e.g., Sackman, 1974; Edwards and Barron, 1994), as conducted for example in
the works of Shiftan et al. (2003) and Wang et al. (2014). In this study, 16 practitioners in policy-
making organizations in Denmark were chosen as the main stakeholders. While standard
procedures impose no limitations of sample size (see, e.g., Sackman, 1974; Edwards and Barron,
1994), the sample size in this study was determined by the conferencing procedure within a focus
group arrangement, which required the stakeholder to meet, while assuring that the participants
represent important policy-making organizations related to the ECV market in Denmark.
Notably, in the case that a Delphi method is used the sample size can be larger. The main focus
of this study is on practitioners in policy-making organizations because they have an important
role in facilitating knowledge exchange and diffusion, aligning expectations across stakeholders,
7
promoting campaigns, experiments, and pilot projects, designing development scenarios and
trajectories through master plans, providing supportive environment stimulating entrepreneurs to
take pioneering actions, generating funds, and enacting policy interventions. The importance of
practitioners in policy-making organizations is highlighted by the findings of Roumboutsos et al.
(2014) that indicate the need to transfer leadership from central authorities to municipal
authorities in order to move from the initiation stage to the implementation stage of ECVs’
logistics. Thus, the perceptions of practitioners in policy-making organizations regarding ECVs
are important for understanding development trajectories and techno-institutional lock-ins
affecting the wide-scale adoption of ECVs as a new technology.
After eliciting the panel of stakeholders, the proposed method has four consecutive steps.
The first step consists of using the SWOT framework in order to identify the challenges
and opportunities associated with the new technology, as well as the effective policy instruments
for alleviating the challenges and seizing the opportunities as facilitators for technology
diffusion. The challenges are challenges to be alleviated, which can be associated with the
inherent product attributes (i.e., range, speed, price) or the consumer-technology interaction (e.g.,
range-anxiety). The opportunities are motivating factors that can be used to promote the
technology and can be associated with inherent consumer attributes (i.e., cost and time saving
skills, environmentally friendly attitudes and norms), and the consumer-technology interaction
(i.e., perceived operational ease, cost-effectiveness, comfort, safety). The policy instruments are
mechanisms that utilize the strengths and weaknesses of the organizational system in which the
new technology and the consumer operate and interact, in order to resolve the challenges (e,g.,
moving to a green taxation system) and seize the opportunities (e.g., marketing campaigns that
highlight the green aspects of ECVs). Using this structured framework helps in avoiding three
8
important biases that lead to partial analysis. The first bias is a framing bias, namely focusing
solely on challenges and policy instruments, while neglecting the opportunities for diffusion
enhancement (see, e.g., Kirk et al., 2014). The second bias can derive either from memory-recall
problems or from strategic-response bias, when stakeholders act on the basis of a narrow
perspective that matches their interests and expectations (see, e.g., Bakker et al., 2014). The third
bias is a confusion bias when technology solution attributes and policy interventions are both
viewed as product related attributes, for example fuel costs (e.g., Yavuz et al. 2015;
Mohamadabadi et al., 2009).
The chosen challenges, opportunities and policy instruments derive from the results of
the study of Kaplan et al. (2015), who proposed a comprehensive framework for understanding
the motivations and challenges to the introduction of ECVs based on a survey across fleet
managers in Austria, Denmark and Germany. The challenges consist of technological, financial,
physical, operational and psychological challenges to be alleviated. The opportunities are related
to the positive perception of ECVs. The policy instruments include both ’carrots’, namely
incentives for using ECVs, and ‘sticks’, namely policies for discouraging the use of conventional
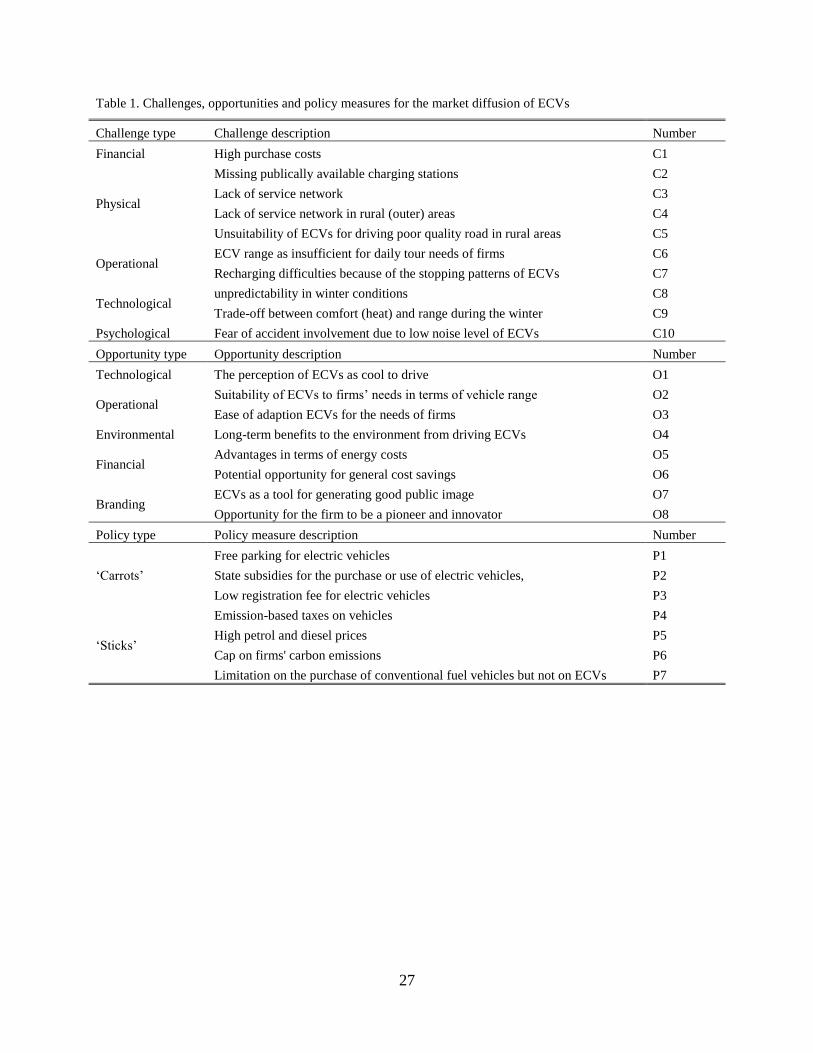
vehicles. The challenges, opportunities and policies are described in table 1.
[Insert Table 1]
The second and the third steps concern the rating of the challenges, opportunities and
policy measures in terms of their relative importance and impact, respectively. In these two
steps, taking a decomposition approach, each of the challenges, opportunities and policy
measures are evaluated as separate items by applying the SMARTER and the Swing Weights
procedures. While some of the items may have a synergetic or complimentary effects, a holistic
evaluation is an extremely complex task which contains considerable random error, in particular

9
when there is a large number of item combinations. However, taking a decomposition approach
helps in defining the decision problem, allows considering a large number of items on multiple
dimensions, and promotes communication of value conflicts among the participants (Fischer,
1997; Morera and Budescu, 1998).
For the second step, namely evaluating the importance of the challenges, opportunities
and policy measures, we apply the SMARTER technique, proposed by Edwards and Barron
(1994), which is an advancement of the SMART (Simple Multi-Attribute Rating Technique)
suggested by von Winterfeldt and Edwards (1986). SMART is a MCDA method that allows
evaluating finite number of decision alternatives with respect to a finite number of performance
criteria.
The purpose of such an analysis is to rank the items in a subjective order of preference
and, if possible, to rate the overall importance and performance of the items via the proper
assignment of numerical grades (Belton and Stewart, 2002). The method is applied to evaluate
the severity of the challenges, the potential of the opportunities and the efficiency of the policy
measures with respect to their role in the market diffusion of ECVs. The challenge severity is
defined as the importance of the challenge multiplied by its alleviation ease, the opportunity
potential is defined as the importance of the opportunity multiplied by its promotional strength,
and the efficiency of the policy measure is defined as its importance multiplied by its ability to
cope with the challenges and seize the opportunities.
SMART, the original variant of the proposed method, is based on a linear additive model
which implies that the overall value of a specific item is calculated as the total sum of the
performance score multiplied with the weights. In the technique, ratings (scores) are assigned
directly in the natural scales of the attributes. However, assigning exact numerical weights in
10
SMART can be a difficult task which is susceptible to uncertainty and the confidence level
associated with such weights. SMARTER overcomes this problem by requesting the participants
to engage in a simpler cognitive task of ranking the items in order of importance. The,
SMARTER assigns predetermined ‘surrogate’ weights to the criteria. These ‘surrogate’ weights
are based on the assumption that generated weights may be more precise than weights produced
by the participants. While a number of methods that enable the ranking to be translated into
‘surrogate’ weights representing an approximation of the ‘true’ weights have been developed, we
use the Rank Order Distribution (ROD) weights, which provide the closest approximation to
participants’ preferences as shown by Roberts and Goodwin, (2002). ROD is a weight
approximation method that assumes that valid weights can be elicited through direct rating. In
the direct rating method the most important criterion is assigned a weight of 100 and the
importance of the other criteria is then assessed to this benchmark. The obtained ‘raw’ weights
are then normalised to sum to 1. These ranges can be approximated by representing all of the
inequalities by less-than-or-equal-to expressions. The uncertainty about the ‘true’ weights can
then be represented by assuming uniform distribution for them. In order to determine ROD
weights for general problems, it is needed to consider the probability distributions for the
normalised weights that follow from the assumptions about the distributions of the ‘raw’
weights. The density functions are a series of piecewise equations. The means of each rank order
distribution weights have been found mathematically and are provided by Roberts and Goodwin
(2002).
In the third step, the analysis technique of swing weights is applied, which is usually
considered to be the most correct theoretical method for eliciting criteria weights (Barfod and
Salling, 2015). By using visually supported scales, participants consider the swing from worst to

11
best performance for each item on a scale of 0-100. Notably, while the technique is commonly
used for importance ranking, we take an untraditional interpretation for performance rating.
Instead of simple importance rating, the third step concerns the rating of the challenges in terms
of their severity, which comprises importance and alleviation ease, rating the opportunities in
terms of their promotional strength (potential), and rating the policy measures in terms of their
efficiency for the market diffusion of ECVs.
In the traditional approach for importance ranking, SMARTER and Swing Weights are
considered as substitutionary (e.g., Wang et al., 2009; Barfod and Salling, 2014). However, in
our proposed approach they measure different aspects and are thus complimentary. For example,
some challenges may be considered important for the consumer but relatively easy to resolve,
which reduces the overall challenge severity, while others may be considered as less important
but more difficult to resolve, which increases the overall challenge severity. Therefore, the
overall score is a function of the ratings obtained in step 2 and step 3. The ROD weights, derived
from the SMARTER procedure, represent the relative importance of the items. The swing rates
represent the performance of each item. For each item and each participant, the overall score is
calculated by multiplying the ROD weights and the swing weight to form a matrix of overall
scores. The scores are normalized to one in order to obtain the normalized impact score for each
item. The normalized scores are then averaged across the participants under the assumption that
they have equal importance in the decision making process. Notably, while in the current study
the items were rated with respect to a single objective of market diffusion, the method can be
generalized to the attainment of multiple decision objectives by applying the multi-attribute
utility theory (MAUT), the regret-based approach or the utility-regret model (see Wang et al.,

12
2014) as useful tools for calculating the overall score of the challenges, opportunities and policy
measures.
The last step is a conferencing procedure where the participants are requested to state the
market diffusion on ECVs for various target years as a trigger for reflecting in a group discussion
on resolving the challenges, using the opportunities, and implementing the policy measures
towards different target years. In the conferencing procedure, a majority and minority group
decisions can be reached concerning the feasible target year for reaching a specific market
diffusion level on the basis of the ease of resolving the challenges, using the opportunities and
the efficiency of the policy initiatives. Last, additional perspectives and discussion points are
raised and discussed to tackle the complexity of reaching the market diffusion goals in each
target year.
3. Results
3.1 Multi-criteria decision analysis
The COPE-SMARTER scores representing the impact as the combination of importance
and performance for the challenges, opportunities, and policy measures, are presented in Figures
1 and 3. The market penetration rate in each target year is provided in table 2. The practitioners
in policy-making organizations generally agreed on the most severe challenges and the most
effective policy measures, but had a more diverse view on the best opportunities.
[Insert Figure 1]
Regarding the challenges, the vast majority of the interviewed practitioners in policy-
making organizations perceived the financial, operational and technological challenges as the
most severe ones. The physical infrastructure and safety, with an overall score close to zero,
were hardly perceived as challenges at all. The most severe challenge unanimously perceived by

13
the panel was by far the high purchase price of ECVs. The second most severe challenge was
perceived to be the ECVs’ range that was considered as inadequate for accommodating the range
needs of firms for their daily tours. The third and fourth most severe challenges were close in
their scores and were related to winter operation (i.e., reliability in winter conditions and need to
use the battery power for heating). The stop pattern of vehicles in their daily tours (i.e., having
the possibility to stop for 30 min. or more during the day) was perceived by seven experts as a
significant challenge, but the overall score of this challenge is by far lower than the scores of the
other operational challenges. Nevertheless, in a minority opinion one expert viewed the stop
pattern of companies as the most severe challenge.
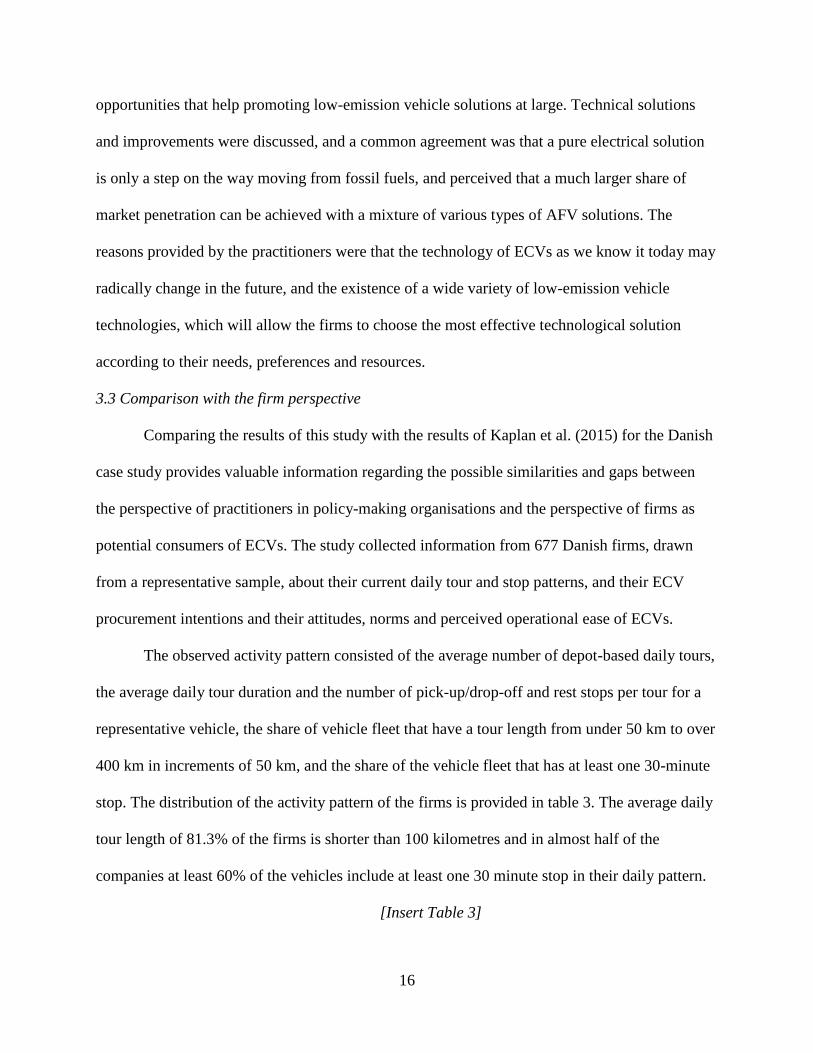
Unlike in the case of the unanimous decision regarding the severity of the challenges, the
practitioners were divided into three groups when looking at the opportunity with the highest
promotional strength. The leading opportunities were the long-term environmental benefits,
which were viewed by five practitioners as the opportunity with the highest score, the general
cost savings, and the suitability of ECVs to the firms’ needs in terms of vehicle range. Each of
these opportunities was viewed by four practitioners as the one with the highest score.
Nevertheless, when considering the three opportunities with the highest potential, more than ten
of the practitioners in policy-making organizations agree that the two financial motivations of
cost-savings in daily use (i.e., energy costs and overall savings in the long-term) should be
included among the three opportunities with the highest promotional strength, and seven
practitioners viewed the long-term environmental benefits as one of the two opportunities with
the highest promotional strength. ECVs as a tool for generating good public image and their
suitability to the firms’ needs were viewed among the three best opportunities by five and six
practitioners, respectively. The opportunity for the firm to be a pioneer and an innovator, and the

14
perception that ECVs are cool to drive, were viewed as the second or third best opportunity by
two and three practitioners, respectively.
[Insert Figure 2]
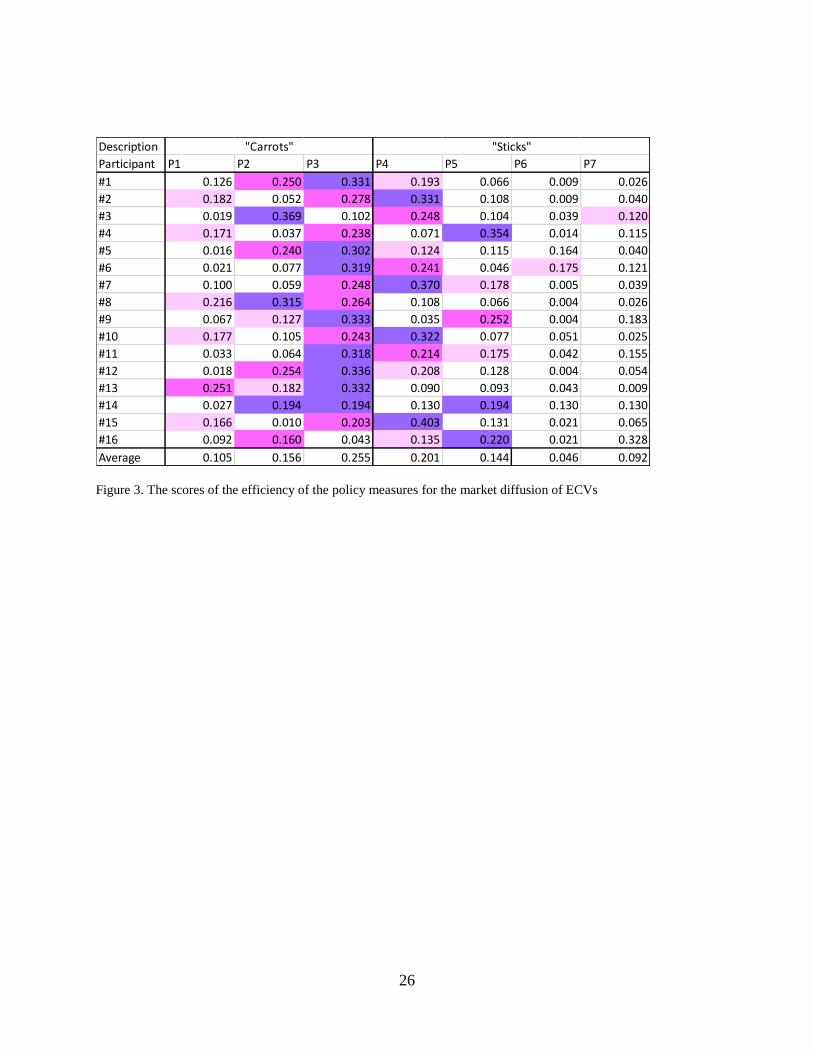
Regarding the efficiency of the policy measure, the practitioners in policy-making
organizations almost unanimously agreed that in general ‘carrot’ are more effective than ‘stick’
policy measures. Most of the practitioners ranked a combination of two ‘carrots’ and one ‘stick’
among the three most effective policy measures. In terms of type, the three policy measures that
were ranked as the most or second most effective by the practitioners are financial policy
measures: low registration fees for ECVs, state subsidies for the purchase or use of ECVs, and
emission-based taxes on vehicles. Among these three measures, low registration fees for ECVs
were by far the most effective policy measure, considered by almost all the practitioners to be
either the most or the second most effective one. High gasoline and diesel prices were considered
as the three most effective measures among a third of the participants. Free parking was
considered to be the third most effective policy measure by a third of the participants.
Limitations on carbon emissions or the purchase of conventional vehicles were considered by far
the least effective policy measures. The practitioners ranked the policy measures independently
and were not requested to choose a preferred policy package. Nevertheless, looking at the three
most effective measures ranked by each participant, the combination of low registration tax and
emission-based taxes was chosen by eight practitioners as most effective, and the combination of
low registration tax and state subsidies was chosen by seven practitioners. Nevertheless, the
combination of low registration taxes, state subsidies and low emission taxes were ranked among
the three most effective measures only by three participants.
[Insert Figure 3]
15
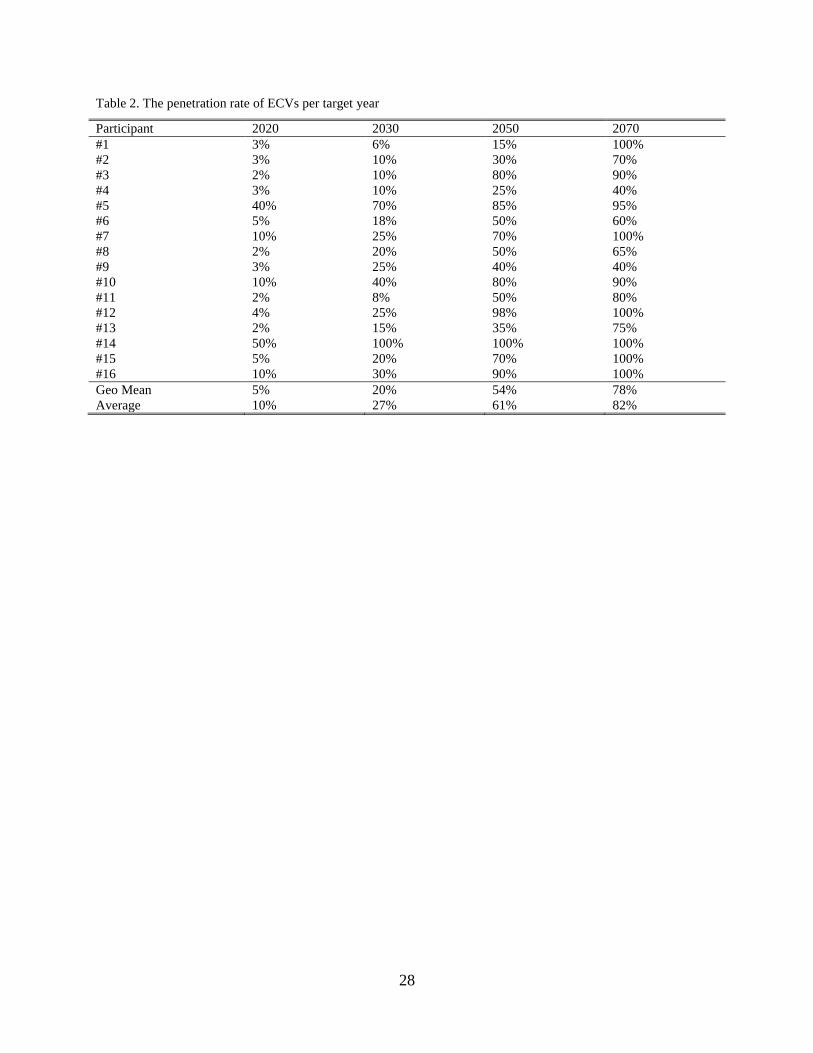
Almost of the practitioners in policy-making organizations agreed on the market
penetration rate for ECVs per target year. The agreed penetration rate was 5-10% until 2020, 20-
30% until 2030, 60% until 2050, and 80% until 2070. Interestingly, in the conferencing
procedure the practitioners agreed that ECVs will not reach their full potential market
penetration because they will compete with other technological solutions for low-emission
vehicles. In a minority opinion, two practitioners perceived a much faster penetration rate of 40-
50% until 2020 and 70-100% until 2030. These two practitioners perceived the high purchase
price of ECVs as the most important challenge, the advantages in terms of energy costs and
general cost savings as the opportunities with the highest promotional effect, and high petrol and
diesel prices and low registration fee for electric vehicles as the most efficient policy measures.
Thus, these two practitioners viewed a more radical change in the financial aspects of car use
that will lead to a faster market penetration of ECVs.
[Insert Table 2]
3.2 Conferencing procedure
In the conferencing procedure, the practitioners pointed out that, in order to achieve
significant impact, it is necessary to decide upon an effective a policy-package consisting of
several policy measures, for creating a synergetic effect. Moreover, they pointed out that an
important challenge for ECVs’ market penetration is associated with prejudice against this new
technology, which is partly related to the lack of information and partly to the collapse of “Better
Place” in Denmark, and thus better information diffusion about the features of ECVs’ technology
and the opportunities associated with them may help in promoting their market diffusion. A
longer discussion questioned the focus on ECVs as a sole technological solution. Namely, the
practitioners underlined that policy-making efforts should be focused on challenges and
16
opportunities that help promoting low-emission vehicle solutions at large. Technical solutions
and improvements were discussed, and a common agreement was that a pure electrical solution
is only a step on the way moving from fossil fuels, and perceived that a much larger share of
market penetration can be achieved with a mixture of various types of AFV solutions. The
reasons provided by the practitioners were that the technology of ECVs as we know it today may
radically change in the future, and the existence of a wide variety of low-emission vehicle
technologies, which will allow the firms to choose the most effective technological solution
according to their needs, preferences and resources.
3.3 Comparison with the firm perspective
Comparing the results of this study with the results of Kaplan et al. (2015) for the Danish
case study provides valuable information regarding the possible similarities and gaps between
the perspective of practitioners in policy-making organisations and the perspective of firms as
potential consumers of ECVs. The study collected information from 677 Danish firms, drawn
from a representative sample, about their current daily tour and stop patterns, and their ECV
procurement intentions and their attitudes, norms and perceived operational ease of ECVs.
The observed activity pattern consisted of the average number of depot-based daily tours,
the average daily tour duration and the number of pick-up/drop-off and rest stops per tour for a
representative vehicle, the share of vehicle fleet that have a tour length from under 50 km to over
400 km in increments of 50 km, and the share of the vehicle fleet that has at least one 30-minute
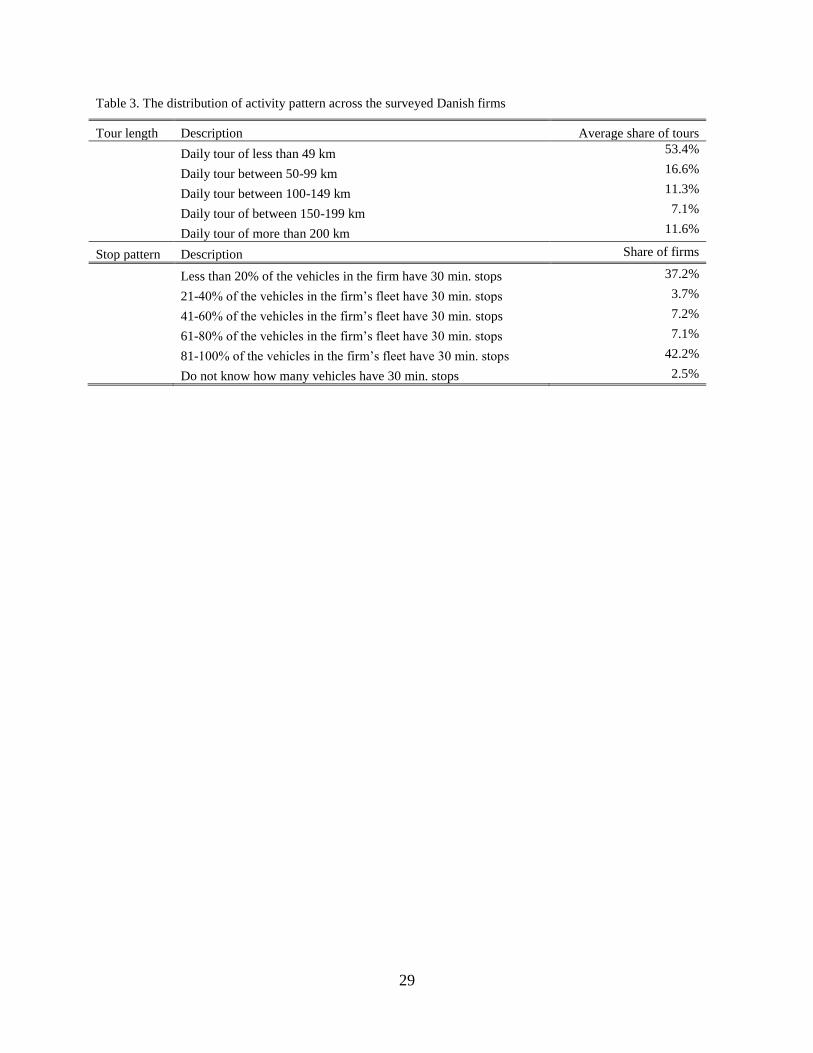
stop. The distribution of the activity pattern of the firms is provided in table 3. The average daily
tour length of 81.3% of the firms is shorter than 100 kilometres and in almost half of the
companies at least 60% of the vehicles include at least one 30 minute stop in their daily pattern.
[Insert Table 3]

17
The attitudes towards ECVs comprised interest in ECVs, perceived level of familiarity
with ECV technology, positive attitudes towards ECVs as an environmentally friendly and
energy saving transport mode, and perception of ECVs as a passing trend. The subjective norms
referred to other firm managers and politicians in the same industrial sector and in geographical
proximity to the firm, and regarded conversations about ECVs use and purchase, positive
opinions about ECVs, and expectations of politicians that ECVs would be introduced in this
industrial sector. The perceived behavioural control targeted perceived difficulties to use EVs,
namely high price, limited range and speed, lack of service network and recharging
infrastructure, maintenance ease, road safety, parking considerations, energy cost-savings and
financial purchase incentives. The attitudinal items were rated on a 5-point Likert scale ranging
from completely disagree to fully agree. The results of the attitudinal items that correspond to the
current study are provided in table 4. In terms of the challenges, the majority of the fleet
managers perceive that the purchase price is too high (75.6%) and that there is missing
recharging infrastructure (59.3%). Almost half of the fleet managers answered "neither agree nor
disagree" to the questions about the reliability and safety of ECVs, indicating a possible lack of
knowledge or experience with ECVs. Nevertheless, less than 20% of the fleet managers think
that ECVs are unreliable or unsafe. Regarding the opportunities, 76.2% of the fleet managers
think that ECVs have long-term environmental benefits, while only 41.1% view them as a
potential opportunity for general cost savings. 51.1% view ECVs as a tool for generating good
public image and 47.1% agree that ECvs are suitable for the driving range needs of the firms.
Regarding the policy measures, 64.3% and 53.2%of the fleet managers, respectively, agree that
tax benefits and free parking are beneficial for encouraging the use of ECVs.
[Insert Table 4]

18
4. Conclusions
We focus on the perceptions of practitioners in policy-making organizations regarding
the severity of the challenges, the opportunities and the policy measures for the market diffusion
of ECVs. These perceptions are important for the diffusion of ECVs because stakeholder’s
strategies in encouraging their wide-scale market penetration are dependent on their perceptions.
While most previous research on the market penetration of ECVs focused on the demand side
from the firm perspective, understanding the perspective of practitioners in policy-making
organizations in addition to the firms will contribute to a dialogue that will eventually lead to a
successful market diffusion.
To perform the analysis, we propose a new four-step expert-based technique, named
COPE-SMARTER, for evaluating the possibility of market diffusion of new environmental
friendly technologies by combining a private case of SWOT analysis for identifying strengths,
weaknesses, opportunities and threats with Multi-Criteria Decision Analysis (MCDA) methods
based on the decomposition approach, namely the divide-and-conquer (DAC) principle. A
conferencing procedure forms the last stage of the method in order to generate in-depth
discussion and an integrated view. Using the COPE-SMARTER methodology, we provide a
rigorous quantitative evaluation of the severity of the challenges, the promotional strength of
opportunities and the efficiency of policy measures. The evaluation results show that the
proposed COPE-SMARTER is an efficient and easy to implement MCDA tool that produces
clear, coherent, and tractable results for an overall assessment of importance-performance, easily
detects minority and majority opinions, and is readily applied in decision making processes of
both small and large group sizes.
19
The most severe challenges perceived by practitioners in policy-making organizations
were financial, operational, and technological, with high purchase prices being by far the most
severe challenge followed by vehicle range and winter operation issues. The opportunities with
the highest perceived promotional strength were financial and environmental, with overall
savings in the long-term as the opportunity with the highest promotional strength, followed by
energy cost savings and long-term environmental benefits. The policy-measures that were
perceived as most effective were low registration fees for ECVs, state subsidies for the purchase
or use of ECVs, and emission-based taxes on vehicles. The policy-packages that were viewed as
the most efficient combine ‘carrot’ and ‘stick’ policy measures, with more ‘carrots’ than ‘sticks’.
Comparing the results of this study with the results of Kaplan et al. (2015) for the Danish
case study provides valuable information regarding the possible similarities and gaps between
the perspective of practitioners in policy-making organizations and the perspective of firms as
potential consumers of ECVs. The firm managers and practitioners in policy making
organizations agree that the main challenge to resolve is the high purchase price of ECVs.
However, there is a mismatch between the fleet managers and the practitioners in policy-making
organizations regarding the importance of driving range versus recharging infrastructure. The
practitioners in policy making organizations view the driving range as a secondary challenge and
disregarded the importance of public charging infrastructure, while fleet managers indicated that
the driving range of their vehicles is relatively short and that ECVs are suitable for
accommodating their needs, but indicated the lack of charging infrastructure. Regarding the
opportunities, practitioners in policy-making organization perceive the environmental benefits of
ECVs as having a good promotional strength, and indeed most fleet managers view this
advantage. Nevertheless, Fleet managers do not view the cost savings related to ECVs while
20
policy makers almost unanimously view the cost saving as the best opportunity for ECV market
penetration. In addition the practitioners in policy-making organizations overlook the potential
promotional strength of ECVs as a tool for generating a good public image. Last there is a wide
agreement regarding the value of tax benefits as an efficient policy measure for encouraging
ECV market penetration.
Acknowledgments
A part of the study was conducted during the stay of Sigal Kaplan as an "Eleonore-
Trefftz" Guest Professor in Faculty of Traffic Sciences, TU Dresden, as part of the TU-Dresden
Excellence program, supported by the German Research Foundation. The study forms part of the
project “SELECT – Suitable Electro Mobility for Commercial Transport”, supported by the
European Union and national funding authorities in Austria, Denmark and Germany.
References
Bae, S.H., Sarkis, J., Yoo, C.S., 2001. Greening transportation fleets: Insights from a two-stage
game theoretic model. Transportation Research Part E: Logistics and Transportation
Review, 47 (6), 793-807.
Bakker, S., Maat, K., van Wee, B., 2014. Stakeholders interests, expectations, and strategies
regarding the development and implementation of electric vehicles: The case of the
Netherlands. Transportation Research Part A: Policy and Practice, 66, 52-64.
Barfod, M.B., Salling, K.B., 2015. New composite decision support framework for strategic and
sustainable transport appraisals. Transportation Research Part A: Policy and Practice,
72, 1-15.
Belton, V., Stewart, T.J., 2002. Multi Criteria Decision Analysis: An integrated approach.
Kluwer Academic Publishers, London, United Kingdom.

21
Browne, M., Cudeck, R., 1993. Alternative ways of assessing model fit. In: Bollen, K., & Long,
S. (Eds.), Testing Structural Equation Models, Sage, Newbury Park, NJ.
Edwards W., Barron F.H., 1994. SMARTS and SMARTER: Improved simple methods for
multiattribute utility measurement. Organizational Behavior and Human Decision
Processes, 60, 306-325.
Feng, W., Figliozzi, M.A., 2012. Conventional vs Electric Commercial Vehicle Fleets: A Case
Study of Economic and Technological Factors Affecting the Competitiveness of Electric
Commercial Vehicles in the USA. Procedia - Social and Behavioral Sciences, 39, 702-
711.
Feng, W., Figliozzi, M.A., 2013. An economic and technological analysis of the key factors
affecting the competitiveness of electric commercial vehicles: A case study from the
USA market. Transportation Research Part C: Emerging Technologies, 26, 135-145.
Fischer, G.W., 1977. Convergent validation of decomposed multi-attribute utility assessment
procedures for risky and riskless decisions. Organizational Behavior and Human
Decision Processes, 18, 295-315.
Haller, M., Welch, E., Lin, J., Fulla, S., 2007. Economic costs and environmental impacts of
alternative fuel vehicle fleets in local government: An interim assessment of a voluntary
ten-year fleet conversion plan. Transportation Research Part D: Transport and
Environment, 12(3), 219-230.
Kaplan, S., Gruber, J., Frenzel, I., Reinthaler, M., Klauenberg. J., 2015. Procurement intentions
of electric vehicles in the commercial sector: a model based on the theory of planned
behaviour. Transportation Research Part A: Policy and Practice, under review.

22
Kirk, J.L., Bristow, A.L., Zanni, A.M., 2014. Exploring the market for Compressed Natural Gas
light commercial vehicles in the United Kingdom. Transportation Research Part D:
Transport and Environment, 29, 22-31.
Morera, O. F., Budescu D.V., 1998. A psychometric analysis of the “Divide and Conquer”
principle in multicriteria decision making. Organizational Behavior and Human Decision
Processes, 75 (3), 187–206.
Mohamadabadi, H. S., Tichkowsky, G., Kumar, A., 2009. Development of a multi-criteria
assessment model for ranking of renewable and non-renewable transportation fuel
vehicles. Energy, 34,112-125.
Roberts, R., Goodwin, P., 2002. Weight approximations in multi-attribute decision models.
Journal of Multi-Criteria Decision Analysis, 11, 291-303.
Rogers, E.M., 2004. A prospective and retrospective look at the diffusion model. Journal of
Health Communication, 9, 13–19.
Roumboutsos, A., Kapros, S., Vanelslander, T., 2014. Green city logistics: Systems of
Innovation to assess the potential of E-vehicles. Research in Transportation Business &
Management, 11, 43-52.
Sackman, H., 1974. Delphi assessment: expert opinion, Forecasting and group process. RAND
report R-1283-PR, pp. 7-8.
Shiftan, Y., Kaplan, S., Hakkert S., 2003. Scenario building as a tool for planning a sustainable
transportation system. Transportation Research Part D: Transport and Environment, 8 (5),
323-342.

23
Sierzchula, W., 2014. Factors influencing fleet manager adoption of electric vehicles.
Transportation Research Part D: Transport and Environment, 31, 126–134.
Sierzchula, W., Bakker, S., Maat, K., van Wee, B., 2014. The influence of financial incentives
and other socio-economic factors on electric vehicle adoption. Energy Policy, 68, 183–
194.
Tzeng, G.H., C.W. Cheng-Wei Lin, Opricovic, S., 2005. Multi-criteria analysis of alternative-
fuel buses for public transportation. Energy Policy, 33, 1373-1383.
Von Winterfeldt, D., Edwards, W., 1986. Decision Analysis and Behavioural Research.
Cambridge University Press, New York, United States of America.
Wang, Y., Monzon, A., Di Ciommo, F., Kaplan, S., 2014. An integrated transport planning
framework involving a combined utility-regret approach. Transportation Research
Record, 2429, 59-66.
Wang, J.J., Jing, Y.Y., Zhang, C.F., Zhao, J.H., 2009. Review on multi-criteria decision analysis
aid in sustainable energy decision-making. Renewable & Sustainable Energy Reviews,
132, 2263-2278.
Wikström, M., Hansson, L., Alvfors, P., 2014. Socio-technical experiences from electric vehicle
utilization in commercial fleets. Applied Energy, 123, 82–93.
Yavuz, M., Oztaysi, B., Onar, S.C., Kahraman, C. (2015). Multi-criteria evaluation of
alternative-fuel vehicles via a hierarchical hesitant fuzzy linguistic model. Expert Systems
with Applications, 42, 2835-2848.

24
Figure 1. The scores of the severity of the challenges for the market diffusion of ECVs
Description Financial Safety
Participant C1 C2 C3 C4 C5 C6 C7 C8 C9 C10
#1 0.256 0.089 0.061 0.014 0.002 0.206 0.029 0.181 0.157 0.005
#2 0.268 0.146 0.020 0.015 0.005 0.215 0.064 0.093 0.168 0.005
#3 0.012 0.051 0.062 0.050 0.037 0.213 0.266 0.167 0.127 0.015
#4 0.265 0.092 0.010 0.063 0.126 0.213 0.040 0.166 0.022 0.002
#5 0.232 0.056 0.094 0.072 0.017 0.186 0.164 0.126 0.048 0.004
#6 0.252 0.177 0.000 0.282 0.000 0.021 0.054 0.115 0.098 0.000
#7 0.198 0.108 0.036 0.012 0.018 0.317 0.174 0.073 0.061 0.003
#8 0.254 0.109 0.030 0.061 0.002 0.093 0.077 0.191 0.168 0.015
#9 0.337 0.065 0.032 0.003 0.000 0.181 0.078 0.159 0.126 0.019
#10 0.309 0.170 0.126 0.072 0.000 0.035 0.017 0.044 0.221 0.006
#11 0.251 0.137 0.057 0.028 0.019 0.180 0.108 0.099 0.116 0.005
#12 0.235 0.166 0.050 0.040 0.005 0.264 0.126 0.099 0.015 0.000
#13 0.243 0.065 0.132 0.113 0.023 0.048 0.005 0.195 0.172 0.005
#14 0.322 0.000 0.000 0.084 0.000 0.173 0.139 0.110 0.173 0.000
Average 0.245 0.102 0.051 0.065 0.018 0.167 0.096 0.130 0.119 0.006
TechnologicalOperationalPhysical
25
Figure 2. The scores of the potential marketing strength of the opportunities for the market diffusion of ECVs
Description Technological Environmental
Participant O1 O2 O3 O4 O5 O6 O7 O8
#1 0.000 0.296 0.192 0.008 0.255 0.046 0.062 0.023
#2 0.036 0.101 0.004 0.337 0.197 0.262 0.048 0.016
#3 0.091 0.056 0.115 0.017 0.155 0.209 0.303 0.053
#4 0.000 0.000 0.000 1.000 0.000 0.000 0.000 0.000
#5 0.065 0.192 0.087 0.037 0.264 0.205 0.127 0.024
#6 0.128 0.095 0.175 0.267 0.066 0.219 0.040 0.009
#7 0.074 0.313 0.055 0.029 0.182 0.243 0.094 0.011
#8 0.059 0.032 0.016 0.278 0.216 0.105 0.133 0.162
#9 0.145 0.015 0.008 0.078 0.257 0.331 0.109 0.058
#10 0.238 0.087 0.054 0.110 0.035 0.306 0.156 0.014
#11 0.227 0.171 0.069 0.051 0.088 0.088 0.293 0.014
#12 0.034 0.318 0.114 0.007 0.197 0.247 0.068 0.015
#13 0.057 0.031 0.015 0.129 0.089 0.177 0.269 0.232
#14 0.085 0.258 0.012 0.178 0.036 0.258 0.113 0.061
#15 0.076 0.186 0.096 0.022 0.320 0.248 0.045 0.007
#16 0.010 0.000 0.000 0.412 0.198 0.284 0.039 0.058
Average 0.090 0.134 0.063 0.185 0.160 0.202 0.119 0.047
BrandingFinancialOperational
26
Figure 3. The scores of the efficiency of the policy measures for the market diffusion of ECVs
Description
Participant P1 P2 P3 P4 P5 P6 P7
#1 0.126 0.250 0.331 0.193 0.066 0.009 0.026
#2 0.182 0.052 0.278 0.331 0.108 0.009 0.040
#3 0.019 0.369 0.102 0.248 0.104 0.039 0.120
#4 0.171 0.037 0.238 0.071 0.354 0.014 0.115
#5 0.016 0.240 0.302 0.124 0.115 0.164 0.040
#6 0.021 0.077 0.319 0.241 0.046 0.175 0.121
#7 0.100 0.059 0.248 0.370 0.178 0.005 0.039
#8 0.216 0.315 0.264 0.108 0.066 0.004 0.026
#9 0.067 0.127 0.333 0.035 0.252 0.004 0.183
#10 0.177 0.105 0.243 0.322 0.077 0.051 0.025
#11 0.033 0.064 0.318 0.214 0.175 0.042 0.155
#12 0.018 0.254 0.336 0.208 0.128 0.004 0.054
#13 0.251 0.182 0.332 0.090 0.093 0.043 0.009
#14 0.027 0.194 0.194 0.130 0.194 0.130 0.130
#15 0.166 0.010 0.203 0.403 0.131 0.021 0.065
#16 0.092 0.160 0.043 0.135 0.220 0.021 0.328
Average 0.105 0.156 0.255 0.201 0.144 0.046 0.092
"Sticks""Carrots"
27
Table 1. Challenges, opportunities and policy measures for the market diffusion of ECVs
Challenge type Challenge description Number
Financial High purchase costs C1
Physical
Missing publically available charging stations C2
Lack of service network C3
Lack of service network in rural (outer) areas C4
Unsuitability of ECVs for driving poor quality road in rural areas C5
Operational ECV range as insufficient for daily tour needs of firms C6
Recharging difficulties because of the stopping patterns of ECVs C7
Technological unpredictability in winter conditions C8
Trade-off between comfort (heat) and range during the winter C9
Psychological Fear of accident involvement due to low noise level of ECVs C10
Opportunity type Opportunity description Number
Technological The perception of ECVs as cool to drive O1
Operational Suitability of ECVs to firms’ needs in terms of vehicle range O2
Ease of adaption ECVs for the needs of firms O3
Environmental Long-term benefits to the environment from driving ECVs O4
Financial Advantages in terms of energy costs O5
Potential opportunity for general cost savings O6
Branding ECVs as a tool for generating good public image O7
Opportunity for the firm to be a pioneer and innovator O8
Policy type Policy measure description Number
‘Carrots’
Free parking for electric vehicles P1
State subsidies for the purchase or use of electric vehicles, P2
Low registration fee for electric vehicles P3
‘Sticks’
Emission-based taxes on vehicles P4
High petrol and diesel prices P5
Cap on firms' carbon emissions P6
Limitation on the purchase of conventional fuel vehicles but not on ECVs P7
28
Table 2. The penetration rate of ECVs per target year
Participant 2020 2030 2050 2070
#1 3% 6% 15% 100%
#2 3% 10% 30% 70%
#3 2% 10% 80% 90%
#4 3% 10% 25% 40%
#5 40% 70% 85% 95%
#6 5% 18% 50% 60%
#7 10% 25% 70% 100%
#8 2% 20% 50% 65%
#9 3% 25% 40% 40%
#10 10% 40% 80% 90%
#11 2% 8% 50% 80%
#12 4% 25% 98% 100%
#13 2% 15% 35% 75%
#14 50% 100% 100% 100%
#15 5% 20% 70% 100%
#16 10% 30% 90% 100%
Geo Mean 5% 20% 54% 78%
Average 10% 27% 61% 82%
29
Table 3. The distribution of activity pattern across the surveyed Danish firms
Tour length Description Average share of tours
Daily tour of less than 49 km 53.4%
Daily tour between 50-99 km 16.6%
Daily tour between 100-149 km 11.3%
Daily tour of between 150-199 km 7.1%
Daily tour of more than 200 km 11.6%
Stop pattern Description Share of firms
Less than 20% of the vehicles in the firm have 30 min. stops 37.2%
21-40% of the vehicles in the firm’s fleet have 30 min. stops 3.7%
41-60% of the vehicles in the firm’s fleet have 30 min. stops 7.2%
61-80% of the vehicles in the firm’s fleet have 30 min. stops 7.1%
81-100% of the vehicles in the firm’s fleet have 30 min. stops 42.2%
Do not know how many vehicles have 30 min. stops 2.5%

30
Table 4. Danish firm managers' perceptions regarding ECVs
Challenge description Number Strongly
disagree Disagree
Neither
agree nor
disagree Agree
Strongly
agree
High purchase costs C1 2.7 2.7 19.1 24.8 50.8
Missing publically available charging stations C2 4.0 5.6 31.2 28.1 31.2
Lack of service network C3 5.0 6.4 46.4 18.2 24.1
unpredictability of ECVs C8 9.9 17.1 54.7 12.1 6.2
Fear of accidents due to low noise level C10 20.2 19.9 48.7 8.0 3.1
Opportunity description Number
The perception of ECVs as cool to drive O1 4.3 7.2 52.1 20.2 16.1
Suitability of ECVs to firms’ driving range O2 15.7 17.6 19.6 25.3 21.9
Ease of adaption ECVs for the needs of firms O3 7.7 7.8 59.7 13.1 11.7
Long-term benefits to the environment O4 5.0 4.0 14.8 24.8 51.4
Potential opportunity for general cost savings O6 11.5 9.7 37.7 17.7 23.3
ECVs as a tool for improving public image O7 6.2 3.4 39.3 31.8 19.4
Policy measure description Number
Free parking for electric vehicles P1 7.5 5.8 33.5 21.7 31.5
Tax benefits for electric vehicles P3 5.5 2.4 27.9 24.7 39.6