copy strategic management accounting not...
TRANSCRIPT

SECTION 6
19 Cost Management, Value Creation and Sustainable Development 00
20 Managing Quality and Time 00
21 Information Systems 00
22 Managing Change & Challenges for the Future 00
STRATEGIC MANAGEMENT ACCOUNTING
S0085_Sample.indd 1 7/25/2012 2:44:52 PM
DRAFT – DO N
OT COPY

S0085_Sample.indd 2 7/25/2012 2:44:57 PM
DRAFT – DO N
OT COPY

CHAPTER 19COST MANAGEMENT, VALUE CREATION AND SUSTAINABLE DEVELOPMENT
Learning outcomes
On completion of this chapter, you will be able to:
Explain the notion of value chain
Uncover managerial insights from activity-based information
Identify the advantages of product life cycle analysis
Describe the potential of kaizen cost management
Describe the potential of target cost management
Describe the stages of target cost management
Describe the advantages and difficulties of Business Process Reengineering (BPR)
Distinguish between business-focused and enlightened perspectives of sustainability
Describe techniques for sustainability-oriented reporting and decision-making
Identify management accountants’ roles in implementing value-oriented techniques
LO1
LO2
LO3
LO4
LO5
LO6
LO7
LO8
LO9
LO10
Chapter outline●● Views on costs and value
●● Activity-Based Management (ABM): exploring and extending ABC
●● Life cycle costing
●● Continuous improvement and kaizen cost management (or kaizen costing)
●● Target costing (or target cost management)
●● Business Process Reengineering (BPR) and Management (BPM)
●● Sustainability accounting
S0085_Sample.indd 3 7/25/2012 2:44:59 PM
DRAFT – DO N
OT COPY
CHAPTER 19 Cost Management, Value Creation and Sustainable Development4
IntroductionThis chapter explores a strategic, value enhancing perspective to management accounting. In previous chapters, you learned various cost and management accounting techniques. But these chapters have already pointed out that a single-minded focus on costs may actually harm companies’ profitability, both in the short and in the long term.
The traditional focus on costs usually means attempts to reduce costs. However, cost management is more than just cost reduction and, in particular, more than just cost minimisation. Cost management must also evaluate the value produced by the organisation and by each of its activities. Cost management is about trade-offs between costs incurred and value produced. Reducing costs without considering impacts on value is a short-sighted approach and risks compromising competitiveness. “Reducing costs” cannot mean “reducing costs at all cost”!
This chapter explores managing and balancing costs and value - with a particular emphasis on creating value and on how management accountants can contribute towards this fundamental managerial concern. A future orientation is crucial. More than calculating past costs, we need to estimate future costs. Even more importantly, we need guidance to take appropriate decisions and actions to ensure that future costs will be supported by generated value. We need a time horizon longer than the typically short reporting periods. Cost management can be performed as activities unfold, but the greatest impact is obtained when cost management is performed in advance, designing processes and products oriented by cost and value concerns. Finally, we must also have concerns about the future in a fundamentally different perspective: the concerns about sustainable development. It is now clear that environmental and social sustainability cannot be taken for granted – at the level of particular products, organisations, industries or the entire planet. So, various proposals have emerged to support reporting and decision making with a sustainable development perspective.
The next section briefly discusses the need to go beyond costs and to develop techniques that consider value; the classic value chain concept is also discussed. The following section discusses Activity-Based Management, a management-oriented approach exploring activity-based insights, including ABC cost information; an example supports practical advice on exploring ABM information. Then, life cycle costing is discussed, widening the typically reduced time horizons of management accounting. The chapter also analyses two Japanese contributions to management accounting: kaizen and target cost management (or costing), improving cost and value during and before the manufacturing stage, respectively. The radical proposals of Business Process Reengineering are then presented. A final section discusses the increasingly important issue of sustainable development, its relevance for businesses and society, and various reporting and decision-making techniques aligned with, and promoting, sustainability concerns.
Views on costs and value
Beyond costs and exploring value and sustainable developmentThe traditional management and management accounting focus on costs usually meant attempts to reduce costs. Lower costs may benefit profitability, either directly through higher margins or indirectly by allowing aggressive pricing strategies to increase volume. Reducing costs is still high in companies’ agenda and may even been a key competitive variable – and even more critical in periods of crisis, when demand slows down, competition increases and short-term survival becomes crucial. Around the world, large and small companies alike have reduced costs through, for example, laying-off workers, reducing management bonuses, cutting on advertising or closing down operations. Nokia, Philips, Bank of Scotland and Bank of America are some examples, and you can probably add to the list a few small businesses near you.
However, the notion of “value” has long entered the language of business and academia – and every one of us. The well-know saying of “knowing the cost of everything and the value of nothing” has been recurrently directed towards accountants, due to accountants’ traditional focus on cost. Techniques like variable, absorption, standard and Activity-Based Costing (ABC) deal with
S0085_Sample.indd 4 7/25/2012 2:45:01 PM
DRAFT – DO N
OT COPY
Views on costs and value 5
costs, not value, even when more sophisticated (e.g., ABC). To analyse profitability, we need to externally determine the prices charged to customers, and then compare them with information from costing systems. In addition, the price paid and the value perceived by customers are two different concepts (see chapter 14 on pricing strategies).
Costing systems do not have an external focus, so they cannot provide indications about the value of products, services or processes. So, a strategic management tool to improve profitability, considering companies’ competitiveness through their value proposition, needs to supplement insights on costs (e.g., from ABC) with insights about customers’ perceptions – in particular, about customers’ perceptions of value.
Fortunately, the need of going beyond costs and the importance of value has long become established in management accounting. The Institute for Management Accountants identified four stages in management accounting focus (IMA, 1998):
●● Stage 1 - Before 1950: cost determination and financial control, through budget and cost accounting;
●● Stage 2 - By 1965: assist planning and control, through decision analysis and responsibility accounting;
●● Stage 3 - By 1985: waste reduction, through process analysis and cost management;
●● Stage 4 - By 1995: generation of value through the effective use of resources, examining the drivers of customer value, shareholder value, and organizational innovation.
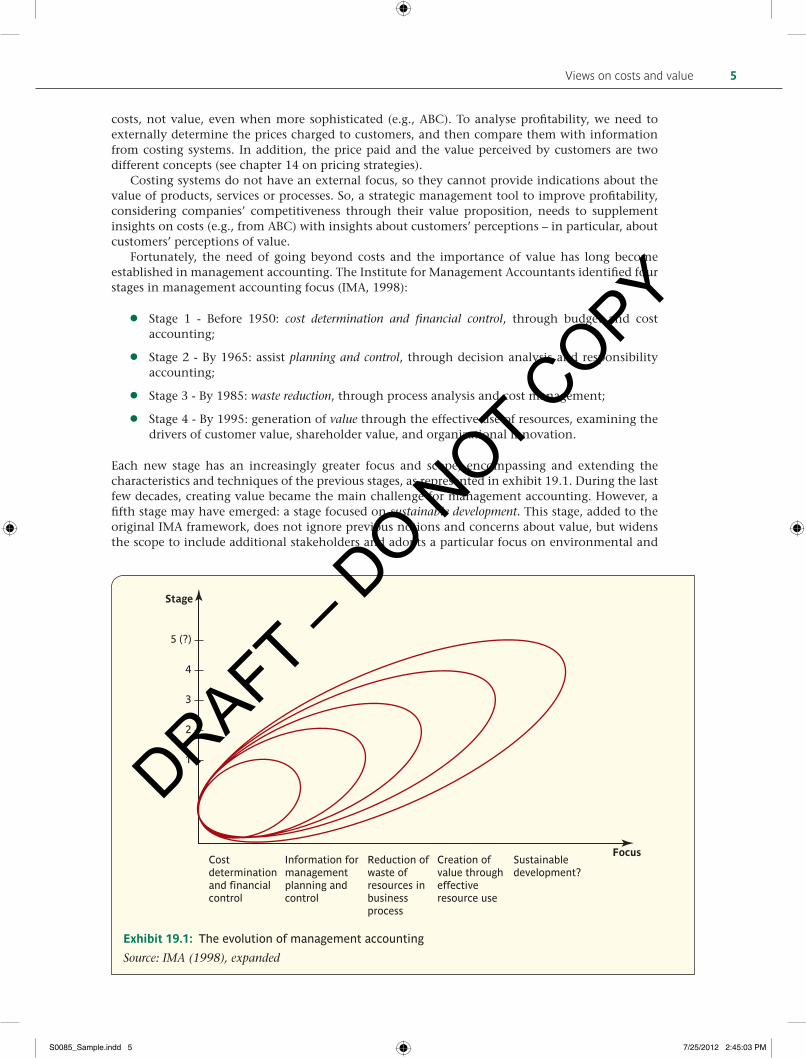
Each new stage has an increasingly greater focus and scope, encompassing and extending the characteristics and techniques of the previous stages, as represented in exhibit 19.1. During the last few decades, creating value became the main challenge for management accounting. However, a fifth stage may have emerged: a stage focused on sustainable development. This stage, added to the original IMA framework, does not ignore previous notions and concerns about value, but widens the scope to include additional stakeholders and adopts a particular focus on environmental and
Stage
5 (?)
4
3
2
1
Costdeterminationand financialcontrol
Information formanagementplanning andcontrol
Reduction ofwaste ofresources inbusinessprocess
Creation ofvalue througheffectiveresource use
Sustainabledevelopment?
Focus
Exhibit 19.1: The evolution of management accounting
Source: IMA (1998), expanded
S0085_Sample.indd 5 7/25/2012 2:45:03 PM
DRAFT – DO N
OT COPY

CHAPTER 19 Cost Management, Value Creation and Sustainable Development6
social impacts. You will explore, in the last section, various techniques to support sustainable development.
Value added and non-value added activitiesThe notion of value adopted at this stage is based on the customers’ perspective. In a customer perspective, and using ABC’s focus on activities, a value added activity increases the worth of a company’s products and services if it increases customers’ willingness to pay a higher price and/or buy greater quantities. On the contrary, a non-value added activity does not directly affect customers and the value they perceive. So, strictly from a customer perspective, these activities could be eliminated.
However, a simple dichotomy between value added vs. non-value added activities is limited. First, there are different levels of customers’ perceived value, ranging between completely non-valued and the highest value added activities. Second, activities perceived as non-value added by customers may be essential for the company existence – for instance, paying employees and suppliers, or any other activities currently required for technological, organisational or regulatory reasons. Finally, other activities invisible to customers (and so not directly adding to customer value) may be important for long-term success. Activities supporting family and work conciliation (e.g., a nursing facility), team building initiatives (e.g., a day-out with radical activities requiring joint-efforts of employees across hierarchical levels and functional areas) and other employees’-oriented activities (e.g., sport facilities) may be decisive in attracting, retaining and motivating key individuals and promoting collective work, relations and trust.
Activities should be rated in a scale of value (e.g., from 1 to 5), rather than using a non-value vs. value dichotomy. Activities which clearly do not add value are rated 1 and become a main target for elimination – for example, manufacturing defective products, or products not meeting customers’ expectations and that will not get sold. The highest-valued activities are rated 5 – for instance, operations supporting on-time delivery of products meeting customers’ quality expectations. Improvements in these high-value activities may also include cost reduction, but with an utmost care to preserve or even improve customer-perceived value.
Finally, activities necessary for company operations or considered important for success, but not perceived as valuable by customers, can be rated as 3. The emphasis should be on reviewing their underlying objectives and how these objectives can be attained in an efficient and effective way. Reasons valid in the past may no longer hold: for example, new technologies may eliminate most activities regarding payments, eliminate the production of defective units or more effectively comply with regulations; regulations themselves may have changed. Since those activities do not directly add to customer-perceived value, they should be scrutinised more closely, to avoid unnecessary waste of resources.
Value: for whom?We have so far evaluated value from the perspective of customers - and, in particular, of external customers, who purchase the company products and services. There are also internal customers – those individuals or parts of the company that use products and services provided by other parts of the company. For example, each employee is an internal customer benefiting from pay-roll services provided by the Human Resources (HR) Department or from a Shared Services Centre.
Value for shareholders is an alternative perspective for value. Finance is heavily based on shareholder value and in the previous chapter you explored various financial measures which, in various degrees, are aligned with this perspective. While this chapter will typically focus on customer value, rather than shareholder value, it is plausible that companies successfully delivering customer value may be rewarded with significant revenues from satisfied customers and hence ultimately may deliver shareholder value. Although this link is far from deterministic and customer value may not lead to shareholder value, a customer value focus is likely to be an adequate perspective to orient operational and business decisions and is hence the major focus of this chapter.
In a radically different perspective, value can be seen from an environmental and social perspective. The increasingly relevant accountability for corporate impacts on environment and society takes
S0085_Sample.indd 6 7/25/2012 2:45:04 PM
DRAFT – DO N
OT COPY

Views on costs and value 7
the notion of value beyond customers’ and shareholders’ perspectives and includes other direct and even indirect stakeholders. Managers increasingly realise that ensuring sustainable development is a crucial requirement. This and ensuing sections predominantly discuss value from a customer perspective, given its more direct impact on the organisation and to simplify the discussion. However, wider considerations on value, including those in the sustainability perspective analysed in the last section, should permeate all analyses and decisions, rather than standing as an isolated thought or the exclusive responsibility of a specific department.
Value: where does it come from? A value chain perspectiveManagement accounting usually focuses on a particular company – its products and services, its activities, its profitability, its value added, and so on. But the activities of a company are preceded by activities carried out by suppliers and are typically followed by activities carried out by other entities, such as distributors and retailers, before reaching the final customer.
It is now accepted that value created and costs incurred outside a company are decisive to its own success. Take the example of a producer of consumer goods. Suppliers that fail to deliver on agreed quality and time compromise the company capacity to meet its own promises. Distributors that mishandle or incorrectly deliver the company products, or retailers providing inadequate customer service, are ultimately compromising the sales, the image and ultimate success of the producer. Exhibit 19.2 depicts this value chain perspective, expanding Porter’s (1985) seminal conceptualisation of the company value chain – the traditional focus of management accounting - to include both upstream and downstream stages of the value chain, right to the final customer.
Firm infrastructure
Human resource management
Technology
Procurement
Inboundlogistics
R&DOpera-tions
Outboundlogistics
Traditional focus of management accounting:value added within the organisation
Wider focus of management accounting:value added across the value chain
Marketing& sales
Service
Companycustomers
Customers’customers
Finalcustomer
Suppliers’suppliers
Companysuppliers
Exhibit 19.2: The value chain and management accounting focus
Source: Porter (1985) (adapted and expanded)
Successful value chains are those that are able to deliver the best value/cost relationship – considering the entire value chain. No company, no matter how efficient, can succeed in the long term if included in an ineffective value chain, when compared to competing value chains.
To understand the industry value chain and evaluate its performance, both globally and of each of its components, management accountants must separate the linked strategic activities contributing to the satisfaction of the final customer, and identify their costs, revenues and assets. This requires an external focus and places challenging problems of estimating figures for suppliers, customers and competitors – and competitors’ suppliers and customers. Even if only rough estimates
S0085_Sample.indd 7 7/25/2012 2:45:05 PM
DRAFT – DO N
OT COPY

CHAPTER 19 Cost Management, Value Creation and Sustainable Development8
are possible, the process of strategic reflection to identify value chain activities and estimate their value contribution and costs is, in itself, useful.
Activity-Based Management (ABM): exploring and extending ABC
Operational and strategic ABMIn Chapter 6 you learned about Activity-Based Costing (ABC), a costing approach proposed to overcome shortcomings of traditional systems. Here we will extend the concepts fo ABC in the management of the organisation. Activity-Based Management (ABM) supplements ABC, combining ABC insights on costs with value considerations, to better orient managerial action. Customers’ perceptions are the key criteria to assess value in ABM approaches.
ABM can be used for operational and for strategic purposes. Operational ABM aims to “do things right”, based on measuring activity costs and understanding what drives those costs; it has a particular focus on operations. Strategic ABM aims to “do the right things”, such as selling the right products, to the right clients, in the right mix, at the right prices. Often, this strategic analysis also leads to operational adjustments.
For operational ABM, only the first three stages of ABC are required:
1) Identifying the major activities, which become the cost pools;
2) Assign costs for each activity cost pool;
3) Select a cost driver for each activity and calculate the cost rate of each cost driver.
In addition, operational ABM requires attributing a customers’ perception of value to the various activities, ranging from no value added to high value added. Such rating is important to orient cost management efforts, in particular towards reducing costs and improving processes, both internal and external - including relations with customers. For instance, if you find that customers highly value obtaining a first class customer service, this activity is rated as high value added; so, improvements plans should first ensure that potential cost saving measures do not put to risk this crucial positive perception.
Strategic ABM requires all the above, plus the last stage of ABC, product costing:
4) Assign activity costs to products (or other cost objects) according to the usage of activities by each product (or cost object).
Finally, we can compare revenues with ABC cost information to conduct profitability analysis, essential for strategic decisions, such as products and customers mix and pricing. Changes in relationship management may also be suggested at this stage.
Extending ABC calculation to become ABM actionLet’s retrieve the example from chapter 6, when ABC was discussed. Elviso Ltd manufactures two parts for medical equipment, Alpha and Beta, and sells both for £60 per unit. Elviso’s previous costing system allocated overhead across the two products according to the number of units produced, leading to the cost and profitability data shown in Worked Example 6.1 (p. x), included again in the comparative table 19.3 below. By adopting ABC, Elviso identified five activities and allocated their overhead costs to products according to various cost drivers. Table 19.1 summarises this information and calculates the cost of each cost driver unit (as in Worked Example 6.1). In addition, it also includes a 1–5 rating to express customers’ perception about the value of each activity, reflecting ABM’s concern on value.
According to Elviso’s market research conducted through a multidisciplinary team of marketing and operational staff, “Production”, “Quality enhancing and inspection” and “Delivery” reap the highest value rating of 5. “Materials handling” ranks lowest, with a rating of 2, since customers do
S0085_Sample.indd 8 7/25/2012 2:45:07 PM
DRAFT – DO N
OT COPY

Activity-Based Management (ABM): exploring andextending ABC 9
not value Elviso’s efforts to handle materials – an activity that can often be substantially improved with better materials and warehouse management, without negatively impacting customer value. Finally, “Product returns management” was rated 3 due to opposing evaluation perspectives: on the positive side, it addresses a clear customer need; on the negative side, it results from a previous failure by Elviso to meet customer expectations and should have been avoided in the first place. It is an important activity but which ideally should be eliminated by addressing the original source of customer lack of satisfaction, as you will learn about quality in chapter 20.
As you learned in chapter 6, for each activity and cost driver, Elviso’s ABC system allocated overheads across the two products based on: 1) the cost driver unit cost and 2) the cost driver usage by each product. Table 19.2 shows this overheads allocation, both in pounds (as in Worked Example 6.1 and as a percentage. Table 19.3 then compares Alpha’s and Beta’s cost and profitability data based on ABC and on the traditional costing system.
Exploring ABM information – a practical guideYou can extract from the above calculations insights for two purposes: for operational ABM and for strategic ABM. Next, you will find some hints on exploring ABM information – but bear in mind that the analysis of each organisation may provide unique challenges, findings and opportunities.
Operational ABM: directing attention to activities and costs drivers, improving processes and reducing costsBy dividing overheads across five activities, managers can have a better idea about why costs are incurred; this improves information richness when compared to using a single overhead figure, as in the traditional costing example. In particular, after choosing adequate cost drivers, their volume indicates the output of each activity. This allows knowing what drives the cost and at which rate – the cost rate of each cost driver. The costs of each activity and of each cost driver should then be evaluated considering value perceptions by customers, based on the value rating of Table 19.1.
Which activities should you focus on, at least to start with? Several criteria are possible:
●● Activities with the largest costs. These may provide the largest-scale savings. However, keep in mind that if they are high value added, utmost care must be taken not to diminish that perceived value, or at least to attain a clearly beneficial relation between value and cost reduction. In addition, note that a costly activity may already be extremely efficient at the present time, in which case further improvements are likely to be minor and difficult to achieve.
Table 19.1: Elviso’s activities, cost drivers and costs
Activity Annual cost
Cost driver Cost per cost driver unit
Customer value perception (1–5 scale)
£ Volume £
Production 180,000 Machine hours 4500 40 per hour 5
Material handling 78,000 Number of orders executed
260 300 per order 1
Quality enhancing and inspection
130,000 Number of production runs
130 1000 per run 5
Delivery 26,000 Number of shipments 65 400 per shipment 5
Product returns management
52,000 Number of returned products
130 400 per return 3
Total overheads 466,000
S0085_Sample.indd 9 7/25/2012 2:45:08 PM
DRAFT – DO N
OT COPY

CHAPTER 19 Cost Management, Value Creation and Sustainable Development10
●● Activities with no or little value added. These activities, identified with the lowest value ratings adopted above, are primary targets for reduction or even elimination, since they have little or no impact on customers’ value perceptions and even on company essential operations. However, if non-value added activities have very little costs, or if they are already extremely efficient and cannot be eliminated entirely, potential savings will not be significant;
●● Activities currently highly inefficient. These may provide the best targets for reaping “low hanging fruit”, i.e., to achieve savings without major efforts. Kaplan and Cooper (1998) suggested another 1–5 scale to identify activities ranging from the lowest opportunities for improvement (<5%, already highly efficient, getting a rating of 1) to the greatest opportunities (50–100%, currently highly inefficient and main targets for elimination, getting a 5 rating). Reaping “low hanging fruit” is particularly important at the start of ABM projects. Remember that ABC projects tend to be lengthy and costly, so getting some quick results is essential to strengthen internal legitimacy, support and impetus towards additional ABM steps.
●● Combinations between the above criteria. For example, all activities with the lowest value ratings (1 and 2) may be initially selected, and then start improving those activities with the largest costs.
You can find in the worked example 19.1 below possible interpretations about the above data to guide operational ABM decisions. They should be used with caution, as mere orientations for analysis; keep in mind that each case may suggest unique relationships and explanations.
Table 19.2: Assignment of activity costs to products (in £ and as a percentage)
Total Alpha Beta
£ £ % £ %
Production 180,000
Alpha: 40 × 2100 machine hours 84,000 46.7%
Beta: 40 × 2400 machine hours 96,000 53.3%
Material handling 78,000
Alpha: 300 × 150 orders 45,000 57.7%
Beta: 300 × 110 orders 33,000 42.3%
Quality improvement and product inspection
130,000
Alpha: 1000 × 90 production runs 90,000 69.2%
Beta: 1000 × 40 production runs 40,000 30.8%
Delivery 26,000
Alpha: 400 × 50 per shipment 20,000 76.9%
Beta: 400 × 15 per shipment 6,000 23.1%
Product returns management 52,000
Alpha: 400 × 90 product returns 36,000 69.2%
Beta: 400 × 40 product returns 16,000 30.8%
Total overhead 466,000 275,000 59.0% 191,000 41.0%
Number of units 12,000 46.2% 14,000 53.8%
Overhead per unit 22.92 13.64
S0085_Sample.indd 10 7/25/2012 2:45:10 PM
DRAFT – DO N
OT COPY

Activity-Based Management (ABM): exploring andextending ABC 11
Table 19.3: Products cost, sale price and profit, under traditional costing and ABC
Traditional costing ABC
Alpha Beta Alpha Beta
Total (£) £/unit Total (£) £/unit Total (£) £/unit Total (£) £/unit
Direct Material 240,000 20.00 350,000 25.00 240,000 20 350,000 25.00
Direct Labour 168,000 14.00 147,000 10.50 168,000 14 147,000 10.50
Overheads
Production 84,000 7.00 96,000 6.86
Material handling 45,000 3.75 33,000 2.36
Quality improv. & product inspection
90,000 7.50 40,000 2.86
Delivery 20,000 1.67 6,000 0.43
Product returns management
36,000 3.00 16,000 1.14
Total Overheads 215,040 17.92 250,880 17.92 275,000 22.92 191,000 13.64
Total Cost 623,040 51.92 747,880 53.42 683,000 56.92 688,000 49.14
Sale price 60 60 60 60
Profit 8.08 6.58 3.08 10.86
Profit (% of sale price)
13.47% 10.97% 5.14% 18.10%
Profit change (% vs. traditional system)
−61.8% +65.0%
Operational ABM in ElvisoLet’s focus on the costliest activities first. More than half of Elviso’s overheads are incurred in “Production” (£180,000) and “Quality enhancing and product inspection” (£120,000) activities. Both are rated as high value added, so caution is required when
trying to reduce costs in these activities. Since “Production” is the costliest, it becomes a primary target for attention.
The nature of the “Quality improvement and product inspection” activity requires further attention. Parts for medical equipment require a high quality level, justifying the high value added rating (5) attributed to this activity. However, note that this activity actually encompasses two sub-activities: “quality improvement” (to “build-in” quality into the product) and “product inspection” (looking for defects). As you will see in chapter 20, preventively “building-in” quality is typically preferable to searching for defects. In fact, the 5 value rating is more applicable to quality building than product inspection: doing things right, the first time, every time (the goal of Total Quality Management) drastically reduces the need of further inspection activities. For ABM, it might be worthwhile to separate these two sub-activities and their costs (we have no data to do it). For example, if most costs concern “product inspection” and only a minority concern “quality
Worked Example
19.1
➤
S0085_Sample.indd 11 7/25/2012 2:45:11 PM
DRAFT – DO N
OT COPY

CHAPTER 19 Cost Management, Value Creation and Sustainable Development12
Strategic ABMProfitability analysis of cost objects (products, in this case, but also others like customers and markets) based on ABC information may provide important insights about product and customer mix and pricing. It can also suggest more detailed, product- or customer-specific operational changes.
Product profitability substantially changed under ABC. Remember that the sale price was £60 for both products. Under traditional costing, Alpha was slightly cheaper and more profitable than Beta (with a profit of £8.08/unit and £6.58/unit, respectively). However, due to different overhead allocation in ABC, profitability of both products changed, in inverse directions, by 61,8% (remember that direct costs - materials and direct labour - do not change in ABC). Alpha costs rose and profitability dropped to £3.08/unit, or 5.14% of sale price, while Beta costs decreased and profitability increased to £10.86/unit, or 18.10% of sale price. Alpha’s low profitability is worrying. Do not forget that additional costs, not included in this ABC analysis, are likely to exist and need to be covered from the contribution obtained from the various products.
Why were these costs incurred? And what courses of action can be suggested for management? Worked example 19.2 (managing products usage of activities), Worked example 19.3 (changing sale prices) and Worked example 19.4 (changing relationships with customers and “menu-based pricing”) explore tentative suggestions that are often relevant in strategic ABM.
improvement” efforts, then cost and value improvements might be possible by redirecting efforts from the former to the latter.
The usefulness of disaggregating this activity illustrates a distinctive characteristic of ABM, when compared to ABC. ABM requires a more detailed breakdown of activities, leading to many activity cost pools and cost drivers. This is necessary for effective cost management, based on an in-depth understanding of the value and of what causes costs in those activities. On the contrary, for costing purposes in ABC you may not require such detailed analysis. In a trade-off between accuracy and simplicity, it may not pay-off to obtain higher cost allocation accuracy from disaggregating activities using more specific and appropriate cost drivers. For example, for ABM it may be crucial to question whether inspection costs are actually driven by the number of production runs – the current cost driver. It is possible that this is not correct, and you may examine alternatives such as the number of units inspected - a transactional cost driver - or inspection time - a duration cost driver. However, for ABC aggregating cost pools with similar cost drivers may be a still satisfactory option.
The cost rate of cost drivers can also provide important insights. The £400 cost per returned product is amazingly high, especially when compared to the £60 sale price. As already stated, managing product returns is a necessary activity to address the needs of unsatisfied customers. However, it is mandatory to investigate why those returns happen, how can customer satisfaction be strengthened to avoid future returns (hence reducing future demand for this activity), and why each return leads to such high costs.
The “Product returns management” activity also allows recalling that an Activity-based approach enhances cost visibility, by aggregating costs of activities spanning across different functional areas and departments. Customer service activities may use resources from customer service, engineering, shop floor, public relations, legal and finance departments. It may well be that because traditional costing systems kept these costs in separate department accounts, managers were until now unaware of the actual costs incurred across the company anytime a product was returned. It may also well be that an ABM project uncovers significant inefficiency in this activity (the third criterion to investigate activities) due to, for example, lack of integration across the various departments, leading to task duplication, unnecessary search for information and processing errors. Business Process Management (BPM), analysed later in this chapter, may allow integrating inter-functional process flows, leading not only to less costs but also to faster, more accurate response and increased customer satisfaction.
➤
S0085_Sample.indd 12 7/25/2012 2:45:12 PM
DRAFT – DO N
OT COPY

Activity-Based Management (ABM): exploring andextending ABC 13
Strategic ABM in Elviso: managing products usage of activitiesBy reassigning overhead, we have discovered that Alpha is costlier than we initially thought, and costlier than Beta. The next stage is to know: why? A useful heuristic approach is:
●● Compare the percentage of overheads assigned to each product under ABC – the shaded cells in Table 19.2. Alpha uses a larger percentage than Beta of almost all activities. Although in the costlier activity, “Production”, that does not happen (only 46.7%), the aggregated effect of Alpha’s greater usage of all other activities explains why Alpha’s total overheads are greater than Beta’s.
However, you should use benchmarks against which to compare these percentages, as suggested next.
●● Compare these percentages (of overheads assigned to each product) with the percentage of each product output. Considering a total volume of 12,000 + 14,000 = 26,000 units, Alpha accounts for 46.2% and Beta accounts for 53.8% of total volume. You can see that overheads of all activities were assigned to Alpha in a percentage greater than 46.2%. So, Alpha’s unit overheads became greater than Beta’s.
●● Compare these percentages (of overheads assigned to each product) under ABC (Alpha: 59%; Beta: 41%) with the percentages under the traditional costing system (Alpha: 46.2%; Beta: 53.8%) (Calculations based on assigned overheads in Table 19.3). What does that mean?
In ABC, overheads of all activities assigned to Alpha are greater than in traditional costing (46.2%), so Alpha’s cost increased in ABC (remember that Elsivo’s traditional costing system allocated overheads according to volume; that’s why this comparison and the previous draw on the same percentage, 46.2%).
In ABC, overheads assigned to Alpha in individual activities are greater than at an aggregated level (59%) in the following activities:
1) Quality improvement and product inspection: 69.2% of costs and cost driver volume;
2) Product returns management: 69.2% of costs and cost driver volume;
3) Delivery: 76.9% of costs and cost driver volume.
Investigating these activities may allow understanding if Alpha’s above average usage of these activities is justifiable or if it can be improved. You should also keep in mind the magnitude of the costs of each activity: if they are insignificant, even large efficiency improvements will yield small cost savings. Let’s analyse each one of these three activities:
1) Alpha is charged with 69.2% of “Quality improvement and product inspection” costs because Alpha is responsible for 69.2% of production runs (the selected cost driver). By merely reducing the number of Alpha production runs, assigned overheads would decrease. If this cost driver really captures quality related costs caused by each product1, then organising Alpha production into fewer production runs would reduce this important cost component of Alpha (£90,000/ 12,000 units = £7.5/unit, almost a third of total £22.92/unit overhead cost). The 69.2% of “Product returns management” costs assigned to Alpha deserves attention. Why are so many Alpha products returned? Should it be due to quality issues, then the greater quality efforts devoted to Alpha (as measured in the previous activity) are apparently not successful. Since this activity may correspond to a quality failure that should not happen in the first place, and since it has a significant impact on Alpha’s cost structure (£36,000/12,000 units = £3/unit), improvements should be sought in this activity and, particularly, by eliminating the source of the activity costs: product returns.
Worked Example
19.2
➤
S0085_Sample.indd 13 7/25/2012 2:45:13 PM
DRAFT – DO N
OT COPY

CHAPTER 19 Cost Management, Value Creation and Sustainable Development14
Strategic ABM in Elviso: Changing sale pricesThe sale price of both products was the same, £60, perhaps because the traditional cost system indicated very similar product costs. Elviso might practice a cost plus pricing policy, common to both products. Sold quantities (Alpha: 12,000 units; Beta: 14,000
units) reflected the market reaction to that price. With ABC information and market research, the company may revise its pricing (see chapter 14). Since Alpha profit dropped and Beta profit increased, Elviso may increase Alpha price to avoid a near loss in this product; Elviso may also use the higher margin in Beta to reduce its price and become more price-competitive in this product.
As you learned in chapter 14, market research is fundamental to orient pricing, including short term and long term, strategic analysis. Short term analysis may include estimating changes in demanded quantities due to price changes and estimating profitability impacts – for example, by how much would Beta sales increase if price is reduced by, say, 5%? Would Beta profitability increase or decrease? Long-term, strategic analysis may include how price changes affect the product market positioning, as well as competitors’ reaction.
Do not forget that ABC analysis does not automatically identify the most adequate policy changes. A business-oriented analysis is always required to decide on these sensitive and crucial issues. It may well be that Elviso decides not to reduce Beta’s sale price and keep the higher margin, because reducing the price might send the wrong message to the market, suggesting that Beta has less quality. A price reduction could also be perceived by competitors as a price war, triggering a similar move from them, reducing their market price. This reaction from competitors might thus off-set the market-share increase that could result from Beta’s price reduction.
Worked Example
19.3
Strategic ABM in Elviso: Changing relationships with customers and “menu-based pricing”You have found out that delivery costs are mostly due to Alpha, which is delivered in smaller shipments. A possible managerial action would be to start charging a fee for
small deliveries, or even a fixed fee for every shipment of Alpha (this would hit smaller deliveries the most, on a unit basis). Introducing this fee would discourage customers from requesting many, but small deliveries, hence reducing the cost driver volume; and, even if it didn’t reduce, it would generate revenues to compensate the additional costs.
Worked Example
19.4
2) “Delivery”, the activity whose costs are more concentrated in Alpha (76.9%), comes third and last. Why? Because activity costs are smaller and costs assigned to Alpha are only £20,000, or £1.67 per unit. Even significant improvements in this activity may yield only small savings. In addition, keep in mind that delivery is a high value added activity. If frequent deliveries, in small shipments, is decisive for customer satisfaction and even an important competitive advantage, then reducing the number of shipments to reduce costs may actually destroy Alpha’s value proposition.
Note that these “heuristics” do not automatically signal problems. A higher percentage of assigned overhead to a product, in a given activity, only means that the product consumes a larger share of that activity when compared with other benchmarks; in turn, this indirectly represents a higher consumption of resources, i.e., costs by that product. A business-grounded interpretation is always necessary to make a correct diagnosis and decide appropriate action.
➤
➤
S0085_Sample.indd 14 7/25/2012 2:45:14 PM
DRAFT – DO N
OT COPY
Activity-Based Management (ABM): exploring andextending ABC 15
This “menu-based pricing” is common in on-line retailers like Amazon.com, that charge a fixed fee per shipment, but which may be waived for higher-value shipments. However, again, keep in mind the high value added of the delivery activity and even the competitive advantage that may be associated with frequent, smaller shipments. Charging such a fee may turn out to be extremely negative – in particular if we take into account that delivery costs are relatively insignificant. So, again, market research is indispensible to orient this pricing decision.
In this section, you explored how activity-based insights may orient operational and strategic decisions. Once again, remember that your analysis should depend on the characteristics of each case, based on calculated figures, the nature of activities and the business itself. So, the suggested questions, comparisons and analyses may yield useful insights, not you should not view them as a definitive road map for ABM analysis. In the next section, you will widen your perspective beyond the typically short time frames adopted for reporting and cost analyses and will focus on the entire life of a product, by exploring life cycle costing.
Life cycle costing
Why is life cycle costing important?When deciding about the introduction of a new product (or service), managers need to estimate all revenues and costs arising during that product life cycle – typically, extending beyond a particular year. A product generates revenues during the period it is sold to customers – its market life cycle. In turn, costs start arising before the product is launched due to, for instance, product development and marketing activities. And costs extend until after it is withdrawn from the market due to, for example, product warranties or ecologically-responsible disposal. Life cycle costing supports the life cycle profitability analysis: the evaluation of products profitability in this extended time horizon – the entire product life cycle - rather than the yearly or monthly segments usually used in common costing and profitability analysis. The following analysis focuses on products, but the fundamental ideas also apply to services. For an environmental perspective on products life cycle, see p. xxx later in this section.
When car manufacturers plan the launch of a new model, they need to estimate total revenues during the model market life cycle – typically a few years. With regard to costs, calculations are more complex and span over a larger period. The development of a new model is complex, costly and takes several years prior to market introduction. Production and sales costs are incurred during the market life cycle. The manufacturer is still committed to incur additional costs, such as those related with warranty commitments, for several years after each car is sold - even after the model is withdrawn from the market and replaced by another one. Some car manufacturers have generous warranty policies – extending for long periods, such as 5 years of basic warranty or 12 years warranty against corrosion. On occasions, they may even offer indefinite warranty against certain damages, limited only by mileage. This actually extends the product life cycle indefinitely – with regard to costs, of course.
Prospective life cycle costing is also important because it supports a financial perspective at a time when few things in the product are yet committed. As you will see later in the target costing section, at an early Research and Development (R&D) stage almost no life cycle costs are yet committed. So, it is the perfect time to evaluate alternative product and production processes and how life cycle costs and revenues change under different alternatives.
Products often have a four-stage market life cycle, as in Exhibit 19.3. Sales are low when products are first introduced, they grow until they reach their peak and then stabilize. Finally, sales decline when customer preference dwindles, until the product is removed from the market. Increasingly, products have shorter market life cycles, due to faster technology advances and increasingly shifting customer preferences towards new products. In addition, some products do not have a typical market life cycle. For example, Harry Potter’s books and Apple’s new versions of iPhone, iPod and iPad have massive sales on their release day and they can even be reserved in advance
➤
S0085_Sample.indd 15 7/25/2012 2:45:14 PM
DRAFT – DO N
OT COPY

CHAPTER 19 Cost Management, Value Creation and Sustainable Development16
in sellers like Amazon. Also, cars and technological products are often removed from the market before their sales start declining and they are replaced with new versions, to prevent market share loss to competitors.
Introduction
Pro
duct
sal
es
Growth Maturity Decline
Exhibit 19.3: Products traditional market life cycle
The product pre-launch stagePre-launch costs may be very significant and extend for a long time, due to R&D, marketing, certification and business development activities. In the pharmaceutical industry, R&D costs and length are particularly high and uncertain. Drugs may take decades to be developed, tested in a lab environment, tested in human patients in clinical trials and certified by health regulators (typically, in every country), before they can be introduced in the various markets.
Estimating pre-launch costs of future products is also critical because they are incurred when there are still no revenues generated by the yet-to-be-launched product. Companies need to evaluate their capacity to support those up-front expenses, based on resources previously accumulated or generated on an on-going basis by other products already on the market. The famous BCG matrix, developed by the Boston Consulting Group in the 1960′s, is still a useful framework to think about a company portfolio of products or business units, and about balancing the needs and generation of resources from the various areas – although we should bear in mind that the life cycle of many products is now substantially different from the typical life cycle some decades ago.
The product production and sale stagesThis is the most traditional focus of accounting systems. Unfortunately, sometimes information systems can only analyse one period at a time. However, keep in mind that a life cycle perspective typically encompasses multiple financial periods, so suitable information systems must be able to aggregate multiple-period data.
The product after-sale stageAfter a unit is sold and even after a product is removed from the market, further costs may be incurred due to customer service and support and, increasingly, to environmental and sustainability responsibilities.
Producers of batteries and tyres have responsibilities towards proper disposal of their products after used by clients and mining companies have to rehabilitate the sites when they end extracting activities. Product warranties are 1 or 2 years in most electric appliances and longer in cars and real estate, depending on legislation and sellers’ policy. Software manufacturers provide support during several years after ending sales. This commitment to customers may be an important component of the value offer, since it protects customers’ investment. See next the Management Accounting in Practice 19.1 example regarding Microsoft, followed by the life cycle costing worked example 19.5.
S0085_Sample.indd 16 7/25/2012 2:45:15 PM
DRAFT – DO N
OT COPY

Activity-Based Management (ABM): exploring andextending ABC 17
19.1: Management Accounting in Practice
Comparing Microsoft’s Windows operating systems life cycleEven a very superficial comparison of the life cycle stages of two operating systems from Microsoft, Windows Vista and XP, provides some interesting insights. Windows Vista, launched in January 2007, had a market life cycle of only about 4.5 years: final sales, through pre-installation in PC’s, ended in October 2011 (sales through retailers ended one year before). This was substantially lower than the total market life cycle of the previous system, Windows XP, which lasted almost nine years.
However, Windows Vista’s pre-launch stage was clearly longer than XP’s: Windows Vista was developed in 5.5 years, against only 1.5 years taken to develop Windows XP. Windows Vista’s after sale stage was also longer than XP’s. The after-sale stages are less different. The end of mainstream support, when Microsoft stops providing automatic fixes, updates, or online technical assistance for the general public, happened in April 2012 for Windows Vista, i.e., half a year after end of sales. For Windows XP, mainstream support ended in April 2009 - even before sales through PC pre-installation ended and about a year after the end of retail sales. For both products, Microsoft provides extended support - at a cost – to commercial customers for an additional period.
Comparing the life cycle of the two systems, Windows Vista’s shorter market lifetime and longer development stage suggests worse financial results – although, of course, any conclusion is impossible without knowing all revenues and costs. Allocating development costs to particular products is not straightforward. Fundamental technical developments, such as IT architecture, may be used in several products. Microsoft’s current operating system, Windows 7, was developed in only one year, but benefited from developments incorporated in Windows Vista – often described as mostly an intermediate version between Windows XP and Windows 7.
Sources: http://windows.microsoft.com/en-us/windows/products/life cycle; http://en.wikipedia.org/wiki/Development_of_Windows_Vista; http://en.wikipedia.org/wiki/Development_of_Windows_XP; http://en.wikipedia.org/wiki/Development_of_Windows_7, accessed on 15-05-2012.
Exercises:1) Suppose a financial analyst argued that Windows Vista was prematurely withdrawn from the market because
its short market life cycle damaged its financial return. Discuss this opinion.
2) Identify alternative ways to allocate development costs benefiting various generations of product releases, and discuss advantages and disadvantages of each alternative.
Continuous improvement and kaizen cost management (or kaizen costing)
The continuous improvement/kaizen approachRanging from the proverb “Slowly but surely” to successful business stories of brands like Tide (a major laundry detergent brand from Procter & Gamble in the USA and many other countries) and companies like Toyota, many examples demonstrate the importance of a permanent, long-term commitment towards improvements. Procter & Gamble has been continuously introducing innovations in the Tide brand and product, such as better cleaning power and energy efficiency, reduced packaging and lower manufacturing and distribution costs. This continuous stream of
S0085_Sample.indd 17 7/25/2012 2:45:19 PM
DRAFT – DO N
OT COPY
CHAPTER 19 Cost Management, Value Creation and Sustainable Development18
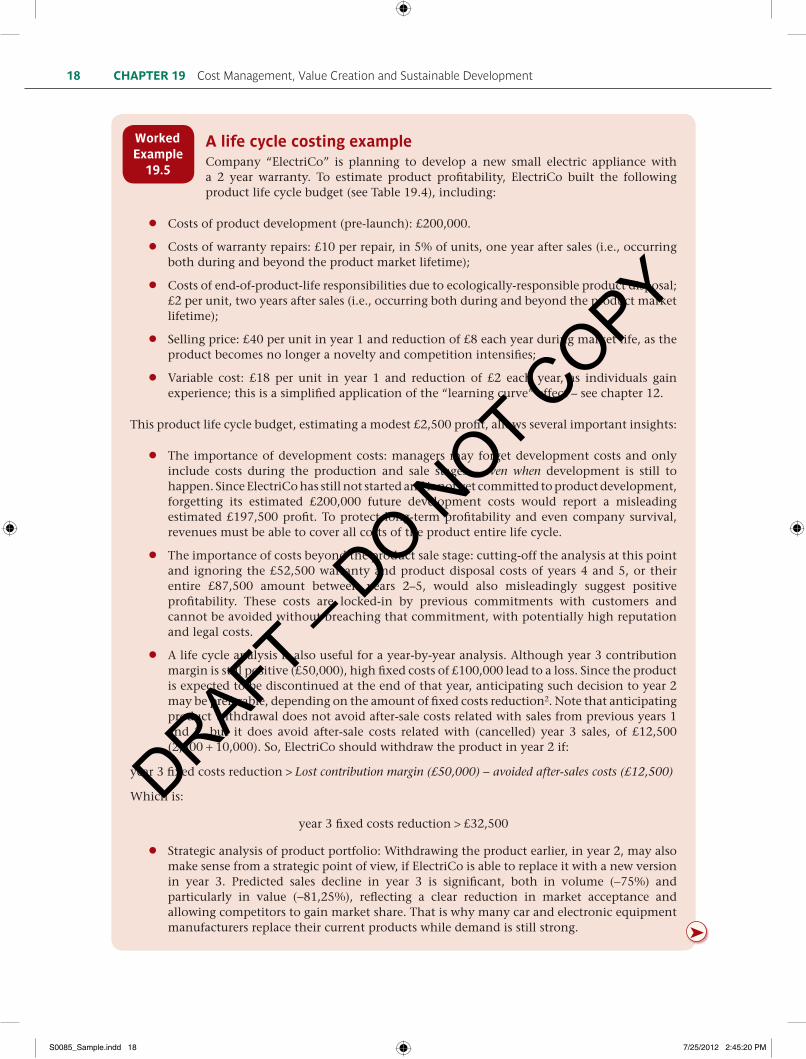
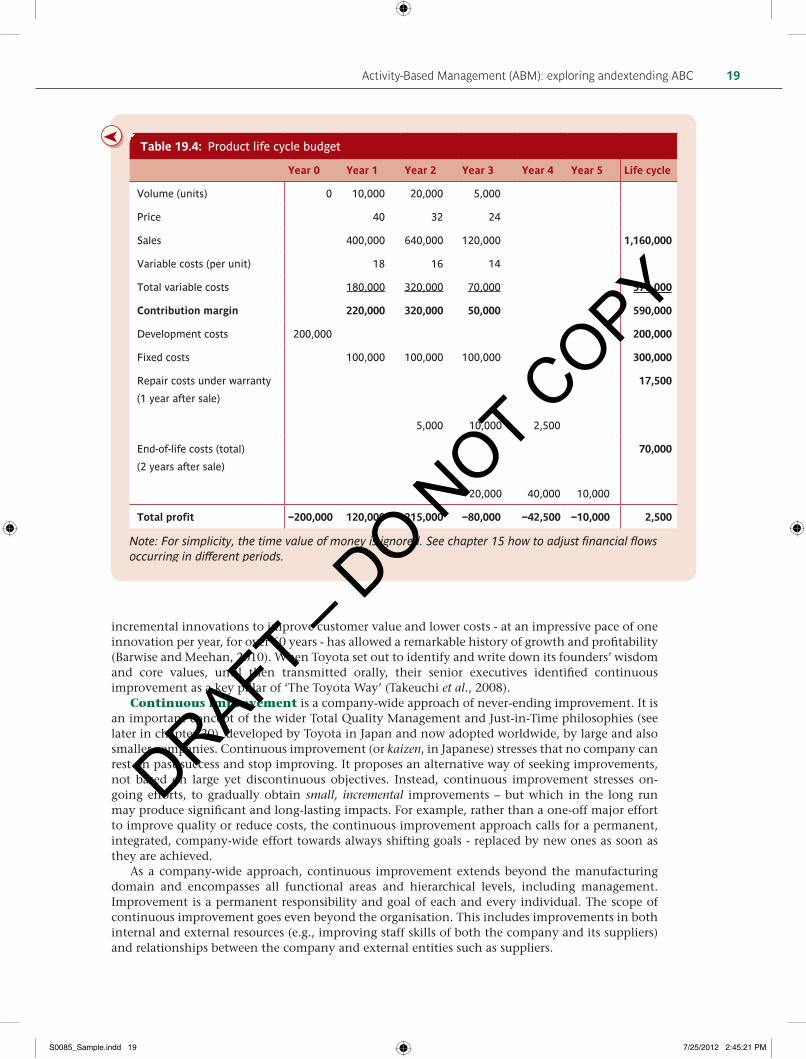
A life cycle costing exampleCompany “ElectriCo” is planning to develop a new small electric appliance with a 2 year warranty. To estimate product profitability, ElectriCo built the following product life cycle budget (see Table 19.4), including:
●● Costs of product development (pre-launch): £200,000.
●● Costs of warranty repairs: £10 per repair, in 5% of units, one year after sales (i.e., occurring both during and beyond the product market lifetime);
●● Costs of end-of-product-life responsibilities due to ecologically-responsible product disposal; £2 per unit, two years after sales (i.e., occurring both during and beyond the product market lifetime);
●● Selling price: £40 per unit in year 1 and reduction of £8 each year during market life, as the product becomes no longer a novelty and competition intensifies;
●● Variable cost: £18 per unit in year 1 and reduction of £2 each year, as individuals gain experience; this is a simplified application of the “learning curve” effect – see chapter 12.
This product life cycle budget, estimating a modest £2,500 profit, allows several important insights:
●● The importance of development costs: managers may forget development costs and only include costs during the production and sale stages – even when development is still to happen. Since ElectriCo has still not started and is not yet committed to product development, forgetting its estimated £200,000 future development costs would report a misleading estimated £197,500 profit. To protect long-term profitability and even company survival, revenues must be able to cover all costs of the product entire life cycle.
●● The importance of costs beyond the product sale stage: cutting-off the analysis at this point and ignoring the £52,500 warranty and product disposal costs of years 4 and 5, or their entire £87,500 amount between years 2–5, would also misleadingly suggest positive profitability. These costs are locked-in by previous commitments with customers and cannot be avoided without breaching that commitment, with potentially high reputation and legal costs.
●● A life cycle analysis is also useful for a year-by-year analysis. Although year 3 contribution margin is still positive (£50,000), high fixed costs of £100,000 lead to a loss. Since the product is expected to be discontinued at the end of that year, anticipating such decision to year 2 may be preferable, depending on the amount of fixed costs reduction2. Note that anticipating product withdrawal does not avoid after-sale costs related with sales from previous years 1 and 2, but it does avoid after-sale costs related with (cancelled) year 3 sales, of £12,500 (2,500 + 10,000). So, ElectriCo should withdraw the product in year 2 if:
year 3 fixed costs reduction > Lost contribution margin (£50,000) - avoided after-sales costs (£12,500)
Which is:
year 3 fixed costs reduction > £32,500
●● Strategic analysis of product portfolio: Withdrawing the product earlier, in year 2, may also make sense from a strategic point of view, if ElectriCo is able to replace it with a new version in year 3. Predicted sales decline in year 3 is significant, both in volume (-75%) and particularly in value (-81,25%), reflecting a clear reduction in market acceptance and allowing competitors to gain market share. That is why many car and electronic equipment manufacturers replace their current products while demand is still strong.
Worked Example
19.5
➤
S0085_Sample.indd 18 7/25/2012 2:45:20 PM
DRAFT – DO N
OT COPY
Activity-Based Management (ABM): exploring andextending ABC 19
Table 19.4: Product life cycle budget
Year 0 Year 1 Year 2 Year 3 Year 4 Year 5 Life cycle
Volume (units) 0 10,000 20,000 5,000
Price 40 32 24
Sales 400,000 640,000 120,000 1,160,000
Variable costs (per unit) 18 16 14
Total variable costs 180,000 320,000 70,000 570,000
Contribution margin 220,000 320,000 50,000 590,000
Development costs 200,000 200,000
Fixed costs 100,000 100,000 100,000 300,000
Repair costs under warranty
(1 year after sale)
5,000
10,000
2,500
17,500
End-of-life costs (total)
(2 years after sale)
20,000
40,000
10,000
70,000
Total profit −200,000 120,000 215,000 −80,000 −42,500 −10,000 2,500
Note: For simplicity, the time value of money is ignored. See chapter 15 how to adjust financial flows occurring in different periods.
➤
incremental innovations to improve customer value and lower costs - at an impressive pace of one innovation per year, for over 60 years - has allowed a remarkable history of growth and profitability (Barwise and Meehan, 2010). When Toyota set out to identify and write down its founders’ wisdom and core values, until then transmitted orally, their senior executives identified continuous improvement as a key pillar of ‘The Toyota Way’ (Takeuchi et al., 2008).
Continuous improvement is a company-wide approach of never-ending improvement. It is an important concept of the wider Total Quality Management and Just-in-Time philosophies (see later in chapter 20), developed by Toyota in Japan and now adopted worldwide, by large and also smaller companies. Continuous improvement (or kaizen, in Japanese) stresses that no company can rest on past success and stop improving. It proposes an alternative way of seeking improvements, not based on large yet discontinuous objectives. Instead, continuous improvement stresses on-going efforts, to gradually obtain small, incremental improvements – but which in the long run may produce significant and long-lasting impacts. For example, rather than a one-off major effort to improve quality or reduce costs, the continuous improvement approach calls for a permanent, integrated, company-wide effort towards always shifting goals - replaced by new ones as soon as they are achieved.
As a company-wide approach, continuous improvement extends beyond the manufacturing domain and encompasses all functional areas and hierarchical levels, including management. Improvement is a permanent responsibility and goal of each and every individual. The scope of continuous improvement goes even beyond the organisation. This includes improvements in both internal and external resources (e.g., improving staff skills of both the company and its suppliers) and relationships between the company and external entities such as suppliers.
S0085_Sample.indd 19 7/25/2012 2:45:21 PM
DRAFT – DO N
OT COPY

CHAPTER 19 Cost Management, Value Creation and Sustainable Development20
Applying kaizen principles to cost managementWhen applied to costs, a continuous improvement (kaizen) management approach leads to kaizen costing, more appropriately called kaizen cost management. As part of on-going efforts to reduce costs, companies set kaizen goals of cost reduction for their products, processes, parts of processes or parts of their cost structure – particular direct materials, labour, or any particular area considered crucial to achieve and maintain competitiveness. Continuous improvement efforts are then targeted to lower costs through higher efficiency and waste reduction. When those goals are attained, the improved performance level becomes the starting point to new, more ambitious goals.
Incorporating kaizen principles in cost management and accounting techniques allows to overcome some of the limitations pointed towards traditional accounting practices, such as budgeting (Chapter 8) and standard costing (Chapter 9). First, both practices been accused of quickly becoming obsolete if circumstances change after the start of the period. As you learned in Chapter 10, kaizen budgeting incorporates the on-going progresses and search for cost improvements within the budgeting process. So, the budget will embed cost improvements and estimates for cost reductions on a continuous basis, rather than keeping initial budget costs.
Second, budgeting has been accused of limiting incentives to improve, since incentives tend to focus on attaining the budget – but not exceeding it. At this point, the cultural component of continuous improvement is crucial, based on a socially-embedded, collective continuous commitment towards improvement. The importance of these cultural traits, typical of the Japanese context where these techniques emerged, has justified concerns about whether Japanese-originated techniques can be easily adopted by organisations in different cultural contexts.
Gains from continuous improvement differ substantially from the learning curve effect discussed in Chapter 12. Both concepts anticipate that costs may be reduced during the manufacturing stage. However, the learning curve concept seems to assume that cost reduction will happen in a somewhat automatic and “natural” way: as cumulative quantity increases and as individuals learn and gain experience with their task, they first obtain high efficiency gains, which then level-off to a more steady-state as less efficiency gains are possible. Although the learning curve concept actually requires active efforts for this improvement to occur, its formula suggests that a greater accumulated volume will make this gain emerge. This suggestion is at odds with the continuous improvement approach, for two reasons. First, the continuous improvement approach does not take improvements for granted or as natural. Instead, improvements will only happen if actively sought after by everyone, all the time; production volume, in itself, plays little or no role. Second, the continuous improvement approach believes that improvements, albeit small, are always possible and – importantly – will add up to very significant accumulated gains in the long run. This belief contrasts with the insignificant gains suggested by the learning curve effect at high levels of cumulative production, which discourage a major commitment towards improvement when those stages are reached.
Next, we will explore another Japanese cost management technique, focused on an earlier stage of the product life cycle: target costing, focused on the development stage.
Target costing (or target cost management)
What is target costing and why is it important?The continuous improvement/kaizen approach may yield significant gains over time, but it has a key limitation: it is only applied in a late stage of the product life cycle, the manufacturing stage. The problem is that most future costs of the product life cycle become committed, or “locked-in”, when a product (or service) and its production process are designed. Product design and technological choices at the Research and Development (R&D) stage largely shape costs of future activities such as production, distribution and customer support, throughout the product life cycle. After production starts, the possibility of cost improvements becomes more limited.
The R&D stage is the best time for cost management. First, because the improvement potential is greater: companies may make choices influencing future costs without the constraints of an already designed product and production process. Second, because only R&D costs have been incurred so far. So, obtained savings will apply to the entire volume of the product life cycle.
S0085_Sample.indd 20 7/25/2012 2:45:21 PM
DRAFT – DO N
OT COPY
Target costing (or target cost management) 21
Finally, if the company realises to be incapable of designing a product expected to deliver the desired profitability, the project never passes that initial stage, hence avoiding additional costs.
Target costing explores the greater potential for cost management at the R&D stage. More appropriately described as a target cost management system, target costing is a proactive, future-oriented costing approach, at the R&D stage, orienting design options to develop new products that attain a desired future profitability level. For that purpose, target costing estimates expected costs, as well as revenues and profits, throughout the entire product life cycle. Target costing was also developed by the Japanese at Toyota in the 1960’s, with some underlying ideas stretching back to Ford’s principles in the early 1900’s, and is now a widespread practice.
Target costing is important because many R&D efforts fail to deliver products which are both marketable and profitable. Frequently, R&D efforts fail because developers are too focused on technical aspects per se, without considering the extent to which customers will value the product technical characteristics. Other times, R&D efforts, although oriented by market research, fail to seriously examine cost issues until the product is ready to leave the lab – or, even worse, accurate cost estimates are only made when the product enters the manufacturing stage. At that stage, significant resources and time have already been spent and, in addition, a large percentage of future product life cycle costs may have already become locked-in.
Integrating the marketing, engineering and costing perspectivesBy ultimately focusing on profitability, target costing focuses on more than just costs. In fact, its starting point is the market and customers’ perceptions of value, as stated early in this chapter. Insights from employees with closer contact with customers and market research are essential to determine customers’ value perceptions which influence customers’ willingness to pay. In particular, companies need to perform attribute pricing, based on estimates of customers’ willingness to pay for different attributes (such as different functionalities, performance and reliability levels), both individually and when integrated within particular product configurations. The ultimate objective is to determine alternative product designs and market prices that support the company strategic competitive position.
In addition, customers’ perceptions of value and willingness to pay only translate into sales and revenues within a particular market context, with both current and potential competitors. So, the target costing approach must also examine competitors, their products, their overall value proposition and prices, and customers’ value perception of competitors’ offer. This requires further marketing and technical insights, including through reverse engineering, a practice included in the wider value engineering approach. Reverse engineering involves disassembling competitors’ products to obtain detailed insights about their design features, materials and production techniques.
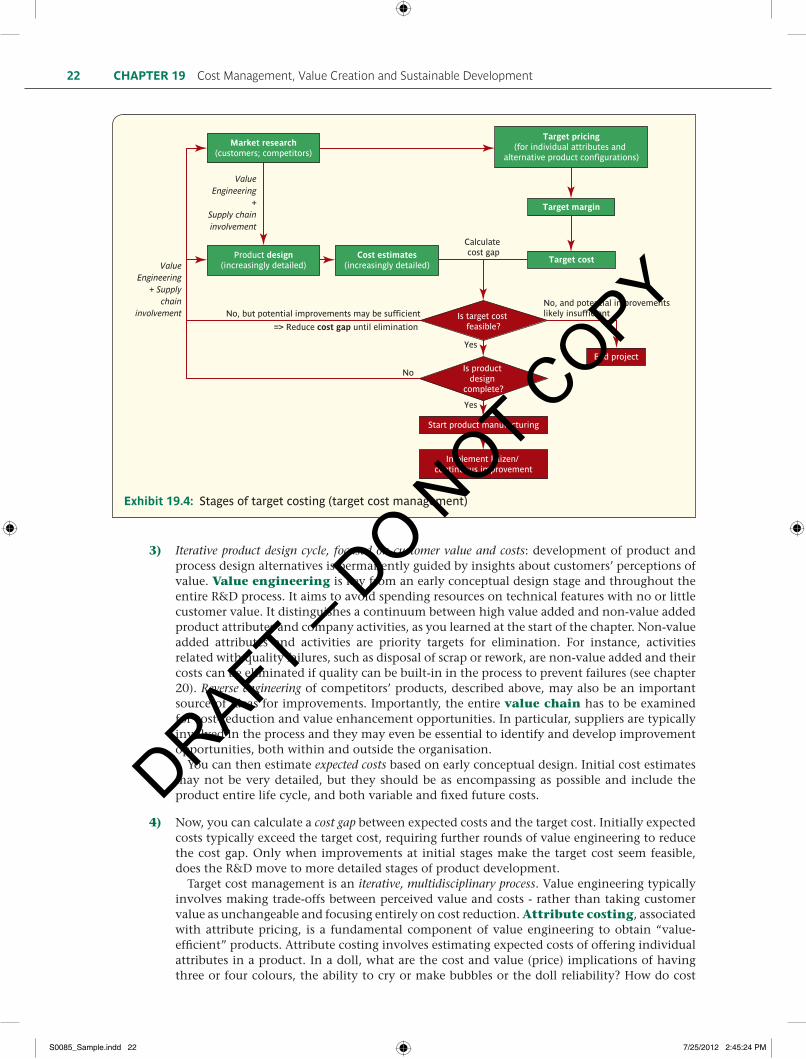
Target costing typically involves various cycles of the following stages, as described in Exhibit 19.4.
1) Market research and target pricing: market insights about customers and competitors are fundamental and the starting point for target costing. Attribute pricing evaluates customers’ willingness to pay for particular attributes, both in isolation and in the context of alternative configurations of the final product. Considering company strategic objectives for sales, market share, image and overall profitability, as well as information about competitors’ offers, companies estimate target prices. Typically, at this stage, various alternative product configurations are examined. As you learned in chapter 14, pricing practices should support strategic and financial objectives, which often does not lead to simply maximising short term profitability, and requires a product life cycle perspective.
2) Set target margins and target costs: based on the target price, a target margin is calculated to meet corporate profitability objectives. This desired margin on sales may be common to all products or may be product-specific to reflect the perceived risk of the particular product. The target cost is the target price minus the target margin, for the selected product or the various alternative configurations under evaluation. This is a distinctive feature of target cost management: keeping every R&D member focused on both value and costs objectives, right from the start of the ensuing design cycle.
S0085_Sample.indd 21 7/25/2012 2:45:22 PM
DRAFT – DO N
OT COPY
CHAPTER 19 Cost Management, Value Creation and Sustainable Development22
3) Iterative product design cycle, focused on customer value and costs: development of product and process design alternatives is permanently guided by insights about customers’ perceptions of value. Value engineering is key from an early conceptual design stage and throughout the entire R&D process. It aims to avoid spending resources on technical features with no or little customer value. It distinguishes a continuum between high value added and non-value added product attributes and company activities, as you learned at the start of the chapter. Non-value added attributes and activities are priority targets for elimination. For instance, activities related with quality failures, such as disposal of scrap or rework, are non-value added and their costs can be eliminated if quality can be built-in in the process to prevent failures (see chapter 20). Reverse engineering of competitors’ products, described above, may also be an important source of ideas for improvements. Importantly, the entire value chain has to be examined for cost-reduction and value enhancement opportunities. In particular, suppliers are typically involved in the process and they may even be essential to identify and develop improvement opportunities, both within and outside the organisation.
You can then estimate expected costs based on early conceptual design. Initial cost estimates may not be very detailed, but they should be as encompassing as possible and include the product entire life cycle, and both variable and fixed future costs.
4) Now, you can calculate a cost gap between expected costs and the target cost. Initially expected costs typically exceed the target cost, requiring further rounds of value engineering to reduce the cost gap. Only when improvements at initial stages make the target cost seem feasible, does the R&D move to more detailed stages of product development.
Target cost management is an iterative, multidisciplinary process. Value engineering typically involves making trade-offs between perceived value and costs - rather than taking customer value as unchangeable and focusing entirely on cost reduction. Attribute costing, associated with attribute pricing, is a fundamental component of value engineering to obtain “value-efficient” products. Attribute costing involves estimating expected costs of offering individual attributes in a product. In a doll, what are the cost and value (price) implications of having three or four colours, the ability to cry or make bubbles or the doll reliability? How do cost
Market research(customers; competitors)
Target pricing(for individual attributes and
alternative product configurations)
Target margin
Target costProduct design(increasingly detailed)
Cost estimates(increasingly detailed)
Is target cost feasible?
No, but potential improvements may be sufficient
=> Reduce cost gap until elimination
ValueEngineering
+ Supplychain
involvement
ValueEngineering
+Supply chaininvolvement
Start product manufacturing
Implement kaizen/ continuous improvement
Yes
Yes
Is product design
complete?
No
No, and potential improvements likely insufficient
End project
Calculate cost gap
Exhibit 19.4: Stages of target costing (target cost management)
S0085_Sample.indd 22 7/25/2012 2:45:24 PM
DRAFT – DO N
OT COPY
Business Process Reengineering (BPR) and Management (BPM) 23
savings from using components common to other dolls compare to a potential loss of value due to less differentiation? How do alternative features interact? For example, might more sophisticated functionalities require fragile components and hence compromise the doll’s reliability and imply additional customer service costs?
This iterative process may take us back to the starting point: market research. As new product alternatives emerge during the process, there may be the need to obtain new market information about customers’ perceptions and competitors’ offers. For these new alternatives, new target prices, margins and costs are calculated; new costs are estimated and compared with the new target costs; and the new cost gap is analysed.
So, there are on-going value engineering efforts, at each R&D stage from conceptual design to final design options. Throughout these R&D cycles, the expected cost and the target cost are compared to calculate the cost gap, leading to one of the following results:
●● ●The cost gap has been eliminated. In this case, the R&D process moves on to a more detailed stage or, if product design is completed, manufacturing may start; alternatively,
●● ●The company concludes that the cost gap cannot be reduced and abandons the project. Abandoning a R&D project, in particular before incurring in huge costs, should not be necessarily seen as a failure, since this is preferable to developing and manufacturing a product that either fails to please the market or to provide the desired profitability.
5) When manufacturing starts, with the selected product and process design, the goal becomes not only to control and ensure that costs estimated during the R&D stage are actually achieved, but also to continuously improve – the kaizen approach described before. Again, both cost reduction and value improvements are sought, now at the manufacturing stage, in a continuous way.
Note that the R&D process may be reopened when it becomes apparent that more fundamental changes are possible and required – restarting target cost management again. Even more fundamentally, R&D processes are typically never ending: when a product enters the manufacturing stage, R&D efforts are then directed to further improve it or to develop its future successor. For instance, in the automotive industry, given the long stages of conceptualisation, development and production, manufacturers are often producing one model, finalising the design of its successor and conceptualising the successor of the next model – all at the same time.
Conclusion about kaizen and target costingBoth target costing and kaizen costing are not actually costing techniques, but rather prospective, future-oriented cost management systems. This system requires the involvement of members of marketing, engineering, production in multifunctional teams. Management accountants can play a key, direct role as a team member highlighting the financial orientation that underlies this cost management system and by providing cost estimates suitable for the various stages of target cost management.
Business Process Reengineering (BPR) and Management (BPM)
Business Process Reengineering (BPR)Aims to design and implement radically different processes to conduct business. Business processes are linked sets of activities that organisations perform to attain their objectives, potentially involving multiple functional areas within organisations, in line with what you learned about ABC/ABM. For example, a customer service process may be triggered by a customer complaint to the call centre and then involve the shop floor (to investigate a potential problem and carry out repairs), the legal department (to avoid or settle a dispute) and the financial department (to issue a refund or other payments).
S0085_Sample.indd 23 7/25/2012 2:45:24 PM
DRAFT – DO N
OT COPY
CHAPTER 19 Cost Management, Value Creation and Sustainable Development24
BPR goes beyond mere process improvement and aims to fundamentally question the way processes are performed at a given time, redesigning them in significantly, even radically different ways. For instance, consumer product manufacturers like Unilever and Procter & Gamble have complex logistical processes involving their packaging suppliers. Logoplaste, a Portuguese-based producer of packaging solutions, was a pioneer in its industry by offering its multinational clients a radically different approach: rather than merely improving traditional logistic processes, Logoplate started building its own plants inside customers’ plants across the world. This reengineers business processes both inside the customer organisation and in its relationships with external parties. It eliminates transportation of goods between the packaging supplier and the customer and it fosters closer cooperation between them (see the case study at the end of the chapter).
BPR became popular in the 1990’s through management gurus like Michael Hammer and Thomas Davenport. Hammer (1990) (see also Hammer, 2007) identified non-value activities within long-established business processes as main causes of competitive difficulties. So, he urged managers to fundamentally question the assumptions and beliefs underlying those activities and processes. Hammer further argued that information systems were not providing needed improvements because they were only mechanising old, obsolete business processes. In other words, information systems were not triggering fundamental organisational change. So, BPR gurus urged managers not to automate (old) processes, but rather to obliterate them, through radical reengineering.
BPR was implemented by many companies. However, the disruption implied (and indeed recommended) by BPR also caused some BPR initiatives to fail. As much research points out, history matters in organisation and much change is path-dependent – what we can do and change now is dependent on previous choices, actions and beliefs. “Starting from scratch”, as sometimes implicitly suggested by BPR, is not a realistic option, since all change implementation is situated, i.e., carried out in particular organisations, with a particular history and characteristics (see Chapter 22).
Furthermore, BPR also became associated with drastic cost reductions, in particular through massive layoffs, promoting organisational resistance, decreasing morale and causing the loss of key staff and organisational knowledge. Davenport (1995) reflected on severe problems with BPR development and implementation, and explained how this huge management fad of the 1990’s was fuelled by converging powerful interests of top managers, major management consultancies and major IT vendors.
The failure of many BPR implementations and the criticisms BPR received promoted the emergence of less radical approaches towards business process improvements. In particular, Business Process Management (BPM) has emerged as a major concept, with a less radical approach than BPR, and has been endorsed and promoted by major consultancies and IT vendors, such as IBM and SAP. BPM’s less radical approach may potentially yield smaller-scale improvements when compared to BPR; however, less organisational disruption and less managerial challenges have fuelled BPM popularity, as well as easier integration with other managerial tools like Continuous Improvement (analysed in this chapter) and Total Quality Management (TQM, analysed in chapter 20). Recently, Hammer (2007) also proposed the “Process and Enterprise Maturity Model” (PEMM), explored in the Management Accounting Insight 19.1.
Sustainable development and accounting
The sustainable development movementSustainable development (SD) has increasingly become a major concern for organisations and society. There is an increasing awareness that environmental resources are limited, with potentially serious consequences for individual companies, business models and society. Social factors related with the well-being of employees, local communities and society at large have also emerged as relevant ethical and business issues. Both environmental and social factors influence the sustainable development of companies, business models and the society. A generally accepted definition of sustainable development is “an approach to progress which meets the needs of the present without compromising the ability of future generations to meet their own needs” (World Commission on Environment and Development, 1987, p. 8). As proponents argue, “sustainable development is the only conceptual game in town” (Bebbington, 2009) and it is now a hot topic in academic and professional journals and the media in general.
S0085_Sample.indd 24 7/25/2012 2:45:25 PM
DRAFT – DO N
OT COPY

Sustainable development and accounting 25
19.1: Management Accounting Insight
BPR is calling for a “mature” management accounting discipline!Hammer (2007) recognised that BPR is “terribly tough to manage” and reflected on why companies often achieve little improvement through BPR initiatives. As a less radical alternative, he recently proposed the ‘Process and Enterprise Maturity Model’ (PEMM) for companies to deliver higher performance over time, by making their processes more mature.
PEMM distinguishes between process enablers and enterprise capabilities. The five process enablers are related to individual processes and include: design; performers; owner; infrastructure; and metrics. Process enablers are all necessary and mutually inter-dependent, but they are not sufficient. Enterprise capabilities, related with the entire organisation, are crucial to allow process enablers and the redesigned processes to take root and become sustained practices – i.e., to become institutionalised (see chapter 22 on institutionalisation). The four enterprise capabilities are leadership, culture, expertise and governance.
While management accounting is absent from Hammer’s analysis, his model (PEMM) provides insights on how management accounting and accountants can fit and support fundamental changes in organizational processes. Drawing from Hammer’s characterisation of four levels of increasing maturity, you can see how management accounting processes and professionals may - and must - become more mature, across various process enablers and enterprise capabilities.
Process enablersMetrics is a traditional area of management accountants. To improve the maturity of the process in management accounting, they must develop the following cumulative metrics, from the most basic to the most mature level:
1) Some basic cost and quality metrics.
2) End-to-end process metrics derived from customer requirements.
3) Individual and cross-process metrics based on the organisational strategic goals.
4) Metrics based on inter-organisational goals.
This requires management accountants to move beyond the traditional domain of cost accounting and adopt metrics with a wider scope, including customer-relevant metrics, strategy-oriented metrics and inter-organisational metrics (see chapters 17, 19, 20 and 22).
Infrastructure is also often an intervention area of management accountants, when they become involved in designing and implementing information systems, in particular integrated information systems (chapter 21), or become involved in performance measurement and evaluation processes.
Enterprise capabilitiesManagement accountants must also contribute to enterprise capabilities. They should develop a culture based on customer focus, teamwork, personal accountability and willingness to change. Finally, they should improve BPR governance by developing mechanisms that support managing complex projects and change initiatives.
Source: Hammer (2007)
Exercises:1) Make a list of the first five management accounting techniques (concerning metrics) that come to your
mind. Considering the four items listed above, what maturity level does each technique have?
2) What does your previous answer reveal about your management accounting background? If more “mature” metrics were missing, did you also learn about them but did not “come first thing to your mind”? Why/why not?
S0085_Sample.indd 25 7/25/2012 2:45:26 PM
DRAFT – DO N
OT COPY

CHAPTER 19 Cost Management, Value Creation and Sustainable Development26
A very narrow view of sustainable development can be found in financial evaluation techniques adopting a long term perspective. For example, calculating the Net Present Value (NPV) of an investment in a new plant requires financial estimates for a long period of time, hence requiring estimating financial flows over the relevant (long) period. But this concern on the sustainability of financial flows (in particular, inflows) typically ignores whether the continuous usage of indispensible social and environmental inputs is, itself, sustainable. Increasing awareness of limits to resources usage led to two types of concerns. The first concern is how those limits can affect the sustainability of business models – an extension of the traditional, financially-oriented view of sustainability. The second concern is to measure, manage and protect those environmental and social resources themselves with an ultimate objective to protect Earth’s multiple stakeholders, including humans, animals and plants. Together, both concerns promote the increasingly acknowledged requirement to have business models which themselves promote the various dimensions of sustainable development. As you will see in the remainder of the chapter, accountants may support the design, implementation and running of sustainable business models by deploying various techniques, both in management accounting and financial reporting. These techniques and practices are commonly referred to as sustainability accounting3.
A business case for sustainable business models – and the role for management accountantsDoes it pay-off to develop sustainable business models? Critics point out the sometimes substantial design and implementation up-front costs. On the other hand, sustainability proponents argue that not only is sustainability free (by its benefits matching its costs), but it can even improve performance.
Golicic et al. (2010) discuss incentives leading major companies to increasingly pursue sustainability, by focusing on the supply chain and, in particular, on transportation. Only 44 among the Fortune 500 companies address environmental impacts of transportation, with varying levels of detail: almost all acknowledge them; most report changing practices; and only a minority reports achieved reductions. The authors acknowledge that profitability pressures may still play against more widespread adoption of sustainable practices. However, they recommend starting with projects targeted at “low-hanging fruit”, i.e., easier to implement, likely to have measured success and visible to key stakeholders.
Other accounts are more positive. Haanaes et al. (2011) report the findings of a survey from MIT Sloan Management Review/Boston Consulting Group, indicating that 69% of surveyed companies are planning to increase their investment in sustainability. Interviewed top executives shared the idea of integrating sustainability in the fabric, rather than as a layer, of the business. And the recent report from Accenture and CIMA indicate numerous examples of business gains from sustainability (see Management Accounting in Practice 19.2).
Researchers and practitioners converge on one aspect: metrics of both costs and results are essential for a business justification of sustainable development. And metrics are a traditional expertise area of the finance and management accounting function. As highlighted in the recent Accenture and CIMA (2011) survey, the finance function has three main roles in assisting sustainable development: investment analysis (including making the business case), tracking Key Performance Indicators (KPIs) and reporting metrics to meet business and customer needs (see Exhibit 19.5). Overall, identified roles contribute towards the three main business drivers for sustainable development – efficiency, compliance and supporting revenue generation. This is in
19.2: Management Accounting in Practice
Business benefits from sustainabilityAn Accenture and CIMA report illustrates of how leading companies benefited from sustainability, by increasing revenues, controlling costs, building trust, managing risks and exploring opportunities across the entire organisational value chain. ➤
S0085_Sample.indd 26 7/25/2012 2:45:27 PM
DRAFT – DO N
OT COPY
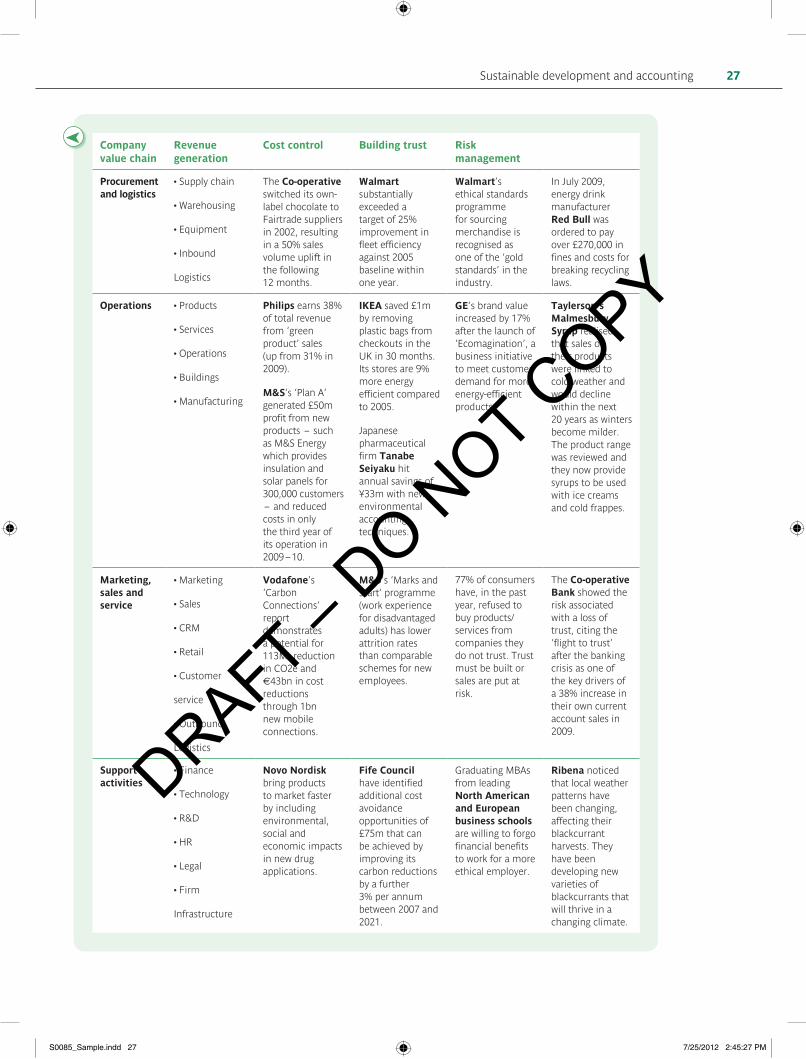
Sustainable development and accounting 27
Company value chain
Revenue generation
Cost control Building trust Risk management
Procurement and logistics
• Supply chain
• Warehousing
• Equipment
• Inbound
Logistics
The Co-operative switched its own-label chocolate to Fairtrade suppliers in 2002, resulting in a 50% sales volume uplift in the following 12 months.
Walmart substantially exceeded a target of 25% improvement in fleet efficiency against 2005 baseline within one year.
Walmart’s ethical standards programme for sourcing merchandise is recognised as one of the ‘gold standards’ in the industry.
In July 2009, energy drink manufacturer Red Bull was ordered to pay over £270,000 in fines and costs for breaking recycling laws.
Operations • Products
• Services
• Operations
• Buildings
• Manufacturing
Philips earns 38% of total revenue from ‘green product’ sales (up from 31% in 2009).
M&S’s ‘Plan A’ generated £50m profit from new products – such as M&S Energy which provides insulation and solar panels for 300,000 customers – and reduced costs in only the third year of its operation in 2009–10.
IKEA saved £1m by removing plastic bags from checkouts in the UK in 30 months. Its stores are 9% more energy efficient compared to 2005.
Japanese pharmaceutical firm Tanabe Seiyaku hit annual savings of ¥33m with new environmental accounting techniques.
GE’s brand value increased by 17% after the launch of ‘Ecomagination’, a business initiative to meet customer demand for more energy-efficient products.
Taylerson’s Malmesbury Syrup realised that sales of their products were linked to cold weather and would decline within the next 20 years as winters become milder. The product range was reviewed and they now provide syrups to be used with ice creams and cold frappes.
Marketing, sales and service
• Marketing
• Sales
• CRM
• Retail
• Customer
service
• Outbound
Logistics
Vodafone’s ‘Carbon Connections’ report demonstrates a potential for 113Mt reduction in CO2e and €43bn in cost reductions through 1bn new mobile connections.
M&S’s ‘Marks and Start’ programme (work experience for disadvantaged adults) has lower attrition rates than comparable schemes for new employees.
77% of consumers have, in the past year, refused to buy products/services from companies they do not trust. Trust must be built or sales are put at risk.
The Co-operative Bank showed the risk associated with a loss of trust, citing the ‘flight to trust’ after the banking crisis as one of the key drivers of a 38% increase in their own current account sales in 2009.
Support activities
• Finance
• Technology
• R&D
• HR
• Legal
• Firm
Infrastructure
Novo Nordisk bring products to market faster by including environmental, social and economic impacts in new drug applications.
Fife Council have identified additional cost avoidance opportunities of £75m that can be achieved by improving its carbon reductions by a further 3% per annum between 2007 and 2021.
Graduating MBAs from leading North American and European business schools are willing to forgo financial benefits to work for a more ethical employer.
Ribena noticed that local weather patterns have been changing, affecting their blackcurrant harvests. They have been developing new varieties of blackcurrants that will thrive in a changing climate.
➤
S0085_Sample.indd 27 7/25/2012 2:45:27 PM
DRAFT – DO N
OT COPY
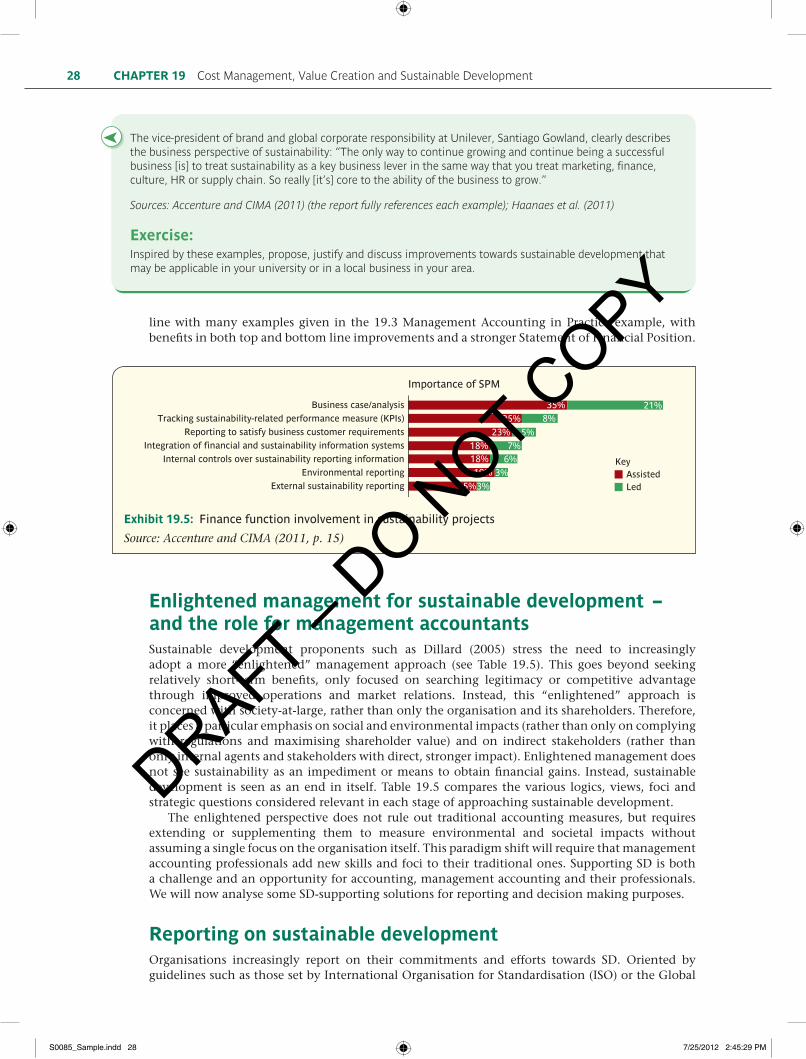
CHAPTER 19 Cost Management, Value Creation and Sustainable Development28
The vice-president of brand and global corporate responsibility at Unilever, Santiago Gowland, clearly describes the business perspective of sustainability: “The only way to continue growing and continue being a successful business [is] to treat sustainability as a key business lever in the same way that you treat marketing, finance, culture, HR or supply chain. So really [it’s] core to the ability of the business to grow.”
Sources: Accenture and CIMA (2011) (the report fully references each example); Haanaes et al. (2011)
Exercise:Inspired by these examples, propose, justify and discuss improvements towards sustainable development that may be applicable in your university or in a local business in your area.
line with many examples given in the 19.3 Management Accounting in Practice example, with benefits in both top and bottom line improvements and a stronger Statement of Financial Position.
Importance of SPM
Key
35%
25%
23%
18%18%
19%
15%
8%
5%
7%6%
3%
3%
21%
AssistedLed
Business case/analysis
Tracking sustainability-related performance measure (KPIs)
Reporting to satisfy business customer requirements
Integration of financial and sustainability information systems
Internal controls over sustainability reporting information
Environmental reporting
External sustainability reporting
Exhibit 19.5: Finance function involvement in sustainability projects
Source: Accenture and CIMA (2011, p. 15)
Enlightened management for sustainable development – and the role for management accountantsSustainable development proponents such as Dillard (2005) stress the need to increasingly adopt a more “enlightened” management approach (see Table 19.5). This goes beyond seeking relatively short-term benefits, only focused on searching legitimacy or competitive advantage through improved operations and market relations. Instead, this “enlightened” approach is concerned with society-at-large, rather than only the organisation and its shareholders. Therefore, it places a particular emphasis on social and environmental impacts (rather than only on complying with regulations and maximising shareholder value) and on indirect stakeholders (rather than only internal agents and stakeholders with direct, stronger impact). Enlightened management does not see sustainability as an impediment or means to obtain financial gains. Instead, sustainable development is seen as an end in itself. Table 19.5 compares the various logics, views, foci and strategic questions considered relevant in each stage of approaching sustainable development.
The enlightened perspective does not rule out traditional accounting measures, but requires extending or supplementing them to measure environmental and societal impacts without assuming a single focus on the organisation itself. This paradigm shift will require that management accounting professionals add new skills and foci to their traditional ones. Supporting SD is both a challenge and an opportunity for accounting, management accounting and their professionals. We will now analyse some SD-supporting solutions for reporting and decision making purposes.
Reporting on sustainable developmentOrganisations increasingly report on their commitments and efforts towards SD. Oriented by guidelines such as those set by International Organisation for Standardisation (ISO) or the Global
➤
S0085_Sample.indd 28 7/25/2012 2:45:29 PM
DRAFT – DO N
OT COPY

Sustainable development and accounting 29
Reporting Initiative (GRI), organisations increasingly produce reports on their social, environmental, sustainable development and corporate social responsibility (CSR) performance. The Triple Bottom Line, measuring economic, environmental and social perspectives, has long been proposed and underlies many recent advances (see various chapters in Henriques and Richardson, 2004). Now you will explore recent proposals from two organisations, ISO and IIRC.
The International Organisation for Standardisation (ISO)The International Organisation for Standardisation is the largest issuer of international standards: over 19,000 standards, by the end of 2011. A recent addition was ISO 26000, with guidance on social responsibility and SD. This standard intends to encourage organisations to go beyond legal compliance and to promote a shared understanding of social responsibility. Guidance covers the following topics, concerning social responsibility:
●● Concepts, background, trends and characteristics;
●● Principles, core issues and practices;
●● Socially responsible behaviour within and beyond the organisation;
●● Stakeholder identification and engagement;
●● Reporting commitments, performance and other information.
Another family of standards, ISO 14000, aims to minimize environmental impacts of organisations’ activities. There were over 200,000 ISO 14001 issued certifications in 2010. ISO 14001 defines an environmental management system (EMS) taking into account both legal requirements and voluntary commitments, as well as relevant environmental information. There are several related standards, such as ISO 14006, on eco-design, and ISO 14005, on phased implementations towards ISO 14001. A phased adoption of an EMS is particularly relevant for Small and Medium Enterprises and has several advantages, such as a quick evaluation of the cost reductions and overall return of the EMS, and better stakeholder relations and satisfaction. Other recent related standards include ISO 14064 and ISO 14065 for greenhouse gas accounting, verification and emissions trading.
The International Integrated Reporting Committee (IIRC)Recently, the International Integrated Reporting Committee (IIRC) launched a Discussion Paper on the future of Integrated Reporting, calling for a new and more ambitious approach to organizational disclosure. “Integrated reporting brings together material information about an organization’s
Table 19.5: Stages of approaching and managing sustainable development
Stages Logics View of sustainability
Focus Strategic questions
Past Legitimacy An impediment to achieve economic ends
Organisation (Compliance/legal; operations)
1. What are the minimum requirements?
2. How do I accomplish it in the most economical way?
Present Competitive advantage
A means to achieve economic ends
Market (economic)
1. What is the most economically beneficial alternative?
2. How do I accomplish it in the most responsible way?
Future (?) Enlightened management
An end in itself Society (social, environmental)
1. What is the most responsible/sustainable alternative?
2. How do I accomplish it in the most economical way?
Source: Dillard (2005 and 2009) (adapted)
S0085_Sample.indd 29 7/25/2012 2:45:30 PM
DRAFT – DO N
OT COPY
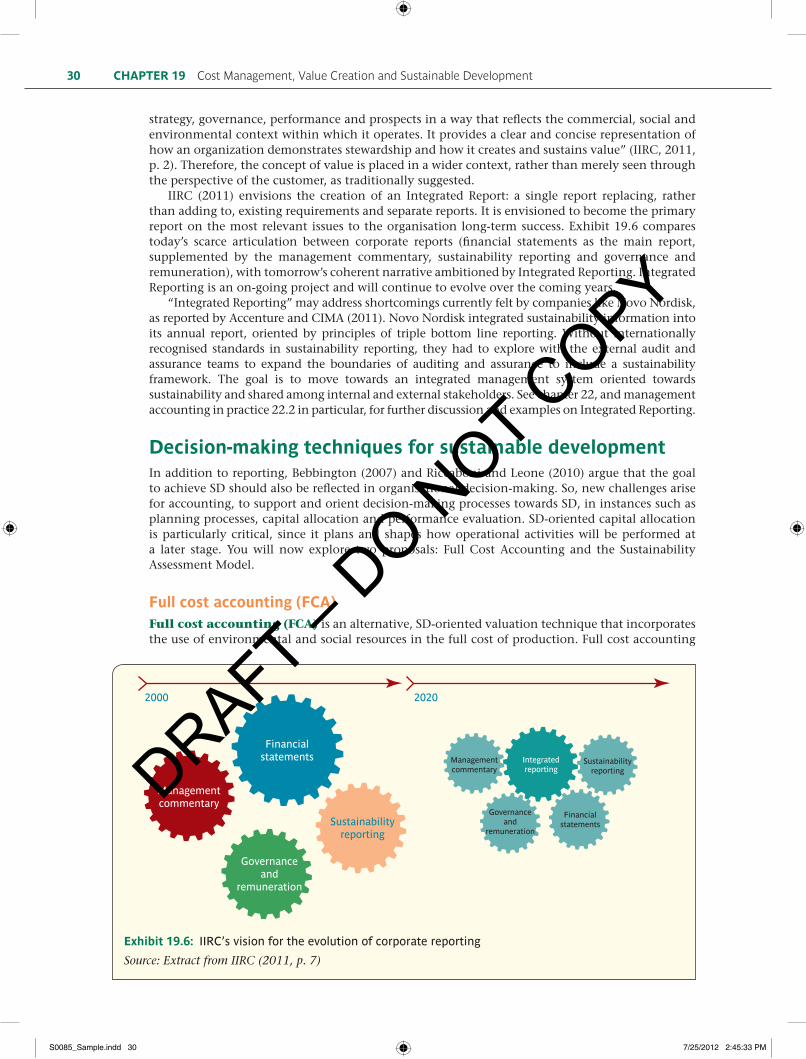
CHAPTER 19 Cost Management, Value Creation and Sustainable Development30
strategy, governance, performance and prospects in a way that reflects the commercial, social and environmental context within which it operates. It provides a clear and concise representation of how an organization demonstrates stewardship and how it creates and sustains value” (IIRC, 2011, p. 2). Therefore, the concept of value is placed in a wider context, rather than merely seen through the perspective of the customer, as traditionally suggested.
IIRC (2011) envisions the creation of an Integrated Report: a single report replacing, rather than adding to, existing requirements and separate reports. It is envisioned to become the primary report on the most relevant issues to the organisation long-term success. Exhibit 19.6 compares today’s scarce articulation between corporate reports (financial statements as the main report, supplemented by the management commentary, sustainability reporting and governance and remuneration), with tomorrow’s coherent narrative ambitioned by Integrated Reporting. Integrated Reporting is an on-going project and will continue to evolve over the coming years.
“Integrated Reporting” may address shortcomings currently felt by companies like Novo Nordisk, as reported by Accenture and CIMA (2011). Novo Nordisk integrated sustainability information into its annual report, oriented by principles of triple bottom line reporting. Without internationally recognised standards in sustainability reporting, they had to explore with the external audit and assurance teams to expand the boundaries of auditing and assurance to include a sustainability framework. The goal is to move towards an integrated management system oriented towards sustainability and shared among internal and external stakeholders. See chapter 22, and management accounting in practice 22.2 in particular, for further discussion and examples on Integrated Reporting.
Decision-making techniques for sustainable developmentIn addition to reporting, Bebbington (2007) and Riccaboni and Leone (2010) argue that the goal to achieve SD should also be reflected in organisational decision-making. So, new challenges arise for accounting, to support and orient decision-making processes towards SD, in instances such as planning processes, capital allocation and performance evaluation. SD-oriented capital allocation is particularly critical, since it plans and shapes how operational activities will be performed at a later stage. You will now explore two proposals: Full Cost Accounting and the Sustainability Assessment Model.
Full cost accounting (FCA)Full cost accounting (FCA) is an alternative, SD-oriented valuation technique that incorporates the use of environmental and social resources in the full cost of production. Full cost accounting
2000 2020
Financialstatements
Managementcommentary
Governanceand
remuneration
Sustainabilityreporting
Managementcommentary
Integratedreporting
Sustainabilityreporting
Financialstatements
Governanceand
remuneration
Exhibit 19.6: IIRC’s vision for the evolution of corporate reporting
Source: Extract from IIRC (2011, p. 7)
S0085_Sample.indd 30 7/25/2012 2:45:33 PM
DRAFT – DO N
OT COPY
Sustainable development and accounting 31
goes beyond the economic costs traditionally considered, based on the usage of economic resources such as the cost of used materials, labour, utilities and machines. Full cost accounting promotes identifying and accounting for externalities of an organisation’s activities, in particular negative environmental and social externalities, such as pollution and unfair employment practices (Bebbington and Gray, 2001; Bent, 2004). By becoming explicitly included in the products (full) cost, managers are more likely to try to minimise them by adopting practices with less environmental and social impacts.
The Sustainability Assessment Model (SAM)Bebbington (2007) presents the Sustainability Assessment Model (SAM), developed by the oil company BP to orient project evaluation towards SD, by modelling and accounting for SD performance and raising awareness to SD among employees. The SAM builds on full cost accounting (FCA), so it encompasses not only economic costs but also environmental and social costs. The SAM is applicable both to the capital allocation stage and to retrospective evaluation. To apply the SAM, you must:
1) Define the cost objective (e.g., a particular investment project);
2) Specify the scope of analysis: the SAM should include the full life cycle of the project. This includes not only the activities of the project itself, but also all upstream and downstream activities related with the project. This is closely related with life cycle costing discussed above in this chapter, but now taking an environmental and social perspective. For example, disposal of batteries used by electronic equipment should be considered at the R&D stage, to evaluate and lessen the total environmental impacts of the equipment, “from cradle to grave”.
3) Identifies impacts of the cost objective, concerning:
a) Economics, as measured in traditional accounting terms over the project life, based on historical or estimated future economic flows;
b) Resource use, in the part that exceeds economic flows, in particular to reflect resource depletion and its future unavailability for alternative, potentially more valuable uses; these negative externalities may be offset, partially or in full, by positive externalities (e.g., the development of individuals’ intellectual capabilities);
c) Environmental flows, such as emissions; noise, odour and visual impact; land occupation; and waste.
d) Social flows, concerning: employment creation; contribution to a sustainable society; and social impacts from products based on the project. These externalities can be positive or negative and are typically the most difficult to measure, in particular in financial terms – the SAM’s final stage.
4) Monetises the impacts, to allow comparing the different impacts. Applying the SAM to a oil and gas field development, Bebbington (2007, p. 50) drew a typical SAM signature as in Exhibit 19.7.
The SAM, a model still under on-going development, can be applied to other types of settings, such as the construction and energy generation industries (Bebbington, 2007). A related development is Procter & Gamble’s “Product Sustainability Assessment Tool” (PSAT) (Riccaboni and Leone, 2010), summarised in Management Accounting in Practice 19.3. The PSAT and the SAM share important similarities, since both aim to integrate the sustainability rationale in everyday operations (although PSAT is particularly focused in new product development) and adopt a product life cycle. However, the two approaches also have differences. First, the PSAT does not monetise the different impacts (the fourth and final stage of the SAM). The lack of monetisation prevents reaching a single measure of project “sustainable value”, thus requiring complex trade-offs between financial, social and environmental perspectives and leading to ambiguity in some decisions. However, by avoiding monetisation, the PSAT also avoids the criticisms addressed to this step of the SAM, as recognised by Bebbington (2007).
S0085_Sample.indd 31 7/25/2012 2:45:33 PM
DRAFT – DO N
OT COPY
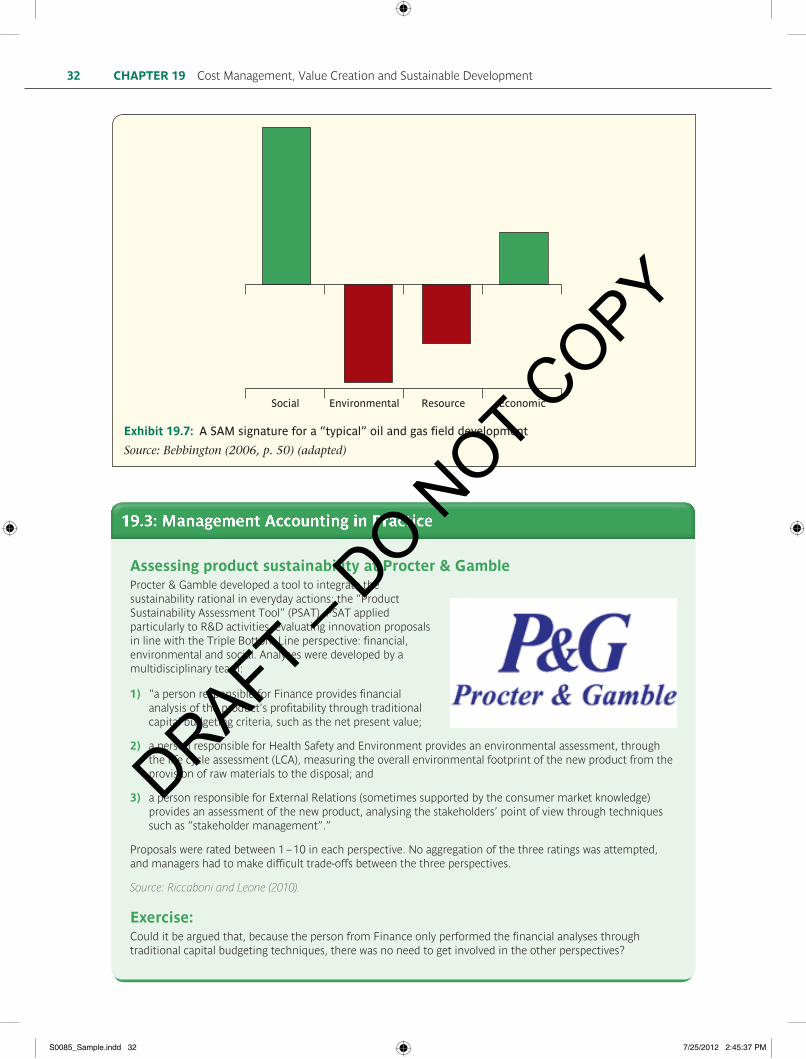
CHAPTER 19 Cost Management, Value Creation and Sustainable Development32
Social Environmental Resource Economic
Exhibit 19.7: A SAM signature for a “typical” oil and gas field development
Source: Bebbington (2006, p. 50) (adapted)
19.3: Management Accounting in Practice
Assessing product sustainability at Procter & GambleProcter & Gamble developed a tool to integrate the sustainability rational in everyday actions: the “Product Sustainability Assessment Tool” (PSAT). PSAT applied particularly to R&D activities, evaluating innovation proposals in line with the Triple Bottom Line perspective: financial, environmental and social. Analyses were developed by a multidisciplinary team:
1) “a person responsible for Finance provides financial analysis of the product’s profitability through traditional capital budgeting criteria, such as the net present value;
2) a person responsible for Health Safety and Environment provides an environmental assessment, through the life cycle assessment (LCA), measuring the overall environmental footprint of the new product from the provision of raw materials to the disposal; and
3) a person responsible for External Relations (sometimes supported by the consumer market knowledge) provides an assessment of the new product, analysing the stakeholders’ point of view through techniques such as “stakeholder management”.”
Proposals were rated between 1–10 in each perspective. No aggregation of the three ratings was attempted, and managers had to make difficult trade-offs between the three perspectives.
Source: Riccaboni and Leone (2010).
Exercise:Could it be argued that, because the person from Finance only performed the financial analyses through traditional capital budgeting techniques, there was no need to get involved in the other perspectives?
S0085_Sample.indd 32 7/25/2012 2:45:37 PM
DRAFT – DO N
OT COPY
Sustainable development and accounting 33
Key termsActivity-Based Management The use of ABC information to identify operational and strategic improvement possibilities, 000Life cycle costing Analyses costs throughout the entire life cycle of a product, from development to after-sales stages; an input for life cycle profitability analysis, 000Continuous improvement (kaizen, in Japanese) A company-wide approach of never-ending pursuit of improvements, typically small and incremental but adding up to significant cumulative improvements, 000Kaizen costing Cost management technique to reduce costs during the production stage, in a kaizen/continuous improvement approach to increase efficiency and reduce waste, 000Target cost Target price (based on market research) minus the target margin (based on corporate profitability objectives), 000Target costing/target cost management A cost management technique for the product development stage, to determine the maximum allowable product cost, based on customers’ willingness to pay and corporate profitability objectives, and to design a product that can be sold at such maximum target cost, 000Business Process Reengineering (BPR) A radical approach to organisational change, fundamentally questioning and reengineering business processes, rather than merely improving them, 000
Value engineering A technique for product development oriented by customers’ perceptions of value and expected costs of each product attribute, 000Reverse engineering Engineering practice of disassembling competitors’ products to obtain detailed insights about their design features, materials and production techniques, 000Value chain The major activities that add customer value; it may be analysed at an organisational level or at an industry-wide level, from suppliers of basic raw materials through to the end customer, 000Attribute pricing Estimation of customers’ willingness to pay for different product attributes, both individually and when integrated within particular product configurations, 000Attribute costing Estimation of expected costs of offering individual attributes in a product, 000Sustainable development “An approach to progress which meets the needs of the present without compromising the ability of future generations to meet their own needs” (WCED, 1987, p. 8), 000Full Cost Accounting (FCA) A costing technique that includes the use of environmental and social resources in the full cost of production, in order to support management decisions promoting sustainable development, 000Sustainability Assessment Model (SAM) A project evaluation technique to support decisions that promote sustainable development, based on Full Cost Accounting, 000
Chapter summaryThis chapter, after recognising the persistent importance of cost reduction and control, went beyond costs and costing systems and analysed cost management with a value enhancing perspective. It expanded the scope beyond the organisation to include the entire value chain. It combined activity-based information on cost and value to obtain managerial insights through operational and strategic ABM. It expanded the usually short time horizon to encompass the entire product life cycle, in life cycle costing. It discussed how cost and value can be improved during and before the manufacturing stage, through kaizen costing and target costing, respectively. It discussed the radical challenge of Business Process Reengineering and its difficulties, as well as the less radical proposal of Business Process Management. The chapter finalised by discussing the increasingly important issue of sustainable development and how management accounting can contribute towards it.
S0085_Sample.indd 33 7/25/2012 2:45:37 PM
DRAFT – DO N
OT COPY
CHAPTER 19 Cost Management, Value Creation and Sustainable Development34
Review questions
Level of difficulty: BASIC INTERMEDIATE ADVANCED
19.1 Describe the industry value chain concept [LO 1]
19.2 Identify and characterise the two uses of Activity-Based Management [LO 2]
19.3 Describe the importance of life cycle costing [LO 3]
19.4 Discuss the applicability and importance of kaizen costing [LO 4]
19.5 Discuss the applicability and importance of target costing [LO 5, LO 6]
19.6 What are the key messages of Business Process Reengineering? [LO 7]
19.7 Distinguish between business-focused and enlightened perspectives of sustainable development. [LO 8]
19.8 Describe the process of target cost management [LO 5, LO 6]
19.9 Describe techniques for reporting and decision-making that promote sustainable development [LO 9]
Group discussion questions19.9 Measuring the multiple contributions towards the value added throughout an entire
value chain may be challenging. Select a particular value chain, identify its most relevant participants and place yourself as a management accountant of an organisation participating in an intermediate stage of that value chain. Discuss the ways and the difficulties of measuring the value added:
a) By your organisation;
b) By other participants, both upstream and downstream in the value chain.
19.10 Identify a product which was withdrawn for the market in an expectedly short time after its launch due to either market non-acceptance or insufficient profitability. Investigate in more detail the reasons behind its withdrawal. Discuss how kaizen costing and / or target costing techniques could have prevented this failure.
19.11 Based on the improvement proposals you suggested in Management Accounting in Practice 19.2, discuss how you, as a management accountant, could contribute towards those improvements.
Exercises
E19.1 Select target activities for improvement initiatives; activities classifications; benchmark and “make-or-buy” decision [LO 2]
Company DAI produces and distributes dairy products and has recently implemented an Activity-Based Costing system. As DAI’s controller, you were requested to propose a cost reduction plan for the next quarter. A key business process to sustain DAI’s competitiveness was introducing new products in the market. You were aware that cost reductions in this business process should not compromise the process success. So, you extracted the costs of the various activities, their cost drivers and the volume of each cost driver in the last quarter. A manager classified each activity according to its value-added and opportunity for improvement, as in the following table:
S0085_Sample.indd 34 7/25/2012 2:45:41 PM
DRAFT – DO N
OT COPY
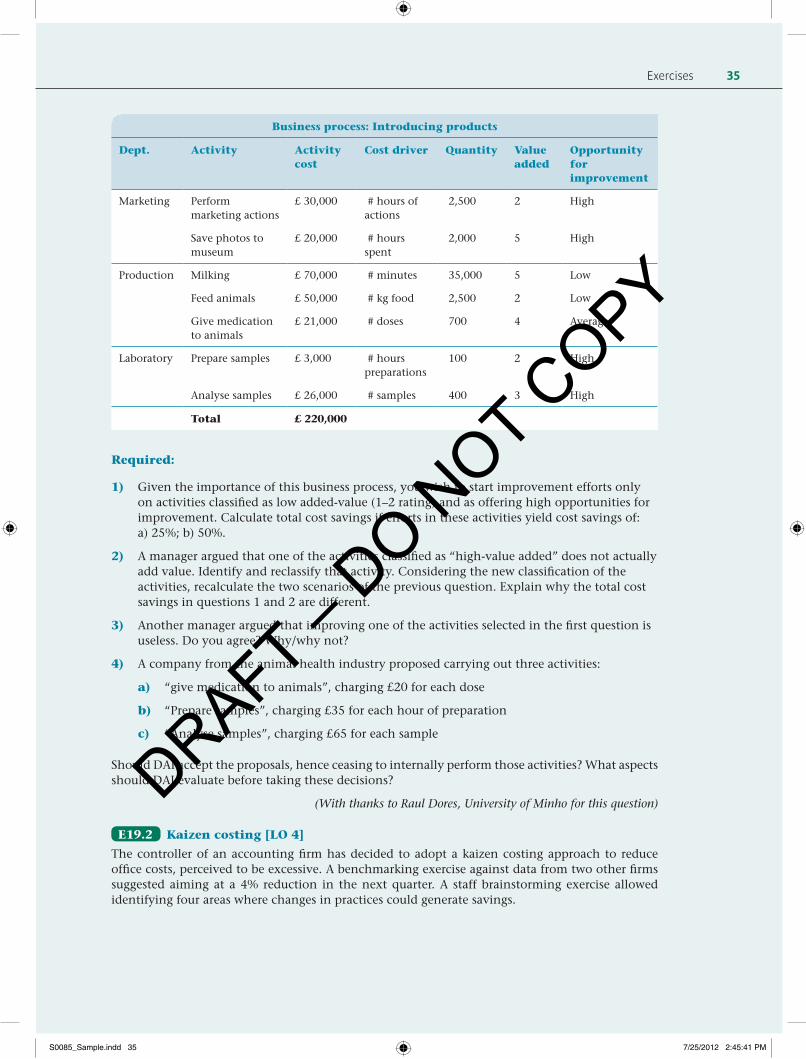
Exercises 35
Business process: Introducing products
Dept. Activity Activity cost
Cost driver Quantity Value added
Opportunity for improvement
Marketing Perform marketing actions
£ 30,000 # hours of actions
2,500 2 High
Save photos to museum
£ 20,000 # hours spent
2,000 5 High
Production Milking £ 70,000 # minutes 35,000 5 Low
Feed animals £ 50,000 # kg food 2,500 2 Low
Give medication to animals
£ 21,000 # doses 700 4 Average
Laboratory Prepare samples £ 3,000 # hours preparations
100 2 High
Analyse samples £ 26,000 # samples 400 3 High
Total £ 220,000
Required:
1) Given the importance of this business process, you wish to start improvement efforts only on activities classified as low added-value (1–2 rating) and as offering high opportunities for improvement. Calculate total cost savings if efforts in these activities yield cost savings of: a) 25%; b) 50%.
2) A manager argued that one of the activities classified as “high-value added” does not actually add value. Identify and reclassify that activity. Considering the new classification of the activities, recalculate the two scenarios of the previous question. Explain why the total cost savings in questions 1 and 2 are different.
3) Another manager argued that improving one of the activities selected in the first question is useless. Do you agree? Why/why not?
4) A company from the animal health industry proposed carrying out three activities:
a) “give medication to animals”, charging £20 for each dose
b) “Prepare samples”, charging £35 for each hour of preparation
c) “Analyse samples”, charging £65 for each sample
Should DAI accept the proposals, hence ceasing to internally perform those activities? What aspects should DAI evaluate before taking these decisions?
(With thanks to Raul Dores, University of Minho for this question)
E19.2 Kaizen costing [LO 4]
The controller of an accounting firm has decided to adopt a kaizen costing approach to reduce office costs, perceived to be excessive. A benchmarking exercise against data from two other firms suggested aiming at a 4% reduction in the next quarter. A staff brainstorming exercise allowed identifying four areas where changes in practices could generate savings.
S0085_Sample.indd 35 7/25/2012 2:45:41 PM
DRAFT – DO N
OT COPY
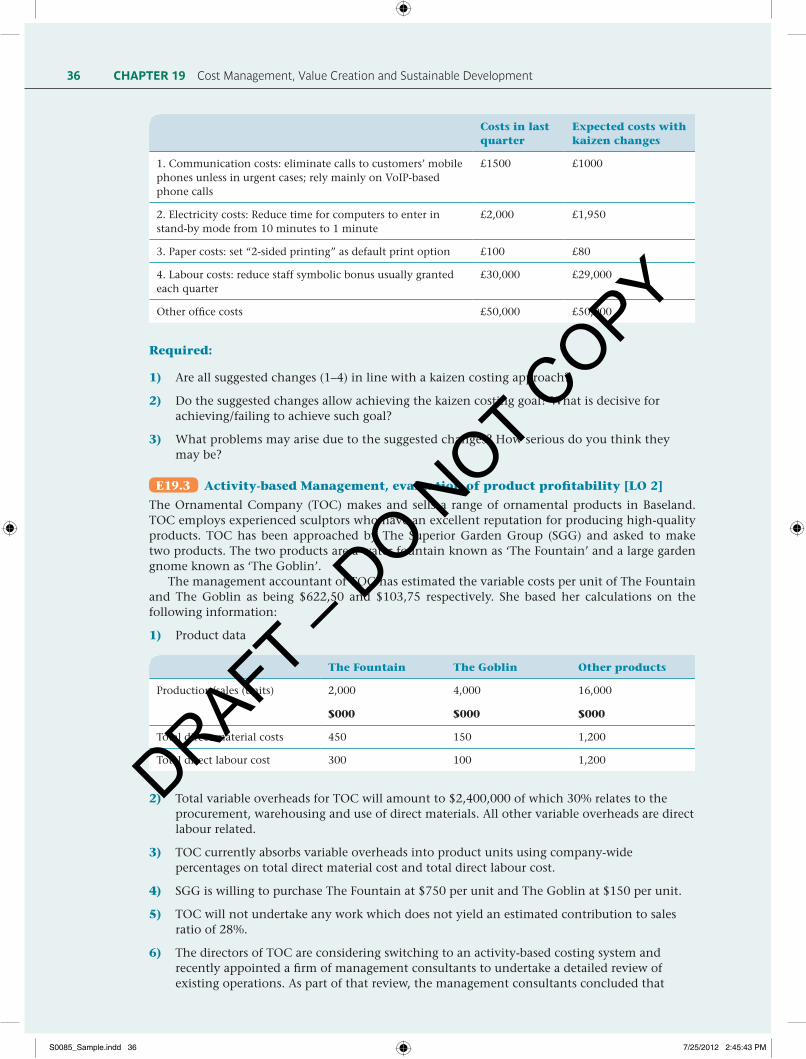
CHAPTER 19 Cost Management, Value Creation and Sustainable Development36
Costs in last quarter
Expected costs with kaizen changes
1. Communication costs: eliminate calls to customers’ mobile phones unless in urgent cases; rely mainly on VoIP-based phone calls
£1500 £1000
2. Electricity costs: Reduce time for computers to enter in stand-by mode from 10 minutes to 1 minute
£2,000 £1,950
3. Paper costs: set “2-sided printing” as default print option £100 £80
4. Labour costs: reduce staff symbolic bonus usually granted each quarter
£30,000 £29,000
Other office costs £50,000 £50,000
Required:
1) Are all suggested changes (1–4) in line with a kaizen costing approach?
2) Do the suggested changes allow achieving the kaizen costing goal? What is decisive for achieving/failing to achieve such goal?
3) What problems may arise due to the suggested changes? How serious do you think they may be?
E19.3 Activity-based Management, evaluation of product profitability [LO 2]
The Ornamental Company (TOC) makes and sells a range of ornamental products in Baseland. TOC employs experienced sculptors who have an excellent reputation for producing high-quality products. TOC has been approached by The Superior Garden Group (SGG) and asked to make two products. The two products are a water fountain known as ‘The Fountain’ and a large garden gnome known as ‘The Goblin’.
The management accountant of TOC has estimated the variable costs per unit of The Fountain and The Goblin as being $622,50 and $103,75 respectively. She based her calculations on the following information:
1) Product data
The Fountain The Goblin Other products
Production/sales (units) 2,000 4,000 16,000
$000 $000 $000
Total direct material costs 450 150 1,200
Total direct labour cost 300 100 1,200
2) Total variable overheads for TOC will amount to $2,400,000 of which 30% relates to the procurement, warehousing and use of direct materials. All other variable overheads are direct labour related.
3) TOC currently absorbs variable overheads into product units using company-wide percentages on total direct material cost and total direct labour cost.
4) SGG is willing to purchase The Fountain at $750 per unit and The Goblin at $150 per unit.
5) TOC will not undertake any work which does not yield an estimated contribution to sales ratio of 28%.
6) The directors of TOC are considering switching to an activity-based costing system and recently appointed a firm of management consultants to undertake a detailed review of existing operations. As part of that review, the management consultants concluded that
S0085_Sample.indd 36 7/25/2012 2:45:43 PM
DRAFT – DO N
OT COPY

Exercises 37
estimated relevant cost drivers for material and labour related overhead costs attributable to The Fountain and The Goblin are as follows:
The Fountain
The Goblin
Other products
Direct material related overheads:
The cost driver is the volume of raw materials held to facilitate production of each product.
Material proportions per product unit: 4 7 4
Direct labour related overheads:
The cost driver is the number of labour operations performed.
Labour operations per product unit: 6 5 4
Required:
a) Calculate variable cost per unit of both products using an activity-based costing approach. (8 marks)
b) Using the unit cost information available and your calculations in (a), prepare a financial analysis of the decision strategy which TOC may implement with regard to the manufacture of each product. (6 marks)
c) Critically discuss the adoption of activity-based management (ABM) in companies such as TOC. (6 marks)
E19.4 Lifecycle costing, incremental budgeting, standard costing [LO 3]
Wargrin designs, develops and sells many PC games. Games have a short lifecycle lasting around three years only. Performance of the games is measured by reference to the profits made in each of the expected three years of popularity. Wargrin accepts a net profit of 35% of turnover as reasonable. A rate of contribution (sales price less variable cost) of 75% is also considered acceptable.
Wargrin has a large centralised development department which carries out all the design work before it passes the completed game to the sales and distribution department to market and distribute the product.
Wargrin has developed a brand new game called Stealth and this has the following budgeted performance figures.
The selling price of Stealth will be a constant $30 per game. Analysis of the costs show that at a volume of 10,000 units a total cost of $130,000 is expected. However at a volume of 14,000 units a total cost of $150,000 is expected. If volumes exceed 15,000 units the fixed costs will increase by 50%.
Stealth’s budgeted volumes are as follows:
Year 1 Year 2 Year 3
Sales volume 8,000 units 16,000 units 4,000 units
In addition, marketing costs for Stealth will be $60,000 in year one and $40,000 in year two. Design and development costs are all incurred before the game is launched and has cost $300,000 for Stealth. These costs are written off to the income statement as incurred (i.e. before year 1 above).
Required:
a) Explain the principles behind lifecycle costing and briefly state why Wargrin in particular should consider these lifecycle principles. (4 marks)
b) Produce the budgeted results for the game ‘Stealth’ and briefly assess the game’s expected performance, taking into account the whole lifecycle of the game. (9 marks)
S0085_Sample.indd 37 7/25/2012 2:45:43 PM
DRAFT – DO N
OT COPY
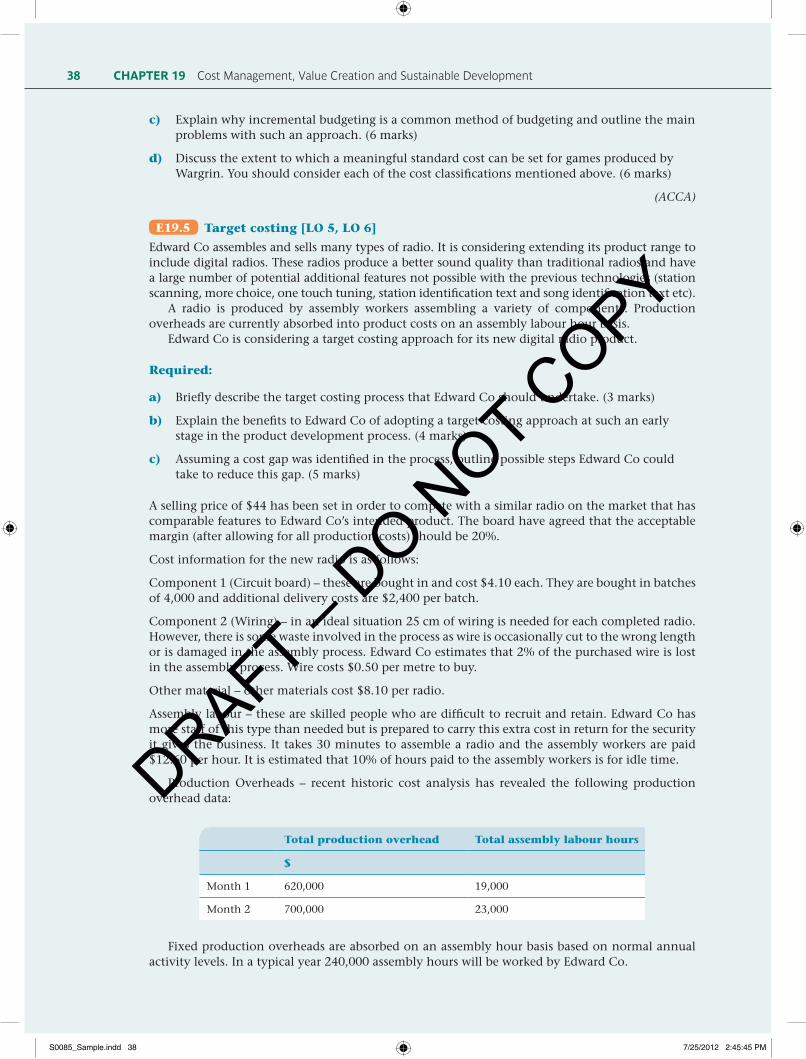
CHAPTER 19 Cost Management, Value Creation and Sustainable Development38
c) Explain why incremental budgeting is a common method of budgeting and outline the main problems with such an approach. (6 marks)
d) Discuss the extent to which a meaningful standard cost can be set for games produced by Wargrin. You should consider each of the cost classifications mentioned above. (6 marks)
(ACCA)
E19.5 Target costing [LO 5, LO 6]
Edward Co assembles and sells many types of radio. It is considering extending its product range to include digital radios. These radios produce a better sound quality than traditional radios and have a large number of potential additional features not possible with the previous technologies (station scanning, more choice, one touch tuning, station identification text and song identification text etc).
A radio is produced by assembly workers assembling a variety of components. Production overheads are currently absorbed into product costs on an assembly labour hour basis.
Edward Co is considering a target costing approach for its new digital radio product.
Required:
a) Briefly describe the target costing process that Edward Co should undertake. (3 marks)
b) Explain the benefits to Edward Co of adopting a target costing approach at such an early stage in the product development process. (4 marks)
c) Assuming a cost gap was identified in the process, outline possible steps Edward Co could take to reduce this gap. (5 marks)
A selling price of $44 has been set in order to compete with a similar radio on the market that has comparable features to Edward Co’s intended product. The board have agreed that the acceptable margin (after allowing for all production costs) should be 20%.
Cost information for the new radio is as follows:
Component 1 (Circuit board) – these are bought in and cost $4.10 each. They are bought in batches of 4,000 and additional delivery costs are $2,400 per batch.
Component 2 (Wiring) – in an ideal situation 25 cm of wiring is needed for each completed radio. However, there is some waste involved in the process as wire is occasionally cut to the wrong length or is damaged in the assembly process. Edward Co estimates that 2% of the purchased wire is lost in the assembly process. Wire costs $0.50 per metre to buy.
Other material – other materials cost $8.10 per radio.
Assembly labour – these are skilled people who are difficult to recruit and retain. Edward Co has more staff of this type than needed but is prepared to carry this extra cost in return for the security it gives the business. It takes 30 minutes to assemble a radio and the assembly workers are paid $12.60 per hour. It is estimated that 10% of hours paid to the assembly workers is for idle time.
Production Overheads – recent historic cost analysis has revealed the following production overhead data:
Total production overhead Total assembly labour hours
$
Month 1 620,000 19,000
Month 2 700,000 23,000
Fixed production overheads are absorbed on an assembly hour basis based on normal annual activity levels. In a typical year 240,000 assembly hours will be worked by Edward Co.
S0085_Sample.indd 38 7/25/2012 2:45:45 PM
DRAFT – DO N
OT COPY

Case study problem 39
Required:
d) Calculate the expected cost per unit for the radio and identify any cost gap that might exist. (13 marks)
(ACCA)
E19.6 The Strategic Assessment Model (SAM) [LO 9]
A mining company is evaluating a new extraction project. Based on geologists’ estimates, the finance director calculated that the project has a net present value of £10 million for the company. However, the general manager is aware of the importance of contemplating other impacts beyond those considered in the financial director’s calculations. So, he commissioned an expert to evaluate the environmental costs associated with the project.
Required:
1) What kind of environmental costs is the expert likely to consider?
2) Is the commissioned evaluation scope sufficient?
3) Discuss the advantages and disadvantages of monetising different perspectives, as recommended by the Strategic Assessment Model.
Case study problem
CS19.1 Title required
Logoplaste is a world player in the rigid plastic packaging industry. It was founded in Portugal and now owns over 60 factories across 18 countries, while still keeping its headquarters in Portugal. It provides integrated solutions for some of the world’s most reputable companies, in the sectors of food and beverage, personal care, household care and oil and lubricants, such as Procter & Gamble, Unilever, Nestlé, Coca-Cola or Danone.
Logoplaste was an industry pioneer by developing the “hole in the wall” concept: manufacturing the packages inside or right next to their customers’ factories. At the time, competitors had central factories manufacturing for different customers, requiring transporting the empty packages to the customer factory. However, the “hole in the wall” concept allowed Logoplaste the competitive advantage of delivering the packages “just-in-time” and without transportation costs, which are often a major part of the total cost. “Empty packages don’t travel well” is a common expression in the industry (Morgado, 2008, p. 1416). Other competitors later adopted the same concept, although Logoplaste may still be enjoying “first-mover” advantages, as illustrated by the final example of this case.
Logoplaste is fully integrated in the customers’ logistic and value chains. Logoplaste customers traditionally considered packaging a non-core step of the value chain, and its outsourcing was a way of obtaining cost savings from a specialised company. However, packaging has become increasingly important, beyond its traditional functions of containing, protecting and preserving the product and informing consumers. Packaging has become a major marketing variable, strongly impacting on consumers’ perceptions. This increases the value added by the packaging step of the value chain. Logoplaste has explored packaging increasing importance by expanding its role in the value chain: instead of being a mere packaging producer, it offers a complete, integrated solution, with services ranging from the package initial concept to its production and quality control.
Logoplaste has developed the capacity to design packages that create innovation and value in customers’ products. For example, packaging played a big part in the huge success of Procter & Gamble’s Sunny Delight. The drink was placed in the refrigerated display (although preservatives actually made this not necessary) and packaging suggested similarities to real 100% fruit juices. This positioning allowed a considerable price premium (Morgado, 2008).
Packaging importance for customers’ perceptions and customer value led to joint development of packages, by a team of staff from Logoplaste and its customers. In addition, customers’ attention “mostly focused on developing new container functions and designs at an acceptable price point”
S0085_Sample.indd 39 7/25/2012 2:45:47 PM
DRAFT – DO N
OT COPY
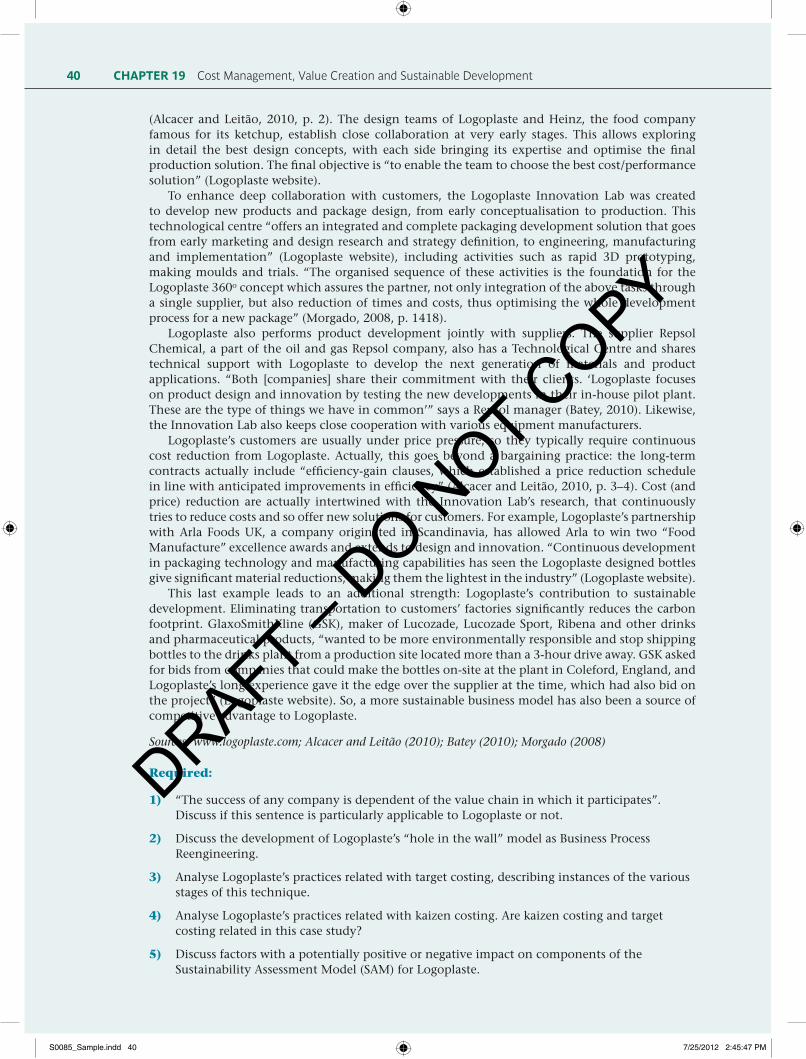
CHAPTER 19 Cost Management, Value Creation and Sustainable Development40
(Alcacer and Leitão, 2010, p. 2). The design teams of Logoplaste and Heinz, the food company famous for its ketchup, establish close collaboration at very early stages. This allows exploring in detail the best design concepts, with each side bringing its expertise and optimise the final production solution. The final objective is “to enable the team to choose the best cost/performance solution” (Logoplaste website).
To enhance deep collaboration with customers, the Logoplaste Innovation Lab was created to develop new products and package design, from early conceptualisation to production. This technological centre “offers an integrated and complete packaging development solution that goes from early marketing and design research and strategy definition, to engineering, manufacturing and implementation” (Logoplaste website), including activities such as rapid 3D prototyping, making moulds and trials. “The organised sequence of these activities is the foundation for the Logoplaste 360o concept which assures the partner, not only integration of the above tasks through a single supplier, but also reduction of times and costs, thus optimising the whole development process for a new package” (Morgado, 2008, p. 1418).
Logoplaste also performs product development jointly with suppliers. The supplier Repsol Chemical, a part of the oil and gas Repsol company, also has a Technological Centre and shares technical support with Logoplaste to develop the next generation of materials and product applications. “Both [companies] share their commitment with their clients. ‘Logoplaste focuses on product design and innovation by testing the new developments in their in-house pilot plant. These are the type of things we have in common’” says a Repsol manager (Batey, 2010). Likewise, the Innovation Lab also keeps close cooperation with various equipment manufacturers.
Logoplaste’s customers are usually under price pressure, so they typically require continuous cost reduction from Logoplaste. Actually, this goes beyond a bargaining practice: the long-term contracts actually include “efficiency-gain clauses, which established a price reduction schedule in line with anticipated improvements in efficiency” (Alcacer and Leitão, 2010, p. 3–4). Cost (and price) reduction are actually intertwined with the Innovation Lab’s research, that continuously tries to reduce costs and so offer new solutions for customers. For example, Logoplaste’s partnership with Arla Foods UK, a company originated in Scandinavia, has allowed Arla to win two “Food Manufacture” excellence awards and extends to design and innovation. “Continuous development in packaging technology and manufacturing capabilities has seen the Logoplaste designed bottles give significant material reductions, making them the lightest in the industry” (Logoplaste website).
This last example leads to an additional strength: Logoplaste’s contribution to sustainable development. Eliminating transportation to customers’ factories significantly reduces the carbon footprint. GlaxoSmithKline (GSK), maker of Lucozade, Lucozade Sport, Ribena and other drinks and pharmaceutical products, “wanted to be more environmentally responsible and stop shipping bottles to the drinks plant from a production site located more than a 3-hour drive away. GSK asked for bids from companies that could make the bottles on-site at the plant in Coleford, England, and Logoplaste’s long experience gave it the edge over the supplier at the time, which had also bid on the project” (Logoplaste website). So, a more sustainable business model has also been a source of competitive advantage to Logoplaste.
Sources: www.logoplaste.com; Alcacer and Leitão (2010); Batey (2010); Morgado (2008)
Required:
1) “The success of any company is dependent of the value chain in which it participates”. Discuss if this sentence is particularly applicable to Logoplaste or not.
2) Discuss the development of Logoplaste’s “hole in the wall” model as Business Process Reengineering.
3) Analyse Logoplaste’s practices related with target costing, describing instances of the various stages of this technique.
4) Analyse Logoplaste’s practices related with kaizen costing. Are kaizen costing and target costing related in this case study?
5) Discuss factors with a potentially positive or negative impact on components of the Sustainability Assessment Model (SAM) for Logoplaste.
S0085_Sample.indd 40 7/25/2012 2:45:47 PM
DRAFT – DO N
OT COPY

Recommended reading 41
Recommended reading●● Bragg, S. M. (2010). Cost Reduction Analysis: Tools and Strategies. New Jersey, John Wiley &
Sons, Ltd.
This practice-oriented book shows than even when cost reduction is a primary objective, value concerns should permanently orient decision making and organisational change.
●● MIT Sloan Management Review, Fall 2009, Summer 2010, Winter 2011.
These three issues include several articles about sustainability, its business opportunities, metrics difficulties, many examples and cases, and the 2009 and 2011 surveys on sustainability. It offers a recent and rich empirical and practitioners’ perspective on sustainable development.
●● Henriques, A. and J. Richardson, Eds. (2004). The Triple Bottom Line: Does it all add up? London, Earthscan.
This book contains multiple contributions offering a comprehensive review of the classic “Triple Bottom Line” concept. It discusses achievements, failures and challenges to be solved and aims at assessing the sustainability of business and Corporate Social Responsibility (CSR). It offers an academic perspective on sustainable development.
●● Accenture and CIMA (2011). Sustainability performance management: How CFOs can unlock value, CIMA.
This report provides numerous insights (beyond the extract mentioned in Management Accounting in Practice 19.2) on the potential contribution, and also necessity, of management accountants to support sustainability oriented practices in their organisations.
ReferencesAlcacer, J. and J. Leitão (2010). “Logoplaste: Global Growing Challenges.” Harvard Business School Cases December: 1–20.
Barwise, P. and S. N. Meehan (2010). “Is Your Company As Customer-Focused As You Think?” MIT Sloan Management Review 51(3): 63–68.
Batey, E.-J. (2010). “Message in a Bottle.” Packaging Europe 4.4 (December): 58–69.
Baxter, T., J. Bebbington, et al. (2004). “Sustainability Assessment Model: Modelling economic, resource, environmental and social flows of a project”, in The Triple Bottom Line: Does it all add up?, Ed. A. Henriques and J. Richardson. London, Earthscan.
Bebbington, J. (2007). Accounting for Sustainable Development Performance. Oxford, CIMA Publishing.
Bebbington, J. (2009). Organisations, policy, economic context and sustainable development. 7th ENROAC International Management Control Research Conference, Dundee.
Bebbington, J. and R. Gray (2001). “An Account of Sustainability: Failure, Success and a Reconceptualization.” Critical Perspectives on Accounting 12(5): 557–588.
Bent, D. (2004). Towards a monetised triple bottom line for an alcohol producer. Sustainability Accounting and Reporting proceedings, Environmental Management Accounting Network (EMAN).
Accenture and CIMA (2011). Sustainability performance management: How CFOs can unlock value, CIMA.
Davenport, T. H. (1995). The Fad That Forgot People. http://www.fastcompany.com/magazine/01/reengin.html, accessed on 2011-10-10.
Dillard, J., D. Brown and R.S. Marshall. (2005). “An environmentally enlightened accounting.” Accounting Forum 29(1): 77–101.
Dillard, J. (2009). An Ethic of Accountability for Sustainable Organizations. 7th ENROAC International Management Control Research Conference, Dundee.
Golicic, S. K., C. N. Boerstler and L.M. Ellram (2010). “‘Greening’ Transportation in the Supply Chain.” MIT Sloan Management Review 51(2): 47–55.
S0085_Sample.indd 41 7/25/2012 2:45:47 PM
DRAFT – DO N
OT COPY
CHAPTER 19 Cost Management, Value Creation and Sustainable Development42
IIRC (2011). Towards Integrated Reporting: Communicating Value in the 21st Century, International Integrated Reporting Committee. http://theiirc.org/wp-content/uploads/2011/09/IR-Discussion-Paper-2011_spreads.pdf, accessed in 2012-05-15.
Hammer, M. (1990). “Reengineering Work: Don’t Automate, Obliterate.” Harvard Business Review 68(4): 104–112.
Hammer, M. (2007). “The Process Audit.” Harvard Business Review 85(4): 111–123.
Haanaes, K., B. Balagopal, et al. (2011). “New Sustainability Study: The ‘Embracers’ Seize Advantage.” MIT Sloan Management Review 52(3): 23–35.
Henriques, A. and J. Richardson, Eds. (2004). The Triple Bottom Line: Does it all add up? London, Earthscan.
Jollands, S. E. (2011). Management control systems and sustainability. Unpublished PhD thesis. Auckland, University of Auckland.
Kaplan, R. S. and R. Cooper (1988). Cost & Effect: using integrated cost systems to drive profitability and performance. Boston, Harvard Business School Press.
Morgado, A. (2008). “Logoplaste: innovation in the global market: From packaging to solution.” Management Decision 46(9): 1414–1436.
Riccaboni, A. and E. L. Leone (2010). “Implementing strategies through management control systems: the case of sustainability.” International Journal of Productivity and Performance Management 59(2): 130–144.
Takeuchi, H., E. Osono and N. Shimizu (2008). “The Contradictions That Drive Toyota’s Success.” Harvard Business Review 86(6): 96–104.
World Commission on Environment and Development (1987). Tokyo Declaration, Tokyo.
End notes1 Remember from page xxx doubts about the adequacy of this cost driver with regard to the
“product inspection” sub-activity.
2 Remember that some costs typically classified as fixed may indeed change, particularly if activities cease entirely, as considered for year 3, since assets or contracts creating fixed costs may be totally or partially eliminated.
3 Drawing from Jollands (2011), sustainability can be seen as a dichotomous state (being sustainable or not) while sustainable development can be seen as a continuous, never ending process towards achieving that state. In practice, these terms are often used interchangeably.
When you have read this chapter
Log on to the Online Learning Centre at www.mcgraw-hill.co.uk/textbooks/burns to explore chapter-by-chapter test questions, links and further online study tools for Management Accounting.
S0085_Sample.indd 42 7/25/2012 2:45:49 PM
DRAFT – DO N
OT COPY