copyright 1990 by the american psychological...
TRANSCRIPT
Journal of Experimental Psychology:Human Perception and Performance1990;Vol. 16, No. 3, 613-625
Copyright 1990 by the American Psychological Association, Inc.00%-1523/90/$00.75
Judgments of Proportions
Carol A. VareyUniversity of California, Berkeley
Barbara A. MellersUniversity of California, Berkeley
Michael H. BirnbaumCalifornia State University, Fullerton
This study investigated the processes that underlie estimates of relative frequency. Ss performed
4 tasks using the same stimuli (squares containing black and white dots); they judged "percent-
ages" of white dots, "percentages" of black dots, "ratios" of black dots to white dots, and
"differences" between the number of black and white dots. Results were consistent with the
theory that Ss used the instructed operations with the same scale values in all tasks. Despite the
use of the correct operation, Ss consistently overestimated small proportions and underestimated
large proportions. Variations in the distributions of actual proportions affected the extent to
which Ss overestimated small proportions and underestimated large proportions in the direction
predicted by range-frequency theory. Results suggest that proportion judgments, and by analogy
probability judgments, should not be taken at face value.
Many of our real-world decisions are based on subjectiveprobabilities. Whether we bring an umbrella to work dependson our estimate of the chance of rain; whether we buy alottery ticket depends, in part, on our estimate of the proba-bility of winning; whether we support nuclear power is influ-enced by our beliefs about the likelihood of disastrous acci-
dents.Subjective probabilities arise from a complex mixture of
our perceptions, memories, and reasoning processes. For ex-ample, to estimate the probability of rain, we might take intoconsideration such information as the appearance of the sky,our knowledge of past weather conditions in the area, recentweather reports, and our opinions of the weather forecasters.How such information is retrieved from memory, evaluated,and combined to form an estimate of subjective probabilityhas been the focus of much research (e.g., Birnbaum, 1983;Birnbaum & Mellers, 1983; Edwards, 1968; Hasher & Zacks,1984; Kahneman, Slovic, & Tversky, 1982; Peterson & Beach,1967; Schum, 1981; Shanteau, 1974; Slovic, Lichtenstein, &Fischhoff, 1988; Wallsten, Budescu, Rappoport, Zwick, &Forsyth, 1986;Zadeh, 1975).
At the heart of probability estimation is the concept ofrelative frequency or proportion. The present article examinesjudgments of relative frequency by using simple situations inwhich all of the necessary information is available. The firstexperiment investigates operations that underlie percentagejudgments. The second experiment tests the hypothesis thatcontextual effects influence percentage judgments.
Support for this research was provided by a National Science
Foundation grant to Barbara A. Mellers (BNS-845-1368).
Correspondence concerning this article should be addressed to
Barbara A. Mellers, Department of Psychology, University of Cali-
fornia, Berkeley, California 94720.
Experiment 1
Early work on proportion judgments investigated the rela-tionship between judged proportion and actual proportion.Visual displays containing two types of elements were pre-sented to subjects, who were asked to estimate the proportionof elements of one type. Philip (1947) presented subjects with11 stimuli (cards containing two colors of dots in proportionsranging from 13/36 to 23/36) and obtained judgments ofproportion on an 11-point rating scale. Philip found a linearrelationship between ratings and actual proportions.
Stevens and Galanter (1957) used a wider range of stimuli(11 cards containing two colors of dots with proportionsranging from 3/36 to 33/36) and found that both 7-pointcategory ratings and percentage estimates were related toactual proportions by inverse ogival-shaped functions (slopesof the curves were flatter in the center and steeper at theends).
Shuford (1961) used visual displays containing 400 ele-ments (vertical and horizontal lines) and asked subjects tojudge proportions directly on a scale from 0% to 100%. Byusing actual proportions ranging from 40/400 to 360/400 at10% intervals, Shuford found a linear relationship betweenjudged percentages and actual percentages. In summary, theexperiments found different stimulus-response functions, de-pending on the experimental conditions. However, these stud-ies are open to numerous alternative interpretations when itis conceded that the output (judgment) function as well asthe psychophysical function affects responses.
The present article extends this earlier work in two ways.First, relative frequency and total frequency are uncon-founded to allow tests of alternative models. Subjects wereshown squares containing black and white dots in which thenumber of black and white dots were independently varied ina factorial design. With this design, the same physical propor-tion is constructed from different numbers of dots. Second,
613

614 C. VAREY, B. MELLERS, AND M. BIRNBAUM
subjects performed four tasks using the same stimuli: "differ-ences," "ratios," "percentage white," and "percentage black."'By obtaining judgments from different tasks, greater leverageis provided to distinguish among alternative representationsof the underlying operations and judgment functions (or theoutput mappings from impressions to responses). If "percent-age" judgments are obtained in isolation and if they areordinally consistent with a relative ratio (or percentage) op-eration, they cannot be distinguished on ordinal grounds froma ratio model or a subtractive model. In this case, there wouldbe no ordinal grounds for selecting one model over another.However, if "percentage" judgments are obtained in conjunc-tion with "difference" judgments and "ratio" judgments andif the scale convergence criterion is assumed (Birnbaum, 1974,1982; Birnbaum & Veit, 1974), it becomes possible to ruleout sets of models for the four tasks in favor of other sets ofmodels.
The scale convergence criterion is the premise that thesubjective values of the stimuli are independent of the task.If scale convergence is assumed and different operations un-derlie the judgments, then the rank orders of the judgmentsacross the different tasks should not be monotonically relatedbut instead should have certain predictable patterns. Twotheories that assume the scale convergence criterion are dis-
cussed next.
One-Operation Theory
One possibility is that people do not have the "mentalmachinery" to perform different operations. Regardless of theinstructions; they might use a single operation and map theirimpressions to the appropriate response scale. For example,if subjects use a subtractive operation in all four tasks and ifthe subjective values of the stimuli are independent of thetask, then all four sets of judgments would be monotonicallyrelated. Another version of the one-operation theory mightbe that subjects use a ratio operation in all four tasks andthen transform their subjective ratios to the appropriate re-sponse scale. One-operation theory implies that the rank orderof judgments will be the same across all four tasks. Birnbaum(1978) used the term indeterminacy theory for this case be-cause if there is only one operation, it is not possible todetermine whether that operation is a ratio or a difference.
Multiple-Operations Theory
Birnbaum and his colleagues (see Birnbaum, 1978, 1980,1982, for reviews) distinguished between the following twotypes of situations. For many continua, when people are askedto judge "ratios" and "differences" of stimuli, they appear touse a subtractive operation regardless of the instructions.Judgments of "ratios" and "differences" are monotonicallyrelated for continua such as loudness and pitch of tones(Birnbaum & Elmasian, 1977; Elmasian & Birnbaum, 1984),heaviness of weights (Mellers, Davis, & Birnbaum, 1984),likableness of persons described by trait adjectives, darkness
of dot patterns, and many others. However, when subjectsare asked to judge "ratios" and "differences" of distancesbetween stimuli, they appear to use both ratio and subtractiveoperations as instructed (Birnbaum, 1978, 1982; Birnbaiyn,Anderson, & Hynan, 1989; Veit, 1978).
These results have been interpreted as follows: When thestimuli along a subjective continuum form an interval scale,the ratio operation is meaningless and subjects compare stim-uli by means of subtraction. However, even on an intervalscale, "distances" or "differences" have a well-defined zeropoint; hence, "ratios of differences" and "ratios of distances"are meaningful. In this case, subjects can perform either ratioor difference operations. For example, when subjects are askedto judge "ratios" and "differences" of easterliness and wester-liness of U.S. cities, all four sets of judgments are monotoni-cally related (Birnbaum & Mellers, 1978), consistent with aone-operation theory. However, when instructed to judge"ratios" and "differences" of distances between pairs of thesame U.S. cities, subjects produce two different rank orders,consistent with the operations on a ratio scale of distances(Birnbaum et al., 1989). Scale values derived from the fit ofthe instructed operations to the data converge with scalevalues obtained from the fit of the subtractive operation tosimple "ratio" and "difference" judgments.
In the present tasks, subjective values associated with thenumber of white or black dots might correspond to distances
or differences between the physical number of dots and zerodots. If the stimuli themselves are inherently subjective dis-tances or differences, subjects could meaningfully performboth ratio and difference operations. However, if the stimuliare merely points along a continuum with an undefined zeropoint, subjects might be expected to perform a subtractiveoperation in all four tasks, regardless of the instructions.
Method
Stimuli consisted of squares containing different numbers of black
and white dots. Each subject judged the "difference" between thenumbers of black and white dots, the "ratio" of the number of black
dots to white dots, the "percentage" of white dots, and the "percent-
age" of black dots.
Stimuli and design. Subjects were presented with 4-cm squares
containing different numbers of black and white dots. An example is
shown in Figure 1. Thirty-six stimuli were constructed from a 6 x 6
(White Dot x Black Dot) factorial design. Numbers of white dots and
black dots were approximately equally spaced on a logarithmic scale.
White dot frequencies were 5, 8, 12, 18, 27, and 40; black dot
frequencies were 40, 60, 90, 135, 201, and 301. These levels uncon-
found total frequencies from relative frequencies, as shown in Table1. Entries are physical percentages that remain approximately con-
stant along the diagonals despite different total number of dots.
Instructions. Subjects read a general instruction sheet that de-scribed the stimuli and the four tasks. Specific instructions for each
1 Quotation marks are used to distinguish instructions and judg-ments from the theoretical operations that subjects might use when
making their judgments. For example, when the instruction is tojudge "ratios," the ratio model may or may not underlie "ratio"
judgments.

JUDGMENTS OF PROPORTIONS 615
*..
*•» •*• *»Y>****° •
Figure I. An example stimulus with 27 white (open) dots and 135
black (filled) dots (17% white and 83% black).
task followed, in which subjects were asked to make intuitive judg-
ments of the "percentage" of black dots, the "percentage" of white
dots, the "ratio" of black dots to white dots, and the "difference"
between the number of black dots and white dots. Subjects wereshown an example stimulus that contained two white and two black
dots. Subjects were told that for this stimulus, their responses should
be 50% black dots, 50% white dots, a ratio of 1, and a difference of
0.
There are four main differences between the procedures used in
the present studies and those used in previous research on "ratios"
and "differences" (Birnbaum, 1978, 1980). First, in the "difference"
task, subjects were asked to estimate physical differences rather than
make ratings on a category scale. Subjects were told to estimate the
actual numerical difference between the number of black dots and
white dots. Second, in the "ratio" task, the modulus was set to 1.0
rather than 100. Third, there was only one example stimulus (and
example response) presented in the instructions. Fourth, differences
presented for judgment were always nonnegative, because the number
of black dots was never less than the number of white dots.
Procedure. Stimuli were arranged in five-page booklets. The first
page contained six stimuli (selected from the 36 trials) that served as
practice trials. The following four pages contained the 36 experimen-
tal stimuli presented in random order. Page order for the experimental
trials was counterbalanced by using two Latin square designs.
Task order and page order for the booklets were counterbalancedas follows: Four different task orders were crossed with the four
booklet orders to form 16 possible order combinations. There were 3
subjects in each ordering. Subjects were tested 2 to 8 at a time and
worked alone at their own pace. The experiment took approximately
1 hr.
Participants. Forty-eight undergraduates at the University of Cal-
ifornia, Berkeley, received credit in an introductory psychology coursefor participating. A few additional subjects who failed to complete
the tasks in the allotted time were excluded from the analyses.
Table 1Physical Proportions of White Dots
White dot frequencies
Black dot frequencies
406090
135201301
5
.077
.053
.036
.024
.016
8
.167
.112
.082
.056
.038
.026
12
.230
.167
.118
.082
.056
.038
18
.310
.231
.167
.118
.082
.056
27
.403
.310
.231
.167
.118
.082
40
.500
.400
.308
.229
.166
.117
Results
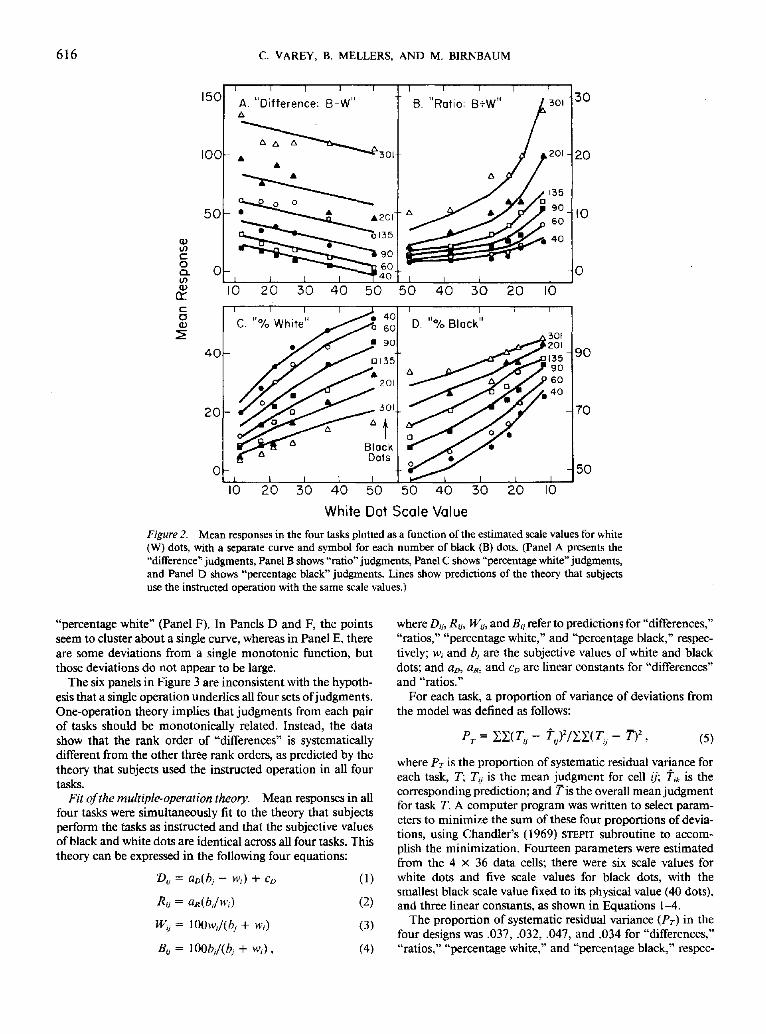
Figure 2 shows mean responses in the four tasks plotted asa function of the estimated scale values for white dots, with aseparate symbol for each level of black dots. (Lines representpredictions of a theory that will be discussed later.) Panel Ashows judged "differences." If the data were consistent with asubtractive model and if the response function was linear,curves connecting data symbols would be parallel. Althoughthe interaction between black and white dots was statisticallysignificant,2 F(25, 1175) = 6.31, deviations from parallelismdo not appear to conform to any interpretable pattern.
Panel B presents judged "ratios" as a function of estimatedscale values for the number of white dots (in reverse order onthe abscissa). If subjects used a ratio operation when makingtheir judgments and if the response scale was linear, the curvesconnecting data points would diverge (differences betweenthe curves would increase from left to right). The data ap-proximate this predicted pattern of divergence. The interac-tion between black and white dots was statistically significant,F(25, 1175) = 14.51. To test whether this divergence wasrepresentative of individual data, vertical differences in re-sponses between the two most extreme curves (the 301 and40 black dots curves) were computed for 5 white dots (right-most points) and 40 white dots (leftmost points). The majorityof subjects (87%) had a larger difference at 5 white dots thanat 40, consistent with the pattern of the means.
Mean "percentage white" and "percentage black" judg-ments are presented in Panels C and D of Figure 2, respec-tively. According to the relative ratio model, the curves inboth panels should be closer together at one end and bulgeout at the other end (resembling two different ends of afootball). The data in both panels resemble these trends. Theinteractions between white and black dots were significant:F(25, 1175) = 17.86 and F(25, 1175)= 9.63 for "percentagewhite" and "percentage black" judgments, respectively. Dif-ferences in responses between the two most extreme curveswere again computed for 5 and 40 white dots. For "percentagewhite" and "percentage black" judgments, 94% and 83% ofthe subjects, respectively, showed the same pattern of diver-gence or convergence as the means.
Ordinal relationships among the tasks. Figure 3 plots themean responses in each of the tasks against those of the othertasks, with a separate panel for each of the six possiblecombinations of four tasks and a separate symbol for eachnumber of black dots. The top panels show judged "differ-ences" plotted against "ratios" (Panel A), "percentage black"(Panel B), and "percentage white" (Panel C). In all three ofthe top panels, no single monotonic function can describe therelationship between judged "differences" and the other tasks;judged "differences" are ordinally distinct from judgments of"ratios," "percentage black," and "percentage white."
The lower three panels (D, E, and F) show the relationshipsbetween "ratios" and "percentage black" (Panel D), "ratios"and "percentage white" (panel E), and "percentage black" and
2 The word significant is used throughout this article to denote
616 C. VAREY, B. MELLERS, AND M. BIRNBAUM
150
100
50
o>incoQ.in
A. "Difference: B-W"A
40
20
BlackDots
D. "% Black"
10 20 30 40 50 50 40 30 20
White Dot Scale Value
30
20
10
10 20 30 40 50 50 40 30 20 10
90
70
50
10
Figure 2. Mean responses in the four tasks plotted as a function of the estimated scale values for white(W) dots, with a separate curve and symbol for each number of black (B) dots. (Panel A presents the
"difference" judgments, Panel B shows "ratio" judgments, Panel C shows "percentage white" judgments,and Panel D shows "percentage black" judgments. Lines show predictions of the theory that subjects
use the instructed operation with the same scale values.)
"percentage white" (Panel F). In Panels D and F, the points
seem to cluster about a single curve, whereas in Panel E, there
are some deviations from a single monotonic function, but
those deviations do not appear to be large.
The six panels in Figure 3 are inconsistent with the hypoth-
esis that a single operation underlies all four sets of judgments.
One-operation theory implies that judgments from each pair
of tasks should be monotonically related. Instead, the data
show that the rank order of "differences" is systematically
different from the other three rank orders, as predicted by the
theory that subjects used the instructed operation in all four
tasks.
Fit of the multiple-operation theory. Mean responses in all
four tasks were simultaneously fit to the theory that subjects
perform the tasks as instructed and that the subjective values
of black and white dots are identical across all four tasks. This
theory can be expressed in the following four equations:
tJ = 100w,/(6, + w,)
B, = I00bj/(hj + w,),
(2)
(3)
(4)
where D,h Ra, W,j, and B,j refer to predictions for "differences,"
"ratios," "percentage white," and "percentage black," respec-
tively; w, and bj are the subjective values of white and black
dots; and aD, aK, and CD are linear constants for "differences"
and "ratios."
For each task, a proportion of variance of deviations from
the model was defined as follows:
' T> ' (5)
where PT is the proportion of systematic residual variance for
each task, T; Ta is the mean judgment for cell ij; tik is the
corresponding prediction; and 7* is the overall mean judgment
for task T. A computer program was written to select param-
eters to minimize the sum of these four proportions of devia-
tions, using Chandler's (1969) STEPIT subroutine to accom-
plish the minimization. Fourteen parameters were estimated
from the 4 x 36 data cells; there were six scale values for
white dots and five scale values for black dots, with the
smallest black scale value fixed to its physical value (40 dots),
and three linear constants, as shown in Equations 1-4.
The proportion of systematic residual variance (PT) in the
four designs was .037, .032, .047, and .034 for "differences,"
"ratios," "percentage white," and "percentage black," respec-

JUDGMENTS OF PROPORTIONS 617
150
100-
10 20
- 100
50 70
Figure 3. Mean responses from each task plotted against the other tasks, with a separate symbol for
each number of black dots and a separate point for each of the common stimuli. (Lines connect stimuli
with the same number of black dots. Upper panels show the "difference" judgments plotted against
"ratios" [Panel A], black "percentages" [Panel B], and white "percentages" [Panel C]. Lower panels
show "ratios" plotted against black "percentages" [Panel D], "ratios" plotted against white "percentages"
[Panel E], and black against white "percentages" [Panel F].)
lively. The fit of the theory can be assessed in Figure 2, whichshows the predictions (solid lines) plotted with the data (sym-bols).
Figure 4 presents the estimated scale values for white and
black dots (w, and bj) plotted against physical values. Thesubjective values for white dots (open circles) are larger thanthe physical values, whereas scale values for black dots (solidcircles) are smaller than their physical values (with the excep-tion of 40 black dots, which was set to its physical value). Therelationship between estimated scales and physical scales forblack dots and white dots may be due to the fact that theactual size of the white dots was slightly larger than that ofthe black dots. It is also possible that white dot scale valueswere larger than their physical values because there werealways fewer white dots than black dots or because of asym-metries in perception, such as the "pop-out" effects investi-gated by Treisman (1988).
The estimated scale values for numbers of dots in Figure 4can be considered in light of previous results from experiments
that investigated judgments of frequency by using latency orthreshold accuracy measures (Beckwith & Restle, 1966; Jen-sen, Reese, & Reese, 1950; Jevons, 1871; Kaufman, Lord,Reese, & Volkmann, 1949). Estimates of number are usuallyaccurate for small numbers and fall short as the numberincreases. This research led investigators to postulate threeprocesses for judging frequency (Klahr, 1973; Klahr & Wal-lace, 1973). For fewer than 5 items, they posit a "subitizing"process; for between 5 and 20 items, they assume a "counting"process; and for more than 20 items, they propose an "esti-mation" process. Although the points in Figure 4 are scalevalues rather than estimates of number, they show negativeacceleration, compatible with previous findings for frequencyestimations.
Judged proportion versus actual proportion. Figure 5 plotsmean judgments from the "percentage white" task (opencircles) and the "percentage black" task (solid circles) averagedover stimuli with equal physical proportions. If judged per-centages and actual percentages were identical, the points

618 C. VAREY, B. MELLERS, AND M. BIRNBAUM
Physical Value
Figure 4. Estimated scale values for white dots {open circles) andblack dots (solid circles) plotted against physical values.
would fall on the diagonal (identity) line. However, judged
percentages below 50% are overestimated, and those above
50% are underestimated. To investigate this effect for individ-
uals, the average judged percentage for each subject was
compared with the average physical percentage in each task;
98% of the subjects both overestimated in "percentage white"
judgments and underestimated in "percentage black" judg-
ments.
The curves in Figure 5 display the predictions of the mul-
tiple-operations theory averaged over stimuli with equal phys-
ical proportions. As seen in the figure, the theory captures the
pattern of overestimation and underestimation of judged
percentages, although it seems to exaggerate the difference
between black and white dots at 50%.
100 -
20 40 60 80
Actual Percentage
100
Figure 5. Judged "percentages" (averaged over equal physical per-centage) plotted against actual percentages. (White "percentages" andblack "percentages" are shown as open and solid circles, respectively.Lines show best-fit predictions of the theory discussed in the text.)
The overestimation of small percentages and underestima-
tion of larger ones follows from the relative ratio operation
and psychophysical functions having the property that the
ratio of the scale value associated with the smaller number of
elements (in this case, white dots) to the scale value for thelarger number of elements (black dots) is greater than the
corresponding physical ratio (i.e., w/b > V^/fi,). This condi-
tion is satisfied by the "regressed" function in Figure 4, which
has a slope less than one. Several other psychophysical func-
tions also have this property (e.g., power functions with
exponents less than one) and would also imply this pattern of
overestimation and underestimation. Thus, even thou h peo-
ple are assumed to be using the "correct" operation, inaccurate
judgments can be explained as a consequence of the shape of
the psychophysical functions.
Experiment 2
The purpose of Experiment 2 was to investigate changes in
"percentage" judgments that are due to variations in the
stimulus distribution. For many continua, it has been found
that the same stimulus receives different judgments depending
on the distribution of other stimuli presented for judgment.
When larger stimuli are presented with greater frequency, an
intermediate-valued stimulus will typically receive a smaller
judgment. When smaller stimuli are presented with greater
frequency, the same stimulus will typically receive a larger
judgment. These contextual effects have been observed for
category ratings, magnitude estimations, "absolute" number
estimates, and other numerical responses (Mellers, 1986;
Mellers & Birabaum, 1982, 1983; Parducci & Perrett, 1971).
Thus, it is possible that proportion judgments will show
similar effects caused by changes in the stimulus distribution.
However, it may be that proportion judgments are inde-
pendent of the context, because of the nature of the stimulus
and response scales. For example, when subjects judge the
proportion of elements of one color in a two-color array, the
scale might have natural anchors at 0 (when there are no
members of one color), at 0.5 (when the two are equal), and
at 1 (when there are no members of the other color). These
constraints might suffice to pin down the response scale and
therefore preclude or substantially reduce the possibility of
contextual effects in proportion judgments.
Method
There were four conditions in Experiment 2, constructed from a 2X 2 (Task X Context) factorial design, with different subjects in eachcondition. Stimuli were squares containing black and white dots, asin Experiment 1, and subjects' tasks were to judge either the "per-centage" of white dots or the "percentage" of black dots. The distri-bution of percentages (context) was either positively skewed or nega-tively skewed.
Stimuli and design. Each of the four conditions contained 150stimuli. There were 130 contextual stimuli and 20 experimentalstimuli that were common to all four conditions. The commonstimuli were a subset of the design from Experiment 1 and constituteda 4 X 5 (White Dot x Black Dot) factorial design. Numbers of whitedots were 8, 12, 18, and 27; numbers of black dots were 40, 60, 90,135, and 201.

JUDGMENTS OF PROPORTIONS 619
Figure 6 shows how the 130 contextual stimuli were distributed in
relation to the stimuli in the 4 X 5 common design. Because it was
thought that percentage judgments based on arrays containing two
types of elements might be anchored at three points—0%, 50%, and
100%—the contextual manipulations were carried out separately on
percentages ranging from 0 to 50 (white percentages) and from 50 to
100 (black percentages).
In the upper panels of Figure 6, actual percentages for the common
design are plotted as a function of the number of white dots, with a
separate curve and symbol for each number of black dots. The
numbers in Panel A show the frequency and approximate value of
the black and white dots for contextual stimuli in the positively
skewed distribution. For example, 100 in Panel A indicates that there
were 100 stimuli having from 9 to 11 white dots and from 136 to 200
black dots (percentages of white ranged from 3.7% to 5.5%). In this
condition, the distribution of white percentages is positively skewed,
and the marginal distributions of white and black dots are positivelyand negatively skewed, respectively. The numbers in Panel B show
the frequency and values of contextual stimuli for the other context.
In this condition, the distribution of white percentages is negatively
skewed, and the marginal distributions of white and black dots are
negatively and positively skewed, respectively.
Lower panels show the physical percentages of black dots from the
common designs. Panel C depicts the positively skewed distribution
of black percentages, which arises from the same stimuli as in Panel
B; a negatively skewed distribution of white percentages produces a
positively skewed distribution of black percentages. Similarly, Panel
D arises from the same distribution as in Panel A; white percentages
that are negatively skewed produce black percentages that are posi-
tively skewed.
Instructions. Subjects were asked to judge either the "percentage"
of white dots or the "percentage" of black dots in each stimulus. As
in Experiment 1, instructions included a stimulus with two white
dots and two black dots. Subjects were told that for this stimulus,
they should respond 50%. Instructions emphasized that the judg-
ments should be subjective rather than based on actual computations.
Procedure. The stimuli were arranged in 15-page booklets, with10 stimuli on each page. To acquaint the subjects with the full range
of proportions, we presented on the first page eight contextual stimuli
and the smallest and largest percentages among the common stimuli.
The next 5 pages contained only contextual stimuli. Each of the
remaining 10 pages contained eight contextual stimuli and two com-
mon stimuli. Ten different versions of the booklet were created by
ordering the last 10 pages according to a Latin square design. Subjects
were tested 1 to 5 at a time and worked alone at their own pace. Theexperiment took approximately 1 hr.
Participants. Subjects were 158 undergraduates from the Univer-
sity of California, Berkeley, who participated for course credit in an
v 40!E
B 20
oin
CL0
_ A. Pos Skew
BlackDots
12 18
B. Neg Skew
27 12 18 27
o_oCD
90
o 70
50
27 18 12 8 27 18 12 8
Number of White Dots
Figure 6. Actual percentages for the four conditions of Experiment 2. (White percentages are shownin the upper panels, and black percentages are shown in the lower panels. The numbers 100, 20, and
10 represent the numbers of contextual stimuli, and their locations depict their composition. Pos =
positive; Neg = negative.)

620 C. VAREY, B. MELLERS, AND M. BIRNBAUM
introductory psychology course. There were between 29 and 50
subjects in each of the four conditions. Data from a few additionalsubjects who did not complete the task were not used in the analyses.
Results
Figure 7 shows mean responses to the "percentage white"
tasks in the upper panels and the "percentage black" tasks in
the lower panels, plotted as a function of the white dot scale
values, with a separate symbol for each number of black dots.
Solid lines are the predictions of a theory that will be discussed
later. "Percentage white" judgments (upper panels) show di-
vergent interactions between the numbers of white and black
dots, as predicted by the relative ratio operation. "Percentage
black" judgments (lower panels) show convergent interac-
tions. The majority of individual subjects in each of the four
conditions gave responses that matched the divergence or
convergence of the means in their condition.
A comparison of panels on the left with those on the right
in Figure 7 shows effects of the context. Judged "percentages"
for the common stimuli in the positively skewed context are
greater than the corresponding "percentages" in the negatively
skewed context. Context has a significant main effect: F(l,
98) = 50.67 and F(l, 98) = 17.00 for white and black
"percentages," respectively. For example, the stimulus in Fig-
ure 1, which had an actual white percentage of 17%, was
called either 21% or 32% depending on the context. In
addition, the interaction between black dots and white dots
changes, depending on the context. The three-way interaction
between white dots, black dots, and context is significant for
both "percentage white" and "percentage black" judgments,
F(12, 1176) = 7.54 and f(12, 1176) = 2.07.
Judged proportion versus actual proportion. Figure 8 plots
judgments from the common designs (averaged over stimuli
with equal physical percentages) against actual percentages
for the four conditions. There are three important points to
note. First, for both contexts, small "percentages" are over-
estimated and large "percentages" are underestimated, as in
Experiment 1. Individual data were consistent with these
trends; in the "percentage white" tasks, 83% of the subjects
overestimated small percentages and in the "percentage black"
tasks, 92% of the subjects underestimated large percentages.
Second, the relationship between judged "percentages" and
actual percentages depends on the context. For "percentage
40
20
ca<B
A. Pos Skew B. Neg Skew
8 12 18 27 8 12 18 27
^ 90oa
CD
-̂ 70
coo>
50-
D. Neg Skew
27 18 12 8 27 18 12 8
White Dot Scale Value
Figure 7. Mean "percentage white" judgments (upper panels) and "percentage black" judgments (lowerpanels) plotted as in Figure 6. (Lines show predictions of the relative ratio model. Pos = positive; Neg= negative.)

JUDGMENTS OF PROPORTIONS 621
white" judgments (see Figure 8, lower left curves), judgments
of small proportions are smaller when there are many pro-
portions near 0.5 (negative skew) than when most stimuli
have proportions near zero (positive skew). For "percentage
black" judgments (upper right curves), judgments of large
proportions are larger when there are many proportions near
0.5 (positive skew) than when there are many contextual
proportions near 1.0 (negative skew). These results indicate
that judged "percentages" cannot simply be corrected by a
single transformation to map them into actual percentages; a
theory of the context is required to predict the relationship
between judged and actual percentages.
Third, for both "percentage white" and "percentage black"
judgments, positively skewed percentages are concave down-
ward in relation to negatively skewed percentages. This shape
is predicted by range-frequency theory for these two distri-
butions (Parducci, 1968, 1974; Parducci & Perrett, 1971).
Fit of the relative ratio model. Because of the success of
the relative ratio operation for "percentage" judgments in
Experiment 1, this model was fit to mean responses for the
common stimuli in the four conditions with a special com-
puter program that selected parameters to minimize the sum
of the four proportions of errors (Equation 5), as in Experi-
ment 1. White scale values and black scale values were esti-
mated separately for each condition (with the smallest black
scale value arbitrarily set to its physical value of 40). The
proportions of systematic residual variance in each of the four
conditions ranged from .007 to .028. The fit of the model can
be assessed in Figures 7 and 8 by comparing predictions of
the theory (lines) with data (symbols).
Figure 9 shows the estimated scale values for white dots
plotted against physical value. The left and right panels show
100-
80
8 60
40
20
20 40 60 80
Actual Percentage
100
Figure 8. Judged "percentage" against actual percentage for the four
conditions. (Open circles are "percentage white" judgments; solid
circles are "percentage black" judgments. Lines show predictions of
the relative ratio operation, allowing changes in the context to affect
the scale values. Pos = positive; Neg = negative.)
40
J3 30
o
•£• 20
10
White ScaleValues/Pos.from"%White"
White Scale Valuesfrom"% Black"
Neg
8 12 18 27 8 1-2
Physical Value
27
Figure 9. Estimated scale values for white dots estimated from the
"percentage white" tasks (left panel) and the "percentage black" tasks
(right panel) plotted as a function of physical value. (Pos and Neg
refer to positive and negative marginal stimulus distributions, respec-
tively. In the panel on the left, Pos and Neg refer to Panels A and B
of Figure 6, respectively. In the panel on the right, Pos and Neg refer
to Panels C and D of Figure 6, respectively.)
white dot scale values estimated from the "percentage white"
and "percentage black" tasks, respectively, with a separate
curve for each context. In Figure 9, context labels refer to the
marginal distributions. For white dot scales estimated from
"percentage white" tasks, Pos and Neg refer to Panels A and
B of Figure 6, respectively. For white dot scales estimated
from the "percentage black" tasks, Pos and Neg refer to Panels
D and C of Figure 6, respectively.
If there were no effects of either the context or the task, all
four curves in Figure 9 would be identical. Instead the curves
differ as a function of both task and context. Contextual
effects (differences between the positive and negative curves)
are more pronounced for white dot scale values when subjects
are judging the "percentage" of white dots than when they are
judging the "percentage" of black dots. For comparison, white
dot scale values in the right panel (estimated from the "per-
centage black" tasks) show a much smaller difference due to
context. Effects of the task were examined by transforming
the "percentage black" judgments to "percentage white" judg-
ments (subtracting them from 100%). Examination of task
effects showed no systematic main effects. However, there
were significant interactions between task and white dots,
F(3, 336) = 12.75, and between task and black dots, F(4,448) = 9.52.
Figure 10 shows the estimated subjective values for black
dots plotted against physical values. The panel on the left
shows black scale values from the "percentage black" tasks,with a separate curve for each context. Scale values from the
positively skewed distribution of percentages are concave
downward in relation to those from the negatively skewed
distribution of percentages. Black scale values from the "per-
centage white" tasks in the right panel are almost identical in
the two contexts. Contextual effects on the black scale values

622 C. VAREY, B. MELLERS, AND M. B1RNBAUM
•ft 100
40 60 90 135 201 40 60 90 135 201
Physical Value
Figure 10. Estimated scale values for black dots estimated from the
"percentage black" tasks (left panel) and the "percentage white" tasks
(right panel). (Pos and Neg refer to positive and negative marginal
stimulus distributions, respectively. In the panel on the left. Pos andNeg refer to Panel C and D of Figure 6, respectively. In the panel on
the right, Pos and Neg refer to Panels A and B. of Figure 6, respec-
tively.)
are more pronounced in the "percentage black" tasks than inthe "percentage white" tasks.
In summary, the data obtained in Experiment 2 appearconsistent with the theory that subjects use a relative ratiooperation when judging "percentages" and that context effects(variations in the stimulus distribution) influence the scalevalues. Because both black and white dots are necessary for apercentage judgment, it may seem surprising that contextualeffects on the white dot scale values are more pronounced inthe "percentage white" tasks than in the "percentage black"tasks. Perhaps when judging "percentage white," subjectsseparate the white dot context from the black dot context andpay more attention to everything about white dots. Thisincreased attention may result in greater changes in the whitedot scales with variations in the context.
Such specific effects of context seem compatible with find-ings that subjects can make judgments of one type of stimulusthat are independent of the distribution of other types ofstimuli shown and judged in the same sequence. Parducci,Knobel, and Thomas (1976) instructed a group of subjects torate the size of each figure in a sequence of squares and circlesby judging each square in comparison with the other squaresand each circle with the other circles. Variation in the skew-ness of the distribution of squares did not influence ratings ofcircles, and vice versa, although the distribution of elementsof the same type did affect the judgments.
General Discussion
Results from the present experiments can be summarizedas follows:
1. Data from Experiment 1 are consistent with the theorythat subjects used the instructed operations with the samescale values in all four tasks. These results can be interpretedas consistent with Birnbaum's (1980, 1982) theory of com-parison if it is assumed that subjective zero points are well-defined for the present stimuli.
2. "Percentage" judgments differ from actual percentagesin that small percentages are overestimated and large per-centages are underestimated. This pattern follows from therelative ratio model if the psychophysical function has theproperty that the ratio of the subjective values (the smallerelement relative to the larger element) is greater than the ratioof their corresponding physical values.
3. "Percentage" judgments depended on the overall stim-ulus distribution in Experiment 2. Effects of the contextappear consistent with Parducci's (1974) range-frequencytheory. A model that attributes contextual effects to shifts inthe scale values fit the data well. The magnitude of the shiftwas greater for the color of dots named in the task; scalevalues for the number of white dots estimated from the"percentage white" judgments changed more as a function ofthe context than did white dot scale values estimated fromthe "percentage black" judgments. Similarly, black scale val-ues were more sensitive to the context in the "percentageblack" task than in the "percentage white" task.
Subjective Versus Objective Proportion
The pattern of overestimation and underestimation shownin Figures 5 and 8 has been found in a number of studies,including those of Stevens and Galanter (1957) for judgmentsof proportions, Dale (1959) for gambling behavior, Attneave(1955) for judged frequencies of the occurrence of tetters inEnglish text, Begg (1974) for estimates of word frequencies,Lichtenstein, Slbvic, Fischhoff, Layman, and Combs (1978)for judged frequencies of lethal events (causes of death), andKellog and Dowdy (1986) for judged frequencies of dots.
The patterns in Figures 5 and 8 are also compatible with atheory of the subjective probability function in risky choice.Karmarkar (1978) noted that certain phenomena in riskydecision making could be explained if subjective probabilitycould be described with the equation s(p) = [ f / [ ( \ - p)a +
i f ] , where s(p) is the subjective probability, p is the objectiveprobability, and a is an exponent. When a is less than 1, therelation between subjective and objective probability has aform similar to that shown in Figure 5.
It is interesting to compare the present results with researchon calibration. In studies of confidence, people typically an-swer binary choice questions and provide confidence ratingsor estimates of the probability that their answers are correcton a scale from 0.5 to 1.0. For each value of judged confi-dence, the percentage of correct items is computed. A typicalfinding is overconfidence: The judged confidence between 0.5and 1.0 exceeds the actual proportion correct (Fischhoff,Slovic, & Lichtenstein, 1977; Lichtenstein, Fischhoff, & Phil-lips, 1982).
One difference between calibration studies and the presentstudies is the method of analysis. When one plots averagejudged proportion for each level of objective proportion (inthe range of 0.5 to 1.0), subjective proportions are typicallyless than objective proportions. Overconfidence occurs incalibration experiments when one plots average objectiveproportion for each level of subjective proportion (in therange of 0.5 to 1.0). These two sets of findings can perhaps bereconciled by considering the role of statistical regression.
JUDGMENTS OF PROPORTIONS 623
Regression implies these patterns when the stimulus andresponse distributions are the same and when the correlationbetween judged proportion and objective proportion is lessthan perfect.
Contextual Effects and Between-Subjects Designs
It seems reasonable to assume as a null hypothesis thatdifferent types of judgments, including probability judgments,are governed by the same laws. Contextual effects in propor-tion judgments suggest that probability judgments are de-scribed by the same principles that apply to other domains ofpsychological judgment. Previous research has found that thefunction relating stimulus to response depends on the rangeand frequencies of the stimulus distribution and on the rangeand shape of the response distribution, according to exten-sions of Parducci's (1968, 1974) range-frequency theory. Al-though Parducci's theory was originally proposed for categoryratings, it appears that contextual effects found in proportionjudgments are similar to those found with other judgments,including magnitude estimation, absolute numerical estima-tion, and other numerical scales, as well as category ratings(Melkrs, 1982, 1986; Mellers & Birnbaum, 1982).
In the present experiments with proportion judgments, thestimulus distribution was manipulated but the response dis-tribution was not. The response distribution can be manipu-lated in magnitude estimation or "ratio" estimation by vary-ing the examples mentioned incidentally in the instructions.For example, Mellers et al. (1984) found that subjects wouldjudge the ratio of 290 grams to 20 grams as either 8 or 32, ifthe largest example response was any of those values. Hardinand Birnbaum (1990) found that the judged "ratio" of theprestige of a physician to that of a trash collector was either 4or 64, depending on whether the largest example responsewas a "ratio" of 4 or 64.
Perhaps the extreme malleability of "ratio" judgments canbe explained by the fact that subjects are really computingdifferences when instructed to judge such "ratios" for thosecontinua. On the other hand, proportion judgments mightnot be as easy to manipulate because subjects are thought tobe using the same operation as instructed when making theirjudgments. The response distribution in proportion judgmentmight be influenced by examples (e.g., "If you think 1 personin 6 has diabetes, say 1/6" vs. "If you think 1 person in 10,000has diabetes, say 1/10,000"). Nevertheless, it seems plausiblethat if the stimulus distribution affects judged proportions,the response distribution could also have such effects.
The important question is whether judgments of probabilitycan be taken at face value. The fact that the same physicalproportion can receive different judgments in different con-texts suggests that the results in Figures 5 and 8 have impli-cations for theories of intuitive probability and also for theinterpretation of studies that involve judgments of probabili-ties.
To understand probability judgments, it is necessary todistinguish among three concepts: subjective, objective, andjudged probability. Some investigators have concluded thatbecause probability is on an absolute scale, judgments ofprobability are also absolute and are identical to subjective
probabilities. Those who treat judged probability as identicalto subjective probability might be tempted to conclude frombetween-subjects comparisons that if an event receives ahigher probability judgment, then it also has a higher subjec-tive probability. However, Figures 5 and 8 show that a theoryof the context is necessary to compare probability judgmentsbetween different groups of subjects. For example, by com-paring judgments between groups, Figure 8 shows that thephysical proportion of. 17 is judged as higher than the physicalproportion of .23 (30.5 vs. 25.3, the fifth open circle and thesixth open square from the left). In contrast, a within-subjectcomparison shows that both groups of subjects gave higherjudgments to higher physical proportions. Because between-subjects comparisons (Figure 8) can lead to such obviouscontradictions, one should be extremely cautious when draw-ing inferences from between-subjects comparisons of judg-ments.
Birnbaum and Mellers (1983) found that research on the"base-rate fallacy" leads to different conclusions dependingon whether the experiments used within-subject or between-subjects designs. The interpretation of base rate "neglect" isbased on the finding that in between-subjects comparisons,the effect of base rate is too small {Kahneman et al., 1982).In within-subject comparisons, however, subjects use the baserate, and the evidence for a "fallacy" disappears (Birnbaum& Mellers, 1983). Birnbaum (1982) noted that the judgedfault of a rape victim also differs in within-subject and be-tween-subjects designs, and he gave a range-frequency analy-sis of why between-subjects comparisons lead to paradoxicalconclusions: Between-subjects comparisons confound thestimulus and the context by allowing the stimulus to evokeits own context. Nihm's (1984) satire on the claim thatsubjects lack self-insight also shows how unusual conclusionscould be reached from between-subjects comparisons. If wedo not wish to argue that larger physical proportions arejudged smaller, the present results provide another argumentfor preferring within-subject comparisons.
If there were a single function relating judged probabilityto objective probability, one could simply apply the inversefunction to convert judgments of probability into "real" prob-abilities. The present data demonstrate that no single functionwould suffice, because such corrections depend on the con-text. Furthermore, it has been shown that judgments of prob-ability do not obey the algebra of probability, even if oneallows for a monotonic transformation of the judgments(Birnbaum & Mellers, 1983). Therefore, even subjective prob-abilities do not obey the algebra that would justify the con-struction of an absolute scale.
In principle, it is possible to determine whether contextualeffects can be attributed to the response scale or to theperception of the stimulus (Mellers & Birnbaum, 1982); how-ever, the present data do not provide an unambiguous deter-mination of the locus of the effect. Although the data couldbe well fit by assuming that contextual effects operate on thescale values, in other judgment tasks contextual effects havebeen attributed to the response stage (Mellers & Birnbaum,1983).
An analogous (but perhaps more philosophical) question isto ask if the contextual effects are truly psychological or

624 C. VAREY, B. MELLERS, AND M. BIRNBAUM
merely semantic. This ill-defined question leads one to spec-ulate about related experiments. For example, suppose thesubject's task was to make bids for the opportunity to playgambles. Suppose a ball was drawn from an urn representedby Figure 1, and that if the ball was white, the subject wouldwin $100 and if the ball was black, the subject would receivenothing. Would subjects in the positively skewed conditionoffer more to play such a gamble than subjects in the nega-tively skewed condition? If the judgments in Figure 8 areindicative of true subjective probabilities, then increasing thesubjective probability of winning should increase the value ofthe gambles based on those probabilities. Recent researchshows that the judged value of a gamble depends on thedistribution of gambles presented for judgment (Mellers, Or-donez, & Birnbaum, 1989).
Conclusions
The present experiments are consistent with the theory thatsubjects use the instructed operation when judging "ratios,""differences," and "percentages." Despite the use of the cor-rect operation, subjects overestimate small percentages andunderestimate large percentages. Percentage judgments showcontextual effects that are due to changes in the stimulusdistribution; the same physical proportion receives differentjudgments in different contexts. These experiments suggestthat proportion judgments are governed by principles similarto those found with other numerical responses. Thus, propor-tion judgments and, by analogy, probability judgments shouldnot be taken at face value because they depend on both thestimulus information and the surrounding context.
References
Attneave, F. (1955). Psychological probability as a function of expe-rienced frequency. Journal of Experimental Psychology, 46, 81-86.
Beckwith, M., & Restle, F. (1966). Process of enumeration. Psycho-logical Review, 73, 437-444.
Begg, I. (1974). Estimation of word frequency in continuous anddiscrete tasks. Journal of Experimental Psychology, 102, 1046-1052.
Birnbaum, M. H. (1974). The nonadditivity of personality impres-sions. Journal of Experimental Psychology, 102, 543-561.
Birnbaum, M. H. (1978). Differences and ratios in psychologicalmeasurement. In N. J. Castellan & F. Restle (Eds.), Cognitivetheory (Vol. 3, pp. 33-74). Hillsdale, NJ: Erlbaum.
Birnbaum, M. H. (1980). Comparison of two theories of "ratio" and"difference" judgments. Journal of Experimental Psychology: Gen-eral, 109, 304-319.
Birnbaum, M. H. (1982). Controversies in psychological measure-ment. In B. Wegener (Ed.), Social attitudes and psychophysicalmeasurement (pp. 401-485). Hillsdale, NJ: Erlbaum.
Birnbaum, M. H. (1983). Base rate in Bayesian inference: Signaldetection analysis of the cab problem. American Journal of Psy-chology, 96, 85-94.
Birnbaum, M. H., Anderson, C., & Hynan, L. G. (1989). Twooperations for "ratios" and "differences" of distances on the mentalmap. Journal of Experimental Psychology: Human Perception andPerformance, 15, 785-796.
Birnbaum, M. H., & Elmasian, R. (1977). Loudness "ratios" and"differences" involve the same psychophysical operation. Percep-
tion & Psychophysics, 22, 383-391.Birnbaum, M. H., & Mellers, B. A. (1978). Measurement and the
mental map. Perception & Psychophysics, 23, 403-408.Birnbaum, M. H., & Mellers, B. A. (1983). Bayesian inference:
Combining base rates with opinions of sources who vary in credi-bility. Journal of Personality and Social Psychology, 45, 792-804.
Birnbaum, M. H., & Veil, C. T. (1974). Scale convergence as acriterion for rescaling: Information integration with difference,ratio, and averaging tasks. Perception & Psychophysics, 16, 276-282.
Chandler, J. P. (1969). STEPIT: Finds local minima of a smoothfunction of several parameters. Behavioral Science, 14, 81-82.
Dale, H. C. (1959). A priori probabilities in gambling. Nature, 183,842-843.
Edwards, W. (1968). Conservatism in human information processing.In B. Kleinmutz (Ed.), Formal representations of human judgment(pp. 17-52). New York: Wiley.
Elmasian, R., & Birnbaum, M. (1984). A harmonious note on pitch:Scales of pitch derived from the subtractive model of comparisonagree with the musical scale. Perception & Psychophysics, 36, 531-537.
Fischhoff, B., Slovic, P., & Lichtenstein, S. (1977). Knowing withcertainty: The appropriateness of extreme confidence. Journal ofExperimental Psychology: Human Perception and Performance, 3,552-564.
Hardin, C., & Birnbaum, M. H. (1990). Malleability of "ratio"judgments of occupational prestige. American Journal of Psychol-ogy, 103, 1-20.
Hasher, L., & Zacks, R. (1984). Automatic processing of fundamentalinformation. American Psychologist, 39, 1372-1388.
Jensen, E. M., Reese, E. P., & Reese, T. W. (1950). The subitizingand counting of visually presented fields of dots. Journal of Psy-chology, 30, 362-392.
Jevons, W. S. (1871). The power of numerical discrimination. Nature,3, 281-282.
Kahneman, D., Slovic, P., & Tversky, A. (Eds.). (1982). Judgmentunder uncertainty: Heuristics and biases. New York: CambridgeUniversity Press.
Karmarkar, U. S. (1978). Subjectively weighted utility: A descriptiveextension of the expected utility model. Organizational Behaviorand Human Performance, 21, 61-72.
Kaufman, E. L., Lord, M. W., Reese, T. W., & Volkmann, J. (1949).The discrimination of visual number. American Journal of Psy-chology, 62, 498-525.
Kellog, R. T., & Dowdy, J. C. (1986). Automatic learning of thefrequencies of occurrence of stimulus features. American Journalof Psychology, 99, 111-126.
Klahr, D. (1973). Quantification processes. In W. G. Chase (Ed.),Visual information processing (pp. 3-34). Orlando, FL: AcademicPress.
Klahr, D., & Wallace, J. G. (1973). The role of quantification oper-ators in the development of conservation of quantity. CognitivePsychology, 4, 301-327.
Lichtenstein, S., Fischhoff, B., & Phillips, L. (1982). Calibration ofprobabilities: The state of the art to 1980. In D. Kahneman, P.Slovic, & A. Tversky (Eds.), Judgment under uncertainty: Heuristicsand biases (pp. 306-334). New York: Cambridge University Press.
Lichtenstein, S., Slovic, P., Fischhoff, B., Layman, F., & Combs, B.(1978). Judged frequency of lethal events. Journal of ExperimentalPsychology: Human Learning and Memory, 4, 551-578.
Mellers, B. A. (1982). Equity judgment: A revision of Aristotelianviews. Journal of Experimental Psychology: General, 111, 242-270.
Mellers, B. A. (1986). "Fair" allocations of salaries and taxes. Journalof Experimental Psychology: Human Perception and Performance,1, 80-91.
JUDGMENTS OF PROPORTIONS 625
Mellers, B. A., & Birabaum, M. H. (1982). Loci of contextual effectsin judgment. Journal of Experimental Psychology: Human Percep-
tion and Performance. 8, 582-601.Mellers, B. A., & Birnbaum, M. H. (1983). Contextual effects in
social judgment. Journal of Experimental Social Psychology, 19,
157-171.Mellers, B. A., Davis, D., & Bimbaum, M. H. (1984). Weight of
evidence supports one operation for "ratios" and "differences" ofheaviness. Journal of Experimental Psychology: Human Perception
and Performance. 10, 216-230.Mellers, B. A., Ordonez, L., & Birnbaum, M. H. (1989). Context and
response mode effects in risky decision making. Unpublished
manuscript.Nihm, S. D. (1984). Self reports on mental processes: Comment on
Birnbaum and Stegner. Bulletin of the Psychonomic Society, 22,426-427.
Parducci, A. (1968). The relativism of absolute judgment. Scientific
American, 219. 84-90.Parducci, A. (1974). Contextual effects: A range-frequency analysis.
In E. C. Carterette & M. P. Friedman (Eds.), Handbook of percep-
tion (Vol. 2, pp. 127-141). Orlando, FL: Academic Press.Parducci, A., Knobel, S., & Thomas, C. (1976). Independent contexts
for category ratings: A range-frequency analysis. Perception &
Psychophysics, 20, 360-366.Parducci, A., & Perrett, L. (1971). Category rating scales: Effects of
relative spacing and frequency of stimulus values. Journal of Ex-perimental Psychology Monograph, 819, 427-452.
Peterson, C. R., & Beach, L. R. (1967). Man as an intuitive statisti-cian. Psychological Bulletin, 68, 29-46.
Philip, B. R. (1947). Generalization and central tendency in the
discrimination of a series of stimuli. Canadian Journal of Psychol-ogy, 1. 196-204.
Schum, D. (1981). Sorting out the effects of witness sensitivity and
response-criterion placement upon the inferential value of testi-mony. Organizational Behavior and Human Performance, 27,153-196.
Shanteau, J. (1974). Component processes in risky decision making.
Journal of Experimental Psychology, 103, 680-691.
Shuford, E. H. (1961). Percentage estimation of proportion as afunction of element type, exposure time, and risk. Journal ofExperimental Psychology, 61, 430-436.
Slovic, P., Lichtenstein, S., & Fischhoff, B. (1988). Decision making.In R. C. Atkinson, R. J. Hernstein, G. Lindzey, & R. D. Luce(Eds.), Stevens'handbook of experimental psychology (2nd ed., pp.673-738). New York: Wiley.
Stevens, S. S., & Galanter, E. (1957). Ratio scales and category scalesfor a dozen perceptual continua. Journal of Experimental Psychol-
ogy, 54, 377-411.
Treisman, A. (1988). Feature analysis in early vision: Evidence forsearch asymmetries. Psychological Review, 95, 15-48.
Veil, C. T. (1978). Ratio and subtractive processes in psychophysicaljudgment. Journal of Experimental Psychology: General, 107, 81-107.
Wallsten, T. S., Budescu, D. V., Rappoport, A., Zwick, R., & Forsyth,
B. (1986). Measuring the vague meaning of probability terms.Journal of Experimental Psychology: General, 115, 348-365.
Zadeh, L. A. (1975a). The concept of a linguistic variable and itsapplication to approximate reasoning: Part 1. Information Science,
8, 199-249.
Zadeh, L. A. (1975b). The concept of a linguistic variable and itsapplication to approximate reasoning: Part 2. Information Science.8, 301-357.
Zadeh, L. A. (1975C). The concept of a linguistic variable and itsapplication to approximate reasoning: Part 3. Information Science,9, 43-98.
Zimmer, A. C. (1983). Verbal vs. numerical processing of subjectiveprobabilities. In R. W. Scholz (Ed.), Decision making under uncer-tainty (pp. 159-182). Amsterdam: North-Holland Publishers.
Received March 21, 1989
Revision received July 18, 1989
Accepted January 2, 1990 •