corso archimate roadmapping workbook v1 lw5-11-1 ·...
TRANSCRIPT

1
IBM Rational Open Day
Roadmapping with the Corso ArchiMate® plug-‐in and IBM Rational System Architect

2
Table of Contents Introduction ........................................................................................................................................... 3
Objectives .............................................................................................................................................. 5
Scenario ................................................................................................................................................. 5
ArchiMate Implementation within Rational System Architect .............................................................. 5
Lab – Roadmapping for Rational System Architect ............................................................................... 6
1.1 Implementation And Migration .............................................................................................. 10
1.2 Work Packages, Program Timelines and Heatmaps ............................................................... 19
1.3 Method Wizard ...................................................................................................................... 32
1.4 Lifecycle States and Application Roadmap Reports ............................................................... 39
1.5 Explorer Diagram .................................................................................................................... 54

3
Introduction Rational System Architect IBM Rational System Architect™ is the leading enterprise architecture tool for developing a complete end-‐to-‐end blueprint of an organization. The System Architect™ toolset allows decision makers, architects and stakeholders to gather enterprise wide information and collaborate on models of the enterprise to understand the impact of change required by business initiatives. With the encouragement of IBM, Corso has created a toolkit that supports version 2.1 of ArchiMate® within System Architect™. The combination of System Architect™ and ArchiMate® provides a rich, yet easy-‐to-‐use set of capabilities specifically targeted at enterprise architects and business analysts intent on documenting and making decisions based upon the ArchiMate® approach.
Enterprise architecture modeling support
IBM® Rational® System Architect enables you to visualize, analyze, and communicate the enterprise architecture of your organization.
Visualize
Rational System Architect provides a rich set of modeling capabilities that enable you to visualize an enterprise architecture. Modeling capabilities include diagram types and definition types that enable you to model the who, what, where, when, why, and how of the business, through all stages of understanding, including contextual, conceptual, logical, and physical modeling, and implementation of working systems supporting the enterprise. Rational System Architect provides a suite of business modeling diagramming (including business process models, organizational hierarchy charts, functional models, business concept diagrams, and so forth), UML modeling for application and system development, and relational data modeling (including logical and physical data models and schema generation/reverse engineering).
Analyze
Rational System Architect provides capabilities to analyze the enterprise architecture models.
• Analytics -‐-‐ The analytic definition type provides a user interface to analytic macros that you can build to run metrics algorithms against models, and visually display indicators next to symbols on diagrams reflecting the output of the algorithms. For example, you might run an analytic to show costs of business processes, and display gauges next to processes on a business process diagram, with the indicator on the gauge reflecting the cost of the particular process.
• Explorer Diagram -‐-‐ the Explorer diagram enables you to visually show relationships of model artifacts in the repository, based on reports that you write using the reporting system. The Explorer diagram enables you to create "what if" analysis on the models. For example, you can visually see what business processes are affected if a hardware server is brought down for repairs.
• Business Process Simulation -‐-‐Simulator II is a paid add-‐on to Rational System Architect that enables you to simulate business process diagrams -‐-‐ BPMN Process diagrams, IDEF3 Process Flow diagrams, or Process Charts.
4
Communicate
Rational System Architect enables you to communicate your enterprise architecture to a wide audience through the use of these features:
• Reporting System -‐-‐ The reporting system provides pre-‐written reports and enables you to build your own reports on model information, and print formatted reports or publish the output to html/xml.
• Word Reporting -‐-‐ The Word Interface enables you to choose from prebuilt reports and generate the output to Word.
• HTML Generator -‐-‐ The HTML Generator enables you to generate models to a website output. • Information Web Publisher -‐-‐ This is a paid add-‐on to Rational System Architect that combines the
power of the reporting system with HTML generation, enabling you to produce very sophisticated websites of enterprise architecture information, with output that can be tailored to different audiences.
ArchiMate ArchiMate offers a common language for describing the construction and operation of business processes, organizational structures, information flows, IT systems, and technical infrastructure. This insight helps the different stakeholders to design, assess, and communicate the consequences of decisions and changes within and between these business domains. An architecture framework is used to structure the concepts and relationships of the ArchiMate language. It divides the enterprise architecture into a business, application and technology layer. In each layer, three aspects are considered: active elements that exhibit behavior (e.g. Process and Function), an internal structure and elements that define use or communicate information.
One of the objectives of the ArchiMate language is to define the relationships between concepts in different architecture domains. The concepts of this language therefore hold the middle between the detailed concepts, that are used for modeling individual domains, for example, the UML for modeling software products and BPMN which is used for business process modeling.
ArchiMate offers a modeling language to create fully integrated models of the organization’s enterprise architecture, the motivation for the enterprise architecture, and the programs, projects and migration paths to implement this enterprise architecture. Using an architecture framework will speed up and simplify architecture development, and communication with non-‐architects, ensuring more complete coverage and understanding of the designed solution. The additional understanding across the enterprise enables faster response to changing business needs.
ArchiMate offers a three-‐layered view
• The Business layer is about business processes, services, functions and events of business units. This layer "offers products and services to external customers, which are realized in the organization by business processes performed by business actors and roles".
• The Application layer about software applications that "support the components in the business with application services".
• The Technology layer deals "with the hardware and communication infrastructure to support the Application Layer. This layer offers infrastructural services needed to run applications, realized by computer and communication hardware and system software".
• ArchiMate also has extensions to the core, consisting of Motivation and Implementation and Migration extensions

5
Each layer "aims to provide a natural way to look at service-‐oriented models. Each layer is self contained despite being a component of the integrated model, and caters to one or more architecture domains".
Objectives
• Understand the implementation of the ArchiMate Framework within Rational System Architect
Get hands on with:
• Creating diagrams (views) and manipulating model content within them • Using the Method Wizard feature to reduce time in understanding and building relationships between
ArchiMate concepts. • Assessing the consequences of decisions and the impact of change using heatmaps • Gap analysis, transition and migration planning activities • Adding temporal states and lifecycles to capabilities, applications, technology and business processes • Understanding how your EA fits within portfolio management in relation to costs, tasks and roadmaps
Scenario
In this Open Day we will use a fictitious Insurance company ‘ArchiSurance’ that is looking to model its enterprise architecture as our example. The company has chosen ArchiMate to do this and the Rational System Architect tool. The System Architect™ toolset allows decision makers, architects and stakeholders to gather enterprise wide information and collaborate on models of the enterprise to understand the impact of change required by business initiatives. The company are hoping to be able to view the domain relationships and better understand the linkages and impact of the changes they wish to make, whilst working out migration paths to take them from the As-‐Is to the To-‐Be architecture. Stakeholders at all levels in the business can then collaborate about transition plans, work packages and roadmaps for strategy, business capabilities, application components and technology.
ArchiMate Implementation within Rational System Architect
ArchiMate like some other notations specifies model-‐view behavior where the view is tied to the model; If the view changes then the model changes, and if the model changes then all of the views which show that part of the model will similarly change. Thus the model and views are kept ‘in sync’.
This behavior applies to both the definitions and the relationships between them. If the details of a definition changes then all views are updated. If a relationship between two objects is created then the model and all views are updated.
In System Architect we can view, create and modify relationships in three ways:
• Via definition properties • Via lines on diagrams • Via the matrix editor

6
The implementation supports the full set of ArchiMate model view types, with an out of the box metamodel for ArchiMate® 2.1, that supports the ArchiMate® standards and exploits the features of IBM Rational System Architect™. The plug-‐in also supports enhanced graphics for the notation, which is scalable, aesthetic shape support, aiding adoption and communication of ArchiMate® to a wider audience.
The first few exercises in the following labs will make use of features in Rational System Architect and the Corso ArchiMate Plug-‐in that aid in adoption and model construction. The later exercises will concentrate on using the features to interrogate and explore the built model and make decisions based upon the findings.
Lab – Roadmapping for Rational System Architect Roadmapping is a fundamental part of strategic planning and enterprise architecture. It allows us to map out the set of actions that are required to move the business from where it is today, to where it wants to be tomorrow. Those actions turn into plans.

7
Roadmapping allows organizations to tie strategy to deliverables using enterprise architecture and to deliver on initiatives that have been prioritized. We have extended the ArchiMate® metamodel to include concepts that support roadmapping. We have also provided viewpoints over and above traditional enterprise architecture viewpoints. These views enable different stakeholders to access the architectural information
With the Corso roadmapping extensions, enterprise architects can collaborate with other communities about transition plans, work packages and roadmaps for strategy, business capabilities, application components and technology
In order to make ArchiMate® pragmatic for roadmapping, we have extended the core metamodel to include both workspaces and work package milestones.

8
Logging In
If not already logged in:
1. Select the ibmclass login account
2. When asked for a password type ibmclass
Windows desktop should load
Opening an Encyclopedia
1. From the desktop, double click the IBM Rational System Architect icon

9
The tool will then open and you will be presented with the following dialog pane
2. Select 'Existing', select the drop down arrow, pick the connection to the WIN-‐LUKVBPI68S8SYSARCH
and when the encyclopedia list is shown, select the ArchiMate_PoT encyclopedia and press OK

10
3. When asked to select a workspace, select the Transition Plan workspace from the list and press OK
1.1 Implementation And Migration
ArchiMate® from the Open Group introduces an ‘Implementation and Migration Extension Metamodel’. The implementation and migration extension is designed to provide concepts that model the transition of enterprise architecture over time. We have extended the ArchiMate® 2.1 Implementation and Migration Extension Metamodel within our ArchiMate add-‐in.
Workspaces
Encyclopedias may be configured to support workspaces. Workspaces are extremely useful for modeling architectures within specific bounds and for modeling current and future states.
• Workspaces are created in a tree structure allowing previous workspaces in the tree to be baselined.
• Child workspaces inherit the views and concepts from preceding workspaces.
• Users can navigate between workspaces at ease and there are also tools for comparing content across workspaces.
With the additional concepts introduced, we can now build a view of our architecture using plateaus and gaps. In IBM Rational System Architect®, we use the Implementation & Migration diagram to represent this view. As

11
each plateau is represented by a workspace, we can use the standard capabilities of IBM Rational System Architect® to show differences between the workspaces and store these against the Gap.
As part of the implementation and migration extension we can start to look at workspaces and what those workspaces represent (plateaus in ArchiMate parlance). Gaps between those plateaus (workspaces) are actually transition plans -‐ from here we can create deliverables that show us the assets we want to create during those transition activities
1. Open diagram of type ArchiMate Implementation and Migration, named 2013 Transition Plan -‐ Pet Insurance
2. Double click the plateau, 2012 ArchiSurance Architecture symbol to open the definition and see the 2013 architecture
3. Click on the Workspace tab

12
We can see that this represents our Baseline workspace for the insurance model inside System Architect
Note: We have full linking and traceability, we can select different workspaces
4. Click the 'Choices' button to see all of the possible workspaces to select 5. See “Baseline Architecture” in the list, right click on this workspace and click on “Details” to see what
they were created for, who created them etc

13
6. Click “X” in the list and OK on the definition to exit out of the definition, without making any changes
7. Now double click the 2013 ArchiSurance Architecture symbol, to open the definition and information behind it

14
We can see in the workspace tab, that this is tied to one potential option for the architecture to transition to
8. Exit out of the definition 9. Double click the 2012-‐2013 Pet Insurance Gap symbol open the definition and information behind it
Multiple gaps can be modeled, as there are various ways architectures can be changed to achieve a successful transition between plateaus

15
Note: behind the gap we can store reference documents, which allows us to make use of some of the default SA tools, such as diagram comparison, graphical overlays -‐ looking at the difference of things over time -‐ we can very easily tie the outputs into the gap between plateaus
10. Exit out of the definition 11. Double click the Create Pet Registry deliverable symbol
This is tied to the 2013 architecture plateau, as an asset we would want to create
Again in here we can physically tie this to deliverables we may be creating as part of the architecture, e.g. powerpoints, word docs etc
12. Exit out of the definition
Behind this we can have child diagrams, that allow you to describe in more detail the process/architecture piece beneath it
13. Right-‐click the 2013 ArchiSurance Architecture plateau symbol and select Attach Child Diagram

16
14. Select 2013 Motivation and then select Attach
The parent symbol now has an extra icon, signifying that there is a child diagram attached
15. Select Yes when asked to Save the diagram

17
16. Once the symbol is selected, the user can then select the Parent > Child button that is now enabled from the toolbar (Note there is also a Child > Parent button)
The child diagram is then opened
Describing in more detail, the projects, work packages that would be involved in the plateau -‐ be they hardware and Operating System upgrades, or enterprise modernization activities. Notice that the requirements that began all of this work are also linked to these deliverables
17. Double click one of the requirements (pink symbols) and see the full traceability offered, back up to the goals that they are trying to fulfill in the architecture

18
Click OK or Cancel to move back to the transition plan diagram
18. Select the Child > Parent button 19. Right-‐Click the Pet Registry work package symbol on the diagram and select Attach Child Diagram
20. Select Pet Registry -‐ projects and click Attach 21. Select yes if asked to Save

19
The child diagram will now be open and we can describe the work package in more detail with a view. In this diagram we can show exactly what we are changing in terms of ArchiMate assets, in terms of business processes, application components and also the change activity that is being carried out -‐ this links directly into the requirements and goals
This diagram shows a complete slice across the model, from a work package perspective, tying things together in terms of date and time.
1.2 Work Packages, Program Timelines and Heatmaps
The Work Packages have also been extended to include the concept of a Work Package Milestone. A milestone represents an action or event marking a significant change or stage in a work package. Each milestone has a date stating its end date.
In the definition for a Work Package, we can specify a list of milestones and their end dates.
An architect can identify a set of standard threads or dimensions that run through all work packages. For each of these threads, there can be a status indicator at any given project milestone. This is achieved using color-‐coding so that stakeholders can tell, at a glance, the status of a given work package at different points in time.
Examples of these dimensions are Cost Savings, Resource Requirements, Risk, Classification etc. We will look at milestones in detail below
Work Packages
ArchiMate concept -‐ Discreet pieces of work/activities with a given start and end time -‐ they can be programmes, projects or tasks
1. Open diagram of type ArchiMate Project, named Pet Insurance Programme
We are now detailing the work packages and the deliverables within those work packages

20
2. Double-‐click the Work package 'Insure your pet campaign' to see the underlying definition
3. If there are no dates entered, enter 2/1/2013 into the Start Date field, and enter 12/1/2014 into the End Date field
21
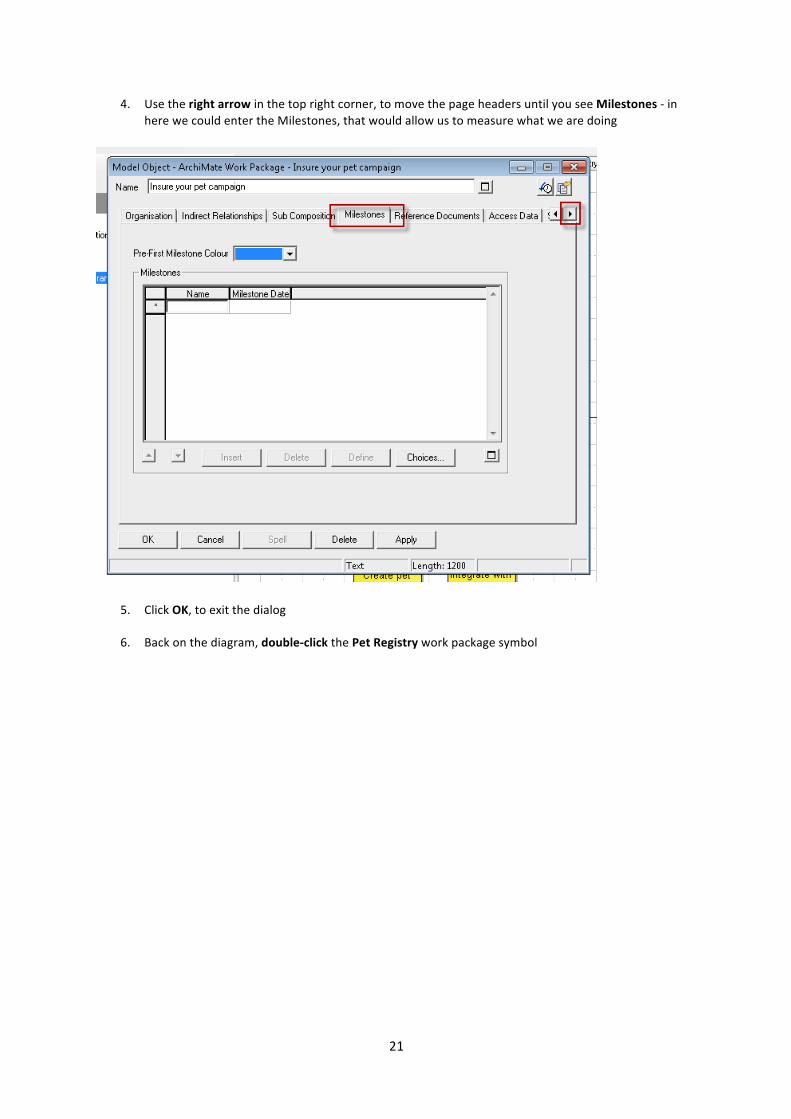
4. Use the right arrow in the top right corner, to move the page headers until you see Milestones -‐ in here we could enter the Milestones, that would allow us to measure what we are doing
5. Click OK, to exit the dialog
6. Back on the diagram, double-‐click the Pet Registry work package symbol

22
7. Again, notice the start and end dates 8. Navigate to the Milestones page
Here we can see that there are many milestones derived -‐ they have a name and a given milestone date
Note: Milestone list does not need to be in temporal order
9. Press Ok, to exit the dialog

23
Timelines
Timeline -‐ Represents a work package at any given moment in time
A new diagram type has also been included to allow users to visualize these milestones within the context of work packages.
A Program Timeline diagram contains a series of ArchiMate® Work Packages. The Work Packages are organized vertically and show their milestones along the horizontal access. Each milestone is represented as a pie chart and its position along the axis is denoted by the date value in the milestone. Each segment of the pie chart is colored to reflect its thread/dimension value selections.
1. Open the diagram of type Programme Timeline, named '2013 Projects'
What you will see is that each horizontal bar on the view represents a work package over time (left to right)

24
Note: you may want to use View > Zoom > Actual Size from the toolbar to see the work package names

25
We can see Pet Registry that we have been working on...
2. Double-‐click the Pet Registry Line symbol (accesses the same underlying definition) and navigate to the Milestones page
3. In the list we can see that Registry Execution is set for 01/01/2013

26
4. Select the milestone and then select the Define button -‐ we can take a look inside this milestone
One of the things included in here is a thread -‐ the milestone is represented by a pie-‐chart and the segments are the threads -‐ the threads are completely customizable by the user, they reflect Business/IT values that are important to your company -‐ threads can be customized by quantity, value, or line of business they represent
5. If you change the values, using the drop down arrows, the colors of the threads on the pie-‐charts will change when the 'Apply' button is pressed. The change is reflected here in the definition, you will also see the color of the pie segments changed in the diagram, to reflect the modified state for the Threads you changed.
6. Use View > Zoom > User Area from the toolbar

27
We can see that the view has been set to show a set timeline...Along the bottom of the screen is a legend that shows the intervals
7. Double click the Timeline symbol to edit it -‐ Specify your own start and end date and pick a Quarter Interval

28
8. When you press OK the diagram will change itself to show the milestones within that date range
Note: The arrow allows us to identify dependencies between milestones
Costing -‐ Work packages allow you to perform calculations
9. Open the ArchiMate Project diagram, named Pet Insurance Programme

29
10. Open the deliverable definition, for 'Create campaign'
11. Navigate to the 'Costs' tab
In here we can set the budgeted cost and the actual cost -‐ this is do-‐able for each deliverable -‐ These costs can be manually entered into System Architect or System Architect/XT, imported from MS Excel, or by form-‐based data capture
12. Exit the definition

30
13. Double click the work package 'Insure your pet campaign' symbol to open the definition 14. Then navigate to the 'Costs' tab
Cost analysis can be performed on Work Packages and Deliverables. An analytical function adds the actual costs of the Deliverables realized by a Work Package and compares the result with the budgeted cost to highlight Work Packages over budget.
This can be done by simply selecting ‘Tools > ArchiMate > Road Mapping Tools > Calculate Work Package Costs’ from the toolbar – The deliverable costs are then searched for, rolled up and the comparisons drawn – If costs or budgets change, then the function from the toolbar can be used to re-‐do the calculations and draw the comparisons again
This is useful from a modeling perspective, an architectural viewpoint, because we can tie it to heatmaps -‐ automatically in our heatmap, we can see which of the work packages are on track, over budget etc
15. Open the diagram of type 'Explorer', named 'Project Dashboard'

31
Shows a dashboard of our work packages -‐ Work packages calculated as being over budget are shown in red
16. Select View > Heat Map Manager
The heat map manager opens and shows the analytics that can be run
Note: Analytics are configurable by end users
17. Click the analytic check box Work Packages that are out of budget and then select the Apply selected Analytics option to run it on the diagram
Notice if any of the Work Package change status when the analytic is re-‐run… Note to Leigh, the analytics have already been applied in the POT database.

32
1.3 Method Wizard
Method wizard aids in the creation of model content, guiding users through creating some complex relationships (direct and indirect), when they may not fully understand the model
1. Select File > Select Workspace
2. Select the 'Option One' under Target State Architecture workspace and click OK
This workspace shows one potential architecture implementation for the Target State Architecture

33
3. Open the diagram of type 'ArchiMate Application Usage', named 'Application Usage View'
This is a view that shows us how we are using our application components
To understand how the Method Wizard works, click on Help and then ArchiMate Help from the toolbar, and then click on ArchiMate 2.0 Metamodel. Click in the right page and scroll down to show the Business Layer of ArchiMate. Notice that a Business Object can be directly connected to a Business Service but a Business Object cannot be directly related to a Business Role. To show a Business Object is related to a Business Role the modeler can choose to use direct relationships but to do that the modeler is required, per the ArchiMate Specification, to add a Business Service, directly connect the Business Object to the Business Service with an ‘Accesses’ relationship, and then directly connect the Business Service to a Business Role with a ‘Uses’ relationship. If the modeler does not want to show the Business Service in the model, the modeler can simply use an Indirect Relationship between the Business Object and the Business Role thereby keeping the diagram cleaner. Direct Relationships to intermediate objects are created behind the scenes, but they are not show in the model. Close Help and continue.
At the bottom of the screen just opened, are application components, flowing up into the application services that the application provides and then which business services these provide in the top layer
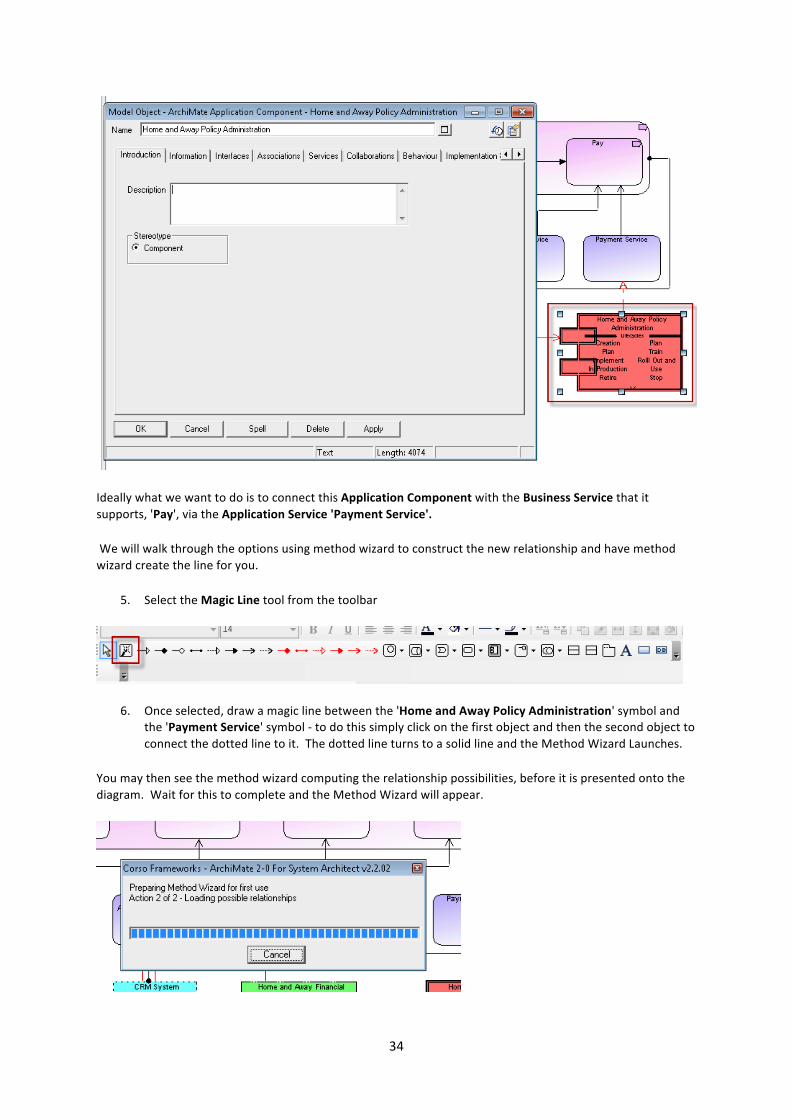
4. Double-‐click the 'Home and Away Policy Administration' symbol so that we can view the information underneath it
34
Ideally what we want to do is to connect this Application Component with the Business Service that it supports, 'Pay', via the Application Service 'Payment Service'.
We will walk through the options using method wizard to construct the new relationship and have method wizard create the line for you.
5. Select the Magic Line tool from the toolbar
6. Once selected, draw a magic line between the 'Home and Away Policy Administration' symbol and the 'Payment Service' symbol -‐ to do this simply click on the first object and then the second object to connect the dotted line to it. The dotted line turns to a solid line and the Method Wizard Launches.
You may then see the method wizard computing the relationship possibilities, before it is presented onto the diagram. Wait for this to complete and the Method Wizard will appear.

35
The wizard is looking at the ArchiMate metamodel and telling us that there are 4 ways to connect this application component to the application service, how do you want to do it?
7. Select the Indirectly Realizes relationship from the choices in the Indirect Relationships Menu. 8. Clicking Next will allow you to choose the how to build the relationship.
First choose how the model will be affected
Options are to just draw the line, populate the diagram with new objects that you can name, or dummy objects that we can fill in later, or to allow the user to select valid existing objects from within the model
9. Select Create or select valid objects and leave checked Create and draw the indirect relationship, then click Next

36
The full path of objects and the relationships between them is now shown. We can now select which objects in our model we wish to connect in the path.
10. Clicking on a symbol in the path will drop down the object selector for that object type, Application Function in this case.
Below, see that the Method Wizard presents a list of existing objects in the model of that type. Those with existing connections to adjacent objects in the path are shown at the top of the list with an indicator to show which object it is connected to. This is a huge value for the modeler because without the wizard, not only would the user need to know the valid relationships but would also have to go search for instances of that relationship in the repository and know which of those use which object types.
11. Click on the Application Function object – per the ArchiMate Specification, this has been identified a way of resolving the path between the two objects. It is a best practice to use Direct Relationships between objects that can be directly related. As stated however, the modeler may want to keep the diagram cleaner by using Indirect Relationships. In this case, the ArchiMate Specification requires

37
Application Components be related to Application Functions, and that those be directly connected to Application Services. Using the Method Wizard, the modeler does not need to know that!
12. Select the Application Function, 'Policy Creation' and then click Finish

38
The new indirect relationship can be seen on the diagram (red arrow). Note Policy Creation is not added to the diagram, keeping the diagram cleaner. See the picture to the left below. -‐ This is how we asked it to be represented, with the red line showing that it is an indirect relationship, via another object. If you open the Application Component Definition you would be able to see the Indirect Relationship to Policy Creation, but for this model, that is kept behind the scenes... Alternatively, we could have asked the Method Wizard to add the Application Function to the diagram, presenting the precise ArchiMate depiction, placing it in between the objects it is connected to, and connected with Direct Relationship Lines as shown to the right here.
It is easy to see this is a useful tool as part of roadmapping and building models, as the full relationship is drawn without the user having to refer to the ArchiMate Specification and without having to run a number of reports on the existing model. This unique feature saves 30-‐50% of an architects' effort and delivers much the same improvement in model quality
13. If we were then to open the 'Home and Away Policy Administration' symbol (by double-‐clicking), navigate to the 'Indirect Relationships' tab, we would be able to see the 'Payment Service' now listed, as an indirectly realized application service

39
1.4 Lifecycle States and Application Roadmap Reports In order to fully support the ability to heatmap and produce lifecycle states for architecture artifacts over time, we have introduced lifecycle states to concepts in ArchiMate®
Although we have included lifecycle states for several objects, or concepts, you may freely add these to other objects inside IBM Rational System Architect® where it is applicable to you.
Two lifecycle state properties have been added to the ArchiMate® Application Component concept (completely configurable). The lifecycles on the left correspond to ‘Deployment lifecycles’ and those on the right to ‘Usage lifecycles’.
Deployment lifecycles map to the ITIL deployment lifecycle states. In most organizations however, we find that the names of these vary and therefore these can be modified in IBM Rational System Architect®. As users interact with products or services, they proceed through a series of steps called the usage lifecycle. The usage lifecycle is a mapping of the user’s actual usage as opposed to the IT deployment view of the world
There is a set of included heatmap reports that will change either the pen style or color of the concepts in ArchiMate® that have lifecycle properties. In the next example, you can see that Deployed, Retired setting is used for the Application Components that have a deployment lifecycle state set to Retired for 2013.
The Application Roadmap Report provides an overview of the application state that supports a specific Business Role, Activity or Service. The document includes a timeline showing the lifecycle states for each application and any relevant milestones.
Lifecycles
An important part of roadmapping is the ability to show lifecycles for particular objects
Deployment -‐ Related to IT, how are we really deploying those assets? -‐ Birth, Planning, Implementation, Production, Retired
Usage -‐ The business view of the world -‐ may have a different view of the application -‐ Plan, Training, Available, Decommissioned, Sunset
1. We are still working on the diagram of type 'ArchiMate Application Usage', named 'Application Usage View' (if closed re-‐open it from the Explorer)
2. In the Explorer pane, expand the 'Definitions' section and navigate until you see the 'Lifecycle' object type

40
Here you can see all of the lifecycles available -‐ they are definitions inside the repository, so names can be changed and properties altered
3. Double-‐click the Decommissioned instance to open it
Notice the lifecycle type is set to Usage and there is a description for use -‐ this is when an application is deemed as decommissioned in the usage scenario, most likely a business view of the world
4. Exit the definition
Back in the diagram, notice the application components at the bottom of the page – notice both types of the lifecycle states are displayed on the Application Objects (these can be turned off)

41
5. Double-‐click on the 'Document Management System' Symbol and navigate to the 'Lifecycles' tab in the definition dialog that opens
In here we can see the lifecycle stages
Notice the name can be different from the type of lifecycle that it is -‐ this is critical as it allows users to have different views of the underlying lifecycle status but it tied to the same lifecycle to facilitate reporting and viewing
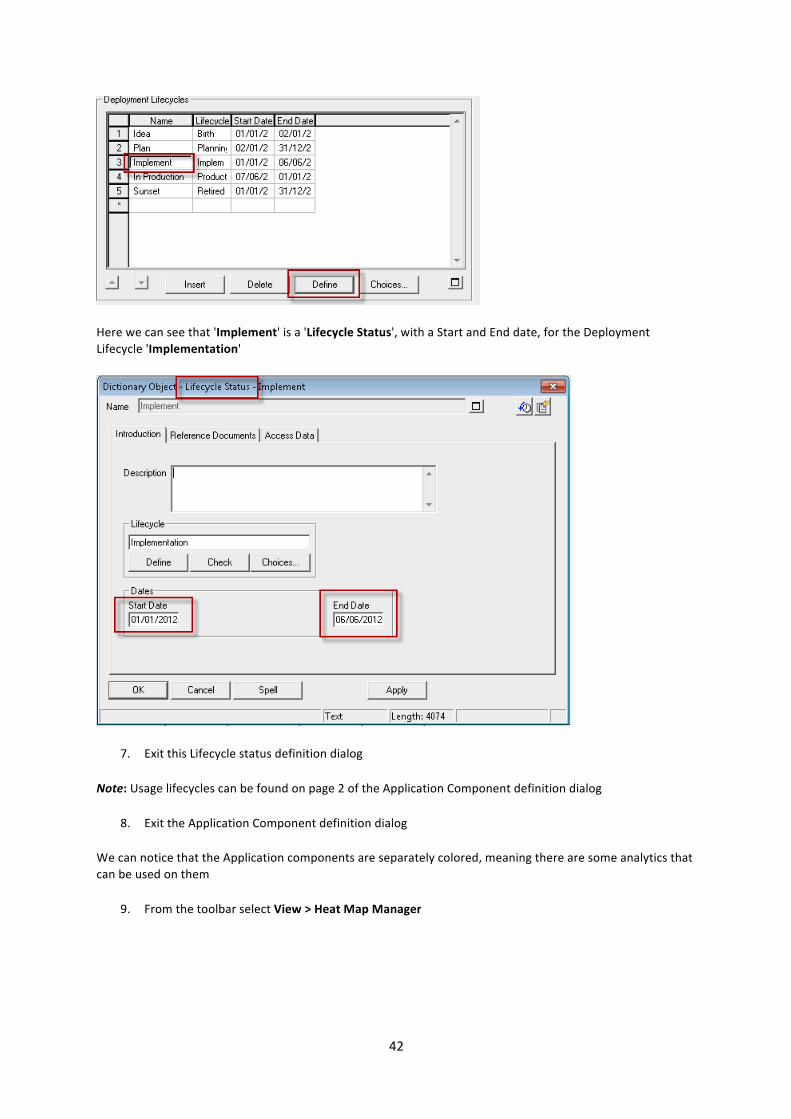
6. Select the 'Implement' name and then choose 'Define'
42
Here we can see that 'Implement' is a 'Lifecycle Status', with a Start and End date, for the Deployment Lifecycle 'Implementation'
7. Exit this Lifecycle status definition dialog
Note: Usage lifecycles can be found on page 2 of the Application Component definition dialog
8. Exit the Application Component definition dialog
We can notice that the Application components are separately colored, meaning there are some analytics that can be used on them
9. From the toolbar select View > Heat Map Manager

43
What we do here is to use a view (defined for 2013 concept lifecycle states) and identify the lifecycle states in 2013 using colors and pen styles of the box
Separate views can be defined for 2014 and 2015 lifecycle states as well
Looking at the model we can see that the Document Management System (Green) is Available in 2013, whereas Home and Away Policy Administration (Red) is in Plan for 2013 -‐ we are looking at a timed view of the world from the business side
10. Select the 'Analytic Builder Wizard' option (this is where analytics can be created or edited)
11. Click the 'Select an existing analytic to edit' option, scroll down the list until you see 'Deployment Planning', select it and click Next

44
The associated report will be selected -‐ We cannot edit the Analytic Report from here, as it is a complex report -‐ we would need to use the System Architect Explorer
Note: If you do click Edit here, you will see the below error -‐ just press OK and continue
12. With the 'Select an existing analytic to edit' option still selected, scroll down the list until you see ‘Concepts in Deployment Planning for 2013’, select it and click Next

45
13. Press Next to continue -‐ In here we can see that the Pen Style for planning is set to a thick unbroken line
14. We can see this on the diagram, 'Home and Away Policy Administration' is also in 'Deployment Planning' lifecycle state for 2013, from an IT perspective -‐ identified by the solid black line around it
15. Exit out from the builder wizard, press Yes when asked if you want to quit
Differentiating in Pen styles and colors allows us to see any existing gaps between the IT view and the business view of the applications

46
Note: We have looked at this graphically through heatmaps, the other way we could have looked at this is through tabular reports
Creating Application Roadmap Reports
We will now look at how we can represent our timeline in a different format, using an Application Roadmap Report, that will run through identified relationships in the meta-‐model, from the ArchiMate object that we select, down to the indirectly related Application Components to report on their lifecycle states. Options to choose from consist of:
• ArchiMate Product • ArchiMate Business Service • ArchiMate Business Activity • ArchiMate Business Collaboration • ArchiMate Business Role
If we begin with an ArchiMate Product, then it could be an Aggregation of Business Services, which in turn, are either Used By or Realize Business Activities, which then have assignments to Application Components. The name of the selected Product will appear in the Report Title, the Business Services and Business Activities will be listed in the Associated Concepts column, and the Application Components listed in the roadmap. Each Application Component could have a relationship to a Lifecycle Status definition (Deployment or Usage) that is associated with a Lifecycle, listed in the Roadmap Key. The Start Date and End Date of the Lifecycle Status will determine the coloring of each of the 'year quarter' cells in the roadmap. Should the Application Components have any related Work Package Milestones, they will be prefixed by a number and listed in the Milestones column, and the number will appear in the appropriate cell of the roadmap.
1. Navigate to the 'Option One' workspace

47
We will navigate through the definitions and relationships as the report will do, and see the model information that will be returned to us
2. Expand the Definitions section in the Explorer pane and expand the ArchiMate Product section
3. Double click the Pet Insurance product to open it 4. In the Services tab select the 'Pet Registry' Service in the 'Is Aggregation of Business Services' list
and select Define

48
5. In the ArchiMate Business Service definition dialog, navigate to the Behavior tab and select the Manage Pet Records Activity in the 'Realized By Activities' list and select Define
6. In the ArchiMate Business Activity definition dialog, navigate to the Applications tab and select the Pet Registry Application Component in the 'Assigned to Pet Registry Application Components' list and select Define

49
This application component will be listed within the roadmap report, as it is indirectly related to the ArchiMate product that we started with
7. In the Application Component definition dialog, use the right arrow key to scroll along until you find the 'Lifecycles' tab
8. Select the Lifecycles tab and we can see the Deployment lifecycles defined for this application component
9. The Birth Lifecycle State of the application component is 1/1/2013 until 15/06/2013 -‐ We can see that the 2014 value, the Implementation lifecycle state is from the 1/1/2014 until 15/06/2013 – so we can keep an eye out for these states on our Roadmap report

50
We can also associate work package milestones with our application component, so that this information can also be displayed on our roadmap report – We can then see which lifecycle state our supporting application components are in, when a milestone is reached, as part of an ongoing defined work package
10. Scroll to page 3 of the tab 11. Select the Choices box underneath the Milestones list, select and drag the 'Support for
PetRegistry' milestone into the Milestones list and select OK -‐ This should now show up on our roadmap report

51
12. Select the Support for PetRegistry' milestone in the list and then select Define

52
13. In the dialog box that opens enter the date 06/06/2013 into the Milestone Date field and then select ok...Select OK to close all of the open dialogs

53
We will now run the report and view these in graphical form
14. Select the Reports menu and then select ArchiMate Excel Reports, followed by Application Roadmap Report
a. Ensure ArchiMate Product is selected in the Concept type drop down box b. Select Pet Insurance in the Concept definition drop down box c. In the 'Excel Application RoadMap File:' field, select the '...' button d. From the drop down arrow, navigate to C:\Program Files (x86)\IBM\Rational\System
Architect Suite\ArchiMate For System Architect and select the Corso ArchiMate Roadmapping Deployment template v3.0.01 that we want to use
e. Once selected, press OK -‐ The selections should match the image below
f. Select Yes when asked if you want to continue g. Select the year to be 2010 when asked and press OK

54
The lifecycle states are color coded so that changes in states can easily be seen. We can see that as expected the Pet Registry application component is in the Birth and planning lifecycles state in 2013 and then into Implementation in early 2014, as we saw in our model dialogs – The milestone that we added, for the work package the application is supporting, can also be seen in the planning lifecycle stage. Milestones are shown on the report as cell comments, hover over one to see the milestone name
Please close out the roadmap and if asked to save, select NO
1.5 Explorer Diagram
We use the Explorer view/diagram to explore the model we have already built, viewing the relationships between objects e.g. to see which Business Service may have an issue, based on the state of a metric in one of the underlying Applications that support the Business Service. In this example we will start with Business Services and break out across activities to components.
1. Right-‐click in the Explorer pane, on the 'Explorer' diagram category and select 'New'

55
2. Give it a name 3. Select Network Style in the drop down box (to show ArchiMate symbols and relation lines between
them). Choosing Landscape Style here builds Explorer Diagrams that reveal relationships as box in box views, rather than by using lines. Please use Network style for this exercise.
4. Right-‐click on the empty diagram and select 'Diagram Properties' 5. Select the 'Network Style Properties' tab and change the 'Maximum Relatives In Expansion' property
to 20
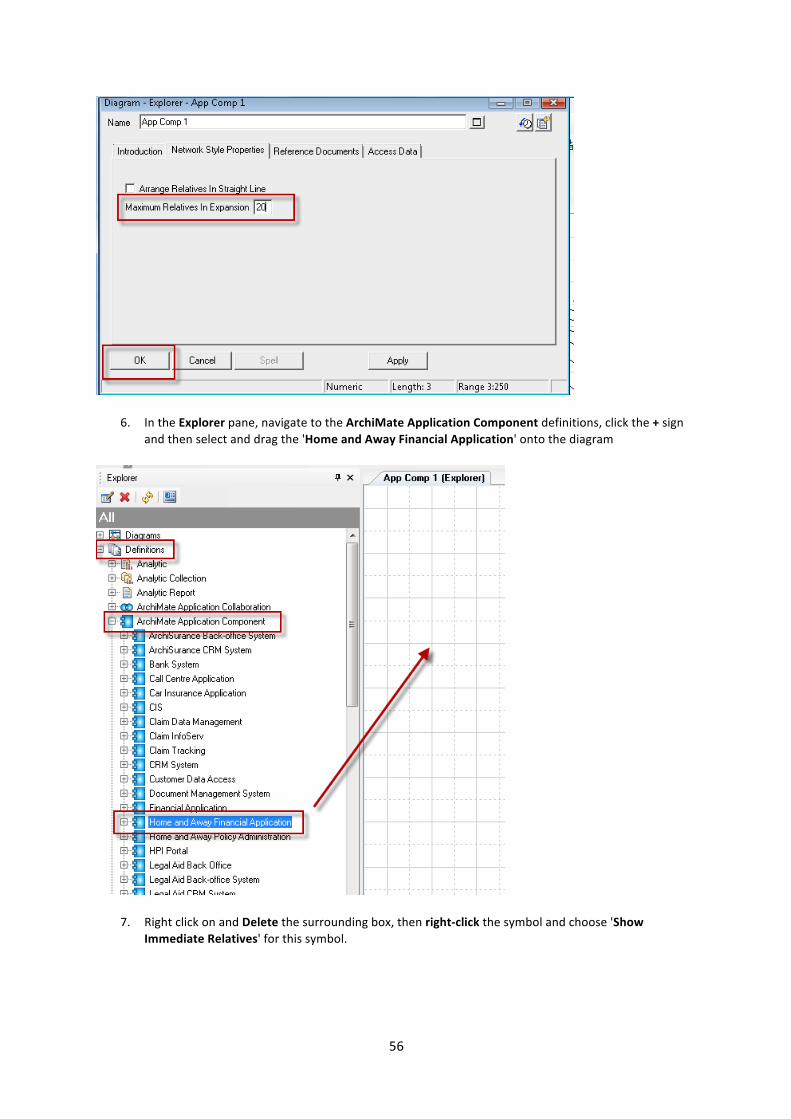
56
6. In the Explorer pane, navigate to the ArchiMate Application Component definitions, click the + sign and then select and drag the 'Home and Away Financial Application' onto the diagram
7. Right click on and Delete the surrounding box, then right-‐click the symbol and choose 'Show Immediate Relatives' for this symbol.

57
Note: You may want to use View > Zoom > Used Area from the toolbar to see the expansion of the related objects
Notice the diagrams the Home and Away Financial Application is used in, the lifecycle statuses it uses, the System Nodes it is realized by and the work packages it is part of
8. Find the 'Legacy Outphasing' Work Package symbol -‐ Right click the symbol and select 'Show Immediate Relatives'

58
We can see the application components and the Nodes that may be outphased as part of this work package...The lifecycles and the milestones are both available to see on this diagram. This is another way of representing the timeline information we looked at earlier
Summary
This is roadmapping inside Enterprise Architecture (roadmaps, timeline diagrams, transition plans, lifecycles, plateaus and gaps) -‐ we can also look at it inside Portfolio Management Views (investment scenario) , to answer questions like these:
-‐ What are the things to concentrate on from a prioritization viewpoint

59
-‐ What are the things to concentrate on from a resource-‐planning viewpoint
System Architect integrates with IBM Rational Focal Point (PPM) -‐ We can take our work packages and export them to Focal Point, allowing us to make strategic plans and think about Application Portfolio Management and prioritization.
ArchiMate® has provided the core building blocks for roadmapping. Although not complete without the Corso extensions, ArchiMate® finally allows enterprise architects to model transition plans, work packages and time in a coherent manner.
For more information on any of the features or tools you have used, please go to www.corso3.com