cotton quality evaluation - texas tech university quality evaluation: testing methods and use, by...
TRANSCRIPT
United States Department of Agriculture Cotton Quality
Economic Research Service Evaluation ERS-668
Testing Methods and Use
Edward H. Glade, Jr. Keith J. Collins Clarence D. Rogers

COTTON QUALITY EVALUATION: TESTING METHODS AND USE, by Edward H. Glade, Jr., Keith J. Collins, and Clarence D. Rogers, National Economics Division, Economic Research Service, U.S. Department of Agriculture. ERS-668.
ABSTRACT Cotton quality characteristics are increasingly measured by instruments rather than manually. Increased competition in the industry, consumer demand for a wider range of products, and more stringent standards for product use have prompted more intensive fiber quality examination. Over 92 percent of textile firms surveyed own one or more fiber testing instruments. Ninety percent own instruments for testing fineness and maturity, 70 percent for measuring length and length uniformity, and 60 percent for determining fiber strength. This report presents information on the determination and use of cotton quality measures, and the development of high volume instrument testing systems.
Keywords: Cotton, quality measurement, fiber properties.
NOTE Use of company names in this publication is for identification only and does not imply endorsement by the U.S. Department of Agriculture.
Washington, D.C. 20250
November 1981
111

Page
CONTENTS SUMMARY .............................................. v
INTRODUCTION. . . . . . . . ............ . . . ..................1
DEVELOPMENT OF COTTON QUALITY TESTING...... . . .. . ..... 2 Changing Needs for Cotton Testing .................. 2 USDA and Cotton Industry Testing Efforts........... 3 Quality Measures and Cotton Marketing.............. 6
COTTON FIBER PROPERTIES AND PROCESSING PERFORMANCE... 8
Grade. . . . . . . . . . . . ......... . . . . . . . . . ........... . . . . 8
Staple. . . . . . . . . ................ . . . . . . . . . . . . . . . . so.. 9
Character........ .................................. 9
CURRENT TEXTILE INDUSTRY TESTING PRACTICES........... 11 Scope and Method of Analysis....................... 11 Fiber Property Testing Methods ................... .. 12 Ownership of Testing Instruments................... 13 Importance of Each Fiber Property.................. 15 Use of Specific Fiber Properties. .................. 15 Relationship of Fiber Property Use to
Instrument Ownership............................. 19 Confidence in Instrument Values Versus Traditional Cotton Classing. .. . .. . .. . . .. .. .. ..... 20
INSTRUMENT TESTING SYSTEMS AND USDA COTTON CLASSING.. 20 Current HVI Testing....................... . . . ...... 20 Implementation Considerations....... .. .... . ........ 22
REFERENCES............................. ..... ......... 24
iv

SUMMARY Increased competitiveness in the textile industry has pushed cotton quality measuring methods toward increased mechanization and a more thorough examination of cotton quality characteristics.
Technological advances in textile production and more stringent standards for product quality have sharpened the importance of the relationships between processing costs and fiber quality. Along with traditional grade and staple information, the cotton industry now uses measurements of fiber fineness and maturity, length uniformity, strength, and nonlint content of the sample to describe fiber quality. Cotton quality determination has now progressed from human assessors to high volume instrument (IIVI) systems.
This report traces the development of cotton quality testing, provides a description of the measurable fiber properties and how they relate to processing performance, and presents the results of a survey of textile mills to determine current use of quality information and the extent of instrument testing for determining cotton quality.
All textile industry firms surveyed in 1980 reported using fiber property measures in some phase of their operation, and over 92 percent of those firms owned one or more fiber testing instruments for making quality evaluations. The extent of instrument ownership increased with firm size, triggering a wider range of goods produced and the corresponding need for additional fiber quality data.
Textile mills indicated that the fiber properties of length, fineness, and maturity, and the elements of grade are the most important properties.
Of the 40 textile firms surveyed, 90 percent reported owning instruments for testing fibers for fineness and maturity, 70 percent for measuring both length and length uniformity, 60 percent for determining fiber strength, and 45 percent of the firms owned instruments for measuring the nonlint content of samples. A surprisingly high 67.5 percent of the respondents indicated ownership of other instruments, primarily for determining neps (tangled masses of fibers) in cotton samples, and equipment for estimating sugar content.
Textile firms reported using fiber property values for mixing and blending fiber, purchasing specifications, maintaining quality control, and screening fibers for other mills in the same firm. The mixing and blending of fibers is one of the most critical operations in textile processing with nearly 93 percent of the firms using fiber property measures for this purpose.

Use of fiber property measurements in the other areas of application included: purchasing, 80 percent; maintaining quality control, 70 percent; and screening fibers, 42.5 percent.
vi

Cotton Quality Evaluation Testing Methods and Use
Edward H. Glade, Jr. Keith J. Collins Clarence D. Rogers*
INTRODUCTION Knowledge of cotton quality is a necessary component of an efficient marketing system. Because cotton exhibits such wide variation in fiber properties among samples, effective description and measurements of these properties are essential.
The use of quality information by textile mills enables management to develop optimum blending levels which reflect the best combination of fiber properties required for each end-use. For cotton producers, premiums paid for qualities most in demand and discounts for undesirable qualities provide an incentive to growers to produce those qualities that have the highest values to manufacturers and consumers of textile products.
Official USDA cotton quality classifications measure three factors: grade, staple, and micronaire (10). 1/ Grade depends on the color, trash content, and preparation (smoothness) of the sample. Staple is the average length of the individual fibers. Micronaire is a measure of fiber fineness and maturity. However, other fiber properties are also recognized as being important and are increasingly being measured by instrument testing.
This report traces the development of cotton quality testing; provides a description of the measurable fiber properties and how they relate to processing performance; and presents the results of a survey of textile mills to determine current use of quality information and the extent of instrument testing of cotton for quality determination.
*Glade and Collins are economists in the National Economics Division, Economic Research Service. Rogers is an economist, Cotton Division, Agricultural Marketing Service, Clemson, S.C.
1/ Underlined numbers in parentheses are cited in the References section.
1

DEVELOPMENT OF Grade and staple have been factors in quality determination COTTON QUALITY of cotton for a long time; micronaire became part of the TESTING official classification system during the sixties. Other
factors, such as fiber strength and length uniformity, have also been used to evaluate cotton quality. These other factors, together with micronaire, determine the character of the cotton.
Changing Needs for Cotton has been used in textile manufacturing for thousands of Cotton Testing years. Over time, manufacturers came to realize some qualities
of cotton behaved much differently from others during the manufacturing process; disparities in performance ultimately led to systems of describing cotton quality. Cotton grading apparently began in Liverpool, England, about 1800 (5). The grading system, which assigned names to grades, was used by merchants and spinners. The system, however, only approximated quality measurement because many differences existed in grade perception as cotton passed through the marketing process, so classed cotton often was not uniform in grade.
Early cotton classers could not grade consistently because of many genetic differences of cotton fibers. Even for a given cotton type, quality varies with climate and cultural practices, such as chemical treatments, irrigation, degree of defoliation, and exposure to the elements. At harvest, cottonpickers and strippers can damage and contaminate fibers. Cleaning and drying equipment at the gin, transportation and handling on the way to the mill, and cleaning equipment at the mill all can cause quality variability and deterioration.
The growth in more stringent standards for end-product quality, as dictated by consumers, has been an important element in establishing the relationships among classes of cotton, spinning performance, and product quality. Technological advances in textile production have sharpened the importance of the relationships between processing costs and fiber quality. Poor quality fiber results in higher waste levels, increased ends down (interruptions in the yarn formation process), and more seconds in finishing operations. Manufacturers must have detailed fiber quality information to keep pace with ever-increasing processing speeds and to assess elimination of some intermediate processing steps.
Technological gains in textile production have been significant. For example, in ring spinning, spindle speeds for manufacturing a typical yarn have grown from fewer than 4,000 revolutions per minute in 1940 to more than 12,000. Weaving gains have been just as dramatic. Loom speeds have surged from fewer than 100 pics per minute (ppm) 20 years ago to 125 to 200 on the current shuttle looms. Speeds are near 300 ppm on rapier
2

looms. Although they do not use cotton, the new water jet looms indicate future technological developments of speeds of 700 to 1,000 ppm. Ends down and the product seconds that result from fiber quality considerations have become more critical under such technological advances.
Different end-use requirements, such as yarn strength and yarn and fabric appearance, require different fiber qualities. The ability of a fabric to hold dyes, as well as recently developed finishes such as shrink resistance, flame retardance, and durable press, depend on fiber qualities. For given product requirements or spinning characteristics, a textile producer may not be able to obtain all the raw fiber qualities needed when buying a particular genetic cotton type from a given location. Quality of a cotton variety can vary from farmer to farmer and vary tremendously from year to year. In such instances, quality measures become the basis for a recipe of sorts--the textile producer blends, or lays down, mixes of various types of cotton to obtain a specific quantity of cotton with the requisite quality measures.
Textile producers have not been alone in their interest in cotton quality measurement. Cotton shippers and merchants also use quality measures to fill textile mill orders with even-running bales, or bales of the same grade and staple. Farmers and ginners demand more and better quality measurement, using such information to improve cotton quality with better growing, harvesting, and ginning methods. Quality measures have also become a marketing tool for the farmer, enabling farm prices to better reflect fiber quantity characteristics and product value.
Quality testing has also been important to researchers. For example, geneticists use quality measures as guidelines for developing improved cotton varieties. USDA and industry researchers employ existing quality measures to develop new measures and tests to establish relationships between fiber and end-product qualities.
USDA and Cotton Grades for upland cotton were first established in 1909 with the Industry Testing preparation of quality standards for nine white grades (U). Efforts However, these grades were never widely used and were replaced
in 1914 by the U.S. Cotton Futures Act's Official Cotton Standards. These standards were revised and became binding with the U.S. Cotton Standards Act in 1923. Standards for staple length and grade standards for American pima cotton were first established in 1918 under authority of the Futures Act.
3

The 1923 Standards Act made the use of the official standards mandatory in interstate and foreign commerce unless the cotton was sold from actual samples or private types (purchasers buy directly from farmers and conduct their own testing). The standards were soon accepted by foreign countries and the name, universal standards, was approved. Since the early twenties, revisions of the standards have continued, with the last major revision coming in 1962. The goal of the revisions was to develop standards that are useful from a product perspective, can be uniformly applied, and are related to stable and measurable quality factors.
Quality testing traditionally has been based on human inspection. With the introduction of the official standards, visual quality determination was aided by the development of practical forms. For grade determination, a practical form is a number of boxes, each containing samples of the same grade. A classer then grades by comparing cotton to be classed to the practical forms. For staple length determination, a practical form is 1 pound of cotton of a given staple length. A classer may then compare cotton to be classed with some pulled from the comparable staple length form, using both sight and touch.
The 1937 Smith-Doxey Amendment to the Cotton Statistics and Estimates Act helped make USDA classing the most pervasive quality testing procedure in the cotton industry. With passage of this amendment, USDA began providing free classing services to cotton growers at their request in an effort to motivate growers to improve quality. The importance of this service is reflected in more than 97 percent of the cotton crop being USDA classed.
Research directed at refining standards, reducing human classing errors, identifying exactly what factors describe a particular cotton, and explaining why that cotton performs the way it does has resulted in refinement of existing standards, creation of new standards, and the invention of instruments that help determine grade, staple, and character of cotton (6).
One of the earliest instrument inventions, the Suter-Webb Sorter, measured the relative quantities of different fiber lengths and length uniformity contained in a sample of a particular cotton. Growth in instrument invention and refinement has surged since the twenties. Early Government and private research indicated that fiber fineness and maturity were closely related to product quality. This was reflected by increased demand from mills for cotton having these properties within a specified range. Fineness and maturity of individual fibers are indicated by micronaire readings taken from airflow instruments. The importance of the micronaire measure and the
4

confidence in instruments to perform accurately was indicated by addition of this fiber property measure to the official USDA cotton classification system. Micronaire readings became part of the Smith-Doxey service beginning with the 1966/67 season.
Instruments are the primary tool for assessing production efficiency and product quality in both USDA and private industry. USDA instruments are used to improve classer accuracy, prepare standards, and provide measures, which are not part of the official classification system, on a fee-for-service basis. For private industry, instruments have been used to grade, measure staple, ascertain character, provide a check on quality of cotton delivered, and aid product manufacturing and quality (I)
Information on USDA research in the relationships between raw fiber properties and product has been published annually since 1946 in the Agricultural Marketing Service's (AMS) Summary of Cotton Fiber and Processing Test Results.
Instrument evolution has reduced the cost of using instruments. USDA and private industry have been cooperating to develop and implement a high volume instrument (HVI) testing system. This system represents a move from primary emphasis on humans in the current USDA classification system to emphasis on instruments.
Test instruments were first demonstrated by USDA in Lubbock, Tex., and Memphis, Tenn., in 1968, to evaluate their capacities to perform high volume, or production line, testing under several arrangements (7). By the seventies, the instrument test line was able to provide measures of color, fiber length, fiber fineness and maturity, length uniformity, and strength. Trash content is visually determined, and a numerical trash grade index is recorded with the other test line measures.
The Secretary of Agriculture created a National Cotton Marketing Study Committee in 1974 to provide recommendations on various cotton industry issues (4). One recommendation, approved by the Secretary, called for funding of a comprehensive field evaluation of the instrument test line in a classing office environment. The test began in 1976 in Lubbock, Tex. In preparation for the test, USDA worked with the test line producer, Motion Control Inc., Dallas, Tex., to refine the line. Two test lines were installed, and almost 61,000 bales were classed during the 1976 crop year.
During the 1976 to 1979 crop years, 50,000 to 70,000 bales were classed on the HVI system each year in the Lubbock laboratory. The instrument test line was accepted by USDA with the establishment of an ANS office in Lamesa, Tex., in 1980. This
5

office classed about 300,000 samples of 1980-crop cotton. Manufacturing interest in test lines increased when the instrument test line moved out of the laboratory and into the classing offices and textile mills.
The move toward automated instrument test lines reflects, in large part, increased economies of scale. For example, using the Pressley strength tester, one operator can test 100 samples in a workday employing two specimens per sample. The three operators running an instrument test line can perform tests of strength and other factors on 600 to 800 samples. Most measures are now an average of the reading results on four specimens per sample.
Economics is only a partial motivation for instrument use. Providing additional quality measures such as strength and length uniformity for the farmer, merchant, and mill buyer should assist their marketing decisions. For the cotton industry, continued improvement in, and application of, instruments will help in the search for uniform standards, accurate and repeatable tests, and constant and measurable factors on which to base quality standards. Reliance on instruments, whether brought together in the form of a test line or used independently for specific tests, is becoming common in cotton classing.
Quality Measures The typical marketing sequence for cotton begins with and Cotton transportation of harvested cotton to a local gin (2,9). At the Marketing gin, the cotton is dried and cleaned, the seed is removed, and
the lint is packed into a 480-pound net weight bale. The cotton usually goes from the gin to a local warehouse for storage, compression, consolidation into even-running lots, and eventual disposition to domestic and foreign outlets. Although farmers sell some cotton to the gin, it is usually sold to merchants at the gin or after entering the warehouse.
Most samples for quality are taken at the warehouse, the first point for sampling. Some gins, mostly in California and Texas, have mechanical samplers which collect samples during the ginning process, but such samples constitute only a small portion of samples classed. At the gin or warehouse, the bale is tagged with identification and is cut on both sides (mechanically or by hand). The two cuttings are combined to form a minimum-6-ounce sample which is identified, packaged, and sent to the bale owner or a designated place for classification. The usual destination is one of 27 USDA marketing services offices.
The marketing services office places the values for grade, staple, and micronaire on the sample's classification or green
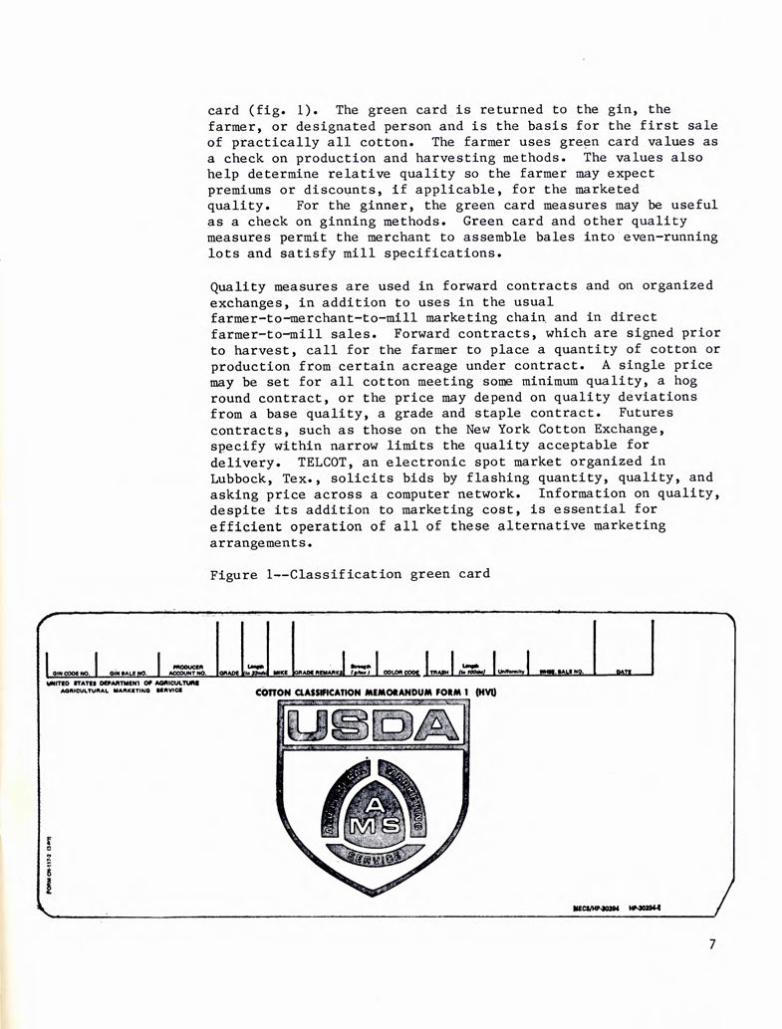
card (fig. 1). The green card is returned to the gin, the farmer, or designated person and is the basis for the first sale of practically all cotton. The farmer uses green card values as a check on production and harvesting methods. The values also help determine relative quality so the farmer may expect premiums or discounts, if applicable, for the marketed quality. For the ginner, the green card measures may be useful as a check on ginning methods. Green card and other quality measures permit the merchant to assemble bales into even-running lots and satisfy mill specifications.
Quality measures are used in forward contracts and on organized exchanges, in addition to uses in the usual farmer-to-merchant-to-mill marketing chain, and in direct farmer-to-mill sales. Forward contracts, which are signed prior to harvest, call for the farmer to place a quantity of cotton or production from certain acreage under contract. A single price may be set for all cotton meeting some minimum quality, a hog round contract, or the price may depend on quality deviations from a base quality, a grade and staple contract. Futures contracts, such as those on the New York Cotton Exchange, specify within narrow limits the quality acceptable for delivery. TELCOT, an electronic spot market organized in Lubbock, Tex., solicits bids by flashing quantity, quality, and asking price across a computer network. Information on quality, despite its addition to marketing cost, is essential for efficient operation of all of these alternative marketing arrangements.
Figure 1--Classification green card
PRODUCER ON COO NO. GIN SALE NO. ACUNT NO
U.US a...... G*M •. Jaa.N1 hIKE RAO( NEMAJUrEI I I.W.. COLOK COOK ThN (I. toGa.! rIIy WMISAIANO, DATE
UNITED flATNI OEMAATMEN1 OF AGoGCULTUI AGRICULTURAL MARKETING SERVICE COTTON CLASSIFICATION MEMORANDUM FORM 1 (HVI)
MIA&
- IIEcM.P403a4 W,102944
7

COTTON FIBER Some tests measure different facets of the same quality factors PROPERTIES AND of grade, staple, and character. Many fiber properties have PROCESSING PER- readily identifiable effects on textile processing and the FORNANCE quality of the yarn and fabric that is produced:
Processing characteristic Quality factor affected
Grade:
Color Trash
Preparation
Staple
Character:
Fineness and maturity
Length uniformity
Strength
Dyeing, bleaching. Processing waste, textile machinery contam-ination, product appearance, cotton dust levels.
Processing waste, product appearance.
Yarn and fabric fineness and strength, nep formation during processing.
Nep formation during proces-sing, yarn and fabric strength, product appearance, processing waste, ends down.
Processing waste, ends down.
Yarn and fabric strength, ends down.
Some properties, such as trash or length uniformity also affect cost of production, as well as spindle speed, end breakage, or losses due to waste. Staple or fineness and maturity affect yarn and fabric quality, such as appearance, strength, and fabric feel, or hand.
Grade Grade, the earliest quality factor measured, is part of official USDA classification, and is determined on the basis of color, trash content, and preparation. There are 37 upland cotton grades. A physical standard (practical form) composed of 12

samples is available for each of 14 grades for visual grade evaluation. Descriptive standards that refer to the physical standards are used for the remaining 23 grades. Color, leaf content, and the ginning process for pima cotton require different grade standards.
Color. Cotton is normally white, but it can become spotted or assume various shades of yellow and gray, deepening in color with age and exposure to weather. Deviation from the normal white color is considered grade deterioration. Color tests evaluate brilliance, or reflectance and hue, with some chroma differences being permitted within a grade.
Trash. Grade depends on trash, the quantity and appearance of foreign matter remaining in cotton lint after ginning. Foreign matter includes seed, stem, leaf, bract, dirt, grass, bark, and particles introduced by harvesting equipment (oil, rubber) and handling (bagging, rope). Differences in trash content can determine color differences within a given grade.
Preparation. This is the effect ginning has on smoothness of the cotton lint. Machine harvesting, excessive gin drying and cleaning, and high gin production rates can lead to rougher lint. Naps and neps contribute to roughness. Naps are large, tangled masses of fibers that often result from ginning wet cotton. Neps are smaller snarled clusters of fibers that look like dots in the lint and are more difficult to remove.
Staple In most cotton, fibers range from less than 1/16 inch to more than 1-3/4 inches. Staple refers to an average of the lengths of the individual fibers, and value depends on the proportions of the different lengths represented in the cotton sample. Staple is critically important in determining product use. Thirty-one official standards exist for U.S. cotton staple. The standard intervals range from less than 13/16 inch to 1-3/4 inches, and are expressed in 1/32 inch. Staple usually refers to the length determination of the classer, and length indicates an instrument measure. The former is expressed in 1/32 inch and the latter is measured in 1/100 inch.
Character The character of cotton is determined by identifying and measuring a number of important fiber properties.
Fineness and Maturity. Two quality factors, fineness and maturity, may be measured independently, but are grouped together in this discussion because the airflow instrument most commonly used to test them gives one value, the micronaire reading, for their combined effect. A cotton fiber has a cross section like a pipe--hollow with inside and outside diameters. For upland cotton, the outside diameter is approximately the
same for all fibers, at 15 microns. Fineness and maturity, then, relate to the inside diameter. Fineness is weight per unit of length, and maturity is the extent of cell wall development. Fineness is a characteristic of variety, so different values for a given variety indicate maturity differences. Similarly, fully mature fibers from different varieties may differ in micronaire due to fineness differences. Micronaire readings range from about 2.4 to 7.5, with each cotton sample containing individual fibers carrying values throughout this range. The overall micronaire reading depends on the proportions of values represented in the sample. A micronaire reading below 3.0 is considered very fine, and 5.0 and above is considered coarse; 3.5 to 4.9 is most desirable for upland cotton varieties.
Strength. Fiber strength contributes to the yarn and fabric strength, and is a measure of the force required to break a sample of fibers. The measures are reported in 1,000 lbs. of pull per square inch or in grams per tex. Increased speeds in modern textile spinning and weaving machinery are placing increased importance on fiber strength as a measure of cotton quality.
Length uniformity. Although staple gives an indication of average fiber length, it does not provide information on the proportions of various fiber lengths constituting the cotton sample. Measures of length uniformity describe the distribution of the fiber lengths in the sample.
Elongation. Elongation is the extent to which a fiber may be stretched, and is usually tested as part of a strength test expressed in percentage terms. Fiber elongation is related to yarn elongation which helps to withstand the stresses of the weaving process without breakage.
Stickiness. Manufacturing problems may occur if cotton fibers stick to equipment because of farm chemical sprays, oils, plant and insect sugar (secretions from insects), or fiber immaturity. One test used to indicate potential stickiness is a measurement of the sugar content of the cotton sample. Processing problems usually occur when the sugar content exceeds 0.3 percent.
Nep count. Although neps may be considered part of preparation, they are related to other fiber properties and have a separate test. Nep formation during harvesting, ginning, and processing increases as fiber length, fineness, and immaturity increase. Neps are measured by processing a cotton sample into a web and counting neps per unit of area.
10

Moisture content. Moisture levels are frequently determined by weighing the fiber before and after drying. Moisture is reported as a percentage of the weight of the predried specimen. Some instruments use a current flow method to determine moisture content. Controlling moisture is also important for accurately measuring other fiber properties.
CURRENT TEXTILE Numerous combinations of machines and machine speeds, settings, INDUSTRY TESTING and drafts (force on the yarn) may be used in a textile mill. PRACTICES All of these factors affect overall production efficiency and
manufacturing costs. These factors also determine cotton qualities required for efficient operation, type of product, and satisfactory product quality.
Mill management has recognized that cotton qualities other than traditional grade and staple have a significant impact on processing performance. While the measurement and use of other factors is not new, increasing reliance is being placed on instrument testing of cotton at textile mills.
Scope and Method Interviews with cotton buyers for textile firms were conducted of Analysis during the fall of 1980 to determine the extent of fiber testing
activities by the textile industry. Initially, 52 firms were contacted--firms that were used in a 1974 study of textile mill operations and covered the major textile producing areas of the southeastern United States (8). Forty usable schedules were obtained for the final sample analyzed. The remaining 12 firms either went out of business, merged with other firms in the intervening years, or did not respond. Every major category of cotton fabric and every class of cotton yarn that is produced in the United States are represented in responses to the survey.
Table 1 shows the distribution of the sample firms by the quantity of cotton they annually consume. Five size categories were used to group textile firms; they ranged from small companies processing less than 15,000 bales to large users with an annual consumption exceeding 150,000 bales. Since most of the larger firms contacted operated more than one mill, data contained in the survey represented each firm's total cotton consumption for textile manufacturing.
Over 3.2 million bales of cotton grown during the 1979/80 season were consumed by the sample firms, representing nearly 50 percent of U.S. mill consumption during 1979/80. The eight largest firms used an average of 236,000 bales, or a total of nearly 1.9 million bales--30 percent of total domestic mill consumption during 1979/80.
11

Table 1--Distribution of sample firms, by quantity of cotton fibers consumed, 1979/80
Fiber Property Testing Methods
Combined :Proportion Firm size : Firms :Proportion: cotton consumed: of total
of sample: by firms : U.S. mill contacted : use
Number Percent 1,000 bales Percent Bales consumed: Less than 15,000 : 11 27.5 119.4 1.8 15,000 to 25,000 : 5 12.5 106.7 1.6 25,001 to 50,000 : 7 17.5 240.5 3.7 50,001 to 150,000 : 9 22.5 861.8 13.2 Over 150,000 : 8 20.0 1,885.9 29.0
All firms : 40 100.0 3,214.3 49.3
Firms provided information about their use of specific fiber properties, use of instrument test values, their ownership and use of cotton fiber testing instruments, and the firms' confidence in instrument values for staple compared with conventional human classing values.
Many methods are used by USDA and private industry for measuring fiber properties to determine cotton quality. The methods include sight and touch, and a variety of instruments:
Quality factor Measurement method
Grade: Color Sight, colorimeter. Sight, Shirley
analyzer, Trash Infrared fiber analyzer. Preparation Sight, touch.
Staple Sight, touch, fibrograph, Suter-Webb sorter, Motion control length/strength analyzer.
Character: Fineness and maturity Micronaire, fibronaire, arealometer,
causticaire maturity test, Shirley fineness and maturity test, fibrograph maturity test, sodium hydroxide test, differential dyeing test.
Length uniformity Fibrograph, Suter-ebb sorter, Motion control L/S analyzer.
Strength Pressley, stelometer, Motion control length/strength analyzer.
Other Nep count, sugar test, moisture test, ultraviolet light.
12
Ownership of The large number of instruments commercially available for Testing Instru- measuring fiber properties suggests instrument ownership is ments widespread in the textile industry. The survey results
confirmed such a pattern.
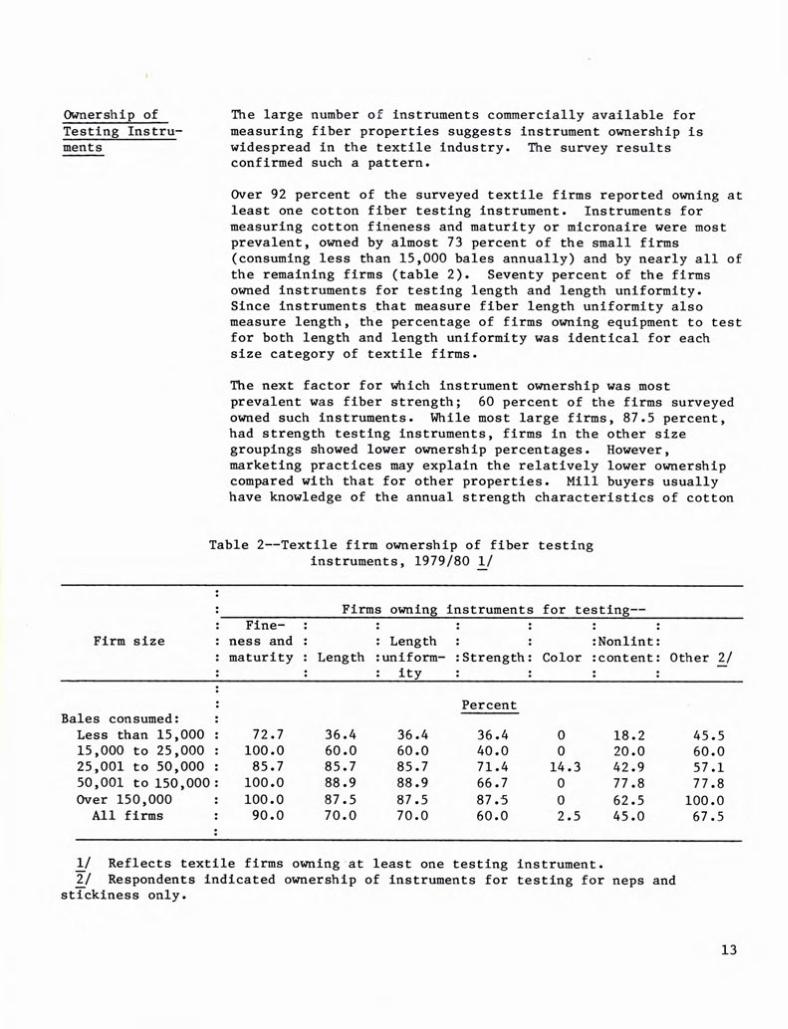
Over 92 percent of the surveyed textile firms reported owning at least one cotton fiber testing instrument. Instruments for measuring cotton fineness and maturity or micronaire were most prevalent, owned by almost 73 percent of the small firms (consuming less than 15,000 bales annually) and by nearly all of the remaining firms (table 2). Seventy percent of the firms owned instruments for testing length and length uniformity. Since instruments that measure fiber length uniformity also measure length, the percentage of firms owning equipment to test for both length and length uniformity was identical for each size category of textile firms.
The next factor for which instrument ownership was most prevalent was fiber strength; 60 percent of the firms surveyed owned such instruments. While most large firms, 87.5 percent, had strength testing instruments, firms In the other size groupings showed lower ownership percentages. However, marketing practices may explain the relatively lower ownership compared with that for other properties. Mill buyers usually have knowledge of the annual strength characteristics of cotton
Table 2--Textile firm ownership of fiber testing instruments, 1979/80 1/
Firms owning instruments for testing--Fine- :
Firm size : ness and : : Length : : :Nonlint: maturity : Length :uniform- :Strength: Color :content: Other 2/
ltv
Percent Bales consumed: Less than 15,000 : 72.7 36.4 36.4 36.4 0 18.2 45.5 15,000 to 25,000 : 100.0 60.0 60.0 40.0 0 20.0 60.0 25,001 to 50,000 : 85.7 85.7 85.7 71.4 14.3 42.9 57.1 50,001 to 150,000: 100.0 88.9 88.9 66.7 0 77.8 77.8 Over 150,000 : 100.0 87.5 87.5 87.5 0 62.5 100.0 All firms : 90.0 70.0 70.0 60.0 2.5 45.0 67.5
1/ Reflects textile firms owning at least one testing instrument. 2/ Respondents indicated ownership of instruments for testing for neps and
stickiness only.
13

grown in the various areas of the Cotton Belt. Therefore, a heavy reliance is placed on purchasing cotton from areas of known fiber strengths and specifying these requirements in contracts with cotton merchants and shippers. USDA's annual cotton quality determinations, which are frequently published, are widely used by the textile industry's cotton buyers to obtain strength data on each season's crop.
Instruments are available for measuring only the color and tras components of grade. Only one firm reported ownership of equipment for cotton color measurements. The textile industry appears to have confidence in official USDA grade determination as an indication of color. The color of a sample is probably close enough to the classer's grade call for mill purposes to justify not having a colorimeter.
Of growing importance to mills is the need to measure nonlint content of cotton samples, including noncotton parts of the cotton plant and other foreign material introduced in harvesting and handling. Also, less opportunity exists for visual inspection because of new and stricter regulations for the opening rooms of textile mills in an effort to reduce cotton dust. Automated bale opening systems are becoming more common. Mills can do a better job of specifying the extent of lint cleaning and estimating the approximate manufacturing waste loss involved by using information on trash content. Instruments for determining the nonlint content of cotton were owned by about half the sample firms with ownership more prevalent among the larger firms.
Other testing instruments owned by firms primarily included equipment for determining neps in cotton samples, as well as sugar content to measure the stickiness of individual fibers. Over 67 percent of textile mills, including a significant number of the smaller firms, reported owning at least one of these instruments.
Fifty-seven percent of all firms contacted reported owning an Uster Evenness Tester, although it is not considered a testing instrument of fiber properties. All fiber properties (including uniformity) are reflected in the quality of the yarn. The Uster tester is used to measure the evenness of cotton yarn after spinning, and it determines whether the yarn varies in thickness from place to place. It is used as a product quality-control device.
14
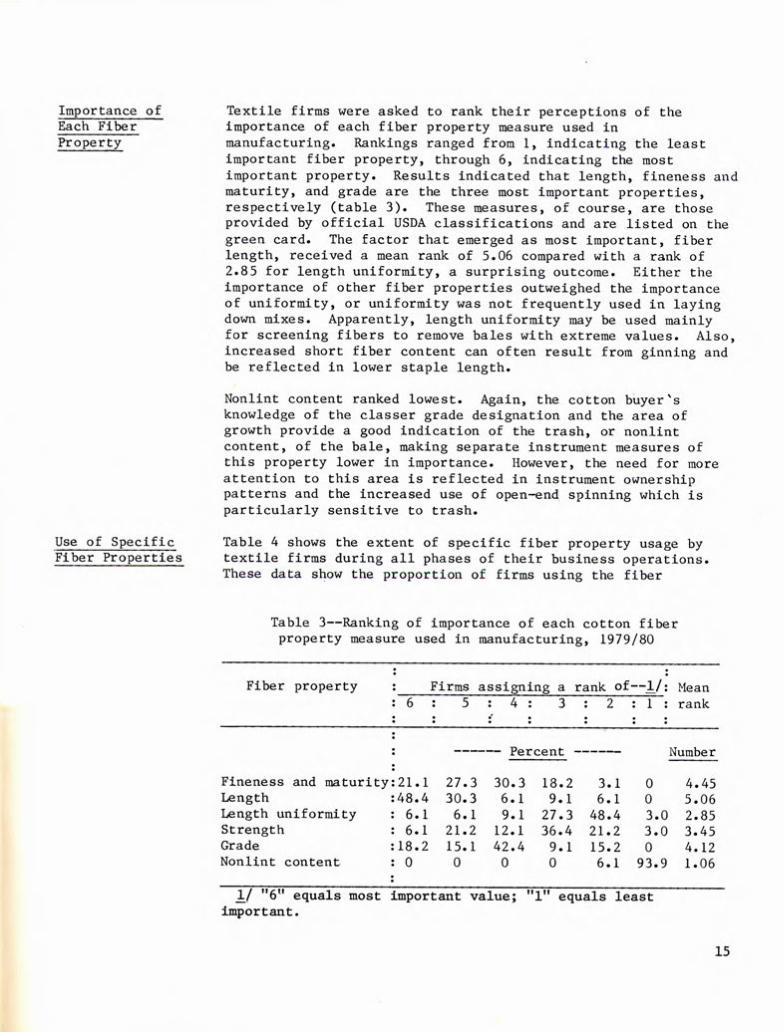
Importance of Textile firms were asked to rank their perceptions of the Each Fiber importance of each fiber property measure used in Property manufacturing. Rankings ranged from 1, indicating the least
important fiber property, through 6, indicating the most important property. Results indicated that length, fineness and maturity, and grade are the three most important properties, respectively (table 3). These measures, of course, are those provided by official USDA classifications and are listed on the green card. The factor that emerged as most important, fiber length, received a mean rank of 5.06 compared with a rank of 2.85 for length uniformity, a surprising outcome. Either the importance of other fiber properties outweighed the importance of uniformity, or uniformity was not frequently used in laying down mixes. Apparently, length uniformity may be used mainly for screening fibers to remove bales with extreme values. Also, increased short fiber content can often result from ginning and be reflected in lower staple length.
Nonlint content ranked lowest. Again, the cotton buyer's knowledge of the classer grade designation and the area of growth provide a good indication of the trash, or nonlint content, of the bale, making separate instrument measures of this property lower in importance. However, the need for more attention to this area is reflected in instrument ownership patterns and the increased use of open-end spinning which is particularly sensitive to trash.
Use of Specific Table 4 shows the extent of specific fiber property usage by Fiber Properties textile firms during all phases of their business operations.
These data show the proportion of firms using the fiber
Table 3--Ranking of importance of each cotton fiber property measure used in manufacturing, 1979/80
Fiber property :Firms assigning a rank of1/; Mean :6: 5:4: 3:2 :1 :rank
-- Percent Number
Fineness and maturity:21.1 27.3 30.3 18.2 3.1 0 4.45 Length :48.4 30.3 6.1 9.1 6.1 0 5.06 Length uniformity : 6.1 6.1 9.1 27.3 48.4 3.0 2.85 Strength : 6.1 21.2 12.1 36.4 21.2 3.0 3.45 Grade :18.2 15.1 42.4 9.1 15.2 0 4.12 Nonlint content : 0 0 0 0 6.1 93.9 1.06
1/ "6" equals most important value; "1" equals least important.
15

properties regardless of ownership of testing instruments. The firms were simply asked which properties were used in manufacturing.
All firms employed measures of fiber fineness and maturity in their manufacturing operations, and 85 percent of the firms used values for fiber length. The next most used measures, strength and grade, were employed by 72.5 and 70 percent of the firms, respectively.
As firm size becomes larger, a higher proportion of fiber properties is used, because as size increases, the variety of fabrics and products generally increases, making the use of additional fiber properties necessary.
Both the importance and use of the specific fiber properties are significantly influenced by the types of products manufactured. For example, manufacturers of thread and fine
Table 4--Use of specific fiber property measures by textile firms during manufacturing, 1979/80 1/
Fiber property measures
Firms
: Less than : 15,000 :
by size, 15,000 to :
25,000 :
bales 25,001 to
50,000
consumed per : 50,001
to : 150,000
year 2/
Over : 150,000
All : firms
Percent
Fineness and maturity : 100.0 100.0 100.0 100.0 100.0 100.0
Length : 72.7 60.0 85.7 100.0 100.0 85.0 Length uniformity : 36.4 20.0 71.4 77.8 75.0 57.5 Strength 54.5 40.0 85.7 77.8 100.0 72.5 Grade : 72.7 60.0 85.7 44.4 87.5 70.0 Noncotton content 9.0 0 42.9 44.4 50.0 30.0
Other 2/ 0 20.0 0 22.2 50.0 17.5
1/ Proportion of textile firms sampled using fiber property measures in processing regardless of ownership of testing instruments. 2/ Nep and stickiness measures.
16

yarns are most concerned with staple length and strength, while producers of denim are more interested in selecting fibers based on grade and fineness and maturity. The results showed industrywide use patterns of the specified fiber properties to the extent that the sample firms still represented as broad a cross section of manufacturers as originally projected when the sample was designed.
Firms were also asked to state the most important operations which required knowledge of fiber properties determined by instruments. The four major areas in which the fiber properties are used in manufacturing operations in textile mills are quality control, fiber screening, laying down mixes, and purchasing.
Quality control involves establishing that the specific quality of cotton purchased was indeed received from merchants and shippers, or from mill stocks at other locations. The screening of fibers refers to sorting and assembling even-running lots at a given mill, or for use at other mills owned by a given firm. Laying down mixes refers to the textile mill opening room operation of mixing and blending cotton fibers with differing properties to achieve spinnable cotton having a desired set of properties. Fiber property measures are used in purchasing to obtain the quality characteristics needed for manufacturing and for determining the alternative prices a firm is willing to pay for differing qualities.
Over 92 percent of all firms contacted used fiber property values for laying down mixes, by far the most important use (table 5). All firms consuming over 25,000 bales used
Table - 5--Textile mill use of fiber property measures in manufacturing operations, 1979/80
Firms using fiber properties for-- Firm size : Quality : Screening : Laying down
control : fibers : mixes : Purchasing
Percent Bales consumed: Less than 15,000 : 45.5 9.1 81.8 72.7 15,000 to 25,000 : 60.0 0 80.0 100.0 25,001 to 50,000 : 71.4 28.6 100.0 57.1 50,001 to 150,000 : 88.9 66.7 100.0 88.9 Over 150,000 : 87.5 100.0 100.0 87.5
All firms : 70.0 42.5 92.5 80.0
17

instrument values of fiber properties in laying down mixes. About 80 percent of the smaller firms consuming less than 25,000 bales also used instrument values.
The second major area of application was the use of fiber properties in purchasing cotton, where 80 percent of all firms used instrument values for this purpose. Seventy percent of all firms used test results for quality control purposes. About 42 percent reported use in screening fibers, primarily for other mills in the same firm; as expected, this function is relatively unimportant for small firms.
Because the mixing and blending of fibers is one of the most critical operations in textile processing, mills were asked to provide information on which fiber properties, as determined by instrument, were used in laying down mixes. Every firm that used fiber properties for mixing and blending used fineness and maturity measures (table 6).
Fiber length was the next most important decision variable, used by 70.3 percent of the firms. About 65 percent reported using grade information. Length uniformity and strength measures were employed by less than 25 percent of the firms contacted.
Each of the various fiber properties is not exclusively used in laying down mixes, but is generally employed in combination with other quality measures, depending on product, equipment, and
Table 6--Textile firm use of specific fiber properties for laying down mixes, 1979/80
Firms using--I/ Firm size : Fineness and : : Length
maturity Length : uniform- : Strength : Grade ity Percent
Bales consumed: Less than 15,000 : 100.0 66.7 33.3 11.1 66.7 15,000 to 25,000 : 100.0 75.0 25.0 25.0 75.0 25,001 to 50,000 : 100.0 71.4 28.6 42.9 71.4 50,001 to 150,000 : 100.0 55.5 22.2 22.2 66.7 Over 150,000 : 100.0 87.5 0 25.0 50.0
All firms : 100.0 70.3 21.6 24.3 64.9
1/ This is the percentage of firms that reported using fiber properties for laying down mixes. No firms reported using nonlint content or other measures such as nepiness or stickiness in laying down mixes.
18

machinery settings. Textile firms clearly have made instrument values essential for optimum blending of. various kinds of cotton.
Relationship of A comparison of textile firm use of fiber property measurements Fiber Property with information on ownership of the associated testing Use to Instru- instruments is shown in table 7. These data provide a broad ment Ownership indication of the potential demand for instrument test values as
an integral part of the official cotton classification system. In most cases, the categories for smaller firms consuming fewer than 25,000 bales, show a higher proportion of their members using fiber property measures relative to their ownership of related instruments. Comparisons for each of the five size groupings of firms may be made by using data contained in tables 4 and 6.
Table 7--Textile mill use of fiber properties related to ownership of associated fiber testing instruments,
1979/80 1/
Firms owning Firms : instruments to
Fiber property : using property : measure property
Percent
Fineness and maturity : 100.0 90.0
Length 85.0 70.0 Length uniformity : 57.5 70.0 Strength : 72.5 60.0 Grade 2/ : 70.0 2.5 Noncot ton content 30.0 45.0
Other : 17.5 67.5
1/ Represents the average for all firms surveyed. 2/ The only associated instruments reported are those
measuring color.
19

Confidence in Textile firms were asked to express their opinion on their Instrumert Values confidence in instrument test values for staple determinations Versus Traditional versus values obtained through traditional human cotton classing Cotton Classing operations. Of the 40 firms surveyed, 34 responses were
obtained. Overall, 26.5 percent reported more confidence in instrument values, 32.4 percent reported the same level of confidence, while 41.1 percent said they had less confidence in instrument values then in conventional cotton classing (table 8). The distribution of responses by size of firms indicates the smaller firms have considerable confidence in instrument values. Less than 50 percent of the firms in the consumption size category between 25,000 and 50,000 bales had reported that they were at least as confident with instruments as traditional methods.
INSTRUMENT TESTING The first section of this report indicated that USDA is SYSTEMS AND USDA currently increasing its use of HVI systems. The HVI system COTTON CLASSING provides those fiber property measures that the textile firms
require.
Current HVI IIVI systems differ by number of operators, instruments included, Testing and sequence of instruments used. A typical HVI system is
depicted in figure 2. A cotton sample passes through three test stations: micronaire, beard preparation, and length/strength. Three operators run the system, one at each station.
The micronaire station operator is the first to touch the cotton sample. A micronaire determination, the same as that for
Table 8--Textile mill confidence in instrument test values for staple versus traditional cotton
classing, 1979/80
Firm size : Favored instru- ments
Conf i- : dent in : either : method
: Favored : tradi- : tional : classing
Percent Bales consumed: Less than 15,000 : 50.0 25.0 25.0 15,000 to 25,000 : 50.0 25.0 25.0 25,001 to 50,000 : 16.7 16.7 66.6 50,001 to 150,000: 0 50.0 50.0 Over 150,000 : 25.0 37.5 37.5 All firms : 6.5 32.4 41.1
RTI

Figure 2. High Volume Instrument System (without Conveyors)
10'
()
I Loose Disposal
Sample Tray
traditional classing, is made; the value is automatically recorded. A visual determination of trash content and preparation is also made and manually entered into the system by keyboard. A refinement of this system now in the developmental stage would have trash content measured by instrument and automatically recorded.
The sample then passes to the beard preparation station where it is tested for, color. Yellowness and grayness (analagous to the colorimeter measures of yellowness) and reflectance are automatically recorded.
The sample is then used to make four small segments, or beards, and placed in clamps for multiple readings on length and strength. The length/strength station operator places the clamped beards on the length and strength elevators for testing and automatic recording. Beards and the remainder of the sample are discarded at the beard preparation station and lose their identity.
A fourth operator services several HVI systems, supplying each system with its samples and collecting the loose waste.
4' Length/Strength I Micronaire
Color
Leaf Keyboard Q
Operators
CA)
CA)
21
Implementation Considerations
The automatic recording of test measures is controlled by an important component of HVI hardware, the microprocessor, which provides sample identification, proper sequencing of the tests, computes averages of multiple test readings, formats data, and records the data on tape. The tape is then used on a computer, with appropriate programs, to write reports. For example, a report is sent to the gin indicating individual bale numbers, quality data, and frequency distributions for quality factors on all cotton processed by the gin. Quality information is also transferred to the classification cards which are then sent to the gin (see fig. 1).
Increasing use of HVI systems is related to both technical and economic issues. The survey results in this report showed 41 percent of the respondents had less confidence in instrument values than in traditional classing. Confidence in instrument values is important for industry acceptance of HVI systems.
AMS has conducted numerous tests of IIVI measures since the system came into existence. The tests assess the accuracy and precision of HVI fiber quality measures. For example, some of the major tests have included:
Assessment of the HVI system's ability to remain in calibration over time,
Comparison of HVI with classer measures to determine the frequency and extent to which the measures differ,
Repeated IWI testing of calibration cotton samples to compare average HVI measures with the calibration cotton's standard values,
Repeated IIVI testing of samples to determine variablity (repeatability),
Comparison of the way processing performance and yarn quality are related to measures determined by IIVI, classer, and a set of individual laboratory instruments of the types often used by textile firms, and
Determination of the extent to which measures from HVI, classer, and various laboratory instruments are related. Overall, the results of these tests show HVI measures are very similar to both classer and individual laboratory instrument measures in terms of accuracy and repeatability (getting the same reading each time tested) and as indicators of manufacturing performance (3,12).
22

A variety of economic issues are related to HVI classification. The broad issue underlying Government grading and classing of any commodity is benefits and costs of publicly supplied services versus private sector monitoring. Given USDA classification, benefit/cost issues relate to partial or all crop HVI classing compared with traditional or alternative instrument classing systems.
Much of the information developed in this report relates to textile firm benefits of instrument testing. Textile firms place a value on knowledge of fiber properties other than traditional grade, staple, and micronaire. The value is derived from a reduction in uncertainty over the quality of cotton purchased and improved processing and final product. For most firms, the apparent value of the additional instrument information exceeds the cost of testing, based on this survey of instrument use and ownership patterns of textile firms. For firms not using instrument data, test costs may exceed use value; however, use value may still be positive. A company using only one type of cotton (high-strength, California cotton, for example) may have little need for instrument testing. However, companies that purchase several types can save by using USDA test results, rather than buying expensive testing equipment. HVI classing by USDA permits these latter firms to employ this use value and allows other firms to increase theirs, especially if USDA testing results in a reduction of their own test efforts. The value of information is also a resource allocation issue. More fiber quality information should permit cotton and its production resources to be attracted to the highest value end-uses. HVI testing would thus aid resource allocation by enabling premiums and discounts of cotton, based on its HVI quality measures, to be transmitted from textile mills back to cotton farmers.
23

REFERENCES (1) Faver, William H. Use of Cotton Fiber Tests by United States Cotton Mills. Southern Coop. Series Bull. No. 70. Southern Regional Cotton Marketing Research Committee, Dec. 1959.
(2) Glade, Edward II., Jr., and Joseph L. Ghetti. Marketing U.S. Cotton to Domestic and Foreign Outlets in 1977/78: Practices and Costs. ESCS-79. U.S. Dept. Agr., Econ. Stat. Coop. Serv., Feb. 1980.
(3) Griffith, Samuel R. "Evaluation of Instrument Classing of Cotton, Lubbock, Texas, Crop of 1976," U.S. Dept. Agr., Agri. Mktng. Serv., Jan. 1978.
(4) National Cotton Marketing Study Committee. National Cotton Marketing Study Committee Report. U.S. Dept. Agr., Aug. 1975.
(5) Palmer, Arthur W. The Commercial Classification of American Cotton. Dept. Circ. 278. U.S. Dept. Agr., Jan. 1924.
(6) . The Growth of Cotton Fiber Science in the United States. Publication 4452. Smithsonian Institution, 1961.
(7) Smith, Harvin R. "High Volume Testing Production and Operation," Summary Proceedings. 1969 Cotton Quality and Processing Conference. Paper presented at National Cotton Council meeting, Memphis, Tenn., 1969, pp. 12-14.
(8) Rogers, C.D., H.C. Spurlock, and D.E. Crawford. Treids in Use of Cotton and Competing Fibers, 1973. Bulletin 578. South Carolina Agr. Exp. Sta., Clemson Univ., in cooperation with the U.S. Dept. Agr., Nov. 1974.
(9) Sporleder, Thomas, James Haskell, Don Ethridge, and Robert Firch. Who Will Market Your Cotton? D-1054. Texas Agr. Ext. Serv., Texas A & M Univ., College Station, Mar. 1978.
(10) U.S. Department of Agriculture, Consumer and Marketing Service. Cotton Testing Service: Tests Available, Equipment and Techniques, and Basis for Interpreting Results. C&MS-82. May 1970.
(11) , Agricultural Marketing Service. The Classification of Cotton. All-566. Apr. 1980.
(12) Agricultural Marketing Service. "Variations in Cotton Classing Systems." Staff paper, July 23, 1980.
24
-U.S. GOVERNMENT PRINTING OFFICE 198.-O-360-932/ERS-229

UNITED STATES DEPARTMENT OF AGRICULTURE AND FEES PAID POSTAGE
WASHINGTON, D.C. 20250 U.S. DEPARTMENT OF AGRICULTURE
AGR 101
THIRD CLASS
Economic Research Service
The Economic Research Service carries out research on the production and marketing of major agricultural commodities; foreign agriculture and trade; economic use, conservation, and development of natural resources; trends in rural population, employment, and housing; rural economic adjustment problems; and performance of the U.S. agricultural industry. ERS provides objective and timely economic information to farmers, farm organization members, farm suppliers, marketers, processors, consumers, and others who make production, marketing, and purchasing decisions, and to legislators and other public officials at the Federal, State, and local government levels.