cotton ()t; situation - cornell...
TRANSCRIPT
9C 7C,
1k FOR RELEASE 1 J
JAN. 5, A.M. [
COTTON SITUATION CS-150····NOV.-DEC. 1953
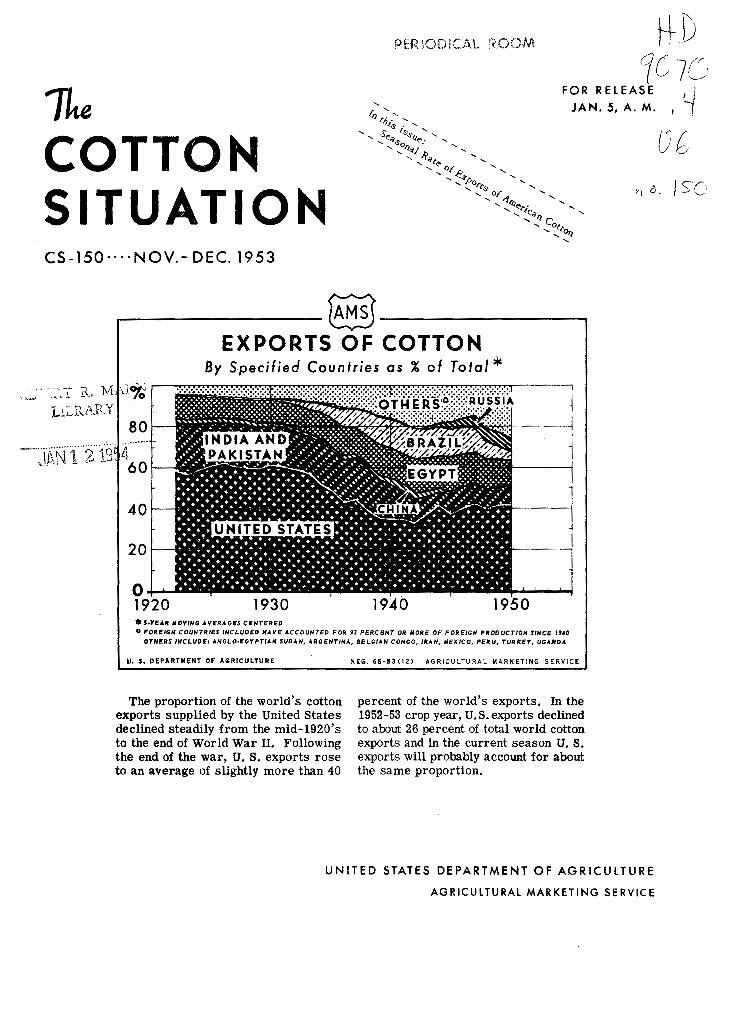
~--------------~--------------~ EXPORTS OF COTTON
By Specified Countries as % of Total*
1930 1940 1950 .S.YEA.R MOVIHG AVERAGES CENTERED
0 FOREIGN COUNTRIES INCLUDED HA.VE ACCOUNTED FOR 93 PERCSHT OR M.ORE OF FOREIGN PRODUCTION SIHCE lf40
OTHl!RS IHCLUDE: A.HGLO-EGYPTIA.H SUDA.H, A.RGENTIHA., BELGIAN COHGO, IIU.H, M.EXICO, PERU, TURICE'I", UGANDA.
U. S. DEPARTMENT OF AGRICULTURE
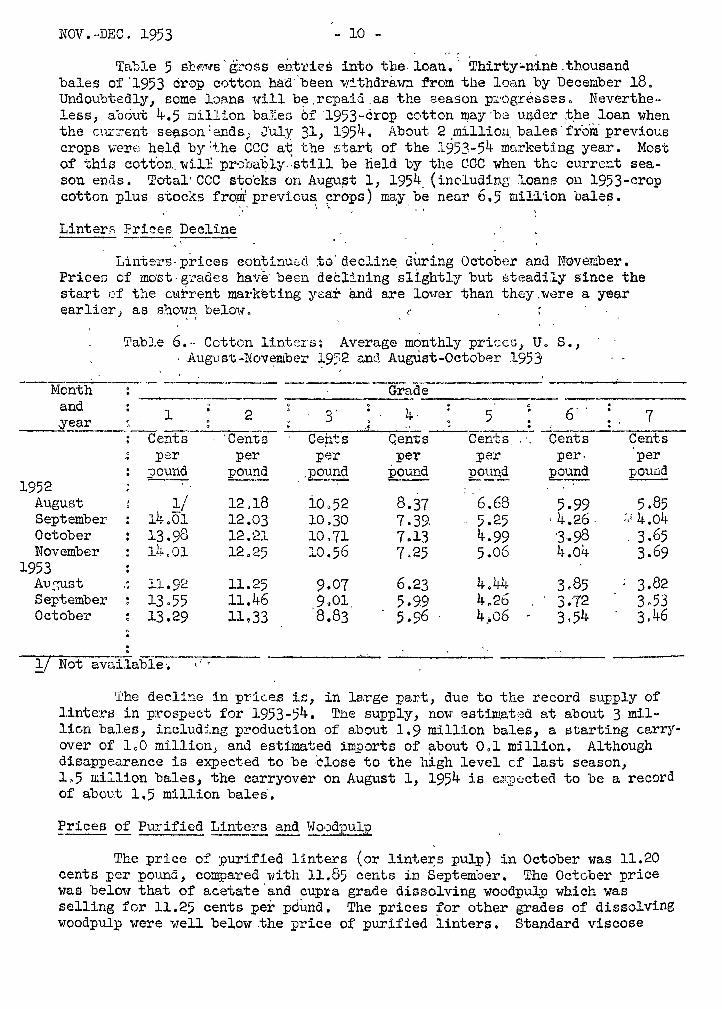
The proportion of the world's cotton exports supplied by the United States declined steadily from the mid-1920's to the end of World War II. Following the end of the war, U.S. exports rose to an average of slightly more than 40
NEG. 65·53(12) AGRICULTURAL MARKETING SERVICE·
percent of the world's exports. In the 1952-53 crop year, U.S. exports declined to about 26 percent of total world cotton exports and in the current season U. S. exports will probably account for about the same proportion.
UNITED STATES DEPARTMENT OF AGRICULTURE
AGRICULTURAL MARKETING SERVICE
()t;
Cotton Situation at a Glance
----~~--
1952 : 1953 Iteill i Unit
;
Sept. : Oct. : Nov. : Sept. : Oct. : Nov. y l.. ---- . - -· -------•
: : Prices, receiTed b7 fl!rurs for Am. Upland (llid-IIOnth) : Cents : 39.11 36.77 34.05 33.09 32.46 31.82 Parity price tor~ r.~laDd •••••••••••••••••••••••••••• : Cents : 34.47 34.35 34.22 34.35 34.22 34.35 Farm price as a perce~tase of parity •••••.•.••••••.•.•• : Percent : 113 1o8 100 96 95 93 Average 10 spot aarket price Middling 15/16 inch .•.••.• : Cents : 38.89 36.65 34-75 32.81 32.68 32.74 Average price for 17 r<:>DBtructioDB, gray goods Jf.· ..... : Cents : 69.91 70.25 69.13 67.09 65.63 64.06 Average price ootto!a ~liBd in 17 constructiona 2 .•...•• : Cents : 4o.l9 37.70 36.o8 34-35 34.19 34.47 Mill .arsins for 17 conetructiona gj ................... : Cents : 29.72 32-55 33.05 32.74 31.44 29.59
BLS wholesale price ill!dex All c~i ties •••••••.••••••.•.••••••••••.••••••.••• : 1947-49 "' 100 : lll.8 lll.l 11.0.7 110.0 110.2 109.8 Cotton broad vo~n soods ••••••••••••••••••••••••••••• : do. : 96.7 97.1 96-3 92.1 91.1 90.1
Index of industrial production : Overall (adJusted) •••••••••.•.•••••.••••••••.•••••••• : 1935-39 .. 100 : 228 230 234 232 231 228 Textiles aad Products (unadjusted) ••• -~ ............. : do. : lTI 172 176 161 157
Personal iDCoae ~nte (adJusted) .•...•.•••.•••..•••• : Billion dollars : 276.4 2TI.3 277.2 286.3 287.3 Department store Bales (adJusted a.nd Z"8Vieed) ••••.••••• : Million dollars : 945 1,018 995 928 1,o46
Mill consumption of all kiDde of cotton J/ ............. ; :
1,000 bales : 737-1 !!:/915.6 755.0 702.4 !!:/872.1 685.0 Mill OOill!lumption, dailJ' rate.. . .•••••••••••••••••.•.•• : 1,000 bales : 37.8 37.0 38.7 36.0 35-2 35.1 llldex of spindle actin t7 ••..•..•••••••••••••.••••••••• : 2.1 : 134.8 135.1 137.0 133·9 130.6 129.1 II) Spindles in place eJIIl of 110nth in cotton system •••.•••. : Thousand : 23,172 23,122 23,090 22,944 22,926 22,931
Spindles coneulling 100 percent cotton .••••••••••••.•• : Thousand : 20,o41 20,188 20,18o 20,039 19,953 19,990 Sp 1lld.les idle •••••••.••••.•.•.•••••.•••••••••.••••••• : Thousaod : 1,74o 1,510 1,507 1,622 1,682 1,678
Gross hourly ~ in broad woven goods §/ . .........• : Cents ; 129.5 130.3 130.2 13().0 129.0 : :
Exports of cotton ••••••••••••••••••.••••••••••••••••••• : 11 000 bales : 24o.5 296.0 337.2 199.8 217.3 EXports of cottaR since August 1 ••••••••••••••••••••••• : 11 000 bales : 347.4 643.4 98o.6 393.1 610.4 Iaports of cottaR •••••••••••••••••••••••••••••••••••••• : Bales : 6,021 7,632 12,362 20,209 7,TI6 !Bporte of cotton eiDce August 1 •••••••••••••••••••.••• : Bales : 11,771 19,4o3 38,8o3 29,339 37,ll5 Mill stocks end or JIOilth ••••••••••••••••••••••••••••••• : 1,000 bales : 987.9 1,300.8 1,466.2 1,296.8 1,506.2 1,586.1 Stocke, public storaee~ etc •••••••••••••••••••••••••• ,: 1,000 bales : 4,039.1 6,753·3 7,464.0 5,852-9 9,4o6.5 ll,219.6
: : Linters prices
Crad.e 2 • II <11 e e e e e e e e e e e e e e e e e e e e ll e e e e e e e e e e e e e • e e e e e II II e : Cents : 1.2.03 12.21 12.25 ll.46 ll.33 Grad.e lt • ••••••••••••••••••••.••••.•• .- •••••••••••••••• t Cents : 7·39 7-13 7.25 5.99 5.96 Grade 6 ..................•.............•............. : Cents : 4.26 3.98 4.o4 3.72 3-54
: : Rayon pr1oea :
Tiecose ,..a, 150 denier •••••.•.••••••••••••••••••••• : Cents : 78 78 78 78 78 78 Staple fiber, ?iacoee 1; denier •••••••••••••••••••••• s Cents : 4o 4o 37 34 34 34 Acetate 1VJl1 150 dealer ••••••••••••••••••••••••••••• : Cente : 73 73 73 73 73 73
: : y Preliminary. y Revised April 1953. J} 4-week period except as noted. !!:/ 5-week period. 2} So hour week = 100 percent. §/ Cotton, silk 8lld
synthetic fibers • 1J Average price at Memphis 1 Dallas and Atlanta.
CaRPiled f'rcm official sources.
CS-150 -3-
T H E C 0 T T 0 N S I T U A T I 0 N
Approved by the Outlook anq Situation Board, December 29, 1953
SUMMARY
.: The supp-ly of cotton in the Un~teg Stat~$ for th~ 1953-54 season is ~stimated at 21.9 million bales and dis~pp~aP$nO~ is ~stimated at about 12 .. 3 million. This would leave a carryover on August 1, 1954 of about 9.6 million bales, compared with 5.5 million a year earlier. About 6 1/2 million bales of this carryover probably will be held by Commodity Credit Corporation under the price support program.
Expor~ of cotton during the current season is expected to increase moderately. above the 310481000 bales exported in 1952-53. Loans and grants from the u. s •. GQvernment to finance cotton exports during the 1953-54 seaso~ amount to 283.4 million dollars as-of December 29,· which if complete~ used would finance about 1.5 million bales. In 1952-53, this figure was ~21 million, which financed about 1.2 million bales. Of the 1953-54 total, 168.7 million are grants from the Foreign Operations Administration and 114.7 are .. loans from the Export-Import Bank.
Foreign exporting countries started tpis season with stocks of about 2.5 mi~on bales available for export. Although much of this will probably be sold during 1953-541 some of it is of low q~ality and will.be difficult to sell. However, foreign free-world production will probably decline about 800 thousand bales from the 1952-53 level, and consumption may be about half a million bales above the post-World War II record of 16.5 million in 1952-53~
. . . The· disappearance of cotton during the first quarter of the 1953-54
·marketing" year was about 100 thousand bales smaller than a year earlier, mainly because of smaller domestic mill consumption. Consun;1ption from August 1 through November 28 was about 5 percent below the rate'of approximately the same period a year earlier. The average daily rate of consumption declined contraseasonally from September through November 1953.
The 1953 U. s. cotton crop is estimated at 16.3 million running bales (16.4 million 500-pound bales). The 1953 yield per harvested acre is estimated at 322.4 pounds, a record.
Entries into the CCC loan from the 1953 crop amounted to over 5·.2 million bales on December 18. Most of the 2 million bales held by CCC at the beginning of that season will still be held by CCC When the season ends.
NOV. ·DEC~ 1953 - 4 -
RECENT DEVELOPMENTS
Carryoy~ 1lP.
The large--1953 crop of cotton plus the starting carryover and ex·· pected imports of cotton give an estimated supply of 21.9 mjllion bales for the 1953-54 marketing year. With the disappearance estimated at about 12.3 million bales; the carryover on August 1, 1954 will be approximately 9.6 million bales. -This will be the largest of the post-World ·war II period and-about 4 million -bales larger than the carryover on August 1; 1953. ' ·
Exnorts.
Exports during the 1953-54 season are expected to be about 3.3 million bales, the same. as·_ estimated in October~ ·However, some of the factors
.which affect exports have become clearer since then. The consumption of · cotton in foreign free-vorld countries in 1953-54 is now expected to be higher than in the-1952-53 season while production in-these countries· is expected to be about.800. thoueand bales smaller. A surr~~ization-of thesupply and disappearance of,cottori abroad in the two seasons follows:· ·
Table 1.- Cotton: Supply and .distribution, foreign free-world countries, 1952 and 1953
Item
Carryover beginning of season Production Imports of u. s.
Total supply
Consumption Exports to u. s. and Iron Curtain
countries Total disappearance
Carryover end of season
. . ....
Year beginning August 1 1952 . :..19"""5~3 __
Million baJ.e.s · •.Million bales
'i6.5 '
0.8
: .. .. ... ,
17.0
0.8 17.8
8._5
Consump-tion abroad in 1953-54 is expected, to be about 1/2 million bale_s larger than the postwar record of 16.5 million bales in 1952~53. Economic activity in Western Europe has been at a high level during recent months. Except for Canada and perhaps Italy, cotton comsumption has been higher than in the same months a year earlier.
CS-150
Even. 'thought the· denia.na :for cotton abroad will be strong, the supply of' ·cot.ton outside" the u-: S .: is large enough to fill this demand without much increase in U·. S. expotts: of· cotton·:· Althougli· beg-iiming stocks were lower~han· a year earlier, the reduction occurred in cotton importing countries. Foreign exporting countries increased their stocks about 400 thousand, ~~les.
· ·· Production ~f cotton in.foreign·free~world couhtries in' 1953-54 is now· estiJi:ia.t(:;d. at. about 12.9 i:nillion baies·. ·Thi@- ~s ~about 800 thousand bales smaller than last season. ~his production estimate is· subject to revision as more' data become· 'available. ' . .
. .~. • ' ?
·'· · ·· l:asappearauce··of cotton in the foreign free-world- count'ries is expected to be about 4.9 million bales ·larger than production in' these· countries. However, about 1.6 mill~on bales of the deficit will probably be made up from stp,cks · in:· r'oreiSn.: eXporting 'countries. It is expected: :that' stocks available
·-~for export, ·except· for some low quality cotton, will be about used up by the end Of 'thE{ current season •. This analysis assumes 'that other eXporting countri~s:wili.keep the· expprt·prices for their cotton below those of the u.S. which are· ·no-t( _supp~ted. at 90. percent of the parity price. · The· analysis also
' ass~eJ:J' that 1inport'ing countries wia.l buy the cheaper foreign cotton instead of: the more ·~xpep.sive u. s: cotto,n. . .
t r : : . ; . . .. :·. . . ..
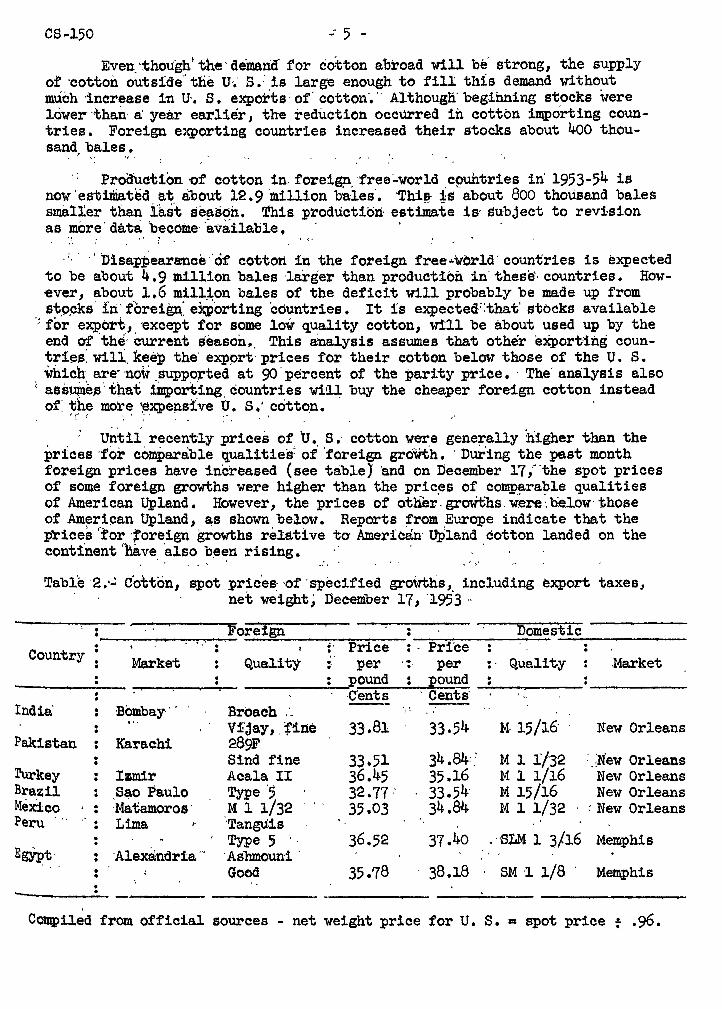
-' Until recently prices of tT. S .. cotton were generally higher than the prices ·fol- com,i?arable qualities: of 'foreign growth. · Dur.ing the pe.st month foreign prices have increased (see table) and on December 17 ;"'the spot prices of some foreign growths were higher than the prices of comparable qualities of American Upland. However, the prices of other. groWt;hs. were:. below· those of Ameri~;:an Upland, ~s shown below. Reports from Europe indicate that the p~icesrfor ·foreign growths relative to Americ~· upland cotton landed on the contfnent 'have. ·also b.e~n rising. ·
. ' . ' . ~. Table ·2.·..:; Cotton, spot pric'es· ·of ·specified groWths, including export taxes,
· · · · net we.ight; Deeember 17, '195 3 ··
Foreign Domestic . ~ . Price :- Price Country • . Market Qualit:Y .. per ... per .. Quality .Market . .. .
pound ~ound . . -c·ents ·Cents·
India· Bombay-·· Broach ---• '! ~
• ... V:fi'jay, . fine 33.81 33.54 M- 15/16- . New Orleans Pakistan . Karachi 289F •
• Sind fine 33.51 34 .84:_: M l 1/32 :_:New Orleans . Turkey Izmir Acala II 36.45 35.16 M l l/16 New Orleans Bra~il Sao Paulo Type '5 32.77: 33.54' M 15/16 New Orleans MeXico . :Matamoros · .M l 1/32
... 35.03 34.84 M l 1/32 : New Orleans .
Peru · ·· Lima ·Tangti.is Type 5 I 36.52 37.40 . ··SLM l 3/16 Memphis
E~t· . -Alexa:ndria ... · Aslunouni · • 0 Good 35.78 38.18 SM ·l l/8 . Memphis .
CotJI.pUed from official sources - net weight price for u. S. = spot price .:. .96. •
NOV .-DEC., 1953 -6-
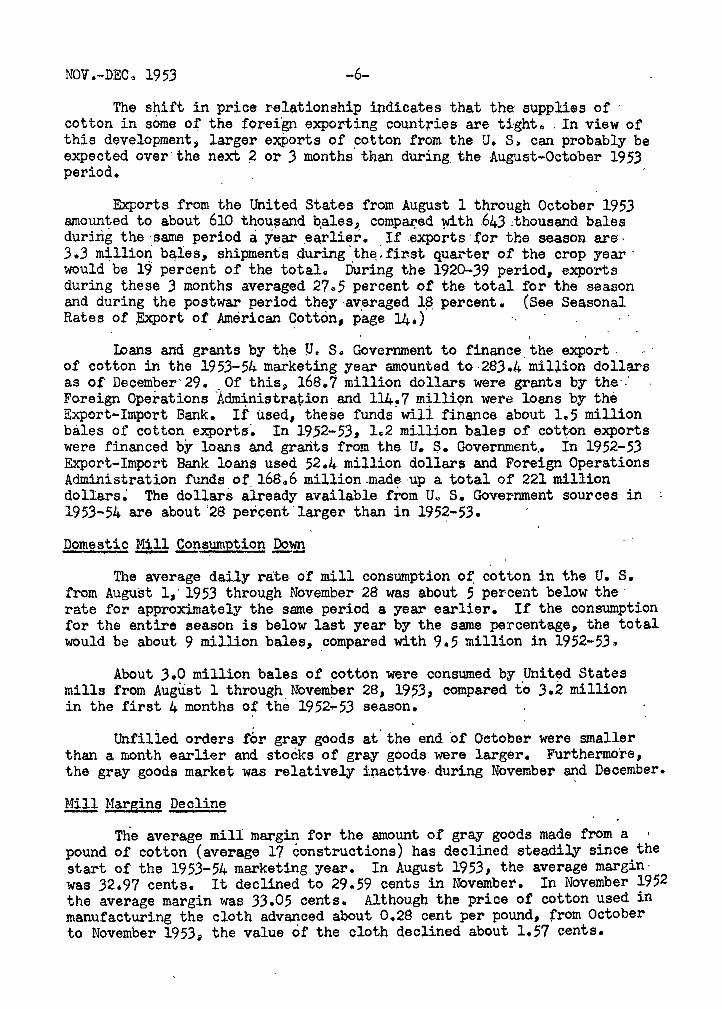
The shift in price relationship indicates that the supplies of · cotton in some o+ the foreign exporting countries are tight$ . In view of this development, larger exPorts of cotton from the u. s~ can probably be expected over· the next ~or 3 months· than during. the August-October 1953 period.
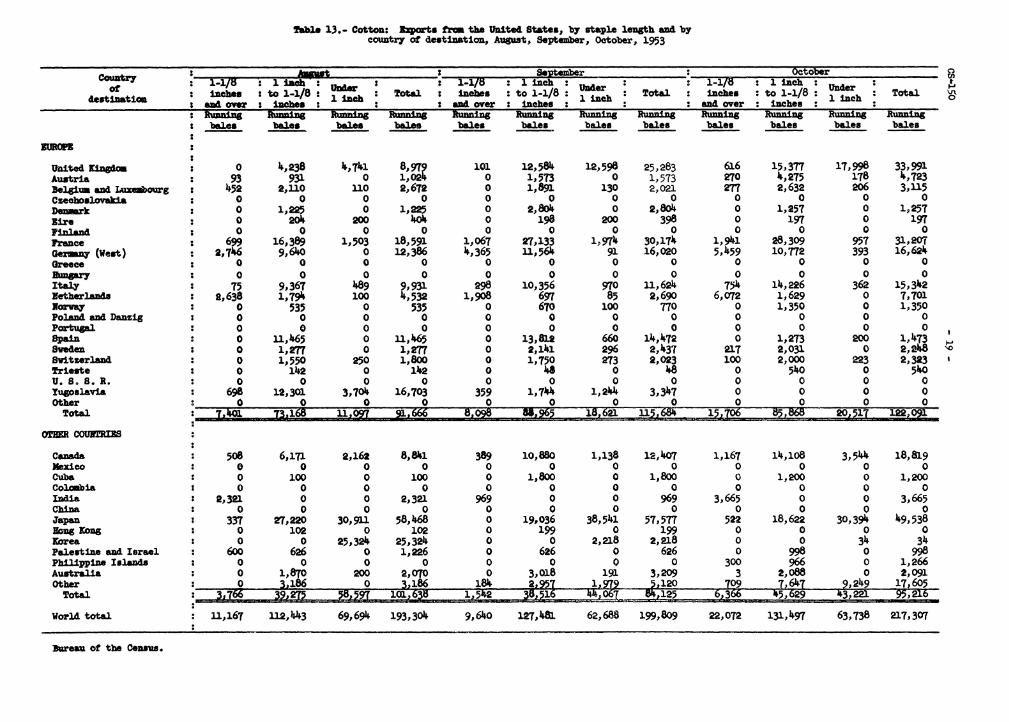
Exports from the United States from August 1 through October 1953 amoun~ed to about 610 thoU;~and ~ales, comp~e.d with .643 :thousand bales duririg the ·same period a year .earlier. If .exports·tor the season ar$·
3.3 m~llion b~Ies, shipments 4uring'th~:fir,st quarter or the crop year· would be 19 percent of the totalQ During the 1920-39 period, exports during these 3 months averaged 27o5 percent of the total for the season and during the postwar period they·av~raged 1~ percent. (See Seasonal Rates of ~ort of American qotton, page 14.)
)
loans and grants by t~e J1 e s. Government to finance. the export . of cotton in the 1953-54 marketing year amounted to.283.4 million dollars as o! December· 29. _Of thisl> 168.7 million dollars were grants by the-." Foreign Operations Adm~istra~ion and 114~7 m~lliQn were loans by the Export•Import Bank. If used, these fund~ will finance about le5 million bales of cotton exports·~ In 19.52-53, 1 .. 2 million bales of cotton exports were financed by loans and grarits from the u. ~. Government.. in 1952-53 Export-Import Bank loans used 52.4 million dollars and Foreign Operations Administration funds of 168.6 million.made-up a total of 221 million dollars~ The dollars already available from U.., s. Government sources in 1953-54 are about '28 percent·larger than in 195~-53.
Domestic ~ £2!ls~Rtion Jl2.'m
The average daily rate ot mill consumption o~ cotton in the U. s. from August 1,· 1953 through November 28 was about 5 percent below the· rate for approximately the same period a year earlier. If the consumption for the entire season is below last year by the same percentage, the total would be about 9 million bales, _compared with 9.5 million in 1952-53~
About 3.0 million bales of cotton were consumed by United States mills from Aug\ist l through.. Novem~er 28, 19?31 compared t'o 3.2 million in the first 4 months of the 1952~53 season.
Unfilied orders fbr gray goods at. the end or October were smaller than a month earlier and stocks of gray goods were larger. Furthermo're, the gray goods market was relatively i~active. during November ~d December.
~ Margins Decline
The average mill margin for the amount of gray goods made from a · pound of cotton (average 17 constructions) has declined steadilY since the start of the 1953-54 marketing year. In August 1953, the average margin· was 32.97 cents. It declined to 29.59 cents in November. In November 1952 the average margin was 33.05 cents. Although the price of cotton used in manufacturing the cloth advanced about 0.28 cent per pound, from October to November 1953j the value of the cloth declined about 1.57 cents.

CS-150 -7-
Cotto~. Prod~y~~ Large
The 195.3 cotter~ ·c~ .. o.p is estim~ted at· .16..,272,~~000 :cD.nning bales (16,437 ~000 bales of 500 pounds),, This is the largest crop since the record of 181 252,000 rum1ing bales in 1937 &id is lo3 million bales la;rger· than the 19-52 cropo The. acreage in cultivation. en July 1,. 1953 wa;3 l. 7 million smr:::J.lei~ th·an a· year earlier~. However, abandonment was 3.7 percent in 195~ compared vrith 5o5 peroent in 195~ and acreage hai'ovested wa~ dovm only 1.4· million. The 1953 average yield per acre for the U. Sc was a record 322.4 pom1ds. Although some states, such as Missou:ri, Tennec;see, Nississippi, wuisiana, Ne\'t Mexico s Arizona a..{d . California show high yieldst no tndiv:i.duul state has a :r·ecord yield •
. . ... ·On December 15, cotton produt::ers approved the 1954 mt;l.rketing quotas
for upland and .extra~lcmg st0.ple cotton by majoritie5 ·of 94 .. 1 'and 89~2 per·cent, respectively$ Approval by a two-thirC.s r;,~;.jo:rity of those voting .is required by· ·law before the· :marketing· quotas c~n [?eco;ne mandatory for all producer·s,
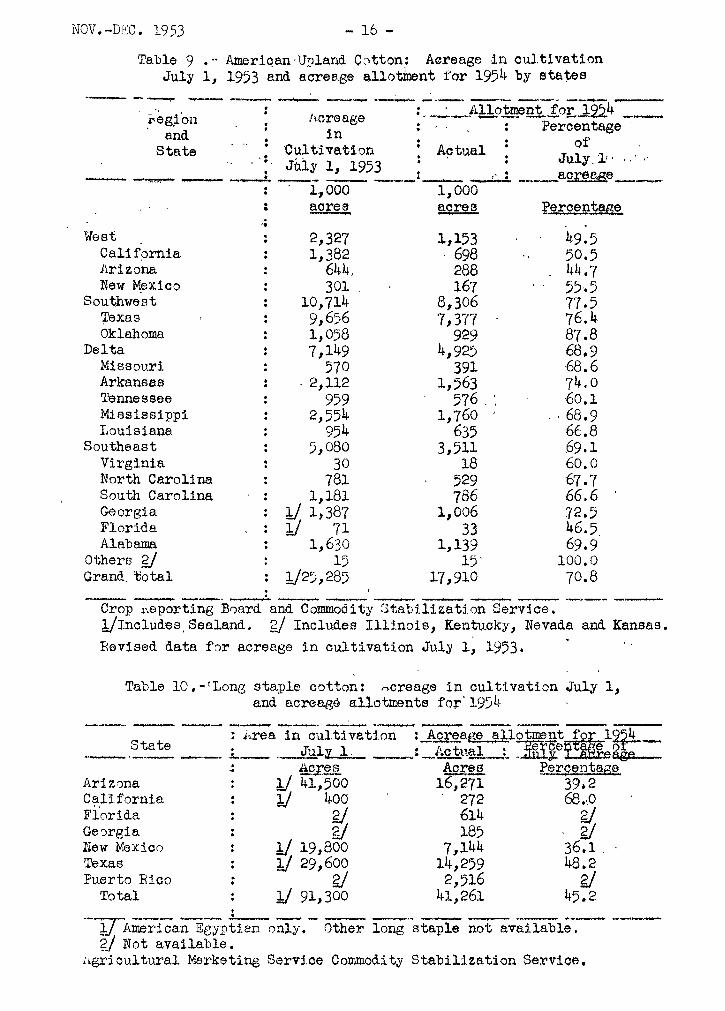
State acreage allotments for the 1954 crop of upland cotton were announced by the Department of Agriculture on November 23. · Those fer . . extra-long staple cotton· ~ere alli!Ounced on Dec6mber 4~ (See tables 9 and 10.) As required by law; State allotme~ts were based oa the acreag~s
, planted.·in l947·p 1948·,. ·1950; 19-51, and 1952. However; no S.tate allotment for upland cotton can be less than 4;000 acres or the highest acreage
. ·plant;:;d. in 1951·» 1952 o·r·l953 ~ v.;hicheve'r is smaller, fo'r up.land cot ten.
: Oh" Decembe~~ 11, · the Secretary of Agricultu~e announced that he would recornm~md to the Congre.:.s an increase in }.he National Acreage .
· Allot:>:rJDht. The' allotment under' current .. legislation is 17 .9. million acres and the Secretary's recommendation is for an increase to about 21 ~lllion.
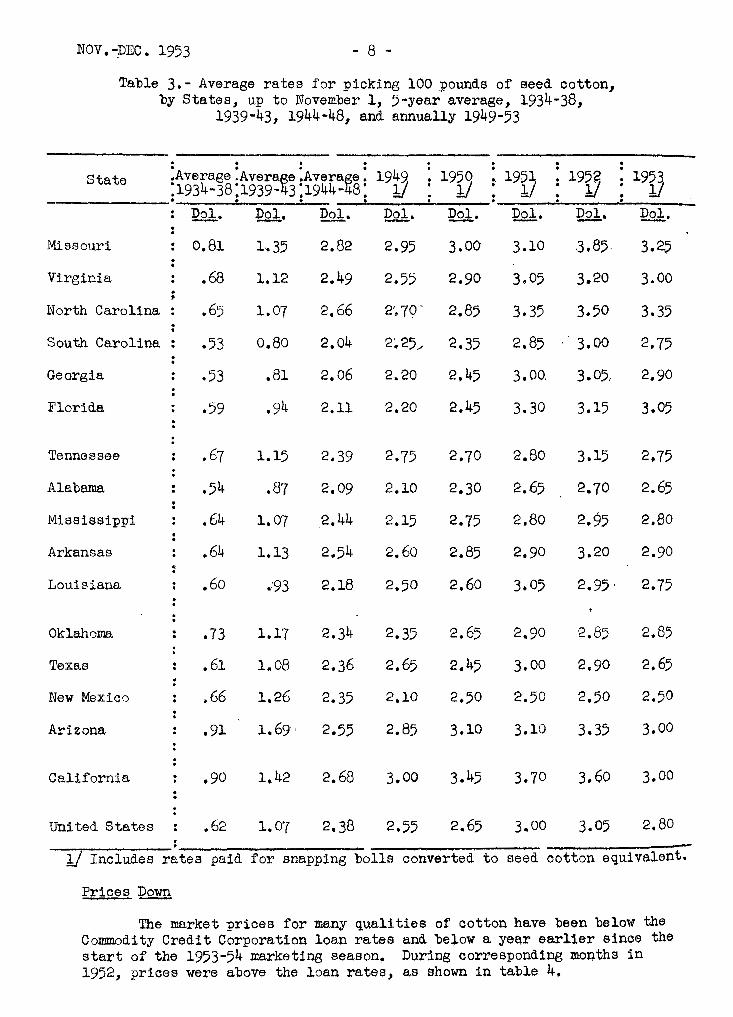
The aver~e wage rate for picking cotton in 1953 was ~bout 8 per-, cent lower than. 'in 1952, and the·lowest since 1950. No. Stat~ had a higher picking cost per hundred pounds in 1953 than in 1951 ~:d 1952, and the
. wage ~ates in most stat@S were lbw·er in 19 53:; than hi the t~o preceding year~i as sho~m in table on following page.
NOV, -_DEC • 195 3 - 8 -
Table 3.- Average rates for picking 100 pounds of seed cotton, by States, up to November 1, 5-year average, 1934-38,
1939-1~3, 1944-48, and annually 1949-53
. . . . . :Average:Avera~e:Avera~e: 1949. 19~
• 19iJ State - 19~ 19iJ :1934-38:1939· 3:1944~ 8: 17 : 1 . .. . . .
Dol. - Dol. ~Ql. ~. ;Q,Ql. Dol, M· ;Q.Ql.
Missouri 0,81 1·.35 2.82 2.95 3.00 3.10 .3.85. 3.25
Virginia .68 1.12 2.49 2.55 2.90 3.05 3.20 3.00
North Carolina .65 1.07 2,66 2'. 70' 2.85 3.35 3.50 3.35
South Carolina .53 0.80 2,04 2~25_, 2.35 2.85 3.00 2.75
Georgia .53 .81 2,06 2.20 2,45 3.00. 3.05, 2.90
Florida .59 ~94 2.11 2,20 2.45 3.30 3.15 3.05
Tennessee .67 1.15 2.39 2.75 2,70 2,80 3.15 2,75
Alabama .54 .87 2,09 2.10 2,30 2.65 2.70 2.65
Mississippi .64 1.07 2.44 2,15 2.75 2,80 2.95 2,80
Arkansas .64 1.13 2.54 2.60 2.85 2.90 3.20 2.90
Louisiana ,60 .,'93 2.18 2,50 2,60 3.05 2.95. 2.75
Oklahoma • 73 1.17 2.34 2,35 2,65 2.90 2.85 2.85
Texas .61 1.08 2.36 2.65 2.45 3.00 2.90 2.65
New Mexico .66 1.26 2.35 2,10 2,50 2.50 2,50 2.50
Arizona .91 1.69·' 2.55 2.85 3.10 3.10 3.35 3.00
California .90 1,42 2,68 3.00 3.45 3.70 3.60 3.00
United States .62 1,07 2.38 2.55 2.65 3.00 3.05 2,80 . . l/ Includes rates paid for snapping bolls converted to seed cotton equivalent.
Prices ~
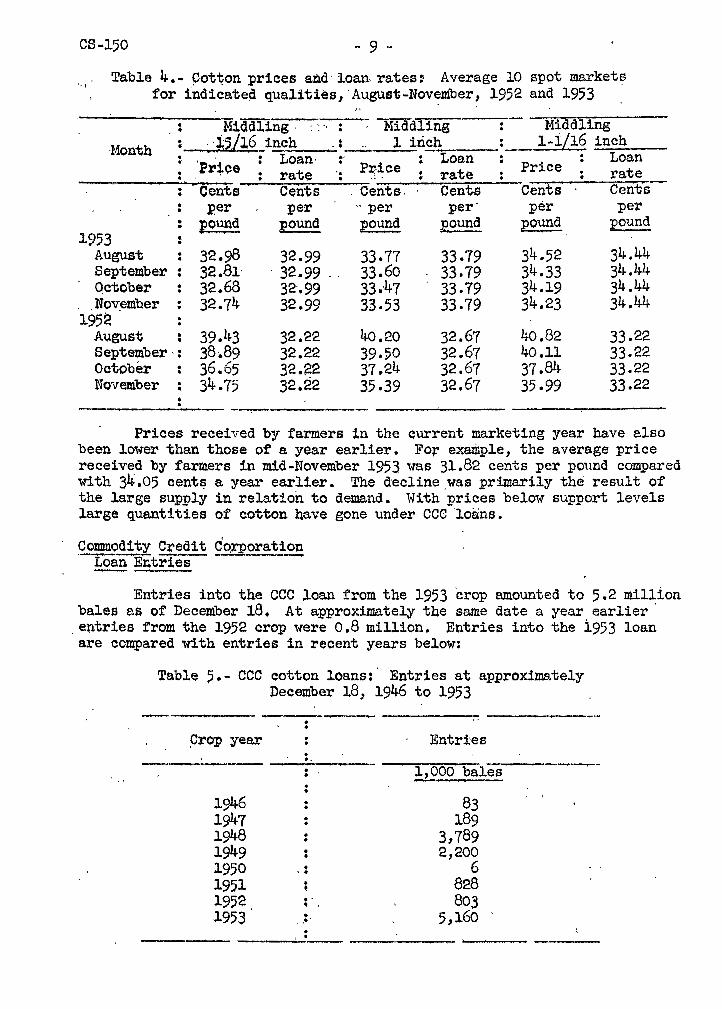
The market prices for many qualities of cotton have been below the Commodity Credit Corporation loan rates and below a year earlier since the start of the 1953-54 marketing season, During corresponding months in 1952, prices were above the loan rates, as shown in table 4.
CS-150 - 9 ..
.,, Table 4.- pot~on prices and· loaTh rates: Average 10 spot markets for indicated qualities,·August-November, 1952 and 1953
Middling. ' ~ .. . . . . -:- Middling Middling . · ·~2.Ll6 inch . 1 irich l-1Ll6 inch ·Month . . . : Loan· •· Loan Loan
'Pr~~e • P~~ce Price rate .. • xate rate • • . Cents Cents . Cents. Cents Cents Cents • per per ··per per· per per
: E?~d pound :EOUn_d pound pound pound 1953
August . 32.98 32.99 33.77 33-79 34.52 34.44 • September 32.81· . 32.99 .. 33.60 33.79 34.33 34.44 October • 32.68 32·.99 33.-47 33.79 34.19 34.44 . November . 32.74 32.99 33.53 33.79 34.23 34.44 .
1952 August 39.43 32.22 40.20 32.67 40.82 33.22 Septem'Qer · : 38 .. 89 32.22 39.BO 32.67 40.11 33.22 October 36.65 32.!22 37.24 32.67 37.84 33.22 November . 34.75 32.22 35.39 32.67 35-99 33.22 •
Prices received by farmers in the current marketing year have also been lower than those of a year earlier. For example, the average price received by farmers in mid-November 1953 was 31.82 cents per pound compared with 34.05 centf? a year earlier. The decline _was primarily the result of the large supply in relation to demand. With prices below support levels large quantities of cotton nave gone under CCC loans.
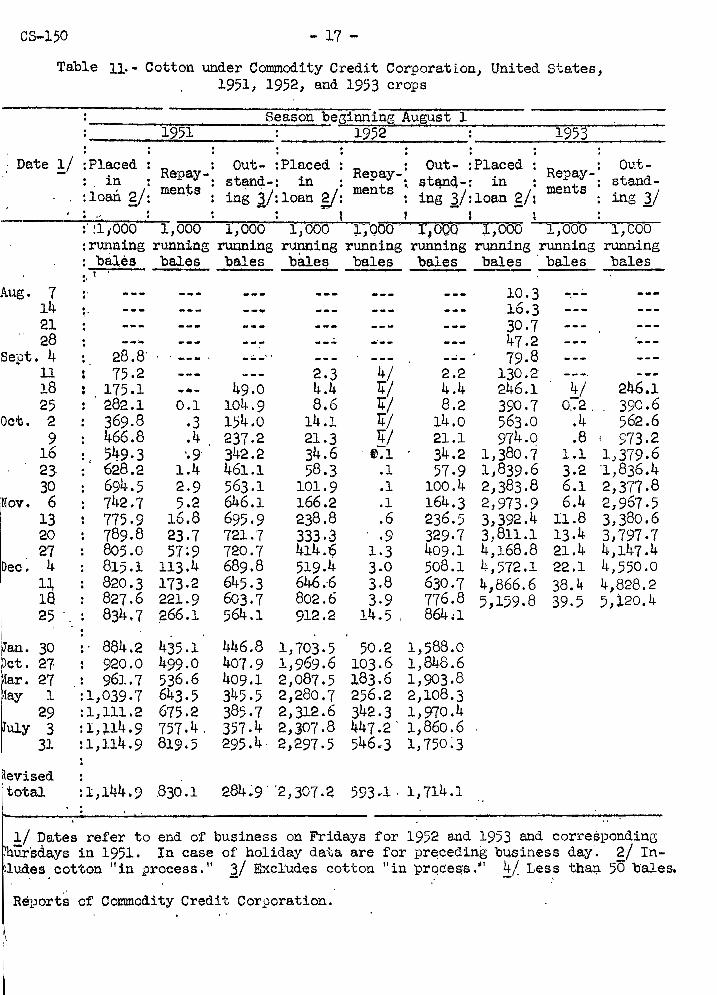
Commodity Credit Corporation Loan Entries ~
Entries into the CCC ~oan from the 1953 crop amounted to 5.2 million bales as of December 18. At approximately the same date a year earlier ·
. entries from the 1952 crop were 0.8 million. Entries into the i953 loan are compared with entries in recent years below:
Table 5·- CCC cotton loans:· Entries at approximately December 18, 1946 to 1953
.. . Crop year Entri:es
• . . -- 1,000 bales ---.--
1946 . 83 • 1947 . 189 . 1948 3,789 1949 2,200 1950 • 6 ' . 1951. 828 19~2. . . 803 ~ . 1953 ' ~:· 5,16o .
' .
NOV. ··DEC . 195 3 - 10 -
Table 5 Sl:t~M6. g:ross en.t:des into the. loan •. Thirty•nintL thousand bales of '1953 crop cotton ha:cfbeen w::thdra:w::t from the loan by December 18. Undoubtedly, some l:);:J.ns vTill be .repaid .as the 8eason :p:;:·og:resses. Neverthe-less, about 4.5 Dillion baie::; Of '1953-·CrO:p cotton zrtay 'bG U~der t.he loan When the cur :rent see-son: ends; ,Tuly 31, 1951+. About 2 ,million. bales· from· :previous crops ,.;·e:ve helQ. by :the CCC at the start of the 1953-54 mo.rketing year. Most of this cott'on.. will~ :prcb'ably.:still be held by the CCC when the curre!'lt season ends. Total' CCC s~o'cks on Augu;st 1, 1954. (inc-luding loans on 1953-cro:p cotton plus stoc:{s fro;mt previous ~reps) may be nea.r 6-.5 million bales.
~ ..... . . .
Linter~ Prices Decline ---·----'
Linters· prices eontinut..d to· decline. uUring October and N'cwember. Pricec of mo·st · g:£>ades have· been declining slightly but 8teadily since the start cf tl1e c'l!l.:i-rent marketing yc.ar and are lower than they .were a year earlier; as sho~; below·. ,.
':PabJ.e 6.- Cotten lintsx·s: Average monthly pricE.G 1 U o S., · Aug-i.Jst.-Noverubex ~952 and August-October ~953
Grad_e __ ___,_ -Month and :year
--- -------- -- ------
< ..
1
Cents per
:po':lnd
2
·cent.s per ~?d
Cej:lts :per
,poun<I
, -~
4· . 5 . - . Cents--Cents ~~ pel' :pe:c
:Pound :pound
Cents :per.
E9Und
: . 7 Cents per
R_OUDC!_ 1952
August September October November
1/ 14.01 13.98 14,01
12.18 12.03 12.21 12.25
i0.,52 10.30 10.71 10.56
8.37 7 .39. 7.13 7.25
6.68 5.25 4.99 5.06
5.99 '4.26. '3·· 98 4.04
5.85 :.< 4.04
3.65 3.69
1953 Au~st September October
11.92 13.55 13.29
11.25 11.46 11.33
9.07 9.01
'8.83'
6.23 4.4l~ 5.99 4.26 5 o6 4,J'6 •.;1 ~v
3.85 3;72 3,54
3.82 3-53 3.46
!:,/ Not available·. '' ' ~ ------------ ------------ --------'I'he decli:a.e in pric.e.s is, in la.rge :pa:r-t, due to the record supply of
linter::; in prospect for 1953-54. The supply, now estimat:~d at about 3 million bales, includ:l.ng p!'oduction of about 1.9 million bales, a :;;tarting carryover of LO million~ and estimated imports of ~bout 0.1 m:i1lion. Although disappearance is expected to·be ·close to the high level cf last season, L5 million bales, the carryover on August 1, 1954 is e::1:p-::cted to be a record of about 1,5 million bales·.
!'rices of Pm::ified Lint~ and WO•)dpul:p
The price of purified linters (or linte~s pulp) in October was 11.20 cents per :pound, compared with 11.85 cents in September. The October price was below that of acetate 'and cu:pr-a grade dissolving woodpul:p -vrhich was selling for 11.25 cents per pdund. ~he :prices 1or other grades of dissolving woodpulp were well be1ow.the price of :purified linters. Standard viscose

CS-150 - 11 -
grade dissolving woodpulp was selling for 9.25 cents per pound in October and the price for high-tenacity grade was 9.75 cents.
Rayon Production Declines
The production of rayon and acetate in the United States bas been declining steadily since July 1953 when it was 112.1 million pounds. Output was 92.2 million in October and 82.9 million in November. The rayon and acetate industry operated at 66 and 61 percent of capacity in October and November. At the same time, producers stocks have been increasini. These stocks were 108.3 and 101.6 million pounds at the end of October and November 1953, respectively. The October stocks were the largest since March 1952 when they were 119.7 million pounds.
Rayon and acetate filament yarn prices of 78 and 73 cents a pound, respectively, have been the same for more than a year. Staple fiber prices have not changed since last May. Both types of staple fiber are selling for 34 cents a pound. The rayon and acetate industry appears to be meeting variations in demand by changing its volume of production while maintaining stable prices.
SEASONAL RATE OF EXPORTS OF AMERICAN COTTON !_/
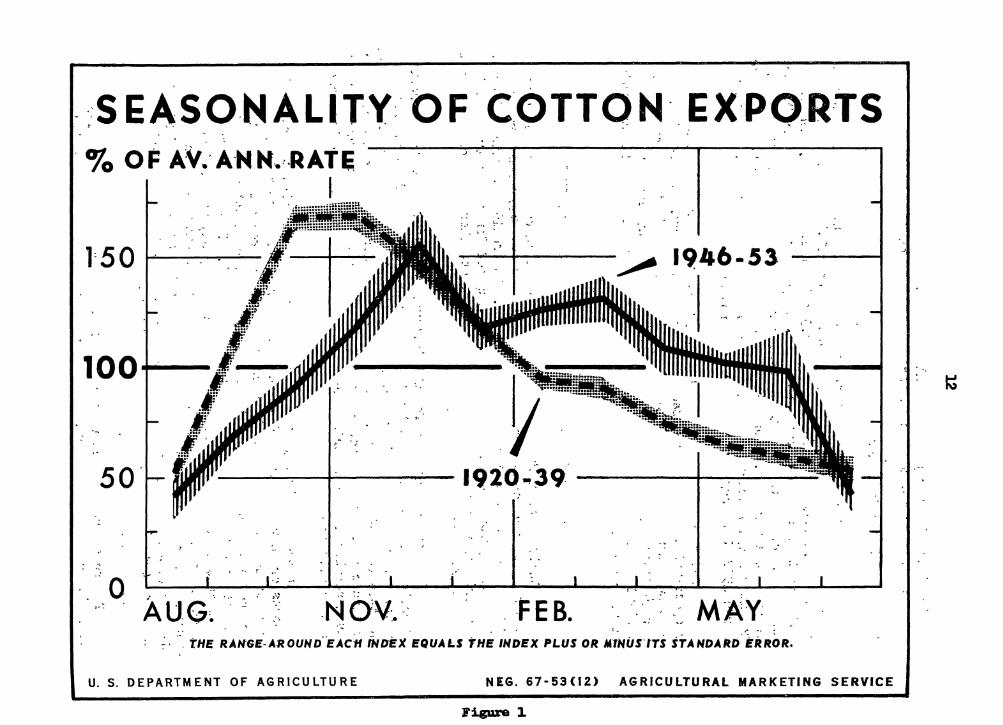
Analysis of monthly export data for American cotton reveals that the seasonal pattern for the postwar years (1946-53) differs in several respects from that of the interwar period (1920-39). The solid and dashed lines in Figure 1 represent the seasonal index as computed for the postwar and interwar periods, respectively. Table 7 also presents these indexes, along with several other related measures.
The seasonal pattern for the interwar years indicates that exports of cotton were usually at a low for the year in July and August. From August exports normally increased sharply to a peak in October and November and then fell off steadily to the summer low. This pattern conformed more or less closely to that for cotton ginnings, indicating that export demand was generally heaviest during the period when there existed the best choice as to qualities of cotton.
In the 7 postwar years for which data are available, the rate of exports ordinarily increased in the fall from a July-August low. In contrast to the prewar period, however, they did not reach a peak until December and then at a level lower relative to the annual average than the October-November peak in the interwar period. In January, the rate of exports tended to drop off from the December peak, rose slightly to a secondary peak in March, and then declined to a summer low. The data also show a higher normal rate of exports relative to the annual average from January to June of the postwar years than that typically experienced in the corresponding months of the interwar years.
1/ The research on which this report is based was carried on under authority of the Agricultural Marketing Act of 1946 (RMA, Title II).
_·.·SEASO.NALIT-Y:·-oF·c:OTTON- EX·PO_R·TS ):' \ ' ... > I • I < .~. I • • ' • "< > •
- ' ... . ' . _· . . ..
. ~0 OF A;V~·AH~f..,.RATE. ~
' t.
;-• ;·: :·' I '<-
l50 ' ...... ~ 1946-53 ':-
f- ~
~ .. 1oo...-·-
.. .. . -~ y
so· _ __.___,..--+--- 192'()..; 3 9 ---~..:..--_____...; ..
--J.. ., ~
...-.: ~ .. . .. 0 I .. I__ ) .; ...
. A·uG~·· .. _. ~ .. _ ::~ -·NOV_.:_. ·-FEB. _- -~--:·· ~~ MAY: ;_:tHE ~A~GE.-A.ROUHD--E~CH fHDEX-EQUAt.S THE ~~~EX PLUS OR M~Hi.JS'ITS STAHDARD'tkR~R:
U.S. DEPARTMENT OF AGRICULTURE N tG. 67-53 (12) AGRICULTURAL MARKETING SERVICE
Fi.gure 1
CS-150 - 13 -
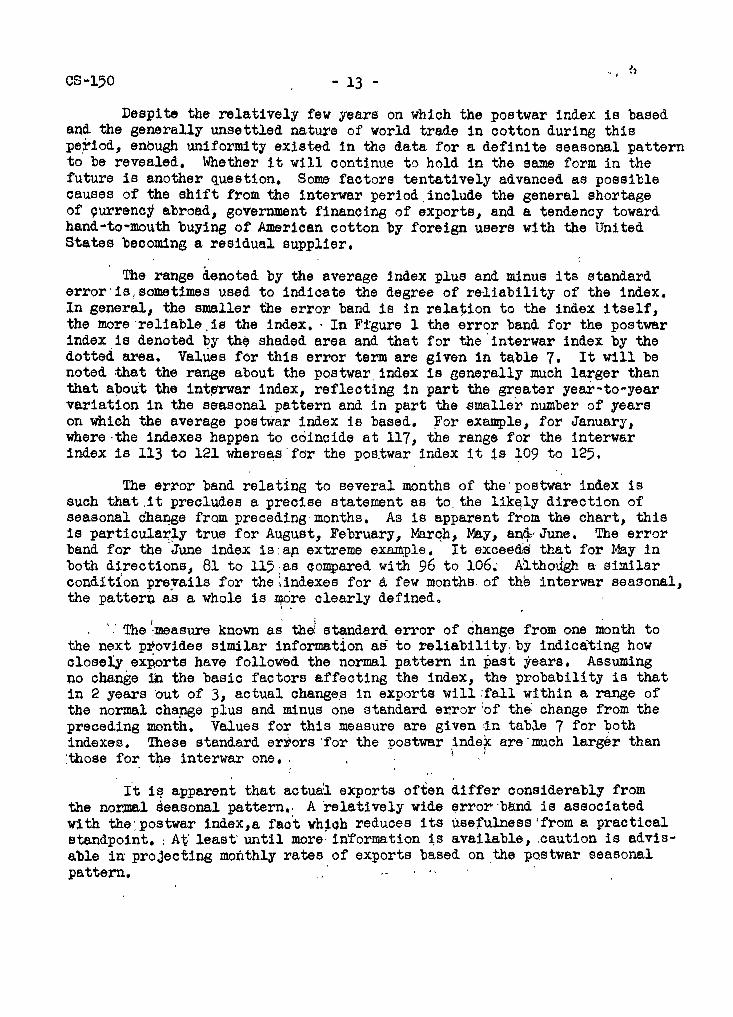
Despite the relatively few years on which the postwar index is based and the generally unsettled nature of world trade in cotton during this pe.riod, enbugh uniformity existed in the data for a definite seasonal pattern to be revealed, Whether it will continue to hold in the same form in the future is another question. Some factors tentatively advanced as possible causes of the shift from the interwar period,include the general shortage of 9urrency abroad, government financing of exports, and a tendency toward hand-to-mouth buying of American cotton by foreign users with the United States becoming a residual supplier.
The range denoted by the average index plus and minus its standard error·is 1 sometimes used to indicate the degree of reliability of the index. In general, the smaller the error band is in rela~ion to the index itself, the more ·reliable .is the index. · In Fi'gure l the error band for the postwar index_is denoted ~Y the shaded area and that for the.interwar index by the dotted area. Values f6r this error term are given in table 7. It will be noted that the range about the pqstwar.index is generally much larger than that about the int~rwar index, reflecting in part the greater year-to-year variation in the seasonal pattern and in part the smaller number of years on which the average postwar index is based. For example, for January, where-the indexes happen to coincide at 1171 the range for the interwar index is 113 to 121 whereas ·fo-r the poe.twar index it j.s 109 to 125.
The error band relating to several months of the·postwar index is such that.it precludes a precise statement as to. the lik~ly direction of seasonal Cha~e from preceding· months. As is apparent from the chart, this is particula~~Y true for August, February, Mar~h 1 May, anq,/June. The error band for the June index is:ap extreme ex~ple. It excee~ that for May in both directions, 81 to 115. as compared with 96 to 106.: A:l th01lgh a similar condition preyails for the;indexes for a few months. of the interwar seasonal, the pattern as a whole is ~~re clearly defined.
' .. The :measure known as' thai standard error of change from one month to the next provides similar information as to reliability. by indica~ing how closely exports have followed the normal pattern in past years. Assuming no change ~ the basic factors affecting the index, the probability is that in 2 years ·out of 31 actual change.s in exports will :fall within a range of the normal chapge plus and minus one standard er.ror:of th& change from the preceding month. Values for this measure are given :in table 7 for both indexes. These standard errors 'for the postwar ~nde~ are·much larger than :those for the interwar one. . 1 '
' '
r't i~ apparent that a:ctua:l exports often differ considerably from the normal seasonal pattern,, A ·relatively wide error·bend is associated with the:postwar 1ndex1 a fao't wh~oh reduces its usefulness 'from a practical standpoint. :A~ least· until more· in~ormation ~s available, .caution is advisable in projecting monthly rates of exports based on.the pQstwar seasonal pattern. ·

Table 7 .-Exports of raw cotton from the United States: Index numbers of seasonal-variati~n, standard error of index for each month and., of the change _
from one month to the next·- -
y
--~nterfNar Period (19.26 to 19_3.-;.9~) ---- ------·------ ----- ____ , -·- . . . - . . . ---.:-:-.....- -----
Seasonal index Standard error of
index Standard error of
change from pre-ceding month
Seasonal index Standard error of
index Standard error of
change from pre-ceding month
Aug. . . Sept. • c • • • - • • •
Oct. : Nov. : Dec. : Jan. ~ Feb. : Mar.' :. Apr. : May . . -:
June . .. July
:Percent Percent Percent Percent Percent Percent Perce~t Percent Percentl'ercent Percent Percent : gL 2/ 2/ 2/ 2/ 2/ 2/ 2/ ' -2/ 2/ 2/ - 2/ . 52 114 168 .168 147 117 94 '90 74 64 . 59 53' . . 3-2 5-5 5.4 6.2 4.8 3.8 4_.0 4~2 ·3.6 4.0 4~9 ;5:~~ . . .
5.4: . 6.4 6.4 7·7 8.2 7.8 6.1 :5.5 5.8 •" 5·5 6.3 ·7~4 . ----- ---
PGstwa'~·- Period U:946 to 1953) ---. 41 70 91 119 156 117 125 131 108 101 99 42 .
. 8.4 6.7 9·3 13.1 14.3 8.2 5.8 9-7 11.5 4.8 17.3- 7-4 . . . . .·, . : 11.2 10.7 11.5 16.1 19.4 16.5 10.0 11.3 15.0 12.5 18.0 _. i8.8 . . -
!/Based on ratios of each-month's exports. to the centered 12-month moving av~rage rounded and adjusted to total 1,200 for the year. Each figure shows the normal value for each month as a percentage of the average.for all months of tQ.e year. .. .- ..
g/ Percent of average monthly rate.
z • <:: . b ~ • I-' '-0 \J1 \.>.)
1-' +:-
'
CS-150 ·- 15 -
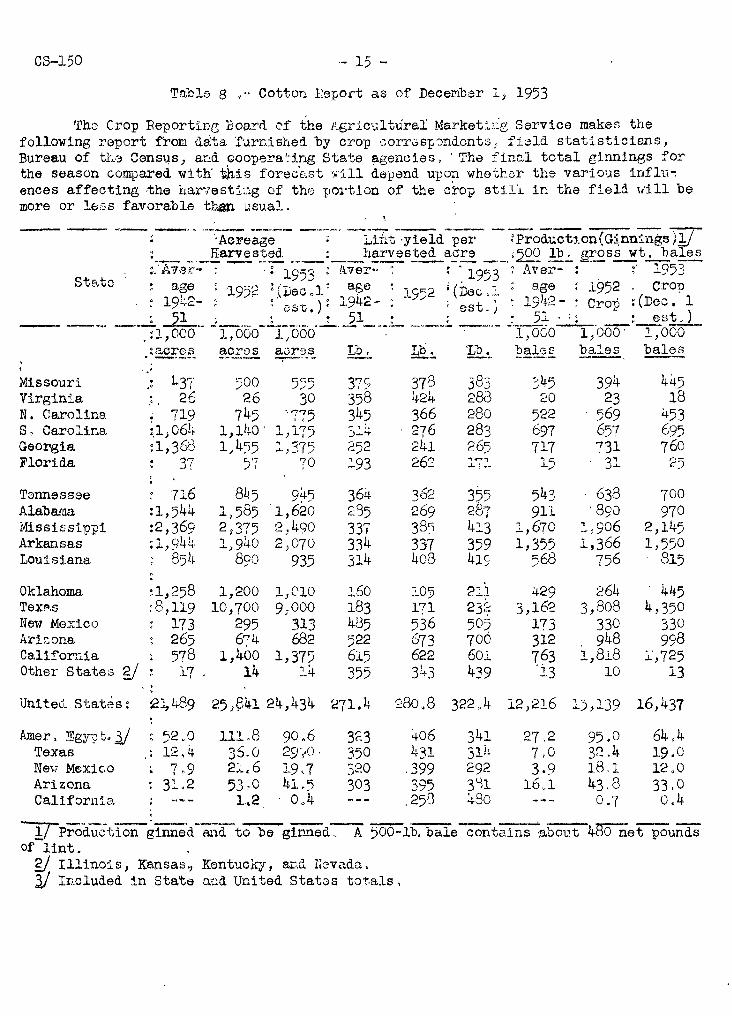
Tabl& 8 ·· Cotton .Ee:po.ct as of Decer1ber l, 1953
Th:) Crop :Re:portir:e; 13oard cf the Agric":.~ltural Ma.rket::.l:::g Service makes the follow·ing report f'rom data f·.Jrr;.ished by crop ·.:;orr.:;sp:mdonts; fi8ld statisticians, Bureau of tt.·) Censtls} ar~d coopera '::ing Ste:te ~ge~"Wies, · The fi!!al total ginnings for the season com-J!ared 'With' this forec't:<.st ·~·J.ll depend upo~ ·whet:l::.ar the various infln~ ences affecting ·the har·restL;.g of the :pOl'tlon of the crop stt:!.·L in the field Vill be more or l~ss favorable than usual.
. 1
... Missouri . L3{' )00 555 37~ 378 383 ::;45 394 445 • c
Virginia .'. 26 26 30 358 424 2&3 20 23 18 N. Carolina . 719 745 ~.775 345 366 280 522 569 453 s, Carolina :1.06!~ l,lt~O. l) 175 .... ; ,. 276 283 697 657 695 . > .)-'T
Georgia d,368 1,455 ::..,375 252 241 265 717 731 760 Florida Q'7 57 70 2.93 26'2 ~ .... , 15 ~'1 r·-
.. J l .L j ·- ..l-'- C.)
Tennessee 716 845 04'1 36/.t 362 355 543 638 700 ./ . ~ Alabama :1,544 1,585 1,620 2S5 269 :;:l$"7 911 '890 970 - I
Mississippi :2,369 2j375 :2,490 337 38'-i 42.3 1,670 ::.,906 2,145 Arkansas ;l, 94~. 1,940 2,070 334 337 359 1,355 1,366 1,550 Louisiana 85h 890 935 314 408 41S 568 756 815
Oklahoma ~1J258 1,200 1,010 l60 }_05) 2::...1 ~29 264 445 Texl".s :8,119 10,700 9;000 183 1?1 23~ 3 ,16'2 3,808 4,350 New Mexico 173 295 313 485 536 505 17~ ,j 330 330 Ari::.ona 265 67L~ 682 522 6'7~ 700 312 948 998 I~
Califorr~ia 578 1,400 1,375 615 622 60.i. 763 1,818 :.L' 725 Other States g) "7 14 ::_4 355 31.:-3 439 'i3 10 13 .L I •
. ' '
UnitecL States: :21,489 25 ;$41 24' }+ 34 ~71.4 280.8 322,4 12,216 l),l39 16,437
Amer, ~gy·g t. ;J 52.0 111-8 90,6 323 406 341 27,2 95,0 64,4 Texas 12,4 J6.0 29·~·C1 · 350 431 311~ 7,0 32.4 19.0 Ne>; Mexico 7~9 2l.6 19,7 320 .399 292 3.9 18.1 12.0 Arizona 3:;..,2 53.-0 41.'1 303 395 3l\l 16<1 43.8 33,0 California 1 .. 2 o.,4 .25S 4.30 0.7 0.4
YProduction~inne'd- and to be girl'!led-::--A" 500-lb, bale contains 'e~400Ii'et pounds of lint. .
g) Illinois, Kansas., Kentucky, a.-;.d r;ev ada. 3./ Included in Sta'te o.~:.d United Stat0s tot.als,
NOV.-DEC. 1953 - 16 -
Table 9 • - American ·UTJland C:)tton: Acreage in cultivation July 1, 1953 ~nd a~reage a1lotkent for 1954 by sta~ee
·--~ ~ ---- -- _,.....,. --~ ------- -- --- .. _ _...,._ ---: _ ,__:.._AJ:l.o.;llJ!ent .f.or.J:22.4 _ .,
:1-egf_'on · and
State
: here age • in • ·cultivation
Percentage · of
July. J.• · .. · ·· . : Jttiy 1, 1953 ____ ...,..,...,.. ... - ___ __... ________ : __ -.:...·· .:.: -·~-agregse __ _
West Calif.ornia Arizona New ~exico
Southwest ':['exas Oklahoma
Delta Missouri Arkansas 'l'enneseee Mississippi Louisiana
Southeast Virginia North Carolina South Carolina Georgia Florida Alabama
Others gj Grand. total
. . .•
. .
1,000 1,000 aorea
2,327 1,382
644. 301 .
10,714 9,656 1,058 7,149
570 . 2,112
959 2,554
954 5,080
30 781
1,181 J) 1,387 JJ 71
1,630 15
l/25,285
acres
1,153 . 698
288 167
8,306 7,3Tf
929 4,92.)
391 1,563
576.: 1,760
635 3,511
18 529 786
1,006 33
1,139 15'
17,910
~~.roentage
49.5 50.5 4~."( 55·.5 77.5 76.4 87.8 68.9 68.6 ?4.0 ·60.1
. '68.9 66.8 .69.1 60,0 ·67. 7 66.6 72.5 46.5 69.9.
100.0 70.8 _____ .. - ----
Crop i~eporting B0ard and Commodity 3tabilization Service. ~Inc1udes.Sea1and. gj Includes Illinois, Kent~cky, Nevada and Kansas, Revised data fQr acreage in cultivation July 11 1953.
Table 10. - 1Long staple cotton: ncreage in cultivation July 1, and acreage allotments foT'l9~4
-- :i,rea'i~~ltivati;;-: Acreag; 'ailotment furl~2tf--4~-__ .s_t_a_t_e - .L_ .____Y'u1l ,1 .• ___ ::._J~~-tnal_j_ ~lfJie£~ijge""4~S!!r'A.___
Ariz0na California Fl0rida Ge'Jrsia. liew Mexico Texas Puerto Rico
Total
! il~~ ~es percentage ~ 41,500 16,271 39.2 v 400 . 272 68.:0
y 614 gj y 185 ·Y
jJ 19,800 7,144 36.1 . !I 29,600 14,259 48.2
gJ 2,516 gj ll 91,300 41,261 45.2
--..:...: __ YAmerican Eeyptian only.-~ long.staple not availabl;:- --
?} Not available, ••gricu1tural Marketins Service Commodity Stabilization Service.
CS-150 - l? -
Table ll·- Cotton under Commodity Credit Corporation, United States, 1951, 1952, and 1953 crops
------=-==-----S~e:..;a.;..::.s..;:..on;;;.....:..beginning August 1 1951 1952 .
. : Date "};,/ :Placed Repav-.= Out- :Placed : R : Out- ;Placed : in : v stand-: in : epay-. $t~q-: in : :ioan g/: ments · ing j/:loan ~: ments ; ing l/:loan g/: : -~ 1 1 I
1953
· Ov.tRepay-: stand-ments ing ll
:· ~1,·000 1,000 1,000 1,000 j_~"QOO .. l'~OQG - J.,OOO 1,000 1,000 :running running running running running running running running running : biles bales bales ba.J.es bales bales bales · bales bales
Aug. 7 14 21
" 28 Sept. 4
11 18 25
Oct. 2 9
16 23 30
Nov. 6 13 20 27
Dec. 4 1~ 18 25 ''
Jan. 30 Oct. 27 ~iar. 27 ',ay 1
29 u1y 3
31
• f .. .. . . ..
28.8' 75.2
175.1 282.1 369.8 466.8
:' 549·3 628.2 694.5 742.7 775.9 789.8 8o5.0 815.1 820.3 827.6 834.7
:· 864.2 920.0 961.7
:1,039·7 :1,111.2 :l,;Ll4.9 :1,114.9
evised :
..... _ 0.1
·3 .4 ·.9·
1.4 2.9 5.2
16.8 23.7 57~9
113.4 173.2 221.9 .266.1
435.1 499.0 536.6 643.5 675.2 757.4. 819.5
-~-~.
49.0 104.9 154.0 237.2 342.2 461.1 563.1 646.1 695·9 721.7 720.7 689.8 645.3 603.7 564.1
2.3 4.4 8.6
14.1 21.3 34.6 58.3
101.9 166.2 238.8 333·3 414.-6 519.4 646.·6 802.6 912.2
446.8 1,703.5 407.9 1,969.6 409.1 2,087.5 345.5 2,280.7 385.7 2,312.6 357.4 2,307.8 295.4· 2,297.5
---
' • .L
.1
.1
.6 ·9
1.3 3·0 3.8 3·9
14.5 '
2.2 4.4 8.2
14.0 21.1 34.2 57.9
100.4 164.3 236.5 329.7 409.1 508.1 630.( 776.8 864.1
50.2 1,588.0 103.6 1,848.6 183.6 1,903.8 256.2 2,108.3 342.3 1,970.4 447.2' 1,860.6 546.3 1,750;3
total :1,144.9 .830.1 284~9· '2,307.2 593~1. 1,714.1
10.3 16.3 30.7 47.2 79.8
130.2 246.1 390· 7 563.0 974.0
1, 380:7 1,839.6 2,383.8 2,973·9 3,392.4 3,811.1 4,168.8 4,572.1 4,866.6 5,159.8
4/ 072 .
.4
.8 1.1 3.2 6.1 6.4
11.8 13.4 21.4 22.1 38.4 39.5
246.1 390.6 562.6 973.2
1,379.6 ·r, 836.4 2,37{.8 2,967.5 3,380.6 3,797·7 4,147.4 4,550.0 4,828.2 5,l20.4
1/ Dates refer to end of business on Fridays for 1952 and 1953 and corresponding hur·sciays in 1951. In case of holiday data are for pr~ceding b'Usiness day'. 2/ Inludes cotton ''in process." 3/ Excludes cotton "in prqces.:s .~' 4/ Less tha.J;l 50 bales.
I ~ - • - '
' -
Reports of Commodity Credit Corporation.
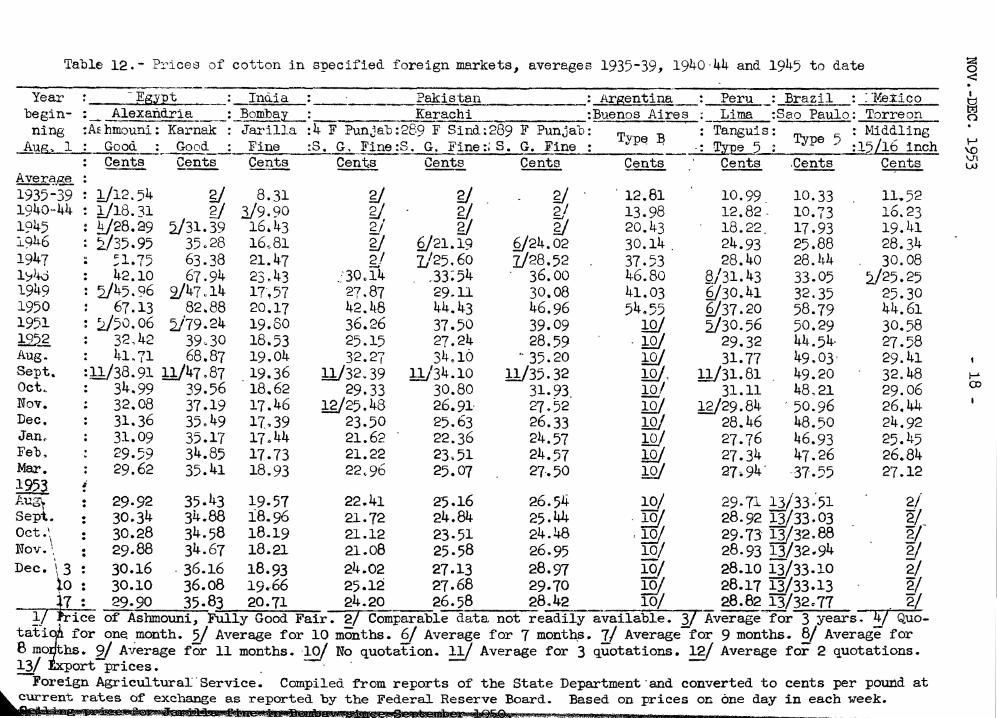
Table 12.- Pyices of cotton in specified foreign markets, averages 1935-39, 1940-44 and 1945 to date
Year : - Egyot : In<iia : Pakistan : Argentina : Peru : Brazil : : ·ttl8:tico begin- :_ Alexaiidria ___ :_~y__: Karachi :!3uenos Ai~:- Lima :Sao Paulo: Torreon ning :AE hmouni: Karnak : Ja~illa :4 F Pun~ab: 2B9 F S~nd :_289 F Punjab: Typ~ :a : Tanguis: Type 5 : Mid~ling
A}lg. 1 . Good . __ Good. . Flne .8. G. __ Flne.S. G. Flne .. S. G. Fine . . Type 5 . .15/lb inch Cents Cents Cents Cents Cents Cents Cents Cents Cents Cents - --- -- -- --- -- -- ~
Aver~.~ : 1935-39 : 1/12.54 gj 8.31 gJ gJ gj . 12.81 10.99_ 10.33 194o-44: b/18.31 g; 3/9.90 g; g; sf 13.98 12.82-1945 : !±/28.29 5./31.39 16.43 gj y g; 20.43 18.22 l946 ; ~35.95 35o28 16,81 gJ Q/21.19 2/24.02 30.14. 24.93 1947 ~ ;1.75 63.38 21.47 sf L'25.6o 1/28.52 37.53 28.4o 1~)+0 : 42.10 67.94 23.43 .:'30.14 .33:54 36.00 46.80 §/31.43 1949 : 2/45.96 2/47.14 17',57 27.87 29.11 30.08 41.03 §/30.41 1950 : 67.13 82.88 20.17 42.48 44.43 46.96 54.55 2/37.20 1951 : ~50.06 2/79.24 19.80 36.26 37.50 39.09 1Q/ 2/30.56 !222 : 32.42 39~30 18.53 25.15 27.24 28.59 - 1Q/ 29.32 Aug. : 41.71 68.87 19.04 32.27 34.16 ·· 35.20 lQ/ 31.77 Sept. :11}38.91 !1/47.87 19.36 !l/32.39 !1/34.10 l!/35.32 !Q/. !1/31.81 Oct. : 34.99 39.56 18.62 29.33 30.80 31.93 lQ/ 31.11 Nov. : 32.08 37.19 17.46 !£/25.48 26.91- 27.52 !Q/ 1'?:/29.84 Dec. : 31.36 35.49 17 .• 39 23.50 25.63 26.33 JJ)} 28.46 Jan, : 31.09 35.17 17.44 21.62 22.36 24.57 !Q/ 27.76 Feb. : 29.59 34.85 17.73 21.22 23.51 24.57 !Q/ 27.34
10.73 17.93 25.88 28.44 33.05 32.35 58.79 50.29 44.54· 49.03-49.20 48,21
- 50.96 48.50 46.93 47.26
-37.55
11 .. 52 16.23 19.41 28.34 30.08
L/25.25 25.30 44.61 30.58 27.58 29.41 32.48 29.06 26.44 24.92 25.45 26.84 27.12 Mar. : 29.62 35.41 18.93 22.96 25.07 27-.50 J:Q/ 27.94 ·
195~ ! . -Au~ : 29-92 35.43 19.57 22.41 25.16 26.54 10/ 29.71 13/33-51 2/ Sept. : 30.34 34.88 i8.96 21.72 24.84 25.44 - 10/ 28.92 13/33.03 2/_ Oct.\ : 30.28 34.58 18.19 21.12 23.51 24.48 , !w. 29.73- 13/32.88 2/ Nov.\ : 29.88 34.67 18.2l 21.08 25.58 26.95 10/ 28.93 13/32-94 2/ Dec. \ 3 : 30.16 · 36.16 18.93 24.02 27.13 28.97 10/ 28.10 13/33-10 2/
to : 30.10 36.o8 19~66 25.12 27.68 29.70 IO/ 28.17 13/33-13 2/ ~ : 29-90 35.83 20.71 24.20 26.58 28.42 16/ 28.82 13/32-77 . 2/
~}ice of Asbmouni, Fully Good Fair. 2/ Comparable data not readily available. J/ Averagefor 3 years. >g Quotatitfor one. month. 5/ Average for 10 months. 6/ Average for 7 month_s. 7/ Average for 9 months. 8/ Average for 8 mo ths. 9/ Average for 11 months. -~ No quotation. 11/ Average for 3 quotations. 12/ Average for 2 quotations. 13/ ort prices. - ---Foreign Agricultura~·service~ Compiled from reports of the State Department-and converted to cents per pound at current rates of exchange as reported by the Federal Reserve Board. Based on prices on one day in each week.
... ""'"' .._ -·-
~ < . t
Ba 0 . 1-' \0 Vl w
1-' CP
Cowrtey c4
4en1Dat101l
lt.IR(R
United~ Aunr1a Be131ua aD4 Luxabourg Csecho•l.cmiJd.a »-rlt Eire F:l..lllend J'rance ~(Wen) Oreece llw2p.ry Italy IJetherl.aD48
·~ PolaDd aD4 Danzig Portvgal. Spain SWe4en SV1tzerlaD4 Trtene U, S. s. R, Yqoalavia Other
Total
O'l'JIER COUJITRDS
Canada Mexico Cuba Col.clab1a IDd1a Ch1Da Japan ~roDe ICoDs Korea Palenine aD4 Israal Ph1l1pp1ne 181111148 AuRralla Other
Total
World total
11areau ot tbe ee-.
t'a1lle 1.3.- Cotton: Bllpart• rr. the Ullitea State• I b7 staple leDgth aDd by cOUDtcy c4 dellt1Dat1on, August, September, October, 1953
...,.u I September l-1/8 : 1 :l.ach : lJDdArr I I 1-1/8 I 1 inch : UDd 1Dchu I to 1-1/8 : 1 inch : ~ I inche. : to 1-1/8 : 1 :ch : Total
I 8114 OYer : illcbe• : : I 11114 over I 1Dchu I R\tliii1iii Riiil1i11ii Riiil1i11ii RuDrd.D8 Jti.1Jm1D« liliiUq - - RuDn1.n8 Runii!J:Ig
~.1!!!!!...~~~~~~
l.-1:78 inchn
11114 over RliDidD8 ~
octo \lei-
l-inch 1 Under • Total to 1-1/8 : 1 inch '
inches -Rlmn1D8 Ruliii1ll8 .RuJiiilii& ~ bales ~
0 4,238 4,741 8,979 101 12,584 12,598 25,283 61.6 15,377 17,998 33,991 93 93l 0 1,024 0 1,573 0 1,573 270 4,275 178 4,723
452 2,110 110 2,672 0 1,891 130 2,021 277 2,632 206 3,115 0 0 0 0 0 0 0 0 0 0 0 0 o 1,225 o 1,225 o 2,8ol. o a,8o4 o 1,257 o 1,257 0 2()lj. 200 4ol. 0 198 200 398 0 197 0 197 0 0 0 0 0 0 0 0 0 0 0 0
699 16,389 1,503 18,591 1,o67 27,133 1,974 30,174 1,941 28,309 957 31.207 2,746 9,64o 0 1.2,386 4,365 11,561. 9l 16,020 5,459 10,772 393 16,624
0 0 0 0 0 0 0 0 0 0 0 0 0 0 0 0 0 0 0 0 0 0 0 0
75 9,367 489 9,931 298 10,356 970 11,624 754 14,226 362 15,342 2,638 1,794 100 4,532 1,908 697 85 2,690 6,072 1,629 0 7,701
0 535 0 535 0 670 100 770 0 1,350 0 1,350 0 0 0 0 0 0 0 0 0 0 0 0 0 0 0 0 0 0 0 0 0 0 0 0 0 11,465 0 11,465 0 13,81.2 660 14,472 0 1,273 200 1,473 0 1,277 0 1,277 0 2,141 296 2,437 2l.7 2,031 0 2,248 0 1,550 250 1,8oo 0 1,750 273 2,023 100 2,000 223 2,323 0 142 0 142 0 " 0 48 0 540 0 5~ 0 0 0 0 0 0 0 0 0 0 0 0
698 12,301 3,704 16,703 359 1,744 1,244 3,347 0 0 0 0 0 0 0 0 0 0 0 0 0 0 0 0
7,Jjiji 73.166 U.Q97 9:1.,666 8,09& -• 81,]65 ___ j.8,62lm __ l.1_2.._@ ___ 15_.1Q9u 85,868 2(),517- • 1~,®0
508 6,171 2,162 8,841 389 10,88o 1,138 12,~ 1,167 14,108 3,544 18,81.9 0 0 0 0 0 0 0 0 0 0 0 0 0 100 0 100 0 1,8oo 0 1,800 0 1,200 0 1,200 0 0 0 0 0 0 0 0 0 0 0 0
2,32l. 0 0 2,32l. 969 0 0 969 3,665 0 0 3,665 0 0 0 0 0 0 0 0 0 0 0 0
337 27,220 30,911 58,468 0 19,036 38,541 57,577 522 18,622 30,394 49,538 0 102 0 102 0 199 0 199 0 0 0 0 0 0 25,324 25,324 0 0 2,21.8 2,21.8 0 0 34 34
600 626 0 1,226 0 626 0 626 0 998 0 998 0 0 0 0 0 0 0 0 300 966 0 1,266 0 1,870 200 2,070 0 3,00.8 191 3,209 3 2,o88 0 2,091
: o ~ 186 o 3 186 184 2 ~t 1 m ~ 120 ~09 7.647 9.~ 17,6o5 : 3,766 3 :m '!ti91 1oo.:638 1,5~2 38!) Slf:;:=:1a5 6, 66 _,,629 43, 95,216
11,167 11.2,443 69,694 193,304 9,640 127,4&. 62,688 199,8o9 22,072 131,497 63,738 21.7,307
C'l :: ~
I
~
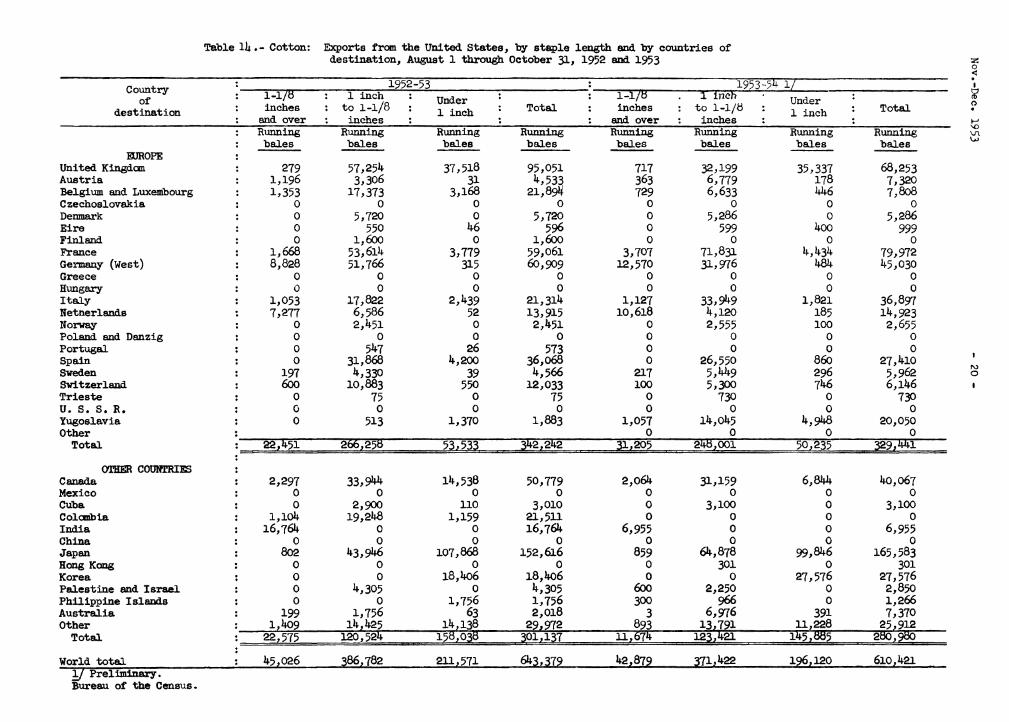
Table 14 • - Cotton: Exports from the United States, by staple length 8Zld by countries of destiDation, August 1 through October 31, 1952 8lld 1953 :<:
0 < .
Country 1952-53 : 1953··5lj: 1z I
of : 1-1/8 : 1 inch : Under : : 1-i/8 1 Inch Under : a? inches to 1-1/8 Total inches to 1-1/ts Total 0
destination : : : 1 inch : : : : 1 inch : . and over : inches : : : and over : inches : : 1-'
Rwming Rwming Rwming Running Running Running Running Running "' Vl.
bales bales bales bales bales bales bales bales ..... EUROPE :
United Kingdan : 279 57,254 37.518 95,051 717 32,199 35,337 68,253 Austria : 1,196 3,306 31 4,533 363 6,779 178 7,320 Belgium and Luxembourg : 1,353 17,373 3,168 21,8911' 729 6,633 446 7,8o8 Czechoslovakia : 0 0 0 0 0 0 0 0 Denmark : 0 5,720 0 5,720 0 5,286 0 5,286 Eire : 0 550 46 596 0 599 4oo 999 Finland : 0 1,6oo 0 1,6oo 0 0 0 0 France : 1,668 53,614 3,779 59,061 3,707 71,831 4,434 79,972 Gel'lll!lllY (West) : 8,828 51,766 315 6o,909 12,570 31,976 484 45,030 Greece : 0 0 0 0 0 0 0 0 Hungary : 0 0 0 0 0 0 0 0 Italy : 1,053 17,822 2,439 21,314 1,127 33.949 1,821 36,897 Netnerlands : 7,277 6,586 52 13,915 10,618 4,120 185 14,923 No~ : 0 2,451 0 2,451 0 2,555 100 2,655 Poland and Danzig : 0 0 0 0 0 0 0 0 Portugal : 0 547 26 573 0 0 0 0 Spain : 0 31,868 4,200 36,o68 0 26,550 86o 27,410 Sweden 197 4,330 39 4,566 217 5,449 296 5,962
1\)
: 0
Switzerland : 6oo 10,883 550 12,033 100 5,300 746 6,146 Trieste : 0 75 0 75 0 730 0 730 U. S, S. R. : 0 0 0 0 0 0 0 0 Yugoslavia : 0 513 1,370 1,883 1,057 14,045 4,948 20,050 Other : 0 0 0 0
Total : 22l451 2COz258 53z533 342z242 3lz205 24BzOOl 50z235 ~9llj:lj:l :
O'J."'IER COUlfrRIES Canada : 2,297 33.944 14,538 50,779 2,064 31,159 6,844 4o,o67 Mexico : 0 0 0 0 0 0 0 0 Cuba . 0 2,900 110 3,010 0 3,100 0 3,100 . Colanbi.a. : l,lo4 19,248 1,159 21,511 0 0 0 0 India : 16,764 0 0 16,764 6,955 0 0 6,955 China : 0 0 0 0 0 0 0 0 Japan : 8o2 43,946 107,868 152,616 859 64,878 99,846 165,583 Hong Kong : 0 0 0 0 0 301 0 301 Korea : 0 0 18,4o6 18,4o6 0 0 27,576 27,576 Palestine 8Zld Israel : 0 4,305 0 4,305 6oo 2,250 0 2,850 PhUippine Isl81lds : 0 0 1,756 1,756 300 966 0 1,266 Australia : 199 1,756 63 2,018 3 6,916 391 7,370 Other : 1 4o9 14~425 14 138 22 972 893 ~~:¢~ 11 228 25:912
Total : 22:575 120 524 12B:o! ~1~137 11zli74 145:!382 2&5 ~
World total : 45,026 386z782 211,571 643.379 42.879 371.422 196.120 610.421 y PrelimiD&ry. Bureau of the Census.