coupled molybdenum, iron and uranium stable isotopes as oceanic
TRANSCRIPT

Chemical Geology 362 (2013) 193–210
Contents lists available at ScienceDirect
Chemical Geology
j ourna l homepage: www.e lsev ie r .com/ locate /chemgeo
Coupled molybdenum, iron and uranium stable isotopes as oceanicpaleoredox proxies during the Paleoproterozoic Shunga Event
Dan Asael a,b,⁎, François L.H. Tissot c, Christopher T. Reinhard d,e, Olivier Rouxel a, Nicolas Dauphas c,Timothy W. Lyons e, Emmanuel Ponzevera a, Céline Liorzou b, Sandrine Chéron a
a IFREMER, Centre de Brest, 29280 Plouzané, Franceb Université de Brest, IUEM, UMR 6538, 29280 Plouzané, Francec Origins Laboratory, Department of the Geophysical Sciences & Enrico Fermi Institute, The University of Chicago, Chicago, IL 60637, United Statesd Division of Geological and Planetary Sciences, California Institute of Technology, Pasadena, CA 91125, United Statese Department of Earth Sciences, University of California, Riverside, CA 92521-0423, United States
⁎ Corresponding author. Tel.:+33 2 98052935.E-mail address: [email protected] (D. Asael).
0009-2541/$ – see front matter © 2013 Elsevier B.V. All rihttp://dx.doi.org/10.1016/j.chemgeo.2013.08.003
a b s t r a c t
a r t i c l e i n f oArticle history:Accepted 4 August 2013Available online 16 August 2013
Keywords:Shunga EventMolybdenum isotopesUranium isotopesIron isotopesPaleoproterozoicEuxinic
The Paleoproterozoic Era was a time of remarkable importance in the redox evolution of Earth's atmosphere andoceans. Here, we present amulti-proxy study ofMo, U and Fe isotopes together with Fe speciation of black shalesand siltstones from the upper Zaonega Formation of the Onega Basin in Karelia.We attempt to better understandoceanic redox conditions during the 2.05 Ga Shunga Event as the next step following the Great Oxidation Event(GOE) and the Lomagundi carbon isotope excursion Event.A cautious examination of the Fe speciation data shows that the studied sectionwas deposited under dominantlyeuxinic conditions (anoxic and sulfidic) and that the lower part of the section experienced metamorphismthrough which pyrite was altered to pyrrhotite. During this episode, the system was closed with respect to Febut not sulfur. The Mo and U isotopic compositions (corrected for detrital input) were not affected by the meta-morphism and loss of S and are fairly uniform throughout the entire section. The Fe isotope compositions are ex-ceptionally heavy in the lower part of the section (up to δ56FeIRMM-14 = 0.83‰) and become lighter towards theupper intervals, which also show significant [Mo] and [U] enrichments. We suggest that this pattern reflectschanges in the position of the deposition site relative to the redox structure of the water column. The upperpart was deposited within a locally euxinic portion of the basin where H2S availability was highest, removal ofMo and U was more efficient and precipitated pyrite captured relatively non-fractionated dissolved Fe. In otherwords, quantitative uptake of Fe was favored. In contrast, the lower interval was deposited on the lower marginof a euxinic wedge where H2S availability was lower, and removal of Mo and U was less efficient. Pyrite precip-itation in this part of the water column reflected a more fractionated dissolved Fe reservoir due to moreprotracted, non-quantitative Fe uptake because of less efficient pyrite formation under lower sulfide conditionsand greater access to the large oceanic pool of Fe. The U isotopic signal was corrected for detrital contribution giv-ing compositions similar to the riverine input and suggesting that co-precipitation into carbonates was the mainprocess of U removal at this time.We estimate theMo isotope composition of the contemporaneous ocean to be δ98MoSW = 0.85 ± 0.21‰. This isthe lowest value yet reported for the Proterozoic ocean, suggesting that the oceanic Mo cycle was dominated byeuxinic and anoxic sinks with negligible Mo removal into oxic environments. Recent studies have proposed asharp increase in ocean–atmosphere oxygen levels during the Lomagundi Event followed by a dramatic crash.Our results from black shales of the 2.05 Ga Shunga Event are consistent with a post-Lomagundi decrease in bio-spheric oxygen levels.
© 2013 Elsevier B.V. All rights reserved.
1. Introduction
The “Great Oxidation Event” (GOE) in the Paleoproterozoic was oneof the most significant events in Earth history (Holland, 2006). At thattime, atmospheric oxygen levels rose from Archean values of ca. 10−5
ghts reserved.
times the present atmospheric level (PAL) tomid-late Proterozoic valuesof ca. 10−2 to 10−1 PAL (Pavlov and Kasting, 2002). This event had a re-markable effect on Earth surface biogeochemical cycles through the ini-tiation of oxidative weathering, shifts in ocean chemistry and aboosting of redox gradients and thus microbial metabolism on a globalscale. The recognition that substantial Mass Independent Fractionation(MIF) of sulfur isotopes is restricted to the time interval before ~2.3 Gaargues for an anoxic atmosphere at that time (Farquhar, 2000; Pavlov

194 D. Asael et al. / Chemical Geology 362 (2013) 193–210
and Kasting, 2002; Mojzsis et al., 2003; Ono et al., 2003; Bekker et al.,2004; Farquhar et al., 2007). “False-starts” in biospheric oxygenation, re-ferred to as “whiffs” of atmospheric oxygen (Anbar et al., 2007) mayhave occurred one ormore times during the latest Archean, although ev-idences are currently disputed (Kirschvink et al., 2012). These presum-ably transient increases in oxygen are reflected in enrichments in theredox-sensitive elements molybdenum and rhenium in marine shalesand a reduction in the extent of MIF precisely coincident with the peakin Mo and FeS2 enrichment (Anbar et al., 2007; Kaufman et al., 2007;Reinhard et al., 2009; Kendall et al., 2010). The interval between2.45 Ga and 2.0 Ga (the early Paleoproterozoic) was a period of transi-tion and dramatic environmental change, with evidence for widespreadglaciation (Evans et al., 1997; Kirschvink et al., 2000), the first appear-ance of red beds, giant Mn deposits (e.g., the Hotazel Formation) andthe disappearance of detrital grains of pyrite and uraninite consistentwith the onset of an oxidative weathering environment (Holland,1994; Farquhar and Johnston, 2008). Banded iron formations, whichwere frequent and voluminous in the Archean, largely disappeared dur-ing the early Paleoproterozoic (2.3–2.0Ga), despite later reappearance at~1.9 Ga due to enhanced global volcanism (Condie, 2001; Rasmussenet al., 2012). A significant increase inmass-dependent S isotope fraction-ation and decrease in Fe isotope fractionation in sedimentary pyrite after~2.32 Ga (Bekker et al., 2004; Canfield, 2005; Rouxel et al., 2005), andthe first appearance of sedimentary sulfate evaporates (Reuschel et al.,2012) likely reflect an increase of seawater sulfate concentrations bythat time. The ocean redox state in the aftermath of the rise of atmo-spheric oxygen remains poorly constrained and various models rangingfrom oxic (Holland, 1984), to euxinic (Canfield, 1998), and to suboxic(Slack et al., 2007) have been proposed, and recent work hypothesizesa redox structure characterized by pervasive anoxia within the deepsea and dynamic regions of euxinia along productive ocean margins(e.g., Poulton et al., 2010; Planavsky et al., 2011; Reinhard et al.,2013a). However, the temporal dynamics and cause-and-effect relation-ships among the various transitions in the surface environment in thewake of the GOE and Lomagundi Event remain poorly known.
The Lomagundi-Jatuli Event—the largest carbon isotope excursion inEarth's history (2.3–2.1 Ga)—is associated with global burial of organicmatter and release of oxygen to the atmosphere (Melezhik et al.,1999a,b). Bekker et al. (2008) showed that in contrast to the LateNeoproterozoic and Phanerozoic, mechanisms of carbon fractionationwere different in the Paleoproterozoic redox-stratified ocean, and thesignal of primary productivity below the redoxcline was overprinted.This relationship complicates the reconstruction of spatial patternsand secular trends in the δ13C values of dissolved inorganic carbon inPaleoproterozoic seawater.
We have studied the Shunga Event sequence from the Onega Basin,which directly follows the Lomagundi-Jatuli Event and, somewhatparadoxically in the face of decreasing δ13C values, shows remarkableorganic carbon accumulation and the first sedimentary phosphorite ac-cumulation (Melezhik et al., 2005). The Shunga Event is part of the strat-igraphic section of the Onega Basin which was deposited in regionalplatformal sequence, where similar sediments are found also in theFrancevillian Group in Gabon (Melezhik et al., 2004; and referenceswithin). Together, these observations suggest that the studied sectionof the Shunga Event can provide insight into the open Paleoproterozoicoceanand associated global phenomena. The Shunga Event,well-knownfor its huge volume of Paleoproterozoic Corg-rich sediments (up to 99%C), represents a giant petrified oil field, including petroleum sourcerock, joint-trapped metamorphosed oil, veins of migrated petroleum,redeposited subaerial oil spills and organo-siliceous substances formingdiapirs (Melezhik et al., 2004). The Zaonega Formation from the OnegaBasin is composed mainly of organic-rich shale, organo-siliceous rocksandmafic lavas and gabbro sills, and it also contains a petrified oil reser-voir. Kump et al. (2011) observed a negative δ13C excursion during theShunga Event, which was considered to represent intense oxidativeweathering of rocks as the result of the initial establishment of an
oxygen-rich atmosphere. The studies of Ovchinnikova et al. (2007)and Puchtel et al. (1998, 1999) constrained the age of the Zaonega For-mation to be ca. 2.06 Ga.
Here, we aim to document the sequence of environmental changesassociated with the Shunga Event by analysis of drill core fromFennoscandia, so that we may evaluate the following hypotheses:
(1) The evolution of the oceanic sulfur cycle through thePaleoproterozoic was such that by the time of the Shunga event(ca. 2000 Ma) it could support exceptionally widespread euxinicconditions in the marine realm.
(2) Oxidative continental weatheringwas important in setting up thesulfate and metal oxyanion inventories of seawater (e.g., U andMo) in the aftermath of theGOE andduring the Lomagundi Event.
Wepresent here Fe speciation;Mo abundance; and Fe, U andMo iso-topes data recorded in Palaeoproterozoic sulfidic shales from theFennoscandian Shield and now available in the FAR-DEEP drillcores.The FAR-DEEP project (Fennoscandian Arctic Russia—Drilling EarlyEarth Project)was initiated in the frame of the International ContinentalDrilling Program (ICDP) (Melezhik et al., 2013). About 3650 m of drillcore were recovered and logged from the early Paleoproterozoic ofArctic Russia during the summer and fall of 2007 and represent a criticalwindow into the tempo and mode of early Earth oxygenation.
2. The Fe, Mo and U proxies
2.1. Molybdenum in the ocean—sources, sinks and fluxes
TheMo isotopic system has drawn considerable attention in the pastdecade as away to better understand the ocean redox structure of mod-ern and ancient oceans (McManus et al., 2002; Arnold et al., 2004;Nägler et al., 2005; Siebert et al., 2005; Poulson et al., 2006; Siebertet al., 2006; Wille et al., 2007; Archer and Vance, 2008; Dahl et al.,2008; Neubert et al., 2008; Pearce et al., 2008; Kendall et al., 2009;Dahl et al., 2010; Duan et al., 2010a,b; Kendall et al., 2011; Nägleret al., 2011; Wen et al., 2011). Many of the above studies have focusedon the authigenic record of Mo isotopes in black shales, trying to estab-lish linkages between the evolution of oxygen in the atmosphere andthe sources and sinks of Mo in the oceans. These studies are based on(1) the principle that theMo isotopic composition of seawater is a func-tion of the balance between the different Mo sedimentary sinks in theocean, and (2) that the Mo isotope composition of contemporaneousocean can be reconstructed directly from euxinic sediments, as there isoften no net fractionation during Mo removal to such sediments (e.g.,Anbar and Rouxel, 2007; Gordon et al., 2009). Therefore, in order tomake a reliable use of Mo us a paleoredox proxy, it is first essential toshow that the removal of Mo was quantitative. We may achieve thatby demonstrating euxinia in the site of depositions using other geo-chemical tools (e.g., Fe speciation andMo concentrations). Nonetheless,we must keep in mind that even under strongly euxinic conditions Moremoval may not be quantitative (e.g., Helz et al., 2011), resulting in sig-nificant Mo isotope fractionation. Therefore, the inferred Mo isotopecomposition of seawater should be used cautiouslywhen reconstructingthe oceanic Mo budget, which in turn can reflect the global oceanicredox state (i.e., Mo sinks) and atmospheric oxygen levels (Anbar,2004; Gordon et al., 2009; Lyons et al., 2009).
The oceanic Mo cycle is dominated by two sources—rivers and hy-drothermal fluids—and three sinks defined by the redox conditions atthe site of deposition in the ocean: euxinic, oxic and suboxic (Berner,1981). For the Mo isotope system, suboxic and anoxic conditions arelumped together (see Table 1). The common theme for both is that sul-fide is limited to the pore fluids, and only euxinic sites, by definition,have free sulfide in the water column. Riverine Mo input constitutes atleast 90% of the total modern Mo input to the oceans, with a small fluxpossibly tied to hydrothermal fluids (McManus et al., 2002). Archer

Table 1Characteristics of the different Mo and U sinks.
[O2] μMa [H2S] μMa Δ98Mo(SW-sink) [‰] Δ238U(SW-sink) [‰]b
Euxinic ≈0 ≥11 0 −0.5Anoxic ≈0 ≈0 ≈1Suboxic ≤10 ≤11 −0.2Oxic ≥10 ≈0 ≈3 –
Carbonates – – – 0
a After Canfield and Thamdrup (2009); Murray et al. (1995); and Berner (1981).b See text for references.
195D. Asael et al. / Chemical Geology 362 (2013) 193–210
and Vance (2008) analyzed various modern rivers and showed arange of δ98Mo values between 0.2 and 2.3‰ and an average ofδ98Mo = 0.7‰, which is similar to the values reported by Pearce et al.(2010) and Neubert et al. (2011). However, on long time scales we ex-pect rivers to represent the average crustal value, which is probablylower and in the range of ca. −0.1 to 0.4‰ (Barling et al., 2001;Siebert et al., 2003). The hydrothermal input may constitute as muchas 10% of the total Mo input to the ocean, and its isotope compositionis currently poorly constrained. McManus et al. (2002) measured avalueof δ98Mo = 0.8‰ for low-temperature ridgeflank springs, thoughthese authors acknowledged that much of this Momay be coming fromsuboxic diagenesis in sediments along the fluid flow path. Pearce et al.(2010) measured a value of δ98Mo = −3.4‰ for terrestrial hydro-thermal spring waters. In any case, as a first approximation, it can beconsidered that the total oceanic Mo input, including riverine and hy-drothermalfluids together, is about δ98Moinput = 0.5 ± 0.2‰, althoughthis issuemay need to be revisited as theMo isotope systematic in riversand hydrothermal systems and their relative Mo contributions to sea-water become better understood. In the modern oceanMo is found pri-marily as the non-reactive molybdate ion (MoO4
2−) with the averageseawater concentration of 100 nM and an oceanic residence time ofca. 700,000 yr.
Under euxinic conditions, where [H2S] ≥ 11 μM and [O2] ≈ 0 μM,themolybdate ion is converted through intermediate oxythiomolybdatespecies to the reactive tetrathiomolybdate (Erickson and Helz, 2000;Tossell, 2005):
MoO42− þ 4 H2S↔MoS4
2− þ 4 H2O
Ultimately, if H2S is in excess overMo, and the rate of water renewalis slow compared to the Mo burial rate (Dahl et al., 2010), molybdate isremoved quantitatively to the sediment, and no net fractionation isexpressed. In the case of widespread euxinic conditions, low Mo/TOCratios across wide lateral and temporal space would suggest that Mois efficiently removed over a much wider region of the ocean (Lyonset al., 2009). Scott and Lyons (2012) showed that Mo/TOC ratios mayprovide direct evidence for euxinic conditions, except under extremeconditions of Mo limitation. It is important to note that if Mo removalis not quantitative, significant fractionation between molybdate andthiomolybdate is expected as an isotopic shift between the sedimentand the open ocean value for dissolved Mo (Neubert et al., 2008;Arnold et al., 2012). Tossell (2005) calculated a fractionation factor forthe complete reaction ofΔ98/95Mo(MoO4–MoS4) ≈ 6.75‰, where Nägleret al. (2011) found ca. 0.5‰ shift between seawater and the sedimentin the modern black sea at water depth b400 m.
In oxic environments, where [O2] N10 μMand [H2S] ≈ 0 μM,Mo re-moval occurs through adsorption to Mn-oxides surfaces via the follow-ing general reaction (Barling and Anbar, 2004):
MeOHþMoO42− þ Hþ↔MeMoO4
− þH2O
Where Me represents metal-oxide surface—typically Mn- and/orFe-oxide crusts. An isotope fractionation of Δ98/95Mo(SW–Oxic) ≈ 3‰
accompanies this reaction inmodern system,where the process is dom-inated by sorption to Mn-oxides (Barling et al., 2001; Siebert et al.,2003; Poulson et al., 2009). Barling and Anbar (2004) and Wasylenkiet al. (2008) showed that this fractionation factor is effectively indepen-dent of temperature, ionic strength and pH within ranges realisticallyapplicable to seawater, and it is thus reasonable to assume that it hasbeen essentially constant over earth history. However, Kendall et al.(2011) pointed that the 3‰ fractionation factormay not hold for all sed-iments with 10 b [O2] b 35 uM.
In suboxic and anoxic environments, where bottom water [O2]b10 μM and sulfide is limited to the porewaters, Mo is typically re-moved through adsorption to Fe-oxideminerals in the following gener-al reaction (Kashiwabara et al., 2011):
Me H2Oð Þn þMoO42−↔Me MoO4
2−� �
H2Oð Þn−1 þH2O
Where Me stands for the metal-oxide surface. Mo isotope fraction-ation in these environments will vary with different phases and condi-tions, and Δ98/95Mo(SW–Suboxic) ranges from approximately 0.8 to 2.2‰(Goldberg et al., 2009) with typical values of ca. 1‰. Goldberg et al.(2009) also argued that during early diagenesis processes of Mo releasedue to reduction of Fe-(oxyhydr)oxides, augmentation by drawdown ofseawater, and finally sequestration, may affect the isotopic compositionof the sediment.
2.2. Uranium in the oceans—sources, sinks and fluxes
In themodern oxic ocean, uranium occurs mainly in the highly solu-ble U6+ oxidation state, dominantly in the form of the uranyl carbonateionUVIO2(CO3)34− (Djogic et al., 1986). Uranium is conservative,meaningits concentration varies linearly with salinity (Ku et al., 1977; Robinsonet al., 2004). In seawater with an average salinity of 3.5 g/L, the U con-centration is 13.8 ± 0.3 nmol/L. This concentration should be homoge-neous for a salinity-normalized ocean since the U mean residence time(~ 400 kyr) is much larger than the global ocean mixing time, deter-mined as 1–2 kyr by 14C reservoir ages (Ku et al., 1977; Chen et al.,1986). The latest estimates of the U budget in the modern ocean(Morford and Emerson, 1999; Dunk et al., 2002; Henderson, 2003)agree within uncertainties and describe three main sinks, which repre-sent roughly similar total removal rates of U: biogenic carbonates, anoxicsediments and suboxic sediments. It should be noted that hydrother-mally altered oceanic crust represents a fourth sink of secondary impor-tance, whose contribution to the oceanic budget is not well constrained.
Modern seawater has a U isotope composition of δ238U ≈ −0.38 ±0.03‰ (relative to CRM112a) (Stirling et al., 2007; Weyer et al., 2008;Tissot and Dauphas, 2011). The modern riverine input has a δ238Uvalue of about−0.22 ± 0.05‰ (Stirling et al., 2007), while continentalcrust (i.e., granites and basalts) has a δ238U of about −0.28 ± 0.03‰(Telus et al., 2012; Tissot and Dauphas, 2012). Isotopic fractionation as-sociatedwith U incorporation in the threemain U sinks described aboveis detailed is Table 1. From the limited available data (Noordmann et al.,2009, 2012) it seems that the processes of U weathering from continen-tal crust, transport to the oceans, and re-deposition as well as removalinto hydrothermally altered oceanic crust, are accompanied by relativelysmall isotopic fractionation.
The process of U removal from seawater occurs in three steps:(1) transport of U to the sediment/water interface; (2) diffusion toporewater and reduction of U in the porewater column; and (3) adsorp-tion or precipitation (Anderson et al., 1989). Themain source of U to thesediment/water interface is dissolved UVI but U can also be taken up inplankton, sorbed to organic matter, concentrated in calcareous and sili-ceous tests, or adsorbed and/or co-precipitated with Fe–Mn oxides andtransported to the sediment/water interface (Langmuir, 1978; Cochran,1992; Barnes and Cochran, 1993). At the sediment/water interface,U delivered from the water column can be released via reduction of

196 D. Asael et al. / Chemical Geology 362 (2013) 193–210
Fe–Mn oxides (Barnes and Cochran, 1993), or from the decompositionof organic matter (20% or less of the flux in porewater (Klinkhammerand Palmer, 1991)). U then diffuses into the porewater, where reduc-tion and removal of U,which ismainly coupled to oxidation of Fe, occursat about the depth of Fe remobilization or below (Cochran, 1992;Morford and Emerson, 1999). The initial reduction is thought to occuras amorphous UIV-oxyhydroxide, which later transform to uraniniteUO2(s) (Langmuir, 1978).
Depending on the redox environment, reduction of solubleUVI into in-solubleUIV is accompaniedbydifferent fractionation factors and can occurthrough a variety of reactions. These reactions include abiotic reduction,coupled or not to adsorption onto ferric hydroxide andmicrobially medi-ated reduction (see Appendix 1).
Sediments deposited under anoxic (euxinic/ferruginous) conditionsshow heavier isotopic compositions than seawater by 0.44 to 0.80‰,with an averageΔ238/235U(SW–Anox) ≈ −0.5‰,Sediments deposited insuboxic condition show δ238U of ~−0.29 ± 0.08‰ equivalent toΔ238/235U(SW–Subox) ≈ −0.1‰ (Weyer et al., 2008).
In oxic environments U can be removed from the water columnthrough adsorption onto Mn-nodules or during precipitation of bandedIron Formations (BIFs) in the ancient ocean. Adsorption experiments aswell asmeasurements of 238U/235U ratios inMn-oxyhydroxides point toan associated fractionation factor of Δ238/235U(SW–Adsorption) ≈ 0.2‰(Stirling et al., 2007; Weyer et al., 2008; Brennecka et al., 2011), whilethe fractionation associated with BIF deposition is poorly constraineddue to the limited and highly scattered data available (Weyer et al.,2008). The Mn-nodule and BIF sinks are negligible in the modernocean. However, in anoxic ancient oceans, deposition of BIFs occurredon short timescales in localized, oxygen-rich waters. The process ofBIF deposition is still a matter of debate, and their role in the U budgetin the ancient ocean remains unknown. At present, BIFs have not beenstudied enough to reveal their role in the U geochemical cycle, andso it is important to keep in mind that BIFs represent a source of uncer-tainty in the U mass balance.
The last main fate for U in the modern ocean is co-precipitation intocarbonates. In oxic environments, soluble UVI is preferentially incorpo-rated and sequestered in aragonite over calcite with [U]aragonite ≈ 10×[U]calcite (Qafoku and Icenhower, 2008; Weyer et al., 2008). Incorpora-tion and long-term sequestration of UVI into calcite was at one time amatter of debate but has recently been documented in natural settings(Kelly et al., 2003, 2006, 2007), thus validating U-related dating of cal-cite formed in oxic environments. However, sequestration of U in car-bonates is not restricted to oxic environments, and the substitution ofinsoluble tetravalent uranium (UIV) for divalent calcium (Ca2+) in cal-cite deposited under anoxic conditions explains the otherwise anoma-lously high concentration of U in these deposits (Israelson et al., 1996;Sturchio, 1998). Other mechanisms of U sequestration into carbonateshave been proposed (e.g., sorption, adsorption) but are somewhat re-versible and probably do not play an important role in the long-termoceanic budget for U (see Qafoku and Icenhower (2008) and referencetherein for more information). The overall U burial rate in carbonatesin the modern ocean is estimated to be ~334 μg/cm2kyr. The co-precipitation/substitution of U in carbonates is not accompanied by sig-nificant U isotope fractionation as δ238UCarbonates ≈ −0.44 ± 0.06‰(Stirling et al., 2007; Weyer et al., 2008; Brennecka et al., 2011).
Theory and experiments explain U isotope variations during Ureduction as a result of mass-independent, volume-dependent fraction-ationmechanismcalledNuclear Field Shift,which states that differencesin nuclear charge radius associated with the number of neutrons shiftsthe atomic energy levels of the isotopes (Fujii et al., 1989; Bigeleisen,1996; Schauble, 2007; Abe et al., 2008). This translates into a preferen-tial incorporation of 238U into the reduced species UIV. A second mecha-nism, fractionating U towards lighter δ238U, has been shown to takeplace during adsorption of U onto Mn-oxyhydroxide (Brennecka et al.,2011). In this case, fractionation is thought to be due to a difference inthe U–O coordination shell between dissolved and adsorbed U.
The potential of the 235U/238U system as a paleoredox tracer hasbeen explored in three recent studies (Kendall et al., 2013–in thisissue; Montoya-Pino et al., 2010; Brennecka et al., 2011). Kendall et al.(2013–in this issue) found a co-occurrence heavy δ238U values andauthigenic enrichments of Re and Mo but not U in late Archean shales.Such elemental enrichment pattern suggests atmospheric oxygen levelssufficient for oxidativeweathering of Re andMo but too low tomobilizeU, a conclusion consistentwith amodel of local pulses in the productionof O2 by photosynthesis (Sverjensky and Lee, 2010). However, the pres-ervation of a heavy δ238U signature in the sediments implies the pres-ence of small amount of dissolved U in the deep waters. Kendall et al.(2013–in this issue) proposed local submarine oxidative weatheringwithin anoxygen oasis as the source of dissolved U. Montoya-Pinoet al. (2010) investigated the extent of marine anoxia by looking atblack shales deposited during and after the mid-CretaceousCenomanian–Turomian Oceanic Anoxic Event (OAE). They speculatedthat the ocean prior to the OAE was slightly less oxic compared totoday's ocean and that the Cenomanian–Turomian OAE correspondsto a threefold increase of oceanic anoxia relative to the present day. Asimilar method was applied to Late Permian and Early Triassic carbon-ate rocks by Brennecka et al. (2011), who interpreted a global shift tolower 238U/235U ratios in the rock record as a consequence of increasedanoxia in the ocean just before the end-Permian mass extinction.
2.3. Fe speciation and isotopes
The distribution and systematics of Fe within ancient sedimentaryrocks can provide crucial information about the local redox of a deposi-tional environment (reviewed in Lyons and Severmann, 2006; Raiswelland Canfield, 2012; and Reinhard et al., 2013b). Although such informa-tion is useful in its own right, an understanding of depositional redoxchemistry is essential if we wish to use Mo isotopes as an oceanicpaleo-redox proxy and specifically to address extents of euxinia onocean scales (Arnold et al., 2004; Gordon et al., 2009). In this approach,different Fe mineral phases are separated bymeans of a well-calibratedsequential extraction scheme described briefly in the methodology andin detail elsewhere (Raiswell et al., 1994; Raiswell and Canfield, 1998;Poulton et al., 2004; Poulton and Canfield, 2005; Reinhard et al., 2009).
We focus here on highly reactive iron (FeHR), a pool of Fe that isbiogeochemically labile and reactive to dissolved S2− species on deposi-tional and early diagenetic (burial) timescales (e.g., Raiswell andCanfield, 1998). In addition to the Fe sulfide pool (Fepy), FeHR also in-cludes a number of ferrous carbonates (e.g., siderite, FeCO3; ankerite,Ca(Fe,Mg,Mn)(CO3)2), crystalline ferric oxides (hematite, Fe2O3; goe-thite, FeOOH) and the mixed valence Fe oxide magnetite (Fe3O4). Bythe conventional interpretation, a ratio of FeHR to total Fe (FeT) that iswell in excess of detrital background levels represents authigenic enrich-ment in a system that was anoxic and reducing with respect to Fe(Canfield et al., 1996; Lyons, 1997; Raiswell and Canfield, 1998;Wijsman et al., 2001). Values for FeHR/FeT in anoxic environments arecommonly greater than 0.38, well above values for oxic siliciclastic ma-rine sediments frommodern (FeHR/FeT = 0.26 ± 0.08) and Phanerozoic(FeHR/FeT = 0.14 ± 0.08) systems (Raiswell andCanfield, 1998; Poulton,2002; Raiswell et al., 2008).
We can further distinguish anoxic environments buffered bydissolved Fe2+ (termed “ferruginous”) from anoxic environments buff-ered by dissolved S2− species (termed “euxinic”) by examining the ex-tent to which biogeochemically labile Fe has been converted to sulfideminerals, a consequence of the very low solubility of Fe–S phases.FeHR-enriched systems in which the majority of reactive Fe has beenconverted to pyrite Fe (FePY) are operationally defined by values ofFePY/FeHR in excess of 0.7–0.8 (e.g., Poulton and Canfield, 2011) andare diagnostic of euxinic water columns. Importantly, it is these sulfidicsystems in particular that can serve as a repository for the Mo isotopecomposition of contemporaneous seawater.

Fig. 1. Composite (~5000-m-thick) and simplified section of the Onega Basin linked tomajor paleoenvironmental events, modified from Melezhik et al. (2010). Radiometricdates from bottom to top are taken from Pukhtel et al. (1992) and Ovchinnikova et al.(2007). Vertical red line shows the position of drill hole 13A studied in this work.
197D. Asael et al. / Chemical Geology 362 (2013) 193–210
Stimulated by the potential to use Fe isotopes as a biosignature andas a tracer of the redox state of ancient oceans, studies of the Fe isotopecomposition of laminated organic-rich sediments and sedimentary sul-fide shales attracted great interest in recent years (Matthews et al.,2004; Rouxel et al., 2005; Yamaguchi et al., 2005; Archer and Vance,2006; Jenkyns et al., 2007; Duan et al., 2010a,b; Fehr et al., 2010;Guilbaud et al., 2011). Microbiological experiments have shown thatsignificant Fe isotope fractionations occur during dissimilatory Fe(III)reduction (e.g., Beard et al., 2003a,b; Icopini et al., 2004; Johnson andBeard, 2005; Crosby et al., 2007) but also during anaerobic photosyn-thetic Fe(II) oxidation (Croal et al., 2004). Fe isotopes can be also frac-tionated by abiotic Fe(II) oxidation and precipitation of ferrichydroxides (Bullen et al., 2001; Balci et al., 2006) and by sorption ofaqueous Fe(II) onto ferric hydroxides. The largest equilibrium isotopefractionation (~3‰) is observed and theoretically calculated betweencoexisting Fe(III) and Fe(II) aqueous species (Johnson et al., 2002;Welch et al., 2003). It should be noted that significant kinetic Fe isotopefractionations are involved in non-redox processes such as inorganicmineral precipitation of Fe-oxides (Skulan et al., 2002) and sulfides(Butler et al., 2005; Guilbaud et al., 2011). The difficulty of clearly iden-tifying biotic versus abiotic processes of Fe isotope fractionation hasbeen the subject of intense debate in recent years (e.g., Beard, 1999;Anbar et al., 2000; Bullen et al., 2001; Rouxel et al., 2005; Guilbaudet al., 2011).
Lithogenic sources of Fe on the modern oxygenated Earth have sim-ilar Fe isotope compositions to that of bulk silicate Earth (Beard et al.,2003a,b). In contrast, marked variations in Fe isotope compositionhave been reported in organic-rich sediments, especially in Precambri-an black shales and sedimentary pyrites N2.3Ga old. Although severalinterpretations of the Fe isotope record in black shales have been pro-posed (Rouxel et al., 2005; Archer and Vance, 2006; Rouxel, 2006;Severmann et al., 2008; Guilbaud et al., 2011, 2012), there is a generalconsensus that the shift from high δ56Fe variability in N2.3 Ga blackshales to little variability b1.8 Ga reflects redox-related changes in theglobal oceanic Fe cycle. Subsequent studies have all confirmed that theiron cycle before 1.8 to 2.3 billion years ago was different from that oftoday and reflected the rise of atmospheric oxygen and the subsequentmoderate atmospheric oxygen levels in the Paleoproterozoic (Bekkerand Kaufman, 2007; Planavsky et al., 2012b). Regarding the processesleading to Fe isotope variations in sedimentary pyrite, it appears thatFe isotopes are particularly sensitive to the concentrations of dissolvedFe(II) and H2S (i.e., the sizes of the seawater Fe and sulfate reservoirs)and can be used to constrain the sources and sinks from the Fe(II) reser-voir in past oceans.
In cases where oxidation and/or precipitation of aqueous iron isquantitative the isotopic composition of the sediment will directlyreflect that of the source solution (e.g., sea water). If the process isnot complete, the mass balance between the phases and the precip-itation model should be considered (i.e., Rayleigh vs. equilibriumfractionation). This difference is particularly relevant in sedimentsthat record the redox evolution of the oceans and atmosphere andto specific redox events such as the GOE. Rouxel et al. (2005) showedthat the Fe isotope composition of marine sediments over geologicaltime divides Earth's history into three stages that are strikingly sim-ilar to the stages defined by the δ34S and Δ33S records. Highly vari-able and negative δ56Fe values in pyrites before ~2.32 Ga wereinterpreted to reflect reservoir effects in dissolved oceanic Fe acrossan iron chemocline resulting from the removal of isotopically heavyFe during oxidative precipitation. Similarly, the positive δ56Fe valuesof pyrites between 1.8 and 2.3 Ga are attributed to the developmentof a discrete redoxcline and diminishing reservoir effects. After1.8 Ga, the near-complete scavenging of dissolved Fe by the reactionwith dissolved oxygen or biogenic H2S to form Fe oxide and sulfideminerals, respectively, has limited the extent of Fe isotope variabilityin sediments (Rouxel et al., 2005; Anbar and Rouxel, 2007; Planavskyet al., 2012b).
2.4. Samples
Our sampleswere collected fromHole 13A of the Fennoscandia ArcticRussia—Drilling Early Earth Project (FAR-DEEP) with support of the In-ternational Continental Scientific Drilling Program (ICDP). This projectincludes a total of 3650 m of core from fifteen holes drilled through sed-imentary and volcanic formations in Fennoscandia, recording severalglobal environmental changes spanning the time interval 2.5–2.0Ga, in-cluding the Great Oxidation Event (GOE).
Hole 13A intersects the upper part of the Zaonega Formation,which, together with the overlaying Suisari Formation, records theShunga Event in the Onega Basin in Karelia (Fig. 1), Russia (EasternFennoscandian Shield). The Shunga Event is defined by the oldestknown significant accumulation of organic-carbon-rich sediments(termed “shungite” in the Onega Basin) and petroleum generation(Medvedev et al., 2009). Sedimentary rocks of the Onega Basin were de-posited in a marine basin within a rifted active continental margin (e.g.,Melezhik et al., 1999a,b; Kumpet al., 2011). Samples offine-grained lam-inated and massive siliciclastic rocks, with occasional turbidite intervals,were selected for this study. Sporadic macroscopic and obviously sec-ondary textures and featureswere avoided, with the aim of providing in-sight into the depositional redox characteristics of the Onega Basinduring typical background sedimentation.

Table 2Summary of XRD data giving semi-quantitative mineral abundances. Symbols represent the following abundances: 0 b * b 5 wt.%; 6 b ** b 10 wt.%; 11 b √ b 20 wt.%; √√ N20 wt.%.
Sample Depth [m] Albite Anorthite Anorthoclase Biotite Calcite Chlorite Graphite Illite muscovite Kaolinite Magnetite Microcline Orthoclase Phlogopite Pyrite Quartz Smectite Talc
3109602 138.12 * ** * √ * * √ √ ** * – * ** ** – √ ** –
3109604 138.71 * ** * √ * * √ √ √ * – ** * * * √ ** –
3109606 139.1 * * * √ * * √ √ ** * – √ * * * √ ** –
3109608 139.23 * * * √ * * √ √ ** * * √ * * * √ ** –
3109612 140.03 √ * * √ * * √ √ * * * * * * * √ √ ** –
3109614 140.29 √ * * ** * * √ √ * * – ** * * * √ √ ** –
3109620 141.62 √ ** * √ * * √ √ ** * – * * * * √ ** –
3109622 142.65 √ ** * √ * * √ ** * – * * * * √ ** –
3109628 143.11 √ * * √ * * √ √ * * – ** * * * √ √ ** –
3109638 145.53 – – – √ √ √ √ * √ √ √ √ * – * – * – √ ** –
3109658 146.14 * ** * √ * * √ √ ** * – * * * – √ √ ** –
3109668 146.87 ** * * √ * * √ √ * * – * * * – √ √ ** –
3109674 149.91 – – – √ √ √ √ * √ √ * – * – * – * ** –
3109676 150.84 √ * * √ ** * √ ** * – * * * – √ ** –
3109688 153.71 √ √ * √ √ √ * * √ √ * * – ** * * – √ ** –
3109748 157.83 – – – √ √ √ * √ ** * – * – * – √ √ ** –
3109706 158.43 √ * * – * * √ √ * * – * * * – √ ** –
3109708 159.75 √ √ * * ** * * √ √ * * – * * * – ** ** –
3109712 161.34 – – – √ √ √ √ * √ √ * – ** – * – √ ** *3109722 162.56 – – – √ √ √ √ * √ √ * – * – * – √ ** –
3109724 163.62 – – – √ √ * * √ √ √ * – * – * – √ ** –
3109726 164.77 √ √ * * √ * * √ √ * * – * * * – √ √ ** –
3109732 166.96 √ √ * * ** * * √ √ * * – ** * * – ** ** –
3109736 167.74 √ √ * * ** * * √ √ * * – * * * – √ ** –
3109738 168.52 √ √ * * ** * * √ √ * * – * * * – √ ** –
3109740 169.02 √ * * ** * * √ √ * * – * * * – √ √ ** –
3109744 169.93 ** * * √ * * √ ** * – * * * – √ √ ** –
3109746 170.47 ** * ** √ * * √ ** * – * * * – √ √ ** –
3109752 171.07 ** * * √ * * √ √ ** * – * * * – √ ** –
3109758 171.81 * * * √ * * √ √ ** * – * * * – √ √ ** –
3109760 172.23 * * * √ * * √ √ ** * – * * * – √ √ ** –
3109764 173.35 * * * √ ** √ √ √ ** * – * * * – √ ** –
3109778 175.3 √ * * √ * * √ √ ** * – 9 * * – ** ** –
198D.A
saeletal./ChemicalG
eology362
(2013)193
–210
199D. Asael et al. / Chemical Geology 362 (2013) 193–210
3. Methodology
3.1. Sample preparation and chemical and mineralogical characterization
Quarter-core samples were chipped in a ceramic jaw crusher, andthe rock chips were subsequently powdered in a SPEX rock crusherwith an aluminadish. Due to the high content of organicmatter, all sam-ples were ashed in quartz beakers at 600 °C for at least 24 h and loss ofweight during ignition (LOI) was determined. All later chemical proce-dures were undertaken in clean labs using distilled acids (HNO3; HCl)or trace metal-grade HF. About 200 mg of ashed sample were dissolvedwith concentrated HNO3 (7 mL) + HF (1.5 mL) and evaporated on ahot plate at 60 °C. Dry residues were further dissolved with concentrat-ed HNO3 + HCl, taken to dryness and finally dissolved with of 7 mol/LHCl. Molybdenum and U concentrations were measured using a Ther-mo Scientific X-series 2 Quad ICP-MS and for Fe and Al using an HoribaJobin Yvon Ultima 2 ICP-AES at the Domaines Océaniques (UMR 6538),UBO, France. Calibration of the instruments was done by running amulti-elemental solution at different concentrations and blank solu-tions, while standardization was done via routine tests of referencema-terials (BHVO-1, BHVO-2, SDO-1, Nod A-1 and Nod P-1).
X-ray diffraction (XRD) analyseswere conductedwith a BRUKERAXSD8 Advancemachine at the Laboratoire de Géochimie et Métallogénie atIFREMER institute, Brest, France. The results are presented in Table 2.Abundances were obtained on samples for which we had a sufficientamount of powder using the Rietveld method, which yields semi-quantitative results.
3.2. Molybdenum isotope analysis
A portion of each sample solution, using an amount determinedfrom the measured Mo concentration, was doped with a double spiketo keep a constant spike/sample ratio and taken through chromato-graphic separation described in Table 3. Molybdenum purification wasdone using a two-stage column procedure: a first stage of anion resinfor separating Mo and most Fe from the matrix and a second stage ofcation exchange separating Mo from remaining Fe. Molybdenum andFe isotope composition measurements were done using a Thermo
Table 3Description of the Mo and Fe columns chromatography procedure.
Step Reagent Volume [ml]
Stage I, anion exchange with AG MP-1 M resin (2 ml of resin)wash H2O 8wash 0.5 N HNO3 4wash H2O 4wash 2 N HCl 4wash H2O 4conditioning 7 N HCl 4sample loading 7 N HCl 1Matrix rinse 7 N HCl 2∙2.5Cu 7 N HCl 3∙6Fe 2 N HCl 2∙2Mo 0.5 N HNO3 3∙5Wash H2O 8Wash 0.5 N HNO3 4Wash H2O 4
Stage II, cation exchange with AG 50 W-X8 resin (2 ml of resin)Wash H2O 8Wash 6 N HCl 4Wash 0.24 N HCL 4Conditioning 0.24 N HCL 4Sample 0.24 N HCL 1Mo 0.24 N HCL 3∙3Fe 6 N HCl 2∙3Wash H2O 8Wash 6 N HCl 4Wash H2O 4
Neptune MC-ICP-MS at the Pole Spectrometry Ocean, Brest atIFREMER, France.
We used a97Mo–100Mo double spike solution prepared gravimetri-cally from Oak Ridge Laboratory metal powders. Optimization of thedouble spike isotope composition relative to the SPEX standard gave95Mo/98Mo, 97Mo/98Mo and 100Mo/98Mo isotopic ratios of 0.278,16.663 and 15.704, respectively. Data reduction was done according toSiebert et al. (2001), where iterationswere repeated until the differencein the δ98Mo value between two consecutive iterations was smallerthan 0.001‰. The typical number of iterations was ≤4. Molybdenumconcentrations during isotopic measurements varied from 100 to500 ppb, depending on the Mo content of the sample powders. Withina given session, standards and samples were measured at a constantconcentration. However, the external precision of the measurementwas not affected within this range—yielding 2SD = ±0.06‰, wherethe typical standard error of a single measurement (2SE) was 0.05‰.Molybdenum concentrations were derived from the spike/sampleratio determined as part of the double spike data reduction scheme.The MC-ICP-MS machine was operated at low resolution with an ESIApex Q introduction systemmeasuring all Mo isotopes masses togetherwith 91Zr and 99Ru in order to monitor isobaric interferences.
During each session of Mo isotope analysis, we performed frequentmeasurements of our in-house laboratory Mo standard (Mo SPEX lot11-177Mo), theNIST-3137 standard and the JohnsonMatthey Specpure®Mo plasma standard (Lot #802309E; RochMo2) used in previous studies(Barling and Anbar, 2004; and others). We have also preformed frequentmeasurements of georeference materials including SDO-1, Nod A-1 andNod P-1. The results of these measurements are presented in Table 4.Mo isotope compositions are reported using the δ notation, whereδ98Mo(‰) = 1000∙[(98Mo/95Mo)sample/(98Mo/95Mo)SPEX − 1], calculat-ed relative to our in-labMo SPEX standard (Lot 11-177Mo). A Calibrationof the SPEX standard relative to NIST-3137 (lot 891307) and Rochester(Lot 802309E) gave:
δ98=95MoSPEX ¼ δ98=95MoNIST3137−0:35� 0:12‰δ98=95MoSPEX ¼ δ98=95Moroch−0:05� 0:06‰
We choose to report our results relative to the SPEX standard since itis, within error (2SD), identical to the Rochester standard which is themost common standard in the recent Mo isotope literature.
3.3. Iron isotope analysis
For the determination of Fe isotope ratios we followed the methodsof Rouxel et al. (2005, 2008a, 2008b), providing us with high precisionmeasurementswithout argon interferences on theNeptune instrument.We operated the MC-ICP-MS in either medium or high-resolutionmode, and we used Ni as an internal standard for mass bias correction.We also used the “sample-standard bracketing” technique to correct forinstrumental mass discrimination by normalizing the isotope ratios tothe average measured composition of the standard that was run beforeand after the sample. Fe isotope values are reported relative to the stan-dard IRMM-14 using the following conventional delta notations:
δ56Fe ¼ 1000 � 56Fe=54Fe� �
sample=
56Fe=54Fe� �
IRMM−14−1
� �
Table 4δ98Mo values of different standards relative to our lab standard Mo SPEX.
NIST3137 Roch Nod P-1 Nod A-1 SDO-1
δ98Mo 0.36 0.05 −0.48 −0.32 1.092SD 0.06 0.06 0.10 0.04 0.08n 29 29 12 5 11

Table 5Chromatographic extraction UTEVA. Column volume (cv) = 2 ml. The procedure wasrepeated twice to ensure complete purification of the sample. A recovery yield of morethan 99% during the last step was measured.
Step Acid Volume [ml]
Wash 0.05 N HCl 20Conditioning 3 N HNO3 6Sample loading 3 N HNO3 10Matrix rinse 3 N HNO3 40Conversion to HCl 11 N HCl 6Th 5 N HCl + 0.1 N oxalic 20Oxalic acid rinse 5 N HCl 10U 0.05 N HCl 25
200 D. Asael et al. / Chemical Geology 362 (2013) 193–210
Based on a complete duplicated procedure (i.e., powder ashing,acid attack, chemical purification and isotope analysis), the long-termexternal reproducibility is 0.07‰ for δ56Fe values (2 standard devia-tions). We also measured the following georeference materials: BHVO-2 (δ56Fe = 0.09 ± 0.07‰) and Nod-P1 (δ56Fe = −0.49 ± 0.08‰).
Table 6Data summary for section 13 A. δ238U* indicate δ238U values corrected for detrital contribution
Sample Depth[m]
δ98MoSPEX
δ98MoNIST 3137
±2σ δ56Fe ±2σ δ238U δ238U* ±2
3109562 129.91 1.24 0.89 0.09 −0.14 0.12 −0.03 0.15 0.03109566 131.40 −0.25 −0.60 0.12 0.03 0.12 0.00 0.25 0.03109572 133.98 0.69 0.34 0.05 −0.15 0.123109640 134.23 0.77 0.42 0.05 −0.14 0.12 0.39 0.49 0.03109576 134.97 0.65 0.30 0.05 −0.14 0.12 0.26 0.38 0.03109578 135.20 0.78 0.43 0.05 −0.18 0.12 0.17 0.30 0.03109580 135.56 0.73 0.38 0.05 −0.20 0.12 0.21 0.42 0.03109582 136.06 0.96 0.61 0.09 −0.15 0.12 0.02 0.34 0.03109594 137.01 0.73 0.38 0.08 −0.07 0.12 0.06 0.33 0.03109596 137.33 0.81 0.46 0.06 −0.02 0.12 0.12 0.22 0.03109598 137.77 0.76 0.41 0.08 0.08 0.12 0.23 0.50 0.03109600 137.97 0.91 0.56 0.06 0.03 0.12 0.19 0.38 0.03109602 138.12 0.76 0.41 0.06 0.02 0.11 0.26 0.37 0.03109604 138.71 0.68 0.33 0.05 −0.08 0.11 0.36 0.52 0.03109606 139.10 0.48 0.13 0.05 −0.03 0.11 0.33 0.53 0.03109608 139.23 0.46 0.11 0.06 0.02 0.11 0.34 0.57 0.03109612 140.03 0.72 0.37 0.10 −0.02 0.11 −0.02 0.13 0.03109614 140.29 0.76 0.41 0.06 0.00 0.11 0.08 0.40 0.03109620 141.62 0.87 0.52 0.06 −0.05 0.11 0.00 0.34 0.03109622 142.65 1.41 1.06 0.11 0.03 0.11 −0.05 0.40 0.03109628 143.11 0.88 0.53 0.11 −0.22 0.11 −0.18 −0.05 0.03109638 145.53 0.67 0.32 0.13 0.41 0.11 −0.09 0.28 0.03109658 146.14 0.59 0.24 0.06 −0.02 0.10 0.19 0.59 0.03109668 146.87 0.58 0.23 0.06 −0.14 0.10 0.22 0.64 0.03109674 149.91 1.11 0.76 0.12 0.28 0.10 0.06 0.03109676 150.84 1.06 0.71 0.11 0.57 0.10 0.10 0.55 0.03109688 153.71 0.88 0.53 0.14 0.03 0.10 −0.05 0.03109748 157.83 1.06 0.71 0.16 0.47 0.09 −0.12 0.11 0.03109706 158.43 0.84 0.49 0.07 0.45 0.09 0.08 0.44 0.03109708 159.75 0.76 0.41 0.10 0.12 0.12 −0.01 0.49 0.03109712 161.34 0.52 0.17 0.48 −0.33 0.03109722 162.56 0.47 0.12 0.32 −0.33 0.03109724 163.62 0.99 0.64 0.18 0.40 0.09 −0.33 −0.49 0.03109726 164.77 0.82 0.47 0.10 0.08 0.09 0.02 0.44 0.03109732 166.96 0.85 0.50 0.06 0.43 0.09 0.10 0.35 0.03109736 167.74 0.96 0.61 0.09 0.83 0.09 −0.06 0.86 0.03109738 168.52 0.80 0.45 0.10 0.56 0.10 −0.08 0.22 0.03109740 169.02 0.74 0.39 0.11 0.47 0.10 0.02 0.22 0.03109744 169.93 0.71 0.36 0.10 0.52 0.10 0.01 0.10 0.03109746 170.47 0.73 0.38 0.10 0.40 0.10 0.12 0.25 0.03109752 171.07 0.85 0.50 0.05 0.20 0.10 0.20 0.33 0.03109758 171.81 0.63 0.28 0.06 0.29 0.10 0.24 0.44 0.03109760 172.23 0.58 0.23 0.05 0.48 0.10 0.15 0.29 0.03109764 173.35 0.39 0.04 0.07 0.40 0.10 0.24 0.43 0.03109778 175.30 1.27 0.92 0.12 0.08 0.10 −0.12 0.0
3.4. Iron speciation
For the Fe speciation procedure ca. 100 mg of sample powder wasfirst treatedwith a buffered sodium acetate solution for 48 h tomobilizeferrous carbonate phases. A split of the extract was removed for analy-sis, the sample was spun down, and the remaining supernatant wasdiscarded. The sample was then treated with a sodium dithionite solu-tion for 2 h to dissolve crystalline ferric oxides (FeOX) and processedas before. Finally, the sample was treated with an ammonium oxalatesolution to mobilize magnetite (FeMag). All extractions were performedat room temperature in 15 mL centrifuge tubes under constant agita-tion. The sequential extracts were analyzed on an Agilent 7500ce ICP-MS after 100-fold dilution in trace-metal grade HNO3 (2%). Pyrite iron(FePY) was calculated separately based on weight percent pyrite sulfurextracted during a 2-hour, hot chromous chloride distillation followedby iodometric titration (Canfield et al., 1986), assuming a stoichiometryof FeS2.
We have modified our procedure to include a wet chemical extrac-tion for pyrrhotite (Fe1 − xS, where x is usually ~0–0.2). Crystalline pyr-rhotite was isolated from pyrite through a boiling 6 N HCl distillation
.
σ TOCwt.%
FeHR/FeT FeS/FeHR FePYwt.%
Fepyrrwt.%
[Mo]ppm
[U]ppm
Fewt.%
Alwt.%
STOTwt.%
5 11.7 0.63 0.60 0.20 8.1 3.96 0.52 5.38 0.115 3.2 0.67 0.31 0.02 0.17 6.5 3.06 0.93 4.72 0.12
8.9 0.44 0.87 1.11 0.19 43.8 3.37 3.16 1.385 10.7 0.57 0.79 1.01 0.22 46.6 11.50 2.71 5.14 1.286 10.2 0.78 0.78 0.86 0.28 72.3 10.81 1.86 6.30 1.146 11.2 0.68 0.82 0.60 0.38 39.5 9.61 1.76 7.10 0.916 9.1 0.78 0.82 0.68 0.24 23.1 6.36 1.44 6.12 0.924 6.1 0.91 0.91 1.28 0.17 10.7 3.83 1.74 6.43 1.564 10.0 0.86 0.88 1.17 0.26 15.5 4.55 1.90 6.52 1.494 6.7 0.55 0.88 0.77 0.27 14.1 3.81 2.13 2.44 1.044 8.5 0.30 0.86 0.41 0.30 23 4.58 2.80 5.27 0.644 8.9 0.44 0.90 0.77 0.33 38.9 7.15 2.75 6.75 1.075 10.5 0.39 0.85 0.64 0.13 33.6 9.90 2.32 5.46 0.815 11.3 0.39 0.77 0.46 0.29 39.5 9.83 2.52 6.54 0.705 11.1 0.83 0.34 33 8.47 1.70 6.71 1.145 11.5 0.64 0.32 40.7 8.44 1.49 7.38 0.925 9.2 1.02 0.28 11.2 4.33 2.02 5.31 1.335 12.1 0.91 0.96 1.98 0.23 12 4.02 2.53 6.21 2.405 7.9 1.85 0.33 12 3.34 2.74 5.96 2.305 4.4 0.91 0.91 2.58 0.18 7.7 2.82 3.33 6.04 3.065 7.3 1.45 0.20 4.1 3.00 2.28 5.68 1.785 4.7 0.43 0.54 0.47 7.2 1.13 2.01 2.41 0.275 10.0 0.51 15.2 3.88 2.56 5.83 0.295 9.8 0.69 0.47 0.71 12.3 3.83 2.17 5.65 0.415 3.5 0.37 0.23 4.1 1.27 2.44 6.13 0.565 6.6 0.03 0.64 5.2 1.73 3.34 3.07 0.415 5.3 1.00 0.70 0.03 2.13 7.1 2.22 2.86 8.02 1.255 3.2 0.57 0.51 0.11 0.29 2 0.75 1.42 1.46 0.305 9.8 0.68 0.45 0.58 10.3 4.72 1.90 7.65 0.335 7.0 0.84 0.61 0.02 1.27 5.1 3.98 2.52 8.48 0.766 2.0 0.27 0.46 0.24 0.45 1.86 2.41 0.146 2.4 0.27 0.49 0.01 0.19 0.65 1.57 1.97 0.135 1.4 0.21 0.51 0.29 1.7 1.71 2.71 3.83 0.176 6.5 1.00 0.62 1.07 5.1 2.85 1.68 5.48 0.616 9.4 0.02 0.37 11.9 6.01 1.24 7.68 0.236 7.1 5.1 2.73 0.91 7.146 8.7 6.5 3.16 0.89 6.326 7.7 0.81 0.58 0.48 7 2.78 1.01 3.70 0.276 9.2 0.77 0.64 0.59 9.7 5.53 1.19 4.51 0.346 10.8 10.5 6.29 1.69 5.106 10.7 0.89 0.61 0.05 1.26 25.5 8.13 2.42 5.74 0.776 10.8 17.4 4.89 2.27 4.426 16.1 0.37 0.55 0.04 0.50 21.6 4.77 2.64 3.88 0.336 10.0 15.5 4.79 3.74 4.166 10.7 1.00 0.57 0.01 1.53 4.6 1.62 2.66 6.76 0.89

201D. Asael et al. / Chemical Geology 362 (2013) 193–210
with SnCl2 serving as a reductant (in case Fe(III) is simultaneously liber-ated). This method (specifically the boiling rather than cold extraction)mobilizes some pyrite in modern sediments and is thus too aggressivefor complete separation of pyrrhotite from pyrite in these systems(Chanton and Martens, 1985; Cornwell and Morse, 1987). However,some previous work suggests that this method provides accurate sepa-ration in more crystalline sedimentary rocks (e.g., Rice et al., 1993), andour internal tests with crystalline pyrrhotite and pyrite standardsshowed relative yields of pyrrhotite and pyrite of N97% and b4%, respec-tively, when treated with hot 6 mol/LHCl and SnCl2. A cold HClapproach will badly underestimate the amount of crystalline pyrrhotitepresent. In contrast, it is well known that the conventional chromiumreduction procedure (Canfield et al., 1986) will effectively mobilize allsulfide phases in sediments and sedimentary rocks. Pyrite sulfur canthus be quantified by the difference between chromium-reduciblesulfur and that sulfur which is extracted with a hot 6 mol/LHCl leachas described above. Separate measurement of pyrrhotite and pyriteallows one to quantify the total amount of ‘sulfidized’ Fe (FeS) asfollows:
FeS ¼FePY þ FePO
FeHR
where in addition to the terms described above FePO denotes Fe presentas pyrrhotite. This essentially amounts to a stoichiometric correction ofthe sulfur-bound Fe pool and is important when appreciable pyrrhotiteis present.
For measurement of total iron (FeT), sample powders are ashedovernight at 450 °C (in order to remove organic matter but preservevolatile metals, such as rhenium) and digested using sequentialHNO3–HF–HCl acid treatments (see, for example, Kendall et al., 2009).After digestion, samples are reconstituted in trace-metal grade HNO3
(2%), diluted and analyzed by ICP-MS.
Fig. 2. Lithology and down-hole chemostratigraphy of drill hole 13A: (a) Generalized startigratration; (c) Uranium isotopic composition, corrected isotopic composition and concentration(f) FePO/FeHR ratio and FePY/FeHR ratio; (g) Total sulfur concentration and Mo/TOC ratio.
3.5. Uranium isotope analysis
Sample preparation for U analyses was adapted from Tissot andDauphas (2011). Depending on U concentration in the samples,digested mass varied from ~20 mg to ~650 mg. Samples were firstplaced in individual aluminum foil envelopes and ashed at ~500 °Covernight in a 47900 Barnstead Thermolyne furnace, to burn off theorganic matter. All samples were double-spiked after ashing but beforedigestion using the 233U/236U IRMM-3636 spike (containing ~49.51% of236U and ~50.46% of 233U). The amount of spike added was determinedto achieve aUspike/Usample of ~3%. Samples were then dissolved on hotplates by at least two 24 h acid attacks in HF/HNO3(2:1) followed byat least two 24 h acid attacks in HCl/HNO3(2:1). Samples were thendried down before being reconstituted in concentrated HNO3 and putback on the hot plate for an additional 24 h, followed by dilution to3 mol/L HNO3. To check that the ashing step was not affecting the re-sults, replicates of five core samples with U concentrations rangingfrom 0.45 ppm to 6.45 ppm were prepared following an identical pro-cedure but with no ashing step. Comparison of ashed and non-ashedsamples showed no difference in U isotopic composition.
The U fraction was extracted from matrix elements and purifiedusingU/Teva resin® (Eichrom). The elution procedure is the sameas de-scribed in Telus et al. (2012) and is shown in Table 5. Uraniummeasure-mentswere performed at the Origins Lab of the University of Chicago ona Thermo Neptune MC-ICP-MS, upgraded with an OnTool Booster 150Jet pump (Pfeiffer), using a combination of an Aridus-II desolvating neb-ulizer and a spray chamber for improved stability of the signal. The sig-nal intensity was typically ~20 V for a 20 ppb solution with a flow rateof ~100 μl/min. Use of a 233U/236U double spike allowed us to correctfor mass fractionation during sample preparation and spectrometry. Afurther correction was applied via sample-standard bracketing, alongwith a tailing correction of 238U onto236U, which was estimated to be0.6 ± 0.1 ppm, in good agreement with the value of 0.5 ppm reportedby Weyer et al. (2008). The procedural blank was estimated to be
phic column divided into three units; (b) Molybdenum isotopic composition and concen-; (d) Iron isotopic composition and concentration; (e) FeHR/FeT ratio and FeS/FeHR ratio;
a
202 D. Asael et al. / Chemical Geology 362 (2013) 193–210
0.07 ng U. A blank correction was applied despite having little effecton the result. All values are reported in δ238U = [(238U/235U)sample/(238U/235U)CRM-112a − 1] × 103.
4. Results
4.1. Mineralogy, lithostratigraphy and chemostratigraphy
Lithological andmineralogical characterization of the samples basedon XRD diffraction and the original drilling log is found in Table 6. Ingeneral, the studied section is predominantly composed of organic-rich silty black shale with varying sand and carbonate contributions.The chemostratigraphy data together with the Mo, Fe and U isotopicdata are presented in Table 6 and in Fig. 2. Based on the down-hole pro-files for [Mo], [U], δ238U and TOC, the section can be divided into threeunits: Unit A (166 to 176 m), which shows relatively high [Mo], [U]and TOC; Unit B (145 to 165 m) marked by lower [Mo], [U] and TOC;and Unit C (129 to 144 m), which is defined by the highest [Mo], [U]and TOC. The Fe speciation data show only a minor difference betweenunits A and B, where FeHR/FeT ratios in Unit B is only slightly lower thanthose in unit A. On the other hand, the transition from unit B to unit C ismarkedby a sharp change,where FeHR/FeT and FePY/FeHR become signif-icantly higher and FePO/FeHR ratios decrease dramatically. In fact, FePYand FePO show clear negative covariation throughout the section. Simi-larly, total S in unit C is higher than in units A and B.
a
b
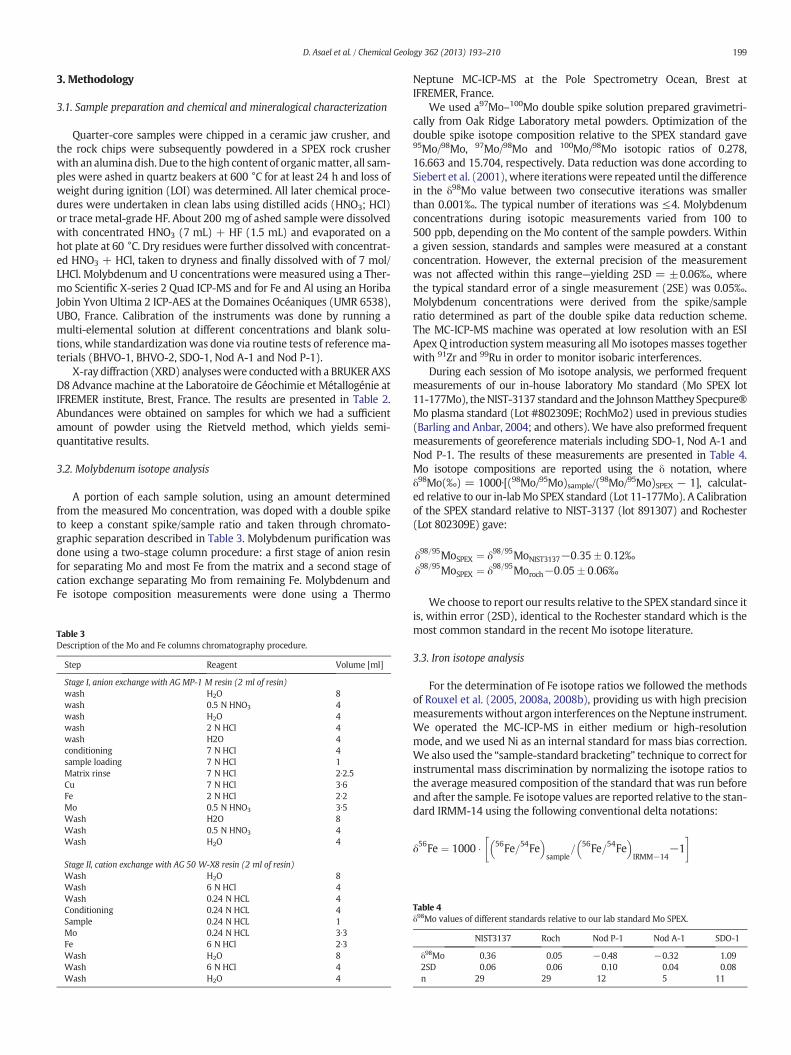
Fig. 3. (a) δ98Mo values vs. Mo/Al ratios, star represents the continental crust value ofMo/Al = 0.19, δ98Mo error bars are plotted where greater than symbol size; (b) Mo con-centrations vs. TOC values. Grey dashed line represents the Black Sea trend of [Mo] vs. TOC(from Lyons et al. (2009)).
4.2. Molybdenum, iron and uraniumisotopic compositions
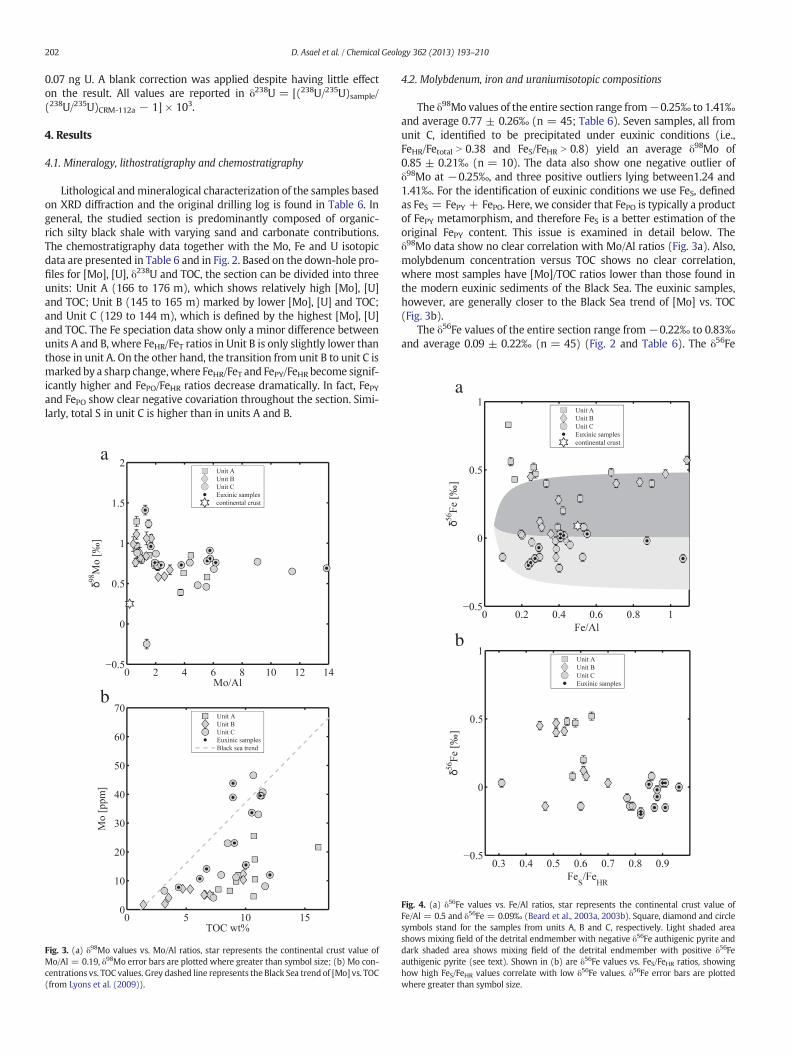
The δ98Mo values of the entire section range from−0.25‰ to 1.41‰and average 0.77 ± 0.26‰ (n = 45; Table 6). Seven samples, all fromunit C, identified to be precipitated under euxinic conditions (i.e.,FeHR/Fetotal N 0.38 and FeS/FeHR N 0.8) yield an average δ98Mo of0.85 ± 0.21‰ (n = 10). The data also show one negative outlier ofδ98Mo at −0.25‰, and three positive outliers lying between1.24 and1.41‰. For the identification of euxinic conditions we use FeS, definedas FeS = FePY + FePO. Here, we consider that FePO is typically a productof FePY metamorphism, and therefore FeS is a better estimation of theoriginal FePY content. This issue is examined in detail below. Theδ98Mo data show no clear correlation with Mo/Al ratios (Fig. 3a). Also,molybdenum concentration versus TOC shows no clear correlation,where most samples have [Mo]/TOC ratios lower than those found inthe modern euxinic sediments of the Black Sea. The euxinic samples,however, are generally closer to the Black Sea trend of [Mo] vs. TOC(Fig. 3b).
The δ56Fe values of the entire section range from−0.22‰ to 0.83‰and average 0.09 ± 0.22‰ (n = 45) (Fig. 2 and Table 6). The δ56Fe
b
Fig. 4. (a) δ56Fe values vs. Fe/Al ratios, star represents the continental crust value ofFe/Al = 0.5 and δ56Fe = 0.09‰ (Beard et al., 2003a, 2003b). Square, diamond and circlesymbols stand for the samples from units A, B and C, respectively. Light shaded areashows mixing field of the detrital endmember with negative δ56Fe authigenic pyrite anddark shaded area shows mixing field of the detrital endmember with positive δ56Feauthigenic pyrite (see text). Shown in (b) are δ56Fe values vs. FeS/FeHR ratios, showinghow high FeS/FeHR values correlate with low δ56Fe values. δ56Fe error bars are plottedwhere greater than symbol size.

a
b
Fig. 5. (a) δ238Uvs. Al/U ratioswith linearfit and95% confidence level lines giving R2 = 0.48;(b) δ238U values corrected for detrital contribution vs. Al/U ratios with linear fit and ±95%confidence level lines giving R2 = 0.01.
203D. Asael et al. / Chemical Geology 362 (2013) 193–210
values vary among the different units and are mostly negative in unit C(δ56Fe = −0.07 ± 0.08‰), becoming positive down-hole in units B(δ56Fe = 0.24 ± 0.24‰) and A (δ56Fe = 0.42 ± 0.20‰). No correla-tion is observed between δ56Fe and Fe/Al ratios (Fig. 4a), where lowδ56Fe values correlate with high FeS/FeHR values (Fig. 4b).
The δ238U values of the entire section range from −0.33‰ to 0.39‰and average 0.07 ± 0.18‰ (n = 45) (Fig. 2 and Table 6). A good correla-tion is observed between δ238U and Al/U ratios (Fig. 5a; R2 = 0.48),whose origins and implications are discussed further in the next section.The average δ238U values in the threeunits are: δ238U = 0.14 ± 0.16‰ inunit C, δ238U = −0.05 ± 0.19‰ in unit B, and δ238U = 0.07 ± 0.13‰ inunit A.
5. Discussion
5.1. Iron speciation and isotopic composition
Our primary observation with respect to Fe speciation chemistry is astriking up-section shift in the proportion of sulfur-bound Fe that is pres-ent as pyrite relative to pyrrhotite. Specifically, in the lower units (A andB), S-bound Fe is predominantly present as pyrrhotite,while in theupperunit (C) S-associated Fe is mostly pyrite. It has been suggested that somepyrrhotite can accumulate in low temperature systems as either a detri-tal phase or through authigenic formation in a sulfur-limited system(Roberts and Turner, 1993; Horng and Roberts, 2006; Larrasoaña et al.,
2007). If this is the case, the reactive Fe system can be relatively straight-forwardly interpreted by using the FeS/FeHR values as an index of iron-limited sulfide formation, as discussed above (e.g., Reinhard et al.,2013b).
However, there are good reasons to suspect that the low-temperature formation of pyrrhotite as an authigenic or diageneticphase should be rare (e.g., Schoonen and Barnes, 1991a,b; Lennie,1995; Rickard and Luther, 2007). We thus consider it far more likelythat the pyrrhotite component of our samples is a result of metamorphicpyrite alteration, which can sometimes occur at relatively lowmetamor-phic grades (sub-greenschist facies), particularly in the presence of ap-preciable organic matter (Ferry, 1981; Poulton, 2002). The likelihood ofpyrite conversion to pyrrhotite is also supported by the observed anti-thetic relationship between the concentrations of the two phases.
The process of post-depositional pyrrhotite formation typically oc-curs through one of following three mechanisms (Ferry, 1981; Oliveret al., 1992; Alonso-Azcarate et al., 1999), which have different ramifica-tions for the ultimate Fe–S stoichiometry:
(a) Partial oxidation of the host rock balances the conversion of py-rite to pyrrhotite: 2FeS2 + 2FeO + Cred → 4FeS + CO2, wherethe “FeO” component can come from oxide or silicate phases inthe host rock, and reduced carbon serves as the redox partner.In this case, the net result is no stoichiometric change in thetotal Fe and S contents of the rock, but there is a change in thedistribution of reactive Fe in that S-bound Fe forms at theexpense of an oxide phase, leaving the overall FeHR budgetunchanged but potentially yielding a spurious euxinic signal.Alternatively, silicate phases can be involved, thus introducingunreactive Fe from the host rock into the FeHR pool.
(b) Introduction of Fe-bearing fluid during metamorphism, whichthen reacts with pyrite to yield pyrrhotite and an acidic fluid:2FeS2 + 2FeCl2 + 2H2O + Cred → 4FeS + 4HCl + CO2, where“FeCl2” represents mobile Fe within the alteration fluid. In thiscase, although there is no stoichiometric change in the total Scontent of the rock, there can be an increase in total Fe if theiron is delivered from sources external to the immediately sur-rounding host rock. This pathway would have the effect of artifi-cially increasing FeHR, FeT and FeS, but because thesewould all beincreased in a commensurate fashion there would be no changein the normalized ratios (FeHR/FeT and FeS/FeHR) provided thatthe stoichiometry of sulfur-bound Fe is accurately assessed.
(c) Pyrrhotite formation through thermal decomposition of pyrite,generating an H2S-bearing fluid: 2FeS2 + 2H2O + Cred →2FeS + 2H2S + CO2. Here, there is no net stoichiometric changein the total Fe content of the host rock, but S is lost from the rockto a reducing fluid during thermal decomposition of pyrite.
We can evaluate the likelihood of each of these processes by com-paring the bulk and reactive Fe–S stoichiometry with an index of meta-morphic alteration, defined as (Ferry, 1981):
FPY ¼ SPYSPY þ SPO
where SPY denotes pyrite sulfur and SPO denotes pyrrhotite sulfur. Dom-ination of the S pool by pyrite (FPY → 1) implies that the Fe–S chemistryis relatively unaltered. In contrast, as FPY → 0 pyrrhotite becomes thedominant host for S-bearing Fe, more extensie alteration of originalFe–S chemistry is indicated.
The behavior of bulk Fe chemistry (FeT and FeHR) and bulk S chemis-try as a function of FPY is shown in Fig. 6. The core can be easily dividedwith respect to Fe–S chemistry into a lower interval dominated by pyr-rhotite (units A and B) and an upper interval dominated by pyrite (unitC; Fig. 2). We find no apparent trends in the behavior of bulk Fe chem-istry between these two zones, either in terms of FeT or FeHR (Fig. 6a).

a
b
Fig. 7. (a) Detailed Fe speciation results for units A and B. All reactive Fe species are shownas a function of total FeHR. Filled symbols correspond to FeS, with open symbols corre-sponding to the other reactive Fe phases as depicted in the legend. Also shown are the lin-ear least-squares regression lines for each Fe pool and the resulting R2 values. The greyregion shows the euxinicfield (defined as 1.0 N FeS/FeHR N 0.8). (b) Detailed Fe speciationresults for Unit C. All symbols and abbreviations as in (a), with filled symbols showing FeSopen symbols residual reactive Fe pools as shown in the legend. Linear least-squares re-gression results are shown as in (a), as is the euxinic field.
a
b
Fig. 6. (a) Relationship between metamorphic alteration of the sulfur pool (quantified asFPY) and the inclusive Fe pools FeT (open symbols) and FeHR (closed grey symbols). Thelarge squares and associated error bars show the mean and 95% confidence interval forthe lower units (A and B; left) and upper unit (C; right). (b) Relationship betweenS/FeHR and FPY, showing evidence for sulfur loss during metamorphic decomposition ofpyrite. The curve shows results from the model discussed in the text.
204 D. Asael et al. / Chemical Geology 362 (2013) 193–210
However, there is a striking systematic trend toward lower S/FeHR ratioswith decreasing FPY values (Fig. 6b), a trend that can also be seen in bulkrock S content. This strongly suggests that the mechanism of pyrrhotiteformation in these units was the thermal breakdown of pyrite and sub-sequent loss of S from the rock. Importantly, this relationship also sug-gests that the system was effectively closed on a bulk-rock scale withrespect to FeT and FeHR (discussed below).
The trend between FPY and S/FeHR in Fig. 6b can be reproduced fairlywell by a simple model that makes the following assumptions: (1) themolar S/FeHR ratio of the Fe–S system in the unmetamorphosed hostrock is 2.0 (corresponding to a stoichiometry of FeS2), (2) the molarS/FeHR ratio of the Fe–S system at complete breakdown of pyrite to pyr-rhotite is 1.0 (corresponding to a stoichiometry of FeS), (3) there is aninitial amount of residual FeHR present in the unaltered parent rockthat behaves conservatively, and (4) the system is completely closedwith respect to reactive Fe. The third assumption effectively accountsfor the fact that the wet chemical extractions are operational innature. For example, euxinic settings should, in theory, always haveFePY/FeHR = 1.0, but this is often not the case in practice becausesome unreactive Fe is extracted during our characterization of ‘reactive’Fe. The correspondence between the data and our simple model
provides additional support for the notion that reactive Fe is behavingconservatively in this system during metamorphism and that the alter-ation patterns observed are straightforwardly interpreted to reflect sul-fur loss during pyrite decomposition.
Many of the samples analyzed here are clearly anoxic, particularlywithin Unit C, as expressed in the elevated FeHR/FeT ratios (Fig. 2).When we examine the reactive Fe systematics in more detail, it be-comes apparent that this unit also shows clear characteristics of aeuxinic setting (Fig. 7b)—that is, a strong correlation between FeHRand FeS (the latter of which is dominated by FePY; R2 = 0.98) andhigh FeS/FeHR ratios that fall within the euxinic field, both of which areconsistent with the Fe-limited conditions that typify euxinia. The reac-tive Fe systematics of the lower units (Unit A and Unit B) aremore com-plex (Fig. 7a). Herewe observe strong correlation between FeHR and FeS,with linear least-squares regression yielding an R2 value of ~0.97,suggesting euxinic Fe limitation but with FeS dominated by FePO. How-ever, reactive Fe phases other than pyrite and pyrrhotite in units A

205D. Asael et al. / Chemical Geology 362 (2013) 193–210
and B make up a non-trivial fraction of the reactive Fe system, with theresult that FeS/FeHR falls out of the euxinic field (Fig. 7a).
If interpreted at face value purely in terms of FeHR/FeT and FeS/FeHR,these patternswould suggest units A and Bwere deposited under ferru-ginous conditions. However, we consider this unlikely. The striking cor-respondence between FeS and FeHR and the relative dominance ofsulfur-bound Fe phases within the overall reactive Fe pool are difficultto explain in the context of a strongly Fe2+-buffered anoxic system. In-deed, if we were to apply a recently proposed lower threshold foreuxinic deposition of FeS/FeHR ~ 0.7 (März et al., 2008; Poulton andCanfield, 2011), many of the unit A and B samples would fall veryclose to the lower end of the euxinic field. Moreover, both the lowerand upper portions of the core show authigenic Mo enrichment sugges-tive of sulfidic conditions (Fig. 2), with little to no systematic differencein δ98Mo values between the clearly euxinic Unit C and themore ambig-uous units A and B. Taken together, these observations suggest thatmost of the corewas deposited under euxinic conditions, with Fe chem-istry that has been obscured bymetamorphic overprinting within unitsA and B.
We therefore conclude that Unit C provides a faithful repository ofcontemporaneous seawater δ98Mo. The limited systematic variabilityin δ98Mo between the lower and upper portions of the core indicatesthat the same can be said also for the metamorphically overprintedunits A and B. We stress, most importantly, that these units provide anobject lesson in the difficulties inherent, and the attendant level of re-quired care, in any application of reactive Fe speciation to heavily al-tered rocks. In addition, it is instructive to consider that were the Fespeciation data to be interpreted at face value, the lower portion ofthe core would be interpreted to reflect ferruginous deposition, a signalthat we consider likely to be spurious in this case.
The Fe isotope compositions are unexpectedly heavy for black shales(up to 0.8‰), especially in the lower part of the section (Units A and B).Our δ56Fe values does not correlate with Fe/Al ratios, eliminating thepossibility of a simple two endmember mixing relationship betweenan Al-rich detrital endmember with crustal δ56Fe values, and a Fe-richauthigenic endmember with generally negative values (Severmannet al., 2008; Duan et al., 2010a,b). Similar positive δ56Fe values fromthis time period have only been reported so far for separated pyrite(Rouxel et al., 2005). Such values may result from one of the followingprocesses: (1) a preferential loss of isotopically light Fe, which willalso result in lower Fe/Al ratios. This was demonstrated at low temper-ature in soil environments and during microbial leaching of silicates(Brantley et al., 2001, 2004) and also during alteration of seafloor basalts(Rouxel et al., 2003); (2) an addition/deposition of isotopically heavy Fe,whichmay be either in the form of authigenic Fe-sulfides (Rouxel et al.,2005) or Fe-oxides, for example produced through partial Fe(II) oxida-tionwithin thewater column (Planavsky et al., 2012b), thereby increas-ing the Fe/Al ratio; or (3) precipitation of isotopically heavy pyrite fromseawater enriched in heavy Fe as a result of Rayleigh effects linked toprior pyrite precipitation and possibly as a result of weak shelf-to-basin Fe transfer (i.e., relativelyweak Fe shuttle) and attendant Rayleighdistillation during Fe transport through the basin.
Although the average of Fe/Al ratio of 0.46 ± 0.26 compares wellwith the average continental crust values (~0.5) (Taylor and McLennan,1995), Fe/Al values as low as 0.1 to 0.3 were encountered at certaindepths (e.g., samples: 3109562, 3109566, 3109608, 3109732, 3109736).On the one hand, such low values may point tomobility of Fe after depo-sition. On the other hand, theymay also result from low Fe content in theprotolith/detrital Fe source and a strong local control on sediment sourc-ing. An examination of the XRD data reveals high content of Al-rich detri-tal minerals (mainly feldspars and biotite; Table 2) in our samples,suggesting that lowFe/Al ratioswere a primary feature of thedetrital sed-iment load. Thus, authigenic input of Fe-minerals, dominated by pyriteprecipitation in our case, was themain factor to determine the Fe isotopecompositions of the bulk sediment. The Fe isotope composition of theprecipitated pyrite is in turn a function of the seawater composition
and mass balance between the dissolved and precipitated Fe. A post-depositional event was responsible for the pyrrhotite formation in unitsA and B. In any case it seems that this alterationwas not involved in a sig-nificant gain or loss of Fe, and therefore the authigenic isotopic signatureof the bulk rock has most likely been preserved.
The low δ56Fe values, mainly observed in unit C, can be explained bymixing of detrital Fe with authigenic pyrite. A mixing relationship be-tween such two endmembers—a detrital endmember with low Al con-tent (Fe/Al ≥ 0.05) and δ56Fe ≈ 0.09‰ (Beard et al., 2003a,b), and anauthigenic pyritic endmember with δ56Fe ranging from −0.4 to 0‰(light shaded area in Fig. 4a)—can account for all samples with δ56Fevalues of ≤0‰. Samples with high δ56Fe values and high Fe/Al ratiosmay testify to relatively weak shelf-to-basin Fe transfer of light Fe, andconsiderable Rayleigh effects that would enrich the seawater in heavyFe and give rise to precipitation of pyrites with positive δ56Fe. This pro-cess can happen at the lower region of or slightly below the core of a lo-cally euxinic portion of the basin, which itself provides a sink of light Fe(i.e., the same part of the basin recorded in Unit C). A mixing relation-ship between a detrital endmember and a heavy Fe endmember suchas mentioned above (dark shaded area in Fig. 4a) can account formost of the samples with δ56Fe values of ≥0‰. In this context we cansay that the transition observed in the δ56Fe values from units A and Bto unit C represents a shift in the relative location in the water columnfrom the bottom margins of aneuxinic wedge into its core or a regionmore proximal to the shallower shelf. It could be noted that benthic Feflux with positive δ56Fe values has been already reported in modernoceanic setting as a result of Fe-sulfide precipitation at or near the sea-water/porewater interface (Roy et al., 2012) andmay also occur at larg-est scale in the water column. Unit C also shows higher [Mo] and [U],which are typical of strongly sulfidic conditions. There are few sampleswith high δ56Fe and low Fe/Al values, which clearly fall outside theabove considerations. In such cases, the only plausible explanation isloss of light Fe during metamorphic processes, which increased theδ56Fe values and decreased the Fe/Al ratios or simply reflect an unusualdetrital source composition.
5.2. Molybdenum concentration and isotopic composition
The elevated Mo/Al ratios (average of 2.2 for the entire section and4.6 for unit C, compared to 0.19 for upper continental crust) togetherwith the fact that the Mo isotope compositions show no correlation to[Mo] or toMo/Al (Fig. 3a), indicate that theMo in these rocks is predom-inantly authigenic and that detrital contributions are negligible.
When taken at face value, the FeHR/FeT and FeS/FeHR ratios suggestthat euxinic conditions were found only in unit C. However, more care-ful evaluation of the Fe data shows they are consistentwith euxinia overall three units. This is further suggested by the observation that the Moisotope compositions are relatively uniform at 0.77 ± 0.26‰ through-out the entire section, while we would expect to see larger Mo isotopicvariations in case of changes in the redox conditions. Moreover, theδ98Mo values do not respond to changes in the [Mo]/TOC ratios or Fespeciation (Fig. 2), and [Mo]/TOC ratios along the entire section are rel-atively low ([Mo]/TOC = 1.9 ± 1.4; compared with ~4.5 for Black Seaeuxinic sediments and ~14 for SDO-1 (Devonian black shale)]. Suchlow [Mo]/TOC values may represent Mo reservoir limitation due towidespread euxinia. These findings support our interpretation of theFe speciation data that the section was deposited under predominantlyeuxinic conditions. Based on geological considerations showing that thestudied section is part of a regional platformal sequence, we eliminatethe possibility the low Mo/TOC values are a result of deposition in avery restricted basin which was not connected to the global ocean.
Unit C yields the highest FeHR/FeT and FePY/FeT with lowest FePO/FeT(Fig. 2) and is thus the only part of our section that did not undergo an ob-vious significant metamorphic/post-depositional overprint, and euxinicconditions can be comfortably identified using Fe speciation data. There-fore, we suggest that the best evaluation of the contemporaneous Mo

206 D. Asael et al. / Chemical Geology 362 (2013) 193–210
isotope composition of the seawatermaybe derived from this unit, givingδ98MoSW value of 0.85 ± 0.21‰. A simple calculation by Kendall et al.(2011) shows that the oceanic residence time of Mo during the lateArchean and Proterozoic would likely have been one or two orders ofmagnitude longer than timescales of ocean mixing, suggesting that dur-ing this time interval the oceanswere probably homogenouswith respectto Mo.
If we argue that the isotopic composition of seawater (δ98MoSW)was0.85 ± 0.21‰ during deposition of the entire studied section, the onelow δ98Mo outlier value of−0.25‰ (sample 3109566) is best explainedthrough non-quantitative removal of the Mo to the sediment. This lowvalue also correlates with low FeS/FeHR and TOC values, supporting atemporary local change to non-euxinic conditions where significantnegative fractionation took place during Mo removal. The section alsocontains three positive outliers with δ98Mo values ranging from 1.24to 1.41‰, which are among the highest values yet measured forPaleoproterozoic black shale samples (Kendall et al., 2009, 2011; Duanet al., 2010a,b) and are close to some Phanerozoic samples (Lehmannet al., 2007). Since net fractionation duringMo removal can only be neg-ative or zero (in case of complete removal), the δ98Mo value of the orig-inal seawater can only be higher or equal to that of the sediment.Therefore, the high δ98Mo values (higher than the contemporaneousδ98MoSW estimates in samples 3109562 at 129.91 m, 3109622 at142.65 m and 3109778 at 175.3 m) are less straightforward to explain.We suggest a water columnmechanismwhereby enhancedMo remov-al to non-euxinic sinks led to a concomitant enrichment of local seawa-ter in heavy Mo isotopes and in turn to higher δ98Mo values during thelater stages of enrichment in the sediment. Such a processwould neces-sarily be transient since Mo isotope compositions above and belowthose positive excursions remain unchanged. It also requires an inter-mittently isolated pool of seawater Mo. The sporadic appearance ofthese values suggests that this could have happened locally for short pe-riods of time, when local renewal of seawater was slow.
5.3. Uranium concentrations and isotopic compositions
The U isotope compositions correlate with Al/U ratios (Fig. 5a). UnitC shows the highest U concentrations and δ238U values, with unit Bmostly notably showing lower U concentrations and δ238U values. Sim-ilar patterns are also observed in Fe speciation and Mo concentrations,all pointing to changes in the deposition conditions along the section.In addition, the XRD data (Table 2) show a high detrital content in allsamples. These observations indicate that the bulk rock U isotope com-positions aremainly a result ofmixing relationship between a low δ238Udetrital endmember and a high δ238U authigenic endmember. There-fore, before interpreting the data in terms of global ocean redox condi-tions, we need to constrain the detrital signature. Carbonates shoulddirectly record the isotopic composition of the seawater they are precip-itating from (Brennecka et al., 2011). However, samples from our sec-tion with high carbonate content show high variations in their δ238Uvalues, which in part are close to the detrital endmember, suggestingdetrital contamination. Therefore, a direct estimation of the contempo-raneous δ238U seawater value based on carbonates is not possible.
A correction for the detrital component in the samples was thusmade by extrapolating the isotopic composition at Al/U = 0 (i.e., no de-trital influence) using the following equation:
δ238Ua ¼ δ238U− Al.U
� �� δ238U det−δ238U
Al�U
� �det−
Al.U
� �0B@
1CA
where the det stands for detrital. The detrital endmember was obtainedby averaging basalt and granite geostandards measured at the OriginsLab (Tissot and Dauphas, 2012) and led to δ238Udet = −0.267‰ and(Al/U)det = 3.19 (geometric mean of the basalts and granites Al/U ra-tios). Similarly, the error in the δ238Ua value was calculated using the
following equation (which propagates any error in the δ238U value ofthe sample but not the error in Al/U ratio of the sample or the errorsin the detrital endmember):
σδ238Ua ¼ffiffiffiffiffiffiffiffiffiffiffiffiffiffiffiffiffiffiffiffiffiffiffiffiffiffiffiffiffiffiffiffiffiffiffiffiffiffiffiffiffiffiffiffiffiffiffiffiffiffiffiffiffiffiffiffiffiffiffiffiffiffiffiffiffiffiffiffiffiffiffiffiffiffiffiffi1þ
Al�U
� �Al�U
� �det−
Al�U
� � !2
� σδ238U2
vuut
A cut-off in the Al/U ratios of the samples was placed at 3, to avoidmeaningless interpolations—i.e., the measured data are too close to thedetrital component and there is no leverage to properly extrapolate,and error becomes too large. The corrected isotopic compositions areheavier, showing an average δ238Ua value of 0.35 ± 0.22‰, where beforecorrection the average δ238U was 0.07 ± 0.18‰ (Figs. 2 and 5). Theeuxinic samples show similar average δ238Ua value of 0.32 ± 0.15‰,whichwe use to infer the U isotope composition of the contemporaneousseawater. It is important to note that the corrected δ238U values show noclear difference between the three units of the section or correlation toother proxies such as [Mo] and Fe speciation. This observation also sup-ports our conclusion that the entire section was deposited under euxinicconditions. Using the seawater-anoxic/euxinic sink fractionation factor ofΔ238/235U(SW–Anox/Eux) ≈ −0.5‰ (Weyer et al., 2008; Brennecka et al.,2011), the authigenic composition recorded corresponds to seawaterwith a δ238U value of −0.18 ± 0.15‰, which is identical within to themodern riverine input value (~−0.2‰, Stirling et al., 2007). This resultcan only be explained if the U removal process did not involve significantfractionation and suggests that either (1) the oceanic U budgetwas dom-inated by co-precipitation into carbonates or U removal during alterationof the oceanic crust (as none of these processes seem to fractionate U iso-topes) or (2) the oceanic U budget involved different reservoirs incorpo-rating preferentially the heavy (e.g. anoxic, suboxic sediments) and thelight isotopes of U (adsorption onto oxides: Mn-nodules, BIFs) in orderfor the δ238USeawater to remain constant. Though we cannot rule out anyof these two hypotheses, the second one would make sense in theframe proposed by Kendall et al. (2013–in this issue) where U is not mo-bilized by oxidative weathering in land but is instead oxidatively mobi-lized in subaerial settings (perhaps in oxygen oasis). Such oases wouldalso be the place where oxidation and precipitation of Fe and Mn oxideswould preferentially occur, possibly allowing removal of dissolved Uthrough adsorption. Given the low amount of available dissolved U,iron andmanganese oxides could then represent a sink of U large enoughto balance the fractionation imparted by U incorporation into anoxic/euxinic/suboxic sediments, and thus keep the δ238USeawater close to thevalue of detrital/riverine input.
6. Conclusions
We have presented a multi-proxy geochemical study of the 2.05 GaShunga Event black shale from the Onega Basin in Karelia. Using a cau-tious examination of the Fe speciation data we showed that the lowerpart of the studied section underwent a post-depositional event inwhich pyrite was altered to pyrrhotite, with concomitant sulfur escapefrom the sediment. However, this post-depositional event did notappear to affect the bulk rock Mo, U and Fe isotope compositions andconsequently made it possible to use the Mo, U and Fe isotope systemsas reliable paleoredox proxies. The authigenic U isotope compositioncorresponds to a seawater δ238U of −0.18 ± 0.15‰ and suggests thatco-precipitation into carbonates was the main process of U removal atthis time.
We conclude that the studied section was deposited under euxinicconditions, where the global contemporaneous oceans had a δ98Mo-SWvalue of 0.85 ± 0.21‰. The relatively uniform Mo and U isotopecompositions across the studied section also point to stable redox con-ditions during deposition. The high Mo and U concentrations in unit C,with respect to units A and B, may represent the following: (1) a shiftin the relative location in the water column of the deposition site from

207D. Asael et al. / Chemical Geology 362 (2013) 193–210
the bottom margins of aneuxinic wedge into its core or a region moreproximal to the shallower shelf; and/or (2) an episode of enhancedoxidative weathering on the continents and therefore greater deliveryof Mo and U to the sediment. This scenario is also in accord with theobserved Fe isotope variations, where in units A and B, precipitation ofpyrite from an already fractionated seawater reservoir resulted in isoto-pically heavy bulk rock Fe isotope composition; and in unit C, pyriteformation undermore sulfidic conditions led to lower δ56Fe values, sim-ilar to those observed in modern anoxic basins such as Black Sea or inPhanerozoic shales (Severmann et al., 2008; Duan et al., 2010a,b).
Our estimation for the contemporaneous δ98MoSW of 0.85 ± 0.21‰is the lowest value yet reported for the Proterozoic (cf., 1.19 ± 0.28‰at 1.84 Ga—(Kendall et al., 2011); 1.03 ± 0.14‰ at 1.36 Ga—(Kendallet al., 2009); 0.99 ± 0.13‰ at 0.75 Ga—(Dahl et al., 2011); 1.06 ±0.11‰ at 0.54 Ga—(Lehmann et al., 2007)). The implication is that atthis time, after the GOE and themassive burial of organic matter associ-ated with the Lomagundi Event, the global oceans were exceptionallyanoxic with relatively widespread euxinia. Recent studies have pro-posed a rise and fall of oxygen levels over the span of the GOE at ca.2.3Ga and the Lomagundi Event between 2.3 and 2.1 Ga (Kump et al.,2011; Bekker and Holland, 2012; Planavsky et al., 2012a). The ShungaEvent is situated in the aftermath of these events and testifies to thepossibility of a severe decrease in oceanic oxygenation at this time.
Acknowledgments
This work was supported by the International Continental DrillingProgram, by NSF (EAR#0820676), EuropoleMer and IFREMER. Wethank Lee Kump, Victor Melezhik, Aivo Lepland and Andrey Bekker foradvice and support in this project and the FAR-DEEP drilling team forsample archiving. We thank Yoan Germain for technical support.
Appendix 1. Uranium reduction under anoxic, euxinic andsuboxic conditions
In anoxic, euxinic and suboxic environments reduction of soluble UVI
to insoluble UIV and concentration in the sediment can be the results ofvarious mechanisms.
First, as a result of abiotic reduction. In this case the uranyl carbonateion is reduced to uraninite in the following total reaction:
4UVIO2ðCO3Þ4−3 þ HS− þ 15Hþ ¼ 4 UIVO2ðcÞ þ SO2−4 þ 12 CO2ðgÞ þ 8H2O
(from Langmuir (1978))or, if the reduction is mediated by iron insteadof sulfur:
UVIO2ðCO3Þ4−3 þ 2 Fe2þ þ 2 H2O ¼ UIVO2ðcÞ þ 2 FeðOHÞ3 þ 3 CO2ðgÞ
(from Langmuir (1978))In porewater, we expect U reduction to be mainly coupled to oxida-
tion of Fe (Reaction 2) as this reaction is thermodynamically favored atpH = 8 and 25 °C (from Langmuir, 1978; Zheng et al., 2002). Similar re-actions can occur through oxidation of pyrite, methane or H2. The firstreaction, under sulfidic conditions, requires production of HS− throughmicrobially mediated reduction of sulfate (Klinkhammer and Palmer,1991; Barnes and Cochran, 1993). There is no evidence that inorganicU reduction occurs at in-situ concentrations of U and H2S, or only ex-tremely slowly (Anderson et al., 1989; Lovley et al., 1991; Barnes andCochran, 1993; Tribovillard et al., 2006).
Second, as a result of microbial reduction. Directmicrobial reductionmechanisms of U are thought to occur, such as during oxidation oforganic matter:
CH2O þ 2 UO2ðCO3Þ4−3 þ H2O þ 2Hþ ¼ 2 UO2ðcÞ þ 6 HCO−3 þ CO2
(Cochran et al., 1986; Barnes and Cochran, 1993)
Third, as a result of adsorption to ferric hydroxide. A last mean of re-moving U from porewater is through adsorption to ferric hydroxide,which is thought to happen in two ways. Either by adsorption of U asthe uranyl ion, UO2
2+:
If pH < 5 : FeOH þ UO2þ2 ¼ ½FeO� UO2�þ þ Hþ
(Langmuir, 1985)
If 5 < pH < 6 : FeOH þ UO2þ2 þ H2O ¼ ½FeO� UO2OH� þ 2Hþ
Langmuir (1985)
If pH < 6 : FeðOHÞ2 þ 3 UO2þ2 þ 5 H2O ¼ ½FeO� ðUO2Þ3ðOHÞ5� þ 6Hþ
(Langmuir, 1985)Or by adsorption of U as the uranyl carbonate species:
FeOH þ UO2þ2 þ 3 CO2−
3 ¼ ½FeOH2 � UO2ðCO3Þ3�3þ
Langmuir (1985)
FeðOHÞ2 þ UO2þ2 þ CO2−
3 ¼ ½FeO2 � UO2CO3�2− þ 2Hþ
Waite et al. (1994).The main removal process of U has been reported to be abiotic re-
duction in the sediment porewater (Cochran, 1992; Morford andEmerson, 1999), but one should keep in mind that all of the abovemechanisms can to some extent remove U from the water column andconcentrate it in the sediment under anoxic, euxinic and/or suboxicconditions.
References
Abe, M., Suzuki, T., Fujii, Y., Hada, M., Hirao, K., 2008. An ab initio molecular orbital studyof the nuclear volume effects in uranium isotope fractionations. J. Chem. Phys. 129,164309.
Alonso-Azcarate, J., Rodas, M., Bottrell, S.H., Raiswell, R., Velasco, F., Mas, J.R., 1999. Path-ways and distances of fluid flow during low-grade metamorphism: evidence frompyrite deposits of the Cameros Basin, Spain. J. Metamorph. Geol. 17, 339–348.
Anbar, A.D., 2004. Molybdenum stable isotopes: observations, interpretations and direc-tions. Rev. Mineral. 55, 429–454.
Anbar, A.D., Rouxel, O., 2007. Metal stable isotopes in paleoceanography. Ann. Rev. EarthPlanet. Sci. 35, 717–746.
Anbar, A.D., Roe, J.E., Barling, J., Nealson, K.H., 2000. Nonbiological fractionation of iron iso-topes. Science (New York, N.Y.) 288, 126–128.
Anbar, A.D., Duan, Y., Lyons, T.W., Arnold, G.L., Kendall, B., Creaser, R.a, Kaufman, A.J.,Gordon, G.W., Scott, C., Garvin, J., Buick, R., 2007. A whiff of oxygen before the greatoxidation event? Science (New York, N.Y.) 317, 1903–1906.
Anderson, R.F., Fleisher, M.Q., LeHuray, A.P., 1989. Concentration, oxidation state, and par-ticulate flux of uranium in the Black Sea. Geochim. Cosmochim. Acta 53, 2215–2224.
Archer, C., Vance, D., 2006. Coupled Fe and S isotope evidence for Archean microbialFe(III) and sulfate reduction. Geology 34, 153.
Archer, C., Vance, D., 2008. The isotopic signature of the global riverine molybdenum fluxand anoxia in the ancient oceans. Nat. Geosci. 1, 597–600.
Arnold, G.L., Anbar, A.D., Barling, J., Lyons, T.W., 2004. Molybdenum isotope evidence forwidespread anoxia in mid-Proterozoic oceans. Science (New York, N.Y.) 304, 87–90.
Arnold, G.L., Lyons, T.W., Gordon, G.W., Anbar, A.D., 2012. Extreme change in sulfideconcentrations in the Black Sea during the Little Ice Age reconstructed using molyb-denum isotopes. Geology 40, 595–598.
Balci, N., Bullen, T.D., Witte-Lien, K., Shanks, W.C., Motelica, M., Mandernack, K.W., 2006.Iron isotope fractionation during microbially stimulated Fe(II) oxidation and Fe(III)precipitation. Geochim. Cosmochim. Acta 70, 622–639.
Barling, J., Anbar, A.D., 2004. Molybdenum isotope fractionation during adsorption bymanganese oxides. Earth Planet. Sci. Lett. 217, 315–329.
Barling, J., Arnold, G.L., Anbar, A.D., 2001. Natural mass-dependent variations in the isoto-pic composition of molybdenum. Earth Planet. Sci. Lett. 193, 447–457.
Barnes, C.E., Cochran, J.K., 1993. Uranium geochemistry in estuarine sediments: controlson removal and release processes. Geochim. Cosmochim. Acta 57, 555–569.
Beard, B.L., 1999. Iron isotope biosignatures. Science 285, 1889–1892.Beard, B.L., Johnson, C.M., Von Damm, K.L., Poulson, R.L., 2003a. Iron isotope constraints
on Fe cycling and mass balance in oxygenated Earth oceans. Geology 31, 629.Beard, B.L., Johnson, C.M., Skulan, J.L., Nealson, K.H., Cox, L., Sun, H., 2003b. Application of
Fe isotopes to tracing the geochemical and biological cycling of Fe. Chem. Geol. 195,87–117.
Bekker, A., Holland, H.D., 2012. Oxygen overshoot and recovery during the earlyPaleoproterozoic. Earth Planet. Sci. Lett. 317–318, 295–304.

208 D. Asael et al. / Chemical Geology 362 (2013) 193–210
Bekker, A., Kaufman, A.J., 2007. Oxidative forcing of global climate change: a biogeochem-ical record across the oldest Paleoproterozoic ice age in North America. Earth Planet.Sci. Lett. 258, 486–499.
Bekker, A., Holland, H.D., Wang, P.-L., Rumble, D., Stein, H.J.J., Hannah, J.L.L., Coetzee, L.L.,Beukes, N.J.J., 2004. Dating the rise of atmospheric oxygen. Nature 427, 117–120.
Bekker, A., Holmden, C., Beukes, N.J., Kenig, F., Eglinton, B., Patterson,W.P., 2008. Fraction-ation between inorganic and organic carbon during the Lomagundi (2.22–2.1 Ga)carbon isotope excursion. Earth Planet. Sci. Lett. 271, 278–291.
Berner, R.A., 1981. A new geochemical classification of sedimentary environments.J. Sediment. Petrol. 51, 359–365.
Bigeleisen, J., 1996. Temperature dependence of the isotope chemistry of the heavy ele-ments. Proc. Natl. Acad. Sci. 93, 9393–9396.
Brantley, S.L., Liermann, L., Bullen, T.D., 2001. Fractionation of Fe isotopes by soil microbesand organic acids. Geology 29, 535.
Brantley, S.L., Liermann, L.J., Guynn, R.L., Anbar, A.D., Icopini, G.A., Barling, J., 2004. Fe iso-topic fractionation during mineral dissolution with and without bacteria. Geochim.Cosmochim. Acta 68, 3189–3204.
Brennecka, G.A., Wasylenki, L.E., Bargar, J.R., Weyer, S., Anbar, A.D., 2011. Uranium isotopefractionation during adsorption to Mn-oxyhydroxides. Environ. Sci. Technol. 45,1370–1375.
Bullen, T.D., White, A.F., Childs, C.W., Vivit, D.V., Schulz, M.S., 2001. Demonstration ofsignificant abiotic iron isotope fractionation in nature. Geology 29, 699.
Butler, I.B., Archer, C., Vance, D., Oldroyd, A., Rickard, D., 2005. Fe isotope fractionation onFeS formation in ambient aqueous solution. Earth Planet. Sci. Lett. 236, 430–442.
Canfield, D.E., 1998. A new model for Proterozoic ocean chemistry. Nature 396, 450–453.Canfield, D.E., 2005. The early history of atmospheric oxygen: homage to Robert M
Garrels. Ann. Rev. Earth Planet. Sci. 33, 1–36.Canfield, D.E., Thamdrup, B., 2009. Towards a consistent classification scheme for geo-
chemical environments, or, why we wish the term “suboxic” would go away.Geobiology 7, 385–392.
Canfield, D.E., Raiswell, R., Westrich, J.T., Reaves, C.M., Berner, R.A., 1986. The use of chro-mium reduction in the analysis of reduced inorganic sulfur in sediments and shales.Chem. Geol. 54, 149–155.
Canfield, D.E., Lyons, T.W., Raiswell, R., 1996. A model for iron deposition to euxinic BlackSea sediments. Am. J. Sci. 296, 818–834.
Chanton, J.P., Martens, C.S., 1985. The effects of heat and stannous chloride addition onthe active distillation of acid volatile sulfide from pyrite-rich marine sedimentsamples. Biogeochemistry 1, 375–382.
Chen, J.H., Lawrence Edwards, R., Wasserburg, G.J., 1986. 238U, 234U and 232Th in sea-water. Earth Planet. Sci. Lett. 80, 241–251.
Cochran, J.K., 1992. The oceanic chemistry of the uranium and thorium series nuclides. In:Ivanovich, M., Harmon, R.S. (Eds.), Uranium Series Disequilibria: Applications toEarth, Marine and Environmental Sciences. Clarendon, Oxford, pp. 334–395.
Cochran, J.K., Carey, A.E., Sholkovitz, E.R., Surprenant, L.D., 1986. The geochemistry of ura-nium and thorium in coastal marine sediments and sediment pore waters. Geochim.Cosmochim. Acta 50, 663–680.
Condie, K., 2001. Precambrian superplumes and supercontinents: a record in black shales,carbon isotopes, and paleoclimates? Precambrian Res. 106, 239–260.
Cornwell, J.C., Morse, J.W., 1987. The characterization of iron sulfide minerals in anoxicmarine sediments. Mar. Chem. 22, 193–206.
Croal, L.R., Johnson, C.M., Beard, B.L., Newman, D.K., 2004. Iron isotope fractionationby Fe(II)-oxidizing photoautotrophic bacteria. Geochim. Cosmochim. Acta 68,1227–1242.
Crosby, H.A., Roden, E.E., Johnson, C.M., Beard, B.L., 2007. The mechanisms of iron isotopefractionation produced during dissimilatory Fe(III) reduction by Shewanellaputrefaciens and Geobacter sulfurreducens. Geobiology 5, 169–189.
Dahl, T.W., Anbar, A.D., Gordon, G.W., Rosing, M.T., Frei, R.E., Canfield, D.E., 2008. Molyb-denum isotope variations in a redox-stratified lake; Removal mechanism and preser-vation in euxinic sediments. Goldschmidt Conference. Geochim. Cosmochim. ActaA194 (Vancouver).
Dahl, T.W., Anbar, A.D., Gordon, G.W., Rosing, M.T., Frei, R., Canfield, D.E., 2010. The behav-ior of molybdenum and its isotopes across the chemocline and in the sediments ofsulfidic Lake Cadagno, Switzerland. Geochim. Cosmochim. Acta 74, 144–163.
Dahl, T.W., Canfield, D.E., Rosing, M.T., Frei, R.E., Gordon, G.W., Knoll, A.H., Anbar, A.D.,2011. Molybdenum evidence for expansive sulfidic water masses in 750 Ma oceans.Earth Planet. Sci. Lett. 311, 264–274.
Djogic, R., Sipos, L., Branica, M., 1986. Characterization of uranium (VI) in seawater.Limnol. Oceanogr. 31, 1122–1131.
Duan, Y., Anbar, A.D., Arnold, G.L., Lyons, T.W., Gordon, G.W., Kendall, B., 2010a. Molybde-num isotope evidence for mild environmental oxygenation before the Great Oxida-tion Event. Geochim. Cosmochim. Acta 74, 6655–6668.
Duan, Y., Severmann, S., Anbar, A.D., Lyons, T.W., Gordon, G.W., Sageman, B.B., 2010b. Iso-topic evidence for Fe cycling and repartitioning in ancient oxygen-deficient settings:examples from black shales of the mid-to-late Devonian Appalachian basin. EarthPlanet. Sci. Lett. 290, 244–253.
Dunk, R., Mills, R., Jenkins, W., 2002. A reevaluation of the oceanic uranium budget for theHolocene. Chem. Geol. 190, 45–67.
Erickson, B.E., Helz, G.R., 2000. Molybdenum(VI) speciation in sulfidic waters. Geochim.Cosmochim. Acta 64, 1149–1158.
Evans, D.A., Beukes, N.J., Kirschvink, J.L., 1997. Low-latitude glaciation in thePalaeoproterozoic era. Nature 386, 262–266.
Farquhar, J., 2000. Atmospheric influence of Earth's earliest sulfur cycle. Science 289,756–758.
Farquhar, J., Johnston, D.T., 2008. The oxygen cycle of the terrestrial planets: insights intothe processing and history of oxygen in surface environments. Rev. Mineral. Geochem.68, 463–492.
Farquhar, J., Peters, M., Johnston, D.T., Strauss, H., Masterson, A., Wiechert, U., Kaufman,A.J., 2007. Isotopic evidence for Mesoarchaean anoxia and changing atmosphericsulphur chemistry. Nature 449, 706–709.
Fehr, M.A., Andersson, P.S., Hålenius, U., Gustafsson, Ö., Mörth, C., 2010. Iron enrichmentsand Fe isotopic compositions of surface sediments from the Gotland Deep, Baltic Sea.Chem. Geol. 277, 310–322.
Ferry, J.M., 1981. Petrology of graphitic sulfide-rich schists from south-central maine—anexample of desulfidation during prograde regional metamorphism. Am. Mineral. 66,908–931.
Fujii, Y., Nomura, M., Onitsuka, H., Takeda, K., 1989. Anomalous isotope fractionation inuranium enrichment process. J. Nucl. Sci. Technol. 26, 1061–1064.
Goldberg, T., Archer, C., Vance, D., Poulton, S.W., 2009. Mo isotope fractionation duringadsorption to Fe (oxyhydr) oxides. Geochim. Cosmochim. Acta 73, 6502–6516.
Gordon, G.W., Lyons, T.W., Arnold, G.L., Roe, J., Sageman, B.B., Anbar, A.D., 2009. When doblack shales tell molybdenum isotope tales? Geology 37, 535–538.
Guilbaud, R., Butler, I.B., Ellam, R.M., 2011. Abiotic pyrite formation produces a large Feisotope fractionation. Science (New York, N.Y.) 332, 1548–1551.
Guilbaud, R., Butler, I.B., Ellam, R.M., 2012. Response to Comment on “Abiotic pyriteformation produces a large Fe isotope fractionation”. Science 335, 538.
Helz, G.R., Bura-Nakić, E., Mikac, N., Ciglenečki, I., 2011. New model for molybdenum be-havior in euxinic waters. Chemical Geology 284, 323–332.
Henderson, G.M., 2003. The U-series toolbox for paleoceanography. Rev. Mineral. Geochem.52, 493–531.
Holland, H.D., 1984. The Chemical Evolution of the Atmosphere and Oceans. PrincetonUniversity Press, Princeton, NJ.
Holland, H.D., 1994. Early Proterozoic atmospheric change. In: Bengtson, S. (Ed.), EarlyLife on Earth: Nobel Symposium, 84. Columbia University Press, New York,pp. 237–244.
Holland, H.D., 2006. The oxygenation of the atmosphere and oceans. Philos. Trans. R. Soc.Lond. Ser. B Biol. Sci. 361, 903–915.
Horng, C., Roberts, A.P., 2006. Authigenic or detrital origin of pyrrhotite in sediments?:resolving a paleomagnetic conundrum. Earth Planet. Sci. Lett. 241, 750–762.
Icopini, G.A., Anbar, A.D., Ruebush, S.S., Tien, M., Brantley, S.L., 2004. Iron isotope fraction-ation duringmicrobial reduction of iron: the importance of adsorption. Geology 32, 205.
Israelson, C., Halliday, A.N., Buchardt, B., 1996. U–Pb dating of calcite concretions fromCambrian black shales and the Phanerozoic time scale. Earth Planet. Sci. Lett. 141,152–159.
Jenkyns, H.C., Matthews, A., Tsikos, H., Erel, Y., 2007. Nitrate reduction, sulfate reduction,and sedimentary iron isotope evolution during the Cenomanian–Turonian oceanicanoxic event. Paleoceanography 22, PA3208.
Johnson, C.M., Beard, B.L., 2005. Biogeochemical Cycling of Iron Isotopes. Science(New York, N.Y.) 309, 1025–1027.
Johnson, C.M., Skulan, J.L., Beard, B.L., Sun, H., Nealson, K.H., Braterman, P.S., 2002. Isotopicfractionation between Fe(III) and Fe(II) in aqueous solutions. Earth Planet. Sci. Lett.195, 141–153.
Kashiwabara, T., Takahashi, Y., Tanimizu, M., Usui, A., 2011. Molecular-scale mechanismsof distribution and isotopic fractionation of molybdenum between seawater and fer-romanganese oxides. Geochim. Cosmochim. Acta 75, 5762–5784.
Kaufman, A.J., Johnston, D.T., Farquhar, J., Masterson, A.L., Lyons, T.W., Bates, S., Anbar,A.D., Arnold, G.L., Garvin, J., Buick, R., 2007. Late Archean biospheric oxygenationand atmospheric evolution. Science (New York, N.Y.) 317, 1900–1903.
Kelly, S.D., Newville, M.G., Cheng, L., Kemner, K.M., Sutton, S.R., Fenter, P., Sturchio, N.C.,Spötl, C., 2003. Uranyl incorporation in natural calcite. Environ. Sci. Technol. 37,1284–1287.
Kelly, S.D., Rasbury, E.T., Chattopadhyay, S., Kropf, A.J., Kemner, K.M., 2006. Evidence of astable uranyl site in ancient organic-rich calcite. Environ. Sci. Technol. 40, 2262–2268.
Kelly, S.D., Kemner, K.M., Brooks, S.C., 2007. X-ray absorption spectroscopy identifiescalcium-uranyl-carbonate complexes at environmental concentrations. Geochim.Cosmochim. Acta 71, 821–834.
Kendall, B., Creaser, R.A., Gordon, G.W., Anbar, A.D., 2009. Re–Os and Mo isotope system-atics of black shales from the Middle Proterozoic Velkerri and Wollogorang Forma-tions, McArthur Basin, northern Australia. Geochim. Cosmochim. Acta 73, 2534–2558.
Kendall, B., Brennecka, G., Weyer, S., Anbar, A.D., 2010. Onset of oxidative uraniummobi-lization on the late Archean earth? Astrobiology Science Conference, p. 5445.
Kendall, B., Gordon, G.W., Poulton, S.W., Anbar, A.D., 2011. Molybdenum isotope constraintson the extent of late Paleoproterozoic ocean euxinia. Earth Planet. Sci. Lett. 307, 450–460.
Kendall, B., Brennecka, G.A., Weyer, S., Anbar, A.D., 2013. Uranium isotope fractionationsuggests oxidative uranium mobilization at 2.50 Ga. Chem. Geol. 362, 105–114(in this issue).
Kirschvink, J.L., Gaidos, E.J., Bertani, L.E., Beukes, N.J., Gutzmer, J., Maepa, L.N., Steinberger,R.E., 2000. Paleoproterozoic snowball Earth: extreme climatic and geochemical globalchange and its biological consequences. Proc. Natl. Acad. Sci. 97, 1400–1405.
Kirschvink, J.L., Raub, T.D., Fischer, W., 2012. Archean “whiffs of oxygen” go Poof!Goldschmidt Conference. Mineralogical Magazine A1943 (Montreal).
Klinkhammer, G., Palmer, M., 1991. Uranium in the oceans: where it goes and why.Geochim. Cosmochim. Acta 55, 1799–1806.
Ku, T., Knauss, K.G., Mathieu, G.G., 1977. Uranium in open ocean: concentration andisotopic composition. Deep-Sea Res. 24, 1005–1017.
Kump, L.R., Junium, C., Arthur, M.A., Brasier, A., Fallick, A., Melezhik, V.A., Lepland, A., Crne,A.E., Luo, G., 2011. Isotopic evidence for massive oxidation of organic matter follow-ing the great oxidation event. Science (New York, N.Y.) 334, 1694–1696.
Langmuir, D., 1978. Uranium solution-mineral equilibria at low temperatures with appli-cations to sedimentary ore deposits. Geochim. Cosmochim. Acta 42, 547–569.
Langmuir, D., 1985. Adsorption of uranyl onto ferric oxyhydroxides: applicationof the surface complexation site-binding model. Geochim. Cosmochim. Acta 49,1931–1941.

209D. Asael et al. / Chemical Geology 362 (2013) 193–210
Larrasoaña, J.C., Roberts, A.P., Musgrave, R.J., Gràcia, E., Piñero, E., Vega, M., Martínez-Ruiz,F., 2007. Diagenetic formation of greigite and pyrrhotite in gas hydrate marine sedi-mentary systems. Earth Planet. Sci. Lett. 261, 350–366.
Lehmann, B., Nägler, T.F., Holland, H.D., Wille, M., Mao, J., Pan, J., Ma, D., Dulski, P., 2007.Highly metalliferous carbonaceous shale and Early Cambrian seawater. Geology 35,403.
Lennie, A.R., 1995. Synthesis and Rietveld crystal structure refinement of mackinawite,tetragonal FeS. Mineral. Mag. 59, 677–683.
Lovley, D.R., Phillips, Elizabeth J.P., Gorby, Y.A., Landa, E.R., 1991. Microbial reduction ofuranium. Nature 350, 413–416.
Lyons, T.W., 1997. Sulfur isotopic trends and pathways of iron sulfide formation in upperHolocene sediments of the anoxic Black Sea. Geochim. Cosmochim. Acta 61,3367–3382.
Lyons, T.W., Severmann, S., 2006. A critical look at iron paleoredox proxies: new insightsfrom modern euxinic marine basins. Geochim. Cosmochim. Acta 70, 5698–5722.
Lyons, T.W., Anbar, A.D., Severmann, S., Scott, C., Gill, B.C., 2009. Tracking euxinia in theancient ocean: a multiproxy perspective and proterozoic case study. Ann. Rev.Earth Planet. Sci. 37, 507–534.
März, C., Poulton, S.W., Beckmann, B., Küster, K., Wagner, T., Kasten, S., 2008. Redoxsensitivity of P cycling during marine black shale formation: dynamics of sulfidicand anoxic, non-sulfidic bottom waters. Geochim. Cosmochim. Acta 72, 3703–3717.
Matthews, A., Morgans-Bell, H.S., Emmanuel, S., Jenkyns, H.C., Erel, Y., Halicz, L., 2004.Controls on iron-isotope fractionation in organic-rich sediments (Kimmeridge Clay,Upper Jurassic, Southern England). Geochim. Cosmochim. Acta 68, 3107–3123.
McManus, J., Nägler, T.F., Siebert, C., Wheat, C.G., Hammond, D.E., 2002. Oceanic molybde-num isotope fractionation: diagenesis and hydrothermal ridge-flank alteration.Geochem. Geophys. Geosyst. 3, 1–9.
Medvedev, P.V., Melezhik, V.A., Filippov, M.M., 2009. Palaeoproterozoic petrified oil field(Shunga Event). Paleontol. J. 43, 972–979.
Melezhik, V.A., Fallick, A.E., Filippov, M.M., Larsen, O., 1999a. Karelian shungite—an indica-tion of 2.0-Ga-old metamorphosed oil-shale and generation of petroleum: geology,lithology and geochemistry. Earth Sci. Rev. 47, 1–40.
Melezhik, V.A., Fallick, A.E., Medvedev, P.V., Makarikhin, V.V., 1999b. Extreme 13Ccarb en-richment in ca. 2.0 Ga magnesite–stromatolite–dolomite–‘red beds’ association in aglobal context: a case for the world-wide signal enhanced by a local environment.Earth Sci. Rev. 48, 71–120.
Melezhik, V.A., Filippov, M.M., Romashkin, A.E., 2004. A giant Palaeoproterozoic deposit ofshungite in NW Russia: genesis and practical applications. Ore Geol. Rev. 24, 135–154.
Melezhik, V.A., Fallick, A.E., Hanski, E.J., Kump, L.R., Lepland, A., Prave, A.R., Strauss, H.,2005. Emergence of the aerobic biosphere during the Archean–Proterozoic transition:challenges of future research. GSA Today 15, 4–11.
Melezhik, V.A., Lepland, A., Romashkin, A.E., Rychanchik, R.V., Mesli, M., Finne, T.E., Conze,R., 2010. The Great Oxidation Event recorded in Paleoproterozoic rocks fromFennoscandia. Sci. Drill. 9, 23–29.
Melezhik, V.A., Prave, A.R., Hanski, E.J., Fallick, A.E., Lepland, A., Kump, L.R., Strauss, H.,2013. Reading the Archive of Earth's Oxygenation. Springer.
Mojzsis, S.J., Coath, C.D., Greenwood, J.P., McKeegan, K.D., Harrison, T.M., 2003. Mass-independent isotope effects in Archean (2. 5 to 3. 8 Ga) sedimentary sulfides deter-mined by ion microprobe analysis. Geochim. Cosmochim. Acta 67, 1635–1658.
Montoya-Pino, C., Weyer, S., Anbar, A.D., Pross, J., Oschmann,W., Van de Schootbrugge, B.,Arz, H.W., 2010. Global enhancement of ocean anoxia during Oceanic Anoxic Event 2:a quantitative approach using U isotopes. Geology 38, 315–318.
Morford, J.L., Emerson, S., 1999. The geochemistry of redox sensitive trace metals insediments. Geochim. Cosmochim. Acta 63, 1735–1750.
Murray, J.W., Codispoti, L.A., Friederich, G.E., 1995. Oxidation-reduction environments—the suboxic zone in the Black-Sea. In: Huang, C.P., OMelia, C.R., Morgan, J. (Eds.),Aquatic Chemistry: Interfacial and Interspecies Processes. AmericanChemical Society,1155 Sixteenth St NW, Washington, DC 20036 USA, pp. 157–176.
Nägler, T.F., Siebert, C., Lüschen, H., Böttcher, M.E., 2005. Sedimentary Mo isotope recordacross the Holocene fresh–brackish water transition of the Black Sea. Chem. Geol.219, 283–295.
Nägler, T.F., Neuberta, N., Bottcherb, M.E., Dellwigb, O., Schnetgerc, B., 2011. Molybdenumisotope fractionation in pelagic euxinia: evidence from the modern Black and BalticSeas. Chem. Geol. 289, 1–11.
Neubert, N., Nägler, T.F., Böttcher, M.E., 2008. Sulfidity controls molybdenum isotope frac-tionation into euxinic sediments: evidence from the modern Black Sea. Geology 36,775.
Neubert, N., Heri, A.R., Voegelin, A.R., Nägler, T.F., Schlunegger, F., Villa, I.M., 2011. Themo-lybdenum isotopic composition in river water: constraints from small catchments.Earth Planet. Sci. Lett. 304, 180–190.
Noordmann, J., Weyer, S., Sharma, M., Georg, R.B., 2009. Variations of the U-238/U-235isotope composition in rivers. Goldschmidt Conference. Geochim. Cosmochim. ActaA651 (Davos).
Noordmann, J., Weyer, S., Sharma, M., Georg, R.B., Rauschand, S., Bach, W., 2012. Fraction-ation of 238U/235U during weathering and hydrothermal alteration. GoldschmidtConference. Mineralogical Magazine A1548 (Montréal).
Oliver, N.H.S., Hoering, T.C., Johnson, T.W., Rumble, D., Shanks, W.C., 1992. Sulfur isotopicdisequilibrium and fluid–rock interaction during metamorphism of sulfidic blackshales from the Waterville–Augusta area, Maine, USA. Geochim. Cosmochim. Acta56, 4257–4265.
Ono, S., Eigenbrode, J.L., Pavlov, A.A., Kharecha, P., Rumble, D., Kasting, J.F., Freeman, K.H.,2003. New insights into Archean sulfur cycle from mass-independent sulfur isotoperecords from the Hamersley Basin, Australia. Earth Planet. Sci. Lett. 213, 15–30.
Ovchinnikova, G.V., Kuznetsov, A.B., Melezhik, V.A., Gorokhov, I.M., Vasil'eva, I.M.,Gorokhovskii, B.M., 2007. Pb–Pb age of Jatulian carbonate rocks: the TulomozeroFormation of southeast Karelia. Stratigr. Geol. Correl. 15, 359–372.
Pavlov, A.A., Kasting, J.F., 2002.Mass-independent fractionation of sulfur isotopes in Archeansediments: strong evidence for an anoxic Archean atmosphere. Astrobiology 2, 27–41.
Pearce, C.R., Cohen, A.S., Coe, A.L., Burton, K.W., 2008. Molybdenum isotope evidence forglobal ocean anoxia coupled with perturbations to the carbon cycle during theEarly Jurassic. Geology 36, 231.
Pearce, C.R., Burton, K.W., Von Strandmann, P.A.E.P., James, R.H., Gíslason, S.R., 2010.Molybdenum isotope behaviour accompanying weathering and riverine transportin a basaltic terrain. Earth Planet. Sci. Lett. 295, 104–114.
Planavsky, N.J., McGoldrick, P., Scott, C.T., Li, C., Reinhard, C.T., Kelly, A.E., Chu, X., Bekker,A., Love, G.D., Lyons, T.W., 2011. Widespread iron-rich conditions in the mid-Proterozoic ocean. Nature 477, 448–451.
Planavsky, N.J., Bekker, A., Hofmann, A., Owens, J.D., Lyons, T.W., 2012a. Sulfur record ofrising and falling marine oxygen and sulfate levels during the Lomagundi event.Proc. Natl. Acad. Sci. U. S. A. 109, 18300–18305.
Planavsky, N.J., Rouxel, O.J., Bekker, A., Hofmann, A., Little, C.T.S., Lyons, T.W., 2012b. Ironisotope composition of some Archean and Proterozoic iron formations. Geochim.Cosmochim. Acta 80, 158–169.
Poulson Brucker, R.L., McManus, J., Severmann, S., Berelson, W.M., 2009. Molybdenumbehavior during early diagenesis: insights from Mo isotopes. Geochem. Geophys.Geosyst. 10, Q06010.
Poulson, R.L., Siebert, C., McManus, J., Berelson, W.M., 2006. Authigenic molybdenum iso-tope signatures in marine sediments. Geology 34, 617.
Poulton, S.W., 2002. The low-temperature geochemical cycle of iron: from continentalfluxes to marine sediment deposition. Am. J. Sci. 302, 774–805.
Poulton, S.W., Canfield, D.E., 2005. Development of a sequential extraction procedure foriron: implications for iron partitioning in continentally derived particulates. Chem.Geol. 214, 209–221.
Poulton, S.W., Canfield, D.E., 2011. Ferruginous conditions: a dominant feature of theocean through Earth's history. Elements 7, 107–112.
Poulton, S.W., Fralick, P.W., Canfield, D.E., 2004. The transition to a sulphidic ocean,1.84 billion years ago. Nature 431, 173–177.
Poulton, S.W., Fralick, P.W., Canfield, D.E., 2010. Spatial variability in oceanic redox struc-ture 1.8 billion years ago. Nat. Geosci. 3, 486–490.
Puchtel, I.S., Arndt, N.T., Hofmann, A.W., Haase, K.M., Kröner, A., Kulikov, V.S., Kulikova,V.V., Garbe-Schönberg, C.-D., Nemchin, A.A., 1998. Petrology of mafic lavas withinthe Onega plateau, central Karelia: evidence for 2.0 Ga plume-related continentalcrustal growth in the Baltic Shield. Contrib. Mineral. Petrol. 130, 134–153.
Puchtel, I., Brügmann, G., Hofmann, A., 1999. Precise Re–Osmineral isochron and Pb–Nd–Osisotope systematics of a mafic–ultramafic sill in the 2.0 Ga Onega plateau (BalticShield). Earth Planet. Sci. Lett. 170, 447–461.
Pukhtel, I.S., Zhuravlev, D.Z., Ashikhmina, N.A., Kulikov, V.S., Kulikova, V.V., 1992. Sm–Ndage of the suisarian suite on the baltic shield. Dokl. Akad. Nauk 326, 706–711.
Qafoku, N.P., Icenhower, J.P., 2008. Interactions of aqueous U(VI) with soil minerals inslightly alkaline natural systems. Rev. Environ. Sci. Biotechnol. 7, 355–380.
Raiswell, R., Canfield, D.E., 1998. Sources of iron for pyrite formation inmarine sediments.Am. J. Sci. 298, 219–245.
Raiswell, R., Canfield, D.E., 2012. The iron biogeochemical cycle past and present. Geochem.Perspect. 1.
Raiswell, R., Canfield, D.E., Berner, R.A., 1994. A comparison of iron extraction methods forthe determination of degree of pyritisation and the recognition of iron-limited pyriteformation. Chem. Geol. 111, 101–110.
Raiswell, R., Newton, R., Bottrell, S.H., Coburn, P.M., Briggs, D.E.G., Bond, D.P.G., Poulton,S.W., 2008. Turbidite depositional influences on the diagenesis of Beecher'sTrilobite Bed and the Hunsruck Slate; sites of soft tissue pyritization. Am. J. Sci. 308,105–129.
Rasmussen, B., Fletcher, I.R., Bekker, A., Muhling, J.R., Gregory, C.J., Thorne, A.M., 2012. De-position of 1.88-billion-year-old iron formations as a consequence of rapid crustalgrowth. Nature 484, 498–501.
Reinhard, C.T., Raiswell, R., Scott, C., Anbar, A.D., Lyons, T.W., 2009. A late Archean sulfidicsea stimulated by early oxidative weathering of the continents. Science (New York,N.Y.) 326, 713–716.
Reinhard, C.T., Planavsky, N.J., Robbins, L.J., Partin, C.A., Gill, B.C., Lalonde, S.V., Bekker, A.,Konhauser, K.O., Lyons, T.W., 2013a. Proterozoic ocean redox and biogeochemical sta-sis. Proc. Natl. Acad. Sci. U. S. A. 110, 5357–5362.
Reinhard, C.T., Lyons, T.W., Rouxel, O., Asael, D., Dauphas, N., Kump, L.R., 2013b. Iron spe-ciation and isotope perspectives on Paleoproterozoic water column chemistry. In:Melezhik, V.A., Fallick, A.E., Kump, L., Lepland, A., Prave, A.R., Strauss, H. (Eds.), Read-ing the archive of Earth's oxygenation: Initial report of the Fennoscandian ArcticRussia—Drilling Early Earth Project (FAR-DEEP). Singer.
Reuschel, M., Melezhik, V.A., Whitehouse, M.J., Lepland, A., Fallick, A.E., Strauss, H., 2012.Isotopic evidence for a sizeable seawater sulfate reservoir at 2.1 Ga. PrecambrianRes. 192–195, 78–88.
Rice, C.A., Tuttle, M.L., Reynolds, R.L., 1993. The analysis of forms of sulfur in ancientsediments and sedimentary rocks: comments and cautions. Chem. Geol. 107, 83–95.
Rickard, D., Luther, G.W., 2007. Chemistry of iron sulfides. Chem. Rev. 107, 514–562.Roberts, A.P., Turner, G.M., 1993. Diagenetic formation of ferrimagnetic iron sulphide
minerals in rapidly deposited marine sediments, South Island, New Zealand. EarthPlanet. Sci. Lett. 115, 257–273.
Robinson, L.F., Henderson, G.M., Hall, L., Matthews, I., 2004. Climatic control of riverineand seawater uranium-isotope ratios. Science 305, 851–854.
Rouxel, O.J., 2006. Response to Comment on “Iron isotope constraints on the Archean andPaleoproterozoic ocean redox state”. Science 311, 177b.
Rouxel, O., Dobbek, N., Ludden, J., Fouquet, Y., 2003. Iron isotope fractionation duringoceanic crust alteration. Chem. Geol. 202, 155–182.
Rouxel, O.J., Bekker, A., Edwards, K.J., 2005. Iron isotope constraints on the Archean andPaleoproterozoic ocean redox state. Science (New York, N.Y.) 307, 1088–1091.
210 D. Asael et al. / Chemical Geology 362 (2013) 193–210
Rouxel, O.J., Sholkovitz, E.R., Charette, M.A., Edwards, K.J., 2008a. Iron isotope fractionationin subterranean estuaries. Geochim. Cosmochim. Acta 72, 3413–3430.
Roy, M., Rouxel, O., Martin, J.B., Cable, J.E., 2012. Iron isotope fractionation in a sulfide-bearing subterranean estuary and its potential influence on oceanic Fe isotope flux.Chem. Geol. 300–301, 133–142.
Schauble, E.A., 2007. Role of nuclear volume in driving equilibrium stable isotope fraction-ation of mercury, thallium, and other very heavy elements. Geochim. Cosmochim.Acta 71, 2170–2189.
Schoonen,M.A.A., Barnes, H.L., 1991a. Reactions forming pyrite andmarcasite from solution:II. Via FeS precursors below 100 °C. Geochim. Cosmochim. Acta 55, 1505–1514.
Schoonen, M.A.A., Barnes, H.L., 1991b. Reactions forming pyrite and marcasite from solu-tion: I. Nucleation of FeS2 below 100 °C. Geochim. Cosmochim. Acta 55, 1495–1504.
Scott, C., Lyons, T.W., 2012. Contrasting molybdenum cycling and isotopic properties ineuxinic versus non-euxinic sediments and sedimentary rocks: refining the paleoproxies.Chem. Geol. 324–325, 19–27.
Severmann, S., Lyons, T.W., Anbar, A.D., McManus, J., Gordon, G., 2008. Modern iron iso-tope perspective on the benthic iron shuttle and the redox evolution of ancientoceans. Geology 36, 487.
Siebert, C., Nägler, T.F., Kramers, J.D., 2001. Determination of molybdenum isotope frac-tionation by double-spike multicollector inductively coupled plasma mass spectrom-etry. Geochem. Geophys. Geosyst. 2 (paper number 2000GC000124).
Siebert, C., Nägler, T.F., Von Blanckenburg, F., Kramers, J.D., 2003. Molybdenum isotope re-cords as a potential new proxy for paleoceanography. Earth Planet. Sci. Lett. 211,159–171.
Siebert, C., Kramers, J.D., Meisel, T., Morel, P., Nägler, T.F., 2005. PGE, Re–Os, and Mo iso-tope systematics in Archean and early Proterozoic sedimentary systems as proxiesfor redox conditions of the early Earth. Geochim. Cosmochim. Acta 69, 1787–1801.
Siebert, C., McManus, J., Bice, A., Poulson, R.L., Berelson, W.M., 2006. Molybdenum isotopesignatures in continental margin marine sediments. Earth Planet. Sci. Lett. 241,723–733.
Skulan, J.L., Beard, B.L., Johnson, C.M., 2002. Kinetic and equilibrium Fe isotope fractionationbetween aqueous Fe(III) and hematite. Geochim. Cosmochim. Acta 66, 2995–3015.
Slack, J.F., Grenne, T., Bekker, A., Rouxel, O.J., Lindberg, P.A., 2007. Suboxic deep seawater inthe late Paleoproterozoic: evidence from hematitic chert and iron formation related toseafloor-hydrothermal sulfide deposits, central Arizona, USA. Earth Planet. Sci. Lett.255, 243–256.
Stirling, C.H., Andersen, M.B., Potter, E., Halliday, A.N., 2007. Low-temperature isotopicfractionation of uranium. Earth Planet. Sci. Lett. 264, 208–225.
Sturchio, N.C., 1998. Tetravalent uranium in calcite. Science 281, 971–973.Sverjensky, D.A., Lee, N., 2010. The Great Oxidation Event and mineral diversification.
Elements 6, 31–36.
Taylor, S.R., McLennan, S.M., 1995. The geochemical evolution of the continental crust.Rev. Geophys. 33, 241–265.
Telus, M., Dauphas, N., Moynier, F., Tissot, F.L.H., Teng, F., Nabelek, P.I., Craddock, P.R.,Groat, L.A., 2012. Iron, zinc, magnesium and uranium isotopic fractionation duringcontinental crust differentiation: the tale from migmatites, granitoids, and pegma-tites. Geochim. Cosmochim. Acta 97, 247–265.
Tissot, F., Dauphas, N., 2011. Development of high precision 238U/235U ratio measure-ments for cosmochemical applications. 42nd Lunar and Planetary Science Conference.The Woodlands, Texas, p. 1082.
Tissot, F.L.H., Dauphas, N., 2012. 238U/235U ratios of anagrams: angrites and granites.43rd Lunar and Planetary Science Conference, p. 1981.
Tossell, J.A., 2005. Calculating the partitioning of the isotopes of Mo between oxidic andsulfidic species in aqueous solution. Geochim. Cosmochim. Acta 69, 2981–2993.
Tribovillard, N., Algeo, T.J., Lyons, T., Riboulleau, A., 2006. Trace metals as paleoredox andpaleoproductivity proxies: an update. Chem. Geol. 232, 12–32.
Waite, T.D., Davis, J.A., Payne, T.E., Waychunas, G.A., Xu, N., 1994. Uranium(VI) adsorptionto ferrihydrite: application of a surface complexation model. Geochim. Cosmochim.Acta 58, 5465–5478.
Wasylenki, L.E., Rolfe, B.A., Weeks, C.L., Spiro, T.G., Anbar, A.D., 2008. Experimental inves-tigation of the effects of temperature and ionic strength on Mo isotope fractionationduring adsorption to manganese oxides. Geochim. Cosmochim. Acta 72, 5997–6005.
Welch, S. a, Beard, B.L., Johnson, C.M., Braterman, P.S., 2003. Kinetic and equilibrium Feisotope fractionation between aqueous Fe(II) and Fe(III). Geochim. Cosmochim.Acta 67, 4231–4250.
Wen, H., Carignan, J., Zhang, Y., Fan, H., Cloquet, C., Liu, S., 2011. Molybdenum isotopicrecords across the Precambrian–Cambrian boundary. Geology 39, 775–778.
Weyer, S., Anbar, A.D., Gerdes, A., Gordon, G.W., Algeo, T.J., Boyle, E.A., 2008. Natural frac-tionation of 238U/235U. Geochim. Cosmochim. Acta 72, 345–359.
Wijsman, J.W., Middelburg, J., Heip, C.H., 2001. Reactive iron in Black Sea Sediments:implications for iron cycling. Mar. Geol. 172, 167–180.
Wille, M., Kramers, J.D., Nägler, T.F., Beukes, N.J., Schröder, S., Meisel, T., Lacassie, J.P.,Voegelin, A.R., 2007. Evidence for a gradual rise of oxygen between 2.6 and 2.5 Gafrom Mo isotopes and Re-PGE signatures in shales. Geochim. Cosmochim. Acta 71,2417–2435.
Yamaguchi, K.E., Johnson, C.M., Beard, B.L., Ohmoto, H., 2005. Biogeochemical cycling ofiron in the Archean–Paleoproterozoic Earth: constraints from iron isotope variationsin sedimentary rocks from the Kaapvaal and Pilbara Cratons. Chem. Geol. 218,135–169.
Zheng, Y., Anderson, R.F., Van Geen, A., Fleisher, M.Q., 2002. Remobilization of authigenicuranium in marine sediments by bioturbation. Geochim. Cosmochim. Acta 66,1759–1772.