credit suiss financial review
TRANSCRIPT
Financial Review
2Q07
in / end of % change in / end of % change
2Q07 1Q07 2Q06 QoQ YoY 6M07 6M06 YoY
Net income (CHF million)
Income from continuing operations 3,189 2,729 1,872 17 70 5,918 4,214 40
Net income 3,189 2,729 2,158 17 48 5,918 4,762 24
Earnings per share (CHF)
Basic earnings per share from continuing operations 3.00 2.56 1.68 17 79 5.56 3.76 48
Basic earnings per share 3.00 2.56 1.94 17 55 5.56 4.25 31
Diluted earnings per share from continuing operations 2.82 2.42 1.61 17 75 5.24 3.60 46
Diluted earnings per share 2.82 2.42 1.86 17 52 5.24 4.07 29
Return on equity (%)
Return on equity 29.7 25.2 21.6 – – 27.4 23.1 –
Core Results (CHF million)
Net revenues 11,703 10,669 8,047 10 45 22,372 17,688 26
Provision for credit losses (20) 53 10 – – 33 (51) –
Total operating expenses 7,637 7,040 5,587 8 37 14,677 12,216 20
Income from continuing operations before taxes 4,086 3,576 2,450 14 67 7,662 5,523 39
Core Results statement of income metrics (%)
Cost/income ratio 65.3 66.0 69.4 – – 65.6 69.1 –
Pre-tax income margin 34.9 33.5 30.4 – – 34.2 31.2 –
Tax rate 21.1 23.0 20.5 – – 22.0 22.0 –
Net income margin from continuing operations 27.2 25.6 23.3 – – 26.5 23.8 –
Net income margin 27.2 25.6 26.8 – – 26.5 26.9 –
Assets under management and net new assets (CHF billion)
Assets under management 1,629.0 1,551.5 1,357.7 5.0 20.0 1,629.0 1,357.7 20.0
Net new assets 27.6 43.0 30.2 (35.8) (8.6) 70.6 57.4 23.0
Balance sheet statistics (CHF million)
Total assets 1,415,174 1,359,687 1,404,562 4 1 1,415,174 1,404,562 1
Net loans 224,222 212,831 198,294 5 13 224,222 198,294 13
Total shareholders’ equity 43,849 44,004 38,882 0 13 43,849 38,882 13
Book value per share (CHF)
Total book value per share 41.90 41.97 35.75 0 17 41.90 35.75 17
Tangible book value per share 30.82 30.97 25.18 0 22 30.82 25.18 22
Shares outstanding (million)
Common shares issued 1,215.9 1,215.5 1,247.9 0 (3) 1,215.9 1,247.9 (3)
Treasury shares (169.4) (167.0) (160.3) 1 6 (169.4) (160.3) 6
Shares outstanding 1,046.5 1,048.5 1,087.6 0 (4) 1,046.5 1,087.6 (4)
Market capitalization
Market capitalization (CHF million) 100,221 101,297 81,841 (1) 22 100,221 81,841 22
Market capitalization (USD million) 81,416 83,442 66,992 (2) 22 81,416 66,992 22
BIS statistics
Risk-weighted assets (CHF million) 296,416 271,293 244,931 9 21 296,416 244,931 21
Tier 1 ratio (%) 13.0 13.2 10.6 – – 13.0 10.6 –
Total capital ratio (%) 16.3 17.3 13.4 – – 16.3 13.4 –
Number of employees (full-time equivalents)
Number of employees 45,600 45,300 44,100 1 3 45,600 44,100 3
Financial Highlights

Dear shareholders, clients and colleagues
Credit Suisse achieved record operating results in the secondquarter of 2007, building on the strong earnings momentumwe have established over several quarters. Revenues rosefrom both the previous quarter and a year earlier, benefitingfrom our client-focused business model. Our focus on effi-ciency led to improved operating leverage, even as we con-tinue to invest in the growth of our business.
While we are very pleased with our performance in thesecond quarter and first half of the year, given the strengths ofour franchise and the advantage of our integrated businessmodel, we are convinced that we can deliver much more.
Overview of the second quarter and first half
We achieved net income of CHF 3.2 billion in the secondquarter of 2007 and CHF 5.9 billion for the first half of theyear. Diluted earnings per share in the quarter were CHF2.82, up from CHF 1.86 in the same period a year earlier. Thereturn on equity was 29.7%, compared to 21.6% in the sec-ond quarter of 2006.
Investment Banking delivered its best quarterly perform-ance to date, with equity and fixed income trading revenuesachieving record levels. Fixed income results were particularlynotable, as they came in the face of more challenging mar-kets, particularly towards the end of the period. Private Bank-ing continued to generate strong profitability. Our Wealth Man-agement business achieved record income from continuingoperations before taxes of CHF 1.0 billion in the quarter, andwe are expanding our international presence to realize theopportunities we see globally. In Asset Management, we ben-efited from last year’s realignment, which established theframework for profitable growth. Just as important, theamount and significance of business we are executing as anintegrated bank is rising steadily.
Priorities to advance our strategy
Credit Suisse is very well positioned. Our mix of high-growthbusinesses is balanced and distinctive. Our global reach isexceptional, extending across developed and developingregions. To take Credit Suisse to the next level of perform-ance, we are sharpening our focus on five areas:
Client-driven innovation
The sophisticated clients we serve are at the center of globaleconomic expansion and wealth creation. Our client-centeredapproach offers excellent growth opportunities that are bestrealized as an integrated bank. Last year, we launched a suc-cessful program in Switzerland that used a structured, cross-divisional approach to assess and address unmet needs of
Brady W. Dougan Walter B. KielholzChief Executive Officer Chairman
major private and corporate clients. Working on an integratedbasis enabled us to understand and better meet client needs.We are rolling out similar programs across the bank. What dis-tinguishes us is the depth of the integrated banking model.We are creating innovative, holistic solutions that we believeare exceptional in our industry.
Collaboration
We are also focusing on new approaches to identify and tapnew business opportunities on a collaborative basis. In certaintarget regional markets, we have created teams, comprised ofseasoned professionals from each business, that are responsi-ble for covering clients in the integrated bank. We have estab-lished other cross-divisional teams aimed at developing busi-ness plans to serve client segments that cannot be servedeffectively by any one business. This is another way of chan-neling our innovation and creating profitable growth.
Capital
Managing our capital to deliver the best possible return toshareholders remains a fundamental priority. We will continueto hold ourselves to a greater than 20% return on equity.Given asset prices, we believe the best opportunity to createvalue is through organic growth in key regions and high poten-tial businesses, especially where we can leverage existingcapabilities on an integrated basis. Capital that cannot be putto work to benefit shareholders, we will return. We havealready executed CHF 2.5 billion of the CHF 8 billion sharebuyback program launched in May. We plan to repurchase afurther CHF 2.5 billion by the end of 2007 and expect to com-plete the program during 2008, well ahead of our 2010 target.
Efficiency
Higher productivity is essential to our ability to maintain strongprofitability during more challenging market conditions as wellas to support the funding of investments to realize new oppor-tunities. We have made good progress towards achieving top-quartile levels of efficiency, relative to peers, in each area ofour business. We are confident that we can achieve substan-tial gains by continuing to improve systems and processes andstreamline our operating capabilities.
Human capital
We have built an outstanding global team – underscored bythe excellent results we have delivered over several quarters,and the potential we are now focused on will take CreditSuisse to the next level of performance. We are taking aglobal approach to investing in and managing talent. Our abil-ity to train employees and to attract top performers with newand complementary expertise has never been stronger, and we
are selectively adding to our team to build out new businessesand regional capabilities.
We are particularly pleased with our performance given thefact that we had more challenging conditions in some markets,which we expect to continue. However, we are very optimisticabout the long-term growth prospects for Credit Suisse. Glob-alization should continue to lead to long-term economic growthin the developed and emerging economies. Wealth creationand global capital flows should remain historically high anddrive increasing demand for our integrated banking services.We believe that our client-focused, integrated business modeland disciplined risk-taking will help us to deliver superior valueto shareholders through market cycles.
Yours sincerely
Walter B. Kielholz Brady W. DouganAugust 2007

Financial Review
2Q 075 Operating Environment
6 Operating Environment
9 Credit Suisse Results
10 Credit Suisse13 Core Results18 Key Performance Indicators
19 Core Results
20 Investment Banking26 Private Banking28 Wealth Management33 Corporate & Retail Banking36 Asset Management
41 Overview of Results and Assets under Management
42 Results44 Assets under Management
47 Balance Sheet, Capital and Risk
48 Balance Sheet49 Capital Management53 Risk Management
59 Highlights from the Condensed ConsolidatedFinancial Statements – unaudited
67 Investor Information
To be read in conjunction with the Credit Suisse Financial Statements2Q07.
For purposes of this report, unlessthe context otherwise requires, theterms “Credit Suisse”, “the Group”,“we”, “us” and “our” mean CreditSuisse Group and its consolidatedsubsidiaries and the term “the Bank”means Credit Suisse, the Swissbank subsidiary of the Group, and itsconsolidated subsidiaries.
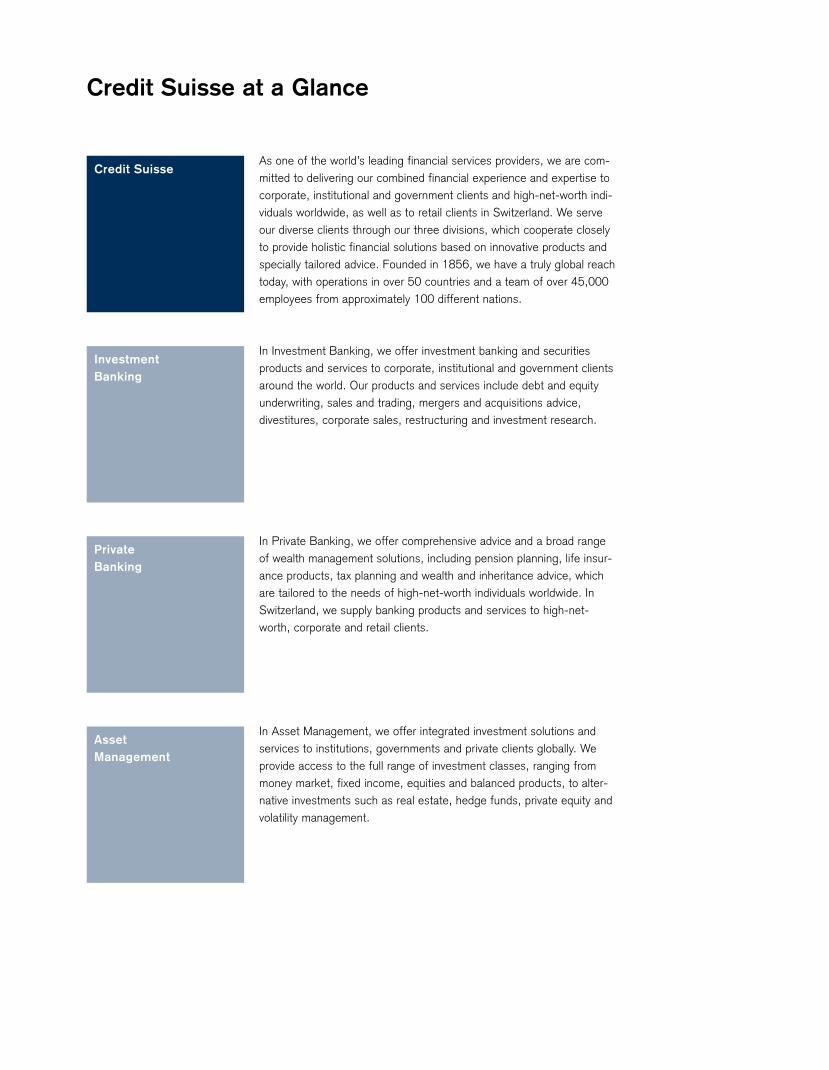
Credit Suisse
Investment Banking
Private Banking
Asset Management
As one of the world’s leading financial services providers, we are com-mitted to delivering our combined financial experience and expertise tocorporate, institutional and government clients and high-net-worth indi-viduals worldwide, as well as to retail clients in Switzerland. We serveour diverse clients through our three divisions, which cooperate closelyto provide holistic financial solutions based on innovative products andspecially tailored advice. Founded in 1856, we have a truly global reachtoday, with operations in over 50 countries and a team of over 45,000employees from approximately 100 different nations.
In Investment Banking, we offer investment banking and securitiesproducts and services to corporate, institutional and government clientsaround the world. Our products and services include debt and equityunderwriting, sales and trading, mergers and acquisitions advice,divestitures, corporate sales, restructuring and investment research.
In Private Banking, we offer comprehensive advice and a broad rangeof wealth management solutions, including pension planning, life insur-ance products, tax planning and wealth and inheritance advice, whichare tailored to the needs of high-net-worth individuals worldwide. InSwitzerland, we supply banking products and services to high-net-worth, corporate and retail clients.
In Asset Management, we offer integrated investment solutions andservices to institutions, governments and private clients globally. Weprovide access to the full range of investment classes, ranging frommoney market, fixed income, equities and balanced products, to alter-native investments such as real estate, hedge funds, private equity andvolatility management.
Credit Suisse at a Glance
Financial Review
2Q 076 Operating Environment
The results of our integrated banking organization depend to alarge extent on the general macro economic environment anddevelopments in the financial markets. In order to put ourresults into context, we provide a review of the operatingenvironment we encountered throughout the reporting period.
6
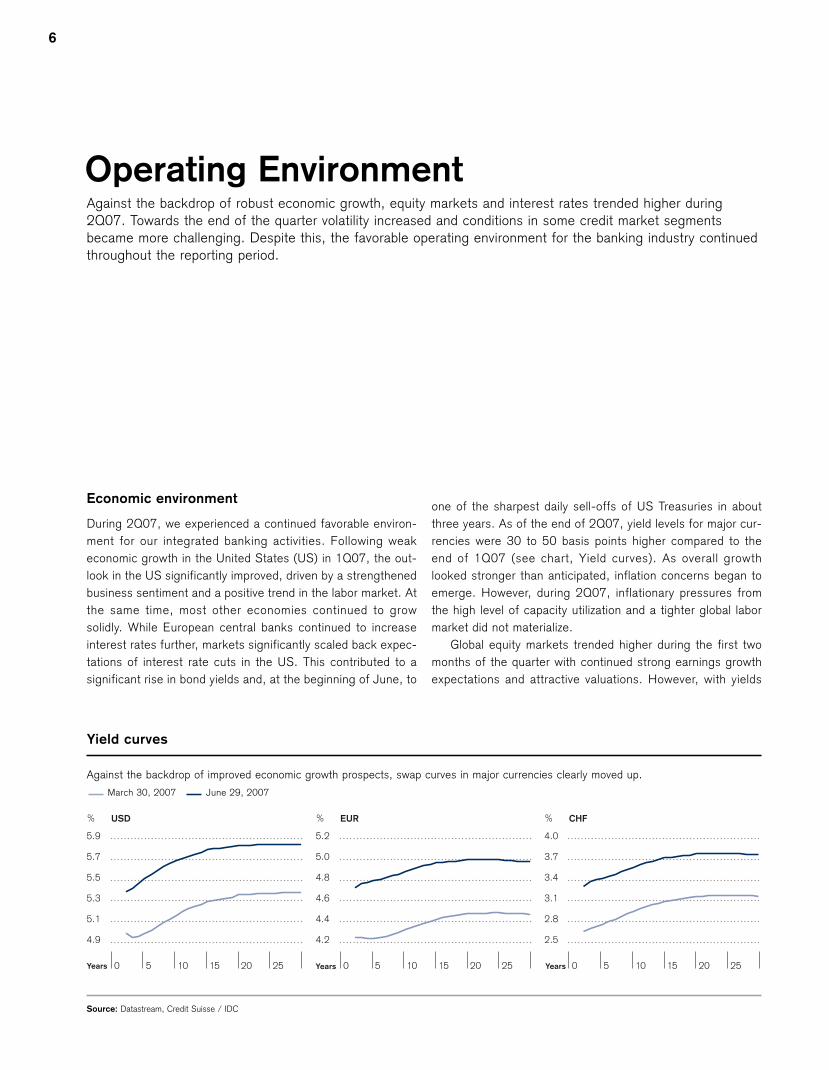
Operating EnvironmentAgainst the backdrop of robust economic growth, equity markets and interest rates trended higher during2Q07. Towards the end of the quarter volatility increased and conditions in some credit market segmentsbecame more challenging. Despite this, the favorable operating environment for the banking industry continuedthroughout the reporting period.
Economic environment
During 2Q07, we experienced a continued favorable environ-ment for our integrated banking activities. Following weakeconomic growth in the United States (US) in 1Q07, the out-look in the US significantly improved, driven by a strengthenedbusiness sentiment and a positive trend in the labor market. Atthe same time, most other economies continued to growsolidly. While European central banks continued to increaseinterest rates further, markets significantly scaled back expec-tations of interest rate cuts in the US. This contributed to asignificant rise in bond yields and, at the beginning of June, to
one of the sharpest daily sell-offs of US Treasuries in aboutthree years. As of the end of 2Q07, yield levels for major cur-rencies were 30 to 50 basis points higher compared to theend of 1Q07 (see chart, Yield curves). As overall growthlooked stronger than anticipated, inflation concerns began toemerge. However, during 2Q07, inflationary pressures fromthe high level of capacity utilization and a tighter global labormarket did not materialize.
Global equity markets trended higher during the first twomonths of the quarter with continued strong earnings growthexpectations and attractive valuations. However, with yields
5.9
5.7
5.5
5.3
5.1
4.9
% USD
0 5 10 15 20 25Years
5.2
5.0
4.8
4.6
4.4
4.2
% EUR
0 5 10 15 20 25Years
4.0
3.7
3.4
3.1
2.8
2.5
% CHF
0 5 10 15 20 25Years
Yield curves
Against the backdrop of improved economic growth prospects, swap curves in major currencies clearly moved up.
March 30, 2007 June 29, 2007
Source: Datastream, Credit Suisse / IDC

Operating Environment 7
moving up in June, equity markets experienced a slight correc-tion and volatility increased, with the latter remaining at com-paratively low levels. Despite the correction, most equity mar-kets ended the quarter with gains. As of the end of 2Q07,equity valuations looked relatively attractive, with above-aver-age equity risk premiums (see chart, Equity markets). Othersources of market volatility in 2Q07 were the measures takenby the Chinese authorities to regulate their domestic equitymarket and the continued challenging conditions in the USmarket for subprime mortgages and the effect on collateralizeddebt obligations (CDOs). Towards the end of 2Q07, somemarket participants in the US experienced liquidity problems,and, as further discussed below under Sector environment,there was greater uncertainty about the valuation of subprimeexposure in CDOs and the implied risks for the holders of suchinstruments.
With the improved economic outlook in the US and the re-pricing in money and bond markets, the US dollar recoveredsomewhat from its lows in early May. However, with the Eurobenefiting from the interest rate increases of the EuropeanCentral Bank, the US dollar remained relatively weak againstthe Euro. With the continued wide interest rate differentialsand the implied currency volatility at low levels, carry tradescontinued with the Japanese yen and Swiss franc as the mainborrowing currencies.
Sector environment
For the banking industry, 2Q07 provided an overall healthyoperating environment to seize business opportunities and to
capitalize further on the promising trends of globalization.Equity trading volumes increased and global initial public offer-ing (IPO) volume reached a record level for the first six monthsof 2007, up by 23% with 18 of the 23 multi-billion US dollardeals from this year coming to the market during 2Q07. Thehigh pace in mergers and acquisitions (M&A) carried on andwas fuelled by increased financial sponsor activity, overallattractive financing conditions and continued earnings growth.Worldwide M&A activity increased 62% for the first six
7.0
5.5
4.0
2.5
1.0
-0.5
%
Year 90 92 94 96 98 00 02 04 06
Global equity risk premium*
+/- 1 standard deviationAverage
125
119
113
107
101
95
2007
North AmericaEurope
EM Latin AmericaEM Asia
April May June
Index
20
18
16
14
12
10
CBOE VIX – S&P Volatility Index
2007 April May June
Index
Equity markets
Equities performed well with higher volatility in June. The yield on equities remained attractive to fair, relative to bond yields; however, the
gap is narrowing following higher bond yields and rising price/earnings ratios.
Source: MSCI Source: Datastream, Credit Suisse / IDC Source: IBES, Datastream, Credit Suisse / IDC*Earnings yield minus real G7 10-year bond yield
ValuationPerformance Volatility
7
6
5
4
3
2
2002 2003 2004 2005 2006 2007 1HYears
Multiple
Leveraged buyouts (Europe)
In the context of low interest rates during recent years, the
debt/EBITDA ratio of leveraged buyouts in Europe increased.
Source: Standard & Poor’s LCD
8
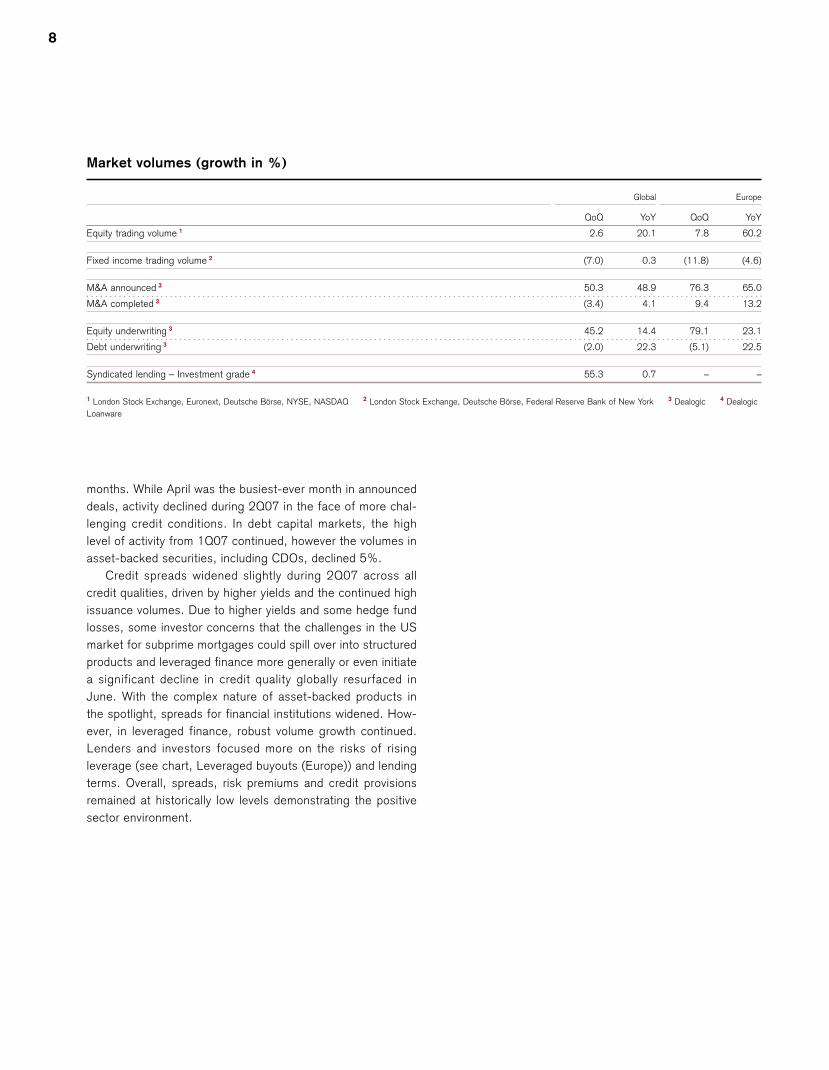
months. While April was the busiest-ever month in announceddeals, activity declined during 2Q07 in the face of more chal-lenging credit conditions. In debt capital markets, the highlevel of activity from 1Q07 continued, however the volumes inasset-backed securities, including CDOs, declined 5%.
Credit spreads widened slightly during 2Q07 across allcredit qualities, driven by higher yields and the continued highissuance volumes. Due to higher yields and some hedge fundlosses, some investor concerns that the challenges in the USmarket for subprime mortgages could spill over into structuredproducts and leveraged finance more generally or even initiatea significant decline in credit quality globally resurfaced inJune. With the complex nature of asset-backed products inthe spotlight, spreads for financial institutions widened. How-ever, in leveraged finance, robust volume growth continued.Lenders and investors focused more on the risks of risingleverage (see chart, Leveraged buyouts (Europe)) and lendingterms. Overall, spreads, risk premiums and credit provisionsremained at historically low levels demonstrating the positivesector environment.
Market volumes (growth in %)
Global Europe
QoQ YoY QoQ YoY
Equity trading volume 1 2.6 20.1 7.8 60.2
Fixed income trading volume 2 (7.0) 0.3 (11.8) (4.6)
M&A announced 3 50.3 48.9 76.3 65.0
M&A completed 3 (3.4) 4.1 9.4 13.2
Equity underwriting 3 45.2 14.4 79.1 23.1
Debt underwriting 3 (2.0) 22.3 (5.1) 22.5
Syndicated lending – Investment grade 4 55.3 0.7 – –
1 London Stock Exchange, Euronext, Deutsche Börse, NYSE, NASDAQ 2 London Stock Exchange, Deutsche Börse, Federal Reserve Bank of New York 3 Dealogic 4 DealogicLoanware
Financial Review
2Q 07Credit Suisse Results
10 Credit SuisseOur consolidated statements of income include minorityinterests without significant economic interest, which do notimpact net income, but significantly increase reported netrevenues and income from continuing operations before taxes.Hence, we separate these minority interests from ourconsolidated performance and report the remainder as CoreResults.
13 Core ResultsCore Results include the performance of our three operatingsegments Investment Banking, Private Banking and AssetManagement as well as Corporate Center, includingeliminations and consolidation adjustments. Core Resultsrepresent the performance of our integrated bankingorganization.
18 Key Performance IndicatorsOur Credit Suisse Key Performance Indicators measure ourprogress as an integrated banking organization. We focus ongrowth, efficiency, shareholder return and capital strength tomanage our business for long-term sustainable value creation.
10
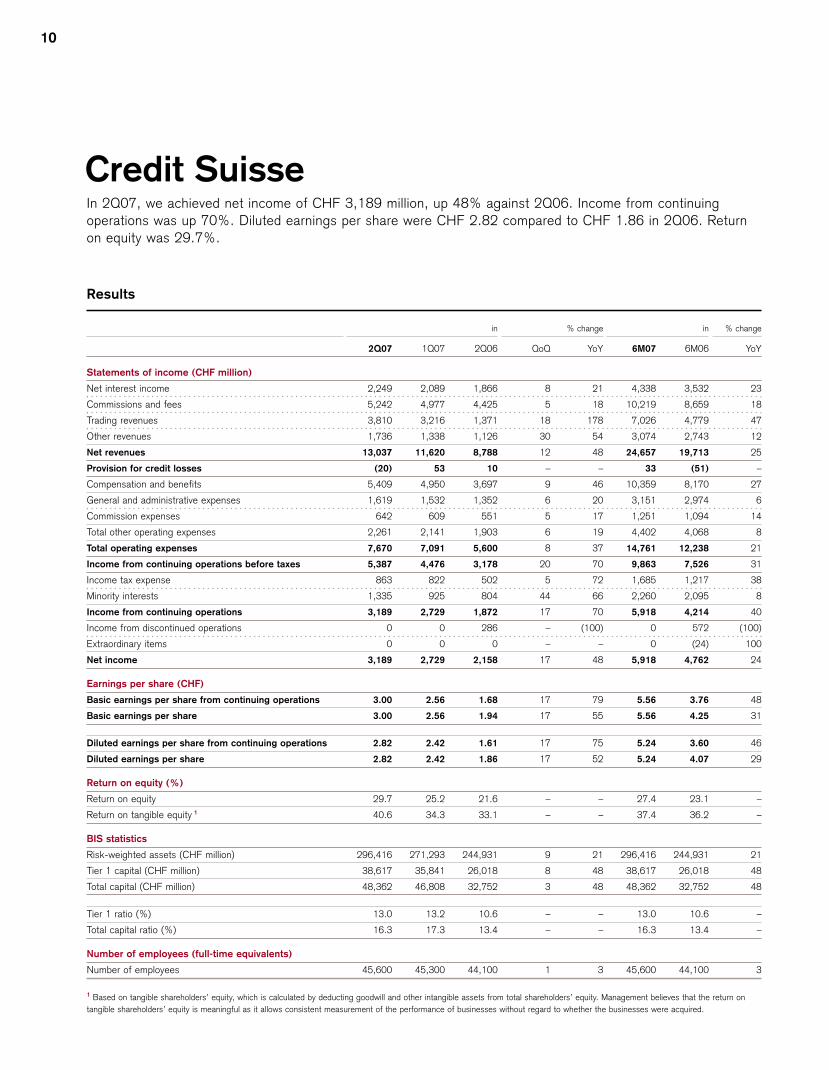
Credit Suisse In 2Q07, we achieved net income of CHF 3,189 million, up 48% against 2Q06. Income from continuingoperations was up 70%. Diluted earnings per share were CHF 2.82 compared to CHF 1.86 in 2Q06. Returnon equity was 29.7%.
Results
in % change in % change
2Q07 1Q07 2Q06 QoQ YoY 6M07 6M06 YoY
Statements of income (CHF million)
Net interest income 2,249 2,089 1,866 8 21 4,338 3,532 23
Commissions and fees 5,242 4,977 4,425 5 18 10,219 8,659 18
Trading revenues 3,810 3,216 1,371 18 178 7,026 4,779 47
Other revenues 1,736 1,338 1,126 30 54 3,074 2,743 12
Net revenues 13,037 11,620 8,788 12 48 24,657 19,713 25
Provision for credit losses (20) 53 10 – – 33 (51) –
Compensation and benefits 5,409 4,950 3,697 9 46 10,359 8,170 27
General and administrative expenses 1,619 1,532 1,352 6 20 3,151 2,974 6
Commission expenses 642 609 551 5 17 1,251 1,094 14
Total other operating expenses 2,261 2,141 1,903 6 19 4,402 4,068 8
Total operating expenses 7,670 7,091 5,600 8 37 14,761 12,238 21
Income from continuing operations before taxes 5,387 4,476 3,178 20 70 9,863 7,526 31
Income tax expense 863 822 502 5 72 1,685 1,217 38
Minority interests 1,335 925 804 44 66 2,260 2,095 8
Income from continuing operations 3,189 2,729 1,872 17 70 5,918 4,214 40
Income from discontinued operations 0 0 286 – (100) 0 572 (100)
Extraordinary items 0 0 0 – – 0 (24) 100
Net income 3,189 2,729 2,158 17 48 5,918 4,762 24
Earnings per share (CHF)
Basic earnings per share from continuing operations 3.00 2.56 1.68 17 79 5.56 3.76 48
Basic earnings per share 3.00 2.56 1.94 17 55 5.56 4.25 31
Diluted earnings per share from continuing operations 2.82 2.42 1.61 17 75 5.24 3.60 46
Diluted earnings per share 2.82 2.42 1.86 17 52 5.24 4.07 29
Return on equity (%)
Return on equity 29.7 25.2 21.6 – – 27.4 23.1 –
Return on tangible equity 1 40.6 34.3 33.1 – – 37.4 36.2 –
BIS statistics
Risk-weighted assets (CHF million) 296,416 271,293 244,931 9 21 296,416 244,931 21
Tier 1 capital (CHF million) 38,617 35,841 26,018 8 48 38,617 26,018 48
Total capital (CHF million) 48,362 46,808 32,752 3 48 48,362 32,752 48
Tier 1 ratio (%) 13.0 13.2 10.6 – – 13.0 10.6 –
Total capital ratio (%) 16.3 17.3 13.4 – – 16.3 13.4 –
Number of employees (full-time equivalents)
Number of employees 45,600 45,300 44,100 1 3 45,600 44,100 3
1 Based on tangible shareholders’ equity, which is calculated by deducting goodwill and other intangible assets from total shareholders’ equity. Management believes that the return ontangible shareholders’ equity is meaningful as it allows consistent measurement of the performance of businesses without regard to whether the businesses were acquired.

Credit Suisse
Credit Suisse Results
11
Results summary
In 2Q07, net income was CHF 3,189 million, up CHF 1,031million, or 48%, against 2Q06, and up CHF 460 million, or17%, from 1Q07. Our results in 2Q07 reflected the continuedoverall favorable operating environment and our client-focusedbusiness model. Diluted earnings per share were CHF 2.82compared to CHF 1.86 in 2Q06 and CHF 2.42 in 1Q07.Return on equity reached 29.7%, compared to 21.6% in2Q06 and 25.2% in 1Q07. The BIS Tier 1 ratio as of the endof 2Q07 was 13.0% compared to 10.6% in 2Q06 and 13.2%in 1Q07.
Management changes
Effective May 5, 2007, Brady W. Dougan assumed the role ofChief Executive Officer Credit Suisse Group following OswaldJ. Grübel’s decision to retire after a successful 38 year careerat Credit Suisse. Brady W. Dougan assigned his responsibili-ties as Chief Executive Officer Investment Banking and ChiefExecutive Officer Credit Suisse Americas to Paul Calello andRobert Shafir, respectively. Robert Shafir joined Credit Suissein August 2007 to further develop our integrated bankingorganization in the Americas region.
As of July 1, 2007, the Executive Board of Credit Suisse isthe same as that of the Bank.
Core Results
Core Results include the results of our three segments andthe Corporate Center. Credit Suisse’s results also include rev-enues and expenses from the consolidation of certain privateequity funds and other entities in which we do not have a sig-
nificant economic interest (SEI) in such revenues andexpenses. The consolidation of these entities does not affectnet income as the amounts recorded in net revenues and totaloperating expenses are offset by corresponding amountsreported as minority interests. In addition, our income taxexpense is not affected by these revenues and expenses.These minority interest-related revenues and expenses arereported as “Minority Interests without SEI” in the “CreditSuisse and Core Results” table on the next page.
Corporate Center includes parent company operationssuch as Group financing, expenses for projects sponsored bythe Group and certain expenses that have not been allocatedto the segments, as well as all gains and losses recorded as aresult of applying the fair value option to our own debt. In addi-tion, Corporate Center includes consolidation and eliminationadjustments required to eliminate intercompany revenues andexpenses.
Capital efficiency
At the Annual General Meeting on May 4, 2007, the share-holders approved the launch of a three-year share buybackprogram of up to CHF 8 billion. During 2Q07, we repurchased14.7 million common shares in the amount of CHF 1.3 billionunder the new program. As of the end of July 2007, we repur-chased a total of CHF 2.5 billion. We plan to repurchase a fur-ther CHF 2.5 billion by the end of 2007 and expect to com-plete this repurchase program during 2008, ahead of the2010 target.
In connection with the centralization of our funding, theBank issued USD 2 billion of Tier 1 capital notes in 2Q07.
Credit Suisse
Core Results Minority Interests without Significant Economic Interest
InvestmentBanking
Private Banking Asset Management
CorporateCenter
Wealth Management
Corporate & Retail Banking
Credit Suisse reporting structure

12
Allocations and fundingRevenue sharing and cost allocation
Responsibility for each product is allocated to a segment,which records all related revenues and expenses. Revenuesharing and service level agreements govern the compensationreceived by one segment for generating revenue or providingservices on behalf of another. These agreements are negoti-ated periodically by the relevant segments on a product-by-product basis. The aim of revenue-sharing and service levelagreements is to reflect the pricing structure of unrelatedthird-party transactions. Corporate services and business sup-port in finance, operations, including human resources, legaland compliance, risk management and information technologyare provided by the Shared Services area. Shared Servicescosts are allocated to the segments and Corporate Centerbased on their requirements and other relevant measures.
Funding
The Bank lends funds to its operating subsidiaries and affili-ates on both a senior and subordinated basis, as needed, thelatter typically to meet capital requirements, or as desired bymanagement to support business initiatives. Capital is distrib-uted to the segments considering factors such as regulatorycapital requirements, utilized economic capital and the historicand future potential return on capital. Transfer pricing, usingmarket rates, is used to record interest income and expense ineach of the segments for this capital and funding.
Credit Suisse and Core Results
Core Results Minority Interests without SEI Credit Suisse
in the period 2Q07 1Q07 2Q06 2Q07 1Q07 2Q06 2Q07 1Q07 2Q06
Statements of income (CHF million)
Net revenues 11,703 10,669 8,047 1,334 951 741 13,037 11,620 8,788
Provision for credit losses (20) 53 10 0 0 0 (20) 53 10
Compensation and benefits 5,386 4,906 3,697 23 44 0 5,409 4,950 3,697
General and administrative expenses 1,609 1,525 1,339 10 7 13 1,619 1,532 1,352
Commission expenses 642 609 551 0 0 0 642 609 551
Total other operating expenses 2,251 2,134 1,890 10 7 13 2,261 2,141 1,903
Total operating expenses 7,637 7,040 5,587 33 51 13 7,670 7,091 5,600
Income from continuing operations before taxes 4,086 3,576 2,450 1,301 900 728 5,387 4,476 3,178
Income tax expense 863 822 502 0 0 0 863 822 502
Minority interests 34 25 76 1,301 900 728 1,335 925 804
Income from continuing operations 3,189 2,729 1,872 0 0 0 3,189 2,729 1,872
Income from discontinued operations 0 0 286 0 0 0 0 0 286
Net income 3,189 2,729 2,158 0 0 0 3,189 2,729 2,158
Statement of income metrics (%)
Compensation/revenue ratio 46.0 46.0 45.9 – – – 41.5 42.6 42.1
Non-compensation/revenue ratio 19.2 20.0 23.5 – – – 17.3 18.4 21.7
Cost/income ratio 65.3 66.0 69.4 – – – 58.8 61.0 63.7
Pre-tax income margin 34.9 33.5 30.4 – – – 41.3 38.5 36.2
Tax rate 21.1 23.0 20.5 – – – 16.0 18.4 15.8
Net income margin from continuing operations 27.2 25.6 23.3 – – – 24.5 23.5 21.3
Net income margin 27.2 25.6 26.8 – – – 24.5 23.5 24.6
Core Results
Credit Suisse Results
13
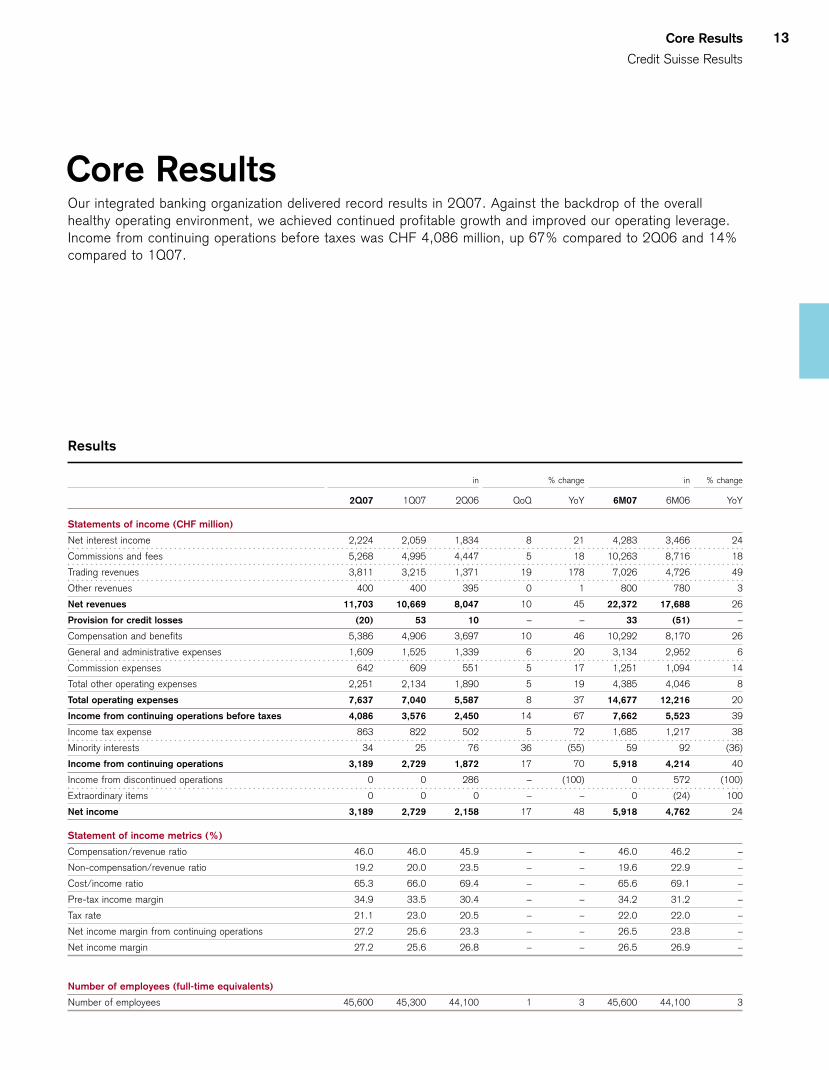
Core ResultsOur integrated banking organization delivered record results in 2Q07. Against the backdrop of the overallhealthy operating environment, we achieved continued profitable growth and improved our operating leverage.Income from continuing operations before taxes was CHF 4,086 million, up 67% compared to 2Q06 and 14%compared to 1Q07.
Results
in % change in % change
2Q07 1Q07 2Q06 QoQ YoY 6M07 6M06 YoY
Statements of income (CHF million)
Net interest income 2,224 2,059 1,834 8 21 4,283 3,466 24
Commissions and fees 5,268 4,995 4,447 5 18 10,263 8,716 18
Trading revenues 3,811 3,215 1,371 19 178 7,026 4,726 49
Other revenues 400 400 395 0 1 800 780 3
Net revenues 11,703 10,669 8,047 10 45 22,372 17,688 26
Provision for credit losses (20) 53 10 – – 33 (51) –
Compensation and benefits 5,386 4,906 3,697 10 46 10,292 8,170 26
General and administrative expenses 1,609 1,525 1,339 6 20 3,134 2,952 6
Commission expenses 642 609 551 5 17 1,251 1,094 14
Total other operating expenses 2,251 2,134 1,890 5 19 4,385 4,046 8
Total operating expenses 7,637 7,040 5,587 8 37 14,677 12,216 20
Income from continuing operations before taxes 4,086 3,576 2,450 14 67 7,662 5,523 39
Income tax expense 863 822 502 5 72 1,685 1,217 38
Minority interests 34 25 76 36 (55) 59 92 (36)
Income from continuing operations 3,189 2,729 1,872 17 70 5,918 4,214 40
Income from discontinued operations 0 0 286 – (100) 0 572 (100)
Extraordinary items 0 0 0 – – 0 (24) 100
Net income 3,189 2,729 2,158 17 48 5,918 4,762 24
Statement of income metrics (%)
Compensation/revenue ratio 46.0 46.0 45.9 – – 46.0 46.2 –
Non-compensation/revenue ratio 19.2 20.0 23.5 – – 19.6 22.9 –
Cost/income ratio 65.3 66.0 69.4 – – 65.6 69.1 –
Pre-tax income margin 34.9 33.5 30.4 – – 34.2 31.2 –
Tax rate 21.1 23.0 20.5 – – 22.0 22.0 –
Net income margin from continuing operations 27.2 25.6 23.3 – – 26.5 23.8 –
Net income margin 27.2 25.6 26.8 – – 26.5 26.9 –
Number of employees (full-time equivalents)
Number of employees 45,600 45,300 44,100 1 3 45,600 44,100 3
14
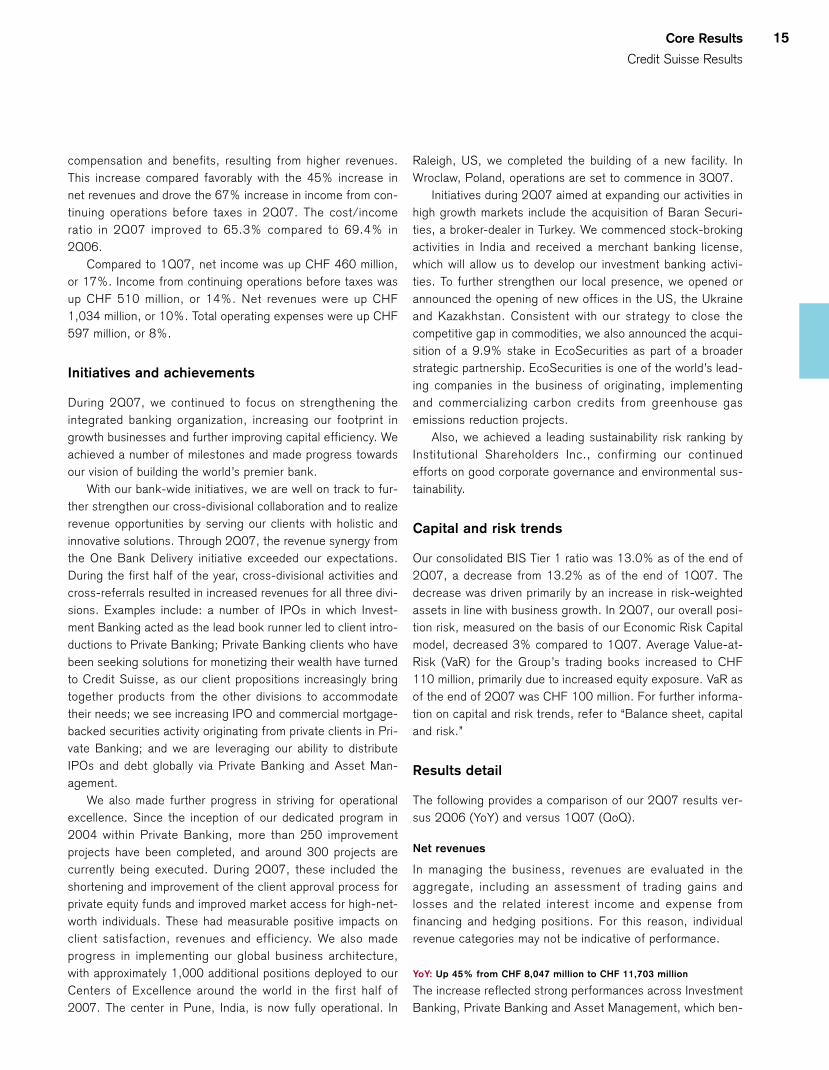
Core Results include the results of our integrated bankingorganization and exclude revenues and expenses in respect ofminority interests in which we do not have significant eco-nomic interest.
Results summary
In 2Q07, net income was CHF 3,189 million, up CHF 1,031million, or 48%, compared to 2Q06. Income from continuingoperations before taxes was CHF 4,086 million, up CHF1,636 million, or 67%. Net revenues were CHF 11,703 mil-lion, up CHF 3,656 million, or 45%. Total operating expenseswere CHF 7,637 million, up CHF 2,050 million, or 37%.
Our Core Results for 2Q07 reached a record level, benefit-ing from good client activity in an overall healthy economicenvironment and driven by strong operating performances
across our businesses. Net revenues benefited from the favor-able equity markets, with global equity markets trendinghigher, increased trading volumes and higher volatility. Thefixed income markets were generally challenging, but offeredattractive trading opportunities, despite the dislocation of theUS subprime mortgage market as of the end of 1Q07, theeffects of which carried over into 2Q07. Favorable marketconditions and continued operational improvement helped tosustain strong growth in assets under management and netnew assets. Net new assets were CHF 27.6 billion, whichbrought the annualized net new asset growth rate to 7.1%compared to 8.7% in 2Q06. Excluding credits from insurancesettlements of CHF 474 million in Investment Banking andrealignment costs of CHF 152 million in Asset Managementrecorded in 2Q06, total operating expenses for 2Q07 were upCHF 1,728 million, or 29%, primarily reflecting increased
Landmark transaction in microfinanceDuring 2Q07, Credit Suisse successfullyclosed the first ever global IPO of a micro-finance institution – the USD 467 millionoffering for Mexico’s Banco Compartamos,S.A. (Compartamos), which provides smallworking capital loans and other financialservices to subsistence entrepreneurs, hasover 600,000 clients and operates in 29of Mexico’s 32 states. These short-term,easily renewable loans support a broadsegment of the population working inhandicraft and garment trades, agriculture,food services and other craft-related busi-nesses. Women account for 98% of Com-partamos’ clients.
The transaction is a landmark for the capi-tal and financial services markets and rep-resents a significant step forward for sus-tainable economic development in theemerging markets. It also underlines ourcommitment to microfinance and reaffirmsour strategic strengths – the ability to pro-vide our clients with innovative financial
solutions by combining investment bank-ing, private banking and asset manage-ment skills and the ability to capitalize onour leading emerging markets platform.
Credit Suisse was able to distinguish itselffrom competitors through its integratedorganization and by demonstrating itscommitment to microfinance and its long-standing interest in sustainable businessinitiatives. In 2003, Credit Suisse helpedestablish responsAbility Social InvestmentServices, Ltd., a Zurich-based companythat invests primarily in microfinance insti-tutions in developing nations. CreditSuisse has been offering its clients theopportunity to invest in a growing suite ofmicrofinance funds managed by respons-Ability AG. In November 2005, CreditSuisse was a participating financial institu-tion in the United Nation’s-sponsored“International Year of Microcredit”. InMarch of this year, Credit Suisse co-spon-sored a conference for institutional
investors on the opportunities in microfi-nance. Attracted by the social as well asthe financial return that these investmentsdeliver, the total portfolio of our microfi-nance investments surpassed USD 260million as of the end of 2Q07.
In the case of Compartamos, the under-served commercial lending market repre-sents a high-quality pool of assets withstrong growth potential. In our view, thistransaction marks the first large-scale,global equity offering for a highly promis-ing new asset class; estimates showapproximately USD 2 trillion in sociallyresponsible investments globally. As afinancial institution dedicated to servingthe emerging markets and to buildingbridges between the beneficiaries ofmicrofinance and investors, Credit Suisseis well positioned to play a key role in thepromising evolution of microfinance aroundthe world.
Core Results
Credit Suisse Results
15
compensation and benefits, resulting from higher revenues.This increase compared favorably with the 45% increase innet revenues and drove the 67% increase in income from con-tinuing operations before taxes in 2Q07. The cost/incomeratio in 2Q07 improved to 65.3% compared to 69.4% in2Q06.
Compared to 1Q07, net income was up CHF 460 million,or 17%. Income from continuing operations before taxes wasup CHF 510 million, or 14%. Net revenues were up CHF1,034 million, or 10%. Total operating expenses were up CHF597 million, or 8%.
Initiatives and achievements
During 2Q07, we continued to focus on strengthening theintegrated banking organization, increasing our footprint ingrowth businesses and further improving capital efficiency. Weachieved a number of milestones and made progress towardsour vision of building the world’s premier bank.
With our bank-wide initiatives, we are well on track to fur-ther strengthen our cross-divisional collaboration and to realizerevenue opportunities by serving our clients with holistic andinnovative solutions. Through 2Q07, the revenue synergy fromthe One Bank Delivery initiative exceeded our expectations.During the first half of the year, cross-divisional activities andcross-referrals resulted in increased revenues for all three divi-sions. Examples include: a number of IPOs in which Invest-ment Banking acted as the lead book runner led to client intro-ductions to Private Banking; Private Banking clients who havebeen seeking solutions for monetizing their wealth have turnedto Credit Suisse, as our client propositions increasingly bringtogether products from the other divisions to accommodatetheir needs; we see increasing IPO and commercial mortgage-backed securities activity originating from private clients in Pri-vate Banking; and we are leveraging our ability to distributeIPOs and debt globally via Private Banking and Asset Man-agement.
We also made further progress in striving for operationalexcellence. Since the inception of our dedicated program in2004 within Private Banking, more than 250 improvementprojects have been completed, and around 300 projects arecurrently being executed. During 2Q07, these included theshortening and improvement of the client approval process forprivate equity funds and improved market access for high-net-worth individuals. These had measurable positive impacts onclient satisfaction, revenues and efficiency. We also madeprogress in implementing our global business architecture,with approximately 1,000 additional positions deployed to ourCenters of Excellence around the world in the first half of2007. The center in Pune, India, is now fully operational. In
Raleigh, US, we completed the building of a new facility. InWroclaw, Poland, operations are set to commence in 3Q07.
Initiatives during 2Q07 aimed at expanding our activities inhigh growth markets include the acquisition of Baran Securi-ties, a broker-dealer in Turkey. We commenced stock-brokingactivities in India and received a merchant banking license,which will allow us to develop our investment banking activi-ties. To further strengthen our local presence, we opened orannounced the opening of new offices in the US, the Ukraineand Kazakhstan. Consistent with our strategy to close thecompetitive gap in commodities, we also announced the acqui-sition of a 9.9% stake in EcoSecurities as part of a broaderstrategic partnership. EcoSecurities is one of the world’s lead-ing companies in the business of originating, implementingand commercializing carbon credits from greenhouse gasemissions reduction projects.
Also, we achieved a leading sustainability risk ranking byInstitutional Shareholders Inc., confirming our continuedefforts on good corporate governance and environmental sus-tainability.
Capital and risk trends
Our consolidated BIS Tier 1 ratio was 13.0% as of the end of2Q07, a decrease from 13.2% as of the end of 1Q07. Thedecrease was driven primarily by an increase in risk-weightedassets in line with business growth. In 2Q07, our overall posi-tion risk, measured on the basis of our Economic Risk Capitalmodel, decreased 3% compared to 1Q07. Average Value-at-Risk (VaR) for the Group’s trading books increased to CHF110 million, primarily due to increased equity exposure. VaR asof the end of 2Q07 was CHF 100 million. For further informa-tion on capital and risk trends, refer to “Balance sheet, capitaland risk.”
Results detail
The following provides a comparison of our 2Q07 results ver-sus 2Q06 (YoY) and versus 1Q07 (QoQ).
Net revenues
In managing the business, revenues are evaluated in theaggregate, including an assessment of trading gains andlosses and the related interest income and expense fromfinancing and hedging positions. For this reason, individualrevenue categories may not be indicative of performance.
YoY: Up 45% from CHF 8,047 million to CHF 11,703 million
The increase reflected strong performances across InvestmentBanking, Private Banking and Asset Management, which ben-
efited from good client activity in an overall healthy economicenvironment. Net revenues benefited from lower fundingcosts, which reflected an increase in the level of free fundsfollowing the disposal of Winterthur as of the end of 4Q06.
In Investment Banking, we had a strong quarter, withrecord quarterly revenues in our equity and fixed income trad-ing businesses. Our equity trading results were driven by goodperformance in our cash, proprietary trading, derivatives andprime services businesses. Our fixed income trading resultswere strong despite the more challenging market environment,including the continued impact of the dislocation in the USsubprime mortgage market. Fixed income trading results weredriven by our structured products, including commercial mort-gage-backed securities, leveraged finance, emerging marketstrading and currency trading businesses. Advisory and otherfees increased significantly due to higher mergers and acquisi-tions activity and market share. Our debt underwriting rev-enues remained strong, driven by our leveraged finance fran-chise, which benefited from active markets and was supportedby our strong client relationships with financial sponsors.Higher equity underwriting revenues reflected strong equitymarkets and improved market share.
In Private Banking, net revenues reflected the positivemarket conditions. Asset-based commissions and fees grewas a result of the strong increase in our assets under man-agement, particularly in managed assets. Transaction-basedrevenues were also higher, most notably in brokerage fees andproduct issuing fees. Net interest income benefited mainlyfrom lower funding costs as well as higher liability volumes andmargins, while asset margins still faced ongoing market pres-sure. Growth in assets under management primarily reflectedthe positive market conditions and net new assets.
In Asset Management, net revenues reflected an increasein asset management and administrative revenues due toincreased assets under management. Private equity commis-sion income increased reflecting growth in commitments to,and assets managed in, our private equity funds. In addition,we had strong private equity and other investment-relatedgains. Growth in assets under management primarily reflectedstrong net new assets and the positive market conditions.
QoQ: Up 10% from CHF 10,669 million to CHF 11,703 million
In Investment Banking, net revenues increased driven bystrong equity and fixed income trading revenues. The increasein fixed income trading revenues was driven by structuredproducts, currency trading, leveraged finance and proprietarytrading. The increase in equity trading revenues was mainlyfrom equity derivatives and prime services. Higher levels ofindustry-wide equity issuances contributed to the strong per-formance in equity underwriting. Additionally, advisory fees
increased significantly due to higher mergers and acquisitionsactivity and higher revenues from the private fund group.These results were partly offset by lower revenues from debtunderwriting reflecting a decrease in underwriting revenues inthe leveraged finance and emerging markets businesses.
In Private Banking, net revenues were flat, as higherasset-based commissions and fees and higher liability marginswere offset by lower transaction-based revenues, reflectingmore cautious client behavior.
In Asset Management, net revenues increased reflectinghigher private equity and other investment-related gains andstrong growth in alternative investments.
Provision for credit losses
YoY: From CHF 10 million to CHF (20) million
The decrease was due primarily to recoveries and reducedreserves. The benign credit environment is not expected tocontinue, which may result in a modest increase in new provi-sion levels towards the end of 2007. QoQ: From CHF 53 million to CHF (20) million
The decrease was due primarily to recoveries and a reducedlevel of new provisions.
Operating expenses
Compensation and benefitsYoY: Up 46% from CHF 3,697 million to CHF 5,386 million
The increase was due primarily to higher performance-relatedcompensation reflecting improved results. In Investment Bank-ing, compensation and benefits expense is targeted at 51.5%of net revenues, with discretionary bonus representing a con-siderable portion of the total amount. In Private Banking, theincrease also related to the international expansion in WealthManagement and higher salaries and benefits in Corporate &Retail Banking. In Asset Management, the increase was also aresult of ongoing efforts to hire new investment talent andbuild product development and distribution capabilities. QoQ: Up 10% from CHF 4,906 million to CHF 5,386 million
The increase was due primarily to higher performance-relatedcompensation in Investment Banking and Asset Managementreflecting improved results. In Private Banking, compensationand benefits was flat.
General and administrative expensesYoY: Up 20% from CHF 1,339 million to CHF 1,609 million
The increase was primarily due to credits from insurance set-tlements of CHF 474 million in Investment Banking andrealignment costs of CHF 141 million in Asset Management in2Q06. Excluding these credits from insurance settlements andrealignment costs, general and administrative expensesdecreased CHF 63 million, or 4%. This reflected a decline in
16
Core Results
Credit Suisse Results
17
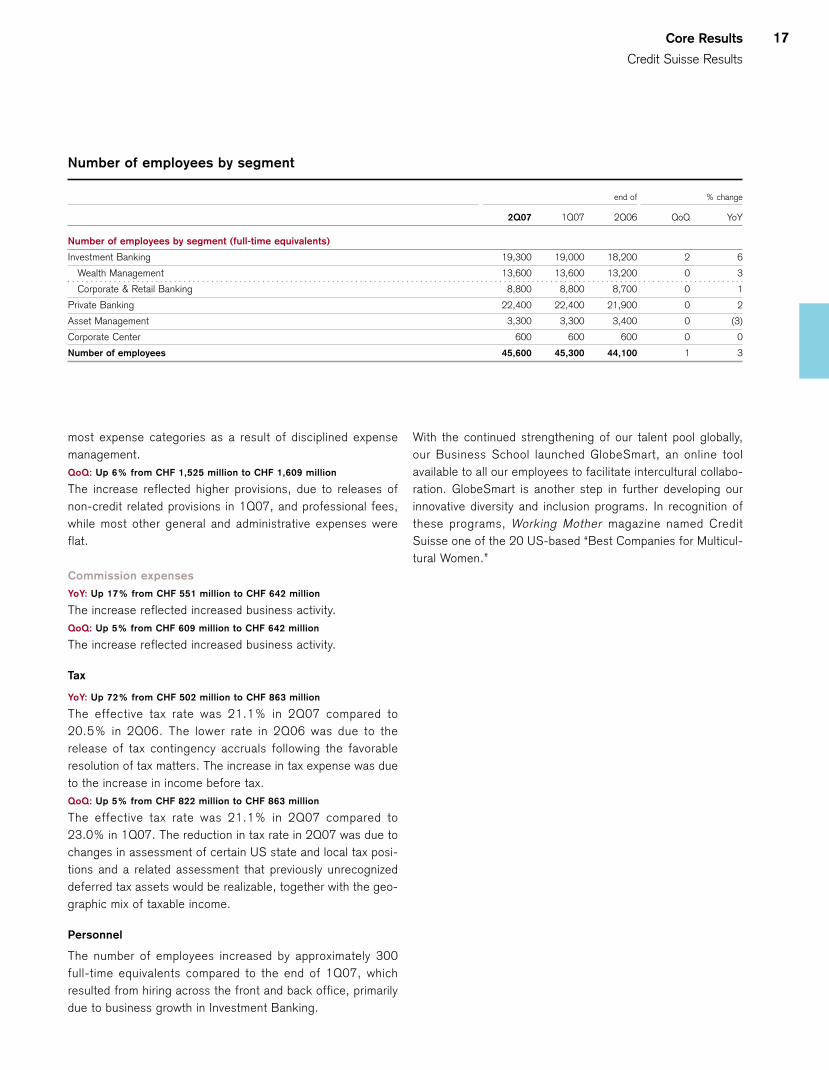
Number of employees by segment
end of % change
2Q07 1Q07 2Q06 QoQ YoY
Number of employees by segment (full-time equivalents)
Investment Banking 19,300 19,000 18,200 2 6
Wealth Management 13,600 13,600 13,200 0 3
Corporate & Retail Banking 8,800 8,800 8,700 0 1
Private Banking 22,400 22,400 21,900 0 2
Asset Management 3,300 3,300 3,400 0 (3)
Corporate Center 600 600 600 0 0
Number of employees 45,600 45,300 44,100 1 3
most expense categories as a result of disciplined expensemanagement. QoQ: Up 6% from CHF 1,525 million to CHF 1,609 million
The increase reflected higher provisions, due to releases ofnon-credit related provisions in 1Q07, and professional fees,while most other general and administrative expenses wereflat.
Commission expensesYoY: Up 17% from CHF 551 million to CHF 642 million
The increase reflected increased business activity. QoQ: Up 5% from CHF 609 million to CHF 642 million
The increase reflected increased business activity.
Tax
YoY: Up 72% from CHF 502 million to CHF 863 million
The effective tax rate was 21.1% in 2Q07 compared to20.5% in 2Q06. The lower rate in 2Q06 was due to therelease of tax contingency accruals following the favorableresolution of tax matters. The increase in tax expense was dueto the increase in income before tax.QoQ: Up 5% from CHF 822 million to CHF 863 million
The effective tax rate was 21.1% in 2Q07 compared to23.0% in 1Q07. The reduction in tax rate in 2Q07 was due tochanges in assessment of certain US state and local tax posi-tions and a related assessment that previously unrecognizeddeferred tax assets would be realizable, together with the geo-graphic mix of taxable income.
Personnel
The number of employees increased by approximately 300full-time equivalents compared to the end of 1Q07, whichresulted from hiring across the front and back office, primarilydue to business growth in Investment Banking.
With the continued strengthening of our talent pool globally,our Business School launched GlobeSmart, an online toolavailable to all our employees to facilitate intercultural collabo-ration. GlobeSmart is another step in further developing ourinnovative diversity and inclusion programs. In recognition ofthese programs, Working Mother magazine named CreditSuisse one of the 20 US-based “Best Companies for Multicul-tural Women.”

18
Key Performance Indicators To benchmark our achievements, we have defined a set of integrated bank performance indicators for whichwe have targets to be achieved over a three to five year period throughout the market cycles. With the resultsdelivered in 2Q07 and against the backdrop of the overall healthy economic environment, we are optimistic inachieving our targets.
in / end of
2Q07 6M07 2006 2005 2004
Growth (%)
YoY diluted earnings per share growth from continuing operations 75.2 45.6 84.4 (7.8) 53.8
Net new asset growth (annualized) 7.1 9.5 7.2 5.4 2.7
Net new asset growth (rolling four-quarter average) 8.0 – 7.2 5.4 2.7
Efficiency (%)
Core Results cost/income ratio 65.3 65.6 69.6 81.6 75.4
Return (%)
Return on equity (annualized) 29.7 27.4 27.5 15.4 15.9
Total shareholder return (annualized) – 1 10.1 30.5 44.2 6.8
Capital strength (%)
Tier 1 ratio 13.0 13.0 13.9 11.3 12.3
1 Not applicable for 2Q07 as Total shareholder return is calculated on a year-to-date basis.
Growth
For earnings per share, we target a double-digit annual per-centage growth. Diluted earnings per share growth from con-tinuing operations was 75.2% in 2Q07.
For net new assets, we target a growth rate above 6%. In2Q07, we achieved an annualized net new asset growth rateof 7.1% and a rolling four-quarter average growth rate of8.0%.
Efficiency
We target efficiency improvements within a top quartile per-formance compared to the industry. Our Core Resultscost/income ratio for 2Q07 was 65.3%.
Performance
For return on equity, we target an annual rate of return ofabove 20%. In 2Q07, we achieved 29.7%.
For total shareholder return, we target superior share priceappreciation plus dividends compared to our peer group. For6M07, annualized total shareholder return was 10.1%.
Capital strength
For the BIS Tier 1 ratio, we target a minimum level of 10%.The BIS Tier 1 ratio as of the end of 2Q07 was 13.0%.

Financial Review
2Q 07Core Results
20 Investment BankingInvestment Banking comprises the performance of our trading,underwriting and advisory franchise for which we aspire to amid-term pre-tax income margin of above 30%.
26 Private BankingPrivate Banking encompasses the results of our WealthManagement and Corporate & Retail Banking businesses.
28 Wealth ManagementWealth Management generates recurring revenues from assetsunder management and loans and transaction-based revenuesfrom client trading and other service offerings. Across thecycle, we target a pre-tax income margin of above 40% andnet new asset growth of 6%.
33 Corporate & Retail BankingCorporate & Retail Banking derives net interest income fromcommercial and consumer loans, as well as non-interestrevenues from various service offerings. Our ambition is togenerate a pre-tax income margin of above 40% across thecycle.
36 Asset ManagementAsset Management records management and performancefees from the entire range of asset classes, managing both traditional and alternative investments. We strive for amid-term pre-tax income margin of above 35%.
20
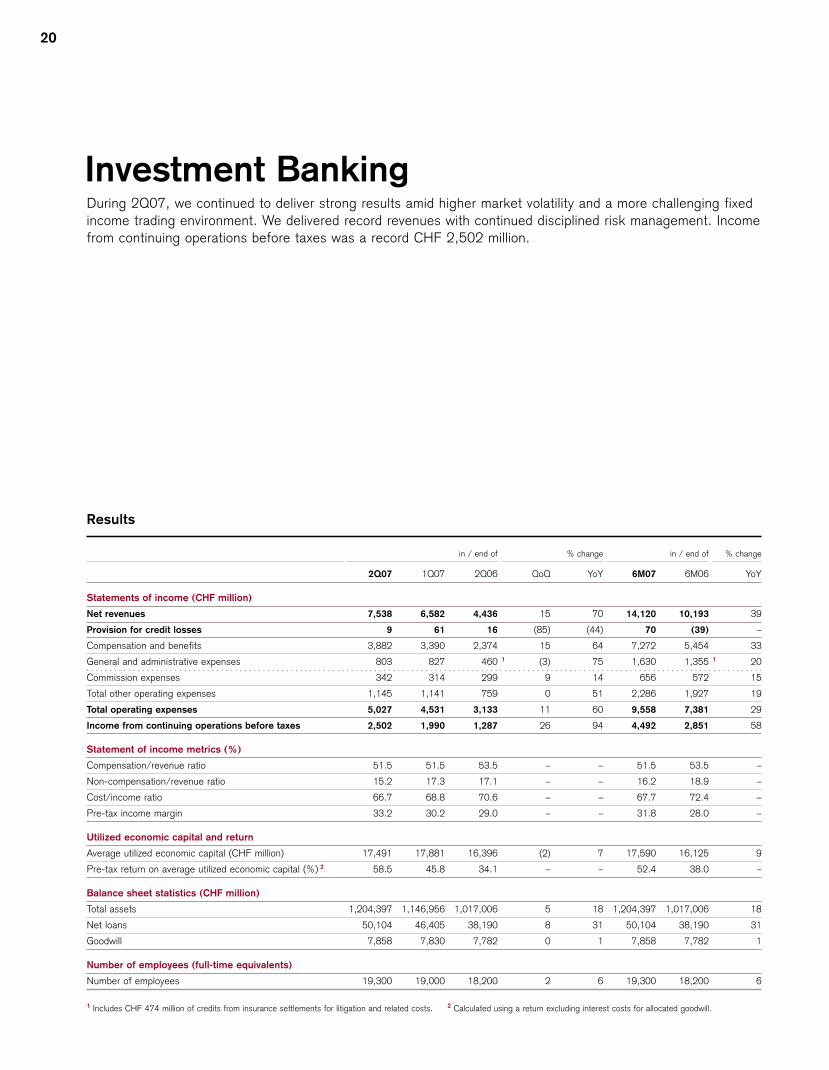
Investment BankingDuring 2Q07, we continued to deliver strong results amid higher market volatility and a more challenging fixedincome trading environment. We delivered record revenues with continued disciplined risk management. Incomefrom continuing operations before taxes was a record CHF 2,502 million.
Results
in / end of % change in / end of % change
2Q07 1Q07 2Q06 QoQ YoY 6M07 6M06 YoY
Statements of income (CHF million)
Net revenues 7,538 6,582 4,436 15 70 14,120 10,193 39
Provision for credit losses 9 61 16 (85) (44) 70 (39) –
Compensation and benefits 3,882 3,390 2,374 15 64 7,272 5,454 33
General and administrative expenses 803 827 460 1 (3) 75 1,630 1,355 1 20
Commission expenses 342 314 299 9 14 656 572 15
Total other operating expenses 1,145 1,141 759 0 51 2,286 1,927 19
Total operating expenses 5,027 4,531 3,133 11 60 9,558 7,381 29
Income from continuing operations before taxes 2,502 1,990 1,287 26 94 4,492 2,851 58
Statement of income metrics (%)
Compensation/revenue ratio 51.5 51.5 53.5 – – 51.5 53.5 –
Non-compensation/revenue ratio 15.2 17.3 17.1 – – 16.2 18.9 –
Cost/income ratio 66.7 68.8 70.6 – – 67.7 72.4 –
Pre-tax income margin 33.2 30.2 29.0 – – 31.8 28.0 –
Utilized economic capital and return
Average utilized economic capital (CHF million) 17,491 17,881 16,396 (2) 7 17,590 16,125 9
Pre-tax return on average utilized economic capital (%) 2 58.5 45.8 34.1 – – 52.4 38.0 –
Balance sheet statistics (CHF million)
Total assets 1,204,397 1,146,956 1,017,006 5 18 1,204,397 1,017,006 18
Net loans 50,104 46,405 38,190 8 31 50,104 38,190 31
Goodwill 7,858 7,830 7,782 0 1 7,858 7,782 1
Number of employees (full-time equivalents)
Number of employees 19,300 19,000 18,200 2 6 19,300 18,200 6
1 Includes CHF 474 million of credits from insurance settlements for litigation and related costs. 2 Calculated using a return excluding interest costs for allocated goodwill.

Investment Banking
Core Results
21
Operating environment
The operating environment was generally positive for Invest-ment Banking during 2Q07. We benefited from favorableequity markets, which trended higher, and from increasedtrading volumes and higher volatility. The volume of globalequity new issuances set a record in 2Q07, as did the volumeof announced global mergers and acquisitions transactions,driven largely by cross-border and financial sponsor activity.The fixed income markets were generally challenging, butoffered attractive trading opportunities despite the dislocationof the US subprime mortgage market as of the end of 1Q07,the effects of which carried over into 2Q07. Rate productsexperienced a more volatile rate environment due to uncer-tainty over the direction of interest rates. Credit marketsremained generally positive with increased new issue activity,although with a heightened focus on underlying issuer creditquality. In the commercial mortgage markets, demand and liq-uidity remained strong. In the residential mortgage market, ourissuance levels were down due to continued subprime con-cerns.
Results summary
In 2Q07, income from continuing operations before taxes wasa record CHF 2,502 million, up CHF 1,215 million, or 94%,compared to 2Q06. Excluding the credits from insurance set-tlements for litigation and related costs of CHF 474 million in2Q06, income from continuing operations before taxesincreased CHF 1,689 million, or 208%. Net revenues were arecord CHF 7,538 million, up CHF 3,102 million, or 70%,with substantial increases in all major business areas. Totaloperating expenses were CHF 5,027 million, up CHF 1,894million, or 60%, primarily from higher compensation expenses,reflecting higher revenues, and higher other operatingexpenses, as 2Q06 included the credits from insurance settle-ments. Excluding these credits from insurance settlements,other operating expenses were CHF 88 million, or 7%, lower.
Compared to 1Q07, income from continuing operationsbefore taxes increased CHF 512 million, or 26%. Net rev-enues were up CHF 956 million, or 15%, driven by increasesin most of our major business areas. Total operating expenseswere up CHF 496 million, or 11%, due primarily to highercompensation expenses reflecting higher revenues.
Overall, we had a strong quarter, with record quarterly rev-enues in our equity and fixed income trading businesses. Our
Results (continued)
in % change in % change
2Q07 1Q07 2Q06 QoQ YoY 6M07 6M06 YoY
Net revenue detail (CHF million)
Debt underwriting 713 725 613 (2) 16 1,438 1,069 35
Equity underwriting 413 311 313 33 32 724 562 29
Total underwriting 1,126 1,036 926 9 22 2,162 1,631 33
Advisory and other fees 632 511 405 24 56 1,143 738 55
Total underwriting and advisory 1,758 1,547 1,331 14 32 3,305 2,369 40
Fixed income trading 3,282 2,772 1,939 18 69 6,054 4,706 29
Equity trading 2,475 2,171 1,146 14 116 4,646 3,223 44
Total trading 5,757 4,943 3,085 16 87 10,700 7,929 35
Other 1 23 92 20 (75) 15 115 (105) –
Net revenues 7,538 6,582 4,436 15 70 14,120 10,193 39
Average one-day, 99% Value-at-Risk (CHF million)
Interest rate and credit spread 58 53 67 9 (13) 56 63 (11)
Foreign exchange 24 17 19 41 26 21 18 17
Commodity 18 12 8 50 125 15 9 67
Equity 93 64 65 45 43 79 59 34
Diversification benefit (83) (69) (64) 20 30 (77) (66) 17
Average one-day, 99% Value-at-Risk 110 77 95 43 16 94 83 13
1 As a result of the decision to fair value substantially all of our loan portfolio, as of the beginning of 1Q07, the revenues from our loan portfolio are included in our business results,primarily in fixed income trading.

22
equity trading results were driven by very good performance inour cash, proprietary trading, derivatives and prime servicesbusinesses. Our fixed income trading results were strongdespite the challenging market environment, including theimpact of the dislocation in the US subprime mortgage market.Fixed income results were driven by our structured products,including commercial mortgage-backed securities, leveragedfinance, emerging markets trading and currency trading busi-nesses. Our debt underwriting revenues remained strong,driven by our leveraged finance franchise, which benefitedfrom active markets, and was supported by our strong clientrelationships with financial sponsors.
We continued to make progress on our cost managementinitiatives, as general and administrative expenses remainedflat compared to 1Q07, despite increased revenues. Com-pared to 2Q06, general and administrative expenses declinedCHF 131 million, or 14%, excluding the impact of the creditsfrom insurance settlements in 2Q06. This decline reflected alower fixed cost run-rate despite increased business activity.
Performance indicators
Pre-tax income margin (KPI)
Our mid-term goal is a pre-tax income margin of 30% orgreater. The 2Q07 pre-tax income margin was 33.2% com-pared to 29.0% in 2Q06 and 30.2% in 1Q07.
Compensation/revenue ratio
The 2Q07 compensation/revenue ratio was 51.5% comparedto 53.5% in 2Q06 and 51.5% in 1Q07.
Value-at-Risk
The 2Q07 average one-day, 99% Value-at-Risk (VaR) wasCHF 110 million compared to CHF 95 million in 2Q06 and
CHF 77 million in 1Q07. The increase in VaR was due prima-rily to increased equity exposure. The one-day, 99% VaR wasCHF 96 million as of the end of 1Q07, reached a maximum ofCHF 141 million during 2Q07, and was subsequently reducedto CHF 101 million as of the end of 2Q07. The VaR develop-ment during 2Q07 was in line with market opportunities whilemaintaining a disciplined approach to risk management. Forfurther information on VaR for Credit Suisse, refer to “RiskManagement.”
Pre-tax return on average utilized economic capital
The 2Q07 pre-tax return on average utilized economic capitalwas 58.5% compared to 34.1% in 2Q06 and 45.8% in 1Q07.
Significant transactions and achievements
We executed a number of significant transactions in 2Q07,reflecting the breadth and diversity of our investment bankingfranchise:p Debt capital markets: We arranged key financings for a
diverse set of clients, including Corus Group PLC (globalsteel company), Community Health Systems Inc. (US hos-pital operator) and Rank Group Holdings Ltd. (NewZealand-based financial sponsor).
p Equity capital markets: We executed the largest acceler-ated share repurchase ever for IBM Corporation (US infor-mation technology company) and the initial public offeringsfor Blackstone Group (US private equity firm) and BelleInternational Holdings (Chinese retailer). In addition, weled the first-ever initial public offering of a microfinanceinstitution, Banco Compartamos, S.A., in Mexico. For fur-ther information, refer to “Landmark transaction in micro-finance” on page 16.
p Mergers & acquisitions: We advised on a number of keytransactions that were announced in 2Q07, including theacquisition of Intelsat Ltd. (global provider of satellite serv-ices) by an investor group led by BC Partners, WachoviaCorporation’s (US financial institution) acquisition of A.G.Edwards (US retail broker) and the acquisition of Con-verium Holding (Swiss reinsurer) by Scor Group (Frenchreinsurer).
We received several industry awards in 2Q07 and expandedour ability to serve certain geographic and product markets: p Credit Suisse was ranked number one for the second con-
secutive year as the broker of choice for direct marketaccess and algorithmic trading tools in the European buy-side trading poll conducted by Financial News, the UnitedKingdom (UK) trade publication.
40
30
20
10
0
(10)
(20)
in % 2Q2005 2006 2007
2Q 3Q 4Q 1Q 2Q 3Q 4Q 1Q
Pre-tax income margin

Investment Banking
Core Results
23
p Credit Suisse was recognized as M&A advisor on fourlandmark transactions by Acquisitions Monthly magazine, aleading trade publication owned by Thomson Financial, inits annual awards edition. Recognizing our advisory expert-ise across a range of sectors and countries, the magazinecited Credit Suisse in more categories than any otherinvestment bank.
p We commenced our stock-broking operation in India as ofthe end of March 2007. Credit Suisse Securities (India)Private Ltd. holds a stock-broker license on the BombayStock Exchange and the National Stock Exchange. This isa significant step in our efforts to establish Credit Suisseas a premier financial services franchise in one of thefastest-growing markets in the world.
p We acquired Baran Securities, a Turkish broker-dealer, inMay 2007. As a result, we now hold a full broker-dealerlicense on the Istanbul Stock Exchange and can offerclients expanded equity sales, trading and research inTurkey. This acquisition extends our global emerging mar-kets franchise to an important and growing market.
p We announced a 9.9% investment in EcoSecurities GroupPLC in June 2007. EcoSecurities is one of the world’sleading companies in the business of originating, imple-menting and commercializing carbon credits from green-house gas emission reduction projects. This transactionexpands our leadership in the high-growth carbon marketsand underscores our commitment to the continued build-out of our commodities platform.
Results detail
The following provides a comparison of our 2Q07 results ver-sus 2Q06 (YoY) and versus 1Q07 (QoQ).
Net revenues
Debt underwritingYoY: Up 16% from CHF 613 million to CHF 713 million
The results primarily reflected a strong performance in lever-aged finance, which benefited from active markets, thestrength of our syndicated lending business, higher levels ofhigh-yield debt issuance and improved high-yield marketshare. The increase in revenues was driven by higher lever-aged finance revenues, partly offset by lower revenues in thestructured products businesses due to the impact of the dislo-cation in the US subprime mortgage market that began in late1Q07.QoQ: Down 2% from CHF 725 million to CHF 713 million
The decrease primarily reflected lower underwriting revenuesin the leveraged finance and emerging markets businesses,offset in part by higher revenues from the structured productsbusinesses.
Equity underwritingYoY: Up 32% from CHF 313 million to CHF 413 million
The increase was due primarily to higher levels of industry-wide equity issuance, including increases in initial public offer-ings, follow-ons and convertible issuances, as well asimproved market share.
League table positions
in / end of
2Q07 6M07 2006 2005
League table rank / market share (%) 1
Global fee pool 2 6 / 6% 5 / 6% 4 / 6% 7 / 5%
High-yield 3 3 / 11% 2 / 11% 3 / 12% 3 / 11%
Investment grade 3 16 / 3% 13 / 3% 13 / 3% 10 / 4%
Asset-backed 3 11 / 5% 11 / 4% 8 / 5% – / –%
Mortgage-backed 3 4 / 7% 4 / 6% 5 / 7% – / –%
Total debt underwriting 3 10 / 4% 8 / 4% 8 / 5% 6 / 5%
IPO 2 6 / 6% 8 / 6% 4 / 7% 1 / 10%
Follow-on 2 5 / 7% 4 / 7% 7 / 6% 10 / 3%
Convertible 2 8 / 6% 6 / 7% 11 / 4% 10 / 4%
Total equity underwriting 2 7 / 7% 8 / 7% 7 / 6% 8 / 5%
Announced mergers and acquisitions 3 8 / 21% 8 / 22% 6 / 19% 10 / 11%
Completed mergers and acquisitions 3 7 / 14% 6 / 20% 8 / 15% 8 / 14%
1 Volume-based, except Global fee pool 2 Dealogic 3 Thomson Financial

QoQ: Up 33% from CHF 311 million to CHF 413 million
The increase was due primarily to a higher level of industry-wide equity issuance.
Advisory and other feesYoY: Up 56% from CHF 405 million to CHF 632 million
The results were due to significantly higher mergers andacquisitions activity and higher market share in announced andcompleted transactions over the past several quarters.QoQ: Up 24% from CHF 511 million to CHF 632 million
The increase was driven primarily by higher mergers andacquisitions activity and higher revenues from the private fundgroup, which had seasonally lower revenues in 1Q07. The pri-vate fund group raises capital for hedge funds, private equityand real estate funds.
Fixed income trading YoY: Up 69% from CHF 1,939 million to CHF 3,282 million
Record revenues primarily reflected good market opportunitiesacross various fixed income businesses. The increase in rev-enues was driven primarily by higher revenues in the leveragedfinance, most structured products, including commercial mort-gage-backed securities, emerging markets trading and cur-rency trading businesses. The fixed income proprietary tradingbusiness improved from a weak 2Q06. The leveraged financebusiness benefited from our strength in the syndicated lendingmarket and increased supply in the high-yield new issue mar-ket. These results were partially offset by lower revenues inthe residential mortgage-backed securities business as aresult of lower origination volumes and lower valuations follow-ing the dislocation in the US subprime mortgage market thatstarted in late 1Q07. QoQ: Up 18% from CHF 2,772 million to CHF 3,282 million
The increase in revenues was driven primarily by higher rev-enues in the structured products, including commercial andresidential mortgage-backed securities, currency trading,leveraged finance and proprietary trading businesses. Theseresults were partly offset by lower revenues in the high-grade,commodities and interest rate products businesses.
Equity trading YoY: Up 116% from CHF 1,146 million to CHF 2,475 million
Record revenues reflected strong results amid favorable equitymarkets across our cash, proprietary trading, derivatives andprime services businesses. The increase primarily includedhigher revenues in equity proprietary trading, which generatedstrong results across most strategies and regions. The cashbusiness also recorded higher revenues, due to increased dealactivity and client flows, as well as the continued strong per-formance of Advanced Execution Services, our algorithmic
trading service, which is part of our electronic trading platform.Equity derivatives performed well and had higher revenuescompared to 2Q06. Prime services revenues increased as itsglobal platform benefited from growth in client balances andnew client mandates. The convertibles business recorded agood performance as the markets improved compared to2Q06. QoQ: Up 14% from CHF 2,171 million to CHF 2,475 million
The increase was driven primarily by higher revenues from theequity derivatives and prime services businesses.
OtherYoY: Up 15% from CHF 20 million to CHF 23 million
The increase was due primarily to higher gains from private-equity related investments not managed as part of Asset Man-agement.QoQ: Down 75% from CHF 92 million to CHF 23 million
The decrease was due primarily to lower gains from private-equity related investments not managed as part of Asset Man-agement.
Provision for credit losses
YoY: Down 44% from CHF 16 million to CHF 9 million
The decrease reflected the continued stable credit environ-ment in 2Q07. The benign credit environment is not expectedto continue, which may result in a modest increase in new pro-vision levels toward the end of 2007. QoQ: Down 85% from CHF 61 million to CHF 9 million
The decrease was due primarily to increased reserves in 1Q07related to the emerging markets loan portfolio.
Operating expenses
Compensation and benefitsYoY: Up 64% from CHF 2,374 million to CHF 3,882 million
The increase was due primarily to higher performance-relatedcompensation reflecting higher revenues. The compensation/revenue ratio of 51.5% in 2Q07 was the same as 1Q07 andlower than 53.5% in 2Q06. For 2007, compensation and ben-efits expense is targeted at 51.5% of net revenues, with dis-cretionary bonus representing a significant portion of the totalamount. Compensation and benefits for a given year aredetermined by the strength and breadth of business results,staffing levels and the impact of share-based compensationprograms.QoQ: Up 15% from CHF 3,390 million to CHF 3,882 million
The increase was due primarily to higher performance-relatedcompensation reflecting higher revenues.
24

Investment Banking
Core Results
25
General and administrative expenses
YoY: Up 75% from CHF 460 million to CHF 803 million
The increase reflected the 2Q06 credits from insurance settle-ments of CHF 474 million. Excluding these credits, generaland administrative expenses declined CHF 131 million, or14%, reflecting our continued focus on cost management.QoQ: Down 3% from CHF 827 million to CHF 803 million
The decrease reflected a decline in most general and adminis-trative expenses as a result of our continued focus on costmanagement, particularly professional fees and travel andentertainment expenses, offset in part by higher provisions, as1Q07 included releases for legal fees. We continued to man-
age our expenses downward in an environment in which weactively grew our business.
Commission expensesYoY: Up 14% from CHF 299 million to CHF 342 million
The increase was driven by higher business volumes.QoQ: Up 9% from CHF 314 million to CHF 342 million
The increase was driven by higher business volumes.
Personnel
The increase was driven primarily by broad-based front officerecruitment in fixed income, equity and investment banking.
Leading position in algorithmic tradingDuring 2Q07, Credit Suisse ranked firstfor the second consecutive year as thebroker of choice for direct market accessand algorithmic trading tools in a poll con-ducted by the UK trade publication Finan-cial News. This reflects the superior valueproposition of Advanced Execution Ser-vices (AES), our algorithmic trading plat-form, which has posted double or tripledigit growth rates every year since itslaunch in 2001. Algorithmic trading madeup nearly a third of US equity trading vol-ume in 2006 and could reach more thanhalf of all US equity trading by 2010,according to Aite Group.
AES meets the growing need amongmoney managers to trade more efficientlyat lower costs, while achieving better exe-cution performance. The increasedappetite among our clients to adopt newand innovative trading solutions reflectsthe increasingly widespread recognitionthat trading style can be a major contribu-tor to fund performance. The sustainedregulatory focus on issues such as bestexecution and unbundling, the resultingchanges in market structure and theemergence of new liquidity pools are alsodriving the use of algorithmic trading.
AES is a collection of algorithmic tradingstrategies used by clients of Credit Suisseto facilitate global securities trading. Thetool is based on the concept of “black box”trading, which means the system is pro-grammed to “think” and “behave” like atrader. The quantitative algorithms used byAES across the various asset classes andcountries are all customized for thenuances of the respective individual mar-ket, but they make use of the same coreconcepts. The algorithms process real-time stock, option and foreign exchangeprices and compute the optimal trade inthe security with subsecond iterations.Consequently, AES helps clients reducemarket impact, improve execution per-formance versus a range of trading bench-marks and add consistency to their trad-ing. Since the system is fully automated,AES also accelerates business transac-tions and minimizes costs.
AES executes trades in multiple assetclasses, such as equities, futures, foreignexchange and listed options, on a confi-dential and automated basis. The key dif-ference between an AES trade and a tra-ditional trade is that there is no informationleakage. The service is therefore ideal fortrading positions when our clients want toremove the risk that others in the market
place could learn about the positions theyare buying or selling. About 1,400 clients,mostly large institutions and hedge funds,currently use our AES platform. But AESalso serves a growing number of broker-dealers, pension funds, endowment funds,private banks and private clients. AES isavailable in 32 countries on more than 40stock exchanges.
Innovation remains one of the greateststrengths of AES. The algorithms used areconstantly refined by our quantitativeresearchers, who have backgrounds inphysics, econometrics, mathematics andcomputer science. The team is continu-ously improving the algorithms and search-ing for ways to make trade executionsmarter, faster and cheaper. The industrycontinues to acknowledge Credit Suisse’sleadership in algorithmic trading. In aFinancial News poll of 100 Europeaninvesting institutions with a combined 3.4trillion Euros of assets under management,AES ranked first for both algorithmic trad-ing and direct market access services. TheExtel Thomson European 2007 equity sur-vey also ranked AES first in all three elec-tronic trading categories. This follows onfrom 2006 when AES ranked first in avariety of independent surveys conducted.
26
Private Banking 2Q07 was marked by an overall favorable economic environment. For the first time, assets under management exceeded CHF 1.0 trillion. Income from continuing operations before taxes was CHF 1,381 million, up CHF 258 million, or 23%, from 2Q06.
Results
in / end of % change in / end of % change
2Q07 1Q07 2Q06 QoQ YoY 6M07 6M06 YoY
Statements of income (CHF million)
Net revenues 3,353 3,366 2,913 0 15 6,719 6,023 12
Provision for credit losses (29) (7) (5) 314 480 (36) (13) 177
Compensation and benefits 1,127 1,152 1,020 (2) 10 2,279 2,091 9
General and administrative expenses 660 569 594 16 11 1,229 1,145 7
Commission expenses 214 213 181 0 18 427 369 16
Total other operating expenses 874 782 775 12 13 1,656 1,514 9
Total operating expenses 2,001 1,934 1,795 3 11 3,935 3,605 9
Income from continuing operations before taxes 1,381 1,439 1,123 (4) 23 2,820 2,431 16
Statement of income metrics (%)
Compensation/revenue ratio 33.6 34.2 35.0 – – 33.9 34.7 –
Non-compensation/revenue ratio 26.1 23.2 26.6 – – 24.6 25.1 –
Cost/income ratio 59.7 57.5 61.6 – – 58.6 59.9 –
Pre-tax income margin 41.2 42.8 38.6 – – 42.0 40.4 –
Utilized economic capital and return
Average utilized economic capital (CHF million) 4,402 4,414 5,069 0 (13) 4,444 5,237 (15)
Pre-tax return on average utilized economic capital (%) 1 126.5 131.3 90.2 – – 127.8 94.3 –
Net revenue detail (CHF million)
Net interest income 1,160 1,174 1,050 (1) 10 2,334 2,016 16
Total non-interest income 2,193 2,192 1,863 0 18 4,385 4,007 9
Net revenues 3,353 3,366 2,913 0 15 6,719 6,023 12
Balance sheet statistics (CHF million)
Total assets 359,903 342,254 316,391 5 14 359,903 316,391 14
Net loans 173,614 166,273 160,013 4 8 173,614 160,013 8
Goodwill 797 791 781 1 2 797 781 2
Number of employees (full-time equivalents)
Number of employees 22,400 22,400 21,900 0 2 22,400 21,900 2
1 Calculated using a return excluding interest costs for allocated goodwill.
Private Banking
Core Results
27
During 2Q07, we continued our geographic expansion,enhanced our talent pool and continued to drive product inno-vation. Income from continuing operations before taxes wasCHF 1,381 million, up CHF 258 million, or 23%, compared to2Q06. Net revenues were CHF 3,353 million, up CHF 440million, or 15%, reflecting the positive market conditions.Asset-based commissions and fees grew as a result of thestrong increase in our assets under management, particularlyin managed assets. Transaction-based revenues were alsohigher, most notably in brokerage fees and product issuingfees. Net interest income benefited mainly from lower fundingcosts as well as higher liability volumes and margins, whileasset margins still faced ongoing market pressure. Provisionfor credit losses resulted in net releases of CHF 29 million,mainly in relation to the resolution of a single exposure in ourCorporate & Retail Banking business, compared to netreleases of CHF 5 million in 2Q06. Total operating expenseswere CHF 2,001 million, up CHF 206 million, or 11%, com-pared to 2Q06. This increase was mainly driven by increasedpersonnel and business expenses related to the internationalexpansion in our Wealth Management business, higher per-formance-related compensation in line with the improvedresults, higher commission expenses and expenses related tominority interests of a consolidated joint venture in our Corpo-rate & Retail Banking business.
Assets under management of CHF 1.0 trillion grew CHF157.1 billion, or 18%, from 2Q06, reflecting positive marketand foreign-exchange related movements and net new assetinflows. Net new assets were CHF 8.9 billion in 2Q07, downfrom CHF 16.6 billion in 2Q06. Our Wealth Management busi-ness reported CHF 13.3 billion of net new assets, but ourCorporate & Retail Banking business reported an outflow ofCHF 4.4 billion, mainly due to a single client in its institutionalpension fund business.
Compared to the strong 1Q07, income from continuingoperations before taxes was down CHF 58 million, or 4%. Netrevenues were flat, as higher asset-based commissions andfees and the impact of higher liability margins were offset bylower transaction-based revenues, reflecting more cautiousclient behavior. Total operating expenses were up CHF 67 mil-lion, or 3%. Compensation and benefits were down slightlydue to lower performance-related compensation, but totalother operating expenses increased, mainly due to releases ofnon-credit related provisions in 1Q07 in our Corporate & RetailBanking business and higher marketing and sales expenses.
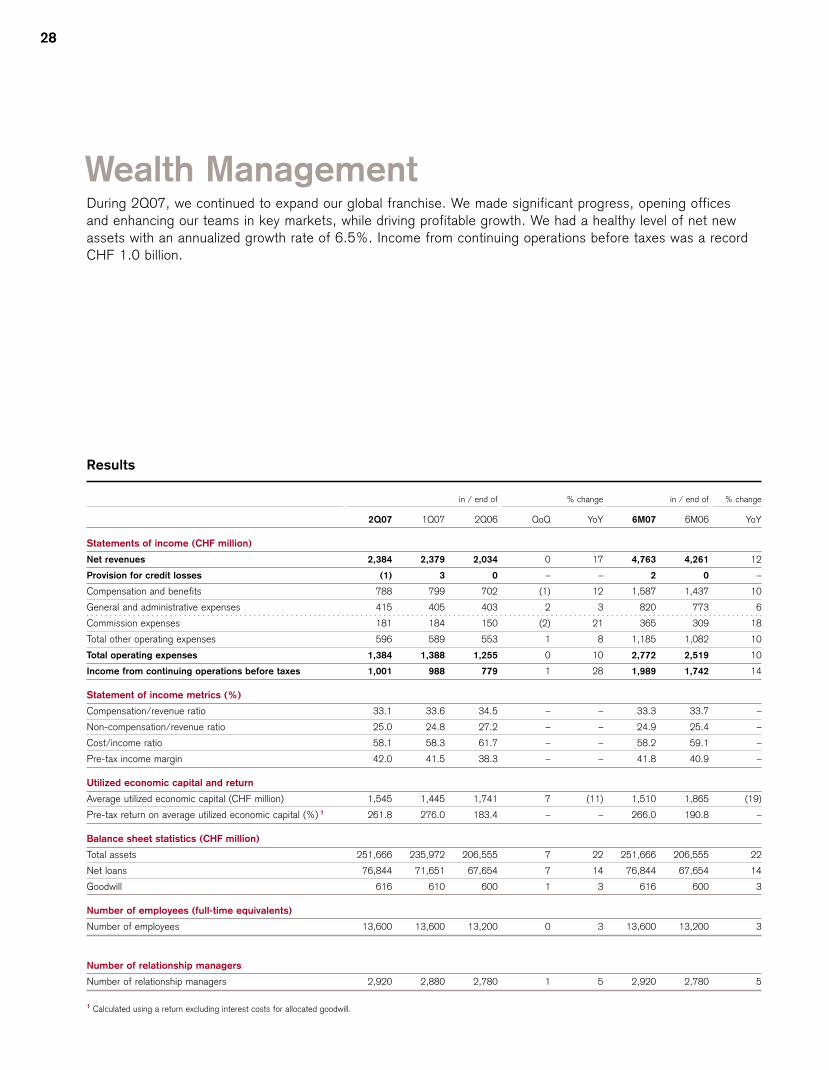
28
Wealth ManagementDuring 2Q07, we continued to expand our global franchise. We made significant progress, opening offices and enhancing our teams in key markets, while driving profitable growth. We had a healthy level of net newassets with an annualized growth rate of 6.5%. Income from continuing operations before taxes was a recordCHF 1.0 billion.
Results
in / end of % change in / end of % change
2Q07 1Q07 2Q06 QoQ YoY 6M07 6M06 YoY
Statements of income (CHF million)
Net revenues 2,384 2,379 2,034 0 17 4,763 4,261 12
Provision for credit losses (1) 3 0 – – 2 0 –
Compensation and benefits 788 799 702 (1) 12 1,587 1,437 10
General and administrative expenses 415 405 403 2 3 820 773 6
Commission expenses 181 184 150 (2) 21 365 309 18
Total other operating expenses 596 589 553 1 8 1,185 1,082 10
Total operating expenses 1,384 1,388 1,255 0 10 2,772 2,519 10
Income from continuing operations before taxes 1,001 988 779 1 28 1,989 1,742 14
Statement of income metrics (%)
Compensation/revenue ratio 33.1 33.6 34.5 – – 33.3 33.7 –
Non-compensation/revenue ratio 25.0 24.8 27.2 – – 24.9 25.4 –
Cost/income ratio 58.1 58.3 61.7 – – 58.2 59.1 –
Pre-tax income margin 42.0 41.5 38.3 – – 41.8 40.9 –
Utilized economic capital and return
Average utilized economic capital (CHF million) 1,545 1,445 1,741 7 (11) 1,510 1,865 (19)
Pre-tax return on average utilized economic capital (%) 1 261.8 276.0 183.4 – – 266.0 190.8 –
Balance sheet statistics (CHF million)
Total assets 251,666 235,972 206,555 7 22 251,666 206,555 22
Net loans 76,844 71,651 67,654 7 14 76,844 67,654 14
Goodwill 616 610 600 1 3 616 600 3
Number of employees (full-time equivalents)
Number of employees 13,600 13,600 13,200 0 3 13,600 13,200 3
Number of relationship managers
Number of relationship managers 2,920 2,880 2,780 1 5 2,920 2,780 5
1 Calculated using a return excluding interest costs for allocated goodwill.

Private Banking
Core Results
29
Operating environment
The economic environment remained healthy during 2Q07.Equity markets maintained their upward trend, although withhigher volatility towards the end of the quarter. Clients weremore cautious compared to 1Q07. Sales volumes of invest-ment products were higher versus 2Q06 and at the same highlevels achieved in 1Q07. The positive market developmentsince 2Q06 helped to support the strong growth in assetsunder management as well as higher asset- and transaction-based commissions and fees income during 2Q07.
Results summary
In 2Q07, income from continuing operations before taxes wasCHF 1,001 million, up CHF 222 million, or 28%, compared to2Q06. Net revenues were CHF 2,384 million, up CHF 350million, or 17%, driven by strong improvement in both recur-ring and transaction-based revenues. Recurring revenues,which were 64% of net revenues, increased CHF 237 million,or 19%, reflecting higher asset-based commissions and fees,particularly from managed assets, as well as higher net inter-est income, mainly from lower funding costs. Transaction-based revenues increased CHF 113 million, or 15%, reflectinghigher brokerage and product issuing fees. Total operating
expenses were CHF 1,384 million, up CHF 129 million, or10%. The 12% increase in compensation and benefitsreflected the ongoing strategic investment in the global fran-chise and higher performance-related compensation in linewith improved results. Total other operating expenses grew8%, primarily driven by higher commission expenses andregional front and back office infrastructure costs due to theinternational expansion in strategic growth markets. Net newassets were CHF 13.3 billion, driven by particularly strong netinflows from Europe and the Americas.
Compared to 1Q07, income from continuing operationsbefore taxes was up CHF 13 million, or 1%. Net revenueswere up CHF 5 million, as transaction-based revenues slightlyincreased while recurring revenues were stable. Compensa-tion and benefits and total other operating expenses were flat.
We have capitalized on the ongoing favorable operatingenvironment and have delivered profitable growth while stillmaking investments to expand and strengthen our global fran-chise.
Results (continued)
in / end of % change in / end of % change
2Q07 1Q07 2Q06 QoQ YoY 6M07 6M06 YoY
Net revenue detail (CHF million)
Net interest income 1 582 584 517 0 13 1,166 975 20
Total non-interest income 1,802 1,795 1,517 0 19 3,597 3,286 9
Net revenues 2,384 2,379 2,034 0 17 4,763 4,261 12
Net revenue detail (CHF million)
Recurring 1,517 1,517 1,280 0 19 3,034 2,586 17
Transaction-based 867 862 754 1 15 1,729 1,675 3
Net revenues 2,384 2,379 2,034 0 17 4,763 4,261 12
Gross and net margin on assets under management (bp)
Recurring 72 75 71 – – 74 72 –
Transaction-based 41 43 42 – – 42 47 –
Gross margin 113 118 113 – – 116 119 –
Net margin (pre-tax) 48 49 43 – – 48 49 –
1 Substantially all net interest income is included in recurring revenues.
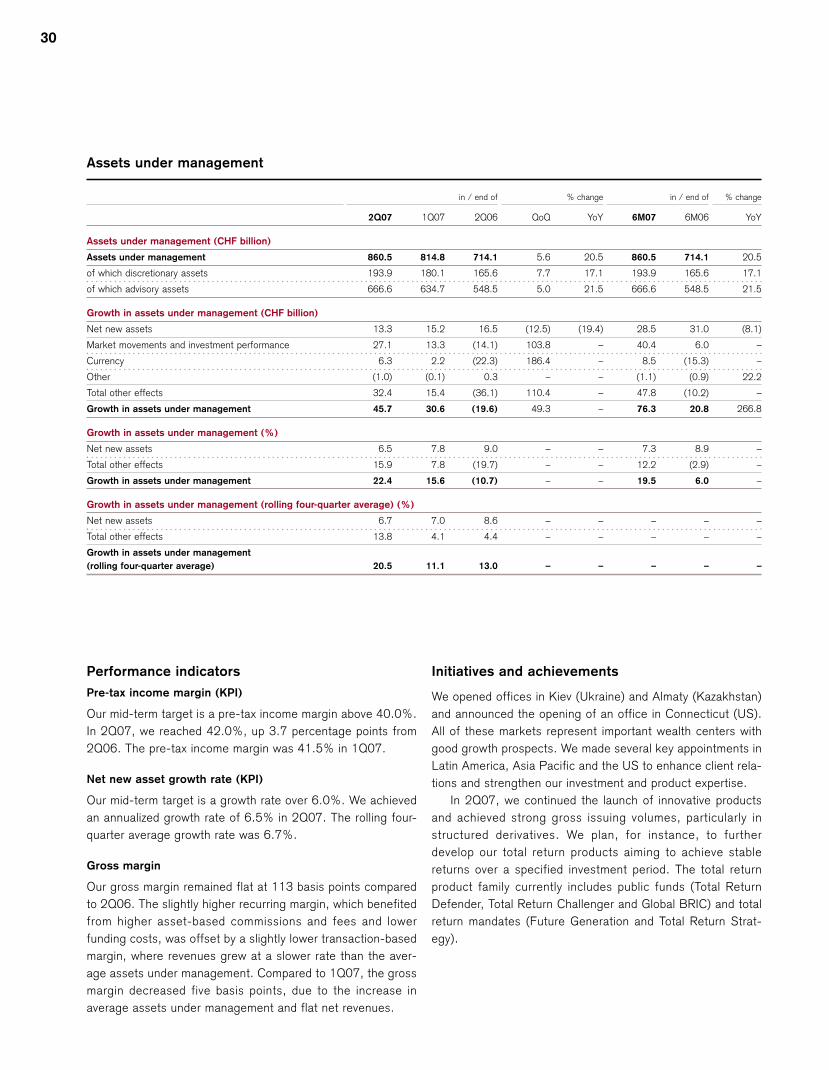
30
Performance indicatorsPre-tax income margin (KPI)
Our mid-term target is a pre-tax income margin above 40.0%.In 2Q07, we reached 42.0%, up 3.7 percentage points from2Q06. The pre-tax income margin was 41.5% in 1Q07.
Net new asset growth rate (KPI)
Our mid-term target is a growth rate over 6.0%. We achievedan annualized growth rate of 6.5% in 2Q07. The rolling four-quarter average growth rate was 6.7%.
Gross margin
Our gross margin remained flat at 113 basis points comparedto 2Q06. The slightly higher recurring margin, which benefitedfrom higher asset-based commissions and fees and lowerfunding costs, was offset by a slightly lower transaction-basedmargin, where revenues grew at a slower rate than the aver-age assets under management. Compared to 1Q07, the grossmargin decreased five basis points, due to the increase inaverage assets under management and flat net revenues.
Initiatives and achievements
We opened offices in Kiev (Ukraine) and Almaty (Kazakhstan)and announced the opening of an office in Connecticut (US).All of these markets represent important wealth centers withgood growth prospects. We made several key appointments inLatin America, Asia Pacific and the US to enhance client rela-tions and strengthen our investment and product expertise.
In 2Q07, we continued the launch of innovative productsand achieved strong gross issuing volumes, particularly instructured derivatives. We plan, for instance, to furtherdevelop our total return products aiming to achieve stablereturns over a specified investment period. The total returnproduct family currently includes public funds (Total ReturnDefender, Total Return Challenger and Global BRIC) and totalreturn mandates (Future Generation and Total Return Strat-egy).
Assets under management
in / end of % change in / end of % change
2Q07 1Q07 2Q06 QoQ YoY 6M07 6M06 YoY
Assets under management (CHF billion)
Assets under management 860.5 814.8 714.1 5.6 20.5 860.5 714.1 20.5
of which discretionary assets 193.9 180.1 165.6 7.7 17.1 193.9 165.6 17.1
of which advisory assets 666.6 634.7 548.5 5.0 21.5 666.6 548.5 21.5
Growth in assets under management (CHF billion)
Net new assets 13.3 15.2 16.5 (12.5) (19.4) 28.5 31.0 (8.1)
Market movements and investment performance 27.1 13.3 (14.1) 103.8 – 40.4 6.0 –
Currency 6.3 2.2 (22.3) 186.4 – 8.5 (15.3) –
Other (1.0) (0.1) 0.3 – – (1.1) (0.9) 22.2
Total other effects 32.4 15.4 (36.1) 110.4 – 47.8 (10.2) –
Growth in assets under management 45.7 30.6 (19.6) 49.3 – 76.3 20.8 266.8
Growth in assets under management (%)
Net new assets 6.5 7.8 9.0 – – 7.3 8.9 –
Total other effects 15.9 7.8 (19.7) – – 12.2 (2.9) –
Growth in assets under management 22.4 15.6 (10.7) – – 19.5 6.0 –
Growth in assets under management (rolling four-quarter average) (%)
Net new assets 6.7 7.0 8.6 – – – – –
Total other effects 13.8 4.1 4.4 – – – – –
Growth in assets under management(rolling four-quarter average) 20.5 11.1 13.0 – – – – –
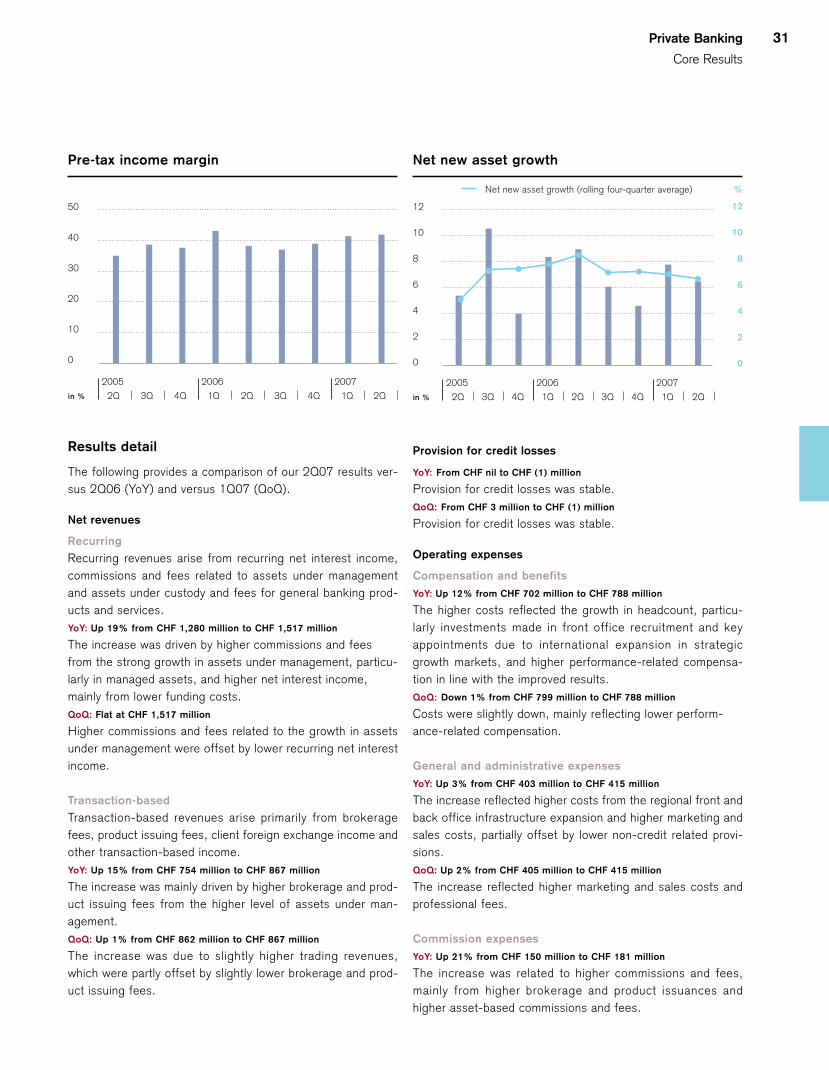
Private Banking
Core Results
31
Results detail
The following provides a comparison of our 2Q07 results ver-sus 2Q06 (YoY) and versus 1Q07 (QoQ).
Net revenues
RecurringRecurring revenues arise from recurring net interest income,commissions and fees related to assets under managementand assets under custody and fees for general banking prod-ucts and services.YoY: Up 19% from CHF 1,280 million to CHF 1,517 million
The increase was driven by higher commissions and feesfrom the strong growth in assets under management, particu-larly in managed assets, and higher net interest income,mainly from lower funding costs.QoQ: Flat at CHF 1,517 million
Higher commissions and fees related to the growth in assetsunder management were offset by lower recurring net interestincome.
Transaction-basedTransaction-based revenues arise primarily from brokeragefees, product issuing fees, client foreign exchange income andother transaction-based income.YoY: Up 15% from CHF 754 million to CHF 867 million
The increase was mainly driven by higher brokerage and prod-uct issuing fees from the higher level of assets under man-agement.QoQ: Up 1% from CHF 862 million to CHF 867 million
The increase was due to slightly higher trading revenues,which were partly offset by slightly lower brokerage and prod-uct issuing fees.
Provision for credit losses
YoY: From CHF nil to CHF (1) million
Provision for credit losses was stable. QoQ: From CHF 3 million to CHF (1) million
Provision for credit losses was stable.
Operating expenses
Compensation and benefitsYoY: Up 12% from CHF 702 million to CHF 788 million
The higher costs reflected the growth in headcount, particu-larly investments made in front office recruitment and keyappointments due to international expansion in strategicgrowth markets, and higher performance-related compensa-tion in line with the improved results.QoQ: Down 1% from CHF 799 million to CHF 788 million
Costs were slightly down, mainly reflecting lower perform-ance-related compensation.
General and administrative expenses YoY: Up 3% from CHF 403 million to CHF 415 million
The increase reflected higher costs from the regional front andback office infrastructure expansion and higher marketing andsales costs, partially offset by lower non-credit related provi-sions.QoQ: Up 2% from CHF 405 million to CHF 415 million
The increase reflected higher marketing and sales costs andprofessional fees.
Commission expensesYoY: Up 21% from CHF 150 million to CHF 181 million
The increase was related to higher commissions and fees,mainly from higher brokerage and product issuances andhigher asset-based commissions and fees.
50
40
30
20
10
0
in % 2Q2005 2006 2007
2Q 3Q 4Q 1Q 2Q 3Q 4Q 1Q
Pre-tax income margin
12
10
8
6
4
2
0
in %
12
10
8
6
4
2
0
%Net new asset growth (rolling four-quarter average)
2Q2005 2007
2Q 3Q 4Q 1Q 2Q 3Q 4Q 1Q2006
Net new asset growth
32
Key clients linked with leading specialists
As part of building a superior and trulyintegrated client offering, we completedthe roll-out of our new client coveragemodel for our top clients in Switzerland in2Q07. A project team started a year agoto redefine our top client approach, andnow more than 1,500 Credit Suisseemployees are part of the newly estab-lished delivery teams. They ensure thatour most important private and corporateclients are served with need-based solu-tions matching their expectations. Thisproject complements a similar initiativealready implemented for our global topclients, and the new client coverage modelwill be rolled out in other markets in themonths to come.
Each key client has been assigned to across-divisional Client Coverage Teammade up of five roles: the Senior Manage-ment Client Sponsor, a Key Account Man-ager, Relationship Manager, Product &Solution Specialists and a Credit Risk
Representative. The clients are conse-quently offered one-stop access to ourinvestment banking, private banking andasset management expertise through theirClient Coverage Team. One of the ClientCoverage Team’s main tasks was to setup cross-divisional business plans forevery top client. These plans include aholistic analysis of the client’s current andfuture needs and concrete actions toensure that we serve the client by provid-ing our integrated services. This structuredapproach also prevents double-trackingand uncoordinated client advisory activitieswhile creating synergies among investmentbanking, private banking and asset man-agement.
This new approach requires our employeesand teams to use “client-centric thinking.”We continue to build a culture of cross-divisional collaboration to better serve ourclients and to reach our goal of becomingthe world’s premier bank. The market-
leading knowledge and the resources ofour global organization are made availableto our clients and create untapped busi-ness potential for Credit Suisse. Goodexamples of cross-selling opportunitiesinclude hedging solutions of institutionalequity exposures, investment swap pro-posals for corporate clients or privateinvestment solutions offered to entrepre-neurs for the proceeds from the sale oftheir businesses.
One year after setting up the first ClientCoverage Teams, we have made signifi-cant and measurable progress in servingour clients in an even better, easier andfaster way, resulting in greater revenuegrowth for Credit Suisse. With theseencouraging results, we are optimisticabout capturing the cross-divisional poten-tial within the three other regions of CreditSuisse as we continue to roll out this newclient coverage model.
QoQ: Down 2% from CHF 184 million to CHF 181 million
The decrease reflected lower transaction-based commissionsand fees.
Personnel
We continued to attract top talent, particularly additional rela-tionship managers for our onshore operations. The number ofrelationship managers increased by approximately 140 sincethe end of 2Q06 and 40 since the end of 1Q07. The largestgrowth was in key markets in Asia, Eastern Europe and theMiddle East, where we built up teams in response to marketdemand and growth prospects.
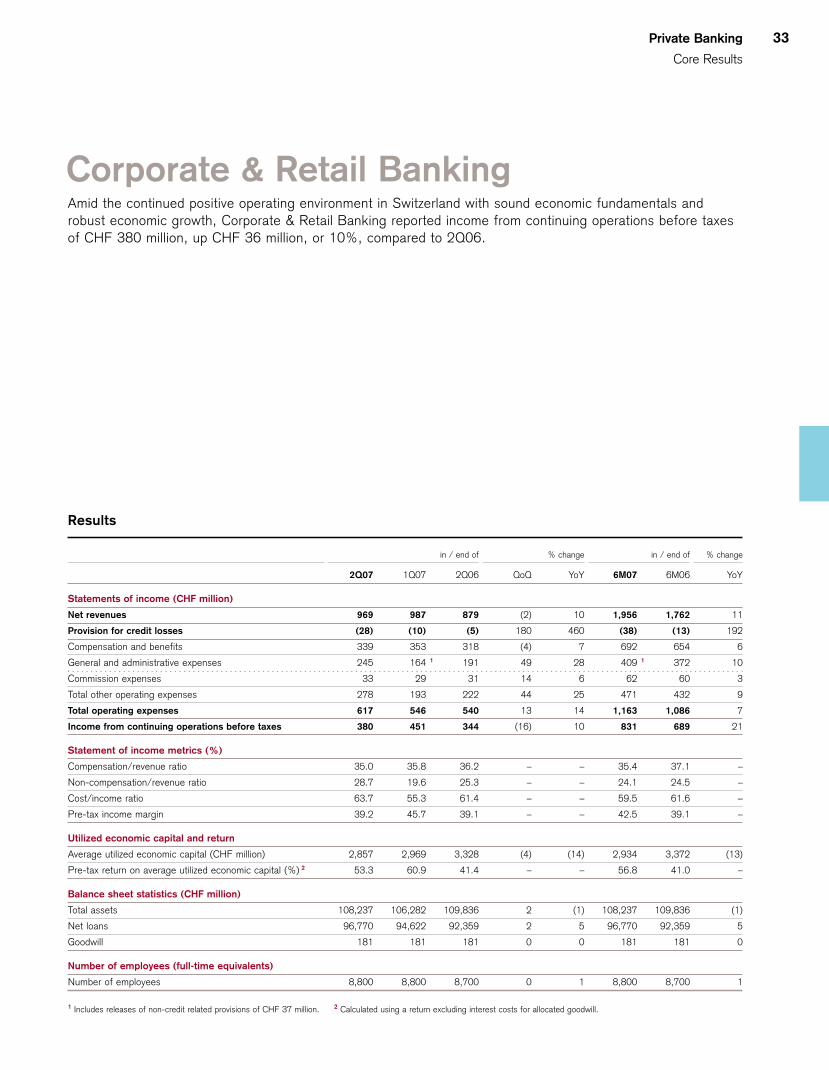
Private Banking
Core Results
33
Corporate & Retail BankingAmid the continued positive operating environment in Switzerland with sound economic fundamentals androbust economic growth, Corporate & Retail Banking reported income from continuing operations before taxesof CHF 380 million, up CHF 36 million, or 10%, compared to 2Q06.
Results
in / end of % change in / end of % change
2Q07 1Q07 2Q06 QoQ YoY 6M07 6M06 YoY
Statements of income (CHF million)
Net revenues 969 987 879 (2) 10 1,956 1,762 11
Provision for credit losses (28) (10) (5) 180 460 (38) (13) 192
Compensation and benefits 339 353 318 (4) 7 692 654 6
General and administrative expenses 245 164 1 191 49 28 409 1 372 10
Commission expenses 33 29 31 14 6 62 60 3
Total other operating expenses 278 193 222 44 25 471 432 9
Total operating expenses 617 546 540 13 14 1,163 1,086 7
Income from continuing operations before taxes 380 451 344 (16) 10 831 689 21
Statement of income metrics (%)
Compensation/revenue ratio 35.0 35.8 36.2 – – 35.4 37.1 –
Non-compensation/revenue ratio 28.7 19.6 25.3 – – 24.1 24.5 –
Cost/income ratio 63.7 55.3 61.4 – – 59.5 61.6 –
Pre-tax income margin 39.2 45.7 39.1 – – 42.5 39.1 –
Utilized economic capital and return
Average utilized economic capital (CHF million) 2,857 2,969 3,328 (4) (14) 2,934 3,372 (13)
Pre-tax return on average utilized economic capital (%) 2 53.3 60.9 41.4 – – 56.8 41.0 –
Balance sheet statistics (CHF million)
Total assets 108,237 106,282 109,836 2 (1) 108,237 109,836 (1)
Net loans 96,770 94,622 92,359 2 5 96,770 92,359 5
Goodwill 181 181 181 0 0 181 181 0
Number of employees (full-time equivalents)
Number of employees 8,800 8,800 8,700 0 1 8,800 8,700 1
1 Includes releases of non-credit related provisions of CHF 37 million. 2 Calculated using a return excluding interest costs for allocated goodwill.
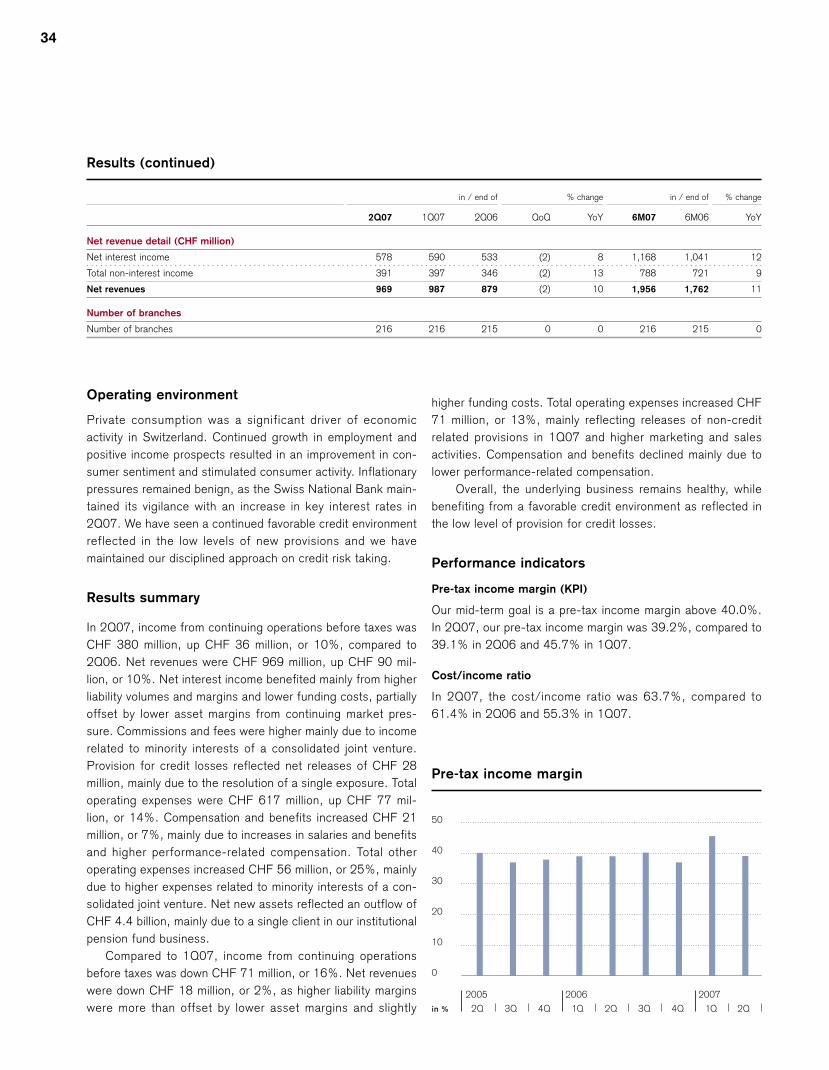
34
Operating environment
Private consumption was a significant driver of economicactivity in Switzerland. Continued growth in employment andpositive income prospects resulted in an improvement in con-sumer sentiment and stimulated consumer activity. Inflationarypressures remained benign, as the Swiss National Bank main-tained its vigilance with an increase in key interest rates in2Q07. We have seen a continued favorable credit environmentreflected in the low levels of new provisions and we havemaintained our disciplined approach on credit risk taking.
Results summary
In 2Q07, income from continuing operations before taxes wasCHF 380 million, up CHF 36 million, or 10%, compared to2Q06. Net revenues were CHF 969 million, up CHF 90 mil-lion, or 10%. Net interest income benefited mainly from higherliability volumes and margins and lower funding costs, partiallyoffset by lower asset margins from continuing market pres-sure. Commissions and fees were higher mainly due to incomerelated to minority interests of a consolidated joint venture.Provision for credit losses reflected net releases of CHF 28million, mainly due to the resolution of a single exposure. Totaloperating expenses were CHF 617 million, up CHF 77 mil-lion, or 14%. Compensation and benefits increased CHF 21million, or 7%, mainly due to increases in salaries and benefitsand higher performance-related compensation. Total otheroperating expenses increased CHF 56 million, or 25%, mainlydue to higher expenses related to minority interests of a con-solidated joint venture. Net new assets reflected an outflow ofCHF 4.4 billion, mainly due to a single client in our institutionalpension fund business.
Compared to 1Q07, income from continuing operationsbefore taxes was down CHF 71 million, or 16%. Net revenueswere down CHF 18 million, or 2%, as higher liability marginswere more than offset by lower asset margins and slightly
higher funding costs. Total operating expenses increased CHF71 million, or 13%, mainly reflecting releases of non-creditrelated provisions in 1Q07 and higher marketing and salesactivities. Compensation and benefits declined mainly due tolower performance-related compensation.
Overall, the underlying business remains healthy, whilebenefiting from a favorable credit environment as reflected inthe low level of provision for credit losses.
Performance indicators
Pre-tax income margin (KPI)
Our mid-term goal is a pre-tax income margin above 40.0%.In 2Q07, our pre-tax income margin was 39.2%, compared to39.1% in 2Q06 and 45.7% in 1Q07.
Cost/income ratio
In 2Q07, the cost/income ratio was 63.7%, compared to61.4% in 2Q06 and 55.3% in 1Q07.
Results (continued)
in / end of % change in / end of % change
2Q07 1Q07 2Q06 QoQ YoY 6M07 6M06 YoY
Net revenue detail (CHF million)
Net interest income 578 590 533 (2) 8 1,168 1,041 12
Total non-interest income 391 397 346 (2) 13 788 721 9
Net revenues 969 987 879 (2) 10 1,956 1,762 11
Number of branches
Number of branches 216 216 215 0 0 216 215 0
50
40
30
20
10
0
in % 2Q2005 2006 2007
2Q 3Q 4Q 1Q 2Q 3Q 4Q 1Q
Pre-tax income margin
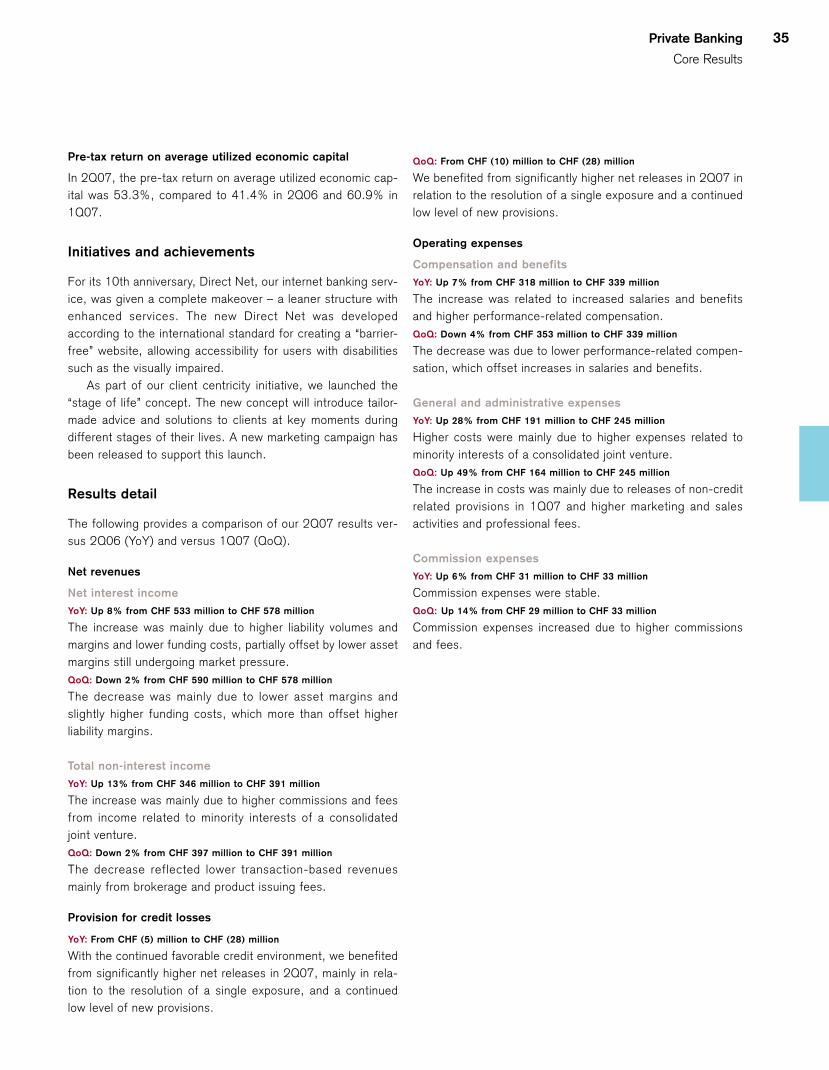
Private Banking
Core Results
35
Pre-tax return on average utilized economic capital
In 2Q07, the pre-tax return on average utilized economic cap-ital was 53.3%, compared to 41.4% in 2Q06 and 60.9% in1Q07.
Initiatives and achievements
For its 10th anniversary, Direct Net, our internet banking serv-ice, was given a complete makeover – a leaner structure withenhanced services. The new Direct Net was developedaccording to the international standard for creating a “barrier-free” website, allowing accessibility for users with disabilitiessuch as the visually impaired.
As part of our client centricity initiative, we launched the“stage of life” concept. The new concept will introduce tailor-made advice and solutions to clients at key moments duringdifferent stages of their lives. A new marketing campaign hasbeen released to support this launch.
Results detail
The following provides a comparison of our 2Q07 results ver-sus 2Q06 (YoY) and versus 1Q07 (QoQ).
Net revenues
Net interest incomeYoY: Up 8% from CHF 533 million to CHF 578 million
The increase was mainly due to higher liability volumes andmargins and lower funding costs, partially offset by lower assetmargins still undergoing market pressure. QoQ: Down 2% from CHF 590 million to CHF 578 million
The decrease was mainly due to lower asset margins andslightly higher funding costs, which more than offset higherliability margins.
Total non-interest incomeYoY: Up 13% from CHF 346 million to CHF 391 million
The increase was mainly due to higher commissions and feesfrom income related to minority interests of a consolidatedjoint venture.QoQ: Down 2% from CHF 397 million to CHF 391 million
The decrease reflected lower transaction-based revenuesmainly from brokerage and product issuing fees.
Provision for credit losses
YoY: From CHF (5) million to CHF (28) million
With the continued favorable credit environment, we benefitedfrom significantly higher net releases in 2Q07, mainly in rela-tion to the resolution of a single exposure, and a continuedlow level of new provisions.
QoQ: From CHF (10) million to CHF (28) million
We benefited from significantly higher net releases in 2Q07 inrelation to the resolution of a single exposure and a continuedlow level of new provisions.
Operating expenses
Compensation and benefitsYoY: Up 7% from CHF 318 million to CHF 339 million
The increase was related to increased salaries and benefitsand higher performance-related compensation.QoQ: Down 4% from CHF 353 million to CHF 339 million
The decrease was due to lower performance-related compen-sation, which offset increases in salaries and benefits.
General and administrative expensesYoY: Up 28% from CHF 191 million to CHF 245 million
Higher costs were mainly due to higher expenses related tominority interests of a consolidated joint venture.QoQ: Up 49% from CHF 164 million to CHF 245 million
The increase in costs was mainly due to releases of non-creditrelated provisions in 1Q07 and higher marketing and salesactivities and professional fees.
Commission expenses YoY: Up 6% from CHF 31 million to CHF 33 million
Commission expenses were stable.QoQ: Up 14% from CHF 29 million to CHF 33 million
Commission expenses increased due to higher commissionsand fees.
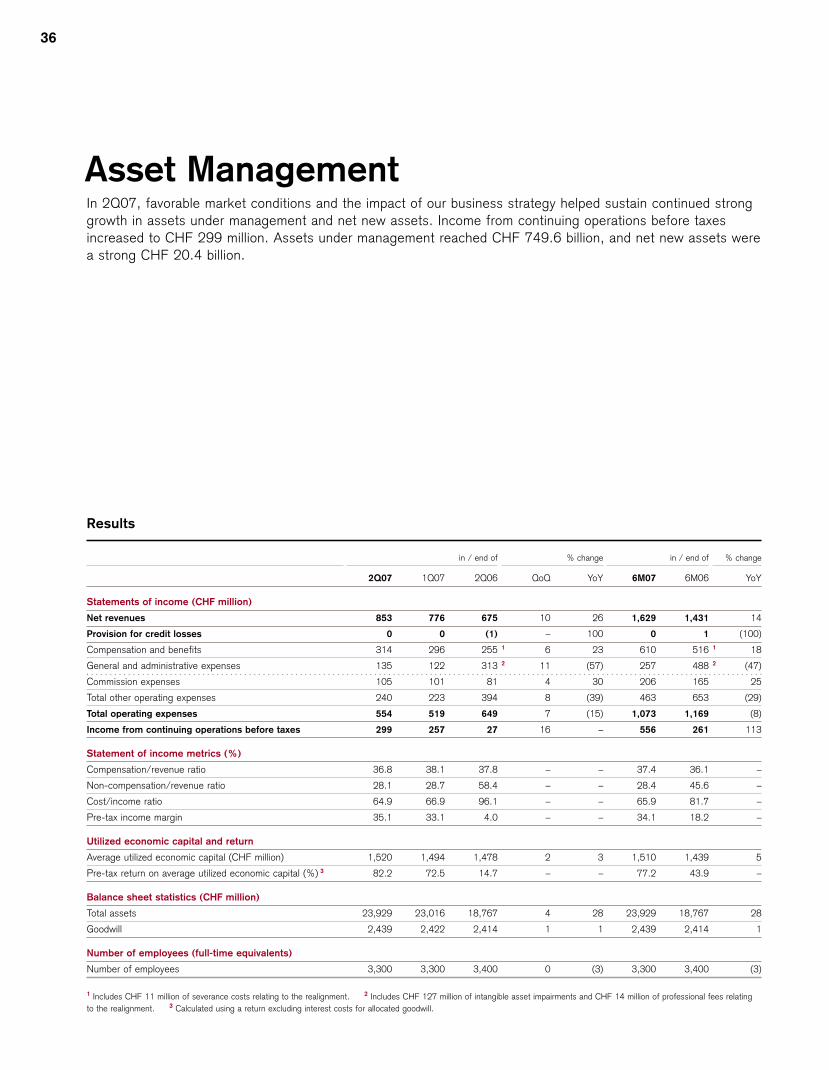
36
Asset ManagementIn 2Q07, favorable market conditions and the impact of our business strategy helped sustain continued stronggrowth in assets under management and net new assets. Income from continuing operations before taxesincreased to CHF 299 million. Assets under management reached CHF 749.6 billion, and net new assets werea strong CHF 20.4 billion.
Results
in / end of % change in / end of % change
2Q07 1Q07 2Q06 QoQ YoY 6M07 6M06 YoY
Statements of income (CHF million)
Net revenues 853 776 675 10 26 1,629 1,431 14
Provision for credit losses 0 0 (1) – 100 0 1 (100)
Compensation and benefits 314 296 255 1 6 23 610 516 1 18
General and administrative expenses 135 122 313 2 11 (57) 257 488 2 (47)
Commission expenses 105 101 81 4 30 206 165 25
Total other operating expenses 240 223 394 8 (39) 463 653 (29)
Total operating expenses 554 519 649 7 (15) 1,073 1,169 (8)
Income from continuing operations before taxes 299 257 27 16 – 556 261 113
Statement of income metrics (%)
Compensation/revenue ratio 36.8 38.1 37.8 – – 37.4 36.1 –
Non-compensation/revenue ratio 28.1 28.7 58.4 – – 28.4 45.6 –
Cost/income ratio 64.9 66.9 96.1 – – 65.9 81.7 –
Pre-tax income margin 35.1 33.1 4.0 – – 34.1 18.2 –
Utilized economic capital and return
Average utilized economic capital (CHF million) 1,520 1,494 1,478 2 3 1,510 1,439 5
Pre-tax return on average utilized economic capital (%) 3 82.2 72.5 14.7 – – 77.2 43.9 –
Balance sheet statistics (CHF million)
Total assets 23,929 23,016 18,767 4 28 23,929 18,767 28
Goodwill 2,439 2,422 2,414 1 1 2,439 2,414 1
Number of employees (full-time equivalents)
Number of employees 3,300 3,300 3,400 0 (3) 3,300 3,400 (3)
1 Includes CHF 11 million of severance costs relating to the realignment. 2 Includes CHF 127 million of intangible asset impairments and CHF 14 million of professional fees relatingto the realignment. 3 Calculated using a return excluding interest costs for allocated goodwill.
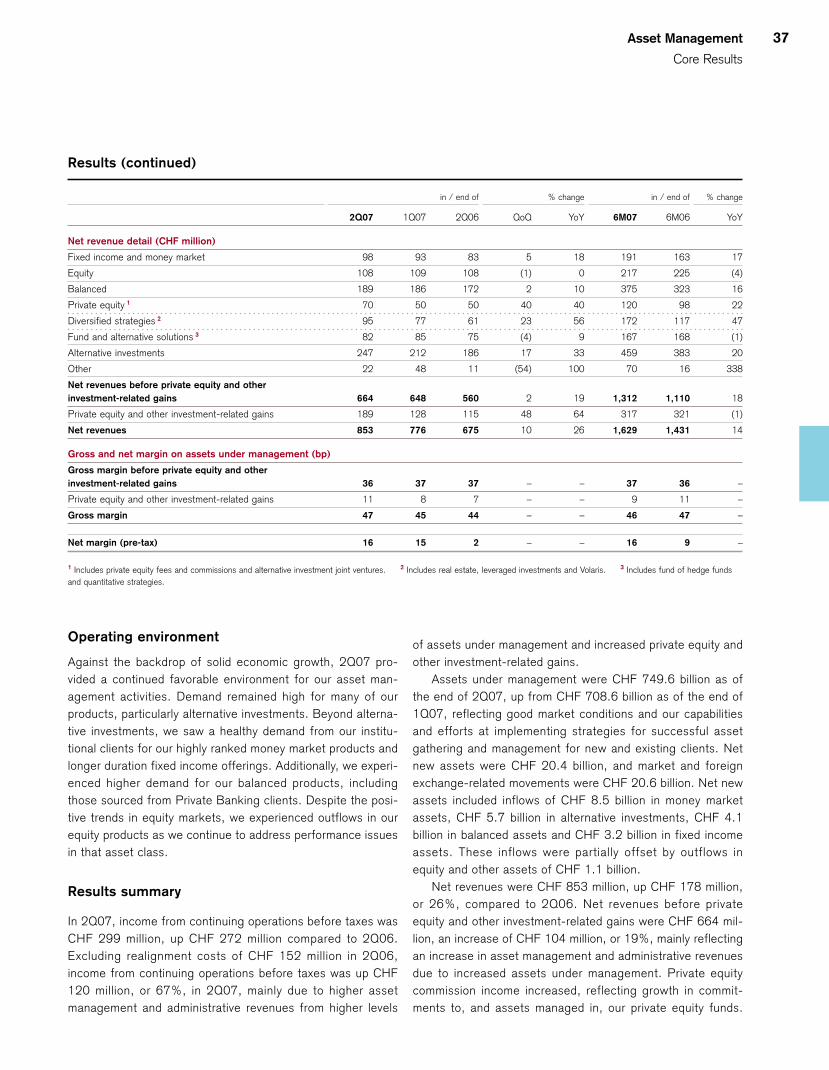
Asset Management
Core Results
37
Results (continued)
in / end of % change in / end of % change
2Q07 1Q07 2Q06 QoQ YoY 6M07 6M06 YoY
Net revenue detail (CHF million)
Fixed income and money market 98 93 83 5 18 191 163 17
Equity 108 109 108 (1) 0 217 225 (4)
Balanced 189 186 172 2 10 375 323 16
Private equity 1 70 50 50 40 40 120 98 22
Diversified strategies 2 95 77 61 23 56 172 117 47
Fund and alternative solutions 3 82 85 75 (4) 9 167 168 (1)
Alternative investments 247 212 186 17 33 459 383 20
Other 22 48 11 (54) 100 70 16 338
Net revenues before private equity and other investment-related gains 664 648 560 2 19 1,312 1,110 18
Private equity and other investment-related gains 189 128 115 48 64 317 321 (1)
Net revenues 853 776 675 10 26 1,629 1,431 14
Gross and net margin on assets under management (bp)
Gross margin before private equity and other investment-related gains 36 37 37 – – 37 36 –
Private equity and other investment-related gains 11 8 7 – – 9 11 –
Gross margin 47 45 44 – – 46 47 –
Net margin (pre-tax) 16 15 2 – – 16 9 –
1 Includes private equity fees and commissions and alternative investment joint ventures. 2 Includes real estate, leveraged investments and Volaris. 3 Includes fund of hedge fundsand quantitative strategies.
Operating environment
Against the backdrop of solid economic growth, 2Q07 pro-vided a continued favorable environment for our asset man-agement activities. Demand remained high for many of ourproducts, particularly alternative investments. Beyond alterna-tive investments, we saw a healthy demand from our institu-tional clients for our highly ranked money market products andlonger duration fixed income offerings. Additionally, we experi-enced higher demand for our balanced products, includingthose sourced from Private Banking clients. Despite the posi-tive trends in equity markets, we experienced outflows in ourequity products as we continue to address performance issuesin that asset class.
Results summary
In 2Q07, income from continuing operations before taxes wasCHF 299 million, up CHF 272 million compared to 2Q06.Excluding realignment costs of CHF 152 million in 2Q06,income from continuing operations before taxes was up CHF120 million, or 67%, in 2Q07, mainly due to higher assetmanagement and administrative revenues from higher levels
of assets under management and increased private equity andother investment-related gains.
Assets under management were CHF 749.6 billion as ofthe end of 2Q07, up from CHF 708.6 billion as of the end of1Q07, reflecting good market conditions and our capabilitiesand efforts at implementing strategies for successful assetgathering and management for new and existing clients. Netnew assets were CHF 20.4 billion, and market and foreignexchange-related movements were CHF 20.6 billion. Net newassets included inflows of CHF 8.5 billion in money marketassets, CHF 5.7 billion in alternative investments, CHF 4.1billion in balanced assets and CHF 3.2 billion in fixed incomeassets. These inflows were partially offset by outflows inequity and other assets of CHF 1.1 billion.
Net revenues were CHF 853 million, up CHF 178 million,or 26%, compared to 2Q06. Net revenues before privateequity and other investment-related gains were CHF 664 mil-lion, an increase of CHF 104 million, or 19%, mainly reflectingan increase in asset management and administrative revenuesdue to increased assets under management. Private equitycommission income increased, reflecting growth in commit-ments to, and assets managed in, our private equity funds.
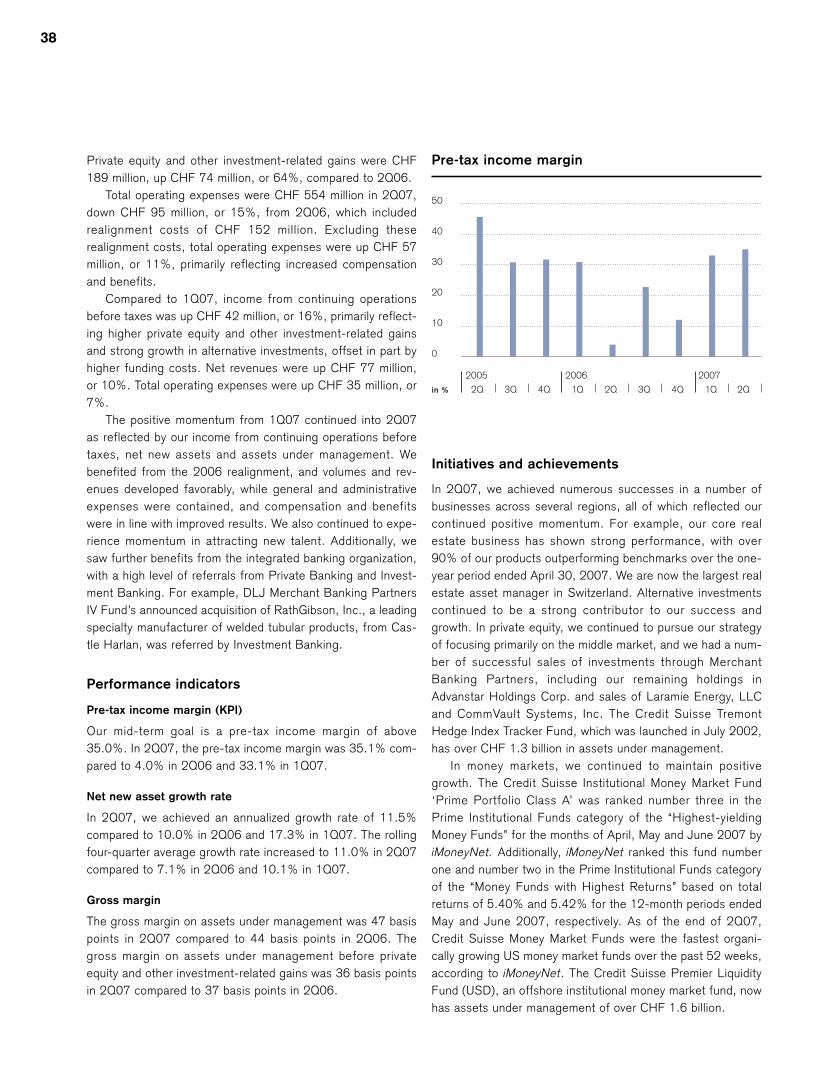
38
Private equity and other investment-related gains were CHF189 million, up CHF 74 million, or 64%, compared to 2Q06.
Total operating expenses were CHF 554 million in 2Q07,down CHF 95 million, or 15%, from 2Q06, which includedrealignment costs of CHF 152 million. Excluding theserealignment costs, total operating expenses were up CHF 57million, or 11%, primarily reflecting increased compensationand benefits.
Compared to 1Q07, income from continuing operationsbefore taxes was up CHF 42 million, or 16%, primarily reflect-ing higher private equity and other investment-related gainsand strong growth in alternative investments, offset in part byhigher funding costs. Net revenues were up CHF 77 million,or 10%. Total operating expenses were up CHF 35 million, or7%.
The positive momentum from 1Q07 continued into 2Q07as reflected by our income from continuing operations beforetaxes, net new assets and assets under management. Webenefited from the 2006 realignment, and volumes and rev-enues developed favorably, while general and administrativeexpenses were contained, and compensation and benefitswere in line with improved results. We also continued to expe-rience momentum in attracting new talent. Additionally, wesaw further benefits from the integrated banking organization,with a high level of referrals from Private Banking and Invest-ment Banking. For example, DLJ Merchant Banking PartnersIV Fund’s announced acquisition of RathGibson, Inc., a leadingspecialty manufacturer of welded tubular products, from Cas-tle Harlan, was referred by Investment Banking.
Performance indicators
Pre-tax income margin (KPI)
Our mid-term goal is a pre-tax income margin of above35.0%. In 2Q07, the pre-tax income margin was 35.1% com-pared to 4.0% in 2Q06 and 33.1% in 1Q07.
Net new asset growth rate
In 2Q07, we achieved an annualized growth rate of 11.5%compared to 10.0% in 2Q06 and 17.3% in 1Q07. The rollingfour-quarter average growth rate increased to 11.0% in 2Q07compared to 7.1% in 2Q06 and 10.1% in 1Q07.
Gross margin
The gross margin on assets under management was 47 basispoints in 2Q07 compared to 44 basis points in 2Q06. Thegross margin on assets under management before privateequity and other investment-related gains was 36 basis pointsin 2Q07 compared to 37 basis points in 2Q06.
Initiatives and achievements
In 2Q07, we achieved numerous successes in a number ofbusinesses across several regions, all of which reflected ourcontinued positive momentum. For example, our core realestate business has shown strong performance, with over90% of our products outperforming benchmarks over the one-year period ended April 30, 2007. We are now the largest realestate asset manager in Switzerland. Alternative investmentscontinued to be a strong contributor to our success andgrowth. In private equity, we continued to pursue our strategyof focusing primarily on the middle market, and we had a num-ber of successful sales of investments through MerchantBanking Partners, including our remaining holdings inAdvanstar Holdings Corp. and sales of Laramie Energy, LLCand CommVault Systems, Inc. The Credit Suisse TremontHedge Index Tracker Fund, which was launched in July 2002,has over CHF 1.3 billion in assets under management.
In money markets, we continued to maintain positivegrowth. The Credit Suisse Institutional Money Market Fund‘Prime Portfolio Class A’ was ranked number three in thePrime Institutional Funds category of the “Highest-yieldingMoney Funds” for the months of April, May and June 2007 byiMoneyNet. Additionally, iMoneyNet ranked this fund numberone and number two in the Prime Institutional Funds categoryof the “Money Funds with Highest Returns” based on totalreturns of 5.40% and 5.42% for the 12-month periods endedMay and June 2007, respectively. As of the end of 2Q07,Credit Suisse Money Market Funds were the fastest organi-cally growing US money market funds over the past 52 weeks,according to iMoneyNet. The Credit Suisse Premier LiquidityFund (USD), an offshore institutional money market fund, nowhas assets under management of over CHF 1.6 billion.
50
40
30
20
10
0
in % 2Q2005 2006 2007
2Q 3Q 4Q 1Q 2Q 3Q 4Q 1Q
Pre-tax income margin

Asset Management
Core Results
39
Assets under management
in / end of % change in / end of % change
2Q07 1Q07 2Q06 QoQ YoY 6M07 6M06 YoY
Assets under management (CHF billion)
Fixed income and money market 241.4 227.9 192.0 5.9 25.7 241.4 192.0 25.7
Equity 46.5 46.4 46.1 0.2 0.9 46.5 46.1 0.9
Balanced 289.5 277.6 245.3 4.3 18.0 289.5 245.3 18.0
Private equity 1 33.4 30.6 29.2 9.2 14.4 33.4 29.2 14.4
Diversified strategies 2 64.6 55.7 39.4 16.0 64.0 64.6 39.4 64.0
Fund and alternative solutions 3 66.2 62.3 57.4 6.3 15.3 66.2 57.4 15.3
Alternative investments 164.2 148.6 126.0 10.5 30.3 164.2 126.0 30.3
Other 8.0 8.1 5.8 (1.2) 37.9 8.0 5.8 37.9
Assets under management 749.6 708.6 615.2 5.8 21.8 749.6 615.2 21.8
of which discretionary assets 646.2 606.9 526.1 6.5 22.8 646.2 526.1 22.8
of which advisory assets 103.4 101.7 89.1 1.7 16.0 103.4 89.1 16.0
Growth in assets under management (CHF billion)
Net new assets 20.4 29.0 15.5 (29.7) 31.6 49.4 32.5 52.0
Acquisitions and divestitures 0.0 0.0 5.8 – (100.0) 0.0 5.8 (100.0)
Market movements and investment performance 15.4 8.8 (12.9) 75.0 – 24.2 0.2 –
Currency 5.2 1.8 (12.8) 188.9 – 7.0 (12.7) –
Other 0.0 (0.9) 4 0.0 100.0 – (0.9) 4 0.0 –
Total other effects 20.6 9.7 (19.9) 112.4 – 30.3 (6.7) –
Growth in assets under management 41.0 38.7 (4.4) 5.9 – 79.7 25.8 208.9
Growth in assets under management (%)
Net new assets 11.5 17.3 10.0 – – 14.8 11.0 –
Total other effects 11.6 5.8 4 (12.8) – – 9.0 4 (2.3) –
Growth in assets under management 23.1 23.1 (2.8) – – 23.8 8.7 –
Growth in assets under management (rolling four-quarter average) (%)
Net new assets 11.0 10.1 7.1 – – – – –
Total other effects 10.8 4.3 4 12.3 – – – – –
Growth in assets under management(rolling four-quarter average) 21.8 14.4 19.4 – – – – –
Private equity investments (CHF billion)
Private equity investments 3.0 2.9 1.9 3.4 57.9 3.0 1.9 57.9
1 Includes alternative investment joint ventures. 2 Includes real estate, leveraged investments and Volaris. 3 Includes fund of hedge funds and quantitative strategies. 4 Includesoutflows as a result of the sale of the insurance business.
Our joint venture in Korea, Woori Credit Suisse Asset Man-agement Co., Ltd., raised CHF 1.0 billion in assets undermanagement – a significant accomplishment for this businessas we expand our footprint in this important market. The NikkoCredit Suisse Infrastructure Fund, which was launched inJapan on June 22, 2007, reached CHF 1.0 billion in assetsunder management by July 10, 2007, a remarkable achieve-ment.
All of these demonstrate the diversity of Asset Manage-ment and the wide sources of growth.
Results detail
The following provides a comparison of our 2Q07 results ver-sus 2Q06 (YoY) and versus 1Q07 (QoQ).
Net revenues
Net revenues before private equity and other investment-related gains include asset management fees, performancefees and fees from fund administration services provided toclients. Private equity and other investment-related gainsinclude realized and unrealized gains and losses on invest-ments and performance-related carried interest.
Fixed income and money market, equity, balanced andother
YoY: Up 11% from CHF 374 million to CHF 417 million
The increase was mainly due to higher asset management andadministrative fees, reflecting growth in balanced assets, par-ticularly premium and international multi-asset class solutions.Revenues from fixed income and money market assets alsoincreased, primarily related to fixed income asset growth inEurope and Asia Pacific and higher money market assetsmainly in the US, reflecting the strong performance of ourmoney market funds.QoQ: Down 4% from CHF 436 million to CHF 417 million
The decrease reflected increased asset management andadministrative fees, more than offset by higher funding costs.The increase in asset management and administrative feesreflected growth in fixed income and money market assets andbalanced assets. In particular, there were increases in interna-tional multi-asset class solutions, balanced total return funds,Asia Pacific and European fixed income funds and US moneymarket funds, partially offset by a decline in Swiss fixedincome/total return funds.
Alternative investmentsYoY: Up 33% from CHF 186 million to CHF 247 million
The increase primarily reflected increased revenues fromdiversified strategies, mainly as a result of higher revenues inthe Leveraged Investment Group (LIG), which specializes inthe management of leveraged loans and other leveragedassets, across most regions and our real estate activities inSwitzerland. The increase also reflected private equity com-missions and fees from leveraged corporate funds, customizedfund of hedge funds and mezzanine funds. Fund and alterna-tive solutions revenues increased, primarily reflecting higherfees from quantitative strategies.QoQ: Up 17% from CHF 212 million to CHF 247 million
The increase was the result of increased revenues in our pri-vate equity leveraged corporate funds and mezzanine funds.Diversified strategies revenues also increased from higher rev-enues in LIG across most regions and real estate activities inEurope and Switzerland.
Private equity and other investment-related gainsYoY: Up 64% from CHF 115 million to CHF 189 million
The increase was primarily the result of gains from successfulsales and unrealized gains on investments, including AdvanstarHoldings Corp., Laramie Energy, LLC, CommVault Systems,Inc. and Merrill Corporation.QoQ: Up 48% from CHF 128 million to CHF 189 million
The increase was primarily the result of gains from these suc-cessful sales and unrealized gains on investments.
Operating expenses
Compensation and benefitsYoY: Up 23% from CHF 255 million to CHF 314 million
The increase was primarily due to increased performance-related compensation in line with higher net revenues and theintroduction of the Group-wide share-based compensationplan. The increase also reflected our ongoing efforts to hirenew investment talent and build product development and dis-tribution capabilities.QoQ: Up 6% from CHF 296 million to CHF 314 million
The increase was primarily due to increased performance-related compensation in line with higher net revenues. Theincrease also reflected our ongoing efforts to hire new invest-ment talent and build product development and distributioncapabilities.
General and administrative expensesYoY: Down 57% from CHF 313 million to CHF 135 million
The decrease is due to realignment costs of CHF 141 millionin 2Q06. Excluding these realignment costs, general andadministrative expenses decreased CHF 37 million, or 22%.This reflected a decline in most expense categories as a resultof disciplined expense management.QoQ: Up 11% from CHF 122 million to CHF 135 million
The increase reflected higher professional fees and informa-tion technology expense, partially offset by decreased occu-pancy costs.
Commission expensesYoY: Up 30% from CHF 81 million to CHF 105 million
The increase was primarily associated with increased transac-tions related to higher assets under management.QoQ: Up 4% from CHF 101 million to CHF 105 million
The increase was primarily associated with increased transac-tions related to higher assets under management.
Personnel
Headcount remained flat from 1Q07 and was down 100 from2Q06. In 2Q07, we continued to hire investment talent andbuild product development and distribution capabilities.
40
Financial Review
2Q 07Overview of Results and Assets underManagement
42 ResultsThe Results section shows the performance of our integratedbanking organization at a glance.
44 Assets under Management The Assets under Management section describesdevelopments in net new assets, assets under managementand client assets for our asset-gathering franchises.
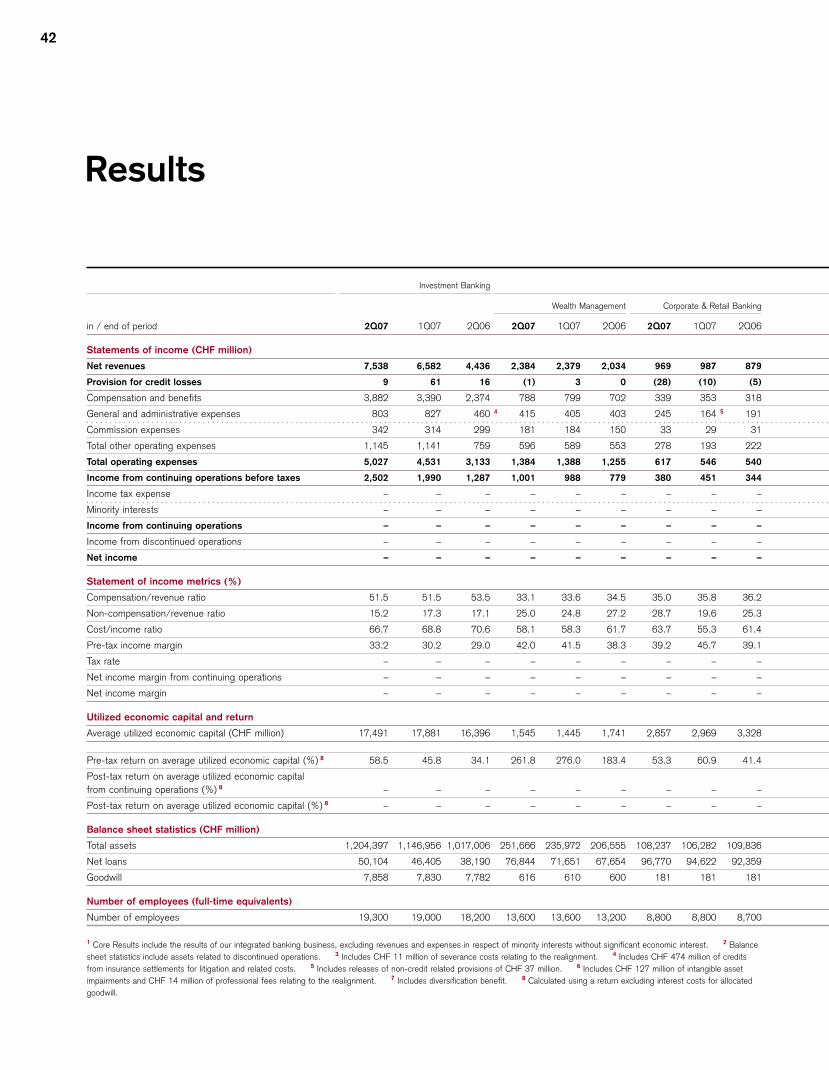
42
Investment Banking
Wealth Management Corporate & Retail Banking
in / end of period 2Q07 1Q07 2Q06 2Q07 1Q07 2Q06 2Q07 1Q07 2Q06
Statements of income (CHF million)
Net revenues 7,538 6,582 4,436 2,384 2,379 2,034 969 987 879
Provision for credit losses 9 61 16 (1) 3 0 (28) (10) (5)
Compensation and benefits 3,882 3,390 2,374 788 799 702 339 353 318
General and administrative expenses 803 827 460 4 415 405 403 245 164 5 191
Commission expenses 342 314 299 181 184 150 33 29 31
Total other operating expenses 1,145 1,141 759 596 589 553 278 193 222
Total operating expenses 5,027 4,531 3,133 1,384 1,388 1,255 617 546 540
Income from continuing operations before taxes 2,502 1,990 1,287 1,001 988 779 380 451 344
Income tax expense – – – – – – – – –
Minority interests – – – – – – – – –
Income from continuing operations – – – – – – – – –
Income from discontinued operations – – – – – – – – –
Net income – – – – – – – – –
Statement of income metrics (%)
Compensation/revenue ratio 51.5 51.5 53.5 33.1 33.6 34.5 35.0 35.8 36.2
Non-compensation/revenue ratio 15.2 17.3 17.1 25.0 24.8 27.2 28.7 19.6 25.3
Cost/income ratio 66.7 68.8 70.6 58.1 58.3 61.7 63.7 55.3 61.4
Pre-tax income margin 33.2 30.2 29.0 42.0 41.5 38.3 39.2 45.7 39.1
Tax rate – – – – – – – – –
Net income margin from continuing operations – – – – – – – – –
Net income margin – – – – – – – – –
Utilized economic capital and return
Average utilized economic capital (CHF million) 17,491 17,881 16,396 1,545 1,445 1,741 2,857 2,969 3,328
Pre-tax return on average utilized economic capital (%) 8 58.5 45.8 34.1 261.8 276.0 183.4 53.3 60.9 41.4
Post-tax return on average utilized economic capital from continuing operations (%) 8 – – – – – – – – –
Post-tax return on average utilized economic capital (%) 8 – – – – – – – – –
Balance sheet statistics (CHF million)
Total assets 1,204,397 1,146,956 1,017,006 251,666 235,972 206,555 108,237 106,282 109,836
Net loans 50,104 46,405 38,190 76,844 71,651 67,654 96,770 94,622 92,359
Goodwill 7,858 7,830 7,782 616 610 600 181 181 181
Number of employees (full-time equivalents)
Number of employees 19,300 19,000 18,200 13,600 13,600 13,200 8,800 8,800 8,700
1 Core Results include the results of our integrated banking business, excluding revenues and expenses in respect of minority interests without significant economic interest. 2 Balancesheet statistics include assets related to discontinued operations. 3 Includes CHF 11 million of severance costs relating to the realignment. 4 Includes CHF 474 million of creditsfrom insurance settlements for litigation and related costs. 5 Includes releases of non-credit related provisions of CHF 37 million. 6 Includes CHF 127 million of intangible assetimpairments and CHF 14 million of professional fees relating to the realignment. 7 Includes diversification benefit. 8 Calculated using a return excluding interest costs for allocatedgoodwill.
Results

Results
Summary
43
Private Banking Asset Management Corporate Center Core Results 1 Credit Suisse
2Q07 1Q07 2Q06 2Q07 1Q07 2Q06 2Q07 1Q07 2Q06 2 2Q07 1Q07 2Q06 2Q07 1Q07 2Q06
3,353 3,366 2,913 853 776 675 (41) (55) 23 11,703 10,669 8,047 13,037 11,620 8,788
(29) (7) (5) 0 0 (1) 0 (1) 0 (20) 53 10 (20) 53 10
1,127 1,152 1,020 314 296 255 3 63 68 48 5,386 4,906 3,697 5,409 4,950 3,697
660 569 594 135 122 313 6 11 7 (28) 1,609 1,525 1,339 1,619 1,532 1,352
214 213 181 105 101 81 (19) (19) (10) 642 609 551 642 609 551
874 782 775 240 223 394 (8) (12) (38) 2,251 2,134 1,890 2,261 2,141 1,903
2,001 1,934 1,795 554 519 649 55 56 10 7,637 7,040 5,587 7,670 7,091 5,600
1,381 1,439 1,123 299 257 27 (96) (110) 13 4,086 3,576 2,450 5,387 4,476 3,178
– – – – – – – – – 863 822 502 863 822 502
– – – – – – – – – 34 25 76 1,335 925 804
– – – – – – – – – 3,189 2,729 1,872 3,189 2,729 1,872
– – – – – – – – – 0 0 286 0 0 286
– – – – – – – – – 3,189 2,729 2,158 3,189 2,729 2,158
33.6 34.2 35.0 36.8 38.1 37.8 – – – 46.0 46.0 45.9 41.5 42.6 42.1
26.1 23.2 26.6 28.1 28.7 58.4 – – – 19.2 20.0 23.5 17.3 18.4 21.7
59.7 57.5 61.6 64.9 66.9 96.1 – – – 65.3 66.0 69.4 58.8 61.0 63.7
41.2 42.8 38.6 35.1 33.1 4.0 – – – 34.9 33.5 30.4 41.3 38.5 36.2
– – – – – – – – – 21.1 23.0 20.5 16.0 18.4 15.8
– – – – – – – – – 27.2 25.6 23.3 24.5 23.5 21.3
– – – – – – – – – 27.2 25.6 26.8 24.5 23.5 24.6
4,402 4,414 5,069 1,520 1,494 1,478 1,238 7 1,280 7 1,526 7 24,623 25,028 24,255 24,623 25,028 24,255
126.5 131.3 90.2 82.2 72.5 14.7 – – – 67.7 58.4 43.0 67.7 58.4 43.0
– – – – – – – – – 52.8 44.6 32.9 52.8 44.6 32.9
– – – – – – – – – 52.8 44.6 37.6 52.8 44.6 37.6
359,903 342,254 316,391 23,929 23,016 18,767 (190,124) (168,857) 37,268 1,398,105 1,343,369 1,389,432 1,415,174 1,359,687 1,404,562
173,614 166,273 160,013 – – – 504 153 91 224,222 212,831 198,294 224,222 212,831 198,294
797 791 781 2,439 2,422 2,414 – – – 11,094 11,043 10,977 11,094 11,043 10,977
22,400 22,400 21,900 3,300 3,300 3,400 600 600 600 45,600 45,300 44,100 45,600 45,300 44,100
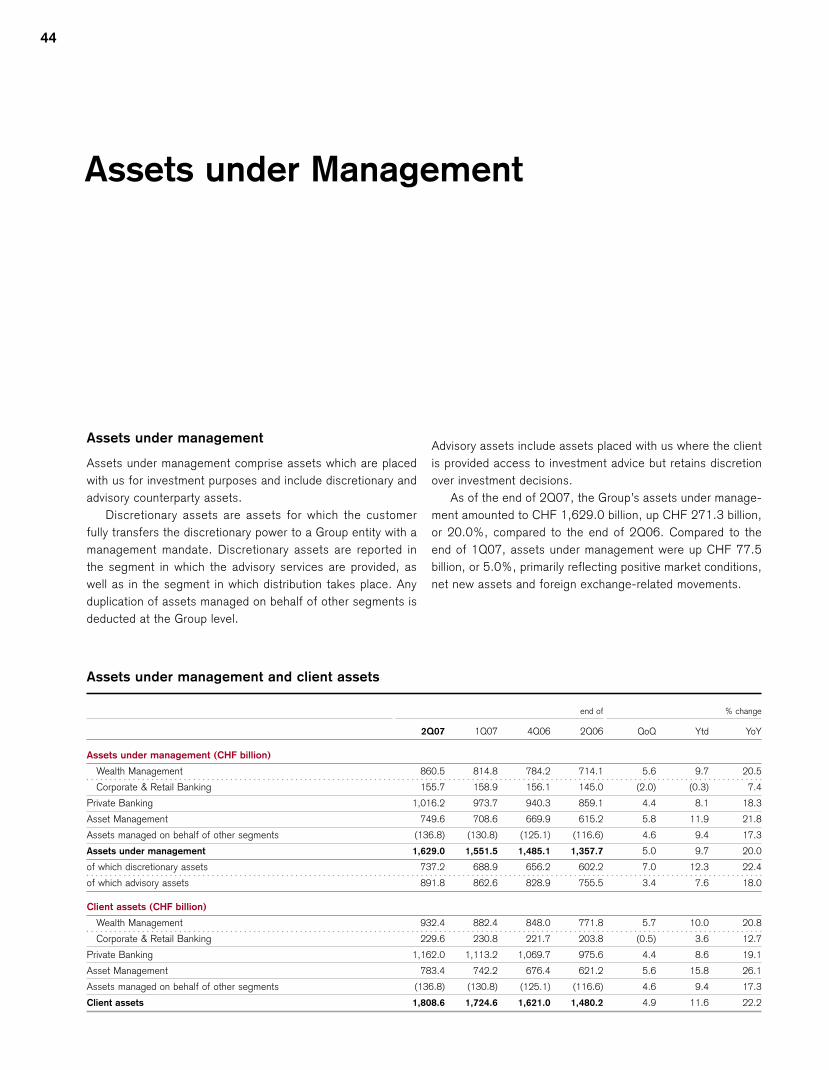
44
Assets under Management
Assets under management and client assets
end of % change
2Q07 1Q07 4Q06 2Q06 QoQ Ytd YoY
Assets under management (CHF billion)
Wealth Management 860.5 814.8 784.2 714.1 5.6 9.7 20.5
Corporate & Retail Banking 155.7 158.9 156.1 145.0 (2.0) (0.3) 7.4
Private Banking 1,016.2 973.7 940.3 859.1 4.4 8.1 18.3
Asset Management 749.6 708.6 669.9 615.2 5.8 11.9 21.8
Assets managed on behalf of other segments (136.8) (130.8) (125.1) (116.6) 4.6 9.4 17.3
Assets under management 1,629.0 1,551.5 1,485.1 1,357.7 5.0 9.7 20.0
of which discretionary assets 737.2 688.9 656.2 602.2 7.0 12.3 22.4
of which advisory assets 891.8 862.6 828.9 755.5 3.4 7.6 18.0
Client assets (CHF billion)
Wealth Management 932.4 882.4 848.0 771.8 5.7 10.0 20.8
Corporate & Retail Banking 229.6 230.8 221.7 203.8 (0.5) 3.6 12.7
Private Banking 1,162.0 1,113.2 1,069.7 975.6 4.4 8.6 19.1
Asset Management 783.4 742.2 676.4 621.2 5.6 15.8 26.1
Assets managed on behalf of other segments (136.8) (130.8) (125.1) (116.6) 4.6 9.4 17.3
Client assets 1,808.6 1,724.6 1,621.0 1,480.2 4.9 11.6 22.2
Assets under management
Assets under management comprise assets which are placedwith us for investment purposes and include discretionary andadvisory counterparty assets.
Discretionary assets are assets for which the customerfully transfers the discretionary power to a Group entity with amanagement mandate. Discretionary assets are reported inthe segment in which the advisory services are provided, aswell as in the segment in which distribution takes place. Anyduplication of assets managed on behalf of other segments isdeducted at the Group level.
Advisory assets include assets placed with us where the clientis provided access to investment advice but retains discretionover investment decisions.
As of the end of 2Q07, the Group’s assets under manage-ment amounted to CHF 1,629.0 billion, up CHF 271.3 billion,or 20.0%, compared to the end of 2Q06. Compared to theend of 1Q07, assets under management were up CHF 77.5billion, or 5.0%, primarily reflecting positive market conditions,net new assets and foreign exchange-related movements.
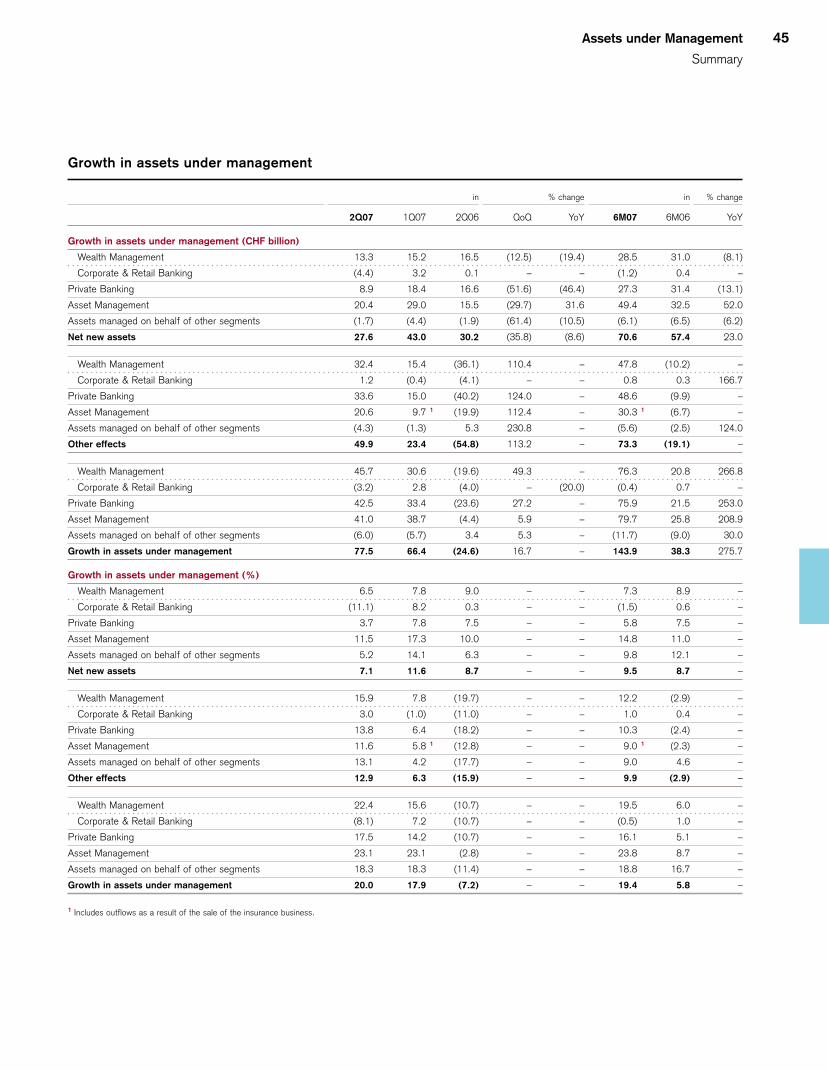
Assets under Management
Summary
45
Growth in assets under management
in % change in % change
2Q07 1Q07 2Q06 QoQ YoY 6M07 6M06 YoY
Growth in assets under management (CHF billion)
Wealth Management 13.3 15.2 16.5 (12.5) (19.4) 28.5 31.0 (8.1)
Corporate & Retail Banking (4.4) 3.2 0.1 – – (1.2) 0.4 –
Private Banking 8.9 18.4 16.6 (51.6) (46.4) 27.3 31.4 (13.1)
Asset Management 20.4 29.0 15.5 (29.7) 31.6 49.4 32.5 52.0
Assets managed on behalf of other segments (1.7) (4.4) (1.9) (61.4) (10.5) (6.1) (6.5) (6.2)
Net new assets 27.6 43.0 30.2 (35.8) (8.6) 70.6 57.4 23.0
Wealth Management 32.4 15.4 (36.1) 110.4 – 47.8 (10.2) –
Corporate & Retail Banking 1.2 (0.4) (4.1) – – 0.8 0.3 166.7
Private Banking 33.6 15.0 (40.2) 124.0 – 48.6 (9.9) –
Asset Management 20.6 9.7 1 (19.9) 112.4 – 30.3 1 (6.7) –
Assets managed on behalf of other segments (4.3) (1.3) 5.3 230.8 – (5.6) (2.5) 124.0
Other effects 49.9 23.4 (54.8) 113.2 – 73.3 (19.1) –
Wealth Management 45.7 30.6 (19.6) 49.3 – 76.3 20.8 266.8
Corporate & Retail Banking (3.2) 2.8 (4.0) – (20.0) (0.4) 0.7 –
Private Banking 42.5 33.4 (23.6) 27.2 – 75.9 21.5 253.0
Asset Management 41.0 38.7 (4.4) 5.9 – 79.7 25.8 208.9
Assets managed on behalf of other segments (6.0) (5.7) 3.4 5.3 – (11.7) (9.0) 30.0
Growth in assets under management 77.5 66.4 (24.6) 16.7 – 143.9 38.3 275.7
Growth in assets under management (%)
Wealth Management 6.5 7.8 9.0 – – 7.3 8.9 –
Corporate & Retail Banking (11.1) 8.2 0.3 – – (1.5) 0.6 –
Private Banking 3.7 7.8 7.5 – – 5.8 7.5 –
Asset Management 11.5 17.3 10.0 – – 14.8 11.0 –
Assets managed on behalf of other segments 5.2 14.1 6.3 – – 9.8 12.1 –
Net new assets 7.1 11.6 8.7 – – 9.5 8.7 –
Wealth Management 15.9 7.8 (19.7) – – 12.2 (2.9) –
Corporate & Retail Banking 3.0 (1.0) (11.0) – – 1.0 0.4 –
Private Banking 13.8 6.4 (18.2) – – 10.3 (2.4) –
Asset Management 11.6 5.8 1 (12.8) – – 9.0 1 (2.3) –
Assets managed on behalf of other segments 13.1 4.2 (17.7) – – 9.0 4.6 –
Other effects 12.9 6.3 (15.9) – – 9.9 (2.9) –
Wealth Management 22.4 15.6 (10.7) – – 19.5 6.0 –
Corporate & Retail Banking (8.1) 7.2 (10.7) – – (0.5) 1.0 –
Private Banking 17.5 14.2 (10.7) – – 16.1 5.1 –
Asset Management 23.1 23.1 (2.8) – – 23.8 8.7 –
Assets managed on behalf of other segments 18.3 18.3 (11.4) – – 18.8 16.7 –
Growth in assets under management 20.0 17.9 (7.2) – – 19.4 5.8 –
1 Includes outflows as a result of the sale of the insurance business.
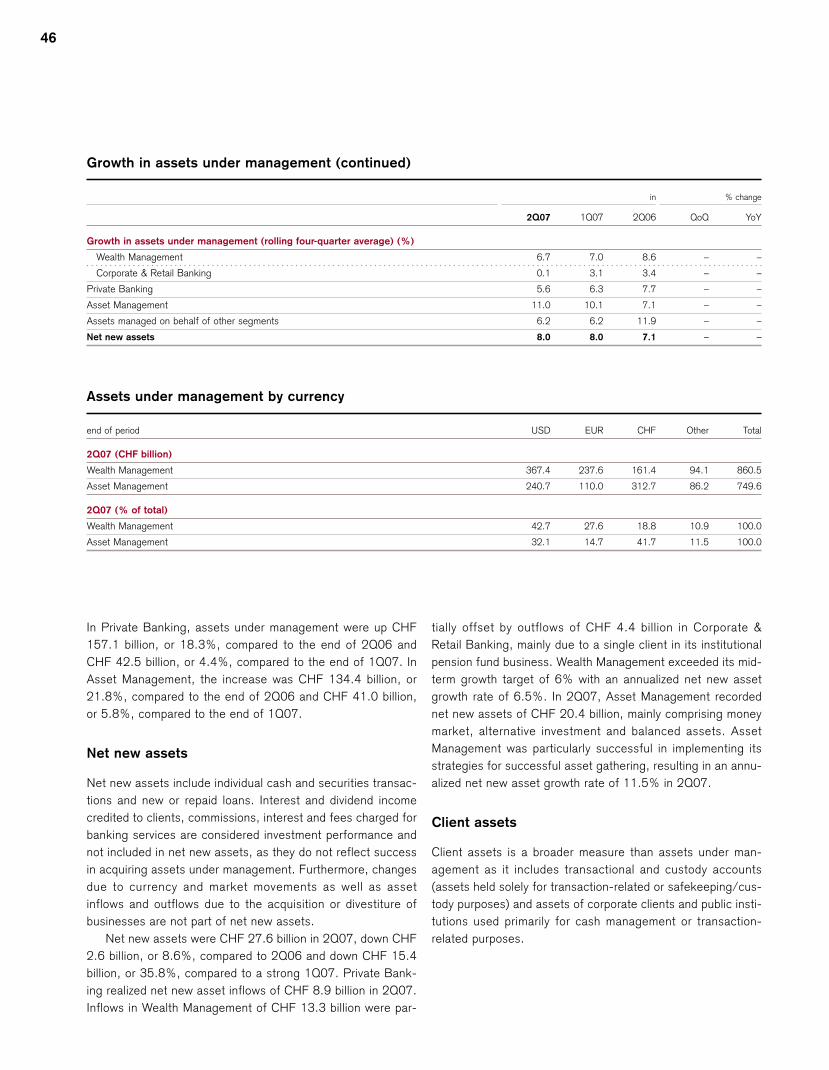
Growth in assets under management (continued)
in % change
2Q07 1Q07 2Q06 QoQ YoY
Growth in assets under management (rolling four-quarter average) (%)
Wealth Management 6.7 7.0 8.6 – –
Corporate & Retail Banking 0.1 3.1 3.4 – –
Private Banking 5.6 6.3 7.7 – –
Asset Management 11.0 10.1 7.1 – –
Assets managed on behalf of other segments 6.2 6.2 11.9 – –
Net new assets 8.0 8.0 7.1 – –
46
In Private Banking, assets under management were up CHF157.1 billion, or 18.3%, compared to the end of 2Q06 andCHF 42.5 billion, or 4.4%, compared to the end of 1Q07. InAsset Management, the increase was CHF 134.4 billion, or21.8%, compared to the end of 2Q06 and CHF 41.0 billion,or 5.8%, compared to the end of 1Q07.
Net new assets
Net new assets include individual cash and securities transac-tions and new or repaid loans. Interest and dividend incomecredited to clients, commissions, interest and fees charged forbanking services are considered investment performance andnot included in net new assets, as they do not reflect successin acquiring assets under management. Furthermore, changesdue to currency and market movements as well as assetinflows and outflows due to the acquisition or divestiture ofbusinesses are not part of net new assets.
Net new assets were CHF 27.6 billion in 2Q07, down CHF2.6 billion, or 8.6%, compared to 2Q06 and down CHF 15.4billion, or 35.8%, compared to a strong 1Q07. Private Bank-ing realized net new asset inflows of CHF 8.9 billion in 2Q07.Inflows in Wealth Management of CHF 13.3 billion were par-
tially offset by outflows of CHF 4.4 billion in Corporate &Retail Banking, mainly due to a single client in its institutionalpension fund business. Wealth Management exceeded its mid-term growth target of 6% with an annualized net new assetgrowth rate of 6.5%. In 2Q07, Asset Management recordednet new assets of CHF 20.4 billion, mainly comprising moneymarket, alternative investment and balanced assets. AssetManagement was particularly successful in implementing itsstrategies for successful asset gathering, resulting in an annu-alized net new asset growth rate of 11.5% in 2Q07.
Client assets
Client assets is a broader measure than assets under man-agement as it includes transactional and custody accounts(assets held solely for transaction-related or safekeeping/cus-tody purposes) and assets of corporate clients and public insti-tutions used primarily for cash management or transaction-related purposes.
Assets under management by currency
end of period USD EUR CHF Other Total
2Q07 (CHF billion)
Wealth Management 367.4 237.6 161.4 94.1 860.5
Asset Management 240.7 110.0 312.7 86.2 749.6
2Q07 (% of total)
Wealth Management 42.7 27.6 18.8 10.9 100.0
Asset Management 32.1 14.7 41.7 11.5 100.0
Financial Review
2Q 07Balance Sheet, Capital and Risk
48 Balance SheetOur balance sheet is managed in line with our capitalresources and risk. We describe the main balance sheettrends in this section.
49 Capital ManagementWe allocate capital to our businesses based on our internaleconomic capital measure. Developments in our statutoryshareholders’ equity and regulatory BIS capital are alsodescribed in this section.
53 Risk ManagementRisk management is a continuous process that extends wellbeyond formal policies, methodologies and tools. Nonetheless,the position risk, Value-at-Risk and credit risk measurespresented in this section provide a good overview of ourexposure levels.
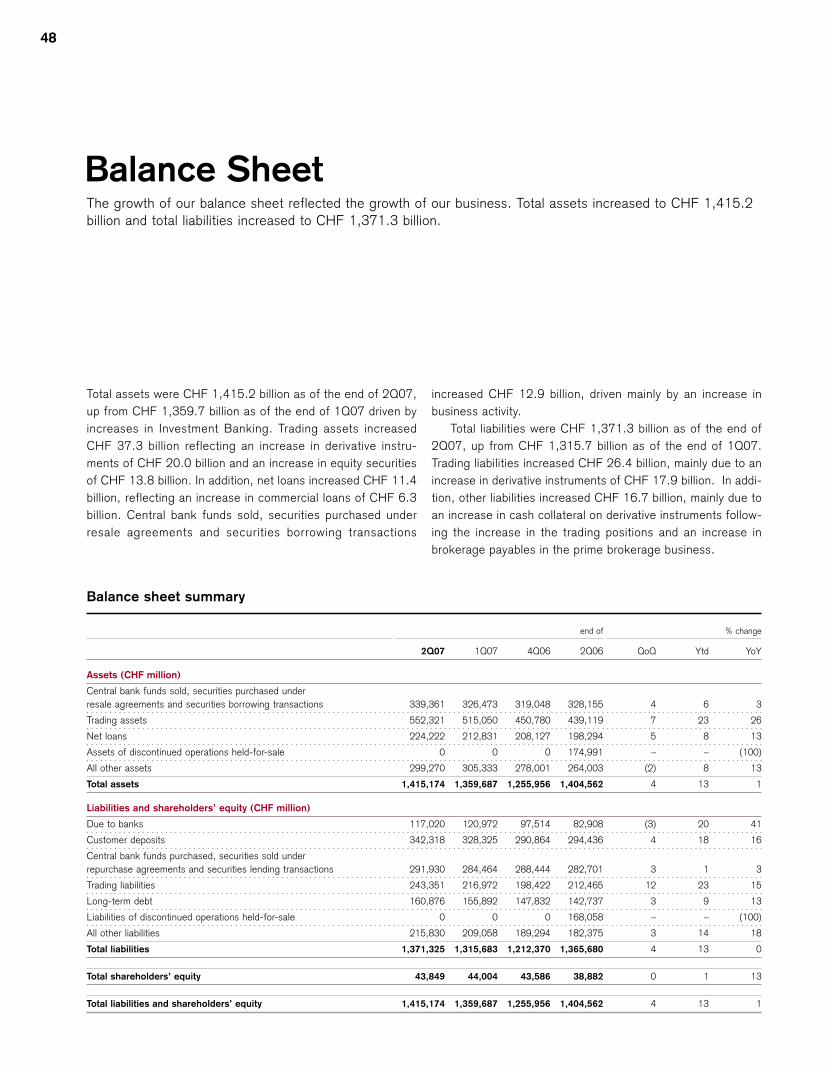
Total assets were CHF 1,415.2 billion as of the end of 2Q07,up from CHF 1,359.7 billion as of the end of 1Q07 driven byincreases in Investment Banking. Trading assets increasedCHF 37.3 billion reflecting an increase in derivative instru-ments of CHF 20.0 billion and an increase in equity securitiesof CHF 13.8 billion. In addition, net loans increased CHF 11.4billion, reflecting an increase in commercial loans of CHF 6.3billion. Central bank funds sold, securities purchased underresale agreements and securities borrowing transactions
increased CHF 12.9 billion, driven mainly by an increase inbusiness activity.
Total liabilities were CHF 1,371.3 billion as of the end of2Q07, up from CHF 1,315.7 billion as of the end of 1Q07.Trading liabilities increased CHF 26.4 billion, mainly due to anincrease in derivative instruments of CHF 17.9 billion. In addi-tion, other liabilities increased CHF 16.7 billion, mainly due toan increase in cash collateral on derivative instruments follow-ing the increase in the trading positions and an increase inbrokerage payables in the prime brokerage business.
48
Balance Sheet The growth of our balance sheet reflected the growth of our business. Total assets increased to CHF 1,415.2billion and total liabilities increased to CHF 1,371.3 billion.
Balance sheet summary
end of % change
2Q07 1Q07 4Q06 2Q06 QoQ Ytd YoY
Assets (CHF million)
Central bank funds sold, securities purchased under resale agreements and securities borrowing transactions 339,361 326,473 319,048 328,155 4 6 3
Trading assets 552,321 515,050 450,780 439,119 7 23 26
Net loans 224,222 212,831 208,127 198,294 5 8 13
Assets of discontinued operations held-for-sale 0 0 0 174,991 – – (100)
All other assets 299,270 305,333 278,001 264,003 (2) 8 13
Total assets 1,415,174 1,359,687 1,255,956 1,404,562 4 13 1
Liabilities and shareholders’ equity (CHF million)
Due to banks 117,020 120,972 97,514 82,908 (3) 20 41
Customer deposits 342,318 328,325 290,864 294,436 4 18 16
Central bank funds purchased, securities sold under repurchase agreements and securities lending transactions 291,930 284,464 288,444 282,701 3 1 3
Trading liabilities 243,351 216,972 198,422 212,465 12 23 15
Long-term debt 160,876 155,892 147,832 142,737 3 9 13
Liabilities of discontinued operations held-for-sale 0 0 0 168,058 – – (100)
All other liabilities 215,830 209,058 189,294 182,375 3 14 18
Total liabilities 1,371,325 1,315,683 1,212,370 1,365,680 4 13 0
Total shareholders’ equity 43,849 44,004 43,586 38,882 0 1 13
Total liabilities and shareholders’ equity 1,415,174 1,359,687 1,255,956 1,404,562 4 13 1
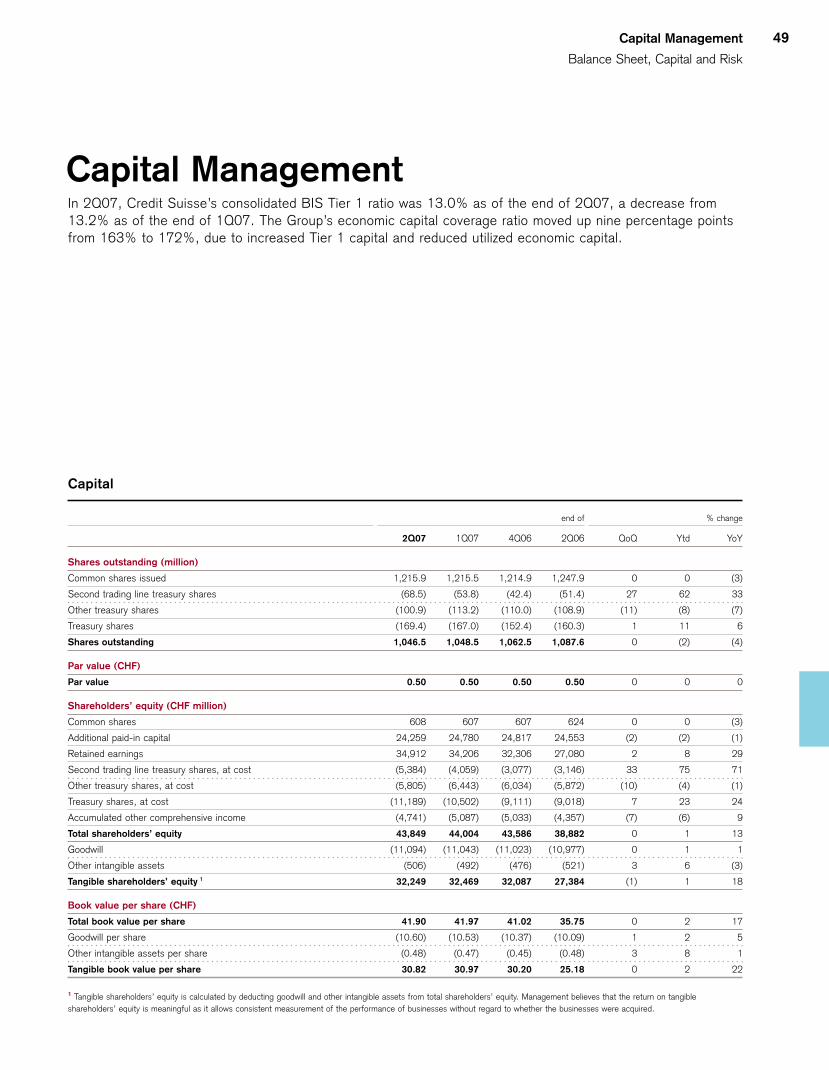
Capital Management
Balance Sheet, Capital and Risk
49
Capital Management In 2Q07, Credit Suisse’s consolidated BIS Tier 1 ratio was 13.0% as of the end of 2Q07, a decrease from13.2% as of the end of 1Q07. The Group’s economic capital coverage ratio moved up nine percentage pointsfrom 163% to 172%, due to increased Tier 1 capital and reduced utilized economic capital.
Capital
end of % change
2Q07 1Q07 4Q06 2Q06 QoQ Ytd YoY
Shares outstanding (million)
Common shares issued 1,215.9 1,215.5 1,214.9 1,247.9 0 0 (3)
Second trading line treasury shares (68.5) (53.8) (42.4) (51.4) 27 62 33
Other treasury shares (100.9) (113.2) (110.0) (108.9) (11) (8) (7)
Treasury shares (169.4) (167.0) (152.4) (160.3) 1 11 6
Shares outstanding 1,046.5 1,048.5 1,062.5 1,087.6 0 (2) (4)
Par value (CHF)
Par value 0.50 0.50 0.50 0.50 0 0 0
Shareholders’ equity (CHF million)
Common shares 608 607 607 624 0 0 (3)
Additional paid-in capital 24,259 24,780 24,817 24,553 (2) (2) (1)
Retained earnings 34,912 34,206 32,306 27,080 2 8 29
Second trading line treasury shares, at cost (5,384) (4,059) (3,077) (3,146) 33 75 71
Other treasury shares, at cost (5,805) (6,443) (6,034) (5,872) (10) (4) (1)
Treasury shares, at cost (11,189) (10,502) (9,111) (9,018) 7 23 24
Accumulated other comprehensive income (4,741) (5,087) (5,033) (4,357) (7) (6) 9
Total shareholders’ equity 43,849 44,004 43,586 38,882 0 1 13
Goodwill (11,094) (11,043) (11,023) (10,977) 0 1 1
Other intangible assets (506) (492) (476) (521) 3 6 (3)
Tangible shareholders’ equity 1 32,249 32,469 32,087 27,384 (1) 1 18
Book value per share (CHF)
Total book value per share 41.90 41.97 41.02 35.75 0 2 17
Goodwill per share (10.60) (10.53) (10.37) (10.09) 1 2 5
Other intangible assets per share (0.48) (0.47) (0.45) (0.48) 3 8 1
Tangible book value per share 30.82 30.97 30.20 25.18 0 2 22
1 Tangible shareholders’ equity is calculated by deducting goodwill and other intangible assets from total shareholders’ equity. Management believes that the return on tangibleshareholders’ equity is meaningful as it allows consistent measurement of the performance of businesses without regard to whether the businesses were acquired.

50
BIS statistics
The Group’s consolidated BIS Tier 1 ratio was 13.0% as ofthe end of 2Q07, a decrease from 13.2% as of the end of1Q07. Risk weighted assets increased CHF 25.1 billion com-pared to the end of 1Q07. The increase was related to busi-ness growth in Investment Banking and Private Banking. Riskweighted assets in Investment Banking increased primarily infixed income credit products and equities and also included anincrease in market risk equivalents. The market risk increasewas related to higher VaR during the quarter (for further infor-mation on VaR for Credit Suisse, refer to “Risk Management”).The increase in risk weighted assets in Private Banking wasprimarily related to growth of commercial and industrial loansas well as loans collateralized with securities.
Tier 1 capital increased CHF 2.8 billion from the end of1Q07, with the positive contribution of net income, theissuance of USD 2 billion of capital notes, partially offset bydividend accruals and the deduction for shares repurchased
through the Group’s CHF 8 billion share buyback program. In2Q07, we redeemed JPY 17 billion and USD 125 million ofnon-cumulative perpetual preferred securities. Our sharehold-ers’ equity decreased from CHF 44.0 billion as of the end of1Q07 to CHF 43.8 billion as of the end of 2Q07, primarilydue to the 2Q07 net income offset by dividend payments andthe shares bought back through the Group’s share buybackprogram. During 2Q07, we repurchased 14.7 million commonshares in the amount of CHF 1.3 billion under the program. Asof the end of July 2007, we repurchased a total of CHF 2.5billion. We plan to repurchase a further CHF 2.5 billion by theend of 2007 and expect to complete this repurchase programduring 2008, ahead of the 2010 target.
In addition, the Group redeemed several Tier 2 capitalinstruments amounting to CHF 1 billion in 2Q07 and sold sev-eral positions in credit enhancements. The Group’s consoli-dated Total Capital increased from CHF 46.8 billion as of theend of 1Q07 to CHF 48.4 billion as of the end of 2Q07 and
BIS statistics
end of % change
2Q07 1Q07 4Q06 2Q06 QoQ Ytd YoY
Risk-weighted assets (CHF million)
Risk-weighted positions 275,782 255,359 240,095 228,079 8 15 21
Market risk equivalents 20,634 15,934 13,581 16,852 29 52 22
Risk-weighted assets 296,416 271,293 253,676 244,931 9 17 21
Capital (CHF million)
Total shareholders’ equity 43,849 44,004 43,586 38,882 0 1 13
Goodwill (11,094) (11,043) (11,023) (12,288) 0 1 (10)
Investments in insurance entities (50%) (72) (55) (22) (3,782) 31 227 (98)
Non-cumulative perpetual preferred securitiesand capital notes 4,225 2,181 2,167 2,142 94 95 97
Other adjustments 1,709 754 439 1,064 127 289 61
Tier 1 capital 38,617 35,841 35,147 26,018 8 10 48
Upper Tier 2 2,873 3,903 4,733 3,422 (26) (39) (16)
Lower Tier 2 8,093 8,449 8,587 8,766 (4) (6) (8)
Tier 2 capital 10,966 12,352 13,320 12,188 (11) (18) (10)
Investments in non-consolidated banking andfinance participations and credit enhancements (1,149) (1,330) (1,681) (1,672) (14) (32) (31)
Investments in insurance entities (50%) (72) (55) (22) (3,782) 31 227 (98)
Total capital 48,362 46,808 46,764 32,752 3 3 48
Capital ratios (%)
Tier 1 ratio 13.0 13.2 13.9 10.6 – – –
Total capital ratio 16.3 17.3 18.4 13.4 – – –
The Swiss Federal Banking Commission (EBK) has advised that Credit Suisse Group may continue to include as Tier 1 capital CHF 1.8 billion in 2Q07 (1Q07: CHF 2.2 billion, 4Q06: CHF2.2 billion and 2Q06: CHF 2.1 billion) of equity from special purpose entities that are deconsolidated under FIN 46(R).
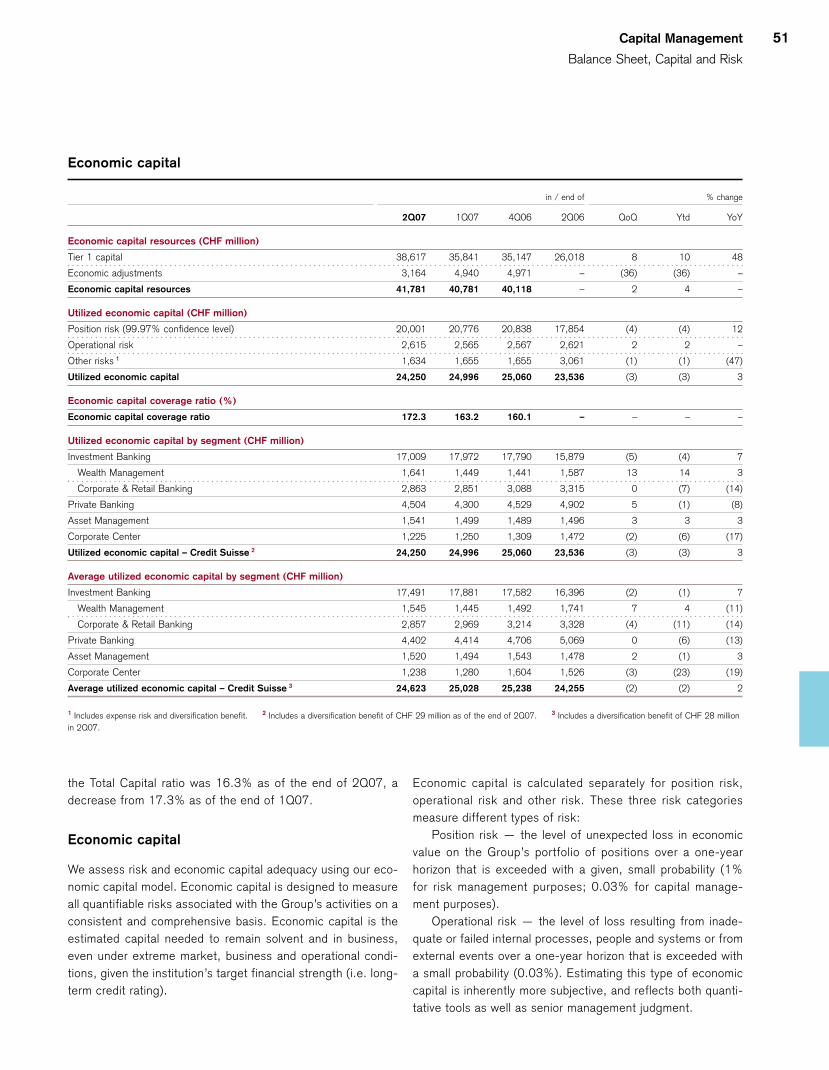
Capital Management
Balance Sheet, Capital and Risk
51
Economic capital
in / end of % change
2Q07 1Q07 4Q06 2Q06 QoQ Ytd YoY
Economic capital resources (CHF million)
Tier 1 capital 38,617 35,841 35,147 26,018 8 10 48
Economic adjustments 3,164 4,940 4,971 – (36) (36) –
Economic capital resources 41,781 40,781 40,118 – 2 4 –
Utilized economic capital (CHF million)
Position risk (99.97% confidence level) 20,001 20,776 20,838 17,854 (4) (4) 12
Operational risk 2,615 2,565 2,567 2,621 2 2 –
Other risks 1 1,634 1,655 1,655 3,061 (1) (1) (47)
Utilized economic capital 24,250 24,996 25,060 23,536 (3) (3) 3
Economic capital coverage ratio (%)
Economic capital coverage ratio 172.3 163.2 160.1 – – – –
Utilized economic capital by segment (CHF million)
Investment Banking 17,009 17,972 17,790 15,879 (5) (4) 7
Wealth Management 1,641 1,449 1,441 1,587 13 14 3
Corporate & Retail Banking 2,863 2,851 3,088 3,315 0 (7) (14)
Private Banking 4,504 4,300 4,529 4,902 5 (1) (8)
Asset Management 1,541 1,499 1,489 1,496 3 3 3
Corporate Center 1,225 1,250 1,309 1,472 (2) (6) (17)
Utilized economic capital – Credit Suisse 2 24,250 24,996 25,060 23,536 (3) (3) 3
Average utilized economic capital by segment (CHF million)
Investment Banking 17,491 17,881 17,582 16,396 (2) (1) 7
Wealth Management 1,545 1,445 1,492 1,741 7 4 (11)
Corporate & Retail Banking 2,857 2,969 3,214 3,328 (4) (11) (14)
Private Banking 4,402 4,414 4,706 5,069 0 (6) (13)
Asset Management 1,520 1,494 1,543 1,478 2 (1) 3
Corporate Center 1,238 1,280 1,604 1,526 (3) (23) (19)
Average utilized economic capital – Credit Suisse 3 24,623 25,028 25,238 24,255 (2) (2) 2
1 Includes expense risk and diversification benefit. 2 Includes a diversification benefit of CHF 29 million as of the end of 2Q07. 3 Includes a diversification benefit of CHF 28 millionin 2Q07.
the Total Capital ratio was 16.3% as of the end of 2Q07, adecrease from 17.3% as of the end of 1Q07.
Economic capital
We assess risk and economic capital adequacy using our eco-nomic capital model. Economic capital is designed to measureall quantifiable risks associated with the Group’s activities on aconsistent and comprehensive basis. Economic capital is theestimated capital needed to remain solvent and in business,even under extreme market, business and operational condi-tions, given the institution’s target financial strength (i.e. long-term credit rating).
Economic capital is calculated separately for position risk,operational risk and other risk. These three risk categoriesmeasure different types of risk:
Position risk — the level of unexpected loss in economicvalue on the Group’s portfolio of positions over a one-yearhorizon that is exceeded with a given, small probability (1%for risk management purposes; 0.03% for capital manage-ment purposes).
Operational risk — the level of loss resulting from inade-quate or failed internal processes, people and systems or fromexternal events over a one-year horizon that is exceeded witha small probability (0.03%). Estimating this type of economiccapital is inherently more subjective, and reflects both quanti-tative tools as well as senior management judgment.

52
Other risk — the risk not captured by the above, for exampleexpense risk and owned real estate risk. Expense risk isdefined as the difference between expenses and revenue in asevere market event, exclusive of the elements captured byposition risk and operational risk. Owned real estate risk isdefined as the risk associated with the buildings owned by us.
Position risk, operational risk and other risk are used todetermine our utilized economic capital.
Prior period balances have been restated for methodologychanges in order to show consistent trends and comparisonsthrough time. For further information, refer to “Risk Manage-ment”.
Utilized economic capital trends in 2Q07
Over the course of 2Q07, the utilized economic capital for theGroup fell by 3%, due to a reduction in overall position risk.For Investment Banking, utilized economic capital decreased5%, mainly due to a significant reduction in international lend-ing and counterparty exposures due to increased buying ofcredit protection and reduced loan exposures within the lever-aged finance business. This was partially offset by increasedemerging market, credit spread and energy fixed income trad-ing position risk exposures. The utilized economic capital forWealth Management increased 13%, due to increased vol-umes in loans and leasing exposures, while Corporate & RetailBanking was flat. Asset Management utilized economic capitalincreased 3% as a result of increased equity trading andinvestments exposures.
Capital adequacy trends in 2Q07
The economic capital coverage ratio remained strong, increas-ing from 163% to 172% over 2Q07 due to increases in Tier 1capital and decreases in utilized economic capital. Followingthe sale of our insurance business in December 2006, thecoverage ratio increased to 172%, which was beyond our tar-get band of 100% to 140%. We expect to see a decline in thecoverage ratio over time as we continue to deploy capital inour business and return capital to shareholders.
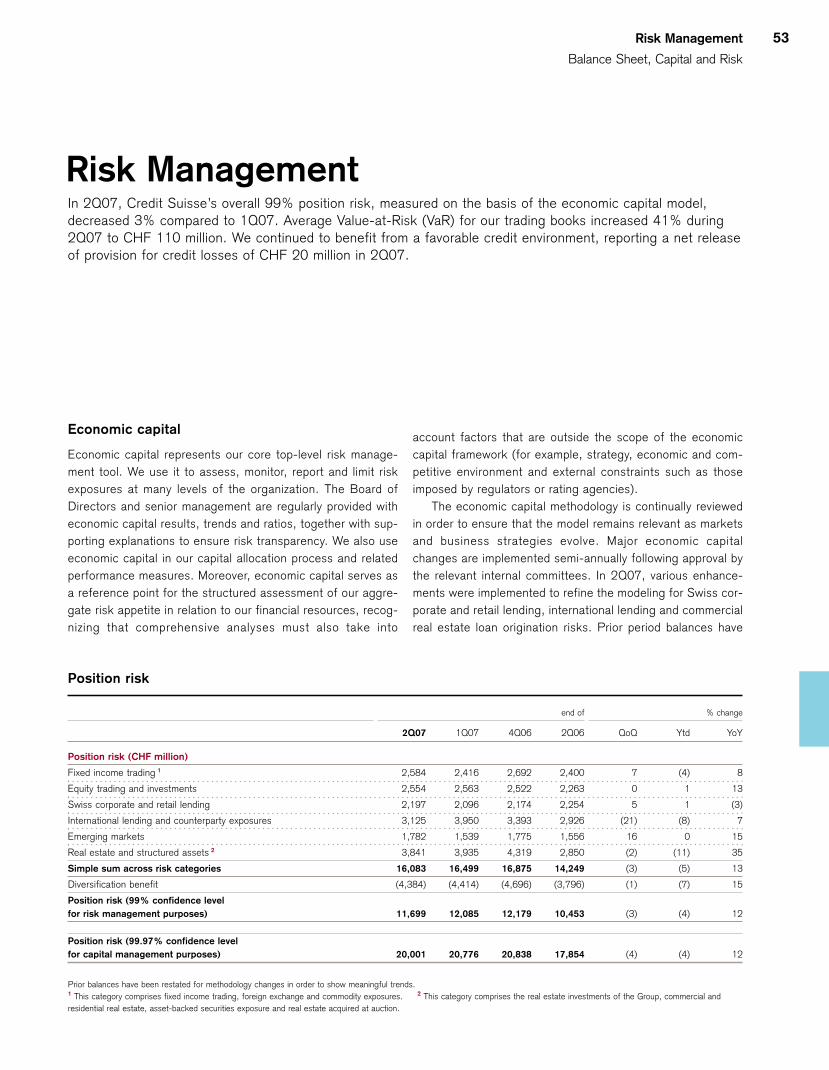
Risk Management
Balance Sheet, Capital and Risk
53
Risk ManagementIn 2Q07, Credit Suisse’s overall 99% position risk, measured on the basis of the economic capital model,decreased 3% compared to 1Q07. Average Value-at-Risk (VaR) for our trading books increased 41% during2Q07 to CHF 110 million. We continued to benefit from a favorable credit environment, reporting a net releaseof provision for credit losses of CHF 20 million in 2Q07.
Position risk
end of % change
2Q07 1Q07 4Q06 2Q06 QoQ Ytd YoY
Position risk (CHF million)
Fixed income trading 1 2,584 2,416 2,692 2,400 7 (4) 8
Equity trading and investments 2,554 2,563 2,522 2,263 0 1 13
Swiss corporate and retail lending 2,197 2,096 2,174 2,254 5 1 (3)
International lending and counterparty exposures 3,125 3,950 3,393 2,926 (21) (8) 7
Emerging markets 1,782 1,539 1,775 1,556 16 0 15
Real estate and structured assets 2 3,841 3,935 4,319 2,850 (2) (11) 35
Simple sum across risk categories 16,083 16,499 16,875 14,249 (3) (5) 13
Diversification benefit (4,384) (4,414) (4,696) (3,796) (1) (7) 15
Position risk (99% confidence level for risk management purposes) 11,699 12,085 12,179 10,453 (3) (4) 12
Position risk (99.97% confidence level for capital management purposes) 20,001 20,776 20,838 17,854 (4) (4) 12
Prior balances have been restated for methodology changes in order to show meaningful trends.1 This category comprises fixed income trading, foreign exchange and commodity exposures. 2 This category comprises the real estate investments of the Group, commercial andresidential real estate, asset-backed securities exposure and real estate acquired at auction.
Economic capital
Economic capital represents our core top-level risk manage-ment tool. We use it to assess, monitor, report and limit riskexposures at many levels of the organization. The Board ofDirectors and senior management are regularly provided witheconomic capital results, trends and ratios, together with sup-porting explanations to ensure risk transparency. We also useeconomic capital in our capital allocation process and relatedperformance measures. Moreover, economic capital serves asa reference point for the structured assessment of our aggre-gate risk appetite in relation to our financial resources, recog-nizing that comprehensive analyses must also take into
account factors that are outside the scope of the economiccapital framework (for example, strategy, economic and com-petitive environment and external constraints such as thoseimposed by regulators or rating agencies).
The economic capital methodology is continually reviewedin order to ensure that the model remains relevant as marketsand business strategies evolve. Major economic capitalchanges are implemented semi-annually following approval bythe relevant internal committees. In 2Q07, various enhance-ments were implemented to refine the modeling for Swiss cor-porate and retail lending, international lending and commercialreal estate loan origination risks. Prior period balances have
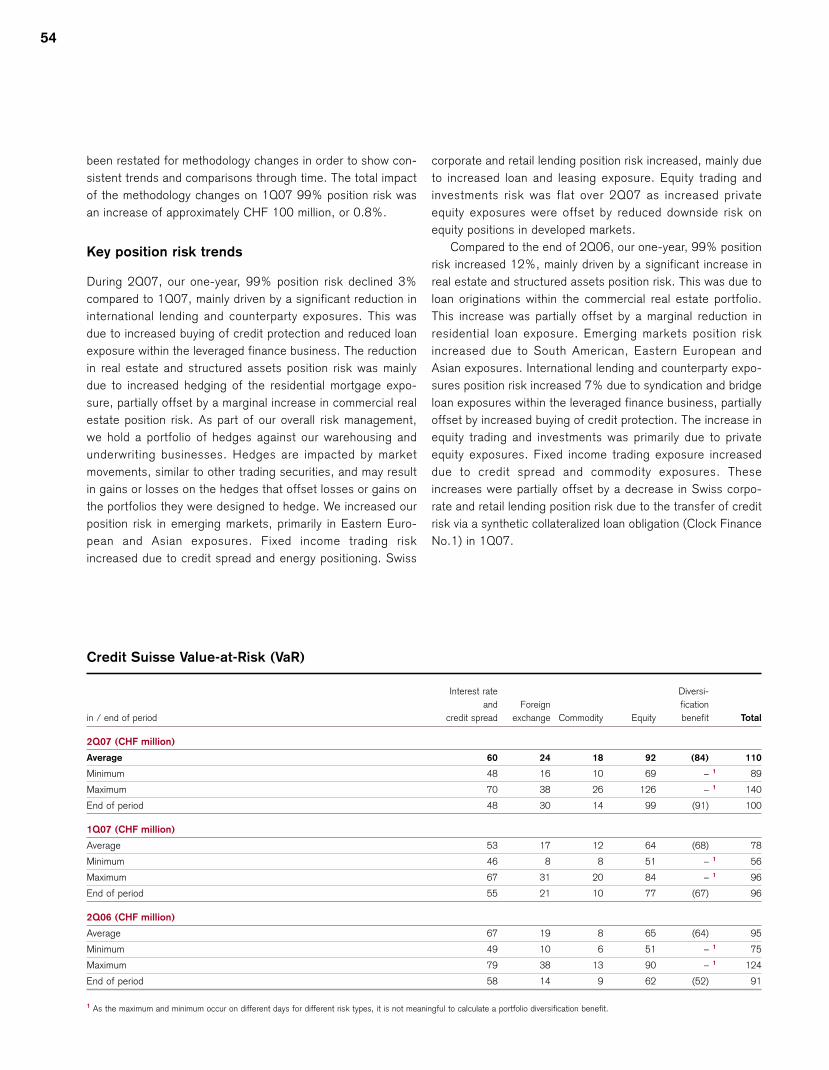
been restated for methodology changes in order to show con-sistent trends and comparisons through time. The total impactof the methodology changes on 1Q07 99% position risk wasan increase of approximately CHF 100 million, or 0.8%.
Key position risk trends
During 2Q07, our one-year, 99% position risk declined 3%compared to 1Q07, mainly driven by a significant reduction ininternational lending and counterparty exposures. This wasdue to increased buying of credit protection and reduced loanexposure within the leveraged finance business. The reductionin real estate and structured assets position risk was mainlydue to increased hedging of the residential mortgage expo-sure, partially offset by a marginal increase in commercial realestate position risk. As part of our overall risk management,we hold a portfolio of hedges against our warehousing andunderwriting businesses. Hedges are impacted by marketmovements, similar to other trading securities, and may resultin gains or losses on the hedges that offset losses or gains onthe portfolios they were designed to hedge. We increased ourposition risk in emerging markets, primarily in Eastern Euro-pean and Asian exposures. Fixed income trading riskincreased due to credit spread and energy positioning. Swiss
corporate and retail lending position risk increased, mainly dueto increased loan and leasing exposure. Equity trading andinvestments risk was flat over 2Q07 as increased privateequity exposures were offset by reduced downside risk onequity positions in developed markets.
Compared to the end of 2Q06, our one-year, 99% positionrisk increased 12%, mainly driven by a significant increase inreal estate and structured assets position risk. This was due toloan originations within the commercial real estate portfolio.This increase was partially offset by a marginal reduction inresidential loan exposure. Emerging markets position riskincreased due to South American, Eastern European andAsian exposures. International lending and counterparty expo-sures position risk increased 7% due to syndication and bridgeloan exposures within the leveraged finance business, partiallyoffset by increased buying of credit protection. The increase inequity trading and investments was primarily due to privateequity exposures. Fixed income trading exposure increaseddue to credit spread and commodity exposures. Theseincreases were partially offset by a decrease in Swiss corpo-rate and retail lending position risk due to the transfer of creditrisk via a synthetic collateralized loan obligation (Clock FinanceNo.1) in 1Q07.
54
Credit Suisse Value-at-Risk (VaR)
Interest rate Diversi-and Foreign fication
in / end of period credit spread exchange Commodity Equity benefit Total
2Q07 (CHF million)
Average 60 24 18 92 (84) 110
Minimum 48 16 10 69 – 1 89
Maximum 70 38 26 126 – 1 140
End of period 48 30 14 99 (91) 100
1Q07 (CHF million)
Average 53 17 12 64 (68) 78
Minimum 46 8 8 51 – 1 56
Maximum 67 31 20 84 – 1 96
End of period 55 21 10 77 (67) 96
2Q06 (CHF million)
Average 67 19 8 65 (64) 95
Minimum 49 10 6 51 – 1 75
Maximum 79 38 13 90 – 1 124
End of period 58 14 9 62 (52) 91
1 As the maximum and minimum occur on different days for different risk types, it is not meaningful to calculate a portfolio diversification benefit.
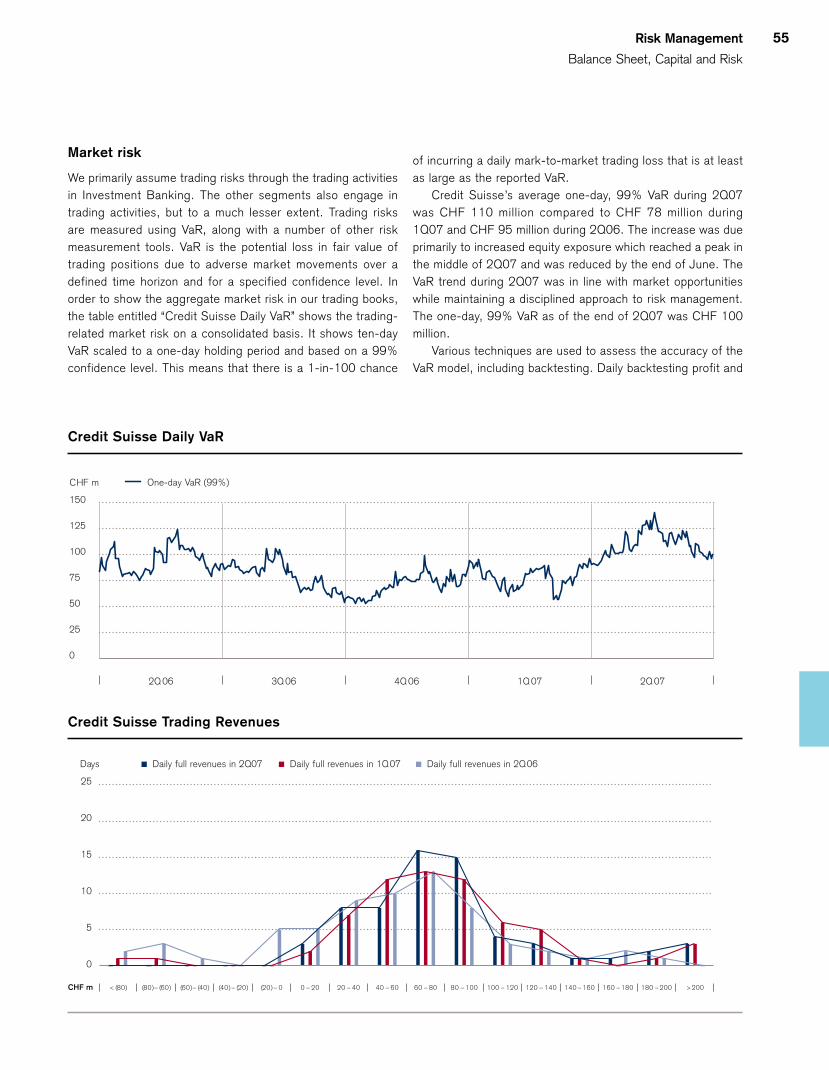
Risk Management
Balance Sheet, Capital and Risk
55
Market risk
We primarily assume trading risks through the trading activitiesin Investment Banking. The other segments also engage intrading activities, but to a much lesser extent. Trading risksare measured using VaR, along with a number of other riskmeasurement tools. VaR is the potential loss in fair value oftrading positions due to adverse market movements over adefined time horizon and for a specified confidence level. Inorder to show the aggregate market risk in our trading books,the table entitled “Credit Suisse Daily VaR” shows the trading-related market risk on a consolidated basis. It shows ten-dayVaR scaled to a one-day holding period and based on a 99%confidence level. This means that there is a 1-in-100 chance
of incurring a daily mark-to-market trading loss that is at leastas large as the reported VaR.
Credit Suisse’s average one-day, 99% VaR during 2Q07was CHF 110 million compared to CHF 78 million during1Q07 and CHF 95 million during 2Q06. The increase was dueprimarily to increased equity exposure which reached a peak inthe middle of 2Q07 and was reduced by the end of June. TheVaR trend during 2Q07 was in line with market opportunitieswhile maintaining a disciplined approach to risk management.The one-day, 99% VaR as of the end of 2Q07 was CHF 100million.
Various techniques are used to assess the accuracy of theVaR model, including backtesting. Daily backtesting profit and
150
125
100
75
50
25
0
CHF m
2Q 06 3Q 06 4Q 06 1Q 07 2Q 07
One-day VaR (99%)
Credit Suisse Daily VaR
25
20
15
10
5
0
< (80) (60) – (40)(80) – (60) (20) – 0(40) – (20) 0 – 20 40 – 6020 – 40 60 – 80 120 – 140100 – 12080 – 100 140 – 160 160 – 180 180 – 200
Daily full revenues in 2Q07 Daily full revenues in 2Q06Daily full revenues in 1Q07
> 200
Days
CHF m
Credit Suisse Trading Revenues
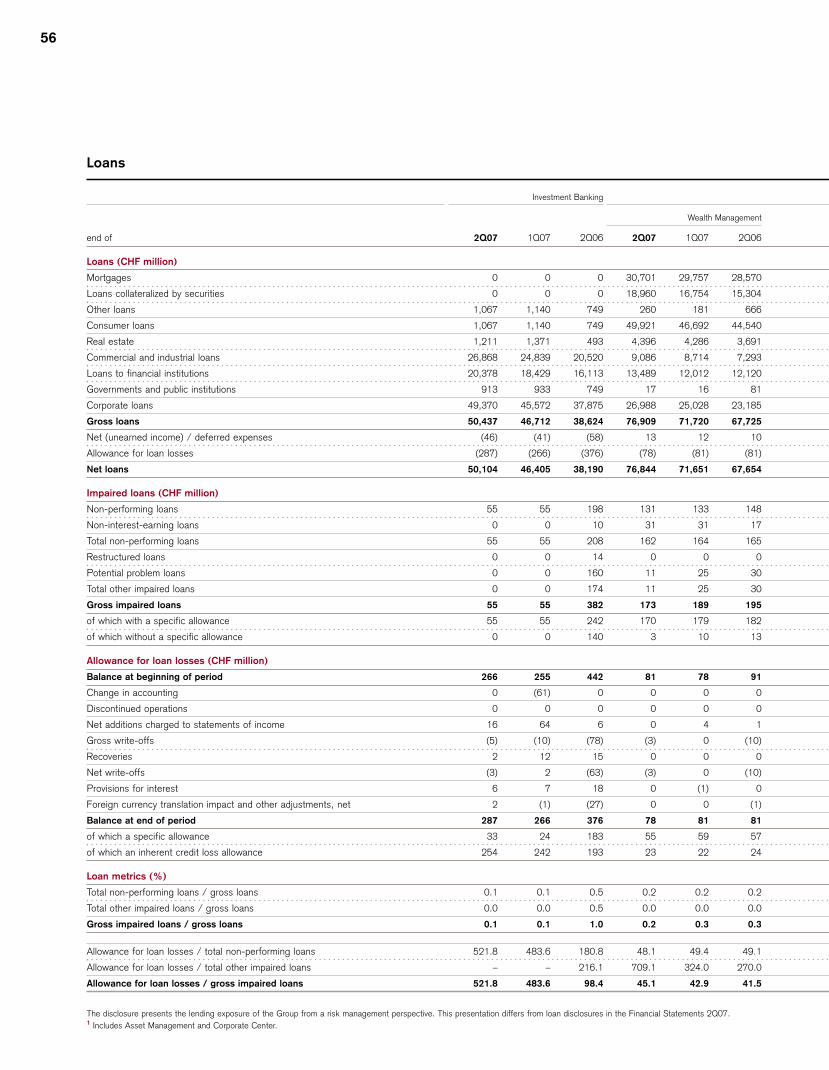
56
Loans
Investment Banking
Wealth Management
end of 2Q07 1Q07 2Q06 2Q07 1Q07 2Q06
Loans (CHF million)
Mortgages 0 0 0 30,701 29,757 28,570
Loans collateralized by securities 0 0 0 18,960 16,754 15,304
Other loans 1,067 1,140 749 260 181 666
Consumer loans 1,067 1,140 749 49,921 46,692 44,540
Real estate 1,211 1,371 493 4,396 4,286 3,691
Commercial and industrial loans 26,868 24,839 20,520 9,086 8,714 7,293
Loans to financial institutions 20,378 18,429 16,113 13,489 12,012 12,120
Governments and public institutions 913 933 749 17 16 81
Corporate loans 49,370 45,572 37,875 26,988 25,028 23,185
Gross loans 50,437 46,712 38,624 76,909 71,720 67,725
Net (unearned income) / deferred expenses (46) (41) (58) 13 12 10
Allowance for loan losses (287) (266) (376) (78) (81) (81)
Net loans 50,104 46,405 38,190 76,844 71,651 67,654
Impaired loans (CHF million)
Non-performing loans 55 55 198 131 133 148
Non-interest-earning loans 0 0 10 31 31 17
Total non-performing loans 55 55 208 162 164 165
Restructured loans 0 0 14 0 0 0
Potential problem loans 0 0 160 11 25 30
Total other impaired loans 0 0 174 11 25 30
Gross impaired loans 55 55 382 173 189 195
of which with a specific allowance 55 55 242 170 179 182
of which without a specific allowance 0 0 140 3 10 13
Allowance for loan losses (CHF million)
Balance at beginning of period 266 255 442 81 78 91
Change in accounting 0 (61) 0 0 0 0
Discontinued operations 0 0 0 0 0 0
Net additions charged to statements of income 16 64 6 0 4 1
Gross write-offs (5) (10) (78) (3) 0 (10)
Recoveries 2 12 15 0 0 0
Net write-offs (3) 2 (63) (3) 0 (10)
Provisions for interest 6 7 18 0 (1) 0
Foreign currency translation impact and other adjustments, net 2 (1) (27) 0 0 (1)
Balance at end of period 287 266 376 78 81 81
of which a specific allowance 33 24 183 55 59 57
of which an inherent credit loss allowance 254 242 193 23 22 24
Loan metrics (%)
Total non-performing loans / gross loans 0.1 0.1 0.5 0.2 0.2 0.2
Total other impaired loans / gross loans 0.0 0.0 0.5 0.0 0.0 0.0
Gross impaired loans / gross loans 0.1 0.1 1.0 0.2 0.3 0.3
Allowance for loan losses / total non-performing loans 521.8 483.6 180.8 48.1 49.4 49.1
Allowance for loan losses / total other impaired loans – – 216.1 709.1 324.0 270.0
Allowance for loan losses / gross impaired loans 521.8 483.6 98.4 45.1 42.9 41.5
The disclosure presents the lending exposure of the Group from a risk management perspective. This presentation differs from loan disclosures in the Financial Statements 2Q07.1 Includes Asset Management and Corporate Center.
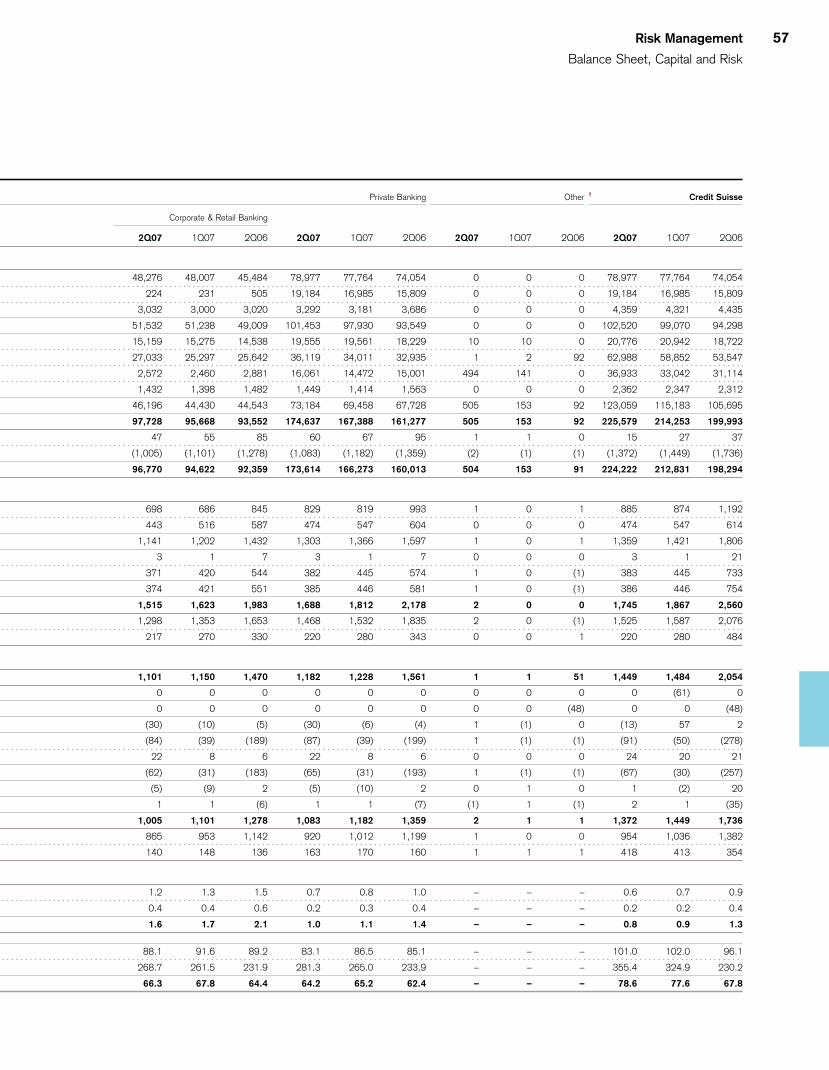
Risk Management
Balance Sheet, Capital and Risk
57
Private Banking Other 1 Credit Suisse
Corporate & Retail Banking
2Q07 1Q07 2Q06 2Q07 1Q07 2Q06 2Q07 1Q07 2Q06 2Q07 1Q07 2Q06
48,276 48,007 45,484 78,977 77,764 74,054 0 0 0 78,977 77,764 74,054
224 231 505 19,184 16,985 15,809 0 0 0 19,184 16,985 15,809
3,032 3,000 3,020 3,292 3,181 3,686 0 0 0 4,359 4,321 4,435
51,532 51,238 49,009 101,453 97,930 93,549 0 0 0 102,520 99,070 94,298
15,159 15,275 14,538 19,555 19,561 18,229 10 10 0 20,776 20,942 18,722
27,033 25,297 25,642 36,119 34,011 32,935 1 2 92 62,988 58,852 53,547
2,572 2,460 2,881 16,061 14,472 15,001 494 141 0 36,933 33,042 31,114
1,432 1,398 1,482 1,449 1,414 1,563 0 0 0 2,362 2,347 2,312
46,196 44,430 44,543 73,184 69,458 67,728 505 153 92 123,059 115,183 105,695
97,728 95,668 93,552 174,637 167,388 161,277 505 153 92 225,579 214,253 199,993
47 55 85 60 67 95 1 1 0 15 27 37
(1,005) (1,101) (1,278) (1,083) (1,182) (1,359) (2) (1) (1) (1,372) (1,449) (1,736)
96,770 94,622 92,359 173,614 166,273 160,013 504 153 91 224,222 212,831 198,294
698 686 845 829 819 993 1 0 1 885 874 1,192
443 516 587 474 547 604 0 0 0 474 547 614
1,141 1,202 1,432 1,303 1,366 1,597 1 0 1 1,359 1,421 1,806
3 1 7 3 1 7 0 0 0 3 1 21
371 420 544 382 445 574 1 0 (1) 383 445 733
374 421 551 385 446 581 1 0 (1) 386 446 754
1,515 1,623 1,983 1,688 1,812 2,178 2 0 0 1,745 1,867 2,560
1,298 1,353 1,653 1,468 1,532 1,835 2 0 (1) 1,525 1,587 2,076
217 270 330 220 280 343 0 0 1 220 280 484
1,101 1,150 1,470 1,182 1,228 1,561 1 1 51 1,449 1,484 2,054
0 0 0 0 0 0 0 0 0 0 (61) 0
0 0 0 0 0 0 0 0 (48) 0 0 (48)
(30) (10) (5) (30) (6) (4) 1 (1) 0 (13) 57 2
(84) (39) (189) (87) (39) (199) 1 (1) (1) (91) (50) (278)
22 8 6 22 8 6 0 0 0 24 20 21
(62) (31) (183) (65) (31) (193) 1 (1) (1) (67) (30) (257)
(5) (9) 2 (5) (10) 2 0 1 0 1 (2) 20
1 1 (6) 1 1 (7) (1) 1 (1) 2 1 (35)
1,005 1,101 1,278 1,083 1,182 1,359 2 1 1 1,372 1,449 1,736
865 953 1,142 920 1,012 1,199 1 0 0 954 1,036 1,382
140 148 136 163 170 160 1 1 1 418 413 354
1.2 1.3 1.5 0.7 0.8 1.0 – – – 0.6 0.7 0.9
0.4 0.4 0.6 0.2 0.3 0.4 – – – 0.2 0.2 0.4
1.6 1.7 2.1 1.0 1.1 1.4 – – – 0.8 0.9 1.3
88.1 91.6 89.2 83.1 86.5 85.1 – – – 101.0 102.0 96.1
268.7 261.5 231.9 281.3 265.0 233.9 – – – 355.4 324.9 230.2
66.3 67.8 64.4 64.2 65.2 62.4 – – – 78.6 77.6 67.8
Banking and Private Banking. The credit risks taken on by Pri-vate Banking are usually collateralized. In Investment Banking,a significant portion of credit risk-related businesses are miti-gated through cash and marketable collateral or transferred tothe market by credit derivatives largely reducing credit risk ineconomic terms.
Loan exposure
Total gross loan exposure increased 5% to CHF 225.6 billionas of the end of 2Q07, compared to 1Q07. In InvestmentBanking, gross loan exposure increased 8% to CHF 50.4 bil-lion, due to increases in commercial and industrial loans and inloans to financial institutions. Gross loan exposure in PrivateBanking increased 4% to CHF 174.6 billion, driven primarilyby an increase in loans collateralized by securities in WealthManagement and an increase in commercial and industrialloans in Corporate & Retail Banking.
Total non-performing loans declined 4% and grossimpaired loans declined 7%, due to a reduction in non-per-forming loans and other impaired loans in Private Banking, pri-marily in Corporate & Retail Banking. Coverage of totalimpaired loans by valuation allowances and coverage of totalnon-performing loans by valuation allowances were stable at79% and 101%, respectively. We recorded a net release ofprovision for credit losses of CHF 20 million, compared to netnew provisions of CHF 53 million in 1Q07.
Total gross loan exposure increased CHF 25.6 billion, or13%, compared to 2Q06, reflecting the growing businesses inPrivate Banking and Investment Banking. During the lasttwelve months, gross loan exposure in Investment Bankingincreased from CHF 38.6 billion to CHF 50.4 billion, mainlydue to increases in commercial and industrial loans and loansto financial institutions. In Private Banking, gross loan expo-sure increased from CHF 161.3 billion to CHF 174.6 billion,primarily due to new mortgages and loans collateralized bysecurities.
Total non-performing loans declined 25% and grossimpaired loans declined 32%, compared to 2Q06, driven by asubstantial reduction in non-performing loans in InvestmentBanking as well as reductions in Private Banking. We recordeda net release of provision for credit losses of CHF 20 million,compared to net new provisions of CHF 10 million in 2Q06.
58
loss is compared to VaR calculated using a one-day holdingperiod. Backtesting profit and loss is a subset of actual tradingrevenue and includes only the profit and loss effects frommovements in financial market variables such as interest rates,equity prices and foreign exchange rates on the previousnight’s positions. A backtesting exception occurs when thedaily backtesting loss exceeds the daily VaR estimate. Weexperienced no backtesting exceptions during 2Q07, and atotal of two backtesting exceptions in the preceding 12months.
We regularly review our VaR model to ensure that itremains appropriate given evolving market conditions and thecomposition of our trading portfolio. During 2Q07, we contin-ued to extend the length of the historical data set used in theVaR model beyond two years in order to capture more histori-cal events. Given current positions and market conditions,these changes will tend to make the VaR model more conser-vative.
The histogram entitled “Credit Suisse Trading Revenue”reflects the distribution of daily actual trading revenues during2Q07, 1Q07 and 2Q06. The width of this distribution providesanother indication of the day-to-day risk in our trading activi-ties.
We assume non-trading interest rate risks through interestrate-sensitive positions originated by Private Banking and risk-transferred to Global Treasury, money market and fundingactivities by Global Treasury and the deployment of our consol-idated equity as well as other activities, including market-mak-ing and trading activities involving banking book positions atthe divisions. Savings accounts and many other retail bankingproducts have no contractual maturity date or direct market-linked interest rate and are risk-transferred from Private Bank-ing to Global Treasury on a pooled basis using replicating port-folios (approximating the re-pricing behavior of the underlyingproduct). Global Treasury, as well as other desks running inter-est rate risk positions, actively manage their position withinapproved limits.
The impact of a one basis point parallel increase of theyield curves on the fair value of interest rate-sensitive non-trading book positions would have amounted to CHF 2.7 mil-lion as of the end of 2Q07, compared to CHF 3.6 million as ofthe end of 1Q07. The change was mainly due to a shorterduration on our deployed equity and the reclassification of cer-tain structured products from the banking to the trading book.
Credit risk
We encounter credit risk in our lending-related businesses, incounterparty trading and through issuer risk in trading assets.The majority of our credit risk is concentrated in Investment
Financial Review
2Q 0760 Highlights from the Condensed Consolidated
Financial Statements – unaudited
This section contains highlights from our US GAAPCondensed Consolidated Financial Statements including thestatements of income, balance sheets, statements of changesin shareholders’ equity and selected notes. The Credit SuisseGroup Financial Statements 2Q07 are available on the internetat www.credit-suisse.com/results.
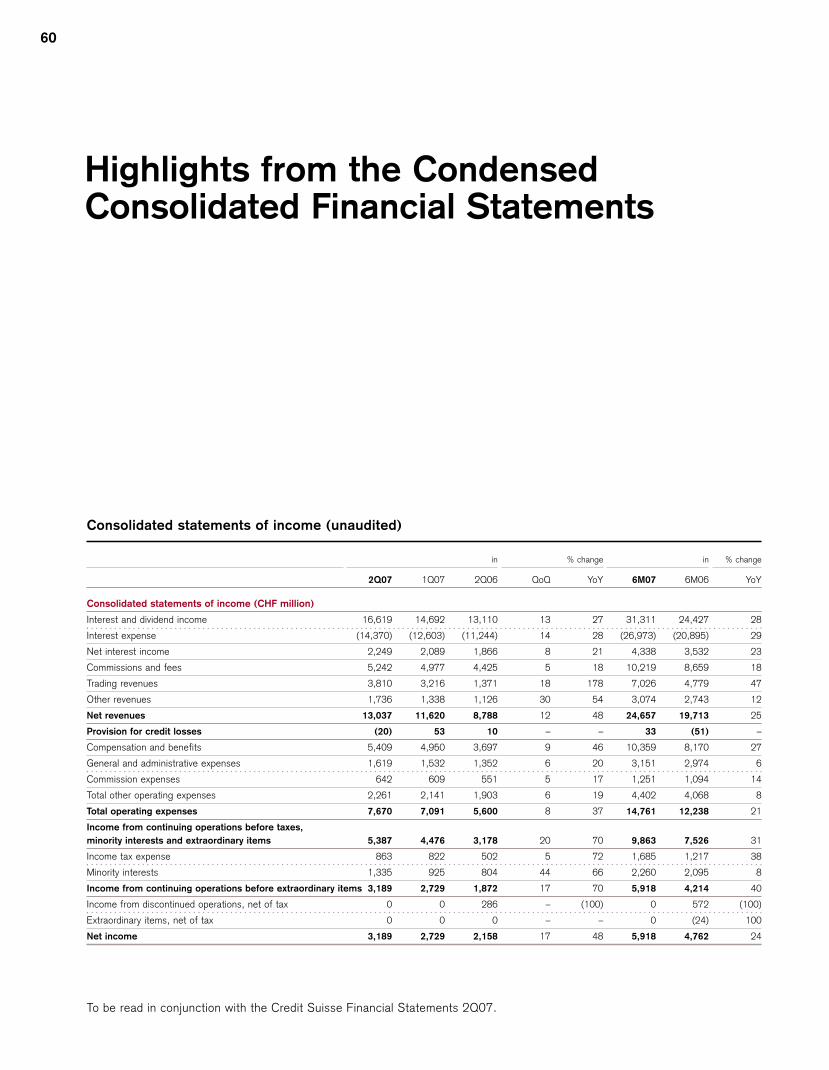
60
Highlights from the CondensedConsolidated Financial Statements
Consolidated statements of income (unaudited)
in % change in % change
2Q07 1Q07 2Q06 QoQ YoY 6M07 6M06 YoY
Consolidated statements of income (CHF million)
Interest and dividend income 16,619 14,692 13,110 13 27 31,311 24,427 28
Interest expense (14,370) (12,603) (11,244) 14 28 (26,973) (20,895) 29
Net interest income 2,249 2,089 1,866 8 21 4,338 3,532 23
Commissions and fees 5,242 4,977 4,425 5 18 10,219 8,659 18
Trading revenues 3,810 3,216 1,371 18 178 7,026 4,779 47
Other revenues 1,736 1,338 1,126 30 54 3,074 2,743 12
Net revenues 13,037 11,620 8,788 12 48 24,657 19,713 25
Provision for credit losses (20) 53 10 – – 33 (51) –
Compensation and benefits 5,409 4,950 3,697 9 46 10,359 8,170 27
General and administrative expenses 1,619 1,532 1,352 6 20 3,151 2,974 6
Commission expenses 642 609 551 5 17 1,251 1,094 14
Total other operating expenses 2,261 2,141 1,903 6 19 4,402 4,068 8
Total operating expenses 7,670 7,091 5,600 8 37 14,761 12,238 21
Income from continuing operations before taxes, minority interests and extraordinary items 5,387 4,476 3,178 20 70 9,863 7,526 31
Income tax expense 863 822 502 5 72 1,685 1,217 38
Minority interests 1,335 925 804 44 66 2,260 2,095 8
Income from continuing operations before extraordinary items 3,189 2,729 1,872 17 70 5,918 4,214 40
Income from discontinued operations, net of tax 0 0 286 – (100) 0 572 (100)
Extraordinary items, net of tax 0 0 0 – – 0 (24) 100
Net income 3,189 2,729 2,158 17 48 5,918 4,762 24
To be read in conjunction with the Credit Suisse Financial Statements 2Q07.
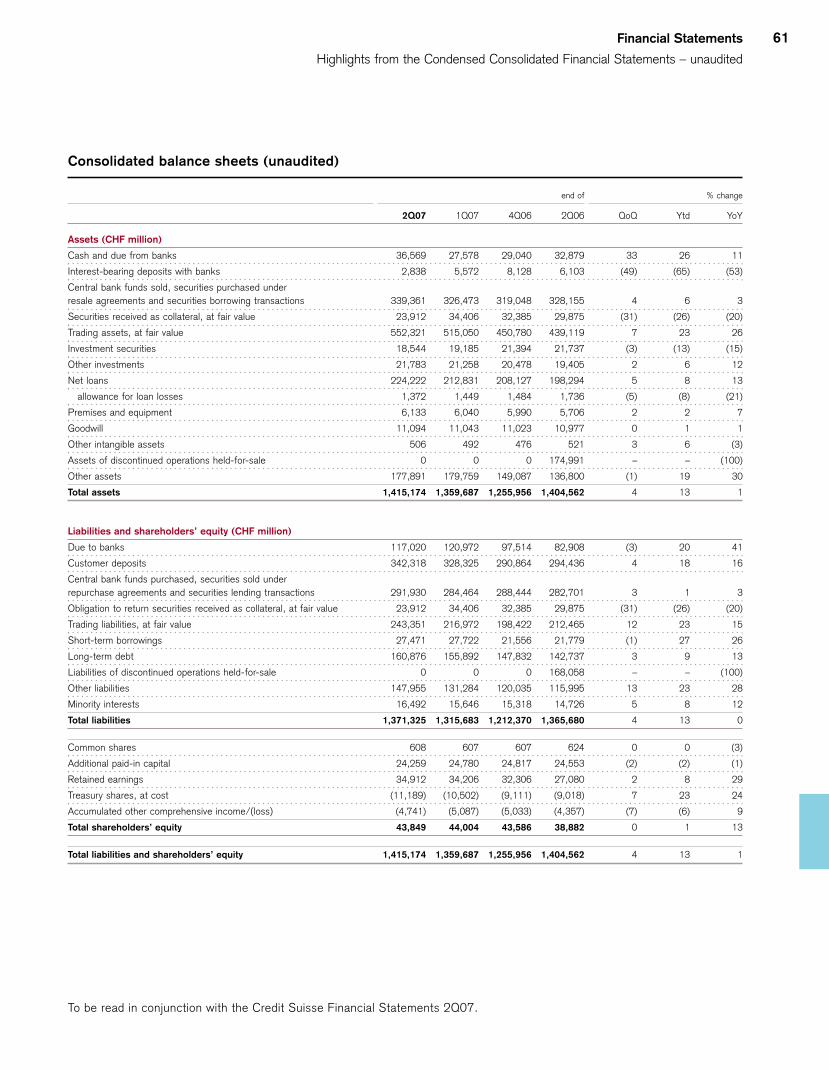
Financial Statements
Highlights from the Condensed Consolidated Financial Statements – unaudited
61
Consolidated balance sheets (unaudited)
end of % change
2Q07 1Q07 4Q06 2Q06 QoQ Ytd YoY
Assets (CHF million)
Cash and due from banks 36,569 27,578 29,040 32,879 33 26 11
Interest-bearing deposits with banks 2,838 5,572 8,128 6,103 (49) (65) (53)
Central bank funds sold, securities purchased under resale agreements and securities borrowing transactions 339,361 326,473 319,048 328,155 4 6 3
Securities received as collateral, at fair value 23,912 34,406 32,385 29,875 (31) (26) (20)
Trading assets, at fair value 552,321 515,050 450,780 439,119 7 23 26
Investment securities 18,544 19,185 21,394 21,737 (3) (13) (15)
Other investments 21,783 21,258 20,478 19,405 2 6 12
Net loans 224,222 212,831 208,127 198,294 5 8 13
allowance for loan losses 1,372 1,449 1,484 1,736 (5) (8) (21)
Premises and equipment 6,133 6,040 5,990 5,706 2 2 7
Goodwill 11,094 11,043 11,023 10,977 0 1 1
Other intangible assets 506 492 476 521 3 6 (3)
Assets of discontinued operations held-for-sale 0 0 0 174,991 – – (100)
Other assets 177,891 179,759 149,087 136,800 (1) 19 30
Total assets 1,415,174 1,359,687 1,255,956 1,404,562 4 13 1
Liabilities and shareholders’ equity (CHF million)
Due to banks 117,020 120,972 97,514 82,908 (3) 20 41
Customer deposits 342,318 328,325 290,864 294,436 4 18 16
Central bank funds purchased, securities sold under repurchase agreements and securities lending transactions 291,930 284,464 288,444 282,701 3 1 3
Obligation to return securities received as collateral, at fair value 23,912 34,406 32,385 29,875 (31) (26) (20)
Trading liabilities, at fair value 243,351 216,972 198,422 212,465 12 23 15
Short-term borrowings 27,471 27,722 21,556 21,779 (1) 27 26
Long-term debt 160,876 155,892 147,832 142,737 3 9 13
Liabilities of discontinued operations held-for-sale 0 0 0 168,058 – – (100)
Other liabilities 147,955 131,284 120,035 115,995 13 23 28
Minority interests 16,492 15,646 15,318 14,726 5 8 12
Total liabilities 1,371,325 1,315,683 1,212,370 1,365,680 4 13 0
Common shares 608 607 607 624 0 0 (3)
Additional paid-in capital 24,259 24,780 24,817 24,553 (2) (2) (1)
Retained earnings 34,912 34,206 32,306 27,080 2 8 29
Treasury shares, at cost (11,189) (10,502) (9,111) (9,018) 7 23 24
Accumulated other comprehensive income/(loss) (4,741) (5,087) (5,033) (4,357) (7) (6) 9
Total shareholders’ equity 43,849 44,004 43,586 38,882 0 1 13
Total liabilities and shareholders’ equity 1,415,174 1,359,687 1,255,956 1,404,562 4 13 1
To be read in conjunction with the Credit Suisse Financial Statements 2Q07.

62
Consolidated statements of changes in shareholders’ equity (unaudited)
Accumu- Total Number of Additional Treasury lated other share- common
Common paid-in Retained shares, comprehen- holders’ shares shares capital earnings at cost sive income equity outstanding
6M07 (CHF million)
Balance at beginning of period 607 24,817 32,306 (9,111) (5,033) 43,586 1,062,467,061 1
Net income – – 5,918 – – 5,918 –
Cumulative effect of accounting changes, net of tax – – (829) – 10 (819) 2 –
Other comprehensive income, net of tax – – – – 282 282 –
Issuance of common shares 1 43 – – – 44 995,655
Issuance of treasury shares – (25) – 17,128 – 17,103 195,928,526
Repurchase of treasury shares – – – (20,369) – (20,369) (233,132,103) 3
Share-based compensation, net of tax – (313) – 1,163 – 850 20,173,268
Derivatives indexed to own shares 4 – (263) – – – (263) –
Cash dividends paid – – (2,483) – – (2,483) –
Balance at end of period 608 24,259 34,912 (11,189) (4,741) 43,849 1,046,432,407 5
6M06 (CHF million)
Balance at beginning of period 624 24,639 24,584 (5,823) (1,906) 42,118 1,125,360,183
Net income – – 4,762 – – 4,762 –
Cumulative effect of accounting changes, net of tax – – 60 – – 60 –
Other comprehensive income/(loss), net of tax – – – – (2,451) (2,451) –
Issuance of common shares – 6 – – – 6 141,332
Issuance of treasury shares – (31) – 9,768 – 9,737 137,703,573
Repurchase of treasury shares – – – (13,621) – (13,621) (191,632,093)
Share-based compensation, net of tax – (61) – 658 – 597 16,047,551
Cash dividends paid – – (2,326) – – (2,326) –
Balance at end of period 624 24,553 27,080 (9,018) (4,357) 38,882 1,087,620,546
1 At par value CHF 0.50 each, fully paid, net of 152,394,952 treasury shares. In addition to the treasury shares, a maximum of 198,476,240 unissued shares (conditional and authorizedcapital) were available for issuance without further approval of the shareholders. 2 Includes CHF 187 million related to SFAS 157, CHF (1,003) million related to SFAS 159, CHF (13)million related to FIN 48 and CHF 10 million reclassified from accumulated other comprehensive income as a result of SFAS 159, all net of tax. 3 Includes 26,074,000 sharesrepurchased in connection with Credit Suisse Group’s share buyback programs. 4 The Group has purchased certain call options on its own shares to economically hedge all or a portionof the Leverage Units element of the Incentive Share Units (ISU) granted to the employees during 1Q07. In accordance with EITF 00-19, these call options are designated as equityinstruments and, as such, are initially recognized in shareholders’ equity at their fair values and not subsequently remeasured. 5 At par value CHF 0.50 each, fully paid, net of169,425,261 treasury shares, of which 53,789,000 shares have been approved at the Annual General Meeting on May 4, 2007, for cancellation which took place in 3Q07. In addition tothe remaining treasury shares of 115,636,261, a maximum of 197,435,597 unissued shares (conditional and authorized capital) were available for issuance without further approval of theshareholders.
Comprehensive income (unaudited)
in % change in % change
2Q07 1Q07 2Q06 QoQ YoY 6M07 6M06 YoY
Comprehensive income (CHF million)
Net income 3,189 2,729 2,158 17 48 5,918 4,762 24
Other comprehensive income/(loss), net of tax 346 (64) (1,748) – – 282 (2,451) –
Comprehensive income 3,535 2,665 410 33 – 6,200 2,311 168
To be read in conjunction with the Credit Suisse Financial Statements 2Q07.

Notes
Highlights from the Condensed Consolidated Financial Statements – unaudited
63
Selected Notes to the CondensedConsolidated Financial Statements –unaudited
Net interest income
in % change in % change
2Q07 1Q07 2Q06 QoQ YoY 6M07 6M06 YoY
Net interest income (CHF million)
Loans 2,131 2,047 1,848 4 15 4,178 3,573 17
Investment securities 187 189 163 (1) 15 376 325 16
Trading assets 6,458 5,482 4,788 18 35 11,940 8,831 35
Central bank funds sold, securities purchased under resale agreements and securities borrowing transactions 5,929 5,316 5,034 12 18 11,245 9,378 20
Other 1,914 1,658 1,277 15 50 3,572 2,320 54
Interest and dividend income 16,619 14,692 13,110 13 27 31,311 24,427 28
Deposits (4,168) (3,704) (2,938) 13 42 (7,872) (5,581) 41
Short-term borrowings (286) (218) (162) 31 77 (504) (281) 79
Trading liabilities (2,689) (2,098) (2,077) 28 29 (4,787) (3,493) 37
Central bank funds purchased, securities sold under repurchase agreements and securities lending transactions (5,436) (4,831) (4,619) 13 18 (10,267) (8,684) 18
Long-term debt (1,204) (1,243) (1,074) (3) 12 (2,447) (2,172) 13
Other (587) (509) (374) 15 57 (1,096) (684) 60
Interest expense (14,370) (12,603) (11,244) 14 28 (26,973) (20,895) 29
Net interest income 2,249 2,089 1,866 8 21 4,338 3,532 23
Commissions and fees
in % change in % change
2Q07 1Q07 2Q06 QoQ YoY 6M07 6M06 YoY
Commissions and fees (CHF million)
Lending business 661 647 452 2 46 1,308 781 67
Investment and portfolio management 1,510 1,445 1,314 4 15 2,955 2,575 15
Other securities business 61 56 37 9 65 117 97 21
Fiduciary 1,571 1,501 1,351 5 16 3,072 2,672 15
Underwriting 717 615 721 17 (1) 1,332 1,322 1
Brokerage 1,429 1,487 1,276 (4) 12 2,916 2,708 8
Underwriting and brokerage 2,146 2,102 1,997 2 7 4,248 4,030 5
Other customer services 864 727 625 19 38 1,591 1,176 35
Commissions and fees 5,242 4,977 4,425 5 18 10,219 8,659 18

64
Other revenues
in % change in % change
2Q07 1Q07 2Q06 QoQ YoY 6M07 6M06 YoY
Other revenues (CHF million)
Minority Interests without Significant Economic Interest 1,336 938 731 42 83 2,274 1,963 16
Loans held-for-sale (15) 2 31 – – (13) 39 –
Long-lived assets held-for-sale 9 6 2 50 350 15 3 400
Equity method investments 23 29 12 (21) 92 52 58 (10)
Other investments 259 263 308 (2) (16) 522 538 (3)
Other 124 100 42 24 195 224 142 58
Other revenues 1,736 1,338 1,126 30 54 3,074 2,743 12
Provision for credit losses
in % change in % change
2Q07 1Q07 2Q06 QoQ YoY 6M07 6M06 YoY
Provision for credit losses (CHF million)
Allowance for loan losses (13) 57 2 – – 44 (49) –
Provisions for lending-related and other exposures (7) (4) 8 75 – (11) (2) 450
Provision for credit losses (20) 53 10 – – 33 (51) –
Compensation and benefits
in % change in % change
2Q07 1Q07 2Q06 QoQ YoY 6M07 6M06 YoY
Compensation and benefits (CHF million)
Salaries and bonuses 4,877 4,473 3,242 9 50 9,350 7,275 29
Social security 325 247 234 32 39 572 482 19
Other 207 230 221 (10) (6) 437 413 6
Compensation and benefits 5,409 4,950 3,697 9 46 10,359 8,170 27
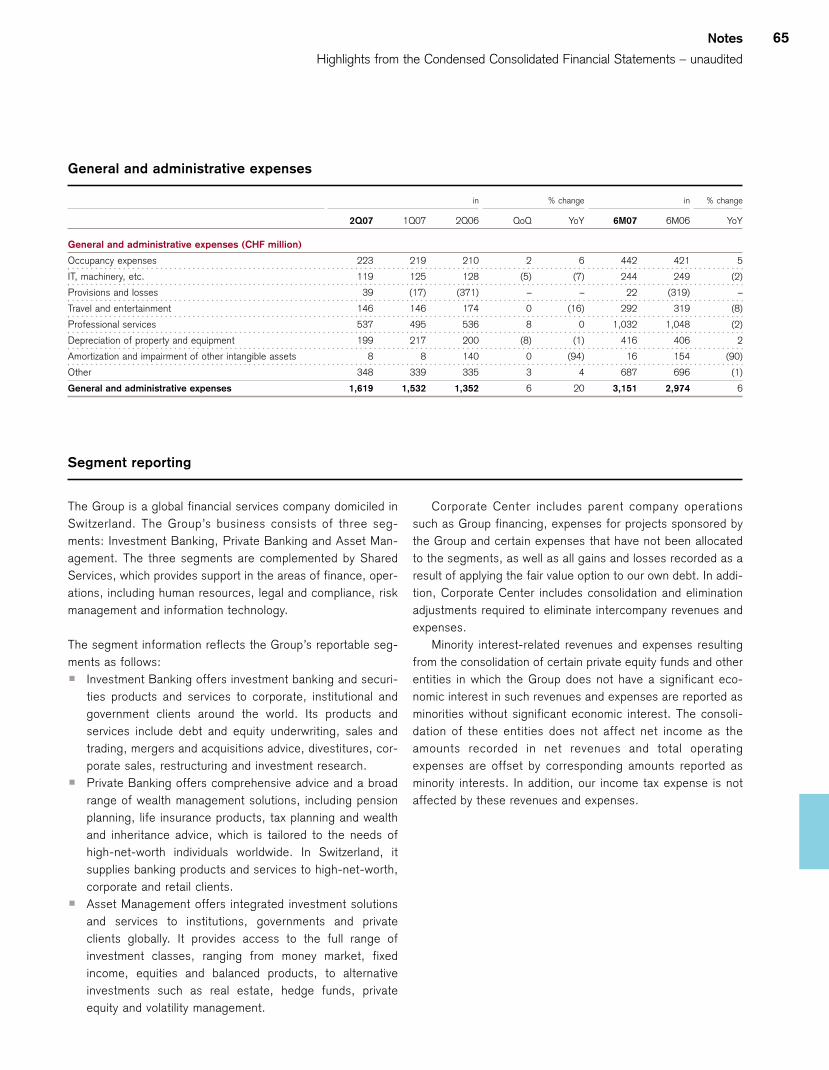
Notes
Highlights from the Condensed Consolidated Financial Statements – unaudited
65
General and administrative expenses
in % change in % change
2Q07 1Q07 2Q06 QoQ YoY 6M07 6M06 YoY
General and administrative expenses (CHF million)
Occupancy expenses 223 219 210 2 6 442 421 5
IT, machinery, etc. 119 125 128 (5) (7) 244 249 (2)
Provisions and losses 39 (17) (371) – – 22 (319) –
Travel and entertainment 146 146 174 0 (16) 292 319 (8)
Professional services 537 495 536 8 0 1,032 1,048 (2)
Depreciation of property and equipment 199 217 200 (8) (1) 416 406 2
Amortization and impairment of other intangible assets 8 8 140 0 (94) 16 154 (90)
Other 348 339 335 3 4 687 696 (1)
General and administrative expenses 1,619 1,532 1,352 6 20 3,151 2,974 6
The Group is a global financial services company domiciled inSwitzerland. The Group’s business consists of three seg-ments: Investment Banking, Private Banking and Asset Man-agement. The three segments are complemented by SharedServices, which provides support in the areas of finance, oper-ations, including human resources, legal and compliance, riskmanagement and information technology.
The segment information reflects the Group’s reportable seg-ments as follows:p Investment Banking offers investment banking and securi-
ties products and services to corporate, institutional andgovernment clients around the world. Its products andservices include debt and equity underwriting, sales andtrading, mergers and acquisitions advice, divestitures, cor-porate sales, restructuring and investment research.
p Private Banking offers comprehensive advice and a broadrange of wealth management solutions, including pensionplanning, life insurance products, tax planning and wealthand inheritance advice, which is tailored to the needs ofhigh-net-worth individuals worldwide. In Switzerland, itsupplies banking products and services to high-net-worth,corporate and retail clients.
p Asset Management offers integrated investment solutionsand services to institutions, governments and privateclients globally. It provides access to the full range ofinvestment classes, ranging from money market, fixedincome, equities and balanced products, to alternativeinvestments such as real estate, hedge funds, privateequity and volatility management.
Corporate Center includes parent company operationssuch as Group financing, expenses for projects sponsored bythe Group and certain expenses that have not been allocatedto the segments, as well as all gains and losses recorded as aresult of applying the fair value option to our own debt. In addi-tion, Corporate Center includes consolidation and eliminationadjustments required to eliminate intercompany revenues andexpenses.
Minority interest-related revenues and expenses resultingfrom the consolidation of certain private equity funds and otherentities in which the Group does not have a significant eco-nomic interest in such revenues and expenses are reported asminorities without significant economic interest. The consoli-dation of these entities does not affect net income as theamounts recorded in net revenues and total operatingexpenses are offset by corresponding amounts reported asminority interests. In addition, our income tax expense is notaffected by these revenues and expenses.
Segment reporting
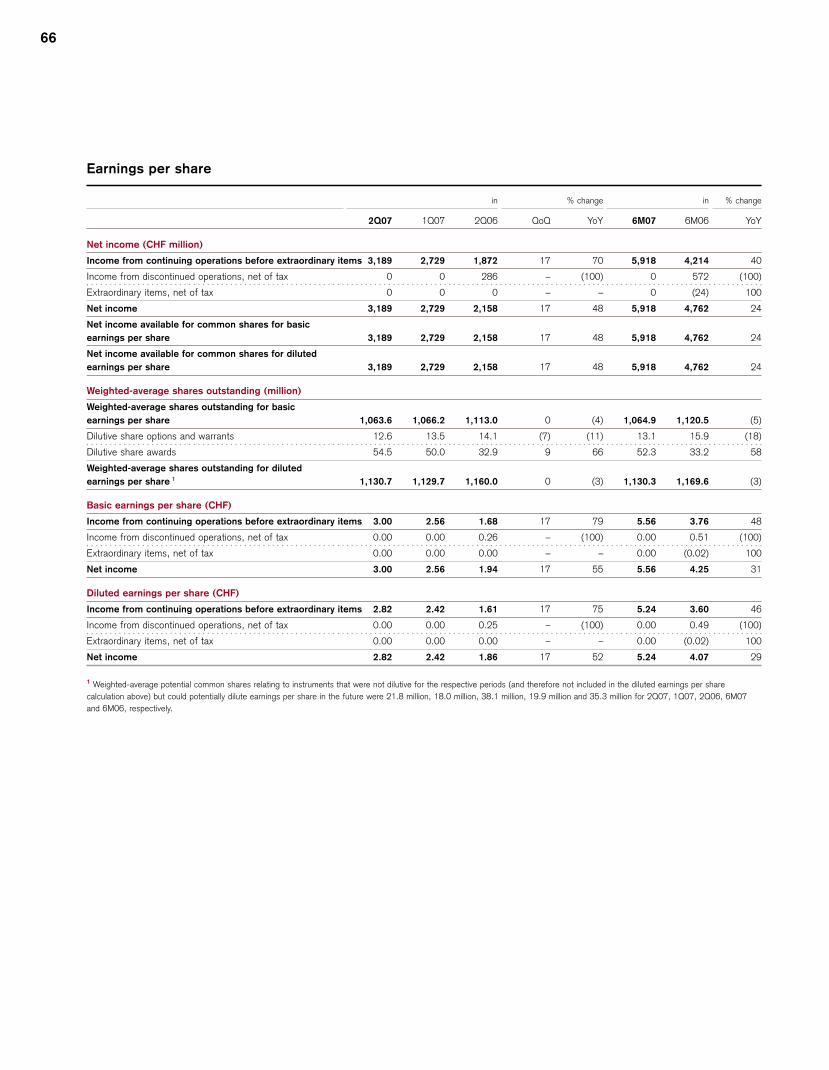
Earnings per share
in % change in % change
2Q07 1Q07 2Q06 QoQ YoY 6M07 6M06 YoY
Net income (CHF million)
Income from continuing operations before extraordinary items 3,189 2,729 1,872 17 70 5,918 4,214 40
Income from discontinued operations, net of tax 0 0 286 – (100) 0 572 (100)
Extraordinary items, net of tax 0 0 0 – – 0 (24) 100
Net income 3,189 2,729 2,158 17 48 5,918 4,762 24
Net income available for common shares for basicearnings per share 3,189 2,729 2,158 17 48 5,918 4,762 24
Net income available for common shares for dilutedearnings per share 3,189 2,729 2,158 17 48 5,918 4,762 24
Weighted-average shares outstanding (million)
Weighted-average shares outstanding for basicearnings per share 1,063.6 1,066.2 1,113.0 0 (4) 1,064.9 1,120.5 (5)
Dilutive share options and warrants 12.6 13.5 14.1 (7) (11) 13.1 15.9 (18)
Dilutive share awards 54.5 50.0 32.9 9 66 52.3 33.2 58
Weighted-average shares outstanding for dilutedearnings per share 1 1,130.7 1,129.7 1,160.0 0 (3) 1,130.3 1,169.6 (3)
Basic earnings per share (CHF)
Income from continuing operations before extraordinary items 3.00 2.56 1.68 17 79 5.56 3.76 48
Income from discontinued operations, net of tax 0.00 0.00 0.26 – (100) 0.00 0.51 (100)
Extraordinary items, net of tax 0.00 0.00 0.00 – – 0.00 (0.02) 100
Net income 3.00 2.56 1.94 17 55 5.56 4.25 31
Diluted earnings per share (CHF)
Income from continuing operations before extraordinary items 2.82 2.42 1.61 17 75 5.24 3.60 46
Income from discontinued operations, net of tax 0.00 0.00 0.25 – (100) 0.00 0.49 (100)
Extraordinary items, net of tax 0.00 0.00 0.00 – – 0.00 (0.02) 100
Net income 2.82 2.42 1.86 17 52 5.24 4.07 29
1 Weighted-average potential common shares relating to instruments that were not dilutive for the respective periods (and therefore not included in the diluted earnings per sharecalculation above) but could potentially dilute earnings per share in the future were 21.8 million, 18.0 million, 38.1 million, 19.9 million and 35.3 million for 2Q07, 1Q07, 2Q06, 6M07and 6M06, respectively.
66
Financial Review
2Q 0768 Investor Information
This section contains information on our share listing inSwitzerland and the US. Bond ratings and foreign currencytranslation rates are also provided.
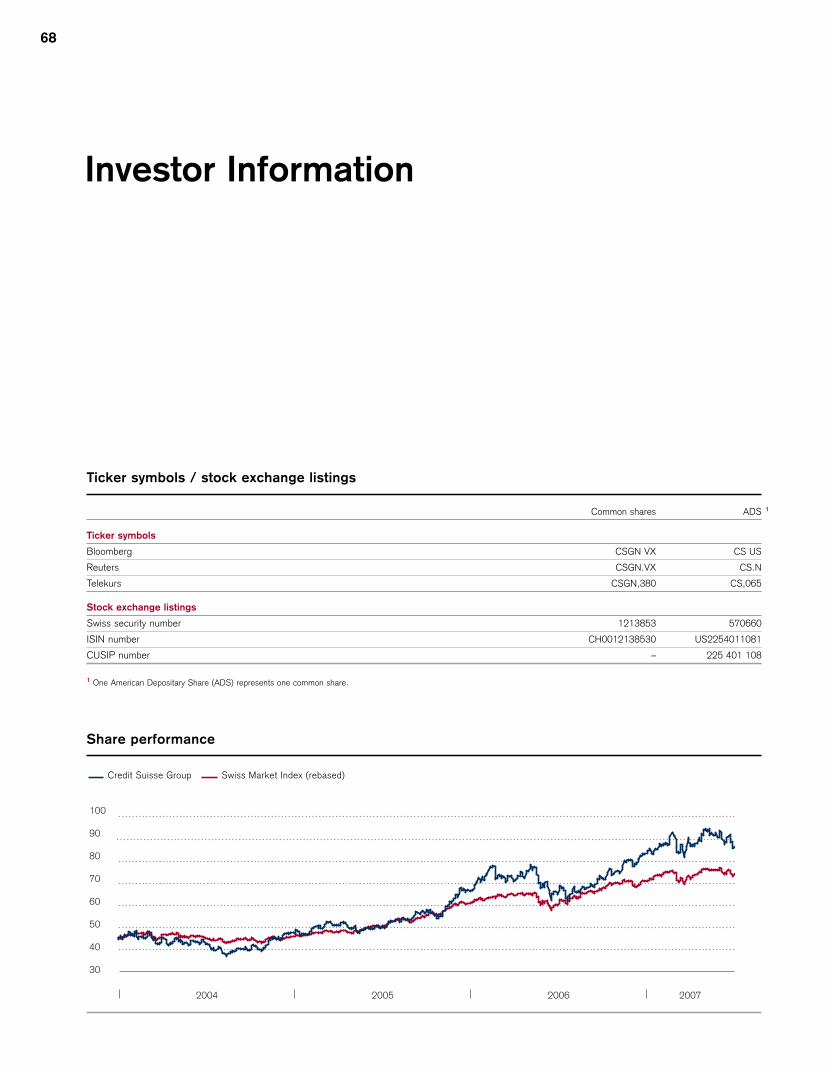
68
Investor Information
Ticker symbols / stock exchange listings
Common shares ADS 1
Ticker symbols
Bloomberg CSGN VX CS US
Reuters CSGN.VX CS.N
Telekurs CSGN,380 CS,065
Stock exchange listings
Swiss security number 1213853 570660
ISIN number CH0012138530 US2254011081
CUSIP number – 225 401 108
1 One American Depositary Share (ADS) represents one common share.
100
90
80
70
60
50
40
30
2004 20062005 2007
Share performance
Credit Suisse Group Swiss Market Index (rebased)
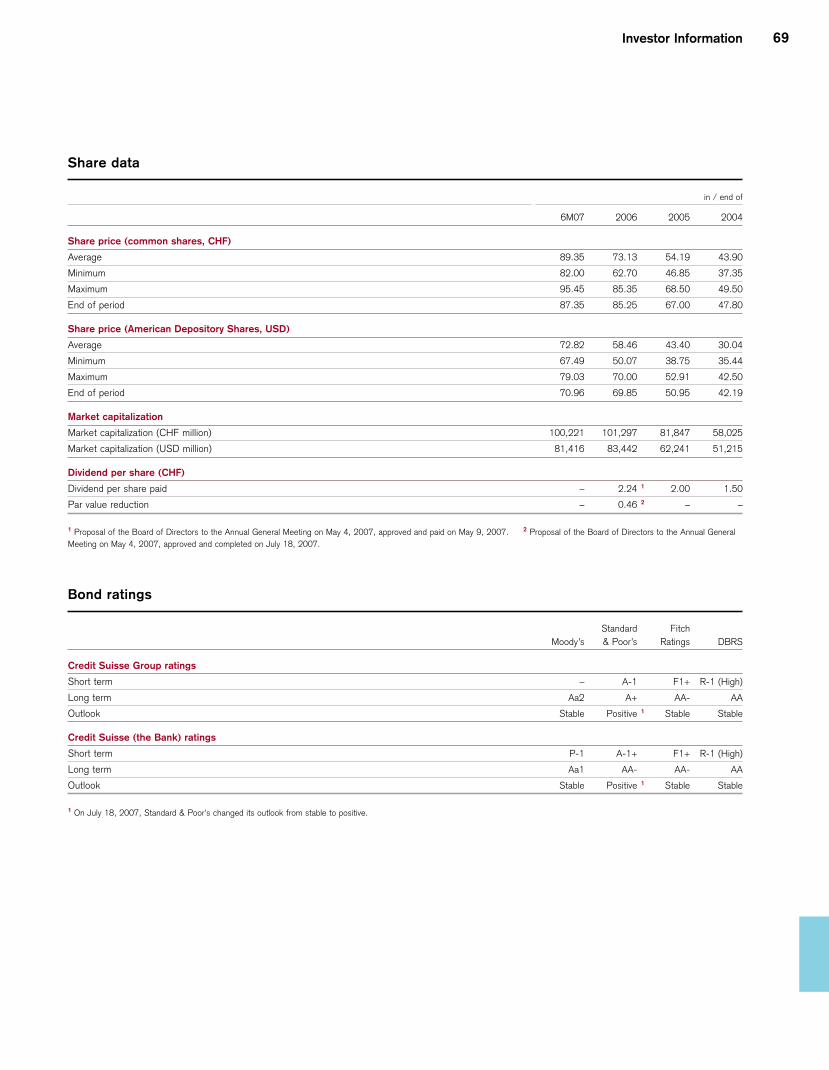
Investor Information 69
Share data
in / end of
6M07 2006 2005 2004
Share price (common shares, CHF)
Average 89.35 73.13 54.19 43.90
Minimum 82.00 62.70 46.85 37.35
Maximum 95.45 85.35 68.50 49.50
End of period 87.35 85.25 67.00 47.80
Share price (American Depository Shares, USD)
Average 72.82 58.46 43.40 30.04
Minimum 67.49 50.07 38.75 35.44
Maximum 79.03 70.00 52.91 42.50
End of period 70.96 69.85 50.95 42.19
Market capitalization
Market capitalization (CHF million) 100,221 101,297 81,847 58,025
Market capitalization (USD million) 81,416 83,442 62,241 51,215
Dividend per share (CHF)
Dividend per share paid – 2.24 1 2.00 1.50
Par value reduction – 0.46 2 – –
1 Proposal of the Board of Directors to the Annual General Meeting on May 4, 2007, approved and paid on May 9, 2007. 2 Proposal of the Board of Directors to the Annual GeneralMeeting on May 4, 2007, approved and completed on July 18, 2007.
Bond ratings
Standard FitchMoody’s & Poor’s Ratings DBRS
Credit Suisse Group ratings
Short term – A-1 F1+ R-1 (High)
Long term Aa2 A+ AA- AA
Outlook Stable Positive 1 Stable Stable
Credit Suisse (the Bank) ratings
Short term P-1 A-1+ F1+ R-1 (High)
Long term Aa1 AA- AA- AA
Outlook Stable Positive 1 Stable Stable
1 On July 18, 2007, Standard & Poor’s changed its outlook from stable to positive.
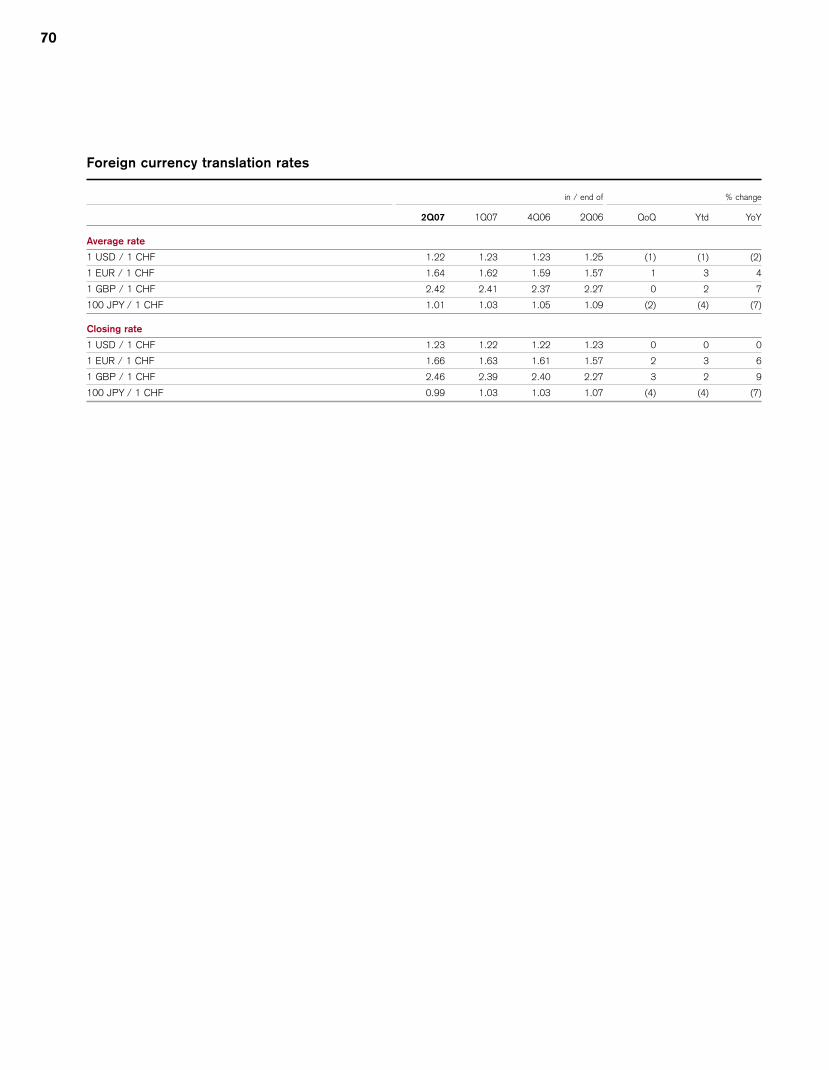
70
Foreign currency translation rates
in / end of % change
2Q07 1Q07 4Q06 2Q06 QoQ Ytd YoY
Average rate
1 USD / 1 CHF 1.22 1.23 1.23 1.25 (1) (1) (2)
1 EUR / 1 CHF 1.64 1.62 1.59 1.57 1 3 4
1 GBP / 1 CHF 2.42 2.41 2.37 2.27 0 2 7
100 JPY / 1 CHF 1.01 1.03 1.05 1.09 (2) (4) (7)
Closing rate
1 USD / 1 CHF 1.23 1.22 1.22 1.23 0 0 0
1 EUR / 1 CHF 1.66 1.63 1.61 1.57 2 3 6
1 GBP / 1 CHF 2.46 2.39 2.40 2.27 3 2 9
100 JPY / 1 CHF 0.99 1.03 1.03 1.07 (4) (4) (7)
Investor Information 71
Financial Calendar
Third quarter 2007 results Thursday, November 1, 2007
Fourth quarter / full year 2007 results Tuesday, February 12, 2008
Investor Relations
Phone +41 44 333 71 49
Fax +41 44 333 25 87
E-mail [email protected]
Internet www.credit-suisse.com/investors
Media Relations
Phone +41 844 33 88 44
E-mail [email protected]
Internet www.credit-suisse.com/news
Swiss Share Register and Transfer Agent
Address Credit Suisse Group
Dept. GHBS
CH-8070 Zurich
Switzerland
Phone +41 44 332 26 60
Fax +41 44 332 98 96
US Share Register and Transfer Agent
ADS depositary institution Deutsche Bank Trust Company Americas
Broker Service Desk
Address Credit Suisse
c/o Mellon Investor Services
P.O. Box 3316
So. Hackensack, NJ 07606
United States
US and Canada phone (toll free) +1 800 301 35 17
Phone from outside US and Canada +1 201 680 66 26
E-mail [email protected]
Additional Information
Credit Suisse results and further financial information www.credit-suisse.com/results
Printed copies Credit Suisse
Procurement Non-IT Switzerland
RSCP 1 Publikationenversand
CH-8070 Zurich
Switzerland
Financial Calendar and Information Sources

72
Cautionary statement regarding forward-looking information
This Report contains statements that constitute forward-looking state-
ments within the meaning of the Private Securities Litigation Reform
Act. In addition, in the future we, and others on our behalf, may make
statements that constitute forward-looking statements. Such forward-
looking statements may include, without limitation, statements relating
to the following:
p Our plans, objectives or goals;
p Our future economic performance or prospects;
p The potential effect on our future performance of certain contingencies;
and
p Assumptions underlying any such statements.
Words such as “believes,” “anticipates,” “expects,” “intends” and “plans”
and similar expressions are intended to identify forward-looking state-
ments but are not the exclusive means of identifying such statements.
We do not intend to update these forward-looking statements except as
may be required by applicable securities laws.
By their very nature, forward-looking statements involve inherent risks
and uncertainties, both general and specific, and risks exist that predictions,
forecasts, projections and other outcomes described or implied in forward-
looking statements will not be achieved. We caution you that a number of
important factors could cause results to differ materially from the plans,
objectives, expectations, estimates and intentions expressed in such for-
ward-looking statements. These factors include:
p The ability to maintain sufficient liquidity and access capital markets;
p Market and interest rate fluctuations;
p The strength of the global economy in general and the strength of the
economies of the countries in which we conduct our operations in partic-
ular;
p The ability of counterparties to meet their obligations to us;
p The effects of, and changes in, fiscal, monetary, trade and tax policies,
and currency fluctuations;
p Political and social developments, including war, civil unrest or terrorist
activity;
p The possibility of foreign exchange controls, expropriation, nationalization
or confiscation of assets in countries in which we conduct our operations;
p Operational factors such as systems failure, human error, or the failure to
implement procedures properly;
p Actions taken by regulators with respect to our business and practices in
one or more of the countries in which we conduct our operations;
p The effects of changes in laws, regulations or accounting policies or
practices;
p Competition in geographic and business areas in which we conduct our
operations;
p The ability to retain and recruit qualified personnel;
p The ability to maintain our reputation and promote our brand;
p The ability to increase market share and control expenses;
p Technological changes;
p The timely development and acceptance of our new products and serv-
ices and the perceived overall value of these products and services by
users;
p Acquisitions, including the ability to integrate acquired businesses suc-
cessfully, and divestitures, including the ability to sell non-core assets;
p The adverse resolution of litigation and other contingencies; and
p Our success at managing the risks involved in the foregoing.
We caution you that the foregoing list of important factors is not exclu-
sive. When evaluating forward-looking statements, you should carefully
consider the foregoing factors and other uncertainties and events, as
well as the information set forth in our Form 20-F Item 3 – Key Infor-
mation – Risk factors.
Personalities
Lukas GähwilerHead Credit Risk Management Private Banking2007 – Hochhaus zur Palme, Zurich
Lukas Gähwiler is heading the Credit Risk Management department forthe Private Banking division. He and his team are present in more than20 locations around the globe.
Credit Risk Management in Zurich is located in Hochhaus zur Palme,which was built in 1964 by the architects Max Ernst Häfeli, Werner MaxMoser and Rudolf Steiger. The striking 50 meter tall office building wasone of Zurich’s first high rise.
Ulrike GratschHead of Strategic Distribution & Market Management2007 – Junghofplaza, Frankfurt
Ulrike Gratsch is a member of the Management Board of Credit Suisse(Deutschland) AG. She and her team support our strategic initiatives inthe German private banking market.
Ulrike Gratsch is photographed at Junghofplaza – JP 16. This build-ing, located in the center of Frankfurt, is the “distribution center” ofCredit Suisse in Germany, and is home to the Private Banking, AssetManagement and Investment Banking teams, among others.
Photography: Hans Schürmann, Zurich; Design: www.arnolddesign.ch; Production: Management Digital Data AG, Zurich; Printer: NZZ Fretz AG, Zurich
CREDIT SUISSE GROUPParadeplatz 88070 ZurichSwitzerlandPhone +41 44 212 16 16Fax +41 44 333 25 87
www.credit-suisse.com 5520
134
Engl
ish