criteria for liquefaction of silty soils - iit … 0312 silt grains come in the same forms as those...
TRANSCRIPT

0312
1 Senior Geotechnical Engineer, Halcrow China Limited, 23/F Central Plaza, 18 Harbour Road, Hong Kong. Fax: 852-2827 83522 Professor, Dept. of Civil and Env. Eng., Univ. of Southern California, Los Angeles, CA 90089, USA. Fax: 1-213-744 1426
CRITERIA FOR LIQUEFACTION OF SILTY SOILS
Desmond C A ANDREWS1 And Geoffrey R MARTIN2
SUMMARY
This paper promotes simple criteria based on “key” soil parameters that help partition liquefiableand non-liquefiable silty soils. A brief review of the physical characteristics of silts and clays isfirst given to help clarify some misconceptions about silty soils. Clay content and liquid limit arethen considered as two “key” soil parameters that help partition liquefiable and non-liquefiablesilty soils. Several case histories are presented that illustrate the applicability of using clay contentas a “key” soil parameter. Attention is drawn to an analogy between the liquid limit and the shearstrength of a soil. This analogy is expanded to show that the liquid limit can be regarded as a“key” soil parameter that gives a relative measure of liquefaction susceptibility. Inadequacies ofbasing criteria for liquefaction of silty soils on just one “key” parameter are finally discussed,leading to the promotion of simple criteria for liquefaction of silty soils, utilising together both theclay content and the liquid limit soil parameters.
INTRODUCTION
The majority of liquefaction studies to date have concentrated on relatively clean sands. Comparatively littleliquefaction research has been undertaken on soils within the grain size range of very silty sand to silt with orwithout some clay content. These silty soils are frequently encountered in engineering practice, and there is anabundance of evidence to show that they can be susceptible to liquefaction. As designers of earthquake resistantinfrastructure, often in silty soil environments, engineers need to know which silty soils are susceptible toliquefaction. This paper promotes simple criteria based on “key” soil parameters that help partition liquefiableand non-liquefiable silty soils.
In the context of this paper, liquefaction is defined as the phenomenon where high excess pore pressures areinduced under cyclic earthquake loading (approaching initial vertical effective confining pressures), leading tosevere loss of strength and stiffness.
LIQUEFACTION SUSCEPTIBILITY OF SILTY SOILS
There is a degree of confusion in the engineering profession about the liquefaction susceptibility of silty soils.Because the grain size of silt falls between that of sand and clay, it is often assumed that the liquefactionsusceptibility of silts must also fall somewhere between the high susceptibility of sands and the non-susceptibility of clays. Confusion about the liquefaction susceptibility of silty soils is further exasperatedwhenever silts and clays are coupled under the one heading - “fines”.
Silt in fact can essentially be viewed as very fine sand. The grain size boundary between sand and silt is set at0.074mm. This corresponds to that which can and cannot be seen by the naked eye. The fact that silt grainscannot be seen, does not bestow on them any significantly different physical characteristics to those of sandgrains. To illustrate, silt grains and sand grains both generally comprise rock-forming minerals. The shapes of

03122
silt grains come in the same forms as those of sand grains. Moreover, attraction forces, such as hydrogen bondsand van der Waals bonds are negligible between silt grains, just as they are between sand grains (Mitchell, 1976).
Clay bears little resemblance to sand and silt. The grain size boundary between silt and clay is generally set at0.002mm. Japan and China set the boundary at 0.005mm. Significantly, most grains finer than 0.002mm tend tocomprise clay minerals, and most grains larger than 0.002mm tend to comprise rock-forming minerals. Becauseof their mineralogy, clay grains tend to be platey shaped, and exhibit plasticity. This plasticity is caused byHydrogen bond and van der Waal bond forces of attraction between the platey shaped grains.
Based on the physical characteristics of silts and clays described above, the liquefaction susceptibility of siltswould be expected to be similar to that of sands and dissimilar to that of clays. The question is, at what claycontent does the liquefaction susceptibility of a silty soil change from resembling the susceptibility of sands toresembling the non-susceptibility of clays?
KEY SOIL PARAMETERS THAT PARTITION LIQUEFIABLE & NON-LIQUFIABLE SILTY SOILS
Seed et al. (1983) outlined criteria, derived from case histories in China (Wang, 1979), which provided a basisfor partitioning clayey soils vulnerable to severe strength loss as a result of earthquake shaking. The clayey soilsvulnerable to severe strength loss appeared to have the following characteristics:
Clay Content (defined as % finer than 0.005mm) <15%and Liquid Limit <35 and Water Content >0.9 x Liquid Limit
This paper utilises further case histories and theory, to reinforce the above criteria outlined by Seed et al., andrefine and promote their application to silty soils. Clay content and liquid limit only are considered as “key” soilparameters that partition liquefiable and non-liquefiable silty soils. Water content is not considered as a “key”soil parameter, due to its sensitivity to fluctuating environmental factors, and errors arising during soil sampling.
Clay Content
There are ample case histories that show silty soils with a low natural clay content (clay defined as grains finerthan 0.002mm in this paper) are susceptible to liquefaction. A brief discussion of several case histories follows:
Figueroa et al. (1995) examined the grain size distribution of soil samples collected from liquefaction relatedsand boils generated at the Lower San Fernando Dam, California during the Northridge earthquake of 1994. Thegrain size distribution of the boils is shown in Figure 1. The grain size distribution indicates that the soilliquefying was very silty sand with a clay content less than 10%.
Figure 1 Grain Size Distribution of LSFD Soils (after Figuroa et al. 1995)
Kishida (1970) observed the grain size distribution of boils ejected at Nanaehama Beach, Japan during theTokachioki earthquake of 1968. The boils consisted of sandy silt with clay contents less than 10% (Figure 2).Kishida indicated that the grain size distribution of the boils showed good agreement with the grain size

03123
distribution of soils located at a depth of 1m to 12m. These soils ranged from silty sand to sandy silt also withclay contents less than 10% (Figure 3). The grain size distribution of the boils did not however match those soilsat a depth of 12m to 17m. These soils had a clay content greater than 10% and appeared to have not liquefied.
Figure 2 Grain Size Distribution of Sand Boils (after Kishida, 1970)
Figure 3 Grain Size Distribution of Soils (after Kishida, 1970)
Tokimatsu and Yoshimi (1983) documented 70 case histories of liquefaction inside Japan resulting from 10earthquakes, as well as about 20 case histories of liquefaction outside Japan. A triangular classification chartshowing the grain sizes of the silty sand to slightly sandy silt soils which liquefied was prepared (Figure 4).Tokimatsu and Yoshimi show a cut-off for liquefaction susceptibility at a clay content of 20%. However, a cut-off at a clay content of about 15% may be more suitable. Furthermore, the clay is defined as grains finer than0.005mm. For clay defined as grains finer than 0.002mm, as used throughout this paper, a final cut-off forliquefaction susceptibility at a clay content of about 10% would be appropriate.
Figure 4 Grain Size of Liquefied Soils (after Tokimatsu and Yoshimi, 1983)
Tuttle et al. (1990) documented damaging liquefaction that occurred at Ferland, Canada during the Saguenayearthquake of 1988. Grain size distribution curves of the boils that erupted indicated that the soil liquefying was

03124
a very silty sand to slightly sandy silt with a clay content less than 10% (Figure 5). This soil was present at adepth between 1.5 and 9.0 m. Clayey silt at a depth of about 0.5 m to 1.5m, and silty clay at a depth of about 9mto 11m, were not present in the boils and appear to have not liquefied.
Figure 5 Grain Size Distribution of Soils (after Tuttle et al. 1990)
Wang (1979) recorded the occurrence of liquefaction in silty sand to slightly sandy silt soils during theHaicheng, China earthquake of 1975 and the Tangshan, China earthquake of 1976, and prepared a very revealingchart indicating the grain sizes of these soils (Figure 6). Wang shows a cut-off for liquefaction susceptibility at aclay content of 15%. However, the clay is defined as grains finer than 0.005mm. For clay defined as grainsfiner than 0.002mm, as used throughout this paper, a cut-off for liquefaction susceptibility at a clay content ofabout 10% would be appropriate.
Figure 6 Grain Size of Liquefied Soils (after Wang, 1979)
Zhou (1981) studied the extensive liquefaction that resulted in Tangshan, China during the Tangshan earthquakeof 1976. An area where widespread liquefaction occurred was in Lutai, southwest of Tangshan, 48km from theepicenter. A typical cross section of this area, showing several soil layers, is shown in Figure 7. Many boilserupted during and after the earthquake. The grain size distribution envelope of the sandy to slightly sandy siltsoils ejected is shown in Figure 8. It can be seen from the grain size distribution envelope that soils ejected had aclay content less than 10% (clay defined as grains finer than 0.005mm). It follows that for clay defined as grainsfiner than 0.002mm, the clay content must also be less than 10%.

03125
Figure 7 Lutai Area Stratigraphy (after Zhou, 1981)
Figure 8 Grain Size Distribution of the Ejecta (after Zhou, 1981)
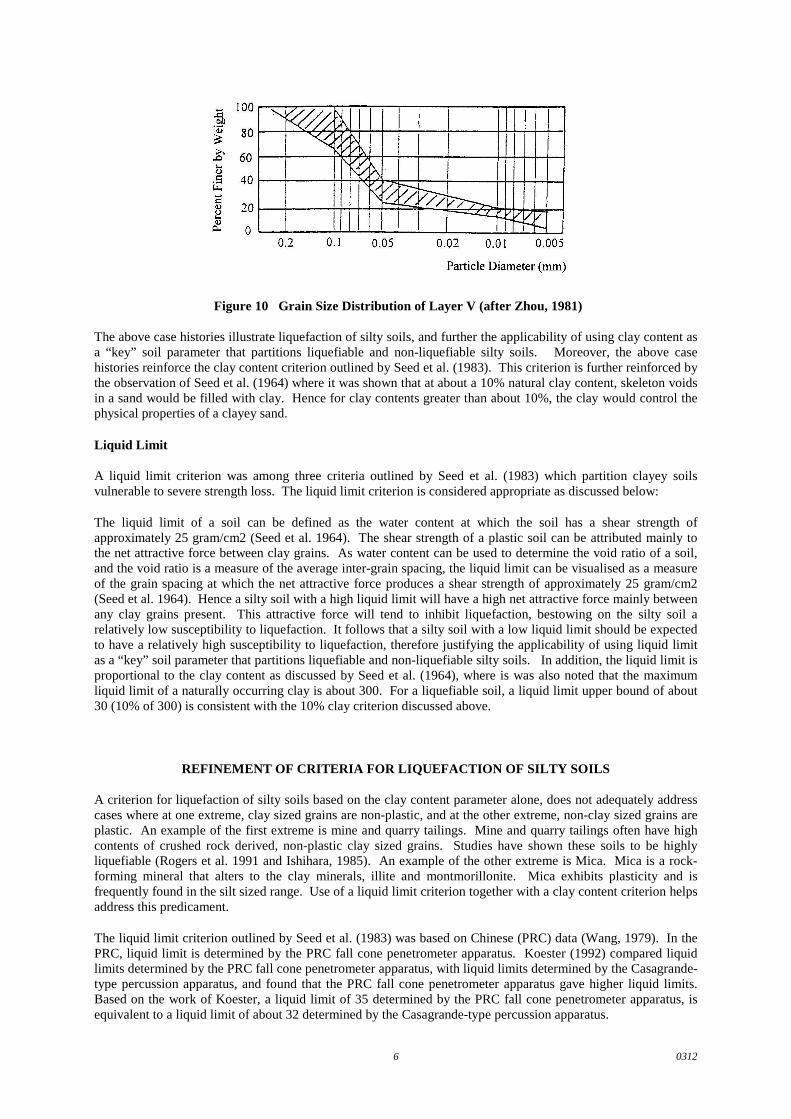
Zhou (1981) presented the grain size distributions of Layer III-1 and Layer V of the Lutai area stratigraphy (seeFigure 7 for location of layers), as shown in Figures 9 and 10 respectively. The grain size distribution of LayerIII-1 (Figure 9) indicates this soil is a sandy silt with a clay content less than 10% (clay defined as grains finerthan 0.005mm). Again it follows that for clay defined as grains finer than 0.002mm, the clay content must alsobe less than 10%. According to Zhou, Layer III-1 is present in only some parts of the Lutai area, and consists ofa lense deposit 0.5m to 1.0m thick, positioned at a depth of about 6m. For Layer V, the grain size distribution(Figure 10) indicates this soil is a sandy to slightly sandy silt with a clay content up to about 19% (clay definedas grains finer than 0.005mm). For clay defined as grains finer than 0.002mm, it could be supposed that the claycontent is up to say 15%. According to Zhou, Layer V is scattered all over the Lutai area, is about 2.5m thickand positioned at a depth of about 10m. Significantly, a macro-survey undertaken found that severe eruptionsoccurred in the areas where the lense layer III-1 and the layer V were both present. However, practically nosignificant eruptions occurred where only the relatively high clay content Layer V was present.
Figure 9 Grain Size Distribution of Layer III-1 (after Zhou, 1981)
03126
Figure 10 Grain Size Distribution of Layer V (after Zhou, 1981)
The above case histories illustrate liquefaction of silty soils, and further the applicability of using clay content asa “key” soil parameter that partitions liquefiable and non-liquefiable silty soils. Moreover, the above casehistories reinforce the clay content criterion outlined by Seed et al. (1983). This criterion is further reinforced bythe observation of Seed et al. (1964) where it was shown that at about a 10% natural clay content, skeleton voidsin a sand would be filled with clay. Hence for clay contents greater than about 10%, the clay would control thephysical properties of a clayey sand.
Liquid Limit
A liquid limit criterion was among three criteria outlined by Seed et al. (1983) which partition clayey soilsvulnerable to severe strength loss. The liquid limit criterion is considered appropriate as discussed below:
The liquid limit of a soil can be defined as the water content at which the soil has a shear strength ofapproximately 25 gram/cm2 (Seed et al. 1964). The shear strength of a plastic soil can be attributed mainly tothe net attractive force between clay grains. As water content can be used to determine the void ratio of a soil,and the void ratio is a measure of the average inter-grain spacing, the liquid limit can be visualised as a measureof the grain spacing at which the net attractive force produces a shear strength of approximately 25 gram/cm2(Seed et al. 1964). Hence a silty soil with a high liquid limit will have a high net attractive force mainly betweenany clay grains present. This attractive force will tend to inhibit liquefaction, bestowing on the silty soil arelatively low susceptibility to liquefaction. It follows that a silty soil with a low liquid limit should be expectedto have a relatively high susceptibility to liquefaction, therefore justifying the applicability of using liquid limitas a “key” soil parameter that partitions liquefiable and non-liquefiable silty soils. In addition, the liquid limit isproportional to the clay content as discussed by Seed et al. (1964), where is was also noted that the maximumliquid limit of a naturally occurring clay is about 300. For a liquefiable soil, a liquid limit upper bound of about30 (10% of 300) is consistent with the 10% clay criterion discussed above.
REFINEMENT OF CRITERIA FOR LIQUEFACTION OF SILTY SOILS
A criterion for liquefaction of silty soils based on the clay content parameter alone, does not adequately addresscases where at one extreme, clay sized grains are non-plastic, and at the other extreme, non-clay sized grains areplastic. An example of the first extreme is mine and quarry tailings. Mine and quarry tailings often have highcontents of crushed rock derived, non-plastic clay sized grains. Studies have shown these soils to be highlyliquefiable (Rogers et al. 1991 and Ishihara, 1985). An example of the other extreme is Mica. Mica is a rock-forming mineral that alters to the clay minerals, illite and montmorillonite. Mica exhibits plasticity and isfrequently found in the silt sized range. Use of a liquid limit criterion together with a clay content criterion helpsaddress this predicament.
The liquid limit criterion outlined by Seed et al. (1983) was based on Chinese (PRC) data (Wang, 1979). In thePRC, liquid limit is determined by the PRC fall cone penetrometer apparatus. Koester (1992) compared liquidlimits determined by the PRC fall cone penetrometer apparatus, with liquid limits determined by the Casagrande-type percussion apparatus, and found that the PRC fall cone penetrometer apparatus gave higher liquid limits.Based on the work of Koester, a liquid limit of 35 determined by the PRC fall cone penetrometer apparatus, isequivalent to a liquid limit of about 32 determined by the Casagrande-type percussion apparatus.

03127
CONCLUSIONS
The following concluding observations can be made:
• There is an abundance of evidence to show that silty soils can be susceptible to liquefaction.
• Clay content can be regarded as a “key” soil parameter that partitions liquefiable and non-liquefiable siltysoils.
• Liquid limit can be regarded as a “key” soil parameter that partitions liquefiable and non-liquefiable siltysoils.
• Use of a liquid limit criterion together with a clay content criterion helps address cases where clay sizedgrains are non-plastic, and non-clay sized grains are plastic.
Based on the further case histories and theory presented above, the criteria outlined in Seed et al. (1983) arereinforced, refined and promoted for silty soils as shown in Table 1.
Table 1 Liquefaction Susceptibility of Silty Soils
Liquid Limit < 32 (1) Liquid Limit ≥ 32
Clay Content < 10% (2) Susceptible Further Studies Required
(Considering plastic non-claysized grains - such as Mica)
Clay Content ≥ 10% Further Studies Required
(Considering non-plastic clay sizedgrains – such as mine and quarrytailings)
Not Susceptible
Notes:
1. Liquid Limit determined by Casagrande-type percussion apparatus
2. Clay defined as grains finer than 0.002mm
ACKNOWLEDGEMENTS
The research described in this paper was funded by a Federal Highway Administration grant(Contract DTF H61-6-0012) to the National Center for Earthquake Engineering, Buffalo. This support isgratefully acknowledged.
REFERENCES
Figueroa, J. L., Saada, A. S. and Liang, L. (1995). Effect of the Grain Size on the Energy Per Unit Volume atthe Onset of Liquefaction. Proceedings: 3rd International Conference on Recent Advances in GeotechnicalEarthquake Engineering and Soil Dynamics, Vol. 1, pp 197-202.
Ishihara, K. (1985). Stability of Natural Deposits During Earthquakes. Proceedings: 11th InternationalConference on Soil Mechanics and Foundation Engineering, San Francisco, Vol. I, pp 321-376.

03128
Kishida, H. (1970). Characteristics of Liquefaction of Level Sandy Ground During the Tokachioki Earthquake.Soils and Foundations, Vol. 10, No. 2, pp 103-111.
Koester, J. P. (1992). The Influence of Test Procedure on Correlation of Atterberg Limits with Liquefaction inFine - Grained Soils. Geotechnical Testing Journal, Vol. 15, No. 4, pp 352-360.
Mitchell, J. K. (1976). Fundamentals of Soil Behavior. John Wiley & Sons Inc., p 319.
Rogers, J. D., Wills, C. J. and Manson, M. W. (1991). Two Sequences of Fine Grained Soil Liquefaction atSoda Lake, Pajaro River Valley, Santa Cruz County, California. Proceedings: 2nd International Conference onRecent Advances in Geotechnical Earthquake Engineering and Soil Dynamics, Vol. 3, pp 2295-2308.
Seed, H. B., Woodward, R. J. and Lundgren, R. (1964). Fundamental Aspects of the Atterberg Limits. J. SoilMechanics and Foundations Division, ASCE, Vol. 90, No. SM6, pp 75-105.
Seed, H. B., Idriss, I. M. and Arango, I. (1983). Evaluation of Liquefaction Potential Using Field PerformanceData. Journal of Geotechnical Engineering, Vol. 109, No. GT3, pp 458-482.
Tokimatsu. K. and Yoshimi, Y. (1983). Empirical Correlation of Soil Liquefaction Based on SPT N-Values andFines Content. Soils and Foundations, Vol. 23, No. 4, pp 56-74.
Tuttle, M., Law, K. T., Seeber, L. and Jacob, K. (1990). Liquefaction and Ground Failure Induced by the 1988Saguenay, Quebec, Earthquake. Can. Geotech. J. 27, pp 580-589.
Wang, W. S. (1979). Some Findings in Soil Liquefaction. Water Conservancy and Hydroelectric PowerScientific Research Institute, Beijing, China.
Zhou, S. G. (1981). Influence of Fines on Evaluating Liquefaction of Sand by CPT. Proceeding: InternationalConference on Recent Advances in Geotechnical Earthquake Engineering and Soil Dynamics, Vol. 2, pp 167-172.