d.2 – summary of need analyses - minnesota€¦ · summary of need analyses 1 ... do not have the...
TRANSCRIPT

Xcel Energy April 2009 Hiawatha Project
D.2 – Summary of Need Analyses

SUMMARY OF NEED ANALYSES
1
1.0 INTRODUCTION
The Distribution Planning Department (“Distribution Planning”) of Northern States Power Company, a Minnesota corporation, (“Xcel Energy”) has been monitoring the growing customer electrical demand in the south Minneapolis area for more than 50 years. In the last 10 years, electrical system planners, operators and construction crews have responded to an overloaded electric distribution system with increasingly intensified customer demand. In response to an increasing number of feeder circuit overloads and service interruptions in the south Minneapolis area over the past decade, Distribution Planning conducted a study of the south Minneapolis distribution delivery system. Distribution Planning determined that typical distribution mitigation strategies, such as extending feeder circuits, reconfiguring feeder circuits, and adding new feeder circuits, had already been exhausted and were no longer capable of addressing overloads and maintaining adequate voltage to ensure reliable local electric service. Distribution Planning also determined that existing distribution substations in south Minneapolis do not have the available capacity necessary to alleviate the overload conditions. Distribution Planning concluded that new substation transformer capacity would be needed to alleviate overload conditions in the south Minneapolis area.
Distribution Planning, in coordination with the Xcel Energy Transmission Planning Department (“Transmission Planning”), developed and analyzed several alternatives to achieving additional capacity in the south Minneapolis area experiencing the most severe overload operating conditions. Ultimately, both Distribution Planning and Transmission Planning determined that the option that best addressed both the immediate and long-term needs for electricity in the south Minneapolis area included the addition of two new distribution substations in the Hiawatha and Midtown areas, each initially housing a single substation transformer, with both new substations tapped off of the existing Elliot Park - Southtown 115 kV transmission line and two new looped 115 kV transmission lines connecting the two new substations.
This report summarizes the planning engineers’ analysis and conclusions. A copy of Distribution Planning’s South Minneapolis Electric Distribution Delivery System Long-Term Study (“Distribution Study”) and Transmission Planning’s Interconnection Study are included at Appendix D.3 and Appendix D.4, respectively.
2.0 SUMMARY OF SOUTH MINNEAPOLIS ELECTRIC DISTRIBUTION DELIVERY SYSTEM LONG-TERM STUDY
2.1 DISTRIBUTION PLANNING CRITERIA
Xcel Energy is committed to and obligated by Minnesota law to provide safe, adequate, efficient, and reasonable electrical service at just and reasonable rates. To meet these objectives, Xcel Energy’s distribution system load is planned, measured, and forecasted on an annual basis with the goal to reliably serve all customer electric load under system intact and first contingency operating conditions.
Normal operation (also called “system intact” or “N-0” operation) is the condition under which all electric infrastructure equipment is fully functional. First contingency operation (also called “single contingency operation” or “N-1” ) is the condition under which a single

2
element (feeder circuit or distribution substation transformer) is out of service. A distribution delivery system that has adequate first contingency capacity is one in which all customer load can be restored through distribution system reconfiguration, e.g., electrical switching. Xcel Energy uses distribution planning criteria, including the following for feeder circuits and substation transformers, to achieve uniform development of Xcel Energy’s distribution systems. See Chapter 2.0 of the Distribution Study for more detailed information on the principles of distribution planning.
2.1.1 Feeder Circuits
Under system intact operating conditions, typical feeder circuits should be loaded to less than 75% of capacity. Xcel Energy developed this indicator to help ensure that service to customers can be maintained under single contingency operating conditions. If feeder circuits were loaded to their maximum capacity and there were an outage, the remaining system components would not be able to make up for the loss because adding load to the remaining feeder circuits would cause them to overload. By targeting a 75% loading level, there is generally sufficient remaining capacity on the system (25% per feeder) to cover an outage of an adjacent feeder with minimal service interruptions. A typical feeder circuit capable of delivering 12 MVA, for example, is normally loaded less than 9 MVA. During contingency conditions, it can be loaded up to 12 MVA.
2.1.2 Substation Transformers
Under system intact operating conditions, substation transformers should be loaded at 75% of normal rating or lower. Substation transformer utilization rates below 75% are indicative of a robust distribution system that has multiple restoration options in the event of a substation transformer becoming unavailable because of an equipment failure or required maintenance and construction. The higher the transformer utilization rate (i.e., greater than 75% of capacity is being used under normal system conditions), the higher the risk that customer electrical service will be interrupted in the event of a transformer outage.
2.1.3 Ongoing Distribution System Reliability Assessment
Distribution Planning assesses on a continuing (operational) basis the loading of feeder circuits and distribution substation transformers in order to assure reliable electrical service to Xcel Energy’s customers. Planning Engineers examine prior and forecast future loads annually to determine whether overload conditions exist. When such conditions are detected, Planning Engineers develop mitigation projects to address the overloads. In general, Distribution Planning implements infrastructure additions to address overloaded distribution system elements on an ongoing basis.
Distribution Planning regularly compares feeder circuit historical and forecast peak load demands to distribution feeder circuit maximum loading limits to identify feeder circuits overloaded under system intact conditions and feeder circuits overloaded under single contingency conditions during peak loading.
Distribution Planning also annually compares substation transformer historical and forecasted peak load demands on substation transformers to capacity load limits under

3
system intact and single contingency conditions. Distribution Planning provides distribution substation transformer loads to Transmission Planning annually. Distribution and Transmission Planning Engineers routinely coordinate to identify distribution load impacts to the transmission system.
Distribution Planning then quantifies the amount of overload and the duration of peak loading for feeder circuit and substation transformer overloads under system intact and single contingency conditions, determines the approximate cost of mitigating the overloads, and identifies the most critical distribution system needs.
When Distribution Planning determines that a distribution system requires additional capacity from a new distribution source, it makes a formal request to Transmission Planning to interconnect to the transmission system. Transmission Planning takes the request and Distribution Planning and Transmission Planning coordinate to develop several options that will address the distribution system deficiencies. Transmission Planning performs analyses to determine the impact of the selected options on the transmission system.
2.2 SOUTH MINNEAPOLIS STUDY AREAS
The south Minneapolis area has been experiencing increasingly significant overload conditions on its distribution system for the past decade. To assess the need for additional capacity on the electric distribution delivery system in the south Minneapolis area, Distribution Planning defined two study areas, the first defined by geographic boundaries and the second defined by the location of substations and associated feeder lines. First, Distribution Planning examined an approximately 22-square mile area of south Minneapolis, within specific geographic boundaries, that is served electrically by 39 specific distribution feeder circuits, all at distribution voltage of 13.8 kV, and is experiencing the most severe overload operating conditions (“Focused Study Area”). Figure 1 shows the Focused Study Area.

4
Figure 1: Focused Study Area
Four substations support 39 feeder circuits that serve the Focused Study Area load. These substations are Southtown, Aldrich, Elliot Park and Main Street substations. The Southtown Substation is the only substation within the Focused Study Area. The Southtown Substation, which is located in the southeast quadrant of the Focused Study Area at the northeast corner of Hiawatha Avenue and East 38th Street, has 23 feeder circuits and currently serves the majority of the load in the Study Area. Aldrich, Elliot Park and Main Street substations, which are located outside of the perimeter of the Focused Study Area, serve the majority of the remaining Focused Study Area load. Wilson and St. Louis Park substations serve less than 1%, a statistically insignificant amount, of the Focused Study Area load and, therefore, were not included in the analyses completed for the Focused Study Area. Figure 2 depicts each of the four substations and their respective number of feeder circuits that serve the Focused Study Area load.

5
Figure 2: Primary Electric Distribution Substations and Associated Feeder Circuits Serving Focused Study Area Load
To assess the availability of existing capacity outside of the Focused Study Area, Distribution Planning examined a larger area of south Minneapolis, encompassing the Focused Study Area, that includes five distribution substations that house an aggregate total of 15 distribution substation transformers, and includes 110 distribution feeder circuits, all at distribution voltage of 13.8 kV, emanating from those five substations that serve an approximately 60 square-mile area (“Greater Study Area”). Figure 3 shows the Greater Study Area.

6
Figure 3: Greater Study Area
The five Greater Study Area substations, which include Southtown, Aldrich, Elliot Park, St. Louis Park and Wilson substations, are served from the 115 kV transmission lines that loop the Greater Study Area. Main Street Substation was not considered in the Greater Study Area because the one feeder circuit from the Main Street Substation presently serving customer load in the Focused Study Area is not part of future plans to serve load in either the Focused or the Greater Study Areas. The one (1) Main Street substation feeder circuit traverses several miles and crosses the Mississippi River to reach the study areas. All Main Street feeder circuits crossing the Mississippi River were damaged when the Interstate 35W bridge collapsed in 2007. As a result, 10,000 kW (or approximately 10 MW) of load that was normally served by the Main Street Substation was transferred to Elliot Park Substation. From 2000 to 2008, approximately 52 MW of Greater Study Area load was transferred outside of the Greater Study Area to adjacent substations with available capacity because the Aldrich and St. Louis Park substations in the Greater Study Area were overloaded. In their analysis of substation transformer load growth in the Greater Study Area, Distribution Planning took into account load transferred out of the Greater Study Area to adjacent substations.

7
Each of the substations and its respective number of feeder circuits that serve Greater Study Area load are depicted in Figure 4.
Figure 4: Substations and Associated Feeder Circuits Serving Greater Study Area Load
See Chapter 3.0 of the Distribution Study for a more detailed discussion of the two study areas.

8
2.3 ANALYSIS OF HISTORICAL AND FORECAST LOAD IN THE FOCUSED AND GREATER STUDY AREAS
Distribution Planning analyzed the capabilities of the existing system within the Focused Study Area and Greater Study Area by evaluating the historical and forecast load data for the 39 feeder circuits in the Focused Study Area and for the 15 substation transformers in the Greater Study Area. The analysis of historical load data from 2000 to 2008 reveals two significant findings. First, an increasing number of feeder overloads occurred in the last several years in the Focused Study Area. Second, there is a general lack of additional capacity at existing area substations to address these overload conditions. Forecast data for 2009 to 2028 indicate that the overloading problems will increase over time absent the installation of additional distribution system capacity. See Chapter 4.0 of the Distribution Study for a more detailed summary of the load analysis for the Focused Study Area and see Chapter 5.0 of the Distribution Study for a more detailed summary of the load analysis for the Greater Study Area.
Figure 5 is a linear depiction of the load growth (“forecast demand”) on the 39 feeder circuits in the Focused Study Area from 2000 through 2028, using a conservative peak load forecast based on the cooler year peak loads from 2008. Generally, measured peak loads fluctuate from year to year due to the impacts of duration and intensity of hot weather and customer air conditioning usage. Figure 5 also shows the upper limit peak load forecast using 2006 historic peak loads (“historic peak forecast”), the result of a hot 2006 summer, which is 22 MW above the conservative peak load forecast. Distribution Planning determined that actual peak loads will likely fall between the conservative forecast and the historic 2006 peak levels. And although the measured peak load appears to decrease over time, the historic 2006 peak represents latent load levels that will recur in future years when economic conditions improve and temperatures reach 2006 levels again.
Figure 5: Historical and Forecasted Load Growth on 39 Feeder Circuits in Focused Study Area
Feeder Circuit Summer "Peak" Demands
0
50
100
150
200
250
300
350
400
450
2000
2001
2002
2003
2004
2005
2006
2007
2008
2009
2010
2011
2012
2013
2014
2015
2016
2017
2018
2019
2020
2021
2022
2023
2024
2025
2026
2027
2028
Year
Meg
awat
ts
Forecast Demand
Actual Demand
N-1 Feeder Capacity
Historic Peak Forecast
1.7% average grow th rate 2000-2008
N-1 Feeder Capacity

9
The measured peak load for feeders increased an average of 1.7% per year in the eight years between 2000 and 2008. Distribution Planning took a conservative outlook for forecasting feeder circuit load for its study because of anticipated customer conservation and a soft economy. Distribution Planning used a lower than historical forecast growth rate of less than 1.3% to forecast load levels on the 39 feeders for the next 20 years, representing growth in demand of approximately 50 MW by 2018.
Figure 6 is a linear depiction of the load growth (“forecast demand”) on the three substation transformers housed at the Southtown Substation, which is the only substation in the Focused Study Area, from 2000 through 2028, using the conservative peak loads forecast based on the cooler year peak loads from 2008. Figure 6 also shows the upper limit peak load forecast based on 2006 historic peak loads (“historic peak forecast”). Distribution Planning determined that actual peak loads will likely fall between the conservative forecast and the historic 2006 peak levels.
Figure 6: Historical and Forecasted Load Growth on Three Substation Transformers at Southtown Substation in Focused Study Area
Southtown Substation Transformers Summer "Peak" Demands
0
50
100
150
200
250
2000
2001
2002
2003
2004
2005
2006
2007
2008
2009
2010
2011
2012
2013
2014
2015
2016
2017
2018
2019
2020
2021
2022
2023
2024
2025
2026
2027
2028
Year
Meg
aWat
ts
Forecast Demand
Actual Demand
N-1 Transformer Capacity
Historic Peak Forecast
1.5% average grow th rate 2000-2008
Southtown N-1 Transformer Capacity
The measured peak load for the three Southtown substation transformers increased an average of 1.5% per year in the eight years between 2000 and 2008.
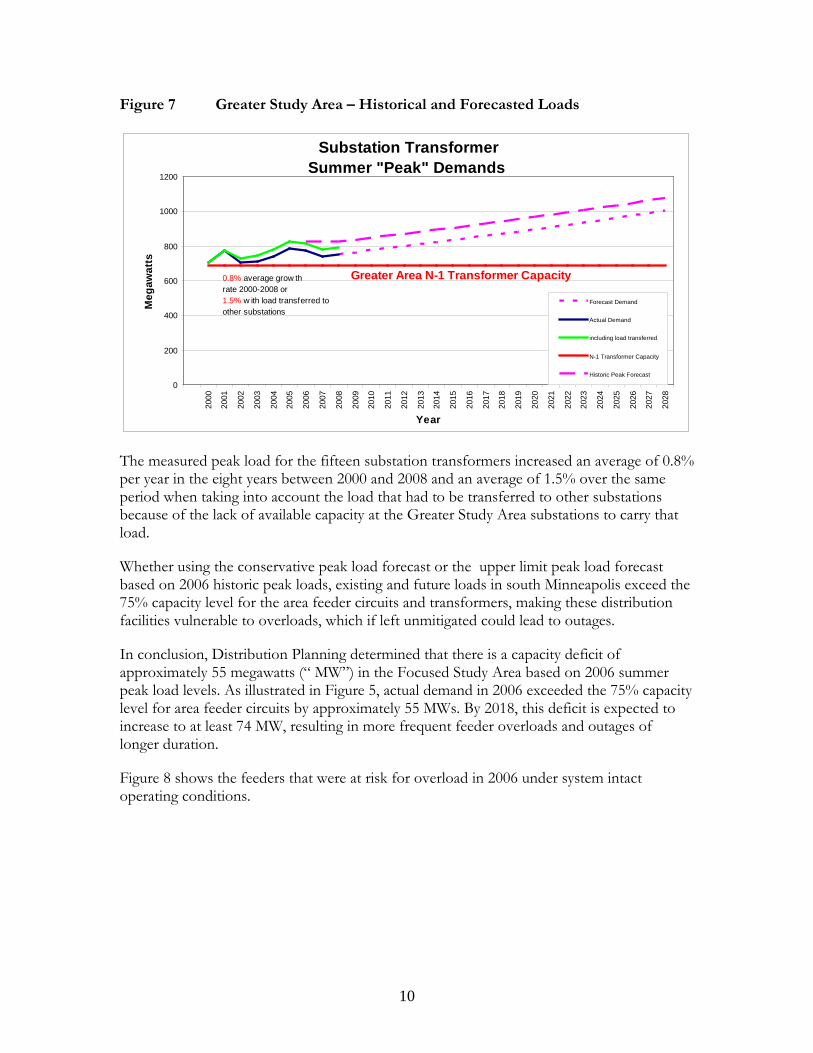
Figure 7 is a linear depiction of the load growth (“forecast demand”) on the 15 substation transformers housed at the five substations located in the Greater Study Area from 2000 through 2028, using the conservative peak loads forecast based on the cooler year peak loads from 2008. Figure 7 also shows the upper limit peak load forecast based on 2006 historic peak loads (“historic peak forecast”). Distribution Planning determined that actual peak loads will likely fall between the conservative forecast and the historic 2006 peak levels.
10
Figure 7 Greater Study Area – Historical and Forecasted Loads
Substation Transformer Summer "Peak" Demands
0
200
400
600
800
1000
1200
2000
2001
2002
2003
2004
2005
2006
2007
2008
2009
2010
2011
2012
2013
2014
2015
2016
2017
2018
2019
2020
2021
2022
2023
2024
2025
2026
2027
2028
Year
Meg
awat
ts
Forecast Demand
Actual Demand
including load transferred
N-1 Transformer Capacity
Historic Peak Forecast
0.8% average grow th rate 2000-2008 or1.5% w ith load transferred to other substations
Greater Area N-1 Transformer Capacity
The measured peak load for the fifteen substation transformers increased an average of 0.8% per year in the eight years between 2000 and 2008 and an average of 1.5% over the same period when taking into account the load that had to be transferred to other substations because of the lack of available capacity at the Greater Study Area substations to carry that load.
Whether using the conservative peak load forecast or the upper limit peak load forecast based on 2006 historic peak loads, existing and future loads in south Minneapolis exceed the 75% capacity level for the area feeder circuits and transformers, making these distribution facilities vulnerable to overloads, which if left unmitigated could lead to outages.
In conclusion, Distribution Planning determined that there is a capacity deficit of approximately 55 megawatts (“ MW”) in the Focused Study Area based on 2006 summer peak load levels. As illustrated in Figure 5, actual demand in 2006 exceeded the 75% capacity level for area feeder circuits by approximately 55 MWs. By 2018, this deficit is expected to increase to at least 74 MW, resulting in more frequent feeder overloads and outages of longer duration.
Figure 8 shows the feeders that were at risk for overload in 2006 under system intact operating conditions.

11
Figure 8: Focused Study Area 2006 Feeder Circuit Risks – System Intact
Figure 9 shows the feeders that will be at risk for overload in 2018 under system intact operating conditions.
Figure 9: Focused Study Area 2018 Feeder Circuit Risks – System Intact

12
Overloads are even more widespread across the 39 feeder circuits in the Focused Study Area under single contingency loading conditions, which is illustrated in Figures 10 and 11. These figures demonstrate that 2018 forecasted load levels, which are conservatively based on the cooler loads of 2008 and take into consideration potential customer conservation and the impacts of a slow economy, reach 2006 historic peak load levels again and result in similar single contingency overload conditions.
Figure 10: Focused Study Area 2006 Feeder Circuit Risks – Single Contingency

13
Figure 11: Focused Study Area 2018 Feeder Circuit Risks – Single Contingency
Distribution Planning determined that the areas within the Focused Study Area that are experiencing the greatest need, i.e., where overloading is most common, are in and around Lake Street and Hiawatha Avenue.
In addition to peak loads, Planning Engineers researched the locations of existing customer load density. As customer load grows in developed areas such as the Focused Study Area, distribution transformers are changed to higher capacity equipment when customer demand exceeds the capacity of the original transformer. Distribution transformers are an indicator of customer electrical loading and peak electrical demand. Figure 12 illustrates distribution transformer installation by size (which indicates present customer load density) in the Focused Study Area. The largest commercial customers in south Minneapolis are shown in yellow. Customers in large multi-residence buildings (more than 100 units), large multi-use buildings (e.g., Midtown Exchange), large retail stores (e.g., K-Mart), or corporate data centers typically have one or more transformers depicted as yellow dots. Customers in small and mid-sized commercial buildings, including retail stores and restaurants are served by smaller transformers that are shown as red. Residential customers and other lowest usage customers are shown in blue. Red and yellow show high density load corridors along Lake Street, Hiawatha Avenue, Excelsior Boulevard, and Chicago Avenue.

14
Figure 12: Distribution Transformer Sizes (Which Is Indicative of Customer Load Density) in Focused Study Area (2006)
The highest load density is concentrated along Lake Street, Hiawatha Avenue and Chicago and Park Avenue corridors. The load density in this area is due in part to various redevelopment projects that have been implemented in the area over the past years. The City of Minneapolis is several years into a redevelopment initiative demonstrated by the Sears Building redevelopment as Midtown Exchange with new high density residential, hotel and surrounding buildings. The State of Minnesota installation of light rail along Hiawatha Avenue is complemented by City of Minneapolis and contractor high density residential projects. Recent improvements along the Chicago Avenue corridor by Abbott Northwestern and Children’s Hospitals and redevelopment north and south of these large hospitals have also contributed to historical and continued electrical load growth in the area.
2.4 ALTERNATIVES
To address the need for additional capacity in the Focused Study Area, Distribution Planning reviewed potential distribution system improvements (including adding new feeder circuits, extending existing feeder circuits and reconfiguring feeder circuits) and concluded that these options had already been exhausted and would not provide the necessary system support. Distribution Planning also determined that existing distribution substations in south Minneapolis do not have the available capacity necessary to alleviate the overload conditions in the Focused Study Area and that these existing substations could not be expanded beyond their existing design capacity to include additional substation transformers because of space and electrical limitations. Distribution Planning concluded that two new distribution sources (i.e., substation transformers at new distribution substations) were needed to ensure adequate system support in the Hiawatha and Midtown areas. Therefore, Distribution Planning, in coordination with Transmission Planning, developed four electrical options that would

15
provide additional substation transformers for that area. See Chapter 6.0 of the Distribution Study for a more detailed description of the various alternatives reviewed by Distribution Planning.
2.4.1 Description of Alternatives
The four electrical options are listed below. The first two alternatives are considered standard installation. The last two alternatives are considered non-standard installation because they involve using multiple distribution voltage express feeder circuits at 13.8 kV or 34.5 kV to move power from a distant substation transformer location instead of using a 115 kV transmission line to transmit power.
New Source Alternative-1 (“A1”): This option includes an ultimate design capacity of five distribution substation transformers with a total of 30 feeder circuits located at two new substation locations. The ultimate design capacity of the Hiawatha substation location includes three 50 MVA substation transformers and up to 15 feeder circuits. This substation would be located near the existing site of the former Hiawatha Substation, which requires a short 115 kV transmission line extension to tap the existing Elliot Park – Southtown 115 kV transmission line into the substation site. The second new substation would be located west of Chicago Avenue and east of I-35W in the Midtown area. The ultimate design capacity of the Midtown Substation includes two 70 MVA substation transformers and up to 15 feeder circuits. The Midtown substation would tap the existing Elliot Park – Southtown 115 kV transmission line. Two additional transmission lines would be located between the Hiawatha Avenue and the new Midtown area substations. The initial installation includes a single substation transformer and five associated feeder circuits installed at each of the two substation locations.
New Source Alternative -2 (“A2”): This option includes an ultimate design capacity of six distribution substation transformers with a total of 30 feeder circuits located at two new substation locations. Each substation location includes three substation transformers and up to 15 feeder circuits. One substation would be located near the existing site of the former Hiawatha Substation, which requires a short 115 kV transmission line extension to tap the existing Elliot Park – Southtown 115 kV transmission line into the substation site. The second new substation would be located west of the Interstate 35W in the Midtown area. The Midtown Substation taps the existing Elliot Park – Southtown 115 kV transmission line. Two additional transmission lines would be located between the Hiawatha Avenue and the new Midtown area substations. The initial installation includes a single substation transformer and five associated feeder circuits installed at two substation locations.
New Source Alternative -3 (“A3”): This option includes an ultimate design capacity of six distribution substation transformers with a total of 30 feeder circuits located at one new substation location. Three of the substation transformers at 115/13.8 kV would serve 15 - 13.8 kV feeder circuits that serve customer loads directly from the substation location. Three of the substation transformers would serve 15 feeder circuits that are express circuits installed in duct banks from the Hiawatha substation site to the nexus of the 13.8 kV feeder circuits located near the existing former Oakland substation in the Midtown area. A distribution substation with an ultimate capacity of six distribution transformers and 30

16
feeder circuits with 15 express feeder circuits instead of a 115 kV transmission line is a non-standard installation.
One substation would be located near the existing site of the former Hiawatha Substation, which requires a short transmission line extension to tap the existing Elliot Park – Southtown 115 kV transmission line into the substation site and more extensive 115 kV equipment installation in the substation to enable the installation of six substation transformers. The proposed substation design requires a larger physical size than the substation considered in A1 or A2.
The initial installation includes two substation transformers and ten associated feeder circuits at one substation site. The first 115/13.8 kV transformer with five associated feeder circuits would serve distribution customer load directly from the substation location. The second 115/13.8 kV transformer, also installed in the same substation site, would have five 13.8 kV express feeders installed in at least 15,000 feet long manhole and duct bank(s) installed from Hiawatha substation site to the nexus of feeder circuits at the existing former Oakland substation site near Oakland Ave and 29th Street in the Midtown area. The length of the duct line and express feeders will be determined by the exact location of the Hiawatha Substation. The five 13.8 kV feeder circuits would be connected to existing feeders at the former Oakland substation site.
New Source Alternative -4 (“A4”)
The first substation location would contain six substation transformers. Three of the substation transformers at 115/13.8 kV would serve 15 - 13.8 kV feeder circuits that serve customer loads directly from the substation location. Three of the substation transformers at 115/34.5 kV would serve six 34.5 kV feeder circuits that are express circuits installed in duct banks from the Hiawatha substation site to the three 34.5/13.8 kV substations. The second, third, and fourth substation locations each would contain two substation transformers. The three 34.5/13.8 kV substations each are distribution substations fed from 34.5 kV sub-transmission voltage lines. The six 34.5 kV express feeders would be installed along an approximately six mile route instead of installing 115 kV transmission lines and additional transformers would be installed in the Midtown area.
: This option includes an ultimate design capacity of 14 distribution substation transformers with a total of 37 feeder circuits located at four new substation locations.
Substation one would be located near the existing site of the former Hiawatha Substation, which requires a short transmission line extension to tap the existing Elliot Park – Southtown 115 kV transmission line into the substation site and a more extensive 115 kV equipment installation in the substation to enable the installation of six substation transformers. This substation has an ultimate substation capacity of six substation transformers with three 115/13.8 kV and three 115/34.5 kV units. The proposed site requires a larger physical size than the substation considered in A1 or A2.
Substation two, located near the site of the existing former Oakland substation site, has an ultimate capacity of four 34.5/13.8 kV distribution substation transformers which feed eight 13.8 kV feeder circuits. 34.5 kV feeder circuits will be installed in a duct bank about 18,000 feet from the Hiawatha substation site to the existing former Oakland substation site near

17
Oakland Ave and 29th Street. The Oakland substation site is at the nexus of 13.8 kV feeder circuits nearest the load center in Midtown.
Substation three, located near the site of the existing former Garfield substation site, has an ultimate capacity of two 34.5/13.8 kV distribution substation transformers which feed four 13.8 kV feeder circuits. Two 34.5 kV feeder circuits will be installed in a duct bank about 35,000 feet from the Hiawatha Substation site to the existing former Garfield Substation site west of Interstate 35W near Garfield Ave and 33rd St in the south Minneapolis area.
Substation four, located near the site of the existing former Nicollet substation site, has an ultimate capacity of two 34.5/13.8 kV distribution substation transformers which feed four 13.8 kV feeder circuits. Two 34.5/13.8 kV feeder circuits will be installed in a duct bank about 50,000 feet from the Hiawatha substation site to the existing former Nicollet substation site west of Interstate 35W near Nicollet Ave and 47th St in the south Minneapolis area.
A distribution substation with an ultimate capacity of six distribution transformers and 37 feeder circuits with six 34.5 kV express feeder circuits instead of a 115 kV transmission line is a non-standard installation.
The initial installation requires five substation transformers and 14 associated feeder circuits; 10 feeder circuits at 13.8 kV and four feeder circuits at 34.5 kV at two of the four new substation sites. The first 115/13.8 kV transformer would be installed at Hiawatha substation site with five associated feeder circuits that serve distribution customer load directly from the substation location. The second and third 115/34.5 kV transformers would also be installed at the Hiawatha substation site with four 34.5 kV express feeders installed in multi-feeder express duct bank(s). Two 34.5 kV feeder circuits would be installed in a duct bank from the Hiawatha substation site to the Oakland substation site. Two 34.5 kV feeder circuits would be installed in a duct bank from the Hiawatha substation site to the existing former Garfield substation site west of Interstate 35W. The fourth and fifth 34.5/13.8 kV transformers would be installed near the existing former Oakland station and the existing former Garfield substation site respectively. Each substation transformer would be installed in a distribution substation that is fed by a primary and a backup 34.5 kV circuit. The Oakland substation site would initially serve three 13.8 kV feeder circuits and the Garfield substation site would initially serve two 13.8 kV feeder circuits.
2.4.2 Comparison of Alternatives
Distribution Planning evaluated and compared the effectiveness of each of the four alternatives to address the identified system deficiencies according to the following objective criteria: System Performance, Operability, Future Growth, Cost, and Electrical Losses. Distribution Planning concluded that A1 was superior to the other three alternatives with respect to the evaluation criteria.
Specifically, Distribution Planning determined that due to the length and required heavy loading of feeder circuits, A3 cannot deliver required voltage levels during system intact and single contingency peak loading levels. In addition to inadequate voltage levels, A3 is one of the highest cost alternatives. A3 requires construction of extensive and lengthy duct line for
18
express feeders that require large utility easements under streets already crowded with buried utility infrastructure. Previous experience with concentrations of feeder circuits from existing substations to the Focused Study Area is that there is not sufficient space on enough routes for the feeders and duct lines required to transmit power at 13.8 kV.
Distribution Planning determined that A4 is the most complex and expensive of the alternatives considered. A4 has the largest number of distribution feeder circuits, utilizes two different distribution voltages (13.8 kV and 34.5 kV), creates an entire new nonstandard sub-transmission system and adds two more distribution substations than the recommended alternative.
Distribution Planning determined that although A1 and A2 are very similar in that they both use power transmitted at 115 kV to distribution substations in the Midtown area, A1 is the superior solution because A1 installs a substation nearest the load center, thereby maximizing the effectiveness of the feeders and using the smallest amount of additional distribution system infrastructure to serve the load.
2.5 RECOMMENDATION
Distribution Planning concluded that A1 was the preferred option for addressing the load serving needs in the Focused Study Area and that the resulting project would consist of a new Hiawatha Substation tapped off of the existing Elliot Park – Southtown 115 kV transmission line between 26th and Lake Streets near Hiawatha Avenue; a new Midtown Substation between 26th and Lake Streets and between Chicago Avenue and Interstate 35W also tapped off of the Elliot Park – Southtown 115 kV transmission line; and two new looped above ground 115 kV transmission lines connecting the two substations. The proposed configuration is estimated to cost $33.4 million and will provide an additional 120 MW of load serving support in the Focused Study Area. This additional capacity will meet the immediate distribution system needs and provide additional support for further demand growth in the Focused Study Area.
3.0 SUMMARY OF TRANSMISSION PLANNING’S INTERCONNECTION STUDY
After determining that additional substation transformer capacity was needed in the Focused Study Area, Distribution Planning submitted an interconnection request to Transmission Planning. Transmission Planning conducted an interconnection study in which Transmission Planning reviewed the capability of the existing transmission system to serve any of the four new distribution source options evaluated by Distribution Planning (A1-A4) and to accommodate the projected south Minneapolis distribution load growth.
The four options included establishing new distribution sources (i.e., additional substation transformers) in the Focused Study Area and specifically in the area of Lake Street and Hiawatha Avenue where high distribution load densities are concentrated. Each of the new distribution source options would require either tapping into an existing transmission line and/or the construction of a new transmission line. Accordingly, early in the analysis, Transmission Planning reviewed how best to bring in a new source to the Midtown area in the Focused Study Area from the 115 kV looped system around Minneapolis.

19
Transmission Planning considered options that would bring a new 115 kV transmission line to a new Midtown Substation in the Midtown area from a new Hiawatha Substation, as well as from the Elliot Park Substation, the St. Louis Park Substation or the Wilson Substation. Transmission Planning determined that bringing a new 115 kV transmission line from any of the latter three substations to a new Midtown substation would require a longer transmission line to traverse a greater distance and would pose routing challenges with respect to crossing Interstate highways and other infrastructure and natural obstacles. Transmission Planning ultimately concluded that it was most feasible to tap into the existing Elliot Park – Southtown 115 kV transmission line at a new Hiawatha Substation, which is closest to the area where the additional capacity is needed.
Transmission Planning evaluated each of the four options (A1-A4) with respect to power system performance, practicality, cost, distribution system losses, and ability to serve distribution load. Transmission Planning concluded that each of the four electrical options evaluated would have similar minimal impacts to the transmission system and could address the immediate load serving needs of the south Minneapolis area. Transmission Planning recommended A1 as the preferred option because it provided the best overall results with respect to power system performance, practicality, cost, distribution system losses, and best option for serving the distribution load.
4.0 OTHER ALTERNATIVES
Distribution Planning and Transmission Planning engineers also determined that the following additional alternatives would not be able to sufficiently address the capacity deficiency in the Focused Study Area: No Build, Conservation / Demand Side Management (“DSM”), Distributed Generation (including Wind Generation and Solar Generation), Smart Technologies and Cogeneration.
4.1 NO BUILD
Due to the need to serve existing distribution system overloads in the Focused Study Area, Distribution Planning considered the no build alternative and concluded it to be unreasonable. The existing distribution system serving the Focused Study Area under system intact and first contingency conditions falls 55 MW short at 2006 peak loading levels. When loading levels exceed capacity, feeder circuit overloads are greater in number and duration. The summer feeder circuit peak loading in 2006 totaled 331 MW. By approximately 2018, the feeder circuit load totals will reach 354 MW. Correcting overloads measured during 2006 peak loading levels without adding feeder circuit infrastructure would require load reductions equivalent to more than 50,000 residential customers, more than 12 hospital complexes, or 16 Midtown Exchange equivalents in the Focused Study Area.
If overloads were to go unmitigated over the next twenty years, conditions would devolve in the South Minneapolis area to where sporadic power would be available for limited periods each day; there would be frequent brown-outs, and distribution equipment would be continually overloaded and more vulnerable to failures.
20
4.2 CONSERVATION/DEMAND SIDE MANAGEMENT
Distribution Planning considered whether an increase in customer participation in Xcel Energy’s conservation and DSM programs in the Focused Study Area could adequately address the capacity needs identified for that area and determined that these programs could not. Customer conservation is a personal choice. Xcel Energy offers a number of effective energy conservation programs and strongly encourages its customers to participate. Energy conservation is the best way to reduce individual customer load. Xcel Energy provides a broad spectrum of no cost and low cost options to customers to help them reduce their energy usage. Information about these programs is provided periodically in monthly billing inserts and on Xcel Energy’s website. Residential customers can call Xcel Energy’s Customer Contact Center at (800) 895-4999 to learn more about Xcel Energy’s other conservation programs. Xcel Energy’s business customers can work with their Xcel Energy account manager or the Business Solutions Center at (800) 481-4700.
At 2006 peak feeder circuit loading levels in the Focused Study Area, there was a total of 331 MW of customer demand and a deficit of 55 MW under single contingency operating conditions. To eliminate the 55 MW deficit, conservation and DSM programs would need to eliminate approximately 17% of existing load on the distribution system in the Focused Study Area, which is a substantial amount of load reduction and unlikely to be achievable through these programs.
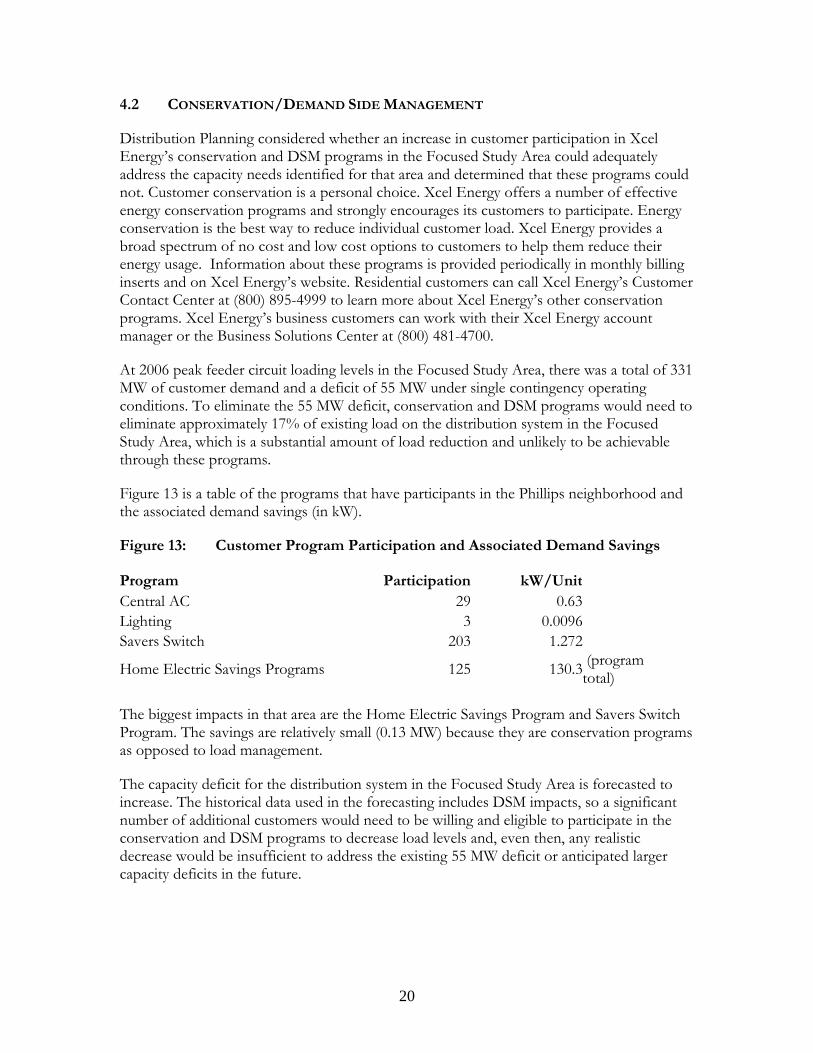
Figure 13 is a table of the programs that have participants in the Phillips neighborhood and the associated demand savings (in kW).
Figure 13: Customer Program Participation and Associated Demand Savings
Program Participation kW/Unit Central AC 29 0.63 Lighting 3 0.0096 Savers Switch 203 1.272
Home Electric Savings Programs 125 130.3 (program total)
The biggest impacts in that area are the Home Electric Savings Program and Savers Switch Program. The savings are relatively small (0.13 MW) because they are conservation programs as opposed to load management.
The capacity deficit for the distribution system in the Focused Study Area is forecasted to increase. The historical data used in the forecasting includes DSM impacts, so a significant number of additional customers would need to be willing and eligible to participate in the conservation and DSM programs to decrease load levels and, even then, any realistic decrease would be insufficient to address the existing 55 MW deficit or anticipated larger capacity deficits in the future.
21
4.3 GENERATION ALTERNATIVES
Engineers at Xcel Energy analyzed whether distributed or renewable generation sources could meet the capacity need identified for the south Minneapolis Distribution Delivery System in the Focused Study Area. As a result of that analysis, it was ultimately determined that additional generation, regardless of fuel source, would not satisfy the existing or expected future demand for electricity in the south Minneapolis area in a reasonable fashion. The need identified for the Focused Study Area is one of distribution load-serving capacity only; no additional generation capacity is needed on the existing 115 kV system to serve the growing load in the south Minneapolis area.
4.3.1 Distributed Generation
Distributed generation is generally considered to be small generation sources, usually less than 10 MW, located close to the ultimate users. However, in some cases generators larger than 10 MW are considered to be distributed generation as well. In general, adding generation could help the reliability of serving the load in a relatively small geographic area. This alternative solution of building small generators, however, decreases the benefit-cost ratio of building generation to avoid transmission because it is less economical than building larger generating stations.
To be sufficient, generation would need to replicate the reliability provided by adding transmission. Transmission lines have the ability to operate more than 99% of the time. This reliability level is one of the benefits of constructing transmission lines. For comparison purposes peaking generation cannot be assumed to be available to operate more than 95% of the necessary hours. Consequently, to replicate the 99% reliability found in transmission, redundant generation would need to be installed.
In addition to the extra capital investment that would be required to install redundant generation to serve the same need as transmission, additional costs would have to be taken into account for the higher operations and maintenance of generators when compared to such expenses for transmission. Once constructed, transmission lines require relatively modest ongoing operations and maintenance costs. Maintenance costs for small generators are high because the units need to be tested frequently to ensure they are fully functional and will be available when needed. Periodic exercising of the units on a monthly or bi-monthly basis (especially for diesel units) is necessary to maintain reliability and must be done under load. Oil changes are also needed on a regular basis. An engine generator can usually be run continually for a period of one to two years and then requires a complete rebuild of the unit.
Another obstacle to installing generation is that transmission typically cannot be avoided altogether. Unless the generation can be built to interconnect to existing lines with sufficient capacity, new lines would have to be built to accommodate the new generation. This needed transmission further increases the cost of that generation alternative.
The most likely fuel for dispatchable distributed generation would be diesel, and many diesel generators, which are typically in the 1.5 to 2 MW range, would be required to generate the amount of capacity necessary to address the shortfalls currently projected. Diesel fired generators like those under consideration here are generally used on a standby basis. These

22
generators are only operated during peak system conditions or if needed for reliability. Diesel generators are not generally operated continually. That provides two concerns in this situation. First, if a contingency arises, like a storm event, there could be a period of time when power was not available while the plant was placed into operation. Second, as the demand for power continues to grow in the south Minneapolis area, these generators would be run more often and new generators would need to be added.
4.3.2 Wind Generation
Because of the theoretical possibility that generation could potentially address community reliability needs, Xcel Energy engineers analyzed whether the addition of small and dispersed wind generation projects could eliminate the need for the proposed transmission project. The analysis concluded that sufficient wind generation cannot be installed to offset the community service reliability deficiencies in the affected area. This is due to the variability of wind, City of Minneapolis ordinances, and cost.
Wind generation is a “variable” resource that is dependent on the availability of wind to operate. While a wind turbine may have a stated nameplate capacity, its average net operating output may range from 10% to 40% of its nameplate capacity throughout the year. A wind turbine is a “nondispatchable” resource and cannot be relied on to produce power in the same way as a conventional power plant. A traditional power plant (e.g., natural gas, nuclear, hydro, coal) is “dispatchable”, meaning it can be relied upon to produce power when power is needed. Power needs to be created and used in equal amounts for each instant of time. Power typically cannot be created one day and used the next without introducing an energy storage system such as batteries to store power until it is needed.
As a result, wind generation is generally relied upon as a source of energy but does not provide the type of capacity that is required to ensure reliable customer service for those times when the wind is not blowing. As a result, wind generation is typically integrated into the transmission system along with dispatchable resources such as natural gas peaking plants and hydro, which are capable of generating power during those hours when customer demand is high but the wind is not blowing.
This operating characteristic creates two separate issues, each of which can be alleviated by transmission. First, the system must be capable of importing power to the affected community during those hours when sufficient wind power is not being generated to satisfy the entire need (i.e., high demand/low wind scenario). Second, the system must be capable of exporting power from the affected community during those hours when more wind energy is being generated than can be used by the local community (i.e., low demand/high wind scenario).
Because the electric system must be designed to meet all customer requirements during all hours of the year, the addition of local wind energy generators will not eliminate the need for additional transmission. To the extent that wind generation projects might be able to meet local community service reliability needs, that ability is limited and therefore the electricity delivery system must still be designed to cover the deficiencies identified. Moreover, additional infrastructure needs to be constructed to export that wind generated power to the transmission system at times when wind-generated power exceeds community load levels.

23
Therefore, dispersed wind projects are not a reasonable alternative to the proposed transmission alternative for local community service reliability needs.
Even if wind generation could provide the needed capacity, it is not a feasible option here. Minneapolis ordinances require at least one acre of land for wind turbine siting (Minneapolis Code § 535.730) and limit the heights of wind turbines to 60 feet on lots between one to five acres in residence, office residence and commercial districts (Minneapolis Code § 535.740). To install wind turbines in the densely populated south Minneapolis area, they would need to be placed on residential lots. If a one-acre residential lot were available for wind turbine placement, the height of the wind turbine would likely exceed Minneapolis City Ordinance height restrictions of 60 feet. The turbines would also be expected to generate noise at decibel levels which violate Minneapolis ordinance noise limit levels of 60-65 dBA during the day and 50-55 dBA during the night in industrial/residential mix areas (see Minneapolis Ordinance § 389.210).
Even if the turbines could be installed in compliance with Minneapolis ordinances, the alternative is not practical. The largest turbine that can be installed on a home without major wiring changes is 20 kW. If the assumption is made that wind could provide the needed capacity, 6,000 turbines would need to be installed to create the 120 MW capacity that would be provided by A1.
turbinesturbineKilowatts
Megawatts 6000/20
120=
The costs associated with new turbines are also a relevant consideration. Using turbine costs provided by ReDriven www.redriven.net, a manufacturer of wind turbines and towers, the costs for a 20 kW unit is $61,628 ($47,737 for turbine and $13,891 for tower). Without considering shipping and installation, charges that are not included, the cost would be $370 million (6000 * $61,628).
4.3.3 Solar Generation
In addition to wind generation as an alternative, Xcel Energy engineers considered distributed solar generation (photovoltaics) as an alternative. For purposes of the analysis, it was assumed that solar panels will be able to output nameplate rating when demand is needed, that each panel would require 400 sq. ft of space, and that residential infrastructure capable of holding the weight (i.e., structural requirements are met) of a solar array would be used.
Using the above assumptions, the largest array solar that can be placed on a home is approximately 4.6 kW. To create 120 MW of capacity, units would have to be installed on 21,739 homes. (http://www.wholesalesolar.com/gridtie.html).
arrayKilowattsMegawattsarrays
/6.4120087,26 =
The cost of the equipment, excluding shipping and installation, would be approximately $26,000 per array. (http://www.wholesalesolar.com/gridtie.html). The total cost for
24
120 MW would be $670 million, which is based on the need for a minimum of 26,087 arrays at a cost of $26,000 per array.
Solar system output reaches its maximum output during the noonday period and falls off as the afternoon progresses. Residential load, however, typically reaches its peak later in the day and usually occurs between 4 and 6 p.m. as people return home from work and school for the day. This means that the energy output of the system has peaked prior to the load on the system peaking. This poses significant challenges to efforts to use photovoltaic systems to displace or defer investments in distribution system equipment designed primarily to serve residential customers. In order to do that, either extremely large systems requiring hundreds of acres or unrealistic photovoltaic saturation would be needed to defer investments.
4.3.4 Smart Technologies
Various smart technologies are being developed and evaluated to improve the effectiveness and efficiency of the power grid. Such technologies include sensors, high-speed communications, digital intelligence and smart meters, as well as conservation measures like high efficiency lighting, and more efficient heating and cooling systems. Smart technologies are expected to allow utility companies and consumers to better communicate and work together to improve performance, reliability and security of the electric grid. The goal of these technologies is to provide consumers the information necessary to monitor and manage how much electricity they are using at any given moment in their home or business and thus use energy more wisely. From a conservation standpoint, the success of smart technologies depends on how consumers use them. The technologies provide energy information to consumers, but it is up to consumers to use the information to change their electric usage behavior for conservation benefits to be fully recognized. If consumers choose not to use the information, any potential conservation benefits are lost.
Regardless, many smart technologies are just beginning to be tested. Xcel Energy is hopeful that these technologies can achieve significant, tangible benefits, but absent real-life data, the efficacy of smart technologies cannot be quantified with any precision. Only proven, readily deployable smart technology elements are currently being used by Xcel Energy. Once these technologies are thoroughly assessed, utilities will know whether the projected benefits, including reductions in residential demand, can be realized. As the technology develops, Xcel Energy hopes to deploy additional tested and relevant elements across their system. Distribution Planning determined that smart technologies would not be able to address the existing 55 MW capacity deficiency in the Focused Study Area.
4.3.5 Cogeneration
Also known as “combined heat and power” (“CHP”) systems, cogeneration is the simultaneous production of electricity and heat from a fuel source. These systems make use of the energy that still remains in the waste heat given off in a conventional power production process.
Cogeneration for heating needs will provide little electricity most of the year. Only in the coldest weather do stores and offices need much heat. Typically, facilities with cogeneration systems use them to produce their own electricity and then capture the waste heat from that
25
process for use in heating, hot water and for other thermal requirements. There are benefits associated with these types of systems including saving money through more efficient use of fuel, improved power reliability to the local system served by the CHP system, and the conservation of fossil fuels by reducing demand on the distribution and transmission systems.
To work economically, the cogenerator needs to follow heat load, not electrical. They are not efficient/cost effective following electrical demand due to needing to dump the excess heat most of the year. Peak electrical need and primary need for substation and transmission capacity is in the summer. Only businesses with high process steam or hot water needs would generate much electricity in the summer. These are rare in urban, predominantly non-industrial areas. Absorption cooling uses heat but it is not cost effective in small units and small users do not want to deal with the toxic ammonia.
Distribution feeders are not designed to handle major power flowing towards the substation. Some export is possible with upgrades to protective devices and voltage regulation devices involved. Major export requires reconductoring and other expensive and potentially disruptive upgrades. On a large scale, such as would be needed to substitute for the addition of new substation and transmission infrastructure, the cost would be higher and the service reliability and power quality would be degraded, in some cases, to a significant degree. This much generation is unlikely to be within the capacity of the existing natural gas system to support and substantial upgrade costs would be incurred including major, disruptive burying of bigger pipes and the installation of additional pressure regulation stations.
5.0 CONCLUSION
Distribution Planning has been monitoring the growing customer electrical demand in the Focused Study Area for many years. Electrical planners have used all available distribution tools available to keep up with increasing demand. These distribution level alternatives are no longer sufficient to meet the needs of the Focused Study Area without adding a new distribution source.
Distribution Planning Engineers analyzed historical loading and utilization of feeders and substation transformers in the Focused Study Area and the Greater Study Area and determined that there exists today a 55 MW capacity deficit in the Focused Study Area. Distribution Planning Engineers and Transmission Planning Engineers determined that the best performing alternative for meeting the area’s need is A1, comprised of two new substations – Hiawatha and Midtown – and two looped 115 kV transmission lines between the two substations.
The proposed alternative costs approximately $33.4 million and will provide 120 MW of additional capacity in the Focused Study Area. This additional capacity addresses the area’s existing capacity deficit and will provide expansion capability to meet the needs of the area for many years to come. In particular, the configuration will locate a new substation in the Hiawatha area and a new substation in the Midtown area that will be capable of expansion to meet future needs for additional transformer and transmission sources to serve the Focused Study Area and the Greater Study Area of south Minneapolis.
2329194v1