d4 initial policy assessment - fvv.tuwien.ac.at filepro pects procedures for recommending optimal...
TRANSCRIPT
pro pects
Procedures for Recommending Optimal Sustainable Planning of European City Transport Systems
Deliverable No. 4
Initial Policy Assessment
Version 5.1
(30th October 2001)
Authors : Tony May and Bryan Matthews
Proposal number : EVK4-1999-00013 Project Co-ordinator : Institute for Transport Studies, University of Leeds, UK Contractors : Kungl Tekniska Högskolan, SE Institute of Transport Economics, NO Institute for Traffic Planning & Traffic Engineering, AU VTT Building and Transport, FI Universidad Politecnica de Madrid, ES David Simmonds Consultancy, UK MVA Limited, UK
Funded by the European Commission 5th Framework - EESD
Table Of Contents
1 Introduction................................................................................................................................ 4 2 Land-Use Measures.................................................................................................................... 7
2.1 Application to Different Modes ......................................................................................... 7 2.2 Types of Measure............................................................................................................... 7
Table 2.1 Summary assessment against objectives: land use measures............................... 10 Table 2.2 Summary assessment against barriers: land use measures................................... 11
3 Attitudinal and behavioural measures...................................................................................... 12 3.1 Types of measures............................................................................................................ 12
Table 3.2 Summary assessment against barriers: attitudinal and behavioural measures .... 14 4 Infrastructure measures ............................................................................................................ 15
4.1 Measures to influence car-use.......................................................................................... 15 4.2 Measures to influence public transport use...................................................................... 16 4.3 Provision for cyclists and pedestrians .............................................................................. 19 4.4 Provision for freight ......................................................................................................... 20
Table 4.1 Summary assessment against objectives: infrastructure measures ...................... 21 Table 4.2 Summary assessment against barriers: infrastructure measures.......................... 22
5 Management of the Infrastructure ............................................................................................ 23 5.1 Measures to influence car use .......................................................................................... 23 5.2 Measures to influence public transport use...................................................................... 27 5.3 Provision for cyclists and pedestrians .............................................................................. 28 5.4 Provision for freight ......................................................................................................... 29
Table 5.1 Summary assessment against objectives: management measures....................... 31 Table 5.2 Summary assessment against barriers: management measures........................... 32
6 Information provision .............................................................................................................. 33 6.1 Measures to influence car use .......................................................................................... 33 6.2 Measures to influence public transport use...................................................................... 34 6.3 Provisions for cyclists and pedestrians ............................................................................ 35 6.4 Provision for freight ......................................................................................................... 35
Table 6.1 Summary assessment against objectives: information systems .......................... 36 Table 6.2 Summary assessment against barriers: information systems .............................. 37
7 Pricing ...................................................................................................................................... 38 7.1 Measures to influence car use .......................................................................................... 38 7.2 Measures to influence public transport use...................................................................... 40 7.3 Provision for Cyclists and Pedestrians............................................................................. 41 7.4 Provision for Freight ........................................................................................................ 41
Table 7.1 Summary assessment against objectives: pricing measures................................ 42 Table 7.2 Summary assessment against barriers: pricing measures.................................... 42
8 Policy Integration ..................................................................................................................... 43 8.1 Need for Integration ......................................................................................................... 43 8.2 Potential Benefits from Integration.................................................................................. 43 8.3 Barriers to Integration ...................................................................................................... 44 8.4 Initial Guidance on Policy Integration ............................................................................. 44
Table 8.1 Interactions between strategy measures .............................................................. 45 References ........................................................................................................................................ 47 Annex A ........................................................................................................................................... 58

3.2 Sustainability, the basic objective .................................................................................... 58 3.3 Sub-objectives to sustainability ....................................................................................... 59
3.3.1 Economic efficiency................................................................................................ 59 3.3.2 Livable streets and neighbourhoods..................................................................... 60 3.3.3 Protection of the environment............................................................................... 60 3.3.4 Equity and social inclusion.................................................................................... 60 3.3.5 Safety and severity of traffic accidents ................................................................ 61 3.3.6 Contribution to economic growth......................................................................... 61 6.1.2 Concept and types of barriers............................................................................... 61

PROSPECTS Deliverable 4 Summary
__________________________________________________________________________________________
Page 3
Summary This report is the fourth deliverable of PROSPECTS: Procedures for Recommending Sustainable Planning of European City Transport Systems. PROSPECTS is funded under the European Commission’s Environment and Sustainable Development Programme. It is designed to provide cities with the guidance which they need in order to generate optimal land use and transport strategies to meet the challenge of sustainability in their particular circumstances. The report presents the results of Task 43 of the project, to provide an initial assessment of the 80 policy instruments identified in Deliverable One (May, Jarvi-Nykanen, Minken, Ramjerdi, Matthews and Monzon, 2000). This initial assessment should be seen as an interim summary of our understanding of the performance of the range of policy instruments. It is a working document which will, between now and late 2002, be developed into the policy guidebook; one of a set of three guidebooks to be prepared by PROSPECTS as the project’s final output. Comments are welcome on the content of this report and in particular on the basis for assessing the policy instruments considered, and on any gaps in the evidence used. Transport planners have available to them, at least in principle, a wide range of transport policy instruments. These are the means by which the policy objectives can be achieved, and the problems identified overcome. The six key policy objectives against which we conduct our initial assessment were identified in Deliverable One (May, Jarvi-Nykanen, Minken, Ramjerdi, Matthews and Monzon, 2001). These objectives are: economic efficiency; liveable streets and neighbourhoods; protection of the environment; equity and social inclusion; safety and severity of traffic accidents; and contribution to economic growth; all of which contribute to the overarching objective of sustainability. In addition, we assess the policy instruments against the three barriers identified in Deliverable One: legal, financial and political. The instruments can be categorised in several ways. This report considers them under the headings of land use measures (Section 2); attitudinal and behavioural measures (Section 3); infrastructure provision (Section 4); management of the infrastructure (Section 5); information provision (Section 6) and pricing (Section 7). Where relevant it considers in order, under these headings, measures to influence car-use; measures to influence public transport-use; provision for cyclists and pedestrians; and provision for freight. It is noted that policy instruments outside the transport field may be important in supporting these transport and land-use instruments and that authorities should liaise between different departments to ensure that policy instruments from all relevant parts of the authority complement each other and form a cohesive, sustainable strategy. This report provides a brief summary of the evidence on each of 66 main types of instrument available, and provides references to particularly useful sources of such evidence. A series of tables are also presented in each section which summarise in headline form the impact of each measure on each objective on a common basis. However, no one instrument on its own is likely to provide a solution to transport problems. Most have at least one positive contribution to make but also have adverse impacts. A package of measures is likely to tackle more problems; one measure can offset the disadvantages of another or avoid the transfer of problems to another area; a second measure can reinforce the impact of the first. Hence, the overall benefits of a package of instruments are greater than the sum of the parts. The main benefits of integration relate to complementarity of impacts on users, financial feasibility and public acceptability. The report concludes with an assessment of how to identify instruments which might achieve such synergy and generate integrated policy packages.
PROSPECTS Deliverable 4 Introduction
__________________________________________________________________________________________
Page 4
1 Introduction
This report is the fourth deliverable of PROSPECTS: Procedures for Recommending Sustainable Planning of European City Transport Systems. PROSPECTS is funded under the European Commission’s Environment and Sustainable Development Programme. It is designed to provide cities with the guidance which they need in order to generate optimal land use and transport strategies to meet the challenge of sustainability in their particular circumstances. The report presents the results of Task 43 of the project, to provide an initial assessment of the 80 policy instruments identified in Deliverable One (May, Jarvi-Nykanen, Minken, Ramjerdi, Matthews and Monzon, 2001). This initial assessment should be seen as an interim summary of our understanding of the performance of the range of policy instruments. It is a working document which will, between now and late 2002, be developed into the policy guidebook; one of a set of three guidebooks to be prepared by PROSPECTS as the project’s final output. This report will also contribute to a new internet-based Knowledgebase on Sustainable Urban Land Use and Transport (KONSULT), which is scheduled to be launched at the same time as the policy guidebooks (May, 2001). Comments are welcome on the content of this report and in particular on the basis for assessing the policy instruments considered, and on any gaps in the evidence used. Deliverable One illustrated that transport planners have available to them, at least in principle, a wide range of transport policy instruments. These are the means by which the policy objectives can be achieved, and the problems identified overcome. The six key policy objectives against which we conduct our initial assessment were identified in Deliverable One. These objectives are: economic efficiency; liveable streets and neighbourhoods; protection of the environment; equity and social inclusion; safety and severity of traffic accidents; and contribution to economic growth, all of which contribute to the overarching objective of sustainability. In addition, we assess the policy instruments against the three barriers identified in Deliverable One: legal, financial and political. Annex A reproduces excerpts from Deliverable One which define the objectives and the barriers. It demonstrates the way in which all six objectives can be presented as contributions to sustainability. It should be noted that a second overarching objective of health improvement has attracted increased interest since Deliverable One was produced. The objectives of liveable streets and neighbourhoods; protection of the environment; equity and social inclusion; and safety and severity of traffic accidents all contribute to this overarching objective. The instruments can be categorised in several ways. This report considers them under the headings of land use measures (Section 2); attitudinal and behavioural measures (Section 3); infrastructure provision (Section 4); management of the infrastructure (Section 5); information provision (Section 6) and pricing (Section 7). Where relevant it considers in order, under these headings, measures to influence car-use; measures to influence public transport-use; provision for cyclists and pedestrians; and provision for freight. A further category of ‘compensatory measures outside the transport field’ was identified in our earlier discussions with city authorities but has not been included within this report. This category included instruments such as changes in local and business taxes and general subsidies for specific groups. However, as these are outside the transport field they are, almost by definition, beyond the scope of this report. Our advice with regard to this category of policy instruments is for city transport and land-use authorities to liaise with their respective education, social services, economic development, health and finance authorities to ensure that policy instruments from all relevant parts of the authority complement each other and form a cohesive, sustainable strategy. The key question with each of the measures is its ability to achieve one or more of the policy
PROSPECTS Deliverable 4 Introduction
__________________________________________________________________________________________
Page 5
objectives listed above. Unfortunately, this is an area of transport policy in which information is often sparse. Experience with some measures, such as bus priorities and cycle lanes, has been well documented through a series of demonstration projects. In other cases, of which road construction is the most glaring example, there have been very few before and after studies to provide the evidence on the impact of the measure. Even where the evidence exists, it may be difficult to generalise from it, since results in one context are not necessarily transferable to another. In the absence of real life trials, the most obvious source of evidence is desk studies, typically using computer models. This is, for example, still the principal source of guidance on the impact of road pricing. Such results are, of course, only as reliable as the models which generate them. This report provides a brief summary of the evidence on each of the main types of measure available, and provides references to particularly useful sources of such evidence. While achievement of objectives is crucial, it is also important to avoid worsening conditions under other objectives. For example, one of the major concerns with road building has always been that, while it may achieve benefits in terms of efficiency, accessibility and economic regeneration, it may seriously compromise the environment of the area through which it passes. Any evidence on adverse impacts of the measures considered is also summarised below. Whilst PROSPECTS Deliverable One identified some 80 policy instruments, this report has re-grouped some of these and, due to a lack of readily identifiable evidence, been compelled to omit others. We have also, as noted above, omitted one category of instruments due to them being beyond the scope of this report. Therefore, this report summarises evidence on some 66 instruments. The instruments which have been re-grouped or omitted are as follows: • Protection of certain sites from development – lack of evidence; • Other land-use taxes – lack of evidence; • Conventional speed controls and restrictions – included under ‘traffic calming; • Maintenance of existing fixed infrastructure – lack of evidence; • New bus services – included under ‘service levels’; • Timetabling strategies – lack of evidence; • On-bus cameras for traffic regulation enforcement – included under ‘bus priorities’; • Safe routes to school – included under ‘pedestrian routes’; • Lorry parking and loading restrictions – lack of evidence; • Integrated ticketing systems – included under ‘fares structures; • Changes in local taxes – out of scope; • Changes in business taxes – out of scope; • General subsidies for specific groups – out of scope; and • Targetted assistance for specific groups – out of scope. Inevitably, when dealing with almost 80 separate policy instruments in one short report, much of this information has to be presented in note form. The reference texts should provide further information where necessary. A series of tables are presented in each section which summarise in headline form the impact of each measure on each objective on a common basis. These tables are provided for guidance only; it is essential to assess the impact of each measure in the context of the area for which it is being considered and more detailed assessment should involve study of the literature cited. The work builds on two earlier assessments of policy measures, the first in the Institution of Highways and Transportation's Guidelines for Developing Urban Transport Strategies (IHT, 1996) and the second in advice developed for the UK Guidance on the Methodology for Multi-Modal

PROSPECTS Deliverable 4 Introduction
__________________________________________________________________________________________
Page 6
Studies (May and Still, 2000). This report differs from previous work in four important ways; it: • uses a different categorisation of policy instruments; • includes a greater number of policy instruments; • incorporates evidence from elsewhere in Europe; and • assesses the policy instruments against a broader range of objectives and barriers.
However, it is still based to a significant extent on the UK experience which underpinned the earlier documents. One purpose of producing the Deliverable at this stage is to encourage readers to identify experience from other countries which might be relevant to the final Policy Guidebook and the Knowledgebase. A final section (Section 8) considers the evidence on the ways in which policy instruments might most effectively be integrated into a coherent strategy. In doing so, it draws on the evidence from the previous two reports, and on subsequent analysis in PROSPECTS (May, Matthews and Jarvi-Nykanen, 2001) and in other research (May and Roberts, 1995; May, Shepherd and Timms, 2000).
PROSPECTS Deliverable 4 Land Use Measures
__________________________________________________________________________________________
Page 7
2 Land-Use Measures
2.1 Application to Different Modes
Land use measures cannot in the main be focused on a particular mode so are considered together, rather than under modal headings, in this section. However, many of them are designed to reduce the growth in length of motorised journeys, to encourage the use of public transport, cycling and walking, and hence also reduce future reliance on the car; principles set out in more detail in recent guidance (DETR, 2001c; Comunidad de Madrid, 1996). Land use measures are also seen to have a role in influencing freight movements, by encouragement of development near to rail and waterborne freight facilities. Many of the land-use measures aim to encourage an integrated approach to land-use and transport planning in both urban and rural areas, and stimulate local authorities to implement their own land-use priorities within this framework. 2.2 Types of Measure
Development densities, involving an increase in density of development throughout an area to reduce the need to travel, can be specified in local authorities’ Development Plans, and will apply to new development. Higher densities enable more opportunities to be reached within a given distance, and hence may encourage shorter journeys and use of cycling and walking. By increasing population and employment densities, they also make public transport more viable. Measures of this kind have been employed in California for a decade (Wachs, 1990). Some examples of schemes attempting to encourage centralisation in London and Watford are given in DoE/DoT (1995). However, there is very little evidence of the scale of these effects, except for cross-sectional comparisons which demonstrate that residents in lower density areas are more likely to use the car and to travel longer distances (Newman and Kenworthy, 1991; Handy, 1997). A modelling study for Bristol found that car trips to the centre could be reduced by over 10% if population could be centralised within Bristol (Coombe and Simmonds, 1997). Development pattern, including transport corridor-based developments whereby development is encouraged within transport corridors and near to transport nodes, can be influenced in such a way as to encourage provision and use of public transport. It can provide a way of concentrating denser development, and that which can more readily use public transport, in those areas where public transport is readily available. This can lead to a corridor-style development, and has been used to considerable effect in cities such as Toronto (Knight and Trygg, 1977). The Dutch ABC policy is an extension of this concept. Developments are categorised in terms of their ability to use public transport and their need for road-based freight transport, and allocated to different zones in an urban area (de Jong, 1995). A Dutch Government report on the ABC policy concluded that while new developments were being concentrated near public transport nodes, there was still resistance to development at sites with limited car parking provision (Bakker et al, 1997). Such strategies are intuitively sensible and should reduce journey lengths, improve accessibility and have some efficiency and environmental benefits. However, there is little evidence concerning their impact on overall travel levels. An alternative approach, practised in several Dutch new towns, is to develop residential areas with more direct access to walking, cycling and bus routes than to the road network. An early comparison of the city of Almere with Milton Keynes, in England, which was developed with a traditional main road network, suggested that the development of Almere had encouraged car ownership and car use levels of around 70% of those in Milton Keynes. (TEST, 1991). There is also evidence to indicate that the pattern of the road network can be important in influencing mode choice. A comparative
PROSPECTS Deliverable 4 Land Use Measures
__________________________________________________________________________________________
Page 8
study of nine Dutch cities suggests that grid-type networks favour non-motorised modes as opposed to ring-radial structures which favour motorised modes (Snellen 2000). Another study of the Dutch town of Houten suggests that its coarse road network and dense cycle network have encouraged levels of car use 25% below the average for new developments elsewhere in Holland (Marshall and Banister, 2000). Development mix, in which homes, jobs and shops are placed close together, thus reducing the need to travel, is strongly advocated in UK government advice (DETR, 2001c). The key objective is to reduce car use and travel distances. The UK Guidance on Good Practice (DoE/DoT, 1995), cites Almere in the Netherlands, parts of Edinburgh, Richmond and Crawley as good practice in mixing land-uses as part of re-development or new developments. Several US states have introduced a ‘jobs-housing balance’ into their planning controls for the same purpose (Wachs, 1993). However, while such policies should improve accessibility, there is little evidence that users do in practice travel to the jobs and leisure facilities which are nearer to their homes. For example, a comparative study of nine Dutch cities found that nearby available facilities are often not chosen as a destination by neighbourhood inhabitants (Snellen, 2000). Generally there is insufficient understanding at present of the impact on travel of different policies for development density and mix. Developer contributions towards the financing of transport infrastructure can be required from developers as part of the process of obtaining permission for development. This approach has been applied successfully in the UK to secure finance for new roads and also for the provision of park and ride sites. More recent examples are for developers to contribute to public transport serving new developments (e.g. at the Leith dockside in Edinburgh or Hounslow in west London (DoE/DoT, 1995). In some cases, eg London Docklands, financial contributions may be voluntarily offered by the developer as a potential means of influencing the timing, scale, design or some other aspect of the scheme (Nash, Matthews, Granero and Marler, 2001). The main risks are that the developer may go elsewhere if too many contributions are demanded and that the social benefits of the scheme may be compremised if developers are permitted to influence it too much to their own benefit. Parking standards probably offer the single most direct impact on levels of car use among land use measures. Conventionally these have required developers to provide at least a minimum number of parking spaces per unit floor area to ensure that all parking generated takes place off street. The resulting parking adds to the stock of private non residential space, and further reduces the ability of city authorities to use parking controls as a restraint tool. UK guidance now requires local authorities to set much more restrictive ‘maximum standards and several authorities have already followed this approach (Sanderson, 1994). Such measures can limit the growth in parking space and aim to induce mode switching (although it is possible that workers simply park elsewhere). Reducing parking can increase the gross floorspace, and hence site profitability. Changes in mode use can lead to efficiency and environmental benefits. However, there is always the danger that, under pressure from developers, city authorities will relax these new standards to attract valuable development, or that developers will find ways around the standards. There is evidence of this in the early years of implementing maximum standards (Haworth and Hilton, 1982). This is particularly the case in areas with competing centres with different parking standards. More recently, some authorities are now linking the level of parking standard applied to the level of public transport accessibility. The higher the latter, the fewer non-operational spaces permitted (LPAC, 1993; Carson et al, 1999). Commuted payments or ‘cashing out’ offers developers the option of providing less parking than
PROSPECTS Deliverable 4 Land Use Measures
__________________________________________________________________________________________
Page 9
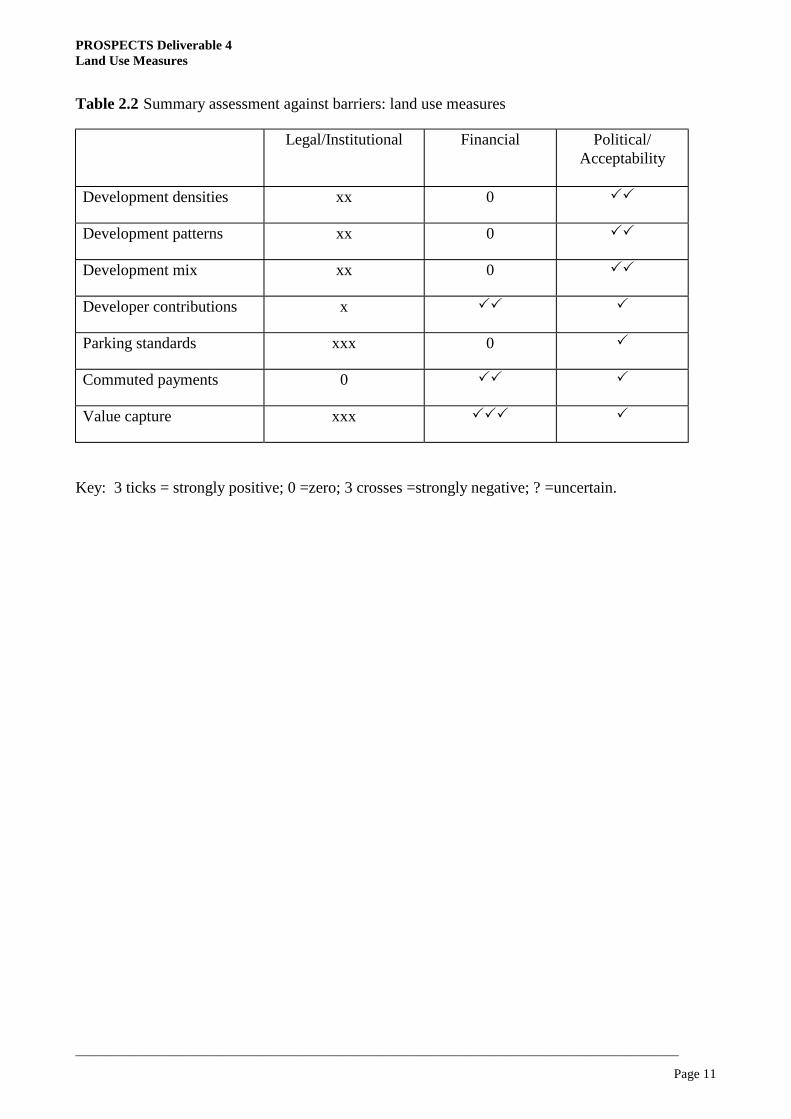
the minimum required under normal planning conditions, but paying for public space. The normal requirements for private parking provision at new developments are waived in return for payment to the local authority of a charge per space so that the local authority can make provision in public car parks. This has the twin advantages of permitting denser development and increasing the proportion of parking stock which is within public control. Hamburg has combined park-and-ride with commuted payments, although the success of these policies is largely unknown (DoE/DoT, 1995). This measure is not feasible when low maximum parking standards are introduced. A variant on commuted payments is the Californian ‘cashing-out’ policy, where employers are required to offer their employees cash in lieu of a parking space. Initial results have shown that solo drivers fell by 17% while car-poolers and public transport patronage increased (Shoup, 1997). Value capture and business taxes are designed to reflect the windfall benefits to existing developments from improved accessibility. The simplest system is a tax related to turnover or number of employees, though the tax may also be related to land values and/or other transport service level criteria. In Vienna the "Dienstgeberabgabe" is a municipal tax collected from all employers in the municipality. Employers pay a fixed rate per employee and the tax revenue is earmarked for investment in the Vienna subway. In French cities with population greater than 20000, the "versement transport" is levied on employers who have more than nine employees and who do not provide workplace-related transport or housing facilities. The tax is calculated as a percentage of the company’s wage bill. This percentage varies according to the type of location (central/peripheral), the number of inhabitants and the type of public transport available in the city. Tax revenues are earmarked for subsidising public transport investment and operating costs. While such schemes provide a valuable source of finance, there is little evidence on their impacts on travel. True value capture, as proposed, involves taxing land owners close to new infrastructure to reflect their increased accessibility benefits. There is little evidence of its application in practice. Table 2.1 provides a summary assessment against the key policy objectives. Because the impacts on travel patterns and modes used are uncertain, so are the impacts of development measures on efficiency, environment, equity, safety and economic growth. However, all of these measures can be expected to have a positive impact on liveable streets by inducing land-use patterns which make cities more lively; development patterns which reduce the emphasis on the road network are also likely to improve the environment and safety. The three financial measures and parking standards are more likely to enhance efficiency by reducing unnecessary investment and focusing investment on alternatives to the car. They will also have positive environmental or equity impacts, but may lead to some discouragement of economic growth. Table 2.2 provides a similar assessment against the three types of barrier. All measures are critically dependent on the willingness of developers to participate. Unless this is required by national legislation, there will always be the threat that developers will transfer to cities which are less restrictive. Conversely, most measures are likely to attract public and political support, at least in principle; those which generate income will also reduce financial barriers.

PROSPECTS Deliverable 4 Land Use Measures
__________________________________________________________________________________________
Page 10
Table 2.1 Summary assessment against objectives: land use measures
Instrument Economic Efficiency
Liveable Streets
Environment Equity Safety Economic Growth
Development densities
? !! ! ? ! ?
Development patterns
! !! ! ? ! ?
Development mix
? !! ? ! ? ?
Developer contributions
! 0 ? !! 0 x
Parking standards
!!! ? !! 0 ! x
Commuted payments
!! ! !! 0 0 0
Value capture ! 0 0 !! 0 x
Key: 3 ticks = strongly positive; 0 =zero; 3 crosses =strongly negative; ? =uncertain.
PROSPECTS Deliverable 4 Land Use Measures
__________________________________________________________________________________________
Page 11
Table 2.2 Summary assessment against barriers: land use measures
Legal/Institutional Financial Political/ Acceptability
Development densities xx 0 !!
Development patterns xx 0 !!
Development mix xx 0 !!
Developer contributions x !! !
Parking standards xxx 0 !
Commuted payments 0 !! !
Value capture xxx !!! !
Key: 3 ticks = strongly positive; 0 =zero; 3 crosses =strongly negative; ? =uncertain.
PROSPECTS Deliverable 4 Attitudinal and behavioural measures
__________________________________________________________________________________________
Page 12
3 Attitudinal and behavioural measures
3.1 Types of measures
Public awareness campaigns are designed to encourage individuals to use alternatives which reduce overall travel, and travel by car. They might use a range of media, e.g. advertisements in newspapers, television, radio, cinemas, and leaflets and other material distributed to specific groups or to drivers in general. The purpose is increased knowledge and understanding. However, unless this results in behavioural changes, no effect is obtained. It is difficult to isolate effects that follow from awareness campaigns. Regarding effects on traffic safety, studies from Europe, the USA and Australia reported small, often insignificant, impacts on the number of accidents (Elvik, Mysen and Vaa, 1997). Behavioural changes seem to be larger when the share of unwanted behaviour initially is low, when the campaign is combined with increased enforcement, and when the medium is television. Those studies which have assessed the impact of encouragements to use more sustainable modes have typically suggested that reductions in car use of around 5% to 10% can be achieved (INPHORMM, 1998). Those which have used personalised marketing to focus advice on the particular needs of the individual have claimed reductions in excess of 20% (Brog et al, 1999). Flexible working hours are designed to reduce demand for peak travel and the resulting congestion. True flexible hours working provides the employee with flexibility in hours of arrival and departure, while specifying a required core time and number of hours per week or month. In many cases they were introduced by employers to retain employees rather than for transport policy purposes, and the scale of their operation, and impact, is thus not well understood. However, there have been some detailed studies of such operations (Daniels, 1981). Staggered hours, in which employers are encouraged to change the fixed working hours of all or a proportion of their employees, were popular in the US in the 1970s, and were designed specifically to reduce peak loadings on the transport system (O'Malley and Selinger, 1973). Another variant which has been discussed, but rarely tested, is the four day week in which employees work the same hours per week, but travel on one fewer day. Whilst this creates the possibility of significantly reducing the number of car commuter journeys per week, it may also have a similar impact on public transport commuter journeys and, hence, lead to adverse impacts on the viability of public transport services. Studies of flexible working hours and staggered hours suggest that the overall economic benefits have been small, but they can have significant benefits for participants. In some cases they have enabled peak public transport services to be withdrawn, thus saving operating costs (DoT, 1977), but in the main they have simply transferred travel to slightly less congested times. It had been feared that flexible working hours would discourage car sharing and public transport use. In practice, US experience suggests the reverse; some car users switch either to car sharing or to public transport because they can adjust their working hours to match the schedules imposed. A study in Boston found that flexible working hours in one major office led to a 7% reduction in drive alone car use, and 6% and 5% increases in car sharing and bus use respectively. (Ott et al, 1980). Brewer (1998) provides a more recent summary. However, all such measures are the direct responsibility of the employer, and can be changed without consultation with transport providers. City authorities therefore have no real power to influence them, but there are now a few examples of local authorities working with selected employers to develop more sustainable transport policies (see Company Travel Plans, below). City authorities can, of course, set an example by implementing flexible working hours themselves. Telecommunications provide an alternative to travel for all, but studies have focused particularly
PROSPECTS Deliverable 4 Attitudinal and behavioural measures
__________________________________________________________________________________________
Page 13
on their use as an alternative to car travel. Teleworking, through which employees can work at home, has been more extensively studied. A variant involves “telecottages” which provide common remote facilities for use by tele-workers. Other developments include teleshopping and teleconferencing (Mokhtarian, 1991). The former is now growing in popularity and practicality through the internet as products can be bought in ‘virtual stores’ and delivered to the consumer’s home. However, such schemes are relatively new, and there is little indication yet as to whether they are replacing or complementing retail trips and to what extent personal trips to shops are simply being substituted for trips by delivery vans. There is a similar lack of information regarding the extent to which teleconferencing is replacing face-to-face meetings. Studies in the US and Holland suggest that teleworking can reduce car use, for carefully selected groups of employees, by up to a half, with a reduction also in non-work travel. Typical teleworkers work from home two days a week, and their cars are used much less on the days when they are at home (Hamer et al, 1991; Kitamura et al, 1991). Such reductions may have economic benefits by reducing peak period car use. This has been strongly argued by Dodgson et al (1997). It may also therefore, contribute to environmental objectives. Their impact is limited by employees' and employers' willingness to permit working from home, and its practicality. It is not yet clear how popular teleworking may become, although attitudinal surveys in the UK suggest that up to 40% of commuters would prefer to work at home (Dodgson et al, 1997). Teleworking is seen as particularly attractive for long distance commuters, who are also have the highest share of public transport use. This may lead to a reduction of public transport use instead of reducing car use, as found in two Norwegian studies referred to by Kolbenstvedt, Solheim and Amundsen (2000). Company Travel Plans can be required as a form of developer contribution. They have been used in this way in the US (as Travel Reduction Ordinances) and the Netherlands; developers are given permission to develop on the condition that they, or their tenants, produce a plan specifying ways in which they will reduce car use to a level below that which would normally be expected from such a development (Wachs, 1990). They can also be implemented voluntarily (DoE/DoT, 1995, Transport 2000, 1997). There are several examples of Company Travel Plans in action, for example the UK Highways Agency Toolkit has an example of its own travel plan (HA, 1998). A review of studies into their impacts has concluded that only around 4% of firms in the UK, and 15% in the Netherlands, have implemented such plans. As a result, while there may be clear reductions at individual workplaces, there appears to be less impact at a wider spatial scale (Rye, 1999; CTM, 1999). Table 3.1 provides a summary assessment against the key policy objectives. There is relatively little experience with any of the four measures. With awareness campaigns, there is sufficient to suggest small beneficial effects on all the objectives, except economic growth, through reductions in car use and more considerate use of the transport system generally. With flexible working hours and teleworking, it appears that a reduction in the provision, use and hence efficiency of the transport system can be achieved, but the impacts on other objectives are still uncertain, as they are for all objectives with company travel plans. Table 3.2 provides a summary assessment against the three barriers. Apart from awareness campaigns, they suffer from the need to involve employers in their introduction and operation. Awareness campaigns and company travel plans can also be expensive for the city authority to implement, while flexible working hours can reduce the financial cost of providing for the peak. All four measures are likely to attract public support.
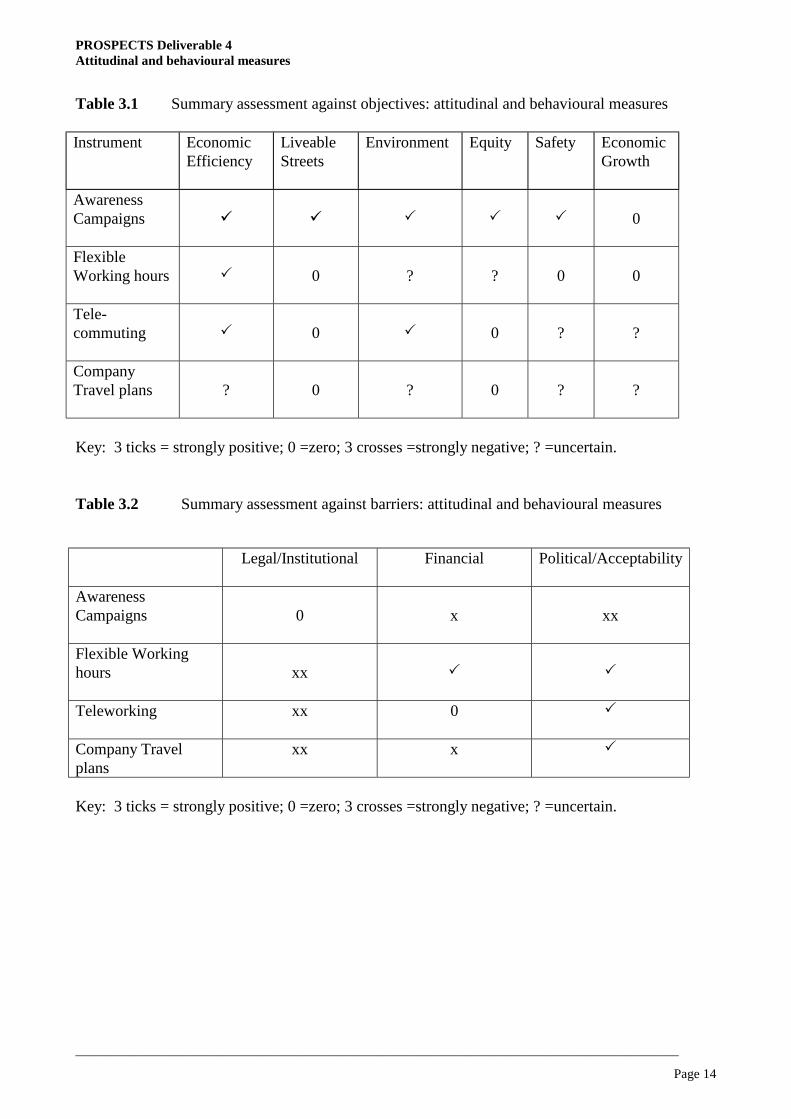
PROSPECTS Deliverable 4 Attitudinal and behavioural measures
__________________________________________________________________________________________
Page 14
Table 3.1 Summary assessment against objectives: attitudinal and behavioural measures Instrument Economic
Efficiency Liveable Streets
Environment Equity Safety Economic Growth
Awareness Campaigns
!
!
!
!
!
0
Flexible Working hours
!
0
?
?
0
0
Tele-commuting
!
0
!
0
?
?
Company Travel plans
?
0
?
0
?
?
Key: 3 ticks = strongly positive; 0 =zero; 3 crosses =strongly negative; ? =uncertain. Table 3.2 Summary assessment against barriers: attitudinal and behavioural measures
Legal/Institutional Financial Political/Acceptability
Awareness Campaigns
0
x
xx
Flexible Working hours
xx
!
!
Teleworking
xx 0 !
Company Travel plans
xx x !
Key: 3 ticks = strongly positive; 0 =zero; 3 crosses =strongly negative; ? =uncertain.
PROSPECTS Deliverable 4 Infrastructure measures
__________________________________________________________________________________________
Page 15
4 Infrastructure measures
4.1 Measures to influence car-use
New road construction has, until the recent past, been the traditional response to relieving congestion. However, its success in reducing congestion has come under increasing criticism. The road user time-saving benefits of road construction (typically accounting for around 80% of the predicted economic benefits), have been called into question in the UK by the 1994 SACTRA Report which indicates that they can be eroded by the induction of additional traffic under some circumstances (SACTRA, 1994, Goodwin, 1996). Indeed, it is entirely possible that the overall scheme benefits may be so small that they are outweighed by the capital costs. New roads can, by bypassing particularly sensitive urban areas, achieve environmental improvements there, as evidenced by a series of studies (Mackie and Davies, 1981). In this way, orbital roads can have a different impact from radial ones (Izquierdo, Monzon and Gutierrez, 1999). However, these environmental improvements are only likely to be sustained if steps are taken to redesign the roads which are relieved of traffic; this has been the main focus of a UK bypass demonstration project (DOT, 1995). There are particular direct environmental concerns associated with new roads, such as land-take, habitat destruction or loss of landscape quality. There are also indirect impacts. New roads focus particularly on the car, and are likely to encourage its use for faster and longer journeys. This in turn will make public transport, cycling and walking relatively less attractive, and increase fuel consumption and carbon dioxide emissions. Moreover, new roads may well, if not carefully designed, worsen accessibility across the alignment, particularly for pedestrians and cyclists. This may give rise to inequities. New roads should almost certainly contribute to a reduction in accidents, by transferring traffic to purpose built roads whose accident rates should be much lower than those of typical urban streets. To some extent this effect, too, will be eroded by the induction of new traffic. New roads are extremely expensive; costs of Euro 30m per kilometre are not uncommon in urban areas, and provision for environmental protection may result in figures substantially above this. The impact of new roads on economic regeneration is far from clear. The 1999 UK SACTRA report found that under certain circumstances transport investment may have economic impacts additional to those measured in a conventional cost/benefit analysis, but that these could be positive or negative (SACTRA 1999). It found no clear unambiguous link between road provision and local regeneration. This means that particularly close scrutiny should be paid to road schemes which are developed for economic regeneration objectives. New off-street parking is the other main way in which infrastructure can be provided for cars. There is even less evidence of their impact, but much will depend on the measures which complement such provision. Additional parking provision can contribute to user travel time savings by reducing the need to search for parking space. Although there is little hard evidence, it does appear that a significant part of town centre traffic is made up of cars searching for available parking space (CTM, 2001). However, lack of parking also acts as a control on car use, and expansion may simply encourage additional car use. New off street parking is probably therefore best combined with a reduction in on street parking. This should reduce searching traffic (since parking locations are clearer), improve the environment and increase safety. It may, however, aggravate accessibility problems, particularly for those who need to park close to their destination. More seriously, car crime is on the whole higher in poorly designed car parks, and there may be personal security concerns (Valleley, 1997). As with new roads, the cost of parking provision, which in multi-storey facilities may well exceed Euro 15k per space, time scale and land availability are likely to be
PROSPECTS Deliverable 4 Infrastructure measures
__________________________________________________________________________________________
Page 16
significant constraints. 4.2 Measures to influence public transport use
Conventional rail provision includes significant upgrades to existing infrastructure, as well as the provision of new lines and stations. Examples include new lines to airports in London, Madrid, Oslo and Stockholm; lines to new suburban development such as Arganda in Madrid; and new underground lines such as those in London, Paris and Madrid. Such schemes can reduce travel time for existing users and attract users from other modes. Several studies have shown that, while around 60% of new usage comes from bus, around 20% is transferred from car use, and 20% newly generated (Nash, 1992; Cristobal, Garcia and Gonzalez, 2001). The transfer from car will reduce congestion, provided that overall demand does not increase. It will also contribute positively to the environment, while the reopening of closed lines and stations, and even new infrastructure, if carefully designed, should have little negative environmental impact. Reduced car use will also contribute positively to safety. So, potentially, can the reduction in bus use. The Tyne and Wear Metro generated a 17% reduction in accidents in the city centre, largely through reductions in bus movements, but unfortunately this was lost once deregulated buses were able to compete with the Metro (Tyne and Wear PTE, 1985). The impact of rail infrastructure projects on wider environmental sustainability is uncertain. By reducing levels of car use they reduce energy consumption and hence CO2 emissions and reduce pressures for further land-take for road infrastructure; however, they may encourage longer distance travel and more decentralised patterns of land use. The short to medium term impacts from new urban schemes in Glasgow and Newcastle have been well documented (Gentleman et al, 1981, Tyne and Wear PTE, 1985). In Newcastle the Tyne and Wear Metro increased by 35% the population within 30 minutes of the city centre. Generally, however, these schemes have only had minor impacts on development or employment. That said, the studies did find that rail infrastructure presents a positive image and enhanced environment for an area, which can be important in marketing and attracting employment. Under some circumstances there also appear to be impacts on residential location choice (Nash and Mackett, 1991; Monzon and Gonzalez, 2001). Rail infrastructure projects are likely to have positive equity implications, since they offer a service which can be used by all. However, these benefits are limited to the corridors directly served, and any resulting reduction in bus services may disadvantage certain groups of travellers. Rail infrastructure projects vary substantially in cost. A single new station may be able to be constructed for under Euro 300k, and a line reopened for as little as Euro 4m per kilometre (exclusive of rolling stock). At the other end of the spectrum, the Jubilee Line Extension in London cost over Euro 250m per kilometre. Cost may therefore be a substantial barrier to implementation. Schemes of this kind will only be of relevance in urban areas where rail services already exist and are in use for local commuting. Even in such circumstances, new provision is probably only justified where journeys in excess of 5km can be made by rail (DoE/DoT, 1995). Below this, bus services, with their more frequent stops and better town centre penetration, will provide shorter access times. This in turn limits rail application to urban areas with a population of over 150,000. Light rail has become a widely proposed alternative to conventional rail provision since the 1980s, with 69 new systems worldwide being built since 1980 (Babalik, 2000). New schemes have been implemented in, for example, Calgary, Vancouver, Grenoble, Strasbourg, Baltimore, Dallas, Valencia, London and Manchester. In many ways it can be expected to have a similar impact to
PROSPECTS Deliverable 4 Infrastructure measures
__________________________________________________________________________________________
Page 17
conventional rail, although the fact that it can operate on street, have more frequent stops, and achieve better penetration of town centres may make it a more attractive alternative to car use and, potentially, to walking and cycling (Howard, 1989; Mackett and Edwards, 1998; Babalik, 2000; Mackett and Babalik, 2001). Its impacts on the economy, the environment, safety, accessibility, and equity are thus likely to be similar to those of conventional rail, with a few exceptions. Light rail may potentially have adverse impacts on travel times for other modes if capacity for other traffic has to be reduced. Light rail schemes have been targeted at producing a mode shift from car use. To some extent this has been successful (Oscar Faber, 1996), with 12-15% of Manchester Metrolink patronage coming from car users, but the majority of patronage has come from bus services and from the rail services which the scheme replaced. However, mode shift will only occur in the area immediately surrounding the light rail corridor and despite the limited mode shift achieved by Manchester Metrolink, it still only accounts for approximately 1% of all passenger km in Greater Manchester, whilst the private car accounts for some 91% (DETR, 2001a and b). As with conventional rail, there is a danger that suppressed car traffic will re-enter the network. The number of cars entering Manchester city centre in the morning peak was estimated to have reduced by only 1.8%, whilst in the off-peak the estimate was a reduction of 0.7% (Oscar Faber, 1996). Its impact on the urban economy has been the subject of considerable monitoring (e.g. Dundon-Smith and Law, 1994a, 1994b; Lawless, 1999; Crocker et al, undated; Babalik, 2000). Generally these studies have found few impacts, although there is a strong perception that urban vitality has been enhanced. Some clear impacts have been found from schemes implemented in Germany (Walmsley and Perrett, 1992). Light rapid transit can also have an adverse impact on noise and the visual environment, and this has been a significant barrier to implementation in some cases. Conversely, it is likely to provide greater accessibility than conventional rail, by having more frequent stops. Finance is again a major barrier. Light rail schemes are expensive, not least because of the requirements of street running, and typically exceed Euro 7m per km. Guided bus provides a lower cost alternative to light rail while having the advantages of dedicated rights of way. While totally separate rights of way can be provided, as in Adelaide, most current proposals envisage providing guideways solely where buses need to bypass congestion, as in Leeds. This can be achieved with minimal space requirements; the guideway need only be 3m wide, and is only needed in the direction in which congestion is experienced. Specially equipped buses can then operate normally on the rest of their routes, hence providing much more extensive suburban coverage than light rail (Read, Allport and Buchanan, 1990). The impact of guided bus is uncertain, as few schemes have been implemented. It should have less adverse impact on congestion than light rail, by requiring less space, but its positive impacts depend critically on its ability to attract patronage. If it is perceived by car users as a slightly improved bus it will be unlikely to contribute significantly to the reduction of congestion, environmental impact and accidents, and will perform much as bus priority measures do (see section 5.2). If it is seen as a higher quality service approaching that of rail, its impact will be much greater. The Adelaide scheme does appear to have been considered as equivalent to rail; it attracted 40% of its users from car drivers, and a further 20% from car passengers (Read et al, 1990). The Leeds scheme achieved a reduction both in bus travel time and in unreliability, and an increase of around 50% in patronage over three years. However, the evidence on the level of reduction in car use is unclear; few users reported switching from cars (Daugherty and Balcombe, 1999). The costs of provision are much lower than those of light rail. The Leeds scheme cost Euro 900k per km for the sections which needed treatment, and Euro 5k per equipped bus, which is then able to operate on other guideways

PROSPECTS Deliverable 4 Infrastructure measures
__________________________________________________________________________________________
Page 18
in the city. Park and ride refers to the provision of car parking (and perhaps other facilities for motorists) at bus stops and/or rail stations so as to provide for interchange between car and public transport. It extends the catchment of fixed track public transport into lower density areas, by enabling car drivers to drive to stations on the main line. It has also been used successfully in smaller cities such as Oxford and York in conjunction with dedicated bus services (Bixby, 1988; McPherson, 1992). The parking facility itself provides a low cost way of extending the benefits of public transport, by increasing the numbers able to use public transport, and hence reducing congestion, environmental intrusion and accidents in inner urban areas. It does not, however, directly offer significant improvements in accessibility and equity since, by definition, only car users can use the facility. Nevertheless, the presence of a park and ride facility is likely to make the particular bus or rail service it serves more viable, which is likely to involve benefits for the non-park and ride users of that service. Some doubt has been cast on the true benefits of park and ride; a survey has suggested that it may in practice generate longer journeys by rural residents, and hence increase car use (Pickett, 1995). There is also the danger that park and ride may take part of its demand from those who previously used public transport for their whole journey (Parkhurst, 1995). However, the beneficial impact on inner urban areas is not in dispute. A survey of eight towns with park and ride concluded that park-and-ride does reduce private car mileage, but is only effective when combined with other measures such as high city parking charges. However, its benefits are severely eroded by the availability of private parking, and park and ride itself will attract patronage from bus (WS Atkins, 1998). The net effect will depend on where the facility is located. Land availability and cost are likely to be the main practical barriers although several recent schemes have been financed as part of new retail developments, or as part of commuted payments in lieu of parking provision. Terminals and interchanges provide a means of extending the coverage of public transport services, by reducing the time taken to interchange between bus services or between bus and rail. They also provide a focus for city centre bus services, and reduce the congestion of on-street stops and terminals. It has been argued that their impacts on travel time and accessibility are likely to be significant if the public transport system is designed to use interchanges and high frequency feeder services, rather than the more traditional solution of longer, less frequent through services (Colin Buchanan and Partners, 1998). In other words, there is an argument that public transport networks should be designed around interchanges, rather than trying to avoid them. However, UK guidelines recommend a different emphasis; that the basic network structure should aim to meet the highest point to point demand without the need to interchange (CIT, 1998). Both arguments may be correct according to circumstances. However, time saving is not the only issue in interchange design and use. Information provision (preferably real-time) at interchanges is critical, for the entire route network being served, and should also offer information about alternative route options. Good design of the interchange is very important to maximise comfort and quality, and ensure security. For ease of travel, through ticketing, travelcards, and simple timetables should be used. The CIT also recommend that informal interchanges are identified and improved, making the best use of existing facilities. This relates to the importance of siting interchanges at appropriate nodes, and ideally, at key destinations (European Commission, 1999). It may well be that the greatest benefits in travel time, environment and safety arise through removal of on-street bus stops, and any encouragement to switch modes from car to public transport. There is no study known of the impacts of interchanges on economic regeneration. Costs will depend greatly on the opportunities for development, which may well be enhanced by the provision of a terminal.
PROSPECTS Deliverable 4 Infrastructure measures
__________________________________________________________________________________________
Page 19
Enhancement of bus and rail vehicles generally fall into two categories. Firstly, there are features to make the vehicles more accessible and user-friendly, in particular to people with impaired mobility. Secondly, adapted engine designs and propulsion mechanisms to accommodate the use of alternative fuels and electric traction have been pursued in order to reduce the environmental impacts, in particular on local air quality, relative to traditional, eg diesel fuelled, vehicles. A study of the use of more accessible buses on six routes in London and North Tyneside (York and Balcombe, 1998) found that the vehicles were easier to use for most categories of passenger, that significant proportions of ambulant disabled people used the vehicles, that boarding and alighting time was reduced for all passengers and that changes in patronage on the routes using these accessible vehicles (in comparison to a number of control routes) varied between -1% and 12%. Operating costs for accessible buses are a little (less than 5%) higher in comparison to traditional buses and, while the capital costs are currently approximately 10% higher than for traditional buses, the differential is decreasing over time. 4.3 Provision for cyclists and pedestrians
Cycle routes provide dedicated infrastructure for cyclists, and hence extend the range of cycle priorities (section 5.3). As well as making cycling safer, they have been designed to attract more people to cycle in preference to driving, hence achieving the benefits of reduced car use. In this, in the UK at least, they have so far proved unsuccessful (Harland and Gercans, 1993). It appears that cycle routes can achieve significant savings in cycling accidents, and potentially travel time benefits for existing cyclists, but will not attract more people to cycle in the absence of other measures. Tolley (1993) argues that a comprehensive network solution is required, as in several continental cities, rather than piecemeal measures. In Delft for example, the development of a network of 25 km of dedicated cycle routes, led to a 7% increase in cycle use and a 7% fall in car use. The costs of cycle provision will depend very much on the availability of suitable corridors and land availability. Pedestrian routes are increasingly seen as an important part of overall strategies to encourage walking. Frequently made walking journeys (such as to access public transport stops and stations, schools and local shops), and the routes used for these journeys, are identified and targeted for a range of improvements designed to enhance walking conditions. These improvements could include the redesign of road crossings to give pedestrians more priority and to avoid diverting them off their desired route, improvements to paving and street-lighting and clear sign-posting (either using traditional sign-posts, street markings or tactile surfaces - see tactile footways below). Good pedestrian routes will be linked in with other pedestrian routes, making up a pedestrian network connecting several key local destinations. Once in place, it may be useful to provide maps setting out the different routes. A specific application of this policy to the school journey, Safe routes to School, has been implemented in the UK with some success (Transport 2000, 1999). The ‘walking bus’, whereby children walk together with a degree of adult supervision along a specified route, has been a particular innovation in this context. A number of good reference and guidance documents exist (DETR, 2000; IHT, 2000; Hopkinson et al, 1989, WALCYNG, 1997) but there is little in the way of evidence on the impacts of pedestrian routes. While they will, on their own, clearly improve conditions for existing pedestrians, it is likely that they would need to be combined with other instruments to restrain car-use and improve public transport before there were any significant shifts from car-use to walking. Pedestrian areas provide a dramatic improvement in the environment for pedestrians, in increasing safety, and have proved very successful in enhancing retail vitality in many town and city centres. There is little evidence to support traders’ claims that pedestrian streets cause a loss in overall trade;

PROSPECTS Deliverable 4 Infrastructure measures
__________________________________________________________________________________________
Page 20
in fact, research shows that consumer spend actually increased in some areas (Hass-Klau, 1993). However, what changes may arise in the composition of shops is less well understood. However, they present some accessibility problems for car and bus users and, particularly, for goods deliveries and for disabled people. Exemptions for some of these, whether permanently or at certain times of day, inevitably reduce the environmental benefits somewhat. They also potentially cause disbenefits in the surrounding area, by loss of roadspace, by diversion of traffic and by attracting trade from competing areas. These potential adverse impacts can be reduced by careful design. Aesthetic design is of crucial importance in maintaining trade and will in turn inevitably add to the costs of the measure (IHT, 1989). The UK Guide to Good Practice gives examples of York and Birmingham where such schemes have been well implemented (DoE, DoT, 1995). 4.4 Provision for freight
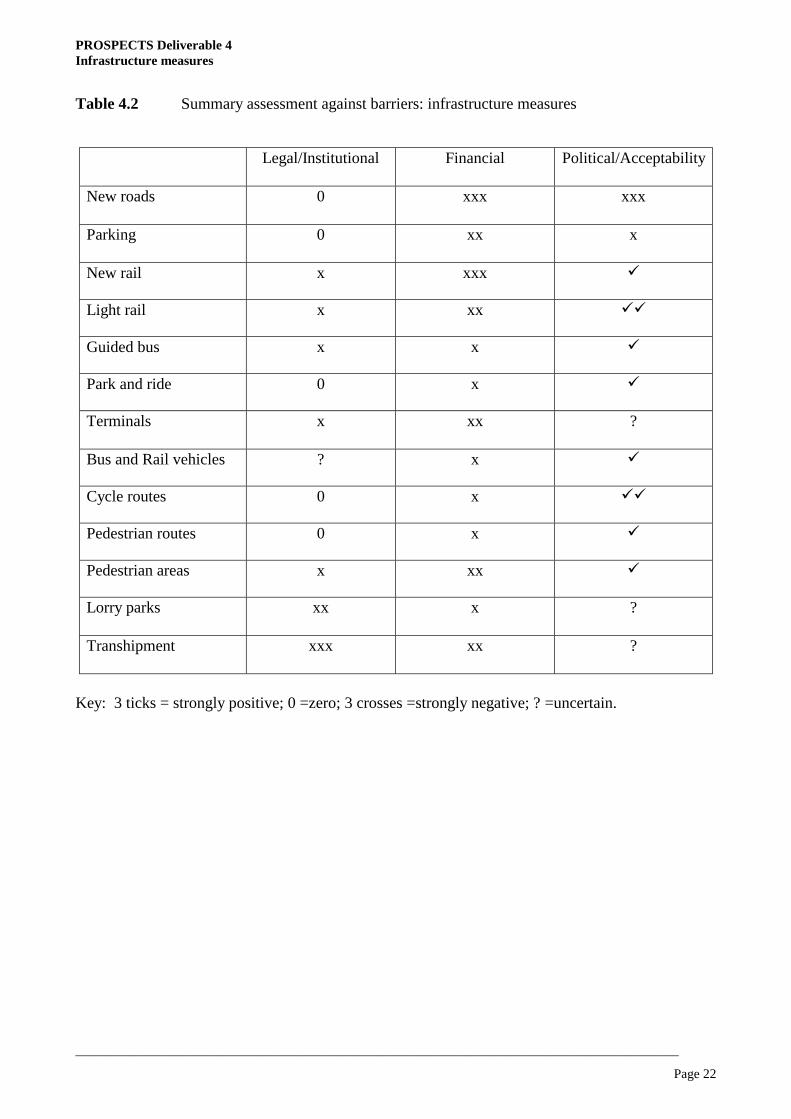
Several of the above policies have implications for freight. Roads and railways are particularly important for the efficient movement of freight, with road taking by far the greatest share. However, pedestrianisation schemes also have implications for freight access for certain times of day. Lorry parks provide a means of reducing the environmental impact of on-street overnight parking of lorries. In practice this has become a less serious problem except in close proximity to industrial areas. However, where it does arise, dedicated provision in a well- designed and secure parking area, together with on-street restrictions, may well be beneficial. Transhipment facilities aim to provide a means of transferring goods from the larger vehicles needed for efficient line haul to smaller, less environmentally intrusive vehicles for distribution in town centres. Some proposals have also envisaged trolleying of goods over short distances and, at the other extreme, underground freight distribution. Experience to date in the UK suggests that such facilities are unlikely to be attractive to freight operators, and hence to be cost effective, at least until much greater restrictions on existing practices can be justified (Collis, 1988). Table 4.1 provides a summary assessment against the key objectives. All the car and public transport measures can enhance efficiency and safety, although much depends on the extent to which car use increases to use the additional road capacity. Few will have significant impact on liveable streets or on the environment unless steps are taken to free streets from traffic, and the more substantial infrastructure projects can have adverse environmental impacts. The public transport measures should have beneficial equity impacts by providing improvements which all can use. The impacts on economic growth are uncertain, but may be more significant with public transport improvements. The measures to provide for cycling, walking and freight, on the other hand, are less likely to improve efficiency, and in some cases will worsen it by reducing road space, but they are likely to have benefits for the environment, safety, equity and particularly for liveable streets. Pedestrian areas appear to stimulate economic activity, but transhipment will almost certainly have the opposite effect. Table 4.2 provides a summary assessment against the barriers. Minor institutional barriers may arise with the public transport measures where private operators are involved; this will be a greater problem with freight measures. All infrastructure projects will involve capital expenditure and in

PROSPECTS Deliverable 4 Infrastructure measures
__________________________________________________________________________________________
Page 21
the case of new roads and rail lines in particular these can be a major barrier to implementation, as can the time taken to construct them. It is frequently the case that new roads and car parks are unpopular with politicians and the public, while improvements to public transport, cycling and walking attract support. However, the balance of support will depend on the local environmental impacts of the schemes. The degree of acceptability of freight improvements is much less clear. Table 4.1 Summary assessment against objectives: infrastructure measures
Instrument Economic
Efficiency Liveable Streets
Environment Equity Safety Economic Growth
New roads
!? !? !or x x ! ?
New parking
!?
?
?
0
?
?
New rail !! ? ? ! ! !
Light rail ! x ! or x ! ! !
Guided bus ! x ? ! ? 0
Park and ride ! ? ! 0 ? ?
Terminals ? ? ? 0 ? ?
Bus and Rail vehicles
?
!
!
!!
?
0
Cycle routes ? ! ! ! !! 0
Pedestrian routes
? ! ! ! ! 0
Pedestrian areas
0 or x
!!!
!!
!!
!!
!
Lorry parks 0 ! ! 0 ! 0
Transhipment xx ! ! 0 ! x
Key: 3 ticks = strongly positive; 0 =zero; 3 crosses =strongly negative; ? =uncertain.
PROSPECTS Deliverable 4 Infrastructure measures
__________________________________________________________________________________________
Page 22
Table 4.2 Summary assessment against barriers: infrastructure measures
Legal/Institutional Financial Political/Acceptability
New roads
0 xxx xxx
Parking 0 xx x
New rail x xxx !
Light rail x xx !!
Guided bus x x !
Park and ride 0 x !
Terminals x xx ?
Bus and Rail vehicles ? x !
Cycle routes 0 x !!
Pedestrian routes 0 x !
Pedestrian areas x xx !
Lorry parks xx x ?
Transhipment xxx xx ?
Key: 3 ticks = strongly positive; 0 =zero; 3 crosses =strongly negative; ? =uncertain.
PROSPECTS Deliverable 4 Management of the Infrastructure
__________________________________________________________________________________________
Page 23
5 Management of the Infrastructure
5.1 Measures to influence car use
Road maintenance may include general renewal of road surface (resurfacing), improvement of surface evenness or friction, and winter maintenance. Resurfacing and improvement of evenness seem to increase the number of accidents slightly, probably due to speed level increase (Elvik, Mysen and Vaa, 1997). Improvement of friction means better ability to drain water from the road surface. This has a greater effect on accident numbers if friction originally is low. High drainage surfaces also reduce noise. Impacts of various winter maintenance measures are reported in Elvik et al (1997), based on studies mostly from Sweden, Norway and Finland but also from the USA. Traffic safety is generally improved, although not necessarily in pedestrian areas and cycle lanes, where snow clearing might make the surface more slippery. Winter maintenance also contributes to mobility.
Conventional traffic management includes a wide range of largely urban measures, and the reader is referred to other texts, especially IHT (1997), for more detail. In general, measures such as one way streets, redesign of junctions, banned turns and controls on on-street parking have been shown to have beneficial impacts on travel time and on accidents, and typically to repay the costs of implementation within a matter of months (Duff, 1963). It is, however, necessary to bear in mind their possible adverse impacts. If such measures cause some traffic to reroute, journey lengths may increase and, in the extreme, this could more than offset the benefits of any increase in speed. The economic user-benefits are particularly sensitive to this process. Such re-routing may also introduce environmental intrusion into previously quiet streets. Accessibility may also be reduced; for example one way streets can pose problems for bus services and deliveries; parking restrictions affect local frontages; and, in the extreme, a gyratory system can make access to the "island" caused very unattractive (Pearce and Stannard, 1973). Finally, any measure which reduces the cost of car use may encourage usage to increase. There is as yet little evidence of this effect, which will be smaller in scale than that now attributed to new roads (SACTRA, 1994), but it could potentially offset many of the resulting benefits. A major practical consideration with all traffic management is that of enforcement. Unless measures are self-enforcing, the costs of enforcement action need to be included in any appraisal (Brown, Evans and Black, 1991). Urban traffic control (UTC) systems are a specialist form of traffic management which integrate and co-ordinate traffic signal control over a wide area (for more detail see IHT, 1997). They use the signal settings to optimise a given objective function such as minimising travel time or stops. UTC systems are either fixed time, using programs such as TRANSYT, or real time, such as SCOOT. The former costs less to implement, but settings are related to past traffic data, and become outdated as patterns change; the latter uses extensive detectors to measure current traffic patterns, and adjusts signal settings accordingly (Wood, 1993). With the expansion of European research in this area, other systems, such as the Italian SPOT system, which is also real time, but uses distributed computing to give greater flexibility, have been tested (Fox et al, 1995). Widespread trials have demonstrated the benefits of such systems. An up to date TRANSYT system can achieve savings in travel time of up to 15%, although this may be degraded by as much as 3% per annum as patterns change. A SCOOT system may achieve as much as a 20% saving, which should not then be degraded (Wood, 1993). Such efficiency gains also improve the environment, since there are fewer stops and queues, and safety, with typical reductions in accidents of the order of 10%. The savings need to be offset against the costs of around Euro 15k to Euro 25k
PROSPECTS Deliverable 4 Management of the Infrastructure
__________________________________________________________________________________________
Page 24
per junction for TRANSYT and Euro 30k to Euro 40k for SCOOT. However the potential for these benefits to be eroded by induced traffic, as mentioned above, needs to be borne in mind. Intelligent transport systems use new technology to improve the performance of the road network, They include developments in motorway access control (ramp metering), automatic incident detection (AID), image processing of CCTV, selective vehicle priority, queue management techniques and many other experimental measures. Many of these measures can be linked in with UTC, generally termed UTMC (Urban Traffic Management and Control (Fox et al, 1995, Routledge et al, 1996). It also includes the extension of UTC to provide priorities for buses, and their integration with information systems such as dynamic route guidance, which are covered in more detail in section 6.1. Although there is considerable research into these measures, most is concerned with operational issues, rather than assessment against the kinds of objectives considered here, and for many measures it is still too early to judge their effectiveness in widespread application. UTMC measures are aimed at network efficiency, and therefore should have economic benefits, possible safety benefits, and potentially accessibility benefits for pedestrians and cyclists. Some hypothetical cost-benefit analysis of measures has been undertaken by TRL, which found most measures returning a positive cost/benefit ratio, and in general the urban measures out-performing the inter-urban measures. The best performing measures were area traffic control, intersection control, emergency vehicle priority and speeding detection, all of which had benefit/cost ratios in excess of 4.0. (Perrett and Stevens, 1996). Accident remedial measures also cover a wide range of possibilities, and are much more fully documented elsewhere (IHT, 1990, 1997; Elvik, Mysen and Vaa 1997). Most blackspot treatment and mass action measures (such as skid-resistant surfacing) will have few impacts other than a reduction in accidents; their effects on other objectives can therefore be considered minimal. Area-wide measures are likely to have other impacts, and are considered below under the general heading of traffic calming. Traffic calming measures are designed to reduce the adverse environmental and safety impacts of car (and commercial vehicle) use. They have traditionally focused on residential streets, for which Buchanan, in “Traffic in Towns”, proposed an environmental capacity of 300 veh/h (Buchanan, 1963), and have involved two types of approach: segregation, in which extraneous traffic is removed; and integration, in which traffic is permitted, but encouraged to respect the environment. More recently they have also been extended to main roads, where integration is the only possible solution (Bicknell, 1993; Hass-Klau, 1992; Transport 2000, 1999). Segregation can be achieved by the use of one way streets, closures and banned turns, which create a ‘maze’ or ‘labyrinth’, which makes through movement difficult, and hence diverts it to surrounding streets. The extra traffic on surrounding streets can add to congestion and environmental intrusion there, and this trade-off needs to be carefully considered at the design stage. However, the maze treatment also reduces accessibility for those living in the area, and this loss of accessibility has often led to the rejection of such measures by the residents whom they are designed to benefit (McKee and Mattingley, 1978). An alternative approach, more often used in city centres, is the traffic cell, in which an area is divided into cells, between which traffic movement, except perhaps for buses and emergency vehicles, is physically prohibited. This can also cause some access problems, particularly where parking supply and demand in individual cells is not in balance, but experience suggests that these are outweighed by the environmental benefits (Elmberg, 1972).
PROSPECTS Deliverable 4 Management of the Infrastructure
__________________________________________________________________________________________
Page 25
Integration measures include low speed limits, speed humps, chicanes, pinch points, resurfacing and planting, all designed to encourage the driver to drive more slowly and cautiously. It is clear that these can achieve significant reductions in speed and accidents (TRL, 1995; Elvik et al, 1997; Barbosa et al, 2000; MOPT, 1998). However, some can cause local noise problems adjacent to the devices (Barbosa et al, 2000). By making routes through residential areas slower, they can also induce re-routing to major roads, and hence a reduction in environmental impact (Sumner and Baguley, 1979). Such benefits may, of course, be offset by increases in congestion and environmental impact on the diversion route. Despite this, re-routeing strategies were the key policy in the UK Urban Safety Project, which did report a reduction in accidents of 13% after implementing policies of this type (IHT, 1990). Such measures are likely to generate significant environmental, safety and equity benefits, without adversely affecting accessibility. A key issue is that of balancing effectiveness with cost of provision and visual quality (Hass-Klau, 1990; Transport 2000, 1999). Physical restrictions on car use have been proposed more generally as ways of reducing car use in urban areas. Possibilities include extensive pedestrian areas and traffic calming, and also the use of bus lanes (see section 5.2) to reduce capacity at junctions and give clear priority to buses. An early example was the Nottingham ‘zone and collar’ scheme, which aimed to use signal control to increase car travel time by 10 minutes, and reduce car travel by 10% (Vincent and Layfield, 1978). The scheme failed to produce these benefits however, primarily due to a lack of queuing space, and signal violation. A more successful programme in Zurich has involved gradually reallocating road space from general traffic to public transport, with the result that car use has not increased over a 15 year period (Fitzroy and Smith, 1993). There has recently been an extensive study of the effects of road capacity reduction on traffic levels using over 60 case studies (Goodwin et al, 1998a, 1998b). This concluded that if the road network is at capacity, capacity reduction measures can reduce car traffic by over 15%, and that this fall in traffic can offset some of the potential disbenefits such as increased travel time, and greater congestion. However, the behavioural response mechanism is complex, and little understood. Regulatory restrictions on car use have been used in several cities as an alternative way of reducing car use. Two main methods are in use: permits and number plate restrictions. In several Italian cities, permits are allocated to those who can justify needing their cars in the centre, and others are banned. A similar system is operated in Bologna, where 50,000 permits were issued restricting access to the centre. Although initial benefits were high (traffic levels were halved), these were eroded over time (Topp and Pharoah, 1994). In Granada, Spain, a similar system of permits, together with physical control points, is being used successfully to protect the historical centre of the city. Feasibility studies have suggested that permit systems could prove expensive in terms of the resources required to issue and check the validity of applications (GLC, 1979), and there will inevitably be an element of rough justice in the way that they are allocated. Number plate restrictions are in operation in Athens and Lagos, where an "odds and evens" system operates, in which cars with odd number plates can enter on alternate days, and those with even numbers on the other days. São Paulo has a similar scheme where two digits are not allowed on each day. Early indications are that vehicle km have been reduced by 7-10%, with a much higher reduction in congestion (Biezus and Rocha, 1999). Those without permits, or with an excluded registration plate may in some cases experience a serious reduction in accessibility. That apart, such systems should in practice be able to achieve any required reduction in car use. Experience with the Lagos system suggests that, while it is easier to operate, it is less effective, since drivers can respond by owning two cars, and some who would not otherwise have chosen to drive may elect to do so (Ogunisanya, 1984). Once again, careful testing would be needed before a scheme of this kind were
PROSPECTS Deliverable 4 Management of the Infrastructure
__________________________________________________________________________________________
Page 26
to be proposed. Parking controls potentially provide a more effective way of controlling car use. Controls can be by reducing the supply of spaces, restricting duration or opening hours, regulating use through permits or charging. The last of these is considered in section 7.1. City authorities are able to impose any of these controls on on-street space and in publicly operated car parks. Powers also exist in some countries to enable controls to be extended to privately operated public car parks, but often give rise to compensation costs. The main problems, however, are that controls cannot readily be imposed on private non-residential parking, which typically accounts for 40% to 80% of all town centre space, or on through traffic. As a result, even the harshest controls on public parking may simply result in an increase in traffic parking privately or driving through the area (May, 1975). Recent studies have identified that controlling private parking, within a complementary package of public on-street and off-street controls, can reduce traffic levels by as much as 25%, while conventional control of public parking can achieve at most a 10% reduction (Coombe et al, 1997). Where private non-residential space is small, or already fully used, and through traffic can be controlled, parking controls can be effective in reducing car use. This in turn should reduce congestion, environmental impact and accidents. However, performance will depend very much on the way in which controls are applied. Simply reducing space is likely to increase the amount of time spent searching for parking space, which may have adverse impacts on congestion. This was found in a study at Delft, which also reported a 20% reduction in car use (Gantvoort, 1984). Similar evidence is available in Topp (1993) and Kolbenstvedt et al (2000). Targeted restrictions on duration or on categories of parker could avoid congestion problems, but will introduce inequities similar to those from other regulatory restrictions. Inevitably accessibility will be reduced for some categories of parker with all types of parking control. Controls are generally inexpensive to implement, but may require continuing expenditure on enforcement if they are to be effective. Car sharing (or “car pooling”) involves encouraging drivers to share the use of their car. It thus offers a means of reducing car traffic while retaining many of the advantages of private car travel. Several experiments have aimed to encourage drivers to share their cars with others or to ‘car pool’ by taking it in turns to drive. Unfortunately, experience suggests that the numbers sharing voluntarily, even with incentives, are unlikely to exceed 5% of car users, and that their passengers are as likely to transfer from bus use as from other cars (Bonsall et al, 1981; Pozueta, 1999). Such schemes are thus likely to have a minimal impact in urban areas although, at the margin, they may offer some reduction in congestion. Such schemes are highly likely to be more successful when linked to other policies such as Company Travel Plans (see section 3.1).
Car clubs involve shared use of vehicles through membership of a car-sharing organisation (there is some confusion between this and car sharing in the terminology in the current literature). Such organisations have existed since the 1970s but were not a success until late 1980s. They are particularly popular in Germany, Switzerland and the Netherlands. Estimates of the market potential vary between 6% (Derkse, 2000) and 9% of urban households (Steininger et al, 1996). It is estimated that, in the Netherlands, 33000 people already “use a car-sharing organisation” (Derkse, 2000). Whilst evidence from the Netherlands finds that, on average, a shared car is driven 80% fewer km than a private car (Derkse, 2000), studies from Norway and Switzerland show that the effects on car kilometres in total are small – in the order of approximately 2% (Derkse, 2000) - since members initially drove less than the average. Even so, they may help to sustain shifts to public transport and to reinforce attitudinal and behavioural measures (section 3.1) (Berge, 1998; Kolbenstvedt, Solheim and Amundsen, 2000). Car sharing organisations contribute to counteract increases in car ownership, which might have an impact on land use. In Oslo, Bilkollektivet with
PROSPECTS Deliverable 4 Management of the Infrastructure
__________________________________________________________________________________________
Page 27
160 members owns 12 cars. Accessibility is not as good as if all members had their own car, but on the other hand this leads to a more conscious attitude towards car use.
5.2 Measures to influence public transport use
Bus priorities enable buses to bypass congested traffic and hence to experience reduced and more reliable journey times. The most common measures are with-flow bus lanes; others include bus-gates or bus only sections, exemption from banned turns, selective detection at signals, and UTC timings weighted to favour buses. Contra-flow bus lanes and bus access to pedestrian areas are designed specifically to reduce the adverse impact on buses of certain traffic management measures. Bus priorities are usually designed to keep loss of capacity to other traffic to a minimum. With with-flow bus lanes this is done by providing a setback at the stop line. Provided that this is done, efficiency is usually improved. Where speeds beforehand are below 15 km/h, travel time savings to buses can reach 10 minutes per km with few losses to other traffic (Daugherty et al, 1999). The segregation of traffic also appears to enhance safety. The main disadvantages are to frontage access, if parking is restricted, and to the environment, since queues will be longer, and traffic diversions may be induced (NATO, 1976), although it may be possible for traffic management systems to relocate queues to places where these disbenefits can be minimised. Unfortunately there is little evidence from the UK that bus travel time savings are sufficient to induce a switch from car to bus travel; thus the potential wider economic and environmental benefits are not achieved. It appears that more continuous application of bus lanes, as practised in Paris, may be more beneficial in this regard (Webster et al, 1980). This has been demonstrated also in the use of Red Routes in London (called Greenways in Edinburgh), in which bus lanes throughout bus routes are combined with intensive and well enforced, parking restrictions. Travel time savings on the pilot Red Route were dramatic, while the evidence on effects on frontage access and trade is mixed (Wood and Smith, 1992). In Edinburgh, bus travel times fell by 25% and patronage was increased significantly (DETR, 1999). The main practical limitations are the lack of sites with sufficient road width and queue storage, and the need for effective enforcement. High occupancy vehicle lanes extend the use of with-flow (and potentially contra-flow) bus lanes to other vehicles which make more effective use of scarce road space. These can include car sharers, taxis and commercial vehicles. Trials of this in an arterial corridor in Leeds since 1998 suggest traffic flows had fallen by around 14%. Average car occupancy in the AM peak has risen from 1.35 to 1.41 for the road as a whole, and 2.19 for the HOV lane (Leeds City Council, 1999). In Madrid, a 16 km length HOV lane has been in service since December 1994. The infrastructure produced an increase in occupation lewvel from 1.36 to 1.53. Experience elsewhere has suggested that HOV lanes can provide greater benefits than conventional bus lanes, provided that the delays to buses are not great. The bus operators in the Leeds scheme have reported time savings of 3-6 minutes along the 1.5km HOV lane section. Introduction of HOV lanes in the USA is reported to have increased the number of accidents. There might be several reasons for this: more vehicles moving from one lane to another, large differences in speed levels from one lane to another, and the mix of buses and light vehicles in the HOV lane (Elvik, Mysen and Vaa, 1997).
Public transport service levels can be modified to increase patronage, and hence to attract diversion from car use. For bus services the main options are to increase route density or to increase frequency on existing routes. The first of these reduces walking time, while the second affects waiting time. Since both of these have a greater impact on passengers than does a similar change in time on the bus, they can be expected to be more effective in increasing patronage (Webster et al, 1980). The most appropriate allocation of a given fleet of buses between denser and more frequent
PROSPECTS Deliverable 4 Management of the Infrastructure
__________________________________________________________________________________________
Page 28
routes will depend on local circumstances. Other bus service measures include the use of minibuses, which are more expensive per seat-km to operate, but can achieve greater penetration and may be more attractive (White, 1992); and demand-responsive bus services, such as dial-a-bus, although for these the operating costs have tended to exceed benefits. There is also a wide spectrum of paratransit measures involving unconventional bus and taxi services; their impacts are too varied to summarise here. With rail services, the only option available is usually to increase service frequency.
The short run elasticity of demand with respect to bus-km run is typically around +0.6, suggesting a 6% increase in patronage for a 10% increase in service level. Unfortunately cross-elasticities for car use are typically an order of magnitude lower, at around -0.08, suggesting less than a 1% reduction in car use for a similar service improvement (Webster et al, 1980). Cross-elasticities are typically somewhat higher for rail service improvements. These elasticities will apply, of course, only to the corridor in which the improvements are introduced. Thus service improvements have, as their primary impacts, improvements in accessibility and equity; they are unlikely on their own to achieve significant efficiency or environmental benefits except, to a limited extent, within the specific corridor. The main practical barriers to such measures are costs of operation and institutional issues if responsibility lies with private operators. In theory, at least, the cost of service increases can be met from increased fares revenue. Indeed, it has been suggested that an optimal operating strategy within given financial constraints may be to increase both service levels and fares (Webster et al, 1980). Bus service management measures can be designed to improve the reliability of bus services and reduce operating costs, using fleet management procedures, and enhance their quality of service using real-time information. These measures are likely to be particularly beneficial in reducing uncertainty in travel time, and the extra waiting time resulting from irregular services, which are major disincentives to travel (Finnamore and Jackson, 1978; Webster et al, 1980). Such measures should generate significant efficiency benefits, and can potentially contribute to reduced car use. While they are largely the preserve of private operators, there are some recent examples of collaboration between local authorities and operators to achieve such benefits (McDonald and Tarrant, 1994). Bus partnerships (known as Quality Bus Partnerships in the UK) are agreements between city authorities and bus operators to enhance bus services (TAS, 1997). The aim is to achieve faster services that will attract more passengers. The city authority role is to enhance the infrastructure and bus priority measures, while the bus operator should provide high quality buses, information, integrated services and integrated ticketing. In other words such partnerships are a means of obtaining synergy between a range of bus policy instruments. There is strong evidence that such partnerships can increase public transport patronage, and figures for trial corridors are between 5 % and 42% (TAS, 1997). Bus partnerships therefore offer accessibility and equity benefits, via improved public transport services and quality. Economic impacts may be more mixed, for the reasons discussed above regarding bus priorities. However, a recent report has cast some doubts over the benefits of the schemes (Audit Commission, 1999). 5.3 Provision for cyclists and pedestrians
Cycle lanes and other priorities, whereby a part of the highway is specifically allocated to cyclists and whereby cyclists receive priority at junctions, serve the same function as cycle routes (section 4.3). Experience with them is similar (Tolley, 1993). They can reduce accidents for cyclists (although the evidence is conflicting (Elvik et al, 1997)), but have to be fast as well as safe

PROSPECTS Deliverable 4 Management of the Infrastructure
__________________________________________________________________________________________
Page 29
if cyclists are to use them (Kolbenstvedt et al, 2000). They have yet, in the UK at least, to achieve a transfer to cycling from other modes (Harland and Gercans, 1993). Once again, an extensive network of provision is needed, and may be more effectively provided in smaller towns, where the Danish and Dutch experience suggests that cycling can provide for up to 30% of journeys to work (Transportradet, 1994; MVW, 1998). They are easier to implement than bus lanes, because they require less road space, but still pose problems of frontage access (IHT, 1997).
Cycle parking provision, to increase availability and security, may also be beneficial. However, its impacts have, with a few notable exceptions (CROW, 1997), rarely been studied. There is currently an increase in the provision of secure cycle parking facilities, such as cycle lockers and weather-protected secure racks. At some larger railway stations, guarded cycle parking is provided, sometimes with on-site cycle repair and rental facilities. For a number of years in Strasbourg and more recently in Grenoble, such facilities have been very popular, particularly during the week (Laferrere, 2000). Pedestrian crossing facilities are primarily a safety measure but may also reduce travel time for pedestrians. Indeed, it is not uncommon to find that total delay to pedestrians at city centre junctions exceeds that for vehicle users. In such circumstances, reallocation of signal time and linking of pedestrian phases, alone or as part of UTMC (section 4.1), may achieve accessibility benefits and reduce severance. There are relatively few other ways in which pedestrians' travel time can be improved, but other measures such as parking controls and footway widening may improve their environment and safety. Unfortunately there has been little or no analysis of the effects of such measures on pedestrian activity. 5.4 Provision for freight
Lorry routes and bans are primarily designed to reduce the environmental intrusion of heavy lorries, rather than to improve their operating conditions. Routes can be mandatory, but are more frequently advisory, and thus avoid serious reductions in freight access. Bans can be area-wide (for example in the cells between lorry routes) or limited to particular roads, or applied solely to short lengths of road forming a screenline or cordon. They can be complete, or limited to certain times and certain sizes of vehicle, or with exemptions for access. Such exemptions avoid problems of lost accessibility, but are difficult to enforce. CCTV is being increasingly used as an enforcement presence (IHT, 1997). Generally, restrictions on lorries are likely to result in reduced efficiency, and will require increased enforcement costs. Conversely they should, if well designed, improve the environment and safety. There have been relatively few studies of such measures, although that for the Windsor cordon demonstrated that any environmental benefits may be more than offset by increased operating costs, and by environmental losses on the diversion routes (Christie et al, 1978). Table 5.1 provides a summary assessment against the key policy objectives. Most measures contribute positively to efficiency; conventional traffic management and urban traffic control are particularly effective because they improve capacity at low cost. A few, such as speed controls, traffic calming, physical reduction of road space and lorry routeing may reduce efficiency, since they reallocate road space for other purposes. For many of the measures listed there is still considerable uncertainty as to their efficiency effects. Relatively few have a direct impact on liveable streets; those which do involve reallocation or reuse of road space. However, many of the others could facilitate the improvement of local streets. Some forms of conventional traffic management, such as one way streets, could have an adverse impact. The position with environmental impacts is similar, although in addition those measures which aim to reduce car use or encourage car users onto other modes could have beneficial area-wide impacts, provided that the
PROSPECTS Deliverable 4 Management of the Infrastructure
__________________________________________________________________________________________
Page 30
reduction in car use was significant. The impacts on safety follow a similar pattern but, in addition, a number of measures which are designed primarily with safety in mind will obviously have beneficial effects. The majority of measures are likely to improve equity, by improving public transport, cycling and walking either directly or indirectly. Few are likely to have any impact on economic growth, though those which involve parking restrictions, access restrictions and controls on frontage access may have a perceived or real adverse impact. One or two measures, such as car sharing, car clubs and cycle parking, appear to have little impact on the objectives, either because they have been assessed and found wanting or because there has been little assessment of their impacts. Table 5.2 provides a summary assessment against the barriers. For this set of measures, the principal institutional barrier is the need for enforcement, although for public transport management measures there is, instead, the potential barrier of having to negotiate with private operators, and for car sharing and car clubs, as well as regulatory restrictions, there is the need to set up administrative procedures. Most measures will require some financial outlay, but it will typically be much more modest than for infrastructure measures, and in some cases there may be a resulting revenue stream. Car clubs should achieve a saving in financial outlay for the participants. The level of public and political acceptability is largely determined by the gainers and losers. In general, those measures which restrict car use or reallocate road space are less likely to be popular than those which improve other modes or directly promote road safety.
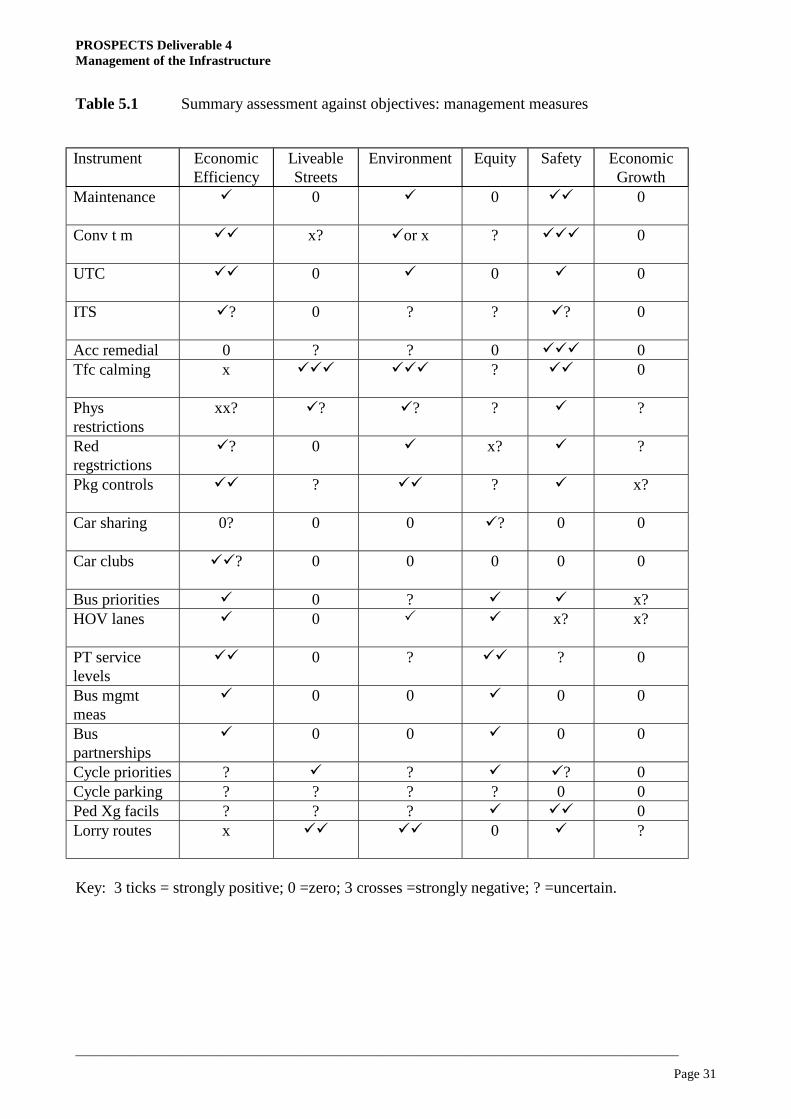
PROSPECTS Deliverable 4 Management of the Infrastructure
__________________________________________________________________________________________
Page 31
Table 5.1 Summary assessment against objectives: management measures
Instrument Economic
Efficiency Liveable Streets
Environment Equity Safety Economic Growth
Maintenance ! 0 ! 0 !! 0
Conv t m !! x? !or x ? !!! 0
UTC !! 0 ! 0 ! 0
ITS !? 0 ? ? !? 0
Acc remedial 0 ? ? 0 !!! 0 Tfc calming x !!! !!! ? !! 0
Phys restrictions
xx? !? !? ? ! ?
Red regstrictions
!? 0 ! x? ! ?
Pkg controls !! ? !! ? ! x?
Car sharing 0? 0 0 !? 0 0
Car clubs !!? 0 0 0 0 0
Bus priorities ! 0 ? ! ! x? HOV lanes ! 0 ! ! x? x?
PT service levels
!! 0 ? !! ? 0
Bus mgmt meas
! 0 0 ! 0 0
Bus partnerships
! 0 0 ! 0 0
Cycle priorities ? ! ? ! !? 0 Cycle parking ? ? ? ? 0 0 Ped Xg facils ? ? ? ! !! 0 Lorry routes x !! !! 0 ! ?
Key: 3 ticks = strongly positive; 0 =zero; 3 crosses =strongly negative; ? =uncertain.
PROSPECTS Deliverable 4 Management of the Infrastructure
__________________________________________________________________________________________
Page 32
Table 5.2 Summary assessment against barriers: management measures
Legal/Institutional Financial Political/Acceptability
Maintenance 0 xx 0
Conv t m x x ?
UTC 0 x 0
ITS 0 x 0
Acc remedial x x !!
Tfc calming x xx !?
Phys restrictions xx x xx?
Reg restrictions xx x xx?
Pkg controls xx x xx?
Car sharing x 0 !
Car clubs x ! !
Bus priorities x x x?
HOV lanes x x x?
PT service levels x x? 0
Bus mgmt meas x x 0
Bus partnerships x x 0
Cycle priorities x x !!
Cycle parking 0 x ?
Ped Xg facils 0 x !!
Lorry routes x x !!
Key: 3 ticks = strongly positive; 0 =zero; 3 crosses =strongly negative; ? =uncertain.

PROSPECTS Deliverable 4 Information provision
__________________________________________________________________________________________
Page 33
6 Information provision
6.1 Measures to influence car use
Conventional direction signing can provide benefits to car users, and other traffic, by reducing journey lengths and travel times; evidence suggests that around 6% of travel time may be accounted for by poor routeing, and that inadequate destination signing may as much as double the time spent searching for unfamiliar destinations (Jeffery, 1981). Conversely, direction signing can be used to divert traffic away from environmentally sensitive routes; however, familiar drivers are unlikely to respond to such measures. Variable message signs enable drivers to be diverted away from known, but unpredictable congestion. They are very location-specific in their application, and hence in their benefits (Brown and Mackenzie, 1994). Potential benefits are primarily in terms of travel times; drivers are unlikely to be willing to divert in significant numbers to avoid environmental and safety problems. Inter-urban VMS signs from the UK Highways Agency Midlands Driver Information System have been found to significantly influence route choice in response to accident warnings on the carriageway ahead, although magnitudes of diversion were not given (Carden, 1999). At the urban level, VMS in London was found to be less effective for immediate warnings than for advanced warnings, and that drivers actual behaviour (around 5% diversion response rate) did not always match their previously stated intentions, of up to a 54% diversion response (Thompson et al, 1998). VMS can be used for other purposes than avoiding congestion. They can be used for regulations that do not apply permanently (e.g. temporarily lower speed limits), as well as for warning of conditions that do not occur often but require immediate actions when they do (e.g. accidents, slippery roads, fog). Another advantage of VMS is the possibility of reducing the number of signs and amount of information, since their content can vary. Significant reductions in injury accidents are reported. In the case of congestion warning on highways, however, damage only accidents are found to occur more often (Elvik, Mysen and Vaa, 1997). An explanation for this is drivers responding by changing to a different lane and looking for diversion possibilities, causing more conflicts between vehicles.
Yet another application of VMS is response to driver behaviour in order to reduce dangerous behaviour. Information might be given on collective (e.g. average speed) or individual (e.g. speed of your vehicle) behaviour. A reduction in the number of violations of speed limits can be expected. Average speed levels decrease, according to several studies referred to by Elvik et al. (1997). A Canadian study found that the obligation to give way to pedestrians at pedestrian crossings was respected by more drivers after the introduction of VMS signs. The signs gave information on the percentage of drivers who respected the give way rule in the previous week at the particular crossing. There seems to be a tendency that drivers do not wish to behave differently from the majority of drivers.
Real-time driver information systems and route guidance are a type of Intelligent Transport System application. Information from equipped vehicles or traffic sensors is used to provide radio or in-vehicle display messages (such as Trafficmaster) of delays, or to indicate preferred routes to avoid congestion. Dynamic route guidance systems can provide recommended routes to all equipped vehicles, dependent both on their destinations and the current traffic conditions. Evidence suggests that familiar drivers are more likely to prefer information, and to choose their own routes, while unfamiliar drivers prefer guidance (Bonsall, 1992).
PROSPECTS Deliverable 4 Information provision
__________________________________________________________________________________________
Page 34
Several studies have predicted reductions in travel time of around 10% from such systems, when applied in urban areas, together with reductions in accidents (Jeffery and Russam, 1984). Unfortunately, the only documented field trial of dynamic route guidance, in Berlin, has suggested that the benefits may be much lower than this (May et al, 1991). Most benefits will, of course, accrue to equipped vehicles in the form of reduced travel times; benefits for other private traffic and for buses may well be very small, thus raising important equity considerations. Simulations indicate that a travel time minimising system generates the largest number of accidents, while an accident minimising system generates the highest travel times (Elvik et al., 1997). It has also been suggested that improved information may generate additional travel. There is, however, little evidence to support such claims. This is a very fast growing area, with new developments such as RDS-TMC and DAB (digital audio broadcasting) allowing detailed information about traffic conditions all over Europe. In development are detailed mapping devices and combined route guidance and travel information systems. Thus there is potential for systems of this sort to be linked in with wider ITS. This would allow network managers to control the information sent to cars, and potentially enhance network efficiency.
Parking guidance and information systems are a further application of ITS principles, designed to reduce the high level of traffic searching for parking space in urban centres. Detectors identify car parks which are full or almost full, and trigger signs indicating the route to the nearest available space (examples can be found in IHT, 1997 and DoE/DoT, 1995). Studies have demonstrated a significant reduction in time spent finding a parking space, but it has proved more difficult to estimate the resulting reduction in vehicle-km (Polak et al, 1990). As with VMS, the actual response levels to PGI are lower than expected, due to the complexity involved in the behavioural choice (Thompson and Bonsall, 1997). The efficiency and accessibility benefits from reduced searching may be associated with some reductions in environmental intrusion and accidents, but these will depend on the local circumstances. 6.2 Measures to influence public transport use
Conventional timetable and other service information, both at bus stops and railway stations and in booklet form, is the basic form of information to public transport users, but has become degraded in many areas since bus deregulation. Indeed, studies of deregulation have identified lack of service information, aggravated by more frequent timetable changes, as one of the main causes of increased loss of patronage (AMA, 1990) and surveys have indicated the potential for improved information to generate additional patronage (Pickett, 1982). This, in turn, could have accessibility and equity benefits and, potentially, help to reduce car use. One problem with private sector operation is the reluctance of any operator to contribute to information which includes competitors' routes. Real time passenger information is now being provided, not just at major terminals, but at individual stations and bus stops, and on trains and in buses. Such information, on delays and alternatives, may on occasion enable travellers to save time by taking alternative routes. Its main impact, however, is in reducing the uncertainty and stress associated with late running services. Studies on the London Underground have attempted to estimate the benefits of such information, and have indicated the potential for increasing patronage (Silcock and Forsyth, 1985). There is some indication that real-time information can increase bus patronage, and if this is the case it offers considerable accessibility and equity benefits. However, technology costs are high. Trip Planning Systems (IHT, 1997), based on either dedicated terminals (at public transport interchanges and stations), over the telephone, or via the Internet, are an attempt to assist the
PROSPECTS Deliverable 4 Information provision
__________________________________________________________________________________________
Page 35
traveller sort through the different travel options with some ‘expert’ advice. Again there appears to be no study of how effective these are in maintaining or increasing public transport patronage, nor about their reliability or use. Operation information systems use ITS-based fleet management facilities to identify locations of buses and to reschedule services to reduce the impact of unreliability. Such systems were studied initially in the 1970s (Finnamore and Jackson, 1978) and under the EU DRIVE programme (Keen, 1992). Examples have been tested in London and Southampton (IHT, 1997). 6.3 Provisions for cyclists and pedestrians
Static direction signs are virtually the only measure available under this heading, but can be used to enhance the use of cycle priority routes and to improve access within pedestrian areas for disabled pedestrians. Tactile footways are a further facility providing specifically for visually handicapped pedestrians. Public awareness campaigns (see section 3.1) can be used to encourage walking and cycling, and familiarise road users with appropriate signing. Tactile footways are a means of providing warning and, in some instances, orientation information to blind and partially-sighted pedestrians. There are a number of different designs of tactile paving which rely on different raised patterns to convey different messages (DETR, 2000). Tactile paving is most commonly used at road crossings, so as to identify where there is a dropped curb and/or a controlled pedestrian crossing point, but it is also used at bus stops and along the edges of railway and metro platforms. More recently it has been used to provide orientation across open pedestrianised areas. Two issues which appear to be important are the need for standardisation of different designs so that they provide a consistent message and the need to strike a balance between providing sufficient information to be helpful, without it being overwhelming and confusing. 6.4 Provision for freight
Static direction signs may be the main element in voluntary lorry routeing schemes (see section 5.4). Fleet management systems have been introduced widely for freight vehicles, enabling them to respond more rapidly to the changing demands of Just in Time delivery schedules, and reducing the number of empty return journeys. They can also extend to dynamic route guidance to avoid congestion. However, whilst a more efficient freight sector is likely to lead to some wider benefits to society in terms of fewer lorries adding to congestion at key times and places, most such systems are introduced by freight operators, and local authorities have little role in their implementation or operation. Table 6.1 provides a summary assessment against the key objectives. All information provision is likely to increase efficiency, by enabling individuals and operators to make journeys are lower cost. Only tactile footways are likely to contribute to liveable streets, and the impact on the environment more generally will only be positive if there is a significant reduction in car use as a result, which appears unlikely. Measures which help public transport users and pedestrians and cyclists are likely to have positive equity implications; route guidance systems may have an adverse impact if those without guidance suffer greater congestion. Safety benefits appear to be most likely to arise with variable message signs, but other guidance to road users may assist. With the possible exception of parking guidance and fleet management systems, there is likely to be little impact on economic activity.
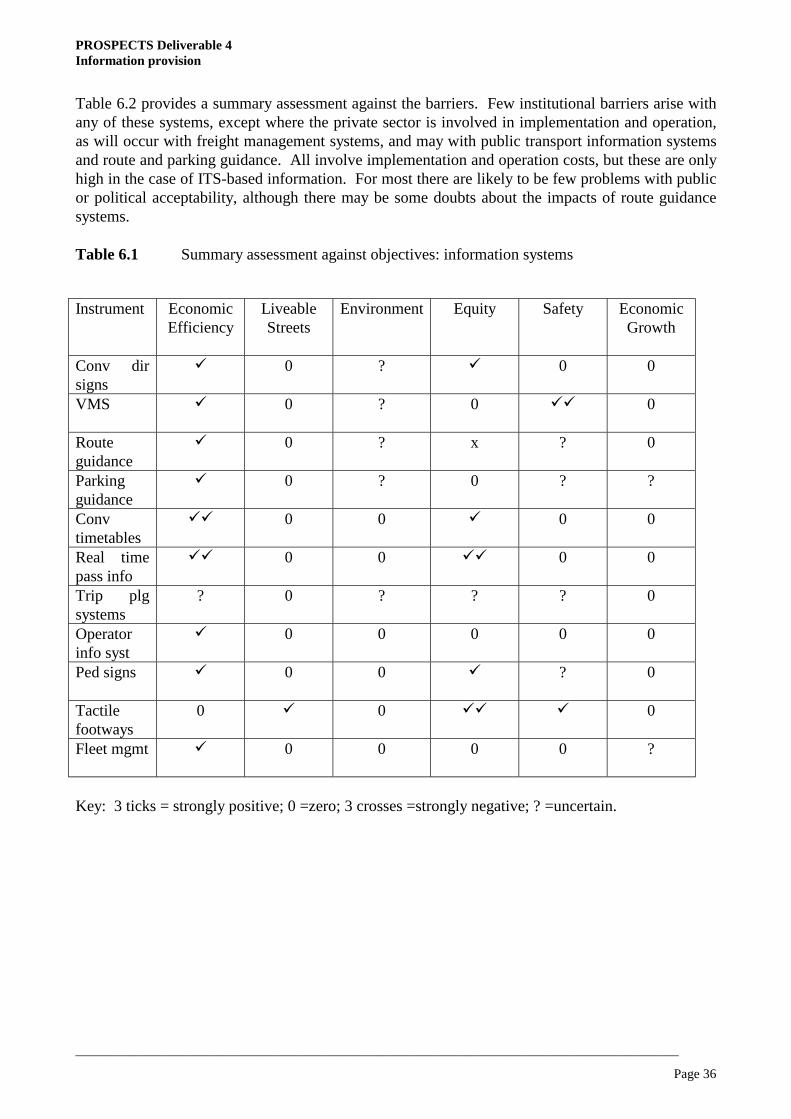
PROSPECTS Deliverable 4 Information provision
__________________________________________________________________________________________
Page 36
Table 6.2 provides a summary assessment against the barriers. Few institutional barriers arise with any of these systems, except where the private sector is involved in implementation and operation, as will occur with freight management systems, and may with public transport information systems and route and parking guidance. All involve implementation and operation costs, but these are only high in the case of ITS-based information. For most there are likely to be few problems with public or political acceptability, although there may be some doubts about the impacts of route guidance systems. Table 6.1 Summary assessment against objectives: information systems
Instrument Economic
Efficiency Liveable Streets
Environment Equity Safety Economic Growth
Conv dir signs
! 0 ? ! 0 0
VMS ! 0 ? 0 !! 0
Route guidance
! 0 ? x ? 0
Parking guidance
! 0 ? 0 ? ?
Conv timetables
!! 0 0 ! 0 0
Real time pass info
!! 0 0 !! 0 0
Trip plg systems
? 0 ? ? ? 0
Operator info syst
! 0 0 0 0 0
Ped signs ! 0 0 ! ? 0
Tactile footways
0 ! 0 !! ! 0
Fleet mgmt ! 0 0 0 0 ?
Key: 3 ticks = strongly positive; 0 =zero; 3 crosses =strongly negative; ? =uncertain.
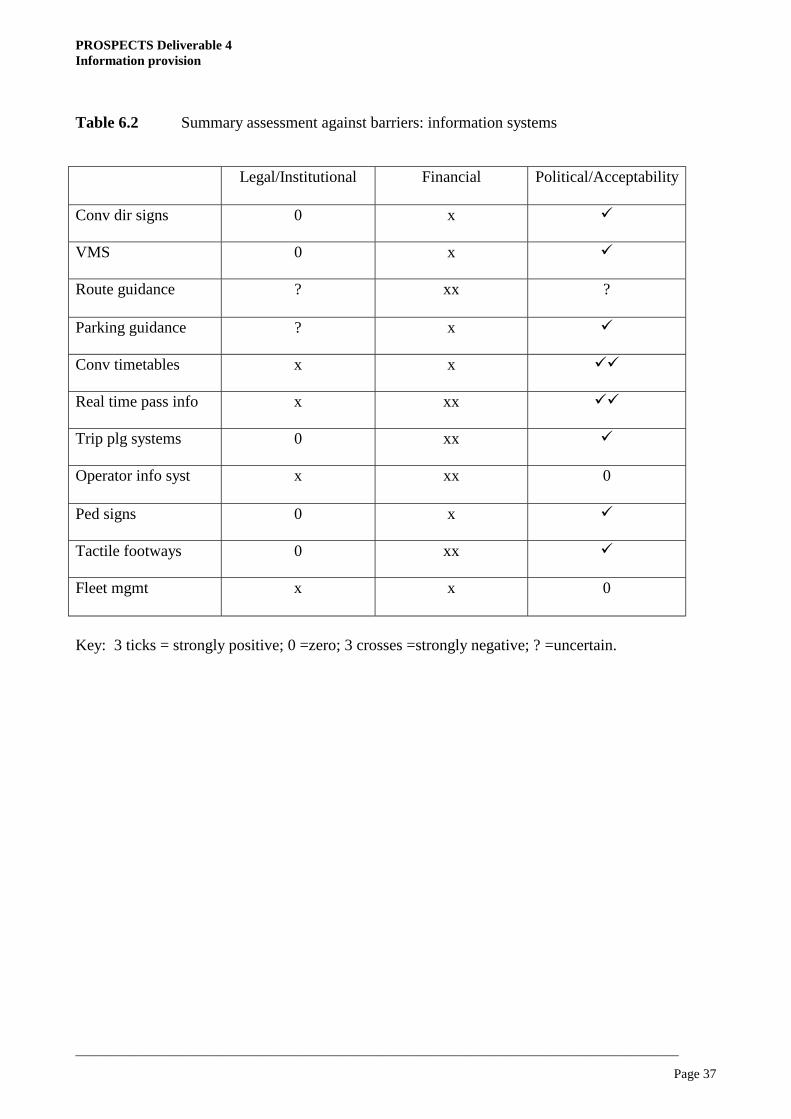
PROSPECTS Deliverable 4 Information provision
__________________________________________________________________________________________
Page 37
Table 6.2 Summary assessment against barriers: information systems
Legal/Institutional Financial Political/Acceptability
Conv dir signs 0 x !
VMS 0 x !
Route guidance ? xx ?
Parking guidance ? x !
Conv timetables x x !!
Real time pass info x xx !!
Trip plg systems 0 xx !
Operator info syst x xx 0
Ped signs 0 x !
Tactile footways 0 xx !
Fleet mgmt x x 0
Key: 3 ticks = strongly positive; 0 =zero; 3 crosses =strongly negative; ? =uncertain.
PROSPECTS Deliverable 4 Pricing
__________________________________________________________________________________________
Page 38
7 Pricing
7.1 Measures to influence car use
Parking charges provide one of the most widely used forms of parking control. Uniquely among parking control measures, they enable demand to be kept below the supply of parking space, thus reducing time spent searching (see section 5.1). The suggestion that meter prices should be pitched so that one space in seven is free was developed with this in mind. Charges which increase with duration can also influence the length of time for which people park, thus further reducing occupancy. However, it should be noted that a parking place used for short stay parking will generate more traffic than a long stay one. Elasticities with respect to parking charges vary depending upon the availability of alternatives, but figures in the range -0.2 to -0.4 have been quoted (Feeney, 1989). The wider impacts depend on the alternative used by the car driver; parking on the fringes of the controlled area, or in private parking spaces, will inevitably have less impact on the environment and travel time than switching to public transport. A recurring concern with the introduction, or increasing, of parking charges is that it will encourage drivers, and particularly those shopping, to go elsewhere, thus adversely affecting the urban economy. There is evidence that this can happen, although a review of aggregate studies found no significant relationship between parking restraint levels and urban economic vitality (Still and Simmonds, 2000). Parking charges will affect low income drivers more, and thus have equity implications. They may as a result have some minor effects on accessibility. They are a source of finance, although the potential for profits is usually small.
As with parking controls (section 5.1), parking charges can readily be applied to publicly controlled parking space. Legislation is available in some countries to permit the licensing of privately operated public car parks, but often requires that operators must be compensated for losses. Parking charges cannot usually be imposed at private car parks and, by definition, do not apply to through traffic. As noted in section 5.1, these represent major loopholes in the effectiveness of any form of parking control. It has also been argued that parking pricing policies are more effective when introduced as part of a package of measures, including a regional strategic approach to parking policy, and public transport improvement (Coombe et al, 1997). Parking advice from LPAC (1997) provides some useful information on these considerations in applying parking policy. Charges for ownership of private parking space, such as the recently introduced Workplace Parking Levy in the UK, enable city authorities to implement a levy on all private non-residential parking at the workplace (DETR, 1998). In the UK scheme, retail parking for consumers is excluded, and the levy is based on the number of vehicles parked, not the number of spaces. The objective of this instrument is to reduce car based commuting, and ease traffic congestion. The possible impacts on the economy are large, and will depend upon the level of charge, and how businesses respond when faced with a charge. These impacts have been examined in a recent interview study in Nottingham and Westminster (MVA, 1999). This concluded that around a quarter of firms would pass on their costs to customers, but that the effects on goods and services would be slight (well under 0.1% of business turnover). The effect on car travel was heavily influenced by the level of the tax, and alternative incentives offered (such as cash for spaces surrendered). However, displaced users still expressed a preference towards continued car use and public parking, which may erode some of the desired traffic benefits. Urban congestion charging (or road pricing) can take a number of different forms, although most involve charging to cross screenlines or cordons (DETR, 1998). Singapore was the first country to
PROSPECTS Deliverable 4 Pricing
__________________________________________________________________________________________
Page 39
implement an electronic road pricing (ERP) system using in-vehicle units and smart cards, replacing an earlier paper-based licence system (Soo, 1998). Toll rings have been introduced in three Norwegian cities, primarily to raise revenue for infrastructure investment (Larsen, 1995). Systems which charge continuously in a defined area, based on distance travelled, time taken, or (as tested in Cambridge) time spent in congestion, have also been proposed (May and Milne, 2000). However, research using a driving simulator has shown that the latter two can lead to increased risk taking (Bonsall and Palmer 1997). Empirical evidence of the impact of early urban road charging schemes comes from Singapore (Holland and Watson, 1982) and Norway (Larsen, 1995). A good deal of our understanding of the impacts of road pricing come from modelling studies, such as Richards et al (1996). Urban congestion charging can significantly reduce car use in the charged area, and hence reduce environmental impact and accidents. Area licensing in Singapore reduced traffic entering the centre by 44% (Holland and Watson, 1978), and electronic road pricing achieved a further 15% reduction (Menon, 2000). Studies in London suggest reductions of 15% to 25% within cordons, depending on the design (Richards et al, 1996). The Norwegian cordons generated much lower reductions, but this was not their aim (Larsen, 1995). Traffic will divert to boundary routes where they are available, and this can adversely affect their performance and potentially lead to new environmental problems; a desk study found that cordon charging was much less efficient than distance-based charging for this reason (May and Milne, 2000). Traffic will also switch to other times of day and other modes. Much of the transfer will be to bus, which will benefit from the reduced congestion. Careful design is needed to ensure that these alternatives do not themselves become congested, and for cordon schemes, the location of the controls is critical. Subject to this, congestion charging can achieve significant road user travel time, environmental and safety benefits. It will also generate substantial revenue, which can potentially be used to finance other elements of a transport strategy (May, Shepherd and Timms, 2000). There are three major concerns about urban congestion charging. The first is the potentially adverse impact on the economy of the charged area if charging encourages drivers to travel elsewhere, on which there is no empirical evidence. However, a number of desktop and attitudinal studies have concluded that there would only be minor negative economic impacts, although it is very much dependent upon the characteristics of the urban centre (e.g.. Flowerdew 1994, Richards et al, 1996, Still, 1996). Most studies have highlighted the need for complementary public transport improvements. The second concern is the equity implications. Bus users, pedestrians and cyclists will benefit; rail users will be little affected except, perhaps, by increased patronage; but car and commercial vehicle users, and particularly those on low incomes, will suffer. The third concern relates to the practicability of the technology, which is largely untested, and the enforcement procedures.
Vehicle ownership taxes are the most obvious direct charge on the private car. However, while there is evidence that they can affect car ownership (Fridstrom, 1999), they have no direct effect on car use. Indeed, by increasing the proportion of car use costs which are fixed, they could potentially have the opposite effect. They are, however, a major source of revenue which can potentially be used to finance transport investment. Such taxes are usually the responsibility of national government, and cannot generally be influenced directly by local authorities. Vehicle ownership taxes could also be an instrument to influence the mix of vehicles. The tax system can be designed to reduce the number of vehicles with high accident risks (Elvik, Mysen and Vaa, 1997) or high fuel consumption and emissions.

PROSPECTS Deliverable 4 Pricing
__________________________________________________________________________________________
Page 40
Fuel taxes, being a variable cost, have a more direct effect on car use. During the 1990s the UK government committed itself to a 6% p.a. real increase in the tax rate as a contribution to its sustainability objective, and the Royal Commission on Environmental Pollution has advocated more rapid increases than this (RCEP, 1994, 1997). Short run elasticities are generally under –0.3 (Goodwin, 1992), with long run figures slightly larger, but generally close to this. However, the studies suggested that most reductions would occur in evening and weekend leisure travel (Atkinson and Lewis 1975). The initial impact on congestion would thus be very small, as appears to be borne out by the response to the current real term rise in fuel duty. In the longer term, drivers are also more likely to switch to more fuel efficient vehicles. This would still contribute to fuel savings and hence to the environmental and economy objectives, but would have little effect on safety. Fuel taxes bear most heavily on low income drivers and rural residents, whose accessibility they may adversely affect. Fuel taxes are again a major source of revenue. (Glaister et al, 1998). 7.2 Measures to influence public transport use
Fare levels can be adjusted on all public transport services, and will have a direct effect on patronage and on car use. Evidence suggests a short term fares elasticity of around -0.3 for buses and slightly higher for rail (Goodwin, 1992). Long run public transport own cost elasticities are usually lower than the short run equivalents (as users gradually return to the service), unless the magnitude of change is such that other responses occur, for example in residential location or car ownership. Available cross-elasticities for car use have been found to be around +0.05 (Webster et al, 1980) although this figure may be in need of updating. Thus a 10% reduction in bus fares could increase patronage by around 3%, but would only reduce car use by 0.5%. However, unlike service level changes (section 5.2), fares changes apply throughout an urban area, and may thus have a greater absolute impact on car use. The Fares Fair campaign in London in the early 1980s, which reduced fares by 32%, was estimated to have reduced cars entering central London by 6% (GLC, 1983). Fares reductions can, therefore, contribute to efficiency and environmental objectives, as well as improving accessibility for public transport users and hence equity. There is also some evidence that they can reduce accidents (Allsop, 1993). Their major drawback is the cost. There is also some evidence that low fares may encourage longer distance travel, and hence land use patterns which are in the longer term less conducive to sustainability. Fare structures, such as flat fares, zonal fares, monthly passes and integrated multi-modal ticketing and fares systems, provide alternatives to conventional graduated and separated fares. There is some evidence that simplification of fares structures may do more than fares reductions to increase patronage (Gilbert and Jalilian, 1991). Since the Fares Fair campaign also involved a zonal fare structure and travelcards, it is difficult to isolate these two effects. Changes in structure may thus also contribute positively to efficiency, environmental and safety objectives, as well as improving accessibility by reducing the cost of marginal journeys. If appropriately designed, they may not impose a significant additional financial burden. However, many such structures rely on the ability to offer a common set of charges, and free interchange to all services in an area. Where the private sector is involved, this may be difficult (AMA, 1990). However, differentiated fares structures may produce financial benefits (Jansson, 2001). In Karlstad, Sweden, a time-differentiated structure was introduced, with peak fares increased and off-peak ones reduced. Elderly people and children paid 50 percent of a regular fare, but in the time differentiated system this discount did not apply during rush hours. The result was more passengers and increased revenues to operators. In some places in Norway minor fare discounts were introduced in the evening and in the middle of the day. There were no increases in fare levels

PROSPECTS Deliverable 4 Pricing
__________________________________________________________________________________________
Page 41
during other parts of the day. The effects on demand were small and operators lost revenues. (Kolbenstvedt, Solheim and Amundsen, 2000.)
Concessionary fares provide lower fares or free travel to identifiable categories of passenger with special needs. These may include schoolchildren, students, elderly people and people with disabilities. in some countries, for example, statutory school travel must be funded by local authorities, the others are currently optional. Their main objective is equity-related, in enabling people who would otherwise find public transport too expensive, or who cannot use cars, to travel. They probably have no significant efficiency or environmental benefits, but they do improve accessibility for the target population (Goodwin, 1988). They do, however, impose a substantial financial burden on the city authorities which support them. 7.3 Provision for Cyclists and Pedestrians
Pricing is rarely an issue for cyclists or pedestrians. However, some charges are made for secure cycle parking, especially if other amenities such as showers are available. 7.4 Provision for Freight
The fiscal measures described in section 7.1 are relevant for freight as well (Fowkes et al, 1992). Parking charges typically vary with vehicle type, and some congestion charging proposals envisage doing this. Table 7.1 provides a summary assessment against the six key objectives. Charges for car use should improve efficiency significantly by reducing use, although public parking charges alone will be less effective. Carefully designed fares policies should also help to attract car users and hence reduce congestion. These should lead to improvements in the environment, and possibly safety, provided that parking and traffic are not increased in other sensitive areas. In the absence of complementary controls on use of road space, improvements to liveable streets cannot be expected. Fuel taxes should have a further significant environmental benefit by encouraging fuel efficiency. Equity implications are complex. Lower income users will be adversely affected by increased costs and vice versa. However, congestion charging and, to a lesser extent, parking charges, will also improve conditions for all users of other road-based modes. All charges on car use in urban areas can be expected to have minor adverse effects on the urban economy, although this will be offset by the improvements in public transport and the environment. Table 7.2 provides a summary assessment against the barriers. Parking charges and, potentially, fares changes, have to be negotiated with private operators, and this may make them harder to implement. Private parking charges and congestion charging frequently require new legislation, and also impose significant administrative and enforcement requirements. All charges on car (and commercial vehicle) use should provide significant sources of revenue. The effects of fare levels will, of course, depend on direction, but most strategies advocate reductions, which will impose a financial burden. Fare structures appear able to offset this effect, but concessionary charges will inevitably add to costs. With the possible exception of private parking charges and vehicle taxes, all charges on car use are unpopular, and this can lead to political reluctance to implement them. Conversely, fares changes are usually popular, unless they involve overall increases.
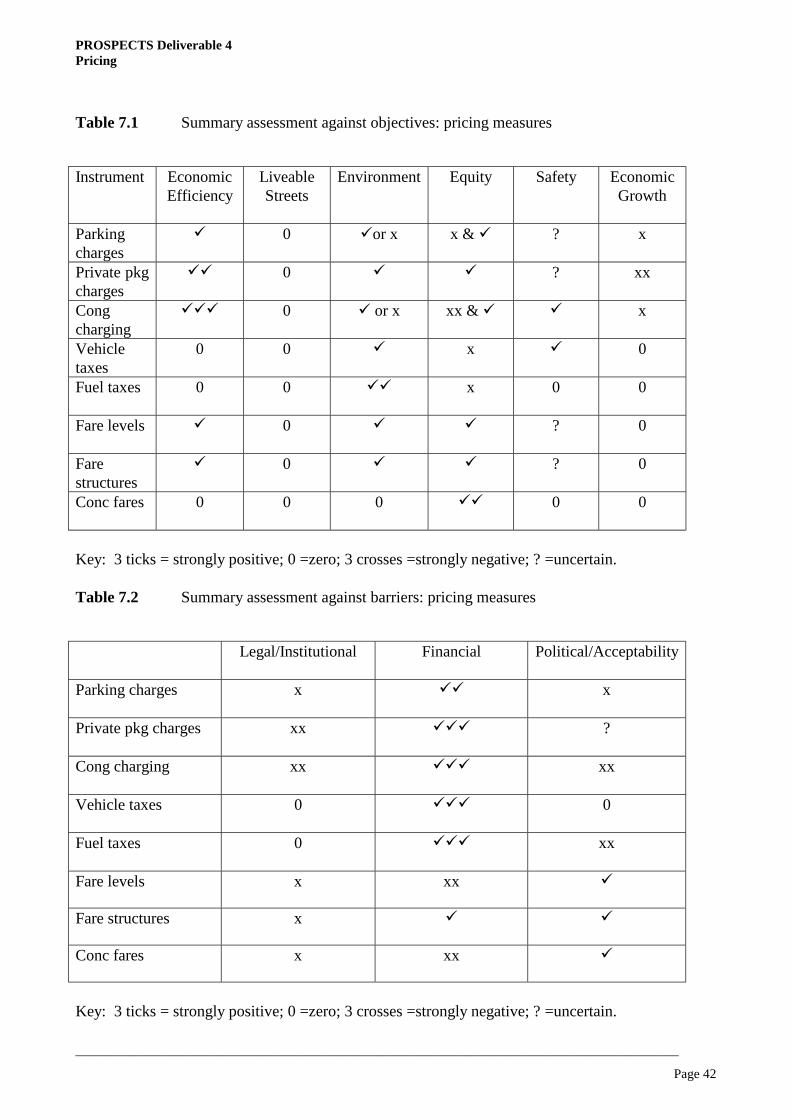
PROSPECTS Deliverable 4 Pricing
__________________________________________________________________________________________
Page 42
Table 7.1 Summary assessment against objectives: pricing measures
Instrument Economic
Efficiency Liveable Streets
Environment Equity Safety Economic Growth
Parking charges
! 0 !or x x & ! ? x
Private pkg charges
!! 0 ! ! ? xx
Cong charging
!!! 0 ! or x xx & ! ! x
Vehicle taxes
0 0 ! x ! 0
Fuel taxes 0 0 !! x 0 0
Fare levels ! 0 ! ! ? 0
Fare structures
! 0 ! ! ? 0
Conc fares 0 0 0 !! 0 0
Key: 3 ticks = strongly positive; 0 =zero; 3 crosses =strongly negative; ? =uncertain. Table 7.2 Summary assessment against barriers: pricing measures
Legal/Institutional Financial Political/Acceptability
Parking charges x !! x
Private pkg charges xx !!! ?
Cong charging xx !!! xx
Vehicle taxes 0 !!! 0
Fuel taxes 0 !!! xx
Fare levels x xx !
Fare structures x ! !
Conc fares x xx !
Key: 3 ticks = strongly positive; 0 =zero; 3 crosses =strongly negative; ? =uncertain.
PROSPECTS Deliverable 4 Policy Integration
__________________________________________________________________________________________
Page 43
8 Policy Integration
8.1 Need for Integration
It will be clear from the previous sections that no one measure on its own is likely to provide a solution to transport problems. Most have at least one positive contribution to make, in reducing travel time, environmental impact or accidents, but also have adverse impacts on, say, accessibility or equity. Some, such as traffic calming, can achieve benefits in one area at the expense of deterioration elsewhere. Some, such as bus priorities, would be more effective if they could influence mode choice; without such an impact they only benefit the users of the affected mode. For all of these reasons, a package of measures is likely to be more effective than selecting any one measure on its own. A set of measures is likely to tackle more problems; one measure can offset the disadvantages of another or avoid the transfer of problems to another area; a second measure can reinforce the impact of the first, for example, inducing a change of mode and generating greater benefits. In these ways, synergy can be achieved between measures; that is, the overall benefits are greater than the sum of the parts. The identification of measures which might achieve such synergy is at the core of successful transport planning. It was noted in Deliverable 1 that all of our Core Cities accepted that they could not tackle their transport problems by using one or two of these measures alone, and that they needed to use them in combination. The combinations which they used, and the reasons for them, however, differed considerably from one city to another. It is important to stress that little clear guidance has yet emerged on the principles for best practice in the integration of policy instruments. This will be a major focus of subsequent work in the project. In the meantime this section simply updates earlier analysis (May and Still, 2000). 8.2 Potential Benefits from Integration
Integration can potentially achieve benefits in several ways. The first involves measures which complement one another in their impact on users. Obvious examples are the provision of park and ride to increase rail or bus patronage; the use of traffic calming to reinforce the benefits of building a bypass; the provision of public transport, or a fares reduction, to intensify the impact of traffic restraint; and the encouragement of new developments in conjunction with rail investment.
The second involves measures which make other elements of the strategy financially feasible. Parking charges, a fares increase or road pricing revenue may all be seen as ways of providing finance for new infrastructure. The third concerns public acceptability, and the need to package measures which are less palatable on their own with ones which demonstrate a clear benefit to those affected. Once again an example is to be found in road pricing, which attitudinal research demonstrates is likely to be much more acceptable if the revenue is used to invest in public transport.
PROSPECTS Deliverable 4 Policy Integration
__________________________________________________________________________________________
Page 44
8.3 Barriers to Integration
There are a number of barriers to policy integration which may be identified. Deliverable 1 highlighted that different levels of government are responsible for different policy areas and that even within a city authority, different policy areas may be the responsibility of different departments of the authority. Specifically, it found that no authority had exclusive responsibility for all relevant transport and land-use policy areas and that only 35% of cities managed their own transport and land-use responsibilities within one department. In addition, it was highlighted that city authorities often need to balance the interests of a number of different sectors, including other levels of government and a range of interest and stakeholder groups. It is likely to be difficult or impossible to implement a package of policy instruments where one influencial group is particularly opposed to a particular element of that package. 8.4 Initial Guidance on Policy Integration
The instruments identified by the cities in Deliverable 1 appear to complement one another in two ways. Firstly, measures often tend to be combined by mode, eg bus priority with bus frequency and with real-time information, so that several mode-specific enhancements build upon one another. Secondly, measures are combined such that one acts as a ‘carrot’ and the other a ‘stick’, eg combining parking charges with public transport. Table 8.1 shows in matrix form, for a selection of those measures described in previous sections, those which are particularly likely to complement one another in one of these ways. This table is intended to be used as a broad design guide only, not, as a definitive assessment of instrument capability. There are important messages here, not just for the development of an integrated strategy, but for the sequence in which measures are to be implemented. Clearly those which need to be implemented to facilitate others are required first. It will also be essential at least to be committed to those measures which generate income before investing in those measures which depend on that revenue for finance. Similar considerations arise with measures which influence public acceptability: commitments are needed to publicly attractive measures before embarking on those which on their own are less attractive. Here, however, there is the continuing risk that the less attractive measures will still not be implemented, for fear of public criticism. It is preferable if both positive and negative measures are implemented together.
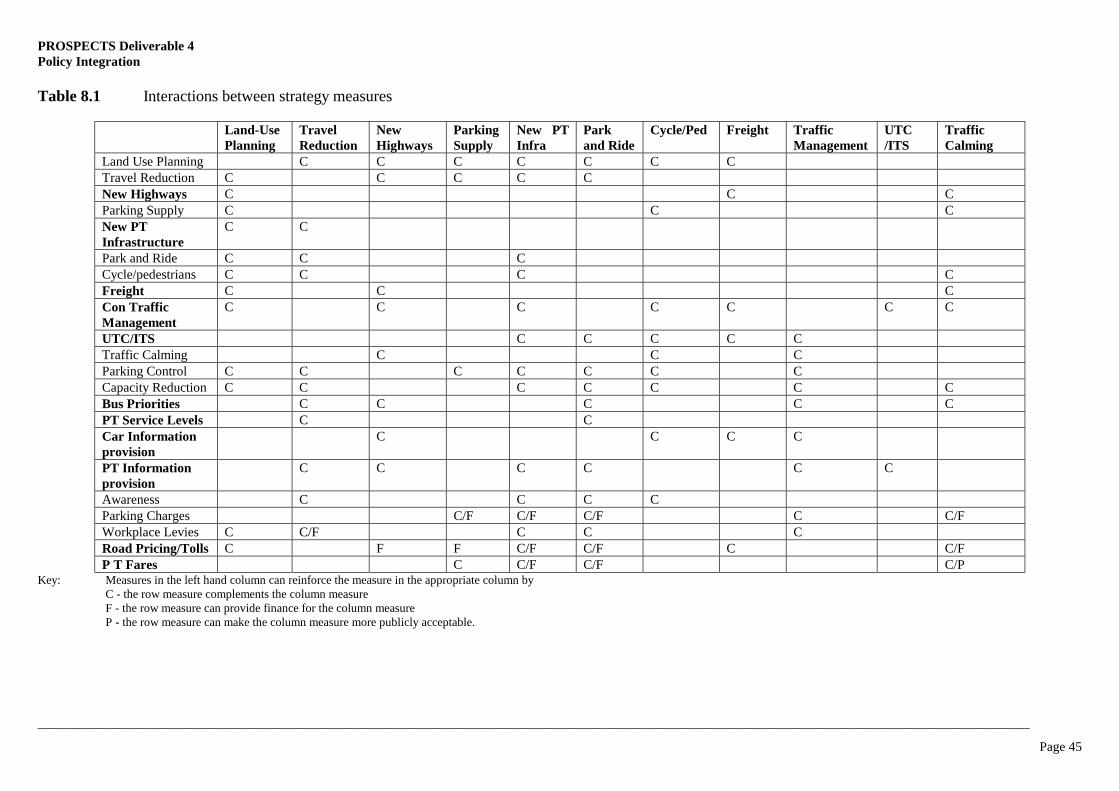
PROSPECTS Deliverable 4 Policy Integration
____________________________________________________________________________________________________________________________________________________
Page 45
Table 8.1 Interactions between strategy measures
Land-Use Planning
Travel Reduction
New Highways
Parking Supply
New PT Infra
Park and Ride
Cycle/Ped Freight Traffic Management
UTC /ITS
Traffic Calming
Land Use Planning C C C C C C C Travel Reduction C C C C C New Highways C C C Parking Supply C C C New PT Infrastructure
C C
Park and Ride C C C Cycle/pedestrians C C C C Freight C C C Con Traffic Management
C C C C C C C
UTC/ITS C C C C C Traffic Calming C C C Parking Control C C C C C C C Capacity Reduction C C C C C C C Bus Priorities C C C C C PT Service Levels C C Car Information provision
C C C C
PT Information provision
C C C C C C
Awareness C C C C Parking Charges C/F C/F C/F C C/F Workplace Levies C C/F C C C Road Pricing/Tolls C F F C/F C/F C C/F P T Fares C C/F C/F C/P
Key: Measures in the left hand column can reinforce the measure in the appropriate column by C - the row measure complements the column measure F - the row measure can provide finance for the column measure P - the row measure can make the column measure more publicly acceptable.
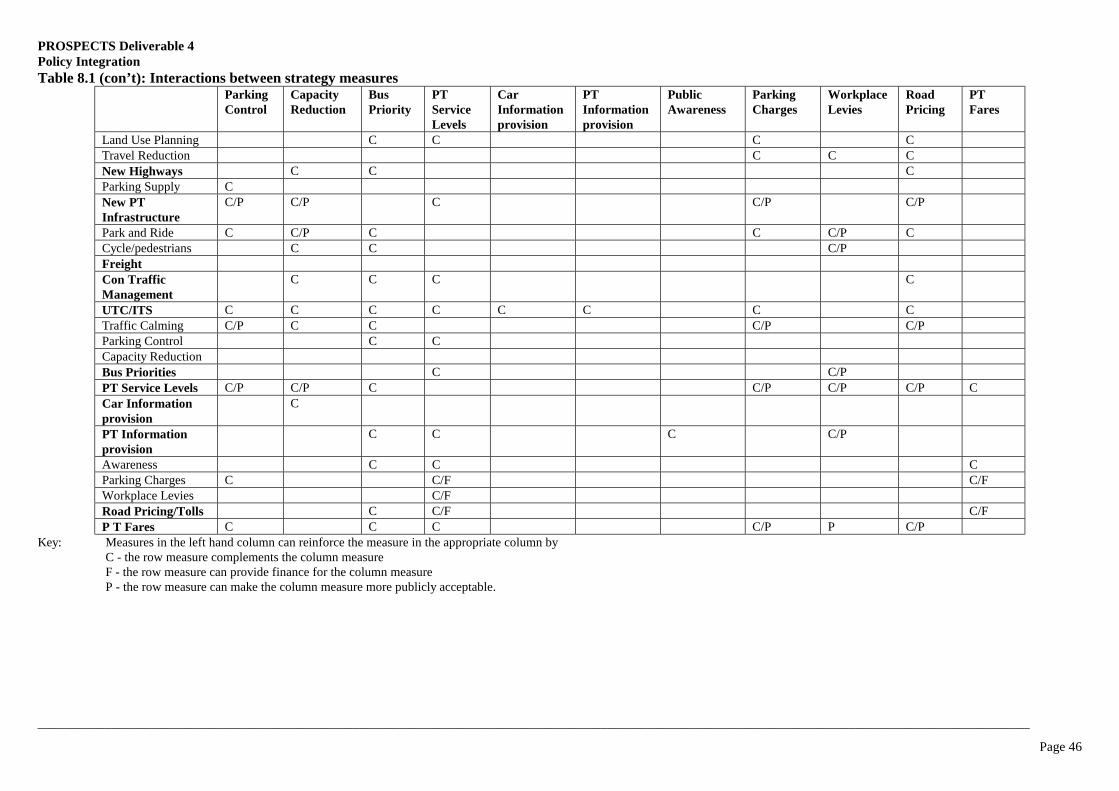
PROSPECTS Deliverable 4 Policy Integration
____________________________________________________________________________________________________________________________________________________
Page 46
Table 8.1 (con’t): Interactions between strategy measures Parking
Control Capacity Reduction
Bus Priority
PT Service Levels
Car Information provision
PT Information provision
Public Awareness
Parking Charges
Workplace Levies
Road Pricing
PT Fares
Land Use Planning C C C C Travel Reduction C C C New Highways C C C Parking Supply C New PT Infrastructure
C/P C/P C C/P C/P
Park and Ride C C/P C C C/P C Cycle/pedestrians C C C/P Freight Con Traffic Management
C C C C
UTC/ITS C C C C C C C C Traffic Calming C/P C C C/P C/P Parking Control C C Capacity Reduction Bus Priorities C C/P PT Service Levels C/P C/P C C/P C/P C/P C Car Information provision
C
PT Information provision
C C C C/P
Awareness C C C Parking Charges C C/F C/F Workplace Levies C/F Road Pricing/Tolls C C/F C/F P T Fares C C C C/P P C/P
Key: Measures in the left hand column can reinforce the measure in the appropriate column by C - the row measure complements the column measure F - the row measure can provide finance for the column measure P - the row measure can make the column measure more publicly acceptable.
PROSPECTS Deliverable 4 References
______________________________________________________________________________________________
Page 47
References
Atkinson, D and Lewis, D (1975). An econometric model of the influence of petrol price on traffic levels in Greater London. Proc. Third PTRC Summer Annual Meeting. London. PTRC. Allsop, RE (1993). London fares and road casualties. Traffic Engineering and Control 34(12). AMA (Association of Metropolitan Authorities) (1990). Bus deregulation: the metropolitan experience. London, AMA. Atkins, WS (1998) The travel effects of park and ride: Final report to DETR. Epsom, WS Atkins. Audit Commission (1999) All aboard; A review of local transport and travel in urban areas outside London. London, Audit Commission. Babalik, E (2000) Urban Rail Systems: A Planning Framework to Increase Their Success, Thesis submitted to the University of London for the Degree of PhD, Centre for Transport Studies, University College London. Bakker, D et al (1997) Office suites suit railways. Proc. 25th European Transport Forum. Seminar E, London, PTRC. Barbosa, HM, Tight, MR and May, AD (2000) A model of speed profiles for traffic calmed roads. Transportation Research 24(A). Berge, G (1998) Bilkollektivet i Oslo. En studie an en pionergruppe. TØI note 1095/1998. Oslo, Institute of Transport Economics. Biezus, L and Rocha, AJO (1998) Does congestion management improve public transit? Sao Paulo, Logos Engenharia. Bicknell, D (1993). Traffic calming. Municipal Engineer 98(1). Bixby, RW (1988). Park and ride schemes. Highways and Transportation 35(4). Bonsall, PW (1992). The influence of route guidance advice on route choice in urban networks. Transportation 19(1). Bonsall, PW and Palmer, I (1997) Do time based road-user charges induce risk taking? – results from a driving simulator, Traffic Engineering and Control 38 (4). Bonsall, PW, Spencer, AH and Tang, W (1981). ITS YORKSHARE: car sharing schemes in West Yorkshire. Traffic Engineering and Control 22(1). Brewer, AM (1998) Work design, flexible work arrangements and travel behaviour: policy implications. Transport Policy 5(2) Brog, W, Erl, E, Funke, S and James, B. (1999) Behavioural change sustainability from individualised marketing. 23rd ATRF Conference, Perth.
PROSPECTS Deliverable 4 References
______________________________________________________________________________________________
Page 48
Brown, M, Evans, R, and Black, I (1991). The evaluation of traffic management and parking schemes: whither now? Traffic Engineering and Control 32(3). Brown, RJ and Mackenzie, N (1994). FEDICS: The Forth Estuary Driver Information and Control System. Traffic Engineering and Control 35(9). Buchanan, C (1963). Traffic in towns. London, HMSO. CAM (Comunidad de Madrid) (1996) Planning Regional Strategy. Consejeria de Obras Publicas, Urbanismo y Transportes, Madrid. Carden, P (1999). The Midlands Driver Information System: Influencing Route Choice. Proc. Driver Information Systems Conference, Institution of Electrical Engineers, London. Carson, G, Dix, M, Callaghan, J and Slevin, R (1999) Encouraging sustainable development by linking public transport accessibility, new parking standards and developer contributions. Traffic Engineering and Control 40 (7/8) Christie, AW, Hornzee, RS and Zammit, T (1978). Effects of lorry controls in the Windsor area. SR 458. Crowthorne, TRRL. CIT (The Chartered Institute of Transport in the UK) (1998) Passenger Interchanges. London, CIT. CITIES (2000) Desarrollo de tecnologías de informacíon en tiempo real de la situación tráfico. Ayuntamiento de Madrid. Madrid. Colin Buchanan and Partners (1998) Transport Interchange: Best Practice. London, CBP. Collis, H (1988). The lorry management study. Traffic Engineering and Control 29(11). Coombe, D, Guest, P, Scholfield, Skinner, A (1997). Study of parking and traffic demand: 3. The effects of parking control strategies in Bristol. Traffic Engineering and Control, 38(4). Coombe, D and Simmonds, D (1997). Transport effects of land use change. Traffic Engineering and Control 38(12). Cristóbal, Garciá and González (2001) Barajas Airport-Madrid city connection: impriving accessibility. Proc 28th European Transport Conference. London, PTRC. Crocker, S, Dabinett, G, Gore, T, Haywood, R, Hennebury, Herrington, A, Kirkpatrick, A, Lawless, P, and Townroe, P (undated). Monitoring the Economic and Development Impact of South Yorkshire Supertram, Centre for Regional Economic and Social Research, South Yorkshire Passenger Transport Executive, and Department of the Environment, Tranpsort and the Regions. CROW (1997) Bicycle parking in the Netherlands. Bicycle Masterplan. The Hague, Ministry of Transport, Public Works and Water Management. ISBN 90-6628-251-7 CTM (Consorcio Regional de Transportes de Madrid) (1998) Plan Alternativo de Movilidad en el Poligono de Tres Cantos. Madrid.
PROSPECTS Deliverable 4 References
______________________________________________________________________________________________
Page 49
CTM (Consorcio Regional de Transportes de Madrid) (2001) Parking Policy Measures in Madrid. Madrid. Daniels, PW (1981). Flexible hours and journey to work in office establishments. Transportation Planning and Technology 6(1). Daugherty, GG and Balcombe, RJ (1999) Leeds guided busway study. TRL 410. Crowthorne, TRL. Daugherty, GG, Balcombe, RJ and Astrop, AJ (1999). A comparative assessment of major bus priority schemes in Great Britain. TRL 409, Crowthorne, TRL. De Jong, MA (1995). National transport policy in the Netherlands. Proc. Institution of Civil Engineers. Transport 111(3). Derkse, C (2000) Car-sharing; how to make it a success for all players. Proc 28th European Transport Conference, Seminar B. London, PTRC DETR (Department of the Environment, Transport and the Regions) (1998). Breaking the Logjam: The Government's consultation paper on fighting traffic congestion and pollution through road user and workplace parking charges. London, DETR. DETR (Department of the Environment, Transport and the Regions) (1999). From Workhorse to Thoroughbred: a better role for bus travel. London, DETR. DETR (Department of the Environment, Transport and the Regions) (2000) Encouraging walking; advice for local authorities. London, DETR. DETR (Department of the Environment, Transport and the Regions) (2001a). Transport Statistics Bulletin: Transport Statistics for Metropolitan Areas, 2000 Edition, available from: http://www.transtat.dtlr.gov.uk/tables/2000/tsma/tsma.htm. DETR (Department of the Environment, Transport and the Regions) (2001b). Transport Statistics Great Britain, 2000 Edition, available from: http://www.transtat.dtlr.gov.uk/tables/tsgb00/text.htm. DETR (Department of the Environment, Transport and the Regions) (2001c) Planning Policy Guidance 13 : Transport. London, DETR. Dodgson, J, Sandbach, J, Shurmer, Lane B, and McKinnon, A (1997). Motors or Modems? NERA, London, Report for the RAC. DoE/DoT (Department of the Environment / Department of Transport) (1995) PPG13: A Guide to Better Practice. London, HMSO. DoT (Department of Transport) (1977). Some effects of flexible working hours on traffic conditions at a large office complex. Traffic Advisory Unit. London, DoT. DoT (Department of Transport) (1992). The good roads guide. Design Manual for Roads and Bridges. Ch. 10. London, DoT.
PROSPECTS Deliverable 4 References
______________________________________________________________________________________________
Page 50
DoT (Department of Transport) (1995). Better places through bypasses - the report of the bypass demonstration project. London, HMSO. DoT (Department of Transport) (1996). The National Cycling Strategy. London, DoT. Duff, JT (1963). Traffic management. Proceedings of the Conference on Engineering for Traffic. London, Printerhall. Dundon-Smith, D and Law, C (1994a). Metrolink and retailing in Greater Manchester, Metrolink Impact Study, University of Salford, Department of Geography. Salford, University of Salford. Dundon-Smith, D and Law, C (1994b). Metrolink and the Greater Manchester Office Market: an appraisal, Metrolink Impact Study, University of Salford, Department of Geography. Salford, University of Salford. Elmberg, CM (1972). The Gothenburg traffic restraint scheme. Transportation 1(1). Elvik R, Mysen, AB and Vaa, T (1997). Trafikksikkerhetshåndbok1. Institute of Transport Economics, Oslo. ISBN 82-480-0027-3. European Commission (1999) PIRATE (Promoting Interchange Rationale, Accessibility & Transport Efficiency) project. IV Framework Programme. Feeney, BP (1989). A review of the impact of parking policy measures on travel demand. Transport Planning and Technology 14(2). Finnamore, AJ and Jackson, RL (1978). Bus control systems: their application and justification. LR851. Crowthorne, TRRL. Fitzroy, F and Smith, J (1993) Priority over pricing: lessons from Zurich. Journal of Transport Economics and Policy 27(4). Flowerdew, AD (1994) The effects of road pricing on land values and settlement patterns, London, RICS. Fowkes, AS, Nash, CA and Tweddle, G (1992). Harmonizing heavy goods vehicle taxes in Europe: a British view. Transport Reviews, 12(3). Fox, KA, Montgomery, FO and May, AD (1995). Integrated ATT strategies for urban arterials: DRIVE II project. PRIMAVERA. 1 Overview. Traffic Engineering and Control 35(5). Fridstrøm, L (1999) Econometric models of road use, accidents and road investment decisions. Report 457/1999. Oslo, Transport Economics Institute. Gantvoort, JT (1984). Effects upon modal choice of a parking restraint measure. Traffic Engineering and Control 25(4).
1 Traffic Safety Handbook
PROSPECTS Deliverable 4 References
______________________________________________________________________________________________
Page 51
Gentleman, H (1981). The Glasgow rail impact study, SR 650. Crowthorne, TRRL. Gilbert, CL and Jalilian, H (1991). The demand for travel and travelcards on London Regional Transport. Journal of Transport Economies and Policy 25(1). Glaister, S, Burnham, J, Stevens, H and Travers, T (1998). Transport Policy in Britain. Macmillan. GLC (Greater London Council) (1979). Area Control. London, GLC. GLC (Greater London Council) (1983). Fares and road casualties in London. London, GLC. Goodwin, P (1988). Bus trip generation from concessionary fares schemes: a study of six towns. RR 127. Crowthorne. TRRL. Goodwin, P (1992). A review of new demand elasticities with special reference to short and long run effects of price changes. Journal of Transport Economics and Policy 26(2). Goodwin, P (1996). Empirical evidence on induced traffic. Transportation 23. Goodwin, P, Hass-Klau, C and Cairns, S (1998a). Evidence on the effects of road capacity reduction on traffic levels. Traffic Engineering and Control, 39(6). Goodwin, P, Hass-Klau, C and Cairns, S (1998b).Traffic impact of highway capacity reductions: assessment of the evidence. London, Landor Publishing. HA (The Highways Agency) (1998). The Highways Agency's Toolkit; CD ROM. London, The Highways Agency. Hamer, R et al (1991). Teleworking in the Netherlands: an evaluation of changes in travel behaviour. Transportation 19(4). Handy, S (1997). How land-use patterns affect travel patterns; a bibliography. Council of Planning Librarians Bibliography, number 279. Harland, G and Gercans, R (1993). Cycle routes. PR 42. Crowthorne, TRL. Hass-Klau, C (1990). An illustrated guide to traffic calming. London, Friends of the Earth. Hass-Klau, C (1992). Civilised streets: a guide to traffic calming. Brighton, Environmental and Transport Planning. Hass-Klau, C (1993). Impact of pedestrianisation and traffic calming on retailing: a review of the evidence from Germany and the UK. Transport Policy 1(1). Haworth, SL and Hilton, IC (1982). Car parking standards and the urban economy. Traffic Engineering and Control 9(12). Holland, EP and Watson, PL (1978). Traffic restraints in Singapore; measuring the effects of the Area Licence Scheme. Traffic Engineering and Control 19(2).
PROSPECTS Deliverable 4 References
______________________________________________________________________________________________
Page 52
Hopkinson, PG, Carsten, OMJ and Tight, MR (1989) Review of literature on pedestrian and cyclist route choice criteria, Deliverable 3, DRIVE project V1031, WP 290. Leeds, Institute for Transport Studies. Howard, DF (1989). The characteristics of light rail. Highways and Transportation 36(11). IHT (Institution of Highways and Transportation) (1989). Pedestrianisation. IHT Guidelines. London. IHT. IHT (Institution for Highways and Transportation) (1990). Guidelines for Urban Safety Management. London, IHT. IHT (Institution of Highways and Transportation) (1996). Developing Urban Transport Strategies. London, IHT. IHT (Institution of Highways and Transportation) (1997). Transport in the Urban Environment. London, IHT. IHT (Institution of Highways and Transportation) (2000) Guidelines for providing for journeys on foot. London, IHT. INPHORMM (1998). A review of current practice in Europe: Summary Report. London, University of Westminster. Izquierdo, Monzon and Gutierrez (1999) Informe sobre el interés público de primer orden por razones de índole social y económica de la construcción del orbital M-50 y las nuevas radiales de acceso a Madrid. Madrid. Jansson, JO (2001) Efficient Modal Split. Paper presented at Thredbo 7. Molde, Norway. Jeffery, DJ (1981). The Potential benefits of route guidance. LR997. Crowthorne, TRRL. Jeffery, DJ and Russam, K (1984). Information systems for drivers. Transport Planning and Technology 9(3). Keen, K (1992). European Community research and technology development on advanced road transport infomatics. Traffic Engineering and Control 33(4). Kitamura, R. et al (1991). Telecommuting as a transportation planning measure: initial results of the California pilot project. Transportation Research Record 1285, Washington, TRB. Knight, RL and Trygg, LL (1977). Evidence of land use impacts of rapid transit. Transportation 6(3). Kolbenstvedt, M, Solheim, T and Amundsen, A (2000): Miljøhåndboken2. Trafikk og miljøtiltak i byer og tettsteder. Institute of Transport Economics, Oslo. ISBN 82-480-0147-4. Laferrere, G (2000) Cycling and public transport together against cars in French urban cities, Proc
2 Environment Handbook.
PROSPECTS Deliverable 4 References
______________________________________________________________________________________________
Page 53
28th European Transport Conference. London, PTRC. Larsen, OI (1995). The toll cordons in Norway – an overview. Journal of Transport Geography 3(3). Lawless, P (1999) Transport Investment and urban regeneration in a provincial city: Sheffield, Environment and Planning C: Government and Policy (17). Leeds City Council (1999) HOV Lane Information Sheet, URL: http://www.leeds.gov.uk/lcc/highways/various /twoplus.html LPAC (London Planning Advisory Committee) (1993). Advice on a parking strategy for London. London, LPAC. Mackett, RL and Babalik, E (2001). How to make new urban light rail systems more successful: a policy-based technique. Paper presented at the 9th World Conference on Transport Research, Seoul, Korea. Mackett, RL and Edwards (1998). The impact of new urban public transport systems: will the expectations be met? Transportation Research A 32(A). Mackie, AM and Davies, CH (1981). Environmental effects of traffic changes. LR 1015 Crowthorne. TRRL. Marshall, S and Banister, D (2000) Travel reduction strategies: intentions and outcomes. Transportation Research 34(A) 5. May, AD (1975). Parking control: experience and problems in London. Traffic Engineering and Control, 16(5). May, AD (2001) Development of an international knowledgebase on urban transport policy instruments. Paper presented at 9th World Conference on Transport Research, Seoul, Korea. May, AD, Bonsall, PW and Hills, PJ (1998). The impacts of different road user charging systems, Proc. 9th International Conference on Road Traffic Information and Control. London, Institution of Electrical Engineers. May, AD, Bonsall, PW and Slapa, R (1991). Measuring the benefits of dynamic route guidance. Proc PTRC. SAM. London. PTRC. May, AD et al (2000) Decision making requirements. PROSPECTS Deliverable 1. Leeds, ITS May, AD, Matthews, B and Jarvi-Nykanen, T (2001) Decision making requirements for the formulation of sustainable urban land use-transport strategies. Paper presented at 9th World Conference on Transport Research, Seoul. Korea. May, AD and Milne, DS (2000) Effects of alternative road pricing systems on network performance. Transportation Research 34 (A).
PROSPECTS Deliverable 4 References
______________________________________________________________________________________________
Page 54
May, AD and Roberts, M (1995). The design of integrated transport strategies. Transport Policy 2(2). May, AD, Shepherd, SP and Timms, PM (2000) Optimal transport strategies for European Cities. Transportation 27. May, AD and Still, BG (2000) The instruments of transport policy. WP 545. Leeds, Institute for Transport Studies. McDonald, M and Tarrant, D (1994). The ROMANSE project. Proc. Vehicle and Navigation and Information Systems Conference, Yokahama. McKee, WA and Mattingley, MJ. (1978) Environmental traffic management: the end of the road. Transportation 6(2). McPherson, RD (1992). Park and ride: progress and problems. Municipal Engineer 93(1). Mokhtarian, PL (1991) Telecommuting and travel: state of the practice, state of the art. Transportation 18(4). Monzon, A and González, JD (2000) Travel demand impacts of a new privately operated suburban rail in Madrid N-III corridor. Proc 28th European Transport Conference. London, PTRC. MOPT (Transport Ministry) (1998) Calmar el tráfico. Madrid. MVA Ltd (1999). Options for influencing PNR usage. Final report for Department of Environment, Transport and the Regions. Woking, MVA. MVW (Ministerie van Verkehr en Waterstraat) (1998) Eindrapport Masterplan Fiets. The Hague, Ministry of Transport, Public Works and Water Maintenance. Nash, CA (1992). The age of the train? University of Leeds Review 35. Leeds, University of Leeds. Nash, CA and Mackett, RL (1991) Commuting. In:- Fowkes, AS and Nash, CA (1991) Analysing demand for rail travel. London, Avebury. Nash, CA, Matthews, B, Granero, P and Marler, NW (2001) Design of new financing schemes for urban public transport; the role of private finance. Paper presented at Thredbo7, Molde, Norway. Nash, CA and Preston, JM (1991). Appraisal of rail investment projects: recent British experience. Transport Reviews 11(4). NATO (1976). Bus priority systems. CCMS Report 45. Crowthorne. TRRL. Newman, PWG and Kenworthy, JR (1991). Transport and urban form in 32 of the world's principal cities. Transport Reviews 11(3). Ogunisanya, A (1984). Improving urban traffic flow by restraint of traffic: the case of Lagos. Transportation 12(2).
PROSPECTS Deliverable 4 References
______________________________________________________________________________________________
Page 55
O'Malley, B and Selinger, CA (1973). Staggered work hours in Manhattan. Traffic Engineering and Control 14(1). Oscar Faber (1996). Manchester Metrolink Study. London, Oscar Faber Ott, M et al (1980). The behavioural impact of flexible working hours. Transportation Systems Centre. Washington, DoT. Parkhurst, G (1995). Park and ride; could it lead to an increase in car traffic? Transport Policy 2(1). Pearce, K and Stannard, C (1973). Catford traffic management study. Vol. 1. Planning and Transportation Research Report 17. London, GLC. Perrett, KE and Stevens, A (1996). Review of the potential benefits of Road Transport Telematics. TRL Report 220. Crowthorne, TRL Pickett, MW (1982). Trials of computer generated public transport travel information in Wiltshire. LR 1036. Crowthorne, TRRL. Pickett, MW (1995). The effectiveness of bus-based park and ride. Proc: Parking Control: from principle to practice. PA 3056. Crowthorne, TRL. Polak, JW et al (1990). Parking guidance and information systems: performance and capability. Traffic Engineering and Control 31(10). Pozueta (1999) Seguimiento y evolución del Bus-VAO en Madrid. Cuadernos de investigación urbanística. ETSA, Madrid. Read, MJ, Allport, RJ and Buchanan, P (1990). The potential for guided busways. Traffic Engineering and Control 31(11). Richards, MG, Gilliam, C and Larkinson, J (1996). London Congestion Charging Research Programme: 6. The Findings. Traffic Engineering and Control 37(7/8). Routledge, I, Kemp, S, and Radia, B (1996). UTMC: The way forward for Urban Traffic Control,. Traffic Engineering and Control 37(11). Rye, T (1999). Employer Transport Plans: A case for regulation. Transport Reviews 19(1). SACTRA (The Standing Advisory Committee on Trunk Road Assessment) (1994). Trunk roads and the generation of traffic. London, HMSO. SACTRA (The Standing Advisory Committee on Trunk Road Assessment) (1999). Transport Investment, Transport Intensity and Economic Growth. London, SACTRA. Sanderson, J (1994). A matrix approach to setting parking standards. Transportation Planning Systems 2(1).

PROSPECTS Deliverable 4 References
______________________________________________________________________________________________
Page 56
Shoup, DC (1997) Evaluating the effects of cashing out employer-paid parking. Transport Policy 4(4). Silcock, DT and Forsyth, E (1985). Real time information for passengers on the London Underground. Proc. 13th PTRC Summer Annual Meeting. London, PTRC. Snellen, D (2000). The relationship between urban form and activity patterns; multi-variate analysis of frequently made trips. Proc 28th European Transport Conference. London, PTRC. Soo, C (1998). ERP cuts congestion in Singapore. Traffic Technology International. June/July. Still, BG (1996) The importance of transport impacts on land use in strategic planning. Traffic Engineering and Control 37(10) Still, BG and Simmonds, DC (2000). The economic impacts of parking restraint policies. Transport Reviews 20(3). Sumner, P and Baguley, C (1979). Speed controls on residential roads. LR 878. Crowthorne, TRRL. TAS (1997). Quality Partnerships in the Bus Industry: A Survey and Review. Preston, TAS. TEST (1991) Changed travel – better world? London, TEST. Thompson, RG and Bonsall, PW (1997). Drivers' response to parking guidance and information systems. Transport Reviews, 17(2). Thompson, RG, Firmin, PE and Bonsall, PW (1998). An assessment of drivers' interpretations, opinions and stated response to VMS in London. Proc of the 5th World Congress on Intelligent Transport Systems, Seoul, South Korea 12-16 October 1998. Tolley, R (1993). The Greening of urban transport. London, Belhaven. Topp, HH (1993) Parking policies to reduce car traffic in German cities. Transport Reviews 13, 83-95. Topp, HH and Pharoah, T (1994). Car Free City Centres. Transportation, 21(3). Transport 2000 (1997). Changing Journeys to Work: an employer's guide to green commuter plans. London, Transport 2000. Transport 2000 (1999) A safer journey to school. London, Transport 2000. Transportrådet (1994) Cykelbrug på korte ture i byer. Notat 07. Aalborg, Aalborg University. TRL (Transport Research Laboratory) (1995). The Environmental Assessment of Traffic Management Schemes: a literature review. TRL 174. Crowthorne, TRL. Tyne and Wear PTE (1985). The Metro Report. Newcastle, TWPTE.
PROSPECTS Deliverable 4 References
______________________________________________________________________________________________
Page 57
Valleley, M (1997). Parking Perspectives. London, Landor Publications. Vincent, RA and Layfield, RE (1978). Nottingham zones and collar experiment: the overall assessment. LR 805. Crowthorne, TRRL. Wachs, M (1990). Regulating traffic by controlling land use. Transportation 16(3). Wachs, M (1993). Learning from Los Angeles: transport, urban form and air quality. Transportation 20(4), 329-354. WALCYNG (1997) Final report for publication, CEC, Brussels. Walmsley, DA and Perrett, KE (1992). The effects of rapid transit on public transport and urban development. RR258. Crowthorne, TRL. Webster, FV et al (1980). The demand for public transport. Crowthorne. TRRL. White, PR (1992). Cost benefit analysis of urban minibus operations. Transportation 19(1). Wood, K (1993). Urban traffic control, systems review. PR 41. Crowthorne. TRL. Wood, K and Smith, R (1992). Assessment of the pilot priority Red Route in London. Traffic Engineering and Control 33 (7/8). York, I and Balcombe, R (1998) Evaluation of low floor bus trials in London and North Tyneside, TRL 271. Crowthorne, TRL.
PROSPECTS Deliverable 4 Annex A
______________________________________________________________________________________________
Page 58
Annex A
Excerpts from Deliverable One (for references, see Deliverable One)
(a) Objectives
3.2 Sustainability, the basic objective
Even if the practical content of a sustainable urban development plan will have to be constantly revised in the light of new external pressures and new knowledge, there is a need for a fixed and clear conception of what (environmental) sustainability is. Without it, sustainability will only be a catchword. Our definition of sustainability follows Chichilnisky (1996) and Heal (1998), see Minken (1999). According to them, one of the two defining characteristics of sustainability as an objective is that it includes both the welfare of the present society and the society of the very distant future. The second defining characteristic of sustainability is that it implies conservation of natural resources. Put in other words: natural resources should be valued not only as something that may be consumed (in production or consumption), but also as stocks that benefit us even when not being consumed. The fundamental reason for this is that we are dependent on some basic qualities of our surrounding ecosystems for our quality of life and indeed to continue to exist. (See for example the Stadtentwicklungsplan 1994 of Vienna, pages 60-64). If our strategies now had negligible long run effects, sustainability would not be an issue. The concerns about sustainability arises precisely because our actions now may constrain the opportunities of future generations and diminish their maximum attainable welfare. The aspects of our actions that are most likely to do so, are energy consumption, CO2-emissions, emissions of other pollutants with long term or irreversible effects, and the running down of non-renewable resources like various kinds of green areas and cultural sites inherited from the past. Some forms of long term investments are also highly relevant. A fuller analysis of definitions is given in Appendix 2. The PROSPECTS working definition of sustainable urban transport and land use reflects these considerations. Our definition is: A sustainable urban transport and land use system • provides access to goods and services in an efficient way for all inhabitants of the urban area • protects the environment, cultural heritage and ecosystems for the present generation, and • does not endanger the opportunities of future generations to reach at least the same welfare
level as those living now, including the welfare they derive from their natural environment and cultural heritage.
While this definition was developed following our discussions with the core cities, it is largely accepted by them. Our survey cities were asked to consider how appropriate this definition of sustainability was to their circumstances. Whilst a relatively small proportion (24%) considered the definition to be ‘very appropriate’, the majority of cities (61%) considered the definition to be ‘quite appropriate’. Only two cities considered that the definition was ‘quite inappropriate’, the remainder either stating neutrality or no response. No alternative definitions of sustainability were offered by the survey cities. Therefore, whilst the survey suggests that there may be scope for identifying a
PROSPECTS Deliverable 4 Annex A
______________________________________________________________________________________________
Page 59
definition of sustainability which is more appropriate to the circumstances of European cities, there was a good general degree of consent with our working definition. Because sustainability involves trade-offs between generations, all sub-objectives listed in section 3.3, even if they are taken to apply only to the present generations, are legitimately sub-objectives of sustainability. Ideally, however, they should apply both to the present and to every future generation. If it is seen as impossible to predict and measure the level of sustainability at some distant point in the future, special emphasis must be attached to the sub-objectives whose current level will mean the most for the welfare of future generations. It is easily seen from our definition of sustainability which sub-objectives in the list below should be given a special emphasis when planning for sustainability. Sustainability in the local transport sector is measurable by making certain modifications to an ordinary cost benefit analysis, see Minken (1999) and OPTIMA (1998). One of the challenges of PROSPECTS is to extend this indicator, the Sustainability Objective Function, to the wider field of land use and transport planning. At the same time, all the indicators of all the objectives listed below might also be utilised in measuring sustainability, provided due emphasis is put on the indicators that means the most to the welfare of future generations. These tasks belong to Work Package 20. But our strategies are embedded in, and must be assessed on the background of local, national and international trends, which make up the scenarios that we plan for. Must we also assume of these trends that they are sustainable? Which strategy is the better, a strategy that performs well in a sustainable scenario, or a strategy that contributes little to sustainability in a sustainable scenario, but much to counteract the unsustainability of an unsustainable scenario? This is a difficult question to which we will have to come back in Work Package 20. 3.3 Sub-objectives to sustainability
While sustainability is considered the basic objective of urban land use – transport strategies, it can be achieved through a number of sub-objectives, all of which are of importance to cities. A list of six sub-objectives was developed in consultation with the Core Cities, covering:
economic efficiency livable streets and neighbourhoods protection of the environment equity and social inclusion safety; and contribution to economic growth.
These are defined more fully below. 3.3.1 Economic efficiency
This is further specified to be economic efficiency in the transport markets, the housing market, the labour market, and possibly some composite commodity markets, as well as economic efficiency in infrastructure and housing provision. This objective concerns the utility that the inhabitants of the city can get from taking part in these markets, and is measurable at the aggregate level as an appropriately specified welfare function, or at the level of each of the markets as consumer and producer surpluses. As for all the other sub-
PROSPECTS Deliverable 4 Annex A
______________________________________________________________________________________________
Page 60
objectives, it may be an objective that is set for the present situation, or for some future situation, or both. The exact way to provide for future generations with respect to this sub-objective is to be decided in WP 20. 3.3.2 Livable streets and neighbourhoods
To us, this has the following aspects
1. Increased freedom of movement for vulnerable road users, including reduced risk of traffic accidents
2. Positive external effects of our transport and land use strategy on social, cultural and recreational activity in inner city and in neighbourhoods
This objective is focused on streets and outdoor conditions in residential areas. It is an important objective when planning for sustainability, and deserves to stand alone because it is neither captured in the economic efficiency objective, as we can measure it now, nor fully in environmental protection or safety objectives. 3.3.3 Protection of the environment
This sub-objective can be considered to involve a number of elements: 1. Reduce use of non-renewable resources and overutilisation of renewables. 2. Reduce energy use in transport, distribution systems and housing, and thereby reduce
contribution to global climatic change (CO2 emissions). 3. Reduce regional pollution by reducing emissions of NOX and SO2. 4. Reduce local damage and health problems caused by emissions of NMVOC and PM 10. 5. Protect cultural heritage sites, natural habitats, green areas, agricultural land and recreational
areas. 6. Reduce urban sprawl and land-take for settlement and transport purposes. 7. Reduce the settlement and bio-diversity fragmentation by infrastructure. 8. Reduce activity with environmental consequences in areas with particular vulnerability. 9. Reduce the number of people exposed to noise, and reduce vibration from transport. Objectives 2-8 may be seen as special cases of objective 1. As objectives, all of the nine fall in two groups: The ones that are included in the economic efficiency objective function (and have an indicator as a part of that) and the ones that must be measured by the level of goal achievement for some politically set goal (and will probably serve as constraints in optimisation). Environmental effects may in turn have distributional effects. If we are able to identify the degree to which different areas are affected by negative environmental effects, it is a step towards identifying winners and losers with regard to environmental costs. 3.3.4 Equity and social inclusion
Social inclusion in as far as our kind of planning is concerned about it, consists of two sub-objectives: 1. accessibility for those without a car 2. accessibility for mobility impaired
PROSPECTS Deliverable 4 Annex A
______________________________________________________________________________________________
Page 61
Important as they are, policies to provide affordable housing to everybody, to secure minimum levels of consumption, schooling etc. for everybody, and to counteract racism and other forms of social exclusion, are seen as lying outside the scope of the project and the kind of planning to be addressed in the guidebooks.
Equity, on the other hand, consists of
3. ”fair shares/level playing field” – each mode and operator should neither pay way more nor way less than it gets from the government
4. “compensation to losers” – inequitable effects of our strategies should be counteracted as far as possible
5. “economise on tax payers’ money” - funds used for transport an land development purposes have alternative uses
The reason why the last objective is grouped under equity, is that public funds could be used instead for schooling, health care etc., which would have obvious equity implications. As far as this is the case, and only as far as this is the case, we also include the wider aspects of social inclusion and equity in our objectives.
The sub-objective of compensation to losers includes compensation to those who are affected by negative impacts on the environment and safety.
3.3.5 Safety and severity of traffic accidents
As with environmental sub-objectives, there is also a distributional perspective associated with traffic accidents. This ought to be reflected by our indicator list. 3.3.6 Contribution to economic growth
It will be an important objective for most cities that land use and transport policies should support economic growth. The SACTRA Report on "Transport and the Economy" (SACTRA 1999) identifies mechanisms by which transport improvements theoretically might lead to increased economic activity and thereby possibly to sustained economic growth. However, the empirical identification of such effects is a field of research that is poorly developed, and evidence is limited. Thus it might be difficult to measure goal achievement with respect to this objective.
Any city is part of wider systems - perhaps world wide systems - of production and trade. Whether these systems are sustainable is an important question that cannot be fully addressed in our project. We will have to make assumptions about it when we develop scenarios in task 12. These assumptions imply a certain city specific growth rate that may be influenced by urban transport and land use strategies, but probably for the most part only in a minor way.
(b) Barriers
6.1.2 Concept and types of barriers
A barrier is an obstacle that prevents the coming-into-force of a particular measure, or causes delays in its implementation. Barriers can be rigid or flexible, the latter being able to be overcome given sufficient time or resources. Land use measures tend to face more rigid barriers than, say, management or information measures.
PROSPECTS Deliverable 4 Annex A
______________________________________________________________________________________________
Page 62
Barriers can be either positive or negative. A positive barrier arises when one of the objectives of the strategy restricts the ability of a measure to achieve other objectives. Environmental constraints are examples, and their imposition could well improve the measure or its performance. By contrast, a negative barrier, such as inadequate legislation, may cause delays and excess costs in the implementation of the measure. Based on the discussions with the Core Cities, the negative barriers have been grouped into three categories: • Legal and institutional: lack of legal powers to implement a particular measure, and legal
responsibilities which are split between agencies, limiting the ability of the city authority to implement the affected measure;
• Financial: budget restrictions limiting the overall expenditure on the strategy, financial restrictions on specific measures, and limitations on the flexibility with which revenues can be used to finance the full range of measures;
• Political and cultural aspects: lack of political or public acceptance of a measure, restrictions imposed by pressure groups, and cultural attributes, such as attitudes to enforcement, which influence the effectiveness of measures.
Results from the surveys in the core cities are reported in separate sections for each of these categories.