daily class - l1.com.au
TRANSCRIPT

§ The L1 Long Short Fund returned 8.6% (net)3 for the June quarter (ASX200AI 8.3%).
§ Over the past year, the Fund has returned 70.1% (net)3 (ASX200AI 27.8%).
§ The strong performance over the past year has been driven by stock selection with a broad range of contributors acrossthe portfolio.
Returns Since Inception (Net)3 (%)
Cumulative Return
Annualised Return p.a.
L1 Capital Long Short Fund 293.4 22.2
S&P ASX 200 Accumulation Index 71.7 8.2
MSCI World Index Total Return (USD) 72.5 8.3
HFRX Global Hedge Fund Index 14.6 2.0
Returns (Net)3 (%)L1 Long
Short FundS&P ASX
200 AIOut-
performance
3 Months 8.6 8.3 +0.3
1 Year 70.1 27.8 +42.3
2 Years p.a. 28.4 8.6 +19.8
3 Years p.a. 15.3 9.6 +5.7
5 Years p.a. 14.8 11.2 +3.6
Since inception p.a. 22.2 8.2 +14.0
Since inception cumulative 293.4 71.7 +221.8
Global markets continued to perform well over the quarter supported by robust economic data, further corporate earnings upgrades and positive vaccine progress. The upbeat quarter contributed to the ASX200 returning 27.8% for the financial year, its strongest performance in more than 30 years. Whilst the sharp rebound in markets has meant that we currently see less upside in equities relative to 12 months ago, we believe markets should remain supported in the near term driven by continued fiscal and monetary stimulus, rising M&A activity and further economic re-opening.
Portfolio PositioningWhile we are more positive on lower P/E (value) stocks at present, than higher P/E (growth) stocks, our portfolio is not exposed to structurally challenged “deep value” stocks. As shown in the table below, the companies that we are long are expected to grow their earnings very strongly (much stronger than the market average) despite trading at lower multiples. They are typically trading below a market multiple due to concerns about a short term or historical issue or they are currently about to enjoy a cyclical recovery or benefit from an operational turnaround. Our longs are also expected to generate more than twice the free cashflow of our shorts, which provides them more opportunities for dividends, buybacks or bolt-on acquisitions. The numbers below use consensus broker forecasts, rather than L1 earnings estimates.
Figure 1 – Portfolio metrics (median) FY22 Forecasts Portfolio longs Portfolio shorts ASX 200
P/E 13.5x 22.0x 19.6xEPS Growth YoY 16.0% 19.1% 9.9%Free Cash Flow Yield 7.2% 2.9% 4.8%Dividend Yield 2.9% 1.7% 2.9%
Source: Bloomberg consensus estimates as at 9 July 2021, calculated as the median for the relevant constituents. Excludes entities with no estimates over the forecast period.
1 The value of the Fund’s assets less the liabilities of the Fund net of fees, costs and taxes. 2 The unit price is calculated by decreasing the NAV price by the sell spread (currently 0.25%). The NAV price is the NAV divided by the units on issue. 3 All performance numbers are quoted net of fees. Figures may not sum exactly due to rounding. Past performance should not be taken as an indicator of future performance. Strategy performance and exposure history is for the L1 Capital Long Short fund – Daily Class since inception on 3 Oct 2016 (being the date that the first Daily Class units were issued). Prior to this date, data is that of the L1 Capital Long Short Fund – Monthly Class since inception (1 Sep 2014) which is subject to a different fee structure.
L1 Capital Long Short FundQuarterly Report | JUNE 2021
Quarterly Report | JUNE 2021 | L1 Capital Long Short Fund – Daily Class 1
DaiLy CLaSS
UNIT PRICE: 1.60241,2

From an individual stock perspective, with the positive performance over the quarter we have taken profits in several “winners” including companies where value catalysts have played out, such as aristocrat Leisure, Lovisa, Nine Entertainment and Wells Fargo. We have recycled this capital into existing high conviction positions and a selection of new ideas. As many sectors continue to trade on “top-down” trends, rather than stock-specific fundamentals, we continue to find numerous exciting stock opportunities yet to be recognised by the market on both the long and short sides.
Key Stock Contributors for the Quarter Wells Fargo (Long +16%) was the strongest contributor to portfolio performance over the quarter. Wells Fargo shares rallied given a better outlook for bad debts driven by improving employment and house price trends. The company had been very undervalued due to excessive fears around likely bad debts due to the pandemic, the continued regulatory “asset cap” (a punishment that was put in place in 2017 for numerous compliance failures) and an inability to commence buybacks. The share price has subsequently recovered strongly in recent months as the company has progressed its turnaround program under the leadership of the well-regarded CEO, Charles Scharf (former CEO of Visa and BNy Mellon). Wells Fargo is now closer to getting the asset cap lifted and has announced a huge cost out program (US$8b+) as well as an $18b buyback program to be completed over the next 12 months. Wells Fargo shares have rallied more than 50% since we initiated the position in late 2020. Given the strong rally, we elected to exit our position and rotate into stocks with larger valuation upside.
Imdex (Long +24%) is the global leader in exploration drilling technology for the mining sector, with 80% of the business exposed to gold, copper and iron ore. imdex shares rose on the back of recent base metals price strength, which is likely to extend the exploration recovery from gold to the broader resources sector. in our visit with imdex management in Western australia, we continued to be impressed by their focussed approach to growing the business for the long term. The company has spent significantly on R&D over the past five years (fully expensed through its P&L) and is now in the early stages of launching the industry’s best suite of new and improved products. We expect earnings growth of more than 20% p.a. for many years to come, which is not reflected in the current multiple of ~10x consensus Fy22 EV/EBiTDa. Finally, we believe imdex’s secure, cloud-based portal for providing access to validated field data (iMDEXHUB-iQ), will become a major contributor to client retention, will increase product penetration per site and is being quickly adopted across the client base.
Mineral Resources (Long +41%) shares rallied, driven by strong increases in lithium and iron ore prices over recent months. in april, we attended a Mineral Resources analyst event in Western australia where an energised management team highlighted the huge pipeline of growth projects across all key areas of the business – lithium, iron ore and mining services. in particular, the company re-affirmed its objective to grow its iron ore production from around 20mt p.a. to over 80mt p.a. in the coming years. We believe Mineral Resources is a very compelling investment, offering a rare combination of attractive valuation, high quality management, supportive industry tailwinds, strong long-term earnings growth and a rock solid balance sheet.
Tabcorp (Long +11%) provides gambling and entertainment services through a range of brands across three segments: lotteries & keno, wagering & media and gaming services. Tabcorp shares rose after reporting a very strong half-year result, which showed both lotteries and wagering ahead of consensus estimates, as well as corporate interest in its wagering business. Lotteries had a particularly strong period with an uplift in digital sales, a significant increase in keno (reflecting excellent operational execution) and higher long-term margins. in the second half of the financial year, lotteries are expected to benefit from a more normal jackpot sequence and a change in lottery game design, while wagering should benefit from retail venues reopening and the launch of new wagering products. Following multiple approaches from a range of corporate and financial buyers, the Board carried out a strategic review and recently announced a demerger of the wagering business. While the demerger is a positive step in achieving a structural separation of the wagering business from the lotteries businesses, we have encouraged the Board to continue engaging with interested buyers should there be an accelerated path to achieving this outcome and delivering significant value to shareholders.
QBE (Long +12%) performed well over the quarter after management gave an upbeat trading update in their aGM commentary in early May. after enduring a flat and challenging premium market for many years, QBE stated that Gross Written Premium (GWP) increased 23% in the first quarter (on a constant currency basis). Excluding crop insurance (which distorts the underlying trends), GWP across the QBE business increased 13%, which reflects positive industry trends and improving combined operating ratios across all regions. We have been cautious on QBE for many years, given the clear industry headwinds they were facing. However, after 15 years of weak industry dynamics, we believe QBE is finally set to deliver improving margins, dividends and ROE which we believe are not yet fully factored into market expectations.
Quarterly Report | JUNE 2021 | L1 Capital Long Short Fund – Daily Class 2
L1 Capital Long Short FundQuarterly Report | JUNE 2021
DaiLy CLaSS

Entain (Long +15%) shares continued to perform positively as the company’s U.S. joint venture with MGM Resorts, BetMGM, continued to show strong market share growth. BetMGM is now the second largest player in the overall U.S. sports betting and iGaming market, overtaking DraftKings. We continue to believe Entain has material upside from current levels. On a sum-of-the-parts basis, we estimate that BetMGM trades at a ~70% discount to DraftKings, despite its greater market share and outstanding execution to date. The company’s core online business could double over the next few years and there is potential for M&a upside with Entain looking at a number of strategic opportunities.
Treasury Wine Estates (TWE) (Long +13%) performed strongly in June following the company’s investor day at which management clarified its regional and brand strategies and provided greater confidence in its ability to develop increased demand for its key Penfolds brand. During 2020, TWE’s shareprice pulled back significantly after a series of adverse announcements, including negative impacts on the U.S. business, the retirement of its long time CEO and exorbitant tariffs that all but banned exports to China. We bought into TWE after the shares had collapsed following the market’s over-reaction to the China tariff news. Notwithstanding the negative newsflow, we have always held TWE’s brand portfolio (especially Penfolds) and its operating management in high regard. acknowledging that the now limited access to the Chinese market makes the current medium-term outlook somewhat unclear, we believe that the company has been able to preserve its brand integrity and, more importantly, its pricing power. This should position TWE well to reallocate the portfolio to adjust for the loss of China over time, with significant upside should there be any tariff relief.
Airbus (Long +12%) shares gained over the quarter after stepping up its production guidance for the critical A320 plane to 45 per month by year end and 64 per month by Q2 2023, higher than the 60 per month it was producing before COViD-19. The company also announced its ambition to build 70 a320’s per month by 2024 and 75 per month in 2025. airbus has the leading market share in narrow-body planes which has further increased in recent years due to the issues that have plagued Boeing’s 737 Max, its only meaningful competitor in the category. We expect narrow-body demand to continue to grow strongly with the planes exceptionally well positioned for the post-COViD-19 travel landscape. Narrow-body planes are expected to continue winning market share over wide-body planes given they are better suited to direct, point-to-point travel (which is typically preferred by the passenger). airbus’ new planes, particularly the a321XLR, are now able to offer a longer flight range than traditional narrow-bodies, which further extends their flexibility for airlines trying to manage an ever-changing list of destinations and traveller preferences. The A320 is airbus’s most profitable product and generates very high incremental returns on invested capital which will support significant profit growth over the medium term. Despite the airbus share price almost doubling since November last year, we believe the shares still remain undervalued. The shares are trading ~20-25% below their pre-COViD-19 levels, despite their production and margin outlook set to be even better than before the pandemic.
Key Stock Detractors for the QuarterPerenti Global (Long -34%) fell after lowering its Fy21 profit guidance and Fy22 outlook due to the impact of COViD-19 on mining productivity, labour shortages in the Australian market and a stronger Australian dollar. Perenti is a mining services company operating surface and underground mining across Africa and Australia with its primary exposure to gold and copper mining. Labour shortages, particularly in Western Australia, have been flagged by a number of mining and contracting companies due to strong commodity prices driving increased demand and reduced inflow of labour from other states limiting supply. While the earnings downgrade is disappointing, many of the issues facing the company are transitory and driven by COViD-19-induced challenges which should pass as the vaccine roll-out accelerates and inter-state and international travel restrictions are relaxed. Perenti has “rise and fall mechanisms” in the majority of its contracts which provide a pass-through for incremental labour costs, however this has not fully compensated for the lower productivity of the workforce given new rostering in light of COViD-19. With the company trading on only ~7x Fy22 P/E based on consensus earnings and ~20% below its tangible book value, we believe Perenti is materially undervalued. While COViD-19 headwinds are likely to persist in the near term, we expect Perenti’s earnings to recover strongly over the medium term as travel restrictions ease and as the supportive commodity backdrop drives new project wins from the significant tender pipeline.
Chorus (Long -6%) shares declined in the June quarter as a result of a punitive determination by the New Zealand Commerce Commission on the allowed rate of return for Chorus’s fibre assets. The very low allowed rate of return severely underestimates the real risks investors have taken on in building and operating the fibre network. We are hopeful this will be corrected through a much more commercial approach to the assumptions underlying the asset base and a re-examination of other assumptions through the rest of this year. Failure to do so would send a strong signal that there is huge risk in entering into long-term public private partnerships with the New Zealand government and that New Zealand is not a reliable destination for investing in regulated assets. in terms of company fundamentals, Chorus’s fibre build has been consuming the majority of cashflow for many years, preventing the company from paying out its true underlying earnings in dividends. With the peak capex period now past, we are hopeful that shareholders will finally begin to see the returns on this 10-year investment program.
Quarterly Report | JUNE 2021 | L1 Capital Long Short Fund – Daily Class 3
L1 Capital Long Short FundQuarterly Report | JUNE 2021
DaiLy CLaSS

Equity Market ObservationsOver the past year, we have seen an enormous flood of money into equities (a result of central bank buying of bonds forcing some traditional buyers of bonds into equities). We have also seen sudden moves in factor and sector performance given the dynamic moves in the outlook for COVID-19, the global economy and bond yields.
From an equities perspective, global inflows over the past 6 months were the greatest on record (refer Figure 2). To put the scale of equity inflows into context, if flows continue at the current pace, this year will see greater net inflows than the preceding 20 years combined (refer Figure 3).
Figure 2 – H1 annualised inflow to equities largest ever Figure 3 – H1 annualised equity inflows > previous 20 years
1H021H03
1H041H05
1H061H07
1H081H09
1H101H11
1H121H13
1H141H15
1H161H17
1H181H19
1H201H21
0
-200
600
Equities ($b)
400
200
0
200
400
600
800
1,000
1,200
Equity flows ($b)
777
1,178
1H21 Annualised20 Year Cumulative
Source: BofA Global Investment Strategy, EPFR Source: BofA Global Investment Strategy, EPFR. Note H1’21 is annualised
Over april and May the rotation into value/cyclical stocks and away from growth/defensive stocks continued. However, this trend reversed from mid-June with the Fed flagging a slightly faster pace of likely policy tightening (given a more positive outlook for the economic recovery). This led to a flattening of the yield curve with growth/defensives stocks strongly outperforming.
We believe this pause in value/cyclical outperformance should be temporary. Despite the sharpest economic recovery in history and a starting point of unprecedented valuation dispersion, we have only seen a very modest value rotation to date (refer Figure 4). Growth stocks have only ever traded at such an extreme premium to value stocks once in the past 30 years (circa 2000), which was followed by 7 years of value outperformance (refer Figure 5).
Figure 4 – MSCI World Growth vs Value Figure 5 – P/E premium of Growth vs. Value (S&P 500)
Relative price performance of MSCi indices in local currency
60
80
100
120
140
160
180
200
19741978
19811984
19881991
19941998
20012004
20082021
20182014
2011
World Value vs GrowthGrowth Outperforming
0
5
10
15
20
25
30
35
Fwd. P/E Spread, S&P 500, Expensive vs Value
Current = 26.7x (98th percentile)Median = 10.8x
19862092
19982003
20102016
19881992
20002006
20122018
19901996
20022008
20142022
2020
Source: Datastream, Goldman Sachs Global Investment Research Source: J.P. Morgan U.S. Equity Strategy & Global Quantitative Research
Quarterly Report | JUNE 2021 | L1 Capital Long Short Fund – Daily Class 4
L1 Capital Long Short FundQuarterly Report | JUNE 2021
DaiLy CLaSS

Positioning continues to be crowded in ultra-high P/E stocks that we believe are at risk of a large fall given extreme retail investor positioning and little valuation support. Figure 6 illustrates the partial correction in non-profitable tech stocks in recent months, however, these shares continue to trade way above their pre-COViD-19 levels despite most having no major change to their outlook or earnings trajectory. From an aSX 200 perspective, Figure 7 outlines where high P/E firms are currently trading relative to long-term averages. Whilst we acknowledge that interest rates have moved structurally lower in recent years, the re-rate in high P/E stocks looks excessive to us, with a current forward P/E of ~47x which is 95% above the 20-year average. These factors continue to support our view that there is much further to go for conditions to revert to a more balanced “equilibrium”.
Figure 6 – Performance of the GS Non-Profitable Tech Basket Figure 7 – ASX 200 – High P/E firms relative to long-term average
0
100
200
300
400
500
600
Apr 16
Oct 16
Apr 17
Oct 17
Apr 18
Oct 18
Apr 19
Oct 19
Apr 20
Oct 20
Apr 21
GS Non-Profitable Tech
12x
17x
22x
27x
Aver
age
12 M
onth
For
war
d PE
32x
37x
47x
42x
19941996
19982000
20022004
20062008
20102012
20142016
20182020
ASX200 – High PE Firms; Average Forward PE 20 Year Average
Source: Goldman Sachs Research Source: Goldman Sachs Research
a key risk we noted in our March quarterly report and investor presentations was inflation, where our analysis suggested we would experience very significant inflationary pressures above market expectations in 2021. Subsequently, the april U.S. CPi reading of 4.2% was far above consensus forecasts (it was the biggest surprise versus broker consensus for an inflation print on record). On page 7 we have outlined our current views on the key drivers of this inflation reading and how we have positioned the portfolio to hedge against the potential risk this may be more than a transitory impact.
Finally, last quarter we wrote about the huge wave of mergers and acquisitions (M&a) activity we expected and how the portfolio is well positioned to benefit from this activity with our skew to undervalued companies that have strategic appeal. As anticipated, this quarter saw a significant step-up in M&a and restructuring activity. For the first half of the year ~$148b worth of deals were announced across australia and New Zealand – more than 2.5x the 5-year average. On page 6, we provide further colour supporting our views on why we continue to believe we are in the early stages of the M&a bull-market and the potential opportunities this offers the portfolio.
Quarterly Report | JUNE 2021 | L1 Capital Long Short Fund – Daily Class 5
L1 Capital Long Short FundQuarterly Report | JUNE 2021
DaiLy CLaSS

M&A and corporate restructuringas expressed previously, we believe we are on the cusp of a major M&a supercycle. as shown in Figure 8 below, australian activity has started to accelerate on a year-to-date basis, with a further step up in deals over the June quarter. Notable recent transaction announcements are the ~$22b takeover offer for Sydney airport from a consortium of investors, the ~$12b merger proposal for Star Entertainment Group and Crown Resorts, the ~$5b takeover offer for altium from autodesk and the ~$4.5b offer for Vocus from a Macquarie infrastructure and Real assets led consortium.
Figure 8 – Announced M&A involving an Australian company (A$b)
0
10
20
30
40
50
60
70
80
90
0
50
100
150
200
250
300
35012m Total (RHS)Monthly
Oct 2009
Aug 2010
Jun 2011
Apr 2012
Feb 2013
Dec 2013
Oct 2014
Aug 2015
Jun 2016
Apr 2017
Feb 2018
Dec 2018
Oct 2019
Aug 2020
Jan 2021
Jun 2021
Dec 2008
May 2010
Jan 2011
Nov 2011
Sep 2012
Jul 2013
May 2014
Mar 2015
Jan 2016
Nov 2016
Sep 2017
Jul 2018
May 2019
Mar 2020
May 2009
Source: MST Marquee as at 30 June 2021
We expect this deal momentum to continue, driven by improving business confidence, debt and equity becoming cheap and easy to access, and a massive pool of available capital from private equity, infrastructure funds and industry super funds.
Furthermore, COViD-19 has accelerated corporate strategic reviews and potential consolidation, which we expect to underpin future deal volumes. Our anecdotal feedback from numerous conversations with investment bankers, private equity investors and lawyers supports this outlook with many stating their deal pipelines are at record levels and noting this is the busiest they have ever been in their careers.
This backdrop is also very supportive for the new L1 Capital Catalyst Fund, which launched on 1 July 2021. L1 Catalyst is a long only, activist listed equities strategy that focuses on unlocking company value to achieve private equity-style returns. The Long Short Fund will benefit directly from the research and engagement of the Catalyst team, led by experienced and well-regarded corporate adviser James Hawkins, and will be investing alongside it in companies where there are opportunities to unlock value.
By way of an update on the individual positions we identified in the last quarterly as having M&a/restructuring catalysts, many have moved closer to realising this upside over the quarter:
§ Telstra announced the sale of a 49% stake in its mobile towers portfolio, valuing the entity at $5.7b or 28x EBiTDa – well aheadof market expectations and also ahead of recent comparable tower deals. While a positive in its own right, the successfultransaction has turned the focus to Telstra’s other fixed network assets which contribute ~20% of Telstra’s group earnings andbased on comparable transactions could be valued at north of 20x EBiTDa. With Telstra currently trading on an EV/EBiTDamultiple of less than 8x, we see strong upside potential as the share price adjusts to better reflect the true value of its high-quality infrastructure assets.
§ Link proceeded with an iPO of PEXa, which provides a true look-through value for Link’s stake in PEXa. PEXa began tradingon the aSX in early July, and currently has a market cap of ~$3.1b, well above the implied non-binding offer level of ~$1.9b fromPacific Equity Partners and Carlyle and also well above prevailing broker valuations.
§ Tabcorp released the outcome of their strategic review noting the demerger of the wagering and media business as thepreferred path. We believe this demerger will unlock significant value for shareholders as it will both catalyse interest in thewagering business and enable a re-rating for the lotteries business, which we think is well-deserved given its high-quality,infrastructure-like characteristics.
Quarterly Report | JUNE 2021 | L1 Capital Long Short Fund – Daily Class 6
L1 Capital Long Short FundQuarterly Report | JUNE 2021
DaiLy CLaSS

InflationSince the start of the year, we have been flagging our expectation of rising inflation. Our research and extensive company meetings suggested that input cost pressures were building rapidly and were likely to convert into rising consumer prices towards the end of 2021. Based on this outlook, we hedged against the risk that inflation may overshoot relative to consensus and central bank expectations by increasing our portfolio exposure to energy, gold and financial stocks and by shorting some ultra-high P/E growth stocks that should de-rate if inflation persists.
Subsequently, the U.S. CPi data for april validated our concerns with a spike in U.S. CPi to 4.2%, considerably above consensus expectations of 3.6%. The May print of 5.0% was also well ahead of expectations and was the fastest year-on-year increase in nearly 13 years.
Over the quarter, we supplemented our research on inflation with numerous discussions with aSX listed executives as well as more than 40 consumer-focused calls with offshore corporates across multiple industries. The overarching theme that has emerged is that most companies are not just seeing pockets of inflationary spikes, but broad-based increases across several key inputs including labour costs, energy costs, raw materials and logistics. The majority of these businesses are planning to pass on these input cost pressures by raising prices (or cutting discounts), rather than absorbing the impacts and suffering reduced margins.
The quotes below are just a few examples of some of the largest industrial companies in the world flagging large and unexpected cost pressures that will translate into price rises over the coming year:
“We are seeing very substantial inflation. We are raising prices. People are raising prices to us, and it’s being accepted.” Berkshire Hathaway Chair & CEO – Warren Buffet
“We are well-hedged in ’21, but there’s pressure built up for ’22, and so there will have to be some price increases.” Coca Cola CEO – James Quincey
“Most people haven’t had a 40-plus year career, and they’ve only seen declining inflation over the last 30-plus years. So this is going to be a pretty big shock.” Blackstone CEO – Larry Fink
“Obviously, we’re facing an environment where we just see cost inflation. I don’t think that cost inflation will go away overnight. We saw a need to come up with price increases and... implemented price increases in the range of 5% to 12%.” Whirlpool CEO – Marc Bitzer
“We are very concerned – concerned but acting to mitigate the possibility of increasing prices through efficiencies. There’s big cost spikes going on.” Kraft Heinz CEO – Miguel Patricio
The key debate in financial markets at the moment is whether the current inflation spike is transitory or more persistent. The consensus view from central banks and economists is that the impact is transitory, with the “base effect” being the largest contributor to recent inflation spikes and a normalisation in this trend, as well as a correction in supply/demand imbalances, expected to temper forward looking estimates.
The “base effect” impact is driven by the comparative increase relative to the prior period. as illustrated in Figure 9, the april and May 2021 periods had extensive “base impacts”, having been referenced against 2020 which was most impacted by COViD-19 and global lockdowns. As the comparative period normalises, we expect to see lower CPi prints over the next few months. However, this factor should not be regarded as a signal that inflation risks have abated as it is purely the mathematical impact of rolling through the trough of the pandemic impact in the prior period.
Figure 9 – Headline Consumer Price Index, 2020 vs 2021
0%
1%
2%
3%
4%
5%
6%
20212020
MarMay Jul
Sep
NovDec
Jan Ap JunAug
OctFeb
2020 April-May CPI lower due to lockdowns
2021 April-May CPI higher in part
due to “base effect”
Lower “base effect” impacts going forward
1
2
3
Source: U.S. Bureau of Labor Statistics
Quarterly Report | JUNE 2021 | L1 Capital Long Short Fund – Daily Class 7
L1 Capital Long Short FundQuarterly Report | JUNE 2021
DaiLy CLaSS

From our analysis of looking through 100 years of inflation data, significant increases in inflation are typically driven by (at least one) of three main factors:
1. Wage pressure,
2. Rising energy prices, and
3. High capacity utilisation.
in each of these components, while many factors appear to be driving transitory price pressures, we do see some risk that the impacts may become more persistent.
1. Wage pressureSince the 1980s, the decline in union power, enhanced labour mobility and offshoring have all acted as deflationary forces helping to contain hourly wage growth to 1-4% p.a. in the U.S.. However, in 2021 we have seen an increase in average hourly earnings above this long-run average. Our view is that this is largely job mix related (in the crisis, the lowest paid jobs were lost, e.g. hospitality and tourism, while higher paid sectors, such as technology and professional services, hired). As we move into 2022, we expect the labour market to continue tightening and the risk of broader wage pressure to rise given high CPi rates (that act as a reference for negotiations) and the balance of power shifting to the employee in a tightening labour market.
Figure 10 – U.S. average private hourly earnings and inflation
(YoY
%)
19661971
19761981
19861991
19962001
20062011
20162021
Average private hourly earnings Inflation rateRecession indicator
-4
-2
0
2
4
8
12
16
6
10
14
1973-75 Oil Crisis and Stagflation
Early 1980s Double-Dip Recession
Early 1990sRecession
2002Dot.com Bust
2008-09Global Financial
Crisis
2020-?COVID-19Pandemic
1960-70sProductivity and Growth
1980sDecline in Union Power
1990-2020sAutomation and moderation of growth
Source: NBER, Bloomberg, RSM U.S.
Quarterly Report | JUNE 2021 | L1 Capital Long Short Fund – Daily Class 8
L1 Capital Long Short FundQuarterly Report | JUNE 2021
DaiLy CLaSS

2. Increasing energy pricesat the height of the pandemic, and as the world ground to a halt, the Brent oil price hit an 18 year low of ~US$20/bbl. However, with the subsequent rapid economic recovery combined with supply-side discipline from OPEC+ and other large oil companies, the oil price has more than tripled from this low point and is now well above pre-COViD-19 levels of ~US$60/bbl. We believe prices could remain elevated as oil majors and national oil companies continue to restrict capex spending while demand should continue to recover strongly as the vaccine rollout progresses. The impact of higher energy prices comes through to CPi with a lag that should manifest over the coming year.
Figure 11 – Crude oil futures prices since 2014
0
20
40
60
80
100
120
Brent
Barr
el ($
)
West Texas Intermediate
20212014
20162020
20182019
20152015
2017
Pandemic hits energy consumption
Rising U.S. output triggers
price slump
Source: IRESS
3. High capacity utilisationThe May iSM Purchasing Managers index (PMi) survey, a key indicator of business conditions, highlights the extreme capacity tightness across U.S. supply chains. Manufacturers reported that their customers’ inventory levels were at the lowest levels on record and their order backlogs were at the highest levels ever recorded by the survey. This tightness has translated into the highest Manufacturing Price index reading since 2008. Whilst supply constraints could ease in the coming months, the level of backlog may take longer to clear than expected, with continued tightness likely to lead to further consumer price increases.
Figure 12 – ISM PMI Survey selected statistics
0
10
20
30
40
50
60
70
80
0
10
20
30
40
50
60
70
80
Customers’ Inventories Index Backlog of Orders Index
May 2017
May 2019
May 2021
May 2018
May 2020
May 2017
May 2019
May 2021
May 2018
May 2020
Source: ISM PMI Survey, Institute for Supply Management
Quarterly Report | JUNE 2021 | L1 Capital Long Short Fund – Daily Class 9
L1 Capital Long Short FundQuarterly Report | JUNE 2021
DaiLy CLaSS

in addition to the above factors, we expect demand to remain strong in the near term, primarily driven by household consumption. Consumers are more cashed up than ever with personal savings rates at record highs which, together with government stimulus cheques, has led to a dramatic increase in cumulative savings (Figure 13 below). The double-digit surge in house prices in many developed markets over the past twelve months, including australia and the U.S., has also led to an enormous wealth effect that has been constrained into spending primarily on goods. Consumers will soon be able to broaden their spending to services, such as travel and entertainment, as the vaccine rollout broadens and enables Governments to reduce their restrictions.
Figure 13 – “Excess” personal savings over pre-COVID-19 level
Based on Jan 2020 Savings Rate (7.6%) and Total Excess Savings (US$b)
$0
$200
$400
$600
$800
$1,000
$1,200
$1,200
$1,400
$1,600
$1,800
$2,000
$0
$200
$400
$600
$800
$1,000
$1,200
$1,200
$1,400
$1,600
$1,800
$2,000
Jan 19
Sep 19
May 19
Jan 20
May 20
Sep 20
Jan 21
Personal Saving (Pre-COVID Level)Personal Saving Exceeding Pre-COVID Level
$1,806
Cumulative Excess Savings
Source: U.S. Department of Commerce and Wells Fargo Securities
in summary, our research indicates there are elevated risks that the current spike in inflation may be more persistent than the consensus view. We have had 30 years of benign inflation and falling interest rates which have catapulted the valuation of bonds, growth stocks and U.S. equities. if this trend were to reverse, we would expect to see very broad implications for asset and sector performance. We believe the areas of the market that are less crowded, such as gold, commodities and short duration, low P/E stocks, offer the best hedge against potential inflationary pressure. Given nothing is currently priced into equities for this potential scenario, we have positioned some of our portfolio to benefit from this “free option”. Figure 14 below shows those sectors that performed best (and worst) during the high inflation period from 1973-1983.
Figure 14 – Asset price inflation and “real economy” inflation
Total return performance in local currency from 1973-1983
Gold
EM Equity
Mark
et
German
Bond
Commodity
World Valu
eUS I
G
World Growth
Japan
Bond
Europe Equity
Mark
et
World Eq
uity M
arket
US Bond
Nasdaq
Japan
Equity
Mark
et
U.S. Eq
uity M
arket
0
200%
100%
300%
400%
500%
600%
700%
Source: Datastream, STOXX, Haver Analytics, FRED, Goldman Sachs Global Investment Research
Quarterly Report | JUNE 2021 | L1 Capital Long Short Fund – Daily Class 10
L1 Capital Long Short FundQuarterly Report | JUNE 2021
DaiLy CLaSS
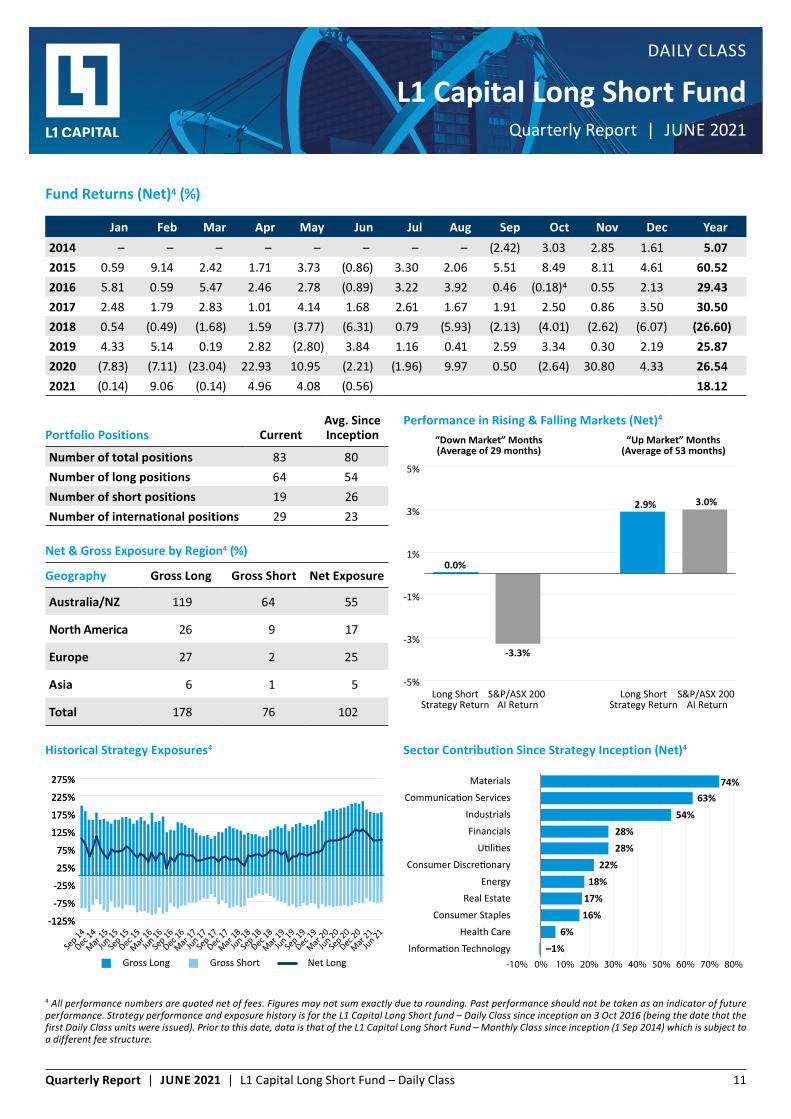
Fund Returns (Net)4 (%)
Jan Feb Mar Apr May Jun Jul Aug Sep Oct Nov Dec Year2014 – – – – – – – – (2.42) 3.03 2.85 1.61 5.072015 0.59 9.14 2.42 1.71 3.73 (0.86) 3.30 2.06 5.51 8.49 8.11 4.61 60.522016 5.81 0.59 5.47 2.46 2.78 (0.89) 3.22 3.92 0.46 (0.18)4 0.55 2.13 29.432017 2.48 1.79 2.83 1.01 4.14 1.68 2.61 1.67 1.91 2.50 0.86 3.50 30.502018 0.54 (0.49) (1.68) 1.59 (3.77) (6.31) 0.79 (5.93) (2.13) (4.01) (2.62) (6.07) (26.60)2019 4.33 5.14 0.19 2.82 (2.80) 3.84 1.16 0.41 2.59 3.34 0.30 2.19 25.872020 (7.83) (7.11) (23.04) 22.93 10.95 (2.21) (1.96) 9.97 0.50 (2.64) 30.80 4.33 26.542021 (0.14) 9.06 (0.14) 4.96 4.08 (0.56) 18.12
4 All performance numbers are quoted net of fees. Figures may not sum exactly due to rounding. Past performance should not be taken as an indicator of future performance. Strategy performance and exposure history is for the L1 Capital Long Short fund – Daily Class since inception on 3 Oct 2016 (being the date that the first Daily Class units were issued). Prior to this date, data is that of the L1 Capital Long Short Fund – Monthly Class since inception (1 Sep 2014) which is subject to a different fee structure.
Portfolio Positions CurrentAvg. Since Inception
Number of total positions 83 80Number of long positions 64 54Number of short positions 19 26Number of international positions 29 23
Performance in Rising & Falling Markets (Net)4
-5%
-3%
-1%
1%
3%
5%
Long ShortStrategy Return
“Down Market” Months(Average of 29 months)
“Up Market” Months(Average of 53 months)
S&P/ASX 200 AI Return
Long ShortStrategy Return
S&P/ASX 200 AI Return
0.0%
-3.3%
2.9% 3.0%
Net & Gross Exposure by Region4 (%)
Geography Gross Long Gross Short Net Exposure
Australia/NZ 119 64 55
North America 26 9 17
Europe 27 2 25
Asia 6 1 5
Total 178 76 102
Historical Strategy Exposures4
-125%
-75%
-25%
25%
75%
125%
175%
225%
275%
-125%
-75%
-25%
25%
75%
125%
175%
225%
275%
Sep 14
Mar 15
Sep 15
Sep 16
Mar 18
Sep 19
Dec 14
Jun 15
Dec 15
Jun 17
Dec 18
Jun 20
Dec 16
Jun 18
Dec 19
Mar 16
Sep 17
Mar 19
Mar 17
Sep 18
Mar 20
Jun 16
Dec 17
Jun 19Jun 21
Mar 21
Dec 20
Sep 20
Net LongGross ShortGross Long
Sector Contribution Since Strategy Inception (Net)4
-10% 0% 10% 20% 30% 40% 50% 60% 70% 80%
–1%6%
16%17%18%
22%28%28%
54%63%
74%MaterialsCommunication Services
IndustrialsFinancials
Utilities
Real Estate
Consumer DiscretionaryEnergy
Consumer StaplesHealth Care
Information Technology
Quarterly Report | JUNE 2021 | L1 Capital Long Short Fund – Daily Class 11
L1 Capital Long Short FundQuarterly Report | JUNE 2021
DaiLy CLaSS

L1 Capital OverviewL1 Capital is a global investment manager with offices in Melbourne, Sydney, Miami and London. The business was established in 2007 and is 100% owned by its senior staff, led by founders Raphael Lamm and Mark Landau. The team is committed to offering clients best of breed investment products through strategies that include long only Australian equities, long short equities, international equities, activist equities, a global multi-strategy hedge fund and U.K. residential property. The firm has built a reputation for investment excellence, with all L1 Capital’s strategies delivering strong returns since inception versus both benchmarks and peers. The team remains dedicated to delivering on that strong reputation through providing market-leading performance via differentiated investment approaches with outstanding client service, transparency and integrity. L1 Capital’s clients include large superannuation funds, pension funds, asset consultants, financial planning groups, family offices, high net worth individuals and retail investors.
Level 28, 101 Collins Street Melbourne ViC 3000 australia
www.L1.com.au
Fund Information – Daily Class
Class Name L1 Capital Long Short Fund Daily ClassStructure/Currency australian Unit Trust/aUDInception 1 September 2014Management Fee 1.54% p.a. inclusive of GST and RiTCPerformance Fee 20.50% inclusive of GST and RiTC5
High Watermark yesBuy/Sell Spread 25bps/25bpsAPIR/ISIN ETL0490AU/AU60ETL04909Minimum Investment a$25,000Subscription/Redemption Frequency Daily
Platform Availability
asgard, BT Wrap, CFS FirstWrap, HUB24, iOOF, Mason Stevens, MLC, Macquarie Manager/Consolidator,
Netwealth, North, Powerwrap, uXchange
Service Providers
Responsible Entity Equity Trustees LimitedPrime Brokers Morgan Stanley, Credit SuisseFund Administrator Mainstream Fund ServicesFund Auditor EyLegal Advisor Hall & Wilcox
5 The performance fee is equal to the stated percentage (inclusive of GST and net of RiTC) of any increase in the NaV over any Performance Period (adjusted for applications and redemptions and before the payment of any distribution after the payment of the management fee and expenses) above the high-water mark.
all performance numbers are quoted net of fees. all performance prior to 3 Oct 2016 (being the date that the first Daily Class units were issued) relate to the Monthly Class units which are subject to a different fee structure. Sources of information in this report are Mainstream Fund Services, Bloomberg and L1 Capital.
Information contained in this publicationEquity Trustees Limited (“Equity Trustees”) (aBN 46 004 031 298), aFSL 240975, is the Responsible Entity for the L1 Capital Long Short Fund. Equity Trustees is a subsidiary of EQT Holdings Limited (aBN 22 607 797 615), a publicly listed company on the australian Securities Exchange (aSX: EQT).
This publication has been prepared by L1 Capital Pty Ltd (aCN 125 378 145, aFSL 314 302), to provide you with general information only. in preparing it, we did not take into account the investment objectives, financial situation or particular needs of any particular person. it is not intended to take the place of professional advice and you should not take action on specific issues in reliance on this information. Neither L1 Capital Pty Ltd, Equity Trustees nor any of its related parties, their employees or directors, provide any warranty of accuracy or reliability in relation to such information or accepts any liability to any person who relies on it. you should obtain a copy of the Product Disclosure Statement before making a decision about whether to invest in this product.
CopyrightCopyright in this publication is owned by L1 Capital. you may use this information in this publication for your own personal use, but you must not (without L1 Capital’s consent) alter, reproduce or distribute any part of this publication, transmit it to any other person or incorporate the information into any other document.
Quarterly Report | JUNE 2021 | L1 Capital Long Short Fund – Daily Class 12
L1 Capital Long Short FundQuarterly Report | JUNE 2021
DaiLy CLaSS