daily production optimization - center for integrated ... · daily production optimization ......
TRANSCRIPT

Daily production optimization White paper
The purpose of this white paper is to summarize the IO Center’s experience, findings and knowl-edge on daily production optimization that are of relevance for the upstream industry in gen-eral and the IO Center partners in particular. Even though the challenges might vary from asset to asset, there are many common features regarding how the work is conducted, the type of decisions that are made, and the challenges faced. This has motivated us to write a white pa-per on the subject.
Note that this paper is not intended as a guide-line on how to set up a production optimization team or which software tools to choose. Based
Figure 1: Heidrun Statoil - Harald Pettersen
on our experience it will instead give an over-view of our understanding, examples of good practice, tips that should be considered, pitfalls that should not be overlooked and dilemmas that might appear. The white paper first gives an overview of IO in production optimization before it outlines the main approaches and re-sults from the IO center research on this topic.
The paper seeks to summarize findings and concepts from our research for an audience of readers with general knowledge within engi-neering disciplines or petroleum production more generally.
Center for IntegratedOperations in the PetroleumIndustry

DefinitionIntegrated Operations (IO) is the integration of people, work pro-cesses, and technology to make smarter decisions and achieve better execution. It is enabled by the use of real time data, col-laborative techniques, and exper-tise across disciplines, organiza-tions, and geographical locations.
Figure 3: The concept of Integrated Operations (Marintek)
Integrated operationsProduction optimization has been subject to heavy digitalization through the last decade. The day to day work of improving produc-tion by pushing towards the bottlenecks of the reservoir and production system is an im-portant task at almost every production asset around the world. Down-hole instrumenta-tion, multiphase meters and other sensors are becoming more common, and generate vast amounts of data. This, in combination with improved control options, allows for much more sophisticated management of wells than before.
Another development over the last decades is that onshore engineers have access to all rel-evant data, allowing more and more people to be moved off the platform and into centers onshore. In the domain of production opti-mization we see the establishment of dedi-cated production optimization teams onshore that monitor and follow up on production of individual wells and the integrated system on a day to day basis.
Fiber optic cables enable robust and uncon-strained transfer of data to any location in the world. Further, video conferencing lets opera-tors draw on competence and resources with-out worrying about where it is located. Prob-lems are now solved by virtual teams, where hands-on operators are located offshore and the production engineer is located at the on-shore production center. When irregular or
Figure 2: Example of a virtual team consisting of an operator, production engineer and flow assurance expert, solving a problem together, while being at different locations (Heidrun is operated by Statoil).
Prod. Eng.Stjørdal
Flow assurance expertStavanger
OperatorHeidrun
Real Time Data
Collaborative Technologies
Multi Disciplines
Geographically Dispersed
Across Organizations

complex challenges occur an expert might easily be called up and included in the team, ref Figure 2. By utilizing the vast amounts of data in computer assisted decision support systems, one is able to take faster decisions, often with higher quality.
The integration of people across distance, in combination with more and better data used in smarter ways, is perhaps the most impor-tant enabler for the industry to continuously improve production and safety. This way of working has several benefits, first, there are large cost savings related to every person that is removed from an offshore production fa-cility, both in reduced investments, but also in operational cost. Most of the personnel are relocated onshore, however new ICT tools
Interaction between people
Offshore asset
Data/measurements
ReservoirWells andpipelines
Process utilities
Pipelines/tankersMarket
Information input from people
Smartphone and tablet applications
Advanced mathematical optimization
Onshore engineer team
Offshore control room
Supporting expert/Manager in meeting
Simulators, data processing and models
Figure 4: Platform, ICT and People involved in a complex production optimization decision
and the “IO way of working”, also allows for people to supervise and control a larger part of an asset, and hence enables the asset to shrink its organization.
Still, the biggest advantage lies in improved production and recovery. In the production optimization domain, new types and in-creased availability of sensor data, combined with increased remote control options, allows for more ambitious optimization strategies, e.g. on shorter time scales and encompass-ing larger systems. Figure 3 contains an il-lustration, and the definition of Integrated Operations that is used by the IO Center, while Figure 4 illustrates the complexity of the hardware, data, software tools and people involved.

OffshoreWell operators
Offshore production asset
Onshore Production engineers
Production measurements
Model based automation
On traditional assets, the decisions are made and implemented offshore, with supervision from onshore. However, many new fields are developed with onshore control rooms, and with that decisions are “moved” onshore. There are safety and union related issues that make this transformation challenging, even though it is technologically feasible. Figure 5 illustrates a typical workflow of a virtual team in its day to day search for the best way of op-erating a field.
In most cases, it is the constantly changing operational conditions, not the changing reservoir conditions, which demand daily re-optimization of the production strategy. In such a case, the production engineers typically start the day by looking at the wells’ production history over the last week, and in
DilemmasOn most assets marginal improvements in production represents large economic gains. Hence, adding one person to the production optimization team will (al-most) always result in a positive expected NPV. If this new person, by putting more brain power into the prob-lem, could improve the production with only 0.1%, he or she would probably justify the salary spending in less than a month.
Figure 5: Production optimization workflow
WorkflowDependent on how fast reservoir and op-erational conditions change at an asset, a typical “work process loop” is repeated any-where from every day to every week. The vast amounts of data have made it possible to con-trol wells in much more sophisticated ways. Better decision support systems and work processes also make it meaningful to re-opti-mize more frequently than before to improve production further. Where one earlier would
stick to quite static strategies and constraints, the optimization group onshore can now reg-ulate and monitor each well closely.
In day to day operations, it is typically one to three operators, and maybe the chief of production that are involved in the decisions made offshore. Onshore, there might be a team of one to five production engineers that monitor and support the operators.
Adding two more people would probably increase the production even further, and so on. The same also applies to maintenance, drilling, logistics, etc.
The dilemma is that this will fast grow into large and non-manageable organizations. And note, it is only the expected NPV that is positive.

PitfallOffshore operators have a very busy schedule. While the production engineer dedicates his entire day to improve production, is this usually a small part of the operators work load. Overloaded with urgent problems to solve,
particular the last 24 hours, with the goal of spotting changes in the well performances. By experience, intuition, limitations set by the process and reservoir engineers, simulation and/or mathematical optimization, he or she will, possibly together with colleagues, decide on a preferred production strategy.
The production engineer will then communi-cate and discuss the strategy with the offshore operator, which if he or she agrees, imple-ments the decision. The transfer of informa-tion is typically communicated through sev-eral channels throughout the day, and there are many examples of operators also being involved in the search for the best production strategy. If the ICT infrastructure is in place, it is common to have video meetings between onshore and offshore for in-depth discussions as part of the workflow loop.
The production engineers’ and operators’ activities on production optimization need coordination with many of the asset’s depart-ments. The frequency of interaction varies, and is highly asset dependent. However, the most important surface is towards the reser-voir engineer. In cases where dedicated pro-cess engineers are responsible for the topside process facilities, this is another important contact surface. Further, production must be coordinated with maintenance, logistics and with possible infield drilling programs.
the operator might not prioritize meetings with production engineers, as problems with shorter deadlines are standing in the way.
Example - A Day at Work07:00 The Production engineer starts the day
by looking through production trends for the wells and prepares for well meeting
09:30 Video meeting between offshore and onshore, to coordinate today’s activities (includes platform management, logistics, drilling, maintenance, HSE, etc.)
09:45 Meeting between production and res-ervoir engineers to discuss well perfor-mance and long-term draining strategies
10:15 Video meeting between production engi-neer and operator to discuss production strategy
11:00 Lunch
11:45 Evaluate and adjust production strategy through simulation, what-if studies and model based automation, and continu-ously collaborate with offshore operator through chat, phone and common work surface
15:00 End of onshore workday. Offshore opera-tors execute scheduled tasks throughout the evening/night.

DecisionsTime horizonTo develop and produce an oil field, decisions at multiple layers as illustrated in Figure 6, are taken with varying frequencies, and for dif-ferent time horizons. While the strategic deci-sions made at the top are guidelines for sev-eral years, the closed loop control decisions at the bottom layer are re-computed maybe eve-ry second. In this context we could allocate the decisions of the production engineer to
Strategic
Tactical
Scheduling
Operational
Real-time optimization (RTO)
Model predictive control (MPC)/ Advanced process control (APC)
Control (PID)
the three middle layers, i.e. the schedule, op-erational and RTO layer, where the focus will vary from asset to asset and also over time.
However, emptying an oil and gas reservoir is essentially a batch process, which means that the conditions for the optimization decisions are transient. Furthermore, there are two main types of dynamics with very different
Figure 7: Aker Barents drilling rig in Barents SeaPhoto Harald Pettersen - Statoil
Figure 6: Planning hierarchy

time constants that we are dealing with. The reservoir dynamics are slow varying, with minimal changes over a week, an in many cases also over several months. On the other hand, the production network dynamics typi-cally stabilize in a few hours, an often in less than an hour.
Therefore, while reservoir engineers focus on reservoir dynamics, the production engineers consider the reservoir as fixed. This is due to the very different time frame or horizon of their decisions. The reservoir engineers are searching for optimal draining strategies, and hence consider the life time of the field. The production engineers on the other hand, focus on the daily operations, and on most assets their decision horizon is one week or shorter.
An illustration of how the focus changes from detailed reservoir modeling to detailed pro-duction network modeling, when the plan-ning horizon becomes shorter, is found in fig-
ure 8. Note that the green part represents the slow dynamics, while the blue part represents the fast dynamics.
Further, since planning is done for one day and up to one week, it is fair to consider the production network dynamics as steady-state. This means that; being sub-optimal for an hour while the system moves from one op-erational condition to another, is acceptable.
Even though software tools for dynamic pro-duction networks and topside process simu-lations are used for e.g. look-ahead purposes, it is common to view the reservoir as fixed, and the production network as steady-state. The production engineer can then simplify the day to day production optimization prob-lem into a problem that does not consider changes with time. In other words, he or she is looking for the amount of gas lift allocation to a particular well, but not how this changes over time.
State of the art simulationNew dynamic pipeline and process simulators are becoming better and faster, and are now running ten to several hundred times faster than real-time. This enables look-ahead function-ality, e.g. it can give you an alarm before the process moves into a hydrate forming condition.
Long planning horizonShort planning horizon
High complexity onreservoir modeling
Detailed production network modeling
Figure 8: Complexity of reservoir and production network modeling

Types of decisionsThe most important decisions in daily pro-duction optimization are related to the wells, and how they can be operated to utilize the production and process system to its full ca-pacity. In other words, it is not only a matter of optimizing the production from each well individually. Since the optimization is con-strained by the capacity and technical layout of the production system, and the considera-tions of how to produce the reservoir opti-mally, it is important to look at the problem as a whole. Increased instrumentation and onshore support makes it possible to devel-op a more fundamental understanding and experience of the production system. This facilitates control in a more advanced man-ner, both in terms of more detailed control of
Other production optimization decisionsOther decisions that could be part of the production engineer’s task list; • Settings on subsea and topside process equipment• Down hole well branch control• Meg injection
Note that the control of the process equipment is often the respon-sibility of offshore personnel, and changes to the branch valves are made with a low frequency.
single wells but also in the sense of integrated optimization of larger parts of the system.
A well’s production can be reduced by chok-ing it back, or it can be increased by add-ing lift gas or by using other artificial lifting technologies such as Electrical Submersible Pumps (ESP), etc. In addition, increasing numbers of offshore production systems con-tain subsea wells connected to subsea mani-folds, where the wells can be routed to one of several production lines. Subsea well routing is therefore also a common part of the prob-lem. Further, there can be more than one sep-arator train, and wells and production lines will need to be routed among them.

Figure 9: Carbon storage at Sleipner Photo Alligator film - Statoil

Target
Optimization
Simulation
Sensor data
Production system
AutomationDecision pyramidWith increased instrumentation, sophisti-cated optimization analyses and decisions can be made. However, these problems are too complex to be tackled by the human mind alone. Motivated by the complexity of the production optimization problems, and the advances made in hardware and software performance, we will now dig into the domain of computer based deci-sion support and automation, to highlight the vast opportunities that might present themselves.
To put automation into context, let’s break the decision on how to search for the best way to operate the wells, into four layers and place them into a “decision pyramid”, ref. Figure 10.
On top is the goal or target and the deci-sion space for how you are allowed to oper-ate the production system. At the bottom you have the actual production system where the decision should be implement-
Figure 10: Decision pyramid
Pitfall There are many examples of software applications for closed loop control or computer based decision sup-port that works very well on the day of deployment. But, there are also many examples of these systems rapidly declining in performance (e.g. as sensors de-teriorate or the production system changes).
Experience from companies in the forefront of IO implementation shows that, in the same way as phys-ical systems need maintenance to be sustained, so do software systems. Looking at the decision pyramid in figure 10, in the same way that a simulator should be treated as an asset and maintained, so should the optimizer.

ed. When considering and evaluating a pro-duction strategy, you need to have an idea of how your production system would respond. Going 20 years back in time, this was the task of an experienced production engineer. It still is, however more and more assets have pro-duction network simulators that are essen-tially “automating” the prediction of system behavior.
Given that the simulator predicts the produc-tion system’s response to a certain production strategy, a what-if study could be conducted on top of the simulator to search for the best strategy. This task is still conducted manually by the production engineer on most assets. However, based on the latest research results, state of the art software tools, and dedicated
engineers, we see potential of also automating the optimization layer of the decision pyra-mid. Simulation based optimization software packages like this are available today. But the softwares are often only able to handle small production systems, or only limited parts of the total system, that is facing the production engineer.
Automating the third layer and providing automatic generation of production recom-mendations, enables the engineers to focus even more on the top layer, and spend their time on questions like; what is the preferred operational envelope for each well, or is the inflow performance ratio predicting the well behavior accurately for the recommended (optimal) production strategy, etc.
Figure 11: Vigdis Statoil

From data to models and simulationWhile discussing automation of the process of making production decisions, keep in mind that the technical bases for expanded use of computers for decision support are not only the developments in ICT. The back bone is the increased use of sensors and the pos-sibility of applying remote control, combined with new modeling, simulation and optimi-zation technologies.
The industry is getting digitalized in a rapid pace, and the volume of data is increasing. However, the full potential of the new data and remote control possibilities will only be realized for companies that are able to be in-novative in the ways data are put to use. An important value of increased use of sensors lies in the potential of combining and aggre-gating data in new ways, thus highlighting
and controlling phenomena that are not possible to inspect directly by single sen-sors.
Models are pivotal in such integration, and thus for achieving the goals of IO in the production domain. Figure 12 is a sche-matic presentation of how data is trans-formed into models.
Single data points are seldom very useful in themselves. Rather it is when they are seen in combination that they yield infor-mation. Raw data points are rarely used directly, and some level of aggregation is always there, often programmed into the sensor software. Lightly processed data are often interpreted by the production engi-neer directly, but for more complex assess-ments they are included in models or sys-tematic aggregation.
A model is a way of combining raw data to a theoretically structured understand-
Figure 12: From data to models
A philosophical point- Divide and conquer Most subsurface phenomena are hard to study di-rectly. The information we have about them are data from sensors that measure specific phenomena like temperatures and pressures.
The data divides the subsurface phenomena into inde-pendent fragments. The understanding of them rests on the ability to combine them, either by interpreta-tion or by models.
Data combinations Temporal – Same measurement taken over time to e.g. see trends.
Spatial – Same measurement taken at different places to make inference of the volumes in between.
Aspectual – Measurements of different properties are combined to make inferences.

ing. It is informed by theory and former experience in addition to the data it rep-resents. Though a well model is based on data and samples from testing the well, and its production history, it is also heav-ily influenced by theory on flow in porous media, multiphase flow in pipelines, and on experiences from similar fields. Since it is structured and symbolic, a model can be an infrastructure for mathematical simulations.
With vast amounts of data available, hu-man interpretation is not enough to make sense of them. More structured efforts like modeling are necessary. They can make human interpretation and decisions easier, and even support interpretation of phenomena that are too complex for hu-mans to interpret. The most advanced stage is autonomous model based control, where a system is programmed to make decisions based on modeling and simula-tions. An intermediate variant of this is decision support by forecasting and rec-ommendations that are evaluated by hu-mans.
The fact that models are used to aggregate and combine data in ever more efficient ways, does not make human work super-fluous. Rather it means that humans are given better tools by which to understand the physical systems (see box on previous page) they are analyzing.
Important human work1. QC of sensor data, adjustment of displays and instrumentation2. Analysis of aggregated data, choice of sensor data to combine and visu- alize.3. Model building, simulation setup and constraints, validation of model results versus non-included data.4. Supervise and monitor state and ac- tions of automated systems.5.
Deciding degree of model support for decisionsThough it might be tempting, all decisions cannot or should not be based on modeling or model based automation.
Here are some characteristics to look at when evalu-ating how suited a decision is for closed loop meth-ods:1. Is the decision easily defined mathemati- cally?2. Is the decision standardized or is it unique every time?3. How much of the relevant information can be included in the model or simulation?4. How is data/information/knowledge that is not included in the model to be handled in the decision workflow?5. What does the organization require in terms of documentation of the decision process and accountability?
Innovation – new sensors, new ways of combining data, new algorithms for combination, and new model ar-rangements.

“Closed loop”Due to great developments in data quality, types and volumes, processing capacities and the possibility to do adjustments to the pro-duction system more extensively through smart wells and completion, the concept of “closed loop” production optimization rises.
IO in production optimization is often seen in the widespread use of collaboration rooms and of data sharing over distances, e.g. the use of expert centers to support decisions dur-ing operations. In the IO center, however, the main thrust of research has been on model
Figure 13: Partly automated decision
Closed loop production optimization
More control options
More real time data
Better simulation
Figure 14: Automation enablers
Decision
Human evaluation
Reservoir and production system model 1) Input parameters
2) Feedback data
3) Other information
Reservoir and production system
Automatic Closed loop system
Decision constraints
Theory
Experience

based optimization. An increased amount and new types of data, improved hard-ware, software and modeling techniques as well as the possibility to make more de-tailed and sophisticated interventions in the reservoir (e.g. multilateral wells, geo-steering etc) are all important enablers for this. With more data and higher updating frequencies, models can be updated and tuned more precisely to improve the ba-sis for both advanced visualizations and simulations. More wells have down-hole instrumentation, remote control is more widespread, drilling is more accurate and flexible and can offer a wider variety of well designs.
The new model supported philosophies in the production domain are often called “closed loop production optimization”. Closed Loop Production Optimization is inspired by control theory. It is based on the principle that real time data are fed back into a model and that the control set-tings are adjusted based on model fore-casts. A simulation model can for example forecast how different choke settings and gas lift rates on producers will influence total production, identify and implement optimal settings, and adjust the model and settings according to the resulting produc-tion data.
“Closed loop” could be interpreted to im-ply that production decisions could be au-tomated and controlled by a closed loop regulator. Most researchers in the field to-day, however, leave room for some human intervention in the control loop, illustrated in figure 13.
Well and production network modelsTo keep a “closed loop” production optimiza-tion system running, we need models of how the system changes with space and time. I.e. we need to know how the well rate changes when we change the choke opening or gas lift rate, but we need also to know how the well rate changes as time goes along.
Current operational conditions
Value on state A
Value onstate B
Time
Trajectory 1
Trajectory 2
Uncertainty and changeMany production data types are indirect meas-urements and imply an element of estimation (either by algorithms or human estimation). They often carry substantial uncertainty, and this is particularly the case when sensors de-grade or are damaged, or when the production system itself changes. Thus even the estimation of how much of the production volume comes from different wells, demands some interpreta-tion. Automated systems must be monitored for such changes.
Figure 15: The system changes with space and time

Mathematical optimization When optimizing, it is necessary to define a goal, or objective as it is often called. In other words, decide what you want to maximize or minimize. Further, you need to define the boundaries for how you are allowed to oper-ate the wells and production system, i.e. the systems constraints.
The most common objective in daily produc-tion optimization is to maximize the through-put of oil. Oil is more valuable and easier to transport than gas, and hence makes it a nat-ural choice. However, during e.g. the plateau
Mathematical optimizationAlthough the term optimization is used (and mis-used) on almost everything that has anything to do with production improvement, optimization is acutely well-defined in a mathematical sense.
Our definitionAn optimization problem consist of maximizing or minimizing an objective function, while at the same time satisfying a set of equations i.e. con-straints (both equalities and inequalities), and up-per and lower bounds on the decision variables.
production period, it might be trivial to meet the production target, which is linked to e.g. the platform’s oil export capacity. A situation like this does not mean that pro-duction optimization is of no value, how-ever the scope changes. Instead of maxi-mizing oil production, you might want to minimize water production or fluid ve-locities, while maintaining the oil target. In other words, making the oil production a “constraint”, instead of an objective.
As the field is produced, the reservoir pres-sure might fall, and water cut and gas to oil ratio increases. At some point it starts to become non-trivial to meet the oil produc-tion target due to other system constraints, such as total water or gas handling capacity. The oil production rate changes from being a constraint, to becoming the objective.
For a period, the system might only be constrained by total gas production, before the water rate also hits the asset’s process capacity. The challenges then are to find the right choke settings and well routing, so that as much oil as possible can be pro-duced given this gas and water handling capacity.
Figure 16 Gullfaks B - Photo Ole Jørgen Bratland - Statoil

As time goes on, water cut increases and/or reservoir pressure declines, and some wells might not be able to meet target rates even with fully open chokes. When this occurs (which might be the case from the beginning at many fields), artificial lift technology becomes relevant. A common and robust technology is to inject gas for gas lift into the lower part of the produc-tion tubing. The available gas lift capacity is often limited, and needs to be distrib-uted among the wells, making it one of the bottlenecks. In addition, if a subsea well is producing with a fully open choke, its production will be affected by changes to other wells producing to the same pipeline. Hence increasing the production from one well, might reduce the production from another, making the search for the optimal production settings even more complex, since pressure drop through the produc-tion system needs to be considered.
Other challengesOther asset specific challenges might be related to; • Hydrate formation, where it is common to constrain the production to be below a certain temperature-pressure line• Sand production, where it might be rel- evant to limit the velocity of the fluid due to erosion
To summarize, the complexity and nature of the day to day production optimization prob-lem addressed by the production engineer, is different from asset to asset, and it is chang-ing over time. At one asset at a given time, it might be trivial to produce at maximum rates, and the production engineer could focus on flow assurance issues and other operational challenges. At other assets it might be very tricky to find the smartest way of operating the asset. In cases like this, simulations and optimization software tools might become a very important and integrated part of the work process, automating parts of the deci-sion process.

Short course in mathematical optimization for daily Production optimization
The goal of this short course is to introduce the
reader to the basic concepts behind the
computations needed to automatically search for
an optimal way of operating a field. To help us, we
will use an FPSO with five subsea and three
platform wells as an example. Let’s say that five of
the wells are gas lifted, while two have ESP’s
installed. For the sake of the readability of the
mathematical problem formulation below, we
have made the example small. It is straight
forward to scale the formulation up to +30 wells,
however it becomes significantly more challenging
to solve the optimization problem. The figure to
the right illustrates the production system setup.
Further, assume that production is off plateau and
hence, the objective is to maximize the total oil
production from day to day, by finding the
optimal choke settings, gas lift rates and ESP
speeds on each well. In addition, the subsea wells
should be routed to one of the two production
lines or be shut off. All this needs to be decided
while taking into account that the handling
capacity of water and gas, and the gas available for
gas lift, is limited.
The subsea wells which are produced with
artificial lift have a fully open choke. This is
important to notice, because it makes it necessary
to take into account that changes in other wells
routed to the same production line, will affect the
production of such a well, even if the well’s own
settings remain unchanged. I.e. if you increase the
production on one well, the manifold line pressure
will increase, giving higher back pressure and
lower production from others wells. Therefore, the
total effect of a change in gas lift rate to one well is
quite challenging to figure out since you need to
consider its effect on all the wells routed to this
production line.
If the choke is not fully open, the change in
manifold line pressure, forced by another well,
could be compensated by adjusting the well’s own
choke setting, keeping the wellhead pressure and
well production the same.
To develop a computer based decision support
system for assisting the production engineer on
how to operate this FPSO optimally is one of the
core research areas of the IO Center.
There are two main challenges of enabling a
robust decision support system for this problem,
one is to automatically predict system behavior,
i.e. the simulator layer in the decision pyramid in
Figure 10, and the second is to automate the
search for the best production settings, i.e. the
optimization layer. Since simulation of production
networks has been addressed by the industry for
several decades, and is hence a quite mature field,
we are focusing on the latter. Automating the
optimization layer, or the what-if study (which is a
more appropriate name when it is conducted
manually) is one of the next steps, in our view.
To enable this, a mathematical formulation of the
problem is needed. Further, one needs an
optimization algorithm to search on top of this
formulation. A large part of this formulation is
essentially the production network simulator,
however a few more items are needed. The next
step in this tutorial is to present a formulation that
is somewhat the industry standard of today.
ESP ESP gas lift gas lift gas lift
Choke valves
Standard approach
The mathematical formulation consists of an
objective function, a network simulator, and
constraints on production capacity, gas lift
injection capacity, and pressure feasibility.
Objective function
The goal is to maximize the sum of oil flow
from all pipelines (first term) and platform wells
(, second term) that enters the FPSO.
max +
Network simulator
The network simulator is a complex calculator.
Given the vectors of all wellhead pressures , gas
lift rates , rpm on ESP’s , on/off settings of
platform wells , and on/off and routing settings
of subsea wells , it computes the vectors of all
rates from platform wells , and pipelines ,
and the pressure in the pipelines at the manifold
.
, , = (, , , , )
Capacity constraints
Total production of gas , and water , from the
pipelines and wells needs to be below the FPSO
handling capacity.
+ ≤ ,
The amount of gas lift, used on each well
should sum to less than the available capacity.
≤
Routing
The platform wells can be turned on or off,
handled by their associated binary variable . A
subsea well has three options, either it is off, or it
is routed to one of the production lines. This is
handled by using two binary variables, one for
each production line, which takes the value one if
well is routed to line .
≤ 1
Pressure relations
For the subsea wells, we need to make sure that
the wellhead pressure is higher than the line
Notes
Short course in mathematical optimization for daily Production optimization
pressure in the manifold , for the line that
well is routed to. The wellhead pressure of the
platform wells need to be higher than the
separator pressure .
< ,
<
Optimization algorithms
How this “standard formulation” is used in an
optimization algorithm is actually quite straight
forward to explain. First, the optimization search
needs to be initiated with a starting “point”. This
could e.g. be the current operating settings of the
production system. The values of all wellhead
pressures, gas lift rates, ESP settings, on/off and
routing settings are needed.
With this we have all the information needed to
run the network simulator, which computes
estimates for all well rates, pipeline rates, and
subsea manifold line pressures. This again enables
the optimization algorithm to compute; 1) the
objective function, 2) if the capacity constraint on
water and gas production is fulfilled or not, and 3)
if the subsea manifold pipeline pressure is lower
than the wellhead pressures on the wells routed to
the particular pipeline. Since the wellhead
pressures, on/off and routing variables are input
variables to the network simulator, the
optimization algorithm will make sure that, the
platform wellhead pressure is higher than the fixed
separator pressure, and that the well is either
completely on or off. Further, it will make sure
that the subsea wells are routed to only one of the
production pipelines, or turned off. However, it is
not trivial for the algorithm to know if the
wellhead pressure on a subsea well is higher than
the subsea manifold line pressure to which it is
routed. To answer this it needs to run the network
simulator and compute the manifold pressures.
Based on the value of the objective function and
constraints and their derivatives, the optimization
algorithm will decide on a next “trial point” to run
the network simulator, and hence iterate further
until the algorithm converges to a (locally)
optimal solution. To decide the next “trial point”
is a very complex task, and it is here most of the
effort in optimization research is conducted. The
question is – how could you find a smart next
“trial point” so that you need few iterations and
network simulations to find the best way of
operating the production system?
Gradient computation
Gradient inform is key regarding this challenge,
e.g. if we slightly increase the gas lift rate of a well,
what will happen to the total oil, gas and water
production, and manifold pipeline pressure which
is used to compute the objective function and
constraints.
What the reader should notice is that a production
network simulator is a network simulator. With
this we mean that, it can be very hard to compute
accurately e.g. the pressure drop through a
pipeline based on the multiphase flow going
through it, or the well production rate as a
function of wellhead pressure and gas lift rate. It is
very easy to compute mass and pressure balances
through the network however, i.e. what goes out of
a well goes into a pipeline. Hence, the structure of
the steady-state network simulator can be
formulated with very simple algebraic equations,
while each component, e.g. well, pipeline,
separator, etc., could be thousands of code lines.
In the standard approach that we presented, this
structure is not exploited. Here the network
simulator is treated as a large “black box” with
input and output variables. For evaluating the
production system’s response to a particular
production setup this is fine, but for computing
gradient information this has large limitations
since you only have gradient information on the
mapping between the input and output variables
of the production network. These gradients are
often computed by finite differencing which
results in low quality. Further, a gradient between
the change in gas lift rate on one particular well, to
e.g. the total oil rate, might be changing non-
continuously.

Today you find very few successful
implementations of decision support systems that
are based on mathematical optimization for
computing recommendations. We believe that the
manner in which the gradients are computed, is
the major showstopper.
Since essentially all petroleum production
optimization problems involve simulation of a
production network, finding an approach that
utilizes this structure efficiently, has great
potential.
One of the main focus areas of the IO Center
research on production optimization is dedicated
to exactly this “network simulator based
optimization”. We have developed a new method
that utilizes the network structure by splitting the
simulator into one component for each well,
pipeline, compressor, separator, etc. Instead of
connecting the components inside the simulator,
we are essentially connecting them inside the
optimization algorithm.
This provides the optimization algorithm with
much more information, which is particularly
important regarding gradients.
Instead of looking at the effect on total oil
production when you change the gas lift rate of
one well, you look at the change in oil rate from
the well itself. The mapping to the total oil rate is
handled by the algebraic mass balance constraints,
which could be derived analytically.
The next step of this tutorial is to present the
changes of the standard formulation that is needed
to apply the IO Center method.
IO Center approach
Objective function
The goal is still to maximize the sum of oil , from
all pipelines ( , first term) and platform wells
(, second term) that enters the FPSO. Note that
the platform wells can be turned on or off using
the binary variable .
Notes

max +
Capacity constraints
Total production of gas , and water , from the
pipelines and wells needs to be below the FPSO
handling capacity. Also here the platform wells
could be turned on/off using the binary variable
.
+ ≤ ,
In the same way as the standard approach, the
amount of gas lift, , used on each well should
sum to less than the available capacity.
≤
On/off and well routing
The platform wells can be turned on/off, handled
by their associated binary variable . The subsea
well has three options, either it is off, or it is
routed to one of the production lines. This is
handled by using two binary variables, which take
the value one if well is routed to the line . This is
handled in the same way as the standard
approach.
≤ 1
The following equations represent the network
simulator. Note that in this approach, it is split up
into equations for each well and each pipeline, in
addition to the mass balances and pressure
relations.
Well model
The flow out of a well is modeled as a function of
its wellhead pressure, , and the amount of gas
lift or ESP rpm, .
= , or
= ,
Mass balance
The oil, gas and water (phase, ) that go out
of subsea well needs to go into one of the
pipelines . By using the routing variable, we are
able to force the well fluid into one of the
pipelines.
= ,
Pressure relations
For the subsea wells, we need to make sure that
the wellhead pressure is higher than the line
pressure in the manifold, , for the line that
well is routed to. If not, the binary variable
will have to take the value zero.
< ,
Pipeline pressure drop
The subsea manifold line pressure is equal to the
separator pressure plus the pressure drop
through the pipeline, which is a function of the
flow through it.
= + , ,
Summary
The IO Center approach feeds much more
information to the optimization algorithm than
the standard approach. This enables the algorithm
to search smarter and more efficiently. Below we
have included a table that shows a comparison of
the two algorithms on a problem similar to the
one described her, but with 12 wells. These results
are part of the project thesis by Shamlou and
Ursin-Holm (2012), and show a speed-up in the
order of two magnitudes.
Short course in mathematical optimization for daily Production optimization
Optimization Approach Standard IO CenterRouting
Topside Wells (on) 2,3,4,5,6 1,2,4,5,6Subsea Wells Line 1 10, 11 7, 11Subsea Wells Line 2 7,9,12 10,12
Total Production RatesGas Lift Allocated (700) 700 700Water Production (4000) 4000 4000Gas Production (1200) 1126 1192Oil Production 4947 5801
Other Comparison Values
% of Optimum 86% 99%Solution Time 237 sec 0.72 sec

Notes

Well monitoring Well monitoring is an important part of daily production optimization. The primary goal of testing wells is to know what it actually is pro-ducing. However, the main value driver is to use this information to make decisions that improve production. Therefore, in addition to gain information about the current state of the well, it is just as important to identify the pa-rameters that give the well’s response to changes in control settings. As mentioned in the previ-ous section on “closed loop”, models of how the well changes with space and time are needed. In other words, we need to know how the well rate changes when the choke opening or gas lift rate is changed, and in addition we also need to know how the well rate changes as time goes along. This information is crucial for the math-ematical optimization problem outlined in the previous section.
Frequent well testing is costly due to production losses, and is often conducted only 2-4 times a year. For production optimization purposes this is very infrequent. Ideally, wells would be tested every time their settings are changed.
As a contribution to this challenge, the IO Cent-
er has developed a method, named SmartX, that allows simultaneous testing of multiple wells.
SmartX uses sinusoidal stimulation to gain information on well parameters. In figure 17 below, SmartX is described considering, for simplicity of illustration, just three wells. The production choke settings are manipulated to induce sinusoidal oscillations in the bottom-hole pressures, which in turn produces an os-cillation in the inflow from the reservoir.
By stimulating all wells at different frequencies one can estimate, simultaneously, relevant pa-rameters for short-term optimization. For ex-ample near-well and flow parameters such as water cut, gas-oil-ratio, and productivity index are estimated with their error margins.
The IO Center is patenting SmartX, and NTNU and Sintef are running an associated project to verify the technology.
Due to the significant reduction in testing time and cost, this technology may enable a large step forward regarding well monitoring for pro-duction optimization.
Figure 17: Illustration of SmartX approach

Figure 18: Troll A platform - Photo Øyvind Hagen - Statoil

Software Within steady-state production network simulation, there are five main actors. The most used simulator is PipeSim from Schlumberger. It has functionality for op-timizing gas-lift distribution, but it does not claim to handle the full production optimization problem with routing flex-ibility. GAP from Petroleum Experts is on the other hand the preferred tool for rate allocation among the major oil companies. GAP is a production network simulator, but it also includes continuous optimiza-tion solvers which handle the rate alloca-tion and gas-lift distribution problem. GAP is arguably the leading software solution addressing the production optimization problem, on the market. However, it does not handle complex routing decisions. Further, PipeSim and GAP are primarily used in offline settings, which means that they are usually not connected to rate esti-mation tools that are running online in real time. Both have an open interface to third party vendors which enables optimization add-on.
Another important and related technology is FlowManager from FMC Technologies. This is primarily an online rate estimation tool; but it has an add-on, MaxPro, which partially addresses the production optimi-zation problem. MaxPro is one of few soft-ware packages that actually offer routing optimization
Other products worth mentioning are Pi-pePhase from Invensys, and HYSYS Up-stream from AspenTech. Both are mainly used for simulation purposes.
All the software packages mentioned above have a hard time addressing the full pro-duction optimization problem, and suc-cessful implementations usually handle one standalone production cluster only. When including routing, the computa-tional time often exceeds one hour or even much more, in the lucky event of actually finding a solution. Hence, we claim there
is currently no industry proven robust so-lution for the full production optimization problem, on medium and large scale assets.
Related domains are simulation of the top-side processes, and the dynamic simulation problem. For the first one, HYSYS from AspenTech is the biggest actor, with K-Spice from Kongsberg as another impor-tant actor. On dynamic simulation of pipe-lines, OLGA from SPT Group, now owned by Schlumberger is dominating. LedaFlow (Kongsberg) is a new simulator package for these applications. As a final comment, solving the dynamic production optimiza-tion problem with dynamic models is still a research topic.
Limitations on today’s solutions• Today’s optimization packages do handle on/off and routing to a limited extent. Some vendors claim to have this capability, but the methods that are used are “brute force” like e.g. genetic algorithms. Such algorithms are computation- ally expensive and are rarely able to find good routings for complex production systems.• Today’s optimization packages do not handle complex full field production optimization problems. They are at most addressing part of the problem, like only the gas-lift, or only one production cluster.• The computation time is long, and unpredict- able.• Current production optimization tools based on mathematical optimization are rarely used in practice. This is a clear indicator that current technologies are below standard.

ConclusionThis paper has summarized some key impli-cations of Integrated Operations for produc-tion optimization. We have sought to outline some key challenges, dilemmas and opportu-nities both from a technical and work process perspective, and more importantly, we have sought to integrate the two. IO in the produc-tion domain involves advanced collaboration facilities, like collaboration rooms and video conferencing facilities. Many of the gains, however, lie in the potential of optimizing the production network by feeding sensor data into advanced algorithms that may support or automate decisions. The development of these optimizers has been a core area of re-search at the IO Centre. This development exploits the increased amount of sensors and remote control opportunities in the produc-
tion system, but also depends on dedicated teams on shore that are able analyze the data and use these opportunities to optimize the production system. We discuss how comput-er based data aggregation and simulation may support the work of production engineers. In particular we argue that the complexity of the available data and the problems to be solved leave great potential for advanced optimiza-tion algorithms.
This white paper has intended to summarize the basics of our understanding of key IO topics in production optimization. We believe that a combination of holistic integration strategies and advances in numerical simula-tion and optimization techniques still has an untapped potential yet to be realized.
Authors information
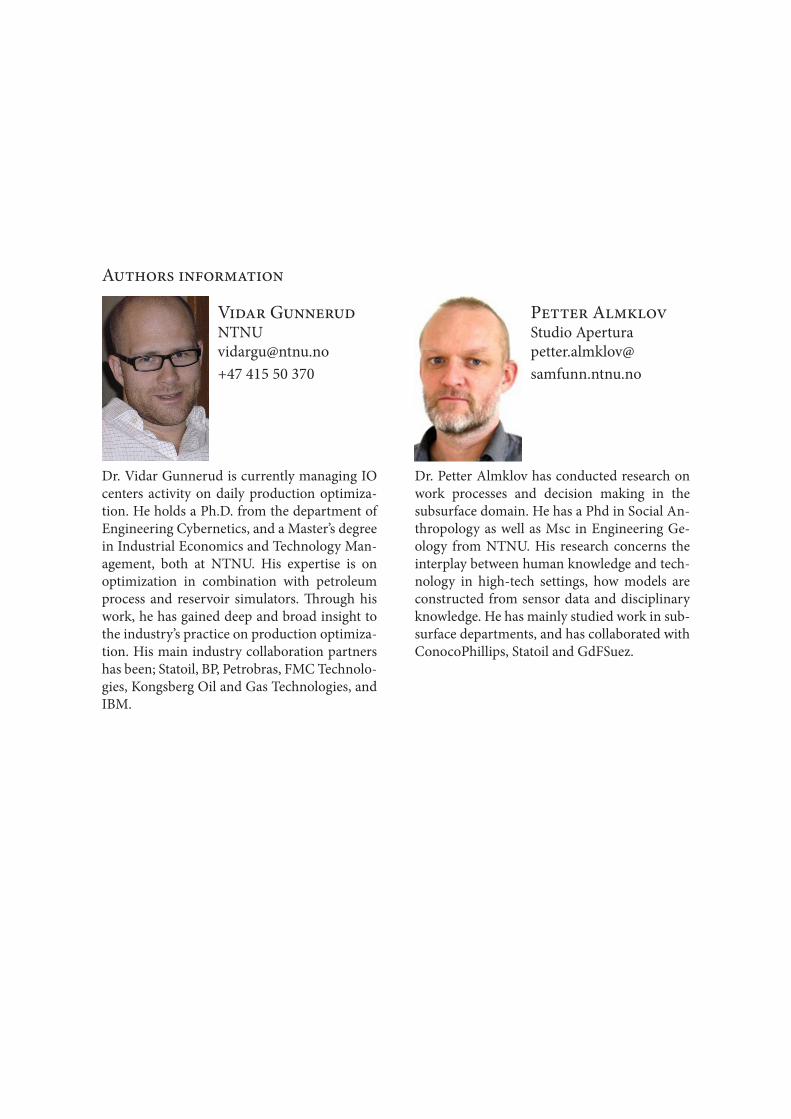
Vidar [email protected]+47 415 50 370
Dr. Vidar Gunnerud is currently managing IO centers activity on daily production optimiza-tion. He holds a Ph.D. from the department of Engineering Cybernetics, and a Master’s degree in Industrial Economics and Technology Man-agement, both at NTNU. His expertise is on optimization in combination with petroleum process and reservoir simulators. Through his work, he has gained deep and broad insight to the industry’s practice on production optimiza-tion. His main industry collaboration partners has been; Statoil, BP, Petrobras, FMC Technolo-gies, Kongsberg Oil and Gas Technologies, and IBM.
Petter AlmklovStudio [email protected]
Dr. Petter Almklov has conducted research on work processes and decision making in the subsurface domain. He has a Phd in Social An-thropology as well as Msc in Engineering Ge-ology from NTNU. His research concerns the interplay between human knowledge and tech-nology in high-tech settings, how models are constructed from sensor data and disciplinary knowledge. He has mainly studied work in sub-surface departments, and has collaborated with ConocoPhillips, Statoil and GdFSuez.