dairy 2007: situation & outlook - brian w....
TRANSCRIPT

1
October 2009
Dairy 2009 Situation and Outlook

2
About this report
The Situation & Outlook process is designed to provide theAustralian dairy industry and its stakeholders with anoverview of the entire industry supply chain – from dairyfarm inputs to consumer markets.
This is the first update to be released, following thepublication of the annual Dairy 2009: Situation & Outlookreport published in June 2009.
The report has been compiled with input from industryorganisations and dairy companies, as well as a range ofinformation sources.
This updated report
Summarises the operating conditions facing the Australiandairy industry supply chain, and ultimately affecting theprofitability of dairy farms;
Summarises the highlights from the follow-up survey to the2009 National Dairy Farmer Survey conducted in September;and
Provides a brief overview of the current industry status andthe situation and outlook for the key drivers of the Australiandairy industry.
October 2009 UpdateTable of Contents
Australian dairy supply chain Page 3
Key driver outlook Page 4
The Australian dairy industry in October Page 5
Industry insights Page 8
September farmer survey results Page 9
The Six Key Drivers
Global Economy Page 13
Global Demand Page 15
Competitive landscape Page 16
Australian market Page 17
Global Supply Page 18
Inputs Page 20
Exchange Rates Page 22
This Situation and Outlook Quarterly Update is published for information only. It is produced with due care and attention toaccuracy, but Dairy Australia accepts no liability if, for any reason, the information is inaccurate, incomplete or out of date.
Copyright Dairy Australia 2009. All rights reserved.

3
Retail
ExportMilk
production
Food serviceDist’nMarketing
Processing/manufacturing
Import
Inputs
supplements
water
Signs of demand recovery as economic outlook improves and buyers return to the market
Government stocks and intervention in the Nth Hemisphere overhanging market
Weak USD impacting export returns and commodity prices
Input prices continue to ease - withgrain prices weakening due to increased supplies
Highly variable seasonal conditionsacross dairying regions impacting onfarmers’ ability to manage low springcash flow
Australian Dairy Supply Chain
Manufacturers carefully assessing market and product mix in order to maximise returns – including export vs domestic
Domestic market volumes and wholesale prices still holding steady - consumers ‘economising’

4
Global economy Global demand
Australian market
Global supply
Inputs Exchange rates
Major discussion points
Asian economies recovering faster than EU, USA and Australia.
Asian countries lifting other economies out of economic slump.
Modest signs of recovery in US and EU, but risks are still weighted on downside.
Stronger performance of Australian economy increasing the likelihood of further interest rate rises.
International buyers returning to the market with increased activity, as commercial inventories have cleared and refilling of supply pipeline begins.
Consumer demand supported by lower retail prices, particularly in Asian markets.
Signs of improved consumption patterns have emerged in large volume markets such as China, Russia, US and Europe.
Domestic consumption remains robust.
Growth returning to supermarket cheese sales.
Consumers continue to seek value through private label offerings.
Dairy product wholesale price trends have remained steady in recent months.
Interest rates likely to continue rising, cutting discretionary spending.
Market forces limiting milk production growth around the world.
Production growth has slowed in US, Brazil and many parts of Europe in 2009.
Slowing sales of surplus product to government intervention stores.
Existing government stockpiles provide an ongoing anchor on world market prices.
Grain prices continuing to trend down due to strong local crop prospects and large northern hemisphere harvests.
Strong AUD pushing down import costs, forcing oil and fertiliser prices lower.
Increasing interest rates will increase financing costs
Water allocation on Goulburn and Murray Systems increased to 30% and 29% respectively.
Australian dollar to remain high while local economy out-performs the EU and USA.
US dollar weak against most major currencies increasing import affordability and supporting higher export offers from EU and NZ.
Global financial institutions predict wide range for AUD (68-95 US cents) but Australian banks are forecasting 85-93 US cents through to the end of 2010.
Key driver outlook
Impact on operating conditions or key driver status:
Positive Steady Negative

5
o Australian dairy farmers are facing the immediatechallenge of managing tight cashflow with highlyvariable Spring conditions. However as positive signs ofa turnaround for the industry are emerging, farmer planshang in the balance.
o The lowest opening farmgate milk prices for 5 yearsmean many dairy farmers are currently operating atbelow break-even levels, despite falling input prices.
o An estimated 95% of farmers surveyed in early Septemberhave had their farmgate price significantly reduced in 2009.In response farmers have implemented multiple strategies- mainly restructuring debt (43%) and reducing herdnumbers (37%), while 34% have cut the amount of feed.
o Confidence has been impacted, however 60% of farmersremain positive about the industry’s future. This is anencouraging result, underpinned more recently byimproving market signals, further easing in input costs –particularly grain - and some good mid-Spring rainfall.
The Australian dairy industry in October 2009o The timing of improved signals is critical for 43% of
farmers surveyed in the lower Murray Darling Basin whowill decide whether to continue dairying before the endof 2009. Decisions will be based on irrigation waterallocations, now the best for four years at this stage ofthe season, milk prices and Spring rainfall.
o More generally, the proportion of farmers surveyed inSeptember considering leaving the industry in threeyears time increased to 16% compared with 3% inMarch. This response is understandable given thesevere financial stresses on farmers at that time. Whileconditions are improving for some, farmers arecontinuing to assess their options carefully.
o Dairy Australia’s forecast for 2009/10 milkproduction is 9.0 billion litres, 4% down on2008/09 production.
o This reflects the impact of farmer exits from NorthernVictoria/southern Riverina, wet conditions in Tasmaniaand the reported reductions in cow numbers andsupplementary feeding rates across the industry.
o International commodity prices have increasedsharply in US dollar terms over the last quarter.
o After running down stocks over a number of months,there are now clear signs of increased buyer activity,and a greater willingness to purchase ahead ofimmediate requirements.
o While the rapid turnaround in commodity prices is goodnews, a recovery in demand may be prematurely burntoff by too rapid an increase in prices.
o Ideally, a gradual economic recovery would lead tosteady improvements in dairy commodity prices andmore sustainable pricing for the longer term. However,while uncertainty around a sustained globalrecovery remains, international dairy marketconditions are likely to remain volatile.
Fig 1: Farmers’ attitude to industry future

6
o While this has eroded returns to exporters in localcurrency, it has also underpinned some of theimprovement in dairy commodity prices, byimproving the purchasing power of importing countries,and increasing the offer prices of competing exporters inUS dollar terms.
o Current forecasts for the Australian dollar varywidely - from 68 to 92 cents by December 2010,with a number of financial institutions currentlyupgrading their forecasts. The large range continues toreflect the continued uncertainty surrounding theworld economy in 2010.
• The strength of the Australian dollar poses the major threat to improved farmgate prices in 2009/10. Current commodity market and exchange rate settings suggest a full year price of between $4.00 and $4.30 per kg MS in southern regions.
The Australian dairy industry in October 2009o Signs of slowing US production, and the likelihood of
lower supplies from the southern hemisphere,coupled with improving demand are bringing theinternational dairy market back into balance.
o However, EU and US government intervention andstockpiles will continue to have a negative impacton market sentiment until they are removed.
o Assuming there are no further global economic shocks,international powder prices are likely to trade aboveUS$3000 per tonne over the coming months, whilebutter prices should maintain their recent gains,given a recovery in Russian demand.
o Currency movements are having a major influenceon Australia’s export prospects. The US dollar hasweakened against the Australian dollar, and most majorcurrencies.
Fig 2: Spot export prices Sep 2003 to Sep 2009
Fig 3: Export index Sep 2005 to Sep 2009
0
100
200
300
400
Sep-05 Sep-06 Sep-07 Sep-08 Sep-09
Jan 2000 = 100
$AUD terms
$US terms

7
Good newso Demand conditions continue to improve in key markets.
Retail prices are easing, economic conditions areimproving and consumer sentiment is rebounding.
o A gradual unfreezing of trade finance has helpedunderpin the market recovery.
o The Australian market continues to provide good growthand steadier returns.
o Fresh supply of dairy products is stagnating in mostparts of the world, which is helping to bring the marketinto better balance.
o Sales of surplus powder and butter into governmentstockpiles in the Northern Hemisphere are drying up.
o First substantial mid-spring rains in southern dairyingregions since 2005. Improved water allocations forfarmers in Goulburn and Murray systems.
o Domestic consumption growth in South and NorthAmerica is limiting export product availability.
Bad newso Strength of Australian dollar is offsetting improvement
in commodity prices.
o The strength of the Australian economy is likely toprompt the Reserve Bank to continue lifting interestrates into 2010. This will support a higher Australiandollar and lift financing costs for the industry.
o EU and US market intervention entrenched for next 12months. Surplus government stocks still exist in theNorthern Hemisphere and remain an anchor on themarket.
Key questionso How will farmers respond to recent step-ups, improved
Spring rainfall and water allocations and weakeninggrain prices? How will the improvements in some ofthese factors affect those considering exiting and theindustry’s 2009/10 production?
o Is global economic recovery sustainable or will it falter?Will we see a U, V or W shaped economic recovery withfurther shocks?
o With lower prices for all dairy producers internationally,how successfully will farmers be able to managemargins over the coming months, and which exportingregions will be most competitive?
o Are we seeing strategic buying in response to lowprices, or a genuine consumer-led demand recovery?
o With policy instruments back in favour (subsidies,intervention) in the Northern Hemisphere, willgovernments bow to pressure to continue and expandthe levels of support?
o What quantities of new season product will be suppliedfrom the Southern Hemisphere?
Issues to look out foro Although conditions in the Russian dairy market are
improving, the government is now pursuing a range ofpolicies that could again disrupt trade.
o The Australian dollar has been driven by interest ratedifferentials rather than increased commodity prices.What will be the currency impact of future interest rateincreases combined with commodity price recovery?
o The prospect of NZX futures as a viable riskmanagement option for the industry.
The Australian dairy industry in October 2009

8
globalDairyTrade...12 months ono Fonterra’s online WMP auction system globalDairyTrade
has now been operating for over 12 months, and hasgained acceptance as an important market indicator.Fonterra has expanded the platform to include Australianorigin WMP and will also sell AMF in auctions fromNovember.
o Auction prices jumped 26% to an average of US$2,301/tin August, ending a three month trend of falling resultsand driving prices back to levels not seen sinceNovember 2008.
o With September average prices rising a further 24.2%, toUS$2,848/t, average WMP prices increased 56% orUS$1,029/t in just two months.
o Forward contract prices were broadly inline with spotprices, indicating buyers were confident about rebuildinginventory levels.
o Results achieved at the beginning of October (averageincrease of 5.1%) suggest the market is digesting thestrong gains over the past two months.
Industry insights
Fig 5: gDT average WMP prices vs DA WMP price range
Lower Murray Darling Basin surveyo 380 dairy farmers in the lower Murray Darling Basin
were surveyed in August as an input into the LowerMurray Darling Basin Inquiry into the factors shapingdairying in the region in the next five to ten years.
o 43% of farmers surveyed indicated they will be makingsignificant decisions regarding the future of theirbusiness before the end of 2009. The key factorsinfluencing their decisions will be milk price, seasonalconditions and irrigation allocations over that period.
o A significantly larger proportion of farmers wereplanning to sell permanent irrigation water entitlementin 2009/10 compared with 2008/09. While some58,320 ML were sold in 2008-09, projected sales ofpermanent water for 2009-10 were almost 120,000ML.
o Use of carryover water was significant with 67% ofsurveyed farmers carrying over an average of 35 MLfor use in the current season.
Figure 4: Water entitlements in lower Murray Darling Basin
1,500
2,000
2,500
3,000
3,500
4,000
4,500
5,000
US
$/
ton
ne
gdt weighted average price, USD/t FAS
DA WMP low
DA WMP high

9
Key resultso In early September, 340 dairy farmers across Australia
who were surveyed in March were re-interviewed to updateintentions and attitudes.
o The timing of the survey found farmers at a low point– dealing with the reality of the 2008/09 step down andthe lowest opening farmgate prices in 5 years, andseasonally low Spring prices. Many had also receivedlimited late Winter rainfall.
o Since the survey was conducted, many regions havereceived good rainfall, grain prices have continued toweaken, step ups have been announced by two majorcompanies, and market signals look increasingly positive.These developments are likely to have shifted sentimentsignificantly from the results reported here.
o Generally survey respondents expressed greaterconfidence in their own dairy business than theyhave in the wider industry, both locally andnationally.
o 60% of respondents were positive about the future of thenational dairy industry - down from 65%. 56% ofrespondents were positive about the future of the dairyindustry in their region, while 36% feel negative.
o 66% of respondents are confident about their own dairybusiness. Tasmanian respondents were most positiveabout their own businesses (80%), while negativesentiment is highest in WA (42%).
September farmer survey
Figure 6: Positive Attitude to national industry
(% of farms)
Figure 7: Attitude to industry future in local dairy region
Figure 8: Attitude to industry future in own dairy business

o The proportion of respondents expecting higherproduction in three years time has fallen from 61% inMarch to 32% in September.
o Among those expecting to increase production over thenext three years, 33% attributed the anticipatedincrease to increasing herd size, 23% to seasonalimprovement, 24% to feeding cows better and 19% tobetter genetics.
o Average herd size in 2009-10 was expected to beslightly smaller than anticipated in February, with some52% of respondents expecting to milk fewer cows andjust 8% planning to milk more.
o Respondents to the September survey lowered theirproduction expectations for the current season, with2009/10 volumes expected to be down around 8% onthe predictions they made in March.
10
September farmer surveyo In March just 3% of respondents indicated that they
intended to exit the industry within three years. In thesubsequent six months, this proportion has risen to 16%.
o The most notable increases in those considering an exitwere in SA up from 5% to 32%, and Tasmania up from 0%in March to 18%.
o Of the 95% of respondents who experienced a significantreduction in milk price, 91% have taken at least one courseof action in response.
o 66% have reduced expenditure
o 43% have restructured debt
o 37% have reduced herd size
o 34% have decreased the levels of supplementaryfeed provided
o 23% of farms reduced staff levels
o There were over 150 different responses implemented,indicating the diversity of individual farmer situations andthe options available.
o 77% of respondents who took action to counteract thereduced price regard the results as being fairly to verypositive.
o 54% of respondents who restructured finances regardedthe outcome as very positive. 47% of respondents whocontracted just one area, had a very positive outcome.
Figure 9: Expect to increase production in 3 years time

11
September farmer surveyRegional highlights
Northern Victoria / Riverinao 62% of respondents were positive about the future of the
national industry, while 54% were positive about their ownenterprise. Just 34% were positive about the future of thelocal industry.
o 36% of farmers expect to increase production over thenext three years, down from 70% six months ago.
o All respondents in the northern Vic/Riverina region hadexperienced a reduction in milk price, and all had movedto make adjustments to their businesses.
o 70% of respondents have extended debt or refinanced.
o 14% expect to have left the industry in three years. Itshould be noted that since the survey, farmers in theregion have received a significant increase in waterallocations, and step ups by two major companies . TheLMDB survey conducted in August (see box on Page 8)indicated these would be key factors influencing farmersdecisions whether to exit the industry.
Western Victoriao Confidence in the national industry had fallen from 81% in
March to 69%.
o This region was the most positive about the future of itslocal industry at 74%. 76% of respondents were positiveabout the future of their own dairy business.
o The proportion of respondents in the region who anticipatethat production will be greater in three years time hasfallen from 60% to just 24%.
o 98% of respondents have experienced a reduction in price and 93% have responded, mainly by reducing expenditure (79%).
o 14% expect to have left the industry in three years time.
Gippslando 54% of respondents were positive about the future of the
national industry (down 2 points). Negativity towards thefuture was highest in this region (40%).
o 62% of respondents were positive about the local dairyindustry and 68% were confident in their own dairybusiness.
o 24% expected to increase production over the next threeyears, down from 64%.
o All respondents in Gippsland have experienced a stepdown and 88% have reacted, mainly by cuttingexpenditure.
o 20% of respondents were considering quitting theindustry by 2012/13 up from 6% in March.
Southern / Central NSWo 50% of respondents were positive about the national
industry’s future, down 13 points.
o 63% expect higher herd production in three years time.
o 10% of respondents did not expect to be dairying inthree years time, up from 5% in March.

12
Regional highlights
Northern NSW / Qld
o The proportion of respondents positive about theindustry’s future has fallen from 78% to 70%, howeverthis region remained the most positive.
o 66% were confident about the future of the local industry,while 69% positive about their own business.
o 52% of respondents expected production volumes toincrease by 2012/13.
o 3% of respondents expect to leave the industry over thenext three years, down from 7%.
South Australiao 53% of SA respondents were positive about the future of
the national dairy industry, with a high 39% feeling negative about the future.
o SA respondents were the most negative of all regions, with 53% negative about the local industry, while 53% are positive about their own dairy business.
o 32% of respondents expect to leave the industry withinthree years, up 27 points. The sharp increase inrespondents planning to exit may reflect some specificissues around low long term contract prices being offeredto some farmers in the region, as well as financialpressures being felt by some larger operators.
o Just 18% of respondents in the region expect greaterproduction in three years time, down 35 points.
o 97% of respondents were affected by price reductions,with 61% cutting expenditure and 21% restructuring theirfinance.
Western Australiao 62% of WA respondents have confidence in the national
dairy industry, down 10%.
o 55% are positive about the future of the local industryand 57% are confident in their own business.
o 37% are expecting their herd production to be greater inthree years time, down 5 points.
o While 92% of WA respondents have experienced stepdowns, 43% have restructured farm finances.
o 10% of respondents now believe they will not be dairyingin three years time, when in March none predicted this.
Tasmaniao The proportion of respondents positive about the future
of the national dairy industry fell from 80% to 60%.
o 63% of respondents’ were confident in their local industrywhile 80% are positive about their own business.
o While 70% of respondents in March expected their herdto be producing more in three years time, this figure hasnow fallen to 20%.
o 98% of respondents experienced a step down in milkprice, with 95% responding, mainly by decreasingsupplementary feed levels, herds sizes and staffing.
o In addition to low milk prices, Tasmanian farmers weredealing with excessive rain which in some casesnecessitated additional supplements as pastures becameunusable. This has placed additional and ongoingpressure on cashflows, as many of these pastures willnow require renovation.
o The proportion of Tasmanian respondents considering anexit from the industry within three years has risen from0% in March to 18%.
September farmer survey

13
o Economic recovery from a financial crisis is generallyslower because households in developed countries increasesavings (thus spend less) to rebuild lost wealth in houseprices and superannuation.
o The World Bank suggests crude oil price volatility shoulddecrease as supply capacity improves. However, averageprices will increase as oil becomes more difficult to extract.
o Global crude oil prices are forecast to increasegradually from US$56/bbl in 2009, to US$66/bbl in2011 before hitting US$75/bbl in 2015 as productioncosts increase. This is well below peak prices ofUS$140/bbl during June 2008, but more than double theaverage price of US$35/bbl over the last 20 years. This willboost the income of key dairy importing countries in theMiddle East and Russia.
o Asian countries are leading the recovery from the globaleconomic downturn. This reflects lower exposure tofinancial derivative products, improved banking systemsfollowing the region’s own financial crisis in the late1990s and large fiscal stimulus packages.
o However, despite some positive economic signals,significant downside risks remain. Withdrawing stimulustoo early could undermine confidence, and worldeconomic growth would suffer if the economies of Chinaor India were to falter.
o The Asian Development Bank has suggested countriesdevelop internal demand which would be positive fordairy consumption, and potentially imports of Australiandairy ingredients.
o The IMF reported economic stabilisation is uneven andthat the recovery will be sluggish forecasting a 1.4%contraction in 2009, and 2.5% growth in 2010.
o Global organisations such as the World Bank and IMFagree that the recovery from an economic downturncaused by a financial crisis tends to be deeper, andlonger, than a normal downturn.
Global economy
2008 2009 2010
World output 3.0 -1.1 (↑0.3) 3.1 (↑0.6)
Advanced economies
0.6 -3.4 (↑0.4) 1.3 (↑0.7)
USA 0.4 -2.7 (↓0.1) 1.5 (↑0.7)
Euro area 0.7 -4.2 (↑0.6) 0.3 (↑0.6)
Japan -0.7 -5.4 (↑0.6) 1.7 (N/C)
Emerging economies
6.0 1.7 (↑0.2) 5.1 (↑0.4)
Fig 10: IMF October 2009 projectionsEconomic growth, % change and (change from July forecast)
Fig 11: Crude oil prices
(US WTI, USD$/bbl)
Source: Bloomberg / World Bank
0
20
40
60
80
100
120
140
160
Sep
-83
Sep
-85
Sep
-87
Sep
-89
Sep
-91
Sep
-93
Sep
-95
Sep
-97
Sep
-99
Sep
-01
Sep
-03
Sep
-05
Sep
-07
Sep
-09
Sep
-11
Sep
-13
Sep
-15

Update on fiscal stimulus packageso The G20 meeting in London in early September called on
governments to continue economic stimulus measures untila global recovery is secured.
o As well as agreeing to continue their expansionary packagesuntil recovery is well entrenched, the G20 agreed on theneed for a co-ordinated exit strategy. which would beunderpinned by effective co-ordination between fiscal andmonetary authorities, international co-operation andcommunication among countries regarding policy actions.
o While more than half of the 5 trillion US dollars fiscalexpansion committed to is yet to be spent, arguments arebrewing about when to phase out the stimulus measures.
o While Britain and the US are warning against tightening toosoon, France and Germany, which have already emergedfrom recession, are keen to turn off the fiscal tap.
o Australia’s stimulus will not be trimmed until the nation'seconomic growth level has returned to a trend level of threeper cent.
o Australia is now the fastest-growing economy in the Westernworld – and the only Western economy that grew in theyear to June.
o Government deficits are growing rapidly and public debt hasreached dangerously high levels. High levels of publicdebt threaten to depress global economic activity inthe longer-term with figure 12 highlighting how muchpublic debt exists in the developed world.
o Germany and Japan are big suppliers of international credit,with Britain and the US heavily reliant on borrowing.
o The IMF estimates the public debt of the ten richestcountries will rise from 78% of GDP in 2007 to 114% by2014.
o Since the economic crisis is so widespread, any recovery isunlikely to come from exports as it did post-war.
o Debt-burdened consumers will be cautious and have apropensity to save more, which is expected to slow growthfor several years, and impact on consumption.
14
Global economy
Fig 12: General Government Gross Debt 2009
Source: OECD

15
o The outlook for global dairy demand remains mixed, withpowders likely to fare better than butter and cheese.
o Global supply pipelines have largely been cleared,and manufacturers have been running down inventoriesover the seasonal production low.
o Buyers appear to be strategically purchasing productin anticipation of a potentially limited availability inearly 2010. Chinese ingredient buyers are back in themarket purchasing large volumes of powders asingredients.
o It is unclear how much renewed demand is strategicbuying, now that prices are moving upwards, or whetherit is consumer-led demand.
o The downturn in high-end hotel and restaurant trade in allcountries will continue, particularly in Asia and the MiddleEast. Low hotel occupancy rates, and reduced tourism andbusiness travel have resulted in lower dairy demand.
Global demando Reduced discretionary spending is evident in some
markets and is affecting some impulse buying (e.g. ice-cream, confectionery and cheese).
o Some brands are repositioning from top-tier to mid levelto take advantage of a growing middle tier of consumerswho are focused on quality and branding, but remainsensitive to prices
o Lower prices will drive an import demand recoveryin some markets in 2009/10, particularly in Africa,China and Southeast Asia. Recombining activity inSouth East Asia will provide some import demandgrowth for milk powders in 2009.
o The economic downturn and trade finance issues areimpacting dairy trade to Russia, one of the world’slargest importers of cheese and butter. Currencyrealignments have more than offset dairy commodity pricefalls, making product less affordable, while letters of creditfor Russian trade are still difficult to obtain. However,Russia appears to be returning to the market despitethese difficulties.
o High cheese inventories in Japan, and commitmentsto utilise new production facilities are likely to limitcheese import recovery until 2010.
o Subsidised government programs in Algeria and Mexicoare likely to hold dairy import volumes steady in 2009.Both countries are significant for world dairy marketbalance, since they import large volumes of milk powders.
o There is likely to be growth demand for imported dairyproduct in China (mainly of UHT milk, powders, andinfant formula). However the government is attempting toimpede import activity.
Fig 13: Russian Qtly Dairy Imports (tonnes)

16
o The competing fat product price outlook is more mixed.Weak demand associated with the economic downturn hasdriven recent falls in prices. Demand has suffered in anumber of countries from the loss of income growth. Agrowing share of demand for vegetable oils is proving tobe quite price inelastic.
o However, world production of palm oil will be considerablylower than expected in the second half of 2009 and in2010 in Malaysia and Indonesia, mainly due to insufficientrainfall resulting from El Niño.
o World palm oil stocks are already unusually low in the keyexporting countries, but comparatively high in majorimporting countries like India and China.
o This uncertainty over fresh supply, coupled with lower thannormal stocks is expected to result in a strengthening ofoil prices into 2010.
Competitive landscape
Fig 14: Competing fat and protein prices (US$/t)
o Prices for competitive protein commodities aretrending upwards, albeit slowly. A combination ofsupply and demand factors have swung the marketmomentum. This is good news for dairy commodityprices as it will provide room for similar upwardmovements.
o The US is expecting a bumper soybean crop in 2009/10,with production expected to be up 10%. South Americansoybean production is expected to recover strongly in2010 from the drought-reduced level of this year.However, these increases in supply are expected tobe offset by very low levels of stocks worldwide.
o There are several uncertainties regarding future pricemovements, including weather, exchange rates, oil pricesand economic and financial developments.
o Political uncertainties, primarily in Argentina, could posefurther threat to supply. The government is consideringraising export taxes on soybeans in an effort to lowerdomestic food costs, which could lead to a new round ofstrikes as farmers protest against lower prices for theircrops.
Imitation cheese
o Imitation (or analog) cheese, is a growing competitorto ingredient cheese, and is an emerging issue forthe European dairy sector.
o This imitation cheese is displacing cheesepredominately in the fast food sector, as analternative cheese topping for the pizza industry.
o The cheaper alternative is made from vegetable oil,casein and various flavours and salts. The imitationcheese is cheaper than natural cheese.
o Estimates suggest the imitation cheese usage hassurpassed 20,000 tonnes in the EU, whichrepresents less than 1% of the market.
0
250
500
750
1,000
1,250
1,500
Jul-06 Jan-07 Jul-07 Jan-08 Jul-08 Jan-09 Jul-09Palm oil Soymeal Soy oil

1717
o The Australian market continues to deliver volumeand value growth, with per capita consumptionholding firm through 2008/09 at around 300 litres inmilk equivalent terms.
o Volume growth has returned in the cheesecategory in recent months, however consumers havecontinued to migrate from branded to private labelproducts in the milk category.
o Australian consumer spending has been supportedby lower interest rates and stimulus funds. A risingsharemarket has also contributed to a significant liftin consumer and business confidence in recentmonths.
o ABS retail sales data flags a recovery in thefoodservice sector – eating out-of-home; with growthin sales through cafes, takeaways and restaurantslifting to parity with the supermarket channel.
o Wholesale prices have held firm across the rangeof dairy products. Manufacturers have tended toprioritise the domestic market given the downturn inexport returns over the past 12 months. However,there will be some careful assessment of local returnsin coming months in the face of a strengthening worldmarket.
o Prices in the non-grocery (foodservice and industrial)sector have followed international commodity trendsmore closely than grocery prices, as prevailingsupermarket supply contracts have limited priceadjustments.
o Increases in official interest rates may reducediscretionary spending. While this is unlikely toaffect the volume of dairy products consumed, itmay impact on the channel and value of dairysales as consumers seek to economise. This wouldtend to favour increased sales of private label productsthrough the supermarket channel, while the foodservicesales and branded products are likely to be negativelyaffected.
Australian market
Fig 15: Supermarket sales growth (6 mths to August)
Fig 16: Wholesale price index – ALL products

18
United Stateso US milk production has finally dipped below August 2008
levels. Total milk production in August was estimateddown 0.3% from a year ago, while July production wasalso revised down by 0.1%.
o Strong output in the Midwest is offset by steep decreasesin the West. The rapid drop in cow numbers continued inAugust, while productivity nationwide remained abovelast year’s levels.
o Production is expected to fall further in the remaining fewmonths of 2009. As Fig 18 shows production is trendinglower.
o USDA forecasts milk production to fall 0.8% for2009, and a further 0.9% in 2010. This may berevised down now that the CWT has announced plans fora 4th herd retirement program.
o Sales of surplus milk powder to the government haveslowed with the stockpile at 220,000t (25% of annualproduction). No sales are forecast for 2010.
o
Global supplyEuropeo In the 2008/09 quota year, total milk production
reached 129 billion litres, which was more than 4%below its total quota.
o In 2009/10, milk quotas have been extended a further1% which provides room for growth.
o Reports suggest production is over 1% in the first4 months of the 2009/10 quota year. Farmers inthe northern dairy belt are boosting supply in order tomaintain income levels.
o New product entering intervention stores hasalmost come to a halt for both butter and SMP. ByOctober over 280,000t of SMP and 83,000t butter hadbeen offered and accepted for intervention.
o The public butter stocks are equivalent to 4% of annualEU butter production.
o The SMP stockpile is more burdensome as itrepresents about 30% of annual EU SMPproduction. There is still no clear policy solution foreliminating the stockpile.
Fig 18: US year-on-year monthly milk productionFig 17: Combined EU and US SMP Stocks
('000 tonnes)
-1%
0%
1%
2%
3%
4%
5%
6%
Aug-04 Aug-05 Aug-06 Aug-07 Aug-08 Aug-
6 month moving average
0
150
300
450
600
750
900
Aug-01 Aug-03 Aug-05 Aug-07 Aug-09

19
Australiao National milk production reached 745 million litres for
August – down 1.5%. The first two months of thenew season are down 1.6% on last year.
o Winter rainfall has been generally satisfactoryacross most southern regions – although it has beentoo wet in Tasmania, which is causing difficulties withcow health condition and could limit production growthover the remainder of the season. Conversely,conditions have been dry and hot in northern NSWand southern Queensland very early in the season.
o Irrigation allocations improved dramatically in October,to 29% for the Murray and 30% for the Goulburnsystems. This represents the highest October allocationfor 4 years.
o The lowest opening farmgate milk prices for 5years mean that many dairy farmers are currentlyoperating at or below break-even levels, despite fallinginput costs.
o Dairy Australia’s current forecast milk production isfor 9.0 billion litres for 2009/10, a 4% reduction onlast year.
New Zealando The New Zealand production season has started slowly
(-2% in first 3 months), as producers have rationalisedfeed and fertiliser costs, lowered stocking rates andadjusted to a lower milk price environment.
o Production is current trailing the same period lastseason. Farmers are still expected to make-up any lostground once the season gets into full swing.
o There is strong speculation that more moderate tolarge start-ups are on the cards in New Zealand.
o This is in addition to the previously announced plans toestablish milk processing facilities.
Global supplySouth Americao In the first half of 2009 Argentina’s milk production was
up 5%. Since then, growth slowed and is reportedly 3-4% up (to August). This trend is expected to continuewith full year forecasts of 1% growth or less.
o After the worst drought in 40 years, Argentina hasreceived good rainfall in most of the dairying regions.
o Brazil’s milk production has continued to trail previousyear levels all year. Production was down 4.7% upuntil the end of July.
o A milder recession with a quick recovery across theregion will continue to keep food demand at stronglevels.
o Exports have been extremely limited due to domesticprices being more attractive, thereby making thedomestic market the primary focus.
o The domestic market will continue to be the primaryfocus, but the improvement in international marketswill trigger an increase in exports.
Fig 19: Change in milk production (% chg on last yr)
2020
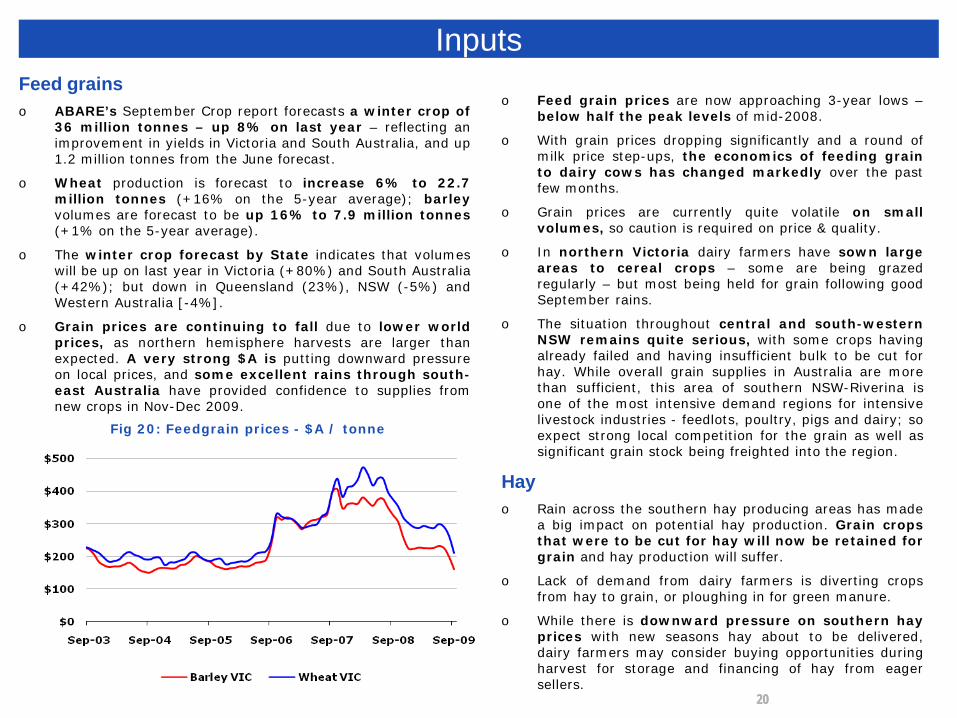
o Feed grain prices are now approaching 3-year lows –below half the peak levels of mid-2008.
o With grain prices dropping significantly and a round ofmilk price step-ups, the economics of feeding grainto dairy cows has changed markedly over the pastfew months.
o Grain prices are currently quite volatile on smallvolumes, so caution is required on price & quality.
o In northern Victoria dairy farmers have sown largeareas to cereal crops – some are being grazedregularly – but most being held for grain following goodSeptember rains.
o The situation throughout central and south-westernNSW remains quite serious, with some crops havingalready failed and having insufficient bulk to be cut forhay. While overall grain supplies in Australia are morethan sufficient, this area of southern NSW-Riverina isone of the most intensive demand regions for intensivelivestock industries - feedlots, poultry, pigs and dairy; soexpect strong local competition for the grain as well assignificant grain stock being freighted into the region.
Hayo Rain across the southern hay producing areas has made
a big impact on potential hay production. Grain cropsthat were to be cut for hay will now be retained forgrain and hay production will suffer.
o Lack of demand from dairy farmers is diverting cropsfrom hay to grain, or ploughing in for green manure.
o While there is downward pressure on southern hayprices with new seasons hay about to be delivered,dairy farmers may consider buying opportunities duringharvest for storage and financing of hay from eagersellers.
Feed grainso ABARE’s September Crop report forecasts a winter crop of
36 million tonnes – up 8% on last year – reflecting animprovement in yields in Victoria and South Australia, and up1.2 million tonnes from the June forecast.
o Wheat production is forecast to increase 6% to 22.7million tonnes (+16% on the 5-year average); barleyvolumes are forecast to be up 16% to 7.9 million tonnes(+1% on the 5-year average).
o The winter crop forecast by State indicates that volumeswill be up on last year in Victoria (+80%) and South Australia(+42%); but down in Queensland (23%), NSW (-5%) andWestern Australia [-4%].
o Grain prices are continuing to fall due to lower worldprices, as northern hemisphere harvests are larger thanexpected. A very strong $A is putting downward pressureon local prices, and some excellent rains through south-east Australia have provided confidence to supplies fromnew crops in Nov-Dec 2009.
Inputs
Fig 20: Feedgrain prices - $A / tonne

2121
Fertilisero In Australian dollar terms, international prices are now
close to pre-boom levels. This has been supported bythe ongoing strengthening of the Australian dollar.
o The international outlook for fertiliser prices is forcontinued weakness at or about the current level.
o Local pricing resisted the downward trend ininternational pricing from June through to August, but hasstarted to fall in recent weeks.
o A Dairy fertiliser mix index is back to where it was twoyears ago due to the strong AUD.
o There appears to be further opportunity for falls in localprices for phosphate and potassium back to internationalparity levels, whilst nitrogen is expected to stabilise at oraround current levels.
o It has been notable that local market prices forcomposite fertiliser mixtures have been muchslower to follow down the fall in international and localprices. Buyers should check the comparative value ofthese mixtures with an equivalent mix of the basic rawingredients.
InputsWatero Water trading has increased by 43% on last year in the
three months to September, for a total volume of just 3,240ML at an average price of $365/ML – down 40% from$610/ML at this time last year.
o Water levels in the Goulburn-Murray system in northernVictoria have increased strongly after good Septemberrains. The total G-M system is at 27% – up from just13% four months ago and 23% at this time last year.
o GM-Water announced large increases in its latest2009/10 allocations to the highest 1 Oct levels in fouryears, with the Murray system at 29% and the Goulburnsystem at 30%.
o The rainfall outlook for the December quarter has the oddsfavouring a drier than normal season across north-eastQueensland, parts of Victoria, south-east South Australiaand Tasmania. This is not a particularly promisingoutlook for the key dairying regions.
o The national outlook for maximum temperaturesindicates moderate to strong shifts in the oddsfavouring higher than average temperatures acrossAustralia.
Cowso Cull cow sales volumes increased 45% in the first six
months of 2009, on very low volumes in 2008, asfarmers held onto cows to take advantage of strong milkprices at that time. The increase was a more realistic 13%on the six-year average.
o The rate of sale has slowed markedly in the last twomonths: +12% and +1% over August and Septemberrespectively.
o Prices have also softened, down -10% and -17% over thepast two months.
Fig 21: Indicative fertiliser prices ($/t)
Urea DAP Single super Potash
May09 $590 $850 $380 $1,010
Sept09 $480 $570 $290 $1,000
Dec 09(f) $400-$480 $500-$550 $270-$300 $700-$800
Source: Xcheque

22
o Volatility remains a central feature in exchange rates, withno contraction in the range of Australian dollar forecasts in2010.
o A Bloomberg survey of 34 financial institutions reveals arange of 68-95 US cents in 2010. Those at the upper endof the range expect significant increases in Australianinterest rates, which would push the Australian dollarhigher, while those at the lower end expect a significantdownturn in the global economy.
o The big four Australian banks are forecasting the AUDto range between 85-93 US cents by end-2010.
o The AUD is benefitting from the resilience of the Australianeconomy, demonstrated by 0.6% GDP growth in Q2 2009,driven by steady household and business spending.
o When the RBA begins increasing rates, the first 1% of raterises could occur quickly. By the end of 2010, banks areforecasting a cash rate between 4.25%-4.75%. The RBAcommenced increasing rates at it’s October meeting.
Exchange rateso The general weakness of the US dollar against
most major currencies is providing support tocommodity prices, by increasing the buying power ofimporting countries, and increasing the offer prices ofexporters.
o However, in some countries, dairy is now moreexpensive for consumers in local currency terms than itwas at the height of the global commodityboom. Russia, Mexico and Korea, have been mostaffected, while China has been protected by virtue of itscurrency being pegged against the US dollar.
o Exchange rates are expected to stabilise once frozenglobal credit markets begin to thaw, but the importaffordability index implies demand may suffer in anumber of major global dairy export markets.
o The appreciation of the Japanese yen has magnified theeffect of the commodity price falls in imported priceterms.
Fig 22: Exchange rates versus US$Fig 23: Import Affordability Index (SMP)
100 = Feb 2005
75
100
125
150
Sep-05 Sep-06 Sep-07 Sep-08 Sep-09China Indonesia Japan Korea Mexico Russia