data supporting anthropogenic global warmingmirrorofnature.org/globalwarmingdebatenesaps.pdf ·...
TRANSCRIPT
DATA SUPPORTING ANTHROPOGENIC
GLOBAL WARMING:
BALANCING ECOLOGY WITH ECONOMICS
I will present data supporting the American Physical Society (APS)
National Policy Statement:
“Emissions of greenhouse gases from human activities are changing
the atmosphere in ways that affect the Earth's climate… Global
warming is occurring.” http://www.aps.org/policy/statements/07_1.cfm
-
Paul H. Carr, Ph. D.
AF Research Laboratory & U Mass Lowell Emeritus
Web page: www.MirrorOfNature.org
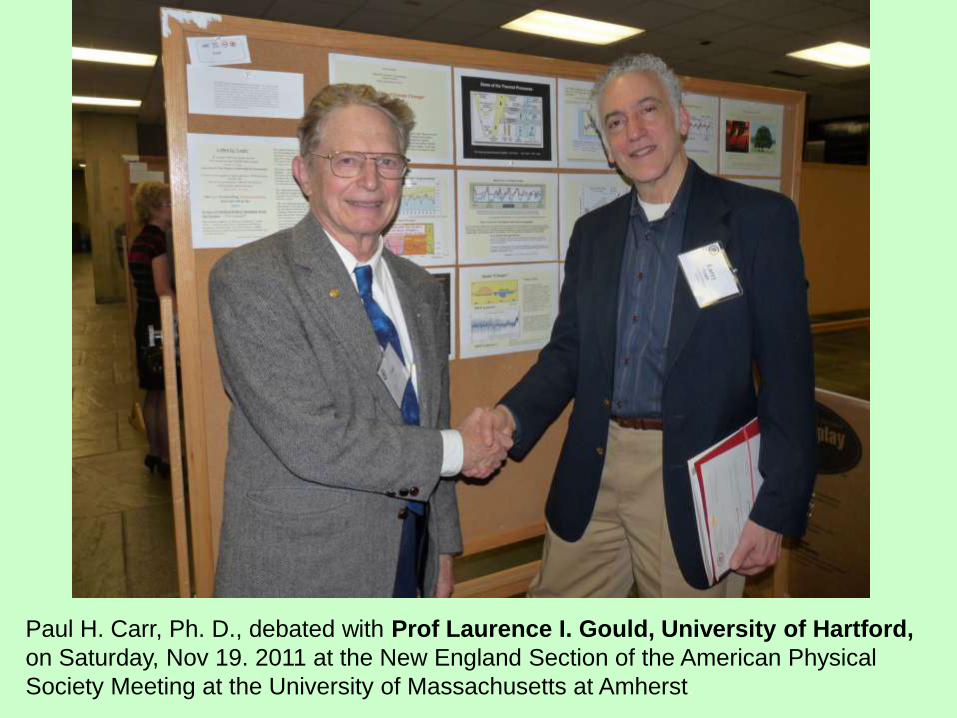
Paul H. Carr, Ph. D., debated with Prof Laurence I. Gould, University of Hartford,
on Saturday, Nov 19. 2011 at the New England Section of the American Physical
Society Meeting at the University of Massachusetts at Amherst.
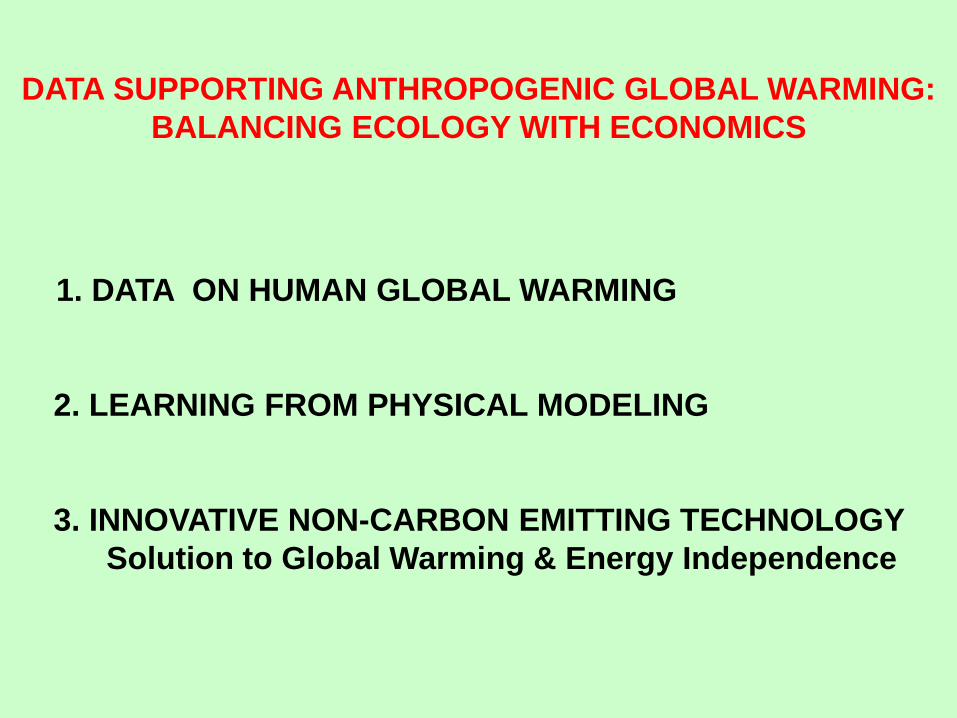
DATA SUPPORTING ANTHROPOGENIC GLOBAL WARMING:
BALANCING ECOLOGY WITH ECONOMICS
1. DATA ON HUMAN GLOBAL WARMING
2. LEARNING FROM PHYSICAL MODELING
3. INNOVATIVE NON-CARBON EMITTING TECHNOLOGY
Solution to Global Warming & Energy Independence
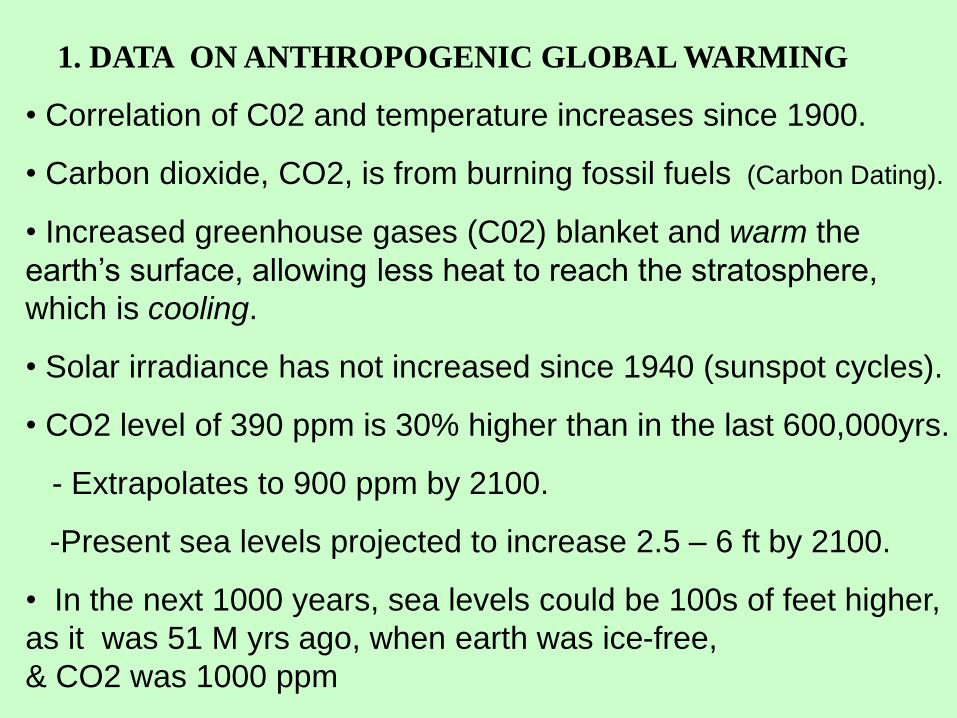
1. DATA ON ANTHROPOGENIC GLOBAL WARMING
• Correlation of C02 and temperature increases since 1900.
• Carbon dioxide, CO2, is from burning fossil fuels (Carbon Dating).
• Increased greenhouse gases (C02) blanket and warm the
earth’s surface, allowing less heat to reach the stratosphere,
which is cooling.
• Solar irradiance has not increased since 1940 (sunspot cycles).
• CO2 level of 390 ppm is 30% higher than in the last 600,000yrs.
- Extrapolates to 900 ppm by 2100.
-Present sea levels projected to increase 2.5 – 6 ft by 2100.
• In the next 1000 years, sea levels could be 100s of feet higher,
as it was 51 M yrs ago, when earth was ice-free,
& CO2 was 1000 ppm
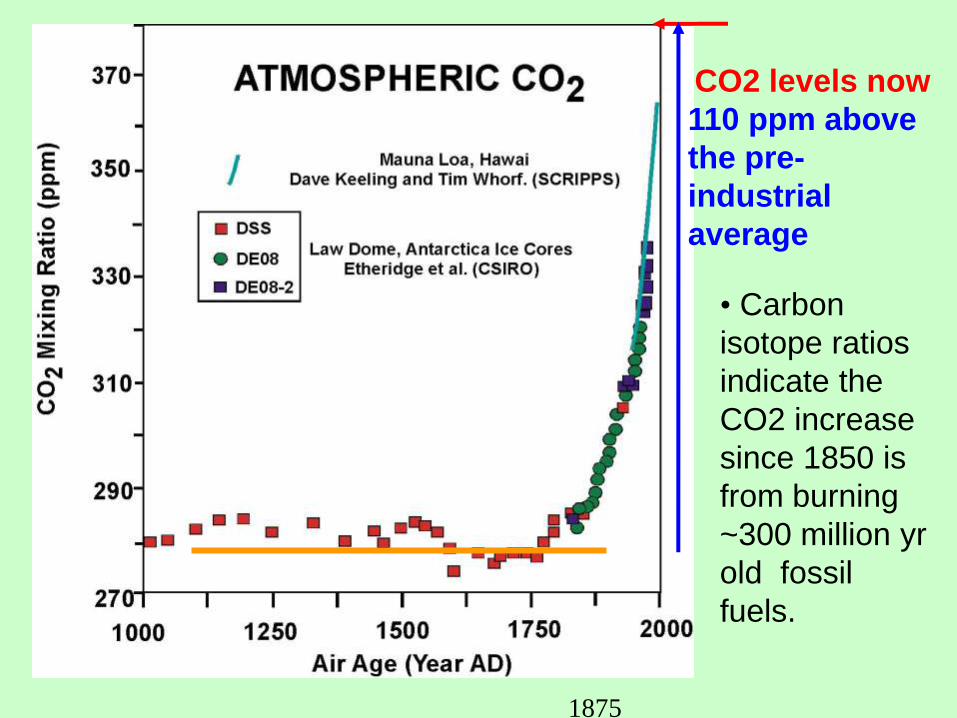
CO2 levels now
110 ppm above
the pre-
industrial
average
1875
• Carbon
isotope ratios
indicate the
CO2 increase
since 1850 is
from burning
~300 million yr
old fossil
fuels.
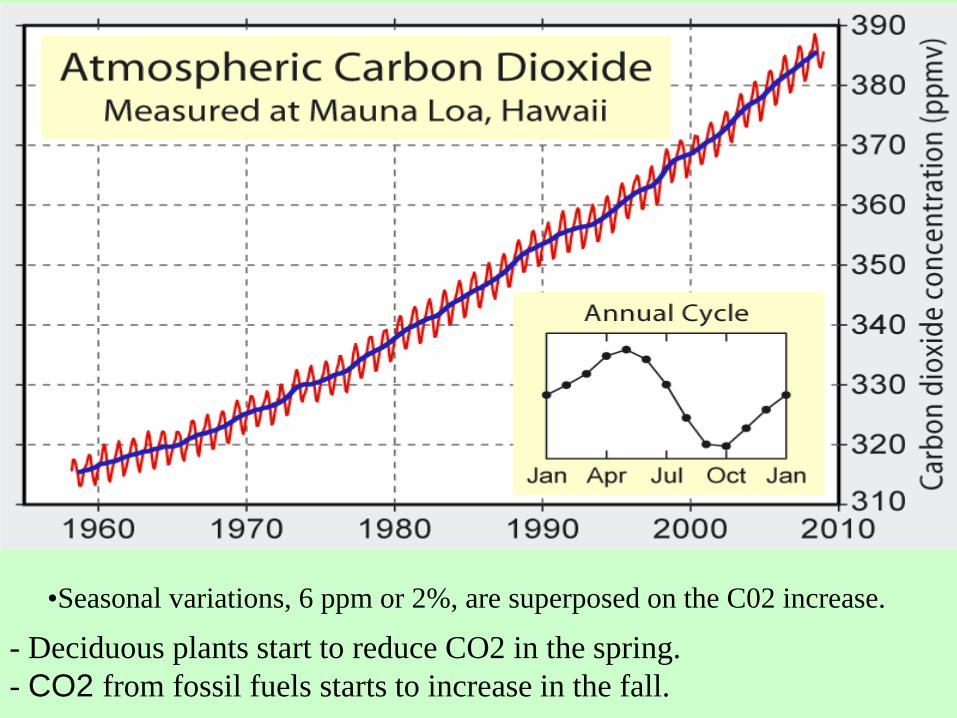
•Seasonal variations, 6 ppm or 2%, are superposed on the C02 increase.
- Deciduous plants start to reduce CO2 in the spring.
- CO2 from fossil fuels starts to increase in the fall.
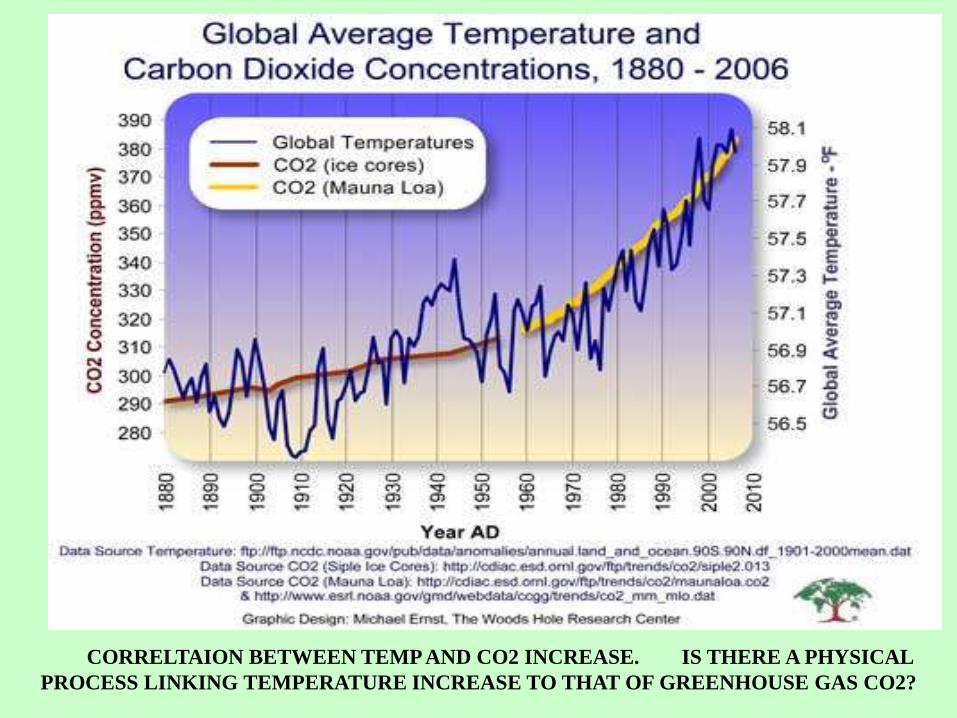
CORRELTAION BETWEEN TEMP AND CO2 INCREASE. IS THERE A PHYSICAL
PROCESS LINKING TEMPERATURE INCREASE TO THAT OF GREENHOUSE GAS CO2?
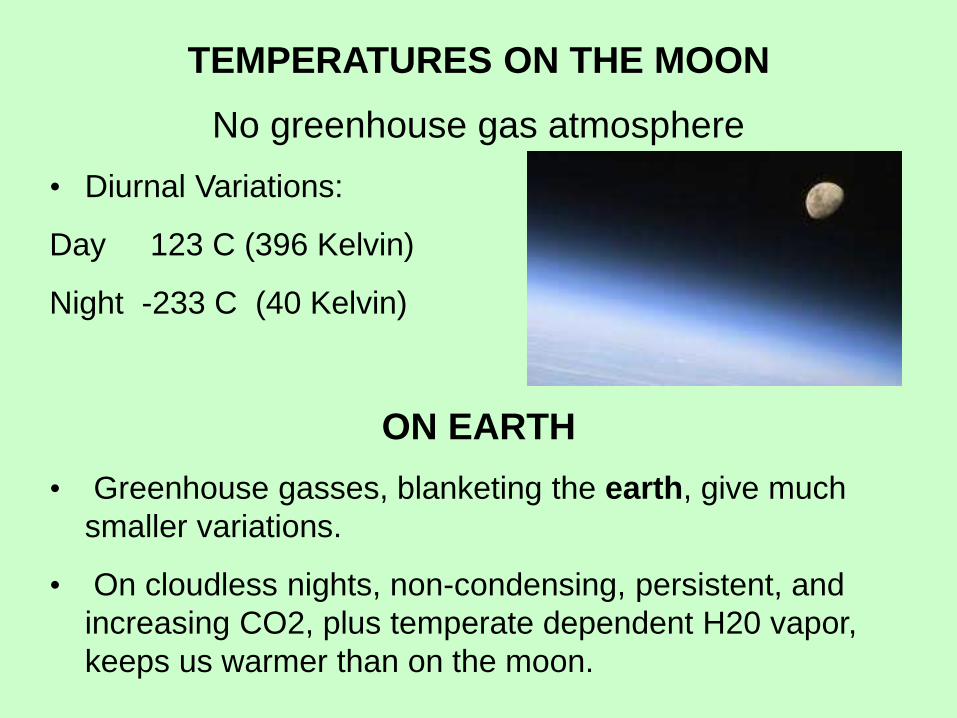
TEMPERATURES ON THE MOON
No greenhouse gas atmosphere
• Diurnal Variations:
Day 123 C (396 Kelvin)
Night -233 C (40 Kelvin)
ON EARTH
• Greenhouse gasses, blanketing the earth, give much
smaller variations.
• On cloudless nights, non-condensing, persistent, and
increasing CO2, plus temperate dependent H20 vapor,
keeps us warmer than on the moon.
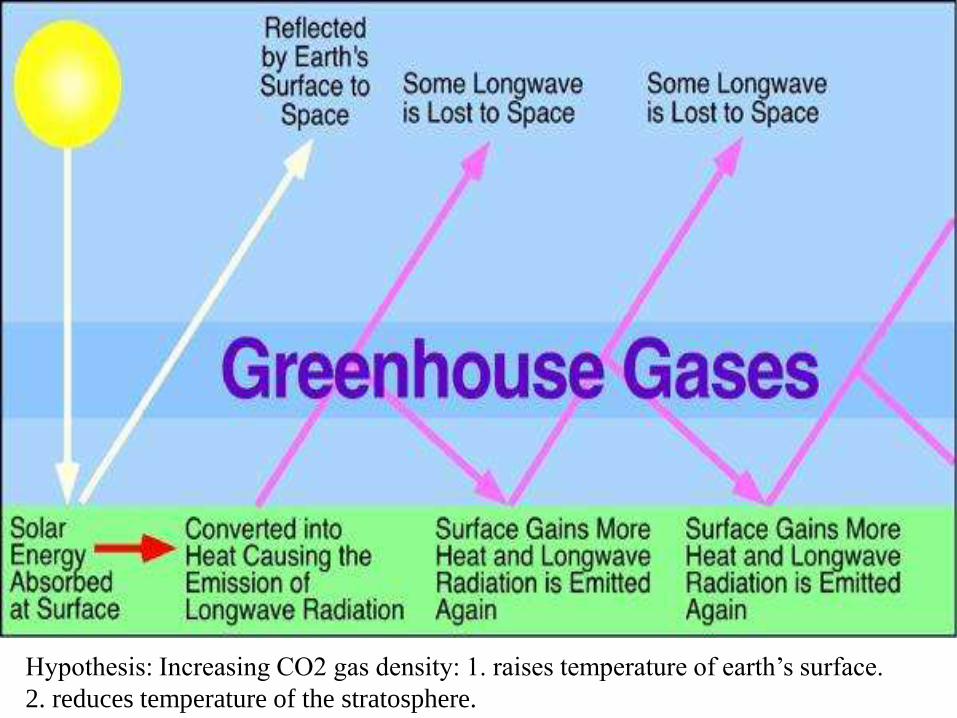
Hypothesis: Increasing CO2 gas density: 1. raises temperature of earth’s surface.
2. reduces temperature of the stratosphere.
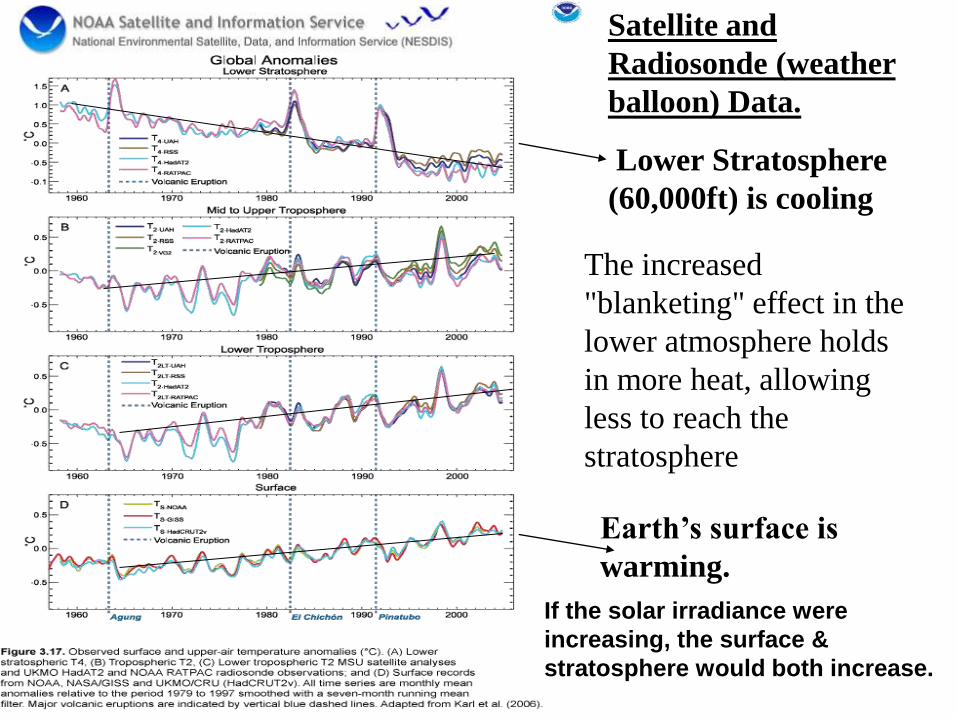
Satellite and
Radiosonde (weather
balloon) Data.
Lower Stratosphere
(60,000ft) is cooling
Earth’s surface is
warming.
The increased
"blanketing" effect in the
lower atmosphere holds
in more heat, allowing
less to reach the
stratosphere
If the solar irradiance were
increasing, the surface &
stratosphere would both increase.
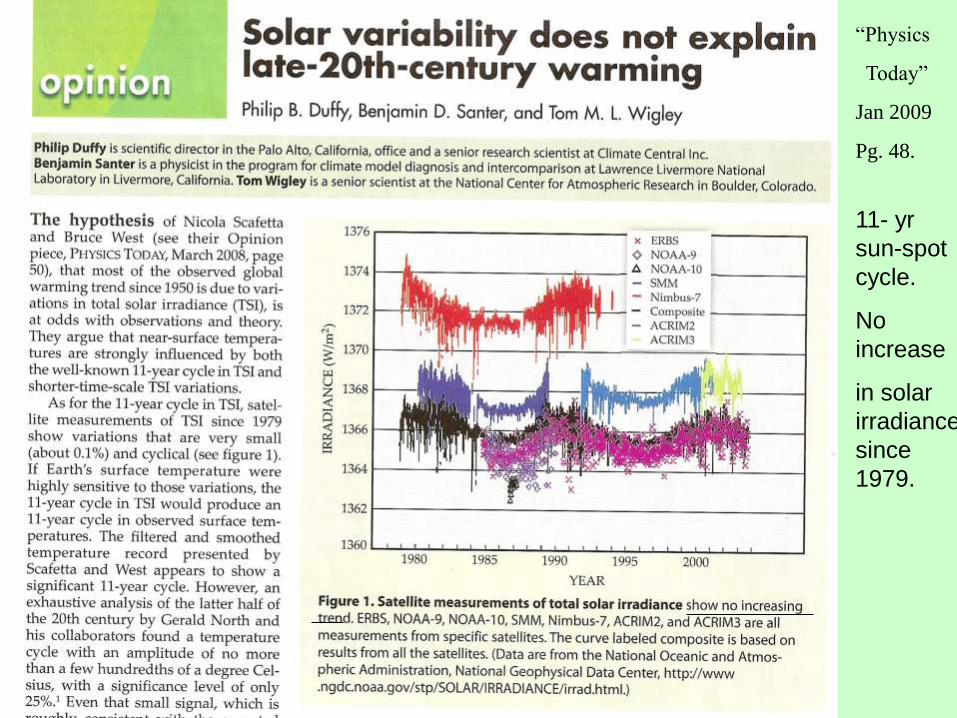
“Physics
Today”
Jan 2009
Pg. 48.
11- yr
sun-spot
cycle.
No
increase
in solar
irradiance
since
1979.
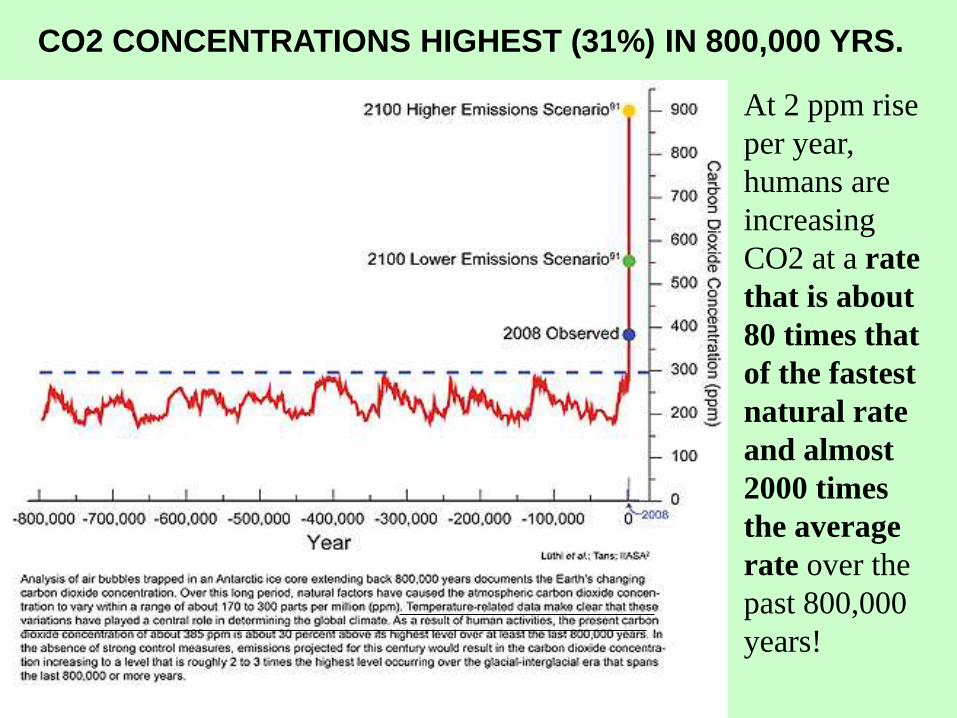
At 2 ppm rise
per year,
humans are
increasing
CO2 at a rate
that is about
80 times that
of the fastest
natural rate
and almost
2000 times
the average
rate over the
past 800,000
years!
CO2 CONCENTRATIONS HIGHEST (31%) IN 800,000 YRS.
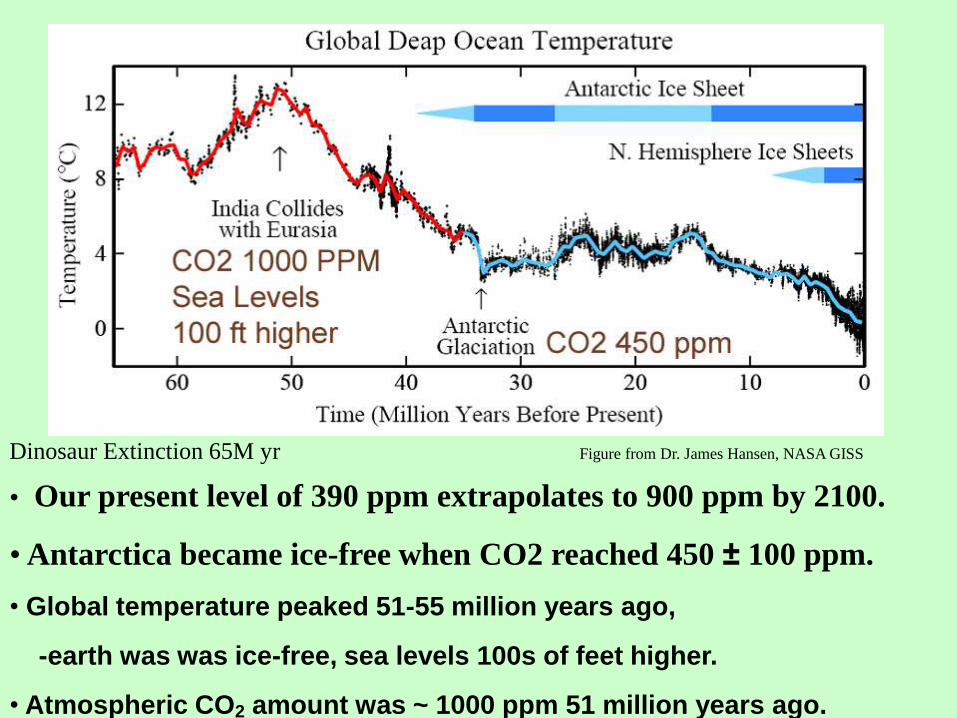
• Our present level of 390 ppm extrapolates to 900 ppm by 2100.
• Antarctica became ice-free when CO2 reached 450 ± 100 ppm.
• Global temperature peaked 51-55 million years ago,
-earth was was ice-free, sea levels 100s of feet higher.
• Atmospheric CO2 amount was ~ 1000 ppm 51 million years ago.
Dinosaur Extinction 65M yr Figure from Dr. James Hansen, NASA GISS
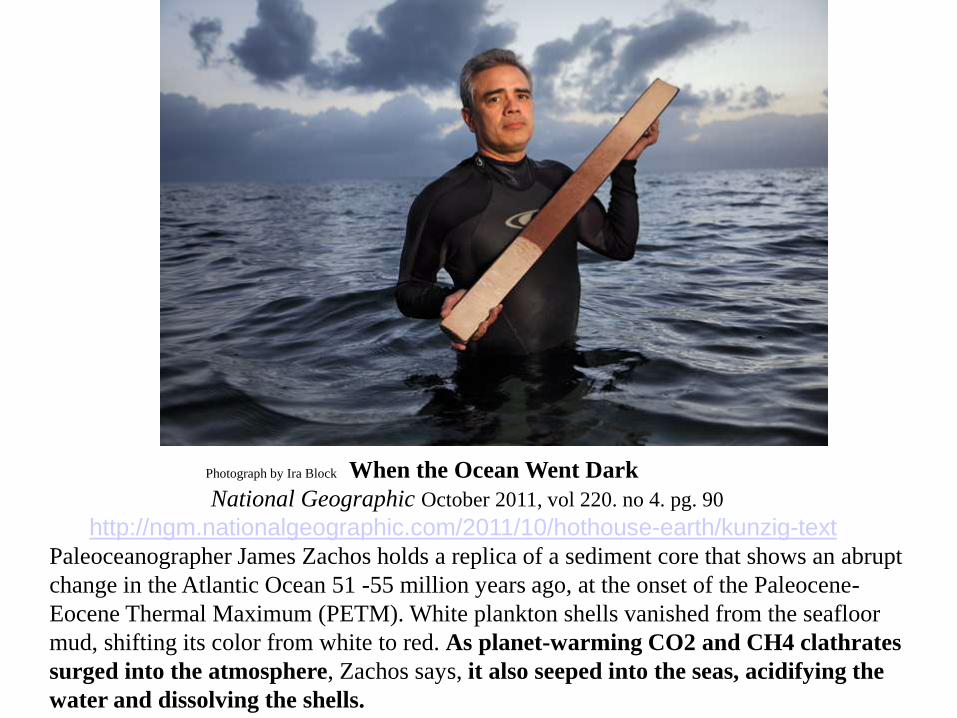
Photograph by Ira Block When the Ocean Went Dark
National Geographic October 2011, vol 220. no 4. pg. 90
http://ngm.nationalgeographic.com/2011/10/hothouse-earth/kunzig-text
Paleoceanographer James Zachos holds a replica of a sediment core that shows an abrupt
change in the Atlantic Ocean 51 -55 million years ago, at the onset of the Paleocene-
Eocene Thermal Maximum (PETM). White plankton shells vanished from the seafloor
mud, shifting its color from white to red. As planet-warming CO2 and CH4 clathrates
surged into the atmosphere, Zachos says, it also seeped into the seas, acidifying the
water and dissolving the shells.
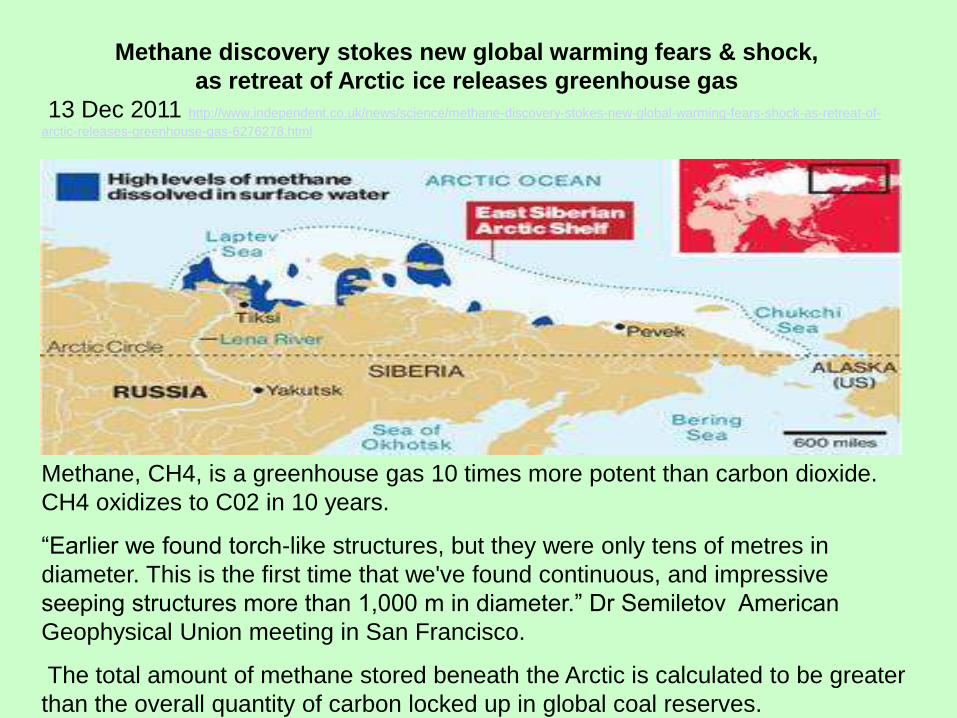
Methane discovery stokes new global warming fears & shock,
as retreat of Arctic ice releases greenhouse gas
13 Dec 2011 http://www.independent.co.uk/news/science/methane-discovery-stokes-new-global-warming-fears-shock-as-retreat-of-
arctic-releases-greenhouse-gas-6276278.html
Methane, CH4, is a greenhouse gas 10 times more potent than carbon dioxide.
CH4 oxidizes to C02 in 10 years.
“Earlier we found torch-like structures, but they were only tens of metres in
diameter. This is the first time that we've found continuous, and impressive
seeping structures more than 1,000 m in diameter.” Dr Semiletov American
Geophysical Union meeting in San Francisco.
The total amount of methane stored beneath the Arctic is calculated to be greater
than the overall quantity of carbon locked up in global coal reserves.
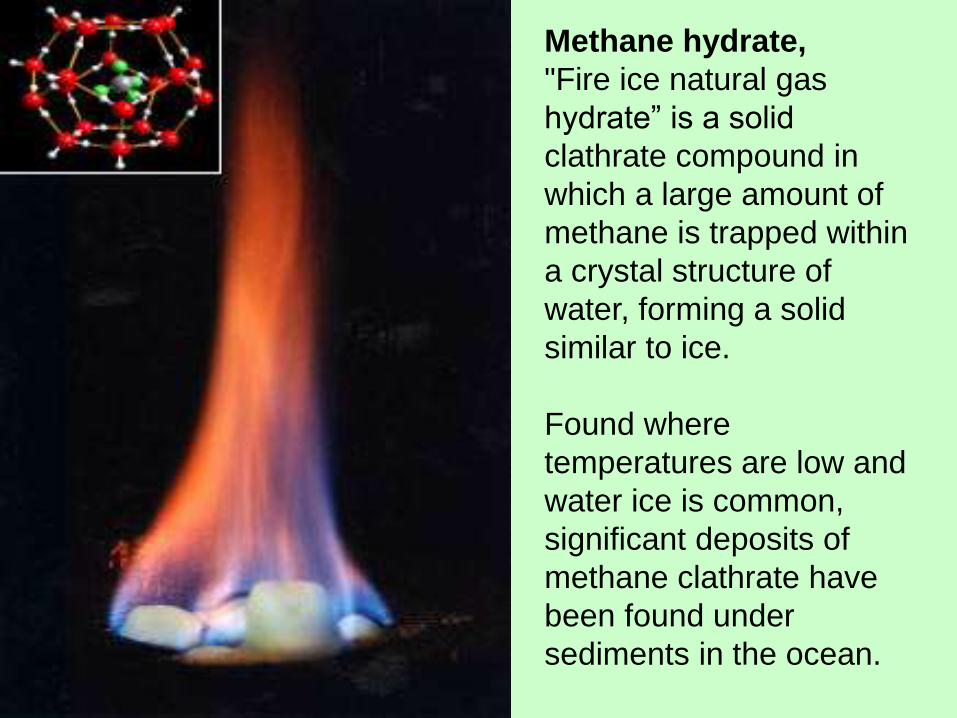
Methane hydrate,
"Fire ice natural gas
hydrate” is a solid
clathrate compound in
which a large amount of
methane is trapped within
a crystal structure of
water, forming a solid
similar to ice.
Found where
temperatures are low and
water ice is common,
significant deposits of
methane clathrate have
been found under
sediments in the ocean.
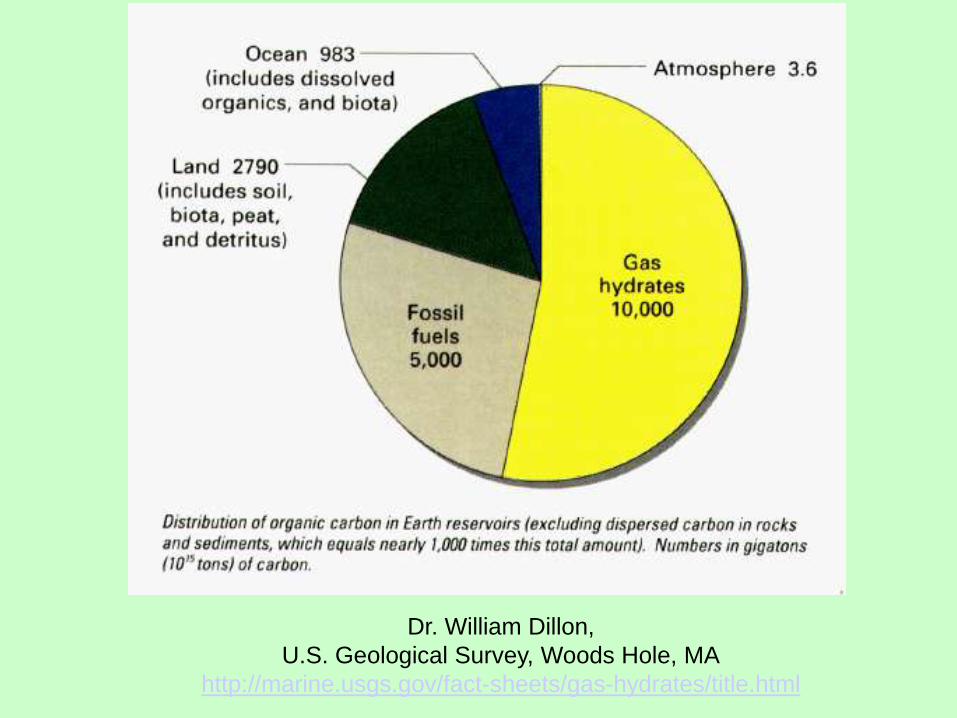
Dr. William Dillon,
U.S. Geological Survey, Woods Hole, MA
http://marine.usgs.gov/fact-sheets/gas-hydrates/title.html
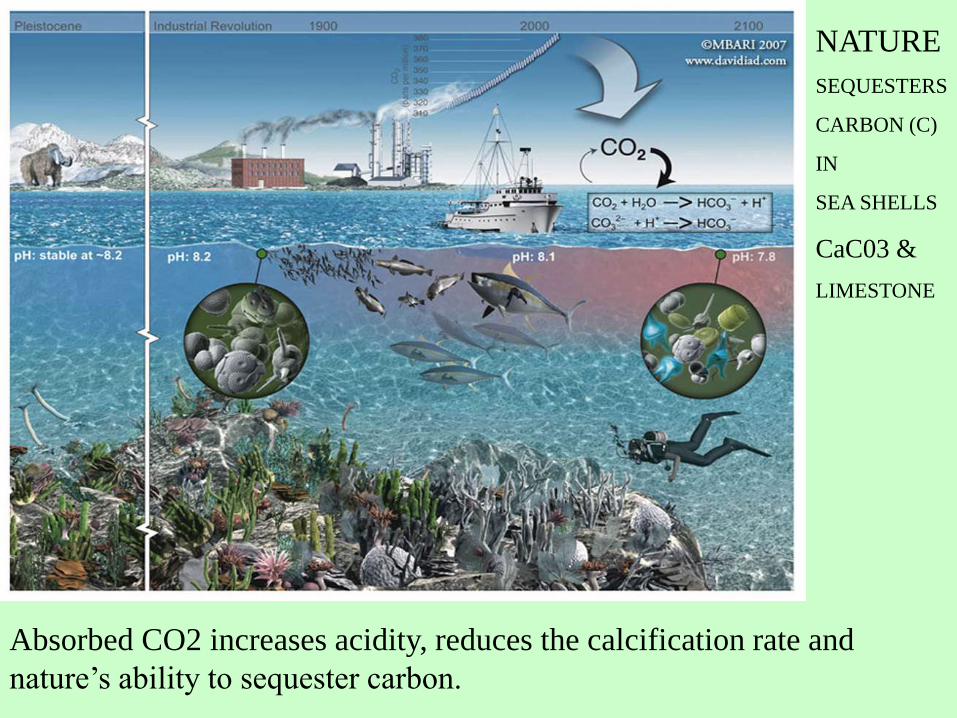
Absorbed CO2 increases acidity, reduces the calcification rate and
nature’s ability to sequester carbon.
NATURE
SEQUESTERS
CARBON (C)
IN
SEA SHELLS
CaC03 &
LIMESTONE
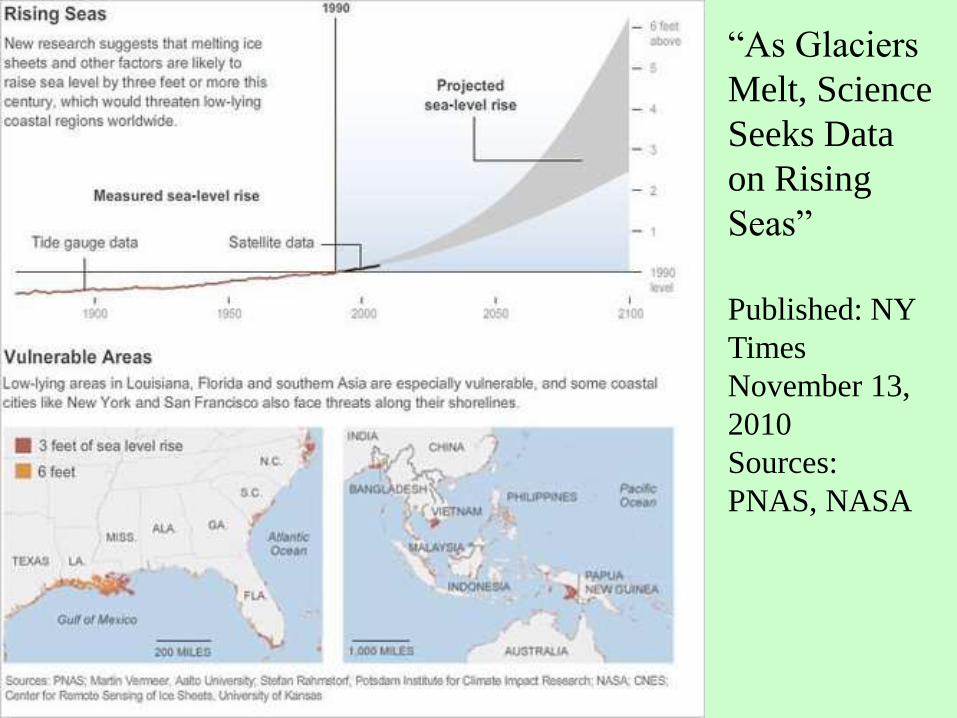
“As Glaciers
Melt, Science
Seeks Data
on Rising
Seas”
Published: NY
Times
November 13,
2010
Sources:
PNAS, NASA
STORMS OF MY GRANDCHILDREN:
The Truth About the Coming Climate
Catastrophe and Our Last Chance to Save
Humanity (2010)
By James Hansen
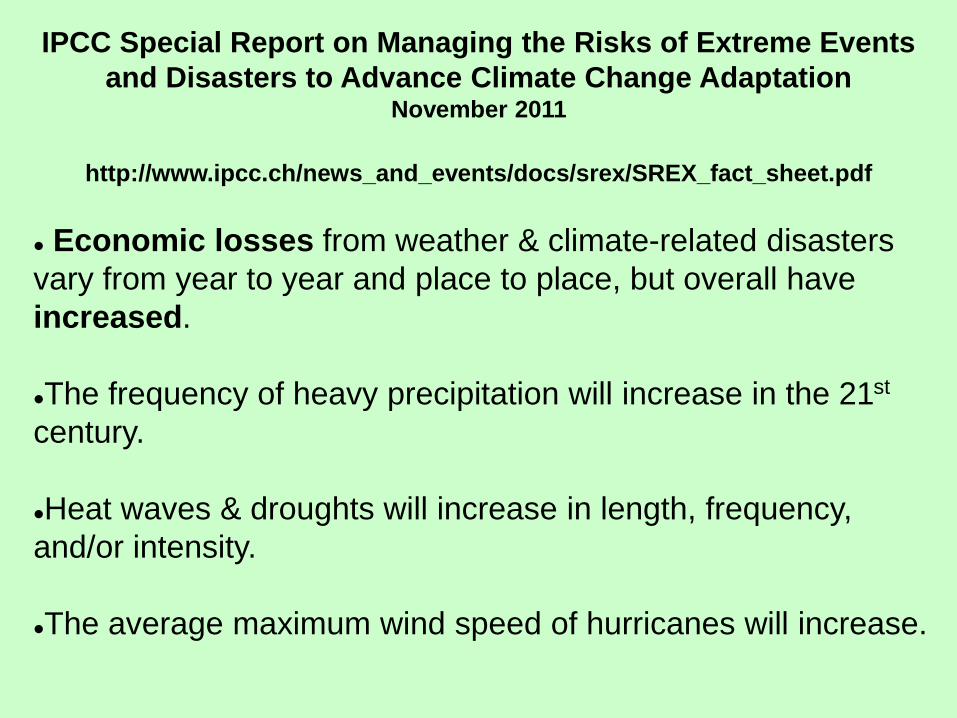
IPCC Special Report on Managing the Risks of Extreme Events
and Disasters to Advance Climate Change Adaptation November 2011
http://www.ipcc.ch/news_and_events/docs/srex/SREX_fact_sheet.pdf
Economic losses from weather & climate-related disasters
vary from year to year and place to place, but overall have
increased.
The frequency of heavy precipitation will increase in the 21st
century.
Heat waves & droughts will increase in length, frequency,
and/or intensity.
The average maximum wind speed of hurricanes will increase.
GLOBAL WAMING OVER THE CENTURIES
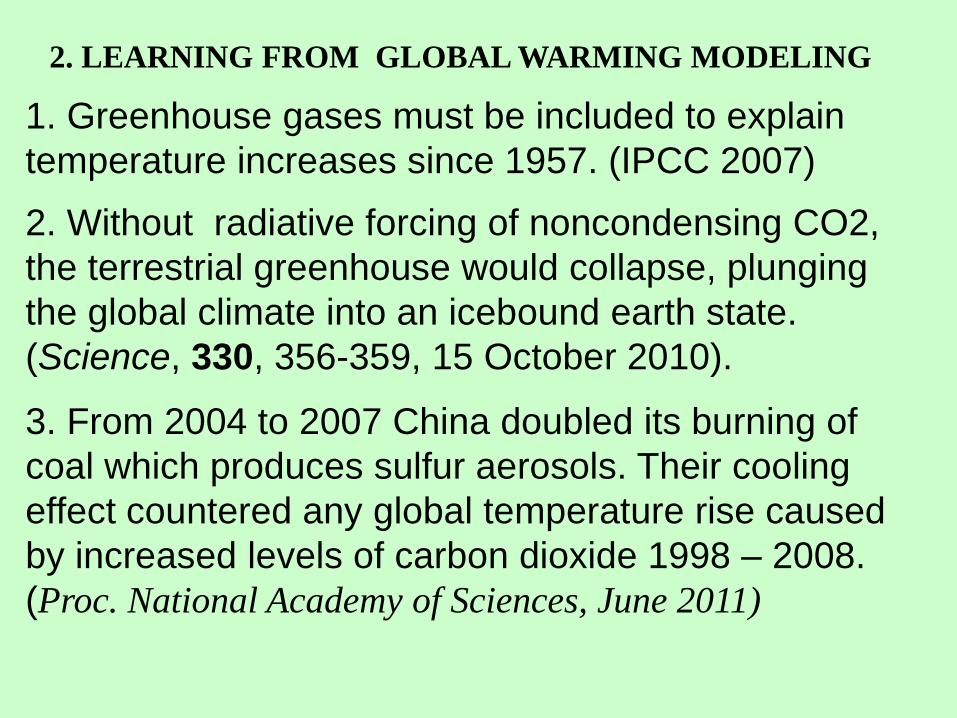
2. LEARNING FROM GLOBAL WARMING MODELING
1. Greenhouse gases must be included to explain
temperature increases since 1957. (IPCC 2007)
2. Without radiative forcing of noncondensing CO2,
the terrestrial greenhouse would collapse, plunging
the global climate into an icebound earth state.
(Science, 330, 356-359, 15 October 2010).
3. From 2004 to 2007 China doubled its burning of
coal which produces sulfur aerosols. Their cooling
effect countered any global temperature rise caused
by increased levels of carbon dioxide 1998 – 2008.
(Proc. National Academy of Sciences, June 2011)
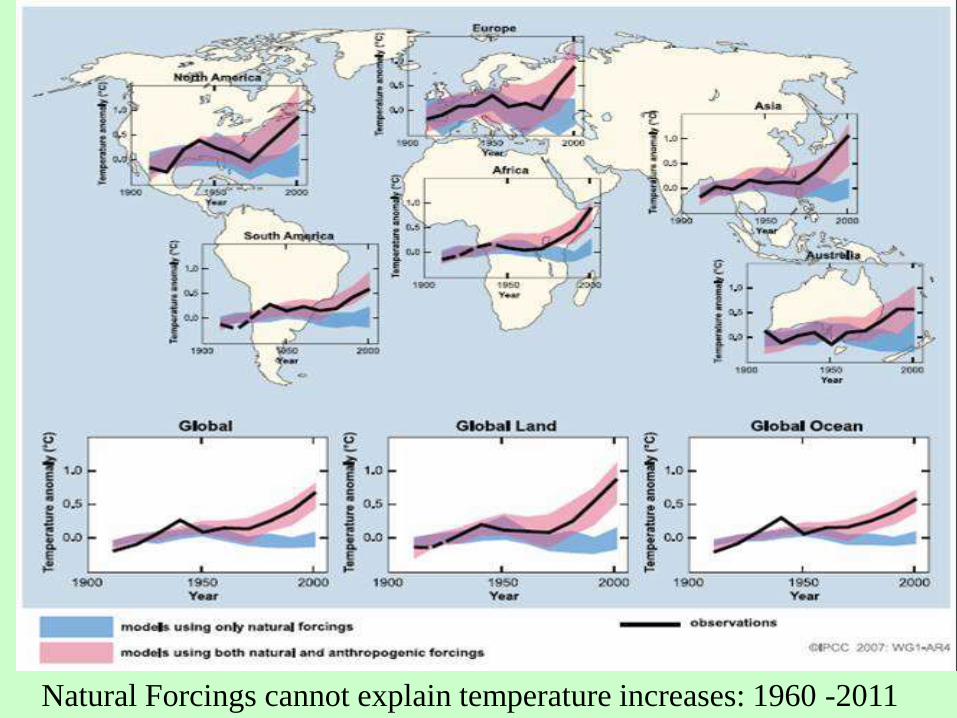
Natural Forcings cannot explain temperature increases: 1960 -2011
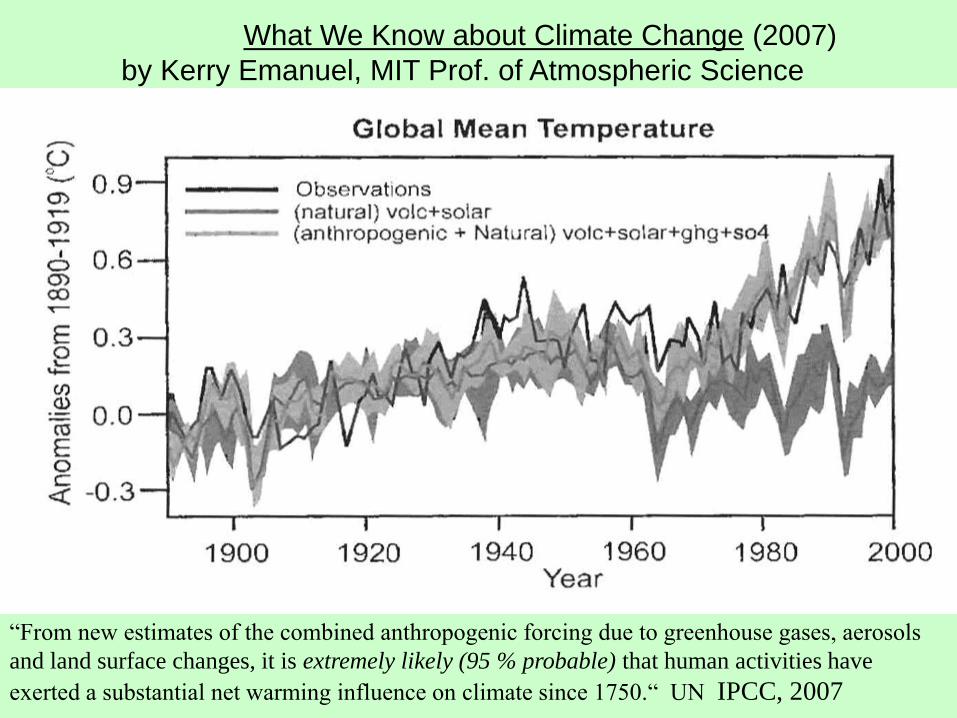
What We Know about Climate Change (2007)
by Kerry Emanuel, MIT Prof. of Atmospheric Science
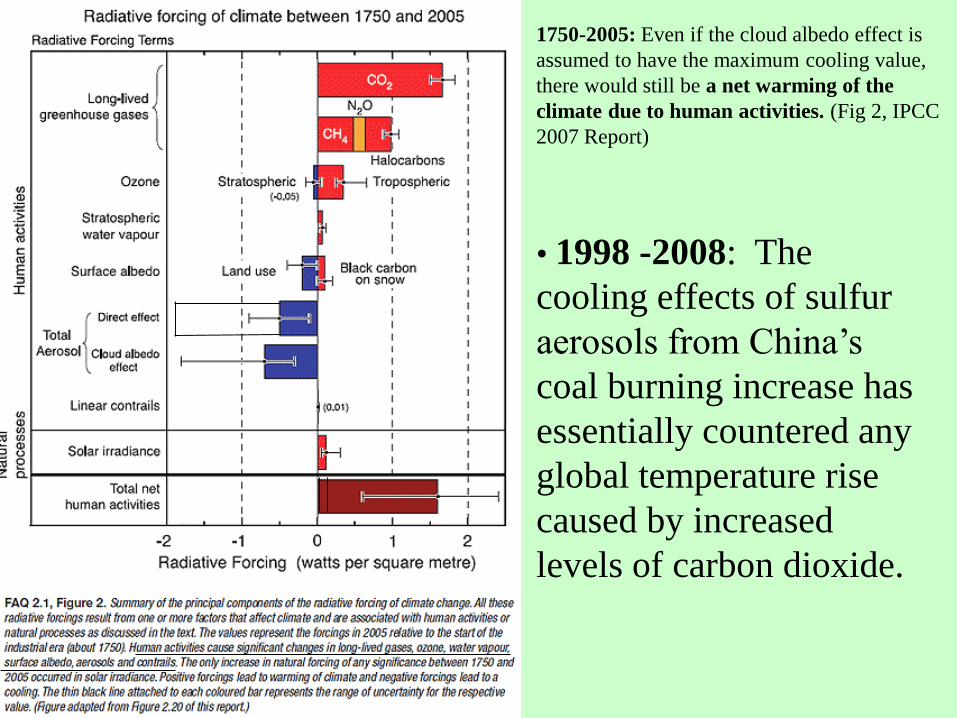
“From new estimates of the combined anthropogenic forcing due to greenhouse gases, aerosols
and land surface changes, it is extremely likely (95 % probable) that human activities have
exerted a substantial net warming influence on climate since 1750.“ UN IPCC, 2007
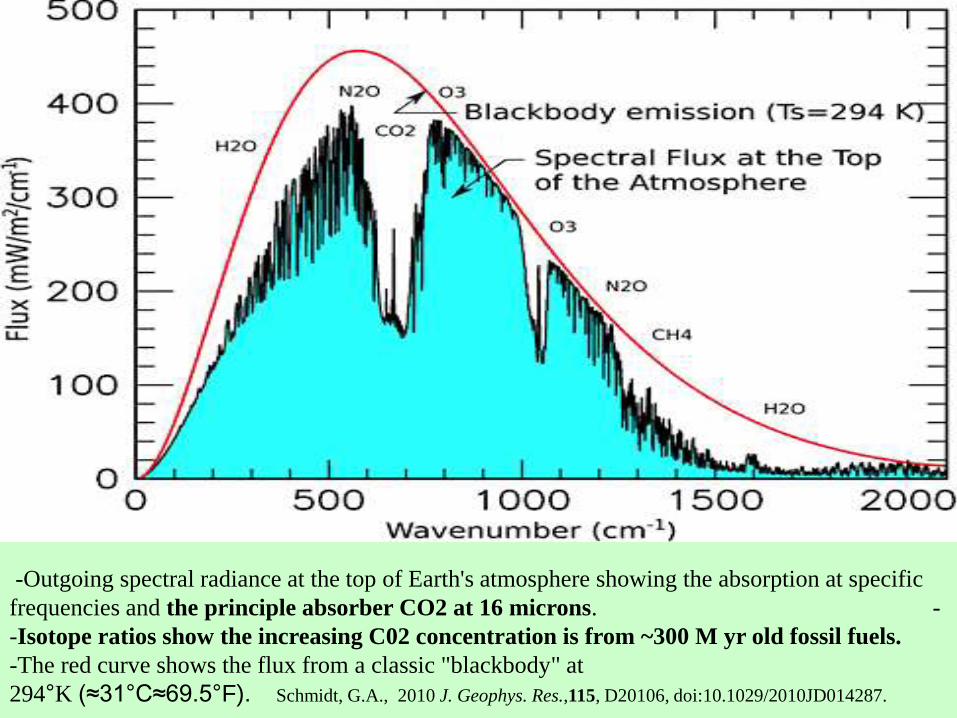
-Outgoing spectral radiance at the top of Earth's atmosphere showing the absorption at specific
frequencies and the principle absorber CO2 at 16 microns. -
-Isotope ratios show the increasing C02 concentration is from ~300 M yr old fossil fuels.
-The red curve shows the flux from a classic "blackbody" at
294°K (≈31°C≈69.5°F). Schmidt, G.A., 2010 J. Geophys. Res.,115, D20106, doi:10.1029/2010JD014287.
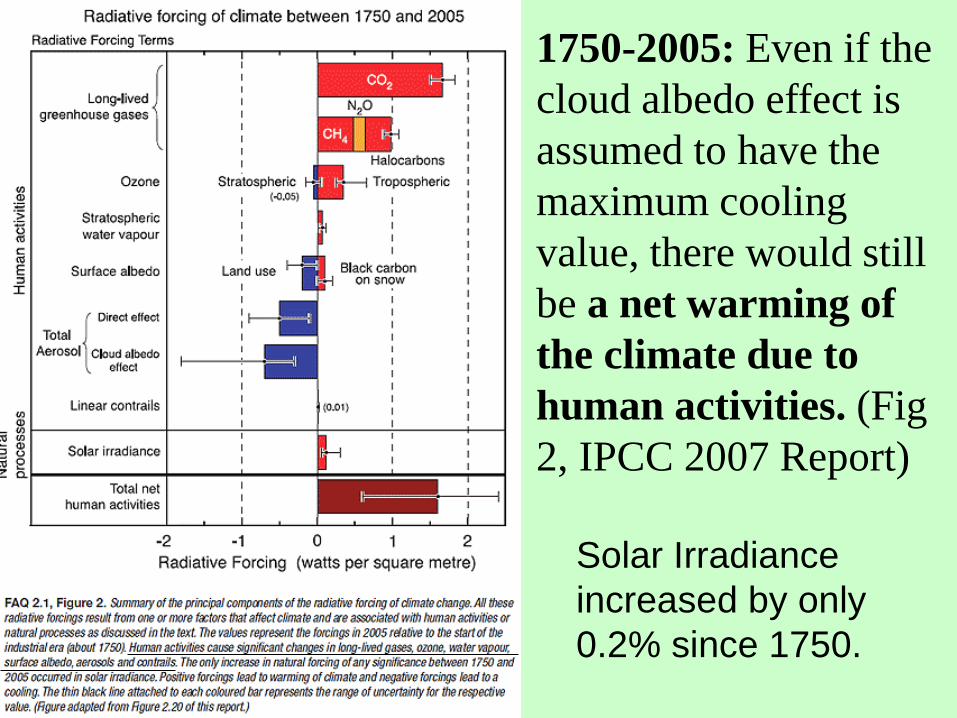
1750-2005: Even if the
cloud albedo effect is
assumed to have the
maximum cooling
value, there would still
be a net warming of
the climate due to
human activities. (Fig
2, IPCC 2007 Report)
Solar Irradiance
increased by only
0.2% since 1750.
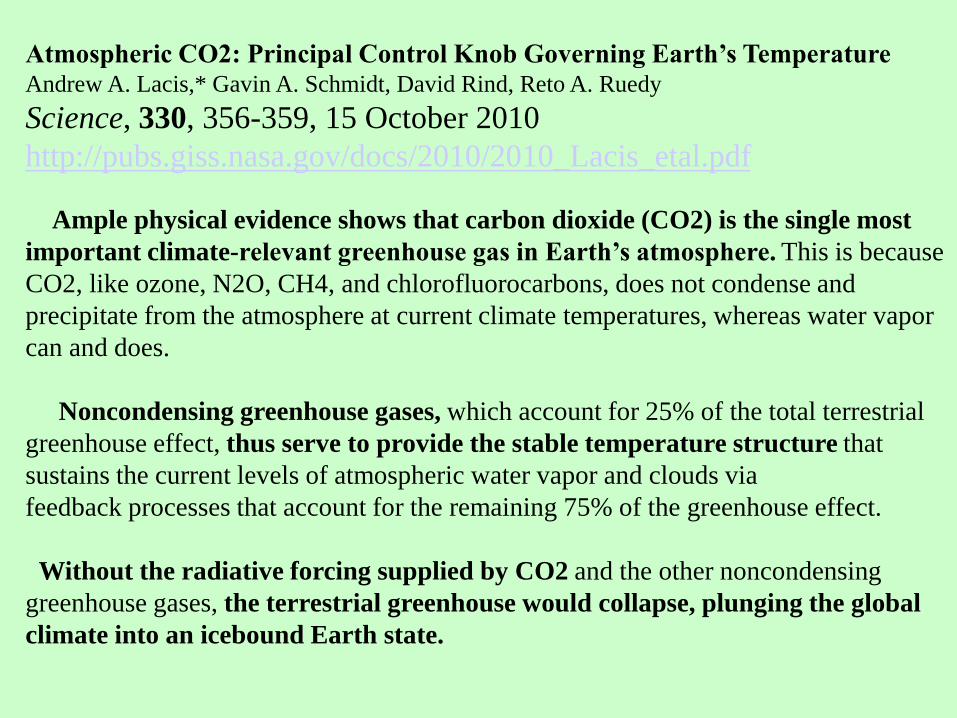
Atmospheric CO2: Principal Control Knob Governing Earth’s Temperature Andrew A. Lacis,* Gavin A. Schmidt, David Rind, Reto A. Ruedy
Science, 330, 356-359, 15 October 2010
http://pubs.giss.nasa.gov/docs/2010/2010_Lacis_etal.pdf
Ample physical evidence shows that carbon dioxide (CO2) is the single most
important climate-relevant greenhouse gas in Earth’s atmosphere. This is because
CO2, like ozone, N2O, CH4, and chlorofluorocarbons, does not condense and
precipitate from the atmosphere at current climate temperatures, whereas water vapor
can and does.
Noncondensing greenhouse gases, which account for 25% of the total terrestrial
greenhouse effect, thus serve to provide the stable temperature structure that
sustains the current levels of atmospheric water vapor and clouds via
feedback processes that account for the remaining 75% of the greenhouse effect.
Without the radiative forcing supplied by CO2 and the other noncondensing
greenhouse gases, the terrestrial greenhouse would collapse, plunging the global
climate into an icebound Earth state.
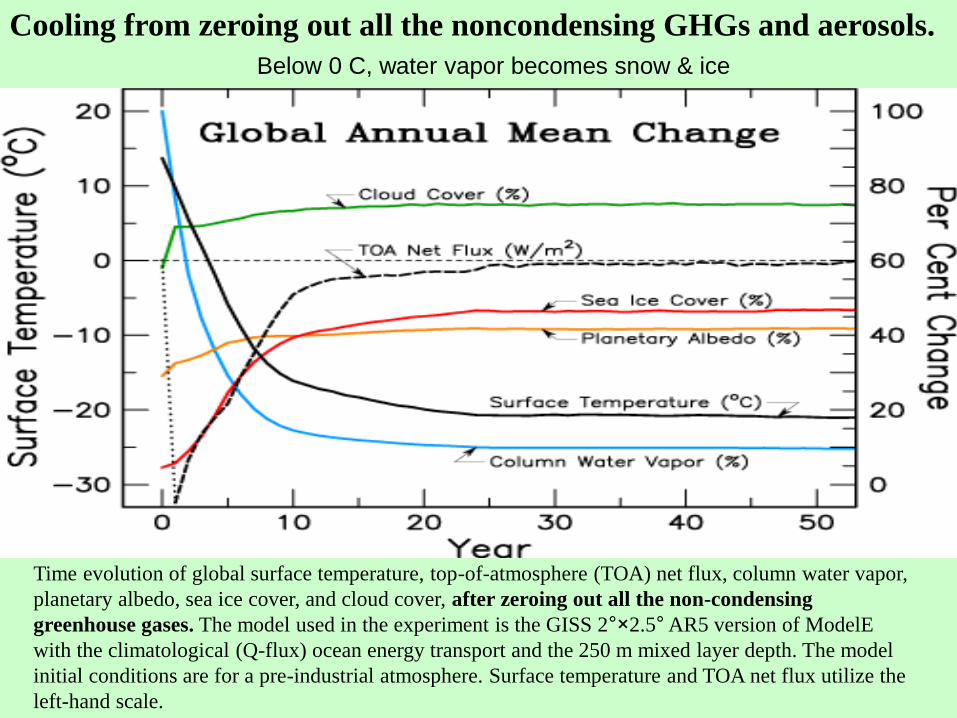
Time evolution of global surface temperature, top-of-atmosphere (TOA) net flux, column water vapor,
planetary albedo, sea ice cover, and cloud cover, after zeroing out all the non-condensing
greenhouse gases. The model used in the experiment is the GISS 2°×2.5° AR5 version of ModelE
with the climatological (Q-flux) ocean energy transport and the 250 m mixed layer depth. The model
initial conditions are for a pre-industrial atmosphere. Surface temperature and TOA net flux utilize the
left-hand scale.
Cooling from zeroing out all the noncondensing GHGs and aerosols.
Below 0 C, water vapor becomes snow & ice
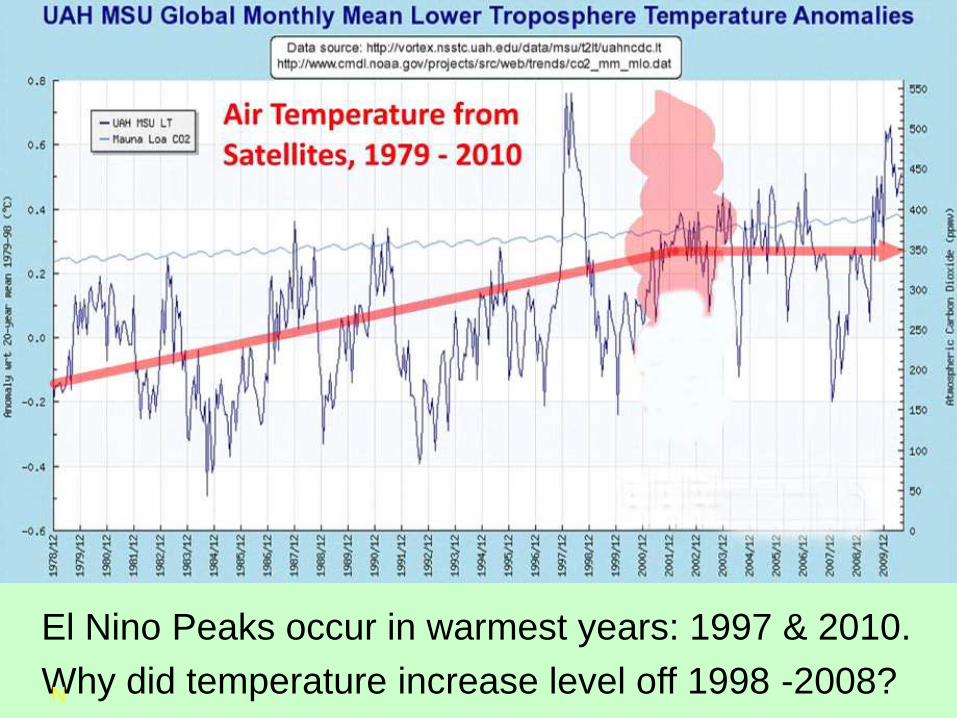
El Nino Peaks occur in warmest years: 1997 & 2010.
Why did temperature increase level off 1998 -2008? N
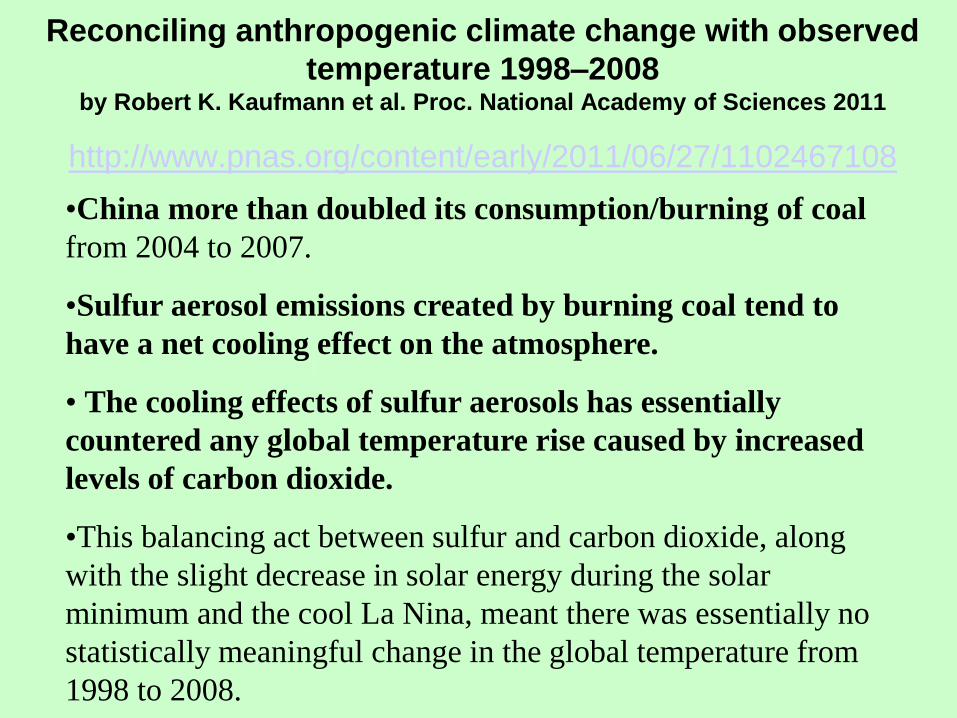
Reconciling anthropogenic climate change with observed
temperature 1998–2008 by Robert K. Kaufmann et al. Proc. National Academy of Sciences 2011
http://www.pnas.org/content/early/2011/06/27/1102467108 •China more than doubled its consumption/burning of coal
from 2004 to 2007.
•Sulfur aerosol emissions created by burning coal tend to
have a net cooling effect on the atmosphere.
• The cooling effects of sulfur aerosols has essentially
countered any global temperature rise caused by increased
levels of carbon dioxide.
•This balancing act between sulfur and carbon dioxide, along
with the slight decrease in solar energy during the solar
minimum and the cool La Nina, meant there was essentially no
statistically meaningful change in the global temperature from
1998 to 2008.
1750-2005: Even if the cloud albedo effect is
assumed to have the maximum cooling value,
there would still be a net warming of the
climate due to human activities. (Fig 2, IPCC
2007 Report)
• 1998 -2008: The
cooling effects of sulfur
aerosols from China’s
coal burning increase has
essentially countered any
global temperature rise
caused by increased
levels of carbon dioxide.
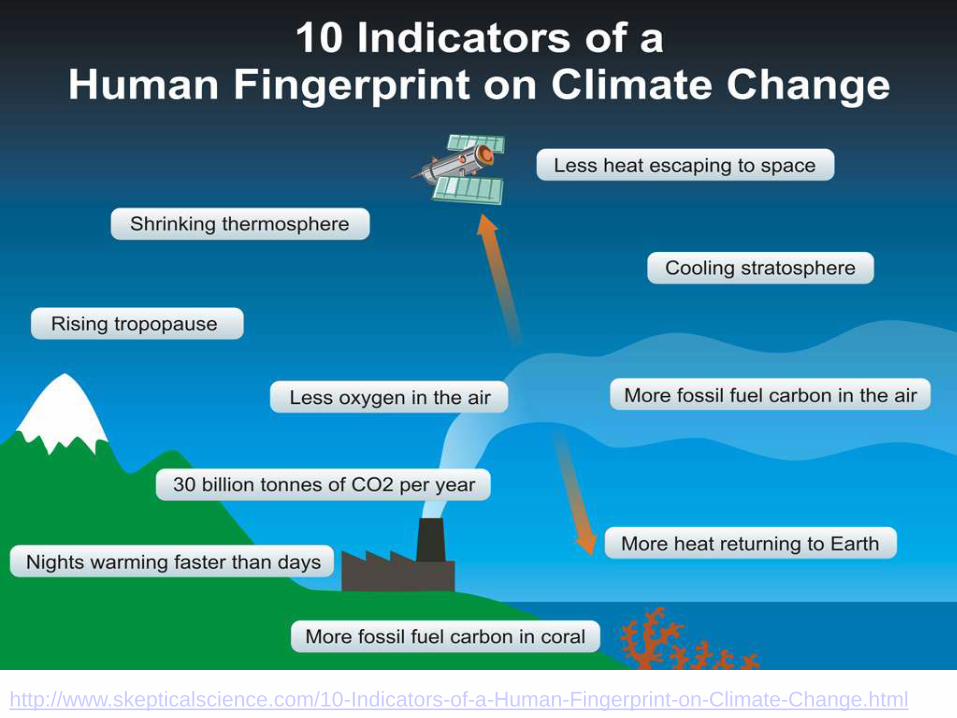
http://www.skepticalscience.com/10-Indicators-of-a-Human-Fingerprint-on-Climate-Change.html
3. INNOVATIVE NON-CARBON EMITTING TECHNOLOGY
- THE US SPENDS $365 B PER YEAR ON IMPORTED OIL
- THE SOLUTION TO ENERGY INDEPENDENCE &
GLOBAL WARMING IS THE SAME.
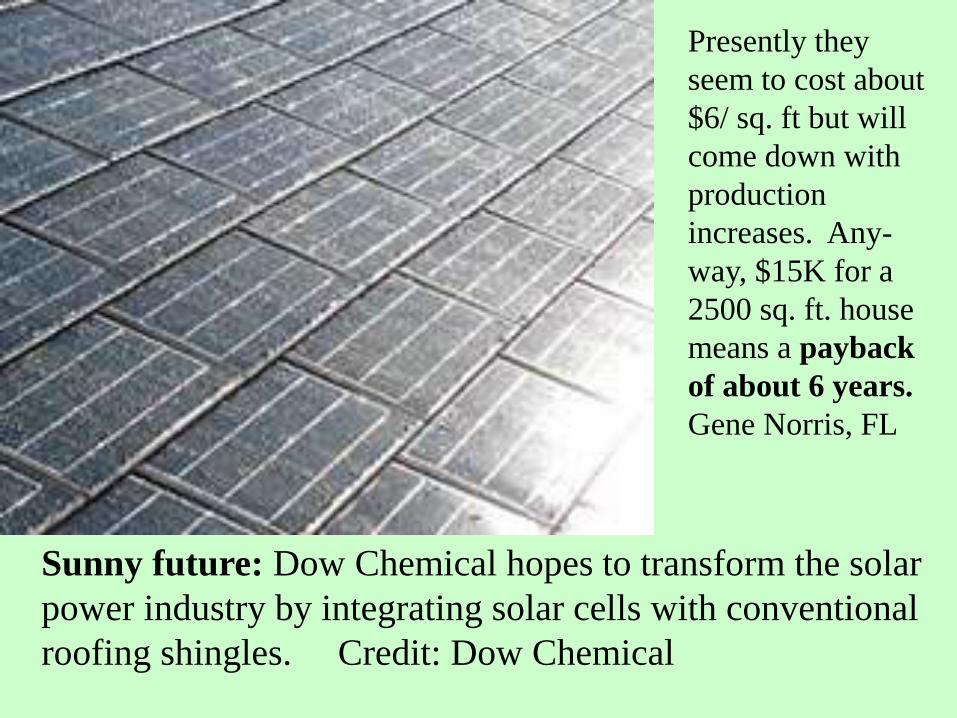
Sunny future: Dow Chemical hopes to transform the solar
power industry by integrating solar cells with conventional
roofing shingles. Credit: Dow Chemical
Presently they
seem to cost about
$6/ sq. ft but will
come down with
production
increases. Any-
way, $15K for a
2500 sq. ft. house
means a payback
of about 6 years.
Gene Norris, FL
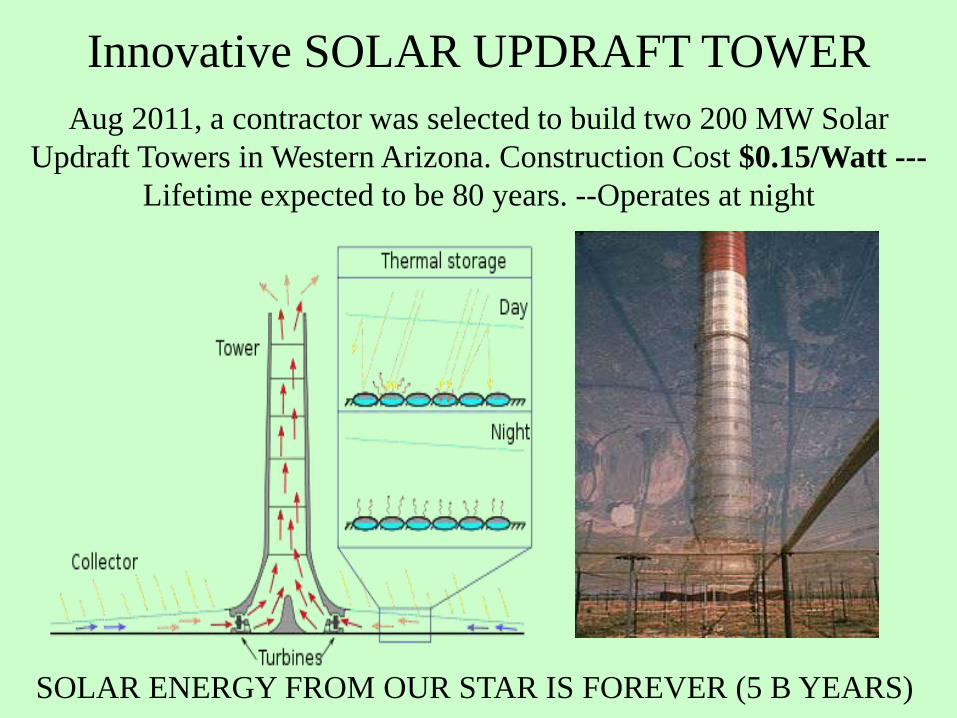
Innovative SOLAR UPDRAFT TOWER
Aug 2011, a contractor was selected to build two 200 MW Solar
Updraft Towers in Western Arizona. Construction Cost $0.15/Watt ---
Lifetime expected to be 80 years. --Operates at night
SOLAR ENERGY FROM OUR STAR IS FOREVER (5 B YEARS)
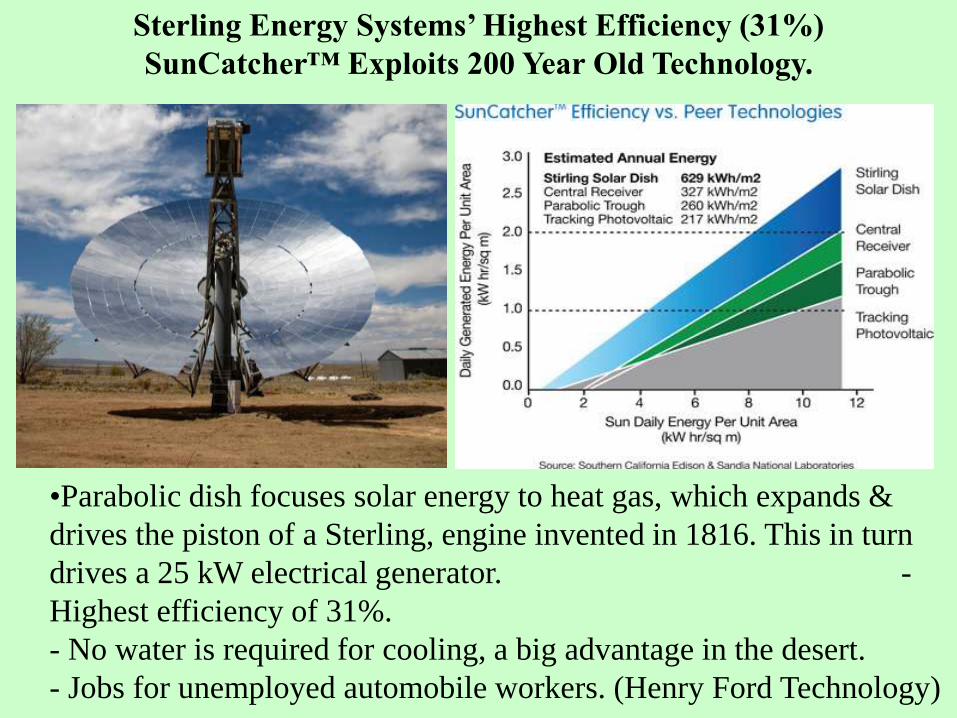
•Parabolic dish focuses solar energy to heat gas, which expands &
drives the piston of a Sterling, engine invented in 1816. This in turn
drives a 25 kW electrical generator. -
Highest efficiency of 31%.
- No water is required for cooling, a big advantage in the desert.
- Jobs for unemployed automobile workers. (Henry Ford Technology)
Sterling Energy Systems’ Highest Efficiency (31%)
SunCatcher™ Exploits 200 Year Old Technology.
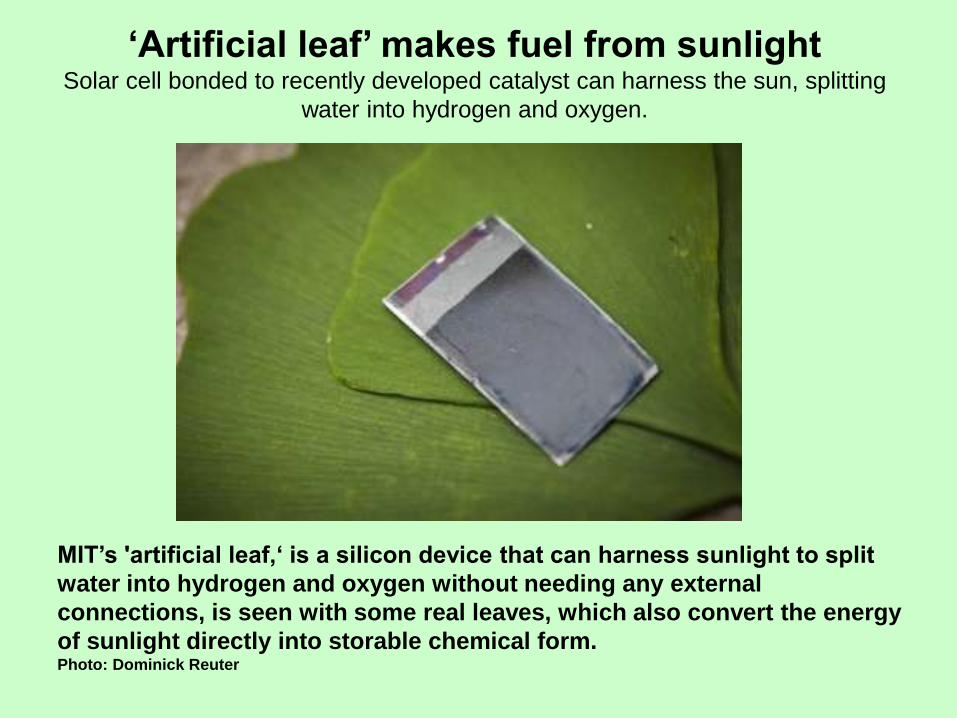
‘Artificial leaf’ makes fuel from sunlight Solar cell bonded to recently developed catalyst can harness the sun, splitting
water into hydrogen and oxygen.
MIT’s 'artificial leaf,‘ is a silicon device that can harness sunlight to split
water into hydrogen and oxygen without needing any external
connections, is seen with some real leaves, which also convert the energy
of sunlight directly into storable chemical form. Photo: Dominick Reuter
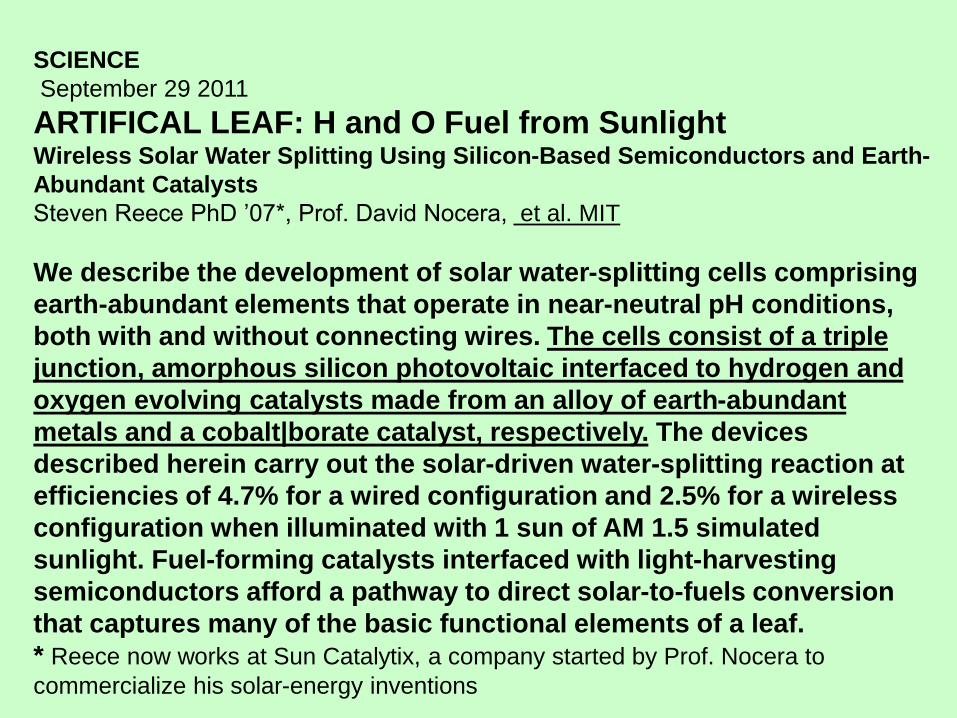
SCIENCE
September 29 2011
ARTIFICAL LEAF: H and O Fuel from Sunlight Wireless Solar Water Splitting Using Silicon-Based Semiconductors and Earth-
Abundant Catalysts
Steven Reece PhD ’07*, Prof. David Nocera, et al. MIT
We describe the development of solar water-splitting cells comprising
earth-abundant elements that operate in near-neutral pH conditions,
both with and without connecting wires. The cells consist of a triple
junction, amorphous silicon photovoltaic interfaced to hydrogen and
oxygen evolving catalysts made from an alloy of earth-abundant
metals and a cobalt|borate catalyst, respectively. The devices
described herein carry out the solar-driven water-splitting reaction at
efficiencies of 4.7% for a wired configuration and 2.5% for a wireless
configuration when illuminated with 1 sun of AM 1.5 simulated
sunlight. Fuel-forming catalysts interfaced with light-harvesting
semiconductors afford a pathway to direct solar-to-fuels conversion
that captures many of the basic functional elements of a leaf.
* Reece now works at Sun Catalytix, a company started by Prof. Nocera to
commercialize his solar-energy inventions
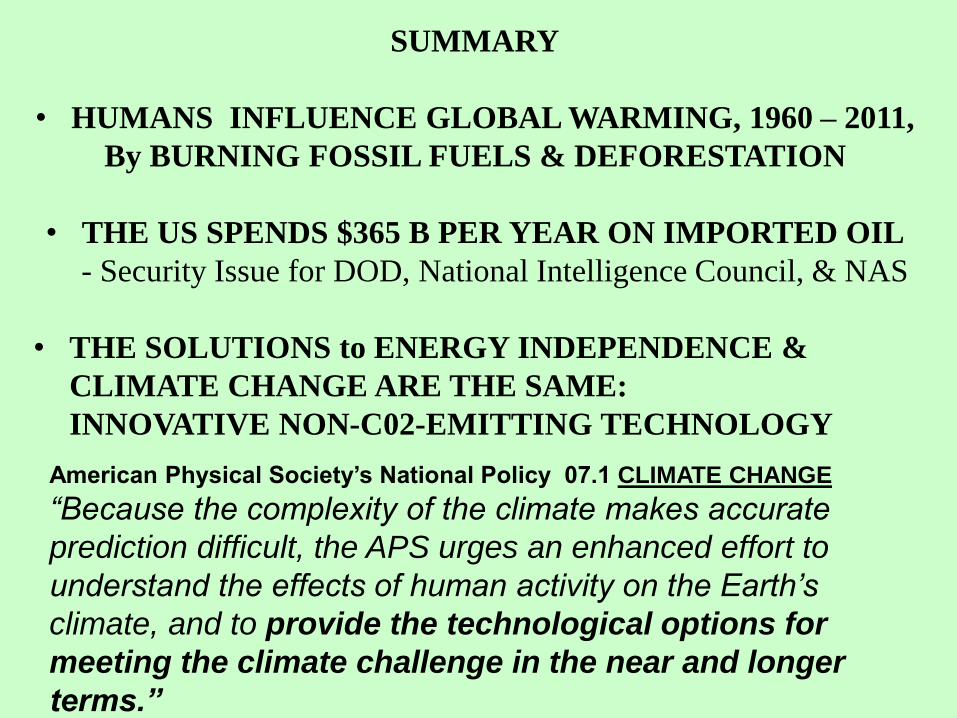
SUMMARY
• HUMANS INFLUENCE GLOBAL WARMING, 1960 – 2011,
By BURNING FOSSIL FUELS & DEFORESTATION
• THE US SPENDS $365 B PER YEAR ON IMPORTED OIL
- Security Issue for DOD, National Intelligence Council, & NAS
• THE SOLUTIONS to ENERGY INDEPENDENCE &
CLIMATE CHANGE ARE THE SAME:
INNOVATIVE NON-C02-EMITTING TECHNOLOGY
American Physical Society’s National Policy 07.1 CLIMATE CHANGE
“Because the complexity of the climate makes accurate
prediction difficult, the APS urges an enhanced effort to
understand the effects of human activity on the Earth’s
climate, and to provide the technological options for
meeting the climate challenge in the near and longer
terms.”
Talks are available:
http://MirrorOfNature.org
Click on PowerPoint Presentations
http://mirrorofnature.org/GlobalWarmingDebateNESAPS.pdf
Larry Gould, Professor of Physics,’ talk is
on his web page:
http://uhaweb.hartford.edu/lgould/
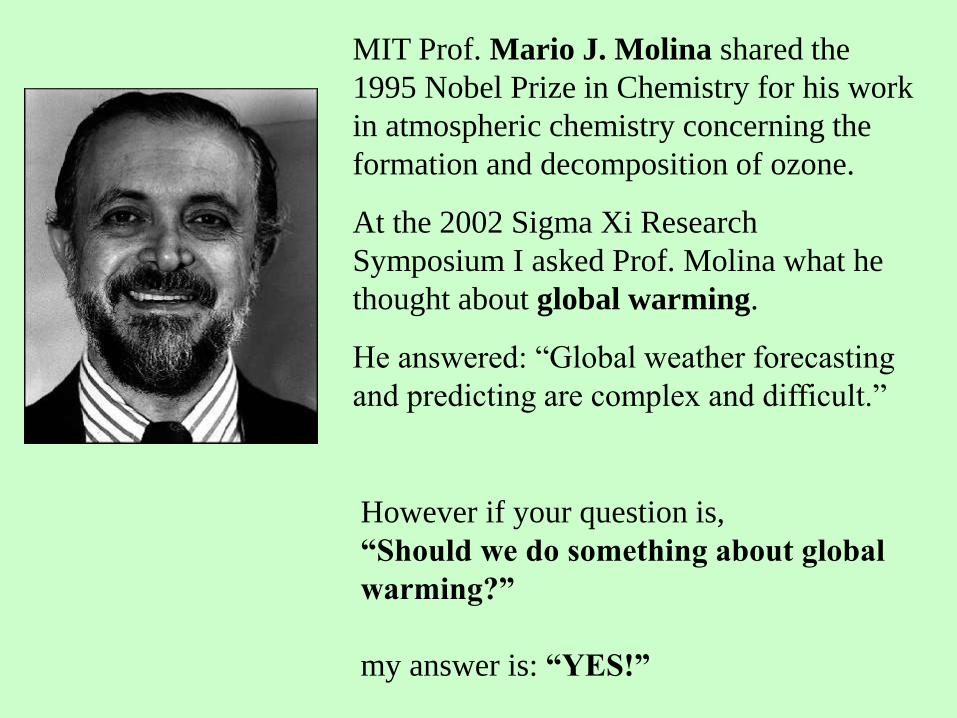
MIT Prof. Mario J. Molina shared the
1995 Nobel Prize in Chemistry for his work
in atmospheric chemistry concerning the
formation and decomposition of ozone.
At the 2002 Sigma Xi Research
Symposium I asked Prof. Molina what he
thought about global warming.
He answered: “Global weather forecasting
and predicting are complex and difficult.”
However if your question is,
“Should we do something about global
warming?”
my answer is: “YES!”

Complexity Principal: OCHAM’S BROOM
In a complex system like the weather, what does not agree with my
hypothesis or paradigm, I will sweep under the rug.
( alternatively called “Cherry Picking.)
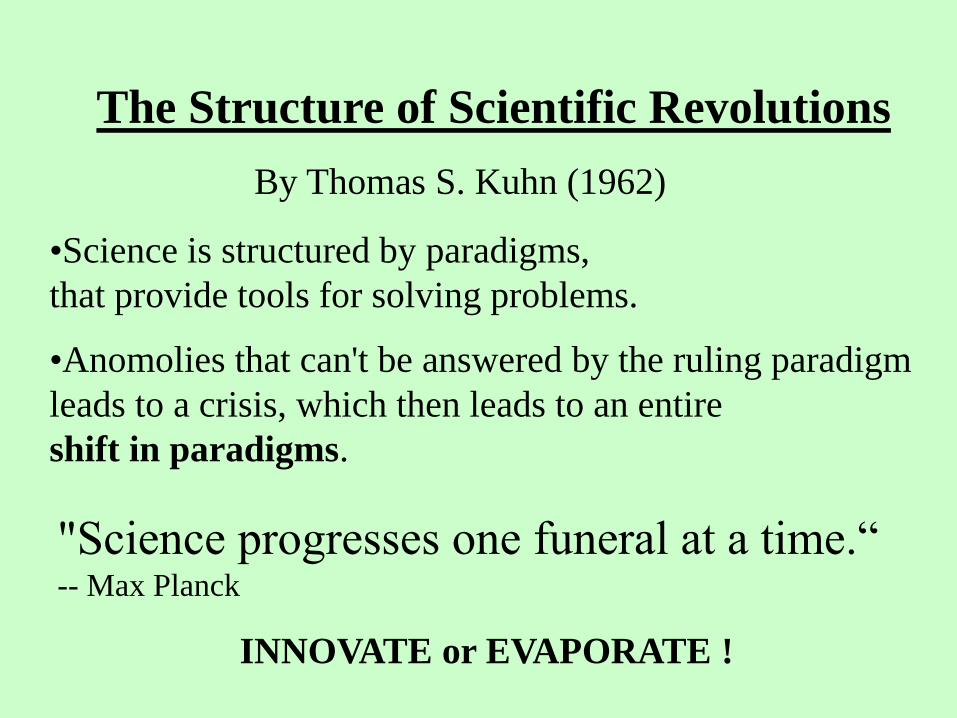
The Structure of Scientific Revolutions
By Thomas S. Kuhn (1962)
•Science is structured by paradigms,
that provide tools for solving problems.
•Anomolies that can't be answered by the ruling paradigm
leads to a crisis, which then leads to an entire
shift in paradigms.
"Science progresses one funeral at a time.“ -- Max Planck
INNOVATE or EVAPORATE !
To Learn More Paul H. Carr:
Data Supporting Anthropogenic Global Warming: Balancing Economics and Ecology, http://mirrorofnature.org/GlobalWarmingDebateNESAPS.pdf.
“The Beauty of Nature vs. Its Utility,” Chap 9, Beauty in Science & Spirit
(2006). www.BeechRiverBooks.com, www.MirrorOfNature.org
CLIMATE CHANGE COURSE
http://www.ei.lehigh.edu/eli/cc/overview.html
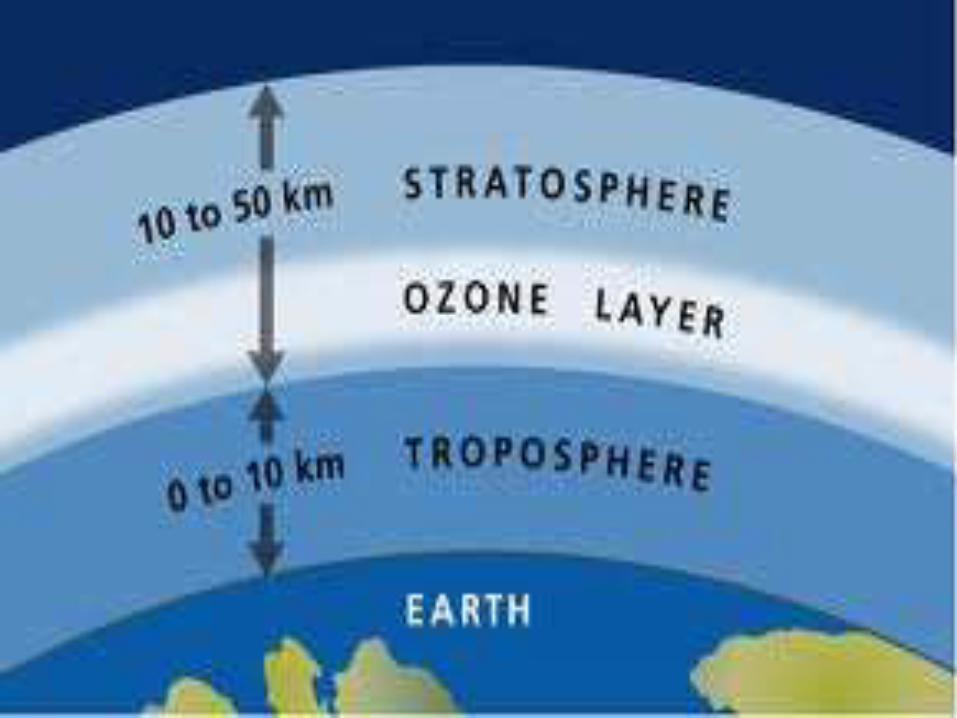
The unit begins with an investigation using Google Earth to explore global temperature changes during a recent 50 - 58 year period. Students explore, analyze, and interpret climate patterns of 13 different cities, and analyze differences between weather and climate patterns. Next, students are introduced to the four main Earth spheres (atmosphere, lithosphere, hydrosphere, and biosphere) and explore the structure and composition of the atmosphere with an emphasis on greenhouse gases and the role that ozone plays in the troposphere and stratosphere.
NATIONAL ACADEMY OF SCIENCES http://dels.nas.edu/Report/Americas-Climate-Choices/12781
National Intelligence Assessment on the National Security Implications of Global Climate Change to 2030 http://www.dni.gov/testimonies/20080625_testimony.pdf
DEPARTMENT OF DEFENSE http://www.defense.gov/QDR/QDR%20as%20of%2029JAN10%201600.pdf
CLIMATE SCIENCE RESOURCES http://www.uml.edu/centers/climate-change/Resources.html
http://http://realclimate.com/
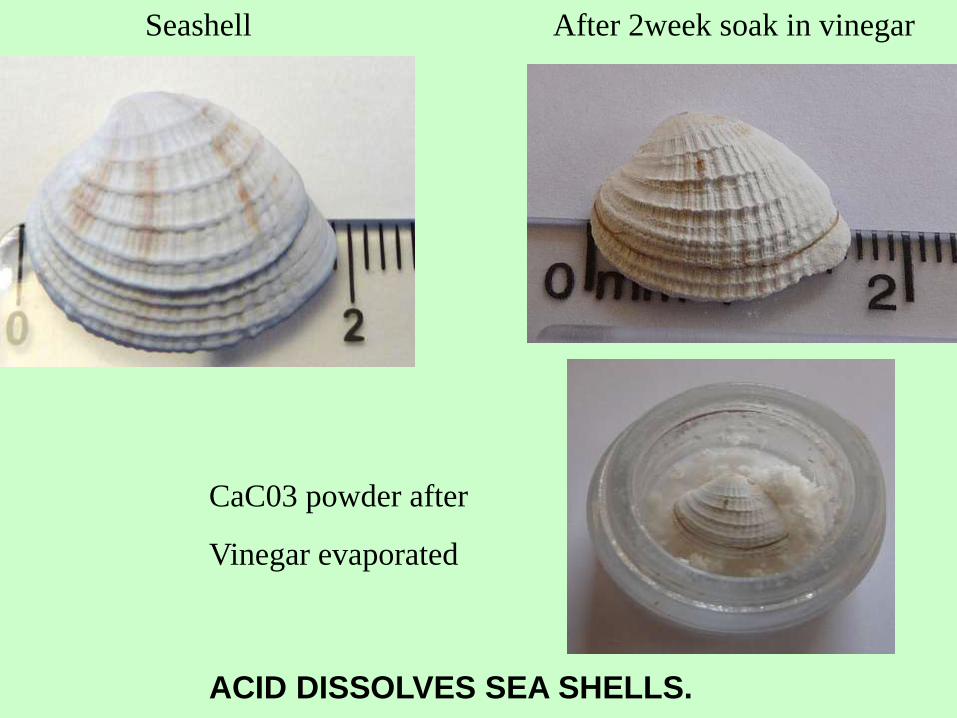
Seashell After 2week soak in vinegar
CaC03 powder after
Vinegar evaporated
ACID DISSOLVES SEA SHELLS.
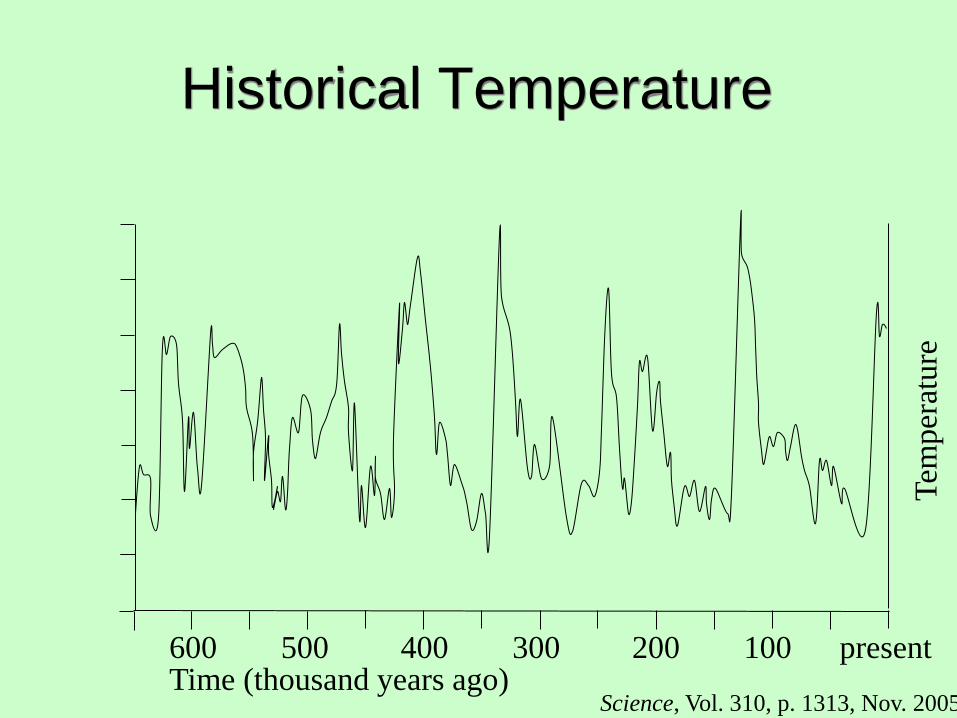
Tem
per
atu
re
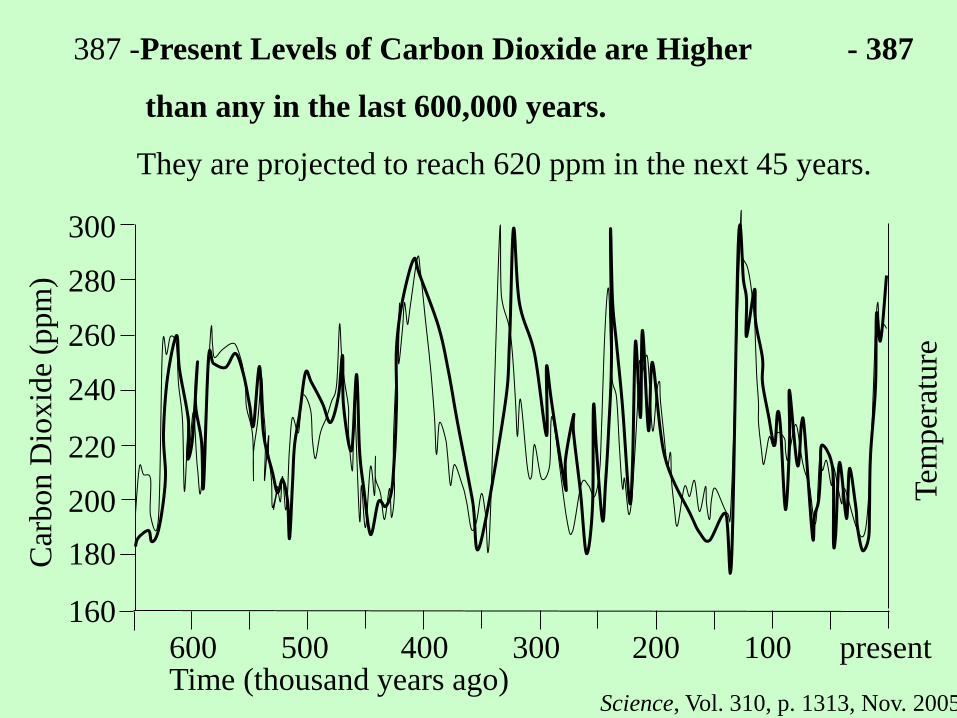
600 500 400 300 200 100 present Time (thousand years ago)
Science, Vol. 310, p. 1313, Nov. 2005
Historical Temperature
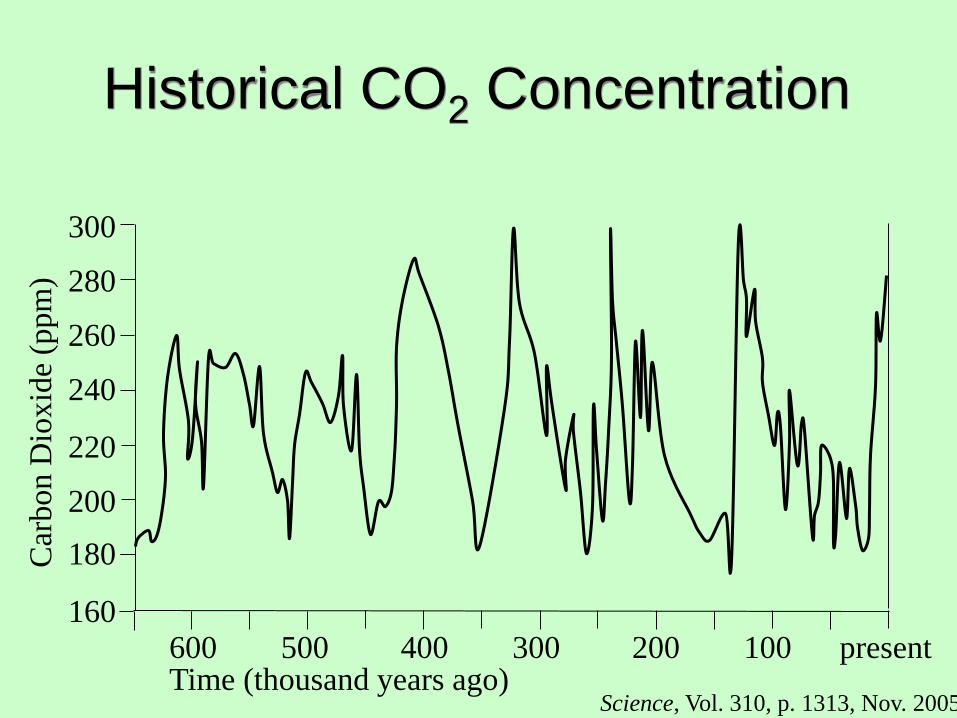
Car
bon D
ioxid
e (p
pm
)
600 500 400 300 200 100 present Time (thousand years ago)
300
280
260
240
220
200
180
160
Science, Vol. 310, p. 1313, Nov. 2005
Historical CO2 Concentration
Tem
per
atu
re
Car
bon D
ioxid
e (p
pm
)
600 500 400 300 200 100 present Time (thousand years ago)
300
280
260
240
220
200
180
160
Science, Vol. 310, p. 1313, Nov. 2005
387 -Present Levels of Carbon Dioxide are Higher - 387
than any in the last 600,000 years.
They are projected to reach 620 ppm in the next 45 years.
“I would put my money on the sun and
solar energy.
What a source of power!
I hope we don’t have to wait until oil and
coal run out before we tackle that.”
(1931)
Thomas Edison
Necessity is the Mother of Invention
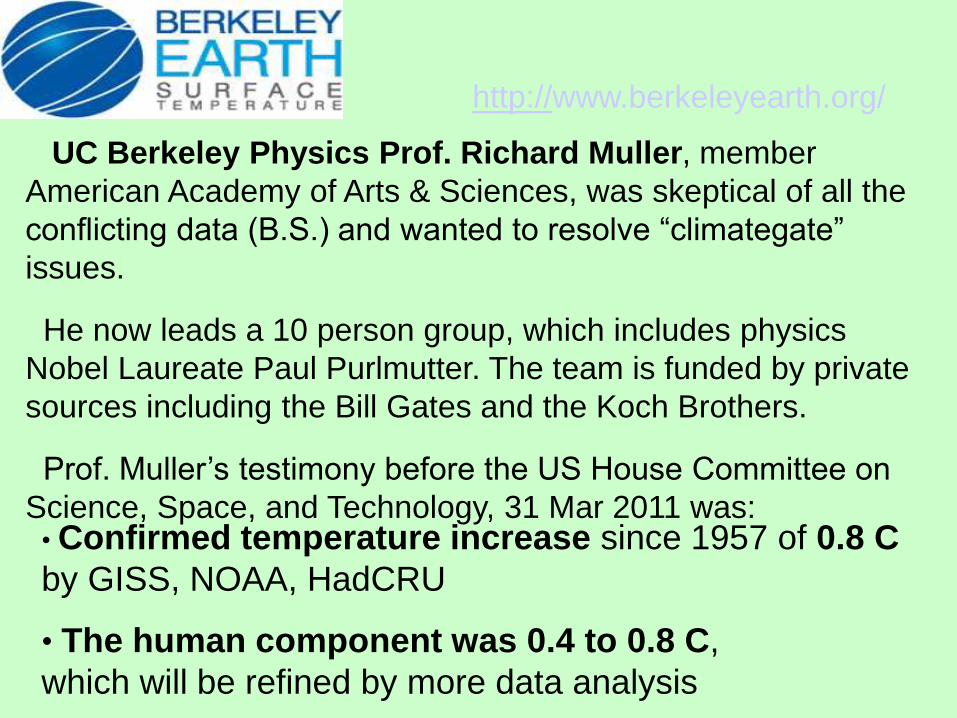
UC Berkeley Physics Prof. Richard Muller, member
American Academy of Arts & Sciences, was skeptical of all the
conflicting data (B.S.) and wanted to resolve “climategate”
issues.
He now leads a 10 person group, which includes physics
Nobel Laureate Paul Purlmutter. The team is funded by private
sources including the Bill Gates and the Koch Brothers.
Prof. Muller’s testimony before the US House Committee on
Science, Space, and Technology, 31 Mar 2011 was:
http://www.berkeleyearth.org/
• Confirmed temperature increase since 1957 of 0.8 C
by GISS, NOAA, HadCRU
• The human component was 0.4 to 0.8 C,
which will be refined by more data analysis
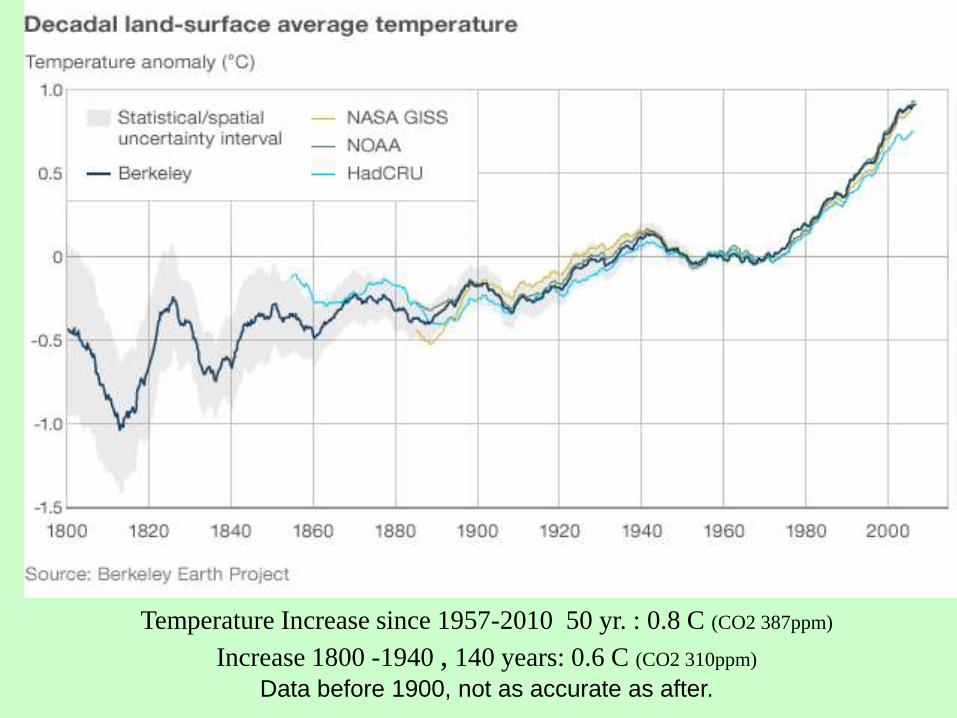
Temperature Increase since 1957-2010 50 yr. : 0.8 C (CO2 387ppm)
Increase 1800 -1940 , 140 years: 0.6 C (CO2 310ppm)
Data before 1900, not as accurate as after.