data validation clarification document (draft...
TRANSCRIPT

3/7/2012 Draft Page 1 of 25
Data Validation Clarification Document (DRAFT) – Continuous Source Monitoring Manual Revision No. 8 (Manual) Disclaimer: The Continuous Source Monitoring Manual Revision No. 8 (Manual) - Data Validation Clarification Document has been developed in order to clarify the Pennsylvania Department of Environmental Protection’s (Department or DEP) data reduction criteria pertaining to hourly averages, contained on page 64 (4.a. and 4.b) of the Manual. The policies and procedures outlined in this document are intended to supplement existing requirements. Nothing in the policies or procedures shall affect regulatory requirements. The policies and procedures provided herein are not an adjudication or a regulation. There is no intent on the part of the Department to give these policies and procedures that weight or deference. DEP reserves the discretion to deviate from this document, if circumstances warrant. Background: The owners/operators of affected facilities and their vendors have requested that the Department clarify and provide examples pertaining to the validation of hourly averages for Revision No. 8 of the Manual. This document is designed to assist facility owners and operators in programming their data acquisition and handling systems (DAHS) and ensuring that hourly averages are coded/calculated properly. The Department’s position has always been that a “valid data reading” would correspond to a valid one-minute average. This was reiterated during the recent Department workshops at each of the Regional Offices. The owners/operators of sources may petition the Department to use a more stringent applicable Federal data reduction criterion (in order to maintain consistency between data considered invalid by multiple agency programs). This enables those that operate under multiple programs to harmonize reporting to the extent practicable. Should you have any comments or questions concerning the examples provided below, please contact Chuck Zadakis by e-mail at [email protected]. 1. With respect to Topic: Hourly averages (page 64, 4.a.) CLARIFICATION: For hours during which calibration or maintenance did not
occur, if at least one valid one-minute average during each quadrant of a clock hour during which the process was

3/7/2012 Draft Page 2 of 25
operating was obtained, the hourly average would be considered valid.
For hours during which calibration or maintenance occurred,
if 1) at least two valid one-minute averages were obtained during the hour, and 2) if the time period between any two valid one-minute averages obtained during the hour was at least 15 minutes, the hourly average would be considered valid.
REASONING: The Department’s rationale is provided as follows: 1) the
parameters affected by this paragraph would not be expected to fluctuate rapidly on a continuing basis, and 2) compliance with emissions standards for the parameters affected by this paragraph would be determined based on a minimum of one clock hour.
2. With respect to Topic: Hourly averages (page 64, 4.b.) CLARIFICATION: With respect to validation by "segments" of a clock hour: For example, for carbon monoxide (CO), if the process
operated only during the first 6 5-minute segments of a clock hour, if at least one one-minute average during at least 5 of those segments was obtained, the hourly average would be considered valid (see Example 4, below).
REASONING: The Department treats these parameters differently because
they might be expected to fluctuate more rapidly on a continuing basis. The intention was that validity would depend on obtaining data in "segments", corresponding to the required minimum cycle time for recording, (rather than quadrants) during which the process operated.
3. Updated hourly average data validation criteria language CLARIFICATION: The following language will be included in future revisions of
the Manual in order to clarify the hourly average data reduction criteria. A number of NOTES will also be included to clarify the invalidation of data due to "process down”. This language represents the current requirements for validation of hourly averages.

3/7/2012 Draft Page 3 of 25
4. Hourly averages.
a. For all parameters except for opacity, temperature, CO, and parameters addressed by Tables XI, or XII of this manual – data from measurement devices of these types can be used to calculate a valid monitoring system hourly average if at least one valid one-minute average is obtained in each 15-min quadrant during which the process was operating. Notwithstanding this requirement, if the process operated during more than one quadrant of the hour and if some data is unavailable as a result of the performance of calibration, quality assurance activities, preventive maintenance activities, or backups of data from the data acquisition and handling system, valid data readings from at least two points separated by a minimum of 15 minutes may be used.
b. For opacity, temperature, CO, and parameters addressed by
Tables XI, or XII, of this manual – data from measurement devices of these types can be used to calculate a valid monitoring system hourly average if at least one valid one-minute average is obtained in at least 75 percent of the segments of the hour corresponding to the minimum required cycle time (for measurement) during which the process was operating.
NOTE: During all valid hours, the hourly average would be calculated as: [Sum of valid one-minute averages] / [number of valid one-minute averages] NOTE: Under the requirements of a and b, above, hourly averages can only be identified as "invalid due to process down" if the process did not operate (monitoring is not required) for the entire hour. Please also note: these requirements will also affect the reporting of "substitute" data, where required. For instance, if a source operates for only a small portion of a clock hour, rather than identifying the hour as invalid due to "Process Down" the emission results monitored during the portion of the clock hour during which the source operated will be used to represent the hour (for hours considered “valid”). In such cases, no "substitute" data will be required (since data substitution is only required for "invalid" hours). REASONING: Consistent with items 1 and 2, above.

3/7/2012 Draft Page 4 of 25
4. Generation of hourly averages utilizing data collected at varying times and frequencies and with different data validation requirements Tables I – XII of the Manual identify the minimum data recorder resolution and number of cycles per hour on an analyzer specific basis. Therefore, calculating the hourly average emission result in the applicable units of measurement may involve the use of data collected at varying times and frequencies as well as different validation requirements (page 64, 4.a or 4.b). This was not an issue in past revisions of the Manual because analyzers were required to meet the most stringent requirement of all analyzers that were used to develop the emission result in the applicable units of measurement and there was a uniform data validation requirement. A typical example is the calculation of a CO PPM @ 15% O2 hourly average. CO requires a minimum data recorder resolution of 5 minutes and 12 cycles per hour, while O2 requires a minimum data recorder resolution of 15 minutes and 4 cycles per hour. By defining the data collection requirements by analyzer, we are forced to calculate an hourly average “analyzer” value and to use those values to calculate emissions in the applicable units of measurement in instances that the timing and frequency of data sample collection is not identical. (See Example 2, below) 5. With respect to Topic: Waste Incinerator Monitoring Requirements CLARIFICATION: This topic applies to monitoring systems installed on municipal and hospital waste incinerators reference in 25 Pa Code § 139.111. More stringent validation requirements (relative to the "general" validation requirements as listed in item 3, above) apply to carbon monoxide and temperature monitoring systems, in that at least 90% of the data collected during process operation for each hour is required to be valid in order to constitute a valid hour. In other words, 90% of the cycle averages (one-minute for temperature or five-minute averages for CO) for each hour during which the process was operating is required to be valid.

3/7/2012 Draft Page 5 of 25
6. Rounding Conventions for Reported Data When it is necessary to round a value to report it using the number of required decimal places, use the standard arithmetic rounding convention where numbers 5-9 round to the next highest number in the previous decimal position to the left. It is not always appropriate to report values to the number of decimal places in the EDR format. The precision of each measured parameter should be the same as the precision of the hourly record for the parameter. Zeros may be used as placeholders to the right of the last digit in each measurement, but are not considered to be significant figures. (Manual, Attachment No. 3, II.C(7)(b), Page 103) 7. Data substitution Monitoring systems used to report data for compliance with emission standards based on total mass, tons per year, etc. are required to report “substitute” data for hours when the data hour is considered invalid. The Department will notify the owners/operators of sources when data substitution is required. They must be notified and concur with the procedure that is ultimately utilized. Revision No. 8 of the Manual indicates that the following procedures are acceptable: 1. The emission value for any hours that are invalid during which the process operated for the entire hour should be calculated using data collected during valid data periods for the hour and the highest valid one-hour emission value that occurred during the reporting quarter for any invalid data periods during that hour (if no valid data were collected during the reporting quarter, use the most recent quarter for which valid data was collected; if no valid data was collected during the reporting quarter or any previous quarter, contact the Department for specific instructions). Sources are required to use minute level emission result data (i.e. pollutant, lbs/hr) when data substitution is required. In such cases, once it is determined that an hourly average isn’t valid for the pollutant, diluent, flow, etc. (based upon the data collection requirements identified for each monitor), the data substituted value should be inserted for the invalid pollutant, lbs/hr readings and the hourly average calculated. The applicable Method of Determination Code (MODC) should be included for each hour to explain how the value for the hour was calculated. The MODC of the monitor with the most missing data should be utilized. In the case of a tie, utilize the MODC of the primary pollutant analyzer. 2. The “Missing Data Substitution Procedures” of 40 CFR, Part 75 (only for the specific parameters covered by that subpart). This method is not applicable for all sources.

3/7/2012 Draft Page 6 of 25
3. An alternative method of data substitution as approved concurrently by the Air Quality Program Manager of the appropriate DEP Regional Office and the Chief of the Division of Source Testing and Monitoring. All the examples provided, below, utilize data substitution procedure 1. Substitution of the highest valid one-hour emission value that occurred during the reporting quarter for any invalid hours continues to be an acceptable option. 8. Flowcharts on Data Validation and Emission Data Reporting Conventions Three flowcharts on data validation and a table on emissions data reporting have been developed (see, below) to assist users with hourly average determination and the reporting of quarterly emissions to the Department. 9. Use of Federal requirements for substitute data NOTE 5 of the Quality Assurance Section of the Manual states that the owners/operators of sources subject to applicable Federal requirements for substitute data for “Diluent Cap”, or “Over-scaling” may petition the Department for use of such substitute data for DEP purposes if they can demonstrate that the use of such substitute data will not adversely impact the Department’s ability to enforce compliance with all applicable requirements. Monitoring Code (MC) 99 should be used in RT 884 for hours in which the substituted data is utilized at any time during the hour unless otherwise stated by the Department in the petition approval letter. The substituted data will be considered valid for the purposes of compliance with Department emission and data availability standards. A Diluent Cap (40 CFR, Part 75, App. F § 3.3.4.1) is used in instances that the heat input of the unit approaches zero. For boilers, a minimum concentration of 5.0% CO2 or a maximum concentration of 14.0% O2 may be substituted for the measured diluent gas concentration value for any operating hour in which the hourly average CO2 concentration is < 5.0% CO2 or the hourly average O2 concentration is >14.0% O2. For stationary gas turbines, a minimum concentration of 1.0% CO2 or a maximum concentration of 19.0% O2 may be substituted for measured diluent gas concentration values for any operating hour in which the hourly average CO2 concentration is <1.0% CO2 or the hourly average O2 concentration is >19.0% O2.

3/7/2012 Draft Page 7 of 25
Under 40 CFR, Part 75, App. F § 3, the use of the diluent cap is limited to the calculation of the NOx emission rate (lbs/MBtu), and only for hours in which a quality-assured diluent gas reading is obtained, showing that use of the cap is justified. Petitions for the use of the diluent cap for NOx and SO2 emission rates (lbs/MBtu) will be accepted by the Department. Method of Determination Code (MDC) 14 should be used in RT 884 for hours in which a “Diluent Cap” is utilized unless otherwise stated by the Department in the petition approval letter. Over-scaling is an exceedance of the high range of a continuous monitor, as described in 40 CFR, Part 75, Appendix A, Sections 2.1.1.5 (for SO2), 2.1.2.5 (for NOx), and 2.1.4.3 (for flow). During hours in which the NOx concentration, SO2 concentration, or flow rate is greater than the analyzer’s capability to measure, the owner or operator is instructed to substitute 200% of the full scale range of the instrument for that hour. Use the applicable Process Code and an MDC of 20 when reporting the hour in RT 884. Additional information is available in the answer to Question 8.1 of the Department’s Question and Answer Document, available on the CEM Homepage. 10. Reporting of Exempt hours There may be cases when the owners/operators of sources may be either exempt from monitoring or authorized for exemptions from short-term average emission standards (3-hour average, 4-hour average, etc.) during specific process conditions (start-up, shut-down, etc.) by the applicable permit, plan approval, or order. If the regulation explicitly states that monitoring is not required during certain process conditions, the corresponding time periods should be reported as “process down/monitoring not required”. If the regulation requires monitoring for all time periods but authorizes exemptions from short-term emission standards during specific process conditions (start-up, shut-down, etc.) then exempt periods should be considered as operating time subject to monitoring. An hourly average must be reported using the appropriate, approved exempt code, for each hour that includes any exempt time.

3/7/2012 Draft Page 8 of 25
Data Validation Flowchart 1 Data Inputs – Quality Assurance I.B.4.a
Key 1 Insert the most prevalent monitoring code. 2 A qualifying exemption would include the following: performance of a calibration, quality assurance
activities, preventive maintenance activities, or backups of data from the data acquisition and handling system.
3 Are there valid data readings from at least 2 points separated by a minimum of 15 minutes? 4 For an hour containing a failed calibration error test, a passed calibration error test may be used to
prospectively validate data for the hour in which it is performed only if, after completion of the test, the minimum data requirements of Quality Assurance I.B.4.a of the Manual are met. Therefore, data collected before the failed daily calibration test would not be utilized in the calculation of the hourly average.
Data is valid for calc. hourly
averages
Valid 1-min avg in each quadrant of
process operation?
1Data is invalid for calc. hourly averages
Did the process operate
during the hour?
Process Down [For parameter and emission
result(s)] No
Yes
No
Yes
No
YesProcess operated
> 1 quadrant?
2Qualifying exemptions
?
Start
No
No
3,4Valid data readings?
Yes
Yes1Data is
invalid for calc. hourly averages
3/7/2012 Draft Page 9 of 25
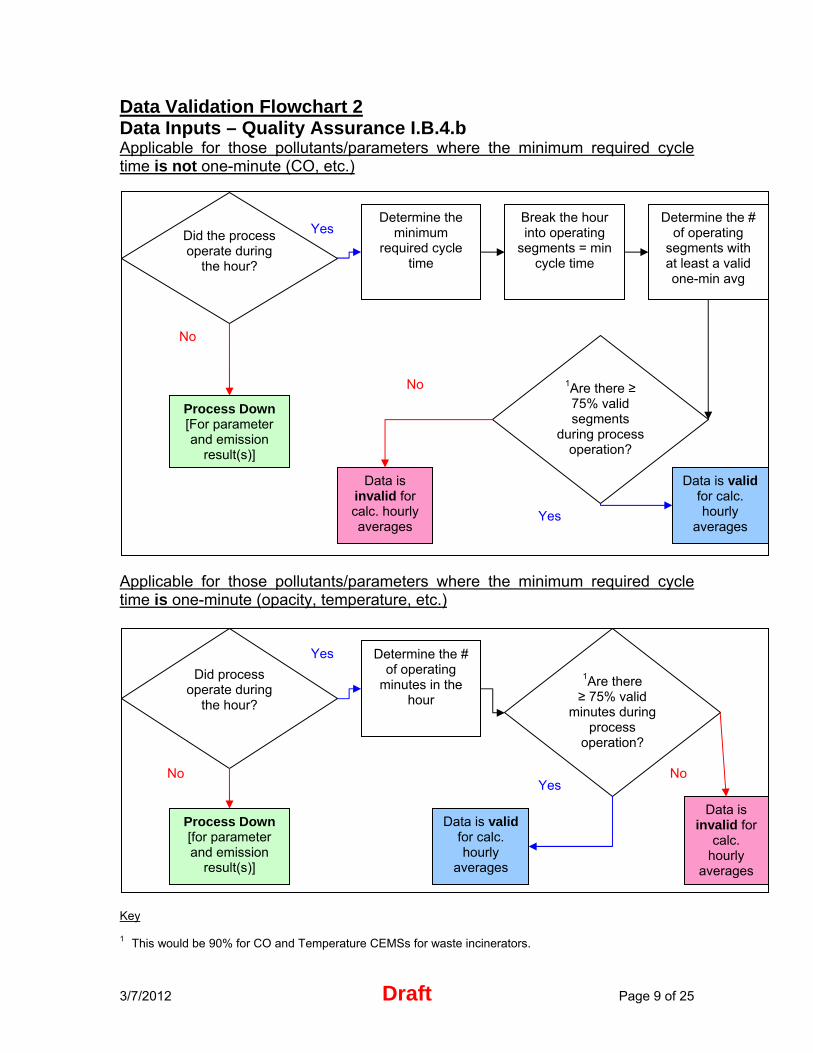
Data Validation Flowchart 2 Data Inputs – Quality Assurance I.B.4.b Applicable for those pollutants/parameters where the minimum required cycle time is not one-minute (CO, etc.)
Applicable for those pollutants/parameters where the minimum required cycle time is one-minute (opacity, temperature, etc.)
Key 1 This would be 90% for CO and Temperature CEMSs for waste incinerators.
1Are there ≥ 75% valid
minutes during process
operation?
Determine the # of operating
minutes in the hour
Data is valid for calc. hourly
averages
Yes
Process Down [for parameter and emission
result(s)]
No
Data is invalid for
calc. hourly
averages
No Yes
Did process operate during
the hour?
1Are there ≥ 75% valid segments
during process operation?
Determine the minimum
required cycle time
Break the hour into operating
segments = min cycle time
Determine the # of operating
segments with at least a valid one-min avg
Data is valid for calc. hourly
averages
Data is invalid for calc. hourly averages
Yes
Process Down [For parameter and emission
result(s)]
Yes
No
Did the process operate during
the hour?
Yes
No

3/7/2012 Draft Page 10 of 25
Data Validation Flowchart 3 Calculating Emission Result Hourly Averages
Key Valid data Invalid data 1 Utilize hourly data inputs from Data Validation Flowchart 1. 2 Utilize hourly data inputs from Data Validation Flowchart 2.
Are all data inputs valid
for calculating a valid hourly
avg?
1Hourly data inputs
applicable to I.B.4.a
Yes
No
Yes
2Hourly data inputs
applicable to I.B.4.b.
Calculate hourly average for
each data input or
Calculate emission result
one minute averages or other data segments
Calculate emission result valid hourly
average
Emission result hourly average is
invalid
No
Apply applicable
data substitution
method
Calculate emission
result hourly average for invalid data
Is data substitution required?
Yes
Calculate hourly average for
each data input or
Calculate emission result
one minute averages or other data segments

3/7/2012 Draft Page 11 of 25
1Emissions Data Reporting Conventions 2Process Operational Status
Valid/Invalid/Process Down
No Data Substitution Data Substitution Value PC MC MDC Value PC MC MDC
On (whole hour)
Valid V.VVV PC 400 4P, B, S V.VVV PC 400 4P, B, S Invalid (blank) PC MC≠00, 13 NV S.SSS PC MC≠00, 13 MDC≠P, B, S
Off (whole hour)
Process Down
0.000 08 13 P 0.000 08 13 P
3Partial hour of operation
Valid V.VVV PC 400 4P, B, S V.VVV PC 400 4P, B, S Invalid (blank) PC MC≠00, 13 NV P.PPP PC MC≠00, 13 MDC≠P, B, S
Key: MC – Monitoring Code P.PPP – Substituted value (prorated) as generated by the DAHS MDC – Method of Determination Code S.SSS – Substituted value as calculated by the CEMS PC – Process Code V.VVV – Valid data as recorded by the CEMS 1 View the “Field Descriptions and Instructions” contained in RT 884 of Revision No. 8 of the Manual for additional information. 2 As defined by the Department and the Continuous Source Monitoring Manual. 3 Process down is a non-existing condition during a partial hour of operation. 4 For the owners/operators of sources subject to Federal requirements for “Diluent CAP” or “Over-scaling that have been approved by the Department for use of these procedures for DEP purposes; use Monitoring Code 99 for the reporting of the subject data in RT 884. The Method of Determination codes that should be applied are as follows: Procedure Type MDC 5Diluent Cap 14 Over-scaling 20 5 May only be used for NOx and SO2 lbs/MBtu reporting when approved by the Department.

3/7/2012 Draft Page 12 of 25
Example 1 With respect to Topic: Hourly average (page 64, 4.a.): In scenarios 1-14, it was assumed that there were no failed calibration error tests during quadrants in which maintenance was conducted. 3, 4, 6Scenario 1 2 3 4 5 6 7 Quadrant 1 O-V O-M O-V O-V O-V O-V O-V Quadrant 2 O-V O-V O-V O-V O-V O-V D Quadrant 3 O-V O-V O-I O-V D O-I O-V Quadrant 4 O-V O-V O-V D O-M D D Hourly Average
V 1V I V 2I I V
3, 4, 6Scenario 8 9 10 11 12 13 14 Quadrant 1 O-V O-V O-V D D D O-I Quadrant 2 O-M O-I D D O-I D O-M Quadrant 3 D O-M D O-M O-I D O-M Quadrant 4 D D D D D D O-I Hourly Average -Status
2I 2I V 2I I 5D 2I
Key: In a clock hour:
Quadrant 1 – Minutes 1-15 Quadrant 2 – Minutes 16-30 Quadrant 3 – Minutes 31-45 Quadrant 4 – Minutes 46-60
D – Process Down (monitoring not required). Assume the process is down the entire quadrant. I – Invalid (not maintenance). Assume data is invalid for the entire quadrant. M – Invalid Maintenance (calibration, quality assurance activities, preventive maintenance activities, or
backups of data from the data acquisition and handling system). Assume that maintenance took place during the entire quadrant and that no calibration error tests were failed.
O – Process Operating. Assume that the process was in operation during the entire quadrant. V – Valid. Assume at least one minute of valid data during which the process was operating during the
entire quadrant. 1 Valid data readings from at least two points separated by a minimum of 15 minutes existed as required in
4.a. (above). 2 Valid data readings from at least two points separated by a minimum of 15 minutes did not exist as required
in 4.a. (above). 3 During all valid hours, the hourly average would be calculated as: [Sum of valid one-minute averages] /
[number of valid one-minute averages] 4 For cases, in which the hour is invalid (no data substitution required), leave the emissions value blank,
enter a process and monitoring code and use “NV” as the method of determination code when reporting quarterly emissions.
5 The process did not operate during the hour. 6 When data substitution is required, the hourly average would be calculated as: [Sum of one-minute
averages]/60. Process down minutes would count as “0” and the data substituted value should be inserted for invalid minutes.

3/7/2012 Draft Page 13 of 25
For an hour containing a failed calibration error test, a passed calibration error test may be used to prospectively validate data for the hour in which it is performed only if, after completion of the test, the minimum data requirements of Quality Assurance I.B.4.a of the Manual are met. All valid one-minute averages collected during the hour must be used to calculate the hourly averages. In scenarios 15-22, it was assumed that there was a failed calibration error test during the hour in which maintenance was conducted. 3, 4, 7Scenario 15 16 17 18 19 20 21 22 Quadrant 1 O-V O-V O-V O-V 5O-M 6O-M 6O-M O-I Quadrant 2 O-V O-V 5O-M 5O-M O-V 5O-M 5O-M 5O-M Quadrant 3 D D O-V O-V D O-V O-V O-V Quadrant 4 5O-M 6O-M O-V O-V D O-V O-V O-V Hourly Average -Status
2I 2I 1V 2I 2I 1V 2I 1V
Key: D – Process Down (monitoring not required). Assume the process is down the entire quadrant. I – Invalid (not maintenance). Assume data is invalid for the entire quadrant. M – Invalid Maintenance (calibration, quality assurance activities, preventive maintenance activities, or
backups of data from the data acquisition and handling system). Assume that maintenance took place during the entire quadrant
O – Process Operating. Assume that the process was in operation during the entire quadrant. V – Valid. Assume at least one minute of valid data during which the process was operating during the
entire quadrant. 1 Valid data readings from at least two points separated by a minimum of 15 minutes existed after a passed
calibration error test as required in 4.a. (above). 2 Valid data readings from at least two points separated by a minimum of 15 minutes did not exist after a
passed calibration error test as required in 4.a. (above). 3 During all valid hours, the hourly average would be calculated as: [Sum of valid one-minute averages] /
[number of valid one-minute averages]. When a daily calibration test is failed, the data from that monitor is prospectively invalidated, beginning with the hour of the test failure and ending when a subsequent daily calibration test is passed. Therefore, data collected before the failed daily calibration test would not be utilized in the calculation of the hourly average.
4 For cases, in which the hour is invalid (no data substitution required), leave the emissions value blank, enter a process and monitoring code and use “NV” as the method of determination code when reporting quarterly emissions.
5 The monitor initially failed a calibration error test then passed it after corrective maintenance. 6 The monitor initially failed a calibration error test and did not pass a calibration error test. 7 When data substitution is required, the hourly average would be calculated as: [Sum of one-minute
averages]/60. Process down minutes would count as “0” and the data substituted value should be inserted for invalid minutes.

3/7/2012 Draft Page 14 of 25
Example 2 With respect to Topic: Hourly average (page 64, 4.a. and 4.b): Given the following scenario: CEMS, CO PPM @ 15% O2, Primary CEMS Operational time – normal operation No invalid data and the process operated the entire hour Actual cycle time for CO = 5 minutes Actual cycle time for O2 = 15 minutes Data for CO and O2 is measured and recorded at different times and frequencies Data substitution is not required for “invalid” hours Minute Pollutant Minute Pollutant Minute Pollutant
CO O2 CO O2 CO O2 1 15 21 41 2 22 42 3 23 43 4 24 44 5 10 25 20 45 30 6 26 46 16 7 27 47 8 28 48 9 29 49 10 10 30 20 50 30 11 31 16 51 12 32 52 13 33 53 14 34 54 15 10 35 20 55 30 16 15 36 56 17 37 57 18 38 58 19 39 59 20 10 40 20 60 30
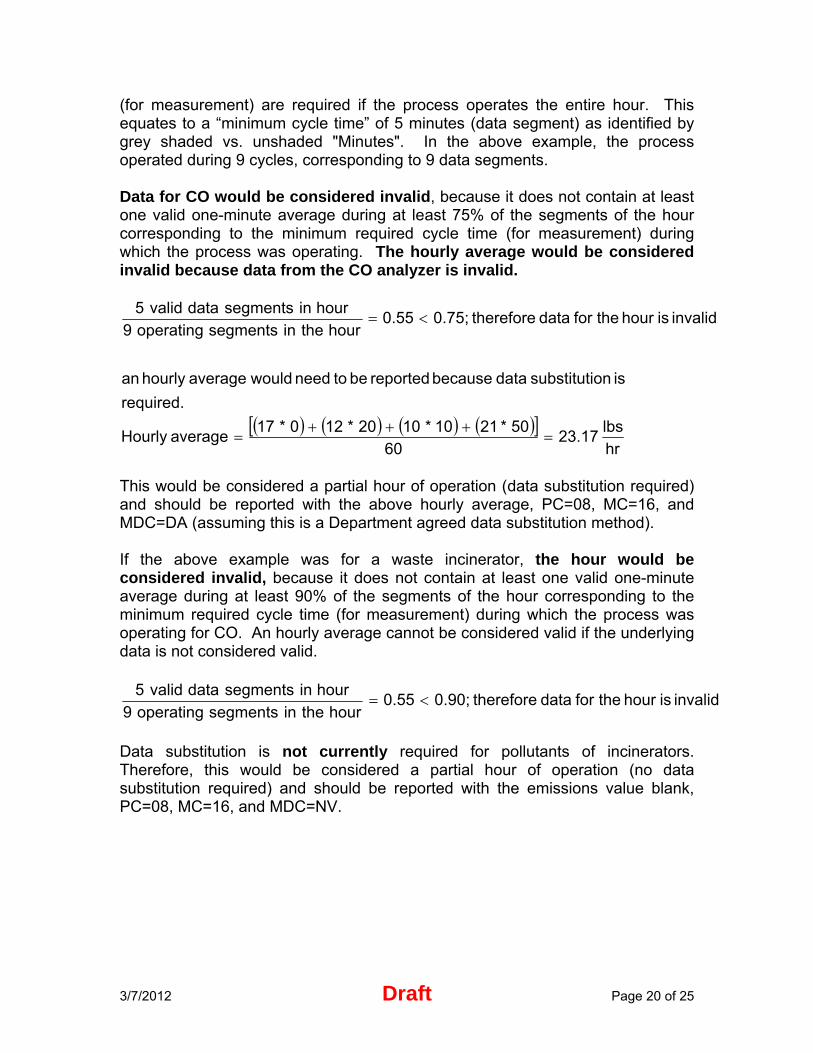
Please note that in order to produce valid CO PPM @ 15% O2 values, the underlying analyzer data (CO and O2) must be valid. The Manual stipulates that data for the CO analyzer can be utilized to calculate a valid monitoring system hourly average if it contains at least 75 percent of the segments of the hour corresponding to the “minimum required cycle time” (for measurement) during which the process was operating. According to Table IV of the Manual (Specifications for Carbon Monoxide Monitors), 12 cycles per hour (for measurement) are required if the process operates the entire hour. This equates to a “minimum cycle time” of 5 minutes (data segment) as identified by
Cycle 1
Cycle 2
Cycle 3
Cycle 4
Cycle 5
Cycle 6
Cycle 7
Cycle 8
Cycle 9
Cycle 10
Cycle 11
Cycle 12
Cycle 1 Cycle 2
Cycle 3 Cycle 4

3/7/2012 Draft Page 15 of 25
yellow shaded vs. unshaded "Minutes". In the above example, the process operated during 12 cycles, corresponding to 12 data segments. Data for CO would be considered valid, because it contains at least one valid one-minute average during at least 75% of the segments of the hour corresponding to the minimum required cycle time (for measurement) during which the process was operating.
PPM 20
12
30*420*410*4averageHourly CO
with,
valid is hour the for data therefore 0.75;1hourtheinsegmentsoperating12
hourinsegmentsdatavalid12
The Manual stipulates that data from an O2 analyzer can be used to calculate a valid monitoring system hourly average if at least one valid data reading (one-minute average) is obtained in each 15-min quadrant during which the process was operating as identified by grey shaded vs. unshaded "Minutes". Data for O2 would be considered valid because it meets this stipulation.
% 15.5
4
16161515averageHourly O
with,
2
The hourly average for CO PPM @ 15% O2 would be considered valid because the underlying analyzer data (for CO and O2) is considered valid. The hourly average for the CEMS would be calculated as follows:
PPM 21.915.520.9
5.9*20
averageHourly O20.95.9
*averageHourly CO averageHourly O 15% @ PPM CO2
2
This would be considered a full hour of operation (process on) and should be reported with the above hourly average, PC=08, MC=00, and MDC=P. If the above example was for a waste incinerator, the hour would be considered valid, because the underlying analyzer data (for CO and O2) is considered valid. Keep in mind that for CO, it must contain at least one valid one-minute average during at least 90% of the segments of the hour corresponding to the minimum required cycle time (for measurement) during which the process was operating. The reporting would be the same as above.

3/7/2012 Draft Page 16 of 25
valid is hour the for data therefore 0.90;1hourtheinsegmentsoperating12
hourinsegmentsdatavalid12

3/7/2012 Draft Page 17 of 25
Example 3 With respect to Topic: Hourly average (page 64, 4.a. and 4.b.): Given the following scenario: CEMS, CO, lbs/hr, Primary CEMS Contains a CO and O2 analyzer and flow monitor Operational time – normal operation Actual cycle time = 1 minute Minimum cycle time = 5 minutes Invalid data time (primary analyzer malfunction) = 8 minutes Process down = 30 minutes Valid data = 22 minutes Data substitution is not required for “invalid” hours Minute Value Minute Value Minute Value 1 20 21 10 41 0 2 20 22 10 42 0 3 20 23 10 43 0 4 20 24 10 44 0 5 20 25 10 45 0 6 Invalid 26 10 46 0 7 Invalid 27 10 47 0 8 Invalid 28 10 48 0 9 20 29 10 49 0 10 20 30 10 50 0 11 20 31 0 51 0 12 20 32 0 52 0 13 20 33 0 53 0 14 20 34 0 54 0 15 20 35 0 55 0 16 Invalid 36 0 56 0 17 Invalid 37 0 57 0 18 Invalid 38 0 58 0 19 Invalid 39 0 59 0 20 Invalid 40 0 60 0 Please note that in order to produce minute CO lbs/hr values, the underlying analyzer data (CO, O2 and flow) must be valid. The Manual stipulates that data for the CO analyzer can be utilized to calculate a valid monitoring system hourly average if it contains at least 75 percent of the segments of the hour corresponding to the “minimum required cycle time” (for measurement) during which the process was operating. According to Table IV of the Manual (Specifications for Carbon Monoxide Monitors), 12 cycles per hour (for measurement) are required if the process operates the entire hour. This
Cycle 1 Valid
Cycle 2 Valid
Cycle 3 Valid
Cycle 4 Invalid
Cycle 5 Valid
Cycle 6 Valid
Cycle 7 Down
Cycle 8 Down
Cycle 9 Down
Cycle 10 Down
Cycle 11 Down
Cycle 12 Down

3/7/2012 Draft Page 18 of 25
equates to a “minimum cycle time” of 5 minutes (data segment) as identified by grey shaded vs. unshaded "Minutes". In the above example, the process operated during 6 cycles, corresponding to 6 data segments. Data for CO would be considered valid, because it contains at least one valid one-minute average during at least 75% of the segments of the hour corresponding to the minimum required cycle time (for measurement) during which the process was operating.
valid is hour the for data therefore 0.75;0.83hourtheinsegmentsoperating6
hourinsegmentsdatavalid5
The Manual stipulates that data from an O2 analyzer and flow monitor can be used to calculate a valid monitoring system hourly average if at least one valid data reading (one-minute average) is obtained in each 15-min quadrant during which the process was operating. Data for O2 and flow would be considered valid because it meets this stipulation. The hourly average for CO lbs/hr would be considered valid because the underlying data is considered valid. The hourly average for the CEMS would be calculated as follows:
hr
lbs15.45
22
10*1020*12 averageHourly
This would be considered a partial hour of operation (no data substitution required) and should be reported with the above hourly average, PC=08, MC=00, and MDC=P. If the above example was for a waste incinerator, the hour would be considered invalid, because it does not contain at least one valid one-minute average during at least 90% of the segments of the hour corresponding to the minimum required cycle time (for measurement) during which the process was operating for CO. An hourly average cannot be considered valid if the underlying data is not considered valid.
invalid is hour the for data therefore 0.90;0.83hourtheinsegmentsoperating6
hourinsegmentsdatavalid5
This would be considered a partial hour of operation (no data substitution required) and should be reported with the emissions value blank, PC=08, MC=16, and MDC=NV.

3/7/2012 Draft Page 19 of 25
Example 4 With respect to Topic: Hourly average (page 64, 4.a. and 4.b.): Given the following scenario: CEMS, CO, lbs/hr, Primary CEMS Contains a CO and O2 analyzer and flow monitor Operational time – normal operation Actual cycle time = 1 minute Minimum cycle time = 5 minutes Invalid data time (primary analyzer malfunction) = 21 minutes Process down = 17 minutes Valid data = 22 minutes Data substitution is required for “invalid” hours Data substituted value = 50 lbs/hr Minute Value Minute Value Minute Value 1 20 21 10 41 50 2 20 22 10 42 50 3 20 23 10 43 50 4 20 24 10 44 0 5 20 25 10 45 0 6 50 26 10 46 0 7 50 27 10 47 0 8 50 28 10 48 0 9 20 29 10 49 0 10 20 30 10 50 0 11 20 31 50 51 0 12 20 32 50 52 0 13 20 33 50 53 0 14 20 34 50 54 0 15 20 35 50 55 0 16 50 36 50 56 0 17 50 37 50 57 0 18 50 38 50 58 0 19 50 39 50 59 0 20 50 40 50 60 0 Please note that in order to produce minute CO lbs/hr values, the underlying analyzer data (CO, O2 and flow) must be valid. The Manual stipulates that data for the CO analyzer can be utilized to calculate a valid monitoring system hourly average if it contains at least 75 percent of the segments of the hour corresponding to the “minimum required cycle time” (for measurement) during which the process was operating. According to Table IV of the Manual (Specifications for Carbon Monoxide Monitors), 12 cycles per hour
Cycle 1 Valid
Cycle 2 Valid
Cycle 3 Valid
Cycle 4 Invalid
Cycle 5 Valid
Cycle 6 Valid
Cycle 7 Invalid
Cycle 8 Invalid
Cycle 9 Invalid
Cycle 10 Down
Cycle 11 Down
Cycle 12 Down
3/7/2012 Draft Page 20 of 25
(for measurement) are required if the process operates the entire hour. This equates to a “minimum cycle time” of 5 minutes (data segment) as identified by grey shaded vs. unshaded "Minutes". In the above example, the process operated during 9 cycles, corresponding to 9 data segments. Data for CO would be considered invalid, because it does not contain at least one valid one-minute average during at least 75% of the segments of the hour corresponding to the minimum required cycle time (for measurement) during which the process was operating. The hourly average would be considered invalid because data from the CO analyzer is invalid.
hr
lbs 23.17
60
50*2110*1020*120*17averageHourly
required.
is onsubstituti data because reported be to need wouldaveragehourly an
invalid is hour the for data therefore 0.75;0.55hourtheinsegmentsoperating9
hourinsegmentsdatavalid5
This would be considered a partial hour of operation (data substitution required) and should be reported with the above hourly average, PC=08, MC=16, and MDC=DA (assuming this is a Department agreed data substitution method). If the above example was for a waste incinerator, the hour would be considered invalid, because it does not contain at least one valid one-minute average during at least 90% of the segments of the hour corresponding to the minimum required cycle time (for measurement) during which the process was operating for CO. An hourly average cannot be considered valid if the underlying data is not considered valid.
invalid is hour the for data therefore 0.90;0.55hourtheinsegmentsoperating9
hourinsegmentsdatavalid5
Data substitution is not currently required for pollutants of incinerators. Therefore, this would be considered a partial hour of operation (no data substitution required) and should be reported with the emissions value blank, PC=08, MC=16, and MDC=NV.

3/7/2012 Draft Page 21 of 25
Example 5 With respect to Topic: Hourly average (page 64, 4.a. and 4.b.): Given the following scenario: CEMS, CO, lbs/hr, Stand-by CEMS Contains a CO and O2 analyzer and flow monitor Dominating process condition – In the process of changing fuels Actual cycle time = 1 minute Minimum cycle time = 5 minutes Invalid data time (data handling system malfunction) = 18 minutes Process down = 18 minutes Valid data = 24 minutes Data substitution is not required for “invalid” hours Minute Value Minute Value Minute Value 1 20 21 10 41 25 2 20 22 10 42 25 3 20 23 10 43 0 4 20 24 10 44 0 5 20 25 10 45 0 6 Invalid 26 10 46 0 7 Invalid 27 10 47 0 8 Invalid 28 10 48 0 9 20 29 10 49 0 10 20 30 10 50 0 11 20 31 Invalid 51 0 12 20 32 Invalid 52 0 13 20 33 Invalid 53 0 14 20 34 Invalid 54 0 15 20 35 Invalid 55 0 16 Invalid 36 Invalid 56 0 17 Invalid 37 Invalid 57 0 18 Invalid 38 Invalid 58 0 19 Invalid 39 Invalid 59 0 20 Invalid 40 Invalid 60 0 Please note that in order to produce minute CO lbs/hr values, the underlying analyzer data (CO, O2 and flow) must be valid. The Manual stipulates that data for the CO analyzer can be utilized to calculate a valid monitoring system hourly average if it contains at least 75 percent of the segments of the hour corresponding to the “minimum required cycle time” (for measurement) during which the process was operating. According to Table IV of the Manual (Specifications for Carbon Monoxide Monitors), 12 cycles per hour (for measurement) are required if the process operates the entire hour. This
Cycle 1 Valid
Cycle 2 Valid
Cycle 3 Valid
Cycle 4 Invalid
Cycle 5 Valid
Cycle 6 Valid
Cycle 7 Invalid
Cycle 8 Invalid
Cycle 9 Valid
Cycle 10 Down
Cycle 11 Down
Cycle 12 Down

3/7/2012 Draft Page 22 of 25
equates to a “minimum cycle time” of 5 minutes (data segments) as identified by grey shaded vs. unshaded "Minutes". In the above example, the process operated during 9 cycles, corresponding to 9 data segments. Data for CO would be considered invalid, because it does not contain at least one valid one-minute average during at least 75% of the segments of the hour corresponding to the minimum required cycle time (for measurement) during which the process was operating. The hourly average would be considered invalid because data from the CO analyzer is invalid.
invalid is hour the for data therefore 0.75;0.67hourtheinsegmentsoperating9
hourinsegmentsdatavalid6
This would be considered a partial hour of operation (no data substitution required) and should be reported with the emissions value blank, PC=01, MC=14, and MDC=NV. If the above example was for a waste incinerator, the hour would be considered invalid, because it does not contain at least one valid one-minute average during at least 90% of the segments of the hour corresponding to the minimum required cycle time (for measurement) during which the process was operating for CO. An hourly average cannot be considered valid if the underlying data is not considered valid. The reporting would be unchanged from the above solution.
invalid is hour the for data therefore 0.90;0.67hourtheinsegmentsoperating9
hourinsegmentsdatavalid6

3/7/2012 Draft Page 23 of 25
Example 6 With respect to Topic: Hourly average (page 64, 4.a. and 4.b.): Given the following scenario: CEMS, CO, lbs/hr, Primary CEMS Contains a CO and O2 analyzer and flow monitor Operating condition – normal operation Actual cycle time = 1 minute Minimum cycle time = 5 minutes Invalid data time (primary analyzer malfunction) = 11 minutes Process down = 18 minutes Valid data = 31 minutes Data substitution is required for “invalid” hours Data substituted value = 50 lbs/hr Minute Value Minute Value Minute Value 1 20 21 10 41 50 2 20 22 10 42 25 3 20 23 10 43 0 4 20 24 10 44 0 5 20 25 10 45 0 6 20 26 10 46 0 7 20 27 10 47 0 8 20 28 10 48 0 9 20 29 10 49 0 10 20 30 10 50 0 11 20 31 50 51 0 12 20 32 50 52 0 13 20 33 50 53 0 14 20 34 50 54 0 15 20 35 50 55 0 16 20 36 50 56 0 17 20 37 50 57 0 18 20 38 50 58 0 19 20 39 50 59 0 20 20 40 50 60 0 Please note that in order to produce minute CO lbs/hr values, the underlying analyzer data (CO, O2 and flow) must be valid. The Manual stipulates that data for the CO analyzer can be utilized to calculate a valid monitoring system hourly average if it contains at least 75 percent of the segments of the hour corresponding to the “minimum required cycle time” (for measurement) during which the process was operating. According to Table IV of the Manual (Specifications for Carbon Monoxide Monitors), 12 cycles per hour
Cycle 1 Valid
Cycle 3 Valid
Cycle 4 Valid
Cycle 5 Valid
Cycle 7 Invalid
Cycle 8 Invalid
Cycle 9 Valid
Cycle 11 Down
Cycle 12 Down
Cycle 2 Valid
Cycle 6 Valid
Cycle 10 Down

3/7/2012 Draft Page 24 of 25
(for measurement) are required if the process operates the entire hour. This equates to a “minimum cycle time” of 5 minutes (data segments) as identified by grey shaded vs. unshaded "Minutes". In the above example, the process operated during 9 cycles, corresponding to 9 data segments. Data for CO would be considered valid, because it contains at least one valid one-minute average during at least 75% of the segments of the hour corresponding to the minimum required cycle time (for measurement) during which the process was operating.
valid is hour the for data therefore 0.75;0.78hourtheinsegmentsoperating9
hourinsegmentsdatavalid7
The Manual stipulates that data from an O2 analyzer and flow monitor can be used to calculate a valid monitoring system hourly average if at least one valid data reading (one-minute average) is obtained in each 15-min quadrant during which the process was operating. Data for O2 and flow would be considered valid because it meets this stipulation. The hourly average for CO lbs/hr would be considered valid because the underlying data is considered valid. The hourly average for the CEMS would be calculated as follows:
hr
lbs16.94
31
25*110*1020*20 averageHourly
This would be considered a partial hour of operation and should be reported with the above hourly average, PC=08, MC=00, and MDC=P. If the above example was for a waste incinerator, the hour would be considered invalid, because it does not contain at least one valid one-minute average during at least 90% of the segments of the hour corresponding to the minimum required cycle time (for measurement) during which the process was operating for CO. An hourly average cannot be considered valid if the underlying data is not considered valid.
invalid is hour the for data therefore
0.90;0.78hourtheinsegmentsoperating9
hourinsegmentsdatavalid7
Data substitution is not currently required for pollutants of incinerators. Therefore, this would be considered a partial hour of operation (no data substitution required) and should be reported with the emissions value blank, PC=08, MC=16, and MDC=NV.

3/7/2012 Draft Page 25 of 25
Example 7 Applicable for those pollutants/parameters where the minimum required cycle time is one-minute (opacity, temperature, etc.) 1, 2Scenario 1 2 3 4 5 6 7 Process Down minutes
0 0 0 2 2 16 25
Invalid minutes 0 15 16 16 14 0 18 Operating minutes 60 60 60 58 58 44 35 Valid minutes 60 45 44 42 44 44 17 % Operating time valid
100 75 73 72 76 100 49
Hourly Average - Status
3Valid 3Valid 4Invalid 4Invalid 3Valid 3Valid 4Invalid
1, 2Scenario 8 9 10 11 12 13 14 Process Down minutes
16 30 16 16 55 55 60
Invalid minutes 16 15 6 17 0 5 0 Operating minutes
44 30 44 44 5 5 0
Valid minutes 28 15 38 27 5 0 0 % Operating time valid
64 50 86 61 100 0 0
Hourly Average - Status
4Invalid 4Invalid 3Valid 4Invalid 3Valid 4Invalid 5Process Down
Key: 1 During all valid hours, the hourly average would be calculated as: [Sum of valid one-minute averages] /
[number of valid one-minute averages] 2 For cases, in which the hour is invalid (no data substitution required), leave the emissions value blank,
enter a process and monitoring code and use “NV” as the method of determination code. 3 At least 75% of the one-minute averages for the hour during which the process was operating are
contained in the hour. 4 Less than 75% of the one-minute averages for the hour during which the process was operating are
contained in the hour. 5 The process did not operate during the hour.