datacom equipment powertrends and cooling applications
TRANSCRIPT
Datacom Equipment Power Trendsand Cooling Applications
Second Edition
© 2012 ASHRAE (www.ashrae.org). For personal use only. Additional reproduction, distribution, or transmission in either print or digital form is not permitted without ASHRAE's prior written permission.
This publication was prepared in cooperation with TC 9.9, Mission Critical Facilities,Technology Spaces, and Electronic Equipment.
Any updates/errata to this publication will be posted on theASHRAE Web site at www.ashrae.org/publicationupdates.
For more information on the ASHRAE Datacom Series, visitwww.ashrae.org/datacenterefficiency.
For more information on ASHRAE TC 9.9, visithttp://tc99.ashraetcs.org.
© 2012 ASHRAE (www.ashrae.org). For personal use only. Additional reproduction, distribution, or transmission in either print or digital form is not permitted without ASHRAE's prior written permission.
Datacom Equipment Power Trendsand Cooling Applications
Second Edition
ASHRAE Datacom Series
Book 2
© 2012 ASHRAE (www.ashrae.org). For personal use only. Additional reproduction, distribution, or transmission in either print or digital form is not permitted without ASHRAE's prior written permission.
ISBN: 978-1-936504-28-2
© 2005, 2012 ASHRAE1791 Tullie Circle, NE
Atlanta, GA 30329www.ashrae.org
All rights reserved.Printed in the United States of America
Cover image by Joe Lombardo of DLB Associates.____________________________________________
ASHRAE has compiled this publication with care, but ASHRAE has not investigated, and ASHRAEexpressly disclaims any duty to investigate, any product, service, process, procedure, design, or the likethat may be described herein. The appearance of any technical data or editorial material in this publi-cation does not constitute endorsement, warranty, or guaranty by ASHRAE of any product, service,process, procedure, design, or the like. ASHRAE does not warrant that the information in the publi-cation is free of errors, and ASHRAE does not necessarily agree with any statement or opinion in thispublication. The entire risk of the use of any information in this publication is assumed by the user.
No part of this publication may be reproduced without permission in writing from ASHRAE, exceptby a reviewer who may quote brief passages or reproduce illustrations in a review with appropriatecredit, nor may any part of this publication be reproduced, stored in a retrieval system, or transmittedin any way or by any means—electronic, photocopying, recording, or other—without permission inwriting fromASHRAE. Requests for permission should be submitted at www.ashrae.org/permissions.
____________________________________________
Library of Congress Cataloging-in-Publication Data
Datacom equipment power trends and cooling applications. -- 2nd ed.p. cm. -- (ASHRAE datacom series ; bk. 2)
Includes bibliographical references and index.ISBN 978-1-936504-28-2 (softcover : alk. paper)
1. Electronic apparatus and appliances--Cooling. 2. Telecommunication--Equipment and supplies--Cooling. 3. Air conditioning--Design and construction. 4. Electronic data processing departments--Design and construction. I. American Society of Heating, Refrigerating and Air-ConditioningEngineers.TK7870.25.D38 2012697.9'316--dc23
2012014005
ASHRAE STAFF
SPECIAL PUBLICATIONS
Mark OwenEditor/Group Manager ofHandbook and Special Publications
Cindy Sheffield MichaelsManaging Editor
Matt WalkerAssociate Editor
Elisabeth WarrickAssistant Editor
Meaghan O’NeilEditorial Assistant
Michshell PhillipsEditorial Coordinator
PUBLISHING SERVICES
David SoltisGroup Manager of Publishing Servicesand Electronic Communications
Tracy BeckerGraphics Specialist
Jayne JacksonPublication Traffic Administrator
PUBLISHER
W. Stephen Comstock
© 2012 ASHRAE (www.ashrae.org). For personal use only. Additional reproduction, distribution, or transmission in either print or digital form is not permitted without ASHRAE's prior written permission.
Foreword . . . . . . . . . . . . . . . . . . . . . . . . . . . . . . . . . . . . . . . . . . . . . . . . vii
Preface . . . . . . . . . . . . . . . . . . . . . . . . . . . . . . . . . . . . . . . . . . . . . . . . . . . ix
Acknowledgments. . . . . . . . . . . . . . . . . . . . . . . . . . . . . . . . . . . . . . . . . .xi
1 Introduction
1.1 Purpose/Objective . . . . . . . . . . . . . . . . . . . . . . . . . . . . . . . . . . . 1
2 Background
2.1 Datacom Facility Planning . . . . . . . . . . . . . . . . . . . . . . . . . . . . . 32.2 Simple Example of Datacom Equipment Growth Impact
on a Facility . . . . . . . . . . . . . . . . . . . . . . . . . . . . . . . . . . . 62.3 Overview of Power Density Definitions . . . . . . . . . . . . . . . . . . . 112.4 IT and Facility Industry Collaboration . . . . . . . . . . . . . . . . . . . . 122.5 IT Industry Background. . . . . . . . . . . . . . . . . . . . . . . . . . . . . . . 13
3 Component Power Trends
3.1 Introduction . . . . . . . . . . . . . . . . . . . . . . . . . . . . . . . . . . . . . . . . 153.2 Servers and Their Components . . . . . . . . . . . . . . . . . . . . . . . . 153.3 Server Power Distribution . . . . . . . . . . . . . . . . . . . . . . . . . . . . . 203.4 Component Power Trends. . . . . . . . . . . . . . . . . . . . . . . . . . . . . 213.5 Power Supplies . . . . . . . . . . . . . . . . . . . . . . . . . . . . . . . . . . . . . 31
4 Load Trends and Their Application
4.1 Introduction—ASHRAE Updated and ExpandedAir-Cooling Power Trends . . . . . . . . . . . . . . . . . . . . . . . . 35
4.2 Definition of Watts per Equipment Square Foot Metric . . . . . . . 374.3 The 2005 ASHRAE Power Trend Chart . . . . . . . . . . . . . . . . . . 374.4 Power Trend Chart Evolution . . . . . . . . . . . . . . . . . . . . . . . . . . 394.5 Volume Servers. . . . . . . . . . . . . . . . . . . . . . . . . . . . . . . . . . . . . 394.6 Idle Power For Servers . . . . . . . . . . . . . . . . . . . . . . . . . . . . . . . 424.7 ASHRAE Liquid-Cooling Power Trends . . . . . . . . . . . . . . . . . . 47
Contents
© 2012 ASHRAE (www.ashrae.org). For personal use only. Additional reproduction, distribution, or transmission in either print or digital form is not permitted without ASHRAE's prior written permission.

vi Contents
4.8 Product Cycle vs. Building Life Cycle . . . . . . . . . . . . . . . . . . . .484.9 Predicting Future Loads. . . . . . . . . . . . . . . . . . . . . . . . . . . . . . .494.10 Provisioning for Future Loads . . . . . . . . . . . . . . . . . . . . . . . . .49
5 Air Cooling of Computer Equipment
5.1 Introduction . . . . . . . . . . . . . . . . . . . . . . . . . . . . . . . . . . . . . . . .515.2 Air Cooling Overview . . . . . . . . . . . . . . . . . . . . . . . . . . . . . . . . .525.3 Underfloor Distribution . . . . . . . . . . . . . . . . . . . . . . . . . . . . . . . .525.4 Overhead Distribution . . . . . . . . . . . . . . . . . . . . . . . . . . . . . . . .535.5 Managing Supply and Return Airflows. . . . . . . . . . . . . . . . . . . .555.6 Local Distribution . . . . . . . . . . . . . . . . . . . . . . . . . . . . . . . . . . . .585.7 Air-Cooling Equipment . . . . . . . . . . . . . . . . . . . . . . . . . . . . . . . .615.8 Air-Cooling Controls. . . . . . . . . . . . . . . . . . . . . . . . . . . . . . . . . .615.9 Reliability . . . . . . . . . . . . . . . . . . . . . . . . . . . . . . . . . . . . . . . . . .63
6 Liquid Cooling of Computer Equipment
6.1 Introduction . . . . . . . . . . . . . . . . . . . . . . . . . . . . . . . . . . . . . . . .656.2 Liquid Cooling Overview . . . . . . . . . . . . . . . . . . . . . . . . . . . . . .666.3 Liquid-Cooled Computer Equipment . . . . . . . . . . . . . . . . . . . . .666.4 Liquid Coolants for Computer Equipment . . . . . . . . . . . . . . . . .686.5 Datacom Facility Chilled-Water System. . . . . . . . . . . . . . . . . . .706.6 Reliability . . . . . . . . . . . . . . . . . . . . . . . . . . . . . . . . . . . . . . . . . .72
7 Practical Example of Trends to Data Center Design
7.1 Introduction . . . . . . . . . . . . . . . . . . . . . . . . . . . . . . . . . . . . . . . .73
Introduction to Appendices. . . . . . . . . . . . . . . . . . . . . . . . . . . . . . . . . .81
Appendix A—Glossary . . . . . . . . . . . . . . . . . . . . . . . . . . . . . . . . . . . . .83
Appendix B—Additional Power Trend Chart Information/Data . . . .101
Appendix C—Electronics, Semiconductors, Microprocessors, ITRS
C.1 Cost-Performance Processors . . . . . . . . . . . . . . . . . . . . . . . .113C.2 High-Performance Processors . . . . . . . . . . . . . . . . . . . . . . . .117C.3 Post CMOS . . . . . . . . . . . . . . . . . . . . . . . . . . . . . . . . . . . . . . .119
References/Bibliography . . . . . . . . . . . . . . . . . . . . . . . . . . . . . . . . . . .123
Index . . . . . . . . . . . . . . . . . . . . . . . . . . . . . . . . . . . . . . . . . . . . . . . . . . .125
© 2012 ASHRAE (www.ashrae.org). For personal use only. Additional reproduction, distribution, or transmission in either print or digital form is not permitted without ASHRAE's prior written permission.

Datacom (data processing and telecommunications) equipment technology isadvancing at a rapid pace, resulting in relatively short product cycles and anincreased frequency of datacom equipment upgrades. Because datacom facilitiesthat house this equipment, along with their associated HVAC infrastructure, arecomposed of components that are typically built to have longer life cycles, anymodern datacom facility design needs the ability to seamlessly accommodate themultiple datacom equipment deployments it will experience during its lifetime.
Based on the latest information from all the leading datacom equipment manu-facturers, Datacom Equipment Power Trends and Cooling Applications, SecondEdition, authored by ASHRAE Technical Committee (TC) 9.9, Mission CriticalFacilities, Technology Spaces, and Electronic Equipment, provides a new andexpanded datacom equipment power trend chart to allow the datacom facilitydesigner to more accurately predict the datacom equipment loads that the facility canexpect to have to accommodate in the future and provides ways of applying the trendinformation to datacom facility designs today. Trends for individual componentssupplement the previous trend information, providing an understanding of the forcesdriving overall information technology equipment (ITE) power consumption.
This book also includes an overview of various air- and liquid-cooling systemoptions that may be considered to handle future loads and an invaluable appendixcontaining a collection of terms and definitions used by datacom equipment manu-facturers, the facilities operation industry, and the cooling design and constructionindustry.
Foreword
© 2012 ASHRAE (www.ashrae.org). For personal use only. Additional reproduction, distribution, or transmission in either print or digital form is not permitted without ASHRAE's prior written permission.

© 2012 ASHRAE (www.ashrae.org). For personal use only. Additional reproduction, distribution, or transmission in either print or digital form is not permitted without ASHRAE's prior written permission.
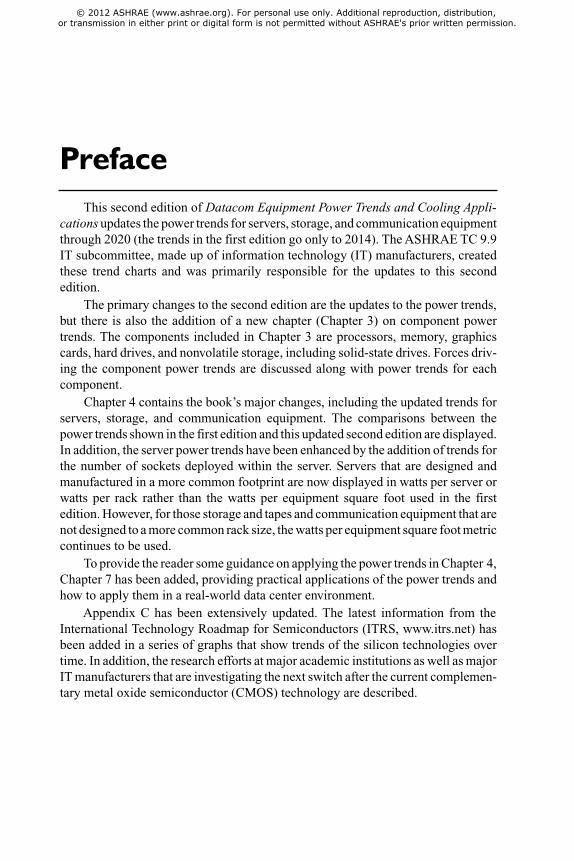
This second edition of Datacom Equipment Power Trends and Cooling Appli-cations updates the power trends for servers, storage, and communication equipmentthrough 2020 (the trends in the first edition go only to 2014). The ASHRAE TC 9.9IT subcommittee, made up of information technology (IT) manufacturers, createdthese trend charts and was primarily responsible for the updates to this secondedition.
The primary changes to the second edition are the updates to the power trends,but there is also the addition of a new chapter (Chapter 3) on component powertrends. The components included in Chapter 3 are processors, memory, graphicscards, hard drives, and nonvolatile storage, including solid-state drives. Forces driv-ing the component power trends are discussed along with power trends for eachcomponent.
Chapter 4 contains the book’s major changes, including the updated trends forservers, storage, and communication equipment. The comparisons between thepower trends shown in the first edition and this updated second edition are displayed.In addition, the server power trends have been enhanced by the addition of trends forthe number of sockets deployed within the server. Servers that are designed andmanufactured in a more common footprint are now displayed in watts per server orwatts per rack rather than the watts per equipment square foot used in the firstedition. However, for those storage and tapes and communication equipment that arenot designed to a more common rack size, the watts per equipment square foot metriccontinues to be used.
To provide the reader some guidance on applying the power trends in Chapter 4,Chapter 7 has been added, providing practical applications of the power trends andhow to apply them in a real-world data center environment.
Appendix C has been extensively updated. The latest information from theInternational Technology Roadmap for Semiconductors (ITRS, www.itrs.net) hasbeen added in a series of graphs that show trends of the silicon technologies overtime. In addition, the research efforts at major academic institutions as well as majorIT manufacturers that are investigating the next switch after the current complemen-tary metal oxide semiconductor (CMOS) technology are described.
Preface
© 2012 ASHRAE (www.ashrae.org). For personal use only. Additional reproduction, distribution, or transmission in either print or digital form is not permitted without ASHRAE's prior written permission.

© 2012 ASHRAE (www.ashrae.org). For personal use only. Additional reproduction, distribution, or transmission in either print or digital form is not permitted without ASHRAE's prior written permission.

ASHRAE TC 9.9 would like to particularly thank those who contributed greatlyto this updated second edition from the TC 9.9 IT subcommittee: Dave Moss, JonFitch, and Paul Artman from Dell; David Copeland from Oracle/Sun; Tim McCannfrom SGI; Bill French from EMC; Mike Patterson, Michael Nelson, Sunny Lam, andRobin Steinbrecher from Intel; Greg Pautsch from Cray; Roger Schmidt, DanSimco, and Jason Matteson from IBM; John Lanni and Mike Mangan from DLBAssociates; Jei Wei from Fujitsu; Declan O’Riodan and David Moore from HP; JimDonaldson from Hitachi; and Marlin Vogel from Juniper.
In addition, ASHRAE TC 9.9 wishes to thank the following people for helpingwith the final editing and formatting of the book: Roger Schmidt from IBM, RobinSteinbrecher from Intel, and Don Beaty and Neil Chauhan from DLB Associates.
TC 9.9 also wishes to thank Jonathan Kellen, Carol Hutchison, David Wang,Lang Yuan, and Mike Ellsworth.
Acknowledgments
© 2012 ASHRAE (www.ashrae.org). For personal use only. Additional reproduction, distribution, or transmission in either print or digital form is not permitted without ASHRAE's prior written permission.

© 2012 ASHRAE (www.ashrae.org). For personal use only. Additional reproduction, distribution, or transmission in either print or digital form is not permitted without ASHRAE's prior written permission.

1.1 PURPOSE/OBJECTIVE
It is important to consider the fundamental definition of trend, which for thisbook is defined as the general direction in which something tends to move. Thetrends referenced or presented in this book should not be taken literally but ratherconsidered as a general indication of both the direction and the magnitude of thesubject matter. The intended audience for this document includes
• planners and managers of datacom facilities,• facility design teams planning and designing datacom facilities, and• facility architects and engineers who require insight on datacom equipment
energy density and installation planning trends.
The variety of backgrounds and educational and practical experience among theintended audience can result in many different methods used to apply the informa-tion in this book. Fortunately, the book is designed for these multiple methods withthe understanding that any methodology employed focuses on the concept of growthpatterns.
Some practical examples of ways the growth patterns can be extracted areprovided in this book, but there are additional methods that can be considered in theplanning, design, and operation of a datacom facility. The growth patterns can useany baseline and provide a mathematical road map to the future. The baseline canuse any metrics or units that make the most sense for the reader. For example, theunits can be
• dimensionless,• density centric (e.g., W/ft2 [W/m2]), or• interface centric (e.g., kW/rack or kW/cabinet).
It is important for the information technology (IT) and facilities industries tohave a general understanding of areas that are not directly their responsibility but dodirectly impact their budgets, operation, or performance. This same general under-standing is important for equipment manufacturers, design architects/engineers,contractors, and service technicians.
Following is an overview of the chapters of this document.Chapter 1—Introduction. The introduction states the purpose/objective of the
book as well as a brief overview of the other chapters.
1
Introduction
© 2012 ASHRAE (www.ashrae.org). For personal use only. Additional reproduction, distribution, or transmission in either print or digital form is not permitted without ASHRAE's prior written permission.

2 Introduction
Chapter 2—Background. In this chapter the five key aspects of planning adatacom facility are discussed. In addition, a simple example is provided to showhow one might use this process in the planning stage. Finally, the use of the powerdensity metric is discussed.
Chapter 3—Component Power Trends. The basis for the power trends shownin Chapter 4 for servers, storage, and communication equipment are the componentsthat make up this equipment. This chapter provides some details of key IT compo-nents—processors, memory, graphics processors, hard drives, and nonvolatilememory.
Chapter 4—Load Trends and Their Application. This chapter contains anupdated and extended datacom equipment power trend chart including the historicaltrends for power dissipation of various server and storage equipment. An overviewis provided of the trend evolution of the various groupings of datacom equipmentfrom the previous power trend chart in the first edition of this book to the trend chartspublished herein. The power trends are enhanced in this book with both power/serverand power/rack metrics provided for those equipment categories that use a morecommon footprint. In addition, some of the server trend information is providedbased on the quantity of processor sockets supported in the server. There is also adiscussion of applying the load trend charts when planning the capacity of a newdatacom facility and an introduction on how to provision for that capacity.
Chapter 5—Air Cooling of Computer Equipment.Various configurations ofair cooling of computer equipment are presented. These configurations include cool-ing equipment outside the room, cooling equipment inside the room but outside therack, and cooling equipment physically mounted on the rack.
Chapter 6—Liquid Cooling of Computer Equipment. This chapter providesan introduction to the forces behind the reemergence of liquid cooling as a consid-eration and potential solution to higher-density loads along with details on the typesof liquid used for enhanced heat transfer.
Chapter 7—Practical Example of Trends to Data Center Design. This chap-ter uses a practical example to demonstrate how the trend chart data can be used inthe design of a data center facility to ensure that the future load values are establishedand planned for. A multistep process is outlined, and each step is explained in detailalong with some tabular templates that can be used to document the data gatheredduring each step.
Appendices. The appendices are a collection of information included to supple-ment the main body of this book. They provide information that is useful for thoseinvolved with datacom cooling but is not readily available or centrally collected. Forexample, the appendices include cooling-related terms used in the building design/construction industry and IT industry, which accomplishes the goal of a centralized,single source and emphasizes integration and collaboration of the industries.
© 2012 ASHRAE (www.ashrae.org). For personal use only. Additional reproduction, distribution, or transmission in either print or digital form is not permitted without ASHRAE's prior written permission.
2.1 DATACOM FACILITY PLANNING
Architects and engineers generally provide the environmental infrastructureaccording to existing conventions, building codes, and local conditions. However,they are not trained to be IT futurists, and given the volatility of technology, an ITstaff would have far more credible insight into IT requirements for their particularorganization, at least for tactical planning cycles.
The IT staff can provide some insight as to what could happen in the future, thusproviding some guidance in the strategic planning of a datacom facility in terms ofthe amount of space required as well as the environmental impacts governed bysystems of the future.
Because the trends have historically indicated increasing power density loads,there is a concern over the impact that the increase will have on how to characterizeor plan for these loads as well as the selection of the cooling system best suited tomeet the load. The most challenging question to answer is “Who really plans thedatacom facility?”
• Is it the architect/engineer?• Is it planned by the IT department based on forecasts of future datacom appli-
cations growth?• Is it planned by the facilities department once they are given the amount and
type of equipment from the IT department?• Is it the owner/developer of the facility based on financial metrics?• Is it a joint decision among all the parties listed above?
Unfortunately, for many companies the planning process for the growth of data-com facilities or the building of new datacom facilities is not a well-documentedprocess. The purpose of this book is to focus on the power trends of datacom equip-ment and also briefly outline a process for arriving at the floor space, power, andcooling required and, hopefully, take some of the confusion out of the process.
Each datacom facility is unique and each company uses different applications,resulting in a different set of hardware; thus, the characteristics of datacom facilitiesvary quite dramatically. The computer room space (also known as white space orraised floor) occupied by the hardware of one specific datacom facility is shown inTable 2.1.
The point in presenting this breakdown is that there are many components thatmake up the computer room space required for a datacom facility. Many times the
2
Background
© 2012 ASHRAE (www.ashrae.org). For personal use only. Additional reproduction, distribution, or transmission in either print or digital form is not permitted without ASHRAE's prior written permission.

Table 2.1 Datacom Computer Room Area Breakdown Example
Space DescriptionFacility Area
(Percent of Total)
IT Space
Storage Servers 19.0%
Compute Servers 11.0%
Telecommunications 5.0%
Command Area 4.0%
Printers 2.0%
Patch Panels 1.0%
IT Space Subtotal 42.0%
Non-IT Space
Aisles 20.0%
Empty (Future Growth) 16.0%
Cooling Equipment 12.0%
Specialty Rooms 3.5%
Power Distribution 3.0%
Room Supplies 2.0%
Columns 1.0%
Doorways/Access Ramps 0.5%
Non-IT Space Subtotal 58.0%
GRAND TOTAL 100.0%
4 Background
focus is on the servers, but a holistic view must be maintained in developing thespace required and must include all the elements.
The hardware that makes up the datacom facility should not be the initial focusfor planning a datacom facility. Although the hardware physically occupies thespace on the datacom facility floor, the software does all the work. Therefore, theplanning should begin with an understanding of the company’s goals, both now andin the future. Application capacity drives hardware acquisition, which in turn drivesthe following energy requirements:
• Floor space for existing applications• Performance growth of technology based on footprint
© 2012 ASHRAE (www.ashrae.org). For personal use only. Additional reproduction, distribution, or transmission in either print or digital form is not permitted without ASHRAE's prior written permission.

Datacom Equipment Power Trends and Cooling Applications, Second Edition 5
• Processing capability compared to storage capability• Change in applications over time• Asset turnover
Each requirement will now be described briefly. Again, this book is focused onequipment power trends and their impact on the environment housing this equipmentand the resulting infrastructure needed to support this equipment. However, theinterrelationships of the other elements that go into the plan for datacom facilityfloor space need to be understood. The importance of the equipment power trendchart will become evident as we proceed through the steps in this planning process.
Figure 2.1 Datacom computer room area allocation example.
2.1.1 Floor Space for Existing Applications
When a new datacom facility is planned, one might assume there is absolutelyno relation between the new facility being planned and the existing one still in use,but it is still instructive to generate the space allocated by the various pieces of equip-ment in the existing datacom facility. This can be surprisingly educational to thoseplanning either the next stage of the new datacom facility or the growth of the exist-ing one.
A simple way to graphically show the spatial allocation of the equipment is witha pie chart, as shown in Figure 2.1. One can quickly get a sense of the proportionsof the various elements and their space requirements. Many times people aresurprised by how little space is taken up by the actual hardware (storage servers,compute servers, and telecom equipment) and how much space appears to be whitespace (i.e., the facility area required to support the actual hardware).
© 2012 ASHRAE (www.ashrae.org). For personal use only. Additional reproduction, distribution, or transmission in either print or digital form is not permitted without ASHRAE's prior written permission.
6 Background
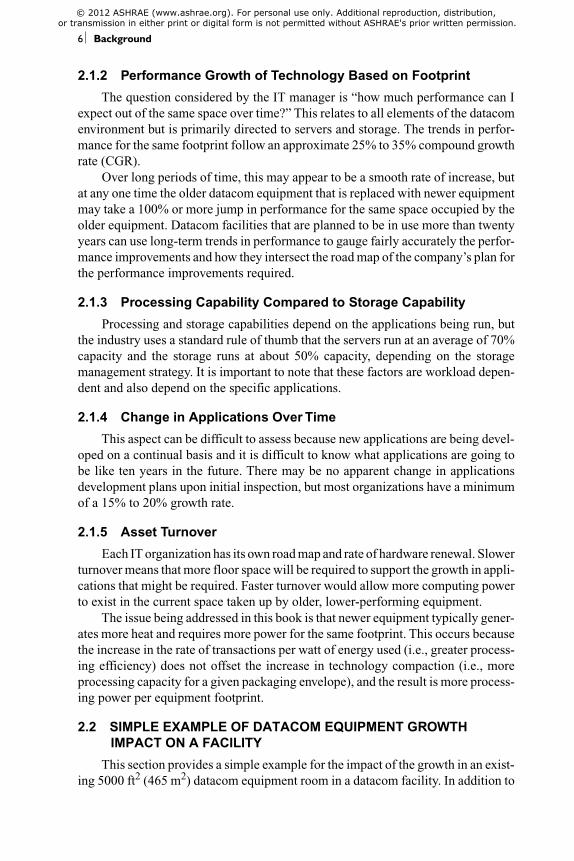
2.1.2 Performance Growth of Technology Based on Footprint
The question considered by the IT manager is “how much performance can Iexpect out of the same space over time?” This relates to all elements of the datacomenvironment but is primarily directed to servers and storage. The trends in perfor-mance for the same footprint follow an approximate 25% to 35% compound growthrate (CGR).
Over long periods of time, this may appear to be a smooth rate of increase, butat any one time the older datacom equipment that is replaced with newer equipmentmay take a 100% or more jump in performance for the same space occupied by theolder equipment. Datacom facilities that are planned to be in use more than twentyyears can use long-term trends in performance to gauge fairly accurately the perfor-mance improvements and how they intersect the road map of the company’s plan forthe performance improvements required.
2.1.3 Processing Capability Compared to Storage Capability
Processing and storage capabilities depend on the applications being run, butthe industry uses a standard rule of thumb that the servers run at an average of 70%capacity and the storage runs at about 50% capacity, depending on the storagemanagement strategy. It is important to note that these factors are workload depen-dent and also depend on the specific applications.
2.1.4 Change in Applications Over Time
This aspect can be difficult to assess because new applications are being devel-oped on a continual basis and it is difficult to know what applications are going tobe like ten years in the future. There may be no apparent change in applicationsdevelopment plans upon initial inspection, but most organizations have a minimumof a 15% to 20% growth rate.
2.1.5 Asset Turnover
Each IT organization has its own road map and rate of hardware renewal. Slowerturnover means that more floor space will be required to support the growth in appli-cations that might be required. Faster turnover would allow more computing powerto exist in the current space taken up by older, lower-performing equipment.
The issue being addressed in this book is that newer equipment typically gener-ates more heat and requires more power for the same footprint. This occurs becausethe increase in the rate of transactions per watt of energy used (i.e., greater process-ing efficiency) does not offset the increase in technology compaction (i.e., moreprocessing capacity for a given packaging envelope), and the result is more process-ing power per equipment footprint.
2.2 SIMPLE EXAMPLE OF DATACOM EQUIPMENT GROWTH
IMPACT ON A FACILITY
This section provides a simple example for the impact of the growth in an exist-ing 5000 ft2 (465 m2) datacom equipment room in a datacom facility. In addition to
© 2012 ASHRAE (www.ashrae.org). For personal use only. Additional reproduction, distribution, or transmission in either print or digital form is not permitted without ASHRAE's prior written permission.

Datacom Equipment Power Trends and Cooling Applications, Second Edition 7
the datacom equipment itself, the datacom equipment also houses power distributionunits (PDUs) and chilled-water computer room air conditioning (CRAC) units andhas some ancillary space (cross aisles, spare parts storage, etc.). For the purposes ofthis example, we consider two baseline scenarios:
Scenario 1—Equipment on which the end user runs applications thatrequire a balanced datacom equipment deployment among compute serv-ers, storage servers, and telecom equipment.
Scenario 2—Equipment on which the end user runs applications thatrequire a compute server intensive deployment.
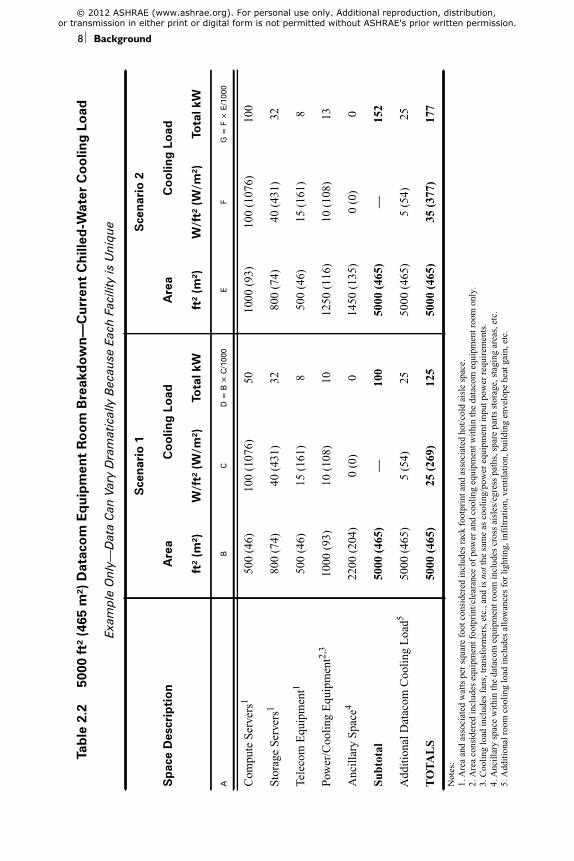
These two baseline scenarios are summarized in Table 2.2. The rows representthe different types of space that occupy the 5000 ft2 (465 m2) gross floor area of thedatacom equipment room and the columns list the areas and their cooling loadcontributions expressed in watts per square foot* and in total kilowatts for each typeof space.
In addition to the cooling load contribution of each space type, an additional5 W/ft2 (54W/m2) cooling load for the entire room is considered to account for light-ing, infiltration, ventilation, etc.
Note: This breakdown is not intended to encompass every datacom facilitybecause each facility is unique.
As shown in Table 2.2, the total current cooling load would be around 35 tons(125 kW) for Scenario 1, which equates to an average of around 25 W/ft2 (269 W/m2)when considered over the 5000 ft2 (465 m2) gross floor area of the datacom equip-ment room. For Scenario 2, it would be approximately 50 tons (177 kW), whichequates to around 35 W/ft2 (377 W/m2), again over the gross floor area.
Now consider the following future scenario. If the current workload on the serv-ers already accounts for 30% to 60% of the hardware capacity, and workload (appli-cations) is increasing at a rate of 40% to 50% CGR, then the workload will exceedthe current hardware capacity in one to two years. To compensate for this, more hard-ware is needed to sustain the applications installed and the company decides toreplace 50% of compute servers and 50% of storage servers that are now four yearsold with newer, more powerful versions capable of meeting the future workload. Thenew datacom equipment cooling load values are determined from the trend charts inChapter 4 as follows:
• New compute servers will have a cooling load of 300 W/ft2 (3228 W/m2).• New storage servers will have a cooling load of 80 W/ft2 (862 W/m2).
The resulting cooling load breakdown is illustrated in Table 2.3, which buildson the baseline scenarios in Table 2.2 by adding additional rows (shaded) to accountfor the new compute and storage servers and also includes the associated coolingloads extracted from growth patterns highlighted in the trend charts. Because 50%
* Throughout this book, watts per square foot is used to represent power density. The SI equiv-alent is watts per square meter. In the text, whenever numerical values for power density aresupplied, they are provided in both I-P and SI units.
© 2012 ASHRAE (www.ashrae.org). For personal use only. Additional reproduction, distribution, or transmission in either print or digital form is not permitted without ASHRAE's prior written permission.
Tab
le 2
.2
500
0 ft
² (4
65 m
²) D
atac
om
Eq
uip
men
t R
oo
m B
reak
do
wn—
Cur
rent
Chi
lled
-Wat
er C
oo
ling
Load
Exam
ple
Onl
y—D
ata
Can
Var
y D
ram
atic
ally
Bec
ause
Eac
h Fa
cilit
y is
Uni
que
Sp
ace
Des
crip
tio
n
Sce
nari
o 1
Sce
nari
o 2
Are
aC
oo
ling
Load
Are
aC
oo
ling
Load
ft²
(m²)
W/f
t² (
W/m
²)To
tal k
Wft
² (m
²)W
/ft²
(W
/m²)
Tota
l kW
AB
CD
= B
× C
/100
0E
FG
= F
× E
/100
0
Com
pute
Serv
ers1
500
(46)
100
(107
6)50
1000
(93)
100
(107
6)10
0
Stor
age
Serv
ers1
800
(74)
40(4
31)
3280
0(7
4)40
(431
)32
Tele
com
Equ
ipm
ent1
500
(46)
15(1
61)
850
0(4
6)15
(161
)8
Pow
er/C
oolin
gE
quip
men
t2,3
1000
(93)
10(1
08)
1012
50(1
16)
10(1
08)
13
Anc
illar
ySp
ace4
2200
(204
)0
(0)
014
50(1
35)
0(0
)0
Subt
otal
5000
(465
)—
100
5000
(465
)—
152
Add
ition
alD
atac
omC
oolin
gL
oad5
5000
(465
)5
(54)
2550
00(4
65)
5(5
4)25
TO
TA
LS
5000
(465
)25
(269
)12
550
00(4
65)
35(3
77)
177
Not
es:
1.A
rea
and
asso
ciat
edw
atts
per
squa
refo
otco
nsid
ered
incl
udes
rack
foot
prin
tand
asso
ciat
edho
t/col
dai
sle
spac
e.2.
Are
aco
nsid
ered
incl
udes
equi
pmen
tfoo
tpri
nt/c
lear
ance
ofpo
wer
and
cool
ing
equi
pmen
twith
inth
eda
taco
meq
uipm
entr
oom
only
.3.
Coo
ling
load
incl
udes
fans
,tra
nsfo
rmer
s,et
c.,a
ndis
nott
hesa
me
asco
olin
g/po
wer
equi
pmen
tinp
utpo
wer
requ
irem
ents
.4.
Anc
illar
ysp
ace
with
inth
eda
taco
meq
uipm
entr
oom
incl
udes
cros
sai
sles
/egr
ess
path
s,sp
are
part
sst
orag
e,st
agin
gar
eas,
etc.
5.A
dditi
onal
room
cool
ing
load
incl
udes
allo
wan
ces
for
light
ing,
infi
ltrat
ion,
vent
ilatio
n,bu
ildin
gen
velo
pehe
atga
in,e
tc.
8 Background
© 2012 ASHRAE (www.ashrae.org). For personal use only. Additional reproduction, distribution, or transmission in either print or digital form is not permitted without ASHRAE's prior written permission.

Tab
le 2
.3
500
0 ft
² (4
65 m
²) D
atac
om
Eq
uip
men
t R
oo
m B
reak
do
wn—
Ant
icip
ated
Chi
lled
-Wat
er C
oo
ling
Load
Exam
ple
Onl
y—D
ata
Can
Var
y D
ram
atic
ally
Bec
ause
Eac
h Fa
cilit
y is
Uni
que
Sp
ace
D
escr
ipti
on
Sce
nari
o 1
Sce
nari
o 2
Are
aC
oo
ling
Load
Are
aC
oo
ling
Load
ft²
(m²)
W/f
t² (
W/m
²)To
tal k
Wft
² (m
²)W
/ft²
(W
/m²)
Tota
l kW
AB
CD
= B
× C
/100
0E
FG
= F
× E
/100
0
Old
Com
pute
Serv
ers1
250
(23)
100
(107
6)25
500
(47)
100
(107
6)50
New
Com
pute
Serv
ers1
250
(23)
300
(322
8)75
500
(47)
300
(322
8)15
0
Old
Stor
age
Serv
ers1
400
(37)
40(4
31)
1640
0(3
7)40
(431
)16
New
Stor
age
Serv
ers1
400
(37)
80(8
62)
3240
0(3
7)80
(862
)32
Tele
com
Equ
ipm
ent1
500
(46)
15(1
61)
850
0(4
6)15
(161
)8
Pow
er/C
oolin
gE
quip
men
t2,3
1250
(116
)15
(161
)19
1250
(116
)10
(108
)15
Anc
illar
ySp
ace4
1950
(181
)0
(0)
014
50(1
35)
0(0
)0
Subt
otal
5000
(465
)—
175
5000
(465
)—
271
Add
ition
alD
atac
omC
oolin
gL
oad5
5000
(465
)5
(54)
2550
00(4
65)
5(5
4)25
TO
TA
LS
5000
(465
)40
(431
)20
050
00(4
65)
59(6
35)
296
Not
es:
1.A
rea
and
asso
ciat
edw
atts
per
squa
refo
otco
nsid
ered
incl
udes
rack
foot
prin
tand
asso
ciat
edho
t/col
dai
sle
spac
e.2.
Are
aco
nsid
ered
incl
udes
equi
pmen
tfoo
tpri
nt/c
lear
ance
ofpo
wer
and
cool
ing
equi
pmen
twith
inth
eda
taco
meq
uipm
entr
oom
only
.3.
Coo
ling
load
incl
udes
fans
,tra
nsfo
rmer
s,et
c.,a
ndis
nott
hesa
me
asco
olin
g/po
wer
equi
pmen
tinp
utpo
wer
requ
irem
ents
.4.
Anc
illar
ysp
ace
with
inth
eda
taco
meq
uipm
entr
oom
incl
udes
cros
sai
sles
/egr
ess
path
s,sp
are
part
sst
orag
e,st
agin
gar
eas,
etc.
5.A
dditi
onal
room
cool
ing
load
incl
udes
allo
wan
ces
for
light
ing,
infi
ltrat
ion,
vent
ilatio
n,bu
ildin
gen
velo
pehe
atga
in,e
tc.
Datacom Equipment Power Trends and Cooling Applications, Second Edition 9
© 2012 ASHRAE (www.ashrae.org). For personal use only. Additional reproduction, distribution, or transmission in either print or digital form is not permitted without ASHRAE's prior written permission.
10 Background
of the compute servers were to be replaced, the area that was occupied by the oldcompute servers was simply halved and distributed evenly between the old and newcompute servers (the same method was used for old and new storage servers).
Associated power and cooling upgrades are also required to handle the morepowerful servers. The space for the additional floor-mounted cooling equipment willbe at the expense of some of the ancillary space and is reflected as such in Table 2.3.It is also assumed that the cooling load in watts per square foot for the cooling/powerequipment will increase through extended use to satisfy the increased load.
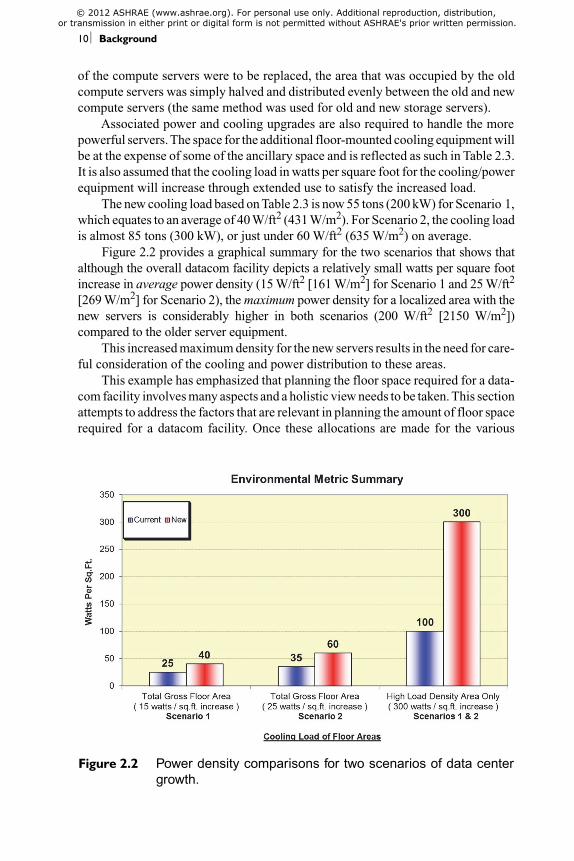
The new cooling load based on Table 2.3 is now 55 tons (200 kW) for Scenario 1,which equates to an average of 40 W/ft2 (431 W/m2). For Scenario 2, the cooling loadis almost 85 tons (300 kW), or just under 60 W/ft2 (635 W/m2) on average.
Figure 2.2 provides a graphical summary for the two scenarios that shows thatalthough the overall datacom facility depicts a relatively small watts per square footincrease in average power density (15 W/ft2 [161 W/m2] for Scenario 1 and 25 W/ft2
[269 W/m2] for Scenario 2), the maximum power density for a localized area with thenew servers is considerably higher in both scenarios (200 W/ft2 [2150 W/m2])compared to the older server equipment.
This increased maximum density for the new servers results in the need for care-ful consideration of the cooling and power distribution to these areas.
Figure 2.2 Power density comparisons for two scenarios of data centergrowth.
This example has emphasized that planning the floor space required for a data-com facility involves many aspects and a holistic view needs to be taken. This sectionattempts to address the factors that are relevant in planning the amount of floor spacerequired for a datacom facility. Once these allocations are made for the various
© 2012 ASHRAE (www.ashrae.org). For personal use only. Additional reproduction, distribution, or transmission in either print or digital form is not permitted without ASHRAE's prior written permission.

Datacom Equipment Power Trends and Cooling Applications, Second Edition 11
pieces of equipment, then the other aspects of the infrastructure need to be assessed,including power distribution capabilities and cooling capabilities.
These factors may cause the design team to examine other cooling options, suchas expansion of the facility area to decrease the heat density (which has to beweighed against the cost of the expansion) or using a more effective cooling systemsuch as liquid cooling.
With recent data showing the power per rack exceeding 20 kW, these trendsneed to be closely examined, whereas in the past increasing power per rack was nota concern or an issue. In today’s environment, the equipment power trends have tobe one of the top priorities for any datacom facility planning process.
2.3 OVERVIEW OF POWER DENSITY DEFINITIONS
Current design and planning of datacom facilities typically uses metrics basedon either historical data or the industry experience of the design professionals. Untilvery recently, the most common metric used was an average watts per square footof available datacom equipment power over the technical (or raised-floor) area of thedatacom facility.
The watts per area metric evolved from circumstances where the occupancy ofa given datacom facility was not known, which was the case when many developer-driven, speculative facilities were built at the height of the datacom industry boom.As a result, the natural high-level or preliminary approach is to use a broad and aver-aged metric such as watts per square foot to define the load.
There has been much controversy over the inaccuracies and varying definitionsof the watts per square foot metric (Mitchell-Jackson 2001).Accurately determiningheat density in terms of watts per square foot requires a clear understanding of theactual values and origins of the watts and area being considered.
The watts being considered can include simply the nameplate data or rated loadof each piece of information technology equipment (ITE). A variation is to use aderating factor to account for the difference between the rated load and the measuredload.Another variation is to base the load on the uninterruptible power supply (UPS)input (assuming all equipment is on UPS) because this accounts for efficiency lossesof UPS units, PDUs, etc.Yet another variation is to also include the load for supportequipment such as HVAC systems, although this is a value that is driven more by util-ity companies that are concerned with total power to the building.
The area can vary simply by considering net versus gross areas of the datacomequipment room, but there are many other variations as well. In cases where the foot-print of the building is used as a guideline, the types of mechanical and power deliv-ery systems have a profound impact on the actual building footprint. Specificcomponents such as chillers or generators can be located either inside or outside thebuilding depending on the preferences of the stakeholders and the constraints of thesite and/or local ordinances.
Also, because the power trend chart points to higher-density loads that aregreater than the loads that have been experienced in the field to this point, little infor-mation is established or available regarding what the preliminary watts per squarefoot should be for those loads.
© 2012 ASHRAE (www.ashrae.org). For personal use only. Additional reproduction, distribution, or transmission in either print or digital form is not permitted without ASHRAE's prior written permission.

12 Background
As a result, some are pushing for the more precise kilowatts per rack metric.Thekilowatts per rack metric is based on approximating the load per rack and then esti-mating the population of racks within the facility to obtain an overall load. Thissecond edition of Datacom Equipment Power Trends and Cooling Applicationsincludes kilowatts per rack and per server for those standard-sized servers. Fornonstandard servers, storage, and communication equipment, watts per square footcontinues to be the most relevant metric to display.
The first challenge to overcome during data center provisioning is the inherentsequence of events. Often at project inception (especially if it is a new site, newroom, or major renovation) the datacom computer equipment has not been finalizedand certainly the rack configuration remains unknown. Therefore, the rack config-uration (i.e., the equipment type and quantity within a given rack) is estimated inorder to establish a load.
Second, equipment nameplate data are often the only information provided bythe manufacturers to establish the cooling load, and using this method essentiallyequates datacom equipment power load with the heat dissipation of that particularpiece of datacom equipment. However, this is not as accurate as it was firstperceived, because the datacom equipment manufacturers’ nameplate data arepublished with a focus on regulatory safety and not heat dissipation. To overcomethis discrepancy, a standard thermal report format was introduced in Thermal Guide-lines for Data Processing Environments (ASHRAE 2009a) and, in conformancewith the guidelines set forth in that publication, datacom equipment manufacturerspublish meaningful heat release data for their equipment that allows for a more accu-rate load assessment. Also, most ITE manufacturers provide the heat release infor-mation for their products on their Web sites in even greater detail, with tools thatallow modeling of specific configurations. Also, the anticipated ENERGY STAR®
program for servers (EPA 2011) will have additional influence on manufacturers toshare actual heat release data.
Both the watts per square foot and the kilowatts per rack metrics are used tocalculate a load at a point in time, but only when the values are used in conjunctionwith the datacom equipment power trend charts can one begin to understand andpredict how that load could change for future datacom equipment deploymentsacross the life cycle of the facility.
2.4 IT AND FACILITY INDUSTRY COLLABORATION
There is a critical need to increase the collaboration between the semiconductor/IT industry and the facility building design/construction industry.
Historically, the semiconductor and IT industries have closely collaborated onpower and cooling technologies integral to the ITE itself. Similarly, the data centerfacility design and construction industries have required close collaboration.
However, the IT and facilities departments within a given organization are oftenseparate (sometimes even reporting to a different division of the company). IT, facil-ities, and real estate have limited communication or collaboration channels withinmany organizations and also within the overall industry. The result of the limitation
© 2012 ASHRAE (www.ashrae.org). For personal use only. Additional reproduction, distribution, or transmission in either print or digital form is not permitted without ASHRAE's prior written permission.

Datacom Equipment Power Trends and Cooling Applications, Second Edition 13
in these channels is the risk of one department negatively impacting the other bymaking independent decisions.
As an example of the noncollaborative process, consider the following projectapproach to the introduction of a higher-density load through the deployment ofblade server equipment. Blade servers are the result of technology compaction,which allows for a greater processing density over the same equipment volume. Thegreater processing density also results in greater power and heat density.
• Step 1—The IT department determines the need to procure and deploy bladeservers, which represent a technology they have never used before. They con-sult with the datacom equipment manufacturers and select a manufacturer andproduct.
• Step 2—The IT department obtains preliminary pricing from the manufac-turer and requests funding. Little or no consideration is given at this time toadditional deployment costs to augment the support or infrastructure services(i.e., power and cooling). Management approves the pricing for the ITE aftergoing through the cost-benefit metrics as part of their approval process.
• Step 3—The datacom equipment is procured and the facilities department isnotified that new equipment is coming and that the datacom equipment roommust be modified to accommodate the new deployment.
• Step 4—The facilities department discovers the datacom equipment loads arefar beyond what they have ever cooled before. Due to their current experiencewith projected loads not being realized, their first reaction is skepticism andthe published loads are declared as being grossly overstated.
• Step 5—The facilities department asks their counterparts in other firms anddiscovers that people feel these incredible loads could be real.
• Step 6—The facilities department hires a mechanical consulting engineer andassigns them the task of figuring out how to cool this new equipment. No bud-get for this scope was assigned previously, and management is blindsided byan additional cost that was not considered in their previous metrics. Com-pounding the difficulty of accomplishing the actual cooling is the fact thatthere are only minimal financial resources available to accomplish it.
A critical focus for ASHRAE Technical Committee 9.9, Mission Critical Facil-ities, Technology Spaces and Electronic Equipment, is to not only provide engineer-ing information to support the overall industry but to have that information reachboth the facilities and IT industries. The committee’s job includes eliminatingscenarios such as the one just described.
2.5 IT INDUSTRY BACKGROUND
The IT industry continues to respond to client demand with their focus on morespeed, more data storage, more bandwidth, higher density, smaller footprint/volume,more portability, more openness, and lower cost.
The typical life cycle for a facility’s infrastructure (e.g., air handlers, pumps,and chillers) can be 10 to 25 years, whereas that of the datacom equipment it serves
© 2012 ASHRAE (www.ashrae.org). For personal use only. Additional reproduction, distribution, or transmission in either print or digital form is not permitted without ASHRAE's prior written permission.

14 Background
is an order of magnitude less. Further, the building itself (e.g., steel and concrete,bricks and mortar) can have a life cycle well beyond 25 years.
A critical challenge in data center design is to initially plan and design both newconstruction and renovation projects so that the investment in the building and itsinfrastructure is fully realized and they do not become prematurely obsolete.
Datacom equipment power trends over the past ten years have been on a pathof rapid increase. There has also been a trend toward equipment compaction,compounding the increases in load density (watts per square foot or watts per rack).While power consumption is increasing, the focus on technology compaction iscausing the power per equipment footprint to increase at a more rapid rate. Chapter 4shows that this dramatic increase in IT power trends over the past decade has startedto taper off for some server designs.
In addition to the rack power trends described in detail in Chapter 4, one mustconsider the increased use of ITE to solve the world’s problems (research in drugs,diagnosing diseases, weather forecasting, social media, defense, telecommunica-tions, traffic control, etc.). This revolutionary technology is indeed a boon to thehuman race and man will continue to exploit it to its fullest capability. All this drivesmore use of ITE, including much larger storage requirements, resulting in an overallincrease in the power and cooling required for hardware to support these efforts.
© 2012 ASHRAE (www.ashrae.org). For personal use only. Additional reproduction, distribution, or transmission in either print or digital form is not permitted without ASHRAE's prior written permission.

3.1 INTRODUCTION
The topic of power consumption of ITE and its future trends provides value indata center planning; however, it provides little insight into what is consuming thatpower and why. One might reasonably assume that each component’s power trendfollows the overall system trends, but that is not the case. Component designers andmanufacturers place great emphasis on improving performance while ensuring thatpower remains manageable and competitive. Market demands require power opti-mization while enabling a highly dynamic range in performance to support widelyvarying workloads. To provide a better understanding of ITE, and servers specifi-cally, the following sections discuss the major components within a server, compo-nent power consumption trends, and the forces driving power consumption andperformance.
3.2 SERVERS AND THEIR COMPONENTS
Most volume servers contain the following major hardware building blocks:processors, memory, chipset, input/output (I/O) devices, storage, peripherals, volt-age regulators, and power supplies. Additional application-specific integratedcircuits (ASICs) may be necessary, such as an onboard redundant array of indepen-dent or inexpensive disks (RAID) controller and a server management controller,along with discrete components such as capacitors and resistors, which dissipaterelatively little power.
The processor, also referred to as the CPU (central processing unit), is usually theprimary source of heat generation within a server. Aside from the basic processing ofdata and instructions to provide an output result, the processors of today may also havemany more features for managing data and power throughout a system. For example,a processor may have a lid to more evenly distribute its heat to an attached coolingcomponent such as a heat sink or cold plate in the case of liquid cooling. Figure 3.1shows a typical processor and Figure 3.2 shows a typical 1U server heat sink.
The onboard memory temporarily stores data that has been processed or is tobe processed. Memory hierarchy is driven by the latency to access the data and thecapacity to store that data. Onboard memory is one step removed from the on-processor memory that stores data more directly in the execution path. A dynamicrandom-access memory (DRAM) is packaged with many devices on one printedcircuit board (PCB), as shown in Figure 3.3. These cards have edge connectors thatallow them to be installed in sockets mounted on the board.
3
Component Power Trends
© 2012 ASHRAE (www.ashrae.org). For personal use only. Additional reproduction, distribution, or transmission in either print or digital form is not permitted without ASHRAE's prior written permission.