data.daff.gov.audata.daff.gov.au/data/warehouse/9aam/...v1.0.0.docx · web viewaustralian...
TRANSCRIPT

Australian fisheries economic indicators report 2014Financial and economic performance of the Eastern Tuna and Billfish FisheryAndrea Bath, Maggie Skirtun and Richard Green
Research by the Australian Bureau of Agriculturaland Resource Economics and Sciences
April 2016

© Commonwealth of Australia 2016
Ownership of intellectual property rights
Unless otherwise noted, copyright (and any other intellectual property rights, if any) in this publication is owned by the Commonwealth of Australia (referred to as the Commonwealth).
Creative Commons licence
All material in this publication is licensed under a Creative Commons Attribution 3.0 Australia Licence, save for content supplied by third parties, logos and the Commonwealth Coat of Arms.
Creative Commons Attribution 3.0 Australia Licence is a standard form licence agreement that allows you to copy, distribute, transmit and adapt this publication provided you attribute the work. A summary of the licence terms is available from creativecommons.org/licenses/by/3.0/au/deed.en. The full licence terms are available from creativecommons.org/licenses/by/3.0/au/legalcode.
Cataloguing data
Bath, A, Skirtun, M & Green, R 2016, Australian fisheries economic indicators report 2014: financial and economic performance of the Eastern Tuna and Billfish Fishery, ABARES, Canberra, April. CC BY 3.0.
ISSN 2204-9444ISBN 978-1-74323-284-2ABARES project 43351
Internet
Australian fisheries economic indicators report 2014: financial and economic performance of the Eastern Tuna and Billfish Fishery is available at agriculture.gov.au/abares/publications.
Australian Bureau of Agricultural and Resource Economics and Sciences (ABARES)
Postal address GPO Box 1563 Canberra ACT 2601Switchboard +61 2 6272 2010Facsimile +61 2 6272 2001Email [email protected] agriculture.gov.au/abares
Inquiries about the licence and any use of this document should be sent to [email protected].
The Australian Government acting through the Department of Agriculture and Water Resources, represented by the Australian Bureau of Agricultural and Resource Economics and Sciences, has exercised due care and skill in preparing and compiling the information and data in this publication. Notwithstanding, the Department of Agriculture and Water Resources, ABARES, its employees and advisers disclaim all liability, including for negligence and for any loss, damage, injury, expense or cost incurred by any person as a result of accessing, using or relying upon information or data in this publication to the maximum extent permitted by law.
Acknowledgements
The ABARES fisheries survey program involves the cooperative effort of industry, fisheries management, agencies and ABARES staff.
Industry—ABARES surveys are voluntary, so the cooperation of Eastern Tuna and Billfish Fishery fishing operators and their accountants in providing data is essential for the success of the fisheries surveys. Without this assistance the surveys would not be possible.
Management agencies—the Australian Fisheries Management Authority (AFMA) provided logbook and address data, as well as fishery management costs and general information about the surveyed fisheries. Comments by AFMA on earlier drafts are also gratefully acknowledged.
ABARES staff—sample design and estimation was undertaken with assistance from Lindsay Penrose, Belinda Barnes and Mark Chambers. Patricia Hobsbawn and Rupert Summerson helped in providing the necessary data and maps. Robert Curtotti, Ilona Stobutzki and Peter Gooday provided comments.
The Department of Agriculture and Water Resources funded this report through the Fisheries Resources Research Fund and ABARES.
ii

Australian fisheries economic indicators report 2014: Eastern Tuna and Billfish Fishery
ContentsSummary 1
Key results 1
1 Introduction 4
2 Background 6
Description of the fishery 6
Key economic trends 7
Current management arrangements 7
Demographic profile of fishers operating in the ETBF 10
3 Financial and economic performance 11
Financial performance 11
Economic performance 14
4 Other key performance indicators 16
Productivity 16
Terms of trade 17
Management costs 17
Entitlement values 19
Quota latency 19
5 Performance against management objectives 20
Appendix A: Survey definitions 21
Financial performance 21
Net economic returns 22
Survey-based estimation of net economic returns 23
Net economic returns and economic performance 24
Appendix B: Survey methods 25
Appendix C: Non-survey based estimation of net economic returns 28
Appendix D: Productivity and terms of trade methodology 31
Productivity measurement 31
Terms of trade measurement 31
Data 31
References 34
iii

Australian fisheries economic indicators report 2014: Eastern Tuna and Billfish Fishery
TablesTable 1 Key financial performance results, Eastern Tuna and Billfish Fishery 2
Table 2 Key economic performance results, Eastern Tuna and Billfish Fishery2
Table 3 Financial performance of boats operating, Eastern Tuna and Billfish Fishery 12
Table 4 Fishery cash profit and net economic returns, Eastern Tuna and Billfish Fishery 14
Table 5 Estimated market price of individual quota SFRs, Eastern Tuna and Billfish Fishery 19
Table C1 Regression model for average cash receipts, Eastern Tuna and Billfish Fishery 29
Table C2 Regression model for average operating costs, Eastern Tuna and Billfish Fishery 29
FiguresFigure 1 Landed catch of key species, Eastern Tuna and Billfish Fishery, 1998–
99 to 2013–14 8
Figure 2 Real gross value of production, Eastern Tuna and Billfish Fishery, 1998–99 to 2013–14 8
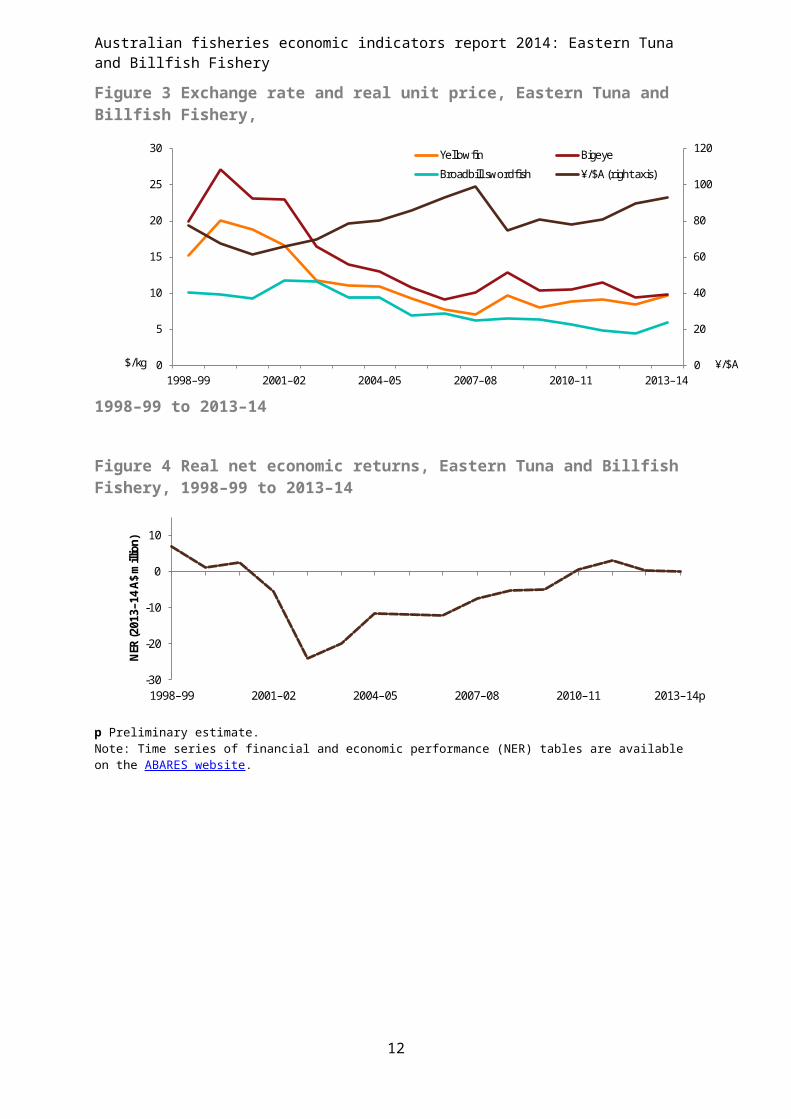
Figure 3 Exchange rate and real unit price, Eastern Tuna and Billfish Fishery, 1998–99 to 2013–14 8
Figure 4 Real net economic returns, Eastern Tuna and Billfish Fishery, 1998–99 to 2013–14 9
Figure 5 Number of vessels operating, Eastern Tuna and Billfish Fishery, 1998–99 to 2013–14 9
Figure 6 Key management changes, 1995–96 to 2013–14 9
Figure 7 Trends in key financial performance variables, Eastern Tuna and Billfish Fishery, 2002–03 to 2012–13 13
Figure 8 Trends in economic returns, Eastern Tuna and Billfish Fishery, 2002–03 to 2013–14 15
Figure 9 Productivity indexes, Eastern Tuna and Billfish Fishery 16
Figure 10 Input cost and output price indexes, Eastern Tuna and Billfish Fishery17
Figure 11 Total management costs, Eastern Tuna and Billfish Fishery 18
Figure 12 Average management cost per active vessel and as a share of GVP, Eastern Tuna and Billfish Fishery 18
iv

Australian fisheries economic indicators report 2014: Eastern Tuna and Billfish Fishery
MapsMap 1 Relative fishing intensity, Eastern Tuna and Billfish Fishery, 2014 6
BoxesBox 1 Economic indicators in fisheries management 5
Box D1 Fisher index 32
v

Australian fisheries economic indicators report 2014: Eastern Tuna and Billfish Fishery
SummaryABARES surveys of Commonwealth fisheries provide insights into the drivers of fishery economic and financial performance and how management and policy changes influence this. This report provides information about the financial and economic performance of the Eastern Tuna and Billfish Fishery (ETBF). Survey-based results are presented for 2011–12 and 2012–13; preliminary non-survey based results are presented for 2013–14.
The ETBF is a multispecies fishery that operates in waters from Cape York to the Victoria–South Australia border, encompassing waters around Tasmania and the high seas of the Pacific Ocean. Many of the species caught in the fishery are internationally shared, with Australia’s domestic management arrangements consistent with Australia’s commitments to the Western and Central Pacific Fisheries Commission (WCPFC). The majority of the catch is taken along the Queensland and New South Wales coast. The key landing ports for the fishery are Mooloolaba, Bermagui, Cairns, Coffs Harbour, Southport and Ulladulla. The fishery predominately uses pelagic longline to target tuna species (mainly yellowfin, bigeye and albacore tuna), swordfish and striped marlin. In the 2013–14 financial year the ETBF generated a gross value of production of $31.2 million, making it the second highest valued Commonwealth tuna fishery after the Southern Bluefin Tuna Fishery.
Net economic returns (NER) is the key performance indicator in these reports and is measured at the fishery level. It measures the economic return earnt by the fishery assuming all resources used in fishing activities, including family labour and use of the fishing operator’s boat capital, and the cost of managing the fishery are paid for. According to the Fisheries Management Act 1991, the Australian Fisheries Management Authority (AFMA) is required to pursue the maximisation of the net economic returns to the Australian community through managing Commonwealth fisheries (AFMA 2014). Interpretation of NER trends and the other economic indicators presented in this report can assist in assessing AFMA’s performance against this objective.
The economic performance of the ETBF has improved substantially since the early 2000s. From negative levels in 2003–04, NER steadily increased to become slightly positive in 2010–11, the first time since 2000–01. This positive change was driven primarily by improved productivity of the fleet, and reduced operating costs. The exit of less efficient vessels from the fishery following the implementation of the Securing our Fishing Future structural adjustment package between 2005 and 2006, would assist in reducing costs for remaining vessels but a change in catch composition toward higher unit value species also played a role in improving returns. NER remained positive from 2011–12 to 2013–14 but declined in 2012–13 and 2013–14 to levels that were only slightly positive. The decrease in NER from 2011–12 to 2012–13 was primarily driven by higher fuel prices.
Key resultsIn this survey, the survey population—defined as vessels that recorded more than one tonne of catch—was 47 vessels in 2011–12 and 41 vessels in 2012–13. From this population, 17 vessels were surveyed for 2011–12 and 14 vessels for 2012–13, representing 36 per cent of the population in 2011–12 and 34 per cent in 2012–13.
1
Australian fisheries economic indicators report 2014: Eastern Tuna and Billfish Fishery
Financial performance Profitability for the average ETBF operator was positive in 2011–12 and 2012–13. Profit
at full equity, a profit indicator that assumes all assets are fully owned by operators, declined for the average boat in the fishery between 2011–12 and 2012–13, from $139 612 to $86 492 (Table 1). The rate of return to full equity declined for the average boat in the fishery between 2011–12 and 2012–13, from 9 per cent to 7 per cent.
The decline in profit at full equity was largely a result of higher total cash costs, driven by increased spending on fuel.
Table 1 Key financial performance results, Eastern Tuna and Billfish Fishery
Vessel-level average
Category Unit 2011–12 2012–13
Total cash receipts $ 1 025 752 1 048 354
Total cash costs $ 892 325 970 647
Boat cash income $ 133 428 77 706
– less depreciation $ 33 232 32 269
Boat business profit $ 107 568 45 702
– plus interest, leasing, rent $ 32 044 40 791
Profit full equity $ 139 612 86 492
Rate of return to full equity % 9 7
Economic performance Net economic returns (including management costs) for the fishery fell from $2.9 million
in 2011–12 to $0.2 million in 2012–13 (Table 2).
Lower net economic returns in 2012–13 were mainly a result of a larger decline in fishing income relative to falling fishing costs, reflecting less vessels operating in the fishery in 2012–13.
In 2013–14 the preliminary NER were estimated to fall further to $0.1 million.
Table 2 Key economic performance results, Eastern Tuna and Billfish Fishery
Total fishery
Category Unit 2011–12 2012–13 2013–14p
Fishing income $m 43.9 38.6 39.3
Operating costs $m 38.7 36.4 37.7
Fishery cash profit $m 5.2 2.2 1.6
– less owner and family labour, opportunity cost of capital and depreciation
– plus interest, leasing and management fees
Net return (excluding management costs) $m 4.6 1.9 1.6
Net return (including management costs) $m 2.9 0.2 0.1
p Preliminary.
2

Australian fisheries economic indicators report 2014: Eastern Tuna and Billfish Fishery
Other indicators
Total factor productivity analysis (2002--03 to 2012–13) shows increasing productivity by an annual average of 4 per cent.
The terms of trade index, an indicator measuring the level of fishery output prices compared with input costs faced by fishers, declined over the period 2002--03 to 2012–13, with the index falling by 21 per cent. This had a moderating effect on the level of NER earnt from the fishery and increased the emphasis on achieving productivity improvements from the fleet.
Real total management costs for the fishery increased from 1997–98 to 2003–04, peaking at $4.3 million in 2003–04, then declined to $1.5 million by 2013–14. The decline in total management costs after 2003–04 supported the positive rising trend in NER and resulted in management costs as a share of gross value of production declining, from 11 per cent in 2005–06 to 5 per cent by 2013–14. Real management costs per active vessel in the fishery also declined, from $64 051 in 2007–08 to $38 568 by 2013–14, with lower total management costs more than offsetting the decline in the number of vessels in the fishery.
Management through total allowable commercial catch (TACC) limits and individual transferable quotas (ITQs) commenced in 2011. Landed catch as a proportion of total allowable catch varied from an average of 30 per cent to 79 per cent across the species caught in the fishery over the 2011 to 2014 fishing seasons, indicating a significant level of quota latency for the fishery. The high degree of quota latency suggests that the fishery may be operating close to an open access point, which lowers the likelihood of maximising NER over the long term.
Implications for management
Recent trends in the fishery show improvements in indicators of NER, financial performance, productivity and management costs. This suggests movement towards the fishery’s objective of maximising net economic returns to the Australian community. However, in this survey net economic returns are estimated to have declined in 2012–13 and 2013–14. If returns deteriorate further, managers may need to consider adjustments to management arrangements to improve economic performance of the fishery.
From March 2011 output controls were introduced for five key target species in the form of TACCs and allocated as ITQs to fishers that were operating in the fishery. This has provided fishers greater flexibility to fish with a more efficient combination of inputs. The transferability of fishing rights has also allowed quota to be allocated to more efficient operators. However, the success of output controls depends on setting levels of TACCs that meet the management objective. In the context of internationally shared stocks, setting TACCs at levels that maximise NER is complicated by uncertainty around the catch of other jurisdictions. Within this context, adjustments to TACC settings may need to be considered by managers if economic performance of the fishery deteriorates further.
3

Australian fisheries economic indicators report 2014: Eastern Tuna and Billfish Fishery
1 IntroductionABARES has undertaken regular surveys of key Commonwealth fisheries since the early 1990s. The resulting data are used to assess the financial performance of operators in the fishery and the economic performance of the fishery as a whole. Both performance measures act as important indicators for fishery managers (Box 1). In this report, survey-based results are presented for 2011–12 and 2012–13; preliminary non-survey based results are presented for 2013–14. To provide a more comprehensive assessment of fishery level performance, ABARES expanded the former Australian Fisheries Surveys report series in 2013 to include a range of economic indicators that draw on data collected from the surveys.
A distinction is made throughout the report between the two primary indicators: financial performance and economic performance. Financial performance estimates are calculated for the average boat in a fishery and include all cash receipts and cash costs that have been earned and incurred within the survey period. These estimates reflect the average boat’s profit and loss statement for all business activities, including cases where boats have operated in several fisheries.
The key indicator of economic performance presented is net economic returns (NER), which is reported at the fishery level. The NER estimates differ from financial performance estimates because they relate only to the surveyed fishery; results exclude revenues and costs attributable to operating in other fisheries and include other economic costs such as the opportunity cost of capital and the opportunity cost of labour. For definitions of these costs see Appendix A.
Other indicators also provide relevant information on performance. Vessel-level financial performance information provides a context for determining trends in the surveyed fishery; for example, positive financial profits at the boat level may reveal how operators continue to operate in a fishery that has experienced negative economic returns. These estimates are relevant to all industry operators, enabling them to compare their individual performance with that of the average boat. Other indicators included are productivity indexes, terms of trade analysis, entitlement values, management costs and latency.
The estimate of NER indicates the economic return to society associated with harvesting the fishery resource. According to the Fisheries Management Act 1991, the Australian Fisheries Management Authority (AFMA) is required to pursue the maximisation of net economic returns to the Australian community through managing Commonwealth fisheries (AFMA 2014). Although estimates of NER do not reveal how a fishery has performed relative to maximum potential NER (maximum economic yield) in a given period, interpretation of NER trends together with other economic indicators can assist in assessing AFMA’s performance against this objective. For example, a period of rising NER that is strongly linked to productivity growth implies that MEY is being approached.
4

Australian fisheries economic indicators report 2014: Eastern Tuna and Billfish Fishery
Box 1 Economic indicators in fisheries management
In September 2007 the Australian Government released the Commonwealth Fisheries Harvest Strategy Policy to provide guidelines for sustainable and profitable management of Commonwealth fisheries. The policy aims to maintain key commercial stocks at ecologically sustainable levels and maximise economic returns to the Australian community by targeting maximum economic yield (MEY) (DAFF 2007). To assess the performance of Commonwealth fisheries against their MEY targets, fishery policymakers frequently rely on economic indicators that provide them with information to inform management decisions and monitor performance.
Informing management decisions against the economic objective
This type of economic indicator is forward-looking and can advise fishery managers on policy settings necessary to achieve MEY. Bio-economic models provide indicators that serve this purpose; models have been developed for the Northern Prawn Fishery (Kompas & Che 2004) and the Southern and Eastern Scalefish and Shark Fishery (Kompas & Che 2008). Management strategy evaluation based approaches that include an economic component can also serve this purpose.
Monitoring management performance against the economic objective
This type of economic indicator is retrospective and assesses previous economic performance. It can provide insight into the impact of previous management decisions on economic performance. Most indicators examined in this report fall under this category. This includes the survey-based estimation of NER, productivity indexes, entitlement values, management costs, latency and terms of trade analysis.
Total factor productivity analysis is an economic tool used to assess how well fishers use inputs to produce outputs and how their ability to convert inputs into outputs over time has changed with changes in the fishery’s operating environment. Productivity indexes can inform fishery managers about the effect of management arrangements on average productivity levels in the fishery.
Analysis of fishers' terms of trade provides an indication of drivers behind changes in profitability or NER. It uses an index approach to examine changes in the price of inputs and outputs for a fishery over time and reveals information about the productivity improvements required to offset long term declines in the terms of trade.
In contrast, entitlement values (or quota values) signal the expected value of future profits to be obtained from the fishery. When compared over time, entitlement values can serve as a general indicator for how well the resources in a fishery have been sustained or managed. If entitlement values are increasing over time, this suggests resources are being managed effectively because operating in the fishery is deemed to have become more profitable.
Measures of management costs, in absolute terms and as a proportion of gross value of fishery production (GVP) and per active boat, also provide information about the cost-effectiveness of fishery management—another key objective referred to in the Fisheries Management Act 1991.
Latency, or the proportion of uncaught quota, can indicate limited economic incentives for fishers to participate in the fishery. A fishery where operators are not utilising their right to fish, is unlikely to be near its MEY target.
5

Australian fisheries economic indicators report 2014: Eastern Tuna and Billfish Fishery
2 BackgroundDescription of the fisheryThe Eastern Tuna and Billfish Fishery (ETBF) is located along the east and south coast of Australia, stretching from the tip of Cape York to the Victoria–South Australia border and includes the waters around Lord Howe Island and Norfolk Island. This multispecies fishery uses predominately pelagic longline to target three species of tuna, yellowfin, bigeye and albacore, along with swordfish and striped marlin. Minor line method is also used but accounts for only a small portion of the fishery’s catch, effort and gross value of production (GVP).
Map 1 Relative fishing intensity, Eastern Tuna and Billfish Fishery, 2014
The fishery operates year-round across some internationally shared stocks. Commonwealth management of the ETBF takes into account Australia’s obligations to the Western and Central Pacific Fisheries Commission (WCPFC), a regional fisheries management organisation responsible for managing internationally shared stocks of tuna and tuna-like species in the Pacific Ocean. The key ports for this fishery are Bermagui, Cairns, Coffs Harbour, Mooloolaba, Southport and Ulladulla (Larcombe & Bath 2015).
6

Australian fisheries economic indicators report 2014: Eastern Tuna and Billfish Fishery
Key economic trendsIn 2013–14 the ETBF was the largest Commonwealth tuna fishery by quantity, with a total landed catch of 4 682 tonnes. This consisted of mainly yellowfin tuna and swordfish. The fishery generated a GVP of $31.2 million. Yellowfin tuna accounted for the largest share of GVP (46 per cent, $14.4 million), followed by swordfish (23 per cent, $7.2 million) and bigeye tuna (15 per cent, $4.7 million).
Since 1998–99 the ETBF landed catch has been variable, with peaks in 2001–02, 2002–03 and 2006–07 (Figure 1). Over the past decade the catch has declined to around 5 000 tonnes. In contrast, real GVP declined at a faster rate after 2001–02 to around $30 million in 2005–06 and has since declined at a slower rate (Figure 2). The fall in real GVP is mainly attributable to the decline in real unit prices received for the more valued species caught in the fishery over this period (Figure 3). Almost 90 per cent of Australia’s tuna production is exported to Japan, so the fall in beach prices in this period largely reflects the appreciation in the exchange rate against the Japanese yen. Global production of the five key species caught in the fishery increased rapidly from 1999–2000 to 2003–04 (FAO 2015), adding to pressure on prices.
The NER in the ETBF was negative from 2001–02 to 2009–10 but has been improving since 2003–04, largely a result of improved productivity (Figure 4). In 2010–11 the fishery achieved positive NER, driven primarily by reduced operating costs. The Securing our Fishing Future structural adjustment package (occurring between 2005 and 2006) saw the likely exit of less efficient vessels from the fishery, which in turn assisted in reducing the cost of fishing for the remaining vessels. The number of vessels was already declining from a peak of 146 vessels in 1998–99; by 2007–08 only 58 vessels remained and in 2013–14 a total of 39 vessels were active (Figure 5). In addition, the shift in catch composition toward higher valued tuna species from 2006–07 contributed to increased fishing income and positive NER. The most recent survey results show that NER improved in 2011–12 but declined in 2012–13, largely because of higher fuel prices faced by operators.
Current management arrangementsIn March 2011 the fishery moved to a system of total allowable commercial catch (TACC) for key target species, with individual transferable quotas (ITQs) entitling holders to a share of the TACC. Quota species are albacore, bigeye tuna, yellowfin tuna, swordfish and striped marlin. Previously, the fishery was managed through transitional arrangements whereby a total allowable effort limit with transferable effort rights was in place (Figure 6). The system of TACC with ITQs manages catch in the fishery while allowing operators to choose a more efficient combination of inputs to operate their business in the most cost-effective way. This allows operators greater flexibility in adapting their business to improve profitability.
7

Australian fisheries economic indicators report 2014: Eastern Tuna and Billfish Fishery
Figure 1 Landed catch of key species, Eastern Tuna and Billfish Fishery, 1998–99 to2013–14
0
1
2
3
4
5
6
7
8
9
1998–99 2001–02 2004–05 2007–08 2010–11 2013–14
Land
ed ca
tch
(kilo
tonn
es)
Yellowfin Albacore Bigeye Broadbill swordfishStriped marlin Other
Figure 2 Real gross value of production, Eastern Tuna and Billfish Fishery,1998–99 to 2013–14
0
20
40
60
80
100
120
1998–99 2001–02 2004–05 2007–08 2010–11 2013–14
GVP
(201
3–14
A$
mill
ion)
Figure 3 Exchange rate and real unit price, Eastern Tuna and Billfish Fishery,1998–99 to 2013–14
Figure 4 Real net economic returns, Eastern Tuna and Billfish Fishery, 1998–99 to 2013–14
8
0
20
40
60
80
100
120
0
5
10
15
20
25
30
1998–99 2001–02 2004–05 2007–08 2010–11 2013–14
Yellowfin Bigeye
Broadbill swordfish ¥/$A (right axis)
$/kg ¥/$A

Australian fisheries economic indicators report 2014: Eastern Tuna and Billfish Fishery
-30
-20
-10
0
10
1998–99 2001–02 2004–05 2007–08 2010–11 2013–14p
NER
(201
3–14
A$
mill
ion)
p Preliminary estimate.Note: Time series of financial and economic performance (NER) tables are available on the ABARES website.
Figure 5 Number of vessels operating, Eastern Tuna and Billfish Fishery, 1998–99 to 2013–14
Figure 6 Key management changes, 1995–96 to 2013–14
9

Australian fisheries economic indicators report 2014: Eastern Tuna and Billfish Fishery
Demographic profile of fishers operating in the ETBFThe median age of skippers surveyed in the fishery was 43 years in 2012–13. Skippers had a median of 15 years of experience in the ETBF and 20 years of fishing experience. Eighty per cent of respondents’ highest level of educational attainment was year 10 completion. The highest qualification was a trade/technical apprenticeship.
10
Australian fisheries economic indicators report 2014: Eastern Tuna and Billfish Fishery
3 Financial and economic performance
Financial performanceThe survey population for a given year is defined as vessels that recorded more than one tonne of catch in the ETBF. The survey sample represented 36 per cent and 34 per cent of the population in 2011–12 and 2012–13, respectively (Table 3). Details of the survey method are in Appendix B.
Some operators surveyed operated in other fisheries during the survey period. The portion of time these operators spent in other fisheries varied. The receipts and costs associated with operating in these fisheries are included in the average vessel financial performance results.
Between 2011–12 and 2012–13 financial performance of vessels in the ETBF declined (Table 3 and Figure 7). Total costs increased (by 9 per cent) and total cash receipts increased by a comparatively smaller amount (2 per cent). This resulted in a substantially smaller average boat cash income of in 2012–13, compared with 2011–12.
Crew costs accounted for the largest share of cash costs at (28 per cent) in 2011–12 and, although increasing by 6 per cent in 2012–13, did not change significantly as a proportion of total cash costs (27 per cent). Fuel costs were another large contributor to cash costs making up 13 per cent and 15 per cent of total cash costs in 2011–12 and 2012–13, respectively. Fuel costs increased by 20 per cent in 2012–13.
Profit at full equity for the average ETBF boat increased from 2006–07 to 2010–11. Between 2010–11 and 2011–12 this trend continued, with profit at full equity estimated at $139 612 in 2011–12 (a $94 103 increase from 2010–11). This decreased by 38 per cent in 2012–13.
11

Australian fisheries economic indicators report 2014: Eastern Tuna and Billfish Fishery
Table 3 Financial performance of boats operating, Eastern Tuna and Billfish Fishery
Vessel-level average
Revenue Unit 2011–12 2012–13
Value RSE Value RSE
Fishing receipts $ 972 701 (12) 984 172 (12)
Non-fishing receipts a $ 53 052 (18) 64 181 (19)
Total cash receipts $ 1 025 752 (12) 1 048 354 (12)
Costs
Administration $ 14 824 (12) 17 513 (14)
Crew costs $ 246 414 (11) 262 274 (10)
Freight and marketing expenses $ 121 615 (16) 114 798 (15)
Fuel $ 117 845 (8) 141 568 (11)
Insurance $ 33 192 (11) 40 095 (8)
Interest paid $ 5 624 (35) 4 595 (41)
Licence fees and levies $ 49 249 (20) 46 266 (17)
Packaging $ 69 344 (28) 74 730 (33)
Repairs and maintenance $ 81 682 (11) 97 675 (14)
Other costs b $ 152 537 (12) 171 134 (14)
Total cash costs $ 892 325 (10) 970 647 (9)
Boat cash income $ 133 428 (30) 77 706 (62)
– less depreciation c $ 33 232 (20) 32 269 (18)
Boat business profit $ 107 568 (33) 45 702 (100)
– plus interest leasing rent $ 32 044 (22) 40 791 (38)
Profit at full equity $ 139 612 (26) 86 492 (50)
Capital (excluding quota and licences) $ 757 451 (11) 668 416 (11)
Capital (including quota and licences) $ 1 536 879 (12) 1 269 097 (11)
Rate of return to boat capital d % 18 – 13 –
Rate of return to full equity e % 9 – 7 –
Population no. 47 na 41 na
Sample no. 17 na 14 na
a Including rebates, charter hire, quota leasing revenue and other non-fishing receipts. b Including quota lease payments. c Depreciation adjusted for profit or loss on capital items sold. d Excluding value of quota and licences. e Including value of quota and licences. na Not available.Note: Figures in parentheses are relative standard errors (RSEs). An RSE will be higher for estimates closer to zero. A guide to interpreting RSEs is included in Appendix A.
12

Australian fisheries economic indicators report 2014: Eastern Tuna and Billfish Fishery
Figure 7 Trends in key financial performance variables, Eastern Tuna and Billfish Fishery,2002–03 to 2012–13
Note: Error bands are equal to two standard errors, approximating the 95 per cent confidence interval. Error bands are typically large for small sample sizes and wider for estimates closer to zero.
13
Australian fisheries economic indicators report 2014: Eastern Tuna and Billfish Fishery
Economic performanceNet economic return (NER) of the fishery is estimated to have declined from $2.9 million in 2011–12 to $0.2 million in 2012–13 (Table 4 and Figure 4). The preliminary estimate of NER for 2013–14 shows an estimated decline to $0.1 million. The decrease in NER from 2011–12 to 2012–13 was primarily driven by a faster decline in fishing income (reduction of 12 per cent), than in fishing costs (reduction of 6 per cent). The reduction in fishing income was driven by a fall in beach prices between 2011–12 and 2012–13. The Australian dollar’s 10 per cent appreciation against the Japanese yen contributed most to the fall in beach prices (Figure 3) because almost 90 per cent of Australia’s tuna production is exported to Japan.
Between 2002–03 and 2012–13 fishing income and operating costs declined (Figure 8). Operating costs decreased at a faster rate than fishing income over this period, increasing the overall net economic returns of the fishery.
Table 4 Fishery cash profit and net economic returns, Eastern Tuna and Billfish Fishery
Total fishery A$ million
Category 2011 12‒ 2012 13‒ 2013‒14p
Receipts Value RSE Value RSE Value
Fishing income 43.9 (14) 38.6 (14) 39.3
Cash costs
Operating costs 38.7 (12) 36.4 (12) 37.7
Fishery cash profit 5.2 (35) 2.2 (78) 1.6
Less
– owner and family labour 1.8 (27) 1.7 (32) 1.5
– opportunity cost of capital 1.0 (19) 0.7 (20) 0.4
– depreciation 1.4 (22) 1.2 (21) 1.0
plus interest, leasing and management fees 3.7 (18) 3.3 (20) 2.9
Net return (excluding management costs) 4.6 (36) 1.9 (91) 1.6
Management costs 1.7 na 1.7 na 1.5
Net return (including management costs) 2.9 na 0.2 na 0.1
p Preliminary non-survey based estimates (for estimation method, see Appendix C). na Not applicable.Note: Figures in parentheses are relative standard errors (RSEs). RSEs are not available for 2013–14 results because of estimation method used (Appendix C).
14

Australian fisheries economic indicators report 2014: Eastern Tuna and Billfish Fishery
Figure 8 Trends in economic returns, Eastern Tuna and Billfish Fishery, 2002–03 to 2013–14
p Preliminary estimate.Note: Error bands are equal to two standard errors, approximating the 95 per cent confidence interval. Standard errors are not calculated for returns or management costs, nor for forecasted values that use non-survey methods. Error bands are typically large for small sample sizes and wider for estimates closer to zero.
15

Australian fisheries economic indicators report 2014: Eastern Tuna and Billfish Fishery
4 Other key performance indicatorsOther economic indicators can help in assessing the economic performance of a fishery and in understanding the trends seen. Indicators discussed in this report include trends in economic productivity, terms of trade, management costs and entitlement values.
ProductivityTotal factor productivity (TFP) analysis shows trends in fishers’ economic productivity. TFP analysis is used to examine the ability of fishers to convert inputs into outputs over time. Results from the TFP analysis can provide an understanding of the factors in a fishers’ operating environment affecting productivity and assist in evaluating changes in NER over time. Such factors may include changes in management settings that regulate fishers’ technology choices, changing market conditions and changes in the mix of outputs produced. Market conditions include variations in input costs, import competition and changes in the value of the Australian dollar.
Change to a fishers’ operating environment can provide fishers an incentive to pursue vessel-level productivity improvements. For example, to keep the business financially viable in response to adverse market conditions, such as increasing input costs or competition, fishers invest in productivity enhancing improvements. Adverse market conditions can also help drive autonomous structural adjustment in the industry. This can include fishing rights moving to the most profitable fishers and the least efficient or least profitable vessels exiting the industry, resulting in a more productive fleet.
TFP analysis was undertaken for the ETBF from 2002–03 to 2012–13 (methods for calculating the indexes are shown in Appendix D). During this period, the productivity index followed an upward trend and increased by an annual average of 4 per cent (Figure 9).
Figure 9 Productivity indexes, Eastern Tuna and Billfish Fishery
0.0
0.5
1.0
1.5
2.0
2002–03 2004–05 2006–07 2008–09 2010–11 2012–13
Input index
Output index
Productivity index
Index 2002-03=1
A possible driver of improvement in productivity in the fishery from 2002–03 to 2012–13 is a reduction in fleet size and the exit of less efficient vessels. Between 2002–03 and 2012–13 the
16

Australian fisheries economic indicators report 2014: Eastern Tuna and Billfish Fishery
number of vessels in the fishery decreased from 138 to 41. Because fewer and more productive vessels are left in the fishery, the ability to convert inputs to outputs is likely to have improved, increasing the productivity index.
It is too early to assess whether the introduction of output controls in March 2011 in the form of TACC for five key target species has led to a marked improvement in productivity. Output controls provide more flexibility to operators than input controls, allowing the flexibility to operate with input combinations that are more efficient and minimising the likelihood of effort creep (Elliston & Cao 2004).
Terms of trade
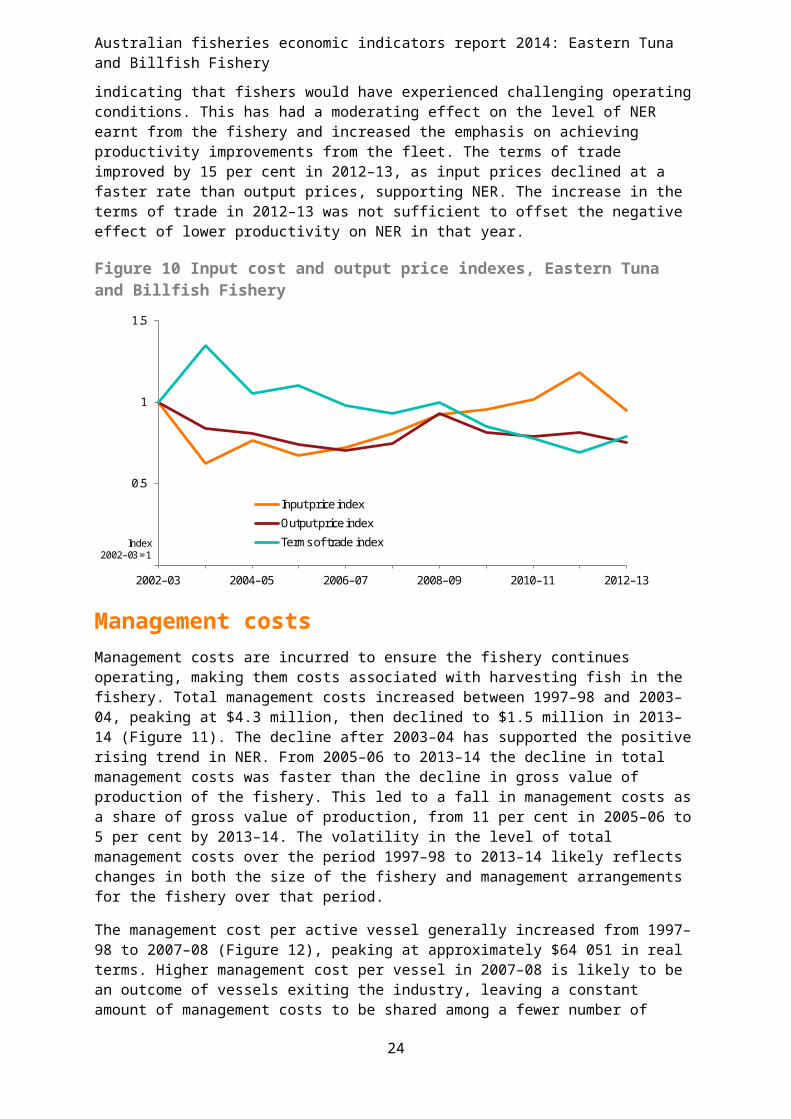
The terms of trade trends look at the change in input prices relative to output costs and can indicate whether improvements in NER are driven by productivity increases or by favourable terms of trade conditions. Between 2002–03 and 2011–12 the input cost index (consisting of fuel, labour and repair costs) increased by 18 per cent before declining in 2012–13 with lower fuel prices (Figure 10). The output price index includes the price of species caught by vessels in the fishery. Over the period 2002–03 and 2012–13 the output price index declined by 25 per cent. As a result, the terms of trade index declined by 21 per cent over the same period, indicating that fishers would have experienced challenging operating conditions. This has had a moderating effect on the level of NER earnt from the fishery and increased the emphasis on achieving productivity improvements from the fleet. The terms of trade improved by 15 per cent in 2012–13, as input prices declined at a faster rate than output prices, supporting NER. The increase in the terms of trade in 2012–13 was not sufficient to offset the negative effect of lower productivity on NER in that year.
Figure 10 Input cost and output price indexes, Eastern Tuna and Billfish Fishery
0.5
1
1.5
2002–03 2004–05 2006–07 2008–09 2010–11 2012–13
Input price index
Output price index
Terms of trade indexIndex2002–03 = 1
Management costsManagement costs are incurred to ensure the fishery continues operating, making them costs associated with harvesting fish in the fishery. Total management costs increased between 1997–98 and 2003–04, peaking at $4.3 million, then declined to $1.5 million in 2013–14 (Figure 11). The decline after 2003–04 has supported the positive rising trend in NER. From 2005–06 to 2013–14 the decline in total management costs was faster than the decline in gross value of production of the fishery. This led to a fall in management costs as a share of gross value of
17

Australian fisheries economic indicators report 2014: Eastern Tuna and Billfish Fishery
production, from 11 per cent in 2005–06 to 5 per cent by 2013–14. The volatility in the level of total management costs over the period 1997–98 to 2013–14 likely reflects changes in both the size of the fishery and management arrangements for the fishery over that period.
The management cost per active vessel generally increased from 1997–98 to 2007–08 (Figure 12), peaking at approximately $64 051 in real terms. Higher management cost per vessel in 2007–08 is likely to be an outcome of vessels exiting the industry, leaving a constant amount of management costs to be shared among a fewer number of vessels. Management cost per vessel has generally declined since 2007–08 but did increase in 2012–13. The management cost per vessel is estimated to have declined to $38 568 in 2013–14.
Figure 11 Total management costs, Eastern Tuna and Billfish Fishery
-
0.5
1.0
1.5
2.0
2.5
3.0
3.5
4.0
4.5
5.0
1997–98 2001–02 2005–06 2009–10 2013–14
Tota
l man
agem
ent
cost
201
3-14
$m
Figure 12 Average management cost per active vessel and as a share of GVP, Eastern Tuna and Billfish Fishery
0
1
2
3
4
5
6
7
8
9
10
11
12
0
10
20
30
40
50
60
70
1997–98 2001–02 2005–06 2009–10 2013–14
Man
agem
ent c
ost
as a
per
cent
age
of G
VP
Man
agem
ent c
ost
per a
ctive
boa
t $'0
00
Management cost per active boat 2013-14 $'000
Management cost as a percentage of GVP
Note: Time series of financial and economic performance (NER) tables and other indicators are available on the ABARES website.
18

Australian fisheries economic indicators report 2014: Eastern Tuna and Billfish Fishery
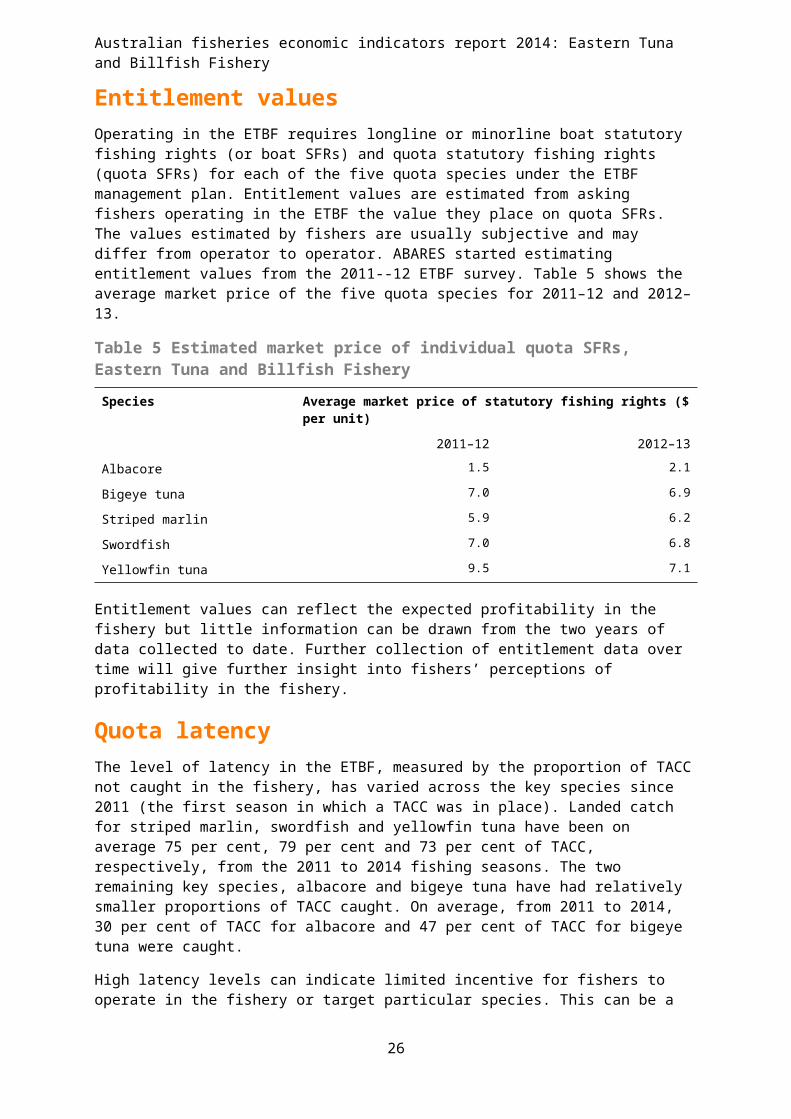
Entitlement valuesOperating in the ETBF requires longline or minorline boat statutory fishing rights (or boat SFRs) and quota statutory fishing rights (quota SFRs) for each of the five quota species under the ETBF management plan. Entitlement values are estimated from asking fishers operating in the ETBF the value they place on quota SFRs. The values estimated by fishers are usually subjective and may differ from operator to operator. ABARES started estimating entitlement values from the 2011--12 ETBF survey. Table 5 shows the average market price of the five quota species for 2011–12 and 2012–13.
Table 5 Estimated market price of individual quota SFRs, Eastern Tuna and Billfish Fishery
Species Average market price of statutory fishing rights ($ per unit)
2011–12 2012–13
Albacore 1.5 2.1
Bigeye tuna 7.0 6.9
Striped marlin 5.9 6.2
Swordfish 7.0 6.8
Yellowfin tuna 9.5 7.1
Entitlement values can reflect the expected profitability in the fishery but little information can be drawn from the two years of data collected to date. Further collection of entitlement data over time will give further insight into fishers’ perceptions of profitability in the fishery.
Quota latencyThe level of latency in the ETBF, measured by the proportion of TACC not caught in the fishery, has varied across the key species since 2011 (the first season in which a TACC was in place). Landed catch for striped marlin, swordfish and yellowfin tuna have been on average 75 per cent, 79 per cent and 73 per cent of TACC, respectively, from the 2011 to 2014 fishing seasons. The two remaining key species, albacore and bigeye tuna have had relatively smaller proportions of TACC caught. On average, from 2011 to 2014, 30 per cent of TACC for albacore and 47 per cent of TACC for bigeye tuna were caught.
High latency levels can indicate limited incentive for fishers to operate in the fishery or target particular species. This can be a result of poor market conditions relative to input costs, low fish stocks levels or other unfavourable fishing conditions such as bad weather, or more profitable options for fishers in other fisheries. The relationship between changes in quota latency and NER trends are less certain for internationally shared stocks where the TACC setting may not reflect the achievement of an economic target. This makes it difficult to draw conclusions about the possible causes of latency in the fishery and how it is affecting overall economic performance. As the TACC is not binding (or not constrained) the fishery could be operating in conditions similar to open access, allowing for inefficiencies such as over-capitalization. In the long-run, NER is unlikely to be maximised with non-binding TACCs.
19

Australian fisheries economic indicators report 2014: Eastern Tuna and Billfish Fishery
5 Performance against management objectives
Harvesting internationally shared stocks complicates selection of economic-based targets and assessment of economic status against maximum economic yield. Management actions domestically may not affect stock-wide biomass, especially where Australian catch is a relatively small proportion of total catch in the fishery. Objectives of the ETBF management plan include maximising the net economic returns to the Australian community from management of the fishery, while being consistent with the principles of ecologically sustainable development, and to manage the fishery efficiently and cost-effectively for the Commonwealth.
The Commonwealth Fisheries Harvest Strategy Policy (HSP; DAFF 2007) is not prescribed for fisheries managed under international agreements. A harvest strategy framework for the ETBF has been developed in line with the Commonwealth Fisheries Harvest Strategy (AFMA 2011). The harvest strategy framework has been used to set the total allowable commercial catch for swordfish and striped marlin since 2011. Target reference catch rates used in the ETBF harvest strategy for swordfish and striped marlin align with default reference points of 48 per cent of unfished biomass for the target and 20 per cent of unfished biomass for the limit. Tuna species’ TACCs are based on historical catch levels in the fishery (Larcombe & Bath 2015).
The NER in the fishery has been improving since 2003–04 and turned positive in 2010–11. It is unclear whether the harvest strategy targets are responsible for this improvement because NER was increasing before their implementation and multiple factors influence the fishery’s economic performance. The improvement in NER occurred despite negative external pressures such as rising fuel prices and the appreciation of the Australian dollar, suggesting that productivity growth has played a strong role in improving economic performance in the fishery. In 2013–14 the preliminary NER were estimated at $0.1 million using non-survey based methods. The estimated slight reduction in NER in 2013–14 is mostly driven by higher operating costs, particularly fuel, and a relatively small increase in fishing income. Among the indicators analysed is the productivity index, which has been trending upwards for the fishery. This improvement in productivity is consistent with the upward trend in NER since 2003–04.
Total management costs in the fishery have been decreasing since 2004–05. Management costs per vessel remained high from 2006–07 to 2007–08, with a similar level of management shared among fewer vessels. Management cost per vessel has been declining in the fishery since 2007–08 and management cost as a percentage of GVP has declined from a high of 11 per cent in 2005–06 to 5 per cent in 2013–14.
From March 2011 output controls were introduced for five key target species in the form of TACCs and allocated as ITQs to fishers that were operating in the fishery. This has provided fishers greater flexibility to fish with a more efficient combination of inputs. The transferability of fishing rights has also allowed quota to be allocated to more efficient operators. However, the success of output controls depends on setting levels of TACCs that meet the management objective. In the context of internationally shared stocks the setting of TACCs at levels that maximise NER is complicated by uncertainty around the catch of other jurisdictions. However, when TACCs are persistently non-binding, the likelihood of maximising NER over the long term is low. If returns deteriorate further, managers may need to consider adjustments to TACC settings in an effort to improve economic performance of the fishery.
20

Australian fisheries economic indicators report 2014: Eastern Tuna and Billfish Fishery
Appendix A: Survey definitionsThis appendix provides definitions of key financial performance variables, net economic returns (NER) and the ABARES method of calculating NER. Use of NER as an indicator of economic performance is briefly discussed.
Financial performanceABARES used these definitions of key variables in the analysis of vessel-level financial performance.
Total cash receipts represent returns from sale of fish, from non-fishing activities (including charter operations) and from other sources (insurance claims and compensation, quota and/or endorsements leased out, government assistance and any other revenue) in the financial year.
For most operators, this information is readily available from their own records. However, different operators record their fishing income in different ways. Where fish are sold through a cooperative, some operators may only record payments received from the cooperative. These payments may be net of commissions, freight and other purchases made through the cooperative.
In other cases, the cooperative or agency pays the crew directly for the catch; the owner’s financial records might include only the revenues received after the crew’s share has been deducted.
For these reasons, operators are asked to provide a breakdown of the total catch of their boat and an estimate of the total value of that catch. For consistency, marketing charges may need to be added back into fishing receipts for some boats to give a gross value. Where this is necessary, these selling costs are also added into the cost estimates to offset the new revenue figure. Receipts also include amounts received in the survey year for fish sold in previous years.
Total cash costs include payments made for both permanent and casual hired labour and payments for materials and services (including payments on capital items subject to leasing, rent, interest, licence fees and repairs and maintenance). Capital and household expenditures are excluded.
Labour costs are often the highest cash cost in the fishing operation. Labour costs include wages and an estimated value for owner/partner, family and unpaid labour. Labour costs cover the cost of labour involved in boat-related aspects of the fishing business, such as crew or onshore administration costs, but do not cover the cost of onshore labour to process fisheries products.
On many boats, the costs of labour are reflected in wages paid by boat owners and/or in the share of the catch they earn. However, in some cases, such as where owner–skippers are involved or where family members work in the fishing operation, payments made can be low or even nil. This will not always reflect the market value of the labour provided. To allow for this possible underestimation, all owner/partner and family labour costs are based on estimates collected at the interview of what it would cost to employ someone else to do the work.
Boat cash income is the difference between total cash receipts and total cash costs.
21

NR = R – CC – OWNFL + ILR – OppK – DEP + recMC – totM
operating costs capital cost management costscash receipt
Australian fisheries economic indicators report 2014: Eastern Tuna and Billfish Fishery
Depreciation costs are estimated using the diminishing value method based on the current replacement cost and age of each item. The rates applied are the standard rates allowed by the Commissioner of Taxation. For items purchased or sold during the survey year, depreciation is assessed as if the transaction had taken place at the midpoint of the year. This method of calculating depreciation is also used in other ABARES industry surveys.
Boat business profit is boat cash income less depreciation and accounting for any profit or loss on the sale of capital.
Profit at full equity is boat profit plus rent, interest and lease payments.
Capital is the value placed on the assets employed by the owning business of the surveyed boat. It includes the value of the boat, hull, engine and other onboard equipment (including gear). Estimates are also reported for the value of quotas and endorsements held by the surveyed boat. Estimates of the value of capital are based on the market value of capital and are usually obtained at interview. However, in some cases quota and endorsement values are obtained from industry sources.
Depreciated replacement value is the depreciated capital value based on the current age and replacement values of the boat and gear. The value of quota and endorsements held is not included in the estimate.
Rate of return to boat capital is calculated as if the proprietors owned all fishing assets. This enables financial performance of sample boats to be compared regardless of proprietors’ equity in the business. Rate of return to boat capital is calculated by expressing profit at full equity as a percentage of total capital (excluding quota and licence value).
Rate of return to full equity is calculated by expressing profit at full equity as a percentage of total capital (including quota and licence value).
Net economic returnsNet economic returns are the long-run profits from a fishery after all costs have been met, including fuel, crew costs, repairs, the opportunity cost of family and owner labour, fishery management costs, depreciation and the opportunity cost of capital.
More specifically, a fishery’s net economic returns for a given period can be defined as:
Where:
NR = net returns
R = total cash receipts attributable to the fishery, excluding leasing income
CC = total cash costs attributable to the fishery, including recovered management costs
OWNFL= imputed cost of owner and family labour
ILR = interest and quota/permit leasing costs
OppK = opportunity cost of capital
DEP = depreciation
recMC = recovered management costs
22

Australian fisheries economic indicators report 2014: Eastern Tuna and Billfish Fishery
totMC = total management costs.
Note that recovered management costs are those management costs paid by industry through management fees and are included in total cash costs (CC). These costs are removed (as indicated by ‘+ recMC’) to prevent double counting, given that these costs are a component of total management costs. Similarly, interest and quota/permit leasing costs are removed (indicated by ‘+ ILR’) because these costs at the fishery level represent revenues that have been redistributed to external investors in the fishery.
Survey-based estimation of net economic returns
Fish sale receiptsFish sale receipts are usually taken from fishers’ financial accounts. Where a fisher operates in more than one fishery, they are asked to indicate the proportion of total fish sales attributable to the fishery being surveyed. Any freight or marketing costs must also be deducted. This provides an estimate of net fishing receipts that incorporates only the ‘beach price’ received for the catch; that is, the price received for fish at its first landing point.
Income received from leasing out quota and licences is not included as income in calculating net economic returns. This item represents a redistribution of profits among investors in the fishery. Also, the amount a fisher earns from leasing out quota and licences relates to the amount of profits the fishery generates. Therefore, including leasing revenue would result in double counting.
Operating costsOperating costs include day-to-day operational expenses incurred to harvest fish in the fishery. Cash costs (CC) are a component of operating costs that includes those cost items that are easily identified in fishers’ accounts, such as fuel, repairs and gear replacement.
Labour costs are often specified in fishers’ accounts as wages. However, in calculating net returns, an estimate of the opportunity cost of labour is needed. The opportunity cost of labour is the wage that could have been earned performing a similar role elsewhere. Where a market wage is paid, it is assumed to represent the opportunity cost of labour and is included in the cash costs component of operating costs.
The opportunity cost of owner and family labour is not easily identifiable in fishers’ accounts. Owners and their families are often involved in operating a boat, either as skippers and crew or onshore as accountants and shore managers. While some will be paid market value for their labour, some will not be paid at all and others paid very high amounts (for example, as director fees or manager fees). In these cases, ABARES survey officers ask survey respondents to estimate the market value of owner and family labour—that is, the amount that would need to be paid to employ a non-family member to fulfil the same position. This amount is entered as a component of operating costs (OWNFL).
Quota and licence leasing costs and interest expenses are included in cash costs. However, these costs must be removed from calculation of net returns for the same reason they are excluded from income. See ‘Fish sale receipts’ for explanation.
Capital costsTo calculate capital costs, an estimate of the value of capital is needed. ABARES survey officers ask fishers to provide information for all capital items associated with the fishing business (including hull, engine, onboard equipment, vehicles and sheds). Information collected for each
23

Australian fisheries economic indicators report 2014: Eastern Tuna and Billfish Fishery
item includes the year the capital item was manufactured and an estimate of what it would cost to replace that item with a new equivalent item. By accounting for previous depreciation and inflation, these data are used to estimate the total value of capital invested in the fishery for the survey year.
Capital costs include the opportunity cost of capital (OppK) and depreciation (DEP). The opportunity cost of capital is the return that could have been earned if capital was invested elsewhere, rather than in the fishery. This cost is not identifiable in fishers’ accounts. A real interest rate that represents the long-term average rate of return that could be earned on an investment elsewhere is applied to the value of capital in the fishery. For fisheries surveys, ABARES uses a rate of 7 per cent per year.
Depreciation expense is the cost of capital becoming less valuable over time as a result of wear and tear and obsolescence. Depreciation expense is not consistently identifiable in fishers’ accounts, so ABARES calculates annual depreciation of boats based on the capital inventory list collected during the surveys and predetermined depreciation rates for each capital item type.
Management costsManagement costs are incurred to ensure the fishery continues operating and are costs associated with harvesting fish in the fishery. Management costs comprise two components: recovered management costs and non-recovered management costs. Recovered management costs (recMC) are those recovered from fishers and appear in the accounts of fishers as payments of management fees or levies. Non-recovered management costs are not charged to fishers but instead are covered by the managing body or government. Calculation of net economic returns requires deduction of total management costs, which is the sum of these two components.
Total cash costs (CC) includes an estimate of recovered management costs based on management levy expenses contained in fishers’ accounts. This estimate of recovered management costs is based only on a sample of the fishery, so it may not be consistent with the actual value of management costs recovered from the entire fishery. AFMA is able to provide an estimate of total management costs for each fishery—that is, the sum of both recovered and non-recovered management costs. For these reasons, recovered management costs from fishers’ accounts are ignored (as indicated by +recMC in the net returns equation). Total management costs (totM) supplied by AFMA are then used to estimate net economic returns.
Net economic returns and economic performanceFishery managers, policy and decision-makers require information on fisheries’ performance for achieving the objective of maximising net economic returns from use of fish stocks—an objective commonly referred to as MEY. If a fishery is operating at MEY, effort, catch and stocks are at levels where the difference between discounted revenues and costs, and therefore profits, are maximised. The term ‘discounted’ means that the difference in the value of a dollar earned today relative to a dollar in the future is accounted for. Although estimates of NER do not reveal how a fishery is performing relative to its maximum potential, positive trends in NER, together with other indicators, suggest that the MEY objective is closer to being met.
24

Australian fisheries economic indicators report 2014: Eastern Tuna and Billfish Fishery
Appendix B: Survey methodsCollecting economic survey dataABARES has undertaken economic surveys of selected Commonwealth fisheries since the early 1980s and on a regular basis for particular fisheries since 1992. Under the current program ABARES surveys major Commonwealth fisheries every two years, or more frequently where the fishery is undergoing major changes and monitoring is particularly important. It aims to develop a consistent time series of economic information for each fishery. Such information, in conjunction with scientific assessments of each fishery, is vital for assessing fisheries’ economic performance.
Survey information is made publicly available so the performance of fisheries and the effect of management policies can be assessed independently.
Sample designABARES surveys are designed and samples selected on the basis of information provided by AFMA. This information includes data on the volume of catch, fishing effort and boat characteristics.
It is not possible to survey all boats in a fishery, so a representative sample of boats is selected. Where possible, boats are classified into subgroups based either on the fishing method used (longline, purse seine and trawl) or on the size of operations (small, medium and large producers). A minimum number of representative boats from each subgroup are then targeted for the survey.
In practice, this sample is seldom fully realised. Non-response is relatively high across fishery surveys, reflecting the difficulty in contacting some operators and a reluctance of others to participate. This may bias the results—for example, if profitability of respondents and non-respondents differs significantly. Sample design and weighting systems have been developed that reduce the non-response effect, but care is still needed when interpreting survey information.
Between February and August, an ABARES officer visits the owner of each boat selected in the sample. The officer interviews the boat owner to obtain physical and financial details of the fishing business for the survey years. When necessary, the skipper of the boat is also interviewed. ABARES subsequently obtains further information from accountants, selling agents and marketing organisations on the signed authority of survey respondents.
ABARES reconciles the information obtained from various sources to produce the most accurate description possible of the financial characteristics of each sample boat in the survey.
Sample weightingEstimates of financial and economic performance presented in this report were calculated based on weighted survey data of sampled vessels. ABARES calculates a weight for each sampled vessel based on how representative that vessel is in the population. This report uses a regression model of GVP on catch for each vessel in the fleet population to estimate sample weights. The individual estimated weights for sampled vessels in the fleet population are then standardised such that two conditions are met, the sum of sample weights equal the population, and the weighted sum of the sample catch approximate total catch of the fleet.
25
Australian fisheries economic indicators report 2014: Eastern Tuna and Billfish Fishery
That is,
wΣ i = P and wΣ ixi = X
where:
wi is the weight for the ith vessel
P is the number of vessels in the fleet population
xi is the catch for the ith vessel
X is the total catch for the fleet population.
Reliability of estimatesABARES generally surveys a relatively small number of boats out of the total number in a particular fishery. Estimates derived from these boats are likely to be different from those that would have been obtained if information had been collected from a census of all boats. The number of boats in the sample, the variability of boats in the population and, most importantly, the design of the survey and the estimation procedures used influence how closely the survey results represent the population.
Measures of sampling variation have been calculated to give a guide to the reliability of survey estimates. These measures, expressed as percentages of the survey estimates and termed relative standard errors, are given next to each estimate in parentheses. In general, the smaller the relative standard error, the more reliable the estimate.
Use of relative standard errorsRelative standard errors can be used to calculate confidence intervals for the survey estimate. First, the standard error is calculated by multiplying the relative standard error by the survey estimate and dividing by 100. For example, if average total cash receipts are estimated to be $100 000 with a relative standard error of 6 per cent, the standard error for this estimate is $6 000.
The chance that the census value (the value that would have been obtained if all boats in the target population had been surveyed) is within one standard error of the survey estimate is roughly two in three. The chance that the census value is within two standard errors of the survey estimates is roughly 19 in 20. Therefore, in this example, the chance that the census value is between $94 000 and $106 000 is two in three and the chance that the census value is between $88 000 and $112 000 is 19 in 20.
Comparing estimatesWhen comparing estimates across groups or years, it is important to recognise that the differences are also subject to sampling error. A conservative estimate of the standard error of the difference can be constructed by adding the squares of the estimated standard errors of the component estimates and then taking the square root of the result.
For example, suppose the estimates of total cash receipts were $100 000 for one year and $125 000 for the previous year—a difference of $25 000—and the relative standard error is given as 6 per cent for each estimate. The standard error of the difference can be estimated as:
√ (0.06∗$100000 )2+ (0.06∗$125000 )2=$9605
The relative standard error of the difference is:
($9605/ $25000 )∗100=38%
26

Australian fisheries economic indicators report 2014: Eastern Tuna and Billfish Fishery
The population of a fishery may change from one year to the next. If these population changes are substantial, differences in estimates may be caused more by the changes in population than by changes in the variables themselves.
Non-sampling errorsThe values obtained in a survey may be affected by errors other than those directly related to the sampling procedure. For example, it may not be possible to obtain information from certain respondents, respondents may provide inaccurate information or respondents may differ from non-respondents for a particular variable being surveyed.
ABARES survey staff are generally experienced and undergo rigorous pre-survey training, aimed at minimising non-sampling errors. However, when drawing inferences from estimates derived from sample surveys, users should be aware that both sampling and non-sampling errors occur.
27
Australian fisheries economic indicators report 2014: Eastern Tuna and Billfish Fishery
Appendix C: Non-survey based estimation of net economic returnsABARES has developed a non-survey based method of estimating net economic returns for financial years where survey data are not yet available. It allows more timely estimation and reporting of net economic return estimates to better inform industry and government decision-making. This method is intended to complement data collection and publication of results normally undertaken through the fisheries surveys.
MethodThe method used to calculate non-survey based estimates of net economic returns for a non-survey year (a year for which no survey data are available) uses regression estimates for key components of net economic returns. Regression approaches use the most relevant variables for each fishery, given unique fishing methods and other characteristics. In all cases, each component is estimated based on an assumed sample of the population and a set of corresponding assumed weights. This assumed sample represents those boats that are expected to be sampled in the next survey. Key variables correlating with cash receipts and operating costs were used in the estimates. Results (see Table C0 and Table C1 for full regression results) show that the same variables were used to estimate both cash receipts and operating costs.
Reliability of estimatesEstimates from the regression analysis are subject to uncertainties. First, relationships estimated between surveyed values of receipts and costs and other more readily available data rely on the historical sample of boats surveyed. Boats that are consistently not included in a sample may be under-represented in the estimates.
It is not certain that historical relationships will hold in the most recent year. Operating conditions in the fishery may change, resulting in changes in receipts and costs not foreseeable using this method.
Estimates should be used as an indication of the likely direction and magnitude of changes in net economic returns. For each receipt and cost category, the coefficient of determination (R2) gives an indication of the extent to which the explanatory variables can explain variation in the dependent variable. Lower coefficients of determination suggest a greater level of uncertainty surrounding the estimates.
Cash receiptsCash receipts is the primary component of net economic return calculations because all other costs are deducted from cash receipts. Cash receipts represents income from fishing operations in the surveyed fishery. For non-survey years, real GVP is a good indicator for cash receipts as it is closely related to fishing income. Real GVP was estimated using average price data and catch data. Variables included for each fishery are real GVP and year and vessel factors (Table C0).
28

Australian fisheries economic indicators report 2014: Eastern Tuna and Billfish Fishery
Table C0 Regression model for average cash receipts, Eastern Tuna and Billfish Fishery
Variable Estimate Std. error t-statistic Pr(>|t|)
Intercept 3.05e+04 5.64e+04 0.54 0.59
Real GVP 1.74e+00 7.87e-02 22.13 0.00
Boat dummy –3.17e+05 1.33e+05 -2.38 0.02
Year dummy (2014)
–2.42e+05 6.96e+04 -3.48 0.00
R2 0.90
Prob (F-stat) 0.00
Operating costsKey drivers of operating costs in any fishery are fuel and labour. Therefore, accurately calculating operating costs for a non-survey year requires selecting variables that influence these two components. For labour, share payment systems imply a close relationship between fishery GVP and labour costs. In contrast, fuel cost is collected during the biennial surveys ABARES conducts for ETBF for sampled vessels, which can then be weighted to generate estimates for each fishery sector. However, fuel cost did not appear to be statistically significant in estimating the operating cost for the ETBF in 2013–14 and in fact deteriorated the model. Preliminary estimates of operating cost were based on real GVP and year and vessel factors (Table C1).
Table C1 Regression model for average operating costs, Eastern Tuna and Billfish Fishery
Variable Estimate Std. error t-statistic Pr(>|t|)
Intercept 2.55e+05 4.50e+04 5.65 0.00
Real GVP 1.34e+00 6.28e-02 21.27 0.00
Boat dummy –3.39e+05 1.06e+05 –3.19 0.00
Year dummy (2014)
–2.19e+05 5.56e+04 –3.95 0.00
R2 0.89
Prob (F-stat) 0.00
Cash receipts and operating cost regressions were tested for model fit including residual normality, heteroskedasticity, multicollinearity and autocorrelation. Initially a larger set of variables were considered for all regressions but only variables that were statistically significant or improved model fit were kept in the final regression.
Interest, leasing and management feesInterest and leasing fees represent a redistribution of profits to investors in the fishery. As such, they are not costs at the fishery level. They are estimated based on historical ratios and values.
Management fees for the purpose of the estimation are taken from AFMA (recovered and non-recovered) and include all costs for managing the fishery, not just those recovered from industry. Management fees are also estimated based on historical ratios and values.
29

Australian fisheries economic indicators report 2014: Eastern Tuna and Billfish Fishery
Opportunity cost of capital and depreciationCapital values, the opportunity cost of capital and depreciation expenses were estimated based on an implied capital rate of 7 per cent and assuming a depreciation rate equal to that in the most recent survey year and a capital upgrade rate (an assumed capital investment amount).
Management costsTotal management costs (recovered and non-recovered) for 2013–14 were based on AFMA’s budgeted estimates.
30

Australian fisheries economic indicators report 2014: Eastern Tuna and Billfish Fishery
Appendix D: Productivity and terms of trade methodologyProductivity measurementProductivity is defined as the quantity of output produced with a given quantity of inputs. For example, a partial measure of productivity for a fishing vessel would be kilos of a particular species of fish produced per hook used. A more complete measure of productivity would be the total catch per unit of all inputs used. This approach is preferred as a measure of productivity and is usually referred to as total factor productivity.
Various methods have been developed to quantitatively assess total factor productivity trends for industries and individual enterprises within industries (see Coelli et al. 2005 for discussion). A frequent approach to measuring productivity trends uses index number theory. In this report a Fisher quantity index is used to measure total factor productivity trends for key Commonwealth fisheries (Box D1). Fishery-level input, output and total factor productivity indexes were estimated for each of the Commonwealth fisheries analysed and for each year where data were available. The Fisher quantity index is well-suited to handling the range of inputs and outputs recorded in ABARES fisheries economic survey data. For example, ABARES fisheries economic survey data contain many zero entries, which are well handled by the Fisher quantity index approach.
As with other index number approaches that measure productivity, the Fisher quantity index enables measurement of productivity trends with multiple inputs and outputs. The prices paid for inputs and received for outputs are used as weights to derive aggregations of outputs and inputs, which are expressed in index form. Output and input indexes are estimated using both Laspeyres and Paasche index approaches. A geometric mean of these indexes is derived to determine the Fisher output and input indexes. Total factor productivity is measured as the ratio of the Fisher output and Fisher input indexes.
Terms of trade measurementABARES constructs a terms of trade analysis using the same process as is used for TFP, except constructing Fisher price indexes rather than Fisher quantity indexes. The price index accounts for the prices of labour and fuel—the major cost components—and the costs of repairing and maintaining capital.
DataData used for this total factor productivity analysis are sourced from the ABARES Australian fisheries surveys dataset. The surveys dataset comprises physical and financial survey data for a sample of vessels operating in key Commonwealth fisheries. The inputs incorporated in the input indexes for each fishery are labour, fuel, repairs and capital. The output indexes for each fishery are described in the results section for each individual fishery. Population estimates are derived using sample vessel data from this database and are calculated for each of the fisheries analysed in this report. A weight is calculated for each boat in the sample, to represent its importance in the total unobserved population. The weight is generally based on the vessel’s catch representation. Weighted vessel-level information is used to derive fishery level input and output indexes.
31

Australian fisheries economic indicators report 2014: Eastern Tuna and Billfish Fishery
Box D0 Fisher index
Using price and quantity data for a set of outputs (and separately for inputs), the Laspeyres quantity index Q0 tL
can be defined as:
Q0 tL =
∑i=1
Np i0q it
∑i=1
Npi 0qi 0
=∑i=1
NW i0
qitq i0
where
W i 0=p i0q i0
∑i=1
Np i0q i0
is the share of ith item in the total value of outputs or inputs in the base period (denoted by 0). The Laspeyres
index compares a total quantity in time period (t) to a base period.
The Paasche index (Q0 tP
) is defined as:
Q0 tP =
∑i=1
Np itq it
∑i=1
Npit qi0
={∑i=1
NW it( q i0qit )}
−1
where
W it=pit qit
∑i=1
Np itq it
is the share of ith item in the total value of outputs or inputs in the current period (denoted by t). Like the
Laspeyres index, the Paasche index compares a total quantity in time (t) to a base period(0).
The Fisher index (Q0 tF
) is the geometric mean of Laspeyres and Paasche indexes, defined as:
Q0 tF =√Q0tL Q0 tP
The TFP index can be calculated as the ratio of the Fisher output (Q0 tFO¿and input¿¿) indexes:
TFP0 t=Q0 tFO
Q0 tFI
The terms of trade index is constructed by the same means as above, except with every instance of Q replaced by P and every instance of P replaced by Q.
Inputs and outputsTotal inputs consist of items that can be split into three major groups:
Capital—account for all capital items associated with the fishing business. These include the boat, hull, engine, onboard equipment, vehicles and sheds. The estimate of capital is based on the depreciated replacement value. For the TFP analysis capital inputs are days fished, weighted by the opportunity cost of using boat capital. For the terms of trade analysis the price is the cost of maintaining and repairing boat capital for the year.
Fuel costs—include the costs of all fuel, oil and grease. The quantity variable used for all fuel is the average of fuel use deflated by the fuel price paid.
32
Australian fisheries economic indicators report 2014: Eastern Tuna and Billfish Fishery
Labour—includes the number of crew employed in boat-related aspects of the fishing business, such as crew or onshore administration costs, but does not cover the cost of onshore labour involved in processing fisheries products. It covers owner/partner, family and unpaid labour.
Outputs are the species caught by vessels in each fishery. In the ETBF, these species are primarily swordfish, yellowfin tuna, striped marlin, bigeye tuna and albacore. The price variable is the price received for the species caught and the quantity variable is the kilograms of each species caught by individual vessels.
33

Australian fisheries economic indicators report 2014: Eastern Tuna and Billfish Fishery
ReferencesAFMA 2011, ETBF Harvest Strategy Simplified, Australian Fisheries Management Authority, Canberra, available at afma.gov.au/sustainability-environment/harvest-strategies.
—— 2014, Objectives, functions and powers, Australian Fisheries Management Authority, Canberra, available at afma.gov.au/about/objectives-functions-powers.
Coelli, TJ, Rao, DSP, O’Donnell, CJ & Battese, GE 2005, An introduction to efficiency and productivity analysis, 2nd edn, Springer, New York.
DAFF 2007, Commonwealth Fisheries Harvest Strategy: policy and guidelines, Department of Agriculture, Fisheries and Forestry, Canberra.
Elliston, L & Cao, L 2004, Managing effort creep in Australian fisheries: an economic perspective, Australian Bureau of Agricultural and Resource Economics eReport 0.45, prepared for the Fisheries Resources Research Fund, Canberra.
FAO 2015, Global Production Statistics 1950–2013, electronic dataset, Fisheries Global Information System, Food and Agriculture Organization of the United Nations, Rome.
Kompas, T & Che, TN 2004, A bioeconomic model of the Australian Northern Prawn Fishery: management options under uncertainty, Australian Bureau of Agricultural and Resource Economics, Canberra.
—— 2008, Maximum economic yield in the Southern and Eastern Scalefish and Shark Fishery, ABARE report to the Fisheries Resources Research Fund, Canberra.
Larcombe, J & Bath, A 2015, ‘Eastern Tuna and Billfish Fishery’ in Patterson, H, Georgeson, L, Stobutzki, I & Curtotti, R (eds), Fishery status reports 2015, Australian Bureau of Agricultural and Resource Economics and Sciences, Canberra.
Vieira, S, Perks, C, Mazur, K, Curtotti, R & Li, M 2010 Impact of the structural adjustment package on the profitability of Commonwealth fisheries, ABARE research report 10.01, Australian Bureau of Agricultural and Resource Economics, Canberra.
34