datasheet 2.5 aesthetic determinands - ministry of … · web viewaesthetic determinands 2.4...
TRANSCRIPT
VOLUME 3
DATASHEETS
PART 2.5
CHEMICAL AND PHYSICAL DETERMINANDS
AESTHETIC DETERMINANDS
Guidelines for Drinking-water Quality Management for New Zealand, May 2017
2.4 AESTHETIC DETERMINANDS
NOTES
This section only covers the aesthetic determinands listed in the Drinking-water Standards for New Zealand (DWSNZ), which therefore have a Guideline Value. Datasheets for aesthetic determinands that also have a MAV appear elsewhere. The DWSNZ define a Guideline Value (GV) as the value for an aesthetic determinand that, if exceeded, may render the water unattractive to consumers. This usually involves taste and/or odour.
Also included in this section are datasheets for aggressiveness, conductivity, dissolved oxygen, silica and UV absorbance/transmittance; this section seems to be the most logical place for them.
Being a subjective area, there are several other determinands that may be noticed by some consumers, often by only a small fraction of the community, or which may appear in drinking-water fairly rarely – datasheets for some of these appear in the relevant section, e.g. the datasheet for geosmin is in the organic determinands section. The datasheet for any determinand that is known to affect the aesthetic quality of drinking-water may be found in the other sections by entering ‘odour’ or ‘taste’ in Edit/Find.
Aesthetic determinands are discussed in Chapter 18 of the Guidelines.
Drinking water standards in England and Wales are now set out in European and UK legislation. They are called Prescribed Concentrations or Values (PCVs) and many are different from WHO’s Guideline Values. See:DWI (2010). The Water Supply (Water Quality) Regulations 2010. Water, England and Wales.
No. 994 (W.99). 42 pp. http://dwi.defra.gov.uk/stakeholders/legislation/wsr2010wales.pdf
WRF (2014) reports the results of aeration trials on the removal of volatile organic contaminants from water. See:WRF (2014). Removal of Volatile Organic Contaminants via Low Profile Aeration Technology.
58 pp. http://www.waterrf.org/PublicReportLibrary/4439.pdf
WRF (2015) is a 70 page publication by the Water Research Foundation in the US that is dedicated to matters related to aesthetic determinands. See:WRF (2015). EPA Secondary Maximum Contaminant Levels: A Strategy for Drinking Water
Quality and Consumer Acceptability. Water Research Foundation. 70 pp. http://www.waterrf.org/PublicReportLibrary/4537.pdf
Guidelines for Drinking-water Quality Management for New Zealand, May 2017
CONTENTS
AGGRESSIVENESS.................................................................................................. 1ALUMINIUM (Al3+).................................................................................................. 4AMMONIA (NH3 & NH4
+)......................................................................................10CALCIUM (Ca2+).................................................................................................... 14CHLORIDE (Cl-)..................................................................................................... 172-CHLOROPHENOL............................................................................................... 20COLOUR................................................................................................................. 25CONDUCTIVITY.................................................................................................... 282,4-DICHLOROPHENOL........................................................................................30DISSOLVED OXYGEN...........................................................................................37HARDNESS (TOTAL)............................................................................................. 39HYDROGEN SULPHIDE (H2S).............................................................................43IRON (Fe2+ & Fe3+).................................................................................................. 47MAGNESIUM (Mg2+)............................................................................................. 51MONOCHLOROBENZENE....................................................................................55pH............................................................................................................................. 60SILICA (SiO2)......................................................................................................... 64SODIUM (Na+)........................................................................................................ 66SULPHATE (SO4
2-)................................................................................................. 69SUSPENDED SOLIDS............................................................................................. 73TASTE AND ODOUR............................................................................................. 75TEMPERATURE..................................................................................................... 79TOTAL DISSOLVED SOLIDS................................................................................81TRICHLOROBENZENES........................................................................................85TURBIDITY............................................................................................................. 91UV ABSORBANCE/TRANSMITTANCE...............................................................94ZINC (Zn2+)............................................................................................................. 98
The following determinands also have a MAV, i.e. also have health concerns, so their datasheet appears in the relevant section (Part 2.1 inorganic determinands or Part 2.2 organic determinands). Only datasheets for the aesthetic determinands without a MAV appear in this Part.
chlorine copper1,2-dichlorobenzene 1,4-dichlorobenzeneethylbenzene manganesestyrene toluene
Guidelines for Drinking-water Quality Management for New Zealand, May 2017

2,4,6-trichlorophenol xylene
Guidelines for Drinking-water Quality Management for New Zealand, May 2017

Datasheets Aesthetic Determinands
AGGRESSIVENESS
Also called plumbosolvency
Description and CharacteristicsThe aggressiveness of a water is estimated by various empirical indices which should not be considered as absolutes. These indices are guides to the behaviour of calcium carbonate in aqueous systems. They should be supplemented, where possible, with experimentally derived information. Neither the calculations referred to here, nor the most complex computerised calculations, adequately describe all corrosion events that establish “aggressiveness”. See also Chapter 10 of the Guidelines: Chemical Compliance, particularly Sections 10.2.6, 10.3.3, 10.3.4 and 10.4.2.
Langelier Saturation Index (LSI)The Langelier Saturation Index is used to evaluate the calcium carbonate (CaCO3) scale-forming and scale-dissolving tendencies of water. It provides no information about the rate, or extent, of precipitation or dissolution of calcium carbonate. This distinction must be appreciated, because a water may have a tendency to precipitate calcium carbonate, but if the concentration of calcium in the water is insufficient, little solid will form. Nevertheless, assessing these tendencies is useful in corrosion control programmes and in preventing CaCO3 scaling in pipes and equipment such as industrial heat exchangers or domestic water heaters. The LSI is based on the assumption that a scale coating protects the pipe; it is not a direct measure of how a water will react with metal pipework or fittings.
The LSI calculation produces a number that may range from a negative to a positive value. A value of zero indicates that the water is in equilibrium with any calcium carbonate solid present, that is, it is saturated and will neither dissolve nor precipitate calcium carbonate.
A negative LSI indicates undersaturation, and the tendency for calcium carbonate dissolution. Waters, such as rainwater, containing very little calcium and alkalinity and having very low pH may have an LSI less than -5, but values between -2 and -3 are more common for aggressive reticulated waters.
A positive LSI shows oversaturation, and the tendency to precipitate calcium carbonate. This is less common in NZ.
Whether the LSI calculated for a water is positive or negative, it must be remembered that the index is only an approximation. The uncertainty in the interpretation of the index increases as the water approaches saturation (zero index value). Near zero, a water with a negative index may be capable of precipitating calcite, and vice versa. The value must be significantly positive or negative before it is possible to be reasonably certain of the precipitating, or dissolving properties of the water.
The calcium carbonate saturation index (LSI) is calculated from the calcium, pH, temperature, dissolved solids or conductivity, and alkalinity characteristics of a water.
Typical Concentrations in Drinking-waterTypical values for aggressiveness in New Zealand drinking waters range from LSI +1.5 to -3.0 with most waters being greater than -1.5 and less than 0.
Aggressiveness ModificationReduction of Scale Formation
Guidelines for Drinking-water Quality Management for New Zealand, May 2017 1
Datasheets Aesthetic Determinands
Chemical softening, reverse osmosis, electrodialysis, or ion exchange, will reduce calcium, and thus decrease the LSI and increase the water’s aggressiveness.
Minimisation of AggressivenessAddition of calcium ions; and pH and alkalinity adjustment using combinations of lime, caustic soda, soda ash, sulphuric acid, and carbon dioxide; can increase the LSI and hence decrease the water’s aggressiveness.
Analytical MethodsThe saturation index can be obtained from the following formula: LSI = pH - pHs,
where pHs is the pH at which a water is saturated with CaCO3, and is calculated from published nomographs or software using values for temperature, total dissolved solids, calcium and alkalinity.
Health ConsiderationsAggressive waters have the potential to cause significant health effects depending on the nature of the materials used in the distribution system.
Corrosion of pipes may lead to heavy metals such as copper, zinc, lead and cadmium being present in water in the distribution system or coming from a tap. Where asbestos-cement pipes are used, corrosion by aggressive water may also release some asbestos fibres into the water. Refer to the individual datasheets for further information.
Plumbosolvent water is covered in the DWSNZ in section 8. Chapter 10 of the Guidelines: Chemical Compliance discusses plumbosolvency in more detail.
Guideline ValueThe 1995 datasheet stated: based on the formation of a calcium carbonate scale acting as a barrier to corrosion, a guideline value of LSI >0 is assigned. There was no GV in the 2000 DWSNZ.
Aggressiveness does not appear in the aesthetic determinand table in the 2005 or 2008 DWSNZ.
The USEPA (2011) has a secondary drinking water regulation level of “non-corrosive”. WRF (2015) discusses how this is difficult to measure, and that while the Langelier index is a most commonly used corrosion index, no one corrosion index is universally applicable or predictive. Selection of materials is obviously important but some recent observations where water suppliers have replaced chlorine have been disturbing. For example, chlorine dioxide has been found to attack and degrade polyethylene pipe, and chloramine attacked and severely degraded elastomer materials in the distribution system and premise plumbing; chloramines also attacked some thermoplastic materials, but the degradation was not as severe.
BibliographyAPHA (2005). Standard Methods for the Examination of Water and Wastewater (21st Edition).
Washington: American Public Health Association, American Water Works Association, Water Environment Federation.
USEPA (2011). 2011 Edition of the Drinking Water Standards and Health Advisories. US Environmental Protection Agency, Washington, DC. Available at: http://water.epa.gov/action/advisories/health_index.cfm or www.epa.gov/waterscience/
WHO (2004). Guidelines for Drinking-water Quality (3rd Ed.). Geneva: World Health Organization. Available at: www.who.int/water_sanitation_health/dwq/gdwq3/en/print.html see also the addenda
Guidelines for Drinking-water Quality Management for New Zealand, May 2017 2
Datasheets Aesthetic Determinands
WHO (2011). Guidelines for Drinking-water Quality 2011 (4th Ed.). Geneva: World Health Organization. Available at: http://www.who.int/water_sanitation_health/publications/2011/dwq_guidelines/en/index.html
WRF (2015). EPA Secondary Maximum Contaminant Levels: A Strategy for Drinking Water Quality and Consumer Acceptability. Water Research Foundation. 70 pp. http://www.waterrf.org/PublicReportLibrary/4537.pdf
Guidelines for Drinking-water Quality Management for New Zealand, May 2017 3
Datasheets Aesthetic Determinands
ALUMINIUM (Al3+)
Description and CharacteristicsAluminium is the third most abundant element in the earth’s crust occurring in minerals, rocks and clays. This wide distribution accounts for the presence of aluminium in nearly all natural water as a soluble salt, a colloid, or an insoluble compound. It may be present in water as a fine suspension through natural leaching from soil, clay and rock, or alumino-silicates.
The concentration of aluminium in seawater is about 0.001 mg/L. The amount of aluminium in surface water varies, ranging from 0.012 to 2.25 mg/L in North American rivers. Aluminium is more likely to exist in surface water than in groundwater; only 9% of groundwaters had detectable amounts of aluminium (detection limit 0.014 mg/L), whereas 78% of surface waters had detectable aluminium; reported in Health Canada (1998).
Aluminium is used in many industrial and domestic products including antacids, antiperspirants, food additives and vaccines. It is used commonly by the food industry for food containers and packaging, and in cooking utensils.
Aluminium salts are used extensively in water treatment as coagulants for the removal of colour and turbidity, mainly from surface waters. Where aluminium coagulants are used, post-treatment plant flocculation effects can occur, precipitating aluminium in the reticulation where it can later be resuspended or redissolved. A whitish gelatinous precipitate of aluminium hydrolysis products may form in the distribution system, which could result in consumer complaints about “milky coloured” water. More commonly though, it attracts iron, manganese and other particulate matter, causing dirty (brown) water.
It has been estimated that the intake of aluminium from food and beverages is approximately 5 - 20 mg/day. Drinking-water probably contributes less than 5% of the total dietary intake, although aluminium in water may be more bio-available than aluminium from other sources.
Concentrations of aluminium in food range widely (means range from <0.001 to 69.5 mg/100 g), depending on the nature of the foodstuffs. The highest levels are found in nuts, grains and dairy products, particularly processed cheeses. The tea plant accumulates large amounts of aluminium, which can leach from tea leaves; aluminium concentrations in brewed tea tend to be in the range of 2 - 8 mg/L. There is also potential for exposure from the ingestion of aluminium contained in over-the-counter drugs, including antacids and buffered acetylsalicylic acid (aspirin); based on the recommended dose, the range of aluminium exposure from antacids has been given as 840 - 5000 mg/d and as 120 - 7200 mg/d, and that from buffered aspirin has been given as 126 - 728 mg/d and as 200 - 1000 mg/d. Aluminium leaching from cooking utensils, containers and packaging made of aluminium may also contribute to dietary exposure. Taken from Health Canada (1998).
Typical Concentrations in Drinking-waterRaw water concentrations are generally less than 0.1 mg/L. Values of aluminium commonly found in New Zealand drinking-waters range from 0.01 to 0.3 mg/L. However, the 1983 - 1989 Surveillance Data Review indicated that for all reticulated water samples 28% contained above 0.05 mg/L aluminium, including 10% above 0.2 mg/L. For aluminium-treated supplies, 81% contained greater than 0.05 mg/L aluminium, including 36% above 0.2 mg/L.
Water dirty enough to give rise to complaints may well contain more than 100 mg/L Al, a lot of it being particulate.
Guidelines for Drinking-water Quality Management for New Zealand, May 2017 4
Datasheets Aesthetic Determinands
Levels of aluminium in Canadian drinking water vary over a wide range. The highest levels in Canada have been recorded in Alberta, where, during 1987, the mean level in 10 major urban centres was 0.384 mg/L; one water sample attained a level of 6.08 mg/L. In a 1987 survey in Ontario, aluminium levels in treated drinking water ranged from 0.003 to 4.6 mg/L, with a mean of 0.16 mg/L. In Manitoba, aluminium levels of up to 1.79 mg/L have been recorded in the finished water of the distribution system, although the levels were mostly below 0.1 mg/L in the drinking water. In Saskatchewan, the average dissolved aluminium concentration in Regina's drinking water is about 0.035 mg/L, whereas that in Saskatoon's drinking water is about 0.724 mg/L. Thirty-five percent of shallow wells sampled at 17 sites in the Atlantic provinces in the fall of 1993 had high aluminium concentrations, ranging from 0.05 to 0.6 mg/L. The global mean level of aluminium in distributed water in Canada, after treatment, has been reported to be 0.17 mg/L. In a US nationwide survey of 80 surface water treatment plants that used alum, a mean total aluminium concentration in the finished water of 0.085 mg/L was reported. From Health Canada (1998).
2,744 water utilities in the US reported detecting aluminium in tap water since 2004, according to EWG's analysis of water quality data supplied by state water agencies, with the highest concentration being 170 mg/L.
Removal MethodsNaturally-occurring aluminium associated with inorganic and organic particulate matter, and soluble natural organic matter, can be reduced using coagulation, flocculation and filtration. Aluminium carry-over from treatment can be reduced by optimisation of the coagulation process.
The chemical coagulation and filtration process also removes protozoa. Filtered water turbidity is one of the criteria for assessing protozoal compliance. In most cases, if the filtered water turbidity satisfies the protozoal criteria, the aluminium content should be less than 0.10 mg/L. However, if the raw water turbidity or alkalinity is low, it cannot be assumed that the aluminium concentration in the filtered water is also low. Aluminium residuals can also be high when the raw water is cold (say <10°C), or when the raw water organic content is high. See Chapter 13 of the Guidelines for further discussion.
Analytical MethodsAluminium is measured by atomic absorption spectroscopy, inductively coupled plasma emission spectroscopy, or colorimetric procedures. Some colorimetric techniques have a limit of detection below 0.05 mg/L, and graphite furnace AAS has a detection limit of approximately 0.005 mg/L. Field test kits are available for aluminium, and are almost exclusively based on colorimetric methods. Colorimetric procedures can be carried out in a treatment plant laboratory, by following the manufacturer’s instructions or standard method procedures carefully, and taking the necessary precautions against contamination. Field kit and treatment plant analyses for aluminium are likely to be used for process control.
Aluminium concentrations are expressed in many terms (e.g. total, soluble, dissolved, extractable). The term “soluble” means truly soluble, not dissolved which is “filterable through a 0.45 micron filter”. Some finely suspended alumino-silicate clay particles can pass through a 0.45 micron filter but are not truly soluble. Studies have proven that different measurement techniques can be more suited to specific aluminium fractions. Analysis for aluminium fractions is only necessary if the total aluminium concentration is greater than guideline values and remedial action is being investigated.
Refer to Health Canada (1998) for a detailed and excellent discussion of aluminium speciation in different types of water and at a range of pH values.
Guidelines for Drinking-water Quality Management for New Zealand, May 2017 5

Datasheets Aesthetic Determinands
Health ConsiderationsAluminium is not accumulated to any significant extent in most plants or animals. There are some exceptions, such as tea plants.
The metabolism of aluminium in humans is poorly understood. It has been suggested that absorption of aluminium is greater in the presence of organic ligands such as citrate. Studies indicate that probably less than 1% of dietary aluminium is absorbed by the gastro-intestinal tract and passes into the blood stream. Some aluminium accumulates in bone tissue but most is removed by the kidneys. In healthy adults the total accumulated body load of aluminium has been estimated at about 35 mg. Although aluminium concentrations in brewed tea are 10 - 100 times those in drinking water, aluminium in tea is present almost exclusively (91 - 100%) in the form of high-molecular-weight organic complexes, which are not readily absorbed; from Health Canada (1998).
Some people who have kidney disease store a lot of aluminium in their bodies. The kidney disease causes less aluminium to be removed from the body in the urine. Investigations have established a correlation between the concentration of aluminium in water used to prepare kidney dialysis fluid and the incidence of dialysis dementia. The condition is treatable using chelation therapy. Aluminium has also been linked to other conditions associated with the use of dialysis units including osteomalacia (a softening of the bones), and anaemia. Reverse osmosis or de-ionisation units are now used to treat dialysis water before use, and aluminium concentrations are kept below 0.01 mg/L.
Elevated concentrations of aluminium have been found in the brains of some Alzheimer’s patients. Studies indicate that a tentative link may exist, but there is no conclusive evidence that aluminium directly causes Alzheimer’s disease. WHO stated in 1998 and repeated in their 2004 Guidelines:
On the whole, the positive relationship between aluminium in drinking-water and Alzheimer disease, which was demonstrated in several epidemiological studies, cannot be totally dismissed. However, strong reservations about inferring a causal relationship are warranted in view of the failure of these studies to account for demonstrated confounding factors and for total aluminium intake from all sources.
Taken together, the relative risks for Alzheimer disease from exposure to aluminium in drinking-water above 0.1 mg/L, as determined in these studies, are low (less than 2.0). But, because the risk estimates are imprecise for a variety of methodological reasons, a population-attributable risk cannot be calculated with precision. Such imprecise predictions may, however, be useful in making decisions about the need to control exposures to aluminium in the general population.
Aluminium has been associated with two severe neurodegenerative diseases, namely Parkinsonism dementia (PD) and Amyotrophic lateral sclerosis (ALS), both of which occur with a high incidence in areas where aluminium is naturally present in food and drinking water. There was an appreciable decrease in the incidence of these conditions when the areas became developed with associated changes in dietary habits, importing of food, and improvements to the water supply.
The Factsheet in the Australian Drinking Water Guidelines was revised in 2001. It states that water authorities are strongly encouraged to keep acid-soluble aluminium concentrations as low as possible, preferably below 0.1 mg/L. No health-based guideline is set for aluminium at this time, but this issue will be kept under review. WHO (2011) also states that available evidence does not support the derivation of a health-based guideline value for aluminium in drinking-water.
Guidelines for Drinking-water Quality Management for New Zealand, May 2017 6

Datasheets Aesthetic Determinands
FSANZ (2004) reported up to 1.4 mg/L of aluminium in bottled waters, but concluded the intake of aluminium from bottled drinking water represents a very small percentage of the total exposure of Australians and New Zealanders. FSANZ considers that levels of aluminium in bottled drinking water and in the food supply are safe. In Australian adults, the mean aluminium intake from food and water is estimated to be 5 to 7 mg/day. Aluminium is permitted as a food additive and is used in colourings, emulsifiers, stabilisers and anti-caking agents. Drinking water contributes less than 2% of total aluminium consumption. Pharmaceuticals (such as antacids and buffered analgesics) potentially contribute substantially to the total body burden of aluminium (up to 5000 mg/day in users of antacids). There is also some absorption through the skin from deodorants containing aluminium.
ATSDR (http://www.atsdr.cdc.gov/mrls/mrls_list.html) quotes a minimal risk level (MRL) of:1 mg/kg/day for intermediate-duration oral exposure (15 – 364 days)1 mg/kg/day for chronic-duration oral exposure (>364 days).
Guideline ValueBased on aesthetic problems caused by post-treatment plant precipitation, the concentration of aluminium in drinking water should not exceed 0.10 mg/L, the guideline value set in the DWSNZ. However, there are factors other than aluminium concentration that contribute to its solubility properties, such as the presence of natural organic matter, the pH of the water, and the presence of coagulation/flocculation aids.
Although data is insufficient to set a health-based value, there has been some concern over the possible health effects of aluminium, particularly on the possible causal link between aluminium concentration and Alzheimer’s disease, and on the bio-availability of aluminium. Water authorities are strongly encouraged to keep aluminium concentrations as low as possible.
The Australian Drinking Water Guidelines (NHMRC, NRMMC 2011) state that based on aesthetic problems caused by post-flocculation, the concentration of acid-soluble aluminium in drinking water should not exceed 0.2 mg/L. Water authorities are strongly encouraged to keep acid-soluble aluminium concentrations as low as possible, preferably below 0.1 mg/L. No health-based guideline is set for aluminium at this time but this issue will be kept under review.
The USEPA (2009/2011) has a secondary drinking water regulation level of 0.05 to 0.2 mg/L.
WRF (2015) reports that aluminium sulfate has a taste threshold at 7.4 mg/L Al in soft water with descriptors of musty, mouldy, and stale. Their research found that the lowest concentrations detectable by taste were 4 mg/L Al in soft and 10 mg/L Al in hard water.
The Prescribed Concentration or Value (PCV) for aluminium in England and Wales is 0.2 mg/L. See Notes.
The livestock guideline value is 5 mg/L. Animals, particularly ruminants, may tolerate much higher levels of aluminium as long as there is sufficient phosphorus in the diet to compensate for the effects of aluminium (ANZECC/ARMCANZ 2000). These guidelines were to be updated in 2012.
Bibliography
Guidelines for Drinking-water Quality Management for New Zealand, May 2017 7

Datasheets Aesthetic Determinands
ANZECC/ARMCANZ (2000). Australian and New Zealand Guidelines for Fresh and Marine Water Quality. http://www.mfe.govt.nz/publications/water/anzecc-water-quality-guide-02/anzecc-water-quality-guide-02-pdfs.html
APHA (2005). Standard Methods for the Examination of Water and Wastewater (21st Edition). Washington: American Public Health Association, American Water Works Association, Water Environment Federation.
ATSDR (2006). Toxicological Profile for Aluminium. Agency for Toxic Substances and Disease Registry. U.S. Department of Health and Human Services, Public Health Service. http://www.atsdr.cdc.gov/toxprofiles/tp22.html
AWWA (1990). Water Quality and Treatment, A Handbook of Community Water Supplies. (4th Edition). McGraw Hill Inc.
EWG (accessed 2010). Environmental Working Group. National Drinking Water Database – Chemical Contaminants. http://www.ewg.org/tap-water/chemical-contaminants
FSANZ (2004). Fact Sheet: Aluminium in food and water. http://www.foodstandards.gov.au/educationalmaterial/factsheets/factsheets2004/aluminiuminfoodandwa2748.cfm
Garruto, R. M., R. Yanagihara, et al (1990). Models of environmentally induced neurological disease; epidemiology and etiology of amyotrophic lateral sclerosis and parkinsonism-dementia in the Western Pacific. Environmental Geochemistry and Health, 12, 137-151.
Garruto, R. M. and Y. Yase (1986). Neurodegenerative disorders of the Western Pacific: the search for mechanisms of pathogenesis. Trends in Neurosciences, 9, pp 368-374.
Gregor, J. E. (1992). Aluminium interlaboratory comparative study. Analytical Workshop. New Zealand Water Supply and Disposal Association Annual Conference.
Health Canada (1998). Guidelines for Canadian Drinking Water Quality; Guideline Technical Documents. Aluminium. 23 pp. http://www.hc-sc.gc.ca/ewh-semt/water-eau/drink-potab/index-eng.php
IPCS (1997). Aluminium; Environmental Health Criteria 194. INCHEM. International Programme on Chemical Safety. http://www.inchem.org/documents/ehc/ehc/ehc194.htm
Martyn, C. N., C. Osmond, J. A. Edwardson, et al (1989). Geographical relation between Alzheimer’s disease and aluminium in drinking water. Lancet (January), pp 59-62.
Mattingley, B. I. (1992). New Zealand Drinking Water Surveillance Programme Data Review 1983-89.
NHMRC, NRMMC (2011). Australian Drinking Water Guidelines Paper 6 National Water Quality Management Strategy. National Health and Medical Research Council, National Resource Management Ministerial Council, Commonwealth of Australia, Canberra. 1244 pp. http://www.nhmrc.gov.au/guidelines/publications/eh52
Perl, D. P. and A. R. Brody (1980). Alzheimer’s disease: X-ray spectrometric evidence of aluminium accumulation in neurofibrillar tangle bearing neurons. Science, 208, 297-299.
USEPA (2009). 2009 Edition of the Drinking Water Standards and Health Advisories. US Environmental Protection Agency, Washington, DC. EPA 822-R-09-011. 18 pp. Available at: http://water.epa.gov/action/advisories/health_index.cfm
USEPA (2011). 2011 Edition of the Drinking Water Standards and Health Advisories. US Environmental Protection Agency, Washington, DC. Available at: http://water.epa.gov/action/advisories/health_index.cfm
Waters, J. D. (1988). Aluminium - Current Toxicity Issues. Proc. NZ Trace Elements Group Conference. Lincoln College, Canterbury.
WHO (2003). Aluminium in drinking-water. Background document for preparation of WHO Guidelines for Drinking-water Quality. Geneva, World Health Organization (WHO/SDE/WSH/03.04/53). http://www.who.int/water_sanitation_health/dwq/chemicals/aluminium/en/
Guidelines for Drinking-water Quality Management for New Zealand, May 2017 8
Datasheets Aesthetic Determinands
WHO (2004). Guidelines for Drinking-water Quality (3rd Ed.). Geneva: World Health Organization. Available at: www.who.int/water_sanitation_health/dwq/gdwq3/en/print.html see also the addenda
WHO (2011). Guidelines for Drinking-water Quality 2011 (4th Ed.). Geneva: World Health Organization. Available at: http://www.who.int/water_sanitation_health/publications/2011/dwq_guidelines/en/index.html
WRF (2015). EPA Secondary Maximum Contaminant Levels: A Strategy for Drinking Water Quality and Consumer Acceptability. Water Research Foundation. 70 pp. http://www.waterrf.org/PublicReportLibrary/4537.pdf
Guidelines for Drinking-water Quality Management for New Zealand, May 2017 9
Datasheets Aesthetic Determinands
AMMONIA (NH3 & NH4+)
Description and CharacteristicsAmmonia may be found in natural surface waters, but is more frequently found at elevated concentrations in anaerobic groundwaters. At the pH of most natural waters, ammonia (NH3) dissolves rapidly in water to form the ammonia molecule NH4OH (ammonium hydroxide) which exists in equilibrium with the ammonium cation (NH4
+) – the predominant form.
The concentration of ammonia in clean seawater is about 0.05 mg/L as N.
Ammonia is used commercially in animal feeds and fertilisers, and in the manufacture of fibres, plastics and explosives. Ammonia products are widely used as cleaning agents and food additives. Long term fire retardants are composed of fertiliser-like chemicals (ammonium phosphate and ammonium sulphate) which affect the thermal degradation and/or combustion properties of flammable materials. These chemicals are commonly mixed into water with a thickening agent (usually guar gum) which helps to reduce the dispersion of the fire retardant load when it is dropped from aircraft and also makes it cling more effectively to vegetation and structures (WQRA 2009).
Ammonia can be an important indicator of pollution as it can be formed as an intermediate product in the breakdown of nitrogen-containing organic compounds, or of urea from human or animal excrement. Ammonia may increase the solubility of some metals such as copper and lead, thus interfering in the formation of passivating films and increasing corrosion rates. It is also a food source for some micro-organisms, and can support nuisance growths of bacteria and algae, often with a subsequent increase in the nitrite and nitrate concentrations. It may be present in unchlorinated drinking-water due to contamination of source water or through microbial metabolism. Ammonia reacts rapidly with chlorine. During breakpoint chlorination most of the ammonia is oxidised to nitrogen and nitrate. However, if the chlorine dose is insufficient, chloramines may be formed. Ammonia is added to water in the chloramination process.
Most uncontaminated source waters have ammonia concentrations below 0.01 mg/L. High concentrations (greater than 10 mg/L) have been reported where water is contaminated with animal waste. Hypolimnetic water (deep water in lakes and reservoirs in summer and autumn) may contain >1 mg/L ammonia as N. Many groundwaters contain 0.1 – 1.0 mg/L of ammonia as N. Ammonia levels in NZ waters have probably risen since the increased use of urea fertiliser.
The odour threshold of ammonia in water is 1.5 mg/L (note that this may require a high pH); the threshold for taste is 35 mg/L (WHO 2004). Chloramines may have an unpleasant biting odour at concentrations in water above 0.2 mg/L. To restrict chloramines forming in the distribution system by the reaction of FAC and ammonia, the ammonia content should be less than 0.3 mg/L (see Chapter 15).
Food can contain substantial amounts of ammonia/ammonium ion, and is the principal source of intake for humans. Ammonia is present in a limited number of foodstuffs, such as cheeses, aged or stored meats and stored vegetables. The ammonia is formed as the result of fermentation and autolytic deamination and deamidation. Ammonium salts are widely used in baked goods, candies, gelatin, fats and oils, jellies, cheeses, processed fruits and beverages; from Health Canada (1987).
Environmental FateIf released to soil, ammonia may either volatilise to the atmosphere, adsorb to particulate matter, or undergo microbial transformation to nitrate or nitrite anions. Uptake by plants can also be an
Guidelines for Drinking-water Quality Management for New Zealand, May 2017 10
Datasheets Aesthetic Determinands
important fate process. Ammonia at natural concentrations in soil is not believed to have a very long half-life. If ammonia is distributed to soil in large concentrations (such as following an ammonia-containing fertiliser application), the natural biological transformation processes can be overwhelmed, and the environmental fate of ammonia will become dependent upon the physical and chemical properties of ammonia, until the ammonia concentration returns to background levels. If released to water, ammonia volatilises to the atmosphere, is transformed to other nitrogenous compounds, or may adsorb to sediments or suspended organic material. Volatilisation is pH-dependent, and can depend on factors such as temperature, wind speed, and atmospheric ammonia concentration. Transformation of ammonia in water occurs primarily by the microbial processes of nitrification (yielding nitrate and nitrite anions) and denitrification. EAWAG (accessed Feb 2015).
Typical Concentrations in Drinking-waterValues of ammonia commonly found in New Zealand drinking waters range up to approximately 2 mg/L. However, most waters contain less than 0.05 mg/L of ammonia. Ammonia is generally not present in groundwater unless it is contaminated with sewage or animal excrement. Ammonia in deep, secure groundwaters should not be a concern.
Removal MethodsAmmonia concentrations in drinking-water supplies can be reduced by chemical or biological oxidation of ammonia to nitrate. Increasing the pH to about 10 will convert ammonium to ammonia; then aeration will remove the ammonia. Removal of ammonia is not normally required.
WRF (2016) found that ammonia could be completely removed by the biological oxidation filtration process, despite the presence of multiple contaminants that could interfere or hinder the effectiveness of the process.
Analytical MethodsThe concentration of ammonia in water can be determined by a number of methods including colorimetric (phenate), titrimetric, ion chromatography, and ion selective electrode techniques. Preliminary distillation may be required for high concentrations and where interferences are present. The limit of detection of ammonia for most methods is 0.01 mg/L.
Health ConsiderationsAmmonia is an important metabolite in humans and animals. It is formed in the liver by the de-amination of amino acids, and in the gastro-intestinal tract by the breakdown of food by enzymes and bacterial flora. Almost all ammonia is absorbed, then transported to the liver and used mostly in the urea cycle. The average daily intake of ammonia (as nitrogen) from drinking water would be about 0.3 mg per person. Only an extremely small proportion of the ammonia absorbed in the intestinal tract originates directly from food or water.
Ammonia has a toxic effect on humans only if the intake becomes higher than the detoxification capacity of the body. At doses above 32 mg of ammonium ion per kilogram body weight per day (over 1000 mg/L in drinking-water!) ammonium chloride influences the metabolism by shifting the acid-base equilibrium, affecting glucose tolerance and reducing tissue sensitivity to insulin.
In studies with animals, high doses of ammonia (over 100 mg/kg body weight per day) generally have not produced any significant toxic effects; however there is some evidence that ammonia may act with cancer causing compounds to increase the incidence of tumours. Ammonia and ammonium chloride have shown mutagenicity in some tests with bacteria and animal cells.
Guideline Value
Guidelines for Drinking-water Quality Management for New Zealand, May 2017 11
Datasheets Aesthetic Determinands
Based on aesthetic considerations (odour threshold), the concentration of ammonia (measured as ammonium ion) should not exceed 1.5 mg/L (the guideline value set in the DWSNZ) at alkaline pHs, and a taste threshold of 35 mg/L has been proposed for the ammonium cation. WHO (2004/2011) states that ammonia in drinking-water is not of immediate health relevance, and therefore no health-based guideline value is proposed. However, ammonia can compromise disinfection efficiency, result in nitrite formation in distribution systems, cause the failure of filters for the removal of manganese and cause taste and odour problems.
The Australian Drinking Water Guidelines (NHMRC, NRMMC 2011) state that based on aesthetic considerations, the concentration of ammonia (measured as ammonia) in drinking water should not exceed 0.5 mg/L (as NH3). High levels may corrode copper pipes and fittings. No health-based guideline value is set for ammonia.
Ammonia appears in the USEPA (2009/2011) drinking water advisory table, with a taste threshold of 30 mg/L.
The Prescribed Concentration or Value (PCV) for ammonium in England and Wales is 0.5 mg/L. See Notes.
The USEPA (2006/2011) established a lifetime health advisory of 30 mg/L, where the lifetime health advisory is the concentration of a chemical in drinking water that is not expected to cause any adverse noncarcinogenic effects for a lifetime of exposure, and is based on exposure of a 70-kg adult consuming 2 litres of water per day. The Lifetime HA for Group C carcinogens includes an adjustment for possible carcinogenicity.
WRF (2015) states that there are no recent sensory data for ammonia. No reports of ammonia-smelling drinking water were found in the recent literature. A current concern for ammonia in drinking water is its role in promoting nitrification within chloraminated drinking water systems; formation of nitrogenous disinfection by-products is also a concern. Typically, chloraminated systems maintain a pH of 8 - 9, which is below the pKa value for this base and thus favours the NH4
+ ion. WRF (2015) states that the recommended limit of 0.12 mg NH3/L to control nitrification should also control taste and odour effects for ammonia.
BibliographyAPHA (2005). Standard Methods for the Examination of Water and Wastewater (21st Edition).
Washington: American Public Health Association, American Water Works Association, Water Environment Federation.
ATSDR (2004). Toxicological Profile for Ammonia. Agency for Toxic Substances and Disease Registry. U.S. Department of Health and Human Services, Public Health Service. http://www.atsdr.cdc.gov/toxprofiles/tp126.html
EAWAG (accessed Feb 2015). Biocatalysis/Biodegradation Database. Select 1396 compounds. http://eawag-bbd.ethz.ch/index.html
Health Canada (1987). Guidelines for Canadian Drinking Water Quality; Guideline Technical Documents. Ammonia. 4 pp. http://www.hc-sc.gc.ca/ewh-semt/water-eau/drink-potab/index-eng.php
Holden, W. S. Water Treatment and Examination. Edition 1970. London: J.& A Churchill.IPCS (1986). Ammonia; Environmental Health Criteria 54. INCHEM. International Programme
on Chemical Safety. http://www.inchem.org/documents/ehc/ehc/ehc54.htmNHMRC, NRMMC (2011). Australian Drinking Water Guidelines Paper 6 National Water
Quality Management Strategy. National Health and Medical Research Council, National
Guidelines for Drinking-water Quality Management for New Zealand, May 2017 12
Datasheets Aesthetic Determinands
Resource Management Ministerial Council, Commonwealth of Australia, Canberra. 1244 pp. http://www.nhmrc.gov.au/guidelines/publications/eh52
USEPA (2009). 2009 Edition of the Drinking Water Standards and Health Advisories. US Environmental Protection Agency, Washington, DC. EPA 822-R-09-011. 18 pp. Available at: http://water.epa.gov/action/advisories/health_index.cfm
USEPA (2011). 2011 Edition of the Drinking Water Standards and Health Advisories. US Environmental Protection Agency, Washington, DC. Available at: http://water.epa.gov/action/advisories/health_index.cfm or www.epa.gov/waterscience/
WHO (2003). Ammonia in drinking-water. Background document for preparation of WHO Guidelines for Drinking-water Quality. Geneva, World Health Organization (WHO/SDE/WSH/03.04/01). See http://www.who.int/water_sanitation_health/dwq/chemicals/ammonia/en/
WHO (2004). Guidelines for Drinking-water Quality (3rd Ed.). Geneva: World Health Organization. Available at: www.who.int/water_sanitation_health/dwq/gdwq3/en/print.html see also the addenda
WHO (2011). Guidelines for Drinking-water Quality 2011 (4th Ed.). Geneva: World Health Organization. Available at: http://www.who.int/water_sanitation_health/publications/2011/dwq_guidelines/en/index.html
WQRA (2009). HealthStream. Public Health Newsletter of Water Quality Research Australia, March issue. http://www.wqra.com.au
WRF (2015). EPA Secondary Maximum Contaminant Levels: A Strategy for Drinking Water Quality and Consumer Acceptability. Water Research Foundation. 70 pp. http://www.waterrf.org/PublicReportLibrary/4537.pdf
WRF (2016). Biological oxidation filtration for the removal of ammonia from groundwater. [Project #4574]. Water Research Foundation. http://www.waterrf.org/Pages/Projects.aspx?PID=4574
Guidelines for Drinking-water Quality Management for New Zealand, May 2017 13
Datasheets Aesthetic Determinands
CALCIUM (Ca2+)
Description and CharacteristicsThe presence of calcium in water sources results from the passage of water through or over deposits of limestone, dolomite, gypsum, or gypsiferous shale. It is often added to drinking-water (usually as hydrated lime) to increase the pH after chemical coagulation and/or to remove carbon dioxide.
Most calcium compounds are not particularly soluble in pure water. However, their solubility increases in the presence of CO2 (carbon dioxide), and sources of water containing up to 100 mg Ca/L are fairly common. Source waters containing over 200 mg Ca/L are rare in NZ. Calcium contributes to the total hardness (qv) of water.
The concentration of calcium in seawater is about 400 mg/L as Ca.
Calcium is present in a great number of industrial products and is a common constituent of food, particularly dairy products. In the building industry, calcium oxide is used in mortar, stucco and plaster. It also finds use in pulp and paper production, sugar refining, petroleum refining, tanning, and as a water and wastewater treatment chemical.
Appreciable concentrations of calcium salts precipitate upon heating to form often harmful scale in boilers and pipes, and on cooking utensils. Depending on pH and alkalinity, hardness above about 200 mg/L can result in scale deposition, particularly on heating. Protection and scaling tendencies are estimated by the saturation index of a water (refer to Aggressiveness Data Sheet). Calcium in asbestos-cement and cement-lined pipes, and concrete tanks leaches when subjected to aggressive water.
Typical Concentrations in Drinking-waterValues of hardness found in New Zealand water supplies range from less than 5 mg/L to 475 mg/L as CaCO3. However most waters have hardness values ranging from less than 5 mg/L to 80 mg/L as CaCO3. See hardness datasheet for further information.
Removal MethodsChemical softening, reverse osmosis, electrodialysis, or ion exchange treatments will reduce calcium and its associated hardness to acceptable levels.
Analytical MethodsCalcium concentrations may be determined by atomic absorption spectroscopy, inductively coupled plasma emission spectroscopy, and complexometric (EDTA) titration methods.
The calcium hardness value (in mg CaCO3 per litre) can be calculated by multiplying the calcium concentration (as Ca) by a factor of 2.5.
Health ConsiderationsRecommended daily intakes of calcium have been set at national and international levels. Dairy products are the richest sources of dietary calcium, contributing over 50% of the total calcium in many diets. Some plant foods, including legumes, green leafy vegetables and broccoli, can also contribute to dietary calcium, but the content is lower than in dairy products, and the bioavailability of calcium in plant foods can be low if the concentration of oxalate or phytate is high.
Typical recommended dietary intakes are about 1000 mg of calcium per day. Moves to reduce the intake of dairy products because of the fat content will lead to a lowering of calcium intake in some
Guidelines for Drinking-water Quality Management for New Zealand, May 2017 14
Datasheets Aesthetic Determinands
groups. Populations that use only a very small amount of dairy products would also have a lower intake of calcium. Inadequate intakes of calcium have been associated with increased risks of osteoporosis, nephrolithiasis (kidney stones), colorectal cancer, hypertension and stroke, coronary artery disease, insulin resistance and obesity. Most of these disorders have treatments but no cures. High levels of calcium are loss in sweat.
There is no evidence of adverse health effects specifically attributable to high levels of calcium in drinking water. A number of ecological and analytical epidemiological studies have shown a statistically significant inverse relationship between hardness of drinking-water and cardiovascular disease. There is some indication that very soft waters may have an adverse effect on mineral balance in the human body, but detailed studies were not available for evaluation.
Recent studies (see WHO 2005) suggest that the intake of soft water, i.e. water low in calcium, is associated with a higher risk of fracture in children, certain neurodegenerative diseases, pre-term birth and low weight at birth and some types of cancer. Furthermore, the possible role of water calcium in the development of cardiovascular disease cannot be excluded.
Studies examining the apparent effects of soft water on cardiovascular disease and cancer commissioned by the UK Drinking Water Inspectorate concluded that there is evidence to support the role of water hardness in preventing cardiovascular mortality, and magnesium in particular based on a meta-analysis of analytical epidemiological studies (DWI 2005; DWI 2008).
Most New Zealand water supplies are taken from surface sources and most contain relatively low levels of calcium compared with European and North American water supplies.
Guideline ValueA guideline value (upper level) for calcium in water is incorporated into the guideline value for total hardness.
WHO (2005) suggests a minimum of 20 mg/L Ca. Typical surface water supplies in New Zealand contain about 12 mg/L Ca (about 30 mg/L as CaCO3).
Hardness is included in the plan of work of the rolling revision of the WHO Guidelines for Drinking-water Quality.
The taste threshold for the calcium ion in drinking water varies from 100 to 300 mg/L as CaCO3, depending on the anions present.
The livestock guideline value is 1000 mg/L provided calcium is the dominant cation and dietary phosphorus levels are adequate. In the presence of high concentrations of magnesium and sodium, or if calcium is added to feed as a dietary supplement, the level of calcium tolerable in drinking water may be less (ANZECC/ARMCANZ 2000). These guidelines were to be updated in 2012.
BibliographyANZECC/ARMCANZ (2000). Australian and New Zealand Guidelines for Fresh and Marine
Water Quality. http://www.mfe.govt.nz/publications/water/anzecc-water-quality-guide-02/anzecc-water-quality-guide-02-pdfs.html
APHA (2005). Standard Methods for the Examination of Water and Wastewater (21st Edition). Washington: American Public Health Association, American Water Works Association, Water Environment Federation.
Guidelines for Drinking-water Quality Management for New Zealand, May 2017 15
Datasheets Aesthetic Determinands
DWI (2005). Review of evidence for relationship between incidence of cardiovascular disease and water hardness. 154 pp. http://dwi.defra.gov.uk/research/completed-research/reports/DWI70_2_176_water_hardness.pdf
DWI (2008). A study into the possible association between step changes in water hardness and incidence of cardiovascular disease in the community. Report submitted to the Drinking Water Inspectorate on contract number DWI/70/2/203. 59 pp. http://dwi.defra.gov.uk/research/completed-research/reports/DWI70_2_203_hardness.pdf
WHO (2003). Hardness in drinking-water. Background document for preparation of WHO Guidelines for Drinking-water Quality. Geneva, World Health Organization (WHO/SDE/WSH/03.04/06). http://www.who.int/water_sanitation_health/dwq/chemicals/hardness/en/
WHO (2004). Guidelines for Drinking-water Quality (3rd Ed.). Geneva: World Health Organization. Available at: www.who.int/water_sanitation_health/dwq/gdwq3/en/print.html see also the addenda
WHO (2005). Nutrients in Drinking-water. WHO/SDE/WSH/05.09, 210 pp. See Chapter 12: Health Risks from Drinking Demineralised Water. This is available on the internet at www.who.int/water_sanitation_health/dwq/nutrientsindw.pdf and select Chapter 12.
WHO (2009a). Calcium and Magnesium in Drinking-water: Public health significance. ISBN 978 92 4 156355 0. Geneva: World Health Organization. 194 pp. See: http://www.who.int/water_sanitation_health/publications/publication_9789241563550/en/print.html or http://whqlibdoc.who.int/publications/2009/9789241563550_eng.pdf
WHO (2009b). Hardness in Drinking-water. Background document for development of WHO Guidelines for Drinking-water Quality. Geneva: World Health Organization. 16 pp. WHO/HSE/WSH/09.01/10. See: http://www.who.int/water_sanitation_health/dwq/chemicals/hardness/en/index.html
WHO (2011). Guidelines for Drinking-water Quality 2011 (4th Ed.). Geneva: World Health Organization. Available at: http://www.who.int/water_sanitation_health/publications/2011/dwq_guidelines/en/index.html
Guidelines for Drinking-water Quality Management for New Zealand, May 2017 16

Datasheets Aesthetic Determinands
CHLORIDE (Cl-)
Description and CharacteristicsChloride is widely distributed in nature, generally in the forms of sodium, potassium, and calcium salts. It constitutes approximately 0.05% of the earth’s crust, but the greatest amount of chloride in the environment is present in the oceans.
The presence of chloride in natural waters can be attributed to dissolution of salt deposits, discharges of effluents from chemical industries, sewage discharges, irrigation drainage, contamination from refuse leachates, seawater intrusion in coastal areas, and in some countries contamination resulting from the salting of roads to control ice and snow and oil well operation. A high chloride content may be damaging to metallic pipes and structures as well as being harmful to growing plants. The chloride content of rainwater can exceed 20 mg/L, especially in windy coastal areas.
Seawater infiltration into groundwater or surface water can often be detected by comparing chloride-to-sulphate ratios. The concentration of chloride in seawater is about 19,000 mg/L.
A high chloride content can accelerate corrosion processes, particularly the pitting of steel, and if the chloride content is higher than the alkalinity, dezincification of duplex brasses can occur.
Typical Concentrations in Drinking-waterNew Zealand drinking waters typically contain less than 100 mg/L chloride. Typically, NZ surface waters contain 15 – 30 mg/L as Cl. Groundwaters are more variable.
Removal MethodsChloride cannot be removed from drinking water by conventional water treatment processes. It can be removed by distillation or reverse osmosis but these require considerable energy and can be expensive to operate. Desalination using cryoscopic techniques (by freezing) is commonly used in the Middle East.
Analytical MethodsThe chloride concentration in drinking water can be determined by titration with silver nitrate or mercuric nitrate, using colorimetric or potentiometric end point detection. The limit of detection is approximately 1 mg/L. Ion chromatography can also be used with a limit of detection of 0.1 mg/L.
Health ConsiderationsChloride is an essential element for humans and animals. It contributes to the osmotic activity of body fluids. The main source of human exposure to chloride is the addition of salt to food, and the intake from this source is usually greatly in excess of that from drinking-water.
WHO (2003) states: chloride increases the electrical conductivity of water and thus increases its corrosivity. In metal pipes, chloride reacts with metal ions to form soluble salts, thus increasing levels of metals in drinking-water. In lead pipes, a protective oxide layer is built up, but chloride enhances galvanic corrosion. It can also increase the rate of pitting corrosion of metal pipes.
Healthy individuals can tolerate the intake of large quantities of chloride provided that there is a corresponding intake of fresh water. A normal 70 kg human body contains approximately 80 g of chloride. The chloride content in the body is regulated by the kidneys.
Guidelines for Drinking-water Quality Management for New Zealand, May 2017 17
Datasheets Aesthetic Determinands
Little is known about the prolonged intake of large amounts of chloride by humans. High salt intakes have been reported to increase blood pressure but this is attributed to the sodium content rather than chloride.
Guideline ValueBased on aesthetic considerations (taste and corrosion), the chloride concentration in drinking water should not exceed 250 mg/L, the guideline value set in the DWSNZ. The taste threshold of chloride in water is dependent on the associated cation and is in the range of 200 - 300 mg/L for sodium, potassium and calcium chloride. Concentrations in excess of 250 mg/L are increasingly likely to be detected by taste, but some consumers may become accustomed to low levels of chloride-induced taste. This level of chloride in drinking water can also impart taste to some foods and drinks.
The aesthetic objective in Canada is not greater than 250 mg/L. The USEPA (2009/2011) has a secondary drinking water regulation level of 250 mg/L.
The Australian Drinking Water Guidelines (NHMRC, NRMMC 2011) states that based on aesthetic considerations, the chloride concentration in drinking water should not exceed 250 mg/L. No health-based guideline value is proposed for chloride.
WRF (2015) present chloride data with sodium because much of the sensory research in this area was performed on the salt, sodium chloride. Technically, chloride modulates the saltiness of sodium rather than being the primary cause of saltiness. The taste threshold of chloride is reported to vary from 200-300 mg/L and depends on which counter cations are present (e.g., the taste intensity varies as: Na> K> Ca).
BibliographyAPHA (2005). Standard Methods for the Examination of Water and Wastewater (21st Edition).
Washington: American Public Health Association, American Water Works Association, Water Environment Federation.
NHMRC, NRMMC (2011). Australian Drinking Water Guidelines Paper 6 National Water Quality Management Strategy. National Health and Medical Research Council, National Resource Management Ministerial Council, Commonwealth of Australia, Canberra. 1244 pp. http://www.nhmrc.gov.au/guidelines/publications/eh52
USEPA Method 300.1. Determination of Inorganic Anions in Drinking Water by Ion Chromatography. 1997. See http://www.epa.gov/safewater/methods/pdfs/met300.pdf
USEPA (2009). 2009 Edition of the Drinking Water Standards and Health Advisories. US Environmental Protection Agency, Washington, DC. EPA 822-R-09-011. 18 pp. Available at: http://water.epa.gov/action/advisories/health_index.cfm
USEPA (2011). 2011 Edition of the Drinking Water Standards and Health Advisories. US Environmental Protection Agency, Washington, DC. Available at: http://water.epa.gov/action/advisories/health_index.cfm or www.epa.gov/waterscience/
WHO (2003). Chloride in drinking-water. Background document for preparation of WHO Guidelines for Drinking-water Quality. Geneva, World Health Organization (WHO/SDE/WSH/03.04/03). http://www.who.int/water_sanitation_health/dwq/chemicals/chloride/en/
WHO (2004). Guidelines for Drinking-water Quality (3rd Ed.). Geneva: World Health Organization. Available at: www.who.int/water_sanitation_health/dwq/gdwq3/en/print.html see also the addenda
Guidelines for Drinking-water Quality Management for New Zealand, May 2017 18

Datasheets Aesthetic Determinands
WHO (2011). Guidelines for Drinking-water Quality 2011 (4th Ed.). Geneva: World Health Organization. Available at: http://www.who.int/water_sanitation_health/publications/2011/dwq_guidelines/en/index.html
WRF (2015). EPA Secondary Maximum Contaminant Levels: A Strategy for Drinking Water Quality and Consumer Acceptability. Water Research Foundation. 70 pp. http://www.waterrf.org/PublicReportLibrary/4537.pdf
Guidelines for Drinking-water Quality Management for New Zealand, May 2017 19
Datasheets Aesthetic Determinands
2-CHLOROPHENOL
CAS No. 95-57-8. Also called 2-monochlorophenol, ortho-chlorophenol, o-chlorophenol or 2-hydroxy-chlorobenzene. Chlorophenols are sometimes referred to as chlorphenols.
Note: datasheets for 3-chlorophenol and 4-chlorophenol appear in Part 2.2 because they do not have a GV.
Maximum Acceptable ValueThere are insufficient data to set a health based MAV for 2-chlorophenol in drinking-water.
The Australian Drinking Water Guidelines (NHMRC, NRMMC 2011) state that based on aesthetic considerations (taste and odour), the concentration of 2-chlorophenol in drinking water should not exceed 0.0001 mg/L, and 2-chlorophenol would not be a health concern unless concentrations exceeded 0.3 mg/L.
The USEPA (2006/2009/2011) established a lifetime health advisory of 0.04 mg/L, where the lifetime health advisory is the concentration of a chemical in drinking water that is not expected to cause any adverse noncarcinogenic effects for a lifetime of exposure, and is based on exposure of a 70-kg adult consuming 2 litres of water per day. The Lifetime HA for Group C carcinogens includes an adjustment for possible carcinogenicity.
2-Chlorophenol is one of the “priority pollutants” under the US Clean Water Act.
Sources to Drinking-water1. To Source Waters2-Chlorophenol may occur in raw water as an industrial contaminant, or through agricultural activity. It may be used as a precursor for the production of higher chlorophenols and dyestuffs. Chlorophenols are used commercially as preservatives, moth-proofing agents, germicides and anti-mildew agents.
2. From Treatment ProcessesChlorophenols are most likely to occur in drinking-water as disinfection by-products through the reaction of naturally-occurring organic matter with chlorine, or due to the chlorination of water containing phenolic compounds from industrial discharge.
3. From the Distribution SystemNo known sources.
Form and Fate in the EnvironmentBecause 2-chlorophenol is water-soluble (about 2%), weakly acidic, and has a low vapour pressure, it is anticipated that volatilisation does not play a significant role in removing it from water. Photolytic breakdown of dilute solutions of monochlorophenols has been reported. Sorption is not significant for monochlorophenols. Biodegradation appears to be the primary removal mechanism of chlorinated phenols from surface waters. Aquatic biota may bioconcentrate chlorinated phenols, with bioconcentration factors increasing with increasing chlorine substitution.
Aerobic micro-organisms in clay loam soils were able to degrade most of the 2-chlorophenol present (100 mg/kg) within a few days (IPCS 1989).
Guidelines for Drinking-water Quality Management for New Zealand, May 2017 20
Datasheets Aesthetic Determinands
If released to soil, Koc values of 51 in clay loam soil and 398 in soil indicate that 2-chlorophenol will exhibit high to moderate mobility depending on soil type. Volatilisation of the neutral species from moist soil surfaces is expected to be an important fate process based upon a Henry's Law constant of 1.12 x 10⁻⁵ atm-cu m/mole. 2-Chlorophenol may volatilise from dry soil surfaces based upon its vapour pressure. However, in conditions where 2-chlorophenol may bind strongly to soil, adsorption to soil is expected to attenuate volatilisation. Biodegradation of 94% after 6.5 hrs, 100% after 14-47 days and 67% after 10 days indicate that biodegradation of 2-chlorophenol in soil may be an important fate process. If released into water, 2-chlorophenol is expected to adsorb to suspended solids and sediment based upon the measured Kocs of 3,981 and 5,012 in course and fine sediment, respectively. Biodegradation of 2-chlorophenol in water may be an important fate process based upon reported complete losses in 10-36 days. Volatilisation of the neutral species from water surfaces is expected to be an important fate process based on its Henry's Law constant. Estimated volatilisation half-lifes for a model river and model lake are 2.5 days and 31 days, respectively. However, in conditions where 2-chlorophenol may bind strongly to suspended solids and sediments, volatilisation from water surfaces is expected to be attenuated by adsorption in the water column. A BCF range of 6-214 suggests bioconcentration in aquatic organisms will be low to high depending on the species. Hydrolysis is not expected to be an important environmental fate process since this compound lacks functional groups that hydrolyse under environmental conditions. EAWAG (accessed Feb 2015).
Typical Concentrations in Drinking-waterOnly a few samples contained in the 1992 review of organic contaminants in New Zealand drinking-water supplies were analysed for 2-chlorophenol. All concentrations reported were below the detection limit of 0.01 mg/L.
IPCS (1989) reports a study of 40 Canadian water supplies where the maximum concentration of 2-chlorophenol was 0.00007 mg/L.
The maximum concentration found in 4822 samples from 1641 groundwaters in the UK was 0.0019 mg/L, mean 0.00004 mg/L (DWI 2008).
Removal MethodsChlorophenols can be removed from contaminated source waters by adsorption on to activated carbon. The effectiveness of the processes is pH dependent. Greater adsorption occurs as the pH is lowered.
However, as this compound arises in New Zealand waters principally during water treatment as a disinfection by-product, the preferred method for minimising its formation is to reduce the concentration of natural organic matter (NOM) coming into contact with the chlorine.
Removal of NOM can be achieved by coagulation/flocculation with aluminium or iron salts. In some cases, adequate removal of NOM may be attained using organic polyelectrolytes as coagulants. NOM can also be removed by adsorption on to activated carbon, activated alumina, or ion exchange resins, however these methods are generally more expensive than coagulation.
Some reduction in disinfection by-product formation can be achieved by introducing the disinfectant into the water after the water has passed through all treatment steps, i.e. avoiding prechlorination wherever possible.
Chlorinated disinfection by-product formation can be reduced by the use of an alternative disinfectant such as ozone or chlorine dioxide, although these too have their associated disinfection
Guidelines for Drinking-water Quality Management for New Zealand, May 2017 21

Datasheets Aesthetic Determinands
by-products. The formation of chlorophenols can be reduced by the use of chlorine dioxide in place of chlorine.
Where minimising disinfection by-product formation cannot reduce the concentration of disinfection by-products to a satisfactory level, methods to remove the disinfection by-products themselves may be considered. Chlorophenols can be removed by adsorption on to activated carbon. The effectiveness of the processes is pH dependent. Greater adsorption occurs as the pH is lowered.
Note that the application of chlorine-containing disinfectants to activated carbon adsorbers should be avoided because of the unknown health effects of compounds formed through surface reactions between adsorbed contaminants and the disinfectants.
Analytical MethodsReferee MethodA referee method cannot be selected for 2-chlorophenol because a MAV has not been established and therefore the sensitivity required for the referee method is not known.
Some Alternative MethodsNo alternative methods can be recommended for 2-chlorophenol for the above reason. However, the following information may be useful:
1. Chlorophenols in water can be solvent extracted with dichloromethane (Method APHA 6410) and analysed by gas chromatography with mass spectrometry detection (Method APHA 6410 or EPA 8270). The detection limit for this method is 0.003 mg/L (3 mg/L). Interference may come from contaminated reagents or glassware.
2 A more sensitive and specific method of analysis for chlorophenols is to solvent extract with dichloromethane and derivatise with pentafluorobenzyl ether and analyse by gas chromatography with electron capture detection (Method EPA 604 or APHA 6420B). The limit of quantification for this method is 0.0006 mg/L (0.6 mg/L). The specificity of this method reduces the likelihood of interferences.
Health ConsiderationsChlorophenols are well-absorbed after oral administration and they readily penetrate the skin. Chlorophenols do not appear to accumulate in body tissues in rats but are rapidly metabolised and eliminated from the body, principally in urine. Exposure to chlorophenols via tap water has been estimated to be less than 10% of total dietary exposure.
There is a limited data base on the toxicity of 2-chlorophenol. One study which exposed rats to 50 mg/kg body weight per day for 10 weeks reported treatment related increases in conception rate, an increase in the number of still births and a decrease in the size of the litters. The three monochlorophenols are expected to have similar toxicity characteristics.
IARC considers chlorophenols as a group to have limited evidence for human carcinogenicity (group 2B). It has been suggested that 2-chlorophenol is a co-carcinogen.
The reference dose or RfD (USEPA 1993/2006/2009/2011) is 0.005 mg/kg/d. The Drinking Water Equivalent Level or DWEL (USEPA 2006/2009/2011) is 0.2 mg/L.
Derivation of Maximum Acceptable Value
Guidelines for Drinking-water Quality Management for New Zealand, May 2017 22
Datasheets Aesthetic Determinands
Because of the limited data base on the toxicity of 2-chlorophenol, no health-based MAV has been derived.
Chlorophenols generally have very low taste and odour thresholds. The DWSNZ include a Guideline Value of 0.0001 mg/L for 2-chlorophenol. The taste threshold in water for 2-chlorophenol is 0.0001 mg/L and its odour threshold is 0.01 mg/L (WHO 2003); Young et al (1996) reported them at about 0.00014 and 0.000088 mg/L respectively. Micro-organisms in distribution systems may sometimes methylate chlorophenols to produce chlorinated anisoles, for which the odour threshold is considerably lower.
The USEPA established an organoleptic effect criterion of 0.0001 mg/L for 2-chlorophenol. Source: Quality Criteria for Water, 1986 ("Gold Book"), http://www.epa.gov/wqc/national-recommended-water-quality-criteria-organoleptic-effects
The Minnesota Department of Health (MDH) has developed health-based rules and guidance to evaluate potential human health risks from exposures to chemicals in groundwater. The chronic health risk limit (exposure greater than 10% of a lifetime) for 2-chlorophenol is 0.03 mg/L.
BibliographyAPHA (2005). Standard Methods for the Examination of Water and Wastewater (21st Edition).
Washington: American Public Health Association, American Water Works Association, Water Environment Federation.
ATSDR (1999). Toxicological Profile for Chlorophenols. Agency for Toxic Substances & Disease Registry, Dept of Health and Human Services. Atlanta, GA. 260 pp. See: http://www.atsdr.cdc.gov/toxprofiles/index.asp
AWWA (1990). Water Quality and Treatment. 4th Edition, Ed. F.W. Pontius, McGraw and Hill.DWI (2008). Review of England and Wales Monitoring Data for which a National or International
Standard Has Been Set. DEFRA Project Code: CEER 0703 DWI 70/2/215 WT1207. 148 pp. http://dwi.defra.gov.uk/research/completed-research/reports/DWI70_2_215_Monitoring_Data.pdf
EAWAG (accessed Feb 2015). Biocatalysis/Biodegradation Database. Select 1396 compounds. http://eawag-bbd.ethz.ch/index.html
Environment Agency (1998). The assessment of taste, odour and related aesthetic problems in drinking waters 1998. Methods for the Examination of Waters and Associated Materials. EA Standing Committee of Analysts, London. Available at: www.environment-agency.gov.uk/static/documents/Research/171_taste__odour_in_water.pdf
Health Canada. Guidelines for Canadian Drinking Water Quality – Supporting Documents. See http://www.hc-sc.gc.ca/home-accueil/search-recherche/a-z-eng.php
IPCS (1989). Chlorophenols other than pentachlorophenol. Environmental Health Criteria 93. INCHEM. International Programme on Chemical Safety. See: http://www.inchem.org/documents/ehc/ehc/ehc093.htm
MDH (2009). Groundwater Values Table. Minnesota Department of Health (MDH). See: http://www.health.state.mn.us/divs/eh/risk/guidance/gw/table.html
NHMRC, NRMMC (2011). Australian Drinking Water Guidelines Paper 6 National Water Quality Management Strategy. National Health and Medical Research Council, National Resource Management Ministerial Council, Commonwealth of Australia, Canberra. 1244 pp. http://www.nhmrc.gov.au/guidelines/publications/eh52
Organic Contaminants in New Zealand Potable Water Supplies. Report to Department of Health, NZ, 1992.
Guidelines for Drinking-water Quality Management for New Zealand, May 2017 23
Datasheets Aesthetic Determinands
USEPA (1993). 2-Chlorophenol. Integrated Risk Information System (IRIS). http://www.epa.gov/iris/subst/0303.htm
USEPA (2006). 2006 Edition of the Drinking Water Standards and Health Advisories. US Environmental Protection Agency, Washington, DC. EPA 822-R-06-013. Available at: http://water.epa.gov/action/advisories/health_index.cfm
USEPA (2009). 2009 Edition of the Drinking Water Standards and Health Advisories. US Environmental Protection Agency, Washington, DC. EPA 822-R-09-011. Available at: http://water.epa.gov/action/advisories/health_index.cfm
USEPA (2011). 2011 Edition of the Drinking Water Standards and Health Advisories. US Environmental Protection Agency, Washington, DC. Available at: http://water.epa.gov/action/advisories/health_index.cfm or www.epa.gov/waterscience/
WHO (2003). Chlorophenols in drinking-water. Background document for preparation of WHO Guidelines for Drinking-water Quality. Geneva, World Health Organization (WHO/SDE/WSH/03.04/47). http://www.who.int/water_sanitation_health/dwq/chemicals/chlorophenols/en/
WHO (2004). Guidelines for Drinking-water Quality 2004 (3rd Ed.). Geneva: World Health Organization. Available at: www.who.int/water_sanitation_health/dwq/gdwq3/en/print.html see also the addenda
WHO (2011). Guidelines for Drinking-water Quality 2011 (4th Ed.). Geneva: World Health Organization. Available at: http://www.who.int/water_sanitation_health/publications/2011/dwq_guidelines/en/index.html
Young, W.F., Horth, H., Crane, R., Ogden, T. and M. Arnott (1996). Taste and odor threshold concentrations of potable water contaminants. Water Research, 30, pp 331–340.
Guidelines for Drinking-water Quality Management for New Zealand, May 2017 24

Datasheets Aesthetic Determinands
COLOUR
Description and CharacteristicsTwo terms are used to describe colour.
1. “True Colour” is the colour of water from which the turbidity has been removed, usually by filtration through 0.45 micron pore size filter.
2. “Apparent Colour” is what one actually sees; it is the colour resulting from the combined effect of true colour and any particulate matter. In turbid waters, the true colour is substantially less than the apparent colour.
Apparent colour may result from atmospheric or microbial oxidation of iron and manganese to insoluble hydroxides that precipitate, giving colour (red, brown and black waters), humus and peat materials, plankton, weeds and industrial wastes (e.g. dyeing operations, electroplating, paper manufacturing).
The dissolution of metals from pipes and fittings can also discolour drinking water. Badly corroded iron pipes can produce a red/brown colour whereas corrosion of copper pipes can produce a blue-green colour.
Colour is measured in Hazen Units (HU) or True Colour Units (TCU) - see Measurement Techniques. A true colour of 15 HU can be detected in a glass of water, and a true colour of 5 HU can be seen in larger volumes or depths of water, for instance in a white bath or basin.
WHO (2011) states that drinking-water should ideally have no visible colour.
WRF (2015) considers colour not to be an issue these days; in a recent literature search they could only find one citation in the drinking water literature, and that was dated 1992.
Typical Concentrations in Drinking-waterValues of true colour in New Zealand drinking waters range from 0 to 40 HU, however most are between 0 and 5 HU.
Removal MethodsConstituents of natural colour derived from humic and fulvic acids can be reduced by coagulation and flocculation followed by filtration. Oxidation of organics by chlorine or ozone will also reduce colour but may produce undesirable by-products. Colour derived from natural organic matter should be removed prior to chlorination to prevent the production of disinfection by-products.
Consumption of disinfectants by reaction with naturally occurring humic and fulvic material can also cause difficulties in maintaining an adequate level of disinfectant, thus creating the opportunity for microbiological regrowth.
Analytical MethodsTrue colour can be measured either spectrophotometrically or using visual comparison. In both cases, the standard unit of measurement is Hazen Units (HU). (True colour is often quoted as True Colour Units; however the numerical values are identical). Hazen Units are defined in terms of a platinum-cobalt standard. This standard was developed for the analysis of colour in natural waters with a yellow-brown appearance, and is not applicable to waters with “different” colours, such as blue copper-containing waters.
Guidelines for Drinking-water Quality Management for New Zealand, May 2017 25

Datasheets Aesthetic Determinands
Colour measurements can be made in the field or in a treatment plant laboratory for process control purposes, using platinum-cobalt calibrated visual comparator discs, or using the standard platinum-cobalt solutions directly for comparison. Ideally samples should be passed through a 0.45 micron pore size filter before comparison, especially if turbidity is present.
Visual colour measurement can be rather subjective and those using the method should be screened for their ability to see the colours in a reasonably quantitative manner. The spectrophotometric method is not really suited to drinking-water.
There can be a relationship between natural organic matter measured by UV absorbance and colour measured visually. The relationship tends to be source-specific. UV absorbance is a quick, cheap and reliable test. The datasheet for UV absorbance includes a graph showing the relationship between colour and UV absorbance found in the UK.
Health ConsiderationsColour in natural waters is generally related to organic content, and while the colour derived from natural sources such as humic and fulvic acids is not of health significance, disinfection of such a water can produce a variety of toxic or carcinogenic organic compounds as by-products. If the colour is high at the time of disinfection, then the water should be checked for disinfection by-products. Low colour at the time of disinfection does not necessarily mean that the concentration of disinfection by-products will be low. Some natural organic precursors to disinfection by-products are not detected by this colour measurement.
A high colour content will increase the dose required for satisfactory UV disinfection (see UV absorbance datasheet).
Unattractive coloured water may prompt people to seek other, perhaps less safe, sources of drinking water.
Guideline ValueFor appearance reasons, true colour in drinking water should not exceed 10 Hazen Units (HU) or true colour units (TCU), the guideline value set in the DWSNZ. The aesthetic objective in Canada is not greater than 15 TCU or less.
The USEPA (2009/2011) has a secondary drinking water regulation level of 15 colour units.
The Australian Drinking Water Guidelines (NHMRC, NRMMC 2011) state that based on aesthetic considerations, true colour in drinking water should not exceed 15 HU. Colour is an important aesthetic parameter for customer acceptance.
The Prescribed Concentration or Value (PCV) for colour in England and Wales is 20 mg/L on the Pt/Co scale. See Notes.
BibliographyAPHA (2005). Standard Methods for the Examination of Water and Wastewater (21st Edition).
Washington: American Public Health Association, American Water Works Association, Water Environment Federation.
NHMRC, NRMMC (2011). Australian Drinking Water Guidelines Paper 6 National Water Quality Management Strategy. National Health and Medical Research Council, National
Guidelines for Drinking-water Quality Management for New Zealand, May 2017 26
Datasheets Aesthetic Determinands
Resource Management Ministerial Council, Commonwealth of Australia, Canberra. 1244 pp. http://www.nhmrc.gov.au/guidelines/publications/eh52
USEPA (2009). 2009 Edition of the Drinking Water Standards and Health Advisories. US Environmental Protection Agency, Washington, DC. EPA 822-R-09-011. 18 pp. Available at: http://water.epa.gov/action/advisories/health_index.cfm
USEPA (2011). 2011 Edition of the Drinking Water Standards and Health Advisories. US Environmental Protection Agency, Washington, DC. Available at: http://water.epa.gov/action/advisories/health_index.cfm or www.epa.gov/waterscience/
WHO (2011). Guidelines for Drinking-water Quality 2011 (4th Ed.). Geneva: World Health Organization. Available at: http://www.who.int/water_sanitation_health/publications/2011/dwq_guidelines/en/index.html
WRF (2015). EPA Secondary Maximum Contaminant Levels: A Strategy for Drinking Water Quality and Consumer Acceptability. Water Research Foundation. 70 pp. http://www.waterrf.org/PublicReportLibrary/4537.pdf
Guidelines for Drinking-water Quality Management for New Zealand, May 2017 27

Datasheets Aesthetic Determinands
CONDUCTIVITY
Description and CharacteristicsConductivity is a measure of the ability of an aqueous solution to carry an electric current. This ability depends on the presence of ions, their total concentration, mobility, and valence, and on the temperature of measurement. Solutions of most inorganic compounds are relatively good conductors. Conversely, molecules of organic compounds that do not dissociate in aqueous solution conduct a current very poorly, if at all.
Using the International System of Units (SI), conductivity has the units millisiemens per metre (mS/m). Refer to Appendix 1 in the DWSNZ for other units of measurement, and conversion rates.
Conductivity is an analytical tool, most often used to approximate total dissolved solids (TDS). Total dissolved solids (mg/L) in a sample can be estimated by multiplying conductivity (in mS/m) by an empirical factor. This factor may vary from 5.5 to 7, but higher values up to 9.6 may be associated with waters high in sulphate. The relationship is also distorted in samples with a high silica content, e.g. many NZ groundwaters.
Typical Concentrations in Drinking-waterThe conductivities of New Zealand water supplies range up to 100 mS/m, but are typically between 3 - 30 mS/m.
Removal MethodsAny reduction in conductivity is associated with treatment of water supplies to remove specific cations and anions.
Analytical MethodsConductance of a solution is measured between two spatially fixed and chemically inert electrodes. To avoid polarisation at the electrode surfaces the conductance measurement is made with an alternating current signal. The conductance of a solution is directly proportional to the electrode surface area, and inversely proportional to the distance between the electrodes.
In the laboratory, conductance of a standard potassium chloride (KCl) solution is measured and the corresponding conductivity is calculated.
An instrument capable of measuring conductivity with an error not exceeding 1% or 0.1 mS/m, whichever is greater should be used. The water sample being tested should be warmed to 25°C (usually) or a temperature correction should be made to record the equivalent conductivity at 20 oC or 25oC; some instruments have an automatic adjustment or compensator. This temperature must be included with the test result. Reporting conductivity without the temperature of measurement changes an otherwise normally accurate and precise result into no more than an approximation.
The conductivity of a sample can be estimated, or the estimation technique can be used as a quality assurance step in the measurement of conductivity. Conductivity can also be included as a step in the ion balance check (APHA 2005, section 1030E).
Health ConsiderationsConductivity reflects the presence of ions capable of carrying an electric current. The types of ions present and their concentrations will determine the effect of a high conductivity value. Any health consideration should consider the specific ion(s) rather than the conductivity measurement itself.
Guidelines for Drinking-water Quality Management for New Zealand, May 2017 28

Datasheets Aesthetic Determinands
Guideline ValueAlthough there is no guideline value for conductivity, this datasheet has been prepared because conductivity can usually be measured more easily, quickly and cheaply than total (dissolved) solids. See APHA and the Guidelines for a discussion on the relationship between the two.
The Prescribed Concentration or Value (PCV) for conductivity in England and Wales is 2500 µS/cm at 20°C. See Notes.
BibliographyAPHA (2005). Standard Methods for the Examination of Water and Wastewater (21st Edition).
Washington: American Public Health Association, American Water Works Association, Water Environment Federation.
WHO (2011). Guidelines for Drinking-water Quality 2011 (4th Ed.). Geneva: World Health Organization. Available at: http://www.who.int/water_sanitation_health/publications/2011/dwq_guidelines/en/index.html
Guidelines for Drinking-water Quality Management for New Zealand, May 2017 29
Datasheets Aesthetic Determinands
2,4-DICHLOROPHENOL
CAS No. 120-83-2. Also called 2,4-DCP or 2,4-dichlorophenic acid. Dichlorophenols are sometimes referred to as dichlorphenols.
Maximum Acceptable ValueThe WHO considers that there are insufficient data to set a health based MAV for 2,4-dichlorophenol in drinking-water.
The USEPA (2006/2009/2011) established a lifetime health advisory of 0.02 mg/L, where the lifetime health advisory is the concentration of a chemical in drinking water that is not expected to cause any adverse noncarcinogenic effects for a lifetime of exposure, and is based on exposure of a 70-kg adult consuming 2 litres of water per day. The Lifetime HA for Group C carcinogens includes an adjustment for possible carcinogenicity.
2,4-Dichlorophenol is one of the “priority pollutants” under the US Clean Water Act.
2,4-Dichlorophenol is the predominant dichlorophenol. Five others exist:2,3-dichlorophenol, CAS No. 576-24-9.2,5-dichlorophenol, CAS No. 593-78-8.2,6-dichlorophenol, CAS No. 87-65-0.3,4-dichlorophenol, CAS No. 95-77-2.3,5-dichlorophenol, CAS No. 591-35-5.
Although 2,4-dichlorophenol is the only dichlorophenol with a GV in the DWSNZ, the others can impart tastes and odours too, so some information about them is included in this datasheet.
Sources to Drinking-water1. To Source Waters2,4-Dichlorophenol may occur in raw water as a result of its use as a pesticide, either directly or due to degradation products. It may be used as a mothproofing agent, germicide and antiseptic, or in the production of the pesticide 2,4-D and 2,4,5-T. Of all the chlorophenols, 2,4-dichlorophenol is probably produced in the greatest quantity.
The sex pheromone, 2,6-dichlorophenol, has been combined with a pesticide to control populations of the American dog tick.
2,6-Dichlorophenol was the most frequently found dichlorophenol in the River Rhine in the 1970s (65 - 75% of all samples). 3,4-Dichlorophenol was the least common (about 1%). The others were found in 10 - 50% of samples. Concentrations were generally <0.001 mg/L.
Technical grade chlorophenols are heterogeneous mixtures of chlorophenol congeners, unreacted precursors, and a variety of dimeric microcontaminants. For example, technical 2,4-dichlorophenol contained on average, 92.24% 2,4-dichlorophenol, 4.48% 2,6-dichlorophenol, 1.24% 2,4,6-trichlorophenol, 1.09% 2-chlorophenol, and 0.46% 4-chlorophenol (IPCS 1989).
2. From Treatment ProcessesChlorophenols are most likely to occur in drinking-water as disinfection by-products through the reaction of naturally-occurring organic matter (mainly phenolic) with chlorine, or with industrially sourced phenols.
Guidelines for Drinking-water Quality Management for New Zealand, May 2017 30
Datasheets Aesthetic Determinands
3. From the Distribution SystemNo known sources.
Form and Fate in the EnvironmentBecause 2,4-dichlorophenol is quite water-soluble (4000 – 5000 mg/L), weakly acidic, and has a low vapour pressure, it is anticipated that volatilisation does not play a significant role in removing it from water. Photolysis of dichlorophenols appears to be minimal. Sorption is not significant for dichlorophenols. Biodegradation appears to be the primary removal mechanism of chlorinated phenols from surface waters. The dichlorophenols break down fairly quickly in aerobic soil and water, but are persistent in anaerobic conditions. Aquatic biota may bioconcentrate chlorinated phenols with bioconcentration factors increasing with increasing chlorine substitution.
The half-life of 2,4-dichlorophenol (DT50) in soil is 7 days, water sediment systems 104 days, water 104 days, and sediment 104 days; EFSA (2014).
If released to soil, 2,4-dichlorophenol is expected to have low to moderate mobility based upon Koc values of 263, 661, and 708. The pKa of 2,4-dichlorophenol is 7.89, indicating that this compound will partially exist in the anion form in the environment and anions generally do not adsorb more strongly to soils containing organic carbon and clay than their neutral counterparts. Volatilisation from moist soil surfaces is expected to be an important fate process based upon an estimated Henry's Law constant of 3.5 x 10⁻⁶ atm-cu m/mole. Volatilisation from dry soil surfaces should not be important given the vapour pressure of this compound. At 0-4°C, 79-82% of initial 2,4-dichlorophenol was degraded in a clay loam soil during 12-14 days of aerobic incubation, suggesting that biodegradation may be an environmental fate process in soil. If released into water, 2,4-dichlorophenol is expected to adsorb to suspended solids and sediment in water based on the Koc. Using a freshwater inoculum, 39-84% degradation was observed in 40 days (35-60% degraded in sterile controls), suggesting that biodegradation is not an important environmental fate process in water. Volatilisation from water surfaces may be an important fate process based on its Henry's Law constant. Estimated half-lifes from a model river and model lake are 14 days and 103 days, respectively. The pKa indicates 2,4-dichlorophenol will exist partially in the anion form which may affect its transport and reactivity in water and sediment. A BCF range of 7.1 to 69 in carp suggests bioconcentration in aquatic organisms is low to moderate. Hydrolysis is not expected to be an important environmental fate process since this compound lacks functional groups that hydrolyse under environmental conditions. EAWAG (accessed Feb 2015).
If released to soil, 2,5-dichlorophenol is expected to have low mobility based upon a Koc of 600. The pKa of 2,5-dichlorophenol is 7.51, indicating that this compound will partially exist in the anion form and anions generally do not adsorb more strongly to soils containing organic carbon and clay than their neutral counterparts. Volatilisation from moist soil surfaces is expected to be an important fate process based upon an estimated Henry's Law constant of 6.03 x 10⁻⁶ atm-cu m/mole. 2,5-Dichlorophenol is not expected to volatilise from dry soil surfaces based upon its vapour pressure of 0.056 mm Hg. A 5% of theoretical BOD using activated sludge in the Japanese MITI test suggests that biodegradation is not an important environmental fate process. If released into water, 2,5-dichlorophenol is expected to adsorb to suspended solids and sediment based upon the Koc of 600. Volatilisation from water surfaces is expected to be an important fate process based on its estimated Henry's Law constant. Estimated volatilisation half-lifes for a model river and model lake are 8 and 61 days, respectively. A BCF range of 4 - 35 suggests bioconcentration in aquatic organisms is low. Hydrolysis is not expected to be an important environmental fate process since this compound lacks functional groups that hydrolyse under environmental conditions. EAWAG (accessed Feb 2015).
Guidelines for Drinking-water Quality Management for New Zealand, May 2017 31
Datasheets Aesthetic Determinands
Typical Concentrations in Drinking-waterNo data are available on the concentration of 2,4-dichlorophenol in New Zealand drinking-water supplies.
2,4-Dichlorophenol was the most commonly found dichlorophenol in Canadian drinking-waters. A Canadian study of 40 water supplies found 2,4-dichlorophenol at levels up to 0.000072 mg/L (72 ng/L or 0.072 mg/L) in chlorinated supplies, and 2,6-dichlorophenol at levels up to 0.000033 mg/L (33 ng/L or 0.033 mg/L).
The maximum concentration of 2,4-dichlorophenol found in 3209 samples from 1450 groundwaters in the UK was 0.0008 mg/L, mean 0.00004 mg/L (DWI 2008).
Removal MethodsChlorophenols can be removed from contaminated source water by adsorption on to activated carbon. The effectiveness of the process is pH dependent. Greater adsorption occurs as the pH is lowered.
However, as these compounds arise in New Zealand waters principally as disinfection by-products, the preferred method for minimising their formation is to reduce the concentration of natural organic matter (NOM) coming into contact with the chlorine.
Removal of NOM can be achieved by coagulation/flocculation with aluminium or iron salts. In some cases, adequate removal of NOM may be attained using organic polyelectrolytes as coagulants. NOM can also be removed by adsorption on to activated carbon, activated alumina, or ion exchange resins, however these methods are generally more expensive than coagulation.
Some reduction in disinfection by-product formation can be achieved by introducing the disinfectant into the water after the water has passed through all treatment steps, i.e. avoiding prechlorination wherever possible.
Chlorinated disinfection by-product formation can be reduced by the use of an alternative disinfectant such as ozone or chlorine dioxide, although these too have their associated disinfection by-products. The formation of chlorophenols can be reduced largely by the use of chlorine dioxide in place of chlorine.
Where minimising disinfection by-product formation cannot reduce the concentration of disinfection by-products to a satisfactory level, methods to remove the disinfection by-products themselves may be considered, e.g. adsorption on to activated carbon, or superchlorination.
Note that the application of chlorine-containing disinfectants to activated carbon adsorbers should be avoided because of the unknown health effects of compounds formed through surface reactions between adsorbed contaminants and the disinfectants.
Analytical MethodsReferee MethodA referee method cannot be selected for 2,4-dichlorophenol because a MAV has not been established and therefore the sensitivity required for the referee method is not known.
Some Alternative MethodsNo alternative methods can be recommended for 2,4-dichlorophenol because a MAV has not been established. However, the following information may be useful:
Guidelines for Drinking-water Quality Management for New Zealand, May 2017 32

Datasheets Aesthetic Determinands
1. Chlorophenols in water can be solvent extracted with dichloromethane (Method APHA 6410) and analysed by gas chromatography with mass spectrometry detection (Method APHA 6410 or EPA 8270). The method detection limit is 0.003 mg/L (3 mg/L). Interference may come from contaminated reagents or glassware.
2. A more sensitive and specific method of analysis for chlorophenols is to solvent extract with dichloromethane and derivatise with pentafluorobenzyl ether and analyse by gas chromatography with electron capture detection (Method EPA 604 or APHA 6420). The limit of quantification for this method is 0.0007 mg/L (0.7 mg/L). The specificity of this method reduces the likelihood of interferences.
Health ConsiderationsChlorophenols are well-absorbed after oral administration and they readily penetrate the skin. Chlorophenols do not appear to accumulate in body tissues in rats but are rapidly metabolised and eliminated from the body, principally in urine.
There is a limited database on the toxicity of 2,4-dichlorophenol. Long-term studies over two years could not determine any dose-related effects using 2,4-dichlorophenol.
IARC considers there is evidence suggesting lack of carcinogenicity of 2,4-dichlorophenol in experimental animals, and that combined exposures to polychlorophenols or to their sodium salts are possibly carcinogenic to humans (Group 2B). Feeding rats and mice high doses of 2,4-dichlorophenol for a long time did not cause cancer. Limited tests have reported no evidence of mutagenicity or carcinogenicity.
As at July 2013 ATSDR (http://www.atsdr.cdc.gov/mrls/mrls_list.html) quotes a minimal risk level (MRL) of 0.003 mg/kg/day for intermediate-duration oral exposure (15 – 364 days) to 2,4-dichlorophenol.
The reference dose or RfD (USEPA 1988/2006/2009/2011) is 0.003 mg/kg/d. The Drinking Water Equivalent Level or DWEL (USEPA 2006/2009/2011) is 0.1 mg/L.
Derivation of Maximum Acceptable ValueBecause of the limited data base on the toxicity of 2,4-dichlorophenol, no health-based MAV has been derived by the WHO.
The Australian Drinking-water Guidelines (NHMRC, NRMMC 2011) have a health value of 0.2 mg/L for 2,4-dichlorophenol.
In Canada the maximum acceptable concentration is 0.9 mg/L on the basis of division of the NOAEL or lowest-observed-adverse-effect level (LOAEL) in an animal species by an uncertainty factor. For 2,4-DCP, the acceptable daily intake (ADI) is derived as follows:
where: - 100 mg/kg bw per day is the NOAEL observed in the only available subchronic (six months) feeding study,11 which suffered from methodological limitations
Guidelines for Drinking-water Quality Management for New Zealand, May 2017 33
Datasheets Aesthetic Determinands
- 1000 is the uncertainty factor (×10 for less-than-lifetime study and limitations in study design; ×10 for intraspecies variation; and ×10 for interspecies variation).
Their maximum acceptable concentration (MAC) is based on:
where:
- 0.1 mg/kg bw per day is the ADI, as derived above - 70 kg is the average body weight of an adult - 0.20 is the proportion of total daily intake ingested in drinking water - 1.5 L/d is the average daily consumption of drinking water for an adult.
The DWSNZ include a Guideline Value for 2,4-dichlorophenol: the taste and odour thresholds are 0.0003 mg/L and 0.04 mg/L respectively.
The USEPA established organoleptic effect criteria as follows. Source: Quality Criteria for Water, 1986 ("Gold Book"), http://www.epa.gov/wqc/national-recommended-water-quality-criteria-organoleptic-effects
2,3-dichlorophenol – 0.00004 mg/L2,4-dichlorophenol – 0.0003 mg/L2,5-dichlorophenol – 0.0005 mg/L2,6-dichlorophenol – 0.0002 mg/L3,4-dichlorophenol – 0.0003 mg/L.
IPCS (1989) reports organoleptic levels in drinking water of:2,3-dichlorophenol – 0.00004 mg/L2,4-dichlorophenol – 0.0003 to 0.008 mg/L2,5-dichlorophenol – 0.0005 mg/L2,6-dichlorophenol – 0.0002 to 0.002 mg/L3,4-dichlorophenol – 0.0003 mg/L.
The Australian Drinking Water Guidelines (NHMRC, NRMMC 2011) state that based on aesthetic considerations, the concentration of 2,4-dichlorophenol in drinking water should not exceed 0.0003 mg/L (taste and odour), and 2,4-dichlorophenol would not be a health concern unless its concentration exceeded 0.2 mg/L.
Health Canada established an aesthetic objective for 2,4-dichlorophenol of 0.0003 mg/L based on odour; levels above the AO would render drinking water unpalatable.
The Minnesota Department of Health (MDH) has developed health-based rules and guidance to evaluate potential human health risks from exposures to chemicals in groundwater. The chronic health risk limit (exposure greater than 10% of a lifetime) for 2,4-dichlorophenol is 0.02 mg/L.
BibliographyAPHA (2005). Standard Methods for the Examination of Water and Wastewater (21st Edition).
Washington: American Public Health Association, American Water Works Association, Water Environment Federation.
Guidelines for Drinking-water Quality Management for New Zealand, May 2017 34

Datasheets Aesthetic Determinands
ATSDR (1999). Toxicological Profile for Chlorophenols. Agency for Toxic Substances & Disease Registry, Dept of Health and Human Services. Atlanta, GA. See: http://www.atsdr.cdc.gov/toxprofiles/tp107.html
AWWA (1990). Water Quality and Treatment. 4th Edition, Ed. F.W. Pontius, McGraw and Hill.DWI (2008). Review of England and Wales Monitoring Data for Which a National or International
Standard Has Been Set. DEFRA Project Code: CEER 0703 DWI 70/2/215 WT1207. 148 pp. http://dwi.defra.gov.uk/research/completed-research/reports/DWI70_2_215_Monitoring_Data.pdf
EAWAG (accessed Feb 2015). Biocatalysis/Biodegradation Database. Select 1396 compounds. http://eawag-bbd.ethz.ch/index.html
EFSA (2014). Conclusion on the peer review of the pesticide risk assessment of the active substance 2,4-D. EFSA Journal 2014; 12 (9): 3812. 76 pp. http://www.efsa.europa.eu/en/efsajournal/doc/3812.pdf
Health Canada. Guidelines for Canadian Drinking Water Quality – Supporting Documents. See http://www.hc-sc.gc.ca/home-accueil/search-recherche/a-z-eng.php
Health Canada (1987). Chlorophenols. http://www.hc-sc.gc.ca/ewh-semt/pubs/water-eau/chlorophenols/index-eng.php and http://www.hc-sc.gc.ca/ewh-semt/water-eau/index-eng.php
IARC (1999). Polychlorophenols and their sodium salts. IARC Monographs on the Evaluation of Carcinogenic Risks to Humans. Volume 71: Re-evaluation of Some Organic Chemicals, Hydrazine and Hydrogen Peroxide. See: http://monographs.iarc.fr/ENG/Monographs/vol71/index.php
IPCS (1989). Chlorophenols other than pentachlorophenol. Environmental Health Criteria 93. INCHEM. International Programme on Chemical Safety. See: http://www.inchem.org/documents/ehc/ehc/ehc93.htm
MDH (2009). Groundwater Values Table. Minnesota Department of Health (MDH). See: http://www.health.state.mn.us/divs/eh/risk/guidance/gw/table.html
NHMRC, NRMMC (2011). Australian Drinking Water Guidelines Paper 6 National Water Quality Management Strategy. National Health and Medical Research Council, National Resource Management Ministerial Council, Commonwealth of Australia, Canberra. 1244 pp. http://www.nhmrc.gov.au/guidelines/publications/eh52
Organic Contaminants in New Zealand Potable Water Supplies. Report to Department of Health, NZ, 1992.
Sithole B. B. and D. T. Willimas (1985). Halogenated phenols in water at forty Canadian potable water treatment facilities. Journal of the Association of Official Analytical Chemists, 69 (5), 807-810.
USEPA (1988). 2,4-Dichlorophenol. Integrated Risk Information System (IRIS). See: http://www.epa.gov/IRIS/subst/0041.htm
USEPA (2006). 2006 Edition of the Drinking Water Standards and Health Advisories. US Environmental Protection Agency, Washington, DC. EPA 822-R-06-013. Available at: http://water.epa.gov/action/advisories/health_index.cfm
USEPA (2009). 2009 Edition of the Drinking Water Standards and Health Advisories. US Environmental Protection Agency, Washington, DC. EPA 822-R-09-011. 18 pp. Available at: http://water.epa.gov/action/advisories/health_index.cfm
USEPA (2011). 2011 Edition of the Drinking Water Standards and Health Advisories. US Environmental Protection Agency, Washington, DC. Available at: http://water.epa.gov/action/advisories/health_index.cfm or www.epa.gov/waterscience/
WHO (2003). Chlorophenols in drinking-water. Background document for preparation of WHO Guidelines for Drinking-water Quality. Geneva, World Health Organization
Guidelines for Drinking-water Quality Management for New Zealand, May 2017 35

Datasheets Aesthetic Determinands
(WHO/SDE/WSH/03.04/47). http://www.who.int/water_sanitation_health/dwq/chemicals/chlorophenols/en/
WHO (2004). Guidelines for Drinking-water Quality 2004 (3rd Ed.). Geneva: World Health Organization. Available at: www.who.int/water_sanitation_health/dwq/gdwq3/en/print.html see also the addenda
WHO (2011). Guidelines for Drinking-water Quality 2011 (4th Ed.). Geneva: World Health Organization. Available at: http://www.who.int/water_sanitation_health/publications/2011/dwq_guidelines/en/index.html
Guidelines for Drinking-water Quality Management for New Zealand, May 2017 36
Datasheets Aesthetic Determinands
DISSOLVED OXYGEN
Description and CharacteristicsOxygen is slightly soluble in water, the solubility being temperature dependant. At 5°C the solubility is about 12 mg/L and at 24°C it is about 8 mg/L. Rain water and running water generally contain close to the theoretical solubility, i.e. close to 100% saturation. During photosynthesis, phytoplankton and macrophytes can cause the dissolved oxygen content of the water to exceed 100% saturation. In the absence of light these organisms consume oxygen (respiration). Aerobic bacteria also use oxygen. The more food in the water, the higher the bacterial content, so the lower the dissolved oxygen content – simplistically this is the basis of the BOD (biological oxygen demand) test.
Typical Concentrations in Drinking-waterAs water percolates through the upper soil layers, bacteria break down the organic matter, and the aerobic bacteria consume oxygen in the process. When all the oxygen has been consumed, some bacteria can obtain their energy by reducing chemicals that contain oxygen, reducing nitrate to ammonia, and sulphate to hydrogen sulphide; the common end-product of these processes is carbon dioxide. It is not unusual to find groundwater with zero dissolved oxygen.
Water supplies fed from surface sources are usually close to 100% saturation. There can be a reduction in the dissolved oxygen content as the water passes through the mains, due to biofilm activity.
Following a watermain repair, tapwater can appear to be very cloudy, sometimes leading to consumer complaints. This is caused by the air trapped in the main forming very fine bubbles under pressure. In a glass of water, the bubbles can be seen to rise slowly, leaving clear water – not unlike the dissolved air flotation treatment (DAF) process.
Removal MethodsThere is no need to remove dissolved oxygen from water used for drinking. To prevent corrosion, water fed to some high pressure boilers requires deoxygenation.
Dissolved oxygen is removed from water as it is boiled; it will gradually return as it cools in an open container.
Dissolved oxygen is more likely to be added to water during the treatment process through intentional aeration to remove substances such as carbon dioxide, hydrogen sulphide or volatile organic matter. Water will also equilibrate with air as it falls over weirs etc.
Analytical MethodsBoth the titrimetric and instrumental methods are suitable; see APHA (2005).
NEMS (2016) covers site selection and deployment, data acquisition, data processing and preservation.
Health ConsiderationsThere are no health issues resulting from either the presence or absence of dissolved oxygen in drinking water.
Guideline Value
Guidelines for Drinking-water Quality Management for New Zealand, May 2017 37

Datasheets Aesthetic Determinands
There is no aesthetic guideline value for dissolved oxygen in the DWSNZ and the WHO Guidelines do not have a Guideline Value.
The Australian Drinking Water Guidelines (NHMRC, NRMMC 2011) state that based on aesthetic considerations, it is desirable that the dissolved oxygen concentration in drinking water be greater than 85% saturation. No health-based guideline value has been set for dissolved oxygen. The guideline value of more than 85% saturation is based on aesthetic considerations for taste, odour and prevention of corrosion of pipes and fittings. If the concentration is lower than 85%, an investigation should be carried out to determine the cause.
WHO (2011) states that the dissolved oxygen content of water is influenced by the source, raw water temperature, treatment and chemical or biological processes taking place in the distribution system. Depletion of dissolved oxygen in water supplies can encourage the microbial reduction of nitrate to nitrite and sulfate to sulfide. It can also cause an increase in the concentration of ferrous iron in solution, with subsequent discoloration at the tap when the water is aerated. No health-based guideline value is recommended. However, very high levels of dissolved oxygen may exacerbate corrosion of metal pipes.
BibliographyAPHA (2005). Standard Methods for the Examination of Water and Wastewater (21st Edition).
Washington: American Public Health Association, American Water Works Association, Water Environment Federation.
NEMS (2016). Measuring, Processing and Archiving of Dissolved Oxygen Data. National Environmental Monitoring Standards. 78 pp. https://www.lawa.org.nz/media/2982081/NEMS-Dissolved-Oxygen.pdf
NHMRC, NRMMC (2011). Australian Drinking Water Guidelines Paper 6 National Water Quality Management Strategy. National Health and Medical Research Council, National Resource Management Ministerial Council, Commonwealth of Australia, Canberra. 1244 pp. http://www.nhmrc.gov.au/guidelines/publications/eh52
WHO (2011). Guidelines for Drinking-water Quality 2011 (4th Ed.). Geneva: World Health Organization. Available at: http://www.who.int/water_sanitation_health/publications/2011/dwq_guidelines/en/index.html
Guidelines for Drinking-water Quality Management for New Zealand, May 2017 38
Datasheets Aesthetic Determinands
HARDNESS (TOTAL)
See separate datasheets for calcium and magnesium.
Description and CharacteristicsStrictly speaking, and traditionally, hardness is a measure of the multivalent cations in water that are capable of precipitating (or wasting) soap. The dominant cations that give rise to hardness are calcium and magnesium, although other cations (e.g. aluminium, barium, iron, manganese, strontium and zinc) can also contribute. For drinking-water, this has now led to hardness being redefined as the sum of the calcium and magnesium concentrations expressed as calcium carbonate.
When the total hardness (as CaCO3) is less than or equal to the total alkalinity (as CaCO3) it used to be called temporary or carbonate hardness. Any hardness greater than the alkalinity was called permanent or non-carbonate hardness; non-carbonate hardness usually comprises calcium sulphate. Strictly speaking, carbonate hardness refers to the amount of carbonates and bicarbonates that can be removed or precipitated from solution by boiling, whereas non-carbonate hardness is caused by the association of the hardness-causing cations with sulphates, chlorides and nitrates; it is also referred to as permanent hardness because it cannot be removed by boiling. See below for a discussion on the units that have been used to describe water hardness.
The principal natural sources of hardness in water are sedimentary rocks or seepage and run-off from soils. Hard water normally originates in areas with thick topsoil and limestone formations. Groundwater rich in carbonic acid and dissolved oxygen usually possesses a high solubilising potential towards soil or rocks that contain appreciable amounts of the minerals calcite, gypsum, and dolomite.
The concentration of total hardness in seawater is about 6120 mg/L.
The hardness of drinking-water can be increased by dosing calcium compounds (usually as hydrated lime) to increase the pH after chemical coagulation, or to remove carbon dioxide.
Levels of hardness have been described as follows (WHO 2009b):
<60 mg/L CaCO3 soft60 - 120 mg/L CaCO3 moderately hard120 - 180 mg/L CaCO3 hard>180 mg/L CaCO3 very hard, with increasing scaling>500 mg/L CaCO3 severe scaling.
Public acceptance of hardness can vary considerably among communities and is generally related to the hardness that the consumer has come to expect.
Soft water may lead to greater corrosion of pipes, although this will depend on other factors such as pH, alkalinity, carbon dioxide and dissolved oxygen concentration (refer to Aggressiveness Data Sheet). Total hardness above 200 mg/L may lead to excessive scaling of pipes and fittings (particularly re hot water), and cause blockage of safety relief valves in hot water systems.
Aggressive water can dissolve lime out of concrete lined and fibrolite pipes, to the extent that the water can become very hard, particularly in dead-ends, or in areas of low water usage overnight.
Guidelines for Drinking-water Quality Management for New Zealand, May 2017 39

Datasheets Aesthetic Determinands
Typical Concentrations in Drinking-waterValues of hardness found in New Zealand water supplies range from less than 5 mg/L to 475 mg/L as CaCO3. Typical values lie between 5 mg/L and 80 mg/L as CaCO3. Calcium tends to appear at a higher concentration than magnesium in most New Zealand surface waters and groundwaters. Waters that have Ca and Mg derived from terrestrial sources will usually have Ca hardness greater than the Mg hardness, but the order is the other way around when the Ca and Mg may arise from a marine influence.
Removal MethodsHardness can be reduced readily by treatments such as chemical softening, reverse osmosis, electrodialysis or ion exchange.
Analytical MethodsHardness may be calculated from the analytical determination of the individual concentrations of the components of hardness, calcium and magnesium; their sum being expressed in terms of an equivalent quantity of calcium carbonate. See below for a discussion on units.
Total hardness (mg equivalent CaCO3/L) = 2.5 [Ca, mg/L] + 4.1 [Mg, mg/L]
Hardness can also be measured by the reaction of the polyvalent metallic ions present in a water sample with a chelating agent such as EDTA, and is expressed as an equivalent concentration of calcium carbonate. Total hardness measured by EDTA titration will include all the cations contributing to hardness, not just calcium and magnesium. In practice, in a good drinking-water, hardness only results from calcium and magnesium.
Health ConsiderationsThere is no evidence of adverse health effects specifically attributable to high levels of calcium or magnesium in drinking water. Some epidemiological studies have found that hard water may have a beneficial effect on health, particularly on some types of cardiovascular disease, but the data are inadequate to conclude that the association is causal. Very few studies have considered drinking and cooking waters in terms of their potential contributions to total calcium/magnesium intakes, and it is critical that this information be gathered to provide more accurate assessments of population intakes.
See WHO (2005), the calcium and magnesium datasheets, and Chapter 10: Chemical Compliance, Section 10.2.2 for a discussion on some possible health aspects related to drinking water with low levels of inorganic determinands, particularly calcium and magnesium.
The taste threshold for the calcium ion in drinking water varies from 100 to 300 mg/L, depending upon the anions present; for the magnesium ion the taste threshold is about 100 mg/L. There is some indication that water with a hardness of less than about 75 mg/L may adversely affect mineral balance.
The UK Department of Health funded research into potential links between water hardness and eczema. In particular, the study examined the hypothesis that use of soft water may reduce symptoms. This study does not indicate that an improvement of eczema is likely to follow a change to artificially soft water. DWI (2005 and 2011).
Guideline ValueThe total hardness in drinking water should not exceed 200 mg/L as CaCO3 (calcium carbonate), the guideline value set in the DWSNZ, to reduce effects on taste, soap wastage/scum formation,
Guidelines for Drinking-water Quality Management for New Zealand, May 2017 40

Datasheets Aesthetic Determinands
and to minimise undesirable build-up of scale. The DWSNZ add that the taste threshold lies in the range of 100 – 300 mg/L CaCO3.
Too little hardness in a drinking-water may result in it being aggressive. An appropriate lower limit of hardness, sufficient to suppress excessive corrosion, has to be determined for each water supply.
The taste threshold for the calcium ion is in the range of 100 – 300 mg/L, depending on the associated anion, and the taste threshold for magnesium is probably lower than that for calcium. In some instances, consumers tolerate water hardness in excess of 500 mg/L (WHO 2011).
Hardness is included in the plan of work of the rolling revision of the WHO Guidelines for Drinking-water Quality.
The Australian Drinking Water Guidelines (NHMRC, NRMMC 2011) state that to minimise undesirable build-up of scale in hot water systems, total hardness (as calcium carbonate) in drinking water should not exceed 200 mg/L.
From WRF (2015):Although Ca and Mg typically co-occur in drinking water, few studies have directly investigated the taste of combinations of Ca and Mg, which can have greatly varying concentrations in different drinking waters. Since hardness is a measure of Ca and Mg and the ratios of these ions vary, it is often difficult to ascertain the individual role of Ca and Mg when total hardness is reported. For waters that had predominantly calcium hardness, hardness values between 10 - 100 mg/L hardness as CaCO3 were reported to taste good. In the UK, Scotland has predominantly soft water while Southern England and the London area have hard water. When residents travel between the two locations, they often complain that the water tastes bad and this may be due to the change in hardness.
Units Used to Describe HardnessThe concept of water hardness has been around a very long time and there have been many methods for measuring and quantifying it. Today we express it as mg/L CaCO3. However, some quaint units are still in use by a few manufacturers of industrial equipment (e.g. boilers) or appliances (e.g. washing machines or home water softeners).
A common British water hardness unit (mostly before the 1950s) was grains per gallon, where 1 grain/gal was equivalent to 14.3 mg/L CaCO3. Because the water hardness test involved a titration with a standard soap solution (the Clark test) the grains per gallon unit was sometimes called degrees of Clark hardness. When grains per gallon was used in the US, it meant 17.1 mg/L.
Because an Imperial gallon of water weighs 10 pounds, one pound per 100,000 gallons was equivalent to 1 part per million (1 ppm or mg/L or g/m3 or g.m-3).
The unit the French used for reporting water hardness was parts of CaCO3 per 100,000, sometimes called French degrees. So, 1 French degree was equivalent to 10 mg/L as CaCO3.
The unit the Germans used for reporting water hardness was parts of CaO per 100,000, sometimes called German degrees. So, 1 German degree was equivalent to 17.8 mg/L as CaCO3.
Bibliography
Guidelines for Drinking-water Quality Management for New Zealand, May 2017 41
Datasheets Aesthetic Determinands
APHA (2005). Standard Methods for the Examination of Water and Wastewater (21st Edition). Washington: American Public Health Association, American Water Works Association, Water Environment Federation.
DWI (2005). Review of evidence for relationship between incidence of cardiovascular disease and water hardness. 154 pp. http://dwi.defra.gov.uk/research/completed-research/reports/DWI70_2_176_water_hardness.pdf
DWI (2011). A Review of Skin Irritation and Tap Water Quality. Report DWI8375.01. 149 pp. http://dwi.defra.gov.uk/research/completed-research/reports/dwi70-2-257.pdf
NHMRC, NRMMC (2011). Australian Drinking Water Guidelines Paper 6 National Water Quality Management Strategy. National Health and Medical Research Council, National Resource Management Ministerial Council, Commonwealth of Australia, Canberra. 1244 pp. http://www.nhmrc.gov.au/guidelines/publications/eh52
WHO (2003). Hardness in drinking-water. Background document for preparation of WHO Guidelines for Drinking-water Quality. World Health Organization, Geneva. (WHO/SDE/WSH/03.04/06). http://www.who.int/water_sanitation_health/dwq/chemicals/hardness/en/ and http://www.who.int/water_sanitation_health/gdwqrevision/hardness/en/index.html
WHO (2004). Guidelines for Drinking-water Quality (3rd Ed.). Geneva: World Health Organization. Available at: www.who.int/water_sanitation_health/dwq/gdwq3/en/print.html see also the addenda
WHO (2005). Nutrients in Drinking-water. WHO/SDE/WSH/05.09, 210 pp. See Chapter 12: Health Risks from Drinking Demineralised Water. This is available on the internet at www.who.int/water_sanitation_health/dwq/nutrientsindw.pdf and select Chapter 12.
WHO (2009a). Calcium and Magnesium in Drinking-water: Public health significance. ISBN 978 92 4 156355 0. Geneva: World Health Organization. 194 pp. See: http://www.who.int/water_sanitation_health/publications/publication_9789241563550/en/print.html
WHO (2009b). Hardness in Drinking-water. Background document for development of WHO Guidelines for Drinking-water Quality. Geneva: World Health Organization. 16 pp. WHO/HSE/WSH/09.01/10. See: http://www.who.int/water_sanitation_health/dwq/chemicals/hardness/en/index.html
WHO (2011). Guidelines for Drinking-water Quality 2011 (4th Ed.). Geneva: World Health Organization. Available at: http://www.who.int/water_sanitation_health/publications/2011/dwq_guidelines/en/index.html
WRF (2015). EPA Secondary Maximum Contaminant Levels: A Strategy for Drinking Water Quality and Consumer Acceptability. Water Research Foundation. 70 pp. http://www.waterrf.org/PublicReportLibrary/4537.pdf
Guidelines for Drinking-water Quality Management for New Zealand, May 2017 42
Datasheets Aesthetic Determinands
HYDROGEN SULPHIDE (H2S)
Description and CharacteristicsHydrogen sulphide (also spelt hydrogen sulfide) is a natural product of decaying organic matter. In residential settings it is most commonly the result of decomposition in septic or sewer systems. Hydrogen sulphide is a gas with an offensive rotten eggs odour that is detectable by the human nose at very low concentrations, below 0.0008 mg/m3 in air.
Hydrogen sulphide is formed in drinking-water by the hydrolysis of soluble sulphides, or through the reduction of sulphate by the action of micro-organisms under anoxic conditions. It may be present in anoxic water drawn from bores or the bottom waters of stratified reservoirs and lakes. When this water is released to the atmosphere, some of the hydrogen sulphide escapes into the air.
Hydrogen sulphide may be present in source waters as a result of its discharge from industries in which it is used. These include the production of sulphur, sulphuric acid, inorganic sulphides, thiophenes and other organic compounds, dye manufacturing, petrol refining, coke ovens, paper mills, iron smelters, food processing, cosmetic production, coal mine wastewater, fellmongeries and tanneries. It is also present in sewers and is a major component of sewage odour.
Anaerobic conditions in areas of low or no flow in the reticulation (usually dirty dead ends) may result in the microbial reduction of sulphate present in the water to hydrogen sulphide.
Once hydrogen sulphide (H2S) is dissolved in water (solubility about 4000 mg/L), it will dissociate into the bisulphide (or hydrosulphide) ion (HS-) and sulphide ion (S2-); the ratio of the concentrations of these various ions will depend on the pH of the solution. The ratio between the three forms depends on the pH, temperature and salinity. At pH 7.4, about one-third exists as the undissociated hydrogen sulphide molecule, and the remainder largely as the hydrosulphide ion. Above pH 10 the sulphide ion will be the dominant form; below pH 5 undissociated hydrogen sulphide will predominate.
In well-aerated water, hydrogen sulphide is oxidised readily to sulphates and biologically oxidised to elemental sulphur. In anaerobic water, the microbial reduction of sulphate to sulphide can occur.
Environmental FateIf released to soil, hydrogen sulfide gas can partition to soil through adsorption. Volatilisation of hydrogen sulfide from moist soil surfaces is expected to be an important fate process given a Henry's Law constant of 0.0098 atm-cu m/mole at 25°C. Since hydrogen sulfide is a gas at ambient temperatures, it is expected to volatilise from dry soil surfaces; however, hydrogen sulfide gas can adsorb to both moist and dry soil surfaces which may attenuate the rate of volatilisation. Hydrogen sulfide can be consumed by bacteria found in soil and water that oxidise hydrogen sulfide to elemental sulfur. If released to water, volatilisation from water surfaces is expected to be an important fate process based on its Henry's Law constant. Estimated volatilisation half-lifes for a model river and model lake are 1.8 hours and 2.3 days, respectively. Hydrogen sulfide is a weak base and has two pKa values of pKa1 = 7.04 and pKa2 = 11.96 which indicate some dissociation at environmental pHs. At pH 5-6, the water-air transfer rate was found to behave like an unreactive gas, but as the pH increases to pH10, the transfer rate was enhanced and nearly 200 times faster at pH10 than pH 5. At 25°C, the half-life for the rate of oxidation of hydrogen sulfide in air-saturated natural waters is about 50 hours in natural water and 26 hours in seawater (pH8). EAWAG (accessed Feb 2015).
Typical Concentrations in Drinking-water
Guidelines for Drinking-water Quality Management for New Zealand, May 2017 43

Datasheets Aesthetic Determinands
Hydrogen sulphide has not been monitored routinely in New Zealand drinking water supplies. In the USA a maximum concentration of 0.5 mg/L of undissociated hydrogen sulphide has been reported in fresh water. Its odour can be detected by many people at less than the detection limit of most common analytical techniques.
244 water utilities in the US reported detecting hydrogen sulfide in tap water since 2004, according to EWG's analysis of water quality data supplied by state water agencies, with the highest concentration being 2.34 mg/L.
Removal MethodsHydrogen sulphide, and other soluble sulphides, can be stripped from water by aeration, so long as the water is sufficiently acidic to ensure that the sulphide is present as the hydrogen sulphide molecule (at pH values of approximately 5 and less).
Some oxidation of the sulphide occurs during aeration, and oxidation can also be carried out by other oxidising agents, such as chlorine, ozone, and permanganate. Aeration is probably the cheapest option, but chlorination of groundwater will avoid the need for repumping. See Section 18.3 of Chapter 18 in the Guidelines for further discussion.
The initial product formed when oxidation is carried out by chlorine or oxygen (during aeration) is predominantly colloidal elemental sulphur. However, some polysulphides are also formed, and at very low concentrations these compounds still lead to odours. This problem can be overcome by dechlorination by sulphur dioxide or sodium metabisulphite, after the majority of the colloidal sulphur has been removed by filtration. This converts the remaining colloidal sulphur and polysulphides to thiosulphate, which can then be converted to sulphate by rechlorination. However, these measures are only required when the H2S content is particularly high.
Analytical MethodsSamples for sulphide analysis should be collected with as little aeration as possible, and, if total sulphide is to be determined, preserved with 4 drops of 2N zinc acetate per 100 mL of sample. The sampling bottle should be filled completely.
The Methylene Blue Colorimetric Method (APHA 4500-S2- D) will allow sulphide levels of less than 0.1 mg/L to be determined if a path length greater than 1 cm is used.
An ion selective electrode is available for sulphide, and has a detection limit of approximately 0.01 mg/L.
Health ConsiderationsSoluble sulphides are absorbed from the gastro-intestinal tract, although hydrogen sulphide is absorbed principally by the lung. Animal studies have indicated that after absorption, hydrogen sulphide is distributed to the brain, liver, kidneys, pancreas and small intestine.
There are no data on the human health effects of ingesting water that contains hydrogen sulphide, hence it has not been possible to derive an oral chronic RfD (USEPA 2003). Although oral toxicity data are lacking, it is unlikely that anyone could consume a harmful dose of hydrogen sulfide in drinking-water. Consequently, no health-based guideline value is proposed. However, hydrogen sulphide should not be detectable in drinking-water by taste or odour.
Ingestion of sulphides has been known to cause nausea, vomiting and irritation of the mucous membranes. Inhalation of hydrogen sulphide gas is known to be extremely toxic to humans with
Guidelines for Drinking-water Quality Management for New Zealand, May 2017 44
Datasheets Aesthetic Determinands
exposure to amounts as low as 5 mg/L for 30 minutes producing headaches, dizziness, nausea, gastro-intestinal disorders and breathing problems. Inhalation of concentrations above 500 mg/L can cause cardiac failure and death.
Animal data are mainly from short-term inhalation studies. Effects include neurotoxic activity and distortions in cardiac rhythm.
No long-term cancer studies have been undertaken on hydrogen sulphide. Sodium sulphide did not induce cancers in experimental animals. Hydrogen sulphide was not found to be mutagenic in tests with different strains of bacteria. USEPA (2003) states that data are inadequate for an assessment of the carcinogenic potential of hydrogen sulfide. No human or animal studies assessing the potential carcinogenicity of H2S were located. Genotoxicity studies also indicate that H2S was not mutagenic in S. typhimurium strains TA97, TA98 or TA100 with or without metabolic activation. Although H2S does not appear to be mutagenic, H2S gas potentiated the mutagenicity of hydrogen peroxide in S. typhimurium strain TA102. The investigators reported that the increased mutagenicity was due to H2S-mediated formation of iron sulfide, which converts hydrogen peroxide to hydroxyl radicals more efficiently than ferrous iron alone.
Guideline ValueBased on aesthetic considerations (odour and taste) the concentration of hydrogen sulphide in drinking water should not exceed 0.05 mg/L, the guideline value set in the DWSNZ. The aesthetic objective in Canada is also not greater than 0.05 mg/L.
The Australian Drinking Water Guidelines (NHMRC, NRMMC 2011) state that based on aesthetic considerations, the concentration of hydrogen sulfide in drinking water should not exceed 0.05 mg/L. No health-based guideline value has been set for hydrogen sulfide, or sulfide, as the aesthetic guideline is considerably below the concentration that would cause health problems.
BibliographyAPHA (2005). Standard Methods for the Examination of Water and Wastewater (21st Edition).
Washington: American Public Health Association, American Water Works Association, Water Environment Federation.
ATSDR (2006). Toxicological Profile for Hydrogen Sulfide. Agency for Toxic Substances and Disease Registry. U.S. Department of Health and Human Services, Public Health Service. http://www.atsdr.cdc.gov/toxprofiles/tp114.html
EAWAG (accessed Feb 2015). Biocatalysis/Biodegradation Database. Select 1396 compounds. http://eawag-bbd.ethz.ch/index.html
EWG (accessed 2010). Environmental Working Group. National Drinking Water Database – Chemical Contaminants. http://www.ewg.org/tap-water/chemical-contaminants
IPCS (1981). Hydrogen sulphide; Environmental Health Criteria 19. INCHEM. International Programme on Chemical Safety. http://www.inchem.org/documents/ehc/ehc/ehc19.htm
NHMRC, NRMMC (2011). Australian Drinking Water Guidelines Paper 6 National Water Quality Management Strategy. National Health and Medical Research Council, National Resource Management Ministerial Council, Commonwealth of Australia, Canberra. 1244 pp. http://www.nhmrc.gov.au/guidelines/publications/eh52
USEPA (2003). Toxicological Review of Hydrogen Sulfide; In Support of Summary Information on the Integrated Risk Information System (IRIS). EPA/635/R-03/005. 74 pp. See: http://cfpub.epa.gov/ncea/iris/index.cfm?fuseaction=iris.showSubstanceList
WHO (2003). Hydrogen sulfide: Human health aspects. Concise International Chemical Assessment Document (CICAD) 53. International Programme on Chemical Safety (IPCS). 41 pp. http://www.who.int/entity/ipcs/publications/cicad/en/cicad53.pdf
Guidelines for Drinking-water Quality Management for New Zealand, May 2017 45
Datasheets Aesthetic Determinands
WHO (2003). Hydrogen sulphide in drinking-water. Background document for preparation of WHO Guidelines for Drinking-water Quality. Geneva, World Health Organization (WHO/SDE/WSH/03.04/07). http://www.who.int/water_sanitation_health/dwq/chemicals/hydrogensulfide/en/
WHO (2004). Guidelines for Drinking-water Quality (3rd Ed.). Geneva: World Health Organization. Available at: www.who.int/water_sanitation_health/dwq/gdwq3/en/print.html see also the addenda
WHO (2011). Guidelines for Drinking-water Quality 2011 (4th Ed.). Geneva: World Health Organization. Available at: http://www.who.int/water_sanitation_health/publications/2011/dwq_guidelines/en/index.html
Guidelines for Drinking-water Quality Management for New Zealand, May 2017 46
Datasheets Aesthetic Determinands
IRON (Fe2+ & Fe3+)
Description and CharacteristicsIron is the fourth most abundant element by weight in the earth’s crust. Iron occurs commonly in soil and rocks as the oxide, sulphide and carbonate minerals. In water it occurs mainly in the divalent and trivalent (ferrous and ferric) states.
The presence of iron in natural waters can be attributed to the dissolution of rocks and minerals, acid mine drainage, landfill leachates, sewage or iron related industries. Iron can be associated with natural organic matter, in soluble, colloidal or particulate forms. Iron is used in many domestic and industrial applications, ranging from iron and steel products and pigments in paints, to food colours and preparations for preventing iron deficiency in humans. Ferric chloride and ferric sulphate are also used as coagulants in water treatment.
The concentration of iron in seawater is about 0.01 mg/L.
Iron in water near the top of a reservoir is typically about 0.3 mg/L, and is mostly in the Fe 3+ form. Iron in water near the bottom of a stratified reservoir can be higher than 30 mg/L, and is mostly in the Fe2+ form.
Iron is a natural constituent in plants and animals, and food is the major source of iron intake. Meats and cereals are the richest food sources of available iron (haem-iron) – containing about 0.03 mg/g.
Iron can have a taste threshold as low as 0.05 to 0.1 mg/L in water, and can become objectionable above 1 mg/L. It is reported (Health Canada 1978) that 5% of a 15- to 20-member taste test panel were able to detect ferrous sulphate in distilled water at a concentration of 0.04 mg/L, approximately 20% detected a concentration of 0.3 mg/L, and 50% detected a concentration of 3.4 mg/L.
High iron concentrations give water an undesirable rust-brown appearance, and can cause staining of laundry and plumbing fittings, fouling of ion-exchange softeners, and blockages in irrigation systems. Growths of iron bacteria, which concentrate iron, may cause taste and odour problems, and lead to pipe restrictions, blockages and corrosion.
Under reducing conditions such as groundwaters drawn from fine sediment peaty deposits or iron-rich volcanic or metamorphic rocks, iron will be present in the soluble, colourless ferrous (Fe2+) state. After the water is drawn and becomes exposed to the air, the ferrous ion will be oxidised to the rusty/cloudy ferric ion (Fe3+) state.
Typical Concentrations in Drinking-waterConcentrations of iron found in New Zealand drinking waters range from less than 0.05 to 21 mg/L. However, most waters contain less than 0.3 mg/L.
Removal MethodsIron salts can generally be removed effectively by the standard water treatment processes of coagulation followed by filtration. Groundwater supplies with a high iron content can be treated to form iron precipitates, using aeration, oxidation with chlorine, pH adjustment, or lime softening. Greensand, which is used in some places for iron and manganese removal, is treated with permanganate which oxidises these elements forming insoluble compounds which are filtered out. See Section 18.3 of Chapter 18 in the Guidelines for further discussion.
Guidelines for Drinking-water Quality Management for New Zealand, May 2017 47

Datasheets Aesthetic Determinands
Analytical MethodsThe iron concentration in drinking water can be determined using inductively coupled plasma emission spectroscopy or atomic absorption spectroscopy. The limits of detection are less than 0.01 mg/L.
Alternatively the phenanthroline colorimetric method, which has a limit of detection of 0.01 mg/L, can be used. In this method, iron is reduced to the ferrous state and treated with the colorimetric reagent to generate an orange-red complex.
Health ConsiderationsIron is an essential trace element for humans. Daily requirements vary with age and gender. For example, women aged 19 - 54 years need about 14 mg per day but this requirement doubles for pregnant women, while men require about 7 mg per day. Iron deficiency is common and is of particular concern for infants, women, vegetarians and athletes. The amount of iron absorbed from food by the gastro-intestinal tract varies from 0% to 25% according to individual requirements and the source of iron. Iron is used in the production of haemoglobin, myoglobin and a number of enzymes, and is stored in the spleen, liver, bone marrow and muscle.
The average lethal dose of iron is 200 – 250 mg/kg of body weight, but death has occurred following the ingestion of doses as low as 40 mg/kg of body weight. Autopsies have shown haemorrhagic necrosis and sloughing of areas of mucosa in the stomach with extension into the submucosa. Chronic iron overload results primarily from a genetic disorder (haemochromatosis) characterised by increased iron absorption and from diseases that require frequent transfusions. Adults have often taken iron supplements for extended periods without deleterious effects, and an intake of 0.4 – 1 mg/kg of body weight per day is unlikely to cause adverse effects in healthy persons. No health-based guideline value for iron is proposed (WHO 2003).
As a precaution against storage in the body of excessive iron, in 1983 JECFA established a PMTDI of 0.8 mg/kg of body weight, which applies to iron from all sources except for iron oxides used as colouring agents and iron supplements taken during pregnancy and lactation or for specific clinical requirements. An allocation of 10% of this PMTDI to drinking-water gives a value of about 2 mg/L, which does not present a hazard to health.
Cases of iron poisoning have been reported, mainly among young children who ingest medicinal iron supplements formulated for adults. Physiological regulation of iron absorption confers a high degree of protection against iron toxicity and there are a number of reports of high doses of iron being taken, particularly by adults, with no adverse effects. Studies with animals over long periods have reported only very mild adverse effects associated with a high iron intake.
There is no evidence that iron induces cancer in laboratory animals. Most iron salts have been inactive in tests for mutagenicity and do not induce chromosome aberrations in human cells.
Guideline ValueBased on aesthetic considerations the concentration of iron in drinking water should not exceed 0.2 mg/L, the guideline value set in the DWSNZ. This is mainly based on the colour in water and resultant staining.
The aesthetic objective in Canada is not greater than 0.3 mg/L.
Guidelines for Drinking-water Quality Management for New Zealand, May 2017 48
Datasheets Aesthetic Determinands
The USEPA established an organoleptic effect criterion of 0.3 mg/L for iron. Source: Quality Criteria for Water, 1986 ("Gold Book"), http://www.epa.gov/wqc/national-recommended-water-quality-criteria-organoleptic-effects. The USEPA (2009/2011) has a secondary drinking water regulation level of 0.3 mg/L.
The Australian Drinking Water Guidelines (NHMRC, NRMMC 2011) state that based on aesthetic considerations (precipitation of iron from solution, and taste), the concentration of iron in drinking water should not exceed 0.3 mg/L. No health-based guideline value has been set for iron.
The Prescribed Concentration or Value (PCV) for iron in England and Wales is 0.2 mg/L. See Notes.
WRF (2015) reports that ferrous ion has a slight taste and substantial retronasal metallic odour caused by lipid oxidation in the oral cavity, whereas Fe(III) has very little taste or odour as it does not participate in lipid oxidation. Individual ferrous flavour thresholds range from 0.007 to >14 mg Fe2+/L for the strong metallic flavour and slight bitter taste. The ferrous ion population thresholds in distilled water ranged from 0.03 - 0.17 mg Fe2+/L. The iron threshold has an age dependency. People over 50 years of age are less sensitive to the flavour of iron due to a reduced sense of smell; the group threshold for the over 50 population is 0.5 mg Fe2+/L
BibliographyAPHA (2005). Standard Methods for the Examination of Water and Wastewater (21st Edition).
Washington: American Public Health Association, American Water Works Association, Water Environment Federation.
Gillanders, L., L. Lloyd, K. Maher and B. Cormack (editors) (1992). Dietitians Clinical Handbook. NZ Dietetics Association.
Health Canada (1978). Guidelines for Canadian Drinking Water Quality; Guideline Technical Documents. Iron. 4 pp. http://www.hc-sc.gc.ca/ewh-semt/water-eau/drink-potab/index-eng.php
NHMRC, NRMMC (2011). Australian Drinking Water Guidelines Paper 6 National Water Quality Management Strategy. National Health and Medical Research Council, National Resource Management Ministerial Council, Commonwealth of Australia, Canberra. 1244 pp. http://www.nhmrc.gov.au/guidelines/publications/eh52
USEPA (2009). 2009 Edition of the Drinking Water Standards and Health Advisories. US Environmental Protection Agency, Washington, DC. EPA 822-R-09-011. 18 pp. Available at: http://water.epa.gov/action/advisories/health_index.cfm
USEPA (2011). 2011 Edition of the Drinking Water Standards and Health Advisories. US Environmental Protection Agency, Washington, DC. Available at: http://water.epa.gov/action/advisories/health_index.cfm or www.epa.gov/waterscience/
WHO (2003). Iron in drinking-water. Background document for preparation of WHO Guidelines for Drinking-water Quality. Geneva, World Health Organization (WHO/SDE/WSH/03.04/08). http://www.who.int/water_sanitation_health/dwq/chemicals/iron/en/
WHO (2004). Guidelines for Drinking-water Quality (3rd Ed.). Geneva: World Health Organization. Available at: www.who.int/water_sanitation_health/dwq/gdwq3/en/print.html see also the addenda
WHO (2011). Guidelines for Drinking-water Quality 2011 (4th Ed.). Geneva: World Health Organization. Available at: http://www.who.int/water_sanitation_health/publications/2011/dwq_guidelines/en/index.html
Guidelines for Drinking-water Quality Management for New Zealand, May 2017 49

Datasheets Aesthetic Determinands
WRF (2015). EPA Secondary Maximum Contaminant Levels: A Strategy for Drinking Water Quality and Consumer Acceptability. Water Research Foundation. 70 pp. http://www.waterrf.org/PublicReportLibrary/4537.pdf
Guidelines for Drinking-water Quality Management for New Zealand, May 2017 50
Datasheets Aesthetic Determinands
MAGNESIUM (Mg2+)
Description and CharacteristicsMagnesium is a common constituent of natural water. Many salts containing magnesium are readily soluble and water sources containing magnesium levels up to 10 mg Mg/L are common; natural waters rarely contain more than 100 mg Mg/L. Healthy adults require about 350 mg of magnesium per day. Magnesium is a common constituent of food of both animal and plant origin.
The concentration of magnesium in seawater is about 1280 mg/L as Mg.
Magnesium is used in various processes in the textile, tanning and paper industries. Alloys of magnesium find extensive use in moulds and die casting, portable tools, luggage and general household goods. The salts of magnesium are used in the production of magnesium metal, fertilisers, ceramics, explosives and medicines.
A major contributor to the hardness of drinking-waters, magnesium salts can form scale in boilers.
See also the datasheet for total hardness.
Typical Concentrations in Drinking-waterValues of total hardness found in New Zealand water supplies range from less than 5 mg/L to 475 mg/L as CaCO3. However most waters have hardness values ranging from less than 5 mg/L to 80 mg/L as CaCO3. Generally, surface waters are softer than groundwaters. Most waters contain less magnesium than calcium when expressed as mg/L CaCO3. A lot of surface waters in NZ contain less than 8 mg/L Mg as CaCO3, or 2 mg/L as Mg.
Removal MethodsChemical softening, reverse osmosis, electrodialysis, or ion exchange treatments will reduce the magnesium and associated hardness to acceptable levels. Magnesium forms the insoluble hydroxide at pHs above 10 - 11.
Analytical MethodsMagnesium concentrations may be determined by atomic absorption spectroscopy, inductively coupled plasma emission spectroscopy and complexometric (EDTA) titration methods.
Once the magnesium concentration is obtained as mg/L Mg, the magnesium hardness value in mg CaCO3 per litre can be calculated by multiplying the result by a factor of 4.1.
Health ConsiderationsMagnesium deficiency can cause hypocalcaemia and hypokalaemia, leading to neurological or cardiac symptoms when it is associated with marked hypomagnesaemia. Owing to the widespread involvement of magnesium in numerous physiological functions and the metabolic interactions between magnesium and other minerals, it is difficult to relate magnesium deficiency to specific symptoms. EFSA (2015).
Typical recommended dietary intakes for magnesium are about 200 to 400 mg of magnesium per day; dairy products, vegetables, grain, fruits and nuts are important contributors. There is no evidence of adverse health effects specifically attributable to high levels of magnesium in drinking water. Concentrations in water greater than 125 mg/L of Mg can have a slight purgative or diuretic effect when associated with sulphate, particularly for people not accustomed to the water supply.
Guidelines for Drinking-water Quality Management for New Zealand, May 2017 51
Datasheets Aesthetic Determinands
The reference nutrient intake (RNI) defines the amount of a particular nutrient (mineral, vitamin etc) that is at least sufficient for 97% of a population group. RNIs may therefore differ by age and gender. Within the UK, the Department of Health has defined the RNI for magnesium to be 300 and 270 mg/d for males and females respectively. Dietary magnesium intake in young males and all females did not meet the RNI. These insufficiencies are accentuated when compared with the higher RNIs applied internationally. DWI (2005). Drinking water contributes 0.6 and 13 percent of the total intake in soft and hard water areas, respectively Health Canada (1978).
Following a request from the European Commission, the Panel on Dietetic Products, Nutrition and Allergies (NDA) derived Dietary Reference Values (DRVs) for magnesium. The Panel considers that Average Requirements (ARs) and Population Reference Intakes (PRIs) for magnesium cannot be derived for adults, infants or children, and therefore defines Adequate Intakes (AIs), based on observed intakes in healthy populations in the European Union (EU). This approach considers the range of average magnesium intakes estimated by EFSA from dietary surveys in children and adults in nine EU countries. For adults, an AI for magnesium is set at 350 mg/day for men and 300 mg/day for women. For children aged 1 to <3 years, an AI for magnesium is set at 170 mg/day for both sexes. For children aged 3 to <10 years, an AI for magnesium is set at 230 mg/day for both sexes. For children aged 10 to <18 years, an AI for magnesium is set at 300 mg/day for boys and 250 mg/day for girls. For infants aged 7–11 months, an AI for magnesium of 80 mg/day is derived by extrapolating upwards from the estimated magnesium intake in exclusively breast-fed infants aged 0–6 months and by considering observed average intakes in the few surveys for which data are available. For pregnant and lactating women, the Panel considers that there is no evidence for an increased need for magnesium, and the same AI is set for them as for non-pregnant, non-lactating women. EFSA (2015).
Magnesium is the fourth most abundant cation in the body and the second most abundant cation in intracellular fluid. It is a cofactor for some 350 cellular enzymes, many of which are involved in energy metabolism. It is also involved in protein and nucleic acid synthesis and is needed for normal vascular tone and insulin sensitivity. Low magnesium levels are associated with endothelial dysfunction, increased vascular reactions, elevated circulating levels of C-reactive protein and decreased insulin sensitivity. Low magnesium status has been implicated in hypertension, coronary heart disease, type 2 diabetes mellitus and metabolic syndrome.
Some 50 to 60% of the total body magnesium content in normal adults resides in bone as a surface constituent of the hydroxyapatite mineral component of bone. The magnesium in bone is readily exchangeable with serum, and therefore it may serve as a reservoir for maintaining a normal extracellular magnesium concentration. Magnesium deficiency in animals results in decreased bone strength and volume, and impaired bone development. EFSA (2013).
Because magnesium is present in many foods, particularly legumes, vegetables, nuts, seeds, fruits, grains, fish and dairy products, severe magnesium deficiency is rarely seen in healthy people. Many NZ soils have less magnesium than in those found overseas, so our ‘home-grown’ food may contain less magnesium than the international average.
WHO (2003) states in Chapter 1 that more than 80 observational epidemiological studies were collected from the worldwide literature published since 1957 which related water hardness and cardiovascular disease (CVD) risks. These studies were conducted in more than 17 countries, primarily in North America, Europe, and Japan.
Most, but not all, of the studies found an inverse (protective) association between cardiovascular disease mortality and increased water hardness (measured by calcium carbonate or another hardness
Guidelines for Drinking-water Quality Management for New Zealand, May 2017 52

Datasheets Aesthetic Determinands
parameter and/or the calcium and magnesium content of water). The associations were reported in numerous countries, and by many different investigators, with different study designs. Both population and individual-based studies have observed benefits.
The most frequently reported benefit was a reduction in ischemic heart disease mortality. The strongest epidemiological evidence for beneficial effects was for drinking-water magnesium concentrations; there was also evidence, but not as strong, for drinking-water calcium concentrations.
WHO (2005) states in Chapter 12 that this relationship has been described independently in epidemiological studies with different study designs, performed in different areas, different populations, and at different times. The consistent epidemiological observations are supported by the data from autopsy, clinical, and animal studies. Biological plausibility for a protective effect of magnesium is substantial, but the specificity is less evident due to the multifactorial aetiology of CVD. In addition to an increased risk of sudden death, it has been suggested that intake of water low in magnesium may be associated with a higher risk of motor neuronal disease, pregnancy disorders (so-called pre-eclampsia), sudden death in infants, and some types of cancer.
WHO (2005) suggests (in Chapter 12) a minimum level for magnesium of 10 mg/L (about 41 mg/L measured as CaCO3). Typical surface water supplies in New Zealand contain about 2 mg/L Mg (about 8 mg/L as CaCO3); most groundwaters in NZ contain less than 10 mg/L Mg too.
Studies examining the apparent effects of soft water on cardiovascular disease and cancer commissioned by the UK Drinking Water Inspectorate concluded that there is evidence to support the role of water hardness in preventing cardiovascular mortality, and magnesium in particular based on a meta-analysis of analytical epidemiological studies (DWI 2005 and 2008).
Hardness is included in the plan of work of the rolling revision of the WHO Guidelines for Drinking-water Quality.
Desalinated water currently provides about 20% of Israel’s drinking water supply, and major expansions to cope with rising demand are predicted to increase this proportion to around 50% by 2020. The Israeli Ministry of Health has announced that it intends to require water providers to supplement desalinated water with magnesium in order to prevent the potential adverse effects of magnesium deficiency (calcium salts are added after desalination to avoid problems of corrosion in the water distribution system). The Israeli proposal would see desalinated supplies supplemented with magnesium to a concentration of 20 - 30 mg/L as magnesium. Taken from WQRA (2011).
Guideline ValueA guideline value for magnesium in water is incorporated in the guideline value for total hardness based on aesthetic considerations.
The taste threshold for the magnesium ion in drinking water is less than 100 mg/L as Mg.
BibliographyAPHA (2005). Standard Methods for the Examination of Water and Wastewater (21st Edition).
Washington: American Public Health Association, American Water Works Association, Water Environment Federation.
DWI (2005). Review of evidence for relationship between incidence of cardiovascular disease and water hardness. 154 pp.
Guidelines for Drinking-water Quality Management for New Zealand, May 2017 53
Datasheets Aesthetic Determinands
http://dwi.defra.gov.uk/research/completed-research/reports/DWI70_2_176_water_hardness.pdf
DWI (2008). A study into the possible association between step changes in water hardness and incidence of cardiovascular disease in the community. Report submitted to the Drinking Water Inspectorate on contract number DWI/70/2/203. 59 pp. http://dwi.defra.gov.uk/research/completed-research/reports/DWI70_2_203_hardness.pdf
EFSA (2013). Scientific Opinion on the substantiation of a health claim related to magnesium and contribution to normal development of bone pursuant to Article 14 of Regulation (EC) No 1924/2006. EFSA Journal 2013; 11 (7): 3331 [10 pp.]. http://www.efsa.europa.eu/en/publications/efsajournal.htm
EFSA (2015). Scientific Opinion on Dietary Reference Values for magnesium. EFSA Journal 2015; 13 (7): 4186; 63 pp. http://www.efsa.europa.eu/en/efsajournal/pub/4186
Health Canada (1978). Guidelines for Canadian Drinking Water Quality; Guideline Technical Documents. Magnesium. 4 pp. http://www.hc-sc.gc.ca/ewh-semt/water-eau/drink-potab/index-eng.php
WHO (2003). Hardness in drinking-water. Background document for preparation of WHO Guidelines for Drinking-water Quality. Geneva, World Health Organization (WHO/SDE/WSH/03.04/06). http://www.who.int/water_sanitation_health/dwq/chemicals/hardness/en/
WHO (2004). Guidelines for Drinking-water Quality (3rd Ed.). Geneva: World Health Organization. Available at: www.who.int/water_sanitation_health/dwq/gdwq3/en/print.html see also the addenda
WHO (2005). Nutrients in Drinking-water. WHO/SDE/WSH/05.09, 210 pp. See Chapter 1: Potential Health Consequences of Long Term Consumption of Demineralised, Remineralised and Altered Mineral Content Drinking-Water. Also see Chapter 12: Health Risks from Drinking Demineralised Water. These Chapters are available on the internet at www.who.int/water_sanitation_health/dwq/nutrientsindw.pdf and select Chapter number.
WHO (2009a). Calcium and Magnesium in Drinking-water: Public health significance. ISBN 978 92 4 156355 0. Geneva: World Health Organization. 194 pp. See: http://www.who.int/water_sanitation_health/publications/publication_9789241563550/en/print.html
WHO (2009b). Hardness in Drinking-water. Background document for development of WHO Guidelines for Drinking-water Quality. Geneva: World Health Organization. 16 pp. WHO/HSE/WSH/09.01/10. See: http://www.who.int/water_sanitation_health/dwq/chemicals/hardness/en/index.html
WHO (2011). Guidelines for Drinking-water Quality 2011 (4th Ed.). Geneva: World Health Organization. Available at: http://www.who.int/water_sanitation_health/publications/2011/dwq_guidelines/en/index.html
WQRA (2011). HealthStream. Public Health Newsletter of Water Quality Research Australia, March issue. www.wqra.com.au
Guidelines for Drinking-water Quality Management for New Zealand, May 2017 54
Datasheets Aesthetic Determinands
MONOCHLOROBENZENE
CAS No.: 108-90-7. Also called chlorobenzene, MCB, phenyl chloride or benzene chloride.
Maximum Acceptable ValueWHO (2004 and 2011) states that because monochlorobenzene occurs at concentrations well below those at which toxic effects are observed, and any health-based value would far exceed the lowest reported taste and odour threshold, thus it is not considered necessary to derive a guideline value.
In DWSNZ 2005, the provisional MAV had been 0.3 mg/L.
Monochlorobenzene is an aesthetic determinand; the DWSNZ include a GV of 0.01 mg/L.
The maximum contaminant level or MCL (USEPA 2006/2009/2011) is 0.1 mg/L. The USEPA (2006/2009/2011) also established a lifetime health advisory of 0.1 mg/L, where the lifetime health advisory is the concentration of a chemical in drinking water that is not expected to cause any adverse noncarcinogenic effects for a lifetime of exposure, and is based on exposure of a 70-kg adult consuming 2 litres of water per day. The Lifetime HA for Group C carcinogens includes an adjustment for possible carcinogenicity.
The maximum acceptable concentration in Canada is 0.08 mg/L, based on an ADI of 0.0089 mg/kg/d, a 125 mg/kg bw per day NOAEL, 5/7 conversion of five days per week of dosing to seven days per week, and an uncertainty of 10,000.
The Australian Drinking Water Guidelines (NHMRC, NRMMC 2011) state that based on health considerations, the concentration of chlorobenzene in drinking water should not exceed 0.3 mg/L.
Chlorobenzene is one of the “priority pollutants” under the US Clean Water Act.
Sources to Drinking-water1. To Source WatersMonochlorobenzene is used primarily as a solvent or carrier in pesticide formulations, as a degreasing agent, and as an intermediate in the synthesis of other halogenated organics, and therefore it may occur in the environment as an industrial and agricultural contaminant. Chlorobenzene is also used as a solvent in the manufacture of adhesives, paints, polishes, waxes, diisocyanates, pharmaceuticals, and natural rubber.
2. From Treatment ProcessesNo known sources.
3. From the Distribution SystemNo known sources.
Fate and Form in the EnvironmentBecause monochlorobenzene is a volatile compound and is used as a solvent, most of that found in the environment is likely to be in the air, and inhalation is probably the major route of environmental exposure. Monochlorobenzene released into water and on to land will decrease in concentration mainly because of volatilisation into the atmosphere. Some biodegradation also occurs in water. Monochlorobenzene is quite soluble in water (about 400 - 500 mg/L), is relatively
Guidelines for Drinking-water Quality Management for New Zealand, May 2017 55
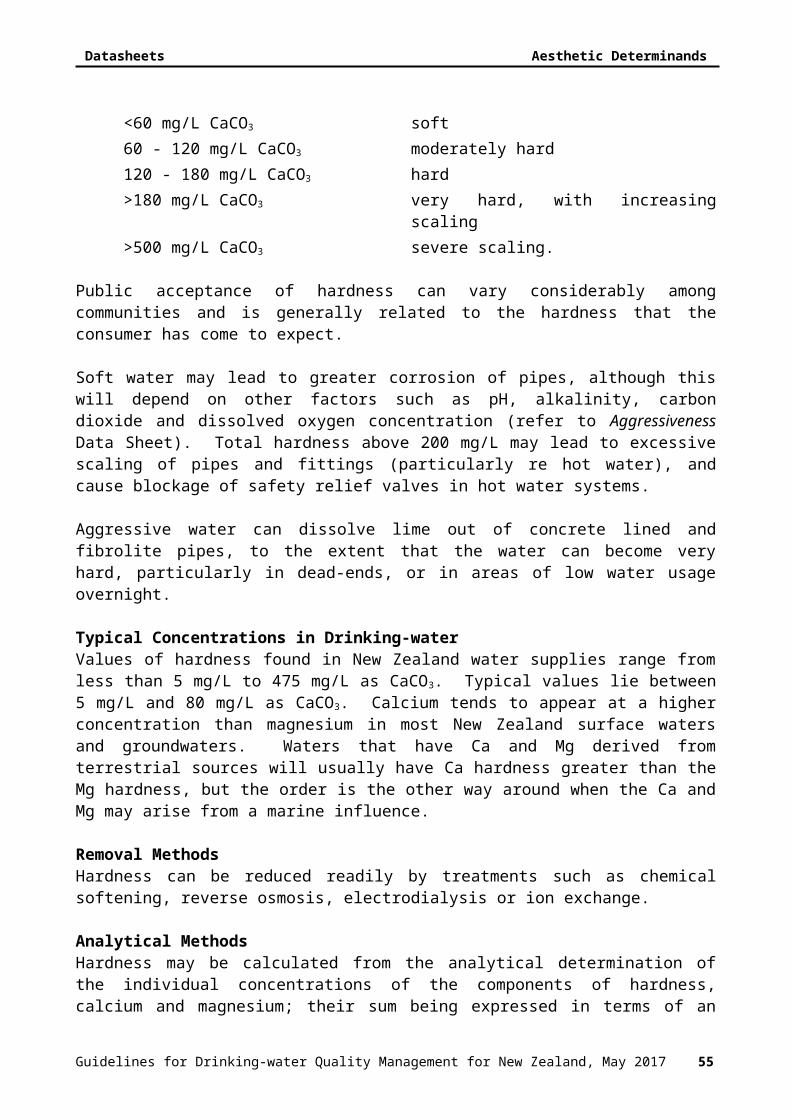
Datasheets Aesthetic Determinands
mobile in sandy soil and aquifer material, and therefore may leach into groundwater. Bioconcentration is unlikely to occur in aquatic species. Reported half-lifes of chlorobenzene in water are 0.3 days in a river and about 1 to 12 hours in a rapidly flowing stream (USEPA 1995).
If released to soil, chlorobenzene is expected to have very high to moderate mobility based upon a Koc range of 4.8 to 313. Volatilisation from moist soil surfaces is expected to be an important fate process based upon a Henry's Law constant of 3.11 x 10⁻³ atm-cu m/mole. Chlorobenzene may volatilise from dry soil surfaces based upon its vapour pressure. A 0% of theoretical BOD using activated sludge in the Japanese MITI test suggests that biodegradation is not an important environmental fate process. If released into water, chlorobenzene may adsorb to suspended solids and sediment based upon the Koc values. Volatilisation from water surfaces is expected to be an important fate process based on its Henry's Law constant. Estimated volatilisation half-lifes for a model river and model lake are 3.4 hours and 4.3 days, respectively. Reported BCF values of 3.9 to 40 suggests bioconcentration in aquatic organisms is low to high, provided the compound is not metabolised by the organism. Hydrolysis is not expected to be an important environmental fate process since this compound lacks functional groups that hydrolyse under environmental conditions. EAWAG (accessed Feb 2015).
Typical Concentrations in Drinking-waterThe P2 Chemical Determinand Identification Programme, sampled from 294 zones, did not find any monochlorobenzene at detectable concentrations (Limit of detection = 0.0005 mg/L); ESR (2001).
Monochlorobenzene has been detected in surface water, groundwater and drinking-water; mean concentrations were less than 0.001 mg/L in some potable water sources (maximum 0.005 mg/L) in Canada.
61 water utilities in the US reported detecting monochlorobenzene in tap water since 2004, according to EWG's analysis of water quality data supplied by state water agencies, the highest concentration being 0.025 mg/L.
Removal MethodsRemoval of monochlorobenzene can be achieved through adsorption on to activated carbon or air stripping.
Analytical MethodsReferee MethodPurge and Trap Capillary Column Gas Chromatographic/Mass Spectrometric Method (APHA 6210D, EPA 524.2).
Some Alternative Methods1. Purge and Trap Capillary-Column Gas Chromatographic Method (APHA 6200C, EPA
502.2).
Health ConsiderationsMonochlorobenzene is absorbed readily after ingestion or inhalation and accumulates mainly in fatty tissue and the liver and kidney. It is metabolised to 4-chlorocatechol, which is excreted in urine.
Monochlorobenzene is of low acute toxicity to experimental animals via the oral and inhalation routes and the major target organs are the liver and kidney.
Guidelines for Drinking-water Quality Management for New Zealand, May 2017 56

Datasheets Aesthetic Determinands
In humans, the symptoms of monochlorobenzene toxicity resulting from poisoning and occupational exposure were central nervous system disturbances. Subjects occupationally exposed to monochlorobenzene for 2 years suffered headaches, dizziness and sleepiness.
There was evidence of an increase of liver tumours in male rats fed 120 mg/kg body weight per day of monochlorobenzene for 2 years. No increases were observed in female rats, or in male and female mice.
Monochlorobenzene was not mutagenic in tests with bacteria, but may bind to RNA and DNA.
The USEPA derived a chronic oral reference dose RfD of 0.02 mg/kg/day for chlorobenzene, based on histopathologic changes in the liver of dogs. High doses of chlorobenzene administered to animals orally or by inhalation produced adverse effects on body weight, liver, kidney, bone marrow, and nervous system. The USEPA has classified chlorobenzene as a Group D; not classifiable as to human carcinogenicity potential (USEPA 1995).
As at July 2013 ATSDR (2010) quotes a minimal risk level (MRL) of 0.4 mg/kg/day for intermediate-duration oral exposure (15 – 364 days) to monochlorobenzene.
The reference dose or RfD (USEPA 2006/2009/2011) for monochlorobenzene is 0.02 mg/kg/d. The Drinking Water Equivalent Level or DWEL (USEPA 2006/2009/2011) is 0.7 mg/L.
Derivation of Maximum Acceptable ValueNo MAV.
WHO (2004) states that because monochlorobenzene occurs at concentrations well below those at which toxic effects are observed, it is not considered necessary to derive a health-based guideline value. It should also be noted that the health-based value far exceeds the lowest reported taste and odour threshold for monochlorobenzene in water.
The DWSNZ 2005 provisional MAV had been derived as follows: a tolerable daily intake approach was used for the derivation of the MAV for monochlorobenzene in drinking-water. The no-observable-adverse-effect level used as the basis for the derivation is for neoplastic nodules in the liver from a 2-year study with rats and mice.
60 x (5/7) mg/kg body weight per day x 70 kg x 0.1 = 0.3 mg/L 2 L x 500
where:- No-observable-adverse-effect level = 60 mg/kg body weight per day for neoplastic nodules
in the liver from a 2-year gavage study with rats and mice (normalised for 5 days/week dosing in derivation)
- Average weight of an adult = 70 kg- Proportion of tolerable daily intake allocated to drinking-water = 0.1- Average quantity of water consumed by an adult per day = 2 L- Uncertainty factor = 500 (100 for intra- and interspecies variation and 5 for limited
evidence of carcinogenicity).
Guidelines for Drinking-water Quality Management for New Zealand, May 2017 57

Datasheets Aesthetic Determinands
The Minnesota Department of Health (MDH) has developed health-based rules and guidance to evaluate potential human health risks from exposures to chemicals in groundwater. The chronic health risk limit (exposure greater than 10% of a lifetime) for monochlorobenzene is 0.1 mg/L.
The USEPA established an organoleptic effect criterion of 0.02 mg/L for monochlorobenzene. Source: Quality Criteria for Water, 1986 ("Gold Book"), http://www.epa.gov/wqc/national-recommended-water-quality-criteria-organoleptic-effects
Taste and odour thresholds of 0.01 - 0.02 mg/L, and odour thresholds of 0.04 - 0.12 mg/L have been reported for monochlorobenzene. NHMRC, NRMMC (2011) states: based on aesthetic considerations (taste), the concentration of chlorobenzene in drinking water should not exceed 0.01 mg/L. Health Canada established an aesthetic objective of 0.03 mg/L based on odour; levels above the AO would render water unpalatable.
BibliographyAPHA (2005). Standard Methods for the Examination of Water and Wastewater (21st Edition).
Washington: American Public Health Association, American Water Works Association, Water Environment Federation.
ATSDR (2010). Toxicological Profile for Chlorobenzene. Agency for Toxic Substances & Disease Registry, Dept of Health and Human Services. Atlanta, GA. See: http://www.atsdr.cdc.gov/toxprofiles/index.asp
EAWAG (accessed Feb 2015). Biocatalysis/Biodegradation Database. Select 1396 compounds. http://eawag-bbd.ethz.ch/index.html
ESR (2001). A report on the chemical quality of New Zealand’s community drinking water supplies. Client Report FW0120, prepared as part of a Ministry of Health Contract for Scientific Services. 333 pp.
EWG (accessed 2010). Environmental Working Group. National Drinking Water Database – Chemical Contaminants. http://www.ewg.org/tap-water/chemical-contaminants
Health Canada. Guidelines for Canadian Drinking Water Quality – Supporting Documents. See http://www.hc-sc.gc.ca/home-accueil/search-recherche/a-z-eng.php and http://www.hc-sc.gc.ca/ewh-semt/water-eau/index-eng.php
IPCS (1991). Chlorobenzenes other than hexachlorobenzene, Environmental Health Criteria 128. INCHEM. International Programme on Chemical Safety. http://www.inchem.org/documents/ehc/ehc/ehc128.htm
MDH (2009). Groundwater Values Table. Minnesota Department of Health (MDH). See: http://www.health.state.mn.us/divs/eh/risk/guidance/gw/table.html
NHMRC, NRMMC (2011). Australian Drinking Water Guidelines Paper 6 National Water Quality Management Strategy. National Health and Medical Research Council, National Resource Management Ministerial Council, Commonwealth of Australia, Canberra. 1244 pp. http://www.nhmrc.gov.au/guidelines/publications/eh52
USEPA (1988). Methods for the Determination of Organic Compounds in Drinking Water. USEPA Methods can be accessed at http://water.epa.gov/scitech/drinkingwater/labcert/methods_index.cfm
USEPA (1993). Chlorobenzene. Integrated Risk Information System (IRIS). http://www.epa.gov/iris/subst/0399.htm
USEPA (1995). Chlorobenzene Fact Sheet: Support Document. EPA 749-F-95-007a. http://www.epa.gov/chemfact/
USEPA (2006). 2006 Edition of the Drinking Water Standards and Health Advisories. US Environmental Protection Agency, Washington, DC. EPA 822-R-06-013. Available at: http://water.epa.gov/action/advisories/health_index.cfm
Guidelines for Drinking-water Quality Management for New Zealand, May 2017 58

Datasheets Aesthetic Determinands
USEPA (2009). 2009 Edition of the Drinking Water Standards and Health Advisories. US Environmental Protection Agency, Washington, DC. EPA 822-R-09-011. Available at: http://water.epa.gov/action/advisories/health_index.cfm
USEPA (2011). 2011 Edition of the Drinking Water Standards and Health Advisories. US Environmental Protection Agency, Washington, DC. Available at: http://water.epa.gov/action/advisories/health_index.cfm or www.epa.gov/waterscience/
WHO (2004). Chlorobenzenes other than hexachlorobenzene: environmental aspects. Concise International Chemical Assessment Document (CICAD) 60. International Programme on Chemical Safety (IPCS). 61 pp. See: www.who.int/entity/ipcs/publications/cicad/en/CICAD60_Chlorobenzenes_2004_08_04.pdf
WHO (2004). Guidelines for Drinking-water Quality 2004 (3rd Ed.). Geneva: World Health Organization. Available at: www.who.int/water_sanitation_health/dwq/gdwq3/en/print.html see also the addenda
WHO (2004a). Monochloroacetic acid in drinking-water. Background document for preparation of the WHO Guidelines for drinking-water quality. Geneva, World Health Organization (WHO/SDE/WSH/03.04/107). This document is available on the Internet at: http://www.who.int/water_sanitation_health/dwq/chemicals/monochlorobenzene/en/
WHO (2004b). Chlorobenzenes other than Hexachlorobenzene: Environmental Aspects. Concise International Chemical Assessment Document (CICAD) 60. International Programme on Chemical Safety (IPCS) Geneva. http://www.inchem.org/pages/cicads.html
WHO (2011). Guidelines for Drinking-water Quality 2011 (4th Ed.). Geneva: World Health Organization. Available at: http://www.who.int/water_sanitation_health/publications/2011/dwq_guidelines/en/index.html
Guidelines for Drinking-water Quality Management for New Zealand, May 2017 59
Datasheets Aesthetic Determinands
pH
Description and CharacteristicspH is a measure of the concentration of hydrogen ions in water. It is measured on a logarithmic scale from 0 to 14, and is described as the negative log of the hydrogen ion concentration (-log [H+]). A pH of 7 is neutral, greater than 7 is alkaline and less than 7 is acidic. A pH of 6 is ten times more acidic than a pH of 7.
The balance amongst carbonate, bicarbonate, dissolved carbon dioxide and/or hydroxide will determine the pH of most waters; see alkalinity section in APHA (2005) for further discussion. Thus, contact of water with limestone (CaCO3) and dissolution or release of dissolved CO2 are significant, particularly in groundwater. The acid-base properties of natural organic matter can influence the pH of lightly buffered waters.
The acceptable pH range in drinking-water is primarily based on minimising corrosion and encrustation. High pH can indirectly cause scaling and encrustation problems, while lower pH can result in metallic corrosion and dissolution of concrete; low pH problems are more prevalent in New Zealand. Steel corrodes at approximately the same rate at all pH levels commonly found in natural waters. The form that the corrosion takes is, however, affected by pH. At values between 7.5 and 9.0, there is a tendency for the corrosion products to adhere in a hard, crusty deposit. At lower pH values, pitting corrosion is more prevalent. Water at pH levels >10 aggressively corrode the zinc coating on galvanised steel. Corrosion of aluminium and iron is likely to increase when the pH exceeds 10 too.
For chlorine disinfection efficiency, the pH should be kept below 8; efficiency decreases with increasing pH. Values of pH above 9.5 can cause a bitter taste in drinking water, can irritate skin if the water is used for ablutions, and give the water a greasy feel.
Typical Concentrations in Drinking-waterValues of pH in New Zealand drinking water range from 5.1 to 10.0, and most are between pH 6.0 and 8.5.
Adjustment TechniquesThe pH of water can be adjusted by the addition of acid or alkali. Usually lime, soda ash, caustic soda, and carbon dioxide are used for this. For waters containing excess dissolved carbon dioxide, the pH can be raised by aeration. Addition of aluminium coagulants or the addition of chlorine gas can lower water pH.
Analytical MethodspH can be determined potentiometrically using a standard glass electrode and reference electrode, or combination electrode. Three standards are preferred to calibrate and check the electrodes and meter. Commonly used buffer standards are pH 4, pH 7 and pH 9.2. Measuring pH is difficult in unbuffered water.
pH measurements can be performed in the field or the treatment plant laboratory, and are often used on-line for process control. On-line electrodes need to be calibrated regularly (as do all electrodes), especially those situated in areas where they are exposed to high turbidity or attachment of biological growths, such as in flashmixers, clarifiers, and immediately after lime slurry addition. Particulate matter can adsorb to the electrode surface, altering its response characteristics.
Guidelines for Drinking-water Quality Management for New Zealand, May 2017 60
Datasheets Aesthetic Determinands
Field tests using pH-sensitive dyes and discs with a comparator or Nessleriser exist but are not recommended because of problems of colour blindness, getting a good colour match under all lighting conditions, and because high levels of FAC can modify some colours. Portable pH meters are reasonably priced and reliable today.
Health ConsiderationsThere is no convincing evidence that pH at the levels found in drinking water can significantly alter the pH of the body (Health Canada 2015). Although pH usually has no direct impact on consumers, it is one of the most important operational water quality parameters. Careful attention to pH control is necessary at all stages of water treatment to ensure satisfactory water clarification and disinfection (WHO 2007).
A direct relationship between pH and human health is difficult to determine as pH is closely associated with other aspects of water quality. Consumption of food and beverages with both low and high pH values is common and does not result in adverse health effects. Some carbonated soft drinks have a pH of 2.5, orange fruit juice has a pH of about 3.8, and the pH of fresh milk is 6.7. Extremes of pH may affect the taste of some foods and drinks.
The effect of pH on health will depend on the buffering capacity of the water used. This is related to the nature and amount of dissolved inorganic and organic material. Water with a low buffering capacity can change pH rapidly, but water with a high buffering capacity is more resistant to pH change.
Higher pH values may have an indirect adverse effect on bacteriological quality through reduced chlorination efficiency. Lower pH values can increase the solubility of heavy metals from pipes, particularly lead and copper, and may decrease the formation of trihalomethanes.
In humans, extreme values of pH result in irritation of the eyes, skin and mucous membranes. Eye irritation and exacerbation of skin disorders have been associated with high pH values. Gastrointestinal irritation may occur in sensitive individuals at pH values above 10. In theory, water with low buffering capacity and a pH between 3.5 and 10.5 can be neutralised by lacrimal fluid (in Health Canada 2015). High pH water can make hair feel slimy. Below pH 4, redness and irritation of the eyes have been reported, with the severity increasing with decreasing pH. However, WHO (2007) considers it is not necessary to propose a health-based guideline value for pH.
Water with a high pH can kill ornamental fish.
Guideline ValueBased on the need to reduce metallic corrosion, dissolution of cementitious pipe linings, and encrustation in pipes and fittings, and to maintain adequate disinfection when using chlorine, the pH of drinking water should normally be between 7.0 and 8.5, the range included in the DWSNZ. At a pH of 6.5, water can corrode some metals at an unacceptable rate. Values of pH at the lower end of this range should therefore be avoided.
The USEPA (2009/2011) has a secondary drinking water regulation level for pH of 6.5 to 8.5.
Health Canada (2015) has a proposed guideline: An acceptable pH range of 7 to 10.5 is proposed for drinking water in order to achieve water quality objectives and corrosion control.
Guidelines for Drinking-water Quality Management for New Zealand, May 2017 61

Datasheets Aesthetic Determinands
The Prescribed Concentration or Value (PCV) for pH in England and Wales is 6.5 – 9.5 at consumers’ taps. See Notes.
Using the Langelier Saturation Index (LSI) as an indicator of the tendency of a water towards corrosion and encrustation, a more appropriate pH range for most New Zealand waters would be pH 7.5 to 8.5. As an example, for a “typical” water with characteristics of alkalinity = 80 mg/L HCO3
-, calcium = 50 mg/L, conductivity = 25 mS/m at 20oC, and temperature = 15oC, the LSI would range from -0.4 to +0.6 over the pH range 7.5 to 8.5. A pH of 6.5 for this water would result in a LSI of -1.4. See Chapter 10 in the Guidelines for further discussion, and the datasheet for Aggressiveness.
The Australian Drinking Water Guidelines (NHMRC, NRMMC 2011) state that while extreme pH values (<4 and >11) may adversely affect health (mainly the eyes), there are insufficient data to set a health guideline value. Based on the need to reduce corrosion and encrustation in pipes and fittings, the pH of drinking water should be between 6.5 and 8.5. New concrete tanks and cement-mortar lined pipes can significantly increase pH and a value up to 9.2 may be tolerated, provided monitoring indicates no deterioration in microbiological quality.
WRF (2015) reports that recent sensory data are not available in the literature for pH. Maintaining drinking water pH to between 6.5 and 8.5 appears reasonable for the direct control of H+ taste and mouthfeel issues, although the implications of this range for corrosion control is less clear as pH values >8.5 are sometimes used for corrosion control.
BibliographyAPHA (2005). Standard Methods for the Examination of Water and Wastewater (21st Edition).
Washington: American Public Health Association, American Water Works Association, Water Environment Federation.
Health Canada (2015). pH of Drinking Water. Health Canada, Environmental and Workplace Health. 45 pp. http://www.hc-sc.gc.ca/ewh-semt/alt_formats/pdf/consult/_2015/ph/consult-eng.pdf
NHMRC, NRMMC (2011). Australian Drinking Water Guidelines Paper 6 National Water Quality Management Strategy. National Health and Medical Research Council, National Resource Management Ministerial Council, Commonwealth of Australia, Canberra. 1244 pp. http://www.nhmrc.gov.au/guidelines/publications/eh52
USEPA (2009). 2009 Edition of the Drinking Water Standards and Health Advisories. US Environmental Protection Agency, Washington, DC. EPA 822-R-09-011. 18 pp. Available at: http://water.epa.gov/action/advisories/health_index.cfm
USEPA (2011). 2011 Edition of the Drinking Water Standards and Health Advisories. US Environmental Protection Agency, Washington, DC. Available at: http://water.epa.gov/action/advisories/health_index.cfm or www.epa.gov/waterscience/
WHO (2004). Guidelines for Drinking-water Quality (3rd Ed.). Geneva: World Health Organization. Available at: www.who.int/water_sanitation_health/dwq/gdwq3/en/print.html see also the addenda
WHO (2007). pH in Drinking-water. Revised background document for preparation of WHO Guidelines for Drinking-water Quality. Geneva, World Health Organization (WHO/SDE/WSH/07.01/1). http://www.who.int/water_sanitation_health/dwq/chemicals/pH/en/
WHO (2011). Guidelines for Drinking-water Quality 2011 (4th Ed.). Geneva: World Health Organization. Available at: http://www.who.int/water_sanitation_health/publications/2011/dwq_guidelines/en/index.html
Guidelines for Drinking-water Quality Management for New Zealand, May 2017 62

Datasheets Aesthetic Determinands
WRF (2015). EPA Secondary Maximum Contaminant Levels: A Strategy for Drinking Water Quality and Consumer Acceptability. Water Research Foundation. 70 pp. http://www.waterrf.org/PublicReportLibrary/4537.pdf
Guidelines for Drinking-water Quality Management for New Zealand, May 2017 63

Datasheets Aesthetic Determinands
SILICA (SiO2)
Description and CharacteristicsSilica is a natural and significant component of most drinking-waters. Chemically the element silicon (Si) is analogous with carbon (C), in that they both form oxides (SiO2 and CO2) and acids (H2SiO3 and H2CO3).
However, in water they behave quite differently. H2CO3 dissociates to the gas CO2 and water; CO2
is soluble in water and causes metallic corrosion. H2SiO3 does not dissociate in water to form SiO2
and water but remains as the molecule H2SiO3 which more correctly should be written as Si(OH)4
or occasionally as H4SiO4, or even as SiO2.2H2O. SiO2 is the monomer of SinO2n, one form appearing as silica sand, where n obviously has a very high value.
Silica makes up 7 – 80% of rocks and 50 – 80% of soil (APHA 2005). Silica concentrations are particularly high in geothermal waters, and some usually precipitates when the water reaches the surface and/or cools, forming interesting shapes. Geothermal waters in the Taupo Volcanic Zone can contain 300 to 1000 mg/L SiO2; GNS (2015).
The concentration of silica in seawater is about 6 mg/L.
In boilers and steam turbines silica can form scale deposits, often in conjunction with magnesium. Silica is usually removed from water fed to high pressure industrial boilers, or the water is treated with specialised boiler treatment chemicals.
Silica has been reported to carry over with steam from steam generators used to clean windows (e.g. buses and trucks), or deposit from high silica-content waters, and adhere to the glass surface, impairing the optical quality.
Silica can also be a problem in water treatment due to its ability to cause fouling of reverse osmosis (RO) membranes. Fouling of membranes can occur in two ways:
precipitation fouling – monosilicic acid polymerises at the membrane surface forming a deposit similar to silica scale on glass surfaces
particulate fouling – accumulation of colloidal silica within the solution is then deposited on the membrane surface.
Typical Concentrations in Drinking-waterNew Zealand drinking-waters from surface sources generally contain 5 - 20 mg/L, and groundwaters 20 – 200 mg/L SiO2. Silica often comprises about 20% of the dissolved solids. New Zealand waters tend to contain more silica than many waters overseas.
Removal MethodsIon exchange systems that operate at a high pH (e.g. lime softening) convert the Si(OH)4 molecule to the silicate ion SiO3
2-, which is then removed, by anion exchange.
Analytical MethodsSee APHA (2005) for a range of methods. The method used should be reported with the results because different methods measure different components. Most water suppliers use APHA 4500-C – the molybdosilicate method – and results are sometimes called molybdate-reactive silica. Other methods can report colloidal silica and molybdate-unreactive silica.
Guidelines for Drinking-water Quality Management for New Zealand, May 2017 64

Datasheets Aesthetic Determinands
Health ConsiderationsSilicon is considered a non-essential trace element for most plants, but essential for most animals. No health guideline has been set for silica as there are no data linking silica to adverse health outcomes.
Guideline ValueThere is no Guideline Value for silica in the DWSNZ.
The Australian Drinking Water Guidelines (NHMRC, NRMMC 2011) state that to minimise an undesirable scale build up on surfaces, silica (SiO2) within drinking waters should not exceed 80 mg/L. The suggested guideline is based on the solubility of amorphous silica being between 100 and 140 mg/L at 25°C, so that, based on current data, limiting the value to below 80 mg/L should limit the formation of silica scaling.
BibliographyAPHA (2005). Standard Methods for the Examination of Water and Wastewater (21st Edition).
Washington: American Public Health Association, American Water Works Association, Water Environment Federation.
GNS (2015). The composition of high temperature geothermal fluids in New Zealand producing geothermal fields. Prepared by E Mroczek, M Climo, D Evans. GNS Science Report 2014/68; 25 pp. www.gns.cri.nz
NHMRC, NRMMC (2011). Australian Drinking Water Guidelines Paper 6 National Water Quality Management Strategy. National Health and Medical Research Council, National Resource Management Ministerial Council, Commonwealth of Australia, Canberra. 1244 pp. http://www.nhmrc.gov.au/guidelines/publications/eh52
Guidelines for Drinking-water Quality Management for New Zealand, May 2017 65

Datasheets Aesthetic Determinands
SODIUM (Na+)
Description and CharacteristicsSodium is present in a number of minerals, the principal one being rock salt (sodium chloride, NaCl). The sodium ion is widespread in water due to the high solubility of sodium salts and the abundance of mineral deposits. Near coastal areas, wind-borne sea spray can make an important contribution either by fall-out on to land surfaces where it can drain to drinking-water sources, or from wash-out by rain. Seawater intrusion, or water trapped in marine sediments, are possible sources of high sodium ion concentrations in groundwaters.
The concentration of sodium in seawater is about 10,600 mg/L.
Natural contamination, water treatment chemicals, domestic water softeners and sewage effluent can also contribute to the sodium content of drinking water. Sodium salts are used in the paper, glass, soap, pharmaceutical and general chemical industries, and for a variety of other purposes. Sodium is also used in the food industry and for culinary purposes. Considerable amounts are excreted by humans and it is a common constituent of domestic sewage.
Sodium, as sodium salts such as sodium chloride or sodium sulphate, has a taste threshold of about 135 mg/L. The taste becomes appreciable when the sodium concentration exceeds 200 mg/L, subject to what consumers consider ‘normal’.
Most people are exposed to less than 50 mg of sodium per day by drinking tap water (based on a consumption of 2 litres per day). As sodium salts are very soluble, virtually all the sodium present in water, whether consumed directly, in the preparation of beverages, or incorporated into food, will be absorbed. Up to 5 g/day of sodium is consumed by normal adults, mainly in food.
Typical Concentrations in Drinking-waterNew Zealand drinking-waters generally contain more than 5 mg/L and less than 40 mg/L.
Removal MethodsSodium salts are not easily removed from drinking water. Processes such as reverse osmosis, ion exchange or distillation can be used but are expensive to operate; these are used for desalination of seawater.
Analytical MethodsSodium concentrations in drinking water can be determined by atomic absorption spectroscopy, inductively coupled plasma emission spectroscopy, flame emission spectroscopy, and ion chromatography. The limits of detection can be as low as 0.001 mg/L depending on the instrumentation used.
Health ConsiderationsSodium is essential to human life and is present in all tissues and fluids. It has been estimated that a total daily intake of approximately 200 mg/person is sufficient to meet the needs of growing infants and children. Sodium salts are found in virtually all food (the main source of daily exposure). Sodium intake via the water supply makes only a modest contribution to total intake.
Water authorities are encouraged strongly, however, to keep sodium concentrations as low as possible. Whether water is consumed directly or with food or beverages, virtually all of the sodium present in it will be absorbed. Sodium concentration in the body is regulated by the kidneys. In general, sodium salts are not acutely toxic substances because of the efficiency with which mature
Guidelines for Drinking-water Quality Management for New Zealand, May 2017 66

Datasheets Aesthetic Determinands
kidneys excrete sodium. Highly excessive intake of sodium chloride may cause vomiting, thus eliminating much of the salt but the vomit response is variable. Increases in the sodium concentration in plasma may give rise to the sensation of thirst.
There is evidence linking excess sodium intake with cardiovascular disease. People with severe hypertension or congestive heart failure may need to restrict their overall dietary intake of sodium further if the concentration in drinking water exceeds 20 mg/L. Medical practitioners treating people with these conditions should be aware of the sodium concentration in the patient’s drinking-water.
No health-based guideline value has been derived for sodium because the contribution from drinking-water to daily intake is small (WHO 2011).
USEPA (2003) established a DWEL of 20 mg/L, a non-enforceable guidance level considered protective against non-carcinogenic adverse health effects, based on an American Heart Association recommendation issued in 1965; they added that the weight of evidence favours the conclusion that sodium concentrations greater than 120 mg/L can have an effect on blood pressure, especially for sodium-hypertensives. Sodium appears in the USEPA (2009/2011) drinking water advisory table, with health-based value of 20 mg/L for individuals on a 500 mg/day restricted sodium diet.
Guideline ValueBased on aesthetic considerations (taste), the concentration of sodium in drinking-water should not exceed 200 mg/L, the guideline value set in the DWSNZ. The aesthetic objective in Canada is not greater than 200 mg/L.
Sodium appears in the USEPA (2009/2011) drinking water advisory table, with a taste threshold of 30 to 60 mg/L, based on USEPA (2003a).
On the basis of existing data, no firm conclusions can be drawn concerning the possible association between sodium in drinking-water and the occurrence of hypertension. No health-based guideline value is therefore proposed. Medical practitioners treating people with severe hypertension or congestive heart failure are often concerned if the sodium concentration in the patient’s drinking-water exceeds 20 mg/L.
The Australian Drinking Water Guidelines (NHMRC, NRMMC 2011) state that based on aesthetic considerations (taste), the concentration of sodium in drinking water should not exceed 180 mg/L. No health-based guideline value is proposed for sodium. Medical practitioners treating people with severe hypertension or congestive heart failure should be aware if the sodium concentration in the patient’s drinking water exceeds 20 mg/L. Sodium, as sodium salts such as sodium chloride or sodium sulfate, has a taste threshold of about 135 mg/L. The taste becomes appreciable when the sodium concentration exceeds 180 mg/L.
The Prescribed Concentration or Value (PCV) for sodium in England and Wales is 200 mg/L. See Notes.
WRF (2015) states that the anion associated with Na affects the degree of saltiness; as the size of the anion increases (e.g., from chloride to acetate or gluconate), the saltiness declines and a bitter taste may appear. The taste threshold for Na, based on solutions of NaCl, was 30 mg Na/L for individuals 18-29 years old and 131 mg Na/L for older subjects of 66-90 years old. An overall taste threshold was determined to be 57 mg Na/L for subjects 23-88 years of age; a small but significant increase in threshold was observed with increasing age.
Guidelines for Drinking-water Quality Management for New Zealand, May 2017 67
Datasheets Aesthetic Determinands
BibliographyAPHA (2005). Standard Methods for the Examination of Water and Wastewater (21st Edition).
Washington: American Public Health Association, American Water Works Association, Water Environment Federation.
NHMRC, NRMMC (2011). Australian Drinking Water Guidelines Paper 6 National Water Quality Management Strategy. National Health and Medical Research Council, National Resource Management Ministerial Council, Commonwealth of Australia, Canberra. 1244 pp. http://www.nhmrc.gov.au/guidelines/publications/eh52
USEPA (2003). Contaminant Candidate List Regulatory Determination Support Document for Sodium. EPA-815-R-03-15. 58 pp. http://www.epa.gov/ccl/regulatory-determination-1-support-documents-sodium
USEPA (2003a). Drinking Water Advisory: Consumer Acceptability Advice and Health Effects Analysis on Sodium. EPA 822-R-03-006. 34 pp. http://www.epa.gov/ccl/regulatory-determination-1-support-documents-sodium
USEPA (2009). 2009 Edition of the Drinking Water Standards and Health Advisories. US Environmental Protection Agency, Washington, DC. EPA 822-R-09-011. 18 pp. Available at: http://water.epa.gov/action/advisories/health_index.cfm
WHO (2003). Sodium in drinking-water. Background document for preparation of WHO Guidelines for Drinking-water Quality. Geneva, World Health Organization (WHO/SDE/WSH/03.04/15). http://www.who.int/water_sanitation_health/dwq/chemicals/sodium/en/
WHO (2004). Guidelines for Drinking-water Quality (3rd Ed.). Geneva: World Health Organization. Available at: www.who.int/water_sanitation_health/dwq/gdwq3/en/print.html see also the addenda
WHO (2011). Guidelines for Drinking-water Quality 2011 (4th Ed.). Geneva: World Health Organization. Available at: http://www.who.int/water_sanitation_health/publications/2011/dwq_guidelines/en/index.html
WRF (2015). EPA Secondary Maximum Contaminant Levels: A Strategy for Drinking Water Quality and Consumer Acceptability. Water Research Foundation. 70 pp. http://www.waterrf.org/PublicReportLibrary/4537.pdf
Guidelines for Drinking-water Quality Management for New Zealand, May 2017 68

Datasheets Aesthetic Determinands
SULPHATE (SO42-)
Description and CharacteristicsThe IUPAC name for sulphate is sulfate; both spellings will be found.
Sulphate occurs naturally in a number of minerals, and is used commercially in the manufacture of numerous products, including ‘gib board’, fertilisers, chemicals, dyes, glass, paper, soaps, textiles, fungicides and insecticides. Sulphate, including sulphuric acid, is also used in mining, pulping, and the metal and plating industries. Barium sulphate is used as a lubricant in drilling rigs for groundwater supply. The majority of sulphates are soluble in water, the exceptions being the sulphates of lead, barium and strontium. Dissolved sulphate is considered to be a permanent solute in water.
The concentration of sulphate in seawater is about 2700 mg/L.
Food is probably the major source of sulphate intake. In general, the average daily intake of sulphate from drinking-water, air and food is approximately 500 mg, food being the major source. In areas where the concentration of sulphate in water is high, drinking water may constitute the principal source.
In the water treatment industry, aluminium sulphate (alum) or iron sulphate may be used as coagulants. A dose of 20 ppm alum will increase the sulphate content of the water by about 10 mg/L SO4, depending a little on the grade of alum used.
Copper sulphate may occasionally be used for the control of blue-green algae (cyanobacteria) in industrial and public water storage reservoirs. However, this is usually not encouraged because once a bloom has established, copper sulphate treatment may not be effective; also copper will build up in the sediments.
High sulphate concentrations may also increase the rate of corrosion of metallic fittings and distribution systems. Under anaerobic conditions, the reduction of sulphate to sulphide by sulphate-reducing bacteria can result in an unpleasant odour due to the release of hydrogen sulphide. Such bacteria can also cause corrosion of pipes.
Atmospheric sulphur dioxide (SO2), formed by the combustion of fossil fuels and emitted by the metallurgical roasting processes, may contribute to the sulphate content of surface water. Sulphur trioxide (SO3), produced by the photolytic or catalytic oxidation of sulphur dioxide, combines with water vapour to form sulphuric acid, which is precipitated as “acid rain” or “acid snow”.
The taste threshold for sulphate is in the range 250 - 500 mg/L, depending on the individual, and on which are the predominant ions in the water, and on what consumers are used to.
Typical Concentrations in Drinking-waterSulphate concentrations in New Zealand waters range from below 5 mg SO4/L to 50 mg SO4/L, however most waters contain less than 25 mg SO4/L, or less than 5 mg/L if the supply is not treated by coagulation with aluminium sulphate.
Removal MethodsMost sulphate salts are very soluble and cannot be removed from drinking water by conventional water treatment processes. Costly desalination methods such as reverse osmosis or distillation are required for sulphate removal.
Guidelines for Drinking-water Quality Management for New Zealand, May 2017 69

Datasheets Aesthetic Determinands
Analytical MethodsThe sulphate concentration of drinking-water can be determined by colorimetric, gravimetric, turbidimetric, or ion chromatography methods. Limits of detection are method-dependent, ranging from the gravimetric method being suitable for sulphate concentrations greater than 10 mg/L, to the ion chromatographic method suitable for concentrations above 0.1 mg/L.
Health ConsiderationsAverage daily intake of sulfate from drinking water, air, and food is approximately 500 mg, with food being the major source. However, in areas with high sulfate concentrations in the drinking water supplies, drinking water may constitute the principal intake source (WHO 1996) – from USEPA (2003a).
Sulphate is absorbed rapidly by the gastro-intestinal tract, but a number of factors, such as the accompanying cation, can influence the rate of absorption. Low doses are probably absorbed more effectively than high doses. Sulphate is found in all body tissues but is highest in the metabolically active areas of bone and in tooth formation, and may be important in regulating bone development.
Sulphate is one of the least toxic anions. Ingestion of high doses can result in, and is used for, catharsis (loosening of the bowels, or osmotic diarrhoea), with dehydration as a possible side-effect; however, no harmful effects have been reported in studies with animals. There are subpopulations that may be more sensitive to the cathartic effects of exposure to high concentrations of sulphate. Infants, transients and the elderly are such populations because of the potentially high risk of dehydration from diarrhoea that may be caused by high levels of sulphate in drinking-water.
USEPA (1999) reports results of a study into the effects of drinking water with a high concentration of sulphate. Experimental trials with adult volunteers did not find a significant dose-response association between acute exposure to sodium sulphate in water (up to 1200 mg/L) and reports of diarrhoea. However, a weak (not statistically significant) increase in reports of diarrhoea was found at the highest dose level (800 – 1200 mg/L) when it was compared with the combined lower doses.
In 1979, the USEPA established a secondary maximum contaminant level (SMCL), a non-enforceable guidance level for aesthetic quality, at 250 mg/L for sulfate in drinking water. In 1985, they proposed a sulfate health advisory (HA) of 400 mg/L that was never finalised. Two alternative MCLGs of 400 and 500 mg/L were proposed in 1990, and a reproposal of a 500 mg/L MCLG and Maximum Contaminant Level (MCL) in were made in 1994; USEPA (2003). Sulphate now appears in the USEPA (2009/2011) drinking water advisory table, with health-based value of 500 mg/L.
The draft version of the Australian Drinking Water Guidelines (NHMRC 2009) states that purgative effects may occur if the sulphate concentration exceeds 500 mg/L so has established a health guideline value of 500 mg/L.
Guideline ValueBased on aesthetic considerations (taste), the concentration of sulphate in drinking water should not exceed 250 mg/L, the guideline value set in the DWSNZ; taste thresholds have been found to range from 250 mg/L for sodium sulfate to 1000 mg/L for calcium sulfate. Purgative effects may occur if the concentration of sulphate exceeds 500 mg/L and the anion is associated with magnesium, particularly for people unaccustomed to the water supply.
Guidelines for Drinking-water Quality Management for New Zealand, May 2017 70

Datasheets Aesthetic Determinands
The aesthetic objective in Canada is not greater than 500 mg/L. The USEPA (2009/2011) has a secondary drinking water regulation level of 250 mg/L. Their drinking water advisory table states that the taste threshold is also 250 mg/L.
The Australian Drinking Water Guidelines (NHMRC, NRMMC 2011) state that based on aesthetic considerations (taste), the concentration of sulfate in drinking water should not exceed 250 mg/L. Purgative effects may occur if the concentration exceeds 500 mg/L.
The Prescribed Concentration or Value (PCV) for sulphate in England and Wales is 250 mg/L. See Notes.
WRF (2015) reports that sulfate is positively associated with consumer taste preference for drinking waters. Overall, sulfate has less perceived taste than chloride.
The livestock guideline value is 1000 mg/L (ANZECC/ARMCANZ 2000). Adverse effects may occur at sulphate concentrations between 1000 and 2000 mg/L, especially in young or lactating animals or in dry, hot weather when water intake is high. These effects may be temporary and may cease once stock become accustomed to the water. Levels of sulphate greater than 2000 mg/L may cause chronic or acute health problems in stock. These guidelines were to be updated in 2012.
BibliographyANZECC/ARMCANZ (2000). Australian and New Zealand Guidelines for Fresh and Marine
Water Quality. http://www.mfe.govt.nz/publications/water/anzecc-water-quality-guide-02/anzecc-water-quality-guide-02-pdfs.html
APHA (2005). Standard Methods for the Examination of Water and Wastewater (21st Edition). Washington: American Public Health Association, American Water Works Association, Water Environment Federation.
NHMRC, NRMMC (2011). Australian Drinking Water Guidelines Paper 6 National Water Quality Management Strategy. National Health and Medical Research Council, National Resource Management Ministerial Council, Commonwealth of Australia, Canberra. 1244 pp. http://www.nhmrc.gov.au/guidelines/publications/eh52
USEPA Method 300.1. Determination of Inorganic Anions in Drinking Water by Ion Chromatography. 1997. See http://www.epa.gov/safewater/methods/pdfs/met300.pdf
USEPA (1999). Health Effects from Exposure to High Levels of Sulfate in Drinking Water Study. (a) EPA 815-R-99-001: 25 pp; and (b) EPA 815-R-99-001: 45 pp). http://water.epa.gov/drink/contaminants/unregulated/sulfate.cfm
USEPA (2003). Contaminant Candidate List Regulatory Determination Support Document for Sulfate. EPA-815-R-03-16. 59 pp. http://www.epa.gov/ccl/regulatory-determination-1-support-documents-sulfate
USEPA (2003a). Drinking Water Advisory: Consumer Acceptability Advice and Health Effects Analysis on Sulfate. EPA 822-R-03-007. 34 pp. http://www.epa.gov/ccl/regulatory-determination-1-support-documents-sulfate
USEPA (2009). 2009 Edition of the Drinking Water Standards and Health Advisories. US Environmental Protection Agency, Washington, DC. EPA 822-R-09-011. 18 pp. Available at: http://water.epa.gov/action/advisories/health_index.cfm
USEPA (2011). 2011 Edition of the Drinking Water Standards and Health Advisories. US Environmental Protection Agency, Washington, DC. Available at: http://water.epa.gov/action/advisories/health_index.cfm or www.epa.gov/waterscience/
Guidelines for Drinking-water Quality Management for New Zealand, May 2017 71

Datasheets Aesthetic Determinands
WHO (2004). Guidelines for Drinking-water Quality (3rd Ed.). Geneva: World Health Organization. Available at: www.who.int/water_sanitation_health/dwq/gdwq3/en/print.html see also the addenda
WHO (2004a). Sulfate in drinking-water. Background document for preparation of WHO Guidelines for Drinking-water Quality. Geneva, World Health Organization (WHO/SDE/WSH/03.04/114). http://www.who.int/water_sanitation_health/dwq/chemicals/sulfate/en/
WHO (2011). Guidelines for Drinking-water Quality 2011 (4th Ed.). Geneva: World Health Organization. Available at: http://www.who.int/water_sanitation_health/publications/2011/dwq_guidelines/en/index.html
WRF (2015). EPA Secondary Maximum Contaminant Levels: A Strategy for Drinking Water Quality and Consumer Acceptability. Water Research Foundation. 70 pp. http://www.waterrf.org/PublicReportLibrary/4537.pdf
Guidelines for Drinking-water Quality Management for New Zealand, May 2017 72
Datasheets Aesthetic Determinands
SUSPENDED SOLIDS
Also refer to datasheet for turbidity
Description and CharacteristicsThis test is not commonly used in water supply testing although it can be quite useful; it is more commonly used in soil conservation studies. Water supply testing usually uses turbidity (qv) as a measure of particulate matter.
Suspended solids is the weight of particulate matter that is removed by a filter. The suspended solids (SS) test is useful for estimating the solids loading on a water treatment plant, or processes within the plant. The SS test is also used in assessing sludge production and sludge treatment performance. The result will depend on the test conditions – see below, Analytical Methods.
Filtering large volumes of drinking water, eg 10 litres, can provide useful qualitative information as well as quantitative, simply by examining the filter paper. If the paper is stained dark brown or black, manganese is indicated. If an orange/brown colour, iron corrosion products may be present. If blue/green: copper corrosion may be implicated, or yellow/green: algae. A muddy brown colour may indicate alum breakthrough or underdosing. Sand may indicate a fault in a bore screen.
Turbidity is an empirical measure of particulate matter, based on the light-scattering properties of the particles. It will only correlate with SS if the particulate matter remains the same.
A severe rainstorm occurred in Auckland on 16 February 1985 resulting in very turbid water entering the upland reservoirs. The initial flush contained a lot of large particles (these do not contribute greatly to the turbidity reading). The large particles settled fairly quickly, the colloidal particles (which do contribute to turbidity) remained suspended for weeks. The following results indicate the variability in turbidity and suspended solids. (Ogilvie, unpublished).
Reservoir date mean SS, mg/L mean turbidity, NTU ratio, NTU:SSCosseys 20/2 239 179 0.7
11/3 97.8 121 1.201/4 43.0 92 2.114/5 16.9 54 3.2
Mangatawhiri 19/2 169 149 0.904/3 46.9 80 1.725/3 18.1 48 2.707/5 8.1 31 3.8
A similar pattern was displayed at Wairoa and Mangatangi reservoirs.
Removal MethodsCoagulation followed by filtration through granular media is used widely to reduce suspended solids down to 0.1 mg/L or lower. Some very fine filters, e.g. microfiltration, can reduce the suspended solids content without coagulation to levels so low that it is difficult to measure.
Analytical MethodsMethod 2540D, total suspended solids, APHA (2012). Using a “standard” filter, eg GF/C, and standard drying conditions, eg 103-105°C, will produce useful results.
Guidelines for Drinking-water Quality Management for New Zealand, May 2017 73
Datasheets Aesthetic Determinands
Health ConsiderationsNone.
Guideline ValueNone.
BibliographyAPHA (2012). Standard Methods for the Examination of Water and Wastewater (22nd Edition).
Washington: American Public Health Association, American Water Works Association, Water Environment Federation.
Guidelines for Drinking-water Quality Management for New Zealand, May 2017 74

Datasheets Aesthetic Determinands
TASTE AND ODOUR
Description and CharacteristicsTaste and odour in drinking-water can occur naturally, or from the result of chemical and/or biological contamination of (or reaction in) water supplies. Generally, taste is indicative of the inorganic constituents and odour of the organic constituents or any gases of drinking water, which are more volatile.
Tastes and odours can also result from the materials used in the distribution system or plumbing. Materials should always be suitable for use in water supplies. DWI (2001) stated that the recent implementation of the Water Industry Approved Plumbers’ Scheme (WIAPS) may improve plumbing practices in domestic premises and avoid some taste and odour problems which occur within consumers’ premises such as from drinking water pipes being warmed by close proximity to hot pipes and lack of thermal insulation.
Odours and tastes are the primary criteria consumers use to judge the quality and acceptability of drinking water. People’s senses of taste and smell tend to vary, so the acceptability of the same water can vary from person to person, and from day to day for the same person. Similarly, one individual within a group may be more or less sensitive to a particular substance than the group as a whole.
The taste perception is generally much less sensitive than that of smell. When “tasting” water, the senses of both gustation (taste) and olfaction (smell) are activated and it is extremely difficult to differentiate between them. Any taste in the water is usually more apparent as the water is warmed to near body temperature; fortunately most people prefer to drink cold water.
pH, colour, temperature, and turbidity all affect the detection and perception of odour and taste. With increased temperature the more volatile compounds vaporise and stimulate the human sensory organs in the nasal and sinus cavities. Temperature also affects the growth rate of micro-organisms, some of which may produce metabolites with offensive tastes and smells. High concentrations of natural organic matter and turbidity in water are often associated with non-specific taste and odour problems. Where pH controls the equilibrium concentration of the neutral and ionised forms of a substance in solution, it can notably influence its taste and odour.
Disinfection chemicals can contribute taste or odour to water. The odour threshold for free chlorine varies with pH, but is between 0.1 mg/L and 0.4 mg/L. Monochloramine and dichloramine have odour thresholds of 0.65 mg/L and 0.15 mg/L respectively. A number of organic compounds can produce taste and odour as by-products of disinfection, particularly chlorination. Some chlorinated phenols, for example, have an antiseptic smell and a very low taste and odour threshold, varying from 1.2 mg/L to 0.0005 mg/L.
Contamination of water from spills, discharges, or leaks of organic compounds, can result in unpleasant taste and odours. Diesel fuel, for example, has a taste and odour threshold of 0.0005 mg/L. See Chapter 16.2.6 of the Guidelines for a discussion on chemicals that can enter the distribution system by permeation.
A number of health significant organic chemicals give rise to taste and odour at concentrations well below their respective MAVs (refer to respective datasheets). These chemicals include ethylbenzene, styrene, toluene, xylene, monochlorobenzene, 1,2- and 1,4-dichlorobenzenes, trichlorobenzenes, and chlorophenols.
Guidelines for Drinking-water Quality Management for New Zealand, May 2017 75
Datasheets Aesthetic Determinands
Organic metabolites resulting from microbial action in waters or surrounding soils can result in a drinking-water that smells “earthy”, “musty” or “woody”. Compounds most often linked to these tastes and odours are geosmin and methyl isoborneol which have extremely low odour threshold concentrations of less than 0.00001 mg/L. These compounds are produced by a number of micro-organisms including blue-green algae (cyanobacteria). While these two compounds are commonly cited as the causes of tastes and odours, they are just a few of the compounds derived from algae that give rise to tastes and odours. Individual datasheets have been prepared for several of these compounds (see Appendix 2.4).
Inorganic compounds generally are present in water at substantially higher concentrations than organic compounds. Taste thresholds for some commonly occurring inorganic ions are about 3 mg/L for manganese, 0.05 to 0.1 mg/L for iron, 3 mg/L for copper, 5 mg/L for zinc, 250 mg/L for chloride, and 250 mg/L for sulphate.
DWI (2001) discusses some commoner causes of taste and odour in drinking water.
A Spanish study (Platikanov et al 2013) found the most important factor that influenced taste preferences was the overall level of mineralisation (TDS). In both studies none of the panellists liked water samples with high levels of TDS (more than 800 mg/L). The study with bottled waters showed that panellists preferred waters with TDS values around 200 - 400 mg/L, and disliked very low mineralised water, with TDS values around 30 mg/L. For moderate levels of TDS, the physiochemical content appeared to be influential. They preferred water samples that had relatively high pH values, around 7.5 - 8.1 and relatively high concentrations of Ca2+, Mg2+, SO4
2-
and HCO3- ions. In general panellists disliked water samples with high concentrations of K+, Na+,
Cl-, NO3- and Si, or with low pH (below 7) values. The presence of residual chlorine (maximum
0.79 mg/L in tap water samples) did not significantly influence the panellists’ ratings. However, this parameter did allow them to distinguish between bottled and tap water samples.
Removal MethodsSubstances producing taste and odour can sometimes be removed by granular activated carbon or less effectively by powdered activated carbon. Oxidation, coagulation/flocculation/filtration, and biological treatments may also reduce tastes and odours. Where micro-organisms are responsible for the chemicals, their physical removal prior to disinfection is recommended.
Manufacturers normally test the efficiency with which point of use devices (PoUs) remove taste and odour problems from drinking water by carrying out chlorine reduction tests. Although it is generally assumed that PoUs based on activated carbon will remove many organic chemicals responsible for taste or odour problems from challenge waters no data was available from manufacturers to confirm this. The removal of some of the highly polar organic chemicals that may cause taste and odour problems by activated carbon may be less effective than for more hydrophobic chemicals. Further investigations would be required to determine the efficiency of activated carbon removal of taste and odour chemicals with a range of physicochemical properties. DWI (2001).
Analytical MethodsMeasurements of taste and odour are difficult to obtain due to the complexity of the testing programme. The Flavour Profile Measurement method is widely recognised as the appropriate procedure when assessing drinking-water. It provides information on both the strength and characteristics of the odour and taste of the water. A small panel (5 to 8 people) can be trained to identify specific odours and tastes associated with common contaminants. These panels are useful
Guidelines for Drinking-water Quality Management for New Zealand, May 2017 76
Datasheets Aesthetic Determinands
for assessing complaints by consumers, identifying the sources of a contaminant, and for the initial assessment of a new or improved purification process.
A few analytical procedures are known to be able to detect and quantify the very low concentrations of some odour-causing organic compounds, for example closed loop stripping GCMS.
See DWI (2001 and 2002) and WRF (2015) for a thorough discussion on taste and odour, and measuring techniques and their limitations. Whilst threshold odour or taste (flavour) numbers are a useful method for obtaining information on taste or odour thresholds for specific chemicals, when applied in the SCA and CEN methods they simply provide a subjective assessment of the presence or absence of a flavour or odour to panellists. They do not provide specific information relating to the causes of any tastes or odours detected and cannot distinguish between effects caused by single chemicals or by mixtures of different chemicals. Also, threshold measurements do not take account of the offensiveness of tastes or odours or of the fact that different chemicals may have different dose responses, that these are nonlinear and that different panellists may have widely differing personal sensitivities to chemicals. The inherent lack of precision in sample screening using threshold numbers limits their utility. Furthermore, the fact that samples can meet statutory regulations if 50% of the panellists cannot perceive a taste or odour in a sample diluted with three volumes of reference water is unlikely to reassure consumers.
Health ConsiderationsOdour in potable water may indicate pollution of the water or malfunctions during water treatment or distribution. Odours of a biological origin can indicate increased biological activity. Some algae can produce toxins, and the detection of these algae by taste and odour provides a useful early warning of potential problems, although taste and odour do not necessarily indicate the presence of toxins.
Guideline ValueThere is no guideline value for taste and odour. The taste and odour of drinking water should be acceptable to most consumers. The aesthetic objective in Canada is “to be inoffensive”.
The European Economic Community Standards require that the Threshold Odour Number (TON) not exceed 3. The Threshold Odour Number method is no longer regarded as a reliable method for the determination of odours.
The USEPA (2009/2011) has a secondary drinking water regulation level for odour of 3 threshold odour numbers.
The Australian Drinking Water Guidelines (NHMRC, NRMMC 2011) state that the taste and odour of drinking water should not be offensive to most consumers. Taste and odour complaints may indicate undesirable contaminants, but usually indicate problems such as algal or biofilm growths.
The Prescribed Concentration or Value (PCV) for quantitative taste and odour in England and Wales is to be acceptable to consumers and no abnormal change. See Notes.
WRF (2015) describes how some countries have adopted national standards or guidelines for specific odour-causing chemicals, mainly geosmin, 2-MIB and MTBE; these are particularly useful in water supplies that often experience these particular problems. Japan and Australia have set limits for geosmin and 2-MIB of 10 ng/L, as have some individual water suppliers in the US.
Guidelines for Drinking-water Quality Management for New Zealand, May 2017 77
Datasheets Aesthetic Determinands
BibliographyAPHA (2005). Standard Methods for the Examination of Water and Wastewater (21st Edition).
Washington: American Public Health Association, American Water Works Association, Water Environment Federation.
DWI (2002). Factors causing off-taste in waters, and methods and practices for the removal of off-taste and its causes. DETR/DWI 5008/1. 69 pp. http://dwi.defra.gov.uk/research/completed-research/2000todate.htm
DWI (2002). Review of Test Methods and Criteria for Assessing Taste and Off-Taste. DEFRA 5013/1. 49 pp. http://dwi.defra.gov.uk/research/completed-research/2000todate.htm
NHMRC, NRMMC (2011). Australian Drinking Water Guidelines Paper 6 National Water Quality Management Strategy. National Health and Medical Research Council, National Resource Management Ministerial Council, Commonwealth of Australia, Canberra. 1244 pp. http://www.nhmrc.gov.au/guidelines/publications/eh52
Platikanov S et al (2013). Influence of minerals on the taste of bottled and tap water: A chemometric approach. Water Research, 47 (2), 693-704.
USEPA (2009). 2009 Edition of the Drinking Water Standards and Health Advisories. US Environmental Protection Agency, Washington, DC. EPA 822-R-09-011. 18 pp. Available at: http://water.epa.gov/action/advisories/health_index.cfm
USEPA (2011). 2011 Edition of the Drinking Water Standards and Health Advisories. US Environmental Protection Agency, Washington, DC. Available at: http://water.epa.gov/action/advisories/health_index.cfm or www.epa.gov/waterscience/
WHO (2004). Guidelines for Drinking-water Quality (3rd Ed.). Geneva: World Health Organization. Available at: www.who.int/water_sanitation_health/dwq/gdwq3/en/print.html see also the addenda
WHO (2011). Guidelines for Drinking-water Quality 2011 (4th Ed.). Geneva: World Health Organization. Available at: http://www.who.int/water_sanitation_health/publications/2011/dwq_guidelines/en/index.html
WRF (2015). EPA Secondary Maximum Contaminant Levels: A Strategy for Drinking Water Quality and Consumer Acceptability. Water Research Foundation. 70 pp. http://www.waterrf.org/PublicReportLibrary/4537.pdf
Guidelines for Drinking-water Quality Management for New Zealand, May 2017 78
Datasheets Aesthetic Determinands
TEMPERATURE
Description and CharacteristicsTemperature is an aesthetic criterion for drinking-water. Generally, cool water is more palatable than warm or cold water. Increased temperature will increase the vapour pressure of volatile compounds in drinking-water and may lead to increased odour. Drinking-water with a particularly high mineral content may be more palatable if it is refrigerated. People become more aware of tastes and odours when the water warms.
Turbidity and colour of filtered water may be affected indirectly by temperature, because low water temperatures tend to decrease the efficiency of water treatment processes by, for instance, affecting floc formation rates and sedimentation efficiency.
Biological activity increases as the temperature rises. Chemical reaction rates increase with temperature too, and this can lead to greater corrosion of pipes and fittings in closed systems. Scale formation in hard waters will also be increased by higher temperatures.
Typical Concentrations in Drinking-waterTemperatures in New Zealand drinking water generally range from 5oC to 25oC. The temperature of surface water sources varies seasonally as well as geographically, whereas groundwater sources often maintain a constant temperature. Water in service reservoirs and in shallow or exposed pipes may become unpleasantly warm during summer.
Control in Drinking-water SuppliesControl of water temperature in reticulated supplies is seldom practical or effective. Selective withdrawal from deep reservoirs can be used but this may introduce other water quality problems. Aeration causing evaporation can also be used to lower temperature.
Some practices can affect water temperatures, such as whether water mains and service pipes are buried underground, and how deep. Long retention times in pipes and storage tanks can increase water temperatures, particularly in the summer.
Analytical MethodsTemperature measurements are made with a thermometer or probe and must be measured on-site. The intended use of the information will dictate which type of thermometer is most appropriate, and whether the thermometer calibration needs to be traceable to a national standard thermometer, e.g. when C.t values are dependent on temperature. Cheap mercury thermometers can be quite inaccurate, even within the same manufactured batch; alcohol thermometers are not recommended.
NEMS (2013) covers site selection and deployment, equipment selection and preparation, data acquisition, and data processing and preservation.
Health ConsiderationsThe effectiveness of disinfectants is influenced by the temperature of the water being dosed. Generally higher temperatures result in more effective disinfection at a particular dose, and this is reflected in C.t tables. However, FAC in the distribution system dissipates more rapidly as the temperature increases.
Water temperature can directly affect the growth and survival of micro-organisms. Increased temperature can also promote the growth of taste and odour producing organisms in lakes and impoundments, and in the distribution system.
Guidelines for Drinking-water Quality Management for New Zealand, May 2017 79

Datasheets Aesthetic Determinands
Warm drinking water supplies have been known to support the growth of legionella bacteria in the plumbing, generally if the temperature is >25°C. When the hot and cold water pipes are close together, cold water has been observed to reach relatively high temperatures overnight or during other periods of low use.
Guideline ValueNo guideline is set due to the impracticality of controlling water temperature. Generally consumers prefer their drinking-water to be cool, for example, the aesthetic objective in Canada is not greater than 15°C.
The temperature of the water dictates the minimum C.t value that needs to be achieved when disinfecting for protozoa compliance.
The Australian Drinking Water Guidelines (NHMRC, NRMMC 2011) state that no guideline is set due to the impracticality of controlling water temperature. Drinking water temperatures above 20°C may result in an increase in the number of complaints; rapid changes can bring complaints.
BibliographyAPHA (2005). Standard Methods for the Examination of Water and Wastewater (21st Edition).
Washington: American Public Health Association, American Water Works Association, Water Environment Federation.
AWWA (1990). Water Quality & Treatment, A Handbook of Community Water Supplies (4th Edition). McGraw Hill Inc.
Health Canada (1979). Guidelines for Canadian Drinking Water Quality; Guideline Technical Documents. Temperature. 4 pp. http://www.hc-sc.gc.ca/ewh-semt/water-eau/drink-potab/index-eng.php
NEMS (2013). Measurement, Processing and Archiving of Water Temperature Data. National Environmental Monitoring Standards. 41 pp. https://www.lawa.org.nz/media/16588/nems-water-temperature-recording-2013-06-2-.pdf
NHMRC, NRMMC (2011). Australian Drinking Water Guidelines Paper 6 National Water Quality Management Strategy. National Health and Medical Research Council, National Resource Management Ministerial Council, Commonwealth of Australia, Canberra. 1244 pp. http://www.nhmrc.gov.au/guidelines/publications/eh52
Guidelines for Drinking-water Quality Management for New Zealand, May 2017 80
Datasheets Aesthetic Determinands
TOTAL DISSOLVED SOLIDS
Description and CharacteristicsA high total dissolved solids (TDS) concentration is usually associated with a high ion concentration in the water and therefore a higher conductivity, which is a measure of the waters ability to carry electrical currents. See datasheet for conductivity.
The total dissolved solids in water comprise the inorganic salts and any dissolved organic matter. The principal ions contributing to TDS are carbonate, bicarbonate, chloride, sulphate, nitrate, sodium, potassium, calcium, and magnesium. Total dissolved solids influence other qualities of drinking-water, such as taste, hardness, corrosion properties, and tendency for encrustation. As a generalisation, calcium and bicarbonate (alkalinity) tend to predominate in hard or inland waters, while sodium and chloride tend to predominate in soft or coastal waters, while hydrothermal waters are both.
The concentration of total solids in seawater is over 35,000 mg/L.
At TDS values greater than 1000 mg/L, scaling may occur through the precipitation of salts from the water. The high level of dissolved material may also enhance corrosion through the improved ability of the water to carry electrical currents necessary for corrosion to occur. Water with low total dissolved solids can be aggressive on reticulation pipework and fittings because protective films are not formed.
Total dissolved solids may originate from natural sources including wind blow sea spray, sewage, effluent discharges, urban runoff, or industrial waste discharges.
The palatability of drinking-water has been rated according to TDS as follows (Bruvold and Daniels, 1990):
Total Dissolved Solids (mg/L) Quality <80 excellent 80 – 500 good500 – 800 fair800 – 1000 poor >1000 unacceptable
Water with extremely low TDS may taste flat and insipid.
Dietrich and Gallagher (2013) found in a large trial that a change from low to moderate TDS was more easily noticed than a change from high to moderate TDS content. When the reference water had low-TDS (26 mg/L), consumers could detect a TDS difference of around 185 mg/L compared with moderate or high TDS samples. However when the reference water was high TDS (524 mg/L) a greater difference in TDS (about 380 mg/L difference) was required for a difference in taste to be noticed compared with low or moderate concentrations. Taste discrimination varied among consumers and some individuals could detect smaller changes in TDS than others.
Typical Concentrations in Drinking-waterNew Zealand drinking-waters contain TDS levels, approximated from conductivity measurements, that range from 20 to 2400 mg/L; however, most are less than 300 mg/L. Typical NZ surface waters contain 60 – 120 mg/L, and groundwaters 80 – 250 mg/L.
Guidelines for Drinking-water Quality Management for New Zealand, May 2017 81

Datasheets Aesthetic Determinands
Removal MethodsIt is difficult and expensive to remove dissolved salts from drinking-water. Suitable technologies include reverse osmosis, ion exchange, and distillation, but all of these require considerable energy input and can be expensive to operate. Lime softening may also be effective where total dissolved solids are mainly due to hardness.
Analytical MethodsThe most common and least expensive method of determining TDS values is to convert electrical conductivity measurements by multiplication with a factor that varies with the type of water (refer to Conductivity Data Sheet). The most accurate method of TDS determination entails the summation of the concentration of all the major anions and of cations from a water sample analysis.
A gravimetric measurement following filtration is the most common analytical method. Total dissolved solids is defined as the residue remaining after evaporation at 105oC of a 0.45 micron filtered sample; good quality drinking-water samples shouldn’t need filtering!
Health ConsiderationsThere is no evidence of deleterious physiological reactions occurring in persons consuming drinking-water supplies that have high total dissolved solid levels. There have been some suggestions that high TDS may reduce the effectiveness of chemical sanitation, but the nature of individual components will give a better correlation with chlorine effectiveness. No health-based guideline value for TDS has been proposed (WHO 2011).
Guideline ValueConductivity is usually easier to measure, so a datasheet has been prepared. It contains the following paragraph (also refer to the silica datasheet):
Conductivity is an analytical tool, most often used to approximate total dissolved solids (TDS). Total dissolved solids (mg/L) in a sample can be estimated by multiplying conductivity (in mS/m) by an empirical factor. This factor may vary from 5.5 to 7, but higher values up to 9.6 may be associated with waters high in sulphate. The relationship is also distorted in samples with a high silica content, e.g. many groundwaters.
Based on taste, and the need to reduce excessive scaling and corrosion, total dissolved solids in drinking-water should not exceed 1000 mg/L, the guideline value set in the DWSNZ.
The aesthetic objective in Canada is not greater than 500 mg/L. The USEPA (2009/2011) has a secondary drinking water regulation level of 500 mg/L.
The Australian Drinking Water Guidelines (NHMRC, NRMMC 2011) state that no specific health guideline value is provided for total dissolved solids (TDS), as there are no health effects directly attributable to TDS. However for good palatability total dissolved solids in drinking water should not exceed 600 mg/L. The palatability of drinking water can be rated according to TDS concentrations based on taste:
<600 mg/L is regarded as good quality drinking-water600 – 900 mg/L is regarded as fair quality900 – 1200 mg/L is regarded as poor quality>1200 is regarded as unacceptable or unpalatable.
Earlier versions had stated that total dissolved solids in drinking water should not exceed 500 mg/L.
Guidelines for Drinking-water Quality Management for New Zealand, May 2017 82
Datasheets Aesthetic Determinands
WRF (2015) notes that the combination of temperature and TDS level are the controlling factors in the perception (taste) of TDS, with higher drinking water temperatures (e.g. 25 - 30ºC) and higher TDS levels being most perceptible.
ANZECC/ARMCANZ (2000) covers guideline values for livestock (these guidelines were to be updated in 2012). The following apply to total dissolved solids:
Tolerances of livestock to total dissolved solids (salinity) in drinking water a
Livestock
Total Dissolved Solids (mg/L)No adverse effects on animals expected
Animals may have initial reluctance to drink or there may be some scouring, but stock should adapt without loss of production
Loss of production and a decline in animal condition and health would be expected. Stock may tolerate these levels for short periods if introduced gradually
Beef cattle 0 – 4000 4000 – 5000 5000 – 10000Dairy cattle 0 – 2400 2400 – 4000 4000 – 7000Sheep 0 – 4000 4000 – 10000 10000 – 13000 b
Horses 0 – 4000 4000 – 6000 6000 – 7000Pigs 0 – 4000 4000 – 6000 6000 – 8000Poultry 0 – 2000 2000 – 3000 3000 – 4000
a Adapted from ANZECC (1992);b Sheep on lush green feed may tolerate up to 13000 mg/L TDS without loss of condition or production.
BibliographyANZECC/ARMCANZ (2000). Australian and New Zealand Guidelines for Fresh and Marine
Water Quality. http://www.mfe.govt.nz/publications/water/anzecc-water-quality-guide-02/anzecc-water-quality-guide-02-pdfs.html
APHA (2005). Standard Methods for the Examination of Water and Wastewater (21st Edition). Washington: American Public Health Association, American Water Works Association, Water Environment Federation.
Bruvold, W. H. and J. I Daniels (1990). Standards for mineral content in drinking water. Journal of the American Water Works Association, 82 (2), 59-65.
Dietrich AM and CD Gallagher (2013). Consumer ability to detect the taste of total dissolved solids. J. AWWA, 105 (5); E255-E263.
NHMRC, NRMMC (2011). Australian Drinking Water Guidelines Paper 6 National Water Quality Management Strategy. National Health and Medical Research Council, National Resource Management Ministerial Council, Commonwealth of Australia, Canberra. 1244 pp. http://www.nhmrc.gov.au/guidelines/publications/eh52
USEPA (2009). 2009 Edition of the Drinking Water Standards and Health Advisories. US Environmental Protection Agency, Washington, DC. EPA 822-R-09-011. 18 pp. Available at: http://water.epa.gov/action/advisories/health_index.cfm
USEPA (2011). 2011 Edition of the Drinking Water Standards and Health Advisories. US Environmental Protection Agency, Washington, DC. Available at: http://water.epa.gov/action/advisories/health_index.cfm or www.epa.gov/waterscience/
WHO (2003). Total dissolved solids in drinking-water. Background document for preparation of WHO Guidelines for Drinking-water Quality. Geneva, World Health Organization
Guidelines for Drinking-water Quality Management for New Zealand, May 2017 83

Datasheets Aesthetic Determinands
(WHO/SDE/WSH/03.04/16). http://www.who.int/water_sanitation_health/dwq/chemicals/tds/en/
WHO (2004). Guidelines for Drinking-water Quality (3rd Ed.). Geneva: World Health Organization. Available at: www.who.int/water_sanitation_health/dwq/gdwq3/en/print.html see also the addenda
WHO (2011). Guidelines for Drinking-water Quality 2011 (4th Ed.). Geneva: World Health Organization. Available at: http://www.who.int/water_sanitation_health/publications/2011/dwq_guidelines/en/index.html
WRF (2015). EPA Secondary Maximum Contaminant Levels: A Strategy for Drinking Water Quality and Consumer Acceptability. Water Research Foundation. 70 pp. http://www.waterrf.org/PublicReportLibrary/4537.pdf
Guidelines for Drinking-water Quality Management for New Zealand, May 2017 84
Datasheets Aesthetic Determinands
TRICHLOROBENZENES1,2,3-trichlorobenzene, CAS No.: 87-61-61,2,4-trichlorobenzene, CAS No.: 120-82-11,3,5-trichlorobenzene, CAS No.: 108-70-3
Sometimes referred to as trichlorbenzols, TCBs.
Maximum Acceptable ValueWHO (2004 and 2011) stated that because trichlorobenzenes occur at concentrations well below those at which toxic effects are observed, it is not considered necessary to derive a health-based guideline value.
In the 2005 DWSNZ, the provisional MAV for trichlorobenzenes (total) in drinking-water had been 0.03 mg/L.
Both the maximum contaminant level (MCL) and the lifetime health advisory for 1,2,4-trichlorobenzene (USEPA 2006/2009/2011) is 0.07 mg/L.
The USEPA (2006/2009/2011) established a lifetime health advisory for 1,3,5-trichlorobenzene of 0.04 mg/L, where the lifetime health advisory is the concentration of a chemical in drinking water that is not expected to cause any adverse noncarcinogenic effects for a lifetime of exposure, and is based on exposure of a 70-kg adult consuming 2 litres of water per day. The Lifetime HA for Group C carcinogens includes an adjustment for possible carcinogenicity.
The Australian Drinking Water Guidelines (NHMRC, NRMMC 2011) state that based on aesthetic considerations (taste and odour), the concentration of trichlorobenzenes in drinking water, either individually or in total, should not exceed 0.005 mg/L. Trichlorobenzenes would not be a health concern unless the concentration exceeded 0.03 mg/L.
The trichlorobenzenes are aesthetic determinands, with GVs in DWSNZ (2008) as below (based on odour):
1,2,3-trichlorobenzene, 0.01 mg/L1,2,4-trichlorobenzene, 0.005 mg/L1,3,5-trichlorobenzene, 0.05 mg/L
EU (2003) states that WHO (1993) reports an odour threshold for 0.005 - 0.030 mg 1,2,4-TCB/L and a taste threshold of 0.030 mg/L.
1,2,4-Trichlorobenzene is one of the “priority pollutants” under the US Clean Water Act.
Sources to Drinking-water1. To Source WatersTrichlorobenzenes may be found in raw water through industrial and agricultural activity. Industrial grade trichlorobenzene is more than 90% 1,2,4-trichlorobenzene with the remainder 1,2,3-trichlorobenzene, and is used as an intermediate in chemical synthesis, a solvent, a coolant, a dielectric fluid, a synthetic transfer oil, a lubricant, and a heat transfer medium; it is also used in polyester dyeing, in termite preparations, and in the manufacture of pesticides.
Guidelines for Drinking-water Quality Management for New Zealand, May 2017 85

Datasheets Aesthetic Determinands
In a Canadian river, levels of 0.002, 0.007 and 0.002 mg/L were reported for 1,2,3-TCB, 1,2,4-TCB and 1,3,5-TCB, respectively. For 1,2,4-trichlorobenzene EU (2003) reports that in the Niagara River (Canada) the mean measured value of weekly samples taken over 2 years was 16 ±16 ng/L and the median value was 12 ng/L (0.012 µg/L). Monitoring data from rivers and lakes in Europe and North America show 1,2,4-TCB levels up to around 1 μg/l, and the vast majority of levels being one or two orders of magnitude less than this concentration level. Generally, monitoring data later than 1992 show levels of two to three orders of magnitude less than earlier monitoring data.
2. From Treatment ProcessesNo known sources.
3. From the Distribution SystemNo known sources.
Fate and Form in the EnvironmentThe trichlorobenzenes are expected to adsorb to soils of high organic content and are not expected to leach appreciably into groundwater, however they may leach into groundwater in sandy soils with low content of organic carbon. Trichlorobenzenes will not hydrolyse and are unlikely to biodegrade significantly. Some evaporation may occur from soil surfaces.
In water, trichlorobenzenes are likely to adsorb to sediments and bioconcentrate in aquatic organisms. Evaporation from water may be a significant removal process if the organic and particulate matter levels are low. Half-lifes of 1,2,4-trichlorobenzene in water range from 1 day in rivers to 10 days in lakes and 100 days in groundwaters (USEPA 1994).
EU (2008) reports the water solubility of 1,2,3-trichlorobenzene is about 17 mg/L at 25°C. The partition coefficient n-octanol/water = logKow = 3.93 to 4.05.
EU (2008a) reports the water solubility of 1,2,4-trichlorobenzene is 36 mg/L at 20°C. The partition coefficient n-octanol/water = logKow = 4.05. Henry’s law constant is about 200 Pa.m3/mol. The hydrolysis half-life at pH7 is 190 days; EU (2003).
If released to soil, 1,2,3-trichlorobenzene is expected to have low to no mobility based upon Koc values of 1380 to 7943. Volatilisation from moist soil surfaces is expected to be an important fate process based upon a Henry's Law constant of 1.25 x 10⁻³ atm-cu m/mole. However, adsorption to soil is expected to attenuate volatilisation. 1,2,3-Trichlorobenzene is expected to biodegrade slowly in soils and water with biodegradation half-lifes ranging from several weeks to several months. If released into water, 1,2,3-trichlorobenzene is expected to adsorb to suspended solids and sediment based upon the Koc values. Volatilisation from water surfaces is expected to be an important fate process based on its Henry's Law constant. Estimated volatilisation half-lifes for a model river and model lake are 4.9 hours and 5.6 days, respectively. However, volatilisation from water surfaces is expected to be attenuated by adsorption to suspended solids and sediment in the water column. The estimated volatilisation half-life from a model pond is 65 days if adsorption is considered. BCFs of 130 in carp to 245,470 in fathead minnow, suggest bioconcentration in aquatic organisms is high to very high. Hydrolysis is not expected to be an important environmental fate process since this compound lacks functional groups that hydrolyse under environmental conditions. EAWAG (accessed Feb 2015).
The half-life of 1,2,4-trichlorobenzene in surface waters exposed to summer sunlight at 40° latitude, was calculated as 450 years, suggesting that the compound is not expected to be
Guidelines for Drinking-water Quality Management for New Zealand, May 2017 86

Datasheets Aesthetic Determinands
susceptible to direct photolysis by sunlight. If released to soil, 1,2,4-trichlorobenzene is expected to have moderate to no mobility based upon Koc values of 440 to 10,715. Volatilisation from moist soil surfaces is expected to be an important fate process based upon a Henry's Law constant of 1.42 x 10⁻³ atm-cu m/mole. However, adsorption to soil is expected to attenuate volatilisation. 1,2,4-Trichlorobenzene is expected to biodegrade slowly in soils, with biodegradation half-lives ranging from several weeks to a few months. If released into water, 1,2,4-trichlorobenzene is expected to adsorb to suspended solids and sediment based upon the Koc values; however, it may leach through sandy soils to groundwater. The aerobic and anaerobic biodegradation half-lifes of 1,2,4-trichlorobenzene in natural waters was reported as 28 and 110 days, respectively. Volatilisation from water surfaces is expected to be an important fate process based its Henry's Law constant. Estimated volatilisation half-lifes for a model river and model lake are 4.8 hours and 5.6 days, respectively. However, volatilisation from water surfaces is expected to be attenuated by adsorption to suspended solids and sediment in the water column. The volatilisation half-life from a model pond is up to 86 days when adsorption is considered. Measured BCF values of 120 in carp to 57,544 in Atlantic croaker suggest bioconcentration in aquatic organisms is high to very high. A hydrolysis half-life was given as 3.4 years for 1,2,4-trichlorobenzene. EAWAG (accessed Feb 2015).
Typical Concentrations in Drinking-waterThe P2 Chemical Determinand Identification Programme, sampled from 294 zones, did not find any trichlorobenzenes at detectable concentrations (Limit of detection = 0.0005 mg/L); ESR (2001).
22 water utilities in the US reported detecting 1,2,3-trichlorobenzene in tap water since 2004, according to EWG's analysis of water quality data supplied by state water agencies, the highest concentration being 0.0018 mg/L.
Tap water concentrations in Canada were reported with the highest being for 1,2,4-TCB, for which the mean reported level was 0.000002 mg/L and 0.000008 mg/L in the US. The maximum value for all isomers found in a groundwater survey in the Netherlands was 0.0012 mg/L. 55 water utilities in the US reported detecting 1,2,4-trichlorobenzene in tap water since 2004, according to EWG's analysis of water quality data supplied by state water agencies, the highest concentration being 0.002 mg/L.
Removal MethodsThe concentration of 1,2,4-trichlorobenzene in the Rhine River was 0.5 μg/L before infiltration and observed to have the average concentration of 0.3 μg/L after bank infiltration and 0.01 μg/L after dune infiltration. EU (2003).
The concentration of trichlorobenzenes in water can be reduced by adsorption on to granular activated carbon. Treatment processes that remove particulate matter are likely to reduce the concentration of trichlorobenzenes.
Analytical MethodsReferee MethodPurge and Trap Capillary Column Gas Chromatographic/Mass Spectrometric Method (APHA
6200B, EPA 524.2).
Some Alternative Methods1. Purge and Trap Capillary-Column Gas Chromatographic Method (APHA 6200C, EPA
502.2).
Guidelines for Drinking-water Quality Management for New Zealand, May 2017 87
Datasheets Aesthetic Determinands
Health ConsiderationsGeneral population exposure will result primarily from air and food.
All three isomers of trichlorobenzenes are readily absorbed following oral administration in rats. In rats and rabbits the trichlorobenzenes are metabolised to trichlorophenols and mercapturic acids. High concentrations of the parent compound were found in fat, skin and liver, whereas high levels of metabolites were found in kidney and muscle.
Trichlorobenzenes are of moderate acute toxicity. After short-term oral exposure, all three isomers show similar toxic effects, predominantly on the liver and thyroid.
Chronic and carcinogenicity studies via the oral route have not been carried out, but trichlorobenzenes did not exhibit mutagenic activity in tests with bacteria.
Trichlorobenzenes are moderately toxic to humans when ingested or inhaled. They are skin, eye and respiratory tract irritants. There has been one report of aplastic anaemia in a woman chronically exposed to 1,2,4-trichlorobenzene from washing work clothes.
The reference dose or RfD (USEPA 2006/2009/2011) for 1,2,4-trichlorobenzene is 0.01 mg/kg/d. The Drinking Water Equivalent Level or DWEL (USEPA 2006/2009/2011) is 0.35 mg/L. The oral RfD had earlier been 0.005 mg/kg/d (USEPA 1993).
The reference dose or RfD (USEPA 2006/2009/2011) for 1,3,5-trichlorobenzene is 0.006 mg/kg/d. The Drinking Water Equivalent Level or DWEL (USEPA 2006/2009/2011) is 0.2 mg/L.
ATSDR (2010, confirmed Oct 2015: http://www.atsdr.cdc.gov/mrls/pdfs/atsdr_mrls.pdf) quotes a minimal risk level (MRL) for 1,2,4-trichlorobenzene of:
0.1 mg/kg/day for intermediate-duration oral exposure (15 – 364 days)0.1 mg/kg/day for chronic-duration oral exposure (>364 days) was derived.
Derivation of Maximum Acceptable ValueNo MAV.
WHO (2004 and 2011) states that because TCBs occur at concentrations well below those at which toxic effects are observed, it is not considered necessary to derive a health-based guideline value. It should be noted that the health-based value exceeds the lowest reported odour threshold in water.
In DWSNZ 2005, the provisional MAVs had been derived as follows (WHO 2011 now calls this a health-based value): long-term toxicity and carcinogenicity studies via the oral route have not been carried out, but the available data suggest that all three isomers are not genotoxic. Therefore, a tolerable daily intake approach has been used for the derivation of the MAV for trichlorobenzenes in drinking-water. The no-observable-adverse-effect level used in the derivation is based on liver toxicity identified in a 13-week rat study.
7.7 mg/kg body weight per day x 70 kg x 0.1 = 0.027 mg/L (rounded to 0.03 mg/L)2 L x 1000
where:- No-observable-adverse-effect level = 7.7 mg/kg body weight per day for liver toxicity
identified in a 13-week rat study
Guidelines for Drinking-water Quality Management for New Zealand, May 2017 88

Datasheets Aesthetic Determinands
- Average weight of an adult = 70 kg- Proportion of tolerable daily intake allocated to drinking-water = 0.1- Average quantity of water consumed by an adult per day = 2 L- Uncertainty factor = 1000 (100 for intra- and interspecies variation and 10 for the short
duration of the study).
The MAV calculated as above would be 0.03 mg/L for each isomer, but because of the similarity in the toxicity of the trichlorobenzene isomers, the MAV was for total trichlorobenzenes.
BibliographyAPHA (2005). Standard Methods for the Examination of Water and Wastewater (21st Edition).
Washington: American Public Health Association, American Water Works Association, Water Environment Federation.
ATSDR (2007). Toxicological Profile for Trichlorobenzenes. Agency for Toxic Substances and Disease Registry, Division of Toxicology and Environmental Medicine, Atlanta, GA. http://www.atsdr.cdc.gov/toxprofiles/index.asp
Canadian Water Quality Guidelines. 1992.EAWAG (accessed Feb 2015). Biocatalysis/Biodegradation Database. Select 1396 compounds.
http://eawag-bbd.ethz.ch/index.htmlESR (2001). A report on the chemical quality of New Zealand’s community drinking water
supplies. Client Report FW0120, prepared as part of a Ministry of Health Contract for Scientific Services. 333 pp.
EU (2003). European Union Risk Assessment Report. 1,2,4-Trichlorobenzene. 204 pp. http://echa.europa.eu/documents/10162/44180838-c246-4d42-9732-45e2af411e52
EU (2008). Results of the evaluation of the PBT/VPVB properties of 1,2,3-trichlorobenzene. 7 pp. http://echa.europa.eu/documents/10162/d8ffe8bd-fcd6-4ef4-b1c4-b78aafff14ac
EU (2008a). Results of the evaluation of the PBT/VPVB properties of 1,2,4-trichlorobenzene. 13 pp. http://echa.europa.eu/documents/10162/d8ffe8bd-fcd6-4ef4-b1c4-b78aafff14ac
EWG (accessed 2010). Environmental Working Group. National Drinking Water Database – Chemical Contaminants. http://www.ewg.org/tap-water/chemical-contaminants
IPCS (1991). Chlorobenzenes other than hexachlorobenzene, Environmental Health Criteria 128. INCHEM. International Programme on Chemical Safety. http://www.inchem.org/documents/ehc/ehc/ehc128.htm
NHMRC, NRMMC (2011). Australian Drinking Water Guidelines Paper 6 National Water Quality Management Strategy. National Health and Medical Research Council, National Resource Management Ministerial Council, Commonwealth of Australia, Canberra. 1244 pp. http://www.nhmrc.gov.au/guidelines/publications/eh52
USEPA (1988). Methods for the Determination of Organic Compounds in Drinking Water. USEPA Methods can be accessed at http://water.epa.gov/scitech/drinkingwater/labcert/methods_index.cfm
USEPA (1993). 1,2,4-Trichlorobenzene. Integrated Risk Information System (IRIS). http://cfpub.epa.gov/ncea/iris/index.cfm?fuseaction=iris.showSubstanceList or http://www.epa.gov/iris/subst/0196.htm
USEPA (1994). Chemical Fact Sheets: 1,2,4-Trichlorobenzene. EPA 749-F-95-020a. http://www.epa.gov/chemfact/
USEPA (2006). 2006 Edition of the Drinking Water Standards and Health Advisories. US Environmental Protection Agency, Washington, DC. EPA 822-R-06-013. Available at: http://water.epa.gov/action/advisories/health_index.cfm
USEPA (2009). 2009 Edition of the Drinking Water Standards and Health Advisories. US Environmental Protection Agency, Washington, DC. EPA 822-R-09-011. Available at: http://water.epa.gov/action/advisories/health_index.cfm
Guidelines for Drinking-water Quality Management for New Zealand, May 2017 89
Datasheets Aesthetic Determinands
USEPA (2011). 2011 Edition of the Drinking Water Standards and Health Advisories. US Environmental Protection Agency, Washington, DC. Available at: http://water.epa.gov/action/advisories/health_index.cfm or www.epa.gov/waterscience/
WHO (2004). Chlorobenzenes other than hexachlorobenzene: environmental aspects. Concise International Chemical Assessment Document (CICAD) 60. International Programme on Chemical Safety (IPCS). 61 pp. See: www.who.int/entity/ipcs/publications/cicad/en/CICAD60_Chlorobenzenes_2004_08_04.pdf
WHO (2004). Guidelines for Drinking-water Quality 2004 (3rd Ed.). Geneva: World Health Organization. Available at: www.who.int/water_sanitation_health/dwq/gdwq3/en/print.html see also the addenda
WHO (2004a). Trichlorobenzenes in drinking-water. Background document for preparation of WHO Guidelines for Drinking-water Quality. Geneva, World Health Organization (WHO/SDE/WSH/03.04/117). This document is available on the Internet at: http://www.who.int/water_sanitation_health/dwq/chemicals/trichlorobenzenes/en/
WHO (2011). Guidelines for Drinking-water Quality 2011 (4th Ed.). Geneva: World Health Organization. Available at: http://www.who.int/water_sanitation_health/publications/2011/dwq_guidelines/en/index.html
Guidelines for Drinking-water Quality Management for New Zealand, May 2017 90

Datasheets Aesthetic Determinands
TURBIDITY
Refer also to datasheet on suspended solids
Description and CharacteristicsTurbidity in water is caused by the presence of fine suspended matter such as clay, silt, colloidal inorganic and/or organic particles, and micro-organisms.
In addition to being aesthetically displeasing, turbidity can protect pathogenic micro-organisms from the effect of disinfection processes and promote disinfection deficiencies. Some heavy metals, pesticides and micro-organisms can be adsorbed and so concentrate on to the surface of some suspended particles.
Examples of turbidity due to micro-organisms are the summer blooms of blue-green algae (cyanobacteria) in surface water, algal debris, and the detritus from iron bacteria in distribution systems (red water).
Turbidity is related to the light scattering properties of a water, and for nephelometric turbidity (required in these Guidelines) it is defined such that 40 NTU is the turbidity of a standard formazin suspension.
Turbidity is an empirical test used in the DWSNZ as a surrogate for the removal of protozoal (oo)cysts following coagulation and/or filtration of a water. Particle counting can be used as an alternative.
Typical Concentrations in Drinking-waterNew Zealand drinking waters have a turbidity range up to (say) 180 NTU, however most waters are less than 2 NTU.
Removal MethodsCoagulation followed by filtration through granular media is used widely to reduce turbidity down to 0.3 NTU or lower. Some very fine filters, e.g. microfiltration, can reduce the turbidity level without coagulation.
Analytical MethodsTurbidity is measured using a lab-bench turbidimeter, with the detector at right angles to the source, using white light from a tungsten lamp. The instrument is calibrated using suitable standards (e.g. formazin) and results are expressed in Nephelometric turbidity units (NTU). The detection limit for most instruments is 0.1 NTU or better. Turbidity measurement is discussed in Chapter 8: Protozoal Compliance.
Turbidity measurements are often made in the field, and on-line for process control purposes. Portable turbidimeters and on-line meters are available. Laser turbidimeters have been developed in recent years which can measure fairly reliably below 0.20 NTU.
NEMS (2013) covers site selection and deployment, instrumentation, data acquisition, and data processing and preservation.
The original method for measuring turbidity was with Jackson candles, the results being expressed as Jackson turbidity units (JTU). WHO (2017) refers to FNU (considered equivalent to NTU) where FNU means formazin nephelometric units; these use infrared light.
Guidelines for Drinking-water Quality Management for New Zealand, May 2017 91
Datasheets Aesthetic Determinands
Health ConsiderationsHighly turbid water does not necessarily constitute a health hazard but turbidities above 1 NTU can protect harmful micro-organisms from the effects of all disinfection techniques, and the particles may adsorb toxic organic or inorganic compounds. Refer to comments in above sections on protozoan cysts.
The British Columbia Ministerial Technical Advisory Committee produced a large report that discussed the history, meaning and use of turbidity in drinking-water in relation to public health.
A study by DWI (2005) found there is some evidence that increases in turbidity of final water are associated with subsequent increases in the incidence of acute gastrointestinal illness at varying lags. Lags of between 4 and 13 days were commonly reported. A peak in acute gastrointestinal illness at certain lags following days of high final water turbidity was consistently found across studies. This association is unlikely to be the result of measurement error, bias or random error and warrants further investigation.
Increases of turbidity in the distribution system can indicate ingress of particulate matter during laying new watermains, main breaks, backflow, scouring of sediments, corrosion products and biomass.
Guideline ValueBased on aesthetic considerations alone, turbidity should not exceed 2.5 NTU, the guideline value set in the DWSNZ. As a guide, water with a turbidity of 5 NTU would appear slightly muddy or milky in a glass. It would not be possible to see through the glass if the turbidity was over 60 NTU. Crystal clear water usually has a turbidity of less than 0.5 NTU.
Although 2.5 NTU is the aesthetic guideline value, the controlling requirement will invariably be that defined in the DWSNZ for bacterial compliance or protozoal (oo)cyst removal/inactivation, for each water treatment process: see DWSNZ.
In 2003 Health Canada established a treated water guideline of <0.1 NTU at all times for individual filters treating surface water. Where not achievable they require:
≤0.3 NTU for chemically assisted filtration: ≤0.3 NTU in at least 95% of a) measurements made or b) of the time each calendar month; never to exceed 1.0 NTU.≤1.0 NTU for slow sand or diatomaceous earth filtration: ≤1.0 NTU in at least 95% of a) measurements made or b) of the time each calendar month; never to exceed 3.0 NTU.≤0.1 NTU for membrane filtration: ≤0.1 NTU in at least 99% of a) measurements made or b) of the time each calendar month; never to exceed 0.3 NTU.
The Australian Drinking Water Guidelines (NHMRC, NRMMC 2011) state that (1) based on aesthetic considerations, the turbidity should not exceed 5 NTU at the consumer’s
tap(2) if disinfection with chlorine is practised, then a turbidity of less than 1 NTU is desirable at
the time of disinfection(3) for chlorine-resistant pathogen reduction: where filtration alone is used as the water
treatment process to address identified risks from Cryptosporidium and Giardia, it is essential that filtration is optimised and consequently the target for the turbidity of water leaving individual filters should be less than 0.2 NTU, and should not exceed 0.5 NTU at any time.
Guidelines for Drinking-water Quality Management for New Zealand, May 2017 92
Datasheets Aesthetic Determinands
The Prescribed Concentration or Value (PCV) for turbidity in England and Wales is 4 NTU at consumers’ taps and 1 NTU at the WTP. See Notes.
BibliographyAPHA (2005). Standard Methods for the Examination of Water and Wastewater (21st Edition).
Washington: American Public Health Association, American Water Works Association, Water Environment Federation.
British Columbia Ministerial Technical Advisory Committee. Turbidity and Microbial Risk in Drinking Water. 69 pp. Feb 28 2008. www.health.gov.bc.ca/protect/pdf/TACsubmitted.pdf
DWI (2005). Study of the feasibility of investigating any potential relationship between the supply of discoloured water and gastrointestinal illness. 89 pp. http://dwi.defra.gov.uk/research/completed-research/reports/DWI70-2-169_Discolouredwater.pdf
Health Canada (2003). Guidelines for Canadian Drinking Water Quality – Supporting Documents. See http://www.hc-sc.gc.ca/home-accueil/search-recherche/a-z-eng.php and http://www.hc-sc.gc.ca/ewh-semt/water-eau/index-eng.php
NEMS (2013). Measurement, Processing and Archiving of Turbidity Data. National Environmental Monitoring Standards. 74 pp. https://www.lawa.org.nz/media/16586/nems-turbidity-recording-2013-06.pdf
NHMRC, NRMMC (2011). Australian Drinking Water Guidelines Paper 6 National Water Quality Management Strategy. National Health and Medical Research Council, National Resource Management Ministerial Council, Commonwealth of Australia, Canberra. 1244 pp. http://www.nhmrc.gov.au/guidelines/publications/eh52
WHO (2011). Guidelines for Drinking-water Quality 2011 (4th Ed.). Geneva: World Health Organization. Available at: http://www.who.int/water_sanitation_health/publications/2011/dwq_guidelines/en/index.html
WHO (2017). Water Quality and Health - Review of Turbidity: Information for regulators and water suppliers. WHO/FWC/WSH/17.01. 10 pp. http://apps.who.int/iris/bitstream/10665/254631/1/WHO-FWC-WSH-17.01-eng.pdf?ua=1
Guidelines for Drinking-water Quality Management for New Zealand, May 2017 93
Datasheets Aesthetic Determinands
UV ABSORBANCE/TRANSMITTANCE
(a) ABSORBANCE
Description and CharacteristicsSome organic compounds commonly found in water, such as tannins, lignins, fulvic acid and some aromatic compounds, strongly absorb ultraviolet light (radiation). UV absorbance (UV abs) is an empirical measure of the organic matter content in water. Most of this organic matter is dissolved or colloidal. UV absorbance has also been called UV absorption. It is unitless so must be defined by the wavelength used, cell path length, and whether the sample had been filtered.
Because many of the UV absorbing materials are coloured, UV abs can be used to measure (or more correctly, indicate) the amount of colour. Being a sensitive instrumental technique, it is a much reproducible method than the visual Hazen disc test. And being a very quick test as well, it is often used in place of the total organic carbon (TOC) test. TOC of around 10 mg/L may be indicated by a UV abs (or more correctly UV254, 10 mm) of 0.200 to 0.400; CRC (2005).
Not all UV absorbing compounds are coloured, so the UV abs test cannot really be used to compare different waters. Factors that affect the degree of UV absorbance and colour will be soil types, pasture/forest cover and type in the catchment, age of the organic matter i.e. whether it has just leached from the topsoil or flowed out of a swamp. CRC (2005) discusses some empirical methods for characterising UVabs.
Some of the UV absorbing material can form disinfection by-products, particularly trihalomethane formation potential (THMFP) so monitoring UV abs can be useful for indicating when a potential problem may arise.
Typical Concentrations in Drinking-waterGroundwater that has a low iron concentration can have a UV abs of <0.005 (254 nm, 10 mm cell). Likewise for rainwater. Most well-treated surface water supplies should have a UV abs <0.015.
Some typical UV absorbance values (254 nm, mf, 10 mm cell) for NZ raw waters are:lakes <0.010 (e.g. L. Taupo), others 0.010 – 0.030reservoirs, bush catchment 0.030 – 0.150streams and rivers 0.020 – 0.050 upper catchment; 0.050 – 0.100 lowerstreams draining swamp land 0.150 – 0.500
Removal MethodsNatural organic matter is removed to reduce colour, DBPs, and chlorine demand. Its removal may also restrict biofilm development.
Coagulation followed by filtration through granular media or membranes is used widely to reduce organic matter down to 0.01 or lower, as measured in a 10 mm cell). Without coagulation, microfiltration (MF) and ultrafiltration (UF) membranes remove little NOM as the NOM is smaller than the pore size of the membranes; in fact NOM can foul membranes (CRC 2005).
Activated carbon treatment processes should remove many types of organic matter. Oxidation processes (e.g. ozone) should break down some organic molecules.
Guidelines for Drinking-water Quality Management for New Zealand, May 2017 94
Datasheets Aesthetic Determinands
Measuring UV abs through the water treatment process offers a good indication of treatment efficiency.
Analytical MethodsBeing an empirical test, UV abs is defined by the test conditions rather than by traceable standardisation. Normally it is measured in a 10 mm cell in a UV-visible spectrophotometer at 254 nm (some labs have used 270 nm). Samples containing turbid matter should first be filtered through a 0.45 micrometre (micron) membrane filter. Some labs use glass fibre filters such as the Whatman GF/C. Drinking water samples can usually be measured directly. When reporting the results, record whether or not the sample was filtered, the wavelength and the cell path length.
The UV abs test is not really suitable for samples containing more than about 0.5 mg/L iron because (a) some forms of iron (ferrous) absorb UV light, and (b) if such a sample is filtered, the iron on the filter will remove some of the organic matter.
There is no standard. The test is controlled by paying attention to the test conditions, and by standard analytical control procedures. It is common to test deionised water to check readings near zero absorbance. A good quality compound that can be weighed, dissolved in water, and is stable can be used as a QC sample. Labs have used oxalic acid, tartrates, phthalates, thiosulphate etc for this purpose.
Health ConsiderationsBeing an empirical test for organic matter that absorbs UV light, UV abs does not correlate with any health considerations.
Guideline ValueThere is no recommended Guideline Value established by WHO, or in NZ. The Prescribed Concentration or Value (PCV) for total organic carbon in England and Wales is that there shall be “no abnormal change”. See Notes.
BibliographyAPHA (2005). Standard Methods for the Examination of Water and Wastewater (21st Edition).
Washington: American Public Health Association, American Water Works Association, Water Environment Federation.
CRC for Water Quality and Treatment (2005). [Now Water Research Australia.] Natural Organic Matter. 28 pp. http://www.waterra.com.au
(b) TRANSMITTANCE
DescriptionAlso called UV transmissivity or UVT. As for absorbance, it is an empirical test, so UVT is defined by the test conditions rather than by traceable standardisation. Normally it is measured in a 10 mm cell in a UV-visible spectrophotometer at 254 nm.
UV absorbance is the loss of light as it passes through a sample, and is measured from 0.000 to infinity (no units). If there is hardly any absorbance the reading will be very low, e.g. 0.005. If all the light is absorbed the reading will be near infinity.
Guidelines for Drinking-water Quality Management for New Zealand, May 2017 95
Datasheets Aesthetic Determinands
UV transmittance is the reciprocal of absorbance. It is measured from 0 to 1, or from 0% to 100%. If the water is exceptionally clear there will be no absorbance, i.e. all the light will be transmitted, so the reading will be 1 or 100% (no units).
Figure 6.1 in DWI (2016) depicts the relationship between colour and UVT as found in the UK. A colour of 20 Hazen approximates a UVT of 70%.
ApplicationUVT has become the test used in conjunction with UV disinfection to measure the potential loss of efficiency in the process due to the presence of organic matter, i.e. the inability of the lamp to provide sufficient radiation to inactivate the micro-organisms. Conversely the UVT reading can be used to regulate the dosage.
ConversionNote the units for UV transmittance on the validation certificate. The readings are not always reported for the traditional 10 mm path length. Annex C in ÖNORM (2001) is a table that relates UV transmittance readings at 100, 50 and 10 mm path lengths; it includes a column headed SSK per metre (spectral attenuation coefficient) which we call UV absorbance (10 mm) except SSK per metre is numerically 100 times larger. Appendix A1.5.9 in the DWSNZ shows how to convert UV absorbance to UV transmittance. Examples follow:
say the absorbance is 0.0721 (as measured in a 10 mm cell), i.e. A10mm = 0.0721
to convert to transmittance, see DWSNZ Appendix A1.5.9, which states A = -logT
therefore 0.0721 A = 0.847 T, or 84.7% T
Using ÖNORM: 84.7% T10mm = 43.6% T50mm = 19% T100mm = 7.212 SSK/m (= 0.0721 A10mm).
That is: %UVT = 10-(SSK/100) where SSK is SSK/m and measured at 254 nm.
An example of converting from UVT to UV abs follows:
Say T = 83% or 0.83
A = – log 0.83
= – (log 8.3 x 10⁻¹)
= – (0.919 – 1)
= 0.081
Conversely, %T = 100 x 10-A
The reading is dependent on the path length, so this must be quoted. A transmittance of 94 percent measured in a 10 mm cell is equivalent to 78 percent measured in a 40 mm cell.
See Chapters 8 and 15 of the Guidelines for more detail.
Bibliography
Guidelines for Drinking-water Quality Management for New Zealand, May 2017 96
Datasheets Aesthetic Determinands
DWI (2016). Comparison of Private Water Supply and Public Water Supply Ultraviolet (UV) Systems: Final Report. Report Reference: DEFRA10932.05. 177 pp. http://dwi.defra.gov.uk/research/completed-research/reports/DWI70-2-306.pdf
Osterreichisches Normungsinstitut (2001). Plants for the Disinfection of Water Using Ultraviolet Radiation: Requirements and testing low pressure mercury lamp plants. ÖNORM M5873-1. Vienna: Österreichisches Normungsinstitut.
Guidelines for Drinking-water Quality Management for New Zealand, May 2017 97
Datasheets Aesthetic Determinands
ZINC (Zn2+)
CAS No. 7440-66-6 (the metal).
Zinc is one of the “priority pollutants” under the US Clean Water Act.
Description and CharacteristicsZinc is an abundant, widespread element in the earth’s crust (average about 70 mg/kg) and is found most commonly as the zinc mineral sphalerite (ZnS). The natural zinc content of soils is estimated to be between 1 and 300 mg/kg.
The concentration of zinc in seawater is about 0.01 mg/L.
Zinc is present in plant and animal tissues, and food is the major source of zinc intake for humans. Drinking-water usually makes a negligible contribution to total intake. The carbonates, oxides, and sulphides of zinc are sparingly soluble, and therefore zinc is present in natural waters at low concentrations. The highly soluble chloride and sulphate salts are hydrolysed to form the hydroxide and carbonate. Zinc ions are strongly adsorbed to soils at pH 5 or greater and are expected to have low mobility in most soils. Zinc is taken up by plants and vegetables, and the normal zinc content is in the range of 15 to 100 mg/kg. Zinc accumulates in aquatic organisms, and bioconcentration factor values for freshwater fish and marine fish were reported as 1000 and 2000, respectively.
In surface waters and groundwaters the concentration of zinc from natural leaching is usually less than 0.01 mg/L. In natural waters, zinc can be found in several chemical forms, such as hydrated ions, metal-inorganic complexes, or metal-organic complexes. Tap water can contain much higher concentrations as a result of corrosion of zinc coated pipes, tanks and fittings. Zinc concentrations in galvanised iron rainwater tanks are typically 2 mg/L to 4 mg/L but have been reported as high as 11 mg/L.
Zinc is used as a coating to prevent corrosion of iron and steel products, and in the manufacture of brass; some waters can dezincify brass (see Chapter 10: Chemical compliance, Section 10.3.4). Zinc oxide is an important component in the manufacture of paint and rubber products, including tyres; zinc is also used in batteries. Zinc chloride is a primary ingredient in smoke bombs used for crowd dispersal, in fire-fighting exercises. Some pesticides and sun blocks contain zinc compounds.
Taste problems can occur if the zinc concentration in drinking-water exceeds 1.5 mg/L as Zn, the guideline value set in the DWSNZ. Water with a zinc concentration above 3 mg/L tends to be opalescent, develops a greasy film when boiled, and has an undesirable astringent metallic taste.
Typical Concentrations in Drinking-waterNew Zealand drinking-waters contain from 0.02 to 9 mg Zn/L, however, in the absence of corrosion products, most are less than 0.2 mg Zn/L. Higher levels usually indicate some metallic corrosion, e.g. dezincification of brass or dissolution of zinc from galvanised steel. Zinc has also been found to leach out of some plastic pipes and fittings.
The maximum concentration found in 28,976 samples from 3,166 groundwaters in the UK was 155 mg/L, mean 0.11 mg/L (DWI 2008).
Removal Methods
Guidelines for Drinking-water Quality Management for New Zealand, May 2017 98
Datasheets Aesthetic Determinands
Zinc salts are generally adsorbed to soil particles, so zinc concentrations in drinking-water can be reduced by alum coagulation at pH 6.5 - 7.0 (at least 30% removal) or by lime softening at pH 9.5 to pH 10 (60% removal).
Analytical MethodsThe concentration of zinc in drinking-water can be determined by atomic absorption spectroscopy or inductively coupled plasma emission spectroscopy. The limits of detection can be as low as 0.001 mg/L.
Health ConsiderationsZinc is an essential element for humans, being essential for the function of more than 300 enzymes; zinc is also involved in DNA and ribonucleic acid (RNA) synthesis and cell proliferation. Intake of zinc from food is more than sufficient to satisfy the recommended daily requirements. Drinking water is not regarded as an important nutritional source of this element. Nutritional zinc deficiency results in retarded growth, infantilism, anorexia, mental lethargy, skin changes and night blindness.
In 1982, JECFA proposed a daily dietary requirement of zinc of 0.3 mg/kg of body weight and a provisional maximum tolerable daily intake (PMTDI) of 1.0 mg/kg of body weight. The daily requirement for adult humans is 15 to 22 mg/day. It was concluded that, in the light of recent studies on humans, the derivation of a health-based guideline value is not required at this time.
Food may contain levels of zinc ranging from approximately 2 parts of zinc per million (2 ppm) parts of foods (e.g. leafy vegetables) to 29 ppm (meats, fish, poultry). Drinking-water is not usually a significant source of zinc.
Approximately 20 - 30% of dietary zinc is absorbed by the gastro-intestinal tract. Highest concentrations of zinc are found in the liver, kidney, bone, retina, prostate, and muscle. To function properly various enzyme systems require zinc such as alkaline phosphatase, carbonic anhydrase, and alcohol dehydrogenase. More than 70 zinc metallo-enzymes are known.
The astringent taste of zinc is likely to be caused by zinc binding to salivary proteins responsible for oral lubrication; WRF (2015).
In humans, consumption of excessive quantities of zinc can result in nausea, vomiting, diarrhoea and abdominal cramps, and subsequent copper deficiency, anaemia and gastric erosion.
In animal studies, zinc has been reported to reduce the toxic effects of nickel and cadmium.
As at July 2013 ATSDR (http://www.atsdr.cdc.gov/mrls/mrls_list.html) quotes a minimal risk level (MRL) of:
0.3 mg/kg/day for intermediate-duration oral exposure (15 – 364 days)0.3 mg/kg/day for chronic-duration oral exposure (>364 days).
The reference dose or RfD (USEPA 2009/2011) is 0.3 mg/kg/d. The Drinking Water Equivalent Level or DWEL (USEPA 2009/2011) is 10 mg/L. USEPA also has a lifetime health advisory of 2 mg/L, where the lifetime health advisory is the concentration of a chemical in drinking water that is not expected to cause any adverse noncarcinogenic effects for a lifetime of exposure, and is based on exposure of a 70-kg adult consuming 2 litres of water per day. The Lifetime HA for Group C carcinogens includes an adjustment for possible carcinogenicity.
Guidelines for Drinking-water Quality Management for New Zealand, May 2017 99
Datasheets Aesthetic Determinands
In establishing an RfD for zinc, the data on essentiality were combined with the data on toxicity to define a level that would meet physiological requirements without causing toxic responses when consumed daily for a lifetime. The exposure values that were considered in determining the RfD suggest that there is only one order of magnitude between the minimum amount of zinc that will maintain physiological function (5.5 mg/day) and the amount associated with appearance of potentially adverse effects (60 mg/day); USEPA (2005). The RfD of 0.3 mg/kg-day was derived by dividing the point of departure of 0.91 mg Zn/kg-day by a total uncertainty factor of 3.
EFSA (2014) states that chronic high zinc intake can result in severe neurological diseases attributable to copper deficiency. A Tolerable Upper Intake Level (UL) of 25 mg/day was set for adults, including pregnant and lactating women, based on studies of zinc supplementation for up to 14 weeks. A No Observed Adverse Effect Level of 50 mg/day was based on the absence of any adverse effect on a wide range of relevant indicators of copper status in controlled metabolic studies. An Uncertainty Factor of 2 was applied. The UL for children was extrapolated from the UL for adults using body weight to the power of 0.75 and reference body weights for European children.
There is no evidence that occupational exposure to zinc increases the risk of cancer. Zinc has been shown to induce chromosomal aberrations in mammalian cells, but is inactive in bacterial mutation tests.
USEPA (2005) states that there is inadequate information to assess the carcinogenic potential of zinc, because studies of humans occupationally-exposed to zinc are inadequate or inconclusive, adequate animal bioassays of the possible carcinogenicity of zinc are not available, and results of genotoxic tests of zinc have been equivocal. Either zinc deficiency or excessively high levels of zinc may enhance susceptibility to carcinogenesis, whereas supplementation with low to moderate levels of zinc may offer protection. For example, zinc deficiency enhanced carcinomas of the oesophagus induced by MBN but retarded the development of oral cancer induced by 4-NQO. Thus, zinc's modifying effect on carcinogenesis may depend on the dose of zinc as well as the carcinogen being affected. The mutagenicity of zinc, particularly in S. typhimurium, appears to depend greatly on the chemical form.
Guideline ValueBased on aesthetic considerations (taste), the concentration of zinc in drinking-water should not exceed 1.5 mg/L, i.e. about 4 mg/L as zinc sulphate (WHO 2011). This is the guideline value included in the DWSNZ.
The aesthetic objective in Canada is not greater than 5 mg/L after flushing. The USEPA established an organoleptic effect criterion of 5 mg/L for zinc. Source: Quality Criteria for Water, 1986 ("Gold Book"), http://www.epa.gov/wqc/national-recommended-water-quality-criteria-organoleptic-effects. The USEPA (2009/2011) has a secondary drinking water regulation level of 5 mg/L.
The Australian Drinking Water Guidelines (NHMRC, NRMMC 2011) state that based on aesthetic considerations (taste), the concentration of zinc in drinking water should be less than 3 mg/L. No health-based guideline value is proposed for zinc. The normal content of zinc in natural water is usually <0.01 mg/L, so zinc in drinking-water usually derives from corrosion of galvanised pipes/fittings, and brasses.
Guidelines for Drinking-water Quality Management for New Zealand, May 2017 100
Datasheets Aesthetic Determinands
The Minnesota Department of Health (MDH) has developed health-based rules and guidance to evaluate potential human health risks from exposures to chemicals in groundwater. The chronic health risk limit (exposure greater than 10% of a lifetime) for zinc is 2 mg/L.
The livestock guideline value is 20 mg/L (ANZECC/ARMCANZ 2000). These guidelines were to be updated in 2012.
The Environmental Protection Authority of New Zealand (www.epa.govt.nz) has established an environmental exposure limit (EEL) for zinc in fresh water (set by an approval under Part 5 of the HSNO Act) of 0.008 mg/L (8 µg/L).
BibliographyANZECC/ARMCANZ (2000). Australian and New Zealand Guidelines for Fresh and Marine
Water Quality. http://www.mfe.govt.nz/publications/water/anzecc-water-quality-guide-02/anzecc-water-quality-guide-02-pdfs.html
APHA (2005). Standard Methods for the Examination of Water and Wastewater (21st Edition). Washington: American Public Health Association, American Water Works Association, Water Environment Federation.
ATSDR (2005). Toxicological Profile for Zinc. Agency for Toxic Substances and Disease Registry. U.S. Department of Health and Human Services, Public Health Service. http://www.atsdr.cdc.gov/toxprofiles/tp60.html
DWI (2008). Review of England and Wales Monitoring Data for Which a National or International Standard Has Been Set. Defra Project Code: CEER 0703 DWI 70/2/215 WT1207. 148 pp. http://dwi.defra.gov.uk/research/completed-research/reports/DWI70_2_215_Monitoring_Data.pdf
EFSA (2014). Scientific Opinion on Dietary Reference Values for Zinc. EFSA Journal 2014; 12 (10): 3844. http://www.efsa.europa.eu/en/efsajournal/doc/3844.pdf
Health Canada (1979). Guidelines for Canadian Drinking Water Quality; Guideline Technical Documents. Zinc. 5 pp. http://www.hc-sc.gc.ca/ewh-semt/water-eau/drink-potab/index-eng.php
IPCS (2001). Zinc, Environmental Health Criteria 221. INCHEM. International Programme on Chemical Safety. http://www.inchem.org/documents/ehc/ehc/ehc221.htm
MDH (2009). Groundwater Values Table. Minnesota Department of Health (MDH). See: http://www.health.state.mn.us/divs/eh/risk/guidance/gw/table.html
NHMRC, NRMMC (2011). Australian Drinking Water Guidelines Paper 6 National Water Quality Management Strategy. National Health and Medical Research Council, National Resource Management Ministerial Council, Commonwealth of Australia, Canberra. 1244 pp. http://www.nhmrc.gov.au/guidelines/publications/eh52
USEPA (1992). RED Facts: Zinc Salts. EPA-738-F-92-007. 423 pp. http://www.epa.gov/oppad001/reds_list_ad.htm or http://www.epa.gov/oppsrrd1/REDs/old_reds/zinc_salt.pdf
USEPA (2005). Toxicological Review of Zinc and Compounds; In Support of Summary Information on the Integrated Risk Information System (IRIS). EPA/635/R-05/002. 83 pp. See: http://cfpub.epa.gov/ncea/iris/index.cfm?fuseaction=iris.showSubstanceList
USEPA (2009). 2009 Edition of the Drinking Water Standards and Health Advisories. US Environmental Protection Agency, Washington, DC. EPA 822-R-09-011. 18 pp. Available at: http://water.epa.gov/action/advisories/health_index.cfm
USEPA (2011). 2011 Edition of the Drinking Water Standards and Health Advisories. US Environmental Protection Agency, Washington, DC. Available at: http://water.epa.gov/action/advisories/health_index.cfm or www.epa.gov/waterscience/
Guidelines for Drinking-water Quality Management for New Zealand, May 2017 101
Datasheets Aesthetic Determinands
WHO (2003). Zinc in drinking-water. Background document for preparation of WHO Guidelines for Drinking-water Quality. World Health Organization, Geneva. (WHO/SDE/WSH/03.04/17). http://www.who.int/water_sanitation_health/dwq/chemicals/zinc/en/
WHO (2004). Guidelines for Drinking-water Quality (3rd Ed.). Geneva: World Health Organization. Available at: www.who.int/water_sanitation_health/dwq/gdwq3/en/print.html see also the addenda
WHO (2011). Guidelines for Drinking-water Quality 2011 (4th Ed.). Geneva: World Health Organization. Available at: http://www.who.int/water_sanitation_health/publications/2011/dwq_guidelines/en/index.html
WRF (2015). EPA Secondary Maximum Contaminant Levels: A Strategy for Drinking Water Quality and Consumer Acceptability. Water Research Foundation. 70 pp. http://www.waterrf.org/PublicReportLibrary/4537.pdf
Guidelines for Drinking-water Quality Management for New Zealand, May 2017 102