davies enterprise award application - himss davies... · davies enterprise award application date:...
TRANSCRIPT

Davies Enterprise Award Application
Date: November 20, 2014
Name of Organization: University of Iowa Health Care
Organization Address: 200 Hawkins Drive, Iowa City, IA 52242
Submitter Name: Dr. Douglas Van Daele/Lee Carmen
Submitter Title: CMIO/CIO
Submitter email: [email protected]/[email protected]
Core Item: Return on Investment
Executive Summary
Implementation of a robust Electronic Health Record (EHR) provides a foundation to support workflow optimization and growth, yet it is difficult to attribute benefits experienced to one single factor. In our analysis of a few key indicators, such as throughput in our Emergency Trauma Center (ED), documentation efficiencies, and order management, we see hard numbers in gains, all the while improving our service and quality. We’ve also experienced benefits in labor costs, resource utilization, and have received Meaningful Use payments since installing our EHR.
Even with a focus on a limited number of metrics, we unearthed a 159% return on our investment in year five of our implementation, far surpassing the conservative pre-implementation predictions of a break-even point in seven years. This translates to $103 million in total savings after the first five years.
These returns are gratifying, yet we continue to grow the number of metrics we are assessing for benefits realization and return on investment.
1 | P a g e
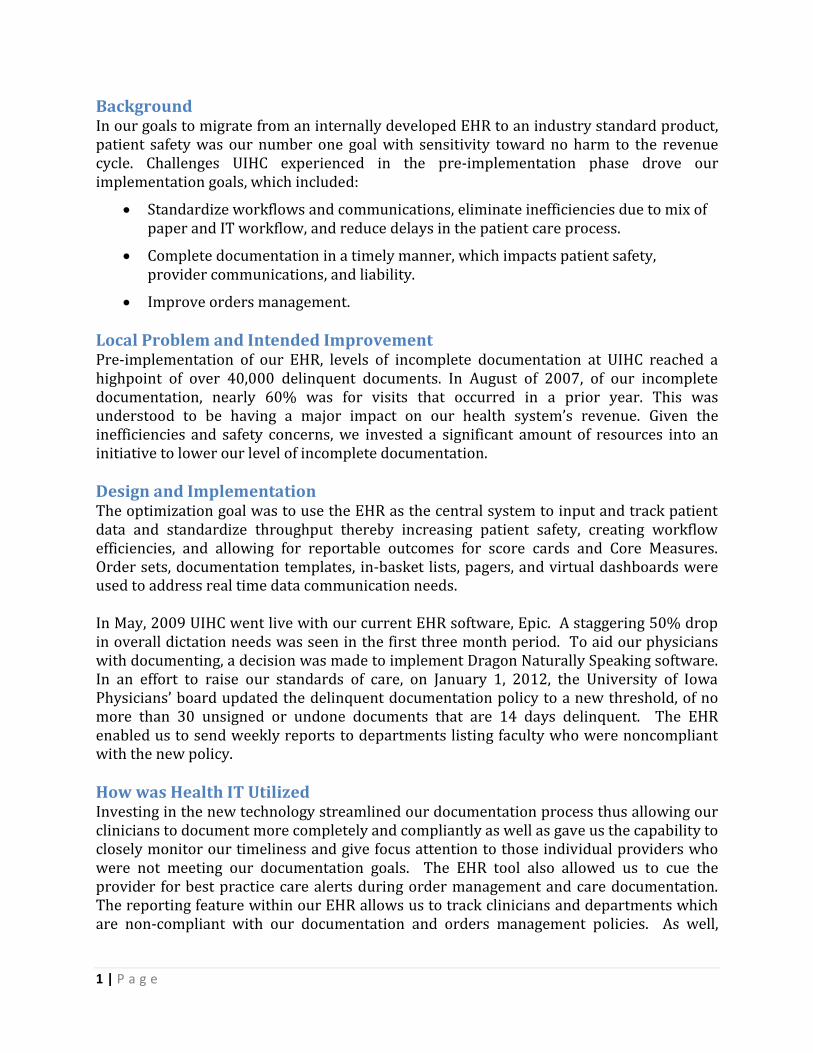
Background In our goals to migrate from an internally developed EHR to an industry standard product, patient safety was our number one goal with sensitivity toward no harm to the revenue cycle. Challenges UIHC experienced in the pre-implementation phase drove our implementation goals, which included:
Standardize workflows and communications, eliminate inefficiencies due to mix of paper and IT workflow, and reduce delays in the patient care process.
Complete documentation in a timely manner, which impacts patient safety, provider communications, and liability.
Improve orders management.
Local Problem and Intended Improvement Pre-implementation of our EHR, levels of incomplete documentation at UIHC reached a highpoint of over 40,000 delinquent documents. In August of 2007, of our incomplete documentation, nearly 60% was for visits that occurred in a prior year. This was understood to be having a major impact on our health system’s revenue. Given the inefficiencies and safety concerns, we invested a significant amount of resources into an initiative to lower our level of incomplete documentation.
Design and Implementation The optimization goal was to use the EHR as the central system to input and track patient data and standardize throughput thereby increasing patient safety, creating workflow efficiencies, and allowing for reportable outcomes for score cards and Core Measures. Order sets, documentation templates, in-basket lists, pagers, and virtual dashboards were used to address real time data communication needs.
In May, 2009 UIHC went live with our current EHR software, Epic. A staggering 50% drop in overall dictation needs was seen in the first three month period. To aid our physicians with documenting, a decision was made to implement Dragon Naturally Speaking software. In an effort to raise our standards of care, on January 1, 2012, the University of Iowa Physicians’ board updated the delinquent documentation policy to a new threshold, of no more than 30 unsigned or undone documents that are 14 days delinquent. The EHR enabled us to send weekly reports to departments listing faculty who were noncompliant with the new policy.
How was Health IT Utilized Investing in the new technology streamlined our documentation process thus allowing our clinicians to document more completely and compliantly as well as gave us the capability to closely monitor our timeliness and give focus attention to those individual providers who were not meeting our documentation goals. The EHR tool also allowed us to cue the provider for best practice care alerts during order management and care documentation. The reporting feature within our EHR allows us to track clinicians and departments which are non-compliant with our documentation and orders management policies. As well,

2 | P a g e
Table 1. University of Iowa HealthCare ROI analysis
interactive dashboards alert staff real-time to the necessary documentation components so to keep current and better support of patient care during transitions of care.
Value/Derived Outcomes Prior to implementation, studies suggested that we had the opportunity over a seven year period to achieve break-even point in benefits and to free up an additional $17 million dollars of available staff time from implementing an EHR. Our reality far surpassed this prediction as laid out in the following ROI analysis in Table 1. After the first five years, we have 159% ROI. Using a 3.5% discount rate, our investment in an EHR has a Net Present Value (NPV) of $81.2 million and the Internal Rate of Return (IRR) of 32%.
Some have claimed that a ROI would not be achievable without governmental incentives. In our analysis, UIHC would still have been able to obtain a positive ROI of 104%, with a NPV of $50.7 million and an IRR of 23%. (See Table 2)
Return on Investment Calculations7/09-06/10 7/10-06/11 7/11-06/12 7/12-06/13 7/13-06/14
Initial Investment
Initial Investment and Implementation Cost 48,816,088$
IT Staffing 16,479,180$
Total Initial Investments 65,295,268$
Benefits from EHR - Hard Numbers
Savings:
HIM Paper Chart Savings 132,000$ 134,000$ 138,020$ 140,366$ 142,753$
Reduction of Paper Communications with External Entities/Patient 520,000$ 1,040,000$ 1,430,000$ 2,600,000$ 2,600,000$
Clinic & HIM Chart Control Staff Reduction 3,886,000$ 4,480,500$ 4,614,915$ 4,753,362$ 5,489,963$
Transcription Service Savings 958,541$ 1,048,675$ 1,216,099$ 1,727,933$ 2,248,468$
Savings through reduction in time spent manual billing Pharmacy 169,724$ 174,816$ 180,060$ 185,462$ 191,026$
Lab Test Utilization 2,278,860$ 2,349,340$ 2,422,000$ 4,320,446$ 4,320,446$
Blood Mgmt. & 1x Unit Order set in Epic (Includes Transfusion Labor) 1,432,447$ 5,729,787$ 5,729,787$ 5,729,787$
2-Unit RBC Transfusion Order BPA 4,600,482$
Monitoring Device Integration 6,986,364$ 7,202,437$ 7,425,193$ 7,654,838$ 7,891,586$
Ventilator Device Integration 370,901$ 382,373$ 394,199$ 406,390$ 418,959$
Accucheck Device Integration 260,476$ 268,532$ 276,837$ 285,399$ 294,226$
MyChart Annual Communications Savings 124,723$ 938,409$ 982,693$ 1,830,642$
Revenues/Incentives:
Good Install Incentive 239,000$
Meaningful Use 15,476,784$ 10,111,211$ 7,866,771$
GPRO Payments (eRx/PQRS/PQRI) 1,437,932$ 583,015$ 222,586$ 100,000$
Grants 2,566,666$ 2,916,666$ 2,916,666$
Documentation Improvements 9,722,484$ 8,184,006$
RWB Reports to Improve Documentation and Workflow 950,000$
Malnutrition Pilot $319,991
Benefits - Soft Numbers
Medication ADEs 127,310$ 952,245$ 1,743,702$ 1,992,091$ 2,415,010$
Reduction in Patient Falls 14,527$ 119,898$ (420,036)$ 82,452$ 1,023,960$
Reduction in CAUTIs 45,600$ 93,600$
Colorectal Surgical Site Infections 510,000$
Annual Benefits 15,704,703$ 21,386,918$ 44,715,651$ 53,879,768$ 60,138,342$
Expenses
Incremental IT Staffing 1,598,225$ 1,917,870$ 2,301,444$ 6,333,028$ 6,762,752$
Incremental Hardware/Software Maintenance 582,172$ 698,606$ 838,327$ 2,330,353$ 2,487,588$
Nuance Dragon Project 1,079,463$
Total Expenses 2,180,397$ 3,695,940$ 3,139,772$ 8,663,380$ 9,250,341$
Net Annual Cash Flows (65,295,268)$ 13,524,306$ 17,690,978$ 41,575,879$ 45,216,388$ 50,888,001$
ROI -79% -52% 11% 81% 159%
Discount Rate 0.035
NPV $81,193,502
IRR 32%
Fiscal Year

3 | P a g e
Table 2. University of Iowa HealthCare ROI analysis excluding governmental incentive payments
Government Incentive Payments The adoption of the robust EHR positioned us well for Meaningful Use. We were able to take advantage of it in year one with 98% of our eligible providers meeting Meaningful Use, bringing to us $33,454,766 alone in the first three years of the initiative. Our GPRO (Group Practice Reporting Option) incentives, which includes e-prescribing payments as well as our PQRS/PQRI (Physician Quality Reporting System, formerly known as the Physician Quality Reporting Initiative) payments for reporting periods 2010 through 2013 total $2,343,533.
ROI (Without MU Incentives)7/09-06/10 7/10-06/11 7/11-06/12 7/12-06/13 7/13-06/14
Initial Investment
Initial Investment and Implementation Cost 48,816,088$
IT Staffing 16,479,180$
Total Initial Investments 65,295,268$
Benefits from EHR - Hard Numbers
Savings:
HIM Paper Chart Savings 132,000$ 134,000$ 138,020$ 140,366$ 142,753$
Reduction of Paper Communications with External Entities/Patient 520,000$ 1,040,000$ 1,430,000$ 2,600,000$ 2,600,000$
Clinic & HIM Chart Control Staff Reduction 3,886,000$ 4,480,500$ 4,614,915$ 4,753,362$ 5,489,963$
Transcription Service Savings 958,541$ 1,048,675$ 1,216,099$ 1,727,933$ 2,248,468$
Savings through reduction in time spent manual billing Pharmacy 169,724$ 174,816$ 180,060$ 185,462$ 191,026$
Lab Test Utilization 2,278,860$ 2,349,340$ 2,422,000$ 4,320,446$ 4,320,446$
Blood Mgmt. & 1x Unit Order set in Epic (Includes Transfusion Labor) 1,432,447$ 5,729,787$ 5,729,787$ 5,729,787$
2-Unit RBC Transfusion Order BPA 4,600,482$
Monitoring Device Integration 6,986,364$ 7,202,437$ 7,425,193$ 7,654,838$ 7,891,586$
Ventilator Device Integration 370,901$ 382,373$ 394,199$ 406,390$ 418,959$
Accucheck Device Integration 260,476$ 268,532$ 276,837$ 285,399$ 294,226$
MyChart Annual Communications Savings 124,723$ 938,409$ 982,693$ 1,830,642$
Revenues/Incentives:
Good Install Incentive 239,000$
Grants 2,566,666$ 2,916,666$ 2,916,666$
Documentation Improvements 9,722,484$ 8,184,006$
RWB Reports to Improve Documentation and Workflow 950,000$
Malnutrition Pilot $319,991
Benefits - Soft Numbers
Medication ADEs 127,310$ 952,245$ 1,743,702$ 1,992,091$ 2,415,010$
Reduction in Patient Falls 14,527$ 119,898$ (420,036)$ 82,452$ 1,023,960$
Reduction in CAUTIs 45,600$ 93,600$
Colorectal Surgical Site Infections 510,000$
Annual Benefits 15,704,703$ 19,948,986$ 28,655,852$ 43,545,971$ 52,171,571$
Expenses
Incremental IT Staffing 1,598,225$ 1,917,870$ 2,301,444$ 6,333,028$ 6,762,752$
Incremental Hardware/Software Maintenance 582,172$ 698,606$ 838,327$ 2,330,353$ 2,487,588$
Nuance Dragon Project 1,079,463$
Total Expenses 2,180,397$ 3,695,940$ 3,139,772$ 8,663,380$ 9,250,341$
Net Annual Cash Flows (65,295,268)$ 13,524,306$ 16,253,046$ 25,516,080$ 34,882,591$ 42,921,230$
ROI -79% -54% -15% 38% 104%
Discount Rate 0.035
NPV $50,719,629
IRR 23%
Fiscal Year

4 | P a g e
Figure 1. Comparison of Yearly Dictation Volumes and Staffing
Grants It also gave us more competitive opportunities for grants. Of note, the University of Iowa, in partnership with 11 Iowa hospitals comprising the UI Critical Access Hospital Network, received a $7.7 million Health Care Innovation Award from the Centers for Medicare and Medicaid Services (CMS) to improve care coordination and communication with practitioners in 10 rural Iowa counties. The award is being used to develop transitional care teams to improve quality and reduce costs for rural patients with complex illness, including psychiatric disorders, heart disease, kidney disease, cancer, endocrine and gastrointestinal disorders, and geriatric issues. It is estimated that the program will save $12.5 million in health care costs over three years.
Paper Chart Savings Estimated annual savings from forms and supplies as well as staffing in managing the paper charts as well as electronic communication with referrals and patient have summed up to over $36.8 million over the first five years. This does not take into consideration the time savings performing redundant documentation, searching for records, and performing inefficient communication.
Transcription Savings Implementing template notes as well as speech recognition software reduced dictation of notes over 179%. This allowed for us to drop transcription staffing from 77 to 24. (See figure 1) At the same time, turnaround time of transcribed notes improved eightfold. This has provided a savings of over $8 million in the first five years.

5 | P a g e
Figure 2. Trend of Delinquencies
Figure 3. Timely Communication Compared to Incoming Referral Volume
As for physician time savings, in a 2010 – 2011 study by our ED on the impact of voice recognition on resident charting time, residents saw 62.9 minute reduction in charting time per shift (23%), and an increase of 18% in job satisfaction. Currently we have on average142 providers per day using voice to text configuration for charting.
One outcome of our initiative was to improve our number of delinquent documents. We went from no automatic monitoring tools and only being able to manually sample inpatient documents to fully automated monitoring for all completeness of outpatient and inpatient visit documentation. (See Figure 2) Once able to monitor the metric, we can improve on it.
Our improvement in more timely documentation directly correlates to improved referring provider satisfaction as measured by surveying our referral base. This improvement has aligned with increased referrals. (See Figure 3)
Emergency Trauma Center (ETC) Efficiencies The predicted benefits opportunity was $278,074 in the system’s ability to aid management of patient throughput and address potential bottlenecks increasing patient flow activities. Prior to implementation of our EHR, only 17% of our 30,000 ETC visits were admitted. The UIHC took on a number of optimization opportunities in the two years prior to implementing Epic, including the

6 | P a g e
Figure 4. Transfers through the Admissions and Transfer Center
development of multiple quick care sites to reduce non-urgent ETC visits, reconstruction of the Emergency Trauma Center to accommodate move patients, and opening a centralized Admission and Transfer Center to standardize admissions and transfers from outside the UIHC. This helped move our capacity to the ETC from 30,000 to 51,866, with those coming through the door being more acutely ill and turning over the patients more quickly. Admissions through the ETC rose to 42.9%.
The new procedures as guided by our EHR clarify the admission/transfer process and more clearly defines staff roles, which has created efficiencies and led to better use of hospital resources. The average placement time from outside facility phone call to a patient assigned a bed moved from 94 minutes pre-implementation of the optimized workflow to 77 minutes post implementation. The average number of transfers to the UIHC moved from 230/month to 1,041/month during these same reporting periods. This data speaks to the improved efficiencies as well as more complete data capture. In balancing the pre-implementation counts against our census data, it is guessed that we were missing 40% of the transfer events. (See Figure 4)
Though we are moving considerably more patients through the ETC at a significantly faster pace and increasing the number of admissions in relationship to this growth, it is difficult to attribute an overall hard dollar benefit. The predictive model prior to implementation attributed a quarter of a million dollars in seven years. If we followed the model’s formula, we had all our ROI in year one. We are not factoring the amount into the ROI tables, but recognize that the true ROI of implementation is leaps above the few metrics reviewed in the analysis of this case study.
Inappropriate and Redundant Orders It was anticipated that we could save $6 million in
seven years from inappropriate and redundant orders. Analysis of ordering of laboratory
tests revealed the following problems:
1. Duplicate orders, most commonly involving panels of chemistry tests
a. Common duplicates: individual analytes ordered on same sample with basic
metabolic panel (aka Chem-8)
b. Glucose duplicates ~3,100/year
c. Total duplicates involving BMP ~7,500/year

7 | P a g e
Table 3. Estimated impact of New Laboratory Utilization Initiatives for FY 13 YTD June Monthly Scorecard Inpatients
d. Creates billing problems, necessitating extensive manual clean-up
2. Repeat orders of (germ-line) genetic tests, most common is for Factor V
Leiden/Prothrombin mutations, where there is very little indication for doing this
except if original result questioned
3. Repetitive (usually daily) ordering of common tests in the absence of clinical
necessity
4. Overly frequent ordering of tests for slowly changing laboratory parameters (e.g.,
albumin, erythrocyte sedimentation rate)
a. Approximately 25,000 albumin/year appear to be unnecessary
Causes #1 and #2 are most easily identified at time of ordering and alerts were
implemented in the second year after our go-live. Causes #3 and #4 required a more
sophisticated multi-disciplinary approach, introducing those alerts to the system in the
past fiscal year as outlined in Table 3.
Patient Safety Implementation of our EHR provided standardized screening and documentation tools which supported early detection of risk and continuity of care across units. Medication errors dropped from pre-implementation average 140/month to post implementation of 70/month. Patient falls dropped from an average of 140/quarter to

8 | P a g e
Figure 5. House wide
average staff per
occupied bed
Table 4. Annual Monitor Device Integration Calculation
70/quarter. In a study of the literature, we used a conservative estimate of on average; adverse drug events (ADEs) add $3,000 to the cost of care, saving an expected $2.5 million per year. (Brigham & Women’s Hospital in Boston, 2012) Estimate projected cost per fall would be $450 in 2009 dollars, using study from 2001. (Bates, Pruess, Souney, & Platt, 1995; Granek et al., 1987), Boswell, Ramsey, Smith, and Wagers (2001)
Clinical Staff Efficiencies (Nursing, Therapies, Case Management): Prior to implementation, it was estimated that over seven years, $17,974,799 could be realized from complete and up-to-date information which will allow staff to communicate more efficiently, reduce redundant documentation, and chart more easily; allowing time to be reallocated to patient care activities. With our implementation of our EHR, overall occupancy and clinic volume continue to climb with less staff per occupied bed, which leads to increased income and less expenses. The efficiencies of online documentation helps to support growth in patient care services with less FTE allocation. (See figure 5)
Prior to implementation, we anticipated there would be savings from reduction of paper and staff time managing paper, but we had not considered what impact device integration would have on staff time. We have 13 types of devices feeding data directly to our EHR. Post implementation, based on a reduction in staff time to complete manual entry tasks, the device
integration of following reflected substantial savings: Monitors ($37 million), Ventilators ($1.9 million) and AccuChecks (1.4 million). (See Table 4)

9 | P a g e
Figure 6. Hospital
and provider
charges
Patient safety was our number one goal with sensitivity toward no harm to AR days and revenue cycle. We were able to achieve our dollar returns on investment while at the same time satisfying a critical goal of patient safety as measured by a number of metrics, examples being PSN, falls, and medication errors that all dropped during this time while our days in AR actually decreased slightly with implementation, surpassing our goals. (See figure 6)
Lessons Learned
Thoughtful planning was used to determine how to compute a hard ROI in relation to EHR implementation alone. This was addressed by introducing measureable metrics in key identified areas related to workflow optimization and growth and improvements to service and quality, and tracking progress by leadership of each administrative and clinical department.
Adoption of the new processes by our clinicians proved to take almost as much energy as developing it. Training documents and ‘Tips and Tricks’ worksheets were distributed to our clinicians; however many failed to immediately embrace the new tools available to them. Individual meetings with nurses and physicians were required to show how to fully take advantage of the new features and how the EHR helps create efficiencies within their department specific workflows.
Throughout these initiatives there was much to learn about our providers and their preferred processes. We learned that streamlining the process and providing tools to guide clinicians has resulted in a decrease in our number of delinquencies and more appropriate use of orders.
Strong leadership support was imperative to get the clinicians on board. Emails, workshops, and flyers reinforced the need for complete, timely documentation, and

10 | P a g e
Figure 7. Annual benefits
appropriate order set usage to ensure patient safety and to enable UIHC to provide better patient care.
A public dashboard, where the clinical staff names are listed alongside an indicator of green/yellow/red toward meeting goals was the most effective tool in motivating staff into desired and compliant workflows.
Financial Considerations The overall savings from implementation of our EHR is multi-leveled. Though difficult to attribute the metrics to any single factor, the implementation of a robust EHR provides a foundation to support workflow optimization and new initiatives which allows us to continue to grow services with fewer resources, thereby continually improving our bottom line. In analysis of a few key indicators such as throughput in our ED, documentation efficiencies, and orders management, we see hard numbers of improvement, all the while improving our service and quality. (See figure 7)
Even with only considering a few key metrics, we saw a 159% return on our investment in year five of our implementation, far surpassing the conservative predictions of a break-even point in seven years. Post big-bang implementation, we see our annual benefits of our EHR continue to climb each year.