nicholas e. davies enterprise award of excellence · nicholas e. davies enterprise award of...
TRANSCRIPT

Nicholas E. Davies Enterprise Award of Excellence
1
Applicant Organization: Mercy
Organization’s Address: 14528 South Outer Forty, Suite 100 St. Louis, MO. 63017
Submitter: Dr. Binu Mathew, Dr. Mary E. Bourland, Dr. Cullen Thomas, Melinda Drewes, Alda
Mizaku, Rayleen Kelly
Email: [email protected], [email protected], [email protected],
[email protected], [email protected], [email protected]
Menu Item: Leveraging Analytics to Maximize Clinical Documentation Improvement
(CDI): Make Every Word Count!
Executive Summary
Mercy is committed to excellence and pioneering a new model of care. As an early adopter of
Epic’s electronic health record (EHR), Mercy has spent a decade optimizing its EHR system, its
processes, and navigating patient data for better cost and outcomes.
Yet, Mercy faced a universal challenge for all health care systems—a wide gap between the
clinical domain and the coding world. Today, Mercy is using industry-leading analytics to
transform clinical documentation workflow, improve the accuracy of physician documentation,
and shrink that gap.
CMI, SOI, ROM, and MCC are
nationally recognized scoring
indexes that reflect the acuity of
care provided.
Mercy’s scoring indexes have
increased with this initiative,
better reflecting the care
delivered for the diagnoses, with
accurate documentation and
improved quality measures.
Through Mercy’s CDI initiative, which aligns people, process, and analytics, physicians are now
able to more precisely reflect the clinical case with appropriate terms resulting in:
• Case mix index (CMI) increased by 6.27%
• Severity of illness (SOI) increased from 2.1 to 2.3
• Risk of mortality (ROM) increased from 1.8 to 2.0
• Major complications and co-morbidities (MCC) increased by 6.7%
The above calculations include all inpatient adult admissions across 10 Mercy hospitals that
participate as a Prospective Payment System accepting Medicare from July 2015 to June 2016.
While the implementation of ICD10 in October 2015 contributed to the calculations above,
Mercy’s results are largely based on the new capabilities of the CDI initiative.

Nicholas E. Davies Enterprise Award of Excellence
2
Background Knowledge
In May of 2014, Mercy’s analytics and medical documentation teams joined forces to embark on
this improvement initiative. Through strong partnership and a combination of technology (e.g.
data warehouse tables, ETL logic, Business Objects reporting universe and Epic’s reporting
interface), Mercy automated the identification of patient charts with probable documentation
deficiencies for one or more diagnoses in a report we call the Secondary Diagnosis Report.
The report, along with an analytical application for insight into operations and Diagnosis-Related
Group (DRG) measurement, is embedded in the workflow to empower medical documentation
specialists (MDS) with actionable data for chart reviews. MDS is a Mercy term and is
synonymous with the industry standard for Clinical Documentation Improvement Specialist or
CDI Specialist. The result is accurate documentation of the care provided and an increase in
related quality measures of CMI, SOI, ROM, and MCC for a true reflection of Mercy’s
commitment to excellence.
This project is one example of how Mercy’s hospitals and clinics have been working together to
leverage resources and improve care. In March, its work was recognized by Truven as one of the
top five large health systems in the U.S., as part of the 2016 Truven Health Analytics 15 Top
Systems study. This study annually ranks the top 15 health systems – five large, five medium and
five small – based on independent research and publicly reported data of system-wide
performance in health care quality, patient satisfaction, coordination of care, cost of care and
operational efficiency. The hospitals chosen represent the highest national standards in hospital
care and management, reducing overall expense year over year, while improving patient
outcomes – exactly the results that the entire industry hopes to attain.
Local Problem being Addressed and Intended Improvement
There were three key problems being addressed:
1. Documentation accuracy
2. Process efficiency
3. Timeliness to response
Documentation Accuracy. Mercy recognized several patterns in the care continuum, quality
metrics, and payment denials indicating that medical documentation was not accurately
reflecting the sickness of our patients or the quality of their care. After closer review of patient
records, we confirmed the patterns were the result of inaccurate documentation. The exact
indicators were as follows:
• DRGs - Program for Evaluating Payment Patterns Electronic Report (PEPPER) results of
DRGs in the 20th percentile.
• Quality – A Mercy hospital in northwest Arkansas was experiencing a high Patient Safety
Indicator (PSI) 15 rate. We reviewed the patient cases and found the majority were not
actual PSI 15 but documentation issues. The hospital received a penalty from CMS that
Nicholas E. Davies Enterprise Award of Excellence
3
year and the information was published in the local newspaper. The reputation of Mercy,
its physicians and hospital were misrepresented and not appropriate, nor was the penalty.
• Continuum of Care - Primary care physicians voiced complaints about the quality and
content of inpatient documentation (e.g. discharge summary) causing difficulty managing
patients after discharge.
• Denials – Several denials for post-acute care services were questionable. Upon review,
over 80% were documentation issues and not medical necessity. This resulted in
significant penalties.
This signified a problem for Mercy because inaccurate documentation, as demonstrated in our
example above, reflects poorly on the hospital and can tarnish the reputation of the care provider,
impacting whether patients choose Mercy as they research quality scores. Inaccurate
documentation also results in decreased reimbursement and limited ability for Mercy to network
with payers because scores do not reflect the true quality of care delivered. Without accurate
documentation, the degree of a patient’s illness is misrepresented. This misrepresentation poses
risks to patient safety and appropriateness of care along the continuum as they transition through
inpatient, rehabilitation, transferring patients from one facility to another, from physician to
physician and eventually home. The greatest safety risk for the patient, whether related to
medications or orders, is during these points of patient transition. Patient safety centers on an
accurate medical record. And as Mercy moves to risk-based contracting, it becomes imperative
to mitigate gaps in care.
We recognize that physicians treating patients in a hospital setting often focus on the primary
reason for admission and sometimes miss the documentation of symptoms or conditions that are
secondary diagnoses. Physicians may also inaccurately reflect the care by documenting a less
specific diagnosis. At best, the clinical indicators are mentioned in the physician’s notes or
captured in discrete measures, but the lack of documentation does not translate the medical
condition into specific language for a coding specialist. For example, if a physician is treating a
patient with a Urinary Tract Infection (UTI) who also has sepsis (a severe life threatening
condition) it may lead to the documentation of “Urosepsis” which codes to a simple UTI and
inaccurately reflects the patient care provided. As a result, MDS users spend hours searching for
specific clinical indicators in patients’ charts to find possible documentation omissions or
opportunities for diagnosis specificity.
The terms used are not wrong, per se; they are exactly the kind of words a physician would use
when treating the primary condition and providing quality care. However, physicians do not
speak coding language. Their terms do not align with ICD-10 coding terminology of the Centers
for Medicare and Medicaid Services (CMS) as they review the case for payment; nor are they
terms that translate to public domains such as Hospital Compare and Physician Compare when
benchmarking quality for consumers. Inaccurate or missed documentation consequentially feeds
into the chasm between the clinical world and the coding world. Mercy needed to find a way to
minimize that gap to ensure the right terms are documented, easily translate clinical information
into claim terminology, and provide visibility into the true events of each encounter.
Prior to the project, our medical terminology painted an inaccurate representation of our patients’
conditions. Our aim was to achieve accuracy; whatever reimbursement came along as a result

Nicholas E. Davies Enterprise Award of Excellence
4
was acceptable. There was no target established in relation to reimbursement at the start of the
project. Mercy believes, as long as there are inaccurate charts, there is work to be done.
Once a solution was designed and implemented, we would measure documentation
improvements through Mercy’s CMI, SOI, ROM, and MCC scores pre- and post-implementation
of the CDI initiative. See Figure #1 below for Mercy’s baseline measures captured over 12
months before the solution’s implementation.
Figure #1 – Diagnostic Related Group (DRG) Accuracy: Baseline (Pre-implementation)
Process Efficiency. Another problem identified was the time it took MDS users to manually
review the charts for missed clinical information and coding deficiencies. On average, it took 20
– 40 minutes to review a single chart, and communication back to the physician for
documentation reconciliation was untimely. The workflow included engaging with numerous
software systems in broken, complex, and cumbersome steps resulting in process inefficiencies
and missed opportunities.
Timeliness to Response. Because there was no single method used by MDS, non-standard
processes created a siloed environment where multiple teams were reaching out with inconsistent
messages to the physician, causing frustration. This led to a prolonged coding query response
time and a culture of disengagement (See Figure #2).

Nicholas E. Davies Enterprise Award of Excellence
5
Figure #2 – Between 2013 and 2014, average physician response time was just over 89 hours
with 19,726 queries
Design and Implementation
Once the issues were identified, MDS workflows were observed and recorded, which allowed for
an open, neutral, and complete evaluation of the process, problems, and bottlenecks.
MDS were involved in the design from the beginning. By incorporating their requirements into
the solution at the outset, it created a culture of acceptance and increased the desire to internalize
change. Through review of the workflows, analysis, constant discussions, and Mercy-wide
collaboration, we identified these goals:
• Streamline workflows by providing information in one place
• Easily identify patients with the most opportunity and prioritize chart reviews to
maximize outcomes
• Automate workflows when possible
• Decrease the amount of work outside Epic
• Create reporting capabilities that are near-real time and actionable
A process map was created outlining all the steps taken by a MDS. This was the foundation and
baseline that led to the process re-design.
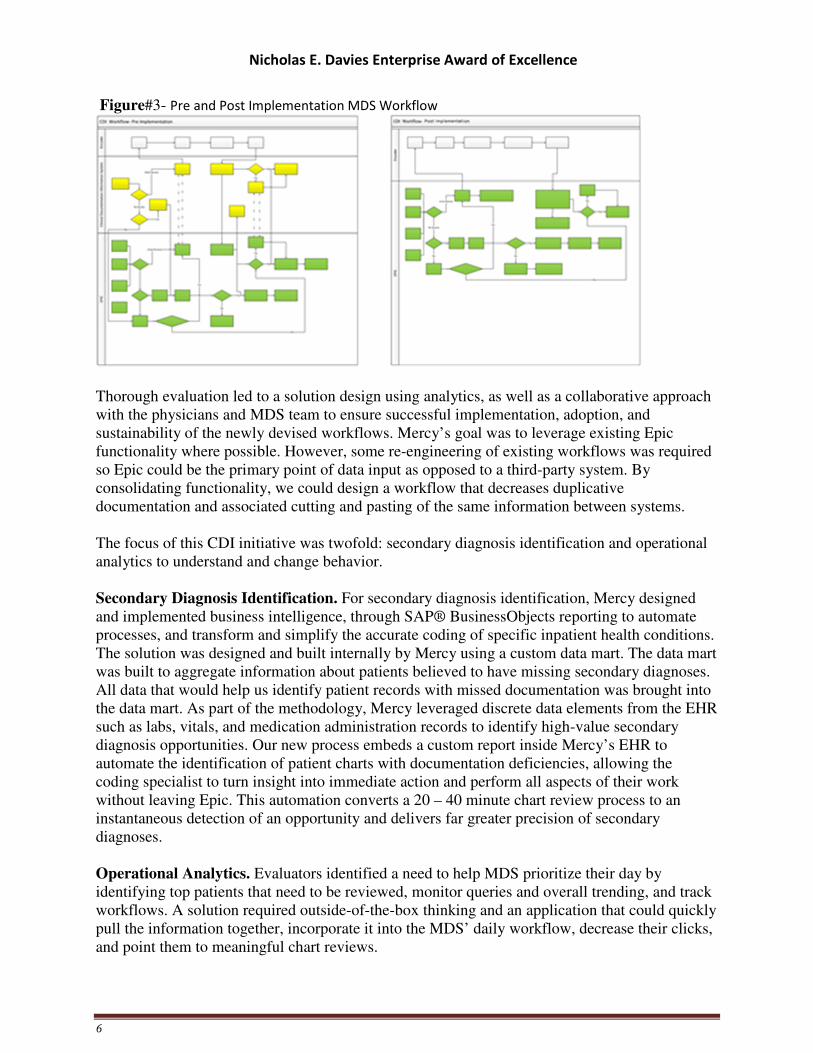
An entire process stream was eliminated as a result of the re-design (See Figure #3).
Nicholas E. Davies Enterprise Award of Excellence
6
Figure#3- Pre and Post Implementation MDS Workflow
Thorough evaluation led to a solution design using analytics, as well as a collaborative approach
with the physicians and MDS team to ensure successful implementation, adoption, and
sustainability of the newly devised workflows. Mercy’s goal was to leverage existing Epic
functionality where possible. However, some re-engineering of existing workflows was required
so Epic could be the primary point of data input as opposed to a third-party system. By
consolidating functionality, we could design a workflow that decreases duplicative
documentation and associated cutting and pasting of the same information between systems.
The focus of this CDI initiative was twofold: secondary diagnosis identification and operational
analytics to understand and change behavior.
Secondary Diagnosis Identification. For secondary diagnosis identification, Mercy designed
and implemented business intelligence, through SAP® BusinessObjects reporting to automate
processes, and transform and simplify the accurate coding of specific inpatient health conditions.
The solution was designed and built internally by Mercy using a custom data mart. The data mart
was built to aggregate information about patients believed to have missing secondary diagnoses.
All data that would help us identify patient records with missed documentation was brought into
the data mart. As part of the methodology, Mercy leveraged discrete data elements from the EHR
such as labs, vitals, and medication administration records to identify high-value secondary
diagnosis opportunities. Our new process embeds a custom report inside Mercy’s EHR to
automate the identification of patient charts with documentation deficiencies, allowing the
coding specialist to turn insight into immediate action and perform all aspects of their work
without leaving Epic. This automation converts a 20 – 40 minute chart review process to an
instantaneous detection of an opportunity and delivers far greater precision of secondary
diagnoses.
Operational Analytics. Evaluators identified a need to help MDS prioritize their day by
identifying top patients that need to be reviewed, monitor queries and overall trending, and track
workflows. A solution required outside-of-the-box thinking and an application that could quickly
pull the information together, incorporate it into the MDS’ daily workflow, decrease their clicks,
and point them to meaningful chart reviews.

Nicholas E. Davies Enterprise Award of Excellence
7
QlikView was selected as the technology that would organize: 1) the MDS’ daily workflow, 2)
consolidate reporting, 3) DRG metrics in one place because of its in-memory functionality,
ability to seamlessly handle large amounts of data, and its powerful associative capabilities.
It was also evident that to re-engineer the workflow process, an application would be required
that organized and displayed operational analytics. The MDS were spending large amounts of
time running, filtering, and manually compiling information from three to four reports just to
identify which patients to see each day. This was not only time consuming, but a huge dis-
satisfier to the MDS. Mercy designed and implemented a technology solution to bring together
and consolidate information from vital sections of the patient chart, such as the medication
record, into a single, organized view (See Figure #4).
Figure #4 – MDS User Tab (Screen View)
Change Management. Change management was foundational. Mercy used the following
approaches to ensure success:
• Alignment of Goals. Where disorganized silos of work previously existed, Mercy
would create alignment with MDS team members, physicians, and coding teams for
change to be more consistent, efficient, and standardized.
• Peer-driven change model. Mercy used a bi-directional (versus top down) change
process to enable engagement, adoption, and feedback from everyone including the
end user. We created a pilot group of MDS users in each of Mercy’s inpatient
facilities. The pilot group performed testing and validation, provided
recommendations, tweaked the rules, and incorporated filters and flags, which

Nicholas E. Davies Enterprise Award of Excellence
8
facilitated the streamlining of processes. These power users were the voice of the
application and change agents within the facilities, raising any changes to the local
MDS director. For the first time, this initiative would bring together physicians, MDS
team members, and coding teams to act as a support system to the power users.
• Face-to-face training. Mercy felt it was important to create a culture of transparency
and openness from which new ideas and a personalized connection could form. Four-
hour training sessions were held onsite at all Mercy’s inpatient facilities. New users
are trained using a train-the-trainer model.
• Governance and communication. Multiple weekly and monthly meetings were held
involving physician advisors, MDS and coding leadership, and the analytics team.
Mercy’s thorough design and implementation plan brought together the right people to facilitate
a change that is sustainable, operational, and effective.
How Health IT Was Utilized
While our aim was accurate documentation, Mercy’s MDS program also helps to improve
patient care. Because MDS users review the record from a clinical perspective, not only do they
see gaps in documentation, but they also see gaps in communication between the patient’s
clinical team, missing test results, and/or physician orders.
With the help of the MDS Operational Analytic Tool and the Secondary Diagnosis Report, MDS
users at Mercy act as both translators and analysis assistants, working between the data-driven
world of coding specialist and the clinical/analytical world of bedside patient care.
Mercy’s new chart review process required integrating business intelligence data and clinical
workflow process information. To satisfy this requirement, we needed a way to gather data from
a variety of different silos quickly, efficiently, and in a secure manner. Mercy leveraged as much
existing technology and infrastructure, including leveraging our Epic EHR system. A Medical
Documentation data mart was designed so data could move in different directions and then be
presented back to the user within their workflow in a meaningful way (See Figure #5).
Figure #5 – Data flow chart

Nicholas E. Davies Enterprise Award of Excellence
9
The MDS Operational Analytic Tool and the Secondary Diagnosis Report provide MDS users a
standardized workflow process across the organization. The new standard process has increased
productivity from 10 to 25 charts per day and promoted accurate clinical documentation
throughout the medical record thanks to compliant methodologies. The results are appropriate
and accurate code/DRG assignment, patient quality measures, and reimbursement for care
rendered. There was a significant amount of effort put into moving people from an old workflow
to a new, standardized process. It involved building a network of leaders across the organization,
training them, and completing standardization for many workflows to ensure success.
The MDS Users Tab found in the MDS Operational Analytic Tool helps us keep track of the
patients we need to review and the queries we need to complete. The Secondary Diagnosis
Report points out clinical indicators and query opportunities on eighteen diagnoses that can
impact the MS-DRG, SOI, and ROM such as Sepsis, Severe Sepsis, Septic Shock, and Acute
Respiratory Failure. The MDS uses this automated report to identify the secondary diagnoses
opportunities which are communicated through non-leading conversations or as a coding query
within the EHR (See Figure #6).
Figure #6 – Consolidated, clickable Secondary Diagnosis Report embedded in Mercy’s EHR
Both the MDS Operational Analytic Tool and the Secondary Diagnosis Report contain
hyperlinks to the patient’s chart within Epic making reviews quick and easy. Once in the
patient’s Epic chart, the MDS user opens the CDI Review Tab. This is where the following codes
are entered: ICD-10-CM diagnostic codes, ICD-10-PCS procedure codes and the Working MS-
DRG with the LOS, SOI, and ROM. Any comments/notes on queries are also placed here.
The links help automate workflows, bringing actionable data to one place and identify patients
with the most opportunity. By having the links within our Epic EHR, workflows are streamlined
and any work outside of Epic is minimized.
The MDS Users at Mercy have developed several different standardized queries to choose from.
A query is placed by clicking on both the “query” tab and the “new note” tab in Epic. The MDS

Nicholas E. Davies Enterprise Award of Excellence
10
User then fills out the query to clarify the specificity of current diagnoses and/or procedures
based on relevant, pertinent clinical facts within the medical record, such as signs, symptoms,
findings, and test results; the treatment rendered including clinical pathways specific to a
condition/diagnosis; and the patient’s risk factors including the patient’s current stable
conditions, past medical history, medications, and overall risk based on his or her total health
status picture. Once completed, the query is shared in Epic by assigning a deficiency to the
provider placing notification of the query in their “In Basket”. The query populates with a clear
description of the coding question with non-leading answer choices that appear in the notes
activity for a provider.
Physicians are overburdened by many of the processes in the electronic health record. Mercy’s
aim was to provide an “easy button,” re-engineering the process to make it simpler and more
efficient. In this example for MDS, hyperlinks are provided in the secondary diagnoses report to
the key part of the electronic health record. For providers, the refined process transformed a 13-
step workflow into three clicks by using standard smart list (F2 key) functionality in Epic.
The following is an example of a Pneumonia query.
Query Example:
Please respond within 48 hours. Thank you!
The authenticated query note is part of the Legal Health Record
Patient Name:
Admission Date:
Hospital MRN #:
Hospital HAR #:
Dear Doctor,
The diagnosis of "Pneumonia / HCAP" is documented in the H&P in a setting of Severe Sepsis
Clinical indicators and/or treatment for this patient include:
08-01-2016 H&P: Upon arrival to the ED, she was found to be in acute respiratory acidosis with
a ABG: 7.13/88/126/29 on NRM. Placed on BPIAP. Chest x-ray with bilateral infiltrate as per
my independent review along with vascular congestion. Started on coverage for HCAP.
PLAN:
1. Admit patient to ICU Inpatient Admission.
Acute hypercapnic Respiratory Failure/Acute Respiratory Acidosis

Nicholas E. Davies Enterprise Award of Excellence
11
2- Severe Sepsis most likely from HCAP
IV fluids @ 100cc/hr
CVP reading every four hours
Levophed. Titrate to maintain MAP > 60
Add procalcitonin/CRP
Triple ABX (Cefepime /Vanco/Levaquin)
Duo neb every 6 hours
Streptococcus and legionella antigens
Note: To answer the following question(s), please click EDIT button on the activity bar then
click F2 in front of the highlighted area(s).
Positive culture results are not necessary to specify a suspected organism.
Question: Clarify if the clinical picture and choice of antibiotic(s) is compatible with a
particular suspect organism(s) or underlying cause(s) for the pneumonia:
• Gram negative pneumonia
• Aspiration pneumonia
• Pneumococcal pneumonia
• Streptococcal pneumonia
• Staphylococcal pneumonia
• Hemophilus Influenzae pneumonia
• Pseudomonas pneumonia
• Moraxella Catarrhalis pneumonia
• Pneumonia due to Anaerobes
• Candidiasis (yeast) pneumonia
• Fungal pneumonia
• Other (Specify)
• Unable to determine
Answer: Suspected and treatment given for: {Pneumonia etiology:1052842564}

Nicholas E. Davies Enterprise Award of Excellence
12
NOTE: HCAP and CAP are modes of transmission and not causative agents of the
pneumonia
Please continue to document the appropriate diagnosis for the clinical information above,
in your Progress Notes, including through the Discharge Summary.
Please keep the Problem List updated for continuity of care. (.hprobl1 or .probhospall)
In responding to this query, please exercise your independent professional judgment. Please be
advised that coding regulations for inpatient admissions allow the physician to document
presumptive/probable diagnoses. The fact that a question is asked does not imply that any
particular answer is desired or expected.
Thank you.
For questions on this coding query please contact: Rayleen Kelly RN, CCDS
Additionally, through the build and use of Smart Data Elements (custom data attributes created
within the Epic system), the team tracks the effectiveness of the automated Secondary Diagnosis
Report versus an independent chart review. Other key modifications implemented in Epic and/or
the MDS process include the use of the CDI Review activity documenting, creating flow sheet
rows and queries which all work together to help drive some of the analytics. The queries and
smart data elements were also rebuilt in Epic for ICD-10.
We utilized the discrete query modifications, and presented the information using Qlikview to
track the physician query types, query status, as well as their timeliness to respond to the query
(See Figure #7). Bringing the query responses into view with the operational analytics tied
together the entire picture for the MDS.

Nicholas E. Davies Enterprise Award of Excellence
13
Figure #7 – Top 10 Queries Counts By Assigned To User Type
This was eye-opening to the MDS as they were, for the first time, able to use analytics to track
response rates for queries not meeting clinical and coding needs. This information is also useful
in identifying ambiguous physician queries causing poor response rates. From there, the team
could collaborate to improve the content and clarity of the query to be clinically meaningful
while mapping to the appropriate coding terminology. This collaboration led to increased
unification and team spirit between the three highly unique groups while creating standardized,
best practice queries and steadfast focus on precise documentation ensuring compliance with
coding requirements (See Figure #8).
Figure #8 – Qlikview - Analytical view of operational data surrounding queries
Using Qlikview, we measure the impact of Mercy’s CDI initiative on key metrics such as CMI,
SOI, ROM, CC/MCC, DRG, and Length of Stay (LOS), which are documented in the Epic EHR.
Monitoring these metrics enables continuous workflow improvement and targeted educational
opportunities (See Figure #9).

Nicholas E. Davies Enterprise Award of Excellence
14
Figure #9 – Qlikview – Performance overview including DRG measures
Value Derived/Outcomes
By bringing together people, process, and technology, Mercy was able to implement a solution
that provides accurate documentation in an efficient and timely manner, standardizes workflows
with best practices, and provides actionable data to enhance communication with physicians.
Once in place, Mercy’s solution:
• Dissolved the vertical silos of knowledge and established collaboration, integrating the
work of physicians, MDS team members, coders, and Health Information Management
(HIM) team members.
• Embedded an unprecedented, innovative solution in the end user workflow, enhancing
precision and improving specificity of diagnoses to truly reflect the care provided.
• Leveraged discrete data elements to automate the identification of high-value secondary
diagnoses.

Nicholas E. Davies Enterprise Award of Excellence
15
• Improved process efficiency by aligning goals unique to each group:
o Physicians - decreased from a 13-step process to three clicks.
o MDS users - embedded, actionable, consolidated workflows saved 10,000 clicks
per user per month.
o Coders - increased efficiency by delivering a complete chart ready for coding and
reduced the number of post discharge queries by 20%.
• Implemented a data-driven, targeted approach to educating the documenting physicians in
near real-time leading to a sustainable, hardwired solution.
• Created an analytical platform for targeted, constructive feedback to drive change and
measure impact for specific diagnoses, such as malnutrition, that cross the continuum of
care.
• Enabled MDS’ to review more patients per day (coverage has increased by 40%) without
an increase in staff, due to efficiencies gained through the automated workflow.
• Expanded patient chart reviews beyond just Medicare populations due to efficiencies;
MDS now review charts for all inpatient visits within Mercy hospitals across all payers.
Accurate Documentation
Accurate documentation is delivered through increased specificity as noted in an increase of
appropriate MCC capture and CMI (See Figure #10).
Figure #10 – DRG with MCC Compare for Mercy’s 10 main PPS facilities

Nicholas E. Davies Enterprise Award of Excellence
16
Timeliness to Response
In FY15, Mercy’s Medical Documentation team worked with the Physician Compensation Plan
Committee to reduce the time it takes to respond to queries, thereby tying the Timeliness to
Response metric to quality, safety, and performance metrics. In addition, physicians voiced their
concerns that the absolute time in hours did not take into consideration their time off. In response
to the concerns, Mercy’s Medical Intelligence and Analytics team built logic into the
measurement which subtracted time when each individual provider is off duty. This helped build
trust and credibility by showing Mercy was listening to the concerns of the physicians. Overall,
these changes resulted in the physicians response to queries decreasing from an average actual
response of 88 hours to an average of 43 hours (~49%) despite an increase in queries from
29,142 to 102,882 (~72%) (See Figure #11). While we saw a dip in Q1 2016 related to the
number of queries, multiple factors could have influenced this, such as preparation of the queries
for ICD 10 compliance, dual coding in ICD 9 and ICD 10, and resource reorganization.
Figure #11 - Timeliness to Respond Pre- and Post-Implementation compared to the number of
queries
CMI
Case mix index (CMI) is a score which reflects the blend of all patients within a group or
facility. It is calculated by the following formula:

Nicholas E. Davies Enterprise Award of Excellence
17
Rises in CMI are a reflection of the type of patients being treated. CMI is a measure of the
complexity of the care delivered and the resources utilized, and is used by payors who reimburse
on a DRG basis. As multiple processes were concreted over time, we began to recognize the lift
in CMI across all payors throughout our main PPS locations across Mercy (See Figure#12).
Figure #12 – Case Mix Index results pre- and post–implementation (Mercy Average CMI – All
Payers/10 Main PPS locations which totals 3,366 total staffed beds)
SOI and ROM Severity of Illness (SOI) is a numerial score from one to four as established by CMS. Each
patient is given a score based on the words used in the record (See Figure #13).

Nicholas E. Davies Enterprise Award of Excellence
18
Figure #13- Severity of Illness results pre- and post–implementation, indicating improved
documentation
Risk of Mortality (ROM) is a numerical score from one to four, where level four carries a higher
risk of mortality. Each DRG (diagnosis related group) has a relative weight (RW) attached. Then
each individual patient’s RW is icreased by the number and severity of the MCC and CC
included in the documentation (See Figure #14).

Nicholas E. Davies Enterprise Award of Excellence
19
Figure #14- Risk of Mortality results pre-and post–implementation, indicating improved
documentation
In summary, a query leads to a more specific diagnosis, resulting in an accurate reflection of the
patients’ complexity. With increased efficiency and automation of secondary diagnoses
opportunities, Mercy noticed a significant rise in the volume of queries sent. This paired with a
greater than 90% agreed rate contributed to a noticeable lift in SOI/ROM which captures not

Nicholas E. Davies Enterprise Award of Excellence
20
only the clinical complexity, but indicates resource consumption and associated costs.
Lessons Learned
• Consider the people and process component. We learned technology alone would not
create sustainable improvement. As we took on the project and assessed the situation,
Mercy encountered existing challenges, which included a complex workflow,
inconsistent and duplicative messages to providers, and the inability to report and track
communication. The solution required creating a coordinated effort among the different
groups, maximizing process efficiency, and bridging the gap between the clinical and
coding worlds. Alignment of purpose can be accomplished in many ways, but the
physicians’ compensation formula has encouraged participation in educational projects
and alignment in overall goals of the organization, which has led to greater compliance.
A key driver was the physician reputation. The more they understood how their
reputation could be impacted by inaccurate words, the alignment became more robust.
Physician compensation was not tied to the answer of the query but tied to the answering
of the query encouraging a more timely response and participation.
• Physician input and governance. The project was governed by physicians. More
importantly, weekly meetings were held with the physicians allowing them to have input
prior to implementation, and in design decisions within the electronic health record.
Working with MDS users, they also tested post- implementation. Collaboration,
communication and education among MDS users and physician champions helped create
clinical guidelines for query processes to improve the quality of the EHR. The physician
champions delivered the solution, as they were the conduit for peer-driven change,
engagement, adoption, and feedback. Individual physicians from each facility were
engaged in the governance process, creating buy-in from each location. And, because we
were making their jobs easier, the “easy button” concept gained a lot of attention from
both the advisors and the local medical staff. Buy-in grew over time, and we saw success
and improvement at every Mercy facility. Despite Mercy’s size, number of physicians
(integrated and non-integrated physicians on the medical staff) and geographic footprint,
Mercy was successful in implementing this initiative.
• Identify key data. Early on, we learned the importance of identifying critical source(s)
of data and ensuring data migrated to the correct database. Once the team identified the
different puzzle pieces and the technology architecture was in place, implementation
occurred quickly.
• Assign champions. We discovered the power of having a MDS super user and champion
at each site to help create buy-in and increase adoption and utilization from fellow MDS
team members.
• Leverage an advanced analytics platform. Over the past three years, Mercy has
systematically implemented a more agile data infrastructure. Our experience taught us the
importance of having a powerful data platform in place to support the volume and
complexity of this advanced analytics initiatives.
This is just the beginning. Mercy’s goal is to continuously integrate analytics into patient care
workflows, enabling the insight gained to drive a smarter platform that raises the bar toward
improved, higher impact and compassionate patient care.

Nicholas E. Davies Enterprise Award of Excellence
21
Financial Considerations
Based on different reports such as PEPPER, etc., it was clear that we had significant opportunity
to improve our documentation accuracy as our existing state of documentation in comparison to
our peers was not truly reflecting the severity of illness and risk of mortality of our patients.
Thus, the focus of the project was on accuracy of documentation which led to improved quality, compliance, and reputation. A byproduct of the accuracy was a significant increase in
revenue. Contributing factors to the cost of implementation should be considered at an
organizational level and is dependent on a health system’s existing infrastructure, resources, and
complexity of clinical services offered.
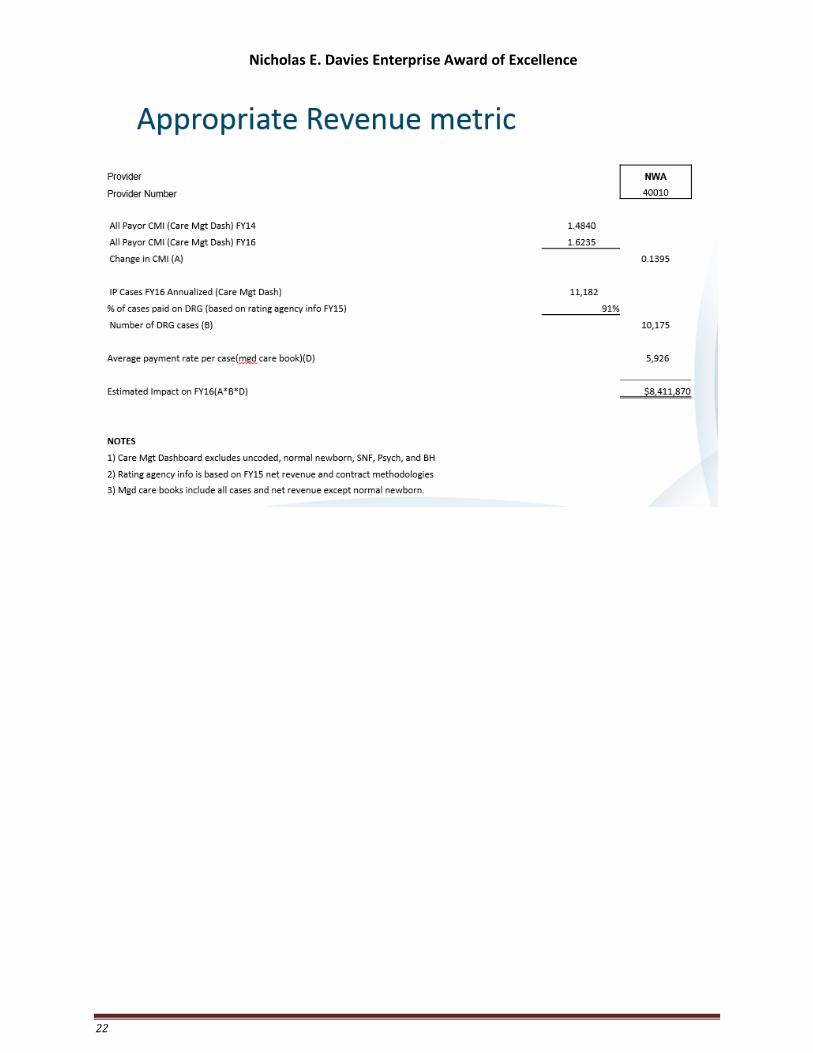
The numbers below reflect an estimated elevation in performance from the pre-implementation
period (July 2013 – Jun 2014) to the post-implementation period (July 2015 – Jun 2016), for all
payers, and for 10 PPS locations across Mercy.
CMI or Case Mix index measures the acuity of the patient based on the discharged diagnosis and
correlates to the cost of care. Because of the correlation to cost and acuity, the CMI is commonly
used to calculate reimbursement and in fact 91% of the Mercy discharges will have a payment
algorithm that includes the case mix index. A robust data driven CDI program translates into an
appropriate CMI and thus appropriate revenue. Below is a sample calculation for one of the
Mercy locations.
Nicholas E. Davies Enterprise Award of Excellence
22