decision-making on mega-projects
TRANSCRIPT

Decision-Making on Mega-Projects

TRANSPORT ECONOMICS, MANAGEMENT AND POLICY
Series Editor: Kenneth Button, Professor of Public Policy, School of Public Policy,George Mason University, USA
Transport is a critical input for economic development and for optimising socialand political interaction. Recent years have seen significant new developments inthe way that transport is perceived by private industry and governments, and inthe way academics look at it.
The aim of this series is to provide original material and an up-to-datesynthesis of the state of modern transport analysis. The coverage embraces allconventional modes of transport but also includes contributions from importantrelated fields such as urban and regional planning and telecommunications wherethey interface with transport. The books draw from many disciplines and somecross disciplinary boundaries. They are concerned with economics, planning,sociology, geography, management science, psychology and public policy. Theyare intended to help improve the understanding of transport, the policy needs ofthe most economically advanced countries and the problems of resource-poordeveloping economies. The authors come from around the world and representsome of the outstanding young scholars as well as established names.
Titles in the series include:
Structural Change in Transportation and Communications in the Knowledge Society
Edited by Kiyoshi Kobayashi, T.R. Lakshmanan and William P. Anderson
Competition in the Railway IndustryAn International Comparative AnalysisEdited by José A. Gómez-Ibáñez and Ginés de Rus
Globalized Freight TransportIntermodality, E-Commerce, Logistics and SustainabilityEdited by Thomas R. Leinbach and Cristina Capineri
Decision-Making on Mega-ProjectsCost–Benefit Analysis, Planning and InnovationEdited by Hugo Priemus, Bent Flyvbjerg and Bert van Wee
Port PrivatisationThe Asia-Pacific ExperienceEdited by James Reveley and Malcolm Tull
The Future of Intermodal Freight TransportOperations, Design and PolicyEdited by Rob Konings, Hugo Priemus and Peter Nijkamp
North American Freight TransportationThe Road to Security and ProsperityMary R. Brooks

Decision-Making onMega-ProjectsCost–Benefit Analysis, Planning andInnovation
Edited by
Hugo PriemusProfessor of System Innovation and Spatial Development,Delft University of Technology, The Netherlands
Bent FlyvbjergProfessor of Planning, Aalborg University, Denmark andChair of Infrastructure Policy and Planning, Delft Universityof Technology, The Netherlands
Bert van WeeProfessor and Head of Transport Policy and Logistics, DelftUniversity of Technology, The Netherlands
TRANSPORT ECONOMICS, MANAGEMENT AND POLICY
Edward ElgarCheltenham, UK • Northampton, MA, USA

© Hugo Priemus, Bent Flyvbjerg and Bert van Wee 2008
All rights reserved. No part of this publication may be reproduced, stored ina retrieval system or transmitted in any form or by any means, electronic,mechanical or photocopying, recording, or otherwise without the priorpermission of the publisher.
Published byEdward Elgar Publishing LimitedGlensanda HouseMontpellier ParadeCheltenhamGlos GL50 1UAUK
Edward Elgar Publishing, Inc.William Pratt House9 Dewey CourtNorthamptonMassachusetts 01060USA
A catalogue record for this bookis available from the British Library
Career choice in management and entrepreneurship : a research companion /edited by Mustafa F. Özbilgin, Ayala Malach-Pines
p. cm.Includes bibliographical references and index.1. Career development. 2. Vocational guidance. 3. Management. 4.Entrepreneurship. 5. Master of business administration degree. I.Özbilgin, Mustafa. II. Malach-Pines, Ayala.
HF5831.C2651435 2007658.0023—dc22
2007011684
ISBN 978 1 84542 737 5
Printed and bound in Great Britain by MPG Books Ltd, Bodmin, Cornwall

Contents
List of contributors viiAcknowledgements x
1. Introduction: scope of the book 1Hugo Priemus, Bent Flyvbjerg and Bert van Wee
PART I MANAGEMENT CHARACTERISTICS ANDCOST–BENEFIT ANALYSIS
2. Management characteristics of mega-projects 23Hans de Bruijn and Martijn Leijten
3. Ex-ante evaluation of mega-projects: methodological issuesand cost–benefit analysis 40Bert van Wee and Lóránt A. Tavasszy
4. Cost–benefit analysis and the wider economic benefits frommega-projects 66Roger W. Vickerman
5. Mega-projects and contested information 84Hans de Bruijn and Martijn Leijten
PART II PLANNING AND DECISION-MAKING
6. How to improve the early stages of decision-making onmega-projects 105Hugo Priemus
7. Public planning of mega-projects: overestimation of demandand underestimation of costs 120Bent Flyvbjerg
8. Evolving strategy: risk management and the shaping ofmega-projects 145Roger Miller and Donald R. Lessard
9. How to overcome major weaknesses in mega-projects: theNorwegian approach 173Knut Samset
v

10. Public–private partnership and mega-projects 189Joop Koppenjan
PART III INNOVATION, COMPETITION AND INSTITUTIONS
11. Innovations in the planning of mega-projects 215Werner Rothengatter
12. The cost of the technological sublime: daring ingenuity and the new San Francisco–Oakland Bay Bridge 239Karen Trapenberg Frick
13. Provision and management of dedicated railway systems:how to arrange competition 263Didier van de Velde and Ernst F. ten Heuvelhof
14. Rail infrastructure at major European hub airports: therole of institutional settings 281Moshe Givoni and Piet Rietveld
15. Drawing institutional lessons across countries on makingtransport infrastructure policy 304W. Martin de Jong
Index 327
vi Contents
Contributors
Hans de Bruijn is Professor of Public Administration at Delft University ofTechnology, The Netherlands. His research is on processes of decision-making, in which many mutually dependent actors are involved, withdifferent interests. He is involved in the development of concepts regardingthis multi-actor decision-making and in applying it to numerous areas, e.g.large infrastructural projects, law enforcement, the relation between man-agement and professionals, environmental policy and privatisation. Hismost recent book is Managing Performance in the Public Sector (Routledge,2007).
Bent Flyvbjerg is Professor of Planning at Aalborg University, Denmarkand Chair of Infrastructure Policy and Planning at Delft University ofTechnology, The Netherlands. He is Founder and Director of AalborgUniversity’s research programme on large-scale infrastructure planning.His books include Megaprojects and Risk (Cambridge University Press,2003, with Nils Bruzelius and Werner Rothengatter), Making SocialScience Matter (Cambridge University Press, 2001) and Rationality andPower (The University of Chicago Press, 1998).
Karen Trapenberg Frick is a Lecturer at the University of California, Berkeley,USA, in the Department of City and Regional Planning and teaches courseson transportation planning, policy and finance. She also is a post-doctoralResearch Scholar at the University of California Transportation Center.
Moshe Givoni is a Marie Curie Fellow at the Department of SpatialEconomics, Free University, Amsterdam. He gained his PhD at the BartlettSchool of Planning, University College London. His academic back-ground also includes degrees in Economics (BA), Geography (BA) andBusiness Administration (MBA), from Tel-Aviv University, Israel. His mainresearch interests relate to air and rail transport.0
Ernst F. ten Heuvelhof (Chair Public Management) is a Professor at theDepartment of Technology, Policy and Management of Delft Universityof Technology and at the Department of Public Administration ofErasmus University in Rotterdam, The Netherlands. His main researchinterests are the management of complex decision-making processes; andliberalisation, privatisation and internationalisation of network-based
vii
industries. He is Scientific Director of the Bsik research programme NextGeneration Infrastructures.
W. Martin de Jong is Associate Professor of Policy, Organisation andManagement at the Faculty of Technology, Policy and Management, DelftUniversity of Technology, The Netherlands. He publishes and teaches onissues of cross-national institutional comparison, cross-national lesson-drawing, transport infrastructure planning and evolutionary approaches tothe administrative sciences.
Joop Koppenjan is Associate Professor at the Faculty of Technology, Policyand Management of the Delft University of Technology, The Netherlands.His research topics include policy networks, decision-making, implemen-tation, privatisation and public–private partnerships.
Donald R. Lessard is the Epoch Foundation Professor of InternationalManagement at the MIT Sloan School of Management, USA. His researchinterests are project management and global strategic management, with anemphasis on managing in the face of uncertainty and risk. He currentlyteaches courses on global strategy and organisation, and global strategy inthe energy sector. Lessard is also the Faculty Director for the BP–MITProjects Academy, a major executive education programme for majorproject leaders that spans management and engineering.
Martijn Leijten is a Researcher at the Faculty of Technology, Policy andManagement of Delft University of Technology, The Netherlands. Hisresearch focuses on multi-actor systems, in particular in the managementof complex infrastructure projects. In 2004 he worked for the DutchParliamentary Committee on Infrastructure Projects.
Roger Miller is the Jarislowsky Professor of Innovation and ProjectManagement at École Polytechnique in Montreal, Canada, and a FoundingPartner of SECOR, a strategy consulting firm with offices in Montreal,Toronto and Paris. He has been a Fellow at the Center for InternationalAffairs of Harvard University and in MIT’s International Motor VehicleProgram. His work has focused on (1) strategy and industry dynamics, (2)public policies in science and technology, and (3) large engineering projectmanagement. Roger Miller is a Fellow of the Canadian Academy ofEngineering.
Hugo Priemus is Professor of System Innovation and Spatial Developmentat Delft University of Technology, The Netherlands. In 2004 he was ResearchCoordinator of the Dutch Parliamentary Committee on InfrastructureProjects. He is Honorary Doctor at the University of Uppsala, Sweden.
viii Contributors

Piet Rietveld is Professor in Transport Economics and Head of theDepartment of Spatial Economics, Vrije Universiteit, Amsterdam, TheNetherlands. He is the Chairman of NECTAR and Fellow of the TinbergenInstitute. He has conducted extensive research in the field of infrastructureand spatial development.
Werner Rothengatter is President of the World Conference on TransportResearch (WCTR) and Head of the Institute of Economic Policy Research(IWW), University of Karlsruhe, Germany.
Knut Samset is Professor in Project Management at the Department ofCivil Engineering and Transport, Norwegian University of Science andTechnology in Trondheim, Norway, and Director of the Concept ResearchProgram on Front-end Management of Major Investment Projects. Hiscurrent research is on project governance, appraisal and quality assuranceof major investments. He is the author of books on technology assessment,project design, evaluation and risk management.
Lóránt A. Tavasszy is Senior Adviser, Mobility & Infrastructure, at theTNO Institute in the Netherlands and Visiting Professor at the RadboudUniversity in Nijmegen, The Netherlands. His research work in recent yearshas focused on freight transportation, and spatial policy and modelling. Hehas conducted several projects on the development of guidelines forcost–benefit analysis of transport projects and policies.
Didier van de Velde is Researcher at the Faculty of Technology, Policy andManagement of Delft University of Technology and Senior Adviser atinno-V consultancy in Amsterdam, The Netherlands. His research workfocuses on institutional reforms in public transport (urban, regional andnational rail) and especially on the introduction of forms of competition inthese sectors.
Roger W. Vickerman is Professor at the Centre for European, Regional andTransport Economics, and Head of the Department of Economics, KeynesCollege, University of Kent at Canterbury, UK.
Bert van Wee is Professor in Transport Policy and Logistics and Head of thesection with the same name at Delft University of Technology, TheNetherlands, in the faculty Technology, Policy and Management. His maininterests are long-term developments in transport, the environment, safetyand accessibility, and policy analysis.
Contributors ix

Acknowledgements
The editors wish to acknowledge not only the authors of the chapters, whowere extremely cooperative, but also the referees, who contributed greatlyto the quality of the final publication.
Most authors have served as referees in cross-referee procedures. In add-ition, the following external referees have delivered valuable contributions:Peter Abelson, David Banister, Giampiero Beroggi, Antonio Estache,Andreas Faludi, Marina van Geenhuizen, Paul ’t Hart, David Hensher,Toon van der Hoorn, Milan Janic, David Luberoff, Rico Maggi, VincentMarchau, Barry Needham, Eric Pels, Dani Shafer, Folke Snickars, ArvidStrand, Barry Ubbels, Jose Viegas and Henk van Zuijlen.
x

1. Introduction: scope of the bookHugo Priemus, Bent Flyvbjerg andBert van Wee
1.1 INTRODUCTION
This book aims to enlarge understanding of the decision-making on mega-projects and to suggest recommendations for a more effective, efficient anddemocratic approach. This is not the first book published on this theme. Butthis is certainly a unique book, presenting an up-to-date and differentiatedoverview of the state of the art, based on experiences and visions of authorsfrom Europe and North America.
Traditionally, it has been the job of the government to develop, financeand – often – to manage major investment projects, which we have bundledtogether in this book under the blanket definition of ‘mega-project’. Thereare many successful mega-projects, most of which have taken some timeto bear fruit – both directly and indirectly. However, there are also manypotential problems, which could turn mega-projects into what Peter Halllabels ‘planning disasters’ (Hall, 1980). These problems include low trans-port performances, adverse environmental effects (landscape erosion, noisepollution, toxic emissions etc.), underestimated investment costs and dis-appointing returns.
In this book, authors from different scientific disciplines address variousaspects of decision-making in mega-projects, such as management char-acteristics and cost–benefit analysis, planning and decision-making, andinnovation, competition and institutions. Many cases are drawn fromdifferent parts of the world, both best and worst practices.
The subject matter is varied and highly differentiated, but certain ques-tions crop up time and again. For example, how do we deal with protractedpreparation processes, how do we tackle risks and uncertainties, and howcan we best divide the risks and responsibilities among the private andpublic players in the different phases of the process?
The next section elaborates the scope of the book. The notion of mega-project will be explained. We will then present a brief review of recent pub-lications on common pitfalls in decision-making processes on mega-projects
1

(Section 1.3). Section 1.4 presents the content of the book, dividedinto three parts: I Management characteristics and cost–benefit analysis;II Planning and decision-making; and III. Innovation, competition andinstitutions.
1.2 SCOPE OF THE BOOK
Frisk’s contribution in Chapter 12 identifies the following general charac-teristics of mega-projects, referred to as the 6 Cs:
1. colossal in size and scope;2. captivating because of size, engineering achievements and aesthetic
design;3. costly: costs are often underestimated;4. controversial: funding, mitigation packages, impacts on third parties;5. complex: risk and uncertainty in terms of design, funding and con-
struction;6. control issues: who are the key decision-makers, funding, operation etc.
Mega-projects are often technological tours de force with an innovative and,not infrequently, an experimental character. They sometimes reflect thecutting edge of modern technology (Frick refers to the notion of ‘the tech-nological sublime’ in Chapter 12), sometimes the initiators overreach them-selves, and the problems and deficiencies become embedded in the project.
There is not only a question of technological complexity, but also of socialcomplexity, as De Bruijn and Leijten argue in Chapter 2. There are often con-cerns about public support, and the rationality and consistency of politicaldecisions. A question consistently raised is where private decision-making,private funding and private risk-taking should be preferred and where publicdecision-making is necessary, for example in order to safeguard publicvalues, to have risks borne publicly, or to come to the aid with public finance.Until recently in the transport infrastructure sector, public decision-making,public finance and public risks were involved exclusively, which usuallyresulted in a weak orientation to the market and serious cost underestimates.The approach has shifted progressively towards arrangements betweenpublic and private institutions, in which the public institutions are requiredto safeguard public values, and private institutions usually ensure a bettermarket orientation, more dynamism, and flexibility. There is a constant questfor the optimum balance between competition and collaboration, and acertain control of the transaction costs, which may be excessively high ininnovative arrangements (Van de Velde and Ten Heuvelhof, Chapter 13).
2 Introduction: scope of the book

We have opted to solicit contributions from the circle of independent,academic experts from Europe and North America. It was tempting also torequest contributions from the banking world (such as the World Bank) orfrom the world of developers and contractors. The expertise of financersand practitioners is included in the scientific contributions in this book, butour preference is for this expertise to come from independent, academicsources.
It was likewise tempting to request contributions from authors whoderive their insights from mega-projects in countries such as China, Indiaand Korea, where the biggest known mega-projects are currently beingplanned and executed. However, we chose evidence-based contributions,embedded in the modern context of democratic governments and market-oriented private institutions. In some contributions (Chapter 7 by Flyvbjerg;Chapter 8 by Miller and Lessard), mega-projects in other continents areincluded, but in general there is insufficient empirical information availableon mega-projects outside Europe and North America, and in many casesthe context is still too specific and too traditional, as in China, where untilrecently the socialist regime dominated decision-making, and where theconcept of private property was scarcely understood. All this is now chang-ing rapidly. Globalisation is introducing an increasing number of Westerninstitutions, companies and experiences into Asia, Africa and LatinAmerica. We think that the experiences compiled in this book are rele-vant for the entire modern developed world, and to some extent also for thedeveloping countries that have now embarked on a spectacular economictransition. None the less, in the course of time there will be enough data fora book compiling experiences with mega-projects outside Europe andNorth America. Whereas now many scientists and practitioners in Asia,Africa, Australia and South America are able to benefit from the findingsand lessons in our book, soon scientists and practitioners in Europe andNorth America will likewise be learning lessons from the decision-makingon mega-projects in other parts of the world.
Many of the cases in this book are related to major transport infra-structure projects. This mega-project category is highly relevant, and anabundance of research has been undertaken to gather empirical evidenceon them. But there is more to mega-projects. This is stated explicitly inChapter 8 (Miller and Lessard) and Chapter 9 (Samset), which deal witha broader set of large engineering projects, including nuclear plants,offshore constructions, water treatment plants, military weapons systems,ICT systems and complex real-estate projects (e.g. hospitals, offices, shop-ping malls and urban centres). The scope of this book is certainly widerthan large transport infrastructure projects. Where general phenomena,concepts, findings and lessons are involved, we always have the broader set
Introduction: scope of the book 3

of mega-projects in mind, which extends beyond the infrastructure pro-jects: technological complexity, social complexity, cost overruns, strategicbehaviour, contested information: all these phenomena apply not only totransport infrastructure projects, but also to mega-projects in a broadersense.
1.3 COMMON PITFALLS IN DECISION-MAKINGON MEGA-PROJECTS
Introduction
Various recent studies on mega-projects have identified certain characteris-tics that are typical of decision-making processes for those projects. In thissection we shall discuss the findings of researchers who each studied alarge number of mega-projects: the American researchers Altshuler andLuberoff (2003), and Miller and Lessard (2001), followed by the Europeanresearchers Flyvbjerg, Bruzelius and Rothengatter (2003). Then we examinethe approach of Short and Kopp (2005) from the Joint OECD/ECMTTransport Research Centre. Finally, the conclusions of the DutchParliamentary Committee on Infrastructure Projects (Tijdelijke CommissieInfrastructuurprojecten; TCI, 2004) are summarised.
Mega-Projects According to Altshuler and Luberoff (2003)
Altshuler and Luberoff (2003: 6–7), who investigated three types of mega-projects – highways, airports and rail transit systems – search for a broaderapproach spanning four dimensions. First, the authors integrate theirfindings with leading theories on urban politics and empirical research byothers on urban renewal. Second, they address national patterns. Althoughthe authors make substantial use of case studies, they take them from mul-tiple sources to illustrate broad themes and intersperse them with discus-sions on national developments. Third, Altshuler and Luberoff examine thesituation from an intergovernmental perspective. Most urban mega-projects in the latter half of the twentieth century were undertaken withsubstantial federal funding and within contours of opportunity defined byfederal programmes. The authors delineate the multilevel dynamics ofthese cases, highlighting the roles of federal, state and local players. Finally,they trace developments over half a century, long enough for considerableevolution to have occurred.
Altshuler and Luberoff (2003: 219–47) identify a number of commonpatterns:
4 Introduction: scope of the book

1. Urban mega-projects ceased to be routine after 1970. Implementationdepended far more on the case-by-case initiative and style of theadvocates.
2. Mega-project support coalitions were, with rare exceptions, spearheadedby business enterprises with immediate interests at stake. The exceptionswere led by environmental groups promoting mass transit projects.
3. Mega-project ideas frequently originated in the public sector and werethen ‘sold’ to prospective constituencies. Even when the initial impetuscame from private groups, energetic and skilful public-sector leader-ship was still required in most cases to widen the base of publicsupport, mollify critics, secure resources at higher levels of govern-ment, and generally manage conflict. The authors dub this kind ofleadership ‘public entrepreneurship’.
4. However broad their support coalitions, mega-project proposals wererarely implemented if they imposed substantial costs on neighbour-hoods or the natural environment. Altshuler and Luberoff call this the‘do-no-harm’ paradigm.
5. But even the most sensitively planned mega-projects generated somenegative impacts, so it became widely accepted that these should be‘mitigated’ as far as possible. The mitigation norm frequently becamea major source of leverage for groups with agendas that went beyonddamage limitation.
6. Though urban mega-projects were often founded mainly by the federalgovernment, they almost invariably originated locally, where they alsodrew their main constituency of support with little or no regard fornational objectives. Altshuler and Luberoff refer to this as ‘bottom-upfederalism’.
7. The whole point of mega-project finance was to avoid increases inbroad-based local taxes – particularly if levied on host-city residentsalone – and, more specifically, property and income taxes. Alternativesources of funding included local taxes designed mainly for visitors,state and regional sales taxes, and sometimes lottery revenues. Altshulerand Luberoff describe this as ‘locally painless project financing’.
8. Finally, the costs of mega-projects rose spectacularly in 1970–2000 andsurpassed official estimates by a considerable margin at the time ofauthorisation. The causes of this development seem to lie in the realmof politics rather than in engineering or accounting.
Mega-Projects According to Miller and Lessard (2001)
In Chapter 8, Roger Miller and Donald Lessard present an overview of theIMEC study, an assessment of 60 mega-projects (IMEC � International
Introduction: scope of the book 5

Program in the Management of Engineering and Construction). Theseprojects include 15 hydroelectric dams, 17 thermal and nuclear powerplants, 6 urban transport facilities, 10 civil infrastructure investments, 4 oilplatforms and 8 technology initiatives. Per project, seven to eight partici-pants–sponsors, bankers, contractors, regulators, lawyers, analysts andothers were interviewed. Particular emphasis was placed on front-enddevelopment decisions, but execution and initial ramp-up to operationwere also studied.
The goal of the IMEC study was to understand the changes that wereoccurring (increasing financial, political and social complexity), and toidentify the practices that, in the experience of executives involved in pro-jects, really made a difference. The study reflects the collective experiencefrom Europe, North and South America, and Asia. The study involved sys-temic and strategic perspectives, and focused on themes such as coping withuncertainly through risk analysis, institution-shaping and strategies.
Mega-projects or large engineering projects (LEPs) are presented ashigh-stakes games characterised by substantial irreversible commitments,skewed reward structures when they are successful, and high probabilitiesof failure. Their dynamics also change over time. The journey from initialconception to ramp-up and revenue generation takes ten years, on average.While the ‘front end’ of a project – project definition, concept selection andplanning – typically involves less than one-third of the total elapsedtime and expense, it has a disproportionate impact on outcomes, as mostshaping actions occur during this phase. During the ramp-up period, thereality of market estimates and the true worth of the project are revealed.Sponsors may find that actual conditions are very different from expecta-tions, but only a few adaptations are possible. Once built, most projectshave little flexibility in use beyond the original intended purpose. Managingrisks is thus a real issue.
Successful projects are not selected but shaped. Successful sponsorsappear to start with project ideas that have the potential to become viable.These sponsors then embark on shaping efforts to influence risk driversranging from project-related issues to broader governance. The seeds ofsuccess or failure of individual projects are thus planted early and nurturedover the course of the shaping period as choices are made. Successful spon-sors, however, do not escalate commitments, and they abandon quicklywhen they recognise that projects have little possibility of becoming viable.
Two other key concepts related to risk that emerge from the study are gov-ernability – the creation of relationships that allow a project to be reconsti-tuted and proceed even after major changes in project drivers and theresulting payoffs to the various parties involved – and turbulence – the ten-dency for risks to compound dramatically once things begin going off track.
6 Introduction: scope of the book

Miller and Lessard argue that projects are dynamic, iterative and oftenchaotic systems. Project-management architectures must reflect this. Whileprojects tend to resemble a spiral more than the classic waterfall, even thismetaphor may be too orderly. Projects are better viewed as evolutionaryand path-dependent systems composed of episodes displaying differentdynamics.
These findings apply equally, albeit in somewhat different ways, to thethree distinct classes of risk (in terms of their causes) encountered in mostprojects: those emanating from the dynamics of the project itself (techni-cal and operational risks); those associated with the markets with which theproject interacts (market risks); and those related to the political, social andeconomic setting of the project (institutional/social risks).
Chapter 8 informs the reader in more depth about the findings of theIMEC study.
Mega-Projects According to Flyvbjerg, Bruzelius and Rothengatter (2003)
Flyvbjerg et al. (2003) base their analysis on a unique database compris-ing 258 large infrastructure projects spread over many years in all conti-nents and involving a total investment of €90 billion. Despite thegeographical and temporal spread and the wide differences in the charac-teristics of the projects, Flyvbjerg et al. (2003) identified some commonfeatures.
The most important finding is that in nine out of ten cases the costsof mega-projects are underestimated. Cost overruns are in particular aproblem in the development of rail infrastructure. On the other hand, thedemand for transport, and hence the actual performance of transport, areinvariably overestimated. This conclusion confirms the findings of previousstudies by Wachs (1989; 1990) and Pickrell (1989; 1992). The actual costsfor rail projects are, on average, 45 per cent higher than the projected costs.The differences are so great and so consistent that Flyvbjerg et al. (2003)rule out the likelihood of coincidence. The World Bank refers to this phe-nomenon as ‘appraisal optimism’ (Short and Kopp, 2005: 366); Flyvbjerget al. (2003) call it ‘misinformation’ (TCI, 2004: 41).
Misinformation undermines Parliament’s ability to exercise democraticcontrol. Flyvberg et al. stress that the effects of misinformation are notconfined to the political arena; for example:
● misinformation destabilises the decision-making on a project. It isbound to emerge sooner or later that the information was incorrect;
● setbacks disrupt the process; for example, new research may beneeded and the political and market players might start getting edgy;
Introduction: scope of the book 7

● incorrect information can also lead directly to squandering of tax-payers’ money.
If the actual costs had been known beforehand, the project could have beenabandoned, and other projects with a higher societal yield per invested eurocould have been considered. As Flyvbjerg et al. say: ‘The wrong projects arebeing chosen and implemented.’
The dividing line between misinformation and prevarication is wafer-thin. According to Flyvbjerg et al. (2003), misinformation is essentially thewilful and deliberate telling of untruths – which is tantamount to lying.
The central challenge when defining decision-making processes for mega-projects is to create incentives that deliver more reliable information –particularly in the early stages. This may be achieved through second opin-ions, hearings, workshops and independent experts. Flyvbjerg et al. (2003)maintain that cost–benefit prognoses should be left to the organisations thatwill actually suffer the consequences of any inaccuracies. Accordingly, theyalso argue that private parties should be allowed to participate in the prepa-rations for mega-projects provided they bear at least 30 per cent of the totalinvestment risk.
The conclusions of Flyvbjerg et al. (2003) do not bode well for politicaldecision-making. They imply that governments and parliaments base theirdecisions on (deliberately fabricated) incorrect information. The costs areunderestimated and the benefits overestimated: there are too many mega-projects with far lower returns than predicted, and nowhere near enougheconomic benefits. Moreover, huge differences exist between projects: whilesome are prepared on the basis of the grossly exaggerated predictions of theinitiators, others are prepared on the basis of (more or less) accurate infor-mation. So it makes no sense to argue that the impacts of the mistakescancel each other out.
Mega-Projects According to Short and Kopp (2005)
Short and Kopp (2005: 362–3) have assembled data that show long-runtrends (1975–2000) in the ratio of investment in different modes of trans-port. In Western European countries the percentage invested in roadtransport is declining slightly while the percentage that goes to rail trans-port is on the increase. Conversely, in Central and Eastern Europeancountries investment in rail transport is declining, standing at around 37per cent in 2000. Short and Kopp (2005: 363) write: ‘[T]he fact that therail market share has been constantly declining and that its share ofinvestment is increasing in Western European countries is certainly worthnoting.’ It looks as if the renaissance of rail investment in Western Europe
8 Introduction: scope of the book

is tied in with the popularity of the high-speed railway and light rail(ECMT, 1994).
Short and Kopp (2005: 363) have misgivings about the recent rise ininvestment in rail infrastructure in Western Europe. Considering the sharpfall in the railway’s market share in the modal split (lower than 10 per centin many West European countries), the low rates of return on rail invest-ment, the relatively large sums needed to make an impact, and the highmaintenance consequences of rail investments (in Germany it is estimatedthat every €100 invested in rail means annual maintenance costs of €40),Short and Kopp (2005: 363) ask ‘whether we can afford this’. Rail invest-ment and user charge in rail transport without accompanying policy mea-sures are likely to be costly and ineffective (Affuso et al., 2003).
Short and Kopp (2005: 363) refer to Bonnafous (2003), who points outthat the costs per kilometre of high-speed railway lines are far higher thanin the past. In fact, they have almost doubled in real prices, from €5.03million for the first lines to over €9.91 million for more recent ones. Thoughthe first high-speed rail projects in Japan and France (Bonnafous andCrozet, 1997) were successful, recent ones show more dubious results.
Short and Kopp (2005: 363) compiled a set of proposals for improvingplanning and decision-making in transport infrastructure mega-projects:
● Greater efforts should be made to explain the planning methods to abroad expert audience. Secrecy about forecasting methods, model-ling assumptions, model selection criteria and, in particular, thedetermination of planning objectives, can make people suspicious ofthe planning outcomes.
● Quality checks on the planning outcomes, similar to reviews byscientific journals, could help to improve the reputation of planningagencies.
● Even if the quality of a planning process is beyond reproach, it is notalways certain that the outcomes will be directly translated into polit-ical decisions and then implemented. If this is due to defects in theplanning, information should be relayed back to improve the planningprocess in general and move it forward to an interactive planning–policy learning process.
● The rejection of planning outcomes should be justified. The reasonsfor political non-acceptance of planning outcomes should be backedby a broad audience.
In general, Short and Kopp (2005) observe a lack of transparency indecision-making on transport infrastructure projects on a national andEuropean scale. The methodological underpinning of decision-making on
Introduction: scope of the book 9

these projects also left much to be desired. Short and Kopp (2005: 364)even say that no use is made of traffic forecasts or economic analyses.Neither data nor costs are publicly available. There is also a dire shortageof reliable and competent ex-post evaluations (Quinet, 2000; Rothengatter,2000). As European decision-making is sometimes geared exclusively toprojects worth at least €500 million, a bias has emerged towards mega-projects. Short and Kopp (2005: 364) write: ‘[T]hese international processesdid not make enough use of economics, became over-politicised andbiased towards mega-projects, and had no close links with financing orimplementation.’
Unfortunately, the findings with regard to decision-making in interna-tional projects apply likewise to decision-making in national transportinfrastructure projects. There is a pressing need at both levels for betterdata, better economic appraisal and more transparency (Mackie andPreston, 1998).
In tram and light-rail projects the costs also tend to be underestimated andthe benefits overestimated (Pickrell, 1989). Even so, Short and Kopp (2005:365) concede that, at the end of the day, sensible decisions are still taken:‘Some cities, for example, Strasbourg, Nantes and Grenoble believe that theirvisions of accessibility and liveability have been achieved and that their lightrail systems have enhanced them. Other cases are much less convincing –Sheffield in the UK is one example and there are several more in the US.’
Short and Kopp (2005: 366) write: ‘It is clear that an evaluation frame-work for light rail needs to address broader aims: better accessibility tocities and particular groups, more attractive cities, revitalised city districtsand more users of other modes to reduce congestion and pollution.’ Thequestion is how all these effects can be credibly determined in advance.
Short and Kopp (2005: 366) draw six general conclusions on investmentin and planning of transport infrastructure projects:
1. Policy and research need good data. The broad information that is cur-rently available allows some analysis but it is still insufficient and inneed of fundamental improvement. Often, project data are not col-lected or made available, and ex-post monitoring of projects and poli-cies needs to be systematically introduced and strengthened.
2. Even at this level, important questions can be raised about appropriatelevels of investment and how the investments are allocated to thevarious modes. The search for answers will involve more in-depthanalyses and may prove a rich topic for research.
3. National investment planning methods are flawed in several respects,the most serious being lack of transparency, not differences in appraisalmethods.
10 Introduction: scope of the book

4. International planning is growing in importance but it risks inheritingall the flaws of national planning and some new ones as well. But thatdoes not alter the fact that there are areas where infrastructure has tobe planned on an international scale. We therefore need better analy-ses and a clearer understanding of where international planning mightapply and how it could work effectively.
5. Project appraisal is still inconsistent and weak. Strategic appraisal is inits infancy. Ex-ante appraisal is often biased and ex-post analysis rarelytakes place.
6. Research into planning and decision-making processes could, given theirever-increasing complexity and duration, be of great value to society.
Mega-Projects According to the Duivesteijn Commission (2004)
The experience of the Dutch Duivesteijn Commission (TCI, 2004)confirms the findings of Short and Kopp (2005).
In 2004 the Dutch Parliamentary Commission on Infrastructure Projectspublished its official report (TCI, 2004). The conclusions of the DuivesteijnCommission are based on the decision-making process for two majorinfrastructure projects: the dedicated High Speed Rail Link South(Amsterdam–Belgian border – HSL-South) and the dedicated FreightRailway Link, connecting Rotterdam and the Ruhr Area (Betuwe Line).The TCI (2004) also turned its attention to recent international analyses ofdecision-making in large infrastructure projects. The central concern of theTCI study (2004) is the role of the Dutch Parliament.
In the Netherlands, empirical evidence drawn from the two cases men-tioned bears out the findings of Altshuler and Luberoff (2003): the PortAuthority of Rotterdam, the Dutch Railways and the ECT Terminal inRotterdam strongly backed the Betuwe Line (no. 2). Public entrepreneur-ship was observable in both the HSL-South and the Betuwe Line (no. 3).The do-no-harm approach was adopted by municipalities and actiongroups in both cases. This led to a number of extra tunnels and other plansfor mitigating negative impacts, incurring substantial cost overruns. Withthe exception of the province of Gelderland, no local or regional authoritymade a financial contribution (no. 4). Mitigation of negative impactsplayed an important role in the Betuwe Line in particular, but HSL-Southalso generated some interesting and costly mitigation programmes, includ-ing the Green Heart Tunnel (no. 5). ‘Bottom-up federalism’ was observedin HSL-South (Amsterdam–Schiphol) and even more so in the BetuweLine (Port Authority of Rotterdam) (no. 6). ‘Locally painless projectfinancing’ occurred in both cases (no. 7). Finally, it was the huge cost over-runs in both cases that prompted the TCI to launch a parliamentary inquiry
Introduction: scope of the book 11
(no. 8). In comparing the USA and the Netherlands we have to keep inmind that the finance of local projects in the Netherlands is much moredependent on the national public budget than in the USA.
The TCI (2004: 15) observed that mega-projects are often contestedduring preparation and implementation. They are characterised bydynamism and complexity, as is reflected in systematic budget overruns.Large projects are one-off events in public administration and thereforerequire an individualised approach.
The frequent budget overruns point to a financial complexity which isintertwined with the immense technological and social complexity of mega-projects. The decision-making on complex projects takes place in a policyarena of interdependent parties (TCI, 2004: 18). Teisman (1998) writes:‘The players are stuck with each other. Mutual dependence creates rela-tionships. The policy field evolves into a network of interdependent ties. . . .Initiatives come under fire in systems founded on checks and balances –which could lead to better policy proposals.’
Any number of obstacles can crop up and obstruct political manage-ment and monitoring of the decision-making process. A huge problem isthat the Lower House is not involved in the decision-making procedure inthe initiation phase of mega-projects and, in effect, acquiesces. In the laterstages it seems to be primarily committed to pushing through spatialadjustments.
The government has set its course and is holding fast; it is subject to aprocess of entrapment (Brockner and Rubin, 1985). The government hasshown that it is hardly capable of learning lessons. Hence the governmentis also to blame for the many overrun budgets.
There was no overall appraisal at the start of the decision-makingprocess. There was no scope for weighing up the alternatives. Sometimes thedecision-making was prematurely included in the text of a coalition agree-ment. However, since the start of the Betuwe Line and the HSL-Southmuch has improved by introducing the OEEI method in calculating ex-antecosts and benefits (Eijgenraam et al., 1999).
The main obstacles to management and monitoring in the implementa-tion phase are the project organisers, project control, risk management,contracting, and the public–private partnership. In all these areas the ambi-tions were found to be too high and the achievements too low, partlybecause of a lack of professionalism in the public sector.
The findings of the TCI (2004) bear out the conclusion of Short andKopp (2005: 366), who call the role of government into question: ‘[I]n manycases, its role as protector of the public interest has become subordinate toits role as promoter of projects. Achieving the right balance requires anurgent redefinition of the job of Transport Minister . . .’.
12 Introduction: scope of the book
1.4 CONTENT OF THE BOOK
The book is structured in three parts, which relate to the three componentsof the subtitle of the book: I Management Characteristics and Cost–Benefit Analysis; II Planning and Decision-Making; and III Innovation,Competition and Institutions.
Part I Management Characteristics and Cost–Benefit Analysis
Part I starts with Chapter 2, ‘Management characteristics of mega-projects’ (Hans de Bruijn and Martijn Leijten). In this contribution theauthors discuss the most common pitfalls for managers of mega-projectsand ways to avoid them. Projects may be unmanageable (in terms of timeand money) as a result of a challenging design or a complex social system,or impoverished as a result of a safe design to prevent this unmanageabil-ity. In addition, this chapter focuses on the characteristics of the technicaland social complexity, and how projects can be managed to avoid these pit-falls. This leads to the central question whether the manager should bemainly involved with the substance of his project or rather with the processthat should lead to its completion.
Chapter 3 is on the ‘Ex-ante evaluation of mega-projects: methodologi-cal issues and cost–benefit analysis’ (Bert van Wee and Lóránt Tavasszy).This chapter discusses methodological issues from the cost–benefit analy-sis (CBA) perspective. Several of the issues, however, are also relevant forother evaluation frameworks such as multi-criteria analysis (MCA). Theissues include both the more technical/methodological issues as well asmodelling issues.
‘Cost–benefit analysis and the wider economic benefits from mega-projects’ is the topic of Chapter 4 (Roger Vickerman). Wider benefits, goingbeyond the direct benefits to the users of transport infrastructure, are fre-quently claimed as the basis for justifying projects that have only marginalrates of return based on user benefits. This chapter reviews the basis forsuch claims, referring to empirical evidence from European, Dutch and UKstudies. It assesses the way in which such evidence can be used to refine theappraisal process for mega-projects. There is a particular emphasis on thevalue of the new economic geography, especially the impacts on the labourmarket. The chapter argues that there is no simple rule of thumb that canbe applied to such projects, and that the data requirements, althoughdemanding, are feasible for mega-projects.
Chapter 5, written by Hans de Bruijn and Martijn Leijten, is on ‘Mega-projects and contested information’. Good information is key to gooddecision-making on mega-projects. Decision-making is information-sensitive
Introduction: scope of the book 13

and empirical research shows that, in many cases, a lack of information hasresulted in poor decision-making. This chapter deals with three issues relatedto mega-projects:
1. The concept of contested knowledge will be introduced. The strongerthe different interests of the main actors are, the stronger the incentiveswill be to make information more contested and devalue it.
2. If the contested character of information is denied, what are the impli-cations for decision-making? Denying the contested character of infor-mation will make decision-making a free fight. This is a paradoxicalconclusion: if information is contested and actors look for objectiveinformation, the role of information will be devalued rather thanstrengthened.
3. A number of strategies will be introduced to cope with the contestedcharacter of information. Their essence is not finding objective infor-mation but negotiating on what the right information for correct deci-sion-making might be. The result of these strategies is negotiatedknowledge rather than objective knowledge.
Part II Planning and Decision-Making
Chapter 6, by Hugo Priemus, tries to explain ‘How to improve the earlystages of decision-making on mega-projects’. The author argues that thedecision-making process on mega-projects is mostly at its weakest in theearly stages.
Very often a solution is presented without a valid analysis of theproblems. In addition, feasible alternatives are not put forward, becauselobby groups work hard mobilising support for the ‘superior’ solution.Alternatives are only later suggested by others than the promoters, and areoften whittled down to nothing.
The systems analysis methodology is presented in this chapter andstrongly recommended: at an early stage alternatives are generated, rankedaccording to the ex-ante calculations of costs and benefits, and finallyselected. This methodology is certainly not new among scientists, but inpractice governments and other promoters of mega-projects seldom usethis well-known approach, let alone more advanced techniques such asactor modelling, simulation and gaming, which could very well be com-bined with systems analysis.
‘Public planning of mega-projects: overestimation of demand and under-estimation of costs’ is the theme of Chapter 7 by Bent Flyvbjerg.This chapterpresents evidence that forecasters generally do a poor job of estimating traveldemand and construction costs for new transportation infrastructure. For
14 Introduction: scope of the book

travel demand, in nine out of ten rail projects passenger forecasts are over-estimated; actual ridership is on average 51 per cent less than that forecasted.In 50 per cent of road projects the difference between actual and forecastedtraffic is more than �20 per cent; for 25 per cent of roads the difference isgreater than �40 per cent. For construction costs, nine out of ten projectshave underestimated costs and cost overruns.
Forecasting inaccuracy appears to be constant over time and space.Estimates of travel demand have not improved for 30 years, cost estimatesand overruns not for 70 years. Inaccuracy exists across the 20 nations andfive continents included in the study. Measures developed to improve thissorry state of affairs include improved governance structures with incen-tives that better reward valid estimates of demand, costs and risks, andpunish deceptive estimates. Measures also include better forecastingmethods, for example the use of ‘reference class forecasting’, based on the-ories of decision-making under uncertainty.
Chapter 8 is on ‘Evolving strategy: risk management and the shaping ofmega-projects’ (Roger Miller and Donald Lessard). The authors argue inthis chapter that the succession of shaping episodes that form the front-endprocess to cope with risks can be reinterpreted in terms of the real-optionsframework that is currently revolutionising academic treatments of projectevaluation. In fact, as is often the case with cutting-edge practice, managershave been successful at creating value through the development and exer-cise of sequential options without explicitly framing the process in optionsterms. Academics have simply codified this practice in the form of a newconceptual framework.
The real-options framework is based on the same logic as that offinancial options as developed by Black and Scholes (1974). It recognizesthat the decisions that determine project cash flows are made sequentiallyover many episodes. The key insight of this approach is that uncertainty orvolatility may actually increase the value of a project, as long as flexibilityis preserved and resources are not irreversibly committed. As a result, theeconomic value of a project when it is still relatively unformed is oftengreater than the discounted present value of the expected future cash flows.Value is increased through the creation of options for subsequent sequen-tial choices and exercising these options in a timely fashion. Thus sponsorsseek projects that have the potential for large payoffs under particular insti-tutional and technical circumstances. The study in this chapter illustratesthe rich varieties of mechanisms through which these options are shapedand exercised over the life of the project – the real management that is inte-gral to real options.
‘How to overcome major weaknesses in mega-projects: the Norwegianapproach’ is the theme of Chapter 9, by Knut Samset. This chapter takes a
Introduction: scope of the book 15

broad view on decisions made at different stages, up front and duringimplementation, of mega-projects – and their effects during the implemen-tation and operational phases. The author discusses characteristics of thedecision-making process and the basis for decisions during these phases.Some general requirements are outlined, and cases used to illustrate thepoints. The presentation focuses on basic generic principles, and only tosome extent goes into further discussion of the complexities and restric-tions that might apply when the principles are implemented. The qualityassurance scheme applied by Norwegian authorities to improve up-frontdecision-making, management and the effect of major public investmentprojects is presented as one type of governance regime that might help over-come some of the problems observed. Current and potential effects andspin-offs of the regime are discussed.
Joop Koppenjan discusses ‘Public–private partnership and mega-projects’ in Chapter 10. This contribution concentrates in particular on thePrivate Finance Initiative (PFI) – as in arrangements in the transport andwater sectors. The author discusses what public–private partnership (PPP)is about: definitions, motives and form. Then an overview is given of expe-riences with PPP. The central question is: does PPP live up to expectations?The author discusses a number of typical problems that occur in PPPprocesses which will have to be dealt with in order to make PPP schemeswork.
Finally, a number of lessons are formulated regarding the conditionsfor successful PPP in mega-projects. The author argues that the currentemphasis on PFI-like models in the world of infrastructure projects shouldbe complemented with other experimental models: the variety of infra-structure projects calls for the development of a variety of PPP options,which makes the task for parties to learn to handle these options even morechallenging.
Part III Innovation, Competition and Institutions
Chapter 11 (Werner Rothengatter) is on ‘Innovations in the planning ofmega-projects’. The focus is the aspects of new institutional arrangementsand innovative assessment tools to improve on the performance of theplanning process for mega-projects.
Wrong procurement is a major cause of public failure; the problems ofhigh risk and long life of mega-projects deserve particular considerationin the procurement process. Innovations in planning approaches start atthis point of departure and first suggest a different organisation structure.Important issues are the establishment of a project company underprivate law and the participation of private risk capital. Furthermore, the
16 Introduction: scope of the book

integration of preferences of different stakeholder groups from the begin-ning is important to minimise conflicts in the procurement process. Thiscan be supported by particular methodological approaches such as logicconstraint programming. Finally, a dynamic assessment scheme is neces-sary, which includes the most important feedback loops between infra-structure use and the economy. One possibility is to apply systemdynamics, which is illustrated by the example of the ASTRA model.
The basic message is that improved success of mega-projects is not somuch a matter of better methods or more accurate calculations. Majorprogress can be achieved by changing the institutional environment so thatthe incentives of the stakeholders work in the direction of generating realeconomic benefits within the budget. Once the incentives are set right, theplayers will almost automatically be interested in using the best technolo-gies and methods, as is suggested.
Chapter 12, written by Karen Trapenberg Frick, is on ‘The cost of thetechnological sublime: daring ingenuity and the new San Francisco–Oakland Bay Bridge’. The ‘technological sublime’ refers to the repeatedexperiences of awe and wonder, often tinged with an element of terror,which people have had when confronted with particular natural sites, archi-tectural forms and technological achievements. This chapter uses thisconcept of the sublime to contribute a new dimension to understanding theevolution of mega-project design and optimism bias. The case of the newSan Francisco–Oakland Bay Bridge in Northern California is used todemonstrate how the technological sublime dramatically influenced bridgedesign, project outcomes, public debate and lack of accountability for itsexcessive cost overruns. The new Bay Bridge case raises several importantadditional dimensions that should be considered in policy analyses aboutmega-projects: the sublime, aesthetics and funding.
Chapter 13 (Didier van de Velde and Ernst ten Heuvelhof) is on‘Provision and management of dedicated railway systems: how to arrangecompetition’. The main aim of using contracting under competition in thecase of infrastructures was the introduction of additional incentives forbudget control in infrastructure realisation and a better inclusion of trade-offs between building costs and maintenance costs in infrastructure designand operation. Further in-depth studies are required to identify the relativeperformance of these different arrangements.
The authors observe that, although the advantages may seem substantialfrom a theoretical perspective, innovative contracting is difficult to get offthe ground. The main issue, identified as the vertical dimension in theirframework of analysis, is whether production stages that are conceptuallyseparable (such as infrastructure management and train operations) shouldbe separated, or whether interdependencies between these or other stages
Introduction: scope of the book 17

require integration to guarantee optimisation. These critical interface prob-lems require specific attention when the use of competition is contemplatedto realise one or several parts of a railway system. This is the fundamentalissue of transaction-cost economics. One feature of the current reformpractices in the railway sector is that they are, to a large extent, dictated bypolitical or economic dogma rather than by optimal outsourcing decisions.Furthermore, many of the reforms go beyond simple outsourcing, as theyintroduce several non-hierarchically related initiative-takers along thevarious layers, adding to the complexity and requiring further coordinationbetween these new actors.
Two questions present themselves in a horizontal sense: to what extentshould the various activities (designing, building, operating, maintaining)and their financing be kept in one hand and how much room should privateparties be given in their role as contractors? Successes appear to be scoredmainly in effectiveness, better project control and innovation. Most prob-lems occur in the areas of transaction costs, transparency, legitimacy andaccountability. Many of the disadvantages might perhaps have been pre-vented if the process had been better organised.
Chapter 14 deals with a specific case: ‘Rail infrastructure at majorEuropean hub airports: the role of institutional settings’. This contributionby Moshe Givoni and Piet Rietveld compares different approaches to inter-modality. The authors argue that the development of rail networks aroundthe world is directly linked to the development of cities. Large airports gen-erate demand which is often even larger than that of city centres. Big air-ports are ideal places for developing railway services. Nevertheless, theconnection of the world’s largest airports to the rail network is a recentdevelopment.
The different degrees of rail development at airports which are bigenough to justify investments in rail infrastructure are very context-specific.In terms of intermodal policies and more specifically rail services at air-ports, the cases of Schiphol (seamless intermodality) and Heathrow(limited intermodality) represent two extremes. The case of Charles deGaulle (Paris) illustrates an intermediate position. These three cases arepresented and compared. The different institutional settings contributestrongly to the explanation of the differences in outcomes.
The authors conclude that in countries with large airports and a devel-oped rail network, airports should be a stop on the main rail lines. It ishelpful to recognise large airports as cities. The role and function of thesecities in a regional-economic perspective depend on their connection to thesurface transport network. It is important not only to improve the inter-connectivity between air networks and road networks, but also the inter-connectivity between air networks and rail networks.
18 Introduction: scope of the book

Chapter 15 draws institutional lessons across countries on making trans-port infrastructure policy. The author, Martin de Jong, argues that institu-tions and institutional systems are hard to change, but it is not impossible.
When congestion on the infrastructure networks or annual investment/maintenance costs are considered to have grown out of hand, or when cit-izens feel they should be more involved in the decision process, drawinglessons from policies in other countries can prove a helpful source of inspi-ration for institutional changes at home. This does not imply, however, thatfollowing good examples from elsewhere also results in policy successes athome. Political, legal, administrative and cultural practices differ amongcountries, and so do their economic, geographical and practical potential.In the end, each country can benefit immensely from experiences abroad,but policy actors will always have to take into account that a transplantmust function in one’s own institutional context, in one’s own practical cir-cumstances and in collaboration with other domestic policy actors. Thechances that such a situation comes about is low when policy models arecopied literally and without making the necessary amendments.
Four examples of promising policy transplants are presented. All fourmay prove invaluable sources of inspiration for policy entrepreneurs apt toprovoke changes in their national systems for infrastructure decision-making, albeit in various directions. But in none of them can transfer beconsidered something automatic. It will require political and policy strug-gles among proponents and opponents, and in all cases intelligent thoughtand careful manoeuvring in negotiations will lead the transplants to deviatesubstantially from their examples.
REFERENCES
Affuso, L., J. Masson and D.M.G. Newbery (2003), ‘Comparing investments in newtransport infrastructures’, Fiscal Studies, 24 (3): 273–315.
Altshuler, Alan and David Luberoff (2003), Mega-Projects. The Changing Politicsof Urban Public Investment, Washington, DC: Brookings Institution Press.
Black, Fischer and Myron Scholes (1974), ‘From theory to a new financial product’,Journal of Finance, 29 (2): 399–412.
Bonnafous, A. (2003), ‘Assessing our expertise’, in European Council of Ministersof Transport (ECMT) (ed.), Fifty Years of Transport Policy. Successes and NewChallenges, Paris: ECMT.
Bonnafous, A. and Y. Crozet (1997), ‘Evaluation, dévaluation ou réévaluation deslignes à grande vitesse?’, Les Cahiers Scientifiques du Transport, 32: 45–56.
Brockner, J. and J.Z. Rubin (1985), Entrapment in Escalating Conflicts: A SocialPsychological Analysis, New York: Springer Verlag.
Eijgenraam, C.C.J., C.C. Koopmans, P.J.G. Tang and A.C.P. Verster (1999),Evaluatie van infrastructuurprojecten. Leidraad voor kosten–batenanalyse. Deel I:
Introduction: scope of the book 19

Hoofdrapport [Evaluation of infrastructure projects. Guide for cost–benefitanalysis. Part 1: Main report]. Onderzoeksprogramma Economische EffectenInfrastructuur (OEEI), The Hague: Ministerie van Verkeer en Waterstaat enMinisterie van Economische Zaken.
European Council of Ministers of Transport (ECMT) (1994), Light Rail TransitSystems, Paris: ECMT.
Flyvbjerg, B., N. Bruzelius and W. Rothengatter (2003), Megaprojects and Risk: AnAnatomy of Ambition, Cambridge: Cambridge University Press.
Hall, P. (1980), Great Planning Disasters, Berkeley, CA: University of CaliforniaPress.
Mackie, P. and J. Preston (1998), ‘Twenty-one sources of error and bias in transportproject appraisal’, Transport Policy, 5 (1): 1–8.
Miller, R. and D. Lessard (2001), The Strategic Management of Large EngineeringProjects: Shaping Risks, Institutions and Governance, Cambridge, MA: MITPress.
Pickrell, D. (1989), Urban Rail Transit Projects. Forecast versus Actual Ridership andCosts, Washington, DC: US Department of Transportation.
Pickrell, D. (1992), ‘A desire named streetcar–fantasy and fact in rail transit plan-ning’, Journal of American Planning Association, 58 (2): 158–76.
Quinet, E. (2000), ‘Evaluation methodologies of transportation projects in France’,Transport Policy, 7 (1): 27–35.
Rothengatter, W. (2000), ‘Evaluation of infrastructure investments in Germany’,Transport Policy, 7 (1): 17–27.
Short, J. and A. Kopp (2005), ‘Transport infrastructure: investment and planning.Policy and research aspects’, Transport Policy, 12: 360–67.
Teisman, G.R. (1998), Complexe besluitvorming, een pluricentrisch perspectief opbesluitvorming over ruimtelijke investeringen [Complex decision-making, a pluri-centred perspective on spatial investments], The Hague: Elsevier.
Tijdelijke Commissie Infrastructuurprojecten (TCI) (2004), Grote projecten uitver-groot. Een infrastructuur voor besluitvorming [Large projects under the magnify-ing glass. An infrastructure for decision-making], Tweede Kamer (Dutch LowerHouse), 2004–2005, 29.283 nos 5–6, The Hague: Sdu Uitgevers.
Wachs, M. (1989), ‘When planners lie with numbers’, APA Journal, 55 (4): 476–9.Wachs, M. (1990), ‘Ethics and advocacy in forecasting for public policy’, Business
and Professional Ethics Journal, 9 (1&2): 141–57.
20 Introduction: scope of the book

PART I
Management Characteristics andCost–Benefit Analysis

2. Management characteristics ofmega-projectsHans de Bruijn and Martijn Leijten
2.1 INTRODUCTION
Over the years the development of mega-projects has presented us withsome of the most persistent problems of our times. Cost overruns, delays,use and revenues falling short, and even technical failure – sometimes withdevastating consequences – plague our progress. In this chapter we providean overview of the uncertainties and the management dilemmas manyproject owners or commissioners encounter.
There are at least two generically formulated pitfalls in the implementa-tion of mega-projects:
● The project is unmanageable in terms of time or money. This can havemany causes that often have to do with the technical and social com-plexity of the project and its environment. Most implementationproblems come into this category. An example of an important factorin technical complexity is the extent of technical uncertainty. Insocial complexity such a factor can be, for instance, the extent towhich there is disagreement between the parties involved regardingthe desirability and design of the project. The costs involved in aproject may be well managed during the setting up of the project, butafter the planning has been completed it turns out that the projectis much less cost-effective than originally thought – for examplebecause the number of users of the completed project falls short.This is also an aspect of manageability.
● The project is impoverished as to its substance: to prevent unmanage-ability it has too little ambition, is not sufficiently future-oriented.The outcome would have had greater added value if – for example –the choice had been of a different scope, if the wishes of the users orlocal inhabitants had been better exploited or if use had been madeof the latest expertise.
23
In this chapter we search for possible explanations for these pitfalls. Insimple terms, three types of explanation can be offered:
1. Explanations stemming from the decision-making process for a mega-project. The classic example here is the strategy of making too low anestimate of the costs involved in the mega-project in order for thedecision-making to go more smoothly at this stage.
2. Explanations stemming from the nature of the project decided upon.Thus a project requiring a great deal of innovative and as yet undevel-oped technology will probably be less manageable than a project thatmainly makes use of ‘proven technology’ (technical complexity).
3. Explanations stemming from the implementation of the mega-project.Here we can expect that a project meeting little opposition is morerapidly implemented than a project that can look forward to a greatdeal of opposition and thus generates a great deal of blocking power(social complexity).
The (political) decision-making process that leads to a decision to carry outa mega-project has already been dealt with extensively (see, e.g., Hall, 1980and Altshuler and Luberoff, 2003). In this chapter we concentrate mainlyon the latter two explanations: the nature of the project and the imple-mentation path.
The chapter is organised as follows: first the management characteristicsof the project will be examined more closely. These can be divided intotechnical and social characteristics (Sections 2.2 and 2.3 respectively). It ispointed out that certain characteristics make projects more manageablewhile others make them less so. When projects are easily manageable thereis the risk that they are less rich and innovative as to their substance,because they must comply with standards already available. We thenexamine the question of how potential unmanageability or impoverishedsubstance can be dealt with, which leads to further elaboration (Section2.4). Some conclusions are formulated in Section 2.5.
2.2 TECHNICAL COMPLEXITY
We distinguish between technical complexity (complexity with regard tothe project’s technical system) and social complexity (complexity withregard to the social system, such as the constellation of players involved)(cf. Cleland and King, 1983: 39).
Table 2.1 gives an overview of the most important factors in determin-ing the technical complexity of a project. The underlying thought is that
24 Management characteristics and cost–benefit analysis

the characteristics on the left are positive in their effect on the manage-ability of a project. We discuss these characteristics briefly and provide anexample of each.
Robustness: Overdesign or Underdesign
The robustness of a project refers to the lifespan and the solidity of a tech-nical design and its realisation. The more technically robust a project is,the less chance there is of unforeseen developments. Robustness is oftenaccompanied by a certain measure of overdesign: there is a standard for therobustness of a particular design, but the project is made more robust andmore detailed than the standard. This brings about a greater chance ofmanageability (though no guarantee). The opposite side of the coin isunderdesign. The project is less robust and thus less predictable and lessmanageable, as failure becomes a serious possibility. Underdesigning canbe an attractive strategy since it offers opportunities for realising the projectat a lower cost or for adjusting the design in the course of its implementa-tion. This can enrich the project’s substance and innovative character.Unexpected and unforeseen chances of a better implementation of theproject’s substance can be included without difficulty. It can also turn out,in hindsight, that an underdesign is sufficiently robust after all. Overdesignis more easily manageable; underdesign can be cheaper.
The Central Artery/Tunnel project of Boston, MA demonstrates the pos-sible risks of underdesigning (assuming that the leakages were the result ofa design problem, as suggested by some engineers). The CentralArtery/Tunnel project was the first US project to use slurry walls (usuallytemporary walls to prevent the excavation from flooding and collapsing) aspermanent walls. Moreover, the tunnel was being constructed in a vulnera-ble area, within a stone’s throw from Boston’s Inner Harbor. After opening,
Management characteristics of mega-projects 25
Table 2.1 Technical characteristics of projects affecting manageability
Manageable if . . . Less well manageable if . . .
Robust (overdesign) Less robust (underdesign)Proven technology (tame Innovative technology (unproven
technology) technology, unruly technology)Divisible IndivisibleLoose coupling Tight couplingFallback option No fallback optionMonofunctional MultifunctionalIncremental implementation Radical implementation

the tunnel experienced structural leakage problems, allegedly as a result ofthis design. However, there has not been a unanimous judgement on thecauses so far, and the commissioner has been discussing responsibility andsolutions with the many parties involved.1
An example of overdesign is also found in Boston, at the Post OfficeSquare underground car park, where engineers made very thick walls inorder to reduce to a minimum the risk of collapse or subsidence in thecomplex inner-city area where the project was planned. This was decidedafter the discovery of minor subsidence at one of the abutting buildings.2
The extent to which overdesign is successful is almost always the same:usually nothing goes wrong technically, but costs are higher and the oppor-tunities for innovation (e.g. development of a cheaper or better technologyor application, inherent to underdesign) are more limited than whenoverdesign is not employed.
Proven Technology or Innovative Technology
An innovative technology is one that is being used for the first time. Thereare different grades:
● A technology is specifically devised and developed for a project andthen applied. This is the most extreme form of innovation.
● A technology has already been developed but not yet applied.● A technology that has been applied previously, but not under the same
conditions (manageability can then be reduced by – for example –unfavourable soil conditions, a more complex project environment,larger scale etc.).
The use of a proven technology provides greater certainty than the use ofinnovative technology. Result: the project is more manageable but the poten-tial for innovation suffers, as does the enrichment of the project’s substance.
An example of the application of innovative technology in infrastructureconstruction is the New Austrian Tunnelling Method, developed in the1950s and 1960s in Austria to build tunnels (with the use of surroundingsoil; see Golser, 1976). It is now regularly applied all over the world. Anexample of the use of a known technology under new conditions is thedrilling of tunnels in the boggy Dutch soil. Tunnels had been drilled world-wide for many years before it was done for the first time under the difficultDutch conditions in the construction of the Tweede Heinenoordtunnel.This was clearly seen as a test project, and its implementation was plannedwith a great deal of redundancy and checks and balances (see also Section2.4), later turning out to be reasonably manageable.
26 Management characteristics and cost–benefit analysis

The Tacoma Narrows Bridge in the US state of Washington is one of thebest-known examples of an infrastructure where the application of aninnovative design went wrong. It was the first suspension bridge with plategirders, rather than open-lattice beams under the roadbed. In the olddesign, the wind would go through the truss, but in the new design the windwas diverted above and below the structure. Soon after the bridge openedin 1940 it was discovered that the roadbed would start to sway and bucklein windy conditions. A few months later, the bridge collapsed (Ammannet al., 1941).
Divisibility or Indivisibility
A divisible project consists of different functional elements or sub-projects, working independently of one another; an indivisible projectconsists of a single functional whole that can no longer function if onepart is removed. Divisible projects usually have more simultaneousprocesses (activities that can be carried out at the same time), which canreduce the consequences of time and cost overruns in the course of theproject (shorter critical path). If activities are carried out sequentially,any slow-down in a particular activity automatically causes delay in thesubsequent activity. Also, in a divisible project any problems in onepart of the project can more easily be isolated or a part of the project caneven be cancelled without any consequences for the rest of the project.For these reasons divisibility ensures more certainty and manageabilityduring the implementation of the project (Van Gigch, 1991; Simon,1996).
Both divisibility and indivisibility can have benefits and disadvantages.A divisible project is less vulnerable to failures, because in general anyfailure can easily be isolated. On the other hand, a divisible project is proneto downsizing. If circumstances make it attractive, the owner of a projectcan opt to scrap part of the project, thereby enhancing the manageabilityof the rest. Seen from the point of view of the project owner, this can beregarded as an advantage, but supporters of the project may see it as a dis-advantage. The situation is precisely the opposite in the case of an indivis-ible project: downsizing is often impossible and failures can bring down theentire project system.
An example of an indivisible project in which all parts are required torender the project useful is a tunnel. By the time a tunnel is only half com-pleted, it cannot be used for the end envisaged in its construction, namelyto be able to cross over, by a fixed link, that which is being tunnelled under.If failures occur in the tunnel, the crossing is blocked and the rest of thetunnel cannot be used.
Management characteristics of mega-projects 27

Tight or Loose Coupling
Projects are systems consisting of components or subsystems with cou-plings (mutual links) between them. To say that a coupling is tight or looseis to refer to the intensity with which two system components are tied toone another. An extremely tight coupling between two system componentsmeans that an occurrence in one element always affects the other. This isnot so if the coupling is loose: any occurrence in an element there is iso-lated. With a tight coupling the risks can be greater because an incident ina particular element or sub-project can have a negative effect on anotherelement or sub-project. Problems with tight coupling therefore often leadto an ‘oil-slick’ mechanism or a domino effect. When a loose coupling isinvolved, a problem of this nature can more easily be isolated (Perrow,1999). A suspension bridge is an example of a project with tight couplings.A weak stay cable, for instance, can lead to problems with the road surface.
The constellation of couplings in a technical system is also important.Systems with linear coupling are the easiest to oversee. Here system ele-ments are linked in series. This has the disadvantage that if a failure occurs,generally the entire system collapses. But the system’s simple structuremeans that problematic couplings or failing systems can often be repairedrelatively easily. The reverse side of the coin is the system with complex cou-plings, with parallel connections. A failure in this type of system can oftenbe solved by using an alternative link in the system. This means that afailure does not necessarily cause the entire system to collapse, but it doesmean that an error is sometimes more complicated to correct because of themany complex links between the system’s elements. And in this type ofsystem it is more difficult for managers and even for engineers to be famil-iar with and to understand all the system’s characteristics. The differencebetween linear and complex couplings is not only found in infrastructureprojects.
This can be shown most clearly by taking the example of an electricitynetwork. When an electrical connection simply runs from A to B and theconnection is damaged at a particular point along this line, the entire con-nection fails. But it is a fairly simple matter to restore the connection.However, if the damage occurs in a complex network of electrical connec-tions, this can be compensated by the current being drawn from elsewherein the system. Then, however, it is more difficult to discover the site of theproblem. The blackout that occurred in north-eastern America on 14August 2003 is a good example of the second situation. A problem in thenetwork made it necessary for other power stations to supply more currentso that they became overloaded and a chain reaction occurred causing theelectricity supply to fail in a large part of the north-eastern USA and the
28 Management characteristics and cost–benefit analysis

Canadian province of Ontario. It took two days to restore power to mostplaces, and a further three months for the official investigating committeeto establish the cause.
Fallback Option Available or Not
A fallback option is a reserve solution offering the possibility of complet-ing a project if something goes wrong with the original option. If a fallbackoption has been provided for, a simple transfer takes place to anotheroption in the case of a failure. This can happen either because the tech-nology bears its own alternative or because provision has been made foran alternative before to the project was implemented. In the case of theSouterrain tram tunnel project in The Hague, for instance, it took two-and-a-half years for a decision to be made regarding an alternative technologyafter leakage occurred when the original technology was applied. If a priordecision had been made to keep an alternative to hand, the project wouldhave experienced far less delay after the leakage had occurred.
Monofunctionality or Multifunctionality
A multifunctional project serves a variety of functions, while a monofunc-tional project has only one. In theory no limit can be placed on multifunc-tionality (perhaps there are projects in which an endless number offunctions can be combined). Multifunctionality can be advantageous formanageability: the more functions a project has, the smaller the risk of totalfailure. Of course there are limits to this. An excessive accumulation offunctions can have an adverse effect on the manageability of the project.There will, in fact, always be at least one function that is realised in the end;the project cannot fail completely. Many railway links are monofunctional:high-speed tracks often serve only for high-speed trains. Many ICT projectsare multifunctional. Certain types of e-enforcement, such as Weigh inMotion (the automatic weighing of a freight truck via loops in the road todetect whether the truck is overloaded) are multifunctional. The ICT servesnot only to detect lawbreakers but also to measure road wear.
Incremental versus Radical Implementation
Incremental implementation implies phased transfer to the new infrastruc-ture/service. Radical implementation means that transfer is achieved in a‘jump’. Incremental implementation is often advantageous to the project’smanageability: it is possible to learn and the project can – if necessary – behalted or adjusted at an early stage in implementation. The advantage of
Management characteristics of mega-projects 29

radical implementation is that all the technological and social complexityinvolved in implementation is concentrated on a single moment. If a projectmanager is absolutely certain that this is possible and that no learning isrequired, then radical implementation is the preferred strategy. However,this will hardly ever be the case with a large-scale project, and there is astrong risk of a radical implementation turning into a big bang and givingbirth to something other than has been expected.
The Dutch C2000 project illustrates this well. C2000 is a new communi-cations system for the emergency services in the Netherlands. Given thecrucial function the new information system plays in disasters, it is almosta necessity that it should be subjected to radical implementation since allthe relevant emergency services have to be connected up to it the momentit comes into service. Add to this the system’s indivisibility (see above) andthe use of innovative technology, and it is clear that this is a difficult projectto manage. At the start the introduction of the system in the Netherlandsled to major problems (Tweede Kamer der Staten-Generaal, 2002).
In the construction of – for instance – drilled tunnels with two practicallyidentical tunnel tubes, lessons that can be applied to work on the secondtube can be learned from the drilling of the first. During construction ofthe Herrentunnel in the northern German city of Lübeck, problems ofdelay arose in the first tube largely caused by obstacles in the soil thatdamaged the drill head. An evaluation and subsequent adjustments led tothe drilling of the second tube going much more rapidly (Assenmacher,2003).
2.3 SOCIAL COMPLEXITY
The social complexity of a project also has various dimensions. These aresummed up in Table 2.2.
Limited or Major Dependence on Users
A first dimension is that of the role of the user. Is the user someone whoplays an active part in the implementation or someone who is completelyabsent? The greater the influence of the user on the completion of theproject, the smaller the chances of manageability. At the same time, thequality of the substance of a mega-project can increase if the user can feelsatisfaction at the final outcome. For many large-scale government ICTprojects this is an important variable. An important role was played by theusers in the implementation of the C2000 project already mentioned, sincethey regularly voiced strong criticism of the system or did not wish to use
30 Management characteristics and cost–benefit analysis

it as yet. The reason is easy to guess. A system of this type is closely boundup in the primary processes of the relevant organisation and thus pushesthe users into action. In the case of rail infrastructure the influence of theuser during implementation is generally more limited. Uncertainties aboutthe use to be made of rail infrastructure can put its public or privatefinancing on a shaky basis. Insufficient participation and lack of commit-ment on the part of operators and end users of rail infrastructure can havemajor undesirable consequences.
A Great Deal or Little Variety in User Preferences
As far as the preferences and aims of users are concerned, it is not onlyimportant to know the extent to which a commissioning party or projectmanager is dependent on them, but also the extent to which the users havecome to a shared assessment. This can vary from complete unanimity tostrong divisions of opinion and thus to variety. Here too C2000 can serveas an example. Various bodies that were expected to work with C2000 turnout to have different preferences. What is good for the police is not neces-sarily so for the fire service.
A Great Deal or Little Dynamics in User Preferences
As far as users are concerned, whether their relevant preferences and aimsare stable or dynamic can make a difference. During the process a changecan occur in preferences or aims – for instance, because of changes in theconditions, progress in technical developments or progress in technology.
Management characteristics of mega-projects 31
Table 2.2 Manageability and unmanageability of projects
Manageable if . . . Less well manageable if . . .
Limited dependence on user Major dependence on user preferences preferences
Uniformity between preferences Variety between preferences and aimsand aims of commissioning party/users of commissioning party/users
Stability of preferences and aims of Dynamic in preferences and aims ofcommissioning party/users commissioning party/users
Little blockage power held by Great deal of blockage power held by third parties third parties
Short transformation time Long transformation timeLimited influence of project on social Major influence of project on socialenvironment environment

When stability is extreme, the preferences and aims of all users remain fixedfor the entire duration of the project. When dynamics are extreme, the pref-erences/aims are subject to constant change, the upper limit of the dynam-ics being difficult to indicate. A project with dynamic preferences and aimson the part of users is, for instance, the Channel Tunnel. It was thought thatthe tunnel would be subject to mass use by travellers by car and train asan alternative to the cross-channel ferries, but the rise of budget airlinesensured a shift in the users’ preferences from the high-speed train and carto the cheap flight.
A Great Deal or Little Third-party Blocking Power
Various external players can exert a great deal of influence on a project,depending on their blocking power. If they have major blocking power theycan make many demands. Blocking power is related to position in a process(e.g. a local council with infrastructure of national importance on its terri-tory) or it can be forcibly acquired (e.g. citizens that penetrate a process).When there is very little blocking power, a commissioning party alone candetermine the implementation of a project, whereas in the presence of agreat deal of blocking power everything has to be laid before third parties.Blocking power can be the result of a wide variety of factors, such as formalpositions (landowners), political power, formal authorisations (local coun-cils) and expertise.
Long or Short Transformation Time
A project’s transformation time is the length of the period required for imple-mentation. A long transformation time increases uncertainty since new tech-nological and social developments can occur in the interim. An examplefamiliar in the Netherlands is the Oosterschelde Zeewering (Eastern ScheldtStorm Surge Barrier). The long period required for the construction made itpossible for social players to change the design during implementation froma closed dam (which would have changed the Oosterschelde from a saltwa-ter to a freshwater reservoir) into a semi-open dam (better able to maintainthe ecosystem). This dynamic also often occurs in large-scale military pro-jects: the length of time required for completion enables changed technolog-ical and social conditions to have a major effect on the project.
A Great Deal or Little Influence on the Social Environment
The influence a project has on its social environment can contribute touncertainty. The greater the impact on the existing environment, the greater
32 Management characteristics and cost–benefit analysis

the chance that players are activated and attempt to exert influence on theproject’s implementation. The classic example here is the extensive spatialchanges in inner-city areas (underground rail lines, tram tunnels) or thethreatened damage to nature and landscape (the Green Hart tunnel in theDutch section of the Paris to Amsterdam high-speed rail link), which is notwithout an effect in the social environment.
2.4 MANAGEMENT OF IMPLEMENTATION
If a project’s implementation can be well managed, a simple project-basedapproach to the job is often sufficient. In simple terms: the project can beclearly and unambiguously described, has a clear planning in a number ofphases, has a transparent budget and has been organised as efficiently aspossible. But if many technical and social uncertainties appear, an approachof this kind is not only insufficient but also misleading. It suggests manage-ment and manageability that, in fact, cannot be realised. There are two con-crete points that need attention: interaction and redundancy.
Interaction: is there any Process Design and Process Management Present?
If there are many uncertainties due to technical and social complexity, theways to manage are:
● to involve actors:– those who create social complexity, e.g. stakeholders who try to
block the project;– those who have expertise to solve technical uncertainty (Miller
and Lessard, 2000);● to shift the attention of managers from a well-defined project to a
process of interaction.
This requires a process design, one that makes clear who will be involved andwhen. Excluding players who create complexity may at times seem attrac-tive (it avoids a great deal of ‘messing about’, discussion etc.), but is a veryrisky business in the situations referred to. The actual facilitation of theinteraction we call process management. Process design and process man-agement can lead to players being activated, including players who opposethe project. If they are not activated, there is a risk that they will emerge laterin the process and still manage to use their blockage power. The social com-plexity (many players, many different interests) requires that the playersclearly recognise how they can play a part in the implementation. If this is
Management characteristics of mega-projects 33

not clear, many players will simply penetrate the implementation process ata time convenient to themselves. Result: increasing chaos and furtherunmanageability of the process.
If the decision-maker faces many technical uncertainties, a solution canbe found in process management. In fact, innovation can come about bynot having the project implemented in a closed circuit (by a limited groupof implementers), but by admitting third parties with their expertise atcrucial moments.
A process approach is the opposite of two other styles of decision-making: command-and-control and project management. The processapproach focuses on organisation and management of a project, rather thanits substance. This approach takes the way managers and engineers act andorganises the project and its technology as the explaining factor for the per-formance of a project. Successful project implementation requires a well-organised process in which all actors with important powers (productionpower, blocking power) and competences cooperate from an equal position,rather than just being hired without responsibilities on the whole project.
Process versus command-and-controlA process approach is the opposite of command-and-control (De Bruijnand Ten Heuvelhof, 2000). As soon as a government (body) has to functionwithin a network of interdependencies (and when is this not the case?), itcannot simply rely on hierarchical management mechanisms. Indeed, sucha body depends on other parties, whose support is far from being guaran-teed. Any government (body) recognising this fact will not take unilateraldecisions but will come to a conclusion in a process of discussion and nego-tiation with other parties. Such a process does justice to the mutual depen-dencies in a network.
Process versus projectA process approach can also be opposed to a project approach (De Bruijnet al., 2002). The assumption in a project approach is that problems andsolutions are (within certain limits) reasonably stable. This makes it possi-ble to use project-management techniques: a clearly defined aim, a timepath, clear conditions and a previously defined end product. Naturally, thistype of approach works only in a static world. If an activity is dynamicrather than static, a project approach is not possible and thus a processapproach is desirable. These dynamics can have both an external and aninternal cause (Morris and Hough, 1987).
● External dynamics An activity starts out as a project but developsinto a process because external parties, all of whom contribute their
34 Management characteristics and cost–benefit analysis

own definitions of and solutions to the problem, interfere with theproject. This is a familiar pattern in many infrastructural projects.What starts as a project (e.g. laying down part of a rail track) endsup as a process in which all manner of parties become involved withthe rail track, a process that has its own dynamic. After a time thereis a chance that the parties are no longer discussing the rail track buttotally different subjects.
● Internal dynamics An activity starts out as a project but developsinto a process because during the project its owner learns that theproblem is wider or more complex than originally thought. A neatillustration of this – once given to us by a process manager at theDHV engineering consultancy – is that of a house owner who decidesone fine morning to hang a painting in his house. He discovers thatthe wall is discoloured and repaints the entire wall – which has reper-cussions for the rest of the interior and finally involves a full-scalerenovation of the house. Subsequently he discovers that this desirefor renewal is connected to the phase of life he is in and he ends upconsulting a psychologist. What starts as a simple project ends as acomplex process involving many parties (other people in the house,contractor, neighbours, psychologist).
Much decision-making on infrastructure and transportation is developedand funded unilaterally by government institutions. An owner of, say, atransportation problem makes an exact formulation of its problem (e.g.traffic jams), a goal is set (e.g. reduction of traffic jams by 20 per cent),information is gathered (what are the possibilities for a solution, what aretheir economic benefits and environmental impact etc.) and a decision istaken (e.g. expansion of highway lanes) that subsequently has to beimplemented and evaluated. The decision is imposed unilaterally onother players, some of whom have an interest in the project while othersdo not, and sometimes they possess blocking power. The gridlock is atypical problem for commuters and government institutions but is notgratuitously recognised by other parties such as environmentalists orpeople who live nearby who experience nuisance from fast-driving cars ifthe gridlock is dissolved by road expansion. It is also imaginable thatwhile other parties may recognise the problem, they give it a differentpriority. Each step in the project-based approach, therefore, can be dis-puted. Instead of unilaterally defining and fixing a problem, a govern-ment body has to accept that different parties define the realities of thesituation differently and (can) also have good arguments in theirfavour. Parties should have to go through a process of negotiation inwhich they make efforts to arrive at a package of solutions that does
Management characteristics of mega-projects 35

justice to the various definitions of the problem advanced by the differentparties.
Clearly an approach of this kind has little chance of success. The BayArea model of decision-making is a famous example of a more process-oriented approach. The model was developed in the San Francisco Bay Area(hence the name). The area was characterised by a disparate group of publicauthorities that needed each other for the realisation of their goals. Ratherthan applying the common substance-oriented, hierarchical approach, theMetropolitan Transportation Commission developed a model in which 17relevant regional actors participated, focusing on values and arguments,which matches better the perceptions of the actors (Chisholm, 1989).
Redundancy: has the Project Sufficient Organisational Redundancy?
A redundant organisation is one in which some overlap has been deliber-ately created. There is no question of clearly separate tasks between – forexample – designer or constructor, or between constructors among them-selves. This may seem inefficient: the designer should design and the con-structor should construct. The constructor of an ICT system for a fighterplane should not interfere with the company building the engines.
However, the idea is that a separation of tasks of this nature only workswhen the project is completely manageable (Lerner, 1986; Low et al., 2000).If major technical uncertainties arise, strict separation leads to ‘over-the-wall-engineering’ (Payne et al., 1996). The designer delivers his design to theconstructors, who then have to see whether the design can be realised. Theconstructors can then become involved in a rat race: the one with his partof the project completed first determines the conditions within which theothers have to work. In consequence of this and similar mechanisms, thissort of project becomes increasingly unmanageable. Major problems oftenarise and there are strong incentives for the engineers involved to blame oneanother for their problems. Redundancy implies that – for instance – theconstructors are involved in the design of the project or that they are mutu-ally involved with one another’s projects, and that clear prior agreementsare arrived at. Redundancy creates the opportunity for mutual checks andstimulates the implementers involved to assume shared responsibility for anappropriate outcome.
A step further is when explicit counter-forces are organised within aproject – for instance by subjecting crucial technical options to counter-expertise. Redundancy and checks and balances can also be beneficialfor the innovative nature of a project. It is precisely in the confronta-tion between designers and constructors, between constructors amongthemselves or between constructors and peers (providers of counter-
36 Management characteristics and cost–benefit analysis
expertise) that innovations can come about. Or, to put it another way: if,with the available expertise, no innovation comes about, then innovation isprobably not possible.
In the case of the Central Artery/Tunnel project in Boston, thecommissioning party (Massachusetts Highway Department, laterMassachusetts Turnpike Authority) lacked the technical knowledge requiredfor a project of such complexity. For this reason the commissioning party gotas close as possible to the contractor. The Federal Highway Authority, whichwas financing the project, also turned out (according to a report by theInspector-General of Massachusetts) to have been very close to the otherorganisations, so that the work of control was jeopardised (Cerasoli, 2001).In the end this led to a situation where nobody could offer any counterweightto the contractor on the basis of (technical) expertise. This meant that notonly was there no redundancy in difficult technical issues, but the costs couldalso rise in an uncontrolled manner (Leijten, 2004).
In the construction of a subway tunnel in the German city of Dortmundwe see exactly the opposite. In this project the commissioning party(Stadtbahnbauamt Dortmund) not only had a great deal of in-house exper-tise itself, but it also had a reference design made by a specialist engineer-ing consultancy, redundant to its own designs. During implementation itallowed itself to be assisted by the same consultancy and checked the con-tractor’s work on a permanent basis. Up to the present the technical uncer-tainties have not led to any problems in this project.
2.5 CONCLUSIONS
Modern mega-projects are commonly plagued by technical and social com-plexity. Preferred solutions do not always result in the most manageableprojects. Sometimes projects even demand a less favourable design, intro-duction or implementation. Both possibilities may result in fierce uncer-tainty. In addition to that, decision-making, design and implementationregularly take place in a complex social environment of actors helpful oreven needed for successful implementation, but also of actors with block-ing power. This requires a trade-off determining whether a project is stillmanageable with traditional project management. A process-orientedapproach does more justice to the complexity and the uncertainties. Theinvolvement of a network of relevant parties may be better at providing theinsights required to make good trade-offs on technical and social issuesthan a hierarchically acting commissioner or manager.
Management characteristics of mega-projects 37
NOTES
1. Boston Globe article: ‘Big Dig began with a critical decision; Novel technique may bebehind troubles’ (19 December 2004).
2. Author’s (ML) interview with R. Weinberg, director of the Friends of the Post OfficeSquare Trust, 30 January 2004.
REFERENCES
Altshuler, A. and D. Luberoff (2003), Mega-projects: The Changing Politics ofUrban Public Investment, Washington, DC: Brookings Institution Press.
Ammann, O.H., T. Von Karman and G.B. Woodruff (1941), The Failure of theTacoma Narrows Bridge, Report to the Federal Works Agency.
Assenmacher, S. (2003), ‘The Herren Tunnel’s Learning Curve’, in T and TInternational, 35 (11): 20–22.
Cerasoli, R. (2001), A History of Central Artery/Tunnel Project Finances 1994–2001:Report to the Treasurer of the Commonwealth, Boston, MA: Commonwealth ofMassachusetts.
Chisholm, D. (1989), Coordination without Hierarchy: Informal Structures inMultiorganizational Systems, Berkeley, CA: University of California Press.
Cleland, D.I. and W.R. King (1983), Systems Analysis and Project Management, 3rdedn, McGraw-Hill Management Series, Singapore: McGraw-Hill.
De Bruijn, J.A. and E.F. ten Heuvelhof (2000), Networks and Decision Making,Utrecht: Lemma.
De Bruijn, J.A., E.F. ten Heuvelhof and R.J. in ‘t Veld (2002), Process Management.Why project management fails in complex decision making processes, Boston, MA:Kluwer Academic Publishers.
Gigch, J.P. van (1991), System Design Modeling and Metamodeling, New York:Plenum Press.
Golser, J. (1976), New Austrian Tunneling Method (NATM), TheoreticalBackground & Practical Experiences, 2nd Shotcrete Conference, Easton, MD.
Hall, P. (1980), Great Planning Disasters, Berkeley, CA: California University Press.Leijten, M. (2004), ‘Big Dig: Een halve eeuw Central Artery in Boston’, in H. de
Bruijn, G.R. Teisman, J. Edelenbos and W. Veeneman, Meervoudig ruimtegebruiken het management van meerstemmige processen, Utrecht: Lemma.
Lerner, A.W. (1986), ‘There is more than one way to be redundant’, Administrationand Society, 18 (3): 334–59.
Low, B., E. Ostrom, C. Simon and J. Wilson (2000), Redundancy and Diversity inGoverning and Managing Common-pool Resources, Bloomington, IN: IASCP.
Miller, R. and D. Lessard (2000), The Strategic Management of Large EngineeringProjects: Shaping Institutions, Risks and Governance, with S. Floricel and theIMEC Research Group, Cambridge, MA: MIT Press.
Morris, P.W.G. and G.H. Hough (1987), The Anatomy of Major Projects: A Studyof the Reality of Project Management, Chichester, UK: John Wiley & Sons.
Payne, A.C., J.V. Chelsom and L.R.P. Reavill (1996), Management for Engineers,Chichester, UK: John Wiley & Sons.
Perrow, C. (1999), Normal accidents: Living with High-Risk Technologies,Princeton, NJ: Princeton University Press.
38 Management characteristics and cost–benefit analysis

Simon, H.A. (1996), The Sciences of the Artificial, 3rd edn, Cambridge, MA: MITPress.
Tweede Kamer der Staten-Generaal (2002), Communicatienetwerk C2000 enGeïntegreerd Meldkamersysteem (Communication Network C2000 and IntegratedEmergency Room System), Kamerstuk 28970, no. 2, vergaderjaar 2002–2003, TheHague (Sdu) (in Dutch).
Management characteristics of mega-projects 39

3. Ex-ante evaluation ofmega-projects: methodologicalissues and cost–benefit analysis1
Bert van Wee and Lóránt A. Tavasszy
3.1 INTRODUCTION
Mega-projects play a major role in most Western and non-Western coun-tries, in several respects. First, they are heavily under debate at the politicallevel, the assumed economic impacts and important budget implicationsbeing the major issues. Such projects often cost several billions of euros ordollars. Second, there is an important scientific debate about these projects,mainly because of the huge cost escalations (Flyvbjerg et al., 2003; Odeck,2004) but also because of the uncertainty of the wider economic effects (inaddition to direct user benefits). Because of the important role of mega-projects a sound ex-ante evaluation of a possible new project is crucial forthe quality of decision-making. In most Western countries cost–benefitAnalysis (CBA) is the method used for ex-ante evaluations of transportinfrastructure projects (Hayashi and Morisugi, 2000). In literature the dis-cussion on the CBA of infrastructure projects focuses on methodologicalissues, as well as on more principal items. In recent years the attention paidto non-methodological issues has gained more attention, including issuesrelated to the position of CBA in decision-making, the complex multi-actorcontext of mega-projects and governance issues. The purpose of thischapter is to discuss the current state of the art with respect to CBA as wellas to discuss possible improvements with respect to costs, benefits and mod-elling. However, we do not discuss wider economic effects because these areextensively discussed in Chapter 4.
Section 3.2 discusses the state of the art of CBA for transport infra-structure projects. Sections 3.3, 3.4, 3.5 and 3.6 deal with possible improve-ments in CBA methodology on costs, benefits, discount rates andmodelling. Section 3.7 presents the main conclusions.
40

3.2 CBA FOR TRANSPORT INFRASTRUCTUREPROJECTS: STATE OF THE ART
CBA: an Overview
Basically a CBA is an overview of all the pros (benefits) and cons (costs) ofa project. These costs and benefits are as far as possible quantified andexpressed in monetary terms. Benefits are based on consumer preferences.2
Costs and benefits occur in different years within the time horizon of theCBA. To deal with this, they are presented as so-called net present values,implying that taking into account interest and inflation it is better to have1 euro or dollar nowadays than in, for example, 2020. The discount rate isused to express this valuation. Final results are often presented in sum-marising tables. The main indicators that are presented are the differencebetween costs and benefits, the return on investment, and the cost–benefitratio. Almost every handbook on transport economics includes CBA intransport (see Button, 1993).
There are several explanations for the popularity of CBA in the ex-anteevaluation of infrastructure projects and its role in decision-making.First, most of the costs and benefits are relatively well known, at least the-oretically. Investment, maintenance and operation costs can be derivedfrom data from projects constructed in the past, or from tenders. Themost important benefits are travel time savings, for both travellers andfreight transport. Models are generally used to estimate the demand ofpassengers or volume of goods transport that will benefit from a newproject. In addition, in the case of passengers, the travel time savings pertrip can easily be estimated by comparing travel times with and withoutthe proposed infrastructure project using changes in network character-istics. Next, the so-called value of time (VOT) is used to express shortertravel times in monetary terms. VOT is higher for business travel andgoods transport than for commuting, and leisure travel has the lowestvalue of time. VOT differs between modes, income classes and some othercharacteristics of travel and travellers (e.g. Gunn, 2001). In the past muchmore research has been carried out on the VOT for passengers than forgoods transport, especially for rail, making VOT estimates for rail goodstransport relatively uncertain. There is far more debate about the indirecteffects (effects additional to the direct effects due to a reduction in gener-alised transport costs; see Chapter 4 by Vickerman) and environmentaleffects. The second reason for the popularity of CBA is its often-assumed‘neutral’ characteristic compared to its main competitor: multi-criteriaanalysis (MCA). In MCA effects are presented and weighed usingweights per effect. Setting the weights is not at all value-free. It is therefore
Ex-ante evaluation of mega-projects 41
much easier to manipulate the final outcomes of an MCA compared toa CBA. However, CBA is not completely value-free either, for examplebecause of the use of the utilitarian concept, the assumption that pricetags should be based on consumer preferences, and because severalmethodologies exist to obtain these price tags, the choice often having amajor impact on the outcomes. In addition, the models to estimate thetransport effects can be manipulated (which of course is also true forMCA). Nevertheless, there is a broad consensus that CBA is much morevalue-free than MCA.
Travel time savings, often the most important benefits of infrastructureprojects, are not fully expressed in GDP. Travel time savings for businesstrips and goods transport lead to higher productivity and lower costs andhave an impact on GDP, but if a commuter can leave home later becausecommuting times are reduced, or because it takes less time to travel to a rel-ative, GDP is not affected. In CBA it is common to have a broad approachto welfare, implying that all benefits for consumers are included, even ifthey are not expressed in GDP.
Next to travel time savings, additional travel (induced demand) is animportant category in the benefits of transport infrastructure projects;these benefits are generally estimated using the so-called rule of half. Thisrule can be explained using an example. Let us assume a rail project reducesthe travel time between cities A and B, for example, because a short cut ismade. It is also assumed that person X living in city A commutes to city Bby train, both with and without the reduced travel time. It is assumed thatall other variables, such as monetary travel costs, safety etc., are notinfluenced by the project. For this person the benefits of the project for eachtrip consist of the travel time saved multiplied by his (marginal) value oftime. Let us now assume that his neighbour only starts travelling to city Bonce the new line is constructed. We do not know at which level of traveltime reduction he might have made the decision to travel. It might be thateven a very small reduction in travel time would have induced the change,but it might also have only occurred if almost the full reduction in traveltime occurred. Assuming many persons, the average break-even reductionin travel time is half of the actual reduction in travel time, assuming a lineardemand function. For the new travellers the benefits are therefore half ofthe reduction in travel time multiplied by the number of trips and the VOTof these persons. As stated before, in transport economics this phenome-non is referred to as the rule of half.
In addition, extra benefits may occur due to changes in the timetable (seealso Section 3.4).
Figure 3.1 visualises demand with (Q1, GTC1 – GTC: generalised trans-port costs, including at least time and money) and without (Q0, GTC0) a
42 Management characteristics and cost–benefit analysis

new infrastructure project. A refers to the benefits (increase in consumer’ssurplus) of those people who travel both with and without the new line, Bto the benefits of the extra demand. The surface of B can easily be calcu-lated as (Q2�Q1 * T2�T1) * 1⁄2, the factor 1⁄2 referring to the ‘rule of half ’as presented above.
Other benefits of rail and tolled road projects might be the gains of thecompany operating the service or road section. Also relevant in ex-anteevaluations are environmental and safety impacts. Changes in safety andthe environment might be both positive and negative, implying that safetyand environmental changes can be listed under both the costs and thebenefits.
For CBA (as well as for other evaluation methods) the spatial and tem-poral system boundaries are of crucial importance. If the spatial bound-aries as used are too tight, relevant effects might occur outside the areaunder consideration. All non-marginal effects at the network level shouldbe included. Temporal boundaries are relevant, as it is only after theopening of a new infrastructure project that the benefits can be realised.Also there may be important disbenefits from the building activities duringthe construction of the project. Due to the generally used discount rates,longer construction periods can significantly reduce the benefits of aproject. It is therefore important that a relatively long time horizon isincluded in a CBA. This should be at least two or three decades. Benefitsin the very long term hardly affect the net present value due to the gener-ally used discount rates.
Ex-ante evaluation of mega-projects 43
Figure 3.1 Increase in consumer surplus due to a decrease in generalisedtransport costs
A B
Q0 Q1
GTC0
GTC1

CBA and Modelling
The main output of a CBA is an overview of economic, ecological andsocial impacts, as far as possible in quantitative and monetary terms. Thecategorisation of these three impact types is generally used for all kinds ofdevelopments and policies, partly as a result of the use of it by the WorldBank. The most important impact categories of transport projects arerelated to accessibility, safety and the environment. Accessibility has botheconomic as well as social impacts. The same is true for safety. Therefore inCBAs for transport projects the World Bank categorisation is not oftenused explicitly.
For the evaluation of transport infrastructure projects the main questionis: which changes are due to the project? Then the question arises: com-pared to what? The comparison should certainly not relate to the currentsituation, because some changes will occur anyway. Nevertheless, for com-munication reasons it can be interesting to compare results with the currentsituation. The comparison should normally also not relate to the ‘do-nothing’ option: several changes will occur anyway. For example, if the dis-cussion is about a new infrastructure project in an area where infrastructurewill be extended or changed anyway, these changes should be included inthe comparison. In economic literature it is suggested that the best alter-native for comparison is the best alternative for the projects or alternativesunder consideration.
The overview of CBA-relevant impacts is preferably based on state-of-the-art methods, modelling being the first priority in most cases. In mostcases two categories of models are used, the first one being transportmodels and the second being impact models. Here we have a broad scopeof transport models: they include both traditional transport models as wellas models for vehicle ownership and characteristics, distribution of trafficover infrastructure classes, etc.
Transport models are used to provide outputs for CBAs. Outputs include:first, the number of vehicles, wagons, vessels etc. as well as their character-istics (age, fuel type, emission class etc.). These numbers and characteristicsare important in modelling transport and traffic flows, as well as their envi-ronmental impact; second, outputs include the origins, destinations and dis-tances over which vehicles travel, in order to calculate route choice, toestimate the use of specific segments of the networks to related environ-mental impacts, and partly also social and economic impacts; third, outputsinclude a classification of road types. This classification is importantbecause substantial differences between road types exist with respect toenergy use per kilometre, noise emissions and safety impacts. A fourth cat-egory of outputs is travel times for both passengers and freight transport.
44 Management characteristics and cost–benefit analysis

As stated before, changes in travel times are a major benefit category ofinfrastructure improvements. Characteristics of passengers and freight areimportant; for instance, the value of time for business trips on average ishigher than for leisure trips, and the added value of transport is often higherin the case of high-value goods compared to low-value goods.
These outputs depend in different ways on the impacts that the infra-structure changes will have. These impacts include: residential choices andlocation choices of firms. These location choices have an impact on modechoice and travel distances.
● Destination choices: the lower the generalised transport costs (time,money, trouble), the easier it becomes to reach destinations at agreater distance.
● Trip frequencies: the choice of vehicle types may be influenced byinfrastructure changes; e.g. the more important the position ofmotorways in the road network is, the more attractive it becomes toown a big, comfortable, fast car.
● Driving behaviour, which is relevant for safety impacts.● Emissions and related concentrations of pollutants.● Noise.● Route choice and freight routing may be influenced by the quality
of infrastructure networks, being relevant for travel times, travelcosts, and impacts on the environment and safety and congestionlevels.
These changes interact in a dynamic way and there are many different typesof users that will all react differently as individuals and in interaction witheach other. Transport models are needed to combine one or more of theseresponses.
The output of transport models is relevant, first, because it providesresults that are directly included in a CBA, such as travel time changes.Second, this output is needed for the calculation of impacts on societyand the environment caused by the change in the transport system. Inother words: transport models provide input for impact models, such asnoise, safety and pollution models. Finally, the monetary expression ofCBA-relevant output is often obtained using external data, such as thevalue of time for discrete modes, motives, income classes and categoriesof goods.
For economic impacts a distinction is often made between direct andindirect effects. The effects that are incurred by the users of the transportsystem are called direct effects. As these users are part of chains of con-sumption and production, effects propagate widely into the economy.
Ex-ante evaluation of mega-projects 45

Through the course of this propagation process, new, i.e. additional,welfare effects can be generated, if prices do not equal marginal social costs.This can happen if markets are subsidised, if there are externalities, benefitsof scale, etc. Mainstream economics tells us that if prices are equal to mar-ginal social costs, indirect effects will not occur. In that case changes in, forexample, economic output and land use are only passed-through directeffects. Then the monetary effects should not be added to the direct effects,to avoid double counting. In practice, however, prices are never equal tomarginal social costs. Therefore indirect effects may occur. We reflect onindirect effects in more detail in the next section and refer also to Chapter4. Here, the focus is on modelling. In our opinion, in addition to conven-tional models, for CBAs of infrastructure projects, models are needed toprovide outputs with respect to both the passed-through direct effects aswell as indirect effects.
A problem arises because traditional transport models often do notinclude some of these passed-through effects, nor do they describe indirecteffects. They do however sometimes include changes in origins, destinationsand trip frequencies, within a given land-use context. Land-use and trans-port interaction (LUTI) models have a broader scope because they doinclude land-use implications. However, these do not give output withrespect to the related utility changes, which is a drawback in the case oftheir use in a CBA context. Other, non land-use-related impacts, e.g. withrespect to job productivity, are not included in traditional land-use models,nor in LUTI models. These models are therefore not sufficiently wellequipped to calculate indirect effects. For these impacts, models based onnew economic geography, also called spatial computable general equilib-rium (SCGE), models, are helpful and are sometimes used in a CBAcontext. Examples include the Dutch RAEM model and the CGEuropemodel (see Gunn, 2004 for a review). These models are explicitly designedto deal with indirect effects, expressed in monetary units, so that effects canbe easily included in a CBA. A more detailed comparison between LUTIand SCGE models can be found in Oosterhaven et al. (2001). As thesemodels require regional economic data to estimate indirect effects of trans-port policies, their use requires additional investments in analytical work.Therefore, their application to address wider economic effects in additionto the conventional transport modelling approach needs to be carefullyconsidered.
From this section it appears that the main costs and benefits of possiblenew infrastructure projects are relatively easy to estimate, making CBA anattractive tool for the ex-ante evaluation of such projects. But is this true?We think many challenges to improving current practice are available andpresent some of these in the next sections.
46 Management characteristics and cost–benefit analysis

3.3 METHODOLOGICAL ISSUES ON COSTS
Research Methods for Construction Cost Estimations
On the basis of an impressive database containing 258 projects, Flyvbjerget al. (2003) concluded that cost overruns are very common for transportinfrastructure projects, the average for roads being 20 per cent and for rail45 per cent. Causes are of a methodological nature as well as the result ofstrategic behaviour by actors that benefit from a positive decision to con-struct the project. In the first case improvements in the methods of cost esti-mations can strengthen the quality of these estimations. Improvements canbe obtained by choosing another methodology or – even better – by apply-ing different types of methodologies. These types might be engineeringmethods, econometric methods and case studies comparing actual costs inpractice. In addition, within each of these methods improvements can bemade. There are several suggestions for research. First, an analysis or meta-analysis can be carried out once a database is available including the realcosts of projects and many possible project characteristics, linking thesecharacteristics to the real costs. This is what Flyvbjerg et al. (2003) did.Extending the database both with respect to the number of projects as wellas project characteristics allowed the researchers to increase their insightsinto the importance of project characteristics. Note that Flyvbjerg et al.found several relationships to be not statistically significant at the 0.95 level,possibly due to the low number of cases. Second, research can focus on theimpact of the market situation on tenders. For example, it is generallyrecognised that a tight market results in higher prices in the tenders, a phe-nomenon that makes sense according to conventional economics. Relevantvariables might be the number of competitors that could be included as wellas those that were actually included in the tender procedure, the marketitself (are there enough projects or is it difficult for construction companiesto acquire projects?), and market prices for materials. The outcomes couldbe used for the simultaneous planning of the construction of more thanone major infrastructure project at a regional or even national level. Insearch of an ‘optimum’, one could compare lower tender prices with dis-counted costs for construction and travellers’ benefits. For a CBA anational perspective is generally used, implying that higher costs for thegovernment or private parties to construct a project lead to additionalprofits for construction companies. These ‘additional costs’ are only atransfer caused by market power, and are not additional costs for theeconomy as a whole. On the other hand, it is also possible that marketpower encourages construction companies to work less efficiently. Thiseffect would indeed be a loss to society.
Ex-ante evaluation of mega-projects 47

Costs Estimates in CBA and Strategic Behaviour
Apart from research improvements, a major challenge relates to the reduc-tion of strategic behaviour. Strategic behaviour is found to be a majorcause of the underestimation of the costs and the overestimation of thebenefits of possible new infrastructure projects, a phenomenon that iseven more important for rail projects than for roads (see Trujillo et al.,2002; Flyvbjerg et al., 2005; Wachs, 1989; 1990; Bruzelius et al., 2002).Possibilities for reducing strategic behaviour, as found in the literature,include the establishment of an independent committee evaluating theforecasts, including an uncertainty analysis for all forecasts, more trans-parency in documentation with respect to costs and benefits, the intro-duction of ‘better’ institutional arrangements (e.g. which institutions oractors have which responsibilities, how to avoid manipulation or strategicbehaviour by some of the actors, what should be done when manipulationdoes occur and by whom), and finally the application of the method of‘reference class forecasting’ (comparing the project under discussion withother comparable projects constructed in the recent past, using a databasewith data on such projects), making use of an ‘outside view’ and data fromother, comparable projects. Strategic behaviour is relevant for ‘costs’ aswell as for ‘benefits’. To avoid overlap we include this subject only under‘costs’.
Optimism Bias
Because cost overruns are so common, estimates can be corrected for opti-mism. Unfortunately not only the average cost escalation is high but so isthe standard deviation (Flyvbjerg et al., 2003), which implies that it is notappropriate to use a simple methodology; for example, applying a generalcorrection factor for the difference between the estimated costs and actualcosts is too simple. Flyvbjerg and COWI (2004) developed a method to dealwith optimism for the UK. This method includes the use of data from otherprojects and distinguishes between project type, such as several types of rail(metro, light rail, conventional rail, high-speed rail). Implementing suchmethods would really improve the quality of CBA. An average cost escala-tion of 20–50 per cent has a major impact on the quality of CBA and itsusefulness in decision-making. To avoid the methodological problem ofecological fallacy (general conclusions are not necessarily applicable tospecific cases) it is preferable to include the country-specific situation in themethod.
48 Management characteristics and cost–benefit analysis
Construction Period
CBAs in general take into account the fact that the construction periodcovers several years, leading to costs preceding benefits. As already men-tioned, using discount rates compensates for these time aspects. A longerconstruction period results in lower (discounted) benefits but also reducesthe discounted costs, because part of the costs is spent later. However, wehave hardly seen any CBA including the extra costs in the constructionperiod related to the inconvenience for other travellers, such as adaptationsto the timetables (i.e. fewer trains), speed reductions and route changes forroads. These costs should be included in CBA as well.
Changes in Project Specification
The specification of projects at the time of decision-making often differsfrom the final project. Changes might occur due to cost escalations, reduc-ing the money available at later stages and leading to adaptations thatreduce costs (less money for the reduction of environmental impacts,simpler layout). But project adaptations might also result from oppositionat a later stage than at the time of decision-making. For example, in the caseof the Dutch Betuwe Line, a dedicated rail freight line from RotterdamHarbour to the German Ruhr area, many adaptations were made as a resultof local and regional opposition, leading to additional tunnels, noise-reducing measures and other adaptations, making the project much moreexpensive than assumed at the time of political decision-making. Not onlyare these adaptations relevant for the cost estimations, but also for the esti-mations of impacts, such as environmental or safety impacts.
Life-cycle Costs and Implications for Project Alternatives
Project alternatives are often not compared on a life-cycle basis. A life-cycleapproach includes the whole life cycle of a product or project. Focusing oninfrastructure, it not only includes the first decades of its use (the periodoften included in CBAs), but the whole period of use, all maintenance andrepair and sometimes modifications needed, and even the stage after its useperiod, e.g. the removal of the infrastructure.3 A life-cycle approach forinfrastructure projects might lead to other conclusions with respect to thebest project specifications than only including the first decades of its use.Sometimes a trade-off exists between construction costs on the one handand the total life span, as well as costs for maintenance and repairs on theother hand. Lower construction costs might result in higher costs for main-tenance and replacement and a shorter life span of the infrastructure
Ex-ante evaluation of mega-projects 49

(see Zoeteman, 2004 for the relevance for rail projects). Replacement costs(or in some cases even major maintenance costs) might be necessary in ayear after the time horizon of a CBA, as a result of which they are notincluded in the CBA. CBA might explicitly put project alternatives on theagenda that result in the lowest life-cycle costs. The construction costs arenot necessarily paid by the same actor as the costs for replacement or main-tenance. Therefore adding alternatives based on life-cycle perspectives isnot only a technocratic issue but may have an impact on the costs andbenefits for the actors involved.
Uncertainty in the Costs of New Technology
One of the aspects that Flyvbjerg et al. (2003) pay attention to is theimportance of technology: new technologies, such as maglev, have higheruncertainties with respect to costs, the continuous increase in estimatedcosts of maglev in Germany in the 1990s being an illustration of this.This is not a plea never to propose unconventional plans, but a plea toinclude uncertainty with respect to new technologies in cost forecastsfor CBA.
3.4 METHODOLOGICAL ISSUES ON BENEFITS
In this section we present an overview of challenges related to benefits. Theimportance of strategic behaviour for benefits has already been describedin Section 3.3.
Demand Forecasting: the Link with Land Use
Transport and land use interact: changes in travel times and costs (e.g. dueto new infrastructure projects, changed prices or subsidies) for distin-guished modes may affect land use, and land-use changes may affect travelbehaviour (Wegener and Fürst, 1999). Many models as used for CBA donot include this two-way interaction. If possible, using a land-use andtransport interaction (LUTI) model would allow the researchers to indicatethe land-use changes resulting from transport changes, and then the relatedeconomic, social and environmental impacts. We realise that a reliableLUTI model is often not available. If this is the case, an alternative mightbe to use expert judgement to estimate the land-use changes due to thetransport changes. And even if a LUTI model is available, the questionis whether the benefits of applying it exceed the costs. We note thatLUTI models do not provide the necessary outputs for CBA in terms of
50 Management characteristics and cost–benefit analysis

additional indirect effects. We treat this subject in more detail in Section 3.6on modelling.
Other Land-use Issues
Apart from the importance of land-use and transport interactions fordemand forecasting, the link between land use and transport offers morechallenges, some of which are discussed below.
First, it is important to realise that better transport reduces transportcosts, which influences the advantages of agglomeration. Agglomerationeffects refer to advantages of economic density, which may or may not yieldadditional benefits in CBA. The consequences of agglomeration are wellknown, but its causes, its specific nature and quantitative relations are not.Finding out more about the causes is an important challenge for CBA, andeven more for spatial economics.
Second, intensive use of land reduces urban sprawl and makes it possi-ble to preserve open space. In CBA the valuation of open space is still achallenge, because not only the agricultural value of land is important, butalso its recreational use and external effects.
The third issue relates to rail. Rail is a ‘land-use-efficient’ transportmode, compared to road transport, not only because of the efficient use ofinfrastructure space, but also because of a lower claim for car parking.Measuring and valuing these benefits is an important issue.
Importance of Indirect Effects
Indirect effects occur if transport prices are not equal to the marginal socialcosts of transport. As transport prices are seldom equal to marginal socialcosts, indirect effects mostly occur; the question is, however, how high theseindirect effects are. Indirect effects can be both positive and negative. Whenpositive, earlier empirical research has found indirect effects up to about 38per cent (Elhorst et al., 2001). Theoretical research seems to indicatethat these benefits can be lower (Venables and Gasiorek, 1998) or higher(FHWA, 2001). As their estimation requires a substantial extra analysiseffort, these impacts are seldom taken into account. However, we argue thattheir consideration can be vital for a good CBA because they can provideimportant information to decision-makers on the socioeconomic impacts,in terms of both overall changes and the redistribution of welfare.Assumed indirect effects often play an important role in the policy discus-sion on large infrastructure projects. Therefore even if they are absent ornegligible it is very valuable to present them explicitly. Indirect effects arediscussed in more detail in Chapter 4.
Ex-ante evaluation of mega-projects 51

Value of Time
The value of time is a well-known subject of debate, partly because of thebig impact it has on the benefits of infrastructure projects. Recent publica-tions include Gunn (2001) and Wardman (2001), who focus on publictransport. Tavasszy and Bruzelius (2005) provide an international overviewof VOT studies for freight transport. Important challenges include theimpact of ICT on the VOT, especially for rail, and the impact of the journeylength in combination with travel purpose. Challenges for freight includetaking into account the dependence between time and reliability values andthe effect of changes in logistics variables on time valuation.
Value of Reliability and Variations in Travel Times
In recent years the reliability of travel times has received more attentionboth in research and in policy-making. Research shows that the negativevalue of unreliability is roughly in the order of magnitude or at least a sub-stantial percentage of the negative value of travel-time losses due to con-gestion (see Lam and Small, 2001; Bates et al., 2001; Rietveld et al., 2001).Challenges relate to getting more insights into the determinants of unreli-ability, the determinants of its negative value for travellers, the possibilityof forecasting unreliability and insights into possible future changes in itsvaluation. In addition, the link between the negative value of unreliabilityand information provision is of great importance, since variations in traveltimes are valued more negatively if the traveller does not know them before-hand. If the traveller is informed before or during the trip, this might reducethe negative value of travel-time variations. Travel-time variations are notequal to unreliability: once they are known to the traveller before he startshis trip, the travel time might be very reliable, although travel times for thesame trip at different times of the day can vary significantly.
Life-cycle Energy Use and Emissions; Indirect Energy Use and Emissions
To estimate energy use and emissions per alternative, CBAs generallyignore the impacts of construction and maintenance, and focus only on thestage when infrastructure projects are actually being used. Indirect energyuse and emissions may also be substantial. Relevant sources of indirectenergy use and emissions are those related to the production of vehicles,including the ‘gain’ due to materials being reused when vehicles are dis-carded. A much more difficult-to-tackle source of indirect energy use andemissions is related to the ‘overhead’ connected to transport. Examples areoffices of railway (and bus) companies, and of vehicle manufacturers and
52 Management characteristics and cost–benefit analysis

vehicle import companies. Energy use and emissions related to the mainte-nance and repair of vehicles may also be relevant. Since it seems to us to bevery complicated to obtain data and avoid ‘double-counting’ problems, wethink that it will not be easy to gain new insights by carrying out newresearch in this area. For more insights into the life-cycle aspects as well asindirect energy use and emissions, see Van Wee et al. (2005).
Location of Emissions
For the impact on climate change the location of emissions is not relevant: 1kg of CO2 has the same impact on climate change, regardless of location. Butfor several other impacts the location is relevant. For instance, for pollutantsthat have health impacts, such as PM, NO2 and CO, the spatial distributionof vehicles (or power plants) in relation to the spatial distribution of the pop-ulation is relevant. The average distances between a power plant providingelectricity for trains and the population will in general be much larger thanthe distance between them and road vehicles. The same emission level mayhave more health impacts if emitted by lorries than by power plants. As aresult, 1 kg of NOx emissions of road traffic may be valued higher comparedto 1 kg of NOx emissions of electricity plants. For acidification and noise thelocation of emissions is also relevant. We have found only a few studies thatinclude the impact of location of emissions on their effects (e.g. Dorland andJansen, 1997; Eyre et al., 1997; Newton, 1997); we have found, however, onlyone CBA that has included this aspect (Koning et al., 2002).
Non-conventional Environmental Impacts
In current practice the environment is included in CBA to a limited extent.Several impacts are stated as pro memory (PM) (not valued) in the CBA,and in decision-making processes PM effects are often ignored, or they getmuch less attention compared to effects that are valued in monetary terms.Van Wee et al. (2005) suggest several ways to improve current practice.
The first improvement is to include the emission of other pollutants. CO2and NOx, and sometimes SO2, emissions are often seen as being the mostimportant, or at least as good indicators for all emissions. Valuing onlythese emissions, however, leads to a possible underestimation of all emis-sion impacts. For example, PM10 emissions are very important, and forhealth effects these emissions are probably the most important pollutants.
The second improvement is that changes in emission factors over timeare generally not included because emission factors for one or two futureyears only are used. If two future years are included, then in general onlyregulations that are already decided upon are taken into account. Emission
Ex-ante evaluation of mega-projects 53

factors for motor vehicles, however, will change, for example due to EU reg-ulations that are as yet partly undecided. Emissions from electricity pro-duction will also change, due to fuel-mix changes, efficiency improvements,changes in the import or export of electricity, and possibly the combinationof heat and power. Changes partly depend on country-specific policies. SeeVan Wee et al. (2005) for a further discussion on the importance of thissubject.
The third improvement is related to the energy use of trains. In theNetherlands, at least, there is hardly any information on this. We find itstrange that the environment forms a political reason to subsidise rail pas-senger transport (and goods transport as well), while the government lacksreliable data on environmental performance (energy use, emissions of dieseltrains). Far more data are available on noise.
Fourth, a major shortcoming of current practice is the limited attentionpaid to the impacts of infrastructure on the landscape and on nature.Because such impacts can be huge, more research into these impacts isneeded. In addition, more research into methods to value these impactsmight result in a more equal treatment of them in CBAs. However, we realisethat there is still a long way to go before these impacts can be valued. Andit is questionable whether methods to value these impacts in a satisfactoryway can be developed at all. For such impacts a combination of CBA andmulti-criteria analysis (MCA) might be a better tool to facilitate decision-making than only a CBA with its questionable values or PM estimations.
Robustness of Policies
Another issue is the robustness of infrastructure and land-use concepts.How vulnerable are we to, for example, an expected or unexpected limita-tion in energy availability for transport? Such limitations may be the resultof political instability in oil-producing countries, much higher prices forfuels or stringent environmental policies. The preferences of consumersand firms may also change in the future. What will happen if sustainablyproduced energy becomes available at reasonable prices? The environmen-tal pros and cons of project alternatives might then change dramatically.
Cross-border Harmonisation
Because cross-border rail links are heavily under discussion, especially in theEU, cross-border issues are becoming more and more important. Theseinclude, first, general methodological issues such as the discount rate to beused and the linking of demand models to be used to estimate travel impacts.Second, ‘real-life’ issues are relevant. For example, in the case of electrical
54 Management characteristics and cost–benefit analysis
traction, differences in power generation between countries should beincluded. Another issue relates to the differences in the value of time. TheEU HEATCO project (Developing Harmonised Approaches for TransportCosting and Project Assessment – see http://heatco.ier.uni-stuttgart.de/hstart.html), focusing on the harmonisation of appraisal methods for cross-border projects, expresses the importance for the European Commission ofsuch ex-ante evaluations. HEATCO provides guidelines for such projectswith respect to decision criteria, the treatment of non-monetarised impacts,the project appraisal evaluation period, the treatment of future risk anduncertainty, discounting, intragenerational equity issues, non-market valua-tion techniques, value transfer, the treatment of indirect socioeconomiceffects, marginal costs of public funds, and the producer surplus of transportproviders. Next to these general guidelines, it elaborates on the value of timeand congestion, the value of changes in accident risks, environmental costs,and costs and indirect impacts of infrastructure investments. In order toreduce the amount of ambiguity and uncertainty in cross-border projectassessments, guidelines are needed that are internationally consistent, trans-ferable and easily executable. As a first step towards this objective, theHEATCO project proposed a set of internationally harmonised method-ological guidelines for project evaluation. These guidelines are based on thestate of the art in project evaluation and also include default values wheredata limitations prohibit the application of comprehensive evaluationmethods. The EU BEACON project also focuses on cross-border aspectsrelated to the strategic environmental assessment of transport plans, policiesand projects (see www.transport-sea.net).
Environmental Performance and Mode Choice
In CBA for the environmental performance of modes, average values areoften used, ignoring specific characteristics of the situation under consid-eration. Van Wee et al. (2005) emphasise the importance of detour factors(difference between overland distance and distance as the crow flies), thecharacteristics of the goods to be transported, speed and many otherfactors on the values for energy use and emissions. The challenge is in bothresearch and application: it is highly recommended that the methodologiesto estimate energy use and emissions per mode are improved as well asapplying insights in CBA practice.
Power Generation
Since in many countries most rail transport uses electricity as the source ofenergy, one has to consider in CBA the expected changes in emissions from
Ex-ante evaluation of mega-projects 55

power plants. But these may be relatively uncertain due to the liberalisationof the electricity market in many countries. Developing scenarios for thenext decades focusing on energy production will probably become availablefrom experts in that research area, and should be used in CBAs of rail pro-jects. Such scenarios may include the use of biofuels or other sustainablyproduced energy sources to generate electricity, as well as technologies tostore CO2 under ground.
Non-user Benefits
Current CBAs focus on user benefits only. There is the question, however,of whether non-user benefits might be relevant. The first category of non-user benefits relates to the so-called option value. The option value can bedescribed as an individual’s valuation of the opportunity to use a particu-lar transport mode or piece of infrastructure in the future that is not beingused in the present. For example, car-owners may value the ability to use apublic transport service when, for whatever reason, they cannot make useof the car due to unavailability or a breakdown, bad weather, increases infuel prices or other car costs, or the loss of the ability to operate a car. Othernon-use benefits relate to altruistic and existence values: a person may valuea rail network even if he never uses it, because he appreciates that othershave the possibility of using it (altruistic value) or even its very existence(a classic example is the South Pole: people value the existence of it even ifnobody, including themselves, ever visits it).
3.5 DISCOUNT RATES
Discount rates are discussed in a separate section because they arenot exclusively related to only costs or benefits. Because costs and benefitsoccur in future years and are discounted, the discount rate has a majorimpact on the outcomes of a CBA, the importance for benefits and costsof operations being even higher than for construction costs because theyoccur at a later stage. The general tendency in most countries is that officialguidance is given for public-sector projects. Another tendency is to lowerthe official discount rates, mainly as a result of the long-term decrease ininflation rates. A problem with discounting, or at least a consequence, isthat benefits or costs in the very long run hardly have any impact on theoutcomes. Intuitively this does not always seem to be correct. One canargue whether it is correct that saving one tree now is equally important tosaving 50 trees in 100 years (the result of a discount rate of 4 per cent), orthat climate change effects that occur after 50 years are hardly relevant. An
56 Management characteristics and cost–benefit analysis

option to deal with benefits or costs in the very long-term could be thetapering of rates for long-term benefits, as well as assuming increases in thevalue of units, e.g. the value of a ton of CO2.
3.6 MODELLING
Until the mid-1990s, in CBA, the analysis of the transport system was mostlylimited to those effects that occurred for passenger transport and took placeon a limited geographical scale. However, network effects may occur on not-included infrastructure elements, such as local roads, as well as outside thestudy area and in the short to medium term. There was generally no accountof freight transport, of network effects that occurred over a wider geo-graphical area and of long-term effects (related to, e.g., residential choice).Practice in these areas has improved as since the mid-1990s many new modelshave become available. In addition, such improvements as well as their impli-cations are discussed in the literature; see for example Gille et al. (2004). Anexample of such new models are the SCGE models described in Section 3.2.Challenges still remain, however, and below we discuss some important ones.
Freight Demand Modelling
Freight transport is an important source for the environmental and eco-nomic effects of transport projects and policies. Despite a large amountof research in the past decade (see Tavasszy, 2006), reviews of modellingpractice often show that freight transport is seldom treated with as muchdetail and attention as passenger transport (see the UK Department forTransport (2002) for a comprehensive international review of freight mod-elling). In particular, the following subjects are not yet well understood:
● Light goods vehicle (LGV) movements In order to understand howincreasing freight flows put pressure on car network capacity, theincrease in the use of LGVs needs to be understood. This requiresnew measuring approaches which can distinguish between passen-gers and freight as motives for an LGV trip, and models whichexplain the trade-offs with other vehicle types.
● Links between freight trips and logistics systems The future growthin freight transport (in terms of total volumes, spatial patterns andfunctional characteristics) depends to a large extent on the underly-ing development of logistics networks. The supply chain manage-ment and operations disciplines drive this development, and formpart of the behavioural explanation of changes in these networks.
Ex-ante evaluation of mega-projects 57

● Relations between freight and the economy Freight transport is animportant determinant of welfare, competitiveness and social equity.The evaluation instruments (models) needed to assess the impacts offreight transport policy in these dimensions are usually inadequate orunavailable. At various spatial levels, the challenges to understand-ing the influence of transport policy on the economy are great, andare strongly dependent on our knowledge of interregional and inter-sectoral interactions, as described by freight models.
New research into the modelling of freight transport should not justinclude work on new mathematical model specifications, but focus also onthe empirical challenges of accurately representing freight flows. Dataacquisition, preferably at the level of individual firms, is a prerequisite foradvances in this area. While proprietary data are difficult to acquire andemploy for public policy purposes, they are needed for specific facilitiessuch as container terminals or industrial site development.
Models of global freight flows are still underdeveloped. Although tradedata do exist, our forecasting abilities for international flows are stilllimited. Part of the problem lies in the difficulty of measuring freight flowsin detail, including, for example, contents of containers. Also, as portregions combine various different functions in the supply chain, includingtransit, value-added logistics, production, import and export clearance, re-exporting etc., the available statistics are often insufficiently detailed tosupport the development of freight flow databases and models aroundports.
Demand Estimations: Technology-specific Aspects
Models that forecast travel demand often include travel costs, travel timeand an alternative specific constant. Data are generally obtained fromresearch (revealed preference or stated preference). However, in the case ofunconventional technologies, such as maglev, it can be questioned whetherthese data are applicable. It is recommended that research is carried out thataims explicitly to take into account the technologies used. Technologiesmay also include the options on board a train, such as power supply forlaptop computers and internet connections, which could be wireless.
Network Effects
When looking at various sorts of models, the distinction between directeffects and direct network effects cannot be clearly made. It is now commonunderstanding that a good transport model will include the effects that
58 Management characteristics and cost–benefit analysis

occur through an interaction between users over a network. More practi-cally, a transport model will treat network effects if it
● covers a geographical study area sufficiently large and a network ofsufficient detail to include re-routing responses;
● includes various multimodal responses, both in terms of modal com-petition and in terms of complementarity (services or modes feedingeach other);
● allows for changes in departure times of network users;● takes into account interaction in the responses between passengers
and freight transport;● includes adequate indicators for congestion and describes changes in
congestion levels, or, maybe better: travel-time losses compared tofree flow;
● expresses traffic in the right units to establish environmental impacts;● includes adequate indicators for reliability and expresses changes in
their levels.
Although the above requirements are theoretically not difficult to meet, fewmodels are generally available that combine these features.
Modelling Traveller Benefits via Logsums
As described in Section 3.2, travel-time gains are an important benefit cat-egory of infrastructure improvements, as well as the benefits of induceddemand. Calculating the benefits of travel-time gains is normally the resultof a simple methodology in which the number of travellers is multiplied bythe travel-time gains and the (mode and income-specific) value of time. Thebenefits of induced demand are calculated using the rule of half. Otherbenefits, such as changes in departure time, or the combination of changesin behaviour (e.g. time and destination) are often ignored. Koopmans andKroes (2003) propose a more advanced method to include all benefits as faras they are related to travel behaviour changes, based on changes in thelogsum of transport models. The method is an option in case a generalisedextreme value (GEV) model is used to forecast changes in travel behaviourdue to the infrastructure project. Basically it calculates the overall con-sumer surplus in a consistent way. It is beyond the scope of this chapter todiscuss the method in more detail. Although the results of applying thismethod are more complicated to communicate, theoretically it is moreadvanced than current practice. The further development of this method,including communication improvements, might contribute to a better mod-elling of benefits of infrastructure changes.
Ex-ante evaluation of mega-projects 59

Modelling Wider Economic Effects
As introduced earlier in this chapter, models are useful to study the widereconomic effects of transport infrastructure changes. From a policy per-spective, these models can show the total change in welfare due to infra-structure policy as well as the distribution of this change over regions andpopulation groups. In order to prevent double counting in CBA, thesemodels should deal in a consistent manner with wider economic effectsthat are additional to the direct effects (which we defined here as indirecteffects), and those that are simply the propagated direct effects. As dis-cussed in Section 3.2, there are a number of alternative models, all of whichare being developed further alongside each other. Below we summarise fourspecific research challenges in the area of modelling of indirect effects. Weagain refer readers to Chapter 4 for a more elaborate discussion of issuesrelated to the assessment of wider economic effects.
The modelling of wider economic effects offers the following challenges:
1. The impact of transport on the economy can be modelled in differentways, for example using direct cost elasticities or explicit productionfunctions. SCGE models require a separate transport model to supplythe production functions with transport inputs, and as the conven-tional ways of dealing with transport costs in CGEs introduce prob-lems for CBA applications, alternatives need to be found (see Tavasszyet al., 2002).
2. Indirect effects can be positive or negative, depending on the nature ofmarket imperfections in various markets. There are various marketsoutside the goods markets which are affected by new infrastructure,such as labour markets, housing markets and land markets. Despite thefact that these can each contribute significantly to the total impacts,most models provide no or only a limited account of some markets(Oosterhaven et al., 2005), and models are continuously being exten-ded.
3. Most models of wider economic effects are static, while it is clear thatthe dynamics of the responses in the system are relevant (because ofnon-linearities in the system) or simply useful (for discounting purposesin CBA) to know. However, as very little is known empirically abouttypically dynamic phenomena such as lagged responses or the role ofexpectations in behaviour, dynamic models are being developed based,for example, on the theory of evolutionary economics (Rothengatter,2002).
4. Models that show economic effects outside the transport sector canhave different theoretical backgrounds. Next to the neoclassical and
60 Management characteristics and cost–benefit analysis

NEG (new economic geography) (microeconomic) based models,we also know the neo-Keynesian (macroeconomic) approaches. Theformer typically show sectoral and regional details, while macromodels work at country level. Linking these models to get the best ofboth worlds is a new direction of research (see Varga et al., 2006).
Consistency between Modelling and Valuation
Transport flows and travel-time changes are the key drivers for the calcula-tion of economic impacts, while changes in vehicle movements are used toassess the environmental effects. In addition, vehicle and traveller charac-teristics are needed to derive the economic and environmental effects. As inpractice different data are used in traditional transport models than ineffect models to calculate changes in transport flows themselves, an issue ofconsistency arises. For example, transport models generally have travel-time-related variables and parameters to calculate traffic flows, which areused in (variables) or obtained from (parameters) model calibration. Incontrast, guidelines for CBA typically prescribe another source of valuesof time, for example as derived from recent empirical (stated-preference)willingness-to-pay (WTP) studies. In addition, both theory and guidelinesconclude that values should be indexed over time to reflect income changes.Therefore consistency in VOTs between the models used and the valuesused in CBAs is rather the exception, based on coincidence, than the ruledue to consistency procedures.
3.7 CONCLUSIONS
The most important conclusions of this chapter are first that large infra-structure projects are heavily under debate in many countries. Second,CBA is a standardised and popular approach to evaluate ex ante theeffects of transport projects, including large infrastructure projects, witha large body of practice/experience. Its popularity can partly be explainedby the (at least seemingly) well-known monetary expressed costs and alsobenefits. Third, this experience tells us that there are many alternativeways to obtain the input for CBAs, but also many possibilities for ‘wrong’input. Fourth, recent studies also show that this can occur easily as a resultof ignorance or misjudgement, rather than manipulative politics. Fifth,the main problems with respect to costs lie in the areas of constructioncost estimates, optimism bias, changes in the project specifications, igno-rance of life-cycle aspects and uncertainty in the costs of new technology.
Ex-ante evaluation of mega-projects 61

Sixth, the main problems with respect to benefits relate to the poor esti-mates of links between transport and land use, the inclusion of indirecteffects, including double counting of effects, value-of-time and reliabilityestimates, the inclusion of environmental aspects, cross-border harmoni-sation, non-use benefits and the limited time horizon of ex-ante evalua-tions. Our final conclusion is that modelling challenges include freightmodelling, demand estimates in the case of unconventional technology,network effects, indirect effects and the consistency between modellingand valuation.
Important questions that arise are: what is the impact of all theimprovements as discussed in this chapter? And: does it have any impacton decision-making? The aim of this chapter is not to fully answer thesequestions. Here we will discuss them briefly. We think that better insightsinto construction costs can really change the outcomes of a CBA and mayhave an important impact on decision-making. We think all aspects as dis-cussed may contribute significantly to better estimates of costs. It is moredifficult to stress the importance of the challenges related to demand ingeneral terms, e.g. land-use implications might be important for oneproject, but not for another project. Our first impression is that the chal-lenges that might be of most importance for the outcomes of a CBA andtherefore perhaps also for decision-making are those related to the valueof time and value of reliability, and non-user benefits. For some projectsindirect effects and land-use change might be relatively important. Effectsin the long term, related to the robustness of policies and long-term envi-ronmental impacts, hardly have any impact on the outcomes of a CBAunless changes in the discount rate are made, or if these impacts arevalued higher in the long term. We have the impression that improvementsin modelling might be important, but the impacts on the outcomes of aCBA are probably of less importance than changes in cost estimates, somebenefit categories, and discount rates. This does not imply that we suggestnot emphasising modelling improvements. On the contrary: because thecosts and benefits of infrastructure projects are generally huge, the add-itional costs of developing and applying better models are marginal com-pared to the size of the costs and benefits, and are therefore highlyrecommended. And next to the content, several improvements withrespect to the process can be made. For example Gille et al. (2004) con-clude that in an early stage it is necessary to combine the insights of theclient, the CBA specialist and the modeller to discuss the level of detailand specific policy questions so that agreement exists on the sort of modeloutput to be used. The process is another area of improvements, stronglylinked to the content, that we consider as an important area for furtherresearch.
62 Management characteristics and cost–benefit analysis

NOTES
1. This chapter is based partly on Van Wee (2007) and Tavasszy et al. (2002).2. In some cases benefits are based on other assumptions than consumer preferences.
Examples include the valuation of CO2 emissions; current consumer preferences are gen-erally much lower than estimates based on political choices.
3. This removal stage is an important one in the case of nuclear power plants, and thereforeis often included in discussions on energy supply. For vehicles (e.g. Bouwman and Moll,1997; ECMT, 1999) and infrastructure projects (Bos, 1998) it is sometimes discussed aswell.
REFERENCES
Bates, J., J. Polak, P. Jones and A. Cook (2001), ‘The valuation of reliability for per-sonal travel’, Transportation Research Part E, 37 (2–3): 191–229.
Bos, S. (1998), Direction Indirect. The Indirect Energy Requirements and Emissionsfrom Freight Transport, Groningen: Groningen University.
Bouwman, M.E. and H.C. Moll (1997), ‘Status quo and expectations concerningthe material composition of road vehicles and consequences for energy use’,IVEM Research Report no. 91, Groningen: Groningen University.
Bruzelius, N., B. Flyvbjerg and W. Rothengatter (2002), ‘Big decision, big risks.Improving accountability in mega projects’, Transport Policy, 9 (2): 143–54.
Button, K.J. (1993), Transport Economics, 2nd edn, Aldershot, UK and Brookfield,MA, USA: Edward Elgar.
Dorland, C. and H.M.A. Jansen (1997), ‘ExternE Transport – the Netherlands.Dutch case studies on transport externalities’, Institute for EnvironmentalStudies (IVM), Amsterdam: Free University.
ECMT (1999), Cleaner Cars. Fleet Renewal and Scrappage Schemes, Paris:European Conference of Ministers of Transport.
Elhorst, J.P., J. Oosterhaven and W.E. Romp (2001), ‘Integral cost–benefit analysisof MAGLEV technology under market imperfections’, Research Report 04C22,Groningen: University of Groningen, Research Institute SOM.
Eyre, N.J., E. Ozdemiroglu, D.W. Pearce and P. Steele (1997), ‘Fuel and locationeffects on the damage costs of transport emissions’, Journal of TransportEconomics and Policy, 31 (1): 5–24.
FHWA (2001), Freight Transportation Improvements and the Economy,Washington, DC: US Department of Transport.
Flyvbjerg, B. and COWI (2004), Procedures for Dealing with Optimism Bias inTransport Planning: Guidance Document, London: UK Department forTransport.
Flyvbjerg, B., N. Bruzelius and W. Rothengatter (2003), Megaprojects and Risk: AnAnatomy of Ambition, Cambridge: Cambridge University Press.
Flyvbjerg, B., M.K. Skamris Holm and S.L. Buhl (2005), ‘How (in)accurate aredemand forecasts in public works projects? The case of transportation’, Journalof the American Planning Association, 71 (2): 131–46.
Gille, J., A.I.J.M. van der Hoorn and F.A. Rosenberg (2004), ‘Transport models asan input for cost benefit analysis’, paper presented at the European TransportConference, Strasbourg, 4–6 October.
Ex-ante evaluation of mega-projects 63
Gunn, H. (2001), ‘Spatial and temporal transferability of relationships betweentravel demand, trip cost and travel time’, Transportation Research E, 37: 163–89.
Gunn, H. (2004), SCGE Models: Relevance and Accessibility for Use in the UK, withEmphasis on Implications for Evaluation of Transport Investments, London: UKDepartment for Transport.
Hayashi, Y. and H. Morisugi (2000), ‘International comparison of backgroundconcept and methodology of transportation project appraisal’, Transport Policy,7: 73–88.
Koning, M., E. Verkade and J. Hakfoort (2002), Implications of Expanding SchipholAirport. A Quick Scan CBA, The Hague: Centraal Planbureau (in Dutch).
Koopmans, C.C. and E. Kroes (2003), ‘Estimation of congestion costs inthe Netherlands’, paper presented at the European Transport Conference,Strasbourg, 8–10 October.
Lam, T.C. and K.A. Small (2001), ‘The value of time and reliability: measurementfrom a value pricing experiment’, Transportation Research Part E, 37 (2–3):231–51.
Newton, P.N. (ed.) (1997), Reshaping Cities for a More Sustainable Future –Exploring the Link between Urban Form, Air Quality, Energy and Greenhouse GasEmissions, Research Monograph 6, Melbourne: Australian Housing andResearch Institute (AHURI). www.ea.gov.au/atmosphere/airquality/urban-air/urban air docs.html.
Odeck, J. (2004), ‘Cost overruns in road construction – what are their sizes anddeterminants?’, Transport Policy, 11 (1): 43–53.
Oosterhaven, J. and K.C. Koopmans (2005), ‘NEG modelling in cost–benefit analy-sis – the Netherlands experience’, paper presented at the ‘Economic impacts ofchanging accessibility’ seminar, Heriot-Watt University, Edinburgh, 27 October.
Oosterhaven, J., T. Knaap, C.J. Ruijgrok and L.A. Tavasszy (2001), ‘On the devel-opment of RAEM: the Dutch spatial general equilibrium model and its firstapplication’, paper presented at the 41st European Regional Science AssociationConference, Zagreb, 29 August–1 September.
Rietveld, P., F.R. Bruinsma and D.J. van Vuren (2001), ‘Coping with unreliabilityin public transport chains: a case study for Netherlands’, Transportation ResearchPart A, 35 (6): 539–59.
Rothengatter, W. (2002), ‘The role of CBA in assessing European transport projectsand strategies’, unpublished paper for the IASON project, Karlsruhe: IWW,Universität Karlsruhe.
Tavasszy, L.A. (2006), ‘International experiences with freight modelling’,Proceedings of the Transportation Research Board Conference on FreightModelling, 25–27 September, Washington, DC.
Tavasszy, L.A. and N. Bruzelius (2005), ‘The value of freight transport time: a logis-tics perspective – state of the art and research challenges’, in OECD, Report ofthe ECMT Round Table No. 127, Time and Transport, Paris: OECD.
Tavasszy, L.A., M.J.P.M. Thissen, A.C. Muskens and J. Oosterhaven (2002),‘Pitfalls and solutions in the application of spatial computable general equilib-rium models for transport appraisal’, paper prepared for the 42nd EuropeanCongress of the Regional Science Association, Dortmund, 27–31 August.
Trujillo, L., E. Quinet and A. Estache (2002), ‘Dealing with demand forecastinggames in transport privatization’, Transport Policy, 9 (4): 325–34.
UK Department for Transport (2002), Review of Freight Modelling, London: UKDepartment for Transport.
64 Management characteristics and cost–benefit analysis

Van Wee, B. (2007), ‘Rail infrastructure: challenges for CBA and other ex anteevaluations’, Transportation Planning and Technology, 30 (1): 31–48.
Van Wee, B., P. Janse and R. van den Brink (2005), ‘Comparing environmental per-formance of land transport modes’, Transport Reviews, 25 (1): 3–24.
Varga, A., A. Koike, M.J.P.M Thissen and L.A. Tavasszy (2006), ‘Endogenizingspatial economic structure in a macro-regional modeling framework’, paper pre-sented at the 2006 European Regional Science Association Conference, Volos,Greece, 30 August–3 September.
Venables, A. and M. Gasiorek (1998), ‘The welfare implications of transportimprovements in the presence of market failure’, Report to SACTRA, London:UK Department for Transport.
Wachs, M. (1989), ‘When planners lie with numbers’, APA Journal, 55 (4): 476–9.Wachs, M. (1990), ‘Ethics and advocacy in forecasting for public policy’, Business
and Professional Ethics Journal, 9 (1&2): 141–57.Wardman, M. (2001), ‘A review of British evidence on time and service quality
valuations’, Transportation Research Part E, 37 (2–3): 107–28.Wegener, M. and F. Fürst (1999), ‘Land-use transport interaction: state of the
art. Deliverable D2a of the project TRANSLAND’ (Integration of Transportand Land Use Planning), Dortmund: Universität Dortmund, Institut fürRaumplanung.
Zoeteman, A. (2004), Railway Design and Maintenance from a Life-cycle CostPerspective. A Decision Support Approach, Delft: Delft University of Technology.
Ex-ante evaluation of mega-projects 65

4. Cost–benefit analysis and thewider economic benefits frommega-projectsRoger W. Vickerman
4.1 INTRODUCTION
The potential for mega-projects to generate a social surplus, benefits aboveand beyond those accruing to users, has been recognised for a long time.The standard cost–benefit approach to the appraisal of transport infra-structure has tended to ignore such wider benefits, arguing that a well-defined cost–benefit analysis will ensure that the benefits to users willadequately capture all economic benefits. This has led to the situationwhere project promoters will attempt to reinforce the justification for pro-jects by adding a mark-up to the user benefits to reflect these supposedwider benefits to the economy. This practice has then been extended tousing such wider benefits as a means of justifying projects that would notbe acceptable on the basis of the user benefits alone.
Over the last 15 years considerable effort has been expended on provid-ing a more rigorous theoretical basis for including such wider effects andon gathering empirical evidence to assess whether the magnitude of anyerrors from ignoring them is sufficient to justify the added complexity ofwidening the appraisal framework. In Section 4.2 we examine the theoret-ical justification for including any wider economic impacts; in Section 4.3we assess empirical evidence on the extent of such impacts; and in Section4.4 we consider the implications for the appraisal process, especially in thesituation where not just public funds are used for the investment. Section4.5 presents some conclusions.
66

4.2 THE CASE FOR INCLUDING WIDERECONOMIC BENEFITS
Microeconomic and Macroeconomic Arguments
The argument for relying on the user benefits from a project to justify itsvalue to society is a simple one. The demand for transport is a deriveddemand; thus transport infrastructure will only be used for journeys thatcan be justified in terms of their value to the activities for which they areundertaken. Since these activities will only be undertaken up to the pointwhere the willingness to pay is just equal to the price that has to be paid,the derived benefit to the user is expressed exactly by the revealed consumersurplus, no more and no less. This is the standard microeconomic argumentidentified by Dodgson (1973) and formalised by Jara-Diaz (1986).
Nevertheless there has always been a rather more macroeconomic argu-ment that significant infrastructure development could have an impact onthe overall rate of growth of the economy. This finds support particularly inthe argument over the role that the development of the railways played in thedevelopment of the American West (Fogel, 1964; Fishlow, 1965). Here it wasargued that the power of new infrastructure to unlock the economic poten-tial of a region generated total economic benefits well above the sum of thebenefits to individual users. This social surplus might of course be difficultto realise if reliance were placed on the market to provide infrastructure, amarket that would only be able to generate its revenue from direct users. Thusthe argument about a social surplus could very quickly become an argumentfor social involvement in the provision of infrastructure.
There is a microeconomic argument that would also support this view.Going right back to Dupuit (1844), it has been recognised that once infra-structure was constructed, the marginal cost for its use by the individualuser would be very small (effectively zero in most cases). Thus the efficientprice for using an uncongested infrastructure would also be zero. In such asituation it would not be possible for a private operator to develop andoperate the infrastructure profitably. This did not, however, necessarilymean that the infrastructure was not worthwhile in the aggregate, as theremight be externalities arising from its use that could not be internalised(Pigou, 1920).
Although these wider benefits were recognised as a theoretical possibil-ity, particularly as Jara-Diaz (1986) identified where there were monopo-listic tendencies in industries in the locations served by the infrastructure,there was little quantitative evidence confirming the actual extent of suchinaccuracies in a standard analysis of transport user benefits. A well-defined transport CBA would thus always be the best estimate of overall
Cost–benefit analysis and the wider economic benefits 67

benefits. This view was reinforced from the macroeconomic perspective bya desire not to use the wider benefits argument as an excuse for public-sector subsidy of such projects. In particular the ‘crowding-out’ argumentwas advanced to accuse public-sector-financed projects of increasing thecost, and reducing the rate of return, of the private sector in productiveindustries. Thus even if there were wider social benefits from an infrastruc-ture project, securing these benefits would involve a reduction in outputelsewhere in the economy. Again, however, although there was no empiri-cal evidence of the relative sizes of these effects, the argument suited thepolitical mood of the time with a desire to find any excuse to reduce the sizeof the public sector.
These views were confronted by Aschauer (1989), who set out to providerobust empirical evidence on the magnitude of the output effects of publicinfrastructure. Using a standard aggregate production function approach,Aschauer claimed that in practice the positive long-term effects of infra-structure on output were so large that they more than outweighed anyshort-term crowding-out effects. Aschauer’s general findings based onevidence from US states were supported by some parallel work onEuropean regions by Biehl (1986). Biehl’s work went further, however.Instead of simply estimating an overall production function with a para-meter that measured an average output elasticity with respect to aggregateinfrastructure in a region, it tried to identify the conditions under whichinfrastructure did and did not have an impact in a particular region. ThusBiehl identified that there were regions, many with quite significantamounts of infrastructure, where infrastructure remained a constraint ongrowth, but other regions seemingly lacking in infrastructure wouldprovide in effect a very poor return on further investment in infrastructureas other factors, such as private capital and skilled labour, were the mainconstraints on growth (Biehl, 1991).
Aschauer’s work in particular did not go unchallenged. There was criti-cism of the econometric specification, and a raft of further studies (includ-ing several by Aschauer himself) was undertaken on a variety of data setswhich confirmed, or in some cases failed to confirm, positive effects,although few produced estimates as large as those in Aschauer’s originalstudy (for a review see SACTRA, 1999; Vickerman, 2000; 2002). The con-sensus that has emerged is that there is evidence of an overall positive effect,with an output elasticity that is probably of the order of 0.1 (Lynde andRichmond, 1993).
The problem with all these studies is that the output elasticity of avolume of infrastructure is not a particularly useful measure of the widereconomic effects that can be associated with any particular project. AsGramlich (1994) suggests, the real impact of infrastructure can only be
68 Management characteristics and cost–benefit analysis

identified at a much more micro or specific level. Depending on the natureof the project, the wider benefits could be very different in magnitude. Incases where the lack of infrastructure was a serious constraint on the inte-gration of a local economy into wider markets, the overall benefits couldbe large relative to the direct user benefits. In other cases, even significantchanges in accessibility could have only marginal impacts on the overalllevel of activity. But this assumes that all transport infrastructure changesare pro-competitive in the sense that they reduce transport costs in such away as to lower the overall costs of transport-using activities, promotingcompetition and increased welfare. This also implies that lower transportcosts are neutral in their impact on different regions.
Imperfect Competition
Jara-Diaz (1986) recognised that if the degree of monopoly were differentin the two regions connected by a new infrastructure, there could bedifferential effects, but the further demonstration of this came from thedevelopment of the so-called new economic geography approach, follow-ing Krugman (1991). The key issue here is that in an imperfectly competi-tive world there will be agglomeration forces that enable firms with largermarkets and enjoying scale economies to take more advantage of anyreduction in transport costs. Hence reductions in transport costs can leadto more agglomeration and to unequal impacts on regions connected by thesame infrastructure (Venables and Gasiorek, 1999). However, the nature ofthis approach means that the impact of any particular reduction of trans-port costs cannot be determined a priori. It will depend on the initial levelof transport costs, the degree of agglomeration already present, the sizeof each market, the extent of scale economies and of the backwardand forward linkages within that market (Fujita et al., 1999; Fujita andThisse, 2002).
What becomes relevant here is the extent of the mark-up over marginalcost in the transport-using industries. In perfectly competitive sectors thereis no mark-up and hence any changes in transport costs will have to bepassed on directly to the final activity, so the extent of the impact on thewider economy is dependent on the elasticity of demand for that final activ-ity. Since the amount of transport demanded depends directly on thedemand for the final activity, the direct user benefits capture all the eco-nomic benefits. As mark-ups increase, a wedge is driven between the marketfor the transport-using activity and the transport associated with it. Anyreduction in transport costs from new infrastructure does not need to bepassed directly on to the customers of the final activity, but firms can usethe opportunity to increase or reduce the mark-up. Reducing the mark-up
Cost–benefit analysis and the wider economic benefits 69

by passing on more than the reduction in transport costs could be a way ofincreasing a firm’s market area and gaining market advantage over firms ina more competitive market. On the other hand, firms may use the fall intransport costs to increase the mark-up, for example to invest so as toreduce other costs, and gain from potential scale economies. The net impactcan also be negative. If the mark-up is negative, for example where thereare industries with significant subsidies, such as in economically laggingregions, then the direct user benefits may overestimate the total economicbenefit. Hence the ultimate impact from any infrastructure project is likelyto be unpredictable, in terms of both magnitude and sign.
Components of the Total Economic Impact
How then can the total economic impact be assessed? There are three mainelements to this. First, there is the impact on competition in the affectedregions; second, there is the impact on the ability to gain benefits fromthe change in market power through agglomeration: and third, there is theimpact on the linkages, and in particular on backward linkages such as thelabour market. Once these have been assessed, we need to identify how toinclude them in a full cost–benefit framework.
The impact on competition is ambiguous. In perfectly competitivemarkets, as we have seen, the impact of increased competition is essentiallyneutral and should be adequately captured by the direct user benefits. Inimperfectly competitive markets, the direct effect of any increased compe-tition resulting directly from lower transport costs is also likely to be essen-tially neutral in its impact. It is traditionally argued that monopoly poweris derived from the effective barriers to competition provided by highertransport costs so that reductions in such barriers are pro-competitive,reducing monopoly mark-ups and hence there is a wider benefit resultingfrom the reduction of prices. On the other hand, such competitive pressuresif they do exist may also drive firms out of the market, and the effect oflower transport costs is to reduce the number of firms able to compete inthe market in the long run. It is likely that such effects cancel each other outin most cases, and thus there is little in the way of wider economic benefitsthat can be added.
There may be some exceptions to this where new links are created thathave such a significant impact on transport costs (which are already veryhigh) that significant market restructuring takes place, introducing compe-tition to previously protected local monopolies. This is the ‘unlocking’argument advanced by SACTRA (1999) and reaffirmed in its latest guid-ance by the UK Department for Transport (2005). These are likely to berare in most developed market economies.
70 Management characteristics and cost–benefit analysis

Much more significant than the market competition effects are theagglomeration benefits that may result from the change in transport costs.The argument here is that the rise in output that follows from the lowertransport costs has cumulative effects through the way in which firms inter-act in a market. This involves both localisation economies, in which firmswithin the same industry benefit from proximity to each other throughsuch factors as specialised labour pools or shared R&D, and urbanisationeconomies, in which firms obtain a form of public-goods benefit from theexistence of an urban infrastructure including knowledge, research andculture, as well as the physical infrastructure. The larger the market, thegreater the likely net additional impact that arises because there is an addi-tional impact on productivity. There has been a long debate over the extentto which urban size and productivity are related, and the direction ofcausality, but there is an increasing consensus that there is a strong positiverelationship that can have a significant additional impact on the benefitsfrom transport improvements (Fujita and Thisse, 2002; Venables, 2004;Graham, 2005). This argues that although the lower transport costs maycause firms to increase the size of their market, that increased size providesan incentive for the firm to enjoy scale economies and to benefit from prox-imity to other more efficient firms. Typical productivity elasticities are inthe range 0.01 to 0.1. Ciccone (2002), using data for EU regions, finds anelasticity with respect to employment density of 0.05. Graham (2005) findsfor UK industries a weighted average elasticity of 0.04 for manufacturing,but significant variations between industries, with some as high as 0.2, andan average of 0.12 for service industries. Graham also identifies someimportant variations between regions, reflecting different degrees of local-isation of industry groups.
Labour-market Effects
A further element of this output benefit under imperfect competition is thatbecause productivity is increasing, the direct user benefits will also begreater than would be the case under an assumption of perfect competi-tion. The largest direct user benefits from most projects are time savings,valued relative to the wage level assuming that wages reflect productivity.The increase in productivity implies that a higher value of time savingsshould be applied. But the increased productivity enables firms to increaseoutput (or produce the same output with fewer workers), which implies thatan uplift needs to be applied to the time savings.
The basic advantage that some regions obtain in an imperfectly compet-itive world derives from a larger market size, which enables firms to increaseboth output (scale) and productivity. However, it is useful to break that
Cost–benefit analysis and the wider economic benefits 71

larger market size effect up into a pure market size effect, and the backwardand forward linkages associated with agglomeration. One of the key back-ward linkages relates to the labour market. As transport costs are reduced,labour markets become larger as commuting times are reduced and firmshave access to a larger labour supply. This enables firms to benefit bothfrom wage levels lower than they might be as a result of more competitionin the larger market, and access to more skilled labour, which will be moreproductive for the reasons discussed above.
Normally a wage premium would be expected at the market centrereflecting its greater accessibility, scale and productivity effects, but alsoreflecting the wage necessary to attract labour to commute in from acrossthe wider region. As transport is improved, more workers find it attractiveto work in the market centre, because of the larger catchment area fromwhich commuting is feasible, and because of the increased opportunitiesfor work in the centre rather than elsewhere (or not at all). Workers in thecentre may also be prepared to work longer hours. Hence an output effectarises because of the increased size of the labour market. Where there isalso a productivity effect due to agglomeration effects at the market centre,the output effect from the expansion of employment is added to by theincreased output of all existing workers.
This is illustrated in Figure 4.1, derived from Venables (2004). The Wcurve represents the mark-up of wages at the market centre relative to theedge of the city. This increases with city size, reflecting the productivityeffect of agglomeration. The C function represents total commuting costs(assuming for simplicity a constant transport cost per unit distance). In theinitial situation with commuting costs given by C0, the city is of size L0 interms of numbers of workers, and the unit benefit (the equilibrium wagemark-up) is B0. Transport improvements lead to commuting costs falling toC1 and thus the equilibrium size of the city increases to L1, at which sizethe wage gap at the centre increases along the W function to B1. The totalnet benefit is composed of an increase in output from the existing workersfacing lower commuting costs (�), an increase in the output from the addi-tional workers (� � �), less the additional transport costs (�), and finallythe increase in output due to the productivity enhancement from agglom-eration (�). Note that if there were no productivity enhancement, the wagegap would remain at B0 and hence, with commuting costs at C1, the citywould only increase to size L1', areas � and � would be smaller and � wouldnot exist.
Note in all this discussion that it is not the size of the infrastructureproject that determines the scale of the wider economic benefits. Mega-projects are likely to have a wider impact in terms of greater direct userbenefits, but the wider benefits are not simply proportional to the direct
72 Management characteristics and cost–benefit analysis
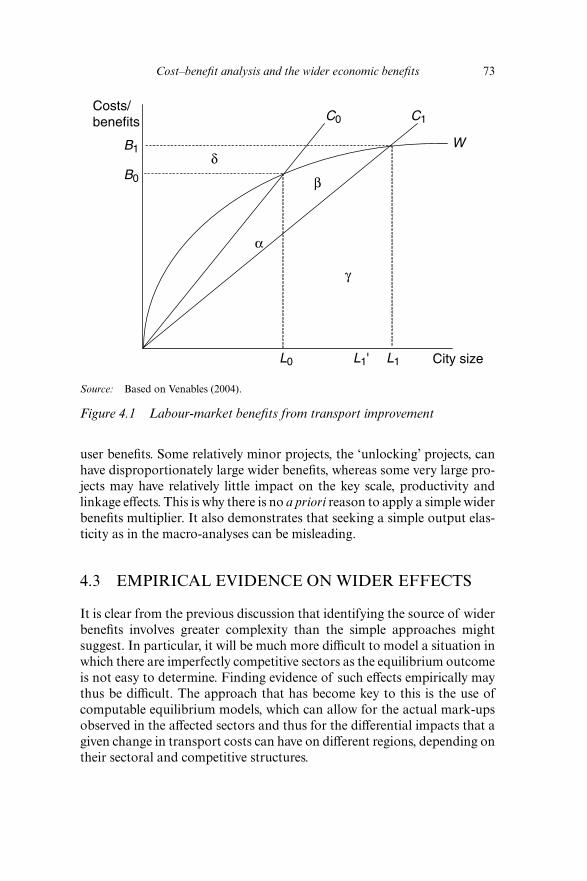
user benefits. Some relatively minor projects, the ‘unlocking’ projects, canhave disproportionately large wider benefits, whereas some very large pro-jects may have relatively little impact on the key scale, productivity andlinkage effects. This is why there is no a priori reason to apply a simple widerbenefits multiplier. It also demonstrates that seeking a simple output elas-ticity as in the macro-analyses can be misleading.
4.3 EMPIRICAL EVIDENCE ON WIDER EFFECTS
It is clear from the previous discussion that identifying the source of widerbenefits involves greater complexity than the simple approaches mightsuggest. In particular, it will be much more difficult to model a situation inwhich there are imperfectly competitive sectors as the equilibrium outcomeis not easy to determine. Finding evidence of such effects empirically maythus be difficult. The approach that has become key to this is the use ofcomputable equilibrium models, which can allow for the actual mark-upsobserved in the affected sectors and thus for the differential impacts that agiven change in transport costs can have on different regions, depending ontheir sectoral and competitive structures.
Cost–benefit analysis and the wider economic benefits 73
Source: Based on Venables (2004).
Figure 4.1 Labour-market benefits from transport improvement
Costs/benefits
City sizeL0 L1' L1
B1
B0
C0 C1
Wδ
α
β
γ

In their general equilibrium form, such models can allow for differencesbetween regions in industrial structure and linkages to model the differ-ential impact on each region. However, this approach is dependent onsignificant data resources, which has so far led to considerable reluctanceto use the approach as a general evaluation tool. In the UK, SACTRA(1999) identified the value of such an approach, but suggested that it wouldbe more useful for overall network evaluation or very large projects thanfor routine investment appraisal, a view reinforced in a more recent assess-ment (Gunn, 2004).
It is not proposed to go into detail here on the structure of computablegeneral equilibrium (CGE) models (see Bröcker, 2004; Gunn, 2004, forvaluable introductions), and we use only a selection of examples from thelarge number of case studies to illustrate key points. Given our focus ondeveloped-country cases where even mega-projects have only a marginalimpact on overall networks, we ignore the large number of examplesapplied to developing countries.
The basic structure involves a demand system that expresses final con-sumers’ preferences over a range of differentiated goods, a social account-ing matrix that expresses the input–output structure of the economy, and aprofit function for firms. The input–output structure distinguishes tradableand non-tradable goods. The demand for non-tradables has to be satisfiedby regional production; that for tradables can be satisfied by importinggoods from other regions, the delivered price of such goods depending onthe price of transport. Firms are assumed to be in imperfect competitionproducing differentiated goods. In order to make the system more tractable,the typical assumption is that of monopolistic competition so thatalthough there is a mark-up over marginal cost, the possibility of entryensures that firms produce where price equals average cost. A furtherimportant element is the labour market. It must be ensured that the demandfor labour necessary for a region’s production is matched by the availablelabour force. In the longer run this requires the recognition of migrationbetween regions to achieve labour-market balance, but in other cases therewill be a need to accommodate commuting between regions as a keyelement.
The advantages of the CGE approach over other modelling approacheslie in its ability to incorporate imperfectly competitive markets anddifferentiated goods. Central to the model structure are the final con-sumers’ preferences for these goods, and hence the output of the model, aswell as sets of demands for these goods and the implicit flows betweenregions which these demands generate, is a direct measure of changes inconsumer welfare in terms of the equivalent variation in income (theincome equivalent of the change in welfare resulting from a change in any
74 Management characteristics and cost–benefit analysis

input, such as the cost of transport). Moreover, the structure of the modelis such that it determines a higher proportion of critical variables endoge-nously without the need for further assumptions.
Although CGE models have been used increasingly widely in the analy-sis of international trade, such trade does not involve the complexity ofspatial relationships which are implicit in most passenger transport appli-cations. The approach has been used to demonstrate the way in which thespatial distribution of the benefits from transport developments areparameter-dependent (see Venables and Gasiorek, 1999), but such demon-strations use highly simplified numerical simulations with a small numberof sectors and regions. Applications of CGE models to specific transportinvestment projects are still relatively scarce. This is not surprising given thedifficulty in deriving the detailed data requirements for a specific project,not least in determining the relevant spatial scale of the area of study. Theavailability of social accounting data at the small area level is particularlyproblematic. There is also a difference between the use of CGE models torefine evidence on Aschauer-type macro-questions of the role of aggregateinfrastructure from those trying to answer micro-type questions about thespecific impact on flows of a given infrastructure improvement.
In between these two extremes is the case of the overall benefits of trans-port network improvements. These require us to model the impact ofdifferential changes on specific links, but are aimed more at identifying theoverall benefits of improvements to the network and their spatial distribu-tion than at the appraisal of an individual investment. Thus, for example,the CGEurope model developed by Johannes Bröcker has been used in anumber of research projects looking at the impact of the Trans-EuropeanNetworks (TENs; see, for example, Bröcker et al., 2004a; 2004b). This usesa detailed representation of the European transport network mapped ontoa detailed regional structure of Europe at the NUTS3 level.
The model generates three important results. First, it demonstrates thatdespite significant changes in transport costs and accessibility occasionedby the development of the TENs, the impact on welfare is relatively modest(equivalent typically to less than 2 per cent of regional GDP). Second, itshows that the network as a whole has both positive and negative impactsand, although the largest positive impacts relative to regional GDP are inthe more peripheral, poorer regions, it is difficult to claim that, despitesignificant investment expenditures, the TENs are a major force for con-vergence and cohesion. Third, specific investments can be seen to havedifferential impacts both on the specific regions they serve and on the addedvalue they bring to the European economy as a whole. Thus, even using afairly aggregated modelling structure, much of parameter dependence andvariety of impact predicted by the theoretical model can be identified.
Cost–benefit analysis and the wider economic benefits 75
More specific project applications include an evaluation of the regionalimpacts of highway developments in Japan (Miyagi, 1998; 2001), and of theimpact of a high-speed rail link between the Randstad and the NorthernNetherlands, including the possibility of using an ultra-high-speed maglevsystem (Oosterhaven and Elhorst, 2003; Elhorst et al., 2004). The Dutchmodel focuses not just on the output and welfare implications, but also veryspecifically on the labour market since the improvement to transport willaffect not only the location of employment but also the residential locationdecision. This introduces further difficulties because it requires not just abalance of production and consumption in the goods markets, with a poten-tial response through migration to long-term imbalances, but a period-by-period balancing of labour-market demands and supplies, zone by zone.Furthermore, once the key benefiting users of the system are passengersrather than goods, some of the simplifying assumptions used in the typicalCGE structure become less plausible. For example, the use of ‘iceberg’ trans-port costs, in which the cost of transport of a good is subsumed into thevalue of the goods moved such that they are worth less at the destinationthan at the origin by the amount of the cost of transport, is inappropriatefor passengers. Similarly the assumption of constant costs of transport perunit of distance is even less appropriate for passenger transport.
Nevertheless, the application of a CGE model to this project has pro-duced an interesting set of results. The wider benefits are shown to varysignificantly as a result of the precise nature of the project and the regionstudied (especially core–periphery differences), and constitute a higher pro-portion of direct benefits than earlier studies suggested, of the order of30–40 per cent. These wider benefits are higher than theoretical simulationmodels have suggested; SACTRA (1999) suggested that a figure of 10 to 20per cent was a likely range, following the conclusion by Venables andGasiorek (1999) that 30 per cent was likely to be exceeded in only a fewcases. (It is worth noting, however, that in the earlier version Oosterhavenand Elhorst had produced a figure of 83 per cent.) What is clear fromElhorst et al. (2004) is that the degree of detail in the modelling of labourmarket responses may be crucial here. These employment effects arise bylinking areas of surplus labour to those of labour shortages, rather thanthrough the productivity effects arising as a result of agglomerationbenefits, which have been argued elsewhere (Venables, 2004).
4.4 LESSONS FOR APPRAISAL
There is a significant difference between a theoretical model that tries toexplain the relationship between investment in transport infrastructure and
76 Management characteristics and cost–benefit analysis

economic welfare, and a method of appraisal to be used for individual pro-jects. We have already suggested that the nature of CGE models makesthem more suitable for mega-projects which are more likely to have the sortof complex effects which CGE models attempt to disentangle. As Gunn(2004) has identified, the applications thus far have been largely in this cat-egory. But identifying economic impacts is not the same as appraisal.SACTRA (1999) pointed out the way in which appraisal using traditionalcost–benefit analysis would require an increasingly complex move from thestandard transport CBA to a more sophisticated analysis that incorporatedenvironmental and wider economic effects, including recognising imperfectcompetition, if the total impact were to be correctly appraised.
The advantage of the CGE model approach is that it allows us to assessthe sensitivity of the overall outcome to varying the assumptions aboutinputs. This identifies which are the most critically sensitive values and rela-tionships included in the model. These are the areas of the appraisalprocess that have to be tackled most carefully and thoroughly. In a recentsummary of the implications for appraisal of work by Venables (2004) andGraham (2005), the UK Department for Transport (2005) has outlined thesteps for appraisal of these wider benefits in large-scale transport invest-ment improvements.
Apart from the usual appraisal of user benefits in terms of journey-timesavings, four wider effects are identified: productivity effects, agglomerationeffects, competition effects and labour-market effects. Productivity effectsaim to measure the way in which journey-time savings and increased relia-bility for business travel affect productivity and GDP. These are in additionto the benefits to the users themselves and can lead, for example, to firmsemploying fewer staff or fewer vehicles because of the greater speed in thenetwork. Agglomeration effects are those we have already identified, whereproductivity among firms increases because of an increasing concentrationof firms or increasing density of employment. Competition effects includethe pro-competitive effects of increased competition and, under imperfectcompetition, the impacts of increasing returns to scale. Finally, labour-market effects arise from three possible sources. First, more people may bewilling to enter the labour market because of the improved transport.Second, workers may be willing to work longer hours. Third, and of great-est significance, employment may relocate from a lower-productivity areato a higher-productivity area.
The key to estimating all these impacts is good data on the relationshipbetween employment density and productivity, and the way in whichlabour supply may adjust in imperfect markets to changing patterns oftransport costs. This requires evidence at a much more detailed levelthan the type of approach typically available for CGE studies. Detailed
Cost–benefit analysis and the wider economic benefits 77

evidence on price–cost mark-ups has been provided by Graham (2005),and this, together with the labour market evidence produced by Venables(2004), enables some estimates of wider benefits to be calculated fromtransport projects. Table 4.1, taken from UK Department for Transport(2005), shows some estimates for the likely impact of introducingCrossrail, a major new cross-London rail link which would provide muchfaster transport along an east–west corridor for commuters into centralLondon.
Table 4.1 presents these benefits in two ways, as an impact on GDP andas an impact on welfare so as to include those things which would not bemeasured in GDP measures. It can be seen that in this case the difference isnot great, but the incidence changes somewhat. The welfare measureincludes as gains to users the time savings that have an impact onlabour supply, which appear as additional benefits in the GDP measure.Particularly important in both measures is the likely agglomeration effects,amounting to some 25 per cent of direct user benefits, suggesting again thatomitting this factor would lead to a serious underestimate of the total eco-nomic benefit of a project. But notice also that over 50 per cent of the GDPbenefits arises from the redeployment of employment to more productivejobs. This approach is based essentially on putting together the findings of
78 Management characteristics and cost–benefit analysis
Table 4.1 Welfare and GDP impacts of Crossrail
Benefits Welfare DGP(£m) (£m)
Business time savings 4 847 4 847Commuting time savings 4 152Leisure time savings 3 833Total transport user benefits – conventionalappraisal 12 832
Increase in labour force participation 872People working longer 0Move to more productive jobs 10 772Agglomeration benefits 3 094 3 094Increased competition 0 0Imperfect competition 485 485Exchequer consequences of increased GDP 3 580Additional to conventional appraisal 7 159Total (excluding financing, social and
environmental costs and benefits) 19 991 20 069
Source: UK Department for Transport (2005).

a set of data from complementary sources, but it produces overall resultsthat are not dissimilar from the full modelling approach of Oosterhavenand Elhorst (2003) and Elhorst et al. (2004) discussed above.
However, care must be taken not to assume that every new infrastructureproject will produce wider benefits on this scale. Most of the studies wehave discussed above are ex-ante modelling studies of projects which havenot yet been developed. Hay et al. (2004) have shown, in a rare ex-post studyof impacts, how a very significant mega-project, the Channel Tunnel, hasnot produced significant wider benefits, at least on the regional economiesclose to the tunnel. In fact it is suggested that any wider benefits are so dis-persed and so long term as not to be easily detectable.
Most appraisal methods have been developed for simple link improve-ments. Such methods require the definition of a well-behaved demandfunction for a clearly defined link or origin–destination pair in order toassess the user benefits. Major infrastructure developments raise the ques-tion of how to handle network effects. This is not just an issue that arisesin the case of how to measure the added value of a network such asthe European Union’s Trans-European Networks. Major infrastructures,particularly fixed links such as the Channel Tunnel, have widespread reper-cussions on the networks they link together, causing a significant redistri-bution of traffic. This goes beyond the question of simply recognisinginduced traffic as it can lead to a complex interaction with the economy inthe way discussed earlier in this chapter. This complexity precludes asimple method of handling such effects and, as Laird et al. (2005) haveargued in a detailed analysis of the issue, these need to be considered on acase-by-case basis.
The identification of these network effects may also be critical in identify-ing the most appropriate sources of finance for such mega-projects. MostCBAs ignore the origin of the funds used to finance the project. The assump-tion is generally that if a CBA is being carried out, then the main source offunding is the public sector, in which case the only real consideration is therelevant discount rate, which must reflect both the social time preference andthe marginal cost of the public funds used. It is usually (implicitly) assumedthat such funds are raised by some form of lump-sum tax that does notdistort the allocation of resources elsewhere in the economy. Where taxes areraised otherwise, for example via an income tax, there may be further com-plications (see, for example, Venables, 2004). If a new transport infrastruc-ture leads to an increase in the size of labour-market areas and an increasein productivity, and hence increased wage rates, then the increased tax takemay have an effect on the willingness of workers to respond to the new situ-ation. If the tax falls mainly on employers through some form of payroll tax,then the willingness of employers to respond to the new situation may
Cost–benefit analysis and the wider economic benefits 79

change. Such a situation may be changed if any increase in such taxes ishypothecated to the transport improvements so that beneficiaries see thatthey are contributing directly to the improvement.
Where the funding needs to go outside the public sector to involve privatefinance, either independently or through some form of public–private part-nership, identifying the beneficiaries may be critical to making the financeavailable (see Vickerman, 2007a; 2007b, for a further discussion). Privateinvestors may be interested in the overall rate of return they will receive onthe project, but may also need to justify it in terms of the distribution ofthose benefits. The distribution of benefits may thus become a key elementin the appraisal process.
4.5 CONCLUSIONS
There are three clear conclusions from the discussion in this chapter:
1. Significant wider economic effects which can be identified from large-scale transport infrastructure mega-projects that cannot be capturedby conventional CBA methods, which concentrate on the change in theconsumers’ surplus of users.
2. The nature of these economic effects will vary considerably betweenprojects, in both magnitude and direction.
3. Although methods exist to capture these effects, principally the devel-opment of spatial computable general equilibrium models, these arecomplex and demand significant data resources, which means that theymay only be viable in cases of mega-projects.
This implies that for many small projects a conventional CBA mayremain the most effective means of decision-making. This is not to arguethat wider benefits are in any way proportional to the scale of the project.It is quite feasible that a very large investment may be able to capture vir-tually all of its benefits as user benefits, for example where any widerimpacts are very widely dispersed and there is little scope for the gener-ation of agglomeration effects or significant impacts on local labourmarkets.
The overriding conclusion is that there is unlikely to be any possibility ofadopting simple rules of thumb for determining whether a project needs awider evaluation than CBA or what that might mean in the way of poten-tial additional benefits. The nature and extent of imperfect competition bysector at the regional level and the scope for thickening labour marketsthrough better accessibility are likely to be the key indicators. Both of these
80 Management characteristics and cost–benefit analysis

require more and better data than are currently available at the regionallevel in most cases.
REFERENCES
Aschauer, D.A. (1989), ‘Is public expenditure productive?’, Journal of MonetaryEconomics, 23: 177–200.
Biehl, D. (ed.) (1986), The Contribution of Infrastructure to RegionalDevelopment, Luxembourg: Office of Official Publications of the EuropeanCommunities.
Biehl, D. (1991), ‘The role of infrastructure in regional development’, in R.W.Vickerman (ed.), Infrastructure and Regional Development, European Research inRegional Science, Vol. 1, London: Pion.
Bröcker, J. (2004), ‘Computable general equilibrium analysis in transportationeconomics’, in D.A. Hensher, K.J. Button, K. Haynes and P. Stopher (eds),Handbook of Transport Geography and Spatial Systems: Handbooks in TransportVolume 5, Oxford: Elsevier.
Bröcker, J., R. Meyer, N. Schneekloth, C. Schürmann, K. Spiekermann and M.Wegener (2004a), Modelling the Socio-economic and Spatial Impacts of EUTransport Policy, IASON (Integrated Appraisal of Spatial, Economic and NetworkEffects of Transport Investments and Policies) Deliverable 6. Funded by 5thFramework RTD Programme, Kiel/Dortmund: Institut für Regionalforschung,Christian-Albrechts-Universität, Kiel/Institut für Raumplanung, UniversitätDortmund.
Bröcker, J., R. Capello, L. Lundquist, T. Pütz, J. Rouwendal, N. Schneekloth,A. Spairani, M. Spangenberg, K. Spiekermann, R. Vickerman and M. Wegener(2004b), Territorial Impact of EU Transport and TEN Policies, FinalReport of Action 2.1.1. of the European Spatial Planning ObservationNetwork ESPON 2006, Kiel: Institut für Regionalforschung, Christian-Albrechts-Universität.
Ciccone, A. (2002), ‘Agglomeration effects in Europe’, European Economic Review,46: 213–27.
Dodgson, J.S. (1973), ‘External effects in road investment’, Journal of TransportEconomics and Policy, 7: 169–85.
Dupuit, J.A. (1844), ‘De la mesure de l’utilité des travaux publics’, Annales des Pontset Chaussées, 8.
Elhorst, J.P., J. Oosterhaven and A.E. Romp (2004), ‘Integral cost–benefit analysisof maglev technology under market imperfections’, SOM Research Report,University of Groningen, available at http://irs.ub.rug.nl/ppn/268887764.
Fishlow, A. (1965), American Railroads and the Transformation of the Ante-BellumEconomy, Harvard Economic Studies, Vol. 127, Cambridge, MA: HarvardUniversity Press.
Fogel, R.W. (1964), Railroads and American Economic Growth: Essays inEconometric History, Baltimore, MD: Johns Hopkins University Press.
Fujita, M., P. Krugman and A.J. Venables (1999), The Spatial Economy: Cities,Regions and International Trade, Cambridge, MA: MIT Press.
Fujita, M. and J. Thisse (2002), The Economics of Agglomeration, Cambridge, MA:Cambridge University Press.
Cost–benefit analysis and the wider economic benefits 81

Graham, D. (2005), Wider Economic Benefits of Transport Improvements: Linkbetween Agglomeration and Productivity. Stage 1 Report, London: Departmentfor Transport, available at www.dft.gov.uk/stellent/groups/dft_econappr/docu-ments/page/dft_econappr_038895.pdf.
Gramlich, E.M. (1994), ‘Infrastructure investment: a review essay’, Journal ofEconomic Literature, 32: 1176–96.
Gunn, H. (2004), SCGE Models: Relevance and Accessibility for Use in theUK, with emphasis on Implications for Evaluation of Transport Investments,Final Report to Department for Transport, London, Cambridge: RANDEurope.
Hay, A., K. Meredith and R. Vickerman (2004), The Impact of the Channel Tunnelon Kent and Relationships with Nord-Pas de Calais, Final Report to Eurotunneland Kent County Council, Canterbury: Centre for European Regional andTransport Economics, available from www.kent.ac.uk/economics/research/Full%20Report.pdf.
Jara-Diaz, S.R. (1986), ‘On the relations between users benefits and the eco-nomic effects of transportation activities’, Journal of Regional Science, 26:379–91.
Krugman, P.R. (1991), ‘Increasing returns to scale and economic geography’,Journal of Political Economy, 99: 483–99.
Laird, J.J., J. Nellthorp and P.J. Mackie (2005), ‘Network effects and total economicimpact in transport appraisal’, Transport Policy, 12: 537–44.
Lynde, C. and J. Richmond (1993), ‘Public capital and long-run costs in UK man-ufacturing’, Economic Journal, 103: 880–93.
Miyagi, T. (1998), ‘A spatial computable general equilibrium approach for measur-ing multiregional impacts of large scale transportation projects’, in L. Lundqvist,L.-G. Mattsson and T.F. Kim (eds), Network Infrastructure and the UrbanEnvironment: Advances in Spatial Systems Modelling, Heidelberg: Springer:224–44.
Miyagi, T. (2001), ‘Economic appraisal for multi-regional impacts by a large scaleexpressway project’, Tinbergen Institute Discussion Paper TI 2001-066/3,Amsterdam: Tinbergen Institute.
Oosterhaven, J. and J.P. Elhorst (2003), ‘Indirect economic benefits of transportinfrastructure investments’, in W. Dullaert, B. Jourquin and J.B. Polak (eds),Across the Border: Building on a Quarter Century of Transport Research in theBenelux, Antwerp: De Boeck.
Pigou, A.C. (1920), The Economics of Welfare, London: Macmillan.SACTRA (Standing Advisory Committee on Trunk Road Assessment) (1999),
Transport and the Economy, London: Stationery Office.UK Department for Transport (2005), Transport, Wider Economic Benefits, and
Impacts on GDP, Technical Paper, available at www.dft.gov.uk/stellent/groups/dft_econappr/documents/page/dft_econappr_038893.pdf.
Venables, A.J. (2004), ‘Evaluating urban transport improvements: cost–benefitanalysis in the presence of agglomeration and income taxation’, mimeo, LondonSchool of Economics.
Venables, A. and M. Gasiorek (1999), The Welfare Implications of TransportImprovements in the Presence of Market Failure Part 1, Report to StandingAdvisory Committee on Trunk Road Assessment, London: DETR.
Vickerman, R.W. (2000), ‘Economic growth effects of transport infrastructure’,Jahrbuch für Regionalwissenschaft, 20: 99–115.
82 Management characteristics and cost–benefit analysis

Vickerman, R.W. (2002), ‘Transport and economic development’, in Transport andEconomic Development, Round Table 119, Economic Research Centre, EuropeanConference of Ministers of Transport, OECD, Paris: 139–77.
Vickerman, R.W. (2007a), ‘Private sector finance of transport infrastructure:progress and prospects’, in P. Rietveld and R. Stough (eds), Institutions andSustainable Transport: Regulatory Reform in Advanced Economies, Cheltenham,UK and Northampton, MA, USA: Edward Elgar.
Vickerman, R.W. (2007b), ‘Cost–benefit analysis and large-scale infrastructure pro-jects: state of the art and challenges’, Environment and Planning B, 34 (4):598–610.
Cost–benefit analysis and the wider economic benefits 83

5. Mega-projects and contestedinformationHans de Bruijn and Martijn Leijten
5.1 INTRODUCTION
Information is crucial to good decision-making on mega-projects. Nomatter whether such decision-making concerns the technical aspects ofimplementation, the economic and ecological impact or the risks of aproject, it is highly information-sensitive. It seems reasonable to assume thatno proper decision-making can take place without the right information.
The reality tends to be different, however. Many decisions on large infra-structural projects have been insensitive to information. Flyvbjerg et al.have demonstrated the poor quality of cost–benefit analyses (Flyvbjerg,2004; Flyvbjerg et al., 2002; 2003a; 2003b; 2004; 2005). This seems easy toexplain: the proponents of a project have an interest in low-cost estimatesand therefore show behaviour that is qualified as ‘strategic misrepresenta-tion, i.e. lying’ (Flyvbjerg et al., 2002). The remedies often suggested follownaturally from these findings. In some of the literature, we find a decision-istic remedy, consisting of two elements:
1. The right information must, and can, be gathered.2. Decision-making follows analyses; there is no decision-making with-
out the right information and analysis. We find this remedy in the olderliterature (Hall, 1980), but it can also be found in the more recent lit-erature (Bell, 1998).
Other authors point out that it is impossible to gather ‘the right informa-tion’. Flyvbjerg et al. reconfirm a general fact about mega-projects: rarelyis there a simple truth about them. What is presented as reality by one setof experts is, in many cases, ‘a social construct that can be deconstructedand reconstructed by other experts’ (Flyvbjerg et al., 2003a: 61).
In theory, the absence of a ‘simple truth’ and the conclusion that facts tendto be ‘mere’ social constructs may lead to the extreme relativism of ‘anything-goes’ decision-making. ‘Strategic misinterpretations’ or ‘lies’ do not exist in
84

Mega-projects and contested information 85
such a view, because any picture of reality is justified. Information is unableto play its disciplining role; decision-making will degenerate into a free fightbetween proponents and opponents of a project. In such a free fight, infor-mation can freely be ignored or the wrong information can be used to disci-pline the decision-making.
A difficult dilemma arises if such relativism is not an option. On the onehand, there is no ‘truth’ and the decisionistic approach to mega-projects istoo simple. Much crucial information is ‘contested’ at the time of decision-making. It is controversial, disputable, difficult to measure objectively oreven non-existent. On the other hand, researchers should seek informationof the best possible quality. Flyvbjerg’s study we referred to is full of exam-ples (2003: 49–64) of the disastrous consequences of the use of poor infor-mation. In more prosaic terms, although there is no holy grail, we have tocontinue the quest for it.
In this chapter, we focus on this dilemma. First, we shall introduce theconcept of ‘contested knowledge’ (Sections 5.2, 5.3 and 5.4). Then we shallpoint out that the paradoxical effect of denying the contested nature ofinformation may be that the quest for the right information to structuredecision-making will, in fact, incentivise chaotic decision-making (Section5.5). We shall conclude with a number of recommendations for dealingwith contested information and the above dilemma. The essence of theserecommendations is that attention should be paid not only to the substanceof analyses and information that are used, but also to the process of gen-erating these analyses and this information (Section 5.6). Short conclusionsare formulated in Section 5.7.
5.2 WHAT IS CONTESTED INFORMATION?
Douglas and Wildavsky (1983) identify four types of problems of risk thatinfluence decision-making on, for example, mega-projects. Two factors areof the utmost importance in these problems: knowledge and consensus onthe desired prospects (see Table 5.1).
● Tamed problems Problems with a high certainty of the knowl-edge available, i.e. with facts that can be measured objectively.Furthermore, there is consensus on standards and a normative trade-off of standards is possible. These problems are guaranteed to befully solvable.
● (Un)tameable ethical problems Problems with a high certaintyof the knowledge available, i.e. with facts that can be measuredobjectively. However, either there is no consensus on standards or a
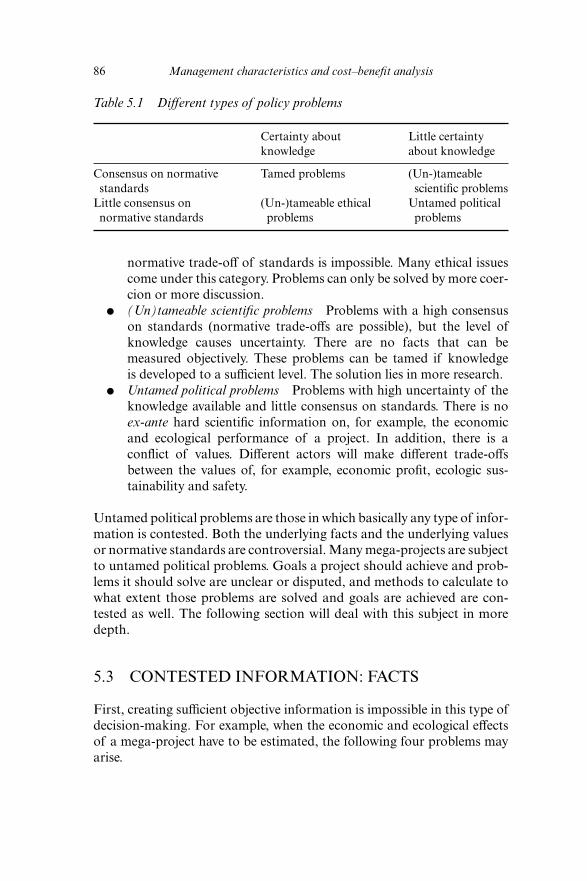
normative trade-off of standards is impossible. Many ethical issuescome under this category. Problems can only be solved by more coer-cion or more discussion.
● (Un)tameable scientific problems Problems with a high consensuson standards (normative trade-offs are possible), but the level ofknowledge causes uncertainty. There are no facts that can bemeasured objectively. These problems can be tamed if knowledgeis developed to a sufficient level. The solution lies in more research.
● Untamed political problems Problems with high uncertainty of theknowledge available and little consensus on standards. There is noex-ante hard scientific information on, for example, the economicand ecological performance of a project. In addition, there is aconflict of values. Different actors will make different trade-offsbetween the values of, for example, economic profit, ecologic sus-tainability and safety.
Untamed political problems are those in which basically any type of infor-mation is contested. Both the underlying facts and the underlying valuesor normative standards are controversial. Many mega-projects are subjectto untamed political problems. Goals a project should achieve and prob-lems it should solve are unclear or disputed, and methods to calculate towhat extent those problems are solved and goals are achieved are con-tested as well. The following section will deal with this subject in moredepth.
5.3 CONTESTED INFORMATION: FACTS
First, creating sufficient objective information is impossible in this type ofdecision-making. For example, when the economic and ecological effectsof a mega-project have to be estimated, the following four problems mayarise.
86 Management characteristics and cost–benefit analysis
Table 5.1 Different types of policy problems
Certainty about Little certaintyknowledge about knowledge
Consensus on normative Tamed problems (Un-)tameablestandards scientific problems
Little consensus on (Un-)tameable ethical Untamed politicalnormative standards problems problems

Data
Data used in calculations are always disputable. In many cases, they aresimply not available, because data about future developments – i.e. fromex-ante analyses – just do not exist; data are mere expectations or predic-tions. Flyvbjerg et al. also acknowledge the contested character of data bystating that ‘mega-project development is currently a field where little canbe trusted, not even – some would say especially not – numbers producedby analysts’ (Flyvbjerg et al., 2003a: 5). They attribute the distrust fully towrongdoing, however. As we saw in Section 5.1, this is not always the onlyvalid explanation. Although the use of data from ex-ante analyses for deci-sion-making may be acceptable in practice, the fact that it describes a futurestate automatically makes it anything but facts and therefore contestable,no matter how fair-minded an analyst may be. This makes any use of datain decision-making, obtained either justly or unjustly, automatically dis-putable. A railway project, for example, depends on factors such as trans-port volume, economic growth and the development of competing modes;both decision-making and construction take many years. Data used withregard to these variables are always disputable. Some private projects wherethe owner himself made the cost–benefit analysis show that wrong data arenot always the result of wrongdoing. Private owners do not have an incen-tive to misrepresent estimates, which makes them a good example. The pri-vately built and operated Warnow tunnel in North German Rostock, forinstance, attracts less traffic than estimated by its private owner, which, inhindsight, makes it a bad investment (Ostseezeitung, 2004).
Methods
Another question is what method is used to calculate the findings from ananalysis. Different actors tend to use different methods as they regard themethods of other actors as less suitable. The views of the various partiesabout the economic effects of a mega-project – both direct and indirect –often differ sharply, because each may adopt different calculating methodsin the cost–benefit analysis. Given the difference in views, reaching scientificconsensus about the method by which the effects are best calculated maythen appear to be impossible.
The different methods may then lead to completely different conclusionsabout the societal feasibility of a project. There are examples of attemptsto arrive at a joint analysis that resulted in academic discussions aboutthe calculation of indirect effects (Ministerie van Verkeer en Waterstaat,2004).
Mega-projects and contested information 87

System Boundaries
The third question concerns the system boundaries: when we consider theeffects of an infrastructural decision, how broadly will the system bedefined? In most cases, the effects included in cost–benefit analyses arethose on a country or state as a whole. However, proponents of certainregionally orientated projects may point out that the value of the infra-structure they propose lies in the shift of jobs and people within the countryor state (for instance in order to achieve economic growth in one region inparticular). If this can be counted as a positive effect (although, on balance,there is hardly any effect on the country or state as a whole), the questionof the system boundaries becomes even more crucial. The point of depar-ture may be the effect on the immediate surroundings of the infrastructure,but also the effect on the areas further away, or even the entire region. If thedecision is made to account for the effects on the region, the decision-makers may ignore the fact that areas in the immediate proximity of aninfrastructure line (such as a motorway or railway) absorb economic activ-ity from areas in the same region, but located further away from a motor-way exit or railway station. Including those peripheral or deprived areas inthe economic analyses will, of course, present a picture that is completelydifferent from the one that emerges when the system boundaries of theanalysis are drawn more narrowly.
Moreover, the wider the system boundaries are, the greater the uncer-tainties will be. The effect of a high-speed rail link on the immediate sur-roundings of a railway station proves to be easier to calculate than the effecton the area on a greater scale level. In the case of high-speed rail links inFrance and Japan, the expected positive economic effect round the railwaystations was indeed found, but there was hardly any effect on the wider areaas economic activities moved from the city’s surroundings to the immedi-ate proximity of the high-speed railway station. This effect appeared forexample in and around the French city of Lyon after the opening of theParis–Lyon TGV (train à grande vitesse) connection (Bonnafous, 1987;Rietveld et al., 2001).
Optimisations
Finally, there is the issue of optimisation of the desired effects. Decision-making about mega-projects tends to be decision-making in which severaloptions have to be compared. An important question in analyses of thiskind is what possibilities the various modes offer for further optimisation:what innovative potential does the mode have, what are the possibilities fora mode to improve the economic and ecological performance? At one stage,
88 Management characteristics and cost–benefit analysis

mode A may score better than mode B, but if mode B has far more innov-ative potential, it may be attractive to opt for mode B. Again, the problemhere is easy to see: optimisations depend on a large number of variables,which cannot be measured objectively, so it is difficult to determine theinnovative potential.
5.4 CONTESTED INFORMATION: NORMATIVESTANDARDS
In addition to this question about facts, a normative question arises in theevent of contested knowledge. Decision-making about mega-projectsalways concerns a trade-off between different interests, and consensusabout this trade-off is usually lacking. If we focus on the example of theeconomic and ecological performance of a mega-project, two trade-offissues arise, even when ‘scientific analyses’ have been made: a trade-offwithin the analysis and a trade-off between analyses.
A Trade-off Within the Analysis
For example, an ecological analysis may show that the construction ofline infrastructure reduces CO2 emission, but makes a heavier demandon scarce resources. This requires a trade-off. Which is more important?Similar issues arise in the event of an economic analysis. Although a projectmay bring economic growth, it may do so mainly in the segment of thehighly educated, while the area served may need jobs for unskilled workers.Which is considered more important? Of course, this does not involve asimple trade-off between two components. In many cases, both economicand ecological analyses have a large number of components that have to beconsidered. The magnetic levitation (maglev) train connection between theChinese city of Shanghai and its airport Pudong was very expensive andthere were considerable technical uncertainties and even problems when theline was built. Once in use, it appeared to attract fewer travellers thanexpected or hoped. The Chinese government nevertheless attached greatvalue to its construction, as it was the first commercial maglev railway linein the world, and many still consider this a dominant value (AssociatedPress, 2004).
A Trade-off Between Analyses
This concerns the question of how to weigh the findings from differentanalyses against each other. Such a question can hardly be formulated
Mega-projects and contested information 89

objectively, and depends heavily on political views and interests. A projectmay for example have a positive economic effect, but a negative effect onthe natural environment (scenic values would be harmed). If scenic beautyis an asset of the region concerned, the value of the natural environmentmight be considered more important than economic growth. Apart fromthe fact that all these effects are difficult to measure objectively, the ques-tion about the trade-off arises: how can we weigh economic, ecological andpossible other effects against each other? This is a normative question, forwhich there is no unambiguous method. The generally used cost–benefitanalysis method monetarises all effects. Although experts in many coun-tries agree that such an analysis is the proper instrument for this, decision-makers may attribute higher values to one effect than to the other.The region may be economically weak and the decision-makers mightthen consider the natural environment subordinate to the economy.Cost–benefit analyses do not take such normative issues into account.Both the trade-offs by politicians and the cost–benefit analyses may thenbe contested.
The first conclusion here must be that, although information is crucial toproper decision-making in complex projects of this kind, there is eitherhardly any objective information or there is none at all: information is‘contested’.
An important mechanism may be added. The more the political struggleround a mega-project increases, the more the amount of objectively estab-lished information will decrease (see also Noordsij and De Bruijn, 2004)because the more different views there are about the desirability of a mega-project, the more incentives there will be for the parties involved to regardvery critically analyses that are being conducted. A party that is fiercelyopposed to the construction of a mega-project will closely scrutinise anyanalysis that appears and check what data were used, what system bound-aries were used, how the issue of optimisation was dealt with, whatmethods were used, and how the trade-off was made. The point is now that,given the contested nature of information, such a party will usually findsufficient ammunition to question the authority of the analysis.
5.5 CONTESTED KNOWLEDGE AND DECISION-MAKING
Now suppose a simple paradigm is used in mega-projects: correct and earlyinformation will result in good decision-making. Because of the contestednature of information, such a recommendation is insufficient, because, inmany cases, correct and unambiguous information is not available, while
90 Management characteristics and cost–benefit analysis

the dynamic of decision-making means that by definition it contains manyiterations. If, nevertheless, too much emphasis is placed on the requirementof good and early information supply, the following effects may beexpected.
Accumulation of Contested Information
In the first place, it will produce soft information, which is neither author-itative nor sufficiently useful for decision-making. Such a conclusion mayraise a call for even more information, to make the whole of the infor-mation no longer soft and insufficiently authoritative. This will result inan immense information overload: piles of reports that, eventually, stillfail to provide the right information and, in the worst case, trigger a callfor even more information. This may result in a ‘report war’. As long asany debate is possible about data, methods, system boundaries and opti-misations, there is no reason to assume that the next analysis will beauthoritative if it is not agreed clearly beforehand how it will be set upand how the main actors will be involved in the process. These actors arenot only the experts on cost–benefit analyses; they are also project-specific stakeholders. These stakeholders will have to accept the findingsof the analysis because they have the power to influence the decision-making. There is every risk that they will not accept these findings if theyhave not been able to participate in the process of analysis. In addition,these stakeholders have ‘local knowledge’, which might be relevant to theanalysis.
A good illustration of the need to involve these stakeholders is the setof new directives for cost–benefit analyses (OEI directives),1 designedby Dutch experts and representatives of the government departments.Project-specific stakeholders were not involved systematically in theprocess of analysis, which led them to make their own analysis. This is notso difficult, because even the most advanced directives will leave room fordiscussion. The 2004 update of the OEI, for example, acknowledges thatthere are different methods to measure indirect project effects. Whichmethod should eventually be used in which situation depends on the kindof indirect effects that can be expected, the kind of infrastructure for whichthe effects must be analysed and the economic conditions in which theeffects take place (Ministerie van Economische Zaken, 2004). It is obviousthat different actors will have different opinions on these issues, and thatproject-specific stakeholders that have not been involved in the process ofanalysis will use this room to criticise the findings. Actors usually onlyaccept information as authoritative if they have been involved in theprocess of problem formulation and problem solution. These actors insert
Mega-projects and contested information 91

their own information and values. This leads to ‘negotiated knowledge’(Salter, 1988; Jasanoff, 1990; De Bruijn and Heuvelhof, 2000; De Bruijnet al., 2002).
A Variety of Truths
In the second place, the fact that much information is either not authorita-tive or conflicting will cause each party to collect its own reports andfacts. This may trigger a struggle of schools between various institutes orscientists. Given all these private views of political decision-makers’ orscientists’ predilections for particular models and data, everybody willultimately put together their own facts. The call for more and correct infor-mation will thus politicise the decision-making rather than objectivise anddepoliticise it. Everybody has their own facts and causalities, and feels thatonly they are right.
This makes the quest for the right information sensitive for the ‘strategicmisrepresentation, i.e. lying’ of Flyvbjerg et al. When a particular party –an external consultant, for example – conducts an analysis and it is certainbeforehand that it will influence the decision-making (as in the proposal ofFlyvbjerg et al.), there will be strong incentives and possibilities for othersto criticise these analyses. In the dynamic that will then develop, thesecritics will, in response, conduct their own analyses. The step to ‘strategicmisrepresentation’ is then just a small one. The quest for correct informa-tion, although information is contested in itself, will have led to far-reaching reservations about the information. Concluding, the ‘lying’ isparticularly problematic from an ethical point of view. For the conse-quences it does not really matter whether an actor is lying or not; in anycase the outcome of analyses can and will be disputed.
In the latter situation, the risk is that the decision-making about mega-projects will turn into a ‘free fight’: wide-ranging reservations about theinformation and merely a conflict of views and interests; or the nationalgovernment (as the main financier) makes a discretionary decision, butthen the decision itself will be contested (see Figure 5.1).
5.6 HOW TO DEAL WITH THE CONTESTEDNATURE OF INFORMATION
The above prompts a dilemma. On the one hand, information is alwayscontested. Consequently, the idea that all information should be gatheredfirst and decisions should be made subsequently is too simple. On the otherhand, the contested nature of information may lead to an undesirable
92 Management characteristics and cost–benefit analysis

qualification of the significance of the right information and be a strongincentive for ‘strategic misrepresentation, i.e. lying’. The question is how weshould deal with this. How can we organise the information-gathering andthe analysis so as to evade this dilemma? In our view, the essence of a strat-egy comprises the following elements.
Need for Procedural and Interactive Rationality
Lindblom and Cohen (1979) and Wildavsky (1980) distinguish betweenanalytical rationality and interactive and procedural rationality. Whereasanalytical rationality uses a purely cognitive analysis, interactive andprocedural rationality concentrates on interpersonal relationships and com-munication processes with elements such as debate, deliberation and con-sultation (Lindblom and Cohen, 1979; Wildavsky, 1980; Van de Graaf andHoppe, 1996). The essence of this is that, in a process of interaction, actorsexchange their views on, for example, the data and system boundaries to beused, discuss them and try to reach a joint perception (interactive rational-ity). In the interest of a proper process, they agree a number of rules of thegame or a procedure (procedural rationality). We will deal with this in moredepth in the following subsections.
Emergence of ‘Negotiated Knowledge’
The result of a process of interaction is called ‘negotiated knowledge’:findings about which the participating actors agree.2 The essence is thatparticipants should conduct a structured debate. Suppose the ecological
Mega-projects and contested information 93
Figure 5.1 Sequence of events that lead to decision-making as a free fight
Call for the right information
Not authoritative/overload
Reservation about theinformation
Decision-making as a free fight
impact of a new railway line has to be established. This dialogue may takethe following course:
● There is dissensus between experts about the ecological impact.● The experts debate the data, the system boundaries, the method they
will use and the way they will reach a trade-off between values.● They may manage to conclude this debate successfully and reach
agreement.● If not, they may conduct a ‘sensitivity analysis’: how sensitive are the
findings from the analysis to the differences of opinion between theexperts?
● If the findings prove to be highly sensitive to these differences, theymay focus on ‘opportunities for improvement’: can they think of anymeasures that might limit the ecological impact and that may beinteresting, regardless of views on data, system boundaries, methodand values?
● If the findings are highly sensitive to the differences, and if there isno consensus about opportunities for improvement, experts canfind out whether there is consensus about particular findings andopportunities for improvement, because there will hardly ever betotal dissensus. Given this partial consensus, they may then pro-pose decisions of a ‘no-regret’ nature (Etzioni, 1989). No regretmeans that the decisions in question are acceptable from any per-spective.
● ‘Third parties’ may be brought in during each of these steps. Supposethere is dissensus about data, system boundaries and methods;suppose sensitivity analysis and opportunities for improvement bringno solution, leading to a deadlock. In such a situation, the expertsmay be asked to formulate this difference of opinion as accurately aspossible. An expert third party may then be asked to give a judge-ment. This third party is not so much the arbitrator that decidesabout the dispute between the experts, but it may contribute newinsights, breaking the deadlock between the experts and giving thedebate a new chance of success.
The idea behind this procedural rationality is threefold. In the first place,structured interaction leads to unfreezing: experts become sensitive toother views on data, system boundaries, methods and values. Unfreezingcreates room: those who are able to put their own views into perspectivehave the room to take the views of others into account. In the second place,if there is unfreezing, interaction is more than just challenging the opinionsof other experts. Interaction may also lead to ‘co-creation’ (Teisman, 2001):
94 Management characteristics and cost–benefit analysis

the joint creation of new knowledge, for example by improving datasets oradapting existing methods.
In the third place, a process of interaction gives rise to new relationshipsand interdependencies between the participants. This makes it difficult forthe participants to withdraw from the process, which might imply contemptof other participants and harm relations with them. In other words, theprocess creates incentives for cooperative behaviour, which promotes thedevelopment of negotiated knowledge.
Results of Interaction: Types of Negotiated Knowledge
Negotiated knowledge of course has a certain variety. Discussions aboutmega-projects are complex, and are always multi-issue analyses. Ecologicalor economic analyses, for example, always contain a large number ofsubtopics, each requiring analysis. The degree of consensus may differ foreach subtopic, and may take a number of forms:
● total consensus about the findings for each subtopic;● partial consensus about the findings for each subtopic;● total dissensus about the findings for each subtopic.
If there is either partial or total dissensus about the findings, there may beconsensus about opportunities for improvement or no-regret decisions.This increases the variety of possible findings:
● partial consensus or dissensus on findings, but consensus or oppor-tunities for improvement;
● partial consensus or dissensus on findings and opportunities forimprovement, but consensus on no-regret decisions;
● total dissensus on findings, opportunities for improvement and no-regret options.
All sorts of other variants are possible (De Bruijn and Porter, 2004).Participants can also make agreements on how to define ‘consensus’ (theremight also be consensus if some participants agree to disagree: they dis-agree with the findings, but they agree not to block the consensus amongother participants). The message here is that the outcome of a process ofinteraction is hardly ever binary (either consensus or dissensus), but offersvariety: there are hard findings and there are findings that are less hard. Onthe one hand this seems disappointing, but it makes the process also attrac-tive to decision-makers. Suppose there were total consensus between theanalysts. This would leave no room at all for decision-makers and wouldmake the process very unattractive for them. The variety of findings leaves
Mega-projects and contested information 95

them ‘decision-making space’, which is very important for the acceptanceof an interaction process. There is no longer a free fight, but there is stillroom for a fight between interests.
Need for Process Management
If the way out of the dilemma mentioned in the introduction of this sectionis to create negotiated knowledge, a number of important proceduralquestions arise, such as:
● Which experts will conduct the analyses and be involved in the inter-action process?
● What will the role of stakeholders be? How will they be involved inthe interaction process? For example, how will they be able to asktheir questions and offer their criticism during the research?
● What is the research agenda? How will interim findings be reported?How will the discussion about system boundaries, data, etc. take place?
● If a deadlock arises, how shall we deal with it? How shall we reporton it? How can we prevent a deadlock on an issue from blocking thewhole process?
● How shall we keep the process from proceeding too slowly?● How shall we report on the process?● How shall we deal with new and unforeseen developments?
These and similar questions call for a set of rules of the game that theexperts involved in the interaction process should observe. This set of rulesis called a process design; managing such a process is called process man-agement (De Bruijn et al., 2002).
A process design is necessary because it structures the interaction betweenexperts. Interaction is necessary because there is no one single truth inprocesses with contested information. Moreover, such a design may boostthe authority of the negotiated knowledge. If the rules of the game are fairand allow all players – be they experts or stakeholders – to participate informing the negotiated knowledge, their commitment to it will be strongeror it will at least be less easy for players to distance themselves from it.
An important question is, of course, who will be allowed to participateand how participants will reach decisions. We cannot give a detailed answerto these partly operational questions (see De Bruijn et al., 2002; De Bruijnand Ten Heuvelhof, 2003), but the essence of the answer is twofold:
● The participants should be a representative reflection of types ofexpertise and views; lack of such representation may harm the process.
96 Management characteristics and cost–benefit analysis

● An important aspect of the decision-making rules is that partiesmust accept them as sufficiently fair. This might imply that they caninfluence them. The initiator of a process may therefore propose thatparticular rules be used, but first submit these rules to the partici-pants for their approval.
Incentives for Setting up a Process
A crucial question is what the incentives are for decision-makers to designa process as described above. The greater the consensus, the more such aprocess will diminish the room for decision-making. Why would a decision-maker, who holds strong views on the desirability of building a railway, forexample, tolerate such a process?
● Because of the broad agenda, i.e. there are many different items onit. A wide agenda takes the complexity of mega-projects into accountand forces different types of experts (for example environmental andeconomic experts) to start a debate with each other. Moreover, thewider the agenda, the greater is the chance that the decision-makerwill still have sufficient decision-making space at the end of theprocess. A wide agenda therefore serves both substantive interestsand the interests of the decision-maker.
● Because of the confrontation between experts. Suppose there is noprocess. Decision-makers will nevertheless be faced with the findingsfrom analysts. There are two differences, however, compared to the sit-uation in which there is a process: (1) researchers who present theirfindings need not face other researchers; and (2) these researchersdecide for themselves when they will present their findings. This maybe highly unpleasant for decision-makers, particularly if these researchfindings are unwelcome to them, are based on controversial assump-tions and methods, and are presented at an inconvenient moment. Aprocess will then be an attractive alternative, because it disciplines thebehaviour of experts.
● Because decision-makers can play a role in the process of interaction.This is pointed out in a number of studies (De Bruijn and Porter,2004; Van Eeten, 1995; 2001). They can play a role in asking criticalquestions of the experts, because decision-makers have their owndata, ‘local knowledge’, knowledge of possible innovations, etc. Thisimproves the quality of the findings.
● Because the process enriches the decision-making. From the per-spective of the decision-maker with strong views, the expert willsometimes play the reactive role of the ‘Mister Noman’: the expert
Mega-projects and contested information 97

tells him what is wrong with the decision. However, a process ofinteraction in which decision-makers can also participate may alsobe attractive to them, because they can ask questions of experts insuch a way that they play a more proactive role. What innovationscan be expected that alleviate the emissions problem? What forms ofsupplementary policy are there that make a rail link more cost-effective? What are the most cost-effective measures to enhance thesafety of a rail link? These and similar questions allocate a proactiverole to the experts and may enrich the decision-making agenda. DeBruijn et al. (2002) mention the example of a political discussionthat focuses on issues A and B and results in a deadlock. The ana-lysts in the process show that issues C and D are far more interest-ing. This is attractive for decision-makers because they do nothave to continue the discussion about A and B, which leads only tostalemate.
● Because of the societal legitimacy. A process of interaction also pro-motes the legitimacy of the decision-making; decision-makers canpoint out that they have involved a great many experts in the decision-making and that these agreed or disagreed on particular points. This,too, serves the interest of the stakeholders, but also the interest of aproper substantive analysis. When there is consensus and decision-makers distance themselves from it, this is difficult to explain to otherstakeholders or to society.
Each of these considerations is slightly ambiguous. On the one hand, theyimply that room is created for a process of interaction to arrive at negoti-ated knowledge. On the other hand, they also serve the interests of thedecision-makers, who retain sufficient room for their mutual struggle ofinterests. However, this is the essence of contested knowledge. On the onehand, it requires a quest for the negotiated knowledge that is necessary. Onthe other hand, where this is impossible, decision-making is a politicalgame, a struggle between interests.
5.7 CONCLUSIONS
A dilemma arises about the necessary information supply in decision-making about mega-projects. On the one hand, there is not ‘one simpletruth’. On the other hand, this conclusion should not lead to ‘anything-goes’ decision-making.
This dilemma requires that, as regards the issue of information supply,attention should be given not only to the substance of the information, but
98 Management characteristics and cost–benefit analysis

also to the process by which information is generated. This process mayresult in negotiated knowledge. Paying attention to the design and the man-agement of such processes may improve decision-making.
ACKNOWLEDGEMENTS
The authors were advisers to the Dutch Parliamentary Commission onInfrastructure Projects. They alone are responsible for this contribution.
The research for this chapter was conducted in the Research Centre forSustainable Urban Areas, Delft University of Technology, The Netherlands.
NOTES
1. OEI � Overview Infrastructure Effects; directive for drawing up societal cost–benefitanalyses (including non-monetary effects), drawn up as an initiative of the DutchMinistry of Transportation, Public Works and Water Management and the DutchMinistry of Economic Affairs (see Ministerie van Verkeer en Waterstaat, 2004;Eijgenraam et al., 2000). Other organisations in various countries make comparableattempts by drawing up guidelines for cost–benefit analyses; for example the EuropeanCommission, for its Trans-European Networks programme (see for instance theHEATCO project at http://heatco.ier.uni-stuttgart.de).
2. An example of the negotiated knowledge solution is the Orange County LandfillSelection Committee’s choice for a landfill location. It is a choice between 17 potentiallocations, to be compared on 16 variables. It tenders its research, expecting to receive anobjective answer on where to site the landfill. The research, however, leads to adifferent outcome. It indicates which judgements are objectifiable and where room fornegotiation exists. The outcome was that in a comparison only four of the 16 variablesproved relevant. Trade-offs on the other 12 would not have led to different locations. Thescores on the remaining four variables were input for negotiation. See Miranda et al.(1996).
REFERENCES
Associated Press (2004), ‘Shanghai maglev starts operating’, 2 January.Bell, Robert (1998), Les Peches Capitaux de la Haute Technologie, Paris: Editions
du Seuil.Bonnafous, A. (1987), ‘The regional impact of the TGV’, Transportation, 14: 127–37.Bruijn, J.A. de and E.F. ten Heuvelhof (2000), Networks and Decision Making,
Utrecht: Lemma.Bruijn, H. de and E. ten Heuvelhof (2003), ‘Policy analysis and decision making in
a network. How to improve the quality of analysis and the impact on decisionmaking?’, Impact Assessment and Project Appraisal, 20 (4): 232–42.
Bruijn, H. de and A. Porter (2004), ‘Education of a technology policy analyst – toprocess management’, Technology Analysis and Strategic Management, 16 (2):261–74.
Mega-projects and contested information 99

Bruijn, H. de, E. ten Heuvelhof and R. In ‘t Veld (2002), Process Management: WhyProject Management Fails in Complex Decision Making Processes, Boston, MA:Kluwer Academic Publishers.
Douglas, M. and A. Wildavsky (1983), Risk and Culture: An Essay on the Selectionof Technological and Environmental Dangers, Berkeley, CA: University ofCalifornia Press.
Eeten, M.J.G. van (1995), Ontwerp van een strategie naar aanleiding van majeureinfrastructurele en bestuurlijke ontwikkelingen [Design of a strategy in response tomajor infrastructural and administrative developments], Delft.
Eeten, M.J.G. van (2001), ‘Recasting intractable policy issues: the wider implica-tions of the Netherlands civil aviation controversy’, Journal of Policy Analysisand Management, 20 (3): 391–414.
Eijgenraam, C.J.J., C.C. Koopmans, P.J.G. Tang and A.C.P. Verster (CPB/NEI)(2000), Evaluatie van infrastructuurprojecten: Leidraad voor kosten–batenanalyse[Evaluation of infrastructural projects: Directive for cost–benefit analysis], TheHague: Sdu Uitgevers.
Etzioni, A. (1989), ‘Humble decision making’, Harvard Business Review, 67 (4):122–6.
Flyvbjerg, B. (2004), ‘International experience with large infrastructure projects’,presentation in the public hearing for the Dutch Temporary Commission onInfrastructural Projects, The Hague.
Flyvbjerg, B., M.S. Holm and S. Buhl (2002), ‘Underestimating costs in publicworks projects’, Journal of the American Planning Association, 68 (3): 279–95.
Flyvbjerg, B., N. Bruzelius and W. Rothengatter (2003a), Megaprojects and Risk:An Anatomy of Ambition, Cambridge, MA: Cambridge University Press.
Flyvbjerg, B., M.K. Skamris Holm and S.L. Buhl (2003b), ‘How common and largeare cost overruns in transport infrastructure projects?’, Transport Reviews, 23 (1):71–88.
Flyvbjerg, B., M.K. Skamris Holm and S.L. Buhl (2004), ‘What causes cost overrunin transport infrastructure projects?’, Transport Reviews, 24 (1): 3–18.
Flyvbjerg, B., M.K. Skamris Holm and S.L. Buhl (2005), ‘How (in)accurate aredemand forecasts in public works projects? The case of transportation’, Journalof the American Planning Association, 71 (2): 131–46.
Graaf, H. van de and R. Hoppe (1996), Beleid en Politiek: Een inleiding tot debeleidswetenschap en de beleidskunde [Policy and politics: An introduction intopolicy science and policy analysis], Bussum: Countinho.
Hall, P. (1980), Great Planning Disasters, Berkeley, CA: University of CaliforniaPress.
Jasanoff, S. (1990), The Fifth Branch: Science Advisers as Policy Makers, Cambridge,MA: Harvard University Press.
Lindblom, C.E. and D.K. Cohen (1979), Usable Knowledge: Social Science andSocial Problem Solving, New Haven, CT: Yale University Press.
Ministerie van Economische Zaken (Ministry of Economic Affairs), Ministerie vanVerkeer en Waterstaat (Ministry of Transportation, Public Works and WaterManagement) (2004), Indirecte Effecten Infrastructuur-Projecten: Aanvulling opde Leidraad OEI, The Hague (Ministerie van Economische Zaken).
Ministerie van Verkeer en Waterstaat (Ministry of Transportation, Public Worksand Water Management), CPB (2004), Aanvulling op de leidraad OEI(Supplement to the OEI directive), 8 parts, The Hague.
Miranda, M.L., J.N. Miller and T.L. Jacobs (1996), Informing Policymakers and the
100 Management characteristics and cost–benefit analysis

Public in Landfill Siting Processes, Princeton, NJ: Institute of Electrical andElectronic Engineers, Technical Expertise and Public Decisions.
Noordsij, R.A. and H. de Bruijn (2004), ‘Informatievoorziening aan de TweedeKamer inzake grote infrastructuurprojecten (Supply of information to Parliamenton large infrastructure projects)’, in Grote Projecten: Inzichten en Uitgangspunten;Achtergrondstudies, Tijdelijke Commissie Infrastructuurprojecten, Tweed Kamer2004–2005, 29.283, nr/10, The Hague: Sdu Uitgevers, pp. 208–31.
Ostseezeitung (2004), ‘Warnowtunnel droht die Pleite’, 6 December.Rietveld, P., F.R. Bruinsma, H.T. van Delft and B. Ubbels (2001), Economic Impacts
of High Speed Trains: Experiences in Japan and France: Expectations in theNetherlands, Amsterdam: Research Memoranda Series, Free University.
Salter, L. (1988), Mandated Science: Science and scientist in the making of publicpolicy, Amsterdam: Kluwer.
Teisman, G.R. (2001), Ruimte mobiliseren voor coöperatief besturen: over manage-ment in netwerksamenlevingen [Mobilizing space for cooperative governing; aboutmanagement in network societies], Rotterdam: Erasmus Universiteit.
Wildavsky, A. (1980), The Art and Craft of Policy Analysis, London: Macmillan.
Mega-projects and contested information 101


PART II
Planning and Decision-Making


6. How to improve the early stages ofdecision-making on mega-projectsHugo Priemus
6.1 INTRODUCTION
The research on decision-making in mega-projects tends to be dominatedby the problem of cost overruns and disappointing operating results(Flyvbjerg et al., 2003; Altshuler and Luberoff, 2004; Pickrell, 1989; 1992;Morris and Hough, 1987; Short and Kopp, 2005; Bell, 1998; Wachs, 1989;1990). This chapter will depart from this trend and explore another theme:the initial stages of decision-making on mega-projects. It is not uncommonin mega-projects for a solution to present itself early – the solution whichsuits the initiators and which then heads off in search of a problem. Hencethe process rarely begins with a proper analysis of the problems involvedand an impartial appraisal of the alternatives.
Often, in the earliest phases, we see lobby groups hard at work mobil-ising support for a particular solution that is thought to be superior.Feasible alternatives are not even put forward, let alone analysed. Anyalternatives proffered by opposing camps further down the line areusually too late. It is not unusual for the government to back the – sup-posedly superior – solution at an early stage. Alternatives suggested byothers in later stages of the process are often whittled down to nothing.This chapter looks at the problem analysis at the initial stage of thedecision-making process and at the general problem of alternatives thatare not generated early on and are therefore mostly not given seriousconsideration.
This chapter argues that, most of the time, the solution precedes theproblem (Section 6.2). Section 6.3 presents the case for a valid problemanalysis as a basis for decision-making. Section 6.4 concentrates on thegeneration and appraisal of relevant alternatives. Section 6.5 focuses onsystems analysis, a well-known and trusted technique which has beenaround since the 1980s but has not been applied nearly enough in practice.Section 6.6 addresses the role of systems analysis in mega-projects. Finally,Section 6.7 presents some conclusions.
105

In this chapter we explain the systems analysis methodology, which ingeneral begins with a detailed problem analysis and leads to an appraisalof alternatives generated to cope with the problems identified. The fact thatsystems analysis is hardly ever applied in the practice of decision-makingon mega-projects is undesirable, as consistent and frequent applicationof systems analysis would certainly pay off, perhaps in combinationwith actor-oriented approaches such as actor modelling, simulation andgaming. Adoption of the systems analysis methodology is strongly recom-mended, in which a problem analysis is conducted right from the start, andin which alternatives are generated at an early stage, ranked according tothe ex-ante calculations of costs and benefits and in which the ‘best’ alter-native is finally selected.
6.2 JUMPING TO CONCLUSIONS: THEWRONG WAY
At the start of the decision-making process, the focus should be on theproblem, not so much on the solution. In general, one can argue that aproblem equals an objective plus an obstacle to achieving that objective.Generally speaking, the objective of creating an infrastructural connectionin its simplest form is the linking of two points: towns/cities and/or regions.This is usually accompanied by further specification in the form of answersto certain questions: how many people and goods are transported or canbe transported between a and b, and between b and a at present? How manypeople and goods need to be transported between a and b and b and a inthe future (t1, t2, t3 etc.)? How should this capacity be spread over 24 hours,the week (weekdays, weekend) and the seasons? How should the capacityof the existing infrastructure be adapted to achieve this? Is a large newinfrastructure project needed to achieve this end? How far does the capac-ity of certain modalities need to be modified? (For the transport of people,these are cars, trains and planes and, for short distances, buses, trams, themetro and bikes. For goods, the modality options are trucks, trains, inlandshipping, coastal shipping, planes and pipelines.) Do the traffic prognosesand the uncertainties that surround them make a large infrastructureproject necessary all at once or would it be more appropriate to expand thecapacity in phases?
In these situations it is essential not only to look at the linear connectionbetween a and b; attention also needs to be paid to the level of infrastruc-ture networks (see the publications by the Roundtable of EuropeanIndustrialists on missing links and missing networks: Roundtable ofEuropean Industrialists, 1984; 1991). Ultimately, the objectives seldom
106 Planning and decision-making

relate exclusively to a link between two points; the aim is also to boost theeconomy in one or more regions. A generous helping of wishful thinkingoften comes into play at this point.
6.3 MOVING TOWARDS A VALID PROBLEMANALYSIS
An infrastructure project is, at best, a solution. This implies that there areone or more problems to which an infrastructure project is the most expe-dient response. A valid problem analysis is essential in order to determinewhether a proposed alternative is effective, efficient and legitimate. The firstquestion that should be asked is: what is or what are the problem(s)? Andthen: what is the problem now and what is it likely to become in the shortand the long term? And finally, who is affected by the problem? A problemfor one actor might be a solution for another actor.
Pretty soon the problem will emerge in the form of locations that areinsufficiently accessible at present or in the future. This may go hand inhand with an increased risk of stagnation (measured in lost vehicle hours)due to growing congestion. Sometimes there are additional health and/orsafety problems as a result of emissions (air quality).
As all of this impinges on mobility, people tend to see the problem inwider terms than just accessibility or stagnation. They refer to the declinein residential and commercial appeal, and the prospect of a deterioratingliving climate, reduced quality of life and a decline or stagnation in busi-ness leading to job insecurity and uncertain economic growth. This implicitconnection between mobility and the living and economic climate is usuallydifficult to substantiate and often bears witness to a long list of policyambitions which cannot be supported by valid insights.
In practice, it is barely possible – and usually impossible – to establish acausal relationship between improved accessibility and a boost to theregional economy (Rietveld, 1989; Vickerman, 1989; 2000; Banister andBerechman, 2000).
As problems are often perceived differently by different parties, it is notonly essential to conduct a problem analysis but also to reach the strongestpossible consensus. A generally shared problem analysis enhances the pos-sibility that the selected alternative will still be endorsed by everyone at alater stage. If there is still a difference of opinion on the analysis, it is usuallythe authorised political body that decides on the problems that will serve asthe departure point.
Any later alternatives must be tested against the problem analysis. Hencecertain aspects need to be concretely and promptly specified:
How to improve the early stages of decision-making 107

● the values and criteria;● the objectives of the parties and the political bodies who bear respon-
sibility;● the boundaries and constraints.
The various parties may have different ideas about these issues, so a conflictcan easily arise. The best approach is to identify potential stumbling blocksat an early stage and to establish a workable consensus.
6.4 CONSIDERING ALTERNATIVES
Once the problem analysis has been sorted out, it is time to think seriouslyabout potential solutions. It is best to appraise alternatives in the initialstages. After all, more than one road leads to Rome. An investment projectis not always the right answer, so the Dutch Ministry of Transport, PublicWorks and Water Management (Ministerie van Verkeer en Waterstaat,2004) differentiates between three types of solution related to transportinfrastructure: utilisation, pricing and building. First, attempts can beorganised to make better use of the capacity of the existing infrastructure.Congestion might easily arise on certain routes during the rush hour. Butcan capacity in the opposite direction be enlarged? Or capacity outside therush hours? That is the first question. The second is whether a price tag canbe attached to the use of infrastructure in the form of a user charge, suchas road pricing. Experience has shown that people curtail their use of infra-structure if it costs money. If the price is differentiated in terms of time andplace, pricing can lead to a (better) utilisation. If utilisation and pricing arenot enough, then new infrastructure or expansions to the current infra-structure can be considered.
The ‘construction’ category embraces various alternatives: differentroutes, different modalities (e.g. road, rail, inland shipping), different cross-sections (e.g. two-lane, four-lane, six-lane) and different types of spatial inte-gration (for instance, in order to conserve nature or prevent urban pollution).
Alternatives must not be put forward at the last minute by, for example,only opponents of the plan favoured by the government. Alternatives mustbe systematically recognised at a very early stage.
One classic illustration of a shameful state of affairs is the decision-making in the Netherlands on the Betuwe Link, the dedicated freight raillink between Rotterdam Harbour and the Ruhr Area (TCI, 2004a; 2004b).From the very start, the Dutch government had decided that a dedicatedrail link would be the best (and only) response to the challenge to improvethe hinterland connection between Rotterdam and the Ruhr Area, and to
108 Planning and decision-making

bolster the competitiveness of Rotterdam Harbour. Only in the very latestages were alternatives considered, mostly from opposing groups. Severaloptions were not objectively considered at early stages:
1. Increase the utilisation of the existing rail network.2. Increase the utilisation of inland shipping.3. Increase the capacity of road traffic (by building new lanes and/or
introducing road pricing) and reduce the emissions from trucks at thesame time.
4. Phase the Betuwe Link, giving priority to the western part: theHavenspoorlijn, connecting Rotterdam Harbour and the marshallingyard Kijfhoek.
5. Lay a pipeline between Rotterdam and Germany.6. Accept a lower growth of freight transport to and from the harbour
and restructure the economy of the Rotterdam region: less freight andmore ICT.
With hindsight it is clear that the capacity of the existing rail network wasunderestimated (1), as a result of which phasing (4) would have been abetter, more cost-effective solution. Inland shipping (2) and road trafficwith reduced emissions (3) would also have provided more cost-effectivealternatives. Finally, when the costs of new infrastructure are higher thanthe benefits, it is better not to expand the infrastructure for freight trans-port (6). This last observation is relevant because the Netherlands Bureaufor Economic Policy Analysis concluded that the variable costs of thefreight rail link can be covered by income, but that the investment costs willprobably never be covered (CPB, 2004).
A similar situation arose during the initial stages of the decision-makingprocess on the Zuiderzee Link: the proposed high-speed railway betweenAmsterdam and Groningen. The main objective of this dedicated line was toincrease the economic strength of the northern provinces of the Netherlands.Calculations by the Netherlands Bureau for Economic Policy Analysis (CPBet al., 2002) indicated that the regional economy would barely improve andthat only a limited number of jobs would be created in the north afterimprovements of the rail connection to Groningen. If the primary aim wasindeed to revitalise the economy in the north, then the strategic question waswhether a rail link was the most cost-effective means of achieving it.
There are countless alternatives which were never explored and appraised,such as:
● promote urban renewal and the restructuring of business areas in thenorth;
How to improve the early stages of decision-making 109

● promote rural vitality by stimulating economic activities in ruralareas in the north;
● improve the road infrastructure in and to the north;● improve the digital accessibility of the north;● stimulate the knowledge economy in the north.
The decision-making process should have begun by identifying the prob-lems and then appraising the options. Instead, it went in search of plausi-ble variations on the theme of one favourite solution. No steps were takento weigh up the alternatives even after the publication of the TCI report(TCI, 2004a). The analysis that was carried out after the publication of theTCI report only considered a few alternatives for improving the rail infra-structure and one new proposal: a track for an automatic Superbus, devel-oped by Professor Wubbo Ockels. Only recently has a broader analysis beenannounced, including alternatives outside the realm of improving trans-port infrastructure.
One factor that tends to be underestimated is the effect of prices andpricing policy. The demand for mobility cannot be satisfied without a price-tag. Without a price, demand tends to be limitless. So, the higher the price,the lower the demand. This is where the substitution of one modality foranother becomes crucially important. If, for example, discounts bring abouta sharp fall in the cost of air travel, then the demand for plane tickets willprobably increase dramatically, but the demand for high-speed rail travelcould plummet at the same time. The government plays a key role here –wittingly and unwittingly – through taxation and policy on user charges.Airlines do not pay VAT on kerosene, the concept of ‘user charge’ has beenintroduced into the train system, and many countries are considering road-pricing. Pricing-policy initiatives like these can have a deep impact on thedevelopment of mobility through a particular modality such as the train.Evaluation studies ex post can determine how the use of infrastructure reactsto user charges (Affuso et al., 2003; Bonnafous, 2003; Bonnafous and Crozet,1997; Nilsson, 1992; Quinet, 2000; Rothengatter, 2000; Priemus, 2005).
6.5 SYSTEMS ANALYSIS
For decades, systems analysis methodology has shown how decision-making on a new policy or project needs to begin by defining the problem.Certain questions need to be asked: what is the nature of the problem? Whois affected? Why is it a problem for one or more players?
The classic systems analysis procedure is shown in Figure 6.1. InSection 6.6 we will apply it to decision-making on a mega-project.
110 Planning and decision-making
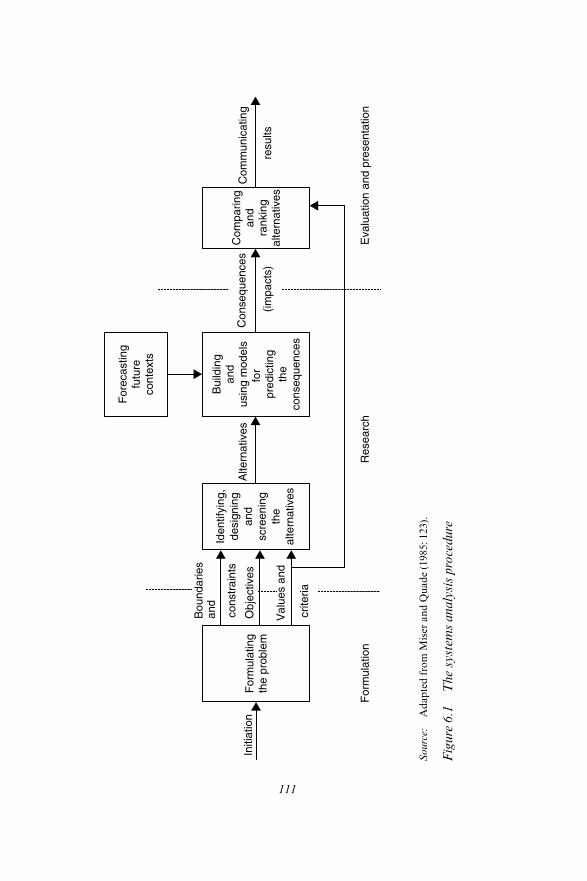
111
Sou
rce:
Ada
pted
fro
m M
iser
and
Qua
de (
1985
:123
).
Fig
ure
6.1
The
sys
tem
s an
alys
is p
roce
dure
Initi
atio
n
Bou
ndar
ies
and
cons
trai
nts
Obj
ectiv
es
Val
ues
and
crite
ria
Alte
rnat
ives
Con
sequ
ence
s
(impa
cts)
Com
mun
icat
ing
resu
lts
For
mul
atio
nR
esea
rch
Eva
luat
ion
and
pres
enta
tion
For
mul
atin
gth
e pr
oble
m
Iden
tifyi
ng,
desi
gnin
gan
dsc
reen
ing
the
alte
rnat
ives
For
ecas
ting
futu
reco
ntex
ts
Bui
ldin
gan
dus
ing
mod
els
for
pred
ictin
gth
eco
nseq
uenc
es
Com
parin
gan
dra
nkin
gal
tern
ativ
es

Figure 6.1 is drawn from Findeisen and Quade (in Miser and Quade,1985: 117–49), who provide an introduction and overview to the method-ology of systems analysis. Findeisen and Quade (1985) argue that besidesformulating the problem, it is necessary to define the values and crite-ria, and map out the boundaries and constraints. The next step is todevise solutions that best meet the objectives, values and criteria of thedecision-maker and other stakeholders, and take account of the bound-aries and constraints. The alternatives are then identified, designed andscreened.
Next, models are built to predict the long- and short-term consequencesof each alternative according to the forecasts for, among others, demo-graphic and economic trends and mobility dynamics. The impacts of eachalternative are quantified on the basis of the models and assumptions.Finally, the alternatives are compared and ranked in advance according totheir impact (costs and benefits). The results of the whole exercise are com-municated clearly and over time. An important dimension is the awarenessand quantification of uncertainties and risks.
Figure 6.2 shows that, in reality, things are much more complicatedthan Figure 6.1 suggests, because many feedbacks with iteration loops arerequired. In addition, interaction between the analysis team and thedecision-maker is essential. Figures 6.1 and 6.2 are basically 20 years old,making it all the more astonishing that systems analysis is so seldom usedin current decision-making on mega-projects.
Systems analysis is still useful as a methodology for decision-making onmega-projects. It stresses for us the crucial importance of meticulous andexhaustive problem analysis at the start of the process and the design, gen-eration, appraisal and ranking of alternative solutions. The decision-makers who apply this procedure will rarely be confronted with solutionssearching for a problem.
6.6 SYSTEMS ANALYSIS AND DECISION-MAKINGON MEGA-PROJECTS
The structure of the decision-making process on infrastructure projects isoften criticised (Teisman, 1998; WRR, 1994; Mackie and Preston, 1998;Priemus, 2004). Several recommendations have been proposed to improvethe decision-making process.
What can systems analysis offer modern-day decision-making processeson mega-projects, such as large infrastructure projects? We follow andexplain the boxes presented in Figures 6.1 and 6.2.
112 Planning and decision-making

113
Not
e:T
he fi
gure
doe
s no
t sh
ow t
he e
ssen
tial
ong
oing
inte
ract
ion
betw
een
the
anal
ysis
tea
m a
nd t
he d
ecis
ion-
mak
er.
Sou
rce:
Ada
pted
fro
m M
iser
and
Qua
de (
1985
:124
).
Fig
ure
6.2
The
sys
tem
s an
alys
is p
roce
dure
wit
h it
erat
ion
loop
s
Itera
tion
to r
econ
side
r th
e co
nstr
aint
s, o
bjec
tives
, or
crite
ria
Bou
ndar
ies
and
Obj
ectiv
es
Val
ues
and
crite
ria
Alte
rnat
ives
(impa
cts)
Com
mun
icat
ing
resu
lts
Itera
tion
to im
prov
e al
tern
ativ
es
Itera
tion
to r
efor
mul
ate
the
prob
lem
Itera
tion
to im
prov
eth
e pr
edic
tive
proc
ess
Initi
atio
nco
nstr
aint
sF
orm
ulat
ing
the
prob
lem
Bui
ldin
g an
dus
ing
mod
els
for
pred
ictin
g th
eco
nseq
uenc
es
Com
parin
gan
dra
nkin
gal
tern
ativ
es
For
ecas
ting
futu
reco
ntex
ts
Iden
tifyi
ng,
desi
gnin
gan
dsc
reen
ing
the
alte
rnat
ives
Con
sequ
ence
s

Formulating the Problem
When an infrastructure project is being considered, the problem is usuallyformulated in terms of accessibility. This problem can manifest itself at thelink level and at the network level. Sometimes it also has an economicdimension: perhaps new infrastructure will revitalise or boost the regionaleconomy. A detailed analysis of the problem is both necessary and desir-able at the start of a decision-making process. When different actors per-ceive different problems, energy has to be invested in communication andnegotiations to reach a certain consensus about the problems perceived (seeChapter 5 in this book).
Identifying, Designing and Screening the Alternatives
The experience with the Betuwe Link and the Zuiderzee Link illustrateshow crucial it is that the players identify, design and screen the options atan early stage. There are alternative modalities (train, truck, inland ship-ping), alternative tracks and alternatives in time (including a clear phasingof the alternative projects).
Building and Using Models for Predicting the Consequences
The effects of the alternative projects can only be determined ex ante if real-istic assumptions are made about the length of the period taken intoaccount, the numbers of persons and/or volume of goods to be trans-ported, the price the customers are willing to pay, the investment costs, theprice to be paid for using the infrastructure, the costs of energy and main-tenance for the infrastructure and vehicles, the trend in interest rates andinflation, the financing costs and the costs and distribution of risk. As thisexercise can lead to some heated debates, Flyvbjerg recommends (in TCI,2004a) that the estimates be left to those players who have to bear the risksof under- and overestimation. This recommendation certainly makes sense.
Comparing and Ranking Alternatives
Once the alternatives have been identified and fleshed out and the costs andbenefits (priced and unpriced) have been established in each case, the alter-natives can be ranked. A separate issue altogether is the allocation of thecosts and benefits in time and across the various players. It is not uncom-mon for (some) benefits to accrue to parties – generally known as ‘free-riders’ – who do not bear the costs. Sometimes the government can interveneso that the costs and benefits are redistributed fairly. But it is still perfectly
114 Planning and decision-making

conceivable that different rational players will arrive at a different rankingof alternatives when they consider only their own costs and benefits.
Coping with Surprises and Chaos: a Design Approach
At first glance, the diagram of the system analysis approach looks fairlystraightforward and free of surprises. The description by Findeisen andQuade (1985) takes insufficient account of the fact that a mega-project cantake a very long time to crystallise. Major shifts can take place in the com-position of the public delegations and in the negotiating teams of theprivate parties. New policy guidelines and priorities may arise, not tomention changes in building techniques, spatial layout and the cost struc-ture of the project. The process followed by a mega-project can be likenedto a series of learning curves in which new, cutting-edge ideas are con-stantly casting a new light on the solution. An Echternach procession (twosteps forward, one step back) may creep in from time to time and decisionsmay end up being taken more than once.
Often, in practice, it is much more difficult to define alternatives thanFindeisen and Quade (1985) suggest. It takes vision and a design approachto come up with options that are unlikely to occur to players with no imag-ination. As Miller and Lessand comment in Chapter 8, mega-projectsfollow a dynamic, iterative and – often – chaotic course, which should bereflected in project-management architectures. This does not, however, dis-pense with the need to conduct a proper problem (and a risk–opportunity)analysis in the start phase and to formulate and flesh out alternatives fromthe earliest stages. A design approach, which partly reflects the initial pref-erences of the various stakeholders, will widen the range of alternatives.Alternatives may not be rejected until it has been conclusively establishedthat the cost–benefit ratio is unfavourable. In fact, it is not inconceivablethat all the plan alternatives will come adrift in the run-up phase – and therewill be no mega-project.
Sometimes a mega-project is the solution, sometimes it is the problem.
6.7 CONCLUSIONS
Experience of decision-making in mega-projects in the Netherlands (TCI,2004a) has exposed the general need for proper problem analysis at the startof the process. It has also revealed that alternatives are seldom generatedand worked out at an early stage, which could solve or reduce the problemin other ways. Most of the time, the solution precedes the problem analy-sis, and any alternatives mooted at a later stage by opponents and observers
How to improve the early stages of decision-making 115

are simply swept aside by the project initiators and the Ministry ofTransportation. As a result, the role of Parliament is often marginalised,especially in the early stages. Mostly Parliament is unable to get a footholdin the decision-making. Any adaptation that Parliament pushes through ata later stage merely adds to the – already looming – excess costs. This is nota particular Dutch problem but a worldwide issue, if we compare the Dutchsituation with experiences in other countries in different continents(Flyvbjerg et al., 2003).
Sörenson (oral presentation at a meeting of the Council on EngineeringSystems Universities, Atlanta, USA, 14 December 2005) argues that thereason why most problems are never solved is because they are not formu-lated correctly in the first place. Far too often it is the wrong problem thatis addressed. It is therefore imperative that each decision-making processfor mega-projects starts with a sound problem analysis.
The flaws mentioned can be remedied by consistent application ofsystems analysis (Miser and Quade, 1985), which begins with a problemformulation and analysis, and the identification of the objectives, values,criteria, boundaries and constraints that the stakeholders attach to theprospective solution. Alternatives are identified, designed and screenedwith a view to meeting these objectives, values, criteria, boundaries andconstraints as far as possible. The assumed effects of each variable aredetermined by a model. The priced and unpriced costs and benefits arequantified by a cost–benefit analysis as suggested in Chapter 3 in thisbook (Eijgenraam et al., 1999). The quantification of indirect effects is aparticularly awkward business, as Chapter 4 in this book makes clear(see also Banister and Berechman, 2000; Elhorst et al., 2004; Oosterhavenet al., 2005). Finally, the alternatives can be ranked and the best oneselected.
A clear structure of the decision-making process can be helpful in clari-fying where go/no go decisions by Parliament or decentralised public rep-resentative bodies are needed to prevent entrapment or feelings ofentrapment (Brockner and Rubin, 1985; TCI, 2004a).
Systems analysis methodology as devised by Findeisen and Quade in1985 still has much to offer as a basis for decision-making. Hands-on expe-rience, gleaned from numerous studies in Europe and North America, hasshown that systems analysis is rarely applied in decision-making processeson mega-projects. It is important in the early phases to create plenty ofscope for generating and working out alternatives. These would includeoptions that would make the project unnecessary or too expensive, as wellas alternatives for the project itself. The integrity of the decision-making –and even of the democratic procedure – is enhanced when the rejected aswell as the selected alternatives are known (including the respective
116 Planning and decision-making

reasons). The adoption of systems analysis can therefore improve theresults in decision-making processes on mega-projects.
REFERENCES
Affuso, L., J. Masson and D.M.G. Newbery (2003), ‘Comparing investments in newtransport infrastructures’, Fiscal Studies, 24 (3): 273–315.
Altshuler, Alan and David Luberoff (2004), Mega-Projects. The ChangingPolitics of Urban Public Investment, Washington, DC: Brookings InstitutionPress.
Banister, D. and J. Berechman (2000), Transport Investment and EconomicDevelopment, London: University College London Press.
Bell, Robert (1998), Worst Practices/De bodemloze put. Megaprojecten en manipu-latie [Worst Practices/The Bottomless Pit. Mega-Projects and Manipulation],Rotterdam: Aristos.
Bonnafous, A. (2003), ‘Assessing our expertise’, in European Council of Ministersof Transport (ECMT) (ed.), Fifty Years of Transport Policy. Successes and NewChallenges, Paris: ECMT.
Bonnafous, A. and Y. Crozet (1997), ‘Evaluation, dévaluation ou réévaluation deslignes à grande vitesse’, Les Cahiers Scientifiques du Transport, 32: 45–56.
Brockner, J. and J.Z. Rubin (1985), Entrapment in Escalating Conflicts: A SocialPsychological Analysis, New York: Springer Verlag.
Centraal Planbureau (CPB) (2004), Vooruitzichten voor spoorvervoer over deBetuweroute [Prospects of rail transport on the Betuwe Rail Link], The Hague,CPB-notitie 2004/39, 24 September.
Centraal Planbureau (CPB), RIVM, RPB and SCP (2002), Selectief investeren;ICES-maatregelen tegen het licht [Selectively investing, ICES-measures in thespotlight], The Hague: CPB.
Eijgenraam, C.C.J., C.C. Koopmans, P.J.G. Tang and A.C.P. Verster (1999),Evaluatie van infrastructuurprojecten. Leidraad voor kosten–batenanalyse. Deel I:Hoofdrapport [Evaluation of infrastructure projects. Guide for cost–benefitanalysis. Part 1: Main report]. Onderzoeksprogramma Economische EffectenInfrastructuur (OEEI), The Hague: Ministerie van Verkeer en Waterstaat,Ministerie van Economische Zaken.
Elhorst, J.P., A. Heyma, C.C. Koopmans and J. Oosterhaven (2004), IndirecteEffecten Infrastructuurprojecten: Aanvulling Leidraad OEI [Indirect Effects ofInfrastructure Projects: Supplement to the OEI Guideline], Groningen/Amsterdam: University of Groningen/Foundation for Economic Research.
Findeisen, W. and E.S. Quade (1985), ‘The methodology of systems analysis: anintroduction and overview’, in H.J. Miser and E.S. Quade (eds), Handbook ofSystems Analysis. Overview of Uses, Procedures, Applications, and Practice,Chichester, New York: John Wiley & Sons.
Flyvbjerg, B., N. Bruzelius and W. Rothengatter (2003), Megaprojects and Risk: AnAnatomy of Ambition, Cambridge, MA: Cambridge University Press.
Mackie, P. and J. Preston (1998), ‘Twenty-one sources of error and bias in transportproject appraisal’, Transport Policy, 5 (1): 1–8.
Ministerie van Verkeer en Waterstaat (2004), Nota Mobiliteit [MemorandumMobility], The Hague: Ministerie van Verkeer en Waterstaat.
How to improve the early stages of decision-making 117

Miser, H.J. and E.S. Quade (1985), Handbook of Systems Analysis. Overview ofUses, Procedures, Applications, and Practice, Chichester, New York: John Wiley& Sons.
Morris, Peter W.G. and George H. Hough (1987), The Anatomy of Major Projects.A Study of the Reality of Project Management, Chichester, New York: John Wiley& Sons.
Nilsson, J.E. (1992), ‘Second-best problems in railway infrastructure pricing andinvestment’, Journal of Transport Economics and Policy, 26 (3): 245–59.
Oosterhaven, J., C.C. Koopmans and J.P. Elhorst (2005), ‘Indirecte effecten vanbeleid: lastig, maar belangrijk’ [Indirect effects of policy: difficult but important],ESB, 90, 29 July: 335–7.
Pickrell, D. (1989), Urban Rail Transit Projects. Forecast versus Actual Ridership andCosts, Washington, DC: US Department of Transportation.
Pickrell, D.H. (1992), ‘A desire named streetcar – fantasy and fact in rail transitplanning’, Journal of American Planning Association, 58 (2): 158–76.
Priemus, H. (ed.) (2004), Grote projecten: inzichten en uitgangspunten. Achtergrond-studies [Mega-projects: insights and starting points. Background studies], commis-sioned by the Temporary Committee for Infrastructure Projects, Tweede Kamer(Dutch Lower House), 2004–2005, 29.283 no. 10, The Hague: Sdu Uitgevers.
Priemus, H. (2005), ‘Design & Construct bij de Hogesnelheidslijn-Zuid: De Wet vanMurphy’ [Design & Construct for the Southern High Speed Rail Link: Murphy’sLaw], Building Business, 7 (1): 42–9.
Quinet, E. (2000), ‘Evaluation methodologies of transportation projects in France’,Transport Policy, 7 (1): 27–35.
Rietveld, P. (1989), ‘Infrastructure and regional development: a survey of multire-gional economic models’, The Annals of Regional Science, 23: 255–74.
Rothengatter, W. (2000), ‘Evaluation of infrastructure investments in Germany’,Transport Policy, 7 (1): 17–27.
Roundtable of European Industrialists (1984), Missing Links. Upgrading Europe’sTransborder Ground Transport Infrastructure, Paris: Roundtable Secretariat,Paris Office.
Roundtable of European Industrialists (1991), Missing Networks. A EuropeanChallenge. Proposals for the Renewal of Europe’s Infrastructure, Paris: RoundtableSecretariat, Paris Office.
Short, J. and A. Kopp (2005), ‘Transport infrastructure: investment and planning.Policy and research aspects’, Transport Policy, 12: 360–67.
Teisman, G.R. (1998), Complexe besluitvorming, een pluricentrisch perspectiefop besluitvorming over ruimtelijke investeringen [Complex decision-making, apluricentred perspective on spatial investments], The Hague: Elsevier.
Tijdelijke Commissie Infrastructuurprojecten (TCI) (2004a), Grote projecten uitver-groot. Een infrastructuur voor besluitvorming [Large projects under the magnify-ing glass. An infrastructure for decision-making], Tweede Kamer (Dutch LowerHouse), 2004–2005, 29.283 nos 5–6, The Hague: Sdu Uitgevers.
Tijdelijke Commissie Infrastructuurprojecten (TCI) (2004b), ReconstructieBetuweroute. De besluitvorming uitvergroot [Reconstruction Betuwe Rail Link.Decision-making under the magnifying glass], Tweede Kamer (Dutch LowerHouse), 2004–2005, 29.283 no. 7, The Hague: Sdu Uitgevers.
Vickerman, R.W. (1989), ‘Measuring changes in regional competitiveness: the effectof international infrastructure investments’, The Annals of Regional Science, 23:275–86.
118 Planning and decision-making

Vickerman, R. (2000), ‘Evaluation methodologies for transport projects in theUnited Kingdom’, Transport Policy, 7 (1): 7–16.
Wachs, M. (1989), ‘When planners lie with numbers’, APA Journal, 476: 476–9.Wachs, M. (1990), ‘Ethics and advocacy in forecasting for public policy’, Business
and Professional Ethics Journal, 9 (1&2): 141–57.Wetenschappelijke Raad voor het Regeringsbeleid [Scientific Advisory Council on
Government Policy] (WRR) (1994), Besluiten over Grote Projecten [Decisions onlarge projects], The Hague: Sdu Uitgevers.
How to improve the early stages of decision-making 119
7. Public planning of mega-projects:overestimation of demand andunderestimation of costsBent Flyvbjerg
7.1 INTRODUCTION
Despite the enormous sums of money being spent on transportation infra-structure, surprisingly little systematic knowledge exists about the costs,benefits and risks involved. The literature lacks statistically valid answers tothe central and self-evident question of whether transportation infrastruc-ture projects perform as forecasted. When a project underperforms, this isoften explained away as an isolated instance of unfortunate circumstance; itis typically not seen as the particular expression of a general pattern of under-performance in transportation infrastructure projects. Because knowledge islacking in this area of research, until now it has been impossible to validlyrefute or confirm whether underperformance is the exception or the rule.
Knowledge about demand risk, cost risk and compound risk is crucial toplanners and decision-makers when developing projects and decidingwhich to build and which not. For transportation infrastructure projects,the benefits and costs involved often run into hundreds of millions ofdollars, with risks being correspondingly high. Estimates of the financialviability of projects are heavily dependent on the accuracy of trafficdemand and construction cost forecasts (Pickrell, 1990; Richmond, 1998).Such forecasts are also the basis for socioeconomic and environmentalappraisal of transportation infrastructure projects. According to the expe-riences gained with the accuracy of demand and cost forecasting in thetransportation sector, there is evidence that such forecasting, despite allscientific progress in modelling, is a major source of uncertainty and riskin the development and management of large infrastructure projects (VanWee, 2007; Priemus, 2007).
Nevertheless, rigorous studies of accuracy are rare. Where suchstudies exist, they are characteristically small-N research, that is, they aresingle-case studies or they cover only a sample of projects too small or too
120

uneven to allow systematic, statistical analyses (Brooks and Trevelyan,1979; Bruzelius et al., 2002; Fouracre et al., 1990; Fullerton and Openshaw,1985; Hall, 1980; Kain, 1990; Mackinder and Evans, 1981; National AuditOffice, 1988; 1992; Nijkamp and Ubbels, 1999; Pickrell, 1990; Richmond,1998; 2001; Skamris and Flyvbjerg, 1997; Szyliowicz and Goetz, 1995;Walmsley and Pickett, 1992; Webber, 1976; World Bank, 1994). Despitetheir value in other respects, with these and other studies, it has so far beenimpossible to give statistically satisfying answers to questions about howaccurate traffic and cost forecasts are for transportation infrastructure pro-jects. The objective of the study presented here has been to change this stateof affairs by establishing a sample of transportation infrastructure projectsthat is sufficiently large to permit statistically valid answers to questions ofaccuracy. The methodology and data of the study are described in detail inFlyvbjerg, Holm and Buhl (2003; 2006) and Flyvbjerg (2005).
The present study focuses on accuracy in demand and cost forecasts. Itshould be mentioned, however, that similar concerns and results as thosepresented here for demand and cost forecasts pertain to (in)accuracy inenvironmental and social forecasts made as part of major projects. Thelatter issue is covered in Flyvbjerg, Bruzelius and Rothengatter (2003).
7.2 INACCURACY IN TRAVEL DEMANDFORECASTS
Inaccuracy in travel demand forecasts is here measured as actual minusforecasted traffic as a percentage of forecasted traffic. Actual traffic iscounted for the first year of operations. Forecasted traffic is the traffic esti-mate for the first year of operations as estimated at the time of decision tobuild the project. Thus the forecast is the estimate available to decision-makers on the basis of which they made the decision to build the project inquestion. With this standard definition of inaccuracy, perfect accuracy isindicated by zero; an inaccuracy of minus 40 per cent, for example, indi-cates that actual traffic was 40 per cent lower than forecasted traffic,whereas an inaccuracy of plus 40 per cent means that actual traffic was 40per cent higher than forecasted traffic.
The study includes 210 transportation infrastructure projects with com-parable data for forecasted and actual traffic. The sample comprises aproject portfolio worth approximately US$62 billion in actual costs (2006prices). The project types are urban rail, high-speed rail, conventional rail,bridges, tunnels, highways and freeways. The projects are located in 14countries on five continents, including both developed and developingnations. The projects were completed during the 30 years between 1969 and
Public planning: overestimation of demand and underestimation of costs 121

1998. The size of the projects ranges from construction costs of US$23million to US$11 billion (2006 prices), with the smallest projects typicallybeing stretches of roads in larger road schemes and the largest projectsbeing rail links, bridges and tunnels.
Figure 7.1 shows the distribution of inaccuracy of traffic forecasts for the210 projects in the sample split into rail and road projects. The most notice-able attribute of Figure 7.1 is the striking difference between rail and roadprojects. Rail passenger forecasts are much more inaccurate and biased(inflated) than are road traffic forecasts.
Tests show that of the 27 rail projects included in the statistical analyses,two German projects should be considered as statistical outliers. These arethe two projects represented by the two right-most columns in the rail his-togram in Figure 7.1. Excluding statistical outliers, the following results arefound for the remaining 25 rail projects (results including the two statisti-cal outliers are given in brackets):
● The data document a massive problem with inflated rail passengerforecasts. For more than nine out of ten rail projects, passenger fore-casts are overestimated; for 72 per cent of all rail projects, passengerforecasts are overestimated by more than two-thirds [including sta-tistical outliers: for 67 per cent of all rail projects, passenger forecastsare overestimated by more than two-thirds].
● Rail passenger forecasts were overestimated by an average of 105.6per cent (95 per cent confidence interval of 66.0 to 169.9), resulting inactual traffic that was on average 51.4 per cent lower than forecastedtraffic (sd � 28.1, 95 per cent confidence interval of �62.9 to �39.8)[including statistical outliers: rail passenger forecasts were overesti-mated by an average of 65.2 per cent (95 per cent confidence intervalof 23.1 to 151.3), resulting in actual traffic that was on average 39.5per cent lower than forecasted traffic (sd � 52.4, 95 per centconfidence interval of �60.2 to �18.8)].
● Eighty-four per cent of the rail projects have actual traffic more than20 per cent below forecasted traffic and none have actual traffic morethan 20 per cent above forecasted traffic. Even if we double thethreshold value to 40 per cent, we find that a solid 72 per cent of allrail projects have actual traffic below that limit [including statisticaloutliers the figures are 85 per cent and 74 per cent, respectively].
For road projects, the tests show (see also Table 7.1):
● Fifty per cent of the road projects have a difference between actualand forecasted traffic of more than �20 per cent. If we double the
122 Planning and decision-making

Public planning: overestimation of demand and underestimation of costs 123
Figure 7.1 Inaccuracies of travel demand forecasts in transportationinfrastructures projects split into 27 rail and 183 roadprojects
30
25
20
Fre
quen
cy (
%)
15
10
–80 –40 0 40Inaccuracy (%) for rail projects
80 120 160
5
0
30
25
20
Fre
quen
cy (
%)
15
10
–80 –40 0 40Inaccuracy (%) for road projects
80 120 160
5
0

threshold value to �40 per cent, we find that 25 per cent of projectsare above this level.
● There is no significant difference between the frequency of inflatedversus deflated forecasts for road vehicle traffic (p � 0.822, two-sidedbinominal test). A total of 21.3 per cent of projects have inaccuraciesbelow �20 per cent, whereas 28.4 per cent of projects have inaccura-cies above �20 per cent.
● Road traffic forecasts were underestimated by an average of 8.7 percent (95 per cent confidence interval of 2.9 to 13.7), resulting inactual traffic that was on average 9.5 per cent higher than forecastedtraffic (sd � 44.3, 95 per cent confidence interval of 3.0 to 15.9).
Thus the risk is substantial that road traffic forecasts are wrong by a largemargin, but the risk is more balanced than for rail passenger forecasts.Testing the difference between rail and road, we find at a very high level ofstatistical significance that rail passenger forecasts are less accurate andmore inflated than road vehicle forecasts (p 0.001, Welch two-samplet-test). However, there is no indication of a significant difference betweenthe standard deviations for rail and road forecasts; both are high, indicat-ing a large element of uncertainty and risk for both types of forecasts (p �0.213, two-sided F-test). Excluding the two statistical outliers for rail, wefind the standard deviation for rail projects to be significantly lower thanfor road projects, although still high (p � 0.0105).
The striking difference in forecasting inaccuracy between rail and roadprojects documented above may perhaps be explained by the different
124 Planning and decision-making
Table 7.1 Inaccuracies in forecasts of rail passenger and road vehicletraffic
Rail Road(figures in brackets
include twostatistical outliers)
Average inaccuracy (%) �51.4 (sd�28.1) 9.5 (sd�44.3)[�39.5 (sd�52.4)]
Percentage of projects with 84 50inaccuracies larger than �20% [85]
Percentage of projects with 72 25inaccuracies larger than �40% [74]
Percentage of projects with 40 13inaccuracies larger than �60% [41]

procedures that apply to how each type of project is funded, where com-petition for funds is typically more pronounced for rail than for road, whichcreates an incentive for rail promoters to present their project in asfavourable a light as possible, that is, with overestimated benefits andunderestimated costs (Flyvbjerg, Holm and Buhl, 2002). One may furtherspeculate that rail patronage will be overestimated and road traffic under-estimated in instances where there is a strong political or ideological desireto see passengers shifted from road to rail, for instance for reasons of con-gestion or protection of the environment. Forecasts here become part ofthe political rhetoric aimed at showing voters that something is beingdone – or will be done – about the problems at hand. In such cases it maybe difficult for forecasters and planners to argue for more realistic forecasts,because politicians here use forecasts to show political intent, not the mostlikely outcome.
All told, the traffic estimates used in decision-making for rail infrastruc-ture development are highly, systematically and significantly misleading.Rail passenger forecasts are consistently and significantly inflated. For roadprojects the problem of misleading forecasts is less severe and less one-sidedthan for rail. But even for roads, for half the projects the difference betweenactual and forecasted traffic is more than �20 per cent. Against this back-ground, planners and decision-makers are well advised to take with a grainof salt any traffic forecast that does not explicitly take into account theuncertainty of predicting future traffic. For rail passenger forecasts, agrain of salt may not be enough. The data demonstrate to planners that riskassessment and management regarding travel demand must be an integralpart of planning for both rail and road projects. The data presented aboveprovide the empirical basis on which planners may found such risk assess-ment and management.
7.3 INACCURACY IN COST FORECASTS
Inaccuracy in construction cost forecasts is measured as actual cost minusforecasted cost as a percentage of forecasted cost. An inaccuracy of zeromeans that the forecasted cost for the project was correct and thus equalledactual cost. Forecasted cost is the estimate made at the time of decision tobuild, or as close to this as possible if no estimate was available for the deci-sion to build. Actual cost is outturn construction cost measured after theproject was completed. All costs are calculated in constant prices.
The study includes 258 projects with comparable data for forecasted andactual construction cost. Figure 7.2 shows histograms with the distributionof cost escalation for these projects. Table 7.2 shows the expected (average)
Public planning: overestimation of demand and underestimation of costs 125
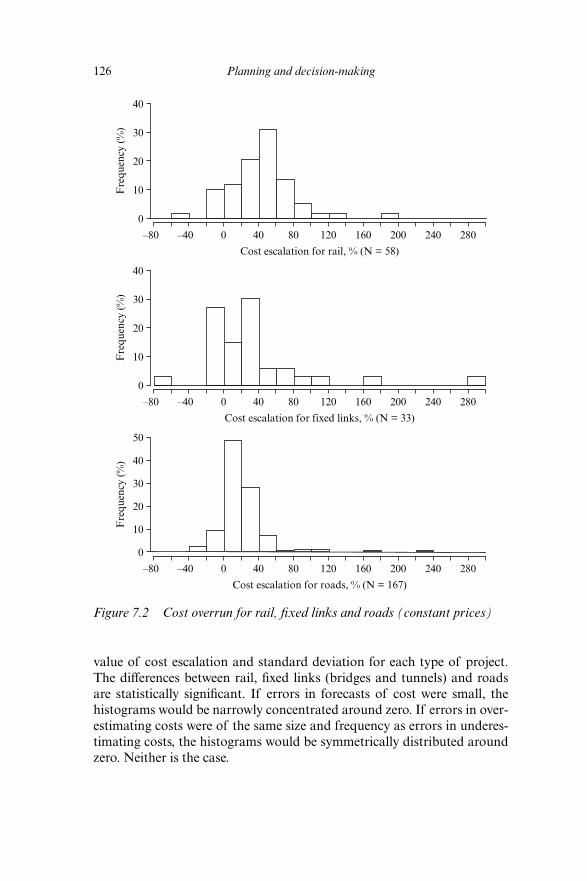
value of cost escalation and standard deviation for each type of project.The differences between rail, fixed links (bridges and tunnels) and roadsare statistically significant. If errors in forecasts of cost were small, thehistograms would be narrowly concentrated around zero. If errors in over-estimating costs were of the same size and frequency as errors in underes-timating costs, the histograms would be symmetrically distributed aroundzero. Neither is the case.
126 Planning and decision-making
Figure 7.2 Cost overrun for rail, fixed links and roads (constant prices)
40
20
30F
requ
ency
(%
)
10
–80 –40 0 40
Cost escalation for rail, % (N = 58)
80 120 160 200 240 280
0
40
20
30
Fre
quen
cy (
%)
10
–80 –40 0 40
Cost escalation for fixed links, % (N = 33)
80 120 160 200 240 280
0
50
20
30
40
Fre
quen
cy (
%)
10
–80 –40 0 40
Cost escalation for roads, % (N = 167)
80 120 160 200 240 280
0
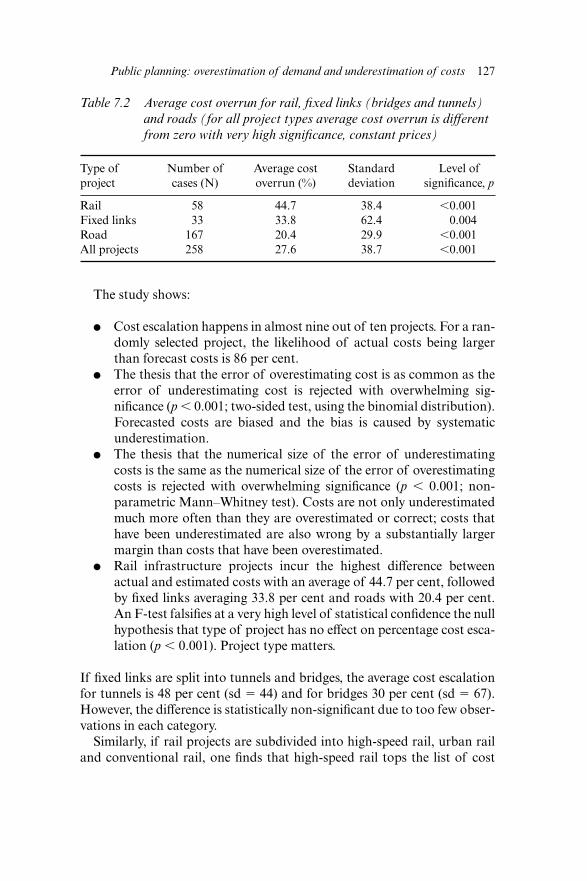
The study shows:
● Cost escalation happens in almost nine out of ten projects. For a ran-domly selected project, the likelihood of actual costs being largerthan forecast costs is 86 per cent.
● The thesis that the error of overestimating cost is as common as theerror of underestimating cost is rejected with overwhelming sig-nificance (p 0.001; two-sided test, using the binomial distribution).Forecasted costs are biased and the bias is caused by systematicunderestimation.
● The thesis that the numerical size of the error of underestimatingcosts is the same as the numerical size of the error of overestimatingcosts is rejected with overwhelming significance (p 0.001; non-parametric Mann–Whitney test). Costs are not only underestimatedmuch more often than they are overestimated or correct; costs thathave been underestimated are also wrong by a substantially largermargin than costs that have been overestimated.
● Rail infrastructure projects incur the highest difference betweenactual and estimated costs with an average of 44.7 per cent, followedby fixed links averaging 33.8 per cent and roads with 20.4 per cent.An F-test falsifies at a very high level of statistical confidence the nullhypothesis that type of project has no effect on percentage cost esca-lation (p 0.001). Project type matters.
If fixed links are split into tunnels and bridges, the average cost escalationfor tunnels is 48 per cent (sd � 44) and for bridges 30 per cent (sd � 67).However, the difference is statistically non-significant due to too few obser-vations in each category.
Similarly, if rail projects are subdivided into high-speed rail, urban railand conventional rail, one finds that high-speed rail tops the list of cost
Public planning: overestimation of demand and underestimation of costs 127
Table 7.2 Average cost overrun for rail, fixed links (bridges and tunnels)and roads (for all project types average cost overrun is differentfrom zero with very high significance, constant prices)
Type of Number of Average cost Standard Level ofproject cases (N) overrun (%) deviation significance, p
Rail 58 44.7 38.4 0.001Fixed links 33 33.8 62.4 0.004Road 167 20.4 29.9 0.001All projects 258 27.6 38.7 0.001

escalation with an average of 52 per cent (sd � 48), followed by urban railwith 45 per cent (sd � 37) and conventional rail with 30 per cent (sd � 34).Again the differences are statistically non-significant, and again the reasonis that the subsamples are too small.
In sum, cost escalation for rail, fixed links and roads is large and has largestandard deviations. The cause is cost forecasts that are highly and system-atically underestimated. Again, decision-makers – as well as investors,media and the public – are well advised to take any estimate of construc-tion costs with a grain of salt.
7.4 HAVE FORECASTS BECOME MORE ACCURATEOVER TIME?
Figures 7.3 and 7.4 show how inaccuracy in traffic forecasts varies over timefor the projects in the sample for which inaccuracy could be coupled withinformation about year of decision to build and/or year of completingthe project. There is no indication that traffic forecasts have become moreaccurate over time. Quite the opposite is true for road projects, where fore-casts appear to become highly inaccurate toward the end of the period.Statistical analyses corroborate this impression.
For rail projects, inaccuracy in forecasts is independent of both year ofproject commencement or year of project conclusion. This is the casewhether two statistical outliers (marked with ‘K’ in Figure 7.3) are includedor not. The conclusion is that forecasts of rail passenger traffic have not
128 Planning and decision-making
Note: K � statistical outliers.
Figure 7.3 Inaccuracies in number of rail passengers
200
100
Inac
cura
cy (
%)
0
–100
1960 1970
Year of commencement
1980
K
K
1990
200
100
Inac
cura
cy (
%)
0
–100
1970 1980
Year of conclusion
1990
K
K
2000

improved over time. Rail passenger traffic has been consistently overesti-mated during the 30-year period studied.
For cost forecasts, Figure 7.5 shows a plot of cost overrun against yearof decision to build for the 111 projects in the sample for which these data
Public planning: overestimation of demand and underestimation of costs 129
Figure 7.4 Inaccuracies in number of road vehicles
200
100
Inac
cura
cy (
%)
0
–100
1960 1970
Year of commencement
1980 1990
200
100
Inac
cura
cy (
%)
0
–100
1970 1980
Year of conclusion
1990 2000
DenmarkOther EU
DenmarkOther EU
Figure 7.5 A century of cost escalation (constant prices)
300
200
100
0
Cos
t es
cala
tion
(%
)
–1001910 1920 1930 1940 1950 1960 1970 1980 1990 2000
Year of decision to build

are available. The diagram does not seem to indicate an effect from time oncost overrun. Statistical analyses corroborate this impression. The nullhypothesis that year of decision has an effect on cost overrun cannot besupported (p � 0.22, F-test). A test using year of completion instead ofyear of decision (with data for 246 projects) gives a similar result (p � 0.28,F-test).1 Similar analyses have been carried out with year of decision com-bined with the logarithm of estimated cost as a measure of the size of pro-jects, also split into rail, fixed links and road. Year of completion andlogarithm of actual cost was also tried. In no case could any statisticallysignificant result be established, neither with main effects nor with interac-tions (in no case was a p-value below 0.10 found). We see that cost perfor-mance has not improved over time. Cost overrun today is in the same orderof magnitude as it was 10, 30 or 70 years ago.
In sum, accuracy in traffic and cost forecasting has not improved overtime. Rail passenger forecasts are as inaccurate, that is, inflated, today asthey were 30 years ago. Road vehicle forecasts even appear to have becomemore inaccurate over time, with large underestimations towards the end ofthe 30-year period studied. Accuracy in cost forecasts has not improved for70 years. If techniques and skills for arriving at accurate traffic and costforecasts have improved over time, this does not show in the data.
At first sight, it may seem strange that no learning and improvementappear to be taking place for forecasting demand and cost in this impor-tant and highly costly sector of public and private decision-making, andthat apparent errors are allowed to continue unchecked decade afterdecade. After all, project promoters and forecasters seem to be as smart andas capable of learning as other people. But perhaps they have alreadylearned what there is to learn. The behaviour of promoters and forecastersinvites speculation that the persistent existence over time of significant andwidespread bias and inaccuracy in demand and cost forecasts is a sign thatan equilibrium has been reached where strong incentives and weak disin-centives for inaccuracy may have taught project promoters that inaccuracypays off. If this is the case, bias and inaccuracy must be expected and it mustbe expected to be intentional.
This and other explanations of ‘inaccuracy’ have been tested else-where (Flyvbjerg, Holm and Buhl, 2002; Flyvbjerg and COWI, 2004). Itwas found that bias and inaccuracy – typically cost underestimation andbenefit overestimation – indeed often appear to be intentional and part ofpower games and rent-seeking behaviour among project promoters andforecasters aimed at getting projects started. Cost underestimation andbenefit overestimation are used strategically to make projects appear lessexpensive and more beneficial than they really are in order to gain approvalfrom decision-makers to build them. Such behaviour best explains why
130 Planning and decision-making

inaccuracy is so consistent over time (see also Wachs, 1986; 1989; 1990;Flyvbjerg, 1996; 1998).
This suggests to decision-makers and planners that the most effec-tive means for improving forecasting accuracy is probably not improvedmethods but, instead, strong measures of accountability that would curbstrategic misrepresentation in forecasts.
7.5 GEOGRAPHICAL VARIATIONS
In addition to testing whether forecasting accuracy varies with time, geo-graphical variations were also tested. The geographical location of projectsin the sample was defined as Europe, North America, or ‘other geographi-cal areas’ (the last being a group of ten developing nations plus Japan).
Table 7.3 shows cost overrun for these geographical areas for fixed links(bridges and tunnels), rail and road, respectively. There is no indication of sta-tistical interaction between geographical area and type of project. The effectsfrom these variables on cost overrun are therefore considered separately.
Considering all projects, the difference between geographical areas interms of cost development is highly significant (p 0.001). Geographymatters for cost overrun.
If Europe and North America are compared separately, which is com-pulsory for fixed links and roads because no observations exist for othergeographical areas here, then comparisons can be made by t-tests (as thestandard deviations are rather different, the Welch version is used). Forfixed links, average cost overrun is 43.4 per cent in Europe versus 25.7 percent in North America, but the difference is non-significant (p � 0.414).Given the limited number of observations and the large standard devia-tions for fixed links, one would need to enlarge the sample with more fixedlinks in Europe and North America in order to test whether the differencesmight be significant for a larger sample.
For rail, the average cost overrun is 34.2 per cent in Europe versus 40.8per cent in North America. For roads the similar numbers are 22.4 per centversus 8.4 per cent. Again these differences are non-significant (p � 0.510and p � 0.184, respectively).
It is concluded that the highly significant differences in cost overrun wesaw above for geographical location are due to ‘other geographical areas’,with their poor track record of cost overrun for rail, averaging 64.6 percent. In addition to more data on projects in Europe and North America,a particularly interesting question for further research is whether data onbridges, tunnels and roads in ‘other geographical areas’ would show thesame tendency at poor cost performance and high risk as does rail.
Public planning: overestimation of demand and underestimation of costs 131

132
Tab
le 7
.3C
ost
over
run
in E
urop
e,N
orth
Am
eric
a an
d ot
her
geog
raph
ical
are
as (
cons
tant
pri
ces)
Typ
e of
Eur
ope
Nor
th A
mer
ica
Oth
er g
eogr
aphi
cal a
reas
proj
ect
Num
ber
Ave
rage
sd
Num
ber
Ave
rage
sd
Num
ber
Ave
rage
sd
ofco
st
ofco
st
ofco
st
proj
ects
over
run
proj
ects
over
run
proj
ects
over
run
(%)
(%)
(%)
Rai
l23
34.2
25.1
1940
.836
.816
64.6
49.5
Fix
ed li
nks
1543
.452
.018
25.7
70.5
0–
–R
oads
143
22.4
24.9
248.
449
.40
––
Tota
l18
125
.728
.761
23.6
54.2
1664
.649
.5

For traffic forecasts, more data are needed in order to study the effect oninaccuracy from geographic location of projects. With the available data,there is no significant difference between geographical areas.
7.6 LESSONS IN HOW TO REDUCE INACCURACY,BIAS AND RISK
The first lesson to be learned from the results presented above is that it ishighly risky to rely on forecasts of travel demand and cost in developinglarge transportation infrastructure schemes. Rail passenger forecasts areoverestimated in nine out of ten cases, with an average overestimate above100 per cent. Half of all road traffic forecasts are wrong by more than �20per cent; a fourth is wrong by more than �40 per cent. Moreover, nine outof ten projects have underestimated costs and cost overrun. Average costoverrun for rail is 45 per cent in constant prices, for tunnels and bridges 34per cent, and for roads 20 per cent. All averages have large standard devia-tions, indicating that risks of individual forecasts being very wrong arehigh. Finally, forecasts have not become more accurate over time.
This state of affairs points directly to better risk assessment and man-agement as something planners could and should do to improve planningand decision-making for transportation infrastructure projects. Today, thebenefit and cost risks generated by inaccurate forecasts of travel demandand cost are widely underestimated in project development and manage-ment (Flyvbjerg, Holm and Buhl, 2003).
However, when contemplating what planners can do to reduce inaccu-racy, bias and risk in forecasting, we need to distinguish between two fun-damentally different situations, namely, (1) the situation where plannersand politicians consider it important to get forecasts right, and (2) the sit-uation where they don’t. We consider the first situation in this section andthe second in the following section.
If planners and politicians genuinely consider it important to get fore-casts right, it is recommended they use a new forecasting method called ‘ref-erence class forecasting’ to reduce inaccuracy and bias.2 This methodwas originally developed to compensate for the type of cognitive bias inhuman forecasting that psychologist Daniel Kahneman found in his Nobelprize-winning work on bias in economic forecasting (Kahneman, 1994;Kahneman and Tversky, 1979). Reference class forecasting has provenmore accurate than conventional forecasting. For reasons of space, hereonly an outline of the method is presented, based mainly on Lovallo andKahneman (2003). For details on how to use this method in practicaldemand and cost forecasting, see Flyvbjerg (2006).
Public planning: overestimation of demand and underestimation of costs 133
Reference class forecasting consists in taking a so-called ‘outside view’on the particular project being forecast. The outside view is established onthe basis of information from a class of similar projects. The outside viewdoes not try to forecast the specific uncertain events that will affect the par-ticular project, but instead places the project in a statistical distribution ofoutcomes from a group of reference projects. Reference class forecastingrequires the following three steps for the individual project:
1. Identify a relevant reference class of past projects. The class must bebroad enough to be statistically meaningful but narrow enough to betruly comparable with the specific project.
2. Establish a probability distribution for the selected reference class. Thisrequires access to credible data for a sufficient number of projectswithin the reference class to make statistically meaningful conclusions.
3. Compare the specific project with the reference class distribution, inorder to establish the most likely outcome for the specific project.
Daniel Kahneman relates the following story to illustrate reference classforecasting in practice (Lovallo and Kahneman, 2003: 61). Some years ago,Kahneman was involved in a project to develop a curriculum for a newsubject area for high schools in Israel. The project was carried out by a teamof academics and teachers. In time, the team began to discuss how long theproject would take to complete. Everyone on the team was asked to writeon a slip of paper the number of months needed to finish and report theproject. The estimates ranged from 18 to 30 months.
One of the team members – a distinguished expert in curriculum devel-opment – was then posed a challenge by another team member to recall asmany projects similar to theirs as possible and to think of these projects asthey were in a stage comparable to their project. ‘How long did it take themat that point to reach completion?’, the expert was asked. After a while heanswered that not all the comparable teams he could think of ever did com-plete their task. About 40 per cent of them eventually gave up. Of thoseremaining, the expert could not think of any that completed their task inless than seven years, nor of any that took more than ten. The expert wasthen asked if he had reason to believe that the present team was moreskilled in curriculum development than the earlier ones had been. Theexpert said no, he did not see any relevant factor that distinguished thisteam favourably from the teams he had been thinking about. His impres-sion was that the present team was slightly below average in terms ofresources and potential.
The wise decision at this point would probably have been for the teamto break up, according to Kahneman. Instead, the members ignored the
134 Planning and decision-making

pessimistic information and proceeded with the project. They finally com-pleted the project eight years later, and their efforts were largely wasted –the resulting curriculum was rarely used.
In this example, the curriculum expert made two forecasts for the sameproblem and arrived at very different answers. The first forecast was theinside view; the second was the outside view, or the reference class forecast.The inside view is the one that the expert and the other team membersadopted. They made forecasts by focusing narrowly on the case at hand,considering its objective, the resources they brought to it, and the obstaclesto its completion. They constructed in their minds scenarios of theircoming progress and extrapolated current trends into the future. The result-ing forecasts, even the most conservative ones, were overly optimistic. Theoutside view is the one provoked by the question to the curriculum expert.It completely ignored the details of the project at hand, and it involved noattempt at forecasting the events that would influence the project’s futurecourse. Instead, it examined the experiences of a class of similar projects,laid out a rough distribution of outcomes for this reference class, and thenpositioned the current project in that distribution. The resulting forecast,as it turned out, was much more accurate.
Similarly – to take an example from urban planning – planners in a citypreparing to build a new subway would, first, establish a reference class ofcomparable projects. This could be the urban rail projects included in thesample for this chapter. Through analyses the planners would establishthat the projects included in the reference class were indeed comparable.Second, if the planners were concerned about getting patronage forecastsright, they would then establish the distribution of outcomes for the refer-ence class regarding the accuracy of patronage forecasts. This distributionwould look something like the rail part of Figure 7.1. Third, the plannerswould compare their subway project to the reference class distribution.This would make it clear to them that unless they had reason to believe theywere substantially better forecasters and planners than their colleagues whodid the forecasts and planning for projects in the reference class, they werelikely to grossly overestimate patronage. Finally, planners can then use thisknowledge to adjust their forecasts for more realism.
The contrast between inside and outside views has been confirmed bysystematic research (Gilovich et al., 2002). The research shows that whenpeople are asked simple questions requiring them to take an outside view,their forecasts become significantly more accurate. However, most individ-uals and organisations are inclined to adopt the inside view in planningmajor initiatives. This is the conventional and intuitive approach. The tra-ditional way to think about a complex project is to focus on the project itselfand its details, to bring to bear what one knows about it, paying special
Public planning: overestimation of demand and underestimation of costs 135

attention to its unique or unusual features, trying to predict the events thatwill influence its future. The thought of going out and gathering simple sta-tistics about related cases seldom enters a planner’s mind. This is the casein general, according to Lovallo and Kahneman (2003: 61–2). And it is cer-tainly the case for forecasts of travel demand and construction cost. Amongthe several hundred forecasts reviewed for the study presented here, not asingle one was a genuine reference class forecast.3
While understandable, planners’ preference for the inside view over theoutside view is unfortunate. When both forecasting methods are appliedwith equal skill, the outside view is more likely to produce a realistic esti-mate. That is because it bypasses cognitive and organisational biases suchas appraisal optimism and strategic misrepresentation, and cuts directly tooutcomes. In the outside view planners and forecasters are not required tomake scenarios, imagine events, or gauge their own and others’ levels ofability and control, so they cannot get all these things wrong. Surely theoutside view, being based on historical precedent, may fail to predictextreme outcomes, that is, those that lie outside all historical precedents.But for most projects, the outside view will produce more accurate results.In contrast, a focus on inside details is the road to inaccuracy.
The comparative advantage of the outside view is most pronounced fornon-routine projects, understood as projects that planners and decision-makers in a certain locale have never attempted before – such as buildingan urban rail system in a city for the first time, or a new major bridge orconcert hall where none existed before. It is in the planning of such newefforts that the biases toward optimism and strategic misrepresentation arelikely to be large. To be sure, choosing the right reference class of compar-ative past projects becomes more difficult when planners are forecasting ini-tiatives for which precedents are not easily found, for instance theintroduction of new and unfamiliar technologies. However, most large-scale infrastructure projects are both non-routine locally and use well-known technologies. Such projects are, therefore, particularly likely tobenefit from the outside view and reference class forecasting.
7.7 THE ‘DARK SIDE’ OF PROJECT DEVELOPMENT
In the present section we consider the situation where planners and politi-cians do not find it important to get forecasts right and where they, there-fore, do not help to clarify and mitigate risk but, instead, generate andexacerbate it. Here planners are part of the problem, not the solution.
This situation needs some explication, because it may sound to many likean unlikely state of affairs. After all, it may be agreed that planners ought
136 Planning and decision-making
to be interested in being accurate and unbiased in forecasting. It is evenstated as an explicit requirement in the American Institute of CertifiedPlanners’ (AICP) Code of Ethics and Professional Conduct that ‘A plannermust strive to provide full, clear and accurate information on planningissues to citizens and governmental decision-makers’ (American PlanningAssociation, 1991: A.3), and who would not agree with this? The BritishRoyal Town Planning Institute (RTPI) has laid down similar obligations forits members (Royal Town Planning Institute, 2001).
Yet the literature is replete with things planners and planning ‘must’strive to do, but which they don’t. Planning must be open and commu-nicative, but often it is closed. Planning must be participatory and democ-ratic, but often it is an instrument to dominate and control. Planning mustbe about rationality, but often it is about power (Flyvbjerg, 1998; Watson,2003). This is the ‘dark side’ of planning and planners identified byFlyvbjerg (1996) and Yiftachel (1998), which is remarkably underexploredby planning researchers and theorists.
Forecasting, too, has its dark side. It is here we find Wachs’s (1989) lyingplanners. They are busy, not with getting forecasts right and following theAICP Code of Ethics, but with getting projects funded and built. And accu-rate forecasts are often not an effective means for achieving this objective.Indeed, accurate forecasts may be counterproductive, whereas biased fore-casts may be effective in competing for funds and securing the go-ahead forconstruction. ‘The most effective planner’, says Wachs (1989: 477), ‘issometimes the one who can cloak advocacy in the guise of scientific or tech-nical rationality.’ Such advocacy would stand in direct opposition toAICP’s ruling that ‘the planner’s primary obligation [is] to the public inter-est’ (American Planning Association, 1991: B.2).
Nevertheless, seemingly rational forecasts that underestimate costs andoverestimate benefits have long been an established formula for projectapproval (Flyvbjerg, Bruzelius and Rothengatter, 2003; Flyvbjerg andCOWI, 2004). Forecasting is here just another kind of rent-seeking behav-iour. Risk is not a result of error but of misinformation. The consequenceis a Machiavellian make-believe world of misrepresentation, which makesit extremely difficult to decide which projects deserve undertaking andwhich do not. The result is, as even one of the industry’s own organs, theOxford-based Major Projects Association (1994: 172), has acknowledged,that too many projects proceed that should not. One might add to thisobservation that many projects don’t proceed that probably should, hadthey not lost out to projects with ‘better’ misrepresentation (Flyvbjerg,Holm and Buhl, 2002).
In this situation, the question is not so much what planners can do toreduce inaccuracy and risk in forecasting, but what others can do to impose
Public planning: overestimation of demand and underestimation of costs 137

on planners the checks and balances that would give them the incentiveto stop producing biased forecasts and begin to work according to theirCode of Ethics. The challenge is to change the rules of the power play thatgoverns forecasting and project development. Here better forecasting tech-niques and appeals to ethics won’t do; institutional change with a focus onaccountability and good governance is necessary.
7.8 GOOD GOVERNANCE IN PROJECTDEVELOPMENT
As argued in Flyvbjerg, Bruzelius and Rothengatter (2003), two main typesof accountability define liberal democracies: (1) public-sector account-ability through transparency and public control, and (2) private-sectoraccountability via competition and market control. Both types of account-ability may be effective tools to curb planners’ misrepresentation in fore-casting and to promote a culture that acknowledges and deals effectivelywith risk.
In order to achieve accountability through transparency and publiccontrol, the following would be required as practices embedded in the rele-vant institutions (the full argument for the measures may be found inFlyvbjerg, Bruzelius and Rothengatter, 2003: chs 9–11):
1. National-level government should not offer discretionary grants tolocal infrastructure agencies for the sole purpose of building a specifictype of infrastructure. Such grants create perverse incentives. Instead,national government should simply offer ‘block grants’, ‘infrastructuregrants’, or ‘transportation grants’ to local governments, and let localpolitical officials spend the funds however they choose to, but makesure that every dollar they spend on one type of infrastructure reducestheir ability to fund another. This prevents the situation where ‘freemoney’ seems to be available, seen from the promoter’s perspective, asituation likely to result in waste. Instead a situation is created wherethe promoter’s own money is at stake, which should always be the case.
2. Forecasts should be made subject to independent peer review. Wherelarge amounts of taxpayers’ money are at stake, peer review may becarried out by national or state accounting and auditing offices, suchas the General Accounting Office in the USA or the National AuditOffice in the UK, who have the independence and expertise to producesuch reviews. Other types of independent review bodies may be estab-lished, for instance within national departments of finance or with rel-evant professional bodies.
138 Planning and decision-making
3. Forecasts should be benchmarked against comparable forecasts, forinstance using reference class forecasting as described in the previoussection.
4. Forecasts, peer reviews and benchmarkings should be made avail-able to the public as they are produced, including all relevant docu-mentation.
5. Public hearings, citizen juries and the like should be organised to allowstakeholders and civil society to voice criticism and support of fore-casts. Knowledge generated in this way should be integrated in plan-ning and decision-making.
6. Scientific and professional conferences should be organised where fore-casters can present and defend their forecasts in the face of colleagues’scrutiny and criticism.
7. Projects with inflated cost–benefit ratios should be reconsidered andstopped if recalculated costs and benefits do not warrant implementa-tion. Projects with realistic estimates of costs and benefits should berewarded. Politicians should keep projects at arm’s length to be free tostop and reward projects in this manner.
8. Professional and occasionally even criminal penalties should beenforced for planners and forecasters who consistently and foreseeablyproduce deceptive forecasts. An example of a professional penaltywould be the exclusion from one’s professional organisation if one vio-lates its code of ethics. An example of a criminal penalty would be pun-ishment as the result of prosecution before a court or similar legalset-up, for instance where deceptive forecasts have led to substan-tial mismanagement of public funds (Garett and Wachs, 1996).Malpractice in planning should be taken as seriously as it is in otherprofessions. Failing to do this amounts to not taking the profession ofplanning seriously.
In order to achieve accountability in forecasting via competition andmarket control, the following would be required, again as practices that areboth embedded in and enforced by the relevant institutions:
1. The decision to go ahead with a project should, where at all possible,be made contingent on the willingness of private financiers to partici-pate without a sovereign guarantee for at least one-third of the totalcapital needs.4 This should be required whether projects pass themarket test or not, that is, whether projects are subsidised or not or pro-vided for social justice reasons or not. Private lenders, shareholders andstock market analysts would produce their own forecasts or would crit-ically monitor existing ones. If they were wrong about the forecasts,
Public planning: overestimation of demand and underestimation of costs 139
they and their organisations would be hurt. The result would be morerealistic forecasts and reduced risk.
2. Full public financing or full financing with a sovereign guaranteeshould be avoided.
3. Forecasters and their organisations must share financial responsibilityfor covering cost overruns and benefit shortfalls resulting from mis-representation and bias in forecasting.
4. The participation of risk capital should not mean that governmentgives up or has reduced control of the project. On the contrary, itmeans that government can more effectively play the role it should beplaying, namely as the ordinary citizen’s guarantor for ensuring con-cerns about safety, environment, risk and a proper use of public funds.
Whether projects are public, private, or public–private partnerships (PPPs),they should be vested in one and only one project organisation with a stronggovernance framework. The project organisation may be a company or not,public or private, or a mixture. What is important is that this organisationenforces accountability vis-à-vis contractors, operators, etc., and that, inturn, the directors of the organisation are held accountable for any costoverruns, benefits shortfall, faulty designs, unmitigated risks, etc. that mayoccur during project planning, implementation and operations. The gover-nance framework should discourage organisational entrenchment, i.e., theexistence of the organisation for longer than it is needed. If the institutionswith responsibility for developing and building major infrastructure pro-jects effectively implemented, embedded and enforced such measures ofaccountability, then the misrepresentation in cost, benefit and risk estimates,which is widespread today, would be mitigated. If this is not done, mis-representation is likely to continue, and the allocation of funds for infra-structure projects is likely to continue to be wasteful and undemocratic.
7.9 CONCLUSIONS
This chapter presents evidence that a key risk in the development and man-agement of large transportation infrastructure projects is misleading fore-casts of demand and cost. Typically such risks are understated or evenignored in infrastructure planning, to the detriment of social and economicwelfare.
Risks, therefore, have a doubly negative effect in infrastructure develop-ment and management, since it is one thing to take on a risk that one hascalculated and is prepared to take, much as insurance companies and pro-fessional investors do. It is quite another matter – that moves risk-taking to
140 Planning and decision-making

a different and more problematic level – to ignore or misrepresent risks.This is especially the case when risks are of the magnitude documentedhere, with many forecasts being off by more than 50 per cent on investmentsthat measure in hundreds of millions of dollars.
Such behaviour is bound to produce losers among those financing infra-structure, be they taxpayers or private investors. If the losers, or, for futureprojects, potential losers, want to protect themselves, then the study pre-sented above shows that the risk of faulty forecasts, and related risk assess-ment and management, must be placed at the core of project developmentand management. The objective of this chapter has been to take a first stepin this direction by developing the necessary data and approach.
The policy implications of the findings are clear. First, the results showthat a major planning and policy problem – namely misinformation – existsfor this highly expensive field of public policy. Second, the size and perse-verance over time of the problem of misinformation indicate that it will notgo away by merely pointing out its existence and appealing to the good willof project promoters and planners to make more accurate forecasts.
The problem of misinformation is an issue of power and profit, and mustbe dealt with as such, using the mechanisms of transparency and account-ability we commonly use in liberal democracies to mitigate rent-seekingbehaviour and the misuse of power. To the extent that infrastructure plan-ners partake in rent-seeking behaviour and misuse of power, this may beseen as a violation of their code of ethics, that is, malpractice. Such mal-practice should be taken seriously by the responsible institutions. Failing todo so amounts to not taking the profession of planning seriously.
NOTES
1. Time may be measured by year of decision to build a project or by year of completion.The year of completing a project, with inauguration and start of operations, is histori-cally substantially more manifest than the year of decision to build. Consequently, it hasbeen a great deal easier to obtain data on year of completion than on year of decision tobuild. Data were available on year of decision to build for only 111 of the 258 projects inthe cost sample, whereas data on year of completion were available for 246 projects.Development in cost overrun over time was tested for both sets of data, although whenevaluating the dependence of cost overrun on year, it is better to use year of decision tobuild rather than year of completion; the latter includes length of implementation phase,which has influence on cost overrun, causing statistical confounding.
2. Other methods aimed at reducing inaccuracy and bias are the ‘cost estimate validationprocess’ (CEVP) developed by Washington Department of Transportation (Reilly et al.,2004), the ‘successive principle’ developed by Lichtenberg (2000), and Monte Carlo sim-ulations. These three methods typically use subjective data (normally an expert panel’sassessment of uncertainty for each of a number of components making up a plannedproject). In contrast, reference class forecasting uses empirical data on uncertainty, basedon actual, documented performance in previous comparable projects. Kahneman’s
Public planning: overestimation of demand and underestimation of costs 141
research shows that we should expect significantly more accurate outcomes of forecaststhat use empirical data compared with forecasts that use subjective data.
3. The closest we have come to an outside view on travel demand forecasts is Gordon andWilson’s (1984) use of regression analysis on an international cross-section of light-railprojects to forecast patronage in a number of light-rail schemes in North America.
4. The lower limit of a one-third share of private risk capital for such capital to effectivelyinfluence accountability is based on practical experience. See further Flyvbjerg, Bruzeliusand Rothengatter (2003: 120–23).
REFERENCES
American Planning Association (1991), ‘AICP Code of Ethics and ProfessionalConduct’, adopted October 1978, as amended October 1991, www.planning.org/ethics/conduct.html.
Brooks, J.A. and P.J. Trevelyan (1979), ‘Before and after studies for inter-urban roadschemes’, in Highway Planning and Design: Proceedings of Seminar held at thePTRC Summer Annual Meeting, University of Warwick, England from 9–12 July1979, Planning and Transport Research and Computation Co. Ltd, London:PTRC Education and Research Services Ltd: 251–66.
Bruzelius, Nils, Bent Flyvbjerg and Werner Rothengatter (2002), ‘Big decisions, bigrisks: Improving accountability in mega projects’, Transport Policy, 9 (2): 143–54.
Flyvbjerg, Bent (1996), ‘The dark side of planning: rationality and realrationalität’,in Seymour Mandelbaum, Luigi Mazza and Robert Burchell (eds), Explorationsin Planning Theory, New Brunswick, NJ: Center for Urban Policy Research Press:383–94.
Flyvbjerg, Bent (1998), Rationality and Power: Democracy in Practice, Chicago, IL:University of Chicago Press.
Flyvbjerg, Bent (2005), ‘Measuring inaccuracy in travel demand forecasting:methodological considerations regarding ramp up and sampling’, TransportationResearch A, 39 (6): 522–30.
Flyvbjerg, Bent (2006), ‘From Nobel prize to project management: gettingrisks right’, Invited plenary paper, Project Management Institute ResearchConference, Montreal, July: 16–19.
Flyvbjerg, Bent and COWI (2004), Procedures for Dealing with Optimism Bias inTransport Planning: Guidance Document, London: UK Department forTransport.
Flyvbjerg, Bent, Nils Bruzelius and Werner Rothengatter (2003), Megaprojects andRisk: An Anatomy of Ambition, Cambridge, MA: Cambridge University Press.
Flyvbjerg, Bent, Mette K. Skamris Holm and Søren L. Buhl (2002), ‘Cost underes-timation in public works projects: error or lie?’, Journal of the American PlanningAssociation, 68 (3): 279–95.
Flyvbjerg, Bent, Mette K. Skamris Holm and Søren L. Buhl (2003), ‘How commonand how large are cost overruns in transport infrastructure projects?’, TransportReviews, 23 (1): 71–88.
Flyvbjerg, Bent, Mette K. Skamris Holm and Søren L. Buhl (2006), ‘Inaccuracy intraffic forecasts’, Transport Reviews, 26 (1): 1–24.
Fouracre, P.R., R.J. Allport and J.M. Thomson (1990), The Performance and Impactof Rail Mass Transit in Developing Countries, TRRL Research Report 278,Crowthorne, Berkshire, UK: Transportation and Road Research Laboratory.
142 Planning and decision-making

Fullerton, B. and S. Openshaw (1985), ‘An evaluation of the Tyneside Metro’, inK.J. Button and D.E. Pitfield (eds), International Railway Economics: Studies inManagement and Efficiency, Aldershot, UK: Gower: 177–208.
Garett, Mark and Martin Wachs (1996), Transportation Planning on Trial: TheClean Air Act and Travel Forecasting, Thousand Oaks, CA: Sage.
Gilovich, Thomas, Dale Griffin and Daniel Kahneman (eds) (2002), Heuristics andBiases: The Psychology of Intuitive Judgment, Cambridge, MA: CambridgeUniversity Press.
Gordon, Peter and Richard Wilson (1984), ‘The determinants of light-rail transitdemand: an international cross-sectional comparison’, Transportation ResearchPart A: Policy and Practice, 18A (2): 135–40.
Hall, Peter (1980), Great Planning Disasters, Harmondsworth, UK: Penguin Books.Kahneman, D. (1994), ‘New challenges to the rationality assumption’, Journal of
Institutional and Theoretical Economics, 150: 18–36.Kahneman, D. and A. Tversky (1979), ‘Prospect theory: an analysis of decisions
under risk’, Econometrica, 47: 313–27.Kain, John F. (1990), ‘Deception in Dallas: strategic misrepresentation in rail
transit promotion and evaluation’, Journal of the American Planning Association,56 (2): 184–96.
Lichtenberg, Steen (2000), Proactive Management of Uncertainty Using theSuccessive Principle, Copenhagen: Polyteknisk Press.
Lovallo, Dan and Daniel Kahneman (2003), ‘Delusions of success: how optimismundermines executives’ decisions’, Harvard Business Review, July: 56–63.
Mackinder, I.H. and S.E. Evans (1981), The Predictive Accuracy of BritishTransportation Studies in Urban Areas, Supplementary Report 699, Crowthorne,Berkshire, UK: Transportation and Road Research Laboratory.
Major Projects Association (1994), Beyond 2000: A Source Book for Major Projects,Oxford: Major Projects Association.
National Audit Office (1988), Department of Transportation, Scottish DevelopmentDepartment and Welsh Office: Road Planning, London: Her Majesty’s StationeryOffice.
National Audit Office (1992), Department of Transportation: Contracting for Roads,London: National Audit Office.
Nijkamp, Peter and Barry Ubbels (1999), How reliable are estimates of infrastruc-ture costs? A comparative analysis’, International Journal of TransportEconomics, 26 (1): 23–53.
Pickrell, Don H. (1990), Urban Rail Transit Projects: Forecast Versus ActualRidership and Cost, Washington, DC: US Department of Transportation.
Priemus, Hugo (2007), ‘Development and design of large infrastructure projects:disregarded alternatives and issues of spatial planning’, Environment andPlanning B, 34 (4): 626–44.
Reilly, J., M. McBride, D. Sangrey, D. MacDonald and J. Brown (2004), ‘The devel-opment of CEVP®: WSDOT’s Cost-Risk Estimating Process’, Proceedings,Boston Society of Civil Engineers, Fall/Winter.
Richmond, Jonathan E.D. (1998), New Rail Transit Investments: A Review,Cambridge, MA: Harvard University, John F. Kennedy School of Government.
Richmond, Jonathan E.D. (2001), ‘A whole-system approach to evaluating urbantransit investments’, Transportation Reviews, 21 (2): 141–79.
Royal Town Planning Institute (2001), ‘Code of professional conduct’, amended bythe Council on 17 January, available at www.rtpi.org.uk.
Public planning: overestimation of demand and underestimation of costs 143

Skamris, Mette K. and Bent Flyvbjerg (1997), ‘Inaccuracy of traffic forecasts andcost estimates on large transportation projects’, Transportation Policy, 4 (3): 141–6.
Szyliowicz, Joseph S. and Andrew R. Goetz (1995), ‘Getting realistic aboutmegaproject planning: the case of the new Denver international airport’, PolicySciences, 28 (4): 347–67.
Van Wee, Bert (2007), ‘Large infrastructure projects: a review of the quality ofdemand forecasts and cost estimations. A review of literature’, Environment andPlanning B, 34 (4): 611–25.
Wachs, Martin (1986), ‘Technique vs. advocacy in forecasting: a study of rail rapidtransit’, Urban Resources, 4 (1): 23–30.
Wachs, Martin (1989), ‘When planners lie with numbers’, Journal of the AmericanPlanning Association, 55 (4): 476–9.
Wachs, Martin (1990), ‘Ethics and advocacy in forecasting for public policy’,Business and Professional Ethics Journal, 9 (1–2): 141–57.
Walmsley, D.A. and M.W. Pickett (1992), The Cost and Patronage of Rapid TransitSystems Compared with Forecasts, Research Report 352, Crowthorne, Berkshire,UK: Transportation and Road Research Laboratory.
Watson, Vanessa (2003), ‘Conflicting rationalities: implications for planning theoryand ethics’, Planning Theory and Practice, 4: 395–408.
Webber, Melvin M. (1976), The BART Experience: What have we Learned?,Monograph no. 26, Berkeley, CA: University of California, Institute ofTransportation Studies.
World Bank (1994), World Development Report 1994: Infrastructure forDevelopment, Oxford: Oxford University Press.
Yiftachel, Oren (1998), ‘Planning and social control: exploring the dark side’,Journal of Planning Literature, 12 (4): 395–406.
144 Planning and decision-making
8. Evolving strategy: risk managementand the shaping of mega-projects1
Roger Miller and Donald R. Lessard
8.1 INTRODUCTION AND OVERVIEW
Project management is often equated with methods that decompose aproject into discrete elements, determine their sequencing, and track theircompletion. Our review of large-scale engineering projects reveals adifferent reality. In the early stages in particular, project management con-sists of a series of shaping episodes, first to explore if there is a project, thento recruit participants and explore potential bases of collaboration amongthem, then to flesh out a holistic proposal – a script for the project if youwill – then to advocate and negotiate more precisely the shape of the projectand the roles of the various parties, and finally to reach closure and a finalagreement. It is at this point that traditional ‘decomposing’ project man-agement begins. Along the way, projects are often abandoned, or theprocess returns to an earlier stage because of obstacles encountered or newinsight or interests that develop.
Rather than a ‘Microsoft Project’, the more apt metaphor is a sequenceof real options, each of which is shaped and then either exercised or aban-doned. In fact, as is often the case with cutting-edge practice, managershave been successful at creating value through the development and exer-cise of sequential options without explicitly framing the process in optionsterms, and without explicitly valuing these options since the emphasis is onwhether there is a positive value option that justified going forward ratherthan determining an exact price.
The real-options framework is based on the same logic as that offinancial options as developed by Black and Scholes (1974). It recognisesthat the decisions that determine project cash flows are made sequentiallyover many episodes. The key insight of this approach is that uncertainty orvolatility may actually increase the value of a project, as long as flexibilityis preserved and resources are not irreversibly committed. As a result, theeconomic value of a project when it is still relatively unformed is oftengreater than the discounted present value of the expected future cash flows.
145

Value is increased through the creation of options for subsequent sequen-tial choices and exercising these options in a timely fashion. Thus sponsorsseek projects that have the potential for large payoffs under particular insti-tutional and technical circumstances. Our study illustrates the rich varietiesof mechanisms through which these options are shaped and exercised overthe life of the project – the real management that is integral to real options.
Large engineering projects (LEPs) are high-stakes games characterisedby substantial irreversible commitments, skewed reward structures whenthey are successful, and high probabilities of failure. Their dynamics alsochange over time. The journey from initial conception to ramp-up andrevenue generation takes ten years on average. While the ‘front end’ of aproject – project definition, concept selection, and planning – typicallyinvolves less than one-third of the total elapsed time and expense, it has adisproportionate impact on outcomes, as most shaping actions occurduring this phase. During the ramp-up period, the reality of market esti-mates and the true worth of the project are revealed. Sponsors may find thatactual conditions are very different from expectations, but only a few adap-tations are possible. Once built, most projects have little flexibility in usebeyond the original intended purpose. Managing risks is thus a real issue.
The purpose of this chapter is to sketch out the various components ofrisk and outline ranges of strategies for coping with risks and turbulencebased on an assessment of 60 projects as part of the IMEC (InternationalProgram in the Management of Engineering and Construction) study.Furthermore, we propose the elements of a governance system to mastertheir evolutionary dynamics. The main finding is that successful projectsare not selected but shaped. Rather than choosing a specific project conceptfrom a number of alternatives at the outset based on projections of the fullsets of benefits, costs and risks over the project’s lifetime, successful spon-sors start with project ideas that have the potential to become viable. Thesesponsors then embark on shaping efforts to influence risk drivers rangingfrom project-related issues to broader governance. The seeds of success orfailure of individual projects are thus planted early and nurtured over thecourse of the shaping period as choices are made. Successful sponsors,however, do not escalate commitments, and they abandon quickly whenthey recognise that projects have little possibility of becoming viable.
Two other key concepts related to risk that emerge from the study aregovernability – the creation of relationships that allow a project to bereconstituted and proceed even after major changes in project drivers andthe resulting payoffs to the various parties involved – and turbulence – thetendency for risks to compound dramatically once things begin going offtrack. In our view, projects are dynamic, iterative and often chaoticsystems: project-management architectures must reflect this. While they
146 Planning and decision-making

tend to resemble a spiral more than the classic waterfall, even this metaphormay be too orderly. Projects are better viewed as evolutionary and path-dependent systems composed of episodes displaying different dynamics.
These findings apply equally, albeit in somewhat different ways, to thethree distinct classes of risk (in terms of their causes) encountered in mostprojects: those emanating from the dynamics of the project itself (techni-cal and operational risks); those associated with the markets with which theproject interacts (market risks); and those related to the political, social andeconomic setting of the project (institutional/social risks).
In this chapter, we first discuss the IMEC project and the sample of pro-jects that underlie it. Our focus is mostly on front-end choices. We thendescribe the nature of risks encountered in projects and assess the variousstrategies that successful projects employ to cope with these risks. Using thesedescriptions, we highlight the extent to which project management in the faceof risk is a sequence of shaping episodes, and then we draw conclusions.
8.2 THE IMEC STUDY AND LARGE ENGINEERINGPROJECTS
The IMEC study grew out of the noted difficulties in project delivery thatbecame public (Miller and Lessard, 2001). As long as governments andbusinesses were content to rely on traditional financing, governance andmethods, there was no need for innovative approaches. However, as publicfinancing became tight and many projects become more financially, politi-cally and socially complex, methods that had served their purpose in thepast were no longer sufficient.
IMEC was thus set up to understand the changes that were occurring. Toour knowledge, there had been no recent attempts to study, evaluate andpresent a systematic analysis of the new approaches to large projects exceptthe initiatives of the UK Treasury Board (HM Treasury, 2006), BentFlyvbjerg and his colleagues on mega-projects and risks (Flyvbjerg et al.,2003) and the book by Thomas Hughes, Rescuing Prometheus (Hughes,1998). To counter the objection that each project is unique and that gener-alisations are therefore impossible, we decided to undertake groundedresearch to understand what leads to success or failure, using a sample of60 LEPs. The goal was to identify the practices that, in the experience ofexecutives involved in projects, really made a difference. The IMEC studywas distinctive in several ways. First, it was an international field study.The study sums up the collective experience from Europe, North andSouth America, and Asia. In general, seven to eight participants – spon-sors, bankers, contractors, regulators, lawyers, analysts and others – were
Evolving strategy: risk management 147

interviewed for each of the 60 projects. Second, it involved systemic andstrategic perspectives. Particular emphasis was placed on front-end devel-opment decisions, but execution and initial ramp-up to operation were alsostudied. Calling upon a range of disciplines, the IMEC study focused onthemes such as coping with uncertainty through risk analysis, institutionshaping and strategies. Finally, projects were selected from a range ofdomains. The 60 projects included 15 hydroelectric dams, 17 thermal andnuclear power plants, 6 urban transport facilities, 10 civil infrastructureinvestments, 4 oil platforms, and 8 technology initiatives.
Projects differ substantially in terms of the intensity of the social/insti-tutional, technical and market-related risks that they pose to sponsors(see Figure 8.1 for the IMEC sample). For instance, oil platforms aretechnically difficult, but they typically face few institutional risks becausethey are built far from public attention and bring high direct benefits totheir sponsors and affected parties. Hydroelectric power projects tend tobe moderately difficult in so far as engineering is concerned, but verydifficult in terms of social acceptability. Nuclear power projects pose hightechnical risks but still higher social and institutional risks. Road andtunnel systems present very high levels of risk, as rock formations usuallyhide big surprises and markets are difficult to predict when user fees areapplied. Market risks faced by roads, bridges and tunnels are especiallyhigh when private sponsors build them under concessionary schemes.Urban transport projects that meet real needs pose average market andsocial/institutional risks. However, they pose technical risks, as theyoften involve underground geological work that affects costs. R&Dprojects present scientific challenges but face fewer social acceptabilityand market difficulties, as they can be broken into smaller testableinvestments.
8.3 THE NATURE OF RISKS IN PROJECTS
Risk is the possibility that events, their resulting impacts and their dynamicinteractions will turn out differently than anticipated. Risk is typicallyviewed as something that can be described in statistical terms, while uncer-tainty is viewed as something that applies to situations in which potentialoutcomes and causal forces are not fully understood. In this chapter, bothrisks and uncertainties will be referred to as risks. Risks are multidimen-sional and thus need to be unbundled for a clear understanding of causes,outcomes and drivers.
In the IMEC study, managers were asked to identify and rank the risksthey faced in the early front-end period of each project (Miller and Lessard,
148 Planning and decision-making

2001). Market-related risks dominated in terms of mentions (41.7 per cent),followed by technical risks (37.8 per cent), and institutional and sovereignrisks (20.5 per cent). Figure 8.2 illustrates the frequency of mentions of therisks that managers identified as important in their projects.
Evolving strategy: risk management 149
Figure 8.1 A taxonomy of LEPs in the IMEC sample
Social andinstitutional
risks
Hydroelectric power projects
Urban transport projects
Road and tunnel systems
R&D projects
Thermal power projects
Nuclear power projects
Oil platforms
Market risks
Tec
hnic
al r
isks
Figure 8.2 Major risks in LEPs, IMEC study
TechnicalConstruction
Operational
Low
5
10
15
20 Market
Financial
Supply
Social acceptability
Regulatory
Sovereign
Rel
ativ
e fr
eque
ncy
(%)
Completion risks Market-related risks Institutional risks

Market-related Risks
The ability to forecast demand varies widely, thus creating high levels ofrisk. The output of oil projects is a fungible commodity sold in highly inte-grated world markets: probabilistic forecasts are possible. In contrast,many road projects face a specific set of customers; however, users of high-ways, tunnels, bridges, airports and ports often have alternatives, and fore-casting behaviour is extremely difficult. Failures to reach traffic volumeseriously threaten business models.
The market for financial inputs depends on prior risk management.2
Unless all risks have been addressed by sponsors, financial markets are hardto convince. Many projects that offer an adequate prospective return areunable to go forward because of the parties’ inability to work out accept-able risk-sharing arrangements. Supply risks are similar to market risks:both involve price and access uncertainties. Supply may be secured throughcontracts, open purchases, or ownership.
Completion Risks
Projects face technical risks that reflect their engineering difficulties anddegrees of innovation: some of these risks are inherent in the designsemployed. Construction risks refer to the difficulties that sponsors, primecontractors and contractors may face in the actual building of the project.Execution risks refer to issues that arise from errors or conflicts in the taskbreakdown, schedule and so on.3 Operational risks refer to the possibility thatthe project will not function as expected – for example, that the availability,capacity, or operating efficiency will turn out to be lower than anticipated.
Institutional Risks
The ability of projects to access key resources or to appropriate the returnsfrom operations in order to repay debts and recoup and profit from invest-ments depends on the laws, regulations and norms that govern the appro-priability of returns, property rights and contracts. Some countries aregoverned under constitutional frameworks and the rule of law, while othersare led by powerful political parties or clans. Institutional risks refer tounexpected changes in these rules and norms that somehow alter the projectpayoffs. They are typically seen as greatest in emerging economies – coun-tries whose laws and regulations are incomplete and in a state of flux –although the risks associated with community opposition to projects (theNIMBY phenomenon) or changes in environmental regulations may be asgreat or greater in highly developed countries.
150 Planning and decision-making

Regulations concerning pricing, entry, unbundling and other elementsare presently undergoing major changes in many countries, thus openingopportunities. Social-acceptability risks refer to the likelihood that spon-sors will meet opposition from local groups, economic-development agen-cies and influential pressure groups. Sovereign risks, in turn, involve thelikelihood that a government will decide to renegotiate contracts, conces-sions, or property rights.
Many of these risks emerge only over time. Emerging opportunities or risksmay call for changes in project configurations. Benefits may outweigh costsbut the reverse can also be true. Projects that appeared sound at one point intime all of a sudden become ungovernable. Events burst out and interact tocreate turbulence. Figure 8.3 illustrates the evolution of risks that emerge andchallenge sponsors. Many risks are linked to the life cycle of the project: reg-ulatory risks, for instance, diminish very soon after permits are obtained,while technical risks drop as engineering experiments are performed.
Turbulence
While strictly speaking not an additional category of risk, one aspect ofrisk that we observed in many projects was turbulence. Turbulence refers to
Evolving strategy: risk management 151
Figure 8.3 The evolution of risks over a project’s life
0 1 2 3 4 5 6 7 8 9 10 11 12 13Project’s early life (years)
Sub
ject
ive
eval
uatio
n of
ris
ksOperating risksMacro risksCompletion risksInstitutional/regulatory risksMarket risks

the way that consequences of events are compounded in unforeseen ways,even if the initial event lies within a range of possibilities that was knownin advance, but often more seriously in the case of events that are truly ‘sur-prises’. In the face of such difficulties, some parties have a tendency to leaveprojects or minimise their losses, perhaps at the expense of other partici-pants. Moves and countermoves lead to a vortex that causes project demise.Without a set of institutional and governance devices to contain degrada-tion, otherwise viable projects sink into deadlocks. In the case of a majorcivil transportation project, the discovery of geological conditions thatwere different from those planned for but well within the range of possibil-ities and did not represent that large a change in overall project economics,for example, allowed opponents to raise multiple issues that ultimatelycaused the collapse of the entire project.
Opportunity Failures and Oversights
Opportunity failures refer to the risk of missing a good opportunity toimprove value or to reduce costs due to error, inadvertence, or even design.While an opportunity failure may be seen as a risk event resulting from acompletion or social/institutional cause, the accumulation of such over-sights in a project may itself become a cause of a governance crisis. Failuresto capture opportunities do not threaten a project’s continuity when thepublic or private sponsors remain unaware of what could have beenachieved. When, however, there is a consensus that too many opportunitieshave been lost, the sponsor or other key players may lose legitimacy in theeyes of others, and the fabric of agreements required to sustain the projectbreaks down.
Oversight risks are particularly salient when projects are constructedusing the traditional mode of contracting, in which the sponsors defineexpectations in detail and call for bids for execution: since these arrange-ments typically have no mechanisms for responding to opportunities andchanges in circumstances, they generate oversights. In contrast, new modesof governance that rely on partnerships or relational contracts may allowthe incorporation of changes and trigger innovative solutions that reducethe likelihood of such oversights.
8.4 APPROACHES TO MANAGING RISK IN LARGEENGINEERING PROJECTS
Theoretical perspectives on structuring and coping with risks range fromnarrow, technical analysis to systemic political and institutional approaches.
152 Planning and decision-making
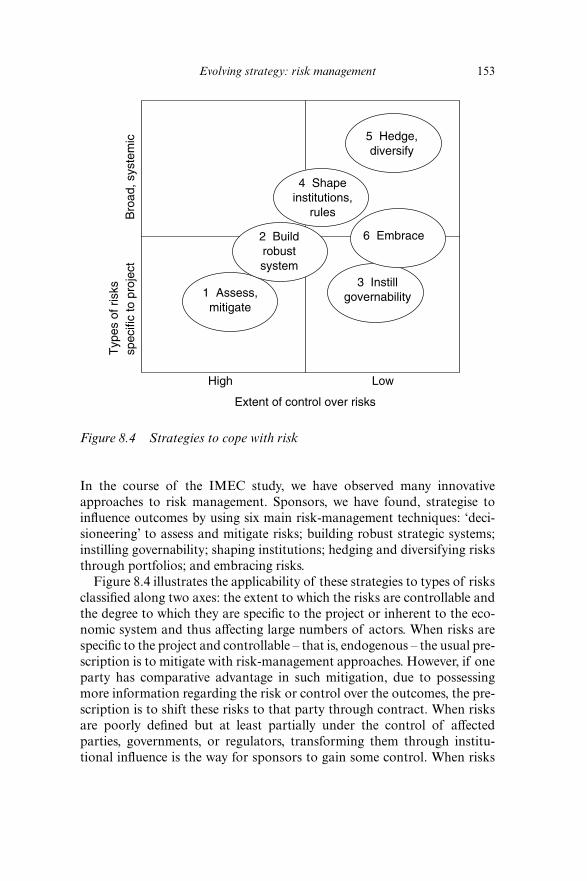
In the course of the IMEC study, we have observed many innovativeapproaches to risk management. Sponsors, we have found, strategise toinfluence outcomes by using six main risk-management techniques: ‘deci-sioneering’ to assess and mitigate risks; building robust strategic systems;instilling governability; shaping institutions; hedging and diversifying risksthrough portfolios; and embracing risks.
Figure 8.4 illustrates the applicability of these strategies to types of risksclassified along two axes: the extent to which the risks are controllable andthe degree to which they are specific to the project or inherent to the eco-nomic system and thus affecting large numbers of actors. When risks arespecific to the project and controllable – that is, endogenous – the usual pre-scription is to mitigate with risk-management approaches. However, if oneparty has comparative advantage in such mitigation, due to possessingmore information regarding the risk or control over the outcomes, the pre-scription is to shift these risks to that party through contract. When risksare poorly defined but at least partially under the control of affectedparties, governments, or regulators, transforming them through institu-tional influence is the way for sponsors to gain some control. When risks
Evolving strategy: risk management 153
Figure 8.4 Strategies to cope with risk
LowHigh
Extent of control over risks
Typ
es o
f ris
kssp
ecifi
c to
pro
ject
3 Instillgovernability1 Assess,
mitigate
6 Embrace
5 Hedge,diversify
4 Shapeinstitutions,
rules
2 Buildrobustsystem
Bro
ad, s
yste
mic
apply broadly but are not under the control of any of the parties, the pre-ferred approach is to transfer them through hedging transactions whenmarkets exist or through insurance when it is priced efficiently. Sponsorsmust be prepared to embrace the remaining risk, and typically enhancetheir ability to do so by diversifying exposure through forming portfoliosof projects, or equivalently, syndicating out parts of some projects tobalance their overall exposure.
Classic Decisioneering Approaches to Assessing and Controlling Risks
Decisioneering approaches view projects as initiatives that can be plannedunder conditions of calculable risks. Careful analyses of trade-offs betweencosts and risks, it is argued, can yield good approximations for the appro-priate timing of investment in projects. Accelerating a project will increasedevelopment costs to the point that there is a danger of sinking it.Proceeding with prudence increases the danger of missing the opportunitythat the project aims to capture.
This perspective, typical of much of the project-management literature(Cleland and Ireland, 2006) assumes an environment in which the range ofissues facing a project is more or less constant and current quantita-tive trends can be easily extrapolated into the future. Decisioneeringapproaches can be grouped into two basic streams. The first are quantita-tive sensitivity analyses that investigate the impact that possible deviationsin some variables, such as anticipated costs, may have on financial perfor-mance. The second are probabilistic approaches – using scenario analysis,decision trees, or influence diagrams – that provide more sophisticatedalternatives to sensitivity analysis and, in some cases, link the assessment ofrisk to choices and actions. Sensitivity analysis and similar approaches arehelpful for making go/no-go decisions by eliminating the projects with highanticipated performance variability. However, because they focus on aggre-gate variables, they are less useful for the concrete and detailed shaping ofa strategic system through specific choices and actions.
Building Robust Strategic Systems
Sponsors of projects deal with anticipated risks, constraints and issues bycreating strategic systems with scope. Large-scale projects potentially faceseveral classes of risks: sponsorship/development, market, social accept-ability, regulatory and political, financial, execution and operation. A largeportion of the risks are addressed through project-specific strategies toreduce the odds of negative events or the maximal negative impact thatsuch events may have on the project. We identified five classes of strategies
154 Planning and decision-making

(summarised in Table 8.1): information/selection, co-optation, allocation,design and action.
‘Information/selection strategies’ refer to the approaches that managersuse to gather information about the project and its environment, as well asto shape and approve the project concept, and to identify and decide on thebest strategies. We identified three classes of information/selection strategies:studies, private search and relational probing. ‘Studies’ refers to ‘impersonal’and ‘objective’ information-gathering approaches such as comparative costs
Evolving strategy: risk management 155
Table 8.1 Devices used in building strategic systems
Information search Research and studiesExpert judgementsDebates, scenarios, risk seminarsMultidisciplinary strategy teams
Network building and co-optation Early involvement of financiers,operators and others
Public–private partnershipsAlliance of owners sharing equityPartnerships with suppliers/contractorsCoalitions with affected parties
Structures of incentives, and Risks/decision rights allocationcontracts Type and number of contracts
Incentives/penaltiesFrame agreementsMethods of contractor selection
Project/design configuration Select geographical location/siteComplementary investments and linkages
Contract flexibility, ability torestructure
Flexible/modular technical solutionsFlexible contracts/contractual options
Influence and bold actions Educate regulator, rating agencies,and others
Side payments: compensation, add-onsPre-emptive action, signalsClimate of optimismWindows of opportunitySignal probity (e.g. bidding)Seek and improve on legalrequirements
Change laws and regulations

estimates, forecasts, tests and simulations. In this class, selection emphasisestheoretical models and bureaucratic procedures. The ‘private search’ classinvolves the use of a network of personal contacts to obtain ‘privileged’information; it often requires a history of previous joint work and trust.Selection takes the form of early commitment to and relentless but flexiblepursuit of a single opportunity. ‘Relational probing’ refers to lengthy face-to-face interactions with potential participants, such as banks, regulators,clients, suppliers, engineering and construction firms, operators and affectedparties, during which the information emerges and the concept is directlytested. Like personal searches, relational probing strategies proactivelyuncover flaws or risks and focus on meeting potential opponents and criticsof the project, rather than supporters. Selection relies on iterative discussionand negotiation to expose unworkable alternatives and stimulate the emer-gence of a better project concept. The information/selection approach usedwill influence the extent to which risks are identified and the quality of thesolutions and strategies that will be produced.
‘Co-optation strategies’ secure a basic set of ‘core competencies’, such astechnical and construction skills, which will increase the odds for success incritical areas of project execution and ensure access to ‘resources’ such asmarkets, financing and even public support. The first step in co-optation isdeciding which resources can be provided by the owner’s business units orsubsidiaries. Some projects, however, require bringing independent partic-ipants on board through ‘partnership’ links – as co-owners, joint-venturepartners, or equity investors. Alternatively, resources can be co-optedthrough contracts and formal agreements such as project financing and taxtreaties. Then again, access to some resources may be achieved throughinformal ‘engagement’ links with communities and other stakeholders inorder to obtain their support.
‘Allocation strategies’ refer to the detailed ways in which rights, respon-sibilities, rewards and risks are apportioned between participants throughpricing, transfer, penalty, incentive and other contractual clauses. Parties toa contract delimit their respective responsibility areas – what each of themhas to provide to the other party, when, and under what conditions. Forinstance, a joint venture between an electric utility and an independent firmcontains agreements that stipulate that the utility provides a site for thegasification plant and guarantees the supply and quality of coal, deminer-alised water and auxiliary power. The utility has the obligation to accept allthe synthetic gas that meets the quality requirements and owns all the by-products that result from the gasification process. Failure to supply therequired quantities reliably triggers the payment of penalties.
Price-determination formulas are another frequently used allocation strat-egy. Cost-reimbursement contracts allocate risks to the owner; fixed-price
156 Planning and decision-making

contracts transfer the cost-overrun risk to the contractor. In cost-incentiveand performance-based price-determination schemes, the owners and con-tractors share the risks and rewards. In many power plant projects theprice of the turnkey contract increases if the contractors deliver the plantearly or if performance tests reveal that real plant capacity is larger thanspecified capacity. Other risk-allocation strategies limit the negative conse-quences for one of the parties to a contract. For instance, utilities ofteninclude clauses that allow them to cancel contracts with independent devel-opers if regulators do not allow them to fully recover the contract costsfrom their customers. Economic-dispatch formulas can be designed to passon the additional costs resulting from operating a power plant at suboptimalcapacity to the electric utility that purchases the power and dispatches theplant.
‘Design strategies’ involve the use of technical, organisational, sched-uling and financial choices to reduce the likelihood and impact of risks.One spectacular example of a technical solution used mainly for politicalrisks is the building of power plants on barges that can be towedaway from the host country in case of difficulties. Other examples aretechnical solutions that reduce the supply risk by providing fuelflexibility and economic development initiatives to gain the support oflocal communities.
‘Action strategies’ include confronting opponents using legal or infor-mational means; persuading other participants and stakeholders such asbanks, rating agencies, regulators, politicians, publics and opponents;making gestures that legitimate the project in the eyes of the regulators orthe communities; developing alternatives to be used if the preferred courseof action is blocked by an adverse event; and taking pre-emptive steps tosignal commitments. For instance, faced with the prospect of socialopposition, the owners of the ITA power plant project in Brazil establisheda public relations centre in the community and organised town-hall meet-ings at which the project was explained. Opposition weakened and the pop-ulation became an ally of the project. Traditionally, engineering firmsdesign projects under a cost-reimbursement contract, and constructionis contracted using fixed-price or unit-price contracts. More recently,engineering–procurement–construction and turnkey contracts group theseactivities together to better align incentives between engineering and con-struction. BOT (build–operate–transfer)-like schemes, which make a singlefirm or consortium responsible not only for developing, designing andbuilding the project but also for operating it for a long period of time,propose an even more radical way of aligning incentives. Finally, partici-pant selection procedures may range from invited negotiations to open andpublic calls for bids.
Evolving strategy: risk management 157

Instilling Governability
Diligent sponsors do not sit idle, waiting for the probabilities to yield a ‘win’or a ‘loss’, but work hard to influence outcomes and turn the selected initialoption into a success. They shepherd their choices in light of changing con-ditions and often succeed against the odds. Governability is enabled byinstilling a series of properties in projects: cohesion, reserves, flexibility andgenerativity (Miller and Floricel, 2005). These four properties are oftencontradictory, so a balance must be sought. For instance, strong inter-organisational bonds increase cohesion but limit flexibility. Hierarchicallinks create inefficiencies, while long-term contracts bring rigidities. Short-term contracts do not provide sufficient stabilisation of the future to induceadequate investment. Increasing flexibility through design and incentivesmay reduce the efficiency of the project.
‘Cohesion’ is the property that results in participants’ staying with theproject and solving the problems caused by turbulence, instead of exitingas crises erupt. The main sources of cohesion are the bonds between projectparticipants resulting from co-optation strategies and informal linkscreated during project execution or early operation. Still other bonds arethe result of collateral ties between the organisations participating in aproject.
Inadequate cohesion leads to disintegration. Cohesion emerged quiteunexpectedly as the basic governability property: one cannot govern aproject that is disintegrating; flexibility is clearly not enough. To supportcohesion reserves can be built into the institutional arrangements sur-rounding it. In fact, ownership is the dominant factor in building reserves.Co-optation and sharing, used to deal with anticipated risks, also build inthe ability to respond to turbulence. Reserves are frequently incorporatedinto execution budgets and schedules; contingency allowances in budgetedcosts are a common practice for dealing with cost and schedule variability.Finally, reserves can be designed into projects through redundancies andslack resources.
‘Flexibility’ is the property that enables a project to be restructured aschoices, actions and commitments, which initially stabilised the future,change when unexpected events occur. Flexibility can be achieved by usingstrategies that do not produce long-term constraints, offer other avenuesfor action, or reduce the costs of restructuring and pursuing alternatives.These costs can be reduced through co-optation and design strategies thatemphasise modularity, in which no element of the project is critical byitself. Contractual structures associated with co-optation and allocationstrategies are among the main sources of lack of flexibility. The same long-term contracts that reduce market and fuel-supply risks in independent
158 Planning and decision-making
projects may block efforts to respond to new market realities. Contractsoften create rigidity at the interface between owner and contractor: as con-tractors stick to specifications, changes required by the owner will be veryexpensive.
‘Generativity’ is the ability to develop creative responses to situationsthat appear difficult. Response generation presupposes correct sensing andinterpretation, as well as the time and attention needed to produce con-structive rather than destructive debates. Co-optation strategies, especiallythose that bring in participants with different competencies, may help.Having many points of view and access to different networks also meansthat adverse developments will probably be detected earlier and differentperspectives will be brought into the discussion. For instance, unlike pro-jects financed on the balance sheet, project financing brings banks, invest-ment advisers, rating agencies and consulting engineers to the heart ofproject debates. Creative individuals bring in new perspectives from outsidethe circle of managers who normally participate in the project. With theirdifferent experiences, they can sense danger and propose innovative solu-tions. On the other hand, numerous participants and contractual interfaceshamper creativity, especially when parties focus on contracts instead ofproblem-solving.
Shaping Institutional Arrangements
Sponsors attempting to anchor projects often find that laws and regulationsare incomplete. Many projects serve to unlock new models of project deliv-ery (for example, the first BOTs were developed in the 1980s). One-third ofthe projects analysed by IMEC required at least one change in laws andrules. Concession rights, property rights, economic regulations, or foreign-investment rules needed to be modified. More than one-quarter required oraccompanied changes in property rights: land rights, water rights, monop-oly on or improvements to BOT and concession frameworks. Changes tolaws and regulations in capital markets were also frequent. A few projectscalled for new environmental frameworks.
The main function of institutional arrangements is to help anchor pro-jects in their economic and political contexts, and ensure that investmentswill be repaid and social utility provided. Unless they are solidly anchored,projects will be at the mercy of shifting interests, caprices and opportunis-tic moves. Sponsors will seek institutional arrangements to buttress LEPs.
Stabilisation of the long-term future to enable investmentsLegal and regulatory frameworks, such as sector regulations and conces-sion frameworks, help to reduce risks by minimising opportunities for
Evolving strategy: risk management 159

clients, communities, or governments to attempt to capture revenues afterthe investment is sunk. The goal is to create the prospect of secure streamsof funds in the long term to cope with the various uncertainties that canaffect the project. To secure streams of revenues, the approach throughoutmost of the twentieth century has been to assign sponsorship and owner-ship to network operators. Recently, power-purchase agreements, in whichthe regulator or the state forces network operators to sign long-term supplycontracts with independent producers, have been used as a tool for provid-ing revenue flows. Concessions by the state to sponsors also provide aframework for future revenues but are less secure.
Flexibility to face turbulenceDuring the front-end development of projects, when agreements are negoti-ated and commitments made, managers develop specific strategies to copewith foreseeable risks; they cannot, however, develop specific ways to copewith ‘surprise’ events. Turbulence is likely to arise given the long time spanrequired for development. Flexibility is provided by elements of institutionalarrangements that enable projects to undergo rescheduling, restructuring, orbankruptcy. The flexibility provided by institutional arrangements helpsmany projects survive unforeseen events.
Enhancing the legitimacy of projects, participating organisations andagreementsMany projects face opposition from interest groups. Laws, regulations andpractices that create well-structured assessment frameworks enable spon-sors and interest groups to air their views through public hearings, and evento oppose decisions through appeal procedures. Public-bidding frame-works structure the orderly selection of ‘fit’ sponsors and provide legiti-macy. Practices such as inviting representatives of the public into planningand design meetings and proactively consulting conservationist groups andenvironmental regulators help to find credible solutions and reduce the like-lihood of protest.
Frameworks for structuring voice, decision-making and public trade-offs make it possible to choose public transportation systems, erect powerplants and, in some countries, build nuclear facilities. To manage social-acceptability risks in siting of power plants in Japan, for instance, theThree Power Source Laws System was put in place by the JapaneseMinistry of International Trade and Industry. This framework structurespublic consultations and hearings across the country; the population isconsulted on choice of eventual sites for projects and their technicalfeatures.
160 Planning and decision-making

Portfolios, Insurance and Hedging
The principle of diversification is applied in projects in many different ways.In many projects, three applications were observed. First, sponsors of riskyprojects likely to face turbulence from disturbances caused by economiccrises or government behaviours build a diversified portfolio across sectorsand jurisdictions to balance risks and cash flows. Positive variations in a fewcompensate for negative outcomes in others. While sponsors may be able toinfluence some behaviour, these risks – particularly those of overall macro-economic conditions or general policy changes – are by and large beyondthe control of project participants. Diversification generally is the soleoption. Second, sponsors may hedge against possible losses due to currencyfluctuations or commodity exposures by employing financial derivatives orother structures to shift these exposures to ‘the market at large’, which bydefinition possesses the maximum diversification potential and henceshould demand the lowest premium for bearing such risks. Third, sponsorsmay protect themselves against political risks by investing in many coun-tries, finding partners in each country, or buying insurance against expro-priation. They may also engage in shaping or influencing behaviours byincorporating legitimate stakeholders and/or by being sure that they delivervalue to those in control.4
Embracing Residual Risks
Of course, not all risks can be mitigated, shaped to sponsors’ advantage, ortransferred to others through contracts or market transactions. Successfulproject sponsors and other strategic players understand which risks mustbe taken in order to seek ‘the prize’ associated with the project. Throughexperience, they have developed a clear sense of their comparative advan-tage in bearing various risks, reflecting their financial strength (their capitalbase, diversification, access to capital markets, and financial sophistica-tion), their understanding of particular risk domains, and their influenceover the relevant events or consequences of those events. In areas whereuncertainty is high, sponsors seek partners with comparative advantages inbearing risks.
Efficient risk management requires matching risks and responses, allwithin a dynamic iterative system. This is typically done through an itera-tive ‘layering process’, as depicted in Figure 8.5. For any given risk that isidentified, there is a pecking order of responses – for example, mitigatingor shaping for risks that are controllable to some extent; applying the prin-ciple of comparative advantage to determine who best should bear themgiven the ability to control coupled with the financial capacity to bear the
Evolving strategy: risk management 161

risk; hedging in the case of risk that can easily be transacted in financialmarkets; and pooling or diversification for risks that cannot be shaped ortraded.
8.5 GOVERNING PROJECTS AS EVOLUTIONARYSYSTEMS
In this section, we will outline a governance framework to manage projectswhile recognising that they are essentially evolutionary and messy. Theactual decision-making processes observed in the projects studied in IMECwere indeed messy, and often chaotic. Projects are often launched bypromoters who need to charm potential participants and feel compelledto build convincing but less-than-reality-grounded stories. Expendituresare allocated to soft issues such as opinion research, public affairs andannouncements that lay bare issues of politics and power. Decisions arenever final but are remade, recast and reshaped. Confrontations often bringdeadlocks.
162 Planning and decision-making
Figure 8.5 The layering process
• Alliance/partnership• Bold pre-emptive moves• Institutional engineering• Incentive contracting
• Hire experts• Engage in projects on learning basis• Simulate, rehearse
• Futures• Options• Swaps• Non-recourse
finance
Form portfolio
• Investment timing• Plant location• Input/output• Flexible contracts
If there is a comparative advantage
Transfer/hedge
Diversify/pool
Createoptions/flexibility
Transform risk-drivers/mitigate
Embraceresidual risks
Assess/understandrisk

This messiness, as opposed to clear-cut decision-making, has led manyobservers to argue that LEPs are basically unmanageable, and that success isa matter of luck and improvisation. In reality, projects are better viewed asevolutionary systems where messy decision processes can be structured by agovernance framework that combines discipline with creative responses.
Performance of Projects
Traditional perspectives on project management measure performance interms of meeting projected costs, deadlines and functionality. However,project sponsors buy benefits not artefacts: they evaluate projects by thevalue and satisfaction they create. Should one adopt an evolutionary per-spective, performance becomes the output of processes over which controlvaries from strong to minimal. Achieved results may be different frominitial expectations for a number of reasons:
● The internal governance framework of the sponsoring organisationmay have led to initial estimates that were off the mark, wrong, ordeceptive, as managers were unwilling to allocate the resources nec-essary to build solid estimates or tell the truth.
● Capabilities of sponsors or consultants to shape projects or respondto crises may have been inadequate or have faltered. Exogenous orendogenous events may have required competencies that parties didnot have.
● Exogenous unexpected events beyond the control of sponsors orpartners may have generated turbulence that was difficult to master.
● Sponsors may have changed priorities mid-course, set new goals, orcut budgets, thus triggering endogenous turbulence.
● Bold moves to profit from emerging technical or market opportunitiesmay have led to overruns but with increased benefits. Overall satisfac-tion may be high, together with a perception of bad management.
Should one adopt an evolutionary perspective, the performance of pro-jects becomes not a comparison with goals stated many years ago but theoutput of processes of shaping, countermoves and facing emerging risk.The project that has been built differs from the original concept because ofunexpected events, imposed redesigns or voluntary changes in the concept.
Progressive Issue Resolution Through Shaping Episodes
Rather than evaluating projects at the outset based on projections of thefull sets of benefits and costs over their lifetime, competent sponsors view
Evolving strategy: risk management 163

and shape them in evolutionary perspectives. They start with initial con-cepts that have the possibility of becoming viable. They then embark onshaping efforts to refine, reconfigure and eventually agree on acceptableconcepts. Sponsors cut their losses quickly when a concept has little possi-bility of becoming viable.
Shaping episodes start with broad hypotheses about what nested prob-lems and risks need to be addressed and what resources are necessary toachieve progress. The shaping process combines deliberate actions withresponses to emergent situations. Various intertwined issues have to beresolved one by one by sponsors alone or in cooperation with partners orco-specialised firms. Progress typically involves ‘buying in’ some stake-holders and ‘buying off’ others. In some cases, the expectations of stake-holders can be specified in advance. In many cases, though, it is not clearhow to accommodate various interests; the leading sponsor uses the front-end period to identify mutual-gains trajectories.
Episodes start with momentum-building, continue with the counteringof opposing forces, and iterate until closure can be achieved. As shapingprogresses, new options are opened and old ones are closed. At closure,clients and partners agree to commit, thus losing degrees of freedom.
Momentum buildingMomentum is built by imagining concepts, promoting legitimacy andselling a project configuration such that partners, affected parties and gov-ernments accept what is proposed. Risk seminars and decision conferencesare used to shape the value proposition and identify risks. To ensure thatinvestments are protected against opportunistic behaviours, risk-sharingagreements will be developed. To gain legitimacy, consent from affectedparties and approval by governments will be sought.
Meeting countering forcesThe countering forces that come into play over time can easily sidetrackweak sponsors into wrong choices or lead inexperienced ones to kill goodideas. In each shaping episode, the forces of criticisms and counteractionswill be at work. Opponents will call for realism. Experts will challenge costestimates and risk potentials. Sponsors will respond and take actions thatmay plant the seeds of later failure or success. In situations of antagonismor when desire to collaborate is mixed with the intention to oppose, partieslearn opponents’ values, communicate promises and make veiled or overtthreats to arrive eventually at meetings of minds.
Sponsors sometimes believe their own overly optimistic assumptions.Weak analyses, incomplete research and the need to show progress lead tothe rejection of valid criticisms. Excessive realism, in contrast, leads to
164 Planning and decision-making
scepticism and to the eventual rejection of good opportunities. What isbasically a good concept is painted negatively and rejected. Unfavourablejudgements drive away parties whose contribution is critical. Doubts, neg-ative stories and emergent problems set in motion self-fulfilling prophecies.
Sponsors often yield to the temptations of unreasonable commitmentsbecause they are unaware of particular risks. Blindness generally comesfrom the inability to form coalitions that confront distinct but relevantviewpoints. Regulatory agencies may refuse to grant permits or changerules during project shaping. Only projects whose leaders and sponsorshave the resources, willingness and competencies to counteract destructiveforces survive.
ClosureEventually, imperfectly coordinated but stabilised understandings movetoward temporary agreements that are enforceable. Each shaping episodeends with a process of closure that suggests either abandoning the wholeproject or accepting a temporary agreement on a concept configuration.
Closure takes many forms: memorandum of understanding, businesscase, negotiated agreement, formal public commitment, sets of formal con-tracts, and so on. The dangers associated with closure are that choices canbe made too early or too late, too rigidly or too flexibly. Missing the boat –rejecting a good opportunity – is just as real a possibility as selecting a badoption or pursuing the wrong project. Premature closure locks a project ona rigid configuration, narrow sets of agreements, or irreversible choices thatlimit degrees of freedom for the future.
When exogenous or endogenous forces are strong, the agreed-uponclosure may be reopened at the start of another shaping episode. Forexample, emerging technical opportunities may call for reopening IT pro-jects or infrastructure projects. When this occurs, assessing costs againstbenefits is necessary. Similarly, changes in the business models may call forreconfiguration of the agreement. Figure 8.6 pictures the shaping effort asgoing up a hill through coalition-building, problem-solving and risk man-agement in the face of counter-dynamics such as cynicism, false expecta-tions and feedback effects.
Projects as Paths of Interdependent Shaping Episodes
Projects are rarely shaped in one over-arching episode. Instead, multipleand interdependent episodes are necessary to resolve issues and arrive at aclosure that, though reopenable, can be agreed upon. Episodes are notstages that logically flow from one to the other, but distinct shaping dynam-ics that are autonomous yet path-dependent. Figure 8.7 illustrates the path
Evolving strategy: risk management 165

166 Planning and decision-making
Figure 8.6 Stages in project shaping
Projectshaping
Str
uctu
re o
f pro
ject
con
figur
atio
n
Expenditures/time
Innovationand
problem-solving
Risk
Coalition-building
Falseexpectations
Perversedynamics
Counter-moves
Temporaryclosure
Figure 8.7 A project as a series of shaping episodes
Confrontingemerging
fears
Abandon
Committable
package
negotiations
1 4 30 90 120
Abandon
Abandon
Abandon
Holisticproposal
Moves andcommitments
s
Initiationand
exploration
Concept
Script
Cost of shaping effort ($ million)
Closureand final
agreements
Agreement
Deg
ree
of s
truc
ture
/mom
entu
m-b
uild
ing

of early front-end shaping episodes for a bridge project that was examinedin great detail. Five episodes characterised the progression from initialhypothesis to formal contracts and construction fund release. We willpresent these episodes in a generic manner:
Initiation and exploration The initiation episode is usually short (six months to a year) and closeswhen a credible party conveys to others that the project concept has rele-vance and should be sponsored. The credible party states openly that it isready to allocate funds and lead debates on the ways and means of shapingand financing the idea. In the IMEC sample, project ideas were initiated bynetwork operators (32 per cent), entrepreneurial firms (20 per cent), polit-ical leaders (20 per cent), technical entrepreneurs (12 per cent) and ownersof rights (8 per cent).
Resources of a few million dollars are used to shape the project conceptduring this episode. Exploratory searches are conducted internally or incollaboration with external parties. In the IMEC sample, the dominantmodes of exploration were a team in symbiosis with external consultants(16 per cent); open idea competition (20 per cent), strategic-planninggroups (30 per cent), and entrepreneur design (28 per cent). Conceptualclosure is achieved when independent studies confirm the viability of theconcept. The output is a series of documents sketching out ideas but withan emphasis on technical issues. The most common form is a position paperpresented to legitimate authorities, such as ministers or boards of directors.
Development of holistic proposalsThe leading sponsors start with ‘horseback’ assumptions and proceed todevelop holistic proposals covering financial and technical parameters,social acceptability, environmental challenges, and regulatory decisionsand permits. The central concern is to maintain a perspective that avoidsblindness to risks. Sponsors build fully developed scripts addressing perti-nent risks and providing concrete solutions. Holistic proposals are pre-sented as business cases to investors or public authorities. Preparing suchproposals is expensive: from a few to many tens of millions of dollars.Entrepreneurial sponsors are often unable to fund such efforts.
Extended negotiationsAssuming that a version of the holistic proposal has been selected, theleader works with selected bidders to clear out assumptions concerningrisks, revenues, costs, guarantees, engineering design and other factors.Assumptions often need to be reworked. Many sketched relationships haveto be made operational. Numerous issues skipped earlier are discovered
Evolving strategy: risk management 167

and require solutions. Such issues may include definition of property rightsto protect sponsors; development of guarantees to protect clients fromcompletion risks faced by sponsors; negotiation of terms of guarantees andcovenants to protect banks and investors; determination of the public con-tribution in the case of projects in which toll revenues are insufficient; deter-mination of pricing structures and conditions of the concession; andidentification of rules, regulations and laws that will have to be modified toprovide security to the project.
When a government is the sponsor, negotiations of agreements have tomeet additional criteria of transparency, probity and accountability.Negotiations often extend over many years because different departmentshave distinct requirements and expectations. Many winners of competi-tions, having sketched beautiful holistic proposals, are dismayed when theyhave to restart negotiations after winning a bid and spend $15–20 millionjust to work out issues that they thought were resolved.
Confronting emerging fearsAs information is made public, pressure groups are triggered. Facing socialand environmental fears is a very expensive affair. Sponsors have to bindthemselves through actions to gain consent. Promises to engage in futureactions are insufficient. Concrete moves to meet expectations and solvesocial and environmental issues have to be made.
If parties are unable to forge agreements, they must wait for court or gov-ernment decisions. The presence of public social- and environmental-assessment frameworks is extremely important here in helping to solvedilemmas. Delays are the inevitable consequence of such formal assess-ments, but the public framework builds legitimacy and forces parties eitherto make trade-offs or to kill the project.
Closure on a Committable PackageCommitment on a final package can take place when all major issues havebeen resolved. In many projects, sponsors have spent a few hundred milliondollars to shape a holistic proposal, gain consent, solve social and environ-mental issues, and build agreements. Once the slow front-end shapingprocess closes on a committable package, the sprint to engineering, pro-curement and construction may then begin.
The costs of shaping projects and planning to meet risks can be high. Forsimple projects, around 2–3 per cent of the overall costs will be spent in plan-ning activities. However, for socially complex projects up to 35 per cent ofthe total costs will be spent in shaping the concept, ensuring good-qualitycoordination between players and investing to master risks. Leadership tendsto be different in each episode. During the initiation period, entrepreneurs or
168 Planning and decision-making

political officials tend to be leaders until a credible client accepts the projectas a viable idea. In developing proposals and negotiations, two leaders, theowner and the sponsor/developer, interact. During construction, leadershipis shared between the owner and contractors.
Sometimes, the reopening of closure is so powerful that shaping has toreturn to early conceptualisation. For example, during the construction ofthe Tucurui dam in Brazil, the extent of rain was such that prior estimatesabout the flow of water had to be revised and all designs redone during con-struction. Similarly, progress in clinical research may lead doctors to openlyquestion assumptions embedded in the design of a university hospital.
Governance Frameworks for Shaping Projects as Evolutionary Systems
Various governance arrangements for developing projects have been tried.The rational model for project planning emerged in the twentieth centuryto replace the entrepreneurial approach. Belief in formal analysis was, andstill is, the central pillar of the rational approach. Successful projects areportrayed as the product of advanced planning by experts who carefullyweigh forecasts, alternatives and contracts. Project failures are seen largelyas resulting from planning errors. Although many studies showed that largeprojects did not always conform to the rational-system model, the ideallives on.
The approach proposed here combines rational planning with evolu-tionary shaping as progress is made on facing issues, risks and opportuni-ties. Governance frameworks can be built at the project level but also at theinstitutional level to provide the scaffolding around which the variousissues of projects can be shaped.
Governance means setting up a structure – a set of decision-makingprocesses and methods for accumulating of knowledge to ensure that cre-ativity and discipline are brought to bear. In conjunction with analyticalplanning, debates and discussions about risks, value creation and opportu-nities to reopen projects are kept alive. They make sure that risks are notdefined as cost contingencies but that risk-management systems are put inplace to trigger the negative feedback loops necessary to counteract thepositive loops. The reopening of closed agreements will be subjected tocost–benefit tests.
ParticipantsBuilding a structure to shape projects through their multiple episodesrequires deciding what parties will be involved. The structure must identifythe multiple perspectives from which the project may be viewed, and themultiple tests that it should be subjected to. If the project team is staffed
Evolving strategy: risk management 169

only with internal technical experts, projects will be configured in technicalterms. In contrast, if the project office includes external parties, experiencedcontractors, lawyers representing opponents, and professional managerswith a systemic perspective, risks and opportunities will be addressed.Sponsors who become blind to particular risks do so because they have notbrought distributed and differentiated expertise and viewpoints. They failto form coalitions that can identify the major issues, put in place mecha-nisms to address them, and not allow commitments to get out of step withthe resolution of key risks.
Using a mountain-climbing metaphor, competent public or private spon-sors do not rush to climb the mountains that they are best equipped toclimb. Rather, they seek to select, equip and train a climbing party. In fact,the game consists in identifying projects that stretch capabilities but that,because of their complexity and risk, offer substantial value and benefits toclients in spite of the costs involved.
ProcessesGovernance processes set up decision-making frameworks to make sure allthe right questions are being asked, to initiate research activities to developanswers, and to outline the hurdles that the project must clear. Large multi-national firms have often put in place complex frameworks composed offive or six decision gates in which most issues are addressed. Governmentalframeworks are usually less complex, with a few decision moments.
For example, the system instituted by the Royal Ministry of Financeof Norway (see Chapter 9 in this book) includes three gates at which theproject concept is tested. Project concepts are developed technically bythe relevant ministries but must answer the following questions: what is thevalue for clients and opponents? Is value created properly shared? What aremarkets estimates? How will the project be financed? Could it be built usingalternatives? What are the major risks and how will they be dealt with?Where are the forgotten costs, especially in risk mitigation? How do esti-mates compare with other projects in the world? Have competing optionssuch as public–private partnerships been analysed? The initial concept isassessed internally. However, holistic proposals are evaluated in coopera-tion with external expert evaluators (Samset et al., 2006).
Methods for accumulating knowledgeWithout comparative knowledge about costs, contracts, risks and so on, it isvery difficult to shape projects. Sponsors who get involved sporadically inlarge projects find themselves starting anew and building on high levels ofignorance. The accumulation of knowledge has to be organised on a system-atic and continuous basis. Sponsors should internally and in cooperation with
170 Planning and decision-making

others build knowledge bases on construction cost estimates, risk-bearingcosts, contractual forms, practices for introducing innovation, financialmethods for business modelling, and learned best practices.
Powerful sponsors such as governments and large firms may even shapethe environments in which projects will be developed. They may decide thatultimate users, engineering contractors or project management firms mustbuild up their capabilities to create value and share knowledge. Improvedcapabilities will make it possible to answer questions better and work coop-eratively to develop superior solutions by engaging in generative thinkingand search for innovative solutions.
8.6 CONCLUSION: CREATION AND EXERCISE OFOPTIONS
As we have shown, the succession of shaping episodes that form the front-end process to cope with risks can be reinterpreted as a sequence of creating,shaping, and the exercising or abandoning of real options. Decisions thatdetermine project cash flows are made sequentially over many episodes, andvalue is often created or preserved in the face of a great deal of uncertaintyby ensuring flexibility and limiting irreversible commitments until a finalclosure is reached, and then ‘sprinting’ to the finish as quickly as possible. Infact, this process of exploration, shaping, closure and sprinting takes placemany times in the complex projects we have reviewed. Value is increasedthrough the creation of options for subsequent sequential choices, and exer-cising these options in a timely fashion. Thus sponsors seek projects thathave the potential for large payoffs under particular institutional and tech-nical circumstances. The study in this chapter illustrates the rich varieties ofmechanisms through which these options are shaped and exercised over thelife of the project – the real management that is integral to real options.
NOTES
1. This chapter is based primarily on Miller and Lessard (2001) and the underlying IMECstudy. However, it also reflects the insights that the two authors have gained from theirseparate journeys over the last six years. Miller has gone on to define and lead the MINEstudy, a large-scale project focusing on innovation games based at Ecole Polytechnique deMontréal. Lessard has continued his work on large-scale projects in the oil-and-gas sectoras faculty director of the BP Projects Academy and the Major Projects Research Programat MIT.
2. The term ‘financial risk’ is often used overly broadly to refer to risks with financial con-sequences – essentially everything. For us, the term applies only to events that have someunderlying financial cause.
Evolving strategy: risk management 171

3. Schedule risk also is often used to identify a risk that has an impact on the schedule. Here,we refer to schedule risks only when they are a cause and not just a consequence. Ofcourse, in episodes of turbulence a schedule impact may become a cause of further unrav-elling, and hence the distinction becomes less clear.
4. For an excellent recent study of how sponsors deal with political risk in major projects,see Wells and Ahmed (2007).
REFERENCES
Black, Fischer and Myron Scholes (1974), ‘From theory to a new financial product’,Journal of Finance, 29 (2): 399–412.
Cleland, D. and L. Ireland (2006), Project Management: Strategic Design andImplementation, 5th edn, New York: McGraw-Hill.
Flyvbjerg B., N. Bruzelius and W. Rothengatter (2003), Megaprojects and Risk: AnAnatomy of Ambition, Cambridge, MA: Cambridge University Press.
HM Treasury (2006), PFI Strengthening Long-term Partnerships, London: HMSO,March.
Hughes, Thomas (1998), Rescuing Prometheus, New York: Pantheon.Miller, R. and S. Floricel (2005), ‘Project risks’, in André Manseau and Rod Shields
(eds), Building Tomorrow: Innovation in Construction and Engineering, Aldershot,UK: Ashgate.
Miller, R. and D. Lessard (2001), The Strategic Management of Large EngineeringProjects: Shaping Risks, Institutions and Governance, Cambridge, MA: MIT Press.
Samset K., P. Berg and O.J. Klakegg (2006), Front-end Governance of Major PublicProjects, Concept Research Program, Technical University of Norway, May.
Wells, Louis T. and R. Ahmed (2007), Making Foreign Investment Safe: PropertyRights and National Sovereignty, New York: Oxford University Press.
172 Planning and decision-making
9. How to overcome major weaknessesin mega-projects: the NorwegianapproachKnut Samset
9.1 INTRODUCTION
A truly successful project is one that has been implemented in accordancewith its budget and time schedule, and which significantly contributes tothe fulfilment of its agreed objectives. Also, it should have only minor neg-ative effects, its objectives should be consistent with needs and priorities insociety, and it should be viable in the sense that the intended long-termbenefits resulting from the project are produced. These requirements werefirst formulated for US-funded international development projects by theUSAID in the 1960s. They were subsequently endorsed by the UN, OECDand the European Commission. They are summarised in terms of fiverequirements or success factors that have to be fulfilled: more specificallythe project’s efficiency, effectiveness, relevance, impact and sustainability.These are tough requirements that go far beyond the performance mea-sures that are usually highlighted in the media and attract public attentionwhen news about shortcomings in mega-projects hit the headlines. In mostsuch cases the debate is about the projects’ efficiency measures, such as theirbudgetary compliance and progress, and in some cases also their cost-efficiency as compared with similar projects.
However, these efficiency measures are only the first signs and immediateindicators of a project’s success. Clearly, they are main features of the con-tractual arrangements governing the implementation of the project, andtherefore essential concerns both for the commissioning party and for thecontractors who are made accountable for delays and overrun. It is also amajor concern in industry, as well as in government, when large amountsof public funds are involved. This may explain why inadequate efficiency isconsidered news in the media and therefore gets public attention. But theseefficiency measures are insignificant indicators that can only provide a veryrestricted testimony of a project’s success. Clearly, there are many examples
173

of projects that score high on efficiency, but subsequently prove to be dis-astrous in terms of their effect and utility. And there are also numerous pro-jects that failed to pass the efficiency test but still prove to be tremendouslysuccessful both in the short and the long run.
9.2 TACTICAL AND STRATEGIC PERFORMANCE
A crucial distinction is between projects’ tactical and strategic performance.Journalists and the public seem to be more concerned about how projectsare being implemented in tactical terms than in their strategic performancein terms of immediate and long-term effects and utility. Strategic perfor-mance requires that the anticipated immediate positive effects of the projectare produced (effectiveness), that these effects are consistent with needs andpriorities in society and the market (relevance), that there are no major neg-ative effects of the project (impact), and that the anticipated benefits result-ing from the project prevails as expected (sustainability).
Projects that score highly on all the five success criteria mentioned aboveare those that perform successfully both tactically and strategically. Suchprojects may be rare. Taking Norway as an example, one type of project
174 Planning and decision-making
Figure 9.1 Performance profiles to categorise different projects fromhighly successful (1) to complete failure (4)
Tactical performance(delivery)
+
–Str
ateg
ic p
erfo
rman
ce(c
once
pt)
–+
Regional aviationcontrol centre
Nationaluniversity hospital
Onshore torpedobattery
3. Wrong type of project
1. Highly successful project
4. Complete failure
2. Inefficient/expensive
Hydroelectricpower plants

that has proved successful and has satisfied all these requirements again andagain are hydroelectric power projects. These involve the construction ofdams to form large water reservoirs in the high mountain areas, powerplants with turbines and electric generators in the valleys below, and hugepipes to carry the water at high speed from the reservoir. In terms of tacti-cal performance the track record of such projects is impressive. One ex-planation is the existence of a national industry with highly specialisedexpertise and decades of accumulated experience in delivering such projectson time and within budgets (efficiency). In strategic terms, these plantsproduce cheap and clean energy (relevance), enough to cover a sizeableshare of the country’s electricity needs (effectiveness). There is no pollutionand no significant adverse environmental effects (impact). In economicterms the power plants are extremely viable, and also long-lived (sustain-ability). Most of these projects therefore fit into category (1) in the perfor-mance matrix in Figure 9.1: they are highly successful projects.
Projects that might qualify for either of the remaining three categories inFigure 9.1 may be more common. Each of these categories will be illus-trated by recent examples from Norway.
Category (2) projects are viable in strategic terms but inefficient tactically.One example would be the national university hospital in Oslo, which wascompleted in 2000, one year behind schedule and with considerable costoverrun. Newspapers had comprehensive coverage of developments duringthe construction phase and there were a number of public debates in themedia. A public inquiry was subsequently commissioned to establish thecauses of the problems. Clearly, the cost overrun was considerable inabsolute terms; however, in relative terms it was equivalent to only anumber of months of operational costs for the entire hospital, and there-fore less significant if seen in a lifetime perspective. Also, the inquiryestablished that a large share of the cost increase was due to necessaryamendments and scope expansions, which have increased the efficiency andutility of the hospital’s operations. The designers failed to foresee theseneeds when the project was planned. In strategic terms, the need for andsignificance of the project have proved conclusive, and in retrospect it isgenerally considered a great success.
Category (3) projects are the wrong type of project in strategic terms, butefficient tactically. One example would be the air traffic control centre forthe country’s central region. It included the construction of a very tall,oversized concrete control tower at Trondheim Airport, which was com-pleted in 2003 in compliance with the project’s time schedule and budget.The media attention has been surprisingly limited, despite the fact that thefacility was never equipped or taken into operation: because of a restruc-turing of the national air traffic control system, this particular centre was
How to overcome major weaknesses: the Norwegian approach 175

left redundant. The problem in this case was that the need for this type ofproject had been overtaken by technological advances in the field of airtraffic control. Decision-makers failed completely since the decision tobuild was already outdated long before it was made.
One example of a conspicuous type of category (4) projects – the totalfailures – would be a sophisticated onshore torpedo battery built inside therocks on the northern coast in 2004 with considerable cost overrun anddelay. The battery, built to accommodate 150 military personnel for as longas three months at a time, was officially opened with the successful launchof a test torpedo against a ship dummy off shore. However, it was closeddown by Parliament only one week later. It was apparent that no potentialenemy would expose its ships to such an obvious risk. The onshore torpedobattery concept harks back to the Second World War and was long over-taken by political, technological and military development when the deci-sion to build was taken in 1997, long after the Cold War ended. The projectis the unfortunate and wasted result of a strategic blunder.
In summary, taking the projects’ performance profiles into account, thepoliticians, media and the public seems to be more preoccupied with cate-gory (2) and (4) projects, which are underperformers in tactical terms, anddisregard their strategic potential or performance. What are highlighted areproblems deriving essentially from weaknesses in project management deci-sions. This is a very restricted perspective. The focus should rather be oncategory (3) and (4) projects – the strategic underperformers. It is a paradoxthat even projects that prove to be complete failures tend to escape atten-tion as long as they perform acceptably in tactical terms.
9.3 PROJECT LIFE CYCLE AND STAKEHOLDERS
Public mega-projects are typically conceived as the result of politicallyexpressed needs in dialogue between various stakeholders. This is followedby some lengthy process to develop the project and make the necessary deci-sions. This typically involves government at various administrative levels, aswell as political institutions, the public, media, and consultants and con-tractors in the private sector. Such processes are often complex, shielded andunpredictable, as described and analysed in the in-depth IMEC study of 60major projects where the focus was on the reconciliation of uncertainty andfeasibility in the front-end phase (Miller and Lessard, 2000). The processescan also be deceptive and irresponsible, affected by hidden agendas ratherthan openness and social responsibility, and dominated by strong stake-holders or coalitions, as discussed for instance by Altshuler and Luberoff(2003), Flyvbjerg et al. (2003) and Miller and Hobbs (2005).
176 Planning and decision-making

In projects that fail strategically, it is likely that the problem is associatedwith the choice of project rather than how it is implemented. The choice isdecided during what might be a highly politicised process up front. In somecases the problem can be traced back to decisions in the earliest phasewhere the initial idea was conceived. What happens during the front-endphase is therefore essential for the project’s success. A study by the WorldBank in 1997, based on a review of as many as 1125 projects, concludedthat 80 per cent of the projects with a satisfactory ‘quality at entry’1 weresuccessful while only 35 per cent of those with unsatisfactory quality weresuccessful. Tactical performance tends to be less dependent on the initialchoice of concept and more on decisions made during planning and imple-mentation. Keeping the distinction between tactical and strategic decisionsis therefore useful in trying to prevent the strategic focus from becomingblurred by project-management concerns during the front-end phase.
Numerous decisions are made during the entire life cycle of a project,resulting from a decision-making process that runs in parallel with an ana-lytic process, which provides input to decision-makers as illustrated inFigure 9.2. The distinction is made between the front-end, the implemen-tation and the operational phases.
The front-end phase is initiated when the initial idea is conceived. It pro-ceeds as a complex and often unpredictable process, aimed to generateinformation, consolidate stakeholders’ views and positions, and arrive atthe final decision whether or not to finance the project. During this period,the initial idea is transformed into the choice of concept. This may takeyears, even decades in some mega-projects. The key stakeholder during thefront-end phase is the commissioning party, who is supposedly attemptingto arrive at what is considered the best choice of concept in dialogue, andsometimes in opposition, with other stakeholders. Decisions during thefront-end phase will clearly have implications for planning and implemen-tation of the project, but more so for its effect and utility. The management
How to overcome major weaknesses: the Norwegian approach 177
Figure 9.2 Decision and analysis throughout a project’s life cycle
Decisions
Needs Effects
Analysis
Project
Front-end phase
Commissioners
OperationPlanning and implementation
UsersContractors
Idea/concept
Decisionto finance
Handingover
Termi-nation
Project
perspective is or at least should be secondary up front, and the focus shouldbe on the justification and potential benefits from the anticipated project asseen in the operational perspective. Once this is agreed, subsequent deci-sions during the front-end phase will tend to have a more restricted effecton the choice of concept as such, but increasingly more on issues that haveto do with budgeting, planning and implementation. This is bordering onand merging with what are termed project-management issues.
The implementation phase begins once the decision to finance is made,and includes detailed planning, mobilisation of resources and implemen-tation, resulting in the delivery of the project’s outputs. The main stake-holders are the contractors, while the commissioning party’s involvementdepends largely on the contractual arrangement. The contractors have arestricted view of the project: their motivation is to deliver the agreedoutputs according to specifications and at the same time make a profit. Forthe contractor, the initial choice is of little significance; his responsibility isto implement whatever he is commissioned to.
The operational phase begins once the outputs have been delivered, setin operation or been used. The main stakeholders are therefore termed theusers. Decision-makers at this stage are responsible for the operation andwill have to make do with what has been produced, with limited possibili-ties to make strategic changes. The users are just the passengers on the ride,and detached from the foregoing decision processes without any possibil-ity of influence.
In this theoretical model the three groups of decision-makers thereforehave different interests and perspectives on the project. They operate inseparate sequences without much interaction. Of course, there is a need forsome sort of alignment of interests, and in many projects contractors andusers may have possibilities to influence decisions during the front-endphase to a limited extent. In reality, there are all sorts of variations of pro-jects and processes that complicate the theoretical case described above.
9.4 CHALLENGES, DECISIONS ANDPERFORMANCE
One fundamental challenge in mega-projects is how to deal with problemssuch as tactical budgeting whereby responsible agencies at various levelstend to underestimate costs in order to increase the chance to obtain gov-ernment funding for a project. Another challenge is to increase the chancethat the most relevant and feasible project concept is chosen. Yet anotherchallenge is to ensure a transparent and democratic process, and avoidadverse effects of stakeholders’ involvement and political bargaining. To
178 Planning and decision-making

make the process predictable is also a major challenge since the front-endphase in public mega-projects commonly extends over at least one parlia-mentary election period. Challenges are abundant and complex. Many ofthe strategic performance problems facing public mega-projects can beinterpreted in terms of deficiencies in the analytic or the political processespreceding the final decision to go ahead, and the interaction between ana-lysts and decision-makers in this process. Below, the distinction is madebetween decisions to improve the project’s tactical versus its strategic per-formance, and the five success factors or decision criteria mentioned aboveare applied.
Decisions Determining Tactical Performance
Here decision-makers are charged with the responsibility to secure efficientdelivery of project outputs in terms of scope, quality, timing, budgetarycompliance, etc. The point of departure is the commissioner’s specificationsand requirements, as well as the contractual obligations. The main chal-lenge is to translate the specifications into a project design and implemen-tation plan, which is realistically achievable in view of uncertainties thatmight affect the undertaking. These are project management issues and thetasks are thoroughly described, for instance, by the Project ManagementInstitute in its ‘Body of Knowledge’ (PMI, 2005). It involves managementof project integration, human resources, communications, procurement,design, planning, cost estimation, risk, etc. Although deficiencies in projectmanagement may have serious economic implications, the problems maystill be marginal seen in a wider strategic perspective, as illustrated above.Examples are the cases of the national university hospital, and the onshoretorpedo battery. We will not go further into such project managementissues in this chapter.
Decisions Determining Strategic Performance
In order to succeed strategically, four of the five success criteria need to besatisfied, as mentioned above. The project’s intended effect should be useful(relevance), the effect should be achieved in time (effectiveness), thereshould be no major negative effects (impact), and the positive effects shouldbe sustained (sustainability). The main challenges for decision-makers areas set out below.
Ensuring that the project is relevant is essentially a question of aligningits objectives with needs and priorities that justify the undertaking on theone hand and what can realistically be expected as its effects on the other.This is often impossible. Take the regional aviation control centre as an
How to overcome major weaknesses: the Norwegian approach 179

example of a project that is not relevant. There was no need for the project,since technological development now allows for more accurate monitoringby satellites and computer processing of data. The system can now be morecentralised. In fact, Norway, with its population of only four million, hasas many as five air traffic control centres. The USA, in comparison, has onlyfour. The regional centre was obviously redundant and should not havebeen built. This illustrates the point that relevance may change over time.The hydroelectric power projects, on the other hand, are relevant as long asthere is a need and a market for electricity and it is used productively. Thisis clearly the case, and strongly so because alternative sources of energy areboth more polluting and expensive.
The next challenge is to ensure that the project’s objectives are realisticallyachievable, in other words, that the intended effect will be realised asplanned (effectiveness). The issue here is to what extent objectives will befulfilled given the resources available and the uncertainties facing theproject. In purely rationalistic terms, a number of formal requirements haveto be satisfied in the strategic design of a project. Objectives should be con-sistent in the sense of being linked logically in sequence and in parallel. Theyshould be realistic in probabilistic terms; essential risks should be identifiedand considered. This type of logic- and probability-based analysis is oftendeficient. This was demonstrated in a study of 30 major Norwegian-fundedinternational development projects that were all designed according to thesame strategic format in order to ensure quality at entry. It was found thatdespite the considerable resources spent on strategic design, all projects hadseveral major design flaws so that the designs were entirely inadequate as abasis for budgeting and planning. The weakest part of the design was theidentification of contextual uncertainties that might affect the projectsduring implementation and operation (Samset et al., 2006).
Securing sustainability and avoiding adverse impacts is essentially aquestion of understanding the complexity of the contextual situation inwhich the project is implemented and operated. This includes its institu-tional setting, market demands and restrictions, stakeholders’ needs andpriorities, technological and environmental opportunities, and challenges.The task up front is one of making comprehensive analyses, identifyingstakeholders, facilitating communication and involvement. Such activitiesmay delay decision-making, but experience strongly suggests that thisoften is worthwhile in order to avoid some of the strategic problemsencountered.
One huge paradox in front-end management of mega-projects is thatthese, even many of the public mega-projects, originate as a single ideawithout systematic scrutiny or consultation. Also, in too many cases, theinitial idea will remain largely unchallenged and therefore survive and end
180 Planning and decision-making

up as the preferred concept – even in cases when it subsequently proves tobe a strategic underperformer or failure. Improved front-end managementis therefore likely to pay off if seen in a wider life-cycle perspective, as evi-denced by the IMEC study (Miller and Lessard, 2000). There is much tobe achieved by improving quality at entry at the earliest stage of theprocess. This requires that the initial ideas be challenged, for instance byanalysis, extracting and making use of previous experience from similarundertakings, and involving stakeholders. The challenge is to ensure thatprojects are designed to respond to needs and priorities in society thatmight be valid throughout their lifetime, that their objectives are realisti-cally achievable, that they are not likely to cause major negative impacts,and that their benefits can be sustained. Clearly, this is not simply a ques-tion of making a rational choice up front. The choice may not survive theunpredictable decision process that lies ahead. However, based on experi-ence with such projects, one could assume that since the less rational choiceseems to be able to survive, the rational concept might at least have thesame ability.
9.5 PRINCIPLES FOR FRONT-END GOVERNANCEOF PROJECTS
Current reforms in public management aim to build effective and account-able institutions in the public sector and facilitate investment and initiativesin the private sector under what is termed good governance. Trends towardsincreased autonomy of public and private institutions have been followedby a corresponding trend to increase control measures and regulation. Theregulatory features of such regimes may represent new restrictions andadministrative challenges, in the stricter sense, with more agencies estab-lished in order to enforce regulations. In a less rigid sense, regimes are basedon degrees of self-regulation with reference to publicly endorsed rules andstandards.
The policy instruments available to the public in order to bring about suchchanges are not restricted to the use of regulations, but would also compriseeconomic means and information, as discussed by Bemelmans-Videc et al.(1998). The instruments can be either affirmative or negative. Regulationscan be either prescriptive and provide rules to be followed, or proscriptive,specifying what is not allowed. Economic means can be either incentives, forinstance in terms of benefits or refunding arrangements, or negative sanc-tions in terms of taxation or fees. Information can be either in terms ofadvice and encouragement giving guidance of what can be achieved and inwhich way, or in terms of warnings or description of pitfalls and possible
How to overcome major weaknesses: the Norwegian approach 181

adverse effects. One example is the World Bank’s model to enhance statecapability (World Bank, 2000), where the regulatory part is described interms of rules and restraints, the economic part in terms of competitivepressure, and the information part in terms of public ‘voice’ and partner-ship.
Governance regimes for mega-projects comprise the processes andsystems that need to be in place on the part of the financing party to ensuresuccessful investments. This would typically include a regulatory frame-work to ensure adequate quality at entry, compliance with agreed objec-tives, management and resolution of issues that may arise during theproject, and standards for quality review of key governance documents.
Miller and Hobbs (2005) have discussed the need for design criteria thatshould be brought to bear when developing a governance regime for amega-project, in light of the complexity of such projects. Their assumptionis that these would contrast with the traditional conception of governanceas a static, binary, hierarchical process. Governance regimes for mega-projects are time-dependent and self-organising. Because the process isspread out over a long period of time, there is an opportunity to transformthe governance structure as the project unfolds. Rather than thinking of thedesign of mega-project governance structures as a search for the one beststructure, the design of such regimes can be thought of as a flexible strate-gic process that will draw on a variety of governance regimes to deal withdifferent issues in different phases of the project life cycle.
Flyvbjerg et al. (2003) discuss ambitions, risk and effects in mega-projects based on a large sample of projects. The authors conclude that theproblem with such projects is mainly one of risk-negligence and lack ofaccountability on the part of project promoters whose main ambition is tobuild projects for private gain, economical or political, not to operate pro-jects for public benefit. Their suggested cure for what is termed the mega-project paradox is (1) that risk and accountability should be much morecentrally placed in mega-project decision-making than is currently the case,(2) that regulations should be in place to ensure that risk analysis and riskmanagement are carried out, (3) that the role of government should beshifted from involvement in project promotion to keeping it at arm’s lengthand restricting its involvement in the formulation and auditing of publicinterest objectives to be met by the mega-project, and (4) that four basicinstruments be employed to ensure accountability in decision-making: by(a) ensuring transparency, (b) specifying performance requirements, (c)making explicit rules regulating the construction and operations of theproject, and finally (d) involving risk capital from private investors, theassumption being that their willingness to invest would be a sound test onthe viability of the project up front.
182 Planning and decision-making
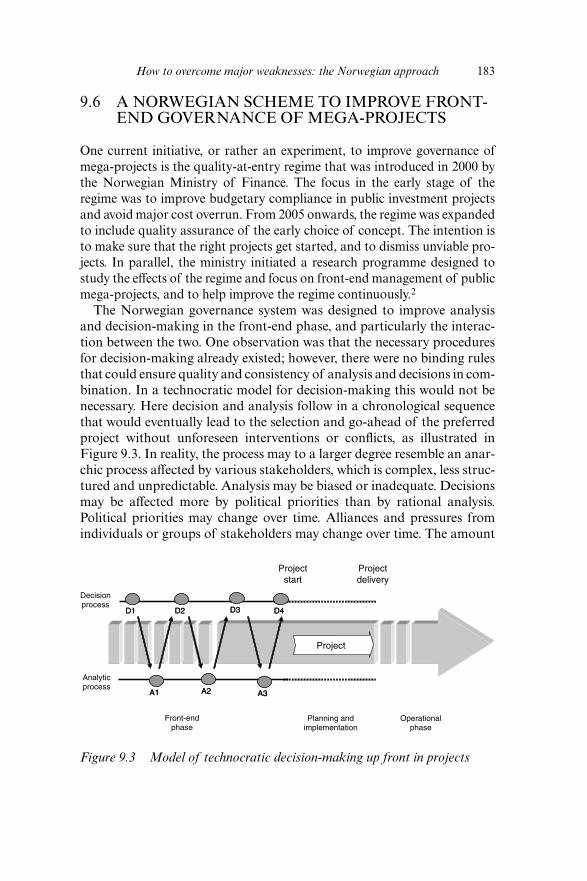
9.6 A NORWEGIAN SCHEME TO IMPROVE FRONT-END GOVERNANCE OF MEGA-PROJECTS
One current initiative, or rather an experiment, to improve governance ofmega-projects is the quality-at-entry regime that was introduced in 2000 bythe Norwegian Ministry of Finance. The focus in the early stage of theregime was to improve budgetary compliance in public investment projectsand avoid major cost overrun. From 2005 onwards, the regime was expandedto include quality assurance of the early choice of concept. The intention isto make sure that the right projects get started, and to dismiss unviable pro-jects. In parallel, the ministry initiated a research programme designed tostudy the effects of the regime and focus on front-end management of publicmega-projects, and to help improve the regime continuously.2
The Norwegian governance system was designed to improve analysisand decision-making in the front-end phase, and particularly the interac-tion between the two. One observation was that the necessary proceduresfor decision-making already existed; however, there were no binding rulesthat could ensure quality and consistency of analysis and decisions in com-bination. In a technocratic model for decision-making this would not benecessary. Here decision and analysis follow in a chronological sequencethat would eventually lead to the selection and go-ahead of the preferredproject without unforeseen interventions or conflicts, as illustrated inFigure 9.3. In reality, the process may to a larger degree resemble an anar-chic process affected by various stakeholders, which is complex, less struc-tured and unpredictable. Analysis may be biased or inadequate. Decisionsmay be affected more by political priorities than by rational analysis.Political priorities may change over time. Alliances and pressures fromindividuals or groups of stakeholders may change over time. The amount
How to overcome major weaknesses: the Norwegian approach 183
Figure 9.3 Model of technocratic decision-making up front in projects
D1D1 D2D2 D3D3 D4D4
Decisionprocess
Analyticprocess
A1A1 A2A2 A3A3
Project
Projectstart
Projectdelivery
Planning andimplementation
Operationalphase
Front-endphase

of information is abundant and may be interpreted and used differently bydifferent parties. The possibility for disinformation is considerable (seeChapter 5 in this book).
The response to these challenges would seem not to be a strict and com-prehensive regulatory regime, but rather (1) to establish a distinct set ofmilestones and decision gates that would apply to mega-projects in allsectors regardless of existing practices and procedures in the different min-istries or agencies involved; (2) to ensure political control with fundamen-tal go/no-go decisions; (3) to ensure an adequate basis for decisions, and (4)to focus decisions on essential matters, not on the details. The answerseemed to be (1) to anchor the most essential decisions in the Cabinet; (2)to introduce a system for quality assurance of the basis for decisions thatwas independent of government and sufficiently competent; and finally, (3)to make sure that the governance regime was compatible with proceduresand practices of the affected ministries and agencies.
Under what is termed the quality-at-entry regime, pre-qualified externalconsultants are assigned to perform quality assurance of the decision basisin all public mega-projects with a total budget exceeding some €60 million.During the first four years, this applied to some 50 projects where cost esti-mates and decision documents were scrutinised prior to Parliamentaryappropriation of funds. Based on the experience gained, the regime wasexpanded in 2005 to include two separate quality assurance exercises insequence, that is to secure the decision basis for (1) the choice of concept(QA1), and (2) the budget, management structure, and contract strategy forthe chosen project alternative (QA2), as illustrated in Figure 9.4.
QA1 should help ensure that the choice of concept is subject to a politi-cal process of fair and rational choice. Since the choice of concept is a
184 Planning and decision-making
Figure 9.4 The Norwegian quality-at-entry regime for major publicinvestment projects
Decisionprocess
Analyticprocess
QA2QA2 ProjectQA1
Pre-feasibilityphase
QA2QA2 ProjectQA1
Pre-projectphase
Planning andimplementation
Parliamentapproval of
budget
QA2QA2 Project
Operationalphase
Governmentapproval
of concept
QA1

political one, the consultants’ role is restricted to reviewing the professionalquality of underlying documents constituting the basis for decision. Thedecision is anchored in the Prime Minister’s Office and will initiate a pre-project to analyse the feasibility of the chosen project. Responsible min-istries are now required to explore at least two alternative concepts inaddition to the zero alternative (doing nothing). They are supposed toprepare the following documents:
1. Needs analysis, which maps all stakeholders and affected parties andassesses the relevance of the anticipated investment in relation to theirneeds and priorities.
2. Overall strategy, which should specify on this basis consistent, realisticand verifiable immediate and long-term objectives.
3. Overall requirements to be fulfilled, for instance functional, aesthetic,physical, operational and economic requirements.
4. Alternatives analysis, which defines the zero option and at least twoalternative concepts, specifying their operational objectives, essentialuncertainties and cost estimates. The alternatives should be subjectedto a full socioeconomic analysis (see Chapter 6 in this book).
QA2 is performed at the end of the pre-project phase, aimed to providethe responsible ministry with an independent review of decision docu-ments before parliamentary appropriation of funds. This is partly a finalcontrol to make sure that the budget is realistic and reasonable, and partlya forward-looking exercise to identify managerial challenges ahead. Theanalysis should help substantiate the final decision regarding the fundingof the project, and be useful during implementation as a referencefor control. The focus is on the strategic management document, andthe consultants will review its consistency with previous decisionswhen the concept was decided (QA1) as well as the implications for theproject of changes that might have occurred afterwards, and the costframe, including a necessary contingency to make sure that the budget isrealistic.
9.7 DISCUSSION
The quality-at-entry regime is essentially a top-down regulatory schemethat was introduced to enforce a qualitative change in government practiceand improve quality at entry of mega-investments. During its first fouryears it did not interfere with current procedures, but merely aimed toimprove on existing documents that are an essential basis in the political
How to overcome major weaknesses: the Norwegian approach 185

decision process. The experience is that although the regime has beencontroversial, it has also been met with essentially constructive responsesfrom the ministries and agencies involved, which have adopted their prac-tices to meet the new quality requirements, and in some cases also adoptedthe scheme as a self-regulatory procedure.
This is possibly due to three factors: (1) the regime does not interfere withexisting procedures for analysis or political decision-making, but merelyaims to lift the professional standard of underlying documents; (2) it doesnot require altered procedures in the involved institutions; (3) the intro-duction of the scheme has been supported by establishing an arena forexchange of experience. This is in the sense of meetings at regular intervalsheaded by the Ministry of Finance, with representatives of involvedministries, agencies, consultants and researchers. This has facilitated open-ness and cooperation among the parties to discuss standards and practicesand develop the scheme further.
Resistance to the scheme seems to be first and foremost rooted in the factthat it challenges the conclusions and professional judgement of theinvolved agencies, but also that it has given rise to increased attention andmedia debate about cost estimates and budgetary compliance in publicmega-projects.
To date, six years after the scheme was introduced, only a few projectshave been completed and it is therefore too early to evaluate its effects. Thefindings so far are that it has resulted in stochastic cost estimation beingapplied in all involved ministries and agencies. Over the first years it hasbeen observed that differences in cost estimates between the ministries andthe quality assurers have been reduced significantly. What effect this has oncosts and cost efficiency cannot be determined at this early stage. Is itperhaps the effect of reduced cost estimates by the ministries or increasedcost estimates by the consultants? The same goes for the effect on budgetarycompliance. If the situation improves, is it the result of better cost estimatesand cost control, or simply because budgets have increased? If the latter,the scheme will not have proved its value. What seems to be the case so far,however, is that there is an increased awareness in ministries and agenciesabout cost estimation, which might have a positive disciplining effect in thetime to come.
The extended quality-at-entry regime, which was introduced in 2005,adds another dimension to the regulatory feature of the scheme, in thatit anchors the decision regarding the choice of concept in the PrimeMinister’s Office. The reason for this is that the choice of concept isconsidered the single most important decision that will determine viabilityand utility of a project, and hence the extent to which public funds arebeing used effectively. Lifting the decision from the administrative to the
186 Planning and decision-making

political level provides a distance from narrow perspectives and profes-sional biases. It also introduces authority, which is expected to have atrickle-down effect on professional conduct at ministry and agency levels.For these reasons, it is expected to be controversial. The response, some-what surprisingly, seems to be rather coloured by an understanding thatthis is a sensible and logical step in the right direction, and that the hands-off approach is being appreciated.
One fundamental aspect of the governance regime is that at least threealternative concepts should be considered, and this should be done at anearly stage when options are still open. The alternatives should have thesame degree of specification, to help to make a fair assessment of alterna-tives. This has triggered a debate regarding what should be considered aconcept. Should it be restricted to a distinction between different technicalsolutions to the same problem, for instance bridge versus tunnel in aninfrastructure project for crossing a fjord, or should it be related to thedifferences in the combined effects of different projects in the broadestsense? Whatever the answer, since the regime has put this on the publicagenda it could have an effect on analysts, politicians and the public in thetime to come. This, and the emphasis on socioeconomic analysis, mightprove significant in the aim to identify relevant alternative concepts andselect viable project alternatives.
In terms of tactical cost underestimation up front, the governmentagency is now required to come up with a realistic preliminary cost estimateat an early stage, when alternative concepts are being considered. The factthat this estimate will be subjected to a second external review once the pre-study is completed could have a disciplining effect on analysts and helpreduce large cost overrun, as we have seen in the past. But again, it is fartoo early to draw any lessons from this experiment.
Project governance has only recently become an issue in the project-management community. In order to move forwards in this field, numer-ous questions need to be answered: which are the current proceduresapplied in different countries and agencies – and what are their effects?What would it take to develop more effective governance regimes at inter-national, government or corporate level to ensure maximum utility andreturn on investment for society and investors? What would be the optimalmix of regulations, economic means and information in improved gover-nance regimes for mega-projects? What seems to be an issue for theproject-management community is to lift their perspective beyond thedelivery of the project itself and onto the broader issues of the project’sutility and effects. An increased understanding and sensitivity in this areacould be of mutual benefit to both the financing and the implementingparties.
How to overcome major weaknesses: the Norwegian approach 187

NOTES
1. Quality at entry was used as an indicator to characterise the identification, preparationand appraisal process that the projects had been subjected to up front.
2. For further information, see www.concept.ntnu.no.
REFERENCES
Altshuler, Alan and David Luberoff (2003), Mega-projects. The Changing Politics ofUrban Public Investment, Washington, DC: Brookings Institution Press/LincolnInstitute of Land Policy.
Bemelmans-Videc, M., R. Rist and E. Vedung (eds) (1998), Carrots, Sticks, andSermons: Policy Instruments and Their Evaluation, New Brunswick, NJ:Transaction Publishers.
Flyvbjerg, Bent, Nils Bruzelius and Werner Rothengatter (2003), Megaprojects andRisk: An Anatomy of Ambition, Cambridge, MA: Cambridge University Press.
Miller, Roger and Brian Hobbs (2005), ‘Governance regimes for large complex pro-jects’, University of Montreal, paper for the EURAM 2005 conference.
Miller, Roger and Donald R. Lessard (2000), The Strategic Management of LargeEngineering Projects: Shaping Institutions, Risk and Governance, Cambridge,MA: MIT Press.
PMI (Project Management Institute) (2005), A Guide to the Project ManagementBody of Knowledge PMBOK® Guide, PMI.
Samset, Knut, Peder Berg and Ele J. Klakegg (2006), ‘Front end governance ofmajor public projects’, paper presented at the annual European Academy ofManagement conference, Oslo.
World Bank (2000), Reforming Public Institutions and Strengthening Governance: AWorld Bank Strategy, Washington, DC: World Bank.
188 Planning and decision-making

10. Public–private partnership andmega-projectsJoop Koppenjan
10.1 INTRODUCTION
Public–private partnership (PPP) in mega-projects has attracted increasingattention worldwide and is seen as a promise for the future (Pollit, 2002). Itis often considered to be a third option for preparing and managing publicinfrastructure projects, in addition to traditional public project develop-ment and privatisation.
Traditional preparation and management of public projects consists ingeneral of governments preparing the projects, contracting out the con-struction and taking care of the maintenance and operation themselves orcontracting these out separately. Despite the popularity of PPP, this is stillthe dominant method of working in, for example, projects in the transportand water sector worldwide.
Although there are examples showing that public service provision is suc-cessful, for instance in the field of water management, it is often associatedwith government failure (Johnstone and Wood, 2001). Public decision-making stands for ‘pork-barrel policies’ in which public funds are chan-nelled into lobbies of alliances of private company, public organisationsand politicians, a selection of uneconomic projects and major budget over-spending and time overruns (Bruzelius et al., 2002). The cost overspend of84 per cent (£3.5 billion instead of the planned £1.9 billion) on the newJubilee Line extension of the London Underground which was delivered in2000, six years after the initially intended date, is a well-known example(Joosten, 2005). Public service provision is considered to involve poorquality and efficiency, inadequate innovation and, particularly in develop-ing and transitional economies, low levels of cost coverage, neglect of poorsections of the population and clientism.
Privatisation of infrastructures has been realised worldwide in thetelecommunication and energy sectors based on the idea that the marketwill provide more funds, greater efficiency, better service and more innova-tion. At the same time there is an increasing awareness that as a result of
189

market failure certain goods and services will not be delivered, the area sur-rounding infrastructures will be burdened with negative side-effects suchas noise and pollution, and other forms of nuisance, and opportunisticbehaviour leads to higher prices, inadequate service provision and invest-ments failing to materialise. Extensive regulation is needed in order tocontrol these negative effects (Johnstone and Wood, 2001; Koppenjan andEnserink, 2005).
In areas where privatisation has remained limited up to now, such as inthe transport and water sector, PPP is seen as a third option, by means ofwhich it will be possible to avoid both public and market failures. Theadvantages of involving the private sector in public projects can be com-bined with the promotion and safeguarding of public values. For politicalreasons, however, in debates PPP may be positioned in somewhat differentways. In the UK, for instance, PPP is put forward by the Labour govern-ment as an alternative to privatisation, whereas in Australia PPP is viewedas a fullyfledged form of privatisation.
The Private Finance Initiative (PFI) model that was developed by theConservative government in the UK in the early 1990s and taken up byBlair under the name public–private partnership appears to be developinginto an important standard worldwide (Osborne, 2000; Pollit, 2002;Spackman, 2002). The UK continues to play a pioneering role in this. HMTreasury (2005) reports a commitment of £42.7 billion by the UK govern-ment for 667 PFI projects in 2004. Among other countries, Australia, theNetherlands and South Africa have set up programmes to follow thisexample.
The spread of PPP worldwide shows that the expectations are high: PPPis supposed to offer the opportunity to avoid government and market fail-ures, and to combine the strong points of public and private involvement,making it a ‘marriage made in heaven’ (Hodge and Greve, 2005). However,PPP also has a host of critics who think that the construction and man-agement of essential public infrastructures and the public service provisionlinked with it cannot be trusted to private parties. In the view of thesecritics, PPP stands for ‘problem, problem, problem’ (Bowman, 2000).
Given the increasing relevance of PPP for public infrastructural projects,we present an overview of the experiences with regard to this phenomenonin this chapter. We will investigate to what extent PPP lives up to expecta-tions: is it a ‘marriage made in heaven’ or does PPP in practice stand for‘problem, problem, problem’?
Given the scope of this contribution, we are not able to provide a com-prehensive overview of all PPP applications in major public infrastructuralprojects worldwide. We concentrate in particular on PFI-like arrangementsin the transport and water sectors. First of all we will discuss what PPP is
190 Planning and decision-making
about, why PPP is introduced and which PPP models are most commonlyused (Section 10.2). We then outline the state of the art of the applicationof PPP in practice: are the ambitions that underlie the choice of PPPrealised (Section 10.3)? After that we discuss a number of typical problemsthat occur in PPP processes which will have to be dealt with in order tomake PPP schemes work (Section 10.4). Finally, Section 10.5 summariseslessons regarding the conditions for successful PPP in mega-projects.
10.2 WHAT PPP IS ABOUT: DEFINITIONS, MOTIVESAND FORMS
The term PPP is used in a catch-all way to denote a large number of rela-tionships between the public sector and the private sector (Whettenhall,2003). Nevertheless there is a certain consensus about what the term doesand does not include.
What’s in a Name? Defining PPP
Broadly speaking, a PPP project is understood to be a project in whichprivate parties on the basis of long-term contracts or arrangements areinvolved in the design, building, maintenance and/or operation of a publicinfrastructure, and co-finance it (Li and Akintoye, 2003; Spackman, 2002).Forms of innovative contracting such as design and construct, and design,construct and maintenance are not usually seen as PPP; in PPP privateparties are expected to take on responsibility with regard to the financingof the project (Van Ham and Koppenjan, 2002).
Motives for PPP: Realising Value for Money
Governments strive for PPP because they think the building and operationof infrastructural projects according to this formula is cheaper, faster andbetter. The following benefits of PPP are expected (HM Treasury, 1993;Ministerie van Financiën, 1998; Spackman, 2002):
1. Attracting private investment Investment in infrastructure is an expen-sive business and governments’ wish lists are long. These desiresconcern both new infrastructure and the upgrading of existing infra-structure. Public funds are too limited to realise all these desires. Bymeans of PPP, efforts are made to attract private money in order toenable these investments. Under EU financial policy European coun-tries see PPP as an opportunity to realise infrastructural projects
Public–private partnership and mega-projects 191

without growing budget deficits, enabling them to meet the require-ments of the EU budget policy (Pollit, 2002; Johnstone and Wood,2001).
2. More value for money (VfM) Private companies are supposed to workmore cost-consciously and efficiently than the public sector. Moreover,with PPP contracts various project components such as design, build-ing, maintenance and realisation are contracted out jointly. Sinceprivate parties are able to coordinate these phases, design optimisationsare possible which lead to better quality and efficiency returns.Ultimately, the same project can thus be delivered for less money, orhigher quality can be achieved for the same money. The chances ofoverspend in terms of time and budget decrease, too, because privateparties are better at project management and contracts discouragemodifications during the project (Pollit, 2002; Spackman, 2002).
3. Promoting innovation By involving private parties and particularlymajor, international players, in public projects, expertise is tappedwhich governments themselves do not have at their disposal so thatinnovative solutions become possible. Innovations can lead to designoptimisations with efficiency returns, but also to redefinitions of thescope and content of projects, thus increasing its societal value(Koppenjan, 2005).
4. Better decision-making and project management Private involvement isconsidered to improve the decision-making on infrastructure because itforces the government to clearly delimit and define the project before-hand. PPP also limits the informal lobby activities of private partiesbecause they are expected to participate in the risk-bearing. Thechances of over-optimistic estimates of returns and costs and the selec-tion of uneconomic projects – characteristics of public decision-making– decrease, since private financial institutions will monitor the qualityof investments and project management (Bruzelius et al., 2002).
Forms of PPP: an Overview of Contractual Arrangements
Forms of PPP can be classified according to the extent to which tasks, risksand responsibilities of former public service provision are transferred to theprivate partner (Bennet and Grohmann, 2000; Akintoye and Beck, 2003;Walker and Smith, 1995). In the literature a wide variety of classifications isused. Figure 10.1 gives an overview of three frequently used categories ofPPPs. These three models of public sector involvement are elaborated below.
1. Operation, maintenance and service contracts The private sector mustperform the service for the agreed costs and must meet performance
192 Planning and decision-making
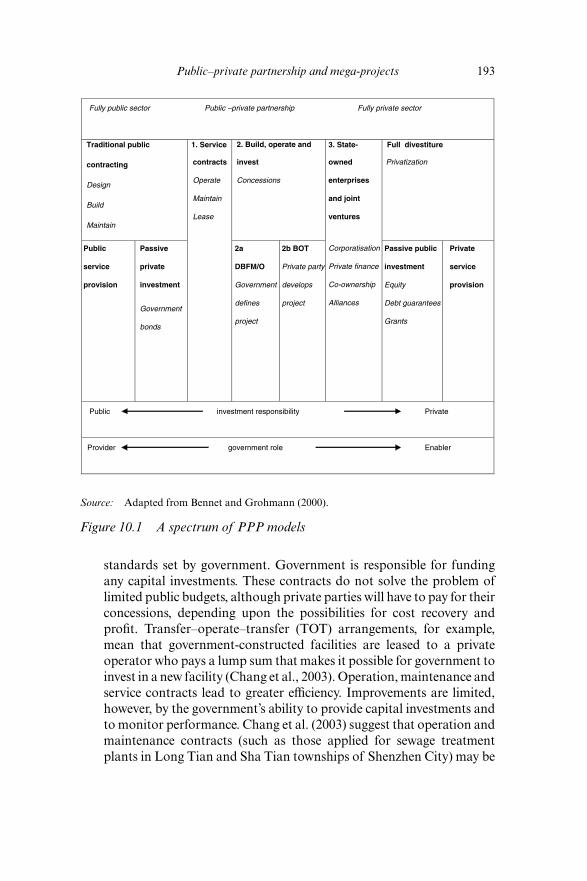
standards set by government. Government is responsible for fundingany capital investments. These contracts do not solve the problem oflimited public budgets, although private parties will have to pay for theirconcessions, depending upon the possibilities for cost recovery andprofit. Transfer–operate–transfer (TOT) arrangements, for example,mean that government-constructed facilities are leased to a privateoperator who pays a lump sum that makes it possible for government toinvest in a new facility (Chang et al., 2003). Operation, maintenance andservice contracts lead to greater efficiency. Improvements are limited,however, by the government’s ability to provide capital investments andto monitor performance. Chang et al. (2003) suggest that operation andmaintenance contracts (such as those applied for sewage treatmentplants in Long Tian and Sha Tian townships of Shenzhen City) may be
Public–private partnership and mega-projects 193
Source: Adapted from Bennet and Grohmann (2000).
Figure 10.1 A spectrum of PPP models
Fully public sector Public –private partnership Fully private sector
Traditional public
contracting
Design
Build
Maintain
2. Build, operate and Full divestiture
Public
service
provision
Passive
private
investment
Government
bonds
1. Service
contracts
Operate
Maintain
Lease
2a
DBFM/O
Government
defines
project
2b BOT
Private party
develops
project
3. State-
owned
enterprises
and joint
ventures
Corporatisation
Private finance
Co-ownership
Alliances
Passive public
investment
Equity
Debt guarantees
Grants
Private
service
provision
Public investment responsibility Private
Provider government role Enabler
invest
Concessions
Privatization

best for cities where facilities have already been constructed. The aim isnot to attract private investments but to increase efficiency. This maylead to savings that will lower subsidies and tariffs.
2. Build, operate and transfer (BOT) These forms bring private invest-ments into the construction of new infrastructure or the upgrading ofexisting infrastructure. Combining construction and operation makesdesign optimisations possible. Because private parties accept financialresponsibilities, they become receptive to financial incentives providedby government. Private parties may receive government payments oruser payment, depending on the kind of contract involved. Concessioncontracts (e.g. design, build, finance, maintain and/or operate –DBFM/O) are publicly developed projects, for which consortia of con-tractors, financers and operators have to be found to realise them. Thisis the model that is known as PFI (Private Finance Initiative) in the UK(Pollit, 2002).
In these contracts up-front financing from private parties is neededto pay for the construction of the project. They can then recover thecosts on this investment through a ‘user-pay’ system in which users haveto pay for the use of the infrastructure or the service provided or, if thatis not possible or desirable, through a ‘government-pay’ system: thegovernment then pays a one-off or annual availability or performancefee. An example of this is the shadow toll, which can be put into oper-ation when toll charging is not possible owing to the existence of alter-native connections or legislation preventing the charging of tolls.Depending on whether the contractor has borne the cost of realisingthe infrastructure and is able to recover the costs on this investment ata profit, this party pays for the concession. If excess profits are antici-pated, benefit-sharing arrangements between government and privateparties can be entered into. Furthermore, contracts can contain bonusand penalty provisions in order to ensure that there are incentives forthe private party to continue to perform during the building, mainte-nance and/or operation phases.
DBFM/O contracts require that governments have the expertise andregulatory capacity to develop viable projects and manage complexcontracts. If this expertise and capacity are not available, as is the situ-ation in many developing countries and countries with economies intransition, the build, (own,) operate and transfer (BO(O)T) model maybe an alternative. If this model is used, private parties are responsiblefor the development of the project. The ownership of the projectremains with the government. After an agreed period for operation, inwhich private parties have to recover their investment costs, the projectis then transferred to government. Sometimes also the ownership is in
194 Planning and decision-making

the hands of the private parties during the concession period (BOOTcontracts). Fully fledged concessions such as those used for watersupply in Manila may result in increased service delivery, which is ofgreat value to poorer households (Johnstone and Wood, 2001).
3. State-owned enterprises and joint ventures Governments may decideto incorporate the realisation and/or operating of an infrastructureproject in a special-purpose vehicle (SPV), a private-law body whoseshares are entirely in the hands of the government. The advantage ofthis is that it places the project development and operational manage-ment at arm’s length from the political sphere so that it can occur in abusiness-like way. A state-owned enterprise (SOE) of this type can befinanced with public funds, which can subsequently be recovered viatoll charges. This is the mode of operation used in the realisation of themulti-billion euro projects at Great Belt (a toll bridge in Denmark) andthe Oeresund (the combined rail and road link comprising a tunneland bridge between Denmark and Sweden) and the – less costly –Westerscheldt Tunnel in the Netherlands. Bruzelius et al. (2002) advo-cate that SOEs of this type should be forced to attract private financingbecause private control mechanisms would thus be activated whichbetter ensure the cost-effectiveness and control of the project.
Joint ventures are SPVs in which both government and private partiesinvest. This model makes it possible for both parties to cooperate inten-sively during some or all phases of infrastructure development andoperation. This model, sometimes referred to as ‘alliance model’ or‘institutional PPP’, to more clearly distinguish it from the ‘concessionmodel’ or ‘contractual PPP’, is particularly suited to complex, innova-tive and uncertain projects that cannot be precisely defined beforehand(Van Ham and Koppenjan, 2002; EU, 2004). By sharing risks, costs andbenefits, it becomes possible to develop and operate these projectsjointly and to realise innovative infrastructures and services. Someauthors consider this arrangement to provide the conditions for realpartnerships, enhancing the intensive forms of collaboration needed todevelop the high-quality infrastructures which the current complexnetwork society demands. Concession contracts in their opinion do notadd much to genuine outsourcing arrangements (Klijn et al., 2007).
These three forms of PPP differ in the extent to which (commercial) risksare transferred from the public to the private sector (Bennet and Grohmann,2000). In addition, they place increasing demands on the skills and capaci-ties of the public procuring agency responsible for designing and managingthe contract. The choice of the PPP model therefore is contingent upon boththe nature of the project and the regulatory capacity of government.
Public–private partnership and mega-projects 195

10.3 EXPERIENCES WITH PPP: DOES IT LIVE UP TOEXPECTATIONS?
To what extent did PPP in mega-projects live up to expectations regardingthe realisation of private investments, value for money, innovation andbetter decision-making?
Are Private Investments Realised?
Experiences in several countries, and especially the UK and theNetherlands, show that it is hard to get PPP projects off the ground. In theUK the first initiatives date from the 1980s, but only from the middle ofthe 1990s onwards did the number of PFIs increase, due to efforts of theTreasury and the establishment of specific units within government pro-moting PFI. Pollit (2002) cites the example of the Channel Tunnel RailLink (the link between the Channel Tunnel and London) and the SkyeBridge (a PFI toll bridge in Scotland) (NAO, 1997). In 2004 there were 667signed PFI schemes in the UK with a total capital value of £42.7 billion.Half of the projects by value were transport projects (HM Treasury, 2005).In the Netherlands from 1998 onwards a large number of PPP initiativeswere taken, but the number of PPP contracts that are actually signedremain rather limited, although the Ministries of Finance and Transportare committed to PPP. More common are partnerships in the form offormal or informal alliances, for instance in city revitalisation projects(Klijn et al., 2007). In Denmark PPP is not developing due to the adverseattitude of the Ministry of Finance. The public funding of projects is con-sidered to be cheaper and more appropriate. Overall one can conclude thatPPP needs active promotion and specific government units and regulationsin order to be accepted as an alternative to the traditional public prepara-tion and management of infrastructural projects.
Nevertheless, in the area of transportation and water managementworldwide, some governments do succeed in attracting private capital andthus in realising projects that, without private money, would be consider-ably delayed or would not be realised at all. Boxes 10.1 and 10.2 give anoverview of the PPPs in these two areas.
BOX 10.1 THE USE OF PPPs IN TRANSPORTPROJECTS
In Europe, Spain and France are known for their extensive networkof toll roads, built and operated by private companies.However, the
196 Planning and decision-making

ownership of many of these companies has passed over to gov-ernment, since the private companies that originally built the roadsperformed poorly as operators (Flyvbjerg et al., 2003). Onlyrecently in France has reprivatisation been considered. Currently,the UK, Spain, Portugal, Finland and the Netherlands haveadvanced PFI arrangements. In Portugal, BOT arrangements havebeen used since the early 1990s. Economic growth resulted in anincreased demand for basic infrastructure such as motorways,bridges, railways and pipelines. PPP was pursued in order to getprivate investment. In Finland, the first DBFO project, the LathiMotorway, was started in 1997 (Akintoye and Beck, 2003). InGermany, about 12 road projects and one railway project werefinanced by DBFO schemes, involving DM 4.6 billion (Flyvbjerget al., 2003). As mentioned in the introduction, Australia andSouth Africa are also committed to PFI programmes. Australia isexpected to realise A$20 billion on PPP projects during the period2002–7 (Gray, 2002).
In the USA and Canada, PPP has mainly developed at thecounty and municipal level, especially in the fields of publicschools, welfare programmes, inner-city redevelopment andwastewater treatment operation. In California, four toll roads havebeen realised by BOT schemes, without state or federal funds(total value $2.5 billion). Since the mid-1990s Canada has selec-tively applied PPP (in Canada: P3) to large infrastructure projectsin Nova Scotia (Akintoye and Beck, 2003).
In the developing world there is a strong regional concentrationof PPP in Latin America and South East Asia. In Mexico, develop-ment franchises were tendered for the construction of 5400 km ofmotorway in the period between 1984 and 1994.
In Asia, BOT-like schemes have been used in China, Thailand,the Philippines, Malaysia, Vietnam, Korea and Japan (Akintoyeand Beck, 2003). The BOT contracts in Hong Kong have beensignificant sources of inspiration.The first major BOT project wasthe Cross Harbour Tunnel (CHT) under Victoria Harbour whichlinks Hong Kong Island with Kowloon. The building of the projectstarted in 1969 and cost US$56 million. The CHT has been suc-cessfully operated since then, and four further tunnels havebeen realised in this way. All these projects had a concessionperiod of 30 years in which the investors will need to recoup theircosts by means of toll charges (Kumaraswamy and Zhang,2001).
Public–private partnership and mega-projects 197

BOX 10.2 THE USE OF PPPs IN THE AREA OFDRINKING-WATER SUPPLY ANDWASTEWATER MANAGEMENT
Haarmeyer and Coy (2002) provide an overview of projects in thefield of drinking-water supply and wastewater management overthe whole world, and show that although public service provisionremains dominant in this sector, in numerous countries projectsare being realised under PPP. Whereas in the UK water and sew-erage are privatised, France and Spain are using long-term con-cessions. In the Netherlands sale-and-leaseback constructionswere popular during the 1990s since tax rules made them finan-cially attractive. Recently a large wastewater treatment facility inDelfland has been realised, using a DBFM concession of 30 years(Expertise Centrum PPS, 2004). In the Eastern European capitalsof Sofia and Bucharest, 25-year concessions have been issuedby means of a public tendering process for the operation andimprovement of extensive drinking-water and wastewater sys-tems. In China, Vietnam, Korea, the Philippines and Thailand, too,important BOT and BOOT contracts have recently been enteredinto with regard to drinking-water supply and wastewater treat-ment. In South America, many BO(O)T projects in this area havebeen delivered, with Argentina in the forefront: 70 per cent of thedrinking-water supply is controlled by private providers. In theUSA, 85 per cent of the drinking-water supply and 95 per cent ofthe wastewater treatment is in public hands. In the coming years,however, huge investments are needed to meet the increasinglystringent requirements that are being imposed on drinking waterand wastewater (Haarmeyer and Coy, 2002; see also Johnsonand Moore, 2002).
Although there are many infrastructural projects for which privatefinancing has been found, there is also a great deal of evidence that govern-ments find it difficult to introduce PPP as a new institutional practice. Inaddition, it is important to note that PPP does not guarantee private invest-ments. In their evaluation of 76 North American PPP projects, Boardmanet al. (2005) state that substantial private investment was realised in less thanhalf of these projects. Five projects in the field of transport, drinking-watersupply and waste processing were fiascos, with private parties wanting to befully compensated for commercial risks and threatening bankruptcy to
198 Planning and decision-making

prevent losses, while the public authorities did their utmost to ensure thatthe projects were continued.
Some authors point out that many PPP contracts such as DBFM andDBFO chiefly concern pre-financing. PPP involves either the purchase ofinfrastructure through users’ credit cards, or the introduction of a mecha-nism whereby a one-off public capital expenditure is replaced by a series ofsmall, annual expenditures (Hodge and Greve, 2005). Especially withregard to PFI schemes, the emphasis on generating new private investmentsrecently seems to have lost importance in favour of the other PPP advan-tages (Klijn et al., 2007). In developing countries, generating private invest-ments obviously remains an important motive.
Is Value for Money Realised?
Do PPP schemes deliver better value for money than publicly developedand managed infrastructural projects?
Hall (1998) examined a number of early PFI projects in the UK andascertained that in road projects and prison projects considerable savingshad been achieved. Although calculations were surrounded by uncertainty,he found that there were nevertheless ‘some grounds for optimism’.Moreover, an analysis of 29 PFI projects commissioned by the TreasuryTask Force identified efficiency advantages of 17 per cent with respect tothe public sector comparator (Arthur Andersen and Enterprise LSE, 2000).In 1999, the National Audit Office (NAO) examined ten PFI projects andfound that in every project the best offer had been selected, and in eight outof ten cases good value for money was achieved. The NAO reported a 10 to20 per cent efficiency return on seven projects (NAO, 1999). An influentialreport from the Institute for Public Policy Research (IPPR, 2001) con-cluded that PFI had been successfully applied in road construction andprisons; but was less successful in delivering hospitals and schools. MottMacdonald (2002) and the NAO (2003) found that PPP delivers on time farmore often than infrastructure projects realised with public funding. Pollit(2005) finds this too: projects under PFI ‘are [now] delivered on time andto budget a significantly higher percentage of the time’.
Hodge (2005) examined 48 Australian projects, three of them in depth,and found that these projects were well managed from a commercial pointof view. By means of a 34-year BOT concession, the A$2.1 billion CityLink project in Melbourne was contracted out, whereby risks were suc-cessfully transfered and value for money was achieved. With regard to PPPin human service contracting in the USA, Martin (2005) found a significantimprovement in contractor performance thanks to the use of performance-based incentives. In the Netherlands, the conversion of a regional road into
Public–private partnership and mega-projects 199

a motorway (the A59) by means of a PPP arrangement underlined thepotential of performance-based incentives.
However, the assessment of PPP as successful in realising value formoney and improved project management is not unchallenged. Althoughsome PPP projects were successful and delivered value for money, othersdid not. The Skye Bridge in Scotland, which opened in 1993, turned out tobe more expensive than if it had been realised with public funding. In theNetherlands the PPP road tunnels which were built in the early 1990sproved to be more expensive than public construction too. In the UK, PPPdid not deliver value for money in the case of hospitals and schools (IPPR,2001; NAO, 2003).
What is more, the methods used for calculating value for money – thePublic Private Comparator (PPC) and the Public Sector Comparator(PSC) – are heavily criticised. Hall (1998) states with respect to his positivefindings that the furnishing of proof is weak because an accurate and non-controversial public-sector comparator is lacking. The complex contractsare surrounded by uncertainties and, in addition, the outcomes of long-term contracts are always uncertain. Moreover, data may have beenadjusted because it was politically advantageous to imply efficiency returns.Shaoul (2005) mentions manipulation of the PSC process. In the DutchHigh Speed Rail Link project and the N31 road project the assumptionsused in conducting these studies were chosen in such a way as to justify thechoice of PPP (TCI, 2004; Buck, 2004). Bloomfield et al. (1998) mention alease contract at a correctional facility in Massachusetts of a 7.4 per centmore expensive deal than using conventional financing, disguised by‘inflated sales pitches’. Fitzgerald (2004) shows with regard to eight PPPprojects in Victoria, Australia, that the finding of value for money is highlysensitive to the choice of the discount rate. If this were set at 5.7 instead ofat 8.65 per cent, the outcomes would be reversed. With regard to four earlyPFI road projects in the UK, the NAO (1998) determined that an inappro-priate discount rate was used. Ultimately it appeared that public construc-tion would have been cheaper. Even more uncertainties are involved in theuse of the PPC and the PSC; for example, the question of to what extentcosts, benefits and risks have been included in the calculations. Boardmanet al. (2005) examined 76 major ‘P3’ projects in North America and ascer-tained that it is difficult to take account of the transaction costs of PPP pro-jects – which can be high – when making a comparison with traditionalpublic implementation.
These latter observations show that it is difficult to conclude beyond anydoubt that PPP schemes deliver better value for money. As far as they do,it is clear that this depends on the specific circumstances of projects andpolicy areas. Following the reasoning of Pollit (2002), we can conclude that
200 Planning and decision-making

in some policy areas and some countries, parties involved seem to have gonethrough a learning circle by which they have gradually succeeded in mas-tering the PPP process, while others still have not.
Do PPP Schemes Result in Innovation?
Do PPP projects result in more innovation than public projects? Pollit(2002) ascertains that substantial innovation is realised both with respectof the physical assets of projects as well as in governance methods, contractforms and financial constructions.
However, some authors state that the potentials of PPP with regard toinnovations are not fully realised, due to the preference for PFI-type con-tracts in which the government defines the project in advance and draws upclear specifications for design. Within the constraints which then apply, thedesign scope for private parties is limited to design optimisations. For moreinnovative contributions, a collaborative development process is necessaryfor which joint ventures are more appropriate (Klijn et al., 2007; Van Hamand Koppenjan, 2002).
Within PFI contracts the design scope is often further limited becausethe specifications for design are not formulated at the level of functionalrequirements and parties endeavour to exclude all risks by means ofdetailed contracts. This trend is reinforced by the fact that both public andprivate parties do not yet have the skills needed for PPP. For example, theproject organisation that led the procurement process for the Dutch HighSpeed Rail Link project until far into the contract negotiations was gearedtowards the conventional tendering of projects. Content-driven expertisedominated and detailed referential designs were used.
Moreover, it appears that the participation in the tendering process offoreign companies, from whom innovation is anticipated, is often disap-pointing. For instance, in the Dutch High Speed Line project foreign com-panies participated only in two of the ten contracts involved. Companiesfind it difficult to meet the legislation and regulations of countries thatare unfamiliar to them. Also, national governments and industries donot warmly welcome foreign companies to their national markets (TCI,2004).
To sum up, in some PPP projects innovations are realised. In other pro-jects they are prohibited by inflexible procurement procedures and the useof detailed rather than functional requirements. PFI-like contracts restrictinnovation to design optimisations. These contracts leave little room forimprovements with regard to the content and scope of projects, since thePFI approach implies that projects are defined up front by governmentwithout private involvement.
Public–private partnership and mega-projects 201

Does PPP Improve the Quality of Decision-making and ProjectManagement?
Do PPP schemes contribute to better decision-making on infrastructuralprojects and fewer budget and time overruns?
PFI indeed seems to encourage governments to clearly define perfor-mance requirements and to introduce financial penalties for failure toperform. Since private parties carry financial risks, it is more likely that pro-jects will start on time and meet requirements because the contractor doesnot get paid until he delivers. Furthermore, PPP brings in private manage-ment skills, innovative design and risk management expertise, conditions forbetter decision-making and better project management (Klijn et al., 2007).
On the other hand, there are examples of governments and private com-panies engaging in PPP schemes without clear up-front project definitionsor realistic assumptions and calculations. In the Netherlands, privatisationdid not appear to have a disciplining influence on the planning processespertaining to the three major rail projects in which PPP was applied, i.e. theHigh Speed Rail Link, the Betuwe Link and the Zuiderzee Link. On thecontrary, the argument that private parties would want to co-finance wasused to convince Parliament that the projects were socially profitable.Furthermore, private parties do not always base their decision to partici-pate on rational arguments either. For example, in promoting the con-struction of the Zuiderzee Link in the Netherlands, Siemens aimed atbringing its maglev technique into practice even though the project wascommercially uneconomic (TCI, 2004).
The quality of decision-making seems to be threatened by problems withregard to transparency, accountability and democratic legitimacy. Walkerand Walker (2000) criticise the ‘off-balance sheet PPP infrastructure deals’as misleading accounting trickery. In addition, they criticise the highreturns on investments of private parties in the Sydney Airlink BOOTproject, in which the private consortium anticipates a profit of 21 to 25 percent while the government is fobbed off with 2 per cent. In the case ofSydney’s M2 Motorway, private investors achieved a pre-tax return oninvestment of 24.4 per cent. They are of the opinion that under PPP,accountability towards Parliament and the public is rendered difficult.Johnston and Romzek (2005) find the same thing with regard to short-termservice contracts in North American water projects. Hodge (2005), too,ascertains in the Australian projects studied that arrangements are non-transparent, the government for political reasons presses ahead with thehurried construction of projects, and seems keener to protect the interestsof the private investors than public interests or the interests of the citizens.In the Melbourne City Link BOT contract, which was successful in
202 Planning and decision-making

terms of value for money, Parliament was hardly involved; the project isproblematic from the point of view of transparency and legitimacy. Otherauthors also mention high deal complexity and low PPP transparency,resulting in accountability problems (Fitzgerald, 2004; Hodge and Greve,2005).
To sum up, PPP may contribute to better decision-making and projectmanagement, but this is not guaranteed. PPP even introduces new challengeswith respect to transparancy, accountability and democratic legitimacy.
Lessons from Mixed PPP Experiences
It is difficult to pass an overall judgement on the success or failure of PPPas a method of working. Successes appear to lie chiefly in the sphere ofeffectiveness (private investments; value for money, improved project man-agement and innovation). The problems arise especially in the sphere oftransparency, legitimacy and accountability. But owing to the complexityof projects and contracts, the uncertainties with which they are surroundedand the limitations of the assessment methods used, the successes are notunquestioned. As far as they hold, they are closely bound up with the skillsthat governments have managed to develop in specific policy areas withregard to the procurement process and contract management.
10.4 ISSUES IN THE FORMATION ANDOPERATION OF PPP PROJECTS
It does not seem wise to go further into the endless debate on the success orfailure of PPP, and the highly normative and therefore unsolvable questionof whether governments should engage in PPP or not. Since PPP is a prac-tice that is adopted in a growing number of countries, it seems wiser toaddress the question of what typical problems parties face when engaging inPPP processes. In doing so, we may identify some of the critical conditionsthat influence the success or failure of PPP and that must be addressed inorder to reduce the chance of failures or disadvantages, and to improve thequality of the development and management of PPP projects in practice.
Issues in the Formation of PPP Projects
Since currently a reasonable number of PPP contracts have been con-cluded, the international literature on PPP provides us with a fairly goodaccount of the typical issues that parties involved face in the formationphase of PPPs.
Public–private partnership and mega-projects 203

Chaotic and lengthy procurement processesThe procurement processes by which PPPs are brought about are charac-terised by lengthy, erratic contract negotiations among a small number ofbidders, and considerable cost inflation during the bidding process, resultingin questionable risk properties. In the UK this pattern has been found in, forinstance, road projects and the London Underground, and in the High SpeedRail Link and the A59 and N31 road projects in the Netherlands (NAO,1998; 1999; 2003; Joosten, 2005; Koppenjan and Leijten, 2005).
In the design and construct and DFBM contracts for the High Speed RailLink, for instance, the private bids were between 43 and 80 per cent higherthan anticipated. What followed were improvised, chaotic negotiationsaimed at driving the bids down via cutbacks and the taking back of risks(TCI, 2004). Governments’ determination to develop PPP contracts putsthem in a weak negotiating position compared to private parties, running therisk of entering into complex contracts which they don’t fully comprehendand ending up taking back risks that they originally wanted to transfer.
High transaction costsThe transaction costs of PPP deals appear to be high for both governmentand private parties. Governments are often forced to hire external expertiseat high rates (Pollit, 2002). In the Dutch High Speed Rail Link project,foreign consultants received over €45 million. Due to the project-basedapplication of PPP, learning effects with regard to PPP are often not insti-tutionalised within standing organisations and may easily get lost after theproject is finished. Knowledge management aimed at institutionalisinglearning effects is an important strategy in trying to reduce transactioncosts.
Companies complain about the costs they have to incur for bids while notknowing if they will be remunerated. These experiences lead to pleas for areduction in the number of parties who are allowed to make bids, privateparties being reimbursed for their design expenses and the standardisationof procedures and contracts (TCI, 2004; Buck, 2004). Each of these solu-tions has institutional implications and drawbacks. So at this point is is farfrom clear how they should or could be brought into practice.
Lack of competitionPPP presupposes competitive tendering to stimulate private parties toproduce their best bids. Open tenders, or at least competitive dialogues,should prevent ‘shotgun marriages’ and ‘sweetheart arrangements’. Thisrequirement also implies that competition between (consortia of) banks,constructing firms and service providers exists. The practice of PPPshows in many cases a remarkable lack of competition, governments often
204 Planning and decision-making

creating legal monopolies in favour of their private partners (EU, 2004;Koppenjan and Enserink, 2005).
For instance, the tender procedure for the Dutch High Speed Rail Linkwas started at a time when there were already many major infrastructuralproject under construction. Constructing firms had little capacity availableand the prices of building materials were high. The competition was furtherlimited by the scale of the project: only a small number of large firms werecapable of doing the job. Collusion on the side of the firms, leading toillegal agreements on the height of the bids and the division of the market,reduced competition even further (TCI, 2004).
Late involvement of private partiesThe earlier private parties are involved, the greater the chance that innova-tive contributions will be delivered. In practice, however, it appears to bedifficult to achieve this early involvement. The preference for PFI-type con-tracts in which governments define projects up front restricts the possibili-ties for private parties to participate in early project stages. The marketconsultations governments use to involve private parties in early projectstages are highly voluntary by nature and there are disincentives for privateparties to invest in these activities. The tendering policies of governments,and especially those of the EU, even deter early involvement because itmight lead to exclusion from the competitive tendering process.
Strategic use of PCC and PSCIn theory, the choice of PPP is made dependent on the added value whichthis method of working has compared to traditional, public project prepa-ration. In the UK a converse burden of proof is used: the public scenariois only raised after it has become apparent that PPP does not deliver morevalue for money. The PCC and the PSC are used to determine this (Pollit,2002). As argued in Section 10.3, evaluation research has shown that theoutcomes of these instruments are not rock-solid but vary according to theassumptions used. The PCC and PSC are often used to legitimise the choiceof PPP. This does not mean that these instruments could not play a usefulrole in the development of PPP, however. De Bruijn and Leijten (2004)suggest that although the outcomes of these instruments are not reliableenough to be used to underpin decisions regarding the use of PPP, they dooffer governments information that can be used as a starting point in thenegotiation process with private parties.
Dealing with representative bodies and stakeholdersPPP schemes for major infrastructural projects result in high complexityand low transparency. This leads to accountability problems: representative
Public–private partnership and mega-projects 205

bodies such as parliaments or municipal and provincial councils arescarcely involved and have difficulty in understanding and exerting controlover PPP schemes. Careful coordination between the project and represen-tative bodies – before, during and after the conclusion of contract negoti-ations – is highly important. Of course Parliament will claim the right totake the final decision on the project. Uncertainty for contract partnerscannot be eliminated. At most, parties can make agreements about howthey will deal with any changes to their contractually agreed relations (DeBruijn and Leijten, 2004). In addition, the lack of transparancy and legiti-macy also raises the question of how stakeholders can be involved in PPPprojects. There are examples of PPP projects that were quite succesful inthis respect (Van Ham and Koppenjan, 2002).
Issues in the Contract Implementation Phase of PPP
The track record with regard to the implementation of PPP contracts,which often have a duration of 25 or even 30 years, is limited. Most of therecent proclaimed PPP victories refer to contract closure or at best to thefinalisation of the construction phase. It remains to be seen which issueswill arise during the contract implementation phase and whether partiesare equipped and capable of handling these. This depends on the contentand quality of the contract. The contract should for instance include con-ditions that further a proper transfer of the project at the end of the con-tract period
But since contracts almost by definition will be incomplete, this is notenough. Governments need to organise the regulation and management ofthe PPP contract. Furthermore, due to the long contract periods, it is clearthat PPP schemes will be vulnerable to changing conditions in the environ-ment of the project (e.g. technologies, physical environment, economy, poli-cies) which may jeopardise the public interest involved as well as privateparties’ return on investments. International accounts of the implementa-tion of PPP contracts suggest that the parties may expect the followingproblems (Koppenjan and Enserink, 2005).
Ex-post contract dependence: strategic behaviourLong-term contracts and arrangements between government and privateparties frequently create private monopolies. These evoke typical forms ofstrategic or opportunistic behaviour by private concessionaires: raisingcharges, reducing the quality of the service provision, cutting down onmaintenance, and avoiding investments in uneconomic project components(‘cherry-picking’). In the Netherlands, for example in urban developmentprojects, it turns out to be difficult to get private parties to invest in public
206 Planning and decision-making

project components such as parks, public transport and road infrastructure(Koppenjan and Enserink, 2005). One way out of this problem is to preventparties from raking in their profits too soon. For example, the contract withthe private infrastructure provider for the London Underground requiresthat during the first years of the contract, period investments only aremade; cost recovery can only occur later (Joosten, 2005; NAO, 2004).
Renegotiating contracts: adapting to circumstances or hold-up?In water concessions in South America the renegotiations by means ofwhich private providers try to get out of their contractual obligations toconnect poorer districts to their physical networks are notorious (Johnstoneand Wood, 2001). This is an example of the ‘hold-up’ phenomenon. If oneof the two parties has made asset-specific investments, asymmetrical depen-dence relations develop, allowing the other party to change contract condi-tions to his advantage. In addition, private parties can threaten bankruptcyor actively aim for it. Since the government ultimately has an interest in acompleted project which will be operated properly, it will feel compelled tointervene in order to save the project. The course of events regarding thebankruptcy of the Channel Tunnel Rail Link in the UK is an example ofthis (Pollit, 2002).
To prevent hold-up, arrangements should ensure that all involved partiesmake asset-specific investments so that they all have a common interest inmaking the project a success. Also, since during the operation of long-termcontracts circumstances are likely to change, contracts and contract part-ners should be prepared for dealing with interim contract modifications.The extent to which these general remedies in practice can be realised, andhow this can be done, is a challenge for practitioners and an interestingsubject for future research.
Manifest political risksAn important cause for the failure of PPP projects is the tendency of gov-ernments to modify contract conditions during development or operation.The consequences of this are budget and time overruns, private bankrupt-cies, or lengthy legal procedures entailing compensation claims. TheBangkok Elevated Transport System project in Thailand, for example, col-lapsed in the early stages of building because the government decided toopt for a tunnel (Tam, 1999). One of the reasons for the budget overspendon the Channel Tunnel was that the French and UK governments were ableto impose a whole range of safety requirements during development, whilethe costs lay with the private parties. This was compensated by an extensionof the concession period, but currently the concessionaire is still teeteringon the edge of bankruptcy (Flyvbjerg et al., 2003).
Public–private partnership and mega-projects 207

These experiences demonstrate that PPP projects need to be protectedagainst the tendency of governments to keep interfering in an uncoordi-nated way with the development and operation of a project. This imposesrequirements on the contract but also on a government as a professionalprocurer of products and services, and its capacity to coordinate the poli-cies and strategies of the various public bodies that are inevitably involvedin major projects.
10.5 CONCLUSION: CONDITIONS FOR PPP INMEGA-PROJECTS
From the overview of the problems public and private parties encounter information and implementation of PPPs, the following picture emerges: inPPPs a large number of parties are involved; contract negotiations andrenegotiations are erratic and lengthy; transactions costs are high; uncer-tainties about technologies, developments and forecasts are huge; trans-parency is lacking; and both public and private actors behave strategically,trying to create beneficial advantages by the way costs, benefits and risksare allocated. Parties often have unrealistic expectations of each other andare not very professional in playing the PPP game both in the phase of for-mation and in the implementation of PPP schemes. Apparently parties arenot very well prepared and equipped to deal with the reality of PPP in infra-structure projects, as a result of which the high expectations of PPP inmany instances are not realised. Parties lack the proper skills and expertise,the operation procedures of their organisations do not fit PPP require-ments and, above all, as far as governments are concerned, they do notwant to lose their control over mega-projects.
So the day-to-day reality of the marriage between public and privateparties can hardly be described as heavenly. PPP imposes stringent require-ments on both partners. In order to make this relationship work, it is notenough to develop proper contract forms and schemes; investments haveto be made in the institutional condition for governing these workingmethods: the development of skills and expertise; improvement of the roleperformance by governments as professional procurers and process man-agers, and private parties as contractors; and the redesign of organisationsto support these new roles.
Experiences from real-life cases teach us that the introduction and devel-opment of PPP in mega-projects follows a learning curve: it is only by actu-ally engaging in a series of PPP projects that parties learn to master the PPPprocess. In some sectors and some countries the learning process hasadvanced further than in others.
208 Planning and decision-making

The fact that PFI-type contracts seem to be developing into a new stan-dard may be considered beneficial for this learning process. Standardisationreduces complexity, thus increasing the understanding and quality of thePPP process. Giving the erratic tender procedures and contract negotia-tions, and the high transactions costs, both public and private parties callfor standardisation, which according to them helps to reduce the uncer-tainties and the costs of involvement in PPP processes.
This standardisation has a price, however. Mega-projects are far fromstandard. They have unique characteristics, which make them worlds apart.Just as some projects will be less suited for involving private partners thanothers (for instance when the project is highly controversial, when compe-tition is lacking or when there is no good business case), when PPP is con-sidered, it is far from obvious that one PPP model fits all. As shown earlier,there are different PPP models, developed for different purposes anddifferent projects. Some aim at a more efficient operation, others at realis-ing private investments, still others at developing innovative, high-qualityprojects.
As far as PFI is concerned, there is a remarkable tension with someessentials of large infrastructure projects. PFI assumes the up-frontspecification of project requirements by governments and risk transferto private parties. These schemes seem to be especially appropriatefor known, standard projects, like some road schemes or water treatmentfacilities. Large, complex infrastructure projects, however, are new,unique and surrounded by a high degree of uncertainty. Governmentsfind it hard to specify their requirements in advance. Private parties aresupposed to bring in their expertise and creativity at an early stage.Uncertainties mean that instead of riks-transfer, risk-sharing is sensible.In such cases the alliance model is perhaps more attractive than PFI-likeschemes.
All in all, there are reasons to argue that the current emphasis on PFI-like models in the world of mega-projects should be complemented byexperiments with other models: the variety of mega-projects calls for thedevelopment of a variety of PPP options, which makes the task for partiesto learn to handle these options even more challenging.
REFERENCES
Akintoye, A. and M. Beck (eds) (2003), Public Private Partnerships: ManagingRisks and Opportunities, London: Blackwell Publishers.
Arthur Andersen and Enterprise LSE (2000), ‘Value for money drivers in theprivate finance initiative’, report commissioned by the Treasury Taskforce,www.treasuryprojects.gov.uk/series_1/andersen.
Public–private partnership and mega-projects 209

Bennet, E. and P. Grohmann (2000), Joint Venture Public Partnerships for UrbanEnvironmental Services. Report on UNDP/PPPUE’s Project Development Facility1995–1999, New York: UNDP and Yale University.
Bloomfield, P., D. Westerling and R. Carey (1998), ‘Innovation and risks in apublic–private partnership: financing and construction of a capital project inMassachusetts, Public Productivity and Review, 21 (4): 460–71.
Boardman, A.E., F. Poschmann and A.R. Vining (2005), ‘North American infra-structure P3s: examples and lessons learned’, in G. Hodge and C. Greve (eds),The Challenge of Public–Private Partnerships. Learning from InternationalExperience, Cheltenham, UK and Northampton, MA, USA: Edward Elgar:169–89.
Bowman, L. (2000), ‘P3; problem, problem, problem’, Project Finance, 206; 25.Bruijn, J.A. de and M. Leijten (2004), ‘Publiek–private samenwerking bij infra-
structuurprojecten’, in TCI, no. 10: 232–48 (in Dutch).Bruzelius, N., B. Flyvbjerg and W. Rothengatter (2002), ‘Big decisions, big risks:
improving accountability in mega projects’, Transport Policy, 9 (2): 143–54.Buck Consultants International (2004), Evaluatie DBFM Rijksweg 31, The Hague
(in Dutch).Chang, M., M.A. Menon and H. Imura (2003), ‘International experience of
public–private partnership for urban environmental infrastructure, and its appli-cation to China’, International Review for Environmental Strategies, 4 (2): 223–48.
EU (2004), Green Paper on Public–Private Partnerships and Community Law onPublic Contracts and Concessions, COM(2004)327.
Expertise Centrum PPS (2004), Voortgangsrapportage 2004, The Hague: Ministerievan Financiën (in Dutch), www.minfin.nl.
Fitzgerald, P. (2004), Review Partnerships Victoria Provided Infrastructure, FinalReport to the Treasurer, Melbourne: Growth Solutions Group.
Flyvbjerg, B., N. Bruzelius and W. Rothengatter (2003), Megaprojects and Risk. AnAnatomy of Ambition, Cambridge, MA: Cambridge University Press.
Gray, J. (2002), ‘Going private: a twenty bn shake up’, Australian Financial Review,1: 52–3.
Haarmeyer, D. and D. Coy (2002), ‘An overview of private sector participation inthe global and US water and wastewater sector’, in P. Seidenstat, D. Haarmeyerand S. Hakim (eds), Reinventing Water and Wastewater Systems, New York: JohnWiley and Sons: 3–28.
Hall, J. (1998), ‘Private opportunity, public benefit?’, Fiscal Studies, 19 (2): 121–40.Ham, J.C. van and J.F.M. Koppenjan (2002), Publiek–private Samenwerking bij
Infrastructuur: Wenkend of Wijkend Perspectief, Utrecht: Lemma (in Dutch).HM Treasury (1993), Breaking New Ground: The Private Finance Initiative,
London: HMSO.HM Treasury (2005), PFI Signed Project Lists, London: HMSO.Hodge, G. (2005), ‘Public–private partnerships: The Australasian Experience with
Physical Infrastructure’, in G. Hodge and C. Greve (eds), The Challengeof Public–Private Partnerships. Learning from International Experience,Cheltenham, UK and Northampton, MA, USA: Edward Elgar: 305–31.
Hodge, G. and C. Greve (eds) (2005), The Challenge of Public–Private Partnerships.Learning from International Experience, Cheltenham, UK and Northampton,MA, USA: Edward Elgar.
IPPR (2001), Significant Reforms of PPPs Necessary for Labour to Deliver on PublicServices: Current Topics, www.ippr.org.uk, 25 June.
210 Planning and decision-making

Johnson, R.A. and A.T. Moore (2002), ‘Improving urban water infrastructurethrough public–private partnerships’, in L.W. Maus (ed.), Urban Water SupplyHandbook, New York: McGraw-Hill: 3.1–3.21.
Johnston, J.M. and B.S. Romzek (2005), ‘Traditional contracts as partnerships:effective accountability in social service contracts in the American states’, inG. Hodge and C. Greve (eds), The Challenge of Public–Private Partnerships.Learning from International Experience, Cheltenham, UK and Northampton,MA, USA: Edward Elgar: 117–43.
Johnstone, N. and L. Wood (2001), Private Firms and Public Water. Realising Socialand Environmental Objectives in Development Countries, Cheltenham, UK andNorthampton, MA, USA: Edward Elgar.
Joosten, W. (2005), ‘London Underground Limited. Een casusstudie van de groot-ste PPS van het Verenigd Koninkrijk’, Delft Thesis, Faculty of Technology,Policy and Management, Delft University of Technology (in Dutch).
Klijn, E.-H., J. Edelenbos and M. Hughes (2007), ‘Public–private partnerships: atwo headed reform; a comparison of PPP in England and the Netherlands’, inC. Pollitt, S. van Thiel and V. Homburg (eds), New Public Management in Europe:Adaptation and Alternatives, Basingstoke, UK: Palgrave Macmillan.
Koppenjan, J.F.M. (2005), ‘The formation of public–private partnerships: lessonsfrom nine transport infrastructure projects in the Netherlands’, PublicAdministration, 83 (1): 135–57.
Koppenjan, J.F.M. and B. Enserink (2005), International Best Practices in PrivateSector Participation in Sustainable Urban Infrastructure. Thematic report andpolicy recommendations, Delft/Stockholm/Beijing: CCICED Taskforce onSustainable Urbanisation Strategies.
Koppenjan, J.F.M. and M. Leijten (2005), ‘Privatising railroads: the problematicinvolvement of the private sector in two Dutch railway projects’, The Asia PacificJournal of Public Administration, 27 (2): 181–201.
Kumaraswamy, M.M. and X.Q. Zhang (2001), ‘Governmental role in BOT-ledinfrastructure development’, International Journal of Project Mangement, 19 (3):195–205.
Li, B. and A. Akintoye (2003), ‘An overview of public–private partnership’, inA. Akintoye and M. Beck (eds), Public–Private Partnerships: Managing Risks andOpportunities, London: Blackwell Publishers: 330.
Martin, L.J. (2005), ‘United States: human services’, in G. Hodge and C. Greve(eds), The Challenge of Public–Private Partnerships: Learning from InternationalExperience, Cheltenham UK and Northampton, MA, USA: Edward Elgar:144–162.
Ministerie van Financiën (1998), Meer Waarde door SamenWerken (eindrapport)The Hague (Ministerie van Financiën) (in Dutch).
Mott MacDonald (2002), Review of Large Public Procurement in the UK, London:Mott MacDonald.
National Audit Office (1997), The Skye Bridge, HC5 Parliamentary Session 1997–8,London: HMSO.
National Audit Office (1998), The Private Finance Initiative: The First Four Design,Build, Finance and Operate Roads Contracts, HC 476, 1997/1998, London:HMSO.
National Audit Office (1999), Examining the Value for Money Deals under thePrivate Finance Initiative, HC 739, Parliamentary Sessions, 1998–9, London:HMSO.
Public–private partnership and mega-projects 211

National Audit Office (2003), PFI Construction Performance, HC 371,Parliamentary session 2002–3, London: The Stationery Office, www.nao.org.uk.publications/nao_reports/01-02/0102375/pdf.
National Audit Office (2004), London Underground: Are the Public–PrivatePartnerships likely to work successfully?, Report by the comptroller and the auditorgeneral, HC 644 Session 2003–4: 17 June 2004, London: The Stationery Office.
Osborne, S. (ed.) (2000), Public–Private Partnerships: Theory and Practice inInternational Perspective, London: Routledge.
Pollit, M.G. (2002), ‘The declining role of the state in infrastructure investments inthe UK’, in S.V. Berg, M.G. Pollit and M. Tsuji (eds), Private Initiatives inInfrastructure: Priorities, Incentives and Performance, Cheltenham, UK andNorthampton, MA, USA: Edward Elgar.
Pollit, M.G. (2005), ‘Learning from UK Private Finance Initiative experience’, inG. Hodge and C. Greve (eds), The Challenge of Public–Private Partnerships.Learning from International Experience, Cheltenham, UK and Northampton,MA, USA: Edward Elgar: 207–30.
Shaoul, J. (2005), ‘The Private Finance Initiative or the public funding of privateprofit’, in G. Hodge and C. Greve (eds), The Challenge of Public–PrivatePartnerships. Learning from International Experience, Cheltenham, UK andNorthampton, MA, USA: Edward Elgar: 190–206.
Spackman, M. (2002), ‘Public–private partnerships: lessons from the Britishapproach’, Economic Systems, 26: 283–301.
Tam, C.M. (1999), ‘Build–Operate–Transfer model for infrastructure developmentsin Asia: reasons for success and failures’, International Journal of ProjectDevelopment, 17: 377–82.
TCI (Tijdelijke Commissie Infrastructuurprojecten) (2004), Grote projecten uitver-groot. Een infrastructuur voor besluitvorming [Large projects under the magnify-ing glass. An infrastructure for decision-making], Tweede Kamer, 2004–2005, nos1–10, The Hague: Sdu Uitgevers (in Dutch).
Walker, B. and B.C. Walker (2000), Privatization: Sell Off or Sell Out, Sydney: ABCBooks.
Walker, C. and A.J. Smith (1995), Privatised Infrastructure: The Build OperateTransfer Approach, London: Thomas Telford.
Whettenhall, R. (2003), ‘The rhetoric and reality of public–private partnerships’,Public Organization Review: A Global Journal, 3: 77–107.
212 Planning and decision-making

PART III
Innovation, Competition and Institutions


11. Innovations in the planning ofmega-projectsWerner Rothengatter
11.1 SOME LESSONS LEARNED FROM GOOD ANDBAD EXPERIENCES
The first big railway projects (Stockton–Darlington in the UK, 1825 andNürnberg–Fürth, 1835, in Germany) were purely business-oriented under-takings. In the second half of the nineteenth century the state came in, notonly to solve the problems with bankruptcy of some major players in therailway business, but in the first instance to coordinate the manifold railwayinitiatives associated with heterogeneous infrastructure and rolling stock aswell as the different types of organisation. Friedrich List (1841) was theprotagonist of spatial development policy through railway infrastructures,and his vision was to improve accessibility of the German regions so radi-cally through an efficient railway network that Germany would catch upwith the UK economy, which at that time was far ahead because of theCommonwealth.
It is obvious that the various spatial impacts stemming from a mega-project in the sense of Friedrich List cannot be captured by the projectcompany. This justifies the state coming in and forming a public–privatepartnership. Other reasons for the state’s participation are high risk, reduc-tion of external effects or social balance (e.g. for regional development). Assoon as the state comes in, however, the race is opened for all kinds of rent-seeking activities. Naturally, the private investors are interested in using statebodies and politicians as promoters for the project, and they will try to hedgetheir risk and gain supernormal profits through the construction work andthe financial business. The political players are interested in passing popularstories to the voters, such as increase of competitiveness, improvement ofregional economic structure, better employment or enhanced quality of life.
Three examples of mega-projects in the transport sector are exhibited inTable 11.1, summarising the most important experiences so far. The majorlessons learned are as follows:
215

1. In the case of public procurement there is a tendency to underestimatecosts and overestimate benefits.
2. In the case of public procurement there is little interest and little chanceto perform ex-post evaluations.
3. If private institutions have to take risk, then the expectations for theproject outcome tend to be more pessimistic. Short- and medium-termreturns dominate the benefit calculation.
216 Innovation, competition and institutions
Table 11.1 Characteristics of some mega-projects (see Flyvbjerg et al., 2003)
Project Function Critical Major benefits Procurementproblems
Channel Link UK to Promotion by Private finance, UnprofessionalTunnel the mainland; construction low public procurement in
passenger, industry; cost contribution; the first phase;freight trains overrun 80%; strengthening financialand rolling financing corridors consolidationmotorway cost 140% London– after
higher than Paris/Brussels establishmentforecasted of Eurotunnel
in 1994
Great Belt Link East Cost overrun Together with Weak costBridge and Denmark to 54%; Oeresund control;Tunnel mainland; complementary linking dominance of
rail and road with Oeresund Sweden public-typetransport but competitive and East procurement
with Fehmarn Denmark toBelt projects mainland
Oeresund Link South- Cost overrun Good example EfficientBridge and West Sweden 26%; of public– procurement;Tunnel to East overestimation private project
Denmark; of demand; partnership; companyprovide reduction positive businessdevelopment of user charges impacts on oriented;axis for the necessary regional publicly setCopenhagen to achieve development; car/truckagglomeration; planned increase of tariffs too highestablish patronage; public transit at start; changetransnational lower to two-partjoint ventures revenues than tariff(ports) expected

4. Private institutions tend to underestimate the network and other exter-nalities.
5. The public and private actors in general apply different cost and benefitcalculation schemes, often based on different forecasting approaches,as soon as the private actors have to bear part of the risk.
Beyond the three mega-projects in Table 11.1, Flyvbjerg et al. (2003) list anumber of projects procured worldwide that have shown dramatic costoverruns and shortfall of traffic demand. In particular, for rail the actualcosts of projects are on average 45 per cent higher than estimated (with astandard deviation of 38).
Looking at the reasons for planning failures for mega-projects, one canidentify five major problem areas:
1. Public procurement schemes are characterised by rewarding projectappraisal optimism. To steer a project successfully through the barri-ers of a public decision process it would be fatal to estimate costs andbenefits realistically. Project appraisal serves to promote the project.Therefore there is no interest in ex-post comparisons for actual andestimated figures.
2. Public procurement schemes don’t include risk estimations. The sameholds for private schemes if the state gives sufficient guarantees. Insuch conditions the financial calculation follows the ‘EGAP’ principle(everything goes according to plan).
3. The planning calculations of public and private actors look completelydifferent. The public applies cost–benefit analysis, which is based on acomparative-static analysis of project impacts for a long time horizon.The private investors will prepare rate-of-return and cash-flow figureswith high emphasis on the short and medium term if they have to bearpart of the financial risk.
4. The transport consultancies, which are in charge of cost–benefit orfinancial calculation, will generate results according to the preferencesof their clients. In most cases their honorarium is independent of theaccuracy of their forecast. This leads to a biased data environment fora mega-project.
5. The contract scheme is in many cases too rigid and does not react tounplanned changes in the environment. For a mega-project contractshave to be signed some eight to ten years before the operation isopened.
The main source of procurement problems is institutional.1 This means thata proper choice of procurement scheme can help to avoid major mistakes.
Innovations in the planning of mega-projects 217

A second source is methodological and can be treated by better assessmenttechniques once the institutional settings are right. Of course the stake-holders will only be interested in applying new assessment methods if theprocurement scheme will reward more economically rational behaviour. Inthis sense introducing truth-telling incentives is a major challenge to inno-vation in the planning of large-scale projects.
The chapter is organised as follows: Sections 11.2, 11.3, 11.4 and 11.5discuss the basic requirements for a revised institutional setting which seemsnecessary for improvements to the procurement scheme. This includes theinvolvement of private risk capital, a professional project company, properrisk allocation and the exposure of major players to risk, including the con-sultants. Once these necessary conditions for institutional improvements arein place, some innovations in decision support systems can help to find com-monly accepted project layouts, as presented in Sections 11.6 and 11.7.Section 11.8 shows how the system dynamic model approach can beenriched to encourage truth-telling. Section 11.9 will conclude the findings.
11.2 INSTITUTIONAL INNOVATIONS: THEPROJECT COMPANY AND INVOLVEMENTOF PRIVATE RISK CAPITAL
Project Company
Flyvbjerg et al. (2003) have pointed out that in the case of mega-projects,politicians often act as promoters rather than as neutral welfare-maximisersso that the normative planning scheme in which the state takes all-importantdecisions from an objective and neutral position (‘benevolent dictatorship’)will not work. The question is whether political decision-makers are expectedto change their attitude to please voters in the short run while neglecting thelong-run economic consequences. The answer is: certainly not. Promotion ofprestige projects and political appearances for opening ceremonies with ahigh level of public attention are part of political business. Only if the pro-curement regime can be changed from the beginning is there a chance tobring in a more economically rational calculation into the scheme. Two basicrequirements are:
1. Establish a project company under private law.2. Let private investors bear a substantial part of the economic risk.
A project company under private law, which is obliged to work underdefined public objectives and constraints on the one hand and has some
218 Innovation, competition and institutions
entrepreneurial freedom to achieve good business results, on the otherhand, would take responsibility for the management of the process. It ismost important to hire professional managers, not (former) politicians oradministrators, for this job and link their salaries to the achievement ofcontracted performance criteria. As the project should be defined infunctional terms by the political side, enough entrepreneurial freedomshould arise to design a project according to economic principles. TheDBFO (design–build–finance–operate) scheme of public–private partner-ship seems to be the most promising form to integrate private creativity indeveloping the project.
If a private management company takes responsibility, along with someindividual risk, then transparency can be provided from the beginningwith respect to two basic aspects: the scoping of the project and the rolesof the private and the public stakeholders. The importance of a properscoping of PPP-financed projects has been demonstrated by a number ofcases, which are readily taken by opponents of private project financeas examples of its inappropriateness. The M1 project in Hungary, whichclosed a gap on the motorway between Budapest and the Austrian/Hungarian border, is a good example. While the project management per-formed well with time and cost discipline for the construction, the projectfailed because the revenues were much too low after the project opened.The main reason was a massive diversion of traffic to the secondarynetwork because of the high user fees. The scoping failure was to limit theconcession to the 40 km stretch, which had to be newly built, and not tothe link between the border and Budapest. In the latter case the chargesper km would have been much lower and the traffic diversion could havebeen minimised.
European and national legacy don’t allow for widening the scope of pri-vately co-financed projects to avoid fragmentation and improve onfinancial viability. Therefore it is difficult to procure a project so that userfinance is sufficient for private profitability.
If the concession does not allow for sufficient revenues, then a negotia-tion on public contributions is necessary. Public support can consist ofvarious measures:
● grants for financing the investment costs;● guarantees for loans and their interest rates;● fixed payments for particular user classes (shadow tolls);● free provision of access links;● guarantee of no competing projects in the future;● extension of the concession to value-added services (e.g. land devel-
opment at intersections, stations or airports).
Innovations in the planning of mega-projects 219
Involvement of Private Risk Capital
Such a scheme is more easily established if there is eventually a substantialinvolvement of private risk capital with a lower bound of about one-thirdof the total capital invested. Private investors will be a better guarantee ofeconomic viability of a project rather than cost–benefit analysis, with itsvarious possibilities of manipulation and appraisal biases. In such a regimethe probability increases that the entrepreneurial freedom that is offeredthrough a DBFO scheme is used to develop an economic project design.The participation of private capital may serve as an economic truth-tellingconstraint in a public environment that is less accustomed to economicthinking.
While calling for private capital involvement seems very natural in orderto avoid public ‘X-inefficiency’, it will not be easy to find a good compro-mise with other public objectives. One example is fostering free competitionfor the transport infrastructure. Often the charges from infrastructure useare not the main source of business profits; rather the profit arises from theuse of the capacity itself for producing services for the customer. This holdsfor railway tracks as well as for airport facilities. If participation of privatecapital is open, then the transport service companies in particular might beinterested in buying a fixed and guaranteed part of the capacity for theirown use. An example is the new airport terminal Munich II, co-financed byLufthansa. It is interesting for the regulator to explore to what extent sucha regime creates a new possibility for grandfathering. Limiting the partici-pation of service companies to 30–50 per cent and guaranteeing free accessof third parties to the slots if they pay the same fees as the incumbent com-panies might solve this problem. In any case a strong regulation authoritywill be needed in such a situation.
11.3 INSTITUTIONAL INNOVATIONS:INTEGRATION OF SHAREHOLDER GROUPSIN THE PROCUREMENT PROCESS
The challenge for institutional solutions is not only economic. Criticalgroups will almost certainly oppose any kind of mega-projects. These groupscan be classified into four categories:
1. Potentially affected residents who try to stop the project because itmight prove detrimental to their living conditions.
2. Land owners who resist as long as possible, in order to maximise thecompensation that has to be paid for the loss of property.
220 Innovation, competition and institutions
3. Green organisations, which fight for a minimisation of environmentaldisturbance.
4. Radical groups that fight against any big project.
The strategy to be followed is to integrate groups (1) and (3) as soon as pos-sible into the planning process while trying to keep the power of opponentsin groups (2) and (4) low. In the traditional planning scheme the analysis ofenvironmental impacts would follow after the economic performance hasbeen confirmed. Practice shows, however, that a project can rarely be stoppedif the economic criteria have proven very positive, such that project promot-ers are encouraged to manipulate environmental data to make the projectpass the public evaluation checks. Against this background it is important toanalyse the environmental impacts at the beginning of the planning process.For instance, in the recently revised German standard evaluation scheme fortransport infrastructure investments, an environmental risk analysis is oblig-atory at the beginning of the process. Therefore necessary mitigation mea-sures can be defined at an early stage of the planning process and enter theeconomic evaluation. In the process of project procurement the environ-mental and social issues can be treated from the beginning in parallel withthe technical and economic issues, such that incompatibilities and barriersare identified as early as possible.
11.4 INSTITUTIONAL INNOVATIONS: RISK-TAKING OF CONSULTANTS
Consultants play a big role in the procurement process as forecasts ofdemand development and economic/ecological/social impacts stronglyinfluence the decision-making. In many cases the consultants are hired bythe promoters of a project or are at least heavily influenced by them. Then,the major objective of a consultant is not to prepare the best forecast, butto maximise the probability of getting the next contract. A good exampleof this type of behaviour is the procurement of two maglev projects inNordrhein–Westfalen (‘Metrorapid’) and in Munich (Transrapid AirportShuttle), after the big maglev project Hamburg–Berlin had failed forfinancial reasons. The federal government then dedicated the financialsubsidy, originally planned for Hamburg–Berlin, to the two successormaglev projects in Nordrhein–Westfalen and Bavaria, which then com-peted for these funds. For legal reasons a cost–benefit analysis had to beprepared for both projects, to be integrated into the federal transportinvestment programme. It was in the interest of the former red/greenfederal government that the Metrorapid would be evaluated not worse than
Innovations in the planning of mega-projects 221
the Munich Transrapid to justify the major part of federal funding goingto Nordrhein–Westfalen, which at that time was also governed by the samepolitical colours. Against this background it was not surprising that theconsultant came out with a cost–benefit ratio of 1.5 for both projects. Toachieve this result some changes of the standard CBA procedure and anumber of strange evaluation approaches were necessary. Taking the com-ments of neutral experts, none of these projects should have passed thethreshold of 1 for benefit over costs, while the Munich Transrapid wasregarded the better of two non-viable projects.
There are two possible ways to set consultants’ incentives properly. First,contracts can be given in parallel to several consultancies so that a com-petitive situation arises. Then different country experiences can be used, ashappened for instance in the case of the Montreal–Ottawa high-speed railcorridor in Canada. This procedure is appropriate for the pre-feasibilityphase. When preparing a feasibility study, confidential information usuallyhas to be included, so that the number of consultants can be kept low. Inthis phase the consultant in charge will be inclined to forecast the mostlikely development if a bonus is paid for forecasting accuracy or a penaltyin case of large deviations of the actual from the forecasted demand/costdevelopment. Of course the long life of transport investment projects willmake it difficult to apply this principle for the whole project life. But it couldbe exercised for instance for the first five years after the start of a project.If private financial institutions are involved in the procurement as risk-takers, such contracts will automatically become standard tools to fostertruth-telling in consultancies.
11.5 INSTITUTIONAL INNOVATIONS: APPROPRIATERISK ALLOCATION STRATEGIES
Public–private partnership for mega-projects requires a proper risk alloca-tion to private and public bodies. Risks can be classified into:
● construction risk● operation risk● demand risk● financial risk● political risk● force majeure risk.
In any case the private investor should bear the part of the risk that can beprivately managed. Asset liability management provides some interesting
222 Innovation, competition and institutions

principles for the management of different types of risk. While it is clearthat construction and operation risk should be allocated to private parties,it is not so obvious with demand and financial risk. Long-term demanddevelopment can not be forecasted with high accuracy, so the contractbetween the state and the project company should include some flexibility.In the case of some recent Spanish motorway projects, this problem wasdealt with in that the contract was based on a defined range for the demanddevelopment. As soon as the actual development comes out higher, thecompany has to pay higher concession fees to the state. If it comes outlower, re-contracting is possible (see Bel and Fageda, 2005). In the case offinancial risk, a hedging strategy for treating long-term risk on interestrates might be very expensive and boost the costs of the project. In thiscase the state can guarantee interest rates because it is the only institutionthat can diversify this risk over a very long period. Political risk naturallyhas to be allocated to the public. The Channel Tunnel is an example ofwrongly assigning parts of political risk to private actors, which at thattime was accepted in a phase of euphoria about the European dreamproject. Force majeure risk must be allocated to a partner that can diver-sify this risk, usually the state. Only in the case of network companies (e.g.the Austrian ASFINAG which is responsible for the whole Austrianmotorway and expressway network) can force majeure risk be allocated tothe company.
11.6 INNOVATIVE DECISION SUPPORT: COPINGWITH THE PREFERENCES OF DIFFERENTSTAKEHOLDER GROUPS
There seem to be two major requirements of the planning process that havenot been fulfilled by an appropriate methodology. The first is derived fromthe existence of a number of stakeholders who can influence the progressof a project in one way or the other. The second is a more holistic anddynamic approach to the evaluation of projects, contrasting the partialapproach of traditional CBA which usually ends up with incompletecomparative-static comparisons. The first issue will be dealt with in thissection; the second issue is the topic of Section 11.7.
The involvement of various parties with different goals leads to a complexinteraction mechanism. Stakeholders have to be integrated in a timelyfashion into the process and it has to be taken into account that they mighthave different preferences. The European Investment Bank, together withthe EU Commission, has published a study on the evaluation of railwayprojects with participation of several stakeholder groups (RAILPAG,
Innovations in the planning of mega-projects 223

2005). The basic concept is a traditional CBA, which is carried out accord-ing to the particular objectives of the different groups.
The classified stakeholders are the users, the transport service operators,the insurance companies, the contractors and suppliers, the infrastructuremanagers, the non-users and the government. A further sub-classificationleads to 20 stakeholder groups. The effects are classified by user service, oper-ation, assets and external effect; considering the sub-classifications results in30 effect types. These effects of a railway project are screened in the form ofan SE (�stakeholdereffects) matrix, which includes 20 30 cells.Although many cells are empty, going through the overall analysis can bevery tedious, although the evaluation procedure for each cell seems simple.
The SE matrix can be regarded as a possible approach to treat the mul-tidimensionality of the planning process. But it might be questionedwhether it is wise in an early stage of the process to force the parties toreveal their preferences in an explicit manner, in order to prepare a com-plete CBA for all stakeholder groups. As long as there is a negotiation sit-uation, the parties might be inclined to avoid a rigid fixing of theirpositions. Furthermore, it is not clear to what extent the SE matrix mighthelp in the case of diverging results.
An alternative approach starts from the assumption that there are a fewpowerful stakeholder groups in the game that base their positions on a fewcharacteristics of the project. For example, the environmentalists will fightagainst additional environmental burdens caused by a project; industry willstress better accessibility of industrial locations; and the regional govern-ment will be interested in employment effects. There are only two groupsthat will be interested in applying a complete calculation. First, the federalgovernment will require an estimation of all costs and benefits arising fromthe project. Second, the investors/operators will need an estimation oflong-run demand/revenues/costs to check financial viability. For both sidesthe results from traditional CBA are not sufficient to support their deci-sions in the case of a mega-project, which is a singularity for the decision-makers and not one of thousands of marginal investments to be ranked bya standard CBA procedure. Therefore we suggest a staged approach to thedecision problem, adjusted to the stage of maturity of the project.
In a first stage, i.e. in a phase of pre-feasibility analysis for the projectwhen the final design is not decided, it will be sufficient to prepare roughcalculations for basic indicators of the social and business appraisals. Thepreferences of the other stakeholder groups can be summarised by a com-parison of the minimum positions of the groups with the expected perfor-mance indicators of the project. The result can be represented in the formof a simple spider diagram, which can be used as a basis for the mediationprocess and the further design of the project.
224 Innovation, competition and institutions

A more sophisticated method is CLP (constraint logic programming),which is an embedding of constraints in a host programming language. Theconstraint programming approach is to search for a state of the world inwhich a large number of constraints are satisfied at the same time. TheCLP methodology has been developed within the framework of artificialintelligence, while its logical roots are closely related to operations research(Heinitz, 2000; Liedtke, 2006). Constraints are formulated, variables andtheir domains defined and the search for solutions carried out by optimi-sation calculation or heuristics. The heart of the method is the constraintsolver, which computes variable domains that satisfy the set of constraints.
For practical application the preferences of the parties are formulated asfunctional constraints. This means that the parties are asked to define aminimum threshold for every important decision criterion. A mediationprocess is used to explore which of these constraints are soft and which arehard. CLP then finds out the minimum change of soft constraints toachieve a feasible solution.
Figure 11.1 shows how CLP can be used to facilitate the negotiationprocess. The stakeholder parties are asked to formulate the conditionsunder which they would accept the project. CLP constructs the feasible
Innovations in the planning of mega-projects 225
Socialoptimisation
Long-rangefeasiblesolutions
Development options
Maximisation
Promoterconstraints
Stakeholderconstraints
Affectedpopulation
Budgetconstraints
Technicalconstraints
Choicesets
Historicalknowledge
Constraintpropagation
A prioriinfeasibilities
Timesteps
Mid-range decisions
Figure 11.1 Principal structure of constraint logic programming (seeHeinitz, 2000)

domain, which, as expected, is empty at the beginning. Exploring soft con-straints and possibilities for trade-offs, the process can be guided to gen-erate first feasible solutions, which the parties might accept – usually underspecific conditions. If a set of feasible solutions is identified, then a designof project alternatives can follow, which concludes the pre-feasibilityphase.
It is not the CLP method itself, but rather the placing of the method inthe context of a mediation process that brings an innovative element intothe procurement. The economic rationale is to apply the Kaldor–Hickscriterion in an explicit manner. This rule says that a project is beneficial tosociety if the advantaged parties can compensate the disadvantaged partiesand enjoy a surplus at the end. In traditional CBA this rule is applied onlyin a virtual way, i.e. the benefits of the advantaged are compared with thecosts of the disadvantaged: if the difference is positive, the net benefit of aproject is proven. However, compensation is not actually given to the dis-advantaged, which explains the strong resistance of negatively affectedgroups even if the CBA results are positive. In the case of mega-projects itseems to be wise to apply the Kaldor–Hicks criterion in its original formto increase acceptability. Furthermore, this will separate the constructivegroups from the destructive groups, which may generate more politicaloptions for the process. Finally it leads the planners to rethink the tech-nical alternatives and the possibility of removing hard constraints (seeBox 11.1).
BOX 11.1 MEGA-INVESTMENT AT FRANKFURTAIRPORT
Fraport AG is planning a €3.4 billion investment, consisting of anew terminal, a new maintenance/repair hall for the Airbus A 380and an additional starting/landing track. While other alterna-tives were confronted with manifold complaints of stakeholders,the north-west track suffered from a hard constraint: the starting/landing route would cross the location of a chemical plant, whichis infeasible for safety reasons. After a tedious mediation processit was decided to relocate the chemical firm and compensate forthe costs, which is estimated at almost €700 million.
This example underlines the point that constraints often have tobe reconsidered during the mediation process, so creativity shouldconcentrate in the pre-feasibility phase on the treatment of soft andeventually also hard constraints.
226 Innovation, competition and institutions

11.7 INNOVATIVE DECISION SUPPORT: SYSTEMSAPPROACH TO DYNAMIC ASSESSMENT OFMEGA-PROJECTS
In most cases mega-projects are evaluated by traditional CBA, sometimesextended by a regional economic impact analysis. While CBA is a usefultool for preparing a ranking for a set of small and medium-sized projects,a warning should be given about the application of this instrument in thecase of mega-projects. The reasons are:
1. CBA is based on partial analysis, deriving the economic impacts fromtraffic changes on the link considered. In the case of mega-projects theindirect impacts distributed through the networks and the economicsectors might dominate the picture.
2. CBA uses average values for important impacts, such as time savings.While these values might work for the whole set of transport invest-ments on average, they can be wrong for the special case.
3. CBA applies a comparative-static analysis, only looking at the startand end situations with and without the project. As the time horizonfor the life of a mega-project is in general very long, many changes canoccur in the time in between; in particular the benefit stream for themega-project will not be independent of other network changes.
4. CBA assumes that the financial side does not matter. This is not truefor mega-projects. The benefit streams can be strongly dependent onthe method of finance.
5. CBA starts from the hypothesis that there is one year for opening theoperation of the whole project. In many cases, however, a mega-projectis composed of a number of sub-projects, which are started sequen-tially. The benefit stream can be dependent on a number of other deci-sions within the time horizon of project life such that the whole timeprofile of benefit development is needed instead of a point-to-pointforecast.
There have been several attempts to extend CBA in the context of theEuropean Framework Programme. The IASON project (IASON, 2004)investigated spatial computed general equilibrium (SCGE) models andsystem dynamic models, while the TIPMAC project (TIPMAC, 2004)focused on combinations of econometric/transport modelling approaches(E3ME) in comparison with system dynamic models (SDM). Every newapproach mentioned brings in a wider systems view and is therefore moreappropriate than traditional CBA for estimating indirect economicimpacts. Taking the present versions of the model developments, one can
Innovations in the planning of mega-projects 227

conclude that the SDM approach is best suited to cope with the specialproblems of mega-projects. This is because of the following features:
1. SDM is intrinsically system-based and dynamic, i.e. constructed tomodel feedback mechanisms between sub-systems.
2. As SDM works sequentially, there is no difficulty in modelling stagedproject realisations.
3. SDM can be based on micro behaviour, which may be aggregated bymicro–macro bridges.
4. SDM can integrate macro, regional and sectoral indicators such that itcan be adjusted to the project scale.
5. SDM provides a closed framework in which all major reactions aremodelled in a consistent way.
6. SDM can be calibrated for every module and every level (meso, macro,regional, sectoral), based on available data.
7. SDM can be easily combined with a transportation model to estimatethe transport reactions most accurately in the feedback processesbetween transport and economic sectors.
8. SDM can allow for breaks in trends in so far as the dominant feedbackmechanism may change over time. Example: decoupling processesfrom GDP for energy consumption or for road transport.
Box 11.2 gives a brief summary of the basic features of SDM approaches,and the weaknesses that might limit the scope of applications.
BOX 11.2 STRUCTURE, STRENGTHSAND WEAKNESSES OF SDMAPPROACHES
SDM was developed by J. Forrester in the late 1960s and consistsof four basic components: feedback theory (cybernetics), numeri-cal simulation, decision theory and mental creativity techniques.Mathematically, it consists of a system of (eventually non-linear)difference equations, which are solved sequentially by applyingnumerical integration techniques. This makes it possible to treatlarge dynamic systems including complex interactions, whichimplies a number of advantages. Efficient solutions techniques areavailable in commercial software packages, such as VENSIM orPOWERSIM, to solve large models, but also software with nicegraphical tools (e.g. ITHINK) can be applied to support manage-ment or political decision-making.
228 Innovation, competition and institutions
As modelling is less rigid compared with equilibrium models ineconomics, there are advantages of flexibility on the one hand, buthigh risks of wrong applications or interpretations on the otherhand. Some problems are listed below:
1. Setting time intervals and choosing numerical integratorsDepending on the type of difference equations, the setting ofparameters for numerical simulation can influence the resultsof computation substantially.
2. Defining the endogenous and the exogenous parts of thesystem This determines the possible feedback mechanismsand can have high impacts on long-term processes.
3. Constructing bridges between different modules of the systemWhile the equations inside a module in most cases can be esti-mated econometrically, this is in general not possible for thebridge equations. Example: modelling the transmission of timesavings from the transport module to the regional and macro-economic modules, which is done in ASTRA through the pro-ductivity variables of the production functions.
4. Filling gaps through mental creativity Overcoming the dis-advantages of partial modelling implies that relationshipshave to be included for which the empirical information is notsufficient for a statistical estimation. This implies high risk ofintroducing subjective value judgements into the quantitativeframework and exposes the SDM to fundamental critique. Seethe justified critics of the first world model of Dennis Meadowsdeveloped for the Club of Rome and the book Limits toGrowth, published in 1972.
5. Applying different methods of calibration As an SDM mayinclude different sub-models (e.g.a decision model for haulagecompanies with aggregation through a calibrated distributionfunction, and a macroeconomic model for the main economicindicators, calibrated on the base of time series), the calibra-tion of the single modules and of the complete system can bea tedious process.While Rogelio (2003) demonstrates the dif-ficulties with calibration, Schade (2005) has shown that it ispossible to calibrate a very large-scale system like ASTRA inthe form of a staged adjustment process. At the end of thecalibration ASTRA simulates 15 years of the past (1990–2004) at a defined level of accuracy, before it starts on thefuture.
Innovations in the planning of mega-projects 229

Figure 11.2 shows the SDM model ASTRA, which consists of eightmodules. ASTRA contains 29 countries (EU 27, Norway, Switzerland) withthe following features. The population module (POP) treats the develop-ment of population by age groups. The macroeconomics module (MAC) iscomposed of the macroeconomic indicators and their relationships withinthe national accounts. It includes among others an input–output table with25 sectors, the employment situation and productivity development. Theforeign trade module (FOT) describes the trade flows between the countries.
230 Innovation, competition and institutions
POP
MAC
FOT
REM
TRA
WEM
ENV
VFT
Potential labour force Population structure
Dis
posa
ble
inco
me
Con
sum
ptio
n, in
vest
men
t in
vehi
cles
, VA
T
GDP, (un-)employment, sectoral output
Population change
VK
T
Sectoral goods flows
Car
fle
et
Fuel price
GDP, productivity
Exports, imports
Transport expenditure,performance, time
Fuel tax revenue, VAT
GDP, employment, ....
Fuel
pric
e
Emissions, noise,accidents
Transport cost, time
Transport demand
POP = Population moduleMAC = Macroeconomics moduleREM = Regional economics moduleFOT = Foreign trade module
Abbreviations:
TRA = Transport moduleENV = Environment moduleVFT = Vehicle fleet technology moduleVKT = Vehicle kilometres travelledWEM = Welfare measurement module
ASTRA-T modules and main interfaces
Generalized cost
Fleet structure
Source: TIPMAC (2004).
Figure 11.2 Structure of the SDM ASTRA

The regional economics module (REM) is for modelling the regional economyand prepares the interfaces with the transport model. The transport module(TRA) is a functional representation of the transport system of a country,which can be linked to a national or international transport model. Thevehicle fleet technology module (VFT) treats the development of vehicle tech-nology over time. The welfare measurement module (WEM) calculates char-acteristic welfare indicators to prepare a final assessment.
After several years of development, ASTRA has made available a large-scale model with some 200 000 dynamic variables and 1 million static rela-tionships. Nevertheless this model has to be prepared and tuned for everyapplication. In the context of the TIPMAC research ASTRA has beenadjusted to the problem of assessment of TEN investments, includingthe financial side. This means that in contrast to the traditional CBA, thefinancial source of investments had to be defined and integrated in themodel context. Financing can be done by taxes, user charges or credits, andevery method of finance will influence the benefit stream of a mega-project.In TIPMAC, taxes or user charges have been investigated, because creditfinance can be performed by a number of different financial instruments,which were not the focus of analysis.
Figure 11.3 shows the investment activity that was assumed following theTEN definition of the van Miert group and of the Commission. It wasassumed that the priority projects would be realised as soon as possible sothat a characteristic expenditure stream followed for each EU country (at the
Innovations in the planning of mega-projects 231
TEN investments in the TIPMAC BAU scenario (Million €/year)
0
2000
4000
6000
8000
10000
12000
14000
1995 1998 2001 2004 2007 2010 2013 2016 2019
AustriaBelgium+LuxembourgDenmarkSpainFinlandFranceUKGermanyGreeceIrelandItalyNetherlandsPortugalSweden
Source: TIPMAC (2004).
Figure 11.3 Expenditures for high-priority projects of TEN in EU 15,1995–2020

time of analysis for the EU 15). Italy has a number of large-scale projects,for instance the Messina Bridge, Lyon–Turin, the Brenner Base Tunnel andother high-speed links. The UK shows an early peak in investment activityfor the West Coast railway line, while in Spain there is a more continuoushigh level of investments for the Pyrenees crossing and a number of railwayprojects (changing to the standard gauge for interoperability reasons).
In the TIPMAC scenarios different assumptions for financing of theTENs have been analysed. Without going into details of these scenarios, itcan be seen from Figure 11.4 and Table 11.2 that the overall impact of theTENs on European GDP is marginal. Table 11.2 underlines that there willbe winners and losers. For instance, Portugal is most likely to win becauseit will enjoy high benefits from the projects without contributing much tothe funding instruments, such as fuel taxes or user charges. The transportcompanies of the Netherlands on the other hand will have to pay high fueltaxes or congestion charges on the congested networks, which will slowdown international trade activity using land transport means.
The general results indicate that there is a high risk of overinvestmentin mega-projects on the TEN priority list. If the procurement process forthe TENs were governed by economic considerations, then the next stepafter presenting the van Miert list would have been to investigate themega-projects more carefully, checking for parallel investment and substi-tutive effects among projects. Instead, the Commission has put politicalpromoters in charge of every project to remove any remaining national bar-
232 Innovation, competition and institutions
Reactions of macroeconomic aggregates for EU 15(SMCP-tolls scenario)
–4
–3
–2
–1
0
1
2
3
2000 2002 2004 2006 2008 2010 2012 2014 2016 2018 2020Year
Cha
nge
to B
AU
sce
nario
(%
)
GDPEmploymentConsumptionInvestmentExportGovernment consumptionGross value-addedTotal factor productivity
Source: TIPMAC (2004).
Figure 11.4 Impacts of TENs and their finance on aggregate economicindicators, 2000–2020

riers and to overcome financial problems. This is just the opposite of therecommendations given in Flyvbjerg et al. (2003). The reduction of theTEN budget 2006–2013 from more than €20 billion to about €8 billionEuro might provide a chance to bring more economic realism into the polit-ical scenery.
11.8 ENRICHMENT OF THE SDM APPROACH TOENCOURAGE TRUTH-TELLING
Every appraisal method is subject to manipulation. The SDM (systemdynamic model) approach can be made more robust against this risk by
Innovations in the planning of mega-projects 233
Table 11.2 Impacts of TENs on GDP and employment in the EU 15 fordifferent finance scenarios
Values for 2020GDP Employment
(%) change TEN� TEN� SMCP- TEN� TEN� SMCP-to BAU Fuel SMCP Tolls Fuel SMCP Tolls
Austria 0.23 3.74 3.61 0.02 �0.00 0.04Belgium�Luxembourg 0.27 0.75 1.09 0.08 0.41 0.54
Denmark 0.01 �0.90 �0.92 0.01 �3.44 �3.37Spain 1.44 �3.67 �4.81 0.57 �1.68 �2.06Finland �0.20 2.73 3.20 �0.08 �0.34 0.06France 0.04 �0.42 �0.10 �0.00 �0.69 �1.06UK 0.22 0.95 0.78 0.22 0.38 0.25Germany 0.06 0.88 0.94 0.08 �0.37 �0.09Greece �1.45 �3.22 �3.15 �0.39 �2.47 �2.54Ireland 0.01 �0.04 �0.01 �0.01 �0.02 �0.01Italy 0.04 �0.38 �0.14 0.01 �1.20 �0.91Netherlands 0.01 �5.44 �5.42 0.00 �1.70 �1.48Portugal 0.65 7.03 7.09 0.28 1.35 1.24Sweden �0.09 2.98 3.66 �0.07 0.92 1.29EU 15 0.18 �0.09 �0.06 0.12 �0.62 �0.61
Notes:BAU � business as usual.Fuel � fuel tax.SMCP � social marginal cost pricing..SMCP-Tolls � combination of social marginal cost pricing and vignette payments.
Source: TIPMAC (2004).
integrating the basic aspects of the financial appraisal for possible privateinvestors. The process of data generation for the social and private-typeproject assessment, as it is designed in the context of an SDM, provides awide interface for the two types of evaluation. Of course, the objectives aredifferent. While the public sector is interested in social rentability, includ-ing internal and external effects wherever they occur, the private investorswill focus only on the rentability of financial capital invested, on risk andcash-flow indicators related to the particular project.
Let us examine this interface more closely. Important inputs for bothtypes of evaluation are:
1. Transport demand pattern, demand for other types of project use(‘value-adding services’).
2. Investment costs and related current costs for the project.3. Investment costs and related current costs for complementary projects
(e.g. access links).4. Willingness-to-pay figures for time savings and reductions of operating
costs (tariff elasticity of demand).5. Spatial economic impacts and indirect benefits (induced transport
demand for the project).
Point (1) is a central issue for transport modelling. It underlines that thereis a close interdependence between transport and economic modelling. Tosatisfy this requirement of a close integration of these fields, the ASTRAsoftware provides an interface for exchanging data with a transport model.IWW2 is running ASTRA in combination with the transport modelVACLAV, which is based on NUTS 3 regions for the EU 27 � 2 and allinterregional links for all traffic modes. On this basis transport demand forthe project that stems from interregional flows can be forecasted within aconsistent framework of socioeconomic developments.
Point (2) relates to the problem that the public decision-maker might bemore interested in an EGAP (everything goes according to plan) forecastof cost, while the private investor would prefer an MLD forecast (mostlikely development) eventually modified by risk considerations.
In several mega-project procurements the necessary additional invest-ments for access links have simply been neglected in the CBA. This failureshould be avoided by implementing point (3). As such costs can besubstantial, they must be included and their allocation must be madeexplicit. Steps (1), (2) and (3) relate to the problem of allocating risks.
Point (4) relates to the fact that often the average values for time savingsand reductions of operating costs are not adjusted to the region, its indus-trial sectors and its population structure. ASTRA offers the possibility to
234 Innovation, competition and institutions

simulate impact chains following from savings of general costs endoge-nously so that the valuation factors in the assessment step can be made con-sistent with the simulated economic impacts.
Spatial impacts and repercussions through a sequence of feedbackprocesses are hard to predict: point (5). Nevertheless there are a number offindings of the World Bank (1994), Vickerman (1987), SACTRA (1999),Lakshmanan and Anderson (2002) as well as the statistical tests of Biehl(1975; 1991) or Rothengatter and Schaffer (2005) that underline that a boostof the regional economy surrounding a mega-project cannot automaticallybe expected. A number of conditions must hold to identify a realistic chanceof stimulation of economic growth, and for regions lagging behind it will benecessary to add substantial further social capital to catch up the develop-ment gap. ASTRA offers an interface in the regional economic module forintegrating such considerations in the system dynamics context. If a highprobability of fostering the regional economy is identified, then inducedtransport activities will follow, which are relevant for the transport forecastand the related benefit/cash-flow estimations. This would create a positivefeedback process, increasing the indirect benefits of the project.
11.9 CONCLUSIONS
Mega-projects have been a playing field of rent-seeking industrials andincompetent public managers in the past. As long as there is enough publicmoney available, the financial disasters associated with some mega-projectswill not make the players nervous. For publicly financed projects in generalthere is no sufficient financial control after the final approval by parlia-ments. The auditor general can control the legality, but not the economicefficiency, of spending public money. Often it is impossible to get data fromthe authorities on the performance of the projects after realisation. Thisholds in particular if several public bodies (federal and state governments,public enterprises) are involved. If private capital is involved, the financialsuccess becomes more transparent. In this case it is dependent on the mag-nitude of private risk-taking whether private involvement will lead to ahigher discipline of money spending.
This chapter has focused on aspects of new institutional arrangementsand innovative assessment tools to improve on the performance of theplanning process for mega-projects. With respect to the institutional side,the main messages are:
1. Establish a project company, hire a professional project manager andallocate a substantial part of the risk to private investors.
Innovations in the planning of mega-projects 235

2. Provide a proper scheme of risk allocation.3. Public guarantees should be handled with care. In general they should
be dedicated to reduce financial risk (interest guarantee).4. Contracts could be set up in a more flexible way to treat demand risk
(data corridor, flexible concession fees, recontracting).5. Consultants could be offered a bonus or be subject to a penalty in their
contracts, depending on the accuracy of their forecasts.6. Constraints and barriers, eventually set by particular stakeholder
parties, can be integrated from the beginning of the procurementprocess (e.g. environmental constraints).
The use of extended assessment methods can help to discover inconsis-tencies and avoid appraisal biases. First, it is recommended to control theconstraints and barriers of the stakeholder groups permanently by con-straint logic programming. This guarantees that feasible steps are discov-ered and the main blocking arguments are treated early in the process.This will reduce friction in the procurement process. Second, it is sug-gested to use a large-scale system dynamics tool as a base platform for thegeneration of all data relevant for decision-making. The main advantagesare:
1. Using a system dynamic approach (SDM), all affected sectors can beintegrated in a holistic way (contrasting partial analysis with CBA) andconsistent feedback schemes can be constructed to analyse the poten-tial impacts of the mega-project.
2. SDM can be extended by coupling it to transport simulation andregional economic impact models to generate the basic input data forevaluation.
3. If the same SDM platform is used for public evaluations (social rent-ability) and private evaluations (rate of return), then a truth-tellingmechanism is built in in the sense that the countervailing interests arebalanced.
In this chapter we have not dealt with aspects of risk and of proper con-tracting in much detail. The basic message is that increased success ofmega-projects is not so much a matter of better methods or more accu-rate calculations. The major progress can be achieved by changing theinstitutional environment so that the incentives of the stakeholders workin the direction of generating real economic benefits within the budget tobe spent. Once the incentives are set right, the players will almost auto-matically be interested in using the best technologies and methods, assuggested.
236 Innovation, competition and institutions
NOTES
1. We are not focusing here on the intrinsic problems associated with mega-projects, such aslong life, high risk or unexpected changes, but rather on general concepts of procurementto cope with these problems appropriately.
2. Institute of Economic Policy Research of the University of Karlsruhe.
REFERENCES
Bel, G. and X. Fageda (2005), ‘Is a mixed funding model for the highway networksustainable over time? The Spanish case’, in G. Ragazzi and W. Rothengatter(eds), Procurement and Financing of Motorways in Europe, Amsterdam: Elsevier:187–204.
Biehl, D. (1975), Bestimmungsgruende des regionalen Entwicklungspotentials:Infrastruktur, Agglomeration und sektorale Wirtschaftsstruktur (InfluencingFactors for Regional Development: Infrastructure, Agglomeration and SectoralStructure), Kiel: Kieler Studien, Bd. 133.
Biehl, D. (1991), ‘The role of infrastructure for regional development’, in S. vonHartard and C. Stahmer (eds), Sozio-ökonomische Berichtssysteme für einenachhaltige Gesellschaft, Marburg: Metropolis: 42–65.
Flyvbjerg, B., N. Bruzelius and W. Rothengatter (2003), Megaprojects and Risk. AnAnatomy of Ambition, Cambridge, MA: Cambridge University Press.
Heinitz, F. (2000), A Constraint Logic Programming Approach to Travel DemandModelling, Karlsruhe Papers on Economic Policy Research, 10.
IASON (2004), ‘Methodology for the assessment of spatial economic impacts oftransport projects and policies’, Deliverable 2 of the IASON project funded bythe 5th Research Framework of the European Commission.
Lakshmanan, T.R. and W.P. Anderson (2002), Transportation Infrastructure,Freight Services Sector and Economic Growth, White Paper for the US DOT andFHWA, Boston, MA.
Liedtke, G. (2006), An Actor-based Approach to Commodity Transport Modelling,diss. thesis, Universität Karlsruhe (TH).
List, F. (1841), Das nationale System der politischen Ökonomie (The National Systemof Polical Economy), Stuttgart: Verlag der J.G. Cottáschen Buchhandlung.
RAILPAG (2005), Railway Appraisal Guidelines, Brussels and Luxembourg:European Commission and European Investment Bank.
Rogelio, O. (2003), ‘Model calibration as a testing strategy for system dynamicsmodels’, European Journal of Operational Research, 151: 552–68.
Rothengatter, W. and A. Schaffer (2005), ‘The impact of transport infrastructureand other immobile production factors on regional competitiveness’, paper pre-pared for DG Regio, Karlsruhe.
SACTRA (Standing Advisory Committee for Trunk Road Assessment)(1999), Transport and the Economy, Report to the Department of Transport,London.
Schade, W. (2005), Strategic Sustainability Analysis: Concept and Application for theAssessment of European Transport Policy, Baden-Baden: NOMOS.
TIPMAC (2004), ASTRA-T: Results of the TIPMAC Policy Scenarios, Report tothe European Commission for the Research Project TIPMAC, Karlsruhe.
Innovations in the planning of mega-projects 237

Vickerman, R.W. (1987), ‘The Channel Tunnel and regional development: A cri-tique of an infrastructure-led growth project’, Project Appraisal, 2 (1), March:31–40, Guildford: Beech Tree Publishing.
World Bank (1994), An Overview of Monitoring and Evaluation in the World Bank,Report 13247, Operations Evaluation Department, Washington, DC.
238 Innovation, competition and institutions

12. The cost of the technologicalsublime: daring ingenuity andthe new San Francisco–OaklandBay BridgeKaren Trapenberg Frick
12.1 INTRODUCTION
Mega-projects are often captivating to political leaders and the publicbecause of their colossal size and the technical hurdles they overcome. Thisfeature of major infrastructure in the landscape has been termed the ‘tech-nological sublime’ (Marx, 1964; 2000; Nye, 1994). This chapter uses theconcept of the sublime to contribute a new dimension to understanding theevolution of mega-project design and optimism bias. The case of the newSan Francisco–Oakland Bay Bridge in Northern California is used todemonstrate how the technological sublime dramatically influenced bridgedesign, project outcomes, public debate, and the lack of accountability forits excessive cost overruns.
According to David Nye (1994: xvi), the technological sublime ‘is aboutrepeated experiences of awe and wonder, often tinged with an element ofterror, which people have had when confronted with particular naturalsites, architectural forms and technological achievements’. In the BayBridge case, the goal of developing a sublime, new structure became thefocal point of the public debate and drove the design and funding process.The project’s initial purpose was to replace the bridge’s east span, whichcollapsed during the 1989 Loma Prieta earthquake. Debate focused ondesigning a ‘signature’ bridge – a bridge that signifies the technological andaesthetic triumph of the region over the San Francisco Bay, a geologicallycomplicated body of water, and thereby leave a unique signature on thelandscape. This daring ingenuity spoke to the interest of many in the BayArea, but not all, to create a sublime new bridge. The concept of the ‘tech-nological sublime’ provides a theoretical context for interpreting underly-ing motivations, optimism and rhetoric of political leaders and participantsadvocating for not only a mega-project, but a ‘mega-landmark’. The basis
239

for the analysis is the results of in-depth interviews with approximately 45key participants and extensive review of project-related documents andmedia accounts.
First, the background on mega-project characteristics and the techno-logical sublime is reviewed. Then an overview of the existing Bay Bridgeand the design process for the new bridge is provided. The chapter con-cludes with observations about the impact of the technological sublime onthe planning process, project design and implementation, as well as impli-cations for analyses of other mega-projects.
12.2 SETTING THE STAGE: MEGA-PROJECTCHARACTERISTICS
Typical characteristics of major transportation infrastructure projectscome to light in the mega-projects literature (see Frick, 2005 and Chapter2 in this book). These characteristics are termed the ‘Six Cs’ for the pur-poses of this chapter, and reveal that mega-projects are often:
● Colossal in size and scope, whereby there is major facility expansionor reconstruction, which may be a new tunnel, bridge, airport or railsystem. These projects are highly visible after construction starts andthe public witnesses these monumental endeavours.
● Captivating because of the project’s size, engineering achievementsand possibly its aesthetic design. This trait is related to the charac-teristic of ‘colossal’. However, the project’s design and technicalaccomplishments may generate a sense of awe and wonder in theproject beyond its size and scope. It may also capture the imaginationand attract the attention of participants and observers who typicallymay not follow a transportation project, such as architects, develop-ers and the broader general public. Little attention has been devotedto this characteristic in the mega-projects literature; however, the‘technological sublime’ literature often focuses on large-scale infra-structure projects.
● Costly, in that costs are often underestimated and increase over thelife of the project. Mega-projects typically cost at least $250 millionto $1 billion (Altshuler and Luberoff, 2003: 2). As discussed in thisbook, ‘optimism bias’ may be at play in cost estimating and the resul-tant cost increases.
● Controversial, as project participants negotiate funding and mitiga-tion packages, engineering and aesthetic design plans, and pursueconstruction. Controversy may brew in part because of a project’s
240 Innovation, competition and institutions

potential displacement or impacts to nearby businesses, residencesand the physical/built environment.
● Complex, which breeds risk and uncertainty in terms of design,funding (as project costs are high and often covered by numerousfunding sources) and construction.
● Laden with control issues related to who the key decision-makers are,what agency/agencies manage/operate the project, and who the mainproject funders are and what restrictions they put on it.
These characteristics are interrelated and evolve during mega-project devel-opment. In particular, mega-projects tend to be colossal and in turnbecome costly endeavours even under the best of circumstances. Since theyare of a colossal nature and highly visible, they captivate a broader set ofstakeholders and citizens who typically do not follow more standard trans-portation projects. In turn, these multifaceted projects become controver-sial because of the additional interests and the complexity associated withunpredictable issues due to risk and uncertainty with project funding,design and implementation. They also become controversial in terms ofpotential impacts to existing businesses, residences and their adjacent sur-roundings. Control issues then arise from this generally described situationbecause numerous stakeholders with differing vested interests assert theirperspectives and attempt to steer the project’s course.
These characteristics are illustrative of a mega-project’s many facets, andprovide a framework for evaluating specific cases and mega-projectsin general. This case study focuses on how the ‘captivating’ and ‘colossal’characteristics of the technological sublime affected the new Bay Bridge’sregional design process.
12.3 THE TECHNOLOGICAL SUBLIME: A FIELDGUIDE
A key aspect of the bridge process revolved around the new bridge rhetoricrelated to creating a captivating ‘signature’ bridge – a bridge that signifiesthe technological and aesthetic triumph of the region in earthquakecountry. The debate became infused with notions of designing a bridge thatis different. Not a bridge ‘that could be anywhere’, according to OaklandMayor Jerry Brown, but a bridge that should be ‘a spectacular structurethat expresses the daring of human ingenuity and symbolizes the splendorof Oakland and the East Bay’ (Brown, 1998).
This ingenuity captured the imagination of some, but not all, to create asublime geographical landmark. The concept of the technological sublime
The cost of the technological sublime 241

provides a tool for understanding some of the motivations and rhetoric ofpolitical leaders and participants to advocate for such a landmark. It alsoproves useful to other researchers and policy-makers examining majorinfrastructure projects who seek to interpret underlying motivations in thedesign and implementation of major infrastructure projects/mega-projectsas this concept has not been addressed in depth in the mega-projects litera-ture.
The notion of technological sublime can be found in the work of histo-rians Leo Marx and David Nye (see also Upton, 1998: 165–8). Marx labelsAmerica’s fascination with technological advances of the nineteenthcentury as the ‘rhetoric of the technological sublime’ in which language wasused, particularly in literature and public speeches, to convey a sense ofthe USA’s unlimited potential in the area of progress. According to Marx,democracy fuelled American pursuits of new technology and inventionsbecause it ‘invites every man to enhance his own comfort and status. To thecitizen of democracy inventions are vehicles for the pursuit of happiness’(Marx, 1964: 205). With respect to transportation technology, Marx com-ments, ‘To look at a steamboat . . . is to see the sublime progress of the race.Variations on the theme are endless; only the slightest suggestion is neededto elevate a machine into a “type” of progress’ (Marx, 2000: 203).
Following the work of Marx, historian David Nye traces the technolog-ical sublime in the USA by examining the impact that railways, skyscrap-ers, bridges and electricity had on the American psyche in the nineteenthand early twentieth centuries. These projects used technological meansnever seen before to achieve an end, be it faster travel or traversing difficultgeographical territory. According to Nye, America’s fascination with tech-nology and major public works is connected to the ‘sublime’, an eighteenth-century aesthetic notion that was developed in literary and artistic worksabout nature, particularly Western natural landscapes such as the GrandCanyon, Yellowstone and Yosemite. From the nineteenth century to thepresent, advances in technology have been able to conquer nature and causeboth fascination and terror in its viewers. He equates new technologies withnational destiny, ‘just as the natural sublime once undergirded the rhetoricof manifest destiny’ (Nye, 1994: xvi, 282). Related to this perception ofdestiny, one of the first American experiences of technological sublime wasthrough the Western expansion of the railways, which ‘dramatized theunfolding of a national destiny’ (ibid.: 76).
Nye (ibid.: 282) acknowledges: ‘Despite its power, the technologicalsublime always implies its own rapid obsolescence, making room for thewonders of the next generation.’ As a result, obsolescence fuels the devel-opment of new technologies to accomplish an even greater technologicalachievement. The idea of progress creates a political dimension that can
242 Innovation, competition and institutions

capture the imagination of political leaders and the public. This aspect ofthe technological sublime is critical to note for major infrastructure pro-jects because it is not just a psychological response to a major technologi-cal achievement, but a political tool that can be used to bolster positionstatements, increase public awareness and/or fulfil personal interests. Inturn, these motivations may shape the design and outcome of a project.This political dimension of the technological sublime is not specificallyaddressed in the mega-projects literature and yet it plays a critical role ingenerating a realm of project optimism and momentum.
The technological sublime contributes to our understanding of majorinfrastructure projects because of its political, aesthetic and functionalimplications. It adds a personal dimension to mega-project design andimplementation. The concept of technological sublime is used in thischapter to examine the debates that centred on bridge aesthetic and func-tion, and how the design process and outcome were shaped as a result.
12.4 THE BAY BRIDGE IN BRIEF
The State of California owns and operates the Bay Bridge through its StateDepartment of Transportation, also known as Caltrans. The San FranciscoBay Area’s regional planning agency, the Metropolitan TransportationCommission (MTC), has also had increasing management authority overthe Bay Area’s seven toll bridges, including the Bay Bridge. The MTCmanages the Bay Area’s state-owned toll bridges through a separate entity,the Bay Area Toll Authority (BATA), whose board is identical to the MTCboard. For the purposes of this chapter, BATA’s approval actions on thenew Bay Bridge are referred to as MTC actions as BATA was establishedduring the new Bay Bridge design process. A different regional entity, theGolden Gate Bridge, Highway and Transportation District, own and oper-ates the internationally known Golden Gate Bridge, which is in close prox-imity and can be seen from the Bay Bridge.
The Bay Bridge was completed in 1936 at a cost of $77 million, and thetechnological sublime aspect of the bridge loomed large (see Figure 12.1).According to Caltrans, the bridge was
the greatest bridge in the world for its cost, length, quantities of steel and con-crete, weight, depth, and number of piers, the size of the bore of the tunnel onYBI (Yerba Buena Island), and the versatility of its engineering. Seven of itspiers were deeper than any others in the world. New technologies were createdto construct the foundations. The submarine work was the greatest underwaterengineering task ever undertaken. The steel for the superstructure was said toconstitute the largest steel order ever placed. (East Span FEIS, 3-104 to 3-105)
The cost of the technological sublime 243

The bridge consists of a west span built in a suspension bridge designbetween San Francisco and Yerba Buena Island, a tunnel through YerbaBuena Island, and an east span in a cantilever/truss design between theisland and the Oakland shore (see Figure 12.2). The bridge is a double-deckstructure and currently contains ten travel lanes – five lanes for westboundtraffic on the upper deck and five lanes for eastbound traffic on the lowerdeck. Travellers on the upper deck have enchanting views of the Bay andSan Francisco, while travellers on the darker lower deck proceed withrestricted views to the East Bay. The total bridge length includingapproaches is 8.25 miles (13.28 km). The current bridge toll for round-tripcrossing is $4.00.
In general terms, the east span is approximately two miles (3.22 km) inlength and has three main sections: (1) a cantilever section located adjacentto Yerba Buena Island (with a centre span of 427 metres or 1400 feet each);(2) an overhead truss system east of the cantilever portion (five spans of 154metres or 504 feet each); and (3) a deck truss system similar to a viaduct (14spans of 89 metres or 288 feet each). For the cantilever section, three of thefour piers hit bedrock or have sunken caisson foundations. Remarkably, oneof the piers (Pier E3) is suspended above bedrock at about 70 feet (21 metres)from the bottom of the caisson. For the overhead and deck truss system’sfoundations, Douglas Fir timbers are used to provide support and wereinstalled by cofferdams that were left in place, filled in with concrete, and
244 Innovation, competition and institutions
Source: Associated Oil Company, www.sfmuseum.net/assoc/bridge06.html.
Figure 12.1 Original Bay Bridge under construction
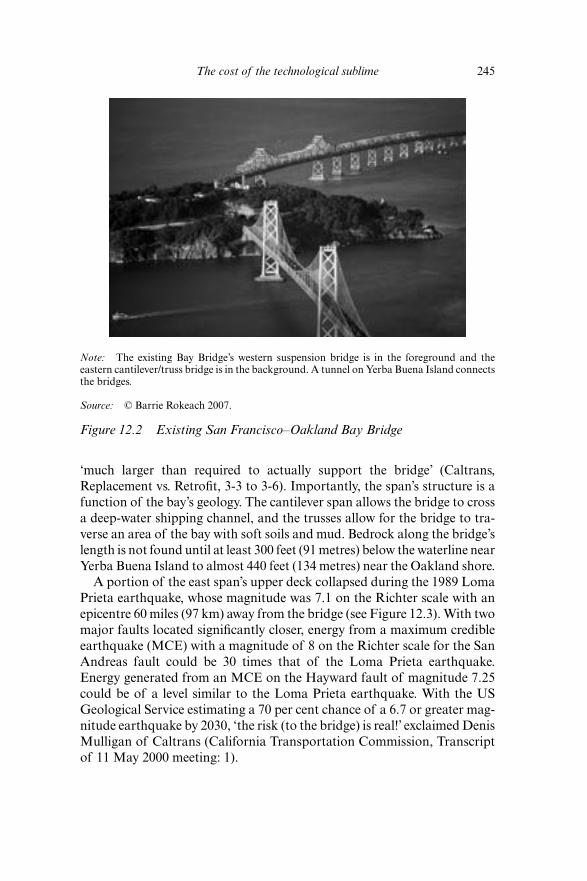
‘much larger than required to actually support the bridge’ (Caltrans,Replacement vs. Retrofit, 3-3 to 3-6). Importantly, the span’s structure is afunction of the bay’s geology. The cantilever span allows the bridge to crossa deep-water shipping channel, and the trusses allow for the bridge to tra-verse an area of the bay with soft soils and mud. Bedrock along the bridge’slength is not found until at least 300 feet (91 metres) below the waterline nearYerba Buena Island to almost 440 feet (134 metres) near the Oakland shore.
A portion of the east span’s upper deck collapsed during the 1989 LomaPrieta earthquake, whose magnitude was 7.1 on the Richter scale with anepicentre 60 miles (97 km) away from the bridge (see Figure 12.3). With twomajor faults located significantly closer, energy from a maximum credibleearthquake (MCE) with a magnitude of 8 on the Richter scale for the SanAndreas fault could be 30 times that of the Loma Prieta earthquake.Energy generated from an MCE on the Hayward fault of magnitude 7.25could be of a level similar to the Loma Prieta earthquake. With the USGeological Service estimating a 70 per cent chance of a 6.7 or greater mag-nitude earthquake by 2030, ‘the risk (to the bridge) is real!’ exclaimed DenisMulligan of Caltrans (California Transportation Commission, Transcriptof 11 May 2000 meeting: 1).
The cost of the technological sublime 245
Note: The existing Bay Bridge’s western suspension bridge is in the foreground and theeastern cantilever/truss bridge is in the background. A tunnel on Yerba Buena Island connectsthe bridges.
Source: © Barrie Rokeach 2007.
Figure 12.2 Existing San Francisco–Oakland Bay Bridge
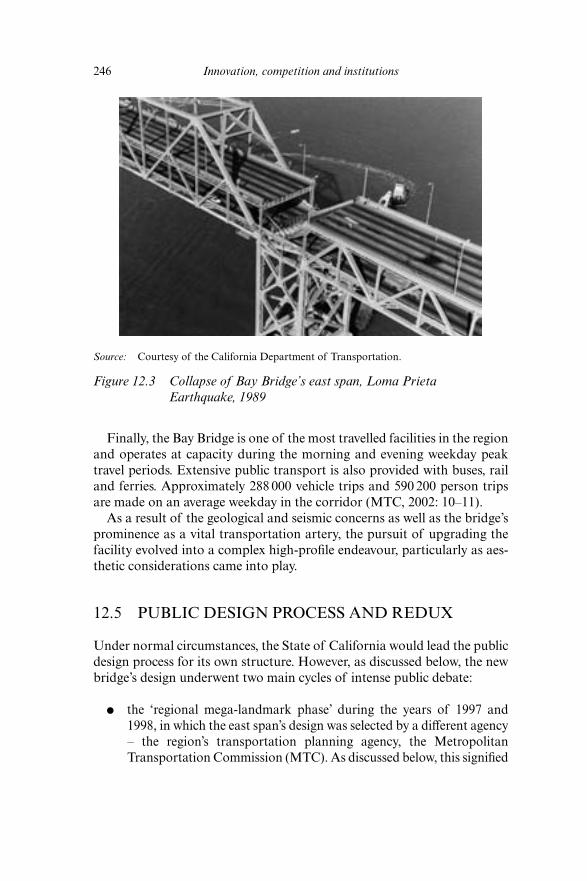
Finally, the Bay Bridge is one of the most travelled facilities in the regionand operates at capacity during the morning and evening weekday peaktravel periods. Extensive public transport is also provided with buses, railand ferries. Approximately 288 000 vehicle trips and 590 200 person tripsare made on an average weekday in the corridor (MTC, 2002: 10–11).
As a result of the geological and seismic concerns as well as the bridge’sprominence as a vital transportation artery, the pursuit of upgrading thefacility evolved into a complex high-profile endeavour, particularly as aes-thetic considerations came into play.
12.5 PUBLIC DESIGN PROCESS AND REDUX
Under normal circumstances, the State of California would lead the publicdesign process for its own structure. However, as discussed below, the newbridge’s design underwent two main cycles of intense public debate:
● the ‘regional mega-landmark phase’ during the years of 1997 and1998, in which the east span’s design was selected by a different agency– the region’s transportation planning agency, the MetropolitanTransportation Commission (MTC). As discussed below, this signified
246 Innovation, competition and institutions
Source: Courtesy of the California Department of Transportation.
Figure 12.3 Collapse of Bay Bridge’s east span, Loma PrietaEarthquake, 1989
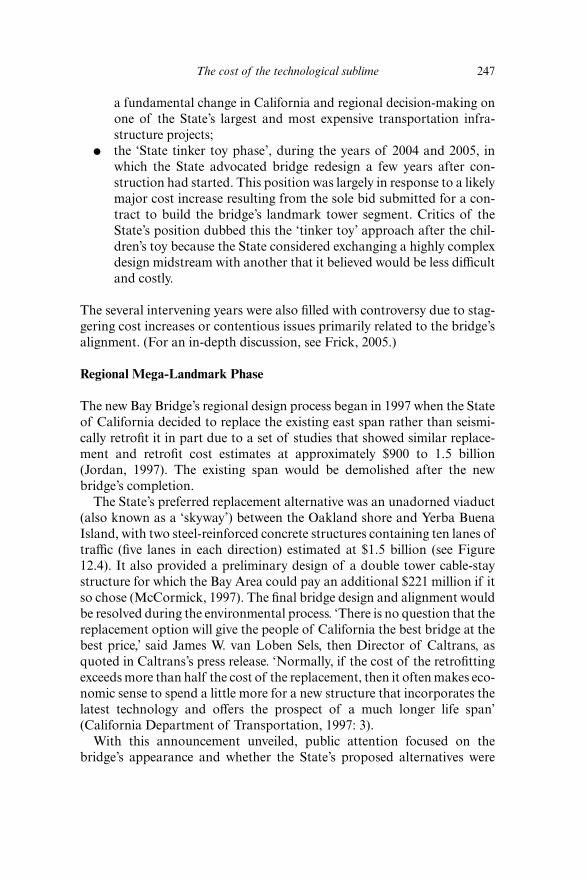
a fundamental change in California and regional decision-making onone of the State’s largest and most expensive transportation infra-structure projects;
● the ‘State tinker toy phase’, during the years of 2004 and 2005, inwhich the State advocated bridge redesign a few years after con-struction had started. This position was largely in response to a likelymajor cost increase resulting from the sole bid submitted for a con-tract to build the bridge’s landmark tower segment. Critics of theState’s position dubbed this the ‘tinker toy’ approach after the chil-dren’s toy because the State considered exchanging a highly complexdesign midstream with another that it believed would be less difficultand costly.
The several intervening years were also filled with controversy due to stag-gering cost increases or contentious issues primarily related to the bridge’salignment. (For an in-depth discussion, see Frick, 2005.)
Regional Mega-Landmark Phase
The new Bay Bridge’s regional design process began in 1997 when the Stateof California decided to replace the existing east span rather than seismi-cally retrofit it in part due to a set of studies that showed similar replace-ment and retrofit cost estimates at approximately $900 to 1.5 billion(Jordan, 1997). The existing span would be demolished after the newbridge’s completion.
The State’s preferred replacement alternative was an unadorned viaduct(also known as a ‘skyway’) between the Oakland shore and Yerba BuenaIsland, with two steel-reinforced concrete structures containing ten lanes oftraffic (five lanes in each direction) estimated at $1.5 billion (see Figure12.4). It also provided a preliminary design of a double tower cable-staystructure for which the Bay Area could pay an additional $221 million if itso chose (McCormick, 1997). The final bridge design and alignment wouldbe resolved during the environmental process. ‘There is no question that thereplacement option will give the people of California the best bridge at thebest price,’ said James W. van Loben Sels, then Director of Caltrans, asquoted in Caltrans’s press release. ‘Normally, if the cost of the retrofittingexceeds more than half the cost of the replacement, then it often makes eco-nomic sense to spend a little more for a new structure that incorporates thelatest technology and offers the prospect of a much longer life span’(California Department of Transportation, 1997: 3).
With this announcement unveiled, public attention focused on thebridge’s appearance and whether the State’s proposed alternatives were
The cost of the technological sublime 247
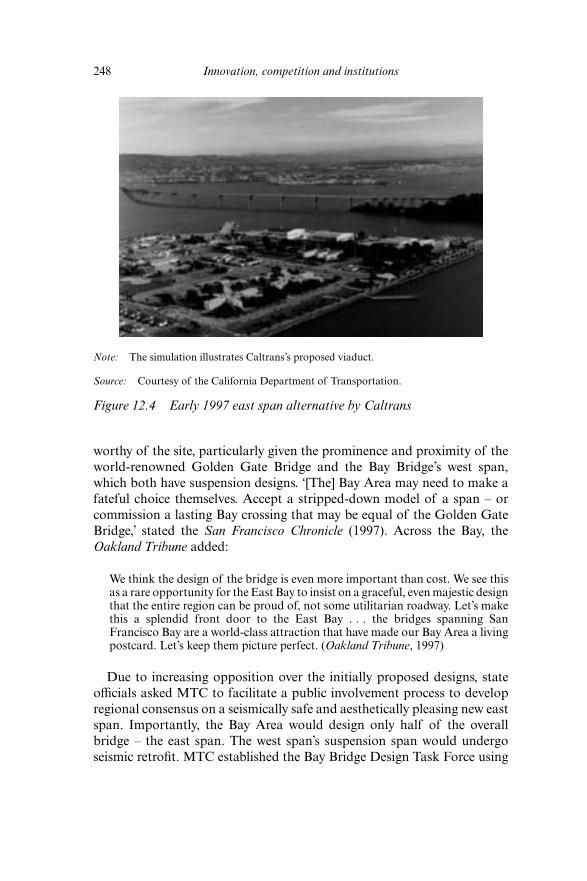
worthy of the site, particularly given the prominence and proximity of theworld-renowned Golden Gate Bridge and the Bay Bridge’s west span,which both have suspension designs. ‘[The] Bay Area may need to make afateful choice themselves. Accept a stripped-down model of a span – orcommission a lasting Bay crossing that may be equal of the Golden GateBridge,’ stated the San Francisco Chronicle (1997). Across the Bay, theOakland Tribune added:
We think the design of the bridge is even more important than cost. We see thisas a rare opportunity for the East Bay to insist on a graceful, even majestic designthat the entire region can be proud of, not some utilitarian roadway. Let’s makethis a splendid front door to the East Bay . . . the bridges spanning SanFrancisco Bay are a world-class attraction that have made our Bay Area a livingpostcard. Let’s keep them picture perfect. (Oakland Tribune, 1997)
Due to increasing opposition over the initially proposed designs, stateofficials asked MTC to facilitate a public involvement process to developregional consensus on a seismically safe and aesthetically pleasing new eastspan. Importantly, the Bay Area would design only half of the overallbridge – the east span. The west span’s suspension span would undergoseismic retrofit. MTC established the Bay Bridge Design Task Force using
248 Innovation, competition and institutions
Note: The simulation illustrates Caltrans’s proposed viaduct.
Source: Courtesy of the California Department of Transportation.
Figure 12.4 Early 1997 east span alternative by Caltrans

a subset of its board to oversee the process. Of the viaduct design,Caltrans’s preferred option, Supervisor Mary King, the Task Force’s chair,commented: ‘While we appreciate [that] the governor [Governor Wilson]has offered vanilla ice cream, we want chocolate sauce on top’ (Oakes,1997). In other words, MTC and many in the region were interested indeveloping a signature bridge design and rejected the viaduct bridge offeredby Governor Wilson.
The Task Force’s recommendations were based on another committeecreated for the design process, called the Engineering and Design AdvisoryPanel (EDAP). It consisted of approximately 35 members who were tech-nical experts in bridge engineering, architecture and geology. EDAP wascharged with the mission of ‘reconciling design and engineering consider-ations so that the residents of the Bay Area can be assured that they willhave a world class bridge’ (Hein, 1997). EDAP chair Joseph Nicoletti com-mented: ‘It is a very exciting thing we are about to do. What we come upwith will result in a landmark that will last for 100 years’ (Nolte, 1997).MTC’s EDAP and Task Force committee meetings became the key politi-cal and technical arena in which the Bay Bridge’s design was debated.
With these committees established, MTC and Caltrans focused on thefollowing issues:
● How should the new bridge be designed? How do different bridgescompare in terms of seismic performance? How does the new designincorporate signature features so that it will become a new Bay Arealandmark/icon? Does it compete with or complement the BayBridge’s west span and the Golden Gate Bridge?
● What should be the alignment of the new bridge? How do alignmentoptions affect the bridge’s termini at Yerba Buena Island and theOakland shore?
● Should there be a rail line, cycle path, and carpool lane on the newbridge?
Decisions on these issues would come at a financial and political cost as eachitem competed for limited funds that would later become available througha complex funding arrangement between the State and the region (see Frick,2005). In addition, many of these issues would challenge Caltrans’s primaryproject objective, which was to provide a seismically safe new bridge asquickly as possible. According to Denis Mulligan, then with Caltrans:
I always like to point out why we’re doing this project. The San FranciscoOakland Bay Bridge East Span Seismic Safety Project is not a project designedto remove an ugly bridge from the Bay or a project designed to interfere with
The cost of the technological sublime 249

someone’s economic development. It is a public safety project. The Bay Bridgewas damaged in the Loma Prieta Earthquake in 1989. (California TransportationCommission, 2000: 1).
Public outreach generally involved public meetings and formal hearings,informal polls, press coverage, and letters, emails and telephone calls receivedfrom the public. MTC and Caltrans held over 30 spirited meetings to discussthe east span’s design from March 1997 to June 1998 (Heminger, 1997).
12.6 BRIDGE DESIGN: FORM AND FUNCTION
At the beginning of their deliberations, EDAP and the Task Force devel-oped design review criteria. In addition to seismic safety, the bar was sethigh for creating a landmark bridge. The Bay Bridge Coalition, an ad hocadvocacy group with representatives from EDAP and other design/engi-neering organizations, recommended:
The design should reflect the Bay Area’s optimism, international status, and pos-itive attitude toward technology. Statements about fashion, style, details, mod-ernism, post-modernism, and whether or not form indeed follows functionshould be de-emphasized in the design criteria. Instead, the emphasis should beon the quality of the design and construction. Please realize that this bridge willdefine the style of the beginning of [the] next millennium, not react to it. (BayBridge Consortium, 1997)
Many participants were concerned about how the Bay Bridge’s east spanwould relate architecturally to the often-noted ‘elegant’ or ‘graceful’ sus-pension bridge of the Bay Bridge’s west span and the Golden Gate Bridge.A key issue was whether the new span should compete with these bridgesor complement them. Some felt that the east span should complementthose bridges. Others thought that was unnecessary. EDAP member ChrisArnold (1997) commented:
I do not think the east [span] solution should be compromised by the need to‘harmonize’ with an existing span developed under quite different site conditionsand separated by an island. Rather, I think the East and West spans should beconsidered a ‘progressive’ series of experiences for the motorist (as it already is)and if the driver has an experience beneath the large vertical trusses of the westspan there is no reason why he or she should not have an equally interesting, andeven contrasting, experience beyond the island.
With this backdrop, the Task Force and EDAP reviewed design propos-als, first those submitted by bridge experts and members of the public, andthen later in a limited competition between two teams within one firm.
250 Innovation, competition and institutions
Design options generally fell into three categories: (1) suspension; (2) cable-stay; and (3) viaduct. Most tower designs had one to two towers locatednear Yerba Buena Island and were connected to a viaduct for the majorityof the bridge’s length. In addition, members of the public and others pro-posed creative and sometimes unorthodox designs that were rejectedduring the early stages. For example, a proposal called the ‘Unity Towersof the East Bay’ recommended that office buildings serve as bridge towersand that a third deck have parking and pedestrian/cycle access. ‘Each officetower would be a city unto itself,’ stated the proposal’s author, MichaelLongo (1997).
The cable-stay bridge design appeared to be the favourite among manyEDAP and Caltrans participants because it was the bridge type of choicethroughout the world. However, as a surprise, a self-anchored single towersuspension design won EDAP approval in May 1998 (see Figure 12.5).Elements of the EDAP-recommended bridge included:
● the new east span should have a single tower self-anchored suspen-sion span because it is similar to the Bay Area’s other suspensionspans (the Golden Gate Bridge, the Bay Bridge’s western spans, andthe forthcoming new Carquinez Bridge);
● the suspension design should be asymmetrical, with the main spaneast of the tower about twice the length of the back span west of thetower;
The cost of the technological sublime 251
Source: Courtesy of the California Department of Transportation.
Figure 12.5 MTC/EDAP-recommended self-anchored suspension span

● the bridge’s viaduct portion should have a variable depth (haunched)profile built in concrete or a constant depth profile built in steel. Theminimum span length would be 525 feet (160 metres), except near theviaduct’s endpoints at Yerba Buena Island and the Oakland shore;
● a cycle/pedestrian pathway should be included and located on theeastbound deck’s south side.
Several EDAP members commented that since the reported cost andseismic strength of the cable-stay and suspension bridges were similar, theirdecisions were made subjectively based on aesthetics and other factors,such as constructability and the east span’s relationship to the west spanand the Golden Gate Bridge. Many EDAP members appeared impressedwith the uniqueness of the suspension bridge type because it had achieveda far greater asymmetry than the cable-stay bridge at EDAP’s final decisionmeeting on the bridge type (with a 385-metre main span and 180-metreback span for the suspension span, and a 275-metre main span and215-metre back span for the cable-stay bridge). Similarly, several key inter-viewees noted that the SAS bridge’s increased asymmetry was the mainreason in their opinion for EDAP’s support of this bridge type over thecable-stay bridge. Support for the SAS bridge was further elevated as itsasymmetry was viewed as better structurally because ‘not only visuallyappealing . . . it shifts the tower west to a better foundation further up therock shelf near Yerba Buena Island and results in a shipping channel withmore than a 1,000 feet of horizontal clearance’, according to EDAP’srecommendations.
On the selection of the suspension bridge type, several interviewees alsocommented that their opinion was swayed because the bridge designersnoted that the SAS bridge design echoed the suspension designs of the BayBridge’s west span and the Golden Gate Bridge, but with a ‘modern flair’.
However, not all EDAP participants were pleased with these recommen-dations. EDAP member T.Y. Lin commented that a ‘suspension bridge rep-resents an ignorance in engineering’ (recorded at the meeting of 18 May1998) and that ‘it will be a testament to our ignorance. We’ll be the laugh-ing stock of the whole world’ (Diaz, 1998). An EDAP member who wasinterviewed interpreted Mr Lin’s statements as reflecting his substantialconcerns about how the SAS bridge type was more difficult to constructthan a cable-stay bridge and that there were less expensive and easieroptions, such as a cable-stay bridge, which Mr Lin proposed to the SanFrancisco Chronicle in 1997.
Opposition from elected officials on both sides of the Bay escalatedagainst the recommended SAS bridge. East Bay elected officials opposedthe design for aesthetic reasons and over concern for how rail was being
252 Innovation, competition and institutions
incorporated into the design. An opposition letter to MTC from severalelected officials was issued and a press conference was held. These officialsstated:
We, the undersigned East Bay community leaders, are expressing our mutualconcerns that the Bay Bridge Eastern Span design process has not produced aworld class design that establishes a sense of gateway and place for the East Bay.The East Bay communities expect and deserve a world class design that is ori-ented towards people and provides quality public access and amenities.(Emphasis added; letter of 18 June 1998)
According to the Berkeley Mayor of the time, Shirley Dean, a signatory ofthe letter; ‘We’re saying time out, we don’t need to rush. We need to do thejob right. People are going to remember this decision for decades, and ourchildren and grandchildren will have to live with what we decide now for along time’ (Hamburg, 1998). Oakland Mayor Jerry Brown also joined theopposition. He recommended an international design competition todevelop a new design in part because
The recommended design – half of a suspension bridge attached to a blandviaduct – speaks of mediocrity, not greatness. It does not respect the site orreflect the incomparable beauty of the place. It mocks the principle of the sus-pension bridge by eradicating its most beautiful part: the freely suspendedtowers. It copies the past rather than pulling us to the future. It fails to rise to thechallenge which the setting and the new millennium demand. It could be any-where. (Brown, 1998)
The San Francisco Chronicle and the San Francisco Examiner similarly fol-lowed suit and suggested a delay in the region’s decision to allow for designreconsideration (editorials 21 and 22 June 1998).
In response, MTC and Caltrans stated that the bridge decision could notbe delayed because the project needed to continue and be completedquickly for seismic safety reasons. Further, with respect to aesthetic design,the agencies responded that the Bay’s geology dictated the bridge type inthat a deep-water shipping channel near the island was the only logicalplace to locate a tower, and that a tower or series of towers in the softshallow soil closer to the East Bay shore would be costly and unnecessary.EDAP vice-chairman John Kriken commented, ‘[Mayor] Jerry Brown, I’msorry you can’t wave your magic wand and put rock over there. There’s noway to build a tower closer to Oakland. If you’re anchored only in mud,you want to keep the bridge profile as low as possible’ (Adams, 1998). Inthe end, MTC approved the EDAP-recommended design of a steel single-tower self-anchored suspension span connected to a viaduct. According tothose involved in the bridge design, Rafael Manzanarez, Brian Maroney
The cost of the technological sublime 253

and Man-Chung Tang, ‘When built, this will be the largest self-anchoredsuspension span in the world.’ The estimated cost was $1.5 billion to $1.65billion.
State ‘Tinker Toy’ Phase
Over the next several years, Caltrans completed a protracted and con-tentious environmental review process mainly due to disputes over the per-ceived impacts of the bridge’s proposed alignment (see Frick, 2005). It alsoentered into numerous construction contracts, and the bridge’s cost startedrising. By mid-2004, Caltrans planned to contract out the bridge’s lastmajor component, the self-anchored suspension tower. Only one bidwas received, submitted by a consortium led by the American BridgeCorporation. The bid, which ranged from $1.4 billion to $1.8 billion, wastwice as high as Caltrans’s contract estimate of approximately $750 million.The State then officially announced that the new span’s overall cost haddoubled to approximately $5 billion. Caltrans cited several factors that con-tributed to the increase: insurance and bonding costs had continued toincrease due to concerns about terrorism; steel prices had increased by 50per cent in the last few years; technical experts and staffing needs weregreater than anticipated; project construction took longer and was moredifficult than expected, particularly due to marine construction activities;and construction costs generally had increased industrywide. In addition,there was limited capacity on the part of the construction industry to bidon the east span’s suspension tower contract. Importantly, it was assertedthat approximately half of the east span’s cost increase was related to theself-anchored suspension tower. However, others strongly disputed theextent to which the signature tower span was to blame for the cost increase.
As a result, Governor Arnold Schwarzenegger and his administrationproposed that the bridge’s ‘signature’ suspension tower should not be builtand that a viaduct should be constructed in place of the tower. TheAdministration’s stated goal was to reduce financial/construction-relatedrisk and project costs by $300 to $500 million (roughly 5 per cent of thetotal east span cost) by pursuing a more standard design. According to WillKempton, Caltrans Director, ‘There are some challenges [with the skywaydesign]. But there are few unknowns with the skyway. This is a muchsimpler kind of design, and we are very familiar with this type of work’(Cabanatuan, 2004). The Administration’s news came as a shock to manybecause the bridge’s viaduct segment was approximately 70 per cent com-plete and a portion of the suspension tower’s foundation was under con-struction. Critics of the Administration’s recommendations argued thatcost savings would not be realised and that the bridge process would get lost
254 Innovation, competition and institutions

in endless environmental, design and permit delays if the viaduct optionwere selected. Many were sceptical of Caltrans’s ability to make such rec-ommendations given its track record to date. California State Senator DonPerata commented: ‘The same agency that botched the last estimate is thesame agency recommending we build the skyway, saying it won’t take anylonger and promising it will save money. I’m not sure there’s a lot ofconfidence in Caltrans there’ (Cabanatuan, 2004). With respect to theoverall project, California State Senator Tom McClintock of VenturaCounty later stated: ‘It’s the biggest fiasco in California transportationhistory. This was a simple retrofit of that bridge that has been botchedbeyond anyone’s wildest imagination’ (CNN, 2005).
Numerous duelling studies were completed comparing suspension,cable-stay and viaduct alternatives, and each side interpreted the studies’results in line with their initial positions (see Frick, 2005). State legislationwas finally signed in 2005 to cover the cost increase and allow the BayBridge project to move forward as designed. Through a toll increase,refinancing and other measures, the Bay Area would fund a large part ofthe additional costs, but it also agreed to assume major oversight responsi-bilities for the Bay Area’s state-owned toll bridge programme. ‘We’re readyto move forward with a bridge that will be beautiful, that will keep thepeople of our state safe and that will keep commerce flowing across a very,very important state bridge,’ stated California State Assemblyperson LoniHancock, bill author of the legislation. The new tower’s contract wasawarded to a joint venture between American Bridge Company and FlourEnterprises in April 2006, nearly two years after the original single-towerbid had been submitted. The total bridge cost is currently estimated at $5.4billion (plus an additional $900 million contingency), a far cry from theinitial 1998 estimate of approximately $1.5 billion. It is expected to open totraffic in 2013.
12.7 OBSERVATIONS, IMPLICATIONS ANDRECOMMENDATIONS FOR MEGA-PROJECTDEVELOPMENT
The case of the new San Francisco–Oakland Bay Bridge exemplifies theallure and potential of the technological sublime to consume a public plan-ning and decision-making process. It fuelled an optimism that engineeringand design can conquer nature while at the same time blinding many stake-holders to the complex realities of building a colossal project ‘on time andon budget’ – a mantra that should be at the forefront of every milestoneduring project planning and delivery. Instead, the underlying theme driving
The cost of the technological sublime 255

the process was that this is history in the making because the bridge wouldbecome a ‘once-in-a-lifetime’ landmark. As a result, the stage was set for awide variety of participants to voice differing perspectives about bridgedesign and even harness this theme to promote additional elements, suchas a cycle/pedestrian facility and reinstitution of rail service on the bridge.Arguments for these modes often focused on increasing capacity for alter-native transport; however, the advocacy was often bolstered with the senti-ment that the bridge could not be ‘world class’ unless it provided rail or newcycle/pedestrian access. A feeding frenzy then occurred in which the bridgeproject became a magnet to resolve other issues plaguing the region suchas: traffic congestion; air quality; tourism, economic development and cityrevitalisation; and lack of pedestrian/cycle access. The one unexpectedbenefit of the sublime’s impact was that it created a small knowledgeable,yet sceptical, group of Bay Area officials later willing to support main-taining the bridge’s signature tower in the face of the SchwarzeneggerAdministration’s recommendation to replace it with a viaduct or cable-staytower. Except for this particular benefit, the overall results are threefold:unrealistic implementation schedules, underestimated costs and lack ofaccountability. Together these results fuelled heightened public scepticismand distrust as nearly a quarter of a century will have passed between the1989 earthquake and the bridge’s projected completion in 2013.
Why did notions of the sublime influence the Bay Bridge process and out-comes? The answer boils down to two words: project definition. Conflictsover this two-mile bridge erupted over major unresolved differences ofopinion between the various players over the project’s basic premise. Wasthe new bridge simply a seismic improvement endeavour, or was it supposedto become a sublime ‘mega-landmark’ that demonstrates the Bay Area’s aes-thetic and engineering sensibilities? Should the new bridge provide add-itional travel capacity for cycles, pedestrians, bus and rail transit, and/orpossibly even cars? According to an MTC commissioner interviewed:
[T]his bridge became for people somehow a place on which to hang all of theiranger, hopes, frustrations, dreams, whatever around the transportation problemsof the Bay Area when really it was a safety measure and the part that got so frus-trating for me because if you could look at it clearly and understand why we weredoing it, if you could remember the reason we were doing it, you remember theday that the bridge collapsed and that government has some obligation to publicsafety.
With the technological sublime as the turbulent undercurrent to unre-solved problem definitions, efforts to achieve the sublime evolved in twointerrelated ways: one that affected the bridge’s aesthetic features and onethat affected the bridge’s functional aspects of design and structural
256 Innovation, competition and institutions

integrity. These aspects are labelled the ‘aesthetic sublime’ and the ‘func-tional sublime’ for the purposes of the chapter. The aesthetic sublimeaddresses how officials and other participants often tailored their passion-ate public testimony to maximise the visual and experiential aspects ofthe design. Their stated motivations were to maximise the potential for anew awe-inducing Bay Area landmark and, in some cases, to garner inclu-sion of different bridge elements they felt were needed for a ‘world-class’structure.
The functional sublime is related to achieving a bridge design that wouldaddress the site’s immense physical requirements in terms of seismic andgeologic constraints while also becoming a symbol of technologicalprogress in bridge engineering. Based on interviews with MTC’s technicalcommittee members and others, the technical design participants hadseismic safety at the forefront of concern. However, an overwhelming senseprevailed that the bridge should benefit from the latest technology andserve to advance new design and construction techniques when appropri-ate. Nowhere is this clearer than in the selection of the self-anchored sus-pension span, a design never before built at this scale in a seismic zone.From a functional perspective, a towerless viaduct bridge could have beenthe bridge of choice; however, the aesthetic backlash against the designremoved this as a legitimate contender. In effect, the design itself symbol-ises a hybrid effort to accomplish both the aesthetic and functional tech-nological sublime – a signature tower connected to a viaduct. The towerprovides the potential for landmark recognition and the viaduct representsthe physical realities of the site affecting the design.
A major ‘leap of optimism’ in accomplishing the sublime occurred at theproject’s onset and had an everlasting effect on the design process andoutcome. The State did not sufficiently anticipate and plan for the BayArea’s strong opposition to the viaduct as the preferred alternative andthe belief that the region should pay for bridge enhancements. MTC’sExecutive Director at the time, Lawrence Dahms, commented in February1997: ‘Until today, I don’t think anybody thought about what the next stepwould be after Caltrans made the announcement. So everybody’s scurryingaround trying to figure out what’s next’ (McCormick, 1997). Some inter-viewees and others point to this approach as the debate’s fire-starter for theregion, never fully considering the State’s towerless viaduct as a viableoption. Alan Hess of the San Jose Mercury News observed:
[W]ith a ham-fisted introduction by Governor Wilson, the skyway solution cameacross instantly as the bargain basement version. This is what the state will payfor, he said in his take-it-or-leave-it taxcutter’s monotone. If the Bay Area wantsupgrades with cables or towers, it will have to pay for it, he said. By presenting
The cost of the technological sublime 257

it as the Motel 6 of bridges, Wilson guaranteed that it would be D.O.A. [‘Deadon arrival’, meaning that the skyway viaduct design would be rejected outright].(Hess, 1998)
Further, the State optimistically thought that a public design process forsuch a complicated structure could be completed in six months even thoughit had taken seven years to recommend bridge replacement over retrofit.The region tentatively agreed, but then later argued that the process shouldbe extended. Then, several agencies within the bridge’s vicinity advocatedfor an even longer decision-making process as the regional decision waslooming in mid-1997, and continued to argue against it during the envi-ronmental process lasting several years thereafter. As a result, the project’sdelivery was regularly delayed and often viewed as ‘behind schedule’.
What could be done differently that would be instructive in the devel-opment of future mega-projects? A cost-estimating tool called ‘optimismbias uplift’ could be expanded to address the potential problem definitionconflicts and schedule delays that develop in design processes resultingfrom the technological sublime. For an optimism bias uplift, ‘referenceclass forecasting’ is used whereby a contingency dollar amount is added toa project’s estimated cost based on other similar projects. This techniqueis based on the work of Daniel Kahneman and others, who analysed thepsychological reasons for the development of overly optimistic estimatesof a project or situation’s duration (see Chapter 7 in this volume; Flyvbjergand COWI, 2004). A similar optimism in schedule estimation occurs inmega-projects, as demonstrated in the Bay Bridge case. Thus optimismbias analyses for mega-projects would benefit from explicit identificationof a ‘contingency schedule uplift’ to budget sufficient time to address thepolitical impacts of the technological sublime on schedule delay and esti-mated costs. A more realistic timeframe could be developed based on otherhigh-profile mega-projects to allow for adequate public involvement upfront and throughout implementation as construction complexitiessurface. The schedule uplift would also allow for the time needed to com-plete required environmental processes and negotiate the ‘Christmas tree’effect of projects in which elements are added to address public concernsor for mitigation purposes. Thus project appraisals would account for a‘cost uplift’ and an explicit ‘schedule uplift’. Both uplifts could be com-municated directly to the public and decision-makers to provide improvedcost estimates and project completion schedules, thereby directly con-fronting the need for projects to be ‘on budget and on schedule’. Theschedule would allow time for ‘the unpredictable’ even if the specifics ofpredicting the unpredictable could not be fully scoped at the beginning ofproject development. Of course, care should be taken to ensure that dollar
258 Innovation, competition and institutions

costs attributed to a schedule uplift are not assumed as immediately avail-able for the project.
Similar to Flyvbjerg’s recommendation that the implementing agencyshould fund any cost uplift used, it also should be held accountable for theschedule uplift. A simple yet clear way to demonstrate schedule adherenceis currently employed in a regular feature of the San Francisco Chronicleabout failing public infrastructure of all sizes called ‘ChronicleWatch’.Each instalment features the following: project(s) in need of repair orupgrade, such as street repaving and intersection improvement; the respon-sible public agency; a photograph of the lead staff person; and the numberof days since the project was identified. When the situation is resolved, theagency and project are likewise identified. A similar form of regular publicnotice could be published through the media and on appropriate websitesfor local mega-projects. The project’s schedule as well as costs – budgeted,the uplift amount and actual to date – could be identified, thereby provid-ing a transparent means for assessing whether the project is on budget, onschedule and who is held accountable, and, it is hoped, later applaudedwhen projects are successfully implemented.
12.8 WRAPPING UP THE SUBLIME AND FUTURERESEARCH CONSIDERATIONS
The new Bay Bridge case raises several important additional dimensionsthat should be considered in policy analyses of mega-projects: thesublime, aesthetics and funding. First, the technological sublime clearlyplayed an instrumental role in the decision-making process. As futuremega-projects are pursued, it would be instructive for project sponsorsto recognise that the technological sublime may consume some publicprocesses and in turn affect project design, budgets and schedule. On theone hand, the sublime has the potential to fuel creative design, engineer-ing and public involvement. On the other hand, it may negatively affectcost and project schedules as optimism persists about the ability of designand engineering to overcome the technical complexities and risks associ-ated with implementing large-scale projects. Additional case study analy-ses should be undertaken to examine the extent to which pursuit of theaesthetic and functional sublime affects other mega-projects, and whethersimilar or divergent themes emerge in project development and imple-mentation.
Second, the Bay Bridge case reveals several issues related to the legiti-macy and level of appropriateness of using public funds on the aestheticdimensions of a project. The Bay Area elected to make a public statement
The cost of the technological sublime 259

with a signature bridge and chose to pay for the initial higher cost differenceto build a bridge that was not simply a utilitarian ‘bare-bones’ viaduct. Theregion’s path generates a set of interesting policy questions for mega-projects as well as other publicly funded projects in general. Should the gov-ernment be expected to invest in aesthetics beyond the basic design of sucha project? Is it reasonable to argue that there is an aesthetic value in sim-plicity and cost minimisation itself ? Should the level of government payingthe basic costs have the full responsibility for the extra cost, or is it legiti-mate to argue that those additional costs should be the responsibility of theunits of government who will gain from the imagery? Further, if costincreases occur, how do the various levels of government cover the addi-tional cost among themselves? These various dimensions of a larger policydebate ought to be further considered as policy-makers and researchersgain a deeper understanding of mega-projects.
Overall, achieving the technological sublime in mega-projects should berecognised as a potentially critical element in project development,whether or not the designs result in endearing landmarks or engineeringmarvels. As in the Bay Bridge case, the sublime may provide participantswith the personal motivation and interest to heighten their involvementand/or with a political tool that at a minimum provides pithy soundbitesthat capture the attention of the media and larger public. Implementingagencies would best be served to acknowledge the unpredictable, chaoticnature that the sublime may contribute to a process and budget sufficienttime to address it, rather than assume all will go according to plan. Suchrecognition would improve project performance and public debate byreducing the prevailing optimism in delivery schedules for projects thatrequire substantial funding and time, and in the end, will change the waywe travel and perceive the landscape.
ACKNOWLEDGEMENTS
The author gratefully acknowledges the support and guidance of MartinWachs and Elizabeth Deakin. They provided unlimited assistance, guid-ance and wisdom during the research and writing phases. Martin Wachsalso reviewed several drafts in detail and provided insightful contribu-tions throughout the chapter. In addition, the research was generouslysupported by assistance from the US Department of Transportationthrough the Dwight D. Eisenhower Program, the University of CaliforniaTransportation Center, the Women’s Transportation Seminar and theUniversity of California, Berkeley.
260 Innovation, competition and institutions

REFERENCES
Adams, Gerald D. (1998), ‘2nd tower? No way, say bridge designers’, San FranciscoExaminer, 5 July.
Altshuler, A. and D. Luberoff (2003), Megaprojects. The Changing Politics of UrbanInvestment, Washington, DC: Brookings Institution Press.
Arnold, Chris (1997), ‘Building systems development, Palo Alto’, Memorandum toJoe LaClair regarding ‘Bay bridge criteria’, 21 April.
Bay Bridge Consortium (1997), Technical Advisory Committee signed by Perry A.Haviland. Letter to Metropolitan Transportation Commission, 22 April.
Brown, Jerry (1998), Mayor-Elect, City of Oakland, ‘ “There” needs to be a morefitting bridge’, San Francisco Chronicle, 22 June.
Cabanatuan, Michael (2004), ‘The new Bay Bridge proposal: simpler? Definitely.Cheaper? Maybe’, San Francisco Chronicle, 11 December.
California Department of Transportation (1997), ‘Wilson Administration recom-mends replacing Bay Bridge’, press release, 13 February.
California Transportation Commission (2000), Transcript of Item 4.11B, Update onEastern Span of Bay Bridge Replacement, Including Comments from U.S. Navy,Meeting of the California Transportation Commission (Sacramento, California),11 May.
CNN International.com (2005), ‘Bay Bridge project California’s “biggest fiasco” ’,16 March.
Diaz, Sam (1998), ‘Opinion on bridge changes: single tower: revised model alsoallows bikes, walkers’, San Jose Mercury News, 30 May.
Flyvbjerg, Bent and COWI (2004), Procedures for Dealing with Optimism Bias inTransport Planning, Guidance Document, London: UK Department ofTransport, June.
Frick, Karen Trapenberg (2005), ‘The making and un-making of the SanFrancisco–Oakland Bay Bridge: a case in megaproject planning and decision-making’, unpublished doctoral dissertation, University of California, Berkeley,CA.
Hamburg, Laura (1998), ‘S.F. Joins 11th-hour stick over bridge design: TreasureIsland Plan could suffer’, San Francisco Chronicle, 19 June.
Hein, William F. (1997), Metropolitan Transportation Commission. Memorandumto EDAP regarding ‘Future role and process of EDAP’, 9 June (Agenda Item #4for 16 June 1997, EDAP meeting).
Heminger, Steve (1997), Metropolitan Transportation Commission. Memorandumto Bay Bridge Design Task Force regarding ‘Summary of public comment’, 17June (Agenda Item #4 of 24 June 1997, Bay Bridge Design Task Force meeting).
Hess, Alan (1998), ‘A bridge to take us from whimsy to expensive looniness’, SanJose Mercury News, 5 April.
Jordan, Edward G. (1997), California Transportation Commission. Letter to Stateof California Senator Deidre Albert, 10 March.
Longo, Michael (1997), Santa Cruz, ‘Unity Towers East Bay Bridge’, New EastSpan Proposal Submitted to MTC Bay Bridge Design Task Force, 6 May.
Mauzanarez, Rafael, Brian Maroney and Man-Chung Tan, San Francisco–Oakland Bay Bridge, T.Y. Lin International and Moffat & Nichol.
Marx, Leo (1964; 2000), The Machine in the Garden, Oxford: Oxford University Press.McCormick, Erin (1997), ‘Cost vs. aesthetics: bridging the gap’, San Francisco
Examiner, 14 February.
The cost of the technological sublime 261

Metropolitan Transportation Commission (MTC) (2002), San Francisco BayCrossings Study, Oakland, CA: Metropolitan Transportation Commission, July.
Nolte, Carl (1997), ‘Case made against “prima donna” span’, San FranciscoChronicle, 10 April.
Nye, David E. (1994), American Technological Sublime, Cambridge, MA: The MITPress.
Oakes, Robert (1997), ‘Bay Area residents have until July to pick Bay Bridge design’,Contra Costa Times, 19 February.
Oakland Tribune (1997), ‘A new front door to the East Bay’, editorial, 19 February.San Francisco Chronicle (1997), ‘A new Bay Bridge, but what design?’, editorial, 14
February.Upton, Del (1998), Architecture in the United States, Oxford: Oxford University
Press.
262 Innovation, competition and institutions
13. Provision and management ofdedicated railway systems: howto arrange competitionDidier van de Velde and Ernst F. ten Heuvelhof
13.1 INTRODUCTION
Since the 1980s, an intensive debate has been going on about the optimalinstitutional design of the rail transport sector (train and metro). Fordecades, activities in this sector were organised in vertically integratedenterprises. ‘Vertically integrated’ means that the various links in the pro-duction chain, particularly infrastructure and transport services, wereunited in one hand. This gave rise to vertically integrated monopolists.Particularly in continental Europe, governments owned these verticallyintegrated monopolists.
In the 1980s, doubts were cast on this arrangement. The absence of com-petition and the dominance of governments were no longer seen as a guar-antee for reliable and cheap service delivery. Many argued that morecompetition and the introduction of private ownership would generateincentives to improve the performance of this industry. This argument wasraised in many network-based industries. The idea is that productiveefficiency will rise after the introduction of competition and privatisation(see, e.g., Winston, 1993; Megginson and Netter, 2001; Letza et al., 2004;Donahue, 1989: 57–78).
One condition that was considered vital for changes of this kind was theunbundling of the various links in the production chain. Infrastructure andservices should no longer be united in one hand as a matter of course.Unbundling would allow the introduction of competition in links that donot require monopolistic ordering. This unbundling would also allow theprivate sector more room, since links in which competition was introducedwould be able to switch to private ownership.
The perceived need for competition was so big that forms of competitionon or for the market were developed even for links that were regarded asnatural monopolies. Public–private arrangements became the fashion and
263

plenty of experiments were conducted with new forms of contracting (com-petition for the market).
However, the high degree of interdependence between the technicaldesign of the infrastructure (including tracks, energy provision and sig-nalling system) and that of the trains as vehicles using the infrastructuregenerates critical interface problems that require specific attention when theuse of competition is contemplated for parts of a railway system.
A large variety of competition-based arrangements for the provisionand management of railway systems can be observed. This chapter suggestsin its second section a framework for the classification and analysis ofcompetition-based arrangements in the railway sector. This frameworktakes into account the design, build, operate, maintain and finance stagescommonly found in recent (competition-based) contractual arrangementsand combines them with the complexity of the railway sector through theconceptual layers that characterise transport infrastructures, such as thecivil engineering work and its equipment (tracks, signalling, energy supply)and vehicles.
An essential purpose of this chapter is to present to a non-specialisedpublic the variety of ways in which contractual and competition-basedarrangements can be incorporated in the provision of rail infrastructuresand train operations.1 Our focus is on the realisation of new railway systems(infrastructure and transport services on these infrastructures) with onemain transport service provider. This means that we do not address issuesrelated to track capacity allocation in competitive train operations.
Before drawing a few conclusions in the last section of the chapter, wepresent in Section 13.3 the framework as applied to a few European cases.This is done to illustrate in a synthetic way the variety of arrangements thatcan be found in recent European cases where competition was used toprovide and manage new railway infrastructures.
13.2 A GRID FOR THE ANALYSIS OFCONTRACTUAL ARRANGEMENTS INTHE RAILWAY SECTOR
Two main perspectives are used to establish a grid for the presentation andanalysis of (competition-based) contractual arrangements in the railwaysector. The first is the life-cycle stage. This is the traditional divisionbetween design, build, operate, maintain and finance. The second is a divi-sion into the main components that characterise railway systems, withinfrastructures (track and stations) and vehicles forming the main inputs inthe production of transport services.
264 Innovation, competition and institutions

Design, Build, Finance, Operate and Maintain
Numerous activities are required before transport services can be providedto customers. Various assets (infrastructures and vehicles) need to be pro-duced; these assets need to be managed and maintained in order to deliverusable infrastructure capacity and usable vehicle time. These intermediateoutputs constitute inputs in the production of transport capacity. Variousmarketing activities have to be deployed first to conceive and then to sellthis transport capacity into individual transport services to passengers.
These activities differ sharply, as do the competencies required to com-plete them successfully. However, in the rail industry they were untilrecently performed by the same enterprise – the state railway company orthe municipal metro company – which had specialised units to carry themout.
Recently, debate has arisen as to whether, and to what extent, otherorganisation forms can bring better results. Each of the activities men-tioned above could, in principle, be contracted out to different companiesspecialising in the relevant activities. For example, asset design may be out-sourced to firms of consulting engineers, build to building contractors andoperate and maintain to specialised operators. The problem with suchdecompositions is that optimal choices for each of the individual activitiesdo not necessarily combine into an optimal set for the global package; poorperformance in one activity could indeed have serious subsequent (butdelayed) impacts on other activities.
More innovative forms of contracting out are also conceivable that tryto address this issue (see, e.g., Hann and Mack, 2005; De Ridder, 1998;Vollaard and Witteveen, 1999), such as: BO contracts (build and operate inone hand), DB contracts (design and build in one hand) and DBFOMcontract (design, build, finance, operate and maintain in one hand). Theessence is that several phases are then entrusted to one contractor, who can,from his own expertise and in response to the set of incentives resultingfrom the combination of several phases into one contract, make economictrade-offs between the various phases of the project so as to improve overallproject efficiency. A typical example is the trade-off that may exist betweenadditional building costs and possible lower maintenance costs in thefuture.
For the clarity of the presentation, we group the traditional stagesdesign, build, operate and maintain (DBOM) into two main types of activ-ities: ‘conception’ and ‘utilisation’ (see Figure 13.1). In the design stageprincipals can confine themselves to indicating functionalities of the activ-ities contracted out, leaving their detailed design and arrangement to thecontractors. Note, however, that the extent to which the contractor is in
Provision and management of dedicated railway systems 265

charge of the full design varies from case to case. This is represented by thedotted lines in Figure 13.1.
An essential feature of public–private partnerships and competition-based arrangements is the mobilisation of private sector capital to realiseinfrastructure projects. Linking private participation in the DBOM stagesto private financing and risk-taking is meant to enhance the incentives towhich contractors are subjected to realise the project aims. Numerous pos-sibilities exist in this respect, but covering these options falls outside thescope of this chapter (see, e.g., Hann and Mack, 2005 for various projectfinancing structures and options, such as equity, debt and bonds).
Components of the Railway System
The elements presented in Figure 13.1 form the first dimension of the gridof analysis suggested in this chapter. However, this is not sufficient topresent the complexity of (competition-based) contractual arrangementsin the railway sector, as railway systems are composed of several compo-nents (see Figure 13.2) for which different contractual and competition-based arrangements can exist. This forms the second dimension of the gridof analysis suggested here.
We distinguish essential components from additional components. Theessential components are those features that are indispensable for providingtransport services to customers. These include fixed installations (infra-structures) and moving components (trains) that are the main inputs toservice provision. Additional components are those that are not essential torealise transport services, even when closely linked to the rail transportsystem. These are, e.g., commercial spaces located at the stations and sur-rounding real estate. We need to include these components in our analysis,as they are potential sources of substantial funding for the provision andmanagement of rail infrastructures and their operations.
Fixed installations are the track infrastructure and the station infra-structure. The track itself is composed of the civil engineering infrastruc-ture (rail bed, tunnels and bridges) the rails themselves, the electrical powersupply for traction (in the case of electric railways) and the infrastructurepart of the signalling and safety system (beacons, sensors, signals locatedalongside the track, etc.) The complementary part of the safety system is
266 Innovation, competition and institutions
FinancingUtilisationConception
Design Build Operate Maintain
Figure 13.1 DBOM and finance

located inside the train (receivers, computers, human interface, etc.) Thestation infrastructure comprises the space needed for realising transportservices: loading and unloading spaces (such as platforms for passengertransport), transfer spaces and waiting spaces for passengers or storagespaces for freight.
The moving components (i.e. the trains) can further be divided into trac-tion units (locomotives) and passenger or freight transport units (carriagesor wagons). Unlike freight trains, most modern passenger trains are madeup of train sets (electrical multiple units or EMUs) in which traction andtransport are integrated into a single device by locating the motor unitsunderneath the vehicles.
Service provision refers to the conception or design of transport services,i.e. identifying (potential) demand and supplying transport services thatsuit demand. This includes on the one hand the conception and productionof transport services (including the design of all related quality aspects andbearing related production-cost risks) and the commercial part, such asfare design and sales activities (including bearing commercial risks), on theother hand.
Provision and management of dedicated railway systems 267
TrainsLocomotives
Carriages
Service provision
Service production
Sales activities
Infrastructure
Track
Civil engineering
Power supply
Signalling
StationsTransport function
Commercial spaces
Real estate
Rails
Figure 13.2 Components of railway systems

The various components and sub-components are linked by input–output relationships that constitute basic steps in chains of production thatultimately lead to the sales of rail transport services. Human resources areused at each of these steps. The various asset components (stations, tracks,trains) need to be designed, built, operated and maintained. This leads tothe production of infrastructure services (rail ‘paths’, station ‘slots’) andvehicle services (the availability in time of rolling stock, well maintainedand fit for purpose). These are combined by a service provider who puts theavailable rolling stock to productive use on specific infrastructures. Thisdelivers transport capacity that can be sold as transport services to cus-tomers (see also Schaafsma, 2001; and Van Twist et al., 2003 for similarapproaches).
A General Framework of Analysis
Combining both dimensions introduced above leads to a table (Figure 13.3)as a general framework of analysis enabling a comparison of the variety ofarrangements that can be encountered in railway systems. The table alsoincludes an additional column referring to the actor taking the initiative forthe respective component of the whole system. In most cases, at least inEurope (transport) authorities or companies belonging to them take theinitiative to create new rail systems.
This framework is meant to illustrate and help explain some of the com-plexities of such arrangements in the railway sector. From this table, it isclear that one cannot simply talk about ‘design, build, operate and main-tain’ for the railway sector. The various parts of the production process(station, track building, track equipment, train or service provision) couldbe entrusted to one or to several actors and, furthermore, different DBOMarrangements could be chosen for each of these. The choice of the best setof arrangements (integration of all sub-components or not, contractualrelation or not, competition-based or not) for a specific railway project willhave to take at least the vertical and horizontal dimensions in the table intoaccount.
The vertical dimension refers to the choice of whether or not to allocatethe various steps in the production of the train transport services to severalorganisations, and whether or not to subject them to different arrange-ments (contractual or not, competition-based or not). The choices made inthis dimension will influence system-wide optimisation, since one of thecharacteristics of the railway system is the high degree of interdependencebetween the technical design of the infrastructure (including the civil engi-neering work, the tracks, the energy provision and the signalling system)and that of the trains using the infrastructure.
268 Innovation, competition and institutions

269
Tra
ins
Loco
mot
ives
Car
riage
s
Tra
nspo
rt s
ervi
ceS
ervi
ce p
rodu
ctio
n
Sal
es a
ctiv
ities
Infr
astr
uctu
re
Tra
ck
Civ
il en
gine
erin
g
Pow
er s
uppl
y
Sig
nalli
ng
Sta
tions
Tra
nspo
rt fu
nctio
n
Com
mer
cial
spa
ces
Rea
l est
ate
Rai
ls
Fin
anci
ngU
tilis
atio
nC
once
ptio
n
Des
ign
Bui
ldO
pera
teM
aint
ain
Initi
ativ
e
Fig
ure
13.3
Gen
eral
fra
mew
ork
ofan
alys
is

The horizontal choice whether or not to separate the design, build,operate and maintain stages will affect the extent to which and the way inwhich trade-offs between building costs and maintenance costs can berealised (including life-cycle cost optimisation). This issue is present forevery single step of the production process represented in the verticaldimension.
These horizontal and vertical splits refer to the existence or absence ofspecific contractual relations between separate contracting parties, asopposed to the more traditional integration of all (or most) steps withinone organisation, such as a state railway company. Various award proce-dures can be designed to establish such contractual relations, such as opentenders, restricted tenders, negotiated awards and auctions. The call fortenders can be designed more or less ‘functionally’, leaving more or lessdesign freedom to the bidders at the time of bidding, as represented by thedotted lines in the ‘design’ box of the table. Various sets of incentives canbe designed for the bidding period and for the contract period. In the caseof contracts for the provision of transport services (upper part of the ver-tical dimension), the operator can also be granted more or less redesignfreedom during the contract period (see, e.g., Van de Velde, 1999, for aclassification of various options). Finally, the resulting contracts can getvarious legal classifications (concession, contract, etc.), giving themvarious rights or obligations.
13.3 CASES OF COMPETITION IN THE PROVISIONOF RAIL INFRASTRUCTURES AND THEOPERATION OF TRAIN SERVICES
Looking at the realisation of new railway systems over the last decade,we can observe a growth in the usage of competition-based arrangementsand of multiple contractual relations within the vertical and horizon-tal dimensions presented in the previous section. The purpose of thischapter is not to provide a full review of all possible arrangements.Rather, the three examples presented here have been selected such as toillustrate the extreme diversity in such arrangements in recent Europeanpractices:
● the TFM Madrid Metro extension case illustrates a fully integratedoutsourcing;
● the HSL South high-speed line case in the Netherlands illustratesperhaps in its most extreme form the splitting up of the productionchain into individual contracts; while
270 Innovation, competition and institutions
● the Copenhagen Metro (Ørestad) case is positioned somewhere inbetween, by having separate contracts in the conception phase, withmore integration in the utilisation phase and in the finance/risk part.
Further cases can be encountered, such as the metro concession in Rouen(France), the Arlanda rail link in Stockholm (Sweden) or the HeathrowExpress in London (the UK). This could indeed illustrate further variationsupon the typical arrangements presented in this chapter, but the main vari-ations are covered in the cases selected here.
Further in-depth studies of these and other cases would be requiredbefore we could identify the relative performance of these different arrange-ments, but that is not the purpose of this chapter. For some of the projects,it might still be too early to be able to draw conclusions, as they are onlynearing completion (e.g. the HSL South case).
Metro Madrid: TFM Metro Extension (Line 9)
The concession which led to the 20 km extension (three stations) of Line 9of the Madrid Metro, using an existing railway alignment, was awarded tothe winning Consortium ‘Transportes Ferroviarios de Madrid’ following acompetitive procedure. This concession lasts for 30 years (until 2029) andrequires the winner to design, build, operate, maintain and finance theproject. The consortium is formed by the public operator of Madrid(Metro de Madrid SA: 42.5 per cent), a bank (Caja Madrid: 25 per cent)and building companies (FCC 12.2 per cent, Acciona (Necso) 12.2. per centand ACS 8.1 per cent). The project is financed for 20 per cent by share-holding through the consortium partners and 80 per cent by a loan led byCaja Madrid in collaboration with the European Investment Bank. Theincome of the project is made up of passenger receipts and a subsidy basedon a (yearly declining) subsidy per passenger that is supposed to cover thedifference between the fare charged to the passengers and the total costs ofthe project per passenger (including operational costs, amortisation,payment of the principal and the interests, and profit) (ICEX, 2006: 20).This subsidy payment is based on the number of passengers realised, up toa maximum number of journeys determined by the concession holder in thetendering process for each year of the contract. Project planning started in1996; the line was opened in 1999 (CRTM, 2005: 10).
What characterises this concession is the integrated way it was granted.All layers distinguished in our framework form part of a single concessioncontract (see Figure 13.4). The exception is real estate, which remainsoutside the concession’s scope. Each consortium member is in charge of itsspeciality within the realisation of the project.
Provision and management of dedicated railway systems 271

272
TF
MT
rans
port
es F
erro
viar
ios
de M
adrid
(= M
etro
de
Mad
rid 4
2.5%
+ B
uild
ing
com
pani
es 3
2.5%
+ B
ank
25%
)
Priv
ate
mar
ket r
eal e
stat
e ow
ners
Ow
n an
d de
velo
p re
al e
stat
e ar
ound
the
stat
ions
Reg
iona
l gov
tC
ompe
titiv
e te
nder
ing
for
conc
essi
on (
30y)
Con
sort
ium
pro
vide
s 20
%of
cap
ital a
nd 8
0%pr
ovid
ed b
y lo
an r
aise
d by
bank
in th
e co
nsor
tium
inco
llabo
ratio
n w
ith th
eE
urop
ean
Inve
stm
ent B
ank
Con
sort
ium
rec
eive
s a
shar
e in
the
reve
nues
from
the
inte
grat
ed ti
cket
ing
syst
em in
the
regi
on +
asu
bsid
y ba
sed
on a
(yea
rly d
eclin
ing)
mea
nra
te o
f com
pens
atio
n pe
rpa
ssen
ger
mul
tiplie
d by
the
num
ber
of p
asse
nger
sre
alis
ed, u
p to
a m
axim
umnu
mbe
r of
jour
neys
dete
rmin
ed b
y th
e co
nces
sion
hol
der
in th
e te
nder
ing
proc
ess
Bui
ldin
g ac
tiviti
es b
y bu
ildin
g co
mpa
nies
(mem
bers
of t
he c
onso
rtiu
m):
4 s
tatio
ns(e
xten
ding
exi
stin
g lin
e) a
nd in
stal
latio
ns
Rol
ling
stoc
k bo
ught
from
man
ufac
ture
r(o
utsi
de c
onso
rtiu
m)
Ser
vice
ope
ratio
n by
Met
ro d
e M
adrid
(m
embe
rof
the
cons
ortiu
m)
Pub
lic s
ecto
r (lo
cal a
utho
ritie
s) P
lan
addi
tiona
l hou
sing
dev
elop
men
ts
Tra
ins
Loco
mot
ives
Car
riage
s
Ser
vice
pro
visi
onS
ervi
ce p
rodu
ctio
n
Sal
es a
ctiv
ities
Infr
astr
uctu
re
Tra
ck
Civ
il en
gine
erin
g
Pow
er s
uppl
y
Sig
nalli
ng
Sta
tions
Tra
nspo
rt fu
nctio
n
Com
mer
cial
spa
ces
Rea
l est
ate
Rai
ls
Fin
anci
ngU
tilis
atio
nC
once
ptio
n
Bui
ldO
pera
teM
aint
ain
Initi
ativ
e
Des
ign
Fig
ure
13.4
TF
M (
Met
ro M
adri
d –
Ext
ensi
on L
ine
9)

Ørestad Metro Line
The Ørestad Development Corporation (established in 1993) is owned 55per cent by the Municipality of Copenhagen and 45 per cent by the DanishMinistry of Transport and Energy. It was set up to plan, develop and sell theland in the Ørestad area. This mainly undeveloped area that was granted tothe Corporation is located between the city centre and CopenhagenInternational Airport. The Corporation also has to build a new metrosystem linking this area to Copenhagen (in three phases, of which theexample presented here is only the first phase), and to invite tenders andenter into contract for the operation of the metro. The building of the metroand the infrastructure of the Ørestad were financed by loans guaranteed bythe Danish state and the participating local and regional authorities. Thebasic principle of the Ørestad development is that the new transport infra-structure (metro) would be paid for by the value increases generated in thesurroundings by this infrastructure. The Corporation’s debt is to be repaidthrough its share of the profits from the metro, through revenues from thesale of land in the Ørestad area and – until the Corporation is free from debt– through the reversing of land tax and service charges from the land sold(Ørestadsselskabet, 2006a: 10–12). The sale of land started in 1997. The firstsection of the metro was opened in 2002. It is expected that the debt will bepaid back by 2038 (Ørestadsselskabet, 2006b).
The Ørestad Metro line (Copenhagen) is a typical example of synergeticdevelopment of real estate with a new transport infrastructure. This railproject differs substantially from the Madrid example. Two contracts are atthe core of the project here. The first is a civil work contract, won by theCOMET consortium of construction companies, to realise the civil engi-neering part of the metro (stations and tunnels). The second is an inte-grated transport system contract, won by Ansaldo Trasporti (see Figure13.5). This contract covers the realisation of the whole transport system(tracks, signalling, rolling stock) in a vertically integrated fashion, and thefirst five years (2002–7) of operation and maintenance of that system,including the stations and tunnels. Ansaldo was recently granted a con-tractually foreseen three-year contract extension until October 2010(Ørestadsselskabet, 2006a: 30). Ansaldo subcontracted this operation andmaintenance contract to Metro Services (Serco) during the first five years.This will now be transferred to a consortium composed of Ansaldo andATM (the public operator of the Milan metro) in October 2007 for thesecond phase of the contract.
Provision and management of dedicated railway systems 273

274
CO
ME
TC
onso
rtiu
m o
f con
stru
ctio
n co
mpa
nies
to b
uild
the
civi
l wor
k pa
rt
Øre
stad
Dev
elop
men
tC
orpo
ratio
nC
ompe
titiv
e te
nder
ing
for
Tra
nspo
rtat
ion
Sys
tem
(bu
ild, a
ndfir
st 5
(+
3) y
of o
pera
tion
and
mai
nten
ance
of t
he s
yste
m)
Øre
stad
Dev
elop
men
t C
orpo
ratio
nC
ompe
titiv
e te
nder
ing
for
the
civi
l wor
k
Ans
aldo
Tra
spor
tiC
ontr
act f
or b
uild
ing
met
ro in
stal
latio
ns,v
ehic
les,
oper
ate
and
mai
ntai
n th
e sy
stem
HU
R (
HT
) C
omm
erci
al o
pera
tion
of th
e in
tegr
ated
tran
spor
t sys
tem
in C
open
hage
n
Met
ro S
ervi
ces
(= S
erco
)S
ubco
ntra
ct (
first
5 y
ears
) fo
r tr
ansp
ort s
yste
mop
erat
ion
and
mai
nten
ance
Thi
s is
a s
ubco
ntra
ct to
Ans
aldo
Tra
spor
ti fo
r20
02–2
007
for
oper
atio
ns a
nd m
aint
enan
ce
Ans
aldo
/AT
MS
ubco
ntra
ct (
3 fo
llow
ing
year
s) fo
r tr
ansp
ort s
yste
mop
erat
ion
and
mai
nten
ance
Thi
s is
a s
ubco
ntra
ct to
Ans
aldo
Tra
spor
ti fo
r20
07–2
010
for
oper
atio
ns a
nd m
aint
enan
ce
(Lat
er d
irect
com
petit
ive
tend
erin
g by
Øre
stad
D
evel
opm
ent C
orpo
ratio
n fo
r tr
ansp
ort s
yste
mop
erat
ions
and
mai
nten
ance
)
Øre
stad
Dev
elop
men
t Cor
pora
tion
New
Tow
n de
velo
pmen
t aro
und
the
new
met
ro li
ne
Øre
stad
Dev
elop
men
tC
orpo
ratio
nF
inan
cing
of t
he b
uild
ing,
oper
atio
ns a
ndm
aint
enan
ce o
f the
met
roth
roug
h tic
ket r
even
ues,
rent
ing
of c
omm
erci
alsp
aces
in th
e m
etro
,re
ceip
ts fr
om la
nd s
ales
in th
e Ø
rest
ad a
rea
deve
lope
d by
Øre
stad
Dev
elop
men
t Cor
pora
tion
arou
nd th
e m
etro
line
(= v
alue
cap
turin
g of
land
pric
e in
crea
ses
due
to th
ede
velo
pmen
t of t
hem
etro
line
)
Priv
ate
mar
ket r
eal-e
stat
e ow
ners
Dev
elop
rea
l est
ate
in Ø
rest
ad fo
llow
ing
the
plan
s de
velo
ped
by th
e Ø
rest
ad D
evel
opm
ent C
orpo
ratio
n
Tra
ins
Loco
mot
ives
Car
riage
s
Ser
vice
pro
visi
onS
ervi
ce p
rodu
ctio
n
Sal
es a
ctiv
ities
Infr
astr
uctu
re
Tra
ck
Civ
il en
gine
erin
g
Pow
er s
uppl
y
Sig
nalli
ng
Sta
tions
Tra
nspo
rt fu
nctio
n
Com
mer
cial
spa
ces
Rea
l est
ate
Rai
ls
Fin
anci
ngU
tilis
atio
nC
once
ptio
n
Des
ign
Bui
ldO
pera
teM
aint
ain
Initi
ativ
e
Fig
ure
13.5
Cop
enha
gen
Met
ro
High-speed Line Amsterdam–Belgium (Netherlands)
The decision to build a high-speed railway line from Amsterdam viaRotterdam to Brussels (to connect it to the existing high-speed line to Paris)was taken in 1996 after many years of discussion. The building of theline started in 2000 and trains are expected to run in 2008, following somedelays.
The contracting for the realisation of the new high-speed train service isdivided into three main blocks (see Figure 13.6). The first is the more tra-ditional outsourcing of the civil engineering work to build the civil work ofthe line. The second block is a concession for providing a functioning trackinfrastructure. In this block, which is the largest public–private partnershipever signed in the Netherlands, the concessionaire has to design, build,operate, maintain and finance all track equipment (rails, safety and sig-nalling system, energy system, etc.) for a period of 25 years. It is paid by thestate for the realised availability of the track. The track concessionaire hasno commercial responsibility for the usage of the track capacity. This con-cession was awarded to the Infraspeed consortium, established in 1999 andcomposed of construction companies and institutional investors (FluorInfrastructure, Siemens Nederland, Koninklijke BAM Groep, Innisfreeand HSBC Infrastructure) (Projectorganisatie HSL-Zuid, 2007). The thirdblock is the transport contract. This is a 15-year concession awarded incompetition by the state to the HSA (High-Speed Alliance) consortium,composed of NS (Dutch Railways) and KLM. HSA has to provide its owntrains and operate at least the minimum required number of train services,and do this on a commercial basis (i.e. without subsidy). This consortiumalso has to pay the state for the right to use the track. This sum, which is infact a charge for infrastructure usage, was maximised in a competitive ten-dering process.
This case represents perhaps one of the most extreme forms of separa-tion of both horizontal and vertical steps in the framework presented.Another particularity of this case is the presence of several other actors.The Dutch rail infrastructure manager (ProRail) and the station operatorof the national railway company (NS Stations) are both present andperform parts of the infrastructure tasks.
13.4 CONCLUSIONS
The main issue, identified as the vertical dimension in our framework ofanalysis, is whether production stages that are conceptually separable (suchas infrastructure management and train operations) should be separated,
Provision and management of dedicated railway systems 275

276
NS
Rea
l Est
ate
Ow
n an
d de
velo
p re
al e
stat
e ar
ound
the
stat
ions
, in
coop
erat
ion
with
oth
ers
(Min
istr
y, p
rivat
e ac
tors
, etc
.)
HS
A fo
r na
t. se
rv. (
with
SN
CB
/SN
CF
for
int.
serv
ices
)O
pera
tor
reco
vers
cos
ts b
ypa
ssen
ger
reve
nue
afte
rpa
ying
con
cess
ion
fee
to th
eS
tate
(co
mpe
titiv
e te
nder
ing)
HS
A (
= N
S+
KLM
) fo
r na
tiona
l ser
vice
s, c
oope
ratio
n w
ithS
NC
B &
SN
CF
for
inte
rnat
iona
l ser
vice
sP
rivat
e co
nces
sion
aire
des
igns
and
ope
rate
s th
e se
rvic
es, a
nd g
uara
ntee
s at
leas
t the
cont
ract
ually
req
uest
ed s
ervi
ces
(15
year
s co
nces
sion
)
Infr
aSpe
edP
rivat
e co
nces
sion
aire
des
igns
and
build
s tr
ack
supr
astr
uctu
re
NS
Sta
tio
ns
Dai
ly s
tatio
n m
ngt a
nd m
aint
enan
ce
Priv
ate
mar
ket r
eal-e
stat
e ow
ners
Ow
n an
d de
velo
p re
al e
stat
e ar
ound
the
stat
ions
, in
coop
erat
ion
with
oth
ers
(Min
istr
y, N
S R
E, e
tc.)
Ans
aldo
-Bre
daR
ollin
g st
ock
man
ufac
ture
rs
NS
Fin
Ser
v(f
or H
SA
) +
SN
CB
Com
petit
ive
tend
erin
g fo
rro
lling
sto
ck
Sta
te
Pro
Rai
lC
apac
itym
ngt a
ndtr
affic
cont
rol
Infr
aSpe
edC
once
ssio
naire
fina
nces
build
ing
of th
e su
pras
truc
ture
and
is r
epai
d by
the
Sta
teth
roug
h pa
ymen
ts li
nked
toef
fect
ive
avai
labi
lity
of tr
ack
durin
g co
nces
sion
per
iod
NS
Fin
anci
al S
ervi
ces
Fin
ance
s pu
rcha
se, o
wns
trai
ns a
nd le
ases
to H
SA
Pro
Rai
lIn
f. to
pub
lic
Sta
teC
ompe
titiv
e te
nder
ing
for
serv
ice
cont
ract
(15
y)
Sta
teC
ompe
titiv
e te
nder
ing
for
supr
astr
uctu
re c
once
ssio
n (2
5 y)
Priv
ate
cont
ract
ors
in s
ever
al b
atch
es
Priv
ate
cont
ract
ors
(in s
ix b
atch
es)
Pro
Rai
l pay
s fo
r th
e bu
ildin
gow
ns ‘t
raffi
c pa
rt’o
f sta
tions
NS
Sta
tio
ns
pays
for
build
ing
and
owns
‘non
-tra
ffic
part
’
Sta
teC
ompe
titiv
e te
nder
ing
for
wor
ks c
ontr
act
Pro
Rai
l & N
S S
tatio
nsC
ompe
titiv
e te
nder
ing
for
stat
ion
rebu
ildin
g/ex
tens
ion
Infr
aSpe
edP
rivat
e co
nces
sion
aire
mai
ntai
nstr
ack,
and
gua
rant
ees
spec
ified
leve
l of a
vaila
bilit
y fo
r w
hole
conc
essi
on p
erio
d
Tra
ins
Loco
mot
ives
Car
riage
s
Tra
nspo
rt s
ervi
ceS
ervi
ce p
rodu
ctio
n
Sal
es a
ctiv
ities
Infr
astr
uctu
re
Tra
ck
Civ
il en
gine
erin
g
Pow
er s
uppl
y
Sig
nalli
ng
Sta
tions
Tra
nspo
rt fu
nctio
n
Com
mer
cial
spa
ces
Rai
ls
Fin
anci
ngC
once
ptio
nU
tilis
atio
n
Des
ign
Bui
ldO
pera
teM
aint
ain
Initi
ativ
e
Rea
l est
ate
To
be o
utso
urce
dby
HS
A&
SN
CB
with
link
toA
nsal
doB
reda
Fig
ure
13.6
Hig
h-S
peed
Lin
e S
outh
(N
ethe
rlan
ds)

or whether interdependencies between these or other stages require inte-gration to guarantee optimisation. These critical interface problems requirespecific attention. This is also a fundamental issue of transaction-cost eco-nomics and essentially a classic question, examined by Coase (1937) in hisfamous article where he raised the question whether coordination shouldcome about through the market mechanism or through the hierarchy in afirm.
A main aim of using contracting under competition in the case of infra-structures was the introduction of additional incentives for budget controlin infrastructure realisation and for better inclusion of trade-offs betweenvarious project stages, such as building and maintenance costs in infra-structure design and operation. But many of the newly introduced con-tracting and competitive practices go beyond simple outsourcing, as theyalso introduce several non-hierarchically related initiative-takers along thevarious components of railway systems, adding to the complexity andrequiring further coordination between these new actors. A characteristicof some of the current reform practices in the European railway sector ingeneral (‘the separation between infrastructure management and trainoperations’) is that they are, to a large extent, more dictated by political oreconomic dogma rather than by optimal outsourcing decisions.
Intensive debate is going on as to whether vertical integration in rail trans-port has, or does not have, positive effects (see, e.g., Mulder et al., 2005). Thecosts of vertical separation are relatively high (Bureau of Transport andRegional Economics, 2003) and it seems that the benefits only outweigh thecosts if separation brings sufficient competition. A conclusion in a recentoverview of institutional changes in the railway industry is that introducingcompetition through vertical unbundling has proven more problematic thanintroducing competition with vertical integration (Gómez Ibáñez, 2006: 3).However, this conclusion is not shared by all the other authors of thebook in which the overview is presented. Apparently, there are exceptions tothis general rule. We think that introducing the horizontal dimension ofthe framework suggested in this chapter may clarify why some examples ofvertical unbundling are effective in introducing competition and others arenot.
Further questions present themselves in our framework of analysis in ahorizontal sense: to what extent should the various activities (designing,building, operating, maintaining) and their financing be kept in one handand how much room should private parties be given in their role as con-tractors? Here, the following considerations play a role:
● Optimising phase by phase might hamper an optimal arrangementacross all phases. A classic example is that cheap building might
Provision and management of dedicated railway systems 277

cause expensive maintenance (Zoeteman, 2004). Slightly more ex-pensive building may bring such savings on maintenance costs that,from an integral perspective, this would be a better policy.
● Private contractors who receive a fully specified call for tender havehardly any room to perform this task in the best possible way. Theyhave only one interest, which is to perform the specified activities ascheaply as possible, exactly matching the agreed quality level.Consequently, these contractors’ extensive expertise is utilised onlypartially.
● Although the integration advantages are important, it is doubtfulwhether they apply to all activities. For example, there would seem tobe a close link between building and maintenance, so close that theirintegration in one hand must yield unmistakable advantages. Theadvantages of integrating building and operations are, on the con-trary, less manifest. It is highly questionable whether and to whatextent the advantages of integration outweigh its disadvantages inthis case.
● A government can invite tenders for both the process and theproduct, giving the contractor room to carry out those tasks opti-mally. Yet, by giving this room, the government loses possibilities forsteering and adjusting. This may be a disadvantage from the per-spective of the tender-inviting government, but an advantage fromthe perspective of society as a whole. Infrastructures and servicestend to involve politically and societally sensitive processes aboutwhich there is almost constant debate. Handing over control ofeverything makes it either impossible or very expensive for the gov-ernment to follow the direction in which this debate is moving.
● One of the problems in traditional contracting is that principals havean information disadvantage compared with contractors. The latterknow more, which makes it difficult for principals to steer and checkcontractors. Allowing contractors more room and, in addition,making them responsible for several activities, increases the princi-pals’ information disadvantage even further and makes it even moredifficult to steer and check contractors.
What did these innovative forms of contracting bring us? The picture issomewhat vague. In Chapter 10, Koppenjan concludes that it is difficult tojudge the success or failure of these new forms of contracting. Successesappear to be scored mainly in effectiveness, better project control and inno-vation. Most problems occur in the areas of transaction costs, trans-parency, legitimacy and accountability. Many of the disadvantages mightperhaps have been prevented if the process had been better organised.
278 Innovation, competition and institutions

NOTE
1. The railway system presents a number of particularities when compared with othernetwork infrastructures. While utilities such as electricity, gas or water distribution net-works can usefully be compared with passenger and freight transportation networks, thenecessity of the use of vehicles (trains, cars and lorries) in passenger and freight trans-portation makes the economics, the operation and the regulation of these networks sub-stantially more complex. While water, gas or electricity networks provide a continuousflow of uniform goods to a set of tapping points, passenger and freight transport net-works, on the contrary, only allow the movement of non-substitutable individuals, groupsof passengers or items of freight on largely non-substitutable origin–destination pairs.Furthermore, these movements require the use of vehicles and components such as con-tainers to protect individual shipments. Moreover, these vehicles and components need tobe continuously repositioned in the network to serve demand where it is located.
REFERENCES
Bureau of Transport and Regional Economics (2003), Rail Infrastructure Pricing:Principles and Practice, Report 109, Canberra: Australian Government,Department of Transport and Regional Services.
Coase, R. (1937), ‘The nature of the firm’, Economica, New Series IV: 386–405.CRTM (2005), Madrid 2005 – A World Reference, Madrid: Consorcio Regional de
Transportes de Madrid.De Ridder, H.A.J. (1998), ‘Modern Bouwproces vraagt Integrale Contractvorm’
(Modern Building Process demands Integral Contract Form [in Dutch]), Land �Water, 3: 39–41.
Donahue, J. (1989), The Privatisation Decision, New York: Basic Books.Gómez Ibáñez, J.A. (2006), ‘An overview of the options’, in J.A. Gómez Ibáñez and
G. de Rus (eds), Competition in the Railway Industry: An InternationalComparative Analysis, Cheltenham, UK and Northampton, MA, USA: EdwardElgar: 1–22.
Hann, N. and T. Mack (2005), ‘A banking perspective on transport’, in K.J. Buttonand D.A. Hensher (eds), Handbook of Transport, Strategy, Policy andInstitutions, Amsterdam: Elsevier: 299–324.
ICEX (2006), Transporte ferroviario urbano en España Madrid, Instituto Español deComercio Exterior.
Letza, S.R., C. Smallman and X. Sun (2004), ‘Reframing privatisation.Deconstructing the myth of efficiency’, Policy Sciences, 37: 159–83.
Megginson, W. and J. Netter (2001), ‘From state to market: a survey of empiricalstudies on privatization’, Journal of Economic Literature, 39: 321–89.
Mulder, M., M. Lijesen, G. Driessen and D.M. Van de Velde (2005), ‘Vertical sep-aration and competition in the Dutch rail industry – A cost–benefit analysis’, inG. Alexandersson and S. Hulten (eds), Third Conference on Railroad IndustryStructure, Competition and Investments, Stockholm, 20–22 October.
Ørestadsselskabet (2006a), Annual Report 2005, Copenhagen: Ørestadsselskabet.Ørestadsselskabet (2006b), www.orestadsselskabet.dk/okonomi, 28 February.Projectorganisatie HSL-Zuid (2007), www.hslzuid.nl, 28 February.Schaafsma, A.A.M. (2001), Dynamisch railverkeersmanagement: besturingsconcept
voor railverkeer op basis van het Lagenmodel Verkeer en Vervoer (Dynamic rail
Provision and management of dedicated railway systems 279

traffic management: management concept for rail traffic on the basis of the LayerModel Transport and Traffic [in Dutch]), TRAIL thesis series, T2001/7, Delft:DUP Science.
Van de Velde, D.M. (1999), ‘Organisational forms and entrepreneurship in publictransport (Part 1: classifying organisational forms)’, Transport Policy, 6: 147–57.
Van Twist, M.J.W., A.W. Diederen, B.P.A. van Mil, M.A.R. van Roost and M.M.Timmermann (2003), ‘Tussen droom en daad . . . Marktordening en publiekebelangen rond vitale transport-infrastructuren’, voorstudie van Berenschot voorde Raad voor Verkeer en Waterstaat, The Hague: Raad voor Verkeer enWaterstaat (in Dutch).
Vollaard, B.A. and W. Witteveen (1999), Innovatief aanbesteden: naar een hogermaatschappelijk rendement van overheidsinvesteringen (Innovative contracting:towards a higher social return of public investments), The Hague: Ministerie vanEconomische Zaken (in Dutch).
Winston, C. (1993), ‘Economic deregulation: days of reckoning for microecono-mists’, Journal of Economic Literature, 31: 1263–89.
Zoeteman, A. (2004), Railway Design and Maintenance from a Life-Cycle CostPerspective: A Decision-Support Approach, Delft: TRAIL Thesis Series, TRAILResearch School.
280 Innovation, competition and institutions

14. Rail infrastructure at majorEuropean hub airports: therole of institutional settingsMoshe Givoni and Piet Rietveld
14.1 INTRODUCTION
The development of rail links to airports can be compared with the devel-opment of rail links to ports. ‘Prior to the advent of road and air transport,the main form of transport for overseas journeys was a combination of railand sea . . . [therefore] railways were built directly into the seaports’ (Stubbsand Jegede, 1998: 56). However, when airports substituted seaports foroverseas journeys the share of rail in surface transport was in decline andthe share of the private car on the rise, resulting in good connections of air-ports to the road network and not the rail network. A notable developmentis that more recently this is changing, and as the air transport industry con-tinues to grow the number of rail connections to airports increases.
The main rationale for railway connections to airports is the need tobring passengers to (or from) the airport when they begin (or end) their airjourney. This need increases with growing congestion on roads, which isoften especially severe around airports, and the growing awareness to theneed to reduce car dependent travel. The development of the high-speedtrain (HST), which can increase airports’ catchment area and on someroutes can substitute the aircraft, provides another important incentive toconnect airports with the (HST) rail network. From a transport policy per-spective, the importance of integration between transport modes and trans-port networks provides the main justification to invest in rail services toairports.
The above is reflected in the increased number of railway connections toairports. In 1998, 62 rail connections to airports existed in the world and116 were planned (in Europe, 40 existing connections and 49 planned andin North America, 14 existing and 32 planned connections – IARO, 1998).In addition to an increase in the number of rail connections to airports,there is an increase in the quality of these connections. At many airports,
281

local, regional, national and international rail services are provided, byboth conventional and high-speed rail, and airlines can use the rail networkas an integral part of their route network.
The notion of integration seems to be a prerequisite for an effective andbeneficial role of the railways in air transport, and vice versa. By examin-ing three cases, London Heathrow Airport, Amsterdam Schiphol Airportand Paris Charles de Gaulle (CDG) Airport, this chapter aims to investi-gate air–rail policies as part of transport policy and examine how thesetranslate into infrastructure investments in terms of railway services at air-ports. The benefits of air–rail integration and the role the railways can playin the future of air transport have been described by Givoni and Banister(2006; 2007) and are therefore briefly described here. The aim of this con-tribution is more to explain why, despite these recognised potential benefitsfrom railway services at airports, the degree of air–rail intermodality stillvaries between Europe’s largest airports.
Before the three cases are described, Heathrow Airport in Section 14.3,Schiphol Airport in Section 14.4 and CDG Airport in Section 14.5, a shortoverview of rail connections to airports is given in Section 14.2. In Section14.6, possible reasons for the differences in the levels of intermodality andrail infrastructure at different European hub airports are discussed. InSection 14.7 conclusions are drawn.
14.2 RAILWAY CONNECTIONS TO AIRPORTS1
Airports can be connected to the railway network in several ways. Based onthe geographical coverage of the rail service from the airport, the followingcategorisation is suggested (Table 14.1). At the lower level are services thatconnect the airport with the city centre only, usually by special trains (withspecial facilities for luggage) that provide fast and frequent connections tothe city centre, but often at premium fares. Examples include the ArlandaExpress in Stockholm, the Heathrow Express in London, and the NaritaExpress in Tokyo. At a higher level, the airport is connected to the citymetro system, providing a wider geographical coverage but usually a lowerstandard of service in terms of travel time to the city centre and capabilityto cater for airport passengers (mainly in terms of luggage space). This isthe most common type of rail link to an airport (IARO, 1998). Examplesinclude the London Underground connection to Heathrow (the Piccadillyline) and the RER (Réseau Express Régional) connection of CDG to Paris.
At the regional level, the airport is connected to the regional railnetwork. These connections can vary in terms of the number of destina-tions directly served by the airport, and as a consequence the geographical
282 Innovation, competition and institutions

area covered by these services. Often, airports happen to be built close torail lines and thus a connection is ‘accidental’, and serving the need of theairport passengers is not the station’s main purpose (IARO, 1998). In addi-tion, the demand for rail services is not high enough to make the airportstation an important stop on routes passing through or near the airport. Inthis case, a change of train is required to access the main railway network,and the rail connection to the airport will usually be a spur or a branch linefrom the main line (Stubbs and Jegede, 1998).
Large airports located along a main-line rail route will usually generateenough demand for rail services to become an important stop on the routespassing through the airport (i.e. a through station), as all trains will stop atthis station and many destinations could be reached by a direct rail service.Such services will usually provide access to the airport from the boundariesof the airport catchment area. Gatwick Airport rail station is an exampleof such a railway connection. As the area covered by rail services fromthe airport increases beyond the airport region and the typical airport
Rail infrastructure at major European hub airports 283
Table 14.1 Categorisation of rail links to airports based on geographicalcoverage
Geographical Category Category according Examplescoverage according to Stubbs to IARO (1998)
and Jegede (1998)
City centre Special line High-speed Heathrow Expressdedicated links service from
Heathrow toLondon
City Metro line Metro links Piccadilly lineservice fromHeathrow
The airport Spur line, branch Accidental links Manchester region line airport
rail station;Prestwick airportrail station
National/ Main line Regional links, HST services:international high-speed Frankfurt
networks Airport toStuttgart andCDG to Brussels
Source: Reproduced from Givoni and Banister (2007).

catchment area, rail services become more than just an access mode to theairport. Rail services to airports present the potential for the airport tocompete with other (regional) airports and can be a potential replacementfor short-haul flights. Such rail connections will be categorised in the upperlevel of the geographical coverage. CDG, Frankfurt and Schiphol airportsbenefit from this type of railway connection. Major hub airports will oftenhave more than one type of rail service. CDG, for example, will have railwayservices covering all the geographical areas mentioned in Table 14.1 afterthe new railway service to the city centre, similar to the Heathrow Expressservice, is completed in 2012 (Mott MacDonald, 2003).
In addition to the type of rail connection to the airport, the locationand configuration of the airport station in relation to the air terminal(s)is important in determining the attraction of railway services to passen-gers and other airport users. In general, two broad configurations can beidentified: one is to build the interchange under the existing air terminalcomplex, and the other is to build it adjacent to the air terminal and at thesame level (Buchanan and Partners, 1995). Schiphol, London Stansted,Zürich and Tokyo Narita airports follow the first configuration, whileFrankfurt, CDG, London Gatwick and Manchester airports are exam-ples of the second configuration. ‘Many would consider the best locationfor a rail/air interchange is under the air terminal complex . . . The loca-tion of the rail station under the terminal has the additional benefit ofmaking the airport and rail station appear well integrated, which is animportant perception for air passengers when making a mode choice’(Buchanan and Partners, 1995: 6–20). More important is, however, thelevel of inconvenience associated with the transfer between the aircraftand the train, which is determined by the distance and change of levelbetween the (aircraft) gate and the (train) platform, and the means pro-vided to the passenger to overcome those, e.g. travelators, elevators,people movers, etc.
The relationship between the rail and air transport networks was tradi-tionally based on the railway as a provider of access services to the airport,thus on a limited cooperation between the modes and in practice coopera-tion between the railways and the airports. Yet close cooperation couldincrease the role of the railways in air transport to the benefit of both indus-tries, while competition between the industries might be counterproductivefor passengers as the benefits of cooperation would be avoided. Whenrailway services to/from airports become important to the airlines, cooper-ation between the air and rail industries can reach the level at which air andrail services are fully integrated. In this case, the railway is an integral partof air transport and the differences between the airlines and the railwaysbecome smaller, as they both provide a complete transport service.
284 Innovation, competition and institutions

Whether cooperation or competition between the air and rail modes ismore desired depends on the relationship between the respective networks.When two networks are parallel to each other, competition is usually con-sidered more beneficial, as it leads to more choice and lower fares for pas-sengers. In serial networks (when the networks are used one after the other,such as when the train is used to access the airport), cooperation is consideredmore beneficial (Borger and Proost, 2007). However, when considering thecapacity constraints at major hub airports and the high environmentalimpact from aircraft operation, in the case of the parallel HST and aircraftnetworks, cooperation might be more beneficial than competition, as Givoniand Banister (2006) suggest.
Demand for rail services at airports usually comes mainly from passen-gers and thus from the terminal area. However, at large airports significantdemand is generated by employment at the airport area, which is oftenspread around a much larger geographical area than the terminals, and thiscould lead to conflicts in deciding where to locate the rail station or, alter-natively, may require more than one rail station.
The high demand generated for railway services at large airports, by pas-sengers but also by people who work, shop, recreate or meet there, makesthese airports similar to city centres. Moreover, people do not live in thesecities, but have to travel to/from them each time they need to carry out anactivity in the city. This view of the airport as a city, from a railway plan-ning perspective, underlines the discussion of intermodality policies in thethree case studies described below.
14.3 LONDON HEATHROW – THE BYPASSED CITY
London Heathrow Airport is the main UK airport and the largest in theworld outside the USA in passenger volume (see Table 14.2). UK airtransport policy is very much focused on development at this airport, andthe airport plays a major role in securing air transport’s socioeconomicbenefits. Heathrow’s importance to the UK stems from the level of ser-vices it provides (direct services to about 190 destinations), which is partlypossible by its international position as a hub airport. ‘Heathrow’s exten-sive route network is only viable because of the large number of interna-tional passengers transferring through the airport . . . As a result, UKtravellers and businesses benefit from having direct flights to more desti-nations and [at] higher frequencies. This is a leading factor in attractinginward investment to the whole of the UK. Regional travellers benefitfrom having an increased range of destinations served one-stop via a hub’(DfT, 2003a: 15).
Rail infrastructure at major European hub airports 285

Heathrow’s contribution to the UK depends on the level of service it pro-vides, but also on the level of access to its services, which from the UK canbe by air, road and rail. Access by air to Heathrow’s international routenetwork is relatively limited. In 1990, 18 UK destinations were served from
286 Innovation, competition and institutions
Table 14.2 Profile of London Heathrow, Amsterdam Schiphol and ParisCDG airports (2003)
Category London Amsterdam ParisHeathrow Schiphol CDG
Air transportmovements (global/ 460 748 392 997 515 025regional ranking) (12th/2nd) (19th/4th) (6th/1st)
Passengers inmillions (global/ 64.26 39.96 48.12regional ranking) (3rd/1st) (8th/4th) (7th/3rd)
Cargo in metrictonnes (global/ 1 300 420 1 353 760 1 481 200regional ranking) (15th/4th) (14th/3rd) (11th/2nd)
Number of runways 2 5 4Terminal size (m2) 291 041 370 000 542 300Gates 141 89 124Check-in counters 515 300 543% of internationalpassengers 88.0 99.6 90.0
% of transferpassengers 34.0 40.9 58 (2000)
% of hub carrierpassengers 40.9 (BA) 51.5 (KLM) 57.2 (AF)
Number ofdestinations 190 245 N/A
Passengers/movement 139 102 93Movements per day 1 262 1 077 1 411Daily gate utilisation(passengers) 1 249 1 230 1 063
Employees 4 000 2 231 4 071Shareholders (from 2006) 100% The state: 75.8%, Aéroports de
Ferrovial Consortium City of Paris: 100%(Spanish) Amsterdam: (from 2005 a
21.8%, City of ‘société anonyme’Rotterdam: 2.4% (corporation))
Sources: Various.

Heathrow by 118 round trips per day, but these figures fell to only 8 desti-nations and 84 round trips per day in 2004 (CAA, 2005). In 2003, SchipholAirport served 16 regional airports in the UK, and Paris and Brusselsserved 11 and 8 respectively (House of Commons Transport Committee,2003). Access to Heathrow by road is increasingly compromised by con-gestion; the roads around Heathrow often have relatively high levels of con-gestion compared with the rest of the network, and journeys to Heathrowfrom the central business district are delayed throughout the day by over 50per cent compared to the free-flow speed. This results in travel time of morethan an hour, compared to just over 40 minutes at free-flow condition, forthe 15 km from London’s city centre to Heathrow (Eddington, 2006). Interms of railway services, Heathrow Airport offers good connections withLondon (Figure 14.1), which include an express service to London citycentre, the Heathrow Express (this line also serves several intermediatestops between the airport and the city centre – the Heathrow Connectservice), and a connection to London’s metro system (the Piccadilly line).Despite its size and importance, Heathrow Airport offers very limitedrailway services to destinations outside London, and these are through abus transit between the airport and nearby railway stations.
Rail infrastructure at major European hub airports 287
10 km
to Bristol
T5
T4
T1,2,3
Heathrow
to Manchester
conventionalrail network
Paddington
Piccadilly Line
EustonKing’sCross andSt Pancras
HST toChannelTunnel
to Newcastle
London
N
Figure 14.1 Rail service to and around Heathrow
Heathrow Airport handles more than 40 million non-transfer passengersper year and, together with the number of employees and visitors makingtheir way to the airport every day, the potential demand for railway servicesat Heathrow is that of a major European city centre railway station. In aEuropean context, it is hard to think of a city of this size that is bypassedby the rail network, regardless of its location with respect to the main railcorridors and the rail network. Making Heathrow a stop on the UK railnetwork could provide the way to improve access to Heathrow from withinthe UK. It could also secure the airport socioeconomic contribution to theUK and limit its impact on the environment. These potential benefits frommaking Heathrow a stop on the rail network are greater after a plan toexpand the airport runway capacity, through the construction of a thirdrunway, had to be postponed for environmental reasons (DfT, 2003b). Thebenefits from better railway services at Heathrow are also greater when con-sidering airlines’ preference to use available runway capacity to serve inter-national rather than domestic destinations and the limitations in improvingaccess to Heathrow by increasing road capacity.
There are currently no plans to make Heathrow an important stop onthe rail network, and air–rail intermodality is not an option considered forthe future development of the airport. There are several rail plans forHeathrow at different planning stages. Those that are most likely to mate-rialise are aimed at extending the current Heathrow Express and the metrosystem services to the new Fifth Terminal (T5) which is now under con-struction. The configuration of these connections means that Heathrow’sfive terminals will be served through three different railway stations with nodirect rail connection between all of them. Other planned rail lines whichinclude Heathrow are the Crossrail and Airtrack projects. The Crossrailline is a new east–west line across London and is considered as the ‘trans-port spine needed to underpin the most rapid economic growth areas ofLondon and is the most critical addition to the transport network’ (Mayorof London and Transport for London, 2006: 80). The line is planned toinclude stations at Stratford, and at Ebbsfleet, where HST services fromLondon to Europe will stop, but plans to make Heathrow a stop on theCrossrail line have changed to include ‘an option to serve HeathrowAirport’ through a link to the Crossrail main line (Crossrail, 2005). Still,the London Plan states that ‘Crossrail will also facilitate journeys fromHeathrow to London’s business districts, thereby improving the Capital’sinternational gateways’ (Mayor of London and Transport for London,2006: 80), but with Crossrail serving Heathrow through a link, the Londonareas served by Crossrail will lack direct access to the range of air servicesHeathrow provides. Thus the benefits from the Crossrail connection toHeathrow could have been greater. The Airtrack project is planned to
288 Innovation, competition and institutions

provide rail connections between the new terminal and the regional railnetwork south of the airport, and it will offer services to South London(Waterloo, Clapham Junction, Richmond) and towns near Heathrow suchas Staines, Reading and Guildford.
The rail plans for Heathrow described above represent the limited rolethe railways are expected to play in the future of UK air transport. In 2003,the UK published its air transport policy for the next 30 years in The Futureof Air Transport White Paper (DfT, 2003b). In its contribution to the debateleading to the White Paper, the Strategic Rail Authority (SRA)2 limited therailways’ role in the air transport industry to improving access to airports.It stated that ‘the work that the authority has carried out is not intended tosuggest which airports are most suitable for growth . . . But the authoritywould like to set out the main rail surface access issues that need to be con-sidered’ (SRA, 2003: 4). Whether rail could play a role in the future of airtransport very much depends on the airports chosen for expansion andtheir location with respect to the rail network. Rail services at Heathrow,current and planned, also represent the UK government vision of the roleof rail in air transport. The government view is that, for example, new raillines can reduce demand for air transport between cities (e.g. London–Manchester) but not between cities and airports (e.g. Manchester–Heathrow) (Dft, 2003a), although connection of airports such as Frankfurtand CDG to the (HST) rail network proved that rail can substitute aircraftin such a market.
The long-term planning of Heathrow on the one hand, and the UK rail-ways on the other hand, does not envisage an upgrade of the railway serviceat the airport. The White Paper considered a horizon of 30 years but, asnoted, it did not venture to change significantly the level of service otherthan improving the access services from the airport’s immediate surround-ings. In its contribution to the White Paper, the SRA makes notes on a pos-sible future south–north HST line and proposes that Heathrow will beconnected to this line through a branch line (SRA, 2003), and not a stationon the line. This means that for passengers to enjoy the services on the newHST line, they would have to use a service to a station on the HST line andtransfer there. Before its demise in 2004, the SRA planned to launch a con-sultation on a future south–north HST and in connection with this a HighSpeed Line Study was published (Atkins, 2004). Also, a suggestion wasmade there to connect Heathrow through a link to the high-speed line.
Since the publication of the White Paper, the nature of air–rail planningin the UK has not changed. At the end of 2006, a special report on trans-port policy, termed the Eddington Report (Eddington, 2006)3 was submit-ted to the government. The report identifies that in economic and socialterms investments in improving access to the main UK international
Rail infrastructure at major European hub airports 289

gateways will have the highest welfare return on investments, mainly sinceaccess to these gateways is currently congested. In the recommendationpart, the report proposed to increase road capacity around the main gate-ways and specifically around Heathrow Airport. Improving rail access toHeathrow is not mentioned as a recommendation.
The importance and benefits of rail services at airports such as Heathrowdo not seem to be recognised in the UK. The debate on the future of airtransport, as reflected mainly in the consultation leading to the WhitePaper, gives the impression that the rail and air transport industries seek tominimise the interaction between them. This is against a background whereother European hub airports have already invested in high-quality railwaystations (see Sections 14.4 and 14.5). In the UK air transport policy debate,much focus is placed on runway and terminal developments at Heathrow’smain hub rivals (DfT, 2003a; 2003b; Vandermeer, 2001), but their rail devel-opments are overlooked.
Stubbs and Jegede (1998) reviewed air–rail transport in mainland Britainand concluded that the approach to intermodality, at the time, lacked thenecessary national coordination to capitalise on the benefits of air–railintermodality. In 1998, following the change of government in the UK(from Conservative to Labour), a new transport policy was published(DETR, 1998). The new policy was based on two main objectives: inte-grated and sustainable transport. Integrated transport was still an objectiveof transport policy when the air transport White Paper was published, butthis is not apparent in it.
Heathrow Airport is only about 2 km from one of the UK main rail cor-ridors, the Great Western Main Line – the line from London to the West –and about 15 km from another main line – The West Coast Main Line con-necting London with the north-west including Manchester and Glasgow(Figure 14.1). These features of the rail network, Heathrow’s potentialdemand for rail services and the benefits such services could provide theairport all suggest that in the UK some barriers to air–rail intermodalityexist. Attempts to identify these barriers will be made after considering theother case studies.
14.4 AMSTERDAM SCHIPHOL – A CITY ON THE(RAIL) NETWORK
Amsterdam Schiphol Airport is among the world’s largest airports and isEurope’s fourth largest (Table 14.2). Due to the Netherlands’ geographyand demography, its international position, especially in the competitionwith the other major European airports, is much more important in
290 Innovation, competition and institutions
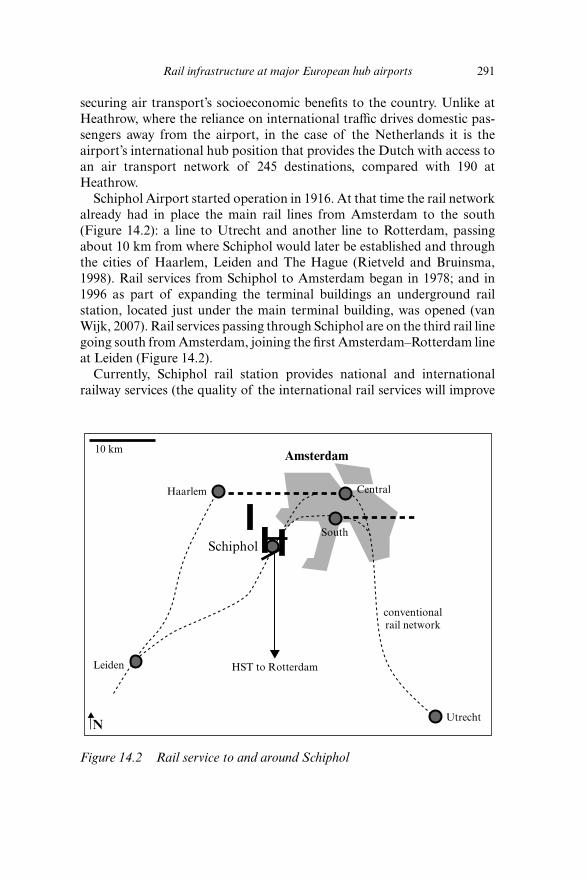
securing air transport’s socioeconomic benefits to the country. Unlike atHeathrow, where the reliance on international traffic drives domestic pas-sengers away from the airport, in the case of the Netherlands it is theairport’s international hub position that provides the Dutch with access toan air transport network of 245 destinations, compared with 190 atHeathrow.
Schiphol Airport started operation in 1916. At that time the rail networkalready had in place the main rail lines from Amsterdam to the south(Figure 14.2): a line to Utrecht and another line to Rotterdam, passingabout 10 km from where Schiphol would later be established and throughthe cities of Haarlem, Leiden and The Hague (Rietveld and Bruinsma,1998). Rail services from Schiphol to Amsterdam began in 1978; and in1996 as part of expanding the terminal buildings an underground railstation, located just under the main terminal building, was opened (vanWijk, 2007). Rail services passing through Schiphol are on the third rail linegoing south from Amsterdam, joining the first Amsterdam–Rotterdam lineat Leiden (Figure 14.2).
Currently, Schiphol rail station provides national and internationalrailway services (the quality of the international rail services will improve
Rail infrastructure at major European hub airports 291
10 km
Leiden
Haarlem
South
Utrecht
HST to Rotterdam
Central
Amsterdam
Schiphol
conventionalrail network
N
Figure 14.2 Rail service to and around Schiphol

significantly with the completion of the HST line to Belgium), and it is acentral node on the Dutch rail network. From the airport station, 54 sta-tions on the Dutch rail network (out of about 350 stations) can be reacheddirectly and another 169 stations can be reached via one transfer. Withup to two transfers, more than 95 per cent of the stations on the Dutchnetwork can be reached. Debrezion (2006) measured the rail service qualityindex for all the stations of the Dutch network4 and found Schiphol airportstation, as a departure station, to be fifth in the Netherlands in servicequality. The most recent development in rail services to Schiphol is thenew connection, opened in 2006, between Schiphol and the rail lineAmsterdam–Utrecht, which allows direct access to Schiphol from, forexample, Utrecht Central, the station with the highest service quality indexin the Dutch network (Figure 14.2; this recent connection is not accountedfor in Debrezion, 2006).
Railway services at Schiphol are also utilised directly by the airlines, toexpand their network of destinations and to substitute the aircraft withtrain services on some routes, for example to Brussels. Following the newrail connection to Utrecht, KLM stopped flight services from Eindhovento Schiphol (they are now used to connect Eindhoven with CDG, the otherhub in the Air France–KLM network; see KLM et al., 2006). In the case ofSchiphol, rail access is recognised to have a strategic importance in com-petition with other airports, especially Frankfurt and Brussels. It thereforealso has strategic importance for KLM, the hub carrier at Schiphol. Withno rail connections to Schiphol, Frankfurt Airport could have been anoption for people between Frankfurt and Amsterdam, especially consider-ing the excellent railway service at Frankfurt Airport and the completeair–rail integration (Givoni, 2005). Furthermore, with good rail connec-tions Schiphol can also extend its catchment area in the direction ofBrussels (airport). IATA (2003) investigated the effect of the HST-Southline, which will allow HST services between Amsterdam, includingSchiphol, and Brussels (and therefore also Paris and CDG), on the con-nectivity of CDG, Schiphol and Zaventem (Brussels) airports using IATA’sconnectivity model. It found that for all these airports completion of theline will substantially increase connectivity, including hubbing connectiv-ity. The increase in connectivity was greater when the airport was directlyconnected to the HST line (CDG and Schiphol as opposed to Zaventem),and the analysis showed that Schiphol will benefit the most from the com-pletion of the HST line.
Schiphol has no unique location attributes that make it the fifth mostimportant station on the network; rather it is its function as an interna-tional gateway and its size (in terms of potential rail travellers) that makethe airport, in terms of railway services, one of the largest cities in the
292 Innovation, competition and institutions

Netherlands. In many respects, from a planning perspective Schiphol isseen within the Randstad region as a city (van Wijk, 2007). The success ofSchiphol as an airport city or cityport (terms often used in the Dutch plan-ning debate) is evident in the fact that it has the highest office rents amongthe Randstad cities, higher than downtown Amsterdam; it is the eighthmost productive cityport in the Randstad (measured in million euros persquare km), out of 23 places compared (which probably also means eighthin the Netherlands); and it has the highest node value of the Randstad’scityports (van Wijk, 2007).
In conclusion, rail services at Schiphol are a direct result of policy andplanning, and the recognition that airports generate significant demand forrail services, enough to make them a stop on a main line. The reference toSchiphol Airport as a city (in terms of rail planning) is justified by the posi-tion of Schiphol railway station on the Dutch rail network.
14.5 PARIS CDG – ESTABLISHING A CITY ON THE(RAIL) NETWORK
France’s main airport, Charles de Gaulle (CDG, also known as Roissy) wasopened in 1974. In 2003, it was the biggest airport in Europe (sixth in theworld) in terms of aircraft movements and second biggest in Europe(seventh in the world) in terms of passengers (Table 14.2). For many yearsCDG followed Heathrow’s example in terms of intermodality policy andspecifically rail access. This changed in the 1990s ‘transforming CDGairport from a buffer between transport modes into a facility serving linkedintermodal travel’ (Perl, 1998: 189).
Rail access to CDG (Figure 14.3) from Paris is through the commuterrail system, the RER. Line B connects the airport with central Paris, includ-ing one of the main rail terminals. In 2012, an express service to Paris citycentre, similar to the Heathrow Express, is scheduled to open (MottMacDonald, 2003). Regional, national and international rail access to theairport is through the HST station. The compatibility of the French HST(the TGV – train à grande vitesse) with the conventional rail networkmeans that rail services from the airport are not limited to destinations onthe (French) HST network. The HST services at CDG and the good trans-fer facilities between air and rail services (probably second only to the facil-ities at Frankfurt Airport) mean that air–rail integration is very muchexploited and there are increasing numbers of airlines pursuing integrationof rail services into their route network. Naturally, Air France is the mainairline utilising rail services. After signing an agreement with SNCF(Société Nationale des Chemins de Fer – French Railways) in 1999, Air
Rail infrastructure at major European hub airports 293

France launched the ‘TGV Air’ services, where SNCF serves CDG airportfrom a half-dozen of relatively close destinations, including internationaldestinations as part of the airline route network (Zembri, 2007). This agree-ment includes services from CDG to Lyon and Brussels, where the TGVreplaces some of the airlines’ flights. For foreign airlines, the connection ofCDG to the (HST) rail network allows them access to the domestic market,which otherwise would not be possible due to the dominant position of AirFrance in this market. Emirates, American Airlines and United Airlineshave code-share agreements with SNCF which allow them such access tothe French domestic market (IATA, 2003).
Understanding the transformation process at CDG is a key to under-standing the differences between Heathrow and Schiphol with regard toair–rail intermodality and rail infrastructure. This process is very muchrelated to the institutional settings of the bodies responsible for the devel-opment of the airport and (HST) rail network.
294 Innovation, competition and institutions
10 km
Orly Airport
Gare de Lyon
Gare de I’EstGare du Nord
RERline B
HST to Lille
HST to Strasbourg
HST to Lyon
ParisCharles De Gaulle
N
Figure 14.3 Rail service to and around CDG

What Perl (1998) calls the ‘institutional roots of intermodal indifference’in French transport planning stem from the institutionalised boundariesand institutional norms inside the organisations responsible for the airportand rail network development, Aéroports de Paris (ADP) and SNCFrespectively. These norms led to a pattern of solving problems based on aninternal inertial logic, ‘neither ADP or SNCF took responsibility for in-tegrating France’s premier gateway into the nation’s transport network,because this task fell outside their logic of appropriate action’ (Perl, 1998:190). For ADP, airport accessibility and economic integration with the sur-rounding region were perceived as costs, rather than benefits. For SNCF,locating CDG’s airport rail station at an equidistance from all airport facil-ities in order to facilitate airport workers’ access to and from their trainsrather than facilitate passenger’s access is the evidence for its intermodalindifference.
The situation changed when ADP and SNCF faced competition andrealised that there are new opportunities for them. Following deregulationof European air transport services, CDG started to compete for traffic andfor a dominant position as a hub airport. In addition, governments, air-lines and national business elites started to view airports as an importantvariable in their particular fortunes and this influenced airport authoritiessuch as ADP to reassess their organisational practices. For SNCF, thedevelopment of the HST in France, but also in Europe, brought the oppor-tunity to play a major role in rail development on a European scale andcreated a competitive dynamic to planning high-speed projects (mainlycompeting with Germany for dominance in this market). ‘Losing the raceto become one of Europe’s principal international air gateways wouldundermine ADP’s credibility, just as allowing other high speed rail tech-nologies to overtake the French Train à Grande Vitesse [TGV] wouldthreaten SNCF’s reputation’ (Perl, 1998: 190). At this point, ADP andSNCF joined forces because both were engaged in new forms of infra-structure development that generated mutually advantageous opportuni-ties for collaboration.
Parallel organisational thinking was a necessary but not sufficient condi-tion for formalising inter-organisational collaboration between ADP andSNCF. To progress beyond informal interaction, a forum in which theorganisations could negotiate was needed, one that would allow them toavoid the exposure to government bureaucracy. France’s traditional use ofhigh-level working groups to initiate new policy options offered that. In1985, the Funel commission laid the foundations for a TGV interconnectionline that would encircle Paris. The commission recommended that this linewould include three stations in the Ile-de-France region placed south, eastand north of Paris. The northern station was intended to be located in the
Rail infrastructure at major European hub airports 295

vicinity of CDG, with the exact location decided by inter-organisationalconsultation between ADP and SNCF (Perl, 1998). In 1994, an HST stationopened at CDG, directly under Terminal 2 (and to be linked to Terminal 1by a people-mover). The station became the sole point at which all branchesof France’s high-speed rail network intersect.
The fact that airlines and railways in the new realties were both targetinginternational business travellers could have led to rivalry between the indus-tries, but ADP and SNCF forged a collaborative partnership to intercon-nect France’s air and high-speed rail networks at CDG. The mutualadvantages of a TGV interconnection facility beneath CDG appearedsufficient to justify the financial and organisational demands of this coop-erative venture (Perl, 1998).
14.6 POSSIBLE REASONS FOR THE DIFFERENCESIN RAIL INFRASTRUCTURE AT MAJOREUROPEAN HUB AIRPORTS
In terms of intermodal policies and more specifically rail services at air-ports, the cases of Schiphol and Heathrow probably represent twoextremes, like CDG before and after intermodality was adopted as a policy.At Schiphol, the picture emerging is one in which every development of theairport on the one hand, and the rail network around it on the other, wasdone in full coordination considering the mutual benefits to air transportand the Netherlands (especially the Randstad region). At Heathrow, thepicture emerging is one of isolation between the airport development andthe rail network development, with no appreciation of possible mutualbenefits and with efforts to limit cooperation between rail and air transport.All three airports considered above, certainly Heathrow, generate enoughdemand for rail services to justify high-quality railway services and a trainstation which is a through station on a main line. Therefore institutionalsettings, or institutional barriers, seem to be more plausible reasons toexplain the different approaches to intermodality which are reflected indifferent levels of rail infrastructure.
The importance of institutional settings in the (success or failure of)implementation of transport policies and decisions on infrastructureinvestments was recognised in the EU TIPP project (Transport Institutionsin the Policy Process). The TIPP findings suggest that problematic imple-mentation of certain transport policies can in many cases be due to inap-propriate and/or ineffective government institutions and organisations,and that these institutions and organisations might even themselves imposebarriers or constraints on implementation. The successful or unsuccessful
296 Innovation, competition and institutions

implementation of transport policies depends on institutional structures(and also on institutional processes) in which nine elements seem of mostimportance. Among them are: the role of national government, the degreeof centralisation, institutional consolidation, the role of the private sector,the degree of regulatory intervention and the coordination across modes(Niskanen, 2005). All these elements can be recognised in the descriptionof the three case studies, especially that of CDG.
The institutional settings played an important role in the transition wit-nessed at CDG and can explain much of the differences between Heathrowand Schiphol. At one extreme, according to Perl (1998), public authority isabsent and collaborative possibilities are precluded. When public authorityexists but is not absolute, collaborative potential increases. In this range,private organisations can interact informally and negotiate discretely, butretain confidence that their agreements can be enforced publicly if neces-sary. Yet, in higher doses, public authority becomes a constraint on inter-organisational collaboration, as deliberations become more formalised,open to wider scrutiny, and subject to challenge by third parties. It can beargued that in the case of Heathrow there is an absence of public author-ity while at CDG in the early days there was too much of it. In contrast, thesituation at Schiphol and at CDG (when the environment became moreintermodal oriented) can be considered as one where there is a sufficientbalance between public authority and organisational independence toallow coordination between organisations without the bureaucracy trap.
By the 1970s, in most of the world, transport had become a largely publicsector activity. This changed in the 1980s when transport policy moved pro-gressively in the direction of the market approach and widespread privati-sation of transport operations took place. The UK was one of the mainpioneers in adopting these changes when it deregulated its express coachservices in 1980 and, following that, of other transport services and infra-structure (Nash, 2005). The British Airport Authority was privatised in1986 with the private company, now called BAA, controlling the threelargest London airports (Heathrow, Gatwick and Stansted). In 1987, theUK flag-carrier British Airways was privatised and the national railway,British Rail, was privatised in 1996 (split into an infrastructure company,Railtrack, and 25 Train Operating Companies). In the Netherlands, gov-ernment and local authorities still have considerable control of the airportand the railway. The government also used to have considerable control ofthe airline, KLM, but this is much less so at present, especially followingKLM merger with Air France.
The situation in the Netherlands makes coordination across industriesand modes relatively seamless. The government involvement in the devel-opment of the airport and its adoption of the mainport concept (i.e. seeing
Rail infrastructure at major European hub airports 297

Schiphol as more than just an airport) as a policy is seen by the industry asone of Schiphol’s advantages (KLM et al., 2006). In contrast, in the UKcoordination will be even harder to achieve at times of crises, such as thoseundergone by the rail industry in the UK (several train accidents, bank-ruptcy of the infrastructure company and finally the demise of the SRA)and the air transport industry (security, increasing fuel costs, SARS).Naturally, at times of crisis cooperation between industries will be low onthe agenda or removed from it. Privatisation probably also means shiftingthe balance, in managing the industry, from the long term (planning andstrategy) to the short term (profitability and return on investment). Theseparation of the industries also means that, as in the case of CDG, solu-tions to problems are sought within the organisation and in such an envi-ronment the costs of possible cooperation would be perceived to outweighany potential benefits. In such an environment, the principle that ‘where arail project also benefits non-airport rail users the broad aim will be todivide the costs between the airport and [the] SRA’ (SRA, 2003: 11), i.e.between the air and rail industries, does not seem to provide enough incen-tive for cooperation.5
Also, under privatisation, transport industries are still governed bypublic policy, usually through the ministries of transport and finance. Inthe case of the UK, the planning forum/coordination body for the air andrail industries is supposed to be the Department for Transport (DfT). Yetin practice, work at such departments is very often uni-modal in nature, theresult of a uni-modal approach to transport planning. This means thatinstead of coordination between the different modes, competition forresources takes place, mainly between the different network administra-tions (i.e. road, rail, aviation and maritime) (Niskanen, 2005).6 Withprivatisation of the transport industries, when each industry lobbies forits own narrow interests and immediate needs, ministries such as theDepartment for Transport might be even more limited in adopting inter-modal philosophy, and this could lead to a situation where the industryinfluences the ministry of transport more than the other way round.Furthermore, for the fragmented UK rail industry, as noted before, the lackof a body like the SRA makes it difficult for the industry as a whole to seethe potential in intermodality.
Surface access to the main UK airports has been recognised by the UKgovernment as a problem and an important planning issue that needs to beaddressed. In response, the major airports were instructed to establishsurface access forums in which different stakeholders within the airportarea take part. In 1996, the Heathrow Area Transport Forum was estab-lished to create partnerships of private and public sector bodies (mainly theairport operator, its users and local authorities surrounding the airport) to
298 Innovation, competition and institutions

improve accessibility and tackle car dependence to and around Heathrow(BAA, 2002). Naturally, such a bottom-up approach can only deal withlocal issues concerning access to Heathrow, and mainly access by employ-ees, but it cannot suggest or progress any strategic decisions on access infra-structure. Furthermore, the forum objectives, as outlined above, focus onaccess issues only, overlooking issues of integration between the surfaceand air transport networks, and overlooking the economic integration(through transport infrastructure) of the airport with its surroundings (theapproach so dominant at Schiphol).
The (regional) market position of each of the airports described mightalso provide an explanation, as well as the competition (or lack of it)between the air and rail networks. At CDG and Schiphol the developmentof the HST network and services led to overlap in the catchment areas ofthese airports with other airports (particularly Frankfurt – the main hubcompetitor in addition to Heathrow). Heathrow is still isolated from thiscompetition, and traffic lost at Heathrow is probably gained at Gatwick andStansted, but these airports are owned together with Heathrow by the samecompany. The situation would change if HST services between Londonand CDG were provided (Eurostar has announced intentions to start sucha service – Brown, 2004). For passengers originating in Kent (throughwhich the HST line from London to the Channel Tunnel passes), which isat the heart of Heathrow’s catchment area, CDG Airport might be easierand quicker to access. In some circumstances, this might also apply to otherareas south-east of London (e.g. East Sussex, Surrey and South Essex).
In terms of competition between the modes, the size of the Netherlandsmeans that there is (almost) no competition between the modes on domes-tic routes, while in France the HST has probably captured most of themarket on the routes where it can offer comparable travel times to aircraft –effectively winning the competition and leading airlines to give it up andinstead cooperate with the railways on these routes (the Paris–Brussels routeis also an example of this). In the UK, in contrast, the two industries are stillvery much in competition; this is mainly noticeable on the London–Manchester route, probably the most profitable in terms of railway oper-ation in the UK and domestic air travel.
14.7 CONCLUSIONS
The development of rail networks around the world is directly linked to thedevelopment of urban centres – the cities. The reason is the high demandgenerated for railway services, to begin with, especially at the city centres.Large airports generate demand equal to, and often larger than, city
Rail infrastructure at major European hub airports 299

centres. Airport cities are high-density cities, with almost all ‘residents’walking distance away from the station. They are cities where all ‘residents’need to travel, often relatively long distances, making them ideal for railwayservices. Still, connection of the world’s largest airports to the rail networkis a relatively recent development, particularly in Europe but much less soin North America.
The principle in developing the railway network, whether an intermedi-ate place (e.g. a city) is connected to a transport line is a function of itsrevenue-generating ability and the cost of deviating from the least-costroute (Black, 2003), somehow does not seem to be always applied in thecase of airports, as the Heathrow case study reveals. Yet it certainly seemsto apply in some (European) airports, as the Schiphol and CDG casestudies reveal.
The different degrees of rail development at airports which are bigenough to justify investments in rail infrastructure depend strongly on thespecific context. Nevertheless, the constant and consistent development ofrailway services at Schiphol, the construction of an HST station at DCG,and in contrast the absence of such developments at Heathrow, point tosome underlying reasons which are more generic in nature. The evidencefrom Heathrow, Schiphol and CDG points to the importance of institu-tional settings within which the industries operate, and here the level andform of privatisation seem to be crucial while the institutional settings ofthe government body responsible for transport (i.e. the ministries of trans-port) seem to be of less importance in determining the extent to whichair–rail opportunities are explored.
The effect of the competitive environment in which the air and rail indus-tries operate is not clear. In the case of CDG, introduction of competitiveforces was the main incentive to consider air–rail cooperation, but in thecase of the UK the competitive environment in which the industries operatemight be a deterrent to considering, at this stage, cooperation between theindustries. In the Netherlands, the relatively low level of competition facedby the rail industry and the airport (on the domestic front) might facilitatecooperation between the industries. Thus the competitive environment iscertainly important, but its effect is not clear. The competitive environmentin this case also includes competition between the industries and thatbetween the airports and nearby airports through the land transportnetwork.
Givoni and Banister (2006) provided evidence for the benefits of provid-ing high-quality rail services at Heathrow. These benefits merit further con-sideration and evaluation, such options should be considered in light of thefuture development of the airport, but this is not taken up by the actorsconcerned. The process described by Perl (1998), in which the CDG
300 Innovation, competition and institutions

Airport was transformed from a buffer between transport modes into afacility serving linked intermodal travel, can be the guide in the case of theUK. Perhaps what is missing in the UK is the type of forum provided toADP and SNCF to meet and discuss intermodality. A need for such aforum was recognised by Eddington (2006), with regard to transport policyin the UK.
Government needs to ensure the delivery system is ready to meet future chal-lenges, including through reform of sub-national governance arrangements andreforming the planning process for major transport projects by introducing anew Independent Planning Commission to take decisions on projects of strate-gic importance. (Eddington, 2006: 7)
The fragmented nature of the UK rail industry and the absence of a singlebody, like the SRA at the time, to represent it probably makes cooperationbetween industries even harder to achieve. In addition to that, as Perl (1998)recognised in the case of CDG, parallel organisational thinking is also nec-essary to promote inter-organisational collaboration between the air andrail industries, and such ‘thinking’ seems to be absent in the case of the UKair and rail industries.
In conclusion, in countries with large airports and a developed railnetwork, airports should be a stop on the main rail lines. This approach isin line with securing air transport socioeconomic benefits and limiting itsenvironmental impact. Air and rail transport infrastructure should not bedeveloped in isolation from each other. One way to achieve this is to recog-nise large airports as cities, where the role and function of these cities in aregional–economic perspective depend on their connection to the surfacetransport network.
ACKNOWLEDGEMENT
We are grateful for Martijn Smit for producing the maps.
NOTES
1. This section is based on Givoni and Banister (2007).2. The public sector body responsible, following privatisation of British Rail, for setting the
strategy for the development of the UK railways. In 2004, the closure of the SRA wasannounced as part of plans for restructuring the UK railway industry.
3. Written by Sir Rod Eddington, former CEO of British Airways.4. The index included attributes such as the number of trips generated from the station,
number of trips attracted to the station, and the level of service provided. The level of
Rail infrastructure at major European hub airports 301

service was measured by a generalised travel time indicator which accounts for service fre-quency and travel time, including penalties for having to transfer, to all other stations onthe network.
5. In the case of the HST services to CDG, the financial burden was split as follows: SNCFpaid for the track (probably since even without the airport station the line would have beenbuilt) and the station was paid for by ADP (45 per cent), SNCF (45 per cent) and the Ile-de-France region (10 per cent) (Perl, 1998).
6. The TIPP project reached these conclusions mainly based on the case study of Finland(case study 7), but it seems to apply to the UK as well.
REFERENCES
Atkins (2004), High Speed Line Study – Summary Report, October, www.dft.gov.uk/stellent/groups/dft_railways/documents/page/dft_railways_032564.pdf(24/02/2005).
BAA (2002), Heathrow Delivering for London and the Regions: A Surface AccessStrategy for Heathrow – The Next Five Years, BAA, Annual Progress Report, May.
Black, W.A. (2003), Transportation – A Geographical Analysis, London: TheGuilford Press.
Borger, B. de and S. Proost (2007), ‘Transport pricing when several governmentscompete for transport tax revenues’, in P. Rietveld and R. Stough (eds),Institutions and Sustainable Transport: Regulatory Reform in AdvancedEconomies, Cheltenham, UK and Northampton, MA, USA: Edward Elgar:211–30.
Brown, R. (2004), High Speed Rail in the UK: Achievements and Prospects, ILTAndré Bénard Lecture by Eurostar Chief Executive, Cavendish ConferenceCentre, London, 6 May.
Buchanan and Partners (1995), Optimising Rail/Air Intermodality in Europe,European Commission – DG VII, London, November.
CAA, Civil Aviation Authority (2005), CAP 754 UK Regional Air Services, CAAEconomic Regulation Group, February, www.caa.co.uk/docs/33/CAP754.pdf(28/11/2005).
Crossrail (2005), www.crossrail.co.uk (23/02/2005).Debrezion, G. (2006), Railway Impacts on Real Estate Prices, PhD thesis,
Amsterdam: Vrije Universiteit.DETR (Department of the Environment, Transport and the Regions) (1998), A
New Deal for Transport: Better for Everyone – The Government’s White Paper onthe Future of Transport, London: DETR, July.
DfT (Department for Transport) (2003a), The Future Development of Air Transportin the United Kingdom: South East, 2nd edn, London: Department for Transport,February.
DfT (Department for Transport) (2003b), The Future of Air Transport, White Paper,London: Department for Transport, December.
Eddington, R. (2006), The Eddington Transport Study – The Case for Action: SirRod Eddington’s Advice to Government, London, December.
Givoni, M. (2005), ‘Aircraft and high speed train substitution: the case for airlineand railway integration’, unpublished PhD thesis, London: University College.
Givoni, M. and D. Banister (2006), ‘Airline and railway integration’, TransportPolicy, 13: 386–97.
302 Innovation, competition and institutions

Givoni, M. and D. Banister (2007), ‘The role of the railways in the future of airtransport’, Transportation Planning and Technology, 30 (1): 95–112.
House of Commons Transport Committee (2003), Aviation, House of CommonsTransport Committee, Sixth Report of Session 2002–03, Volume I, HC 454-I,London: The Stationery Office, July.
IARO (International Air Rail Organization) (1998), Air Rail Links – Guide to BestPractice, International Air Rail Organization, Air Transport Action Group,Airports Council International, September.
IATA (International Air Transport Association) (2003), Air/Rail IntermodalityStudy, IATA, February.
KLM, Air Traffic Control and Schiphol Group (2006), ‘Connecting cities – a strongmainport to sustain the Netherlands’ competitive edge’, in W. Salet (ed.), Synergyin Urban Networks? European Perspectives and Randstad Holland, The Hague:Sdu Publishers: 111–35.
Mayor of London and Transport for London (2006), Transport 2025 – TransportVision for a Growing World City, London, November, www.tfl.gov.uk/tfl/downloads/pdf/T2025-new.pdf (07/01/2007).
Mott MacDonald (2003), Key European Hubs – Comparison of Aviation Policy,Mott MacDonald, Report to the House of Commons – Transport SelectCommittee, May, www.parliament.uk/parliamentary_committees/transport_committee/transport_committee_reports_and_publications.cfm (18/06/2003).
Nash, C. (2005), ‘Privatisation in transport’, in K.J. Button and D.A. Hensher (eds),Handbook of Transport Strategy, Policy and Institutions, Amsterdam: Elsevier:97–114.
Niskanen, E. (2005), Towards Efficient and Effective Implementation of TransportPolicy, TIPP Final Report, November.
Perl, A. (1998), ‘Redesigning an airport for international competitiveness: thepolitics of administrative innovation at CDG’, Journal of Air TransportManagement, 4: 189–99.
Rietveld, P. and F. Bruinsma (1998), Is Transport Infrastructure Effective?, Berlin:Springer.
Stubbs, J. and F. Jegede (1998), ‘The integration of rail and air transport in Britain’,Journal of Transport Geography, 6 (1): 53–67.
SRA (Strategic Rail Authority) (2003), Statement by SRA – The FutureDevelopment of Air Transport in the United Kingdom: South East, SRA, June.
Vandermeer, R.Q.C. (2001), The Heathrow Terminal Five and AssociatedPublic Inquiries – Main Report, Department for Transport, Local Governmentand the Regions, November, www.planning.dtlr.gov.uk/callins/terminal5/pdf/mainrep 01.pdf and www.planning.dtlr.gov.uk/callins/terminal5/pdf/mainrep 02.pdf (22/12/2001).
Van Wijk, M. (2007), ‘Airports as Cityports in the city region’, NetherlandsGeographical Studies, 353, Utrecht.
Zembri, P. (2007), ‘The spatial consequences of air transport deregulation: anoverview of the French case since 1995’, in M. van Geenhuizen, A. Reggiani andP. Rietveld (eds), Policy Analysis of Transport Networks, Aldershot, UK:Ashgate: 235–56.
Rail infrastructure at major European hub airports 303

15. Drawing institutional lessonsacross countries on makingtransport infrastructure policyW. Martin de Jong
15.1 INTRODUCTION
The growth of the global movement of people, goods and data has, in itswake, increased transnational policy dependence and the exchange ofknowledge and information among policy-makers and specialists. Bothbilateral learning by representatives of one country from another and mul-tilateral learning within transnational expert networks in Europe and else-where have made the phenomenon of ‘policy transfer’ or ‘institutionaltransplantation’ across countries and regions more salient (Dolowitz, 1999;Rose, 1993; 2005; Stone, 2000; 2004; Van Bueren et al., 2002; De Jong et al.,2002; De Jong and Edelenbos, 2007). Policy-makers rate the performanceof their own countries in terms of investment levels, congestion levels,modal split and many other indicators against that of their neighbours, andattempt to copy elements from the institutional framework of countriesthey consider their benchmarks. In the world of transport infrastructureinvestment the proponents of comprehensive policy analysis may admirethe German ‘Standardisierte Bewertung’ (‘standardised appraisal’), whichhas been in existence there for decades and want to emulate its proceduresat home (De Jong and Geerlings, 2005). Those with a strong preference fordirect democracy may choose to study the Swiss or Californian practices ofconsulting individual voters on specific transport issues through the ballotbox. Those reluctant to accept high levels of public spending in publictransport are more favourably inclined towards a purely economicapproach to investment and look at the practice of involving the privatesector which occurs in the UK (Nash and Preston, 1991; Pakkala, 2002).Singapore’s transit system and its curbs on free motor vehicle ownership,on the other hand, are a source of inspiration for those who believe in alter-native forms of globalisation and the responsible use of natural resources(Cervero, 1998).
304

The cross-national transplantation of policy ideas and arrangementsholds both opportunities for the improvement of the performance of one’sown policy system and serious institutional challenges when it comes to theviability of the transplant in its new environment. The opportunities derivefrom the fact that one’s own country has in the course of its own historicalpath developed its own particular solutions to investment challenges, withall their advantages and disadvantages. Since other countries have followedother paths, they are likely to have found other path-dependent solutions tothe same or similar policy problems. Policy ideas, models and institutionstaken from elsewhere therefore represent a promising, handy and relativelycheap source of inspiration for institutional self-improvement (Rose, 2005).Copying, imitation or even the transformed adoption of ideas, models orinstitutions from elsewhere is, however, not something that occurs auto-matically by decree. It is highly improbable, especially if they are solelydecreed, that such transplants will fulfil their function properly and be suc-cessfully deployed in their new institutional environment (Watson, 1993;Jacoby, 2000). The policy issues that the country of adoption is faced withmay not be the same. The availability of funds to make investment pro-grammes a success may be lacking. The legal context in which new regula-tions have to operate may differ fundamentally from how they worked in thecountry of origin. Policy-makers and citizens in the adopting country maybe decidedly less or more respectful of institutional rules. The customers oftransport services may, alternatively, have completely different preferenceswhen it comes to choosing their transport mode or price/quality considera-tions. If cities in South Africa desire a subway system as in New York orWashington DC, will they be able to gather the required financial meanstogether for such a large-scale construction and refurbishment? Policy-makers in countries in continental Europe hoping to adopt the UK plan-ning policy guidelines for environmental issues to boost the flexibility oftheir decision-making processes are likely to encounter problems, particu-larly if they want to give them a similar function at home. Their legalsystems are stricter about the distinction between what is official legislationand what is not. Similarly, transport authorities in Northern Europe com-mitted to the introduction of toll roads along the lines of Southern Europeand Latin America to cover the funds necessary for their construction mayfind that in countries where no such tradition of péage or pedágio exists,public resistance completely thwarts their initiatives. Policy transplantation,therefore, involves many subtleties which cannot lightly be discarded.
In this chapter, the question of how to learn constructively from othercountries on promising institutional arrangements for investment in trans-port infrastructures is addressed by considering the following sub-questions, each in a separate section:
Drawing institutional lessons across countries 305
● How do existing institutional structures affect the viability of trans-planting policy ideas, models and institutions from elsewhere? What areinstitutional structures, what do they consist of and how do theyaffect the behaviour of public and private actors involved in thepolicy-making process? And, as a consequence, when a new institu-tional element is introduced into the system, what reactions can beexpected? The above issues will be the subject of Section 15.2.
● What types of institutional structures exist in reality in the world ofdecision-making on transport infrastructures and what are their char-acteristics? We systematically study the essential characteristics ofinstitutional systems and provide a general typology of institutionalstructures for investing in road and rail infrastructure, as well asstudying how they impact on actor behaviour in these systems. Thissubject is dealt with in Section 15.3.
● What examples can be given of promising policy transplants from aselection of European countries and what challenges would their adop-tion probably pose in other countries? The knowledge acquired inSections 15.2 and 15.3 will be of great help in answering this partic-ular sub-question, since a prediction of actor behaviour in the adopt-ing country and legal, cultural and other challenges resulting fromthe types of institutional structure in the country is relevant here,along with idiosyncratic aspects for the specific case at hand. Thesub-question is dealt with in Section 15.4.
● What are general dos and don’ts in policy transplantation regarding thedecision-making on transport infrastructure projects that can begleaned from this chapter? These concluding lessons will be drawn inSection 15.5.
15.2 INSTITUTIONAL STRUCTURES AND THEIREFFECT ON POLICY TRANSPLANTATION
Policy actors do not think and act in a void when they draw up plans, allo-cate funds, negotiate and make choices. Their thoughts and actions arestrongly influenced by both formal and informal heuristics or rules of thegame telling them what is and what is not allowed, what is and what is notappropriate or adequate in specific circumstances, what is the correct thingto do and what is not (March and Olsen, 1989). Even though at first sightit may seem that such ‘institutions’ are an impediment to intelligent orflexible action, the fact that they allow actors to make choices in an estab-lished, routine manner is a definite advantage. Institutions are often solu-tions that were found to similar problems in the past, making it unnecessary
306 Innovation, competition and institutions

to reinvent the wheel each time one is presented with the same or verysimilar problems (Nelson and Winter, 1982; North, 1990; Mantzavinos,2004). Time and attention, which are always limited, can then be directedto new problems for which clear-cut solutions have not yet been found.
The more conspicuous institutions have a formal character, meaning thatthey have been given a visible legal or organisational form. Or, put differently,governmental or other authorities have taken them through a process ofofficial enactment as a result of which they have achieved formal applicabil-ity. All legislation regarding investment in transport infrastructure and com-monly known organisational structures are a reality for policy actors andrepresent the formal rules of the game in this field. This applies to the prop-erty rights, powers and competencies each of the actors has been granted inthe policy area, how the service rates for customers of public transport facil-ities or roads are to be determined, which companies are shareholders forwhat percentages in public or private transport enterprises, what environ-mental and noise zonings have to be respected in new and existing runwaysor port terminals, and so on. It is the formal institutions that are often dis-cussed in political debates and it is to them that policy-makers often turnwhen they want to change or overturn existing policies or develop completelynew policies and policy instruments.
There is also, however, something that could be described as the culturalside to the institutional structure: the informal institutions. Informal insti-tutions have never been officially enacted and can rarely be found in anyguidebook on rules and heuristics, but they do have a strong impact on howpolicy actors behave towards each other, to what extent and in what formthey exchange information when formal regulations require them to, if andhow they sanction civilians and citizens who do not comply with officialnorms. They can encourage actors to compensate the loss of sensitive areasby ‘planting new forests’ even if this is not laid down in any public law oract. Informal institutions can take the shape of conventions, moral codesor social norms: actors feel compelled to follow them or are pushed byothers to follow them, but if not backed up by formal institutions, they arenot enforceable.
Formal and informal institutions can either reinforce each other, have noimpact on each other or can weaken each other’s effects. If the first is thecase, then official policies and regulations can expect solid support frompolicy actors and affected groups in the policy area and there is littleimpetus to change anything. If the second option applies, no complicationsarise as long as informal institutions are not sabotaged by small defectingminorities (in which case an outcry for formal arrangements is likely toarise) or as long as the enforcement of formal institutions is not hamperedby large-scale informal evasion (in which case authorities will either revoke
Drawing institutional lessons across countries 307

the policy or invest heavily in enforcement measures). If formal institutionsand informal institutions work against each other and push in oppositedirections, one can speak of ‘incongruence’. Policy-makers could theneither (1) decide to strictly enforce the formal institutions and thus evokestrong public resistance and make themselves unpopular, or (2) fail toenforce without officially renouncing the policy and leave things as they are,which is the easiest option and happens most frequently, or (3) officiallyrevoke the policy and give in to the dominance of informal institutions,which means acknowledging policy failure.
Congruence between formal and informal institutions, therefore, or thelack of it, has major repercussions on the viability and effectiveness of newpolicies.
An interesting example to demonstrate this point is that of a particularmeasure taken in metropolises suffering from smog in hot summers. It hasbecome common to curb motor vehicle use in such periods by allowing cardrivers with even number-plates to drive on one half of the day and thosewith odd numbers on the other half. The typical Scandinavian publicpolicy-maker imposing such a rule will meet with a comparatively benevo-lent public and a critically respectful attitude towards this emergencymeasure. Other policy actors will react mildly and citizens will comply,because informal compliance with formal regulation is high, by and large.The city government of a typical South European or Latin Americanmetropolis will be confronted with a very different situation, however.These countries are known for much lower rates of interpersonal and inter-organisational trust, and low faith in the operations of their public author-ities. Many car users there will anticipate these new policies differently andensure that they have two number-plates available in their garage, one withan even number for half the days and one with an odd number for the otherhalf. In Scandinavian culture such behaviour may be judged irresponsible,but most Latins think that it is clever and admire agile ways of evading gov-ernment regulation. Combating this behaviour is quite a challenge. Strictenforcement is costly, practically demanding, complicated and highlyunpopular. As a consequence, the necessary follow-up to make the policymeasures really environmentally effective is hard to implement. One can seethat the adoption of similar formal institutions in two different informalinstitutional environments has a hugely different effect in the two places.
Exactly this congruence (or lack of it) between the formal regulatoryframework and the informal institutional environment in which it has tofunction becomes crucial in exercises of policy transplantation. One couldconsider the adoption of a foreign policy idea, model or institution to be aspecific subset of all policy changes, namely those inspired by examples takenfrom abroad (Rose, 2005). Even if the example were successful in its country
308 Innovation, competition and institutions
of origin, it is far from certain that it would lead to the same achievementsin its country of adoption. There, in contradistinction to the circumstancesin the model country, financial means to effectively implement an action pro-gramme may be lacking, the positive effects of a new legal framework maynot arise but the interaction with necessary auxiliary regulations is differentand less helpful, the cultural values and norms regarding the desirability andacceptability of using public transport by the more privileged may bedifferent, or practical or geographical issues may prevent similar positiveeffects from appearing. Normally, institutional systems have particularstrengths and weaknesses making the implantation of specific types of trans-plants possible, but not others. Many Dutch policy-makers in the area oftransport infrastructure investment, for instance, have long admired thecomprehensive German appraisal method for evaluating infrastructure pro-jects, based on social cost–benefit analysis, and especially its systematicapplication and actual political impact on the decision-making processes(Bundesministerium für Verkehr, 1993). They saw it as comparing quite pos-itively with their own practice (until recently, when a home-grown economicmodel obtained wide recognition and became institutionalised) in whichsome more limited models were only used some of the time for some deci-sions. Yet, at the same time they praised the flexibility of their own institu-tional structure and the prevalence of political primacy, while the Germansystem in their eyes was characterised by rigidity and technocracy. But onecannot eat one’s cake and have it too. If German policy-makers are willingto accept the outcomes of studies that only experts can completely under-stand and base their decisions on them, it is because they feel politically com-mitted to these studies and hold on to their outcomes even when this is lessconvenient. This inherently implies a certain level of consistency and beliefin analytical procedures, which is less common in the Netherlands.Conversely, German policy-makers have regularly expressed their delight inthe looseness and flexibility of Dutch decision-making practice, but it isprobable that, where they are confronted with the regular adjustments andchanges in direction common in the Netherlands, they will find them oppor-tunistic, sloppy and ‘not serious’.
Congruence can also become an issue when formal institutions are trans-planted from countries belonging to another political or legal ‘family ofnations’ (Castles, 1993; Zweigert and Kötz, 1998; Newman and Thornley,1996; Lijphart, 1999). In such cases, pieces of new legislation or organisa-tional framework do not fit easily with other endogenous institutions andwill become alien, often dysfunctional, bodies in their new environment.UK planning policy guidelines regarding transport planning, for instance,which are commonly praised for their flexible use at home (in a common-law country working on the basis of precedent law), become much stricter
Drawing institutional lessons across countries 309

legislation when incorporated in continental civil-law systems. There, the‘law’ is simply to be applied and enforced. Guidelines then cease to be‘guidelines’ in the UK sense of the word.
Congruence, both between formal and informal institutions and betweenold and new formal institutions is an important issue and not somethingthat develops automatically. Lack of congruence between the originalpolicy transplant and the informal institutional environment does nothowever make transfer impossible, since the form in which the original idea,model or institution is adopted is susceptible to adaptation to make it suit-able for its new context. In previous work, the author has distinguished sixfactors which, if taken into consideration, are conducive to minimising thisincongruence and making successful transplantation more likely (De Jonget al., 2002):
1. One model or several models If the idea, model or set of formal insti-tutions is taken from just one country, too much value is attached toone particular problem-solving approach and chances are missed tolearn from a wider array of solution repertoires. Developing creativesyntheses from various models is preferable.
2. Literal copying or free interpretation If the idea, model or set of insti-tutions is copied literally, no attempt is made to bend and adjust it topreferences and perceptions of relevant players and institutional con-ditions in the adopting country. Creative interpretation is also prefer-able since it allows policy actors more space for necessary political andconceptual manoeuvres during negotiations.
3. Detailed legal framework or general idea If detailed procedures arestudied for adoption, the odds are that implementation issues will befocused on even before a fundamental debate on the why and how ofthe transplant has taken place. Using a general approach as a source ofinspiration allows policy actors in the adopting country to mould themodel in their own way and increase its functionality.
4. Business as usual or strong sense of urgency If there is a strong senseof urgency in the adopting country, meaning that the institutionalsystem and its performance are felt to be in a state of crisis (or if suchfeelings can be evoked), the position of those wanting change isstrengthened and that of the defenders of the status quo weakened.
5. Adjustment for structural and cultural differences If the legal and polit-ical systems (formal institutions) and the cultural norms and values(informal institutions) in the country adopting a transplant are com-paratively similar to those in the country of origin, adoption is likely tobe easier. However, in both cases serious discounting of even small andsubtle institutional differences is necessary to avoid policy failure.
310 Innovation, competition and institutions

6. Pushed by donor or pulled in by adopter If changes in the adoptingcountry are pushed too strongly by policy-makers from the donor,resistance among potential opponents is more likely to develop and theposition of proponents compromised by all-too-enthusiastic outsidersknowing what’s ‘best for you’. Adopting actors who pull in and evalu-ate options independently and accept only solicited advice fare better.
Below, we shall bear in mind the clues for successful policy transplanta-tion when looking at the promising foreign ideas, models and institutionsfor investing in transport infrastructure.
15.3 TYPES OF INSTITUTIONAL STRUCTURESFOR INVESTING IN TRANSPORTINFRASTRUCTURES
In a study conducted for the Dutch Ministry of Transport by the author(Ministry of Transport, Public Works and Water Management, 1999; DeJong, 1999), which has been updated and extended with two extra countriesin De Jong and Geerlings (2005), a relatively complete picture has beengiven on the deliberation procedures and practices for the prioritisation oftransport infrastructure investments in eight Western countries. The analy-sis distinguished the following four institutional dimensions, based on 30characteristics (see Appendix 15.1), for which the institutional structures inthe countries were tested:
1. Federalism–unitarism: the more a country’s institutional structureencourages administrative layers other than the top layers to organiseveto powers against proposals initiated by the top layers and the moreinitiatives they can take, the more federalist a country is. Higher levelsof federalism imply higher level of checks and balances in an institu-tional system when it comes to the creation of information.
2. Democracy–technocracy: the more the institutional structure encour-ages societal groups – pressure groups and citizens – to question expertjudgement from professional or academic circles, the more democratica country is. High levels of democracy also imply higher levels ofchecks and balances in an institutional system when it comes to the cre-ation of information.
High scores on dimensions (1) and (2) reflect high levels of checks and bal-ances in the institutional structure and therefore a much more even distri-bution of power among actors.
Drawing institutional lessons across countries 311

3. Integralism–reductionism: the more the institutional structure pro-motes the involvement of as many infrastructure-related aspects aspossible in trade-off issues, the more integralist a country is. Higherlevels of integralism imply that a greater variety of information deliv-ered to the institutional system is effectively taken into account whenchoices are made.
4. Corporatism–pluralism: the more the institutional structure encouragesactors to feel obliged to each other after reaching agreement and there-fore to adopt a less opportunistic attitude towards each other, the morecorporatist a country is. Higher levels of corporatism imply that agreater variety of information delivered to the institutional system andeffectively taken into account when choices are made.
High scores on the dimensions (3) and (4) reflect stronger incentives forcooperation, thereby increasing levels of information exchange and therealisation of co-productions with various parties contributing toprojects.
The scores of the eight countries (Sweden, Denmark, Germany,Netherlands, Switzerland, France, the UK and the USA) on each of thefour dimensions were obtained at an ordinal scale (high, medium, low) andare shown in Table 15.1.
Although some similar patterns can be observed when these scores arecompared with the families-of-nations typology developed by severalauthors mentioned above, the scores in this table are specific for the field oftransport infrastructure investments and can be placed at the policy sectorrather than constitutional level.
Table 15.1 becomes more meaningful when it is placed in the context oftypes of institutional structures, in which interaction between players/
312 Innovation, competition and institutions
Table 15.1 Institutional characteristics of eight countries regardinginfrastructure policy
Country/dimension Federalism Democracy Integralism Corporatism
Sweden MEDIUM MEDIUM HIGH HIGHDenmark MEDIUM MEDIUM MEDIUM MEDIUMGermany MEDIUM MEDIUM HIGH HIGHNetherlands LOW MEDIUM MEDIUM MEDIUMSwitzerland MEDIUM HIGH HIGH HIGHFrance MEDIUM LOW MEDIUM MEDIUMUK LOW LOW LOW LOWUSA HIGH HIGH LOW LOW

organisations occurs along different patterns. Four types of institutionalstructures can be distinguished, shown in Table 15.2. Here, we can see thatdimensions (1) and (2) (on checks and balances) constitute one axis anddimensions (3) and (4) (on cooperation) the other.
The four types of institutional structures distinguished in Table 15.2 canbe described as follows.
Type 1. Cooperative Interactors
This type of institutional system has a wide range of interdependentactors, who also maintain durable relationships. It demands a combina-tion of creation of various ideas and extensive sharing of them. Bothchecks and balances and cooperative structures have been realised,leading to a high degree of information exchange over time betweenactors. This limits the extent to which actors ‘blind one another withscience’ during the evaluation process, since they can acquire clear insightinto each other’s calculation methods. The standardisation, acceptanceand wide applicability of the models allow them to be used repeatedlywithout the need for continual redesign or modification to deal with newcases.
Type 2. Benevolent Dictators
This type of institutional system comprises relatively few actorsmonopolising most of the resources, who maintain lasting relationshipswith each other. As a market form, one could claim that this structureresembles an oligopoly with strong cartel formation. Information comesfrom only a small number of sources, but it is widely shared. Actors havecooperative inclinations, but power is not really evenly spread amongthem.
Drawing institutional lessons across countries 313
Table 15.2 Four types of institutional structures
Key aspects as to the use Many checks and Monopoloid powerof information balances structure
Incentives for cooperation Type 1 Type 2Cooperative interactors Benevolent dictators
Incentives for competition Type 3 Type 4Individualist competitors Hierarchical determinators
Source: De Jong (2001).

Type 3. Individualist Competitors
This institutional system comprises a very wide range of actors, who main-tain only volatile relations between themselves. As a market form, thisstructure resembles a market with a relatively large number of players onthe supply and demand sides, who do not succeed in reaching collusion oragreement because these are mainly focused on direct individual utility.There is a great deal of individual innovation, but this innovation is onlystandardised after the event or not at all. There are a great many checks andbalances, but cooperative structures among the actors are missing.
Type 4. Hierarchical Determinators
This institutional system has a relatively small number of different actorsof which one or two dominate the debate. Moreover, these actors maintainfew relationships. A dominant market leader sets the agenda and tries toimpose it on the other actors without the need or willingness to listen to anyof them. He/she is focused on direct utility and the speed of decision-making.
Connecting the data obtained in Tables 15.1 and 15.2 led us to concludethat Sweden, Switzerland and Germany come closest to approaching insti-tutional structure type 1, the USA to type 3 and the UK to type 4.
The Swiss and German institutional structures are rather federal, demo-cratic, integralist and corporatist. In terms of informal behaviour, Swissand German policy-makers rarely deviate from their formal structure.Before acceptance the formal structure takes a long time to mature, butthen fits well with the informal structures. Reasoning in the UK is muchmore hierarchical and automatically departs from the informal structure.British policy-makers, especially English ones, are prepared to adapt theformal structure if the informal structure so requires. What is strikingfor the USA is the high democracy score. Perhaps contradictory to theidea that exists about the functioning of representative democracy, directdemocracy appears to be alive and kicking. The ethos of individualfreedom and property rights is translated into informal practice; that astructure sometimes appears to be missing is hardly a problem. Just as strik-ing is the strong resemblance to the UK regarding the integralism and cor-poratism indices, and the extreme differences on federalism and democracy.The combination of the distribution of power and competitive orientationleads to fundamentally different politics than a combination of power con-centration and competitiveness. Despite cultural similarities between thetwo Anglo-Saxon states, the differences in state and organisational struc-ture have major consequences.
314 Innovation, competition and institutions

The positions of Denmark, France and the Netherlands are slightly morecomplicated because the Netherlands and France cross each other when itcomes to federalism and democracy. French citizens and pressure groups arerelatively less powerful, but lower tiers of government can bar central gov-ernment decisions better through a system of osmosis and double functions.The Netherlands has more provisions for citizens to speak out their opin-ions, but provinces and municipalities have hardly any funds when it comesto transport investments. France and the Netherlands, each other’s mirrorimages, are improbable candidates for a type 1 or type 3 position, but bothcould swing to be types 2 or 4, depending on the circumstances.
Denmark appears to have medium scores on all dimensions. BothSweden and Denmark have a stronger tradition of local autonomy than theNetherlands (Rose and Stahlberg, 2002) and in addition to that, Sweden isalso more integralist and corporatist. The latter is evident mainly from theconcreteness and reliability of agreements, similar to those in Germany.Cervero’s case study of the Stockholm metro (1998) offers a splendidexample: it is a kind of model state, whose policy models and approachesare either difficult or impossible to imitate. Denmark is explicitly known assomewhat less strictly managed and ‘more liberal’ than Sweden (Leleur,1995). Its scores on integralism and corporatism indicate this and bringDenmark closer to flexible and opportunist practice. This is clear from bothCervero’s case study of Copenhagen (1998) and from Flyvbjerg’s study intodecision-making in Aalborg (1998).
As is now clear, cross-national institutional variety essentially refers tohaving different positions in the table of types of institutional structures.Regularly having similar scores in them, such as Germany and Switzerland,does not mean having exactly the same formal and informal decision-making institutions, but it does mean that styles of decision-making areroughly comparable and that a transplant is likely to be received in more orless the same way in both countries. As mentioned before, the success ofcross-national institutional transfers is not guaranteed. The fit with the restof the institutional framework must be reasonable to good, and the con-comitant informal practices must grow around it to make it effective andprevent it from becoming a paper tiger.
15.4 EXAMPLES OF PROMISING POLICYTRANSPLANTS AND HINTS FOR THEIRSUCCESSFUL ADOPTION
In this section, stylised descriptions of four potentially promising insti-tutional transplants are offered, taken from different countries. The
Drawing institutional lessons across countries 315
advantages in their countries of origin are given, after which some well-reasoned speculations are made regarding adoption of those transplantselsewhere and what it would take to make them operate successfully. Thesefour promising transplants are:
1. Public referenda on infrastructure initiatives or complete investmentpackages.
2. Public procurement policies for the selection of private funding andcontracting.
3. Institutionalised appraisal methods developed in an interactive multi-actor process.
4. Five-year plan-contracts with earmarked budgets between state andregions.
The usefulness of the characterisation of types of institutional structuresfor fathoming the feasibility and possible congruence of institutional trans-plants will then become apparent.
1. Public Referenda on Infrastructure Initiatives or Complete InvestmentPackages
The strongest forms of direct democracy worldwide can be found inSwitzerland and some states in the USA, such as California. Their scoreson the relevant institutional dimension in Section 15.3 also made this pointclearly, and they are strongly embedded in national or regional adminis-trative cultures with decade- or sometimes century-old traditions. Theintroduction of referenda or propositions submitted to the ballot box else-where is therefore no sine cura. Switzerland, for instance, has not one butactually three types of non-consultative referenda in the field of transportinfrastructure. These are (1) public votes on investment packages exceedingcertain amounts of public sums made obligatory by law, (2) votes onrunning government actions forced through by certain numbers of citizensshowing support through their signatures and (3) votes on policy initiativesproposed by citizens who managed to garner a certain number of support-ing signatures.
Much can be said in favour of the above form of radical democratisation.Public debate is stimulated, citizens are made more responsible for whattheir governments do and feel more connected to them. Referenda of thistype are also a successful tool to bring deeply felt public emotions or dis-satisfaction out into the open in a controlled fashion when the political andbureaucratic classes have remained impervious to them. A radical policychange in the field of infrastructure investment occurred, for instance, when
316 Innovation, competition and institutions

through a Volksinitiativ (people’s initiative) the Swiss electorate decided toban freight lorries exceeding 28 tons, often foreign ones from using Swissmotorways through sometimes environmentally sensitive areas. Theoutcome was both courageous and inconvenient for the Swiss government,who saw its relations with European partners endangered and felt compelledto have all lorries transported on piggyback trains through the Alps, requir-ing huge investments in an Alpine tunnel system. The investment packageresulting from this new government initiative required public approvalthrough a referendum, which was granted for an amount of 16 billion Swissfrancs. Unfortunately, when the construction costs proved to exceed theapproved budget by far, this pushed public officials to economise but alsomade them apprehensive about whether they should seek renewed publicapproval by referendum for this higher sum. Another referendum would notonly be costly and make postponement necessary, but what should be doneif the new proposal were to be rejected in a referendum? Direct democracycertainly strengthens the link between elector and elected, often pushesauthorities to take the voice of the public seriously and impels them to findcreative policy solutions when the budget is limited by the vote (high-speedtilting trains on existing tracks instead of constructing new tracks, forinstance). On the other hand, it may also lead to political and bureaucraticstalemates, and limited space for manoeuvre by officials.
Introduction of referenda of this sort in countries that have no strongtradition of democracy is no easy matter. The requirement to achievea ‘HIGH’ score on the democracy dimension (see Table 15.1) would notonly make this legally possible, but also create a favourable climate for it,which would curb many privileges public authorities are accustomed toand bestow greater responsibility on citizens than they are used to.Furthermore, it would require citizens to show serious interest and involve-ment in public matters to avoid irresponsible outcomes. In short, it wouldrequire public authorities, involved private parties as well as a large major-ity of the electorate to be cooperative interactors, a situation that cannothappen overnight. Lastly, it would require authorities to accept outcomesfor votes even if the initial turnout were low (say 20 per cent or less), toaccommodate the wishes of passionate minorities and convince all thatvoting does make a difference and that participation next time could bebeneficial for them. It is obvious that exact replicating of the Swiss modelor even looking only at that model is far from commendable. Each of thecountries interested in moving in that direction should also look at theCalifornian and Swiss experiences and then make proposals moulded fortheir own societies.
Drawing institutional lessons across countries 317

2. Public Procurement Policies for the Selection of Private Funding andContracting
A growing number of countries have chosen to give the private sector a muchgreater role in the design, funding, construction and maintenance of trans-port infrastructures (Flyvbjerg et al., 2003; Pakkala, 2002; Pakkala et al.,2007). The underlying philosophy is often that private companies can dothings cheaper and better, but also that there is a great deal of creative inno-vative potential left unearthed among designers, engineers and bankers ifpublic regulations determine the how and what of infrastructure develop-ment. The UK was among the first to experiment with this new line of publicmanagement, soon followed by countries such as Australia, New Zealandand later Sweden, Finland and Norway. The most radical version wasadopted in the UK, where new road and railway tracks were contracted to aprivate consortium who were to design, build, finance and operate (DBFO)them for a period of 30 years and then lease them back to the public sector.Less radical solutions were adopted in New Zealand and Australian states(generally for a period of ten years, including maintenance). Even moremoderate was the version adopted in the Nordic countries (for only three orfour years with possible extensions, with design and the rest often kept in sep-arate packages to prevent collusion, and excluding construction in the caseof Sweden where ‘public–private partnerships were never accepted politi-cally). Experiences have obviously varied in each of the countries, but expertsgenerally agree that public expenditure on transport infrastructure forsimilar projects has decreased substantially and that speed and flexibility ofdecision-making have increased. As regards innovation, creativity and theimprovement of quality performance levels, the evidence is still unclear. Thereason why these benefits have occurred is likely to have been the realisationof economies of scale by contracting with large consortia in which banks andinsurance companies, designers, construction companies, engineering firmsand consultants have joined forces. Another benefit is likely to have been thedisplacement of many risks to those private firms, who subsequently workaccording to business principles, take the benefits from the rising value ofland and real estate around new infrastructure links, and ensure that possi-ble commercial activities around these links are exploited to the full. Listedas a final gain is the fact that these procurement constructions often allow forthe introduction of tolls, through which the user rather than the taxpayer ischarged for transport services. The latter depends, however, on the specificinstitutional arrangement chosen, for the Nordic counties continue to refundthe private consortium through the public purse.
This is not to say that there are no public policy risks involved in thismove towards increased private sector involvement. Three main arguments
318 Innovation, competition and institutions

are relevant here. Concerns have been raised about the tendency of cartelsto develop between the few contractors involved in this business. InSweden, one case of illegal price agreements was proven (De Jong, 2003),and few would deny that this market can be characterised as strongly oli-gopolistic. This places special responsibilities on procurement offices andcompetition regulators. Second, certain policy goals as agreed in plans andpublic statements (promotion of intermodal policies, optimisation oftransport network effects, most environment-friendly option chosen) can intheory all be upheld in negotiations between the procurement agency andcontractors, but they can be compromised in the final contracts. Even ifthey are included, they may be ignored with relative impunity since inter-vening in the way in which contracts are respected is not easy. Finally,public policy concerns and priorities may and will change in the course ofthe years: the further the public sector has distanced itself from directinvolvement with infrastructure projects, the fewer the chances that any(financially affordable) intervention and infraction in the contract is possi-ble to accommodate these concerns and interests.
Transplantation of public procurement in its various forms as describedabove has been popular since the late 1990s. Many of the institutional char-acteristics in the corporatism dimension have been altered in a morecompetitive, individualistic direction. In fact, the various Anglo-Saxoncountries have eyed each other closely, and the Nordic states have studiedboth the Anglo-Saxon and each other’s models. Australia’s and NewZealand’s arrangements are rather similar, and so are Finland’s andNorway’s. In all of these cases, the precepts for successful policy trans-plantation were taken into account. This was often because the initiativeswere pushed forward in periods of financial crisis, generic action pro-grammes rather than legal procedures were followed, and because variousalternative models were studied. In the case of the Nordic countries, theNordic Road Federation proved a useful forum for a systematic exchangeof experiences. The decision-making logic underlying this sort of institu-tional transplant shows a tendency towards stronger incentives for compe-tition, meaning that it should work best in individualist competitor orhierarchical determinator types of institutional structures. Although it istrue that this form of transplant certainly originated there, it has alsocaught on in some Nordic countries (not Sweden) and is under considera-tion in some countries in continental Europe. Adoption there will probablyprove less easy, since it will require countries to alter central features in theintegralism and corporatism dimensions that they may be quite attached to,such as integrated transport planning and soft and warm relations amongvarious actors. On the other hand, the solutions found in some Nordiccountries which have made these relations more business-like and distant,
Drawing institutional lessons across countries 319
but not a modern form of cut-throat competition, will presumably begreeted with more enthusiasm than the UK model.
3. Institutionalised Appraisal Methods Developed in an InteractiveMulti-actor Process
In order to make the investment choice from among multiple alternatives,some form of evaluation and weighing is always necessary. Even though theactual decision-making is to a very large extent a political and interest-ridden decision, appraisal methods are nearly always used to generate anoverview of the effects of various options. In relatively politicised institu-tional systems such as France, analytical studies may be conducted, but inactual practice (as opposed to the world of paper) their outcomes play arelatively minor role when political priorities are set in the negotiationprocess among various policy actors. In more technocratic systems such asthe German one, on the other hand, political decision-makers show a highlevel of commitment to the outcomes of integrated analytical policystudies. Whereas the former increase the chances of producing negotiatednonsense enjoying a substantial amount of political support, the latterseverely restrict decision-makers’ freedom of manoeuvre to accommodateinformation not contained in the study or obliges them to sell alternativesthat may not arouse much excitement among other actors.
In some places, such as in certain Metropolitan Planning Organizations(MPOs) in the USA, and in certain states in Australia and Finland, anintriguing middle ground has been sought and found by having a publicagency take the initiative in setting up a process to develop an appraisalmethod or evaluation procedure in which the indicators or criteria weredeveloped and ultimately approved by all the involved actors in the field, bothpublic and private. In Northern California, for instance, the regional MPOsfor the San Francisco Bay Area hosted brainstorming and interactive deci-sion processes in which local governments, counties, port and airport author-ities, the state government, transport companies and social, environmentaland business pressure groups collectively developed an appraisal methodsuitable for their region. In the first instance, all were invited to contribute theevaluation criteria on which they wanted projects submitted for funding tobe judged. Later on, all actors participated in a voting procedure in whichthey were to decide collectively which of these criteria were to be incorpo-rated in a generally applicable appraisal model and what weight each of themwould get. This resulted in a report comprising a comprehensive list of crite-ria for which projects submitted to the MPO could score a certain number ofpoints. The total number of points scored would decide whether the submit-ted project would qualify for funding and what priority it should get.
320 Innovation, competition and institutions
The outcomes of this and similar other interactive appraisal method devel-opment processes are remarkable for a number of reasons. The appraisalmethod generated was, in terms of its contents, quite different from tradi-tional ones based on cost–benefit economics. It consisted sometimes of verypractical elements, such as the sizes and heights of bridges, or the presenceof money reserved for environmental compensation measures. Second, aftersome bargaining all involved actors in the region agreed to apply the MPOconsistently to all submitted projects. In response to this process, the State ofCalifornia took the unusual step of devolving all funds for projects ofregional size to the MPO and giving it free rein as long as it spent the fundsin accordance with the agreed method. In addition, some other actors in theregion also entrusted their funds for investment in infrastructure to the MPO,making it a real regional pooling of funds. Finally, during the process soli-darity among the various actors had grown enormously, even to the extentthat they considered each other partners and the transport networks in theregion an intermodal whole. Since then, several other MPOs in the USA havefollowed suit.
It is not straightforward to come up with powerful caveats against thispotentially promising transplant, other than that economists or engineeringexperts may criticise the contents of the model on scientific grounds or thatwidespread support can only be produced in quite propitious circumstances.The relevant actors in a region, state or country are not always so predis-posed to collaborate, a facilitator is not always capable of producing a usefuloutcome, and in many cases the authority responsible for funding projectsmay not be willing to give up its own discretion on allocation decisions. Onthe other hand, once a critical mass of support has been generated for suchan initiative, social pressure on opponents will rise and they may end upgetting committed. Interestingly, as an institutional transplant, the require-ments for its introduction are in fact a constellation of institutional featurestaking institutional systems generally in the direction of more federalism,more democracy, more integralism and more corporatism. The choice infavour of these changes will, however, almost always follow after theappraisal method and the regional solidarity have been created, when theclimate for making the required formal institutional changes will havebecome much better. The final result should then be a type 1 institutionalstructure (cooperative interactors), both highly desirable and hard to obtain.
4. Five-year Plan-contracts with Earmarked Budgets between State andRegions
Making a national transport plan which includes all the main existing andnewly intended infrastructure hubs and links, and connecting this plan as
Drawing institutional lessons across countries 321

consistently as possible with the actual implementation of projects, is thepreferred policy of most continental European countries, at least officially.Two of them, France and Germany, have made major strides in making thisconnection as systematic as possible, albeit under different names. Theyhave national plans in place for transport infrastructure investments, calledSchéma directeur and Bundesverkehrswegeplan, respectively, which lay outthe government’s general policy intentions for the coming decades. In these,the reader will also find a list of all the actions that the government, basedon suggestions given by various policy actors considering the future, thinkrequire serious consideration. This does not yet guarantee construction, foronly some of the projects mentioned in this national plan are actually trans-ferred to the contrat de plan (plan contract) in France or the Bedarfsplan(need plan) in Germany. The five-year agreements signed by both thenational or federal government on the one hand, and the regional or stategovernment on the other, do contain those projects whose implementationhas been secured. Not only are general sketches given of the spatial andenvironmental shape the new road, rail or waterway connection will acquireand how it is connected to the entire intermodal network; the financialarrangements for the next five years are also taken care of to make sureannual adjustments of the budget are not necessary. Since these five-yearplan contracts have been negotiated and are approved by both relevantpartners, discordance is much less likely to arise and certainty about thefinancial flux is no longer an issue.
Compared to the three previous types of promising policy transplants,this one has very different advantages and disadvantages. Particularlystrong points are the comparatively transparent overview of missing linksin the national and regional transport networks and the translation of someof them into actual projects to be implemented. Since the signatories enterinto a legally binding partnership with clear-cut financial consequencesfor many years, certainty, security and acceptance are generated in rela-tion to their implementation and construction. Haggling each year overthe funding is not necessary; only large-scale reviews after five years arerequired. The political and administrative requirements of living up to thisdemanding system are substantial, and obviate flexibility and alterationsshould actors change their opinions in the course of the process. Also,adoption of any of the previous three transplants is precluded if this systemis in place. Since this approach is rather supply-oriented, the voices oftransport users and citizens are weak and space for possible privatisationand liberalisation is limited.
Adoption of this type of transplant involves a relatively federal, inte-gralist and corporatist institutional structure. If several of those compo-nents mentioned above are already present in a disconnected fashion,
322 Innovation, competition and institutions

strong political leadership aiming for agreement to systematise the decision-making process and massaging the various governmental levels may besufficient. But should these components be largely absent, as in Anglo-Saxon countries, should the various tiers of government not consider eachother more or less as equals, or should a drive for a comprehensive consis-tent framework not exist, chances of successful introduction will be quitesmall.
Combining the second type of transplant (public procurement policiesfor the selection of private funding and contracting), requiring a more com-petitive spirit, and this one, which necessitates a more cooperative style, willbe nearly impossible to achieve.
15.5 CONCLUSIONS
Institutions and institutional systems are hard to change, but, especiallywhen policy actors feel that their performance or legitimacy is at stake, it isnot impossible. When congestion on the infrastructure networks has grownout of hand, when annual investment or maintenance costs are consideredto be out of control, or when citizens feel they should be more involved inthe decision process, drawing lessons from policies in other countries canprove helpful as a source of inspiration for institutional changes at home.This does not imply, however, that following good examples from elsewherealso results in policy successes at home. Political, legal, administrative andcultural practices differ among countries, and so do their economic, geo-graphical and practical potential. In the end, each country can benefitimmensely from experiences abroad, but policy actors will always have totake into account that a transplant has to function in a particular institu-tional context, in its own practical circumstances and in collaboration withother domestic policy actors. If policy models are copied literally andwithout giving due consideration to necessary amendments, the chances ofsuccess are low. The four examples of promising policy transplantsdescribed in Section 15.4 – (1) public referenda on infrastructure initiativesor complete investment packages; (2) public procurement policies for theselection of private funding and contracting; (3) institutionalised appraisalmethods developed in interactive multi-actor process; and (4) five-year plancontracts with earmarked budgets between state and regions – reflect verydifferent developmental institutional trajectories and were derived fromvery different national examples. All four may prove invaluable sources ofinspiration for policy entrepreneurs apt to provoke changes in theirnational systems for infrastructure decision-making, albeit in quitedifferent directions. But in none of them can transfer be considered as
Drawing institutional lessons across countries 323

automatic. It requires political and policy struggles among proponents andopponents, and in all cases intelligent thought and careful manoeuvring innegotiations, which leads the transplants to deviate substantially from theirexamples. Since histories, needs and preferences also differ, this is a bless-ing rather than a curse.
APPENDIX 15.1 LIST OF INSTITUTIONALCHARACTERISTICS
FED (federalism index): DEM (democracy index):
11. Number of financing actors 16. Role of referenda12. Importance of territorial 17. Room for participation
distribution procedures13. Importance of consultation 18. Openness of societal discussion
rounds 9. Role of societal groups on 14. Juridical role of sub-national 1 assessment criteria
government 10. Representative role of public 15. Organising role of regional authorities
authorities
INT (integralism index): COR (corporatism index):
11. Interdepartmental nature of 21. Intermodal nature of plansplans 22. Intermodal nature of legislation
12. Formal importance of 23. Importance of actor environmental impact reports commitment
13. Informal importance of 24. Formal role of assessment environmental impact reports procedures
14. Broadness of assessment 25. Importance of prior framework standardisation
15. Importance of spatial 26. Promoting network effectstranslation 27. Equal distribution over modes
16. Belief in the supply approach 28. Reliability of financial promises17. Public nature of reports 29. Avoidance of privatisation 18. Nature of public–economic tendencies
prioritisation 30. Strength relationship 19. Importance of assessment in infrastructure – servicing
territorial context20. Extensive formulation of
assessment criteria
324 Innovation, competition and institutions

REFERENCES
Bundesministerium für Verkehr (1993), Gesamtwirtschaftliche Bewertung vonVerkehrswegeinvestitionen; Bewertungsverfahren für den Bundesverkehrswegeplan1992, Schriftenreihe, Heft 72, Bonn.
Castles, F.G. (1993), Families of Nations: Patterns of Public Policy in WesternNations, Aldershot, UK: Dartmouth.
Cervero, Robert (1998), The Transit Metropolis: A Global Inquiry, New York: IslandPress.
Dolowitz, D. (1999), Policy Transfer and British Social Policy: Learning from theUSA, Buckingham, UK: Open University Press.
Flyvbjerg, Bent (1998), Rationality and Power: Democracy in Practice, Chicago andLondon: The University of Chicago Press.
Flyvbjerg, Bent, Nils Bruzelius and Werner Rothengather (2003), Mega-projects andRisk: An Anatomy of Ambition, Cambridge, MA: Cambridge University Press.
Jacoby, Wade (2000), Imitation and Politics: Redesigning Modern Germany, NewYork: Cornell University Press.
Jong, Martin de (1999), Institutional Transplantation: How to Adopt Good TransportInfrastructure Decision-making Ideas from Other Countries, Delft: Eburon Press.
Jong, Martin de (2001), ‘The impact of institutional structures on transport infra-structure performance: a cross-national comparison on various indicators’,European Journal of Transport and Infrastructure Research, 1 (2): 169–96.
Jong, Martin de (2003), ‘Wegenonderhoud in Zweden en Finland’, in Ernst tenHeuvelhof, Martin de Jong, Martijn Kuit and Helen Stout (eds), Infrastratego:Strategisch Gedrag in Infrastructuurgebonden Nutssectoren, Utrecht: Lemma,pp. 99–114 (in Dutch).
Jong, Martin de and Jurian Edelenbos (2007), ‘An insider’s look into policy trans-fer in transnational expert networks’, European Planning Studies, 15 (5): 687–706.
Jong, Martin de and Harry Geerlings (2005), ‘Exchanging experiences betweenDenmark and the Netherlands on transport infrastructure policies’, InternationalJournal of Technology, Policy and Management, 5 (2): 181–99.
Jong, Martin de, Konstantinos Lalenis and Virginie Mamadouh (2002), The Theoryand Practice of Institutional Transplantation. Experiences with the Transfer ofPolicy Institutions, Dordrecht/London/Boston: Kluwer Academic Publishers.
Leleur, Steen (1995), Road Infrastructure Planning: a Decision-Oriented Approach,Lyngby: Polyteknisk Forlag.
Lijphart, A. (1999), Patterns of Democracy: Governance Forms and Performance in36 Countries, New York and London: Yale University Press.
Mantzavinos, C. (2004), Individuals, Institutions and Markets, Cambridge, MA:Cambridge University Press.
March, James G. and Johan P. Olsen (1989), Rediscovering Institutions, New York:The Free Press.
Ministry of Transport, Public Works and Water Management (Ministerie vanVerkeer en Waterstaat) (1999), International Comparison of Decision-Making onInfrastructure, Research Series of the Directorate for Strategy and Coordination,The Hague.
Nash, C. and J. Preston (1991), ‘Appraisal of rail investment projects, recent Britishexperience’, Transport Reviews, 11 (4): 295–309.
Nelson, R.R. and S.G. Winter (1982), An Evolutionary Theory of Economic Change,Cambridge, MA: The Belknap Press of Harvard University.
Drawing institutional lessons across countries 325

Newman, P. and A. Thornley (1996), Urban Planning in Europe: InternationalCompetition, National Systems and Planning Projects, London: Routledge.
North, Douglas, C. (1990), Institutions, Institutional Change and EconomicPerformance, Cambridge, MA: Cambridge University Press.
Pakkala, Pekka (2002), Innovative Project Delivery Methods for Infrastructure: AnInternational Perspective, Helsinki: Finnish Road Enterprise.
Pakkala, Pekka, Martin de Jong and Juha Aijo (2007), Performance Indicators andInnovative Contracting for Roads – International Results, Helsinki/Delft: FinnishRoad Administration/Foundation Next Generation Infrastructures.
Rose, L.E. and K. Stahlberg (2002), ‘De Noordse landen: het “beloofde land” voorhet lokaal bestuur’, Bestuurswetenschappen, 6: 525–44.
Rose, Richard (1993), Lesson-Drawing in Public Policy: A Guide to Learning AcrossTime and Space, London: Chatham House.
Rose, Richard (2005), Learning Lessons in Comparative Public Policy: A Guide toAnalysis, London: Routledge.
Stone, Diane (2000), ‘Non-governmental policy transfer: the strategies of indepen-dent policy institutes’, Governance: An International Journal of Policy andAdministration, 13 (1): 45–70.
Stone, D. (2004), ‘Transfer agents and global networks in the “transnation-alization” of policy’, Journal of European Public Policy, 11 (3): 545–66.
Van Bueren, Ellen, Frederic Bougrain and Thomas Knorr-Siedow (2002),‘Sustainable neighbourhood rehabilitation in Europe: from simple toolbox tomultilateral learning’, in M. de Jong, K. Lalenis and V. Mamadouh (eds), TheTheory and Practice of Institutional Transplantation: Experiences with theTransfer of Policy Institutions, Dordrecht/London/Boston: Kluwer AcademicPublishers, pp. 263–82.
Watson, Alan (1993), Legal Transplants: An Approach to Comparative Law, Athensand London: The University of Georgia Press.
Zweigert, K. and H. Kötz (1998), An Introduction to Comparative Law, Oxford:Clarendon Press.
326 Innovation, competition and institutions

accountabilitydecision-making on mega-projects
9–10, 178, 202, 203large engineering projects 160, 168mega-projects 182, 219of project managers 182public–private partnership (PPP)
205–6transport infrastructure projects
138–9Affuso, L. 9, 110airports, rail links to see rail links to
airportsAkintoye, A. and M. Beck 192, 197Altshuler, A. and D. Luberoff 4–5, 11,
24, 105, 176, 240appraisal methods
decision-making on mega-projects76–80, 108–10, 114–15, 224,320–21
transport infrastructure projects76–80, 108–10, 114–15
Argentina, build, operate and transfer(BOT) contracts 194–5
Aschauer, D.A. 68, 75Australia
build, operate and transfer (BOT)contracts 199, 202–3
institutional transport investmentstructures 320
Melbourne City Link project 199,202–3
public–private partnership (PPP) 190,197, 199, 200, 202–3, 318, 319
Sydney Airlink project 202Sydney M2 Motorway 202
Austriamotorway and expressway network
223New Austrian Tunnelling Method 26TEN (Trans-European Network)
high-priority projects 231
Banister, D. and J. Berechman 107, 116Bates, J. 52Bel, G. and X. Fageda 223Belgium
Brussels Airport 287, 292TEN (Trans-European Network)
high-priority projects 231Bell, R. 84, 105Bemelmans-Videc, M. 181Bennet, E. and P. Grohmann 192, 193,
195Biehl, D. 68Black, W. 300Bloomfield, P. 200Boardman, A. 198, 200Bonnafous, A. and Y. Crozet 9, 110Borger, B. and S. Proost 285Brazil
ITA power plant 157Tucurui dam 169
Bröcker, J. 74, 75Brockner, J. and J. Rubin 12, 116Brooks, J. and P. Trevelyan 121Brown, R. 299Bruzelius, N. 4, 7–8, 40, 47, 48, 50, 52,
84, 87, 105, 116, 121, 137, 138,147, 176, 182, 189, 192, 195, 197,207, 217, 218, 233, 318
build–operate–transfer (BOT) schemes,large engineering projects 157,159, 194–5, 197, 198, 199, 202–3
Bulgaria, design, build, finance,operate (DBFO) contract 198
Button, K. 41
Cabanatuan, M. 254, 255Canada
cost overruns 131, 132infrastructure projects, Nova Scotia
197Montreal–Ottawa high-speed rail
corridor 222
327
Index

public–private partnership (PPP)197, 198–9, 200
rail links to airports, number of 281water projects 202
Castles, F. 309Cerasoli, R. 37Cervero, R. 304, 315Chang, M. 193China
build, operate and transfer (BOT)contracts 197, 198
maglev train connection, Shanghai89
sewage treatment plants 193–4Chisholm, D. 36Ciccone, A. 71city revitalisation projects 196, 197Cleland, D. 24, 154competition
economic impact on 70, 77, 78,139–40, 220
imperfect 69–70, 71–2, 74, 77, 78lack of, public–private partnership
(PPP) 204–5, 219, 319rail links to airports 284–5, 288,
289–90, 293–4, 295–9and railway systems, dedicated
263–80contested information see mega-
projects and contestedinformation
contractsconcession, public–private
partnership (PPP) 194, 195,198, 200, 207, 219, 223
concession, railway systems,dedicated 271–2, 275
dependence, ex post 206–7five-year plan 321–3‘hold-up’ phenomenon 207public–private partnership (PPP)
192–5, 200, 201, 204, 205–7,223, 318
railway systems, dedicated 264–70,273, 278
renegotiation 207cost overruns
decision-making on mega-projects11–12, 131, 132, 216
large engineering projects 163
cost–benefit analysesmanagement characteristics of
mega-projects, problems with23, 24
mega-projects 40, 216, 221–2, 224,226, 227–8
OEI directives 91private risk capital 220public planning calculations 217public–private partnership (PPP)
195, 207, 216–17, 220transport infrastructure projects see
transport infrastructureprojects, cost–benefit analysis
de Bruijn, Hans 23–39, 84–101, 205de Jong, W. Martin 304–26De Ridder, H. 265Debrezion, G. 292decision-making on mega-projects
accountability 9–10, 178, 202, 203appraisal methods 11, 76–80,
108–10, 114–15, 224, 320–21Bay Area model 36budget overruns 11–12, 131, 132,
216common pitfalls 4–12contested information see mega-
projects and contestedinformation
cost estimation 7–8, 178, 184, 185,186, 187
and cost–benefit analysis seecost–benefit analysis
front-end phase 177–8, 179, 180–81,183–7
government support 5, 12, 31, 35–6,114–15, 140, 178
IMEC study see large engineeringprojects
implementation phase 178, 179international planning 11large engineering projects see large
engineering projectsmanagement characteristics 24, 34–6misinformation 7–8, 184pork-barrel policies 189problem analysis, valid 107–8, 116,
178–81problem, focussing on 106–7
328 Index

project alternatives, consideration of187
project management 178, 179, 183–7public–private partnership (PPP)
192, 202–3, 319quality checks 9, 10, 184, 186research into 11risk management 6–7, 11, 115SDM (system dynamic models)
software 228sponsorship 6staged approach 105–19, 224, 227systems analysis 110–15tactical and strategic, differences
between 177–8, 179–81and technological sublime see
technological sublimetransport infrastructure projects see
transport infrastructure projectsDenmark
Great Belt Bridge and Tunnel 216Great Belt toll bridge 195institutional transport investment
structures 312, 315Ørestad Metro Line 273–4Oeresund tunnel 195, 216public–private partnerships (PPP)
196road vehicles, inaccuracy in
forecasting 129TEN (Trans-European Network)
high-priority projects 231design, build, finance, operate (DBFO)
contracts, public–privatepartnership (PPP) 194, 197, 198,199, 204, 219, 220, 318
design, build, operate and maintain(DBOM), railway systems,dedicated 265–6, 268, 270, 271,277–8
Dodgson, J. 67Dolowitz, D. 304Donahue, J. 263Dorland, C. and H. Jansen 53Douglas, M. and A. Wildavsky 85Duivesteijn Commission (TCI) 11–12Dupuit, J. 67
Eddington, R. 301Eijgenraam, C. 12, 116
Elhorst, J. 51, 76, 79, 116Etzioni, A. 94Europe
air transport deregulation 295ASTRA-T modules and interfaces
229–31, 234BEACON project 55CGEurope model 46, 75cost overruns 131, 132cross-border projects 55emissions regulations 53–4European Framework Programme
227HEATCO project 55HST network 295IASON project 227institutional framework 304, 305institutional transport investment
structures 311–15, 321–2mega-projects bias 10public–private partnership (PPP)
190–92, 196–7, 199–202, 204–7,219, 318–20
rail links to airports, number of 281rail transport decision-making
transparency 9–10rail transport investment 8–9, 268,
270–75RAILPAG study 223–4road vehicles, inaccuracy in
forecasting 129SMCP-tolls projects 232TEN (Trans-European Network)
high-priority projects 75, 79,231–3
TIPMAC project 227, 230, 231, 232TIPP project 296–7vertical integration of rail systems
263see also individual countries
Eyre, N. 53
financial risklarge engineering projects 149–51,
159–61, 163, 164, 167–71, 184–6Private Finance Initiative (PFI) 190,
194, 196, 197, 199, 201, 205, 209and public–private partnership
(PPP) 192–4, 198–202, 204–7,217, 219–20, 222, 223
Index 329

Findeisen, W. and E. Quade 112, 115,116
Finlanddesign, build, finance, operate
(DBFO) contracts 197institutional transport investment
structures 320Lathi Motorway 197Private Finance Initiative (PFI) 197public–private partnership (PPP)
318, 319–20TEN (Trans-European Network)
high-priority projects 231Fitzgerald, P. 200Flyvbjerg, Bent 1–20, 48, 85, 92, 114,
120–44, 258, 259, 315with N. Bruzelius and W.
Rothengatter 4, 7–8, 40, 47, 50,84, 87, 105, 116, 147, 176, 182,197, 207, 217, 218, 233, 318
Fouracre, P. 121France
CDG Airport, profile of 286, 287,293–6
CDG Airport rail link 282, 283, 284,289, 292, 293, 297, 299
Channel Tunnel 32, 79, 207, 216, 223HST rail network 9, 88, 293–4,
295–6, 299institutional transport investment
structures 312, 315, 320, 322light rail systems 10Paris–Lyon TGV 88public–private partnership (PPP)
197RER connection to CDG 282, 293Rouen metro concession 271TEN (Trans-European Network)
high-priority projects 231TGV Air services 294, 295–6toll roads 196–7water and sewage 198
Frick, Karen Trapenberg 239–62Fujita, M. and J. Thisse 69, 71Fullerton, B. and S. Openshaw 121
GermanyBavaria maglev project 221design, build, finance, operate
(DBFO) contracts 197
Dortmund subway tunnel 37Frankfurt Airport 226Frankfurt Airport rail link 283, 284,
289, 292, 293, 299Hamburg–Berlin maglev project 221Herrentunnel, Lübeck 30institutional framework 304, 309institutional transport investment
structures 312, 314, 315, 320,322
Munich II airport terminal 220Munich Transrapid Airport Shuttle
221, 222Nordhein–Westfalen Metrorapid
maglev project 221, 222road and rail projects 9, 197, 215TEN (Trans-European Network)
high-priority projects 231transport infrastructure investment
evaluation scheme 221, 309Warnow tunnel 87
Gille, J. 57, 62Givoni, Moshe 281–303governability
large engineering projects 146–7,151, 152, 158–9, 162–71
political problems, untamed, mega-projects and contestedinformation 86, 90
governmentperformance standards,
public–private partnership(PPP) 192–3
regulation, front-end governance ofmega-projects 181–2
support, decision-making on mega-projects 5, 12, 31, 35–6, 114–15,140, 178
see also institutional effectsGraham, D. 71, 77, 78Gramlich, E. 68–9Gray, J. 197Greece, TEN (Trans-European
Network) high-priority projects231
Gunn, H. 41, 52, 74, 77
Haarmeyer, D. and D. Coy 198Hall, J. 199, 200Hall, P. 1, 24, 84, 121
330 Index

Hann, N. and T. Mack 265, 266Hay, A. 79Hayashi, Y. and H. Morisugi 40Heinitz, F. 225Hodge, G. 190, 199, 202Hong Kong
build, operate and invest (BOT)contracts 197
Cross Harbour Tunnel (CHT) 197Hoppe, R. 93Hughes, T. 147Hungary, M1 project 219hydroelectric power systems 149, 175,
180
ICT projects, Weigh in Motion 29IMEC study see large engineering
projectsinnovation
planning mega-projects 215–38and public–private partnership
(PPP) 192, 201, 202, 205, 318technology and management
characteristics of mega-projects26–7, 30, 34, 37
innovation, institutional 218–20constraint logic programming (CLP)
225–6consultant risk-taking 221–2dynamic assessment of mega-
projects 227–33mediation process 225–6risk allocation strategies 222–3shareholder integration 220–21stakeholder preferences 223–6
institutional effectsbenevolent dictators 313cooperative interactors 313corporatism–pluralism 312–13, 314,
315, 319, 324cross-national lessons 304–26democracy–technocracy 311,
312–13, 314, 315, 316–17, 324federalism–unitarism 311, 312–13,
314, 315, 324five-year plan contracts 321–3hierarchical determinators 313,
314individualist competitors 313, 314,
319
institutionalised appraisal methods320–21
integralism–reductionism 312–13,314, 315, 319, 324
investment structures 311–15public–private partnership (PPP)
195rail links to airports 296–9structures, types of 313–15transplants 309–11, 315–23transport investment structures
307–9, 311–15, 320, 321–2see also government
institutional risks, large engineeringprojects 149, 150, 151, 152,159–60, 161, 164, 168
Ireland, TEN (Trans-EuropeanNetwork) high-priority projects231
Italyhigh-speed rail links 232TEN (Trans-European Network)
high-priority projects 231,232
Jacoby, W. 305Japan
build, operate and invest (BOT)contracts 197
high-speed rail projects 9, 88highway developments, regional
impact 76Narita Airport, Tokyo rail link 282,
284Three Power Source Laws System
160Jara-Diaz, S. 67, 69Jasanoff, S. 92Johnson, R. and A. Moore 198Johnston, J. and B. Romzek 202Johnstone, N. and L. Wood 189, 190,
191, 195, 207Joosten, W. 189, 204
Kahneman, D 133, 134–5, 136, 258Kain, J. 121Klijn, E.-H. 195, 196, 199, 201Koning, M. 53Koopmans, C. and E. Kroes 59Koppenjan, Joop 189–212
Index 331

Korea, build, operate and invest (BOT)contracts 197, 198
Krugman, P. 69Kumaraswamy, M. and X. Zhang 197
Laird, J. 79Lakshmanan, T. and W. Anderson 235Lam, T. and K. Small 52large engineering projects
accountability 160, 168action strategies 157allocation strategies 156, 158, 167build–operate–transfer (BOT)
schemes 157, 159, 194–5, 197,198, 199, 202–3
closure process 165, 168–9co-optation strategies 156, 158, 159cohesion and governability 158completion risks 149, 150, 151construction risks 149, 150contingency allowances 158contract length 158–9, 161, 170cost overruns 163cost-reimbursement contracts 157countering forces, dealing with
164–5decisioneering approaches 154,
162–3, 164, 169design strategies 157, 158development costs 154economic-dispatch formulas 157evolutionary nature of 162–71execution risks 150financial risks 149–51, 159–61, 163,
164, 167–71, 184–6flexibility 158–9, 160governability 146–7, 151, 152, 158–9,
162–71IMEC study outline 5–7, 147–8, 176,
181information/selection strategies 155initiation and exploration 167institutional risks 149, 150, 151, 152,
159–60, 161, 164, 168knowledge accumulation 170–71legitimacy enhancement 160, 164long-term investment stabilisation
159–60market-related risks 149, 150, 151,
159
momentum building 164operational risks 149, 150, 151opportunity failures and oversights
152, 163performance measurement 163portfolio diversification 161power-purchase agreements 160price-determination formulas 156–7probabilistic approaches 154proposal development 167–8real-options framework 145, 146,
164–5regulatory risks 149, 150, 151, 157,
165, 167residual risks 161–2response generation 159risk management 145–72risk management, approaches to
152–62, 169risks, nature of 148–52sensitivity analysis 154shaping episodes 163–4, 165–7, 168,
169social-acceptability risks 151, 152,
160, 168sovereign risks 149, 150, 151sponsorship 146, 150, 151, 153, 154,
158–61, 163–5, 167, 168, 170–71staffing considerations 169–70stakeholder involvement 156, 157,
160, 161, 164, 167strategic systems, robust 154–7supply risks 149, 150technical risks 149, 150, 151turbulence 151–2, 158, 160, 161, 163
Leijten, Martijn 23–39, 84–101, 204,205
Leleur, S. 315Lerner, A. 36Lessard, Donald R. 4, 5–7, 33, 145–72,
176, 181Letza, S. 263Li, B. and A. Akintoye 191Liedtke, G. 225Lijphart, A. 309Lindblom, C. and D. Cohen 93List, F. 215Lovallo, D. and D. Kahnemann 133,
134–5, 136Low, B. 36
332 Index

Luxembourg, TEN (Trans-EuropeanNetwork) high-priority projects231
Lynde, C. and J. Richmond 68
McCormick, E. 247, 257Mackie, P. and J. Preston 10, 112Mackinder, I. and S. Evans 121maglev technology 50, 58, 76, 89, 202,
221, 222Malaysia, build, operate and invest
(BOT) contracts 197management characteristics of mega-
projectsaccountability 182blocking power, external 32, 35–6command-and-control approach 34cost-effectiveness problems 23, 24decision-making process 24, 34–6fallback options 29functionality of project 29future orientation, lack of 23implementation management 33–7incremental implementation 29–30interaction 33–4and organisational redundancy 36–7process design 33–4process versus project approach 34–6project design robustness 25–6, 35project divisibility 27, 30project opposition, external 33–4project transformation time 32radical implementation 29–30social complexity 23, 24, 30–34task separation 36–7technical complexity 23, 24–30, 32,
33–4, 36–7and technology, innovative 26–7, 30,
34, 37and technology, proven 26–7tight or loose coupling 28–9uncertainty management 32–4, 35–7user dependence 30–31user preferences 31–2
Mantzavinos, C. 307March, J. and J. Olsen 306Martin, L. 199Marx, L. 239, 242Meadows, D. 229mega-projects
accountability 182, 219characteristics 240–41contractual arrangements 178, 179,
217, 221, 222cost overruns 175, 187, 216, 217cost–benefit analysis 40, 216, 221–2,
224, 226, 227–8decision-making see decision-
makingdesign criteria for governance regime
182economic impact analysis 227, 234–5effectiveness 175–6, 179, 180, 181efficiency in 173–4, 175, 179ex-ante evaluation 40–65expert involvement 94–5, 96, 97–8,
139, 184–5failure of 176, 177, 180, 181feasibility study 222, 224, 226front-end governance (regulation)
181–2impact 175, 179, 180innovation, institutional see
innovation, institutionalinnovation in planning 215–38large engineering projects see large
engineering projectslife cycle 176–8, 182management characteristics see
management characteristics ofmega-projects
operational phase 178paradox 182procurement scheme 217–18, 221public planning of 120–44and public–private partnerships
(PPP) see public–privatepartnerships (PPP)
relevance 175, 178, 179–80risk management 145–72, 182stakeholders 176–8, 180, 181, 183,
186, 218sustainability 175, 179, 180system dynamic modelling (SDM)
and truth-telling 233–5tactical and strategic performance
174–6, 177, 179, 180TEN (Trans-European Network)
high priority projects 75, 79,231–3
Index 333

mega-projects and contestedinformation
consensus building 95–6, 98, 114contested information, accumulation
of 91–2data and future analysis 87, 90decision-making 90–92, 95–8definition of 85–6ethical problems 85–6expert involvement 94–5, 96, 97–8,
139facts 86–9, 92, 96methods for dealing with 87, 92–8misinformation see misinformationnegotiated knowledge 91–2, 93–6,
97–8normative standards 89–90optimisations 88–9, 90political problems, untamed 86, 90process incentives 97–8process management 96–7project company procurement
scheme 204, 218–19rationality, procedural and
interactive 93, 94–5scientific problems 86, 87stakeholder involvement 91–2, 96,
98, 139, 241, 255strategic misrepresentation 92, 93,
136–8system boundaries 88, 90tamed problems 85trade-offs 89–90uncertainty 86unfreezing information 94–5
Megginson, W. and J. Netter 263Mexico
motorway construction 197public–private partnership (PPP)
197Miller, Roger 4, 5–7, 33, 145–72, 147,
148–9, 176, 181, 182Miser, H. and E. Quade 111–12, 113,
116misinformation
contested information see mega-projects and contestedinformation
and decision-making on mega-projects 7–8, 184
strategic misrepresentation 92, 93,136–8
system dynamic modelling (SDM)and truth-telling 233–5
Miyagi, T. 76Morris, P. and G. Hough 34, 105Mulder, M. 277
Nash, C 297, 304Nelson, R. and S. Winter 307Netherlands
Betuwe Freight Railway Link 11, 12,49, 108–9, 114, 202
C2000 emergency services project30–31
design, build, finance, operate(DBFO) contract 198, 204
do-no-harm approach 11Duivesteijn Commission (TCI)
11–12Eastern Scheldt Storm Surge Barrier
32government control of transport
297–8Green Heart Tunnel 11, 33High Speed Rail Link 11, 12, 76,
109, 114, 200, 201, 202, 204,205, 271, 275–6, 292, 299
institutional transport investmentstructures 312, 315
institutional framework 309motorway conversion (A59)
199–200, 204Private Finance Initiative (PFI) 197project finance 11–12public–private partnership (PPP)
190, 196, 199–200, 201, 202,204, 205, 206–7
RAEM model 46road project (N31) 200, 204road tunnels 200sale-and-leaseback constructions
198Schiphol Airport, Amsterdam,
profile of 286, 287, 290–93Schiphol Airport, Amsterdam rail
link 284, 296, 298, 299Souterrain tram tunnel project, The
Hague 28Superbus track 110
334 Index

TEN (Trans-European Network)high-priority projects 231, 232
transport infrastructure appraisal108, 232, 309
Tweede Heinenoordtunnel 26urban development projects 206–7wastewater treatment, Delfland 198water and sewage 198Westerscheldt Tunnel 195Zuiderzee Link (high-speed between
Amsterdam and Groningen)109, 114, 202
New Zealand, public–privatepartnership (PPP) 318, 319
Newman, P. and A. Thornley 309Newton, P. 53Nijkamp, P. and B. Ubbels 121Nilsson, J. 110Niskanen, E. 297Noordsij, R. and H. de Bruijn 90North, D. 307Norway
ASTRA-T modules and interfaces229–31
hydroelectric power projects 175, 180international development projects’
study 180mega-projects, front-end governance
improvements 183–7onshore torpedo battery 176, 179Oslo national university hospital
175, 179public–private partnership (PPP)
318, 319–20Royal Ministry of Finance system
170Trondheim Airport air traffic control
centre 175–6, 179–80nuclear power projects, risk
management 149Nye, D. 239, 242
Odeck, J. 40oil platforms, risk management 149,
150Oosterhaven, J. 46, 60, 76, 79, 116Osborne, S. 190
Pakkala, P. 304, 318Perl, A. 295, 296, 297, 300–301
Philippinesbuild, operate and invest (BOT)
contracts 197, 198Manila water supply 195
Pickrell, D. 7, 105, 120, 121Pigou, A. 67political risk, public–private
partnership (PPP) 207–8, 222, 223political tool, as technological sublime
243Pollit, M. 189, 190, 191, 194, 196, 199,
200, 201, 204, 205, 207Portugal
build, operate and invest (BOT)contracts 197
Private Finance Initiative (PFI) 197TEN (Trans-European Network)
high-priority projects 231, 232Priemus, Hugo 1–20, 105–19, 120Private Finance Initiative (PFI) 190,
194, 196, 197, 199, 201, 205, 209public–private partnership (PPP)
accountability 205–6alliance model 195, 196asset liability management 222–3Australia 190, 197, 199, 200, 202–3,
318, 319benefit-sharing arrangements 194bonus provisions 194build, operate and invest (BOT)
194–5, 197, 202cartels 319cherry-picking of components 206–7choice justification 200competition, lack of 204–5, 219,
319concession contracts 194, 195, 198,
200, 207, 219, 223contract dependence, ex post 206–7contract ‘hold-up’ phenomenon
207contract renegotiation 207contractual arrangements 192–5,
200, 201, 204, 205–7, 223, 318cost effectiveness 195, 207, 216–17,
220decision-making, improved 192,
202–3, 319definition 191demand risk 222, 223
Index 335

design, build, finance, operate(DBFO) contracts 194, 197,198, 199, 204, 219, 220, 318
discount rates 200efficiency returns 200EGAP (everything goes according to
plan) principle 217Europe 190–92, 196–7, 199–202,
204–7, 219, 318–20expectations, living up to 196–203and financial risk 192–4, 198–202,
204–7, 217, 219–20, 222, 223formation and operation of 203–8government performance standards
192–3government-pay system 194innovation 192, 201, 202, 205, 318institutional 195introduction of, difficulties with
198–9joint ventures 195, 201, 255knowledge management 204late involvement of private parties
205motives 191–2operation, maintenance and service
contracts 192–4penalty provisions 194political risk 207–8, 222, 223Private Finance Initiative (PFI) 190,
194, 196, 197, 199, 201, 205,209
private investment 191–2private investment, realisation of
196–9private risk capital 220problems with 190procurement processes 204project company under private law
218–19project management 192, 201, 202–3quality assessment 192, 202–3, 206,
318railway systems, dedicated 266, 273,
275risk assessment 192, 202, 222–3,
318–19scoping of 219special-purpose vehicle (SPV) 195stakeholder involvement 205–6
state-owned enterprises 195system dynamic modelling (SDM)
and truth-telling 233–5toll charging 194, 195, 196–7, 318transaction costs 204transfer–operate–transfer (TOT)
arrangements 193transport infrastructure projects
79–80, 139–40, 190, 197, 318–20user-pay system 194, 198, 318value for money 192, 199–201, 203,
205, 234
quality assessmentdecision-making on mega-projects 9,
10, 184, 186public–private partnership (PPP)
192, 202–3, 206, 318Quinet, E. 110
R&D projects, risk management 149rail links to airports
air traffic demand 284–5, 288,289–90, 292
airport cities 293, 298catchment area 283–4city connection 282, 283, 287, 288,
293city metro connection 282, 283, 287,
288, 291connection types 282–5cooperation and competition 284–5,
288, 289–90, 293–4, 295–9infrastructure differences, reasons
for 296–9institutional settings 296–9major hub airports 283–4, 290–93,
299number of 281regional network connection 282–3,
288, 289, 291, 292–7, 299terminal interchange 284, 289, 296
rail projectscost estimation 7cross-border harmonisation 54–5energy use of trains 54high-speed tracks 29investment levels 8–9land-use efficiency 51light rail systems 10–11
336 Index

maglev technology 50, 58, 76, 89,202, 221, 222
power generation 55–6underground lines 33value of time (VOT) 52see also individual countries;
transport infrastructure projectsrailway systems, dedicated
additional components 266analysis framework 268–70and competition 263–80competition cases 270–75components of 266–8concession contracts 271–2, 275contracting out 265contractual arrangements 264–70,
273, 278design, build, operate and maintain
(DBOM) 265–6, 268, 270, 271,277–8
design freedom 270essential components 266fixed installations 266–8horizontal dimension 270, 275infrastructure 266, 267–8, 273, 275,
278privatisation 263–4, 265provision and management of
263–80public–private partnerships 266, 273,
275safety system 266–7service provision 267–8, 278tendering 270, 271, 273, 278unbundling 263, 277vehicles 266, 267–8, 275vertical dimension 263, 268, 270,
273, 275, 277, 278regulation see government;
institutional effectsRichmond, J. 120, 121Rietveld, Piet 52, 107, 281–303risk management
completion risks, large engineeringprojects 149, 150, 151
construction risks, large engineeringprojects 149, 150
decision-making on mega-projects6–7, 11, 115
financial risks, large engineering
projects 149–51, 159–61, 163,164, 167–71, 184–6
large engineering projects 145–72large engineering projects,
institutional risks 149, 150, 151,152, 159–60, 161, 164, 168
mega-projects 145–72, 182oil platforms 149, 150public–private partnership (PPP)
192, 202, 222–3, 318–19regulatory risks, large engineering
projects 149, 150, 151, 157, 165,167
transport infrastructure projects133–6, 137–8, 140
Rogelio, O. 229Romania, design, build, finance,
operate (DBFO) contract 198Rose, L. and K. Stahlberg 315Rose, R. 304, 305, 308–9Rothengatter, Werner 4, 7–8, 40, 47,
50, 60, 84, 87, 105, 110, 116, 121,137, 147, 176, 182, 197, 207,215–38, 318
Salter, L. 92Samset, Knut 170, 173–88Schaafsma, A. 268Schade, W. 230Shaoul, J. 200Short, J. and A. Kopp 4, 7, 8–11, 12,
105Simon, H. 27Singapore, institutional framework 304Skamris, M. 121South Africa, public–private
partnership (PPP) 190, 197South America
build, operate and transfer (BOT)contracts 194–5
contract renegotiation 207public–private partnership (PPP)
197, 207water concessions 207see also individual countries
South East Asiapublic–private partnership (PPP)
197see also individual countries
Spackman, M. 190, 191
Index 337

SpainMetro Madrid, Line 9 271–2Private Finance Initiative (PFI)
197public–private partnership (PPP)
197Pyrenees rail crossing 232rail projects 232TEN (Trans-European Network)
high-priority projects 231, 232toll roads 196–7water and sewage 198
sponsorshipdecision-making on mega-projects
6large engineering projects 146, 150,
151, 153, 154, 158–61, 163–5,167, 168, 170–71
stakeholder involvementlarge engineering projects 156, 157,
160, 161, 164, 167mega-projects 176–8, 180, 181, 183,
186, 218mega-projects and contested
information 91–2, 96, 98, 139,241, 255
public–private partnership (PPP)205–6
Stone, D. 304Stubbs, J. and F. Jegede 281, 283, 290Sweden
Arlanda rail link , Stockholm 271,282
institutional transport investmentstructures 312, 314, 315, 316,317
Oeresund tunnel 195, 216public referenda on infrastructure
initiatives 316–17public–private partnership (PPP)
318Stockholm metro 315TEN (Trans-European Network)
high-priority projects 231Switzerland
ASTRA-T modules and interfaces229–31
freight lorry restrictions 317institutional transport investment
structures 312, 314
institutional framework 304Zürich Airport rail link 284
Szliowicz, J. and A. Goetz 121
Tavasszy, Lóránt A. 40–65technological sublime
aesthetic sublime 257, 259–60ChronicleWatch, San Francisco
Chronicle 259contingency schedule uplift 258–60cost 239–62design experts 249, 257field guide to 241–3functional sublime 257future research 259–60obsolescence 242–3optimism bias uplift 258as political tool 243public design process 246–50, 258,
259–60public outreach 250reference class forecasting 257regional mega-landmark phase
247–50state tinker toy phase 247, 254–5
technological sublime, SanFrancisco–Oakland Bay Bridge239, 241–50, 251
design form and function 250–55,256–7
environmental concerns 254–5as joint venture 255observations, implications and
recommendations 255–60project definition 256–7toll charges 255
Teisman, G. 12, 94, 112Ten Heuvelhof, Ernst F. 34, 92, 96,
263–80tendering
market situation 47, 60railway systems, dedicated 270, 271,
273, 278tenders and market situation, transport
infrastructure projects 47, 60Thailand
Bangkok Elevated Transport System207
build, operate and invest (BOT)contracts 197, 198
338 Index

public–private partnership (PPP)197, 198, 207
thermal power projects, riskmanagement 149
toll chargingCalifornia roads 197France 196–7Great Belt toll bridge, Denmark 195public–private partnership (PPP)
194, 195, 196–7, 318shadow toll 194Spain 196–7
transport infrastructure projectsaccessibility 44, 69, 75, 107, 114accountability 138–9additional travel (induced demand)
category 42agglomeration effects 51, 69, 71,
72–3, 77, 78appraisal methods 76–80, 108–10,
114–15ASTRA-T modules and interfaces
229–31, 234–6benefits, methodological issues on
50–56bias in 133–6, 137–8, 140change evaluation 44–6characteristics of 240–41competition, economic impact on
70, 77, 78, 139–40, 220competition, imperfect 69–70, 71–2,
74, 77, 78construction costs estimations,
research methods 47construction period 49cost forecasting, geographic
variations 131–3cost forecasting inaccuracy 125–8,
130, 131, 139–40cost–benefit analysis see transport
infrastructure projects,cost–benefit analysis
cross-border harmonisation 54–5demand forecasting 50–51, 58, 59,
74–5, 114demand forecasting, accuracy
improvement 128–31, 133–6demand forecasting, inaccuracy in
121–5discount rates 43, 49, 56–7, 60
discount rates and taxation 79–80,110
dynamic models 60E3ME (econometric/transport)
modelling approach 227economic impact, effect of total
70–71economic impacts 45–6, 49, 50, 55,
57, 58, 67–83, 88, 89–90, 107,109, 110, 125, 220–21
economic impacts, empiricalevidence 12, 73–6
economic impacts, modelling 60–61emissions location 53–4, 89environmental impacts, non-
conventional 53–4environmental and safety aspects 43,
44, 45, 49, 50, 52–3, 55–6, 57,59, 78, 89, 90, 107, 221, 241, 308
feasibility study 222freight characteristics 41, 45, 54, 76freight demand modelling 57–8, 59good governance 138–40grants 138‘iceberg’ transport costs 76indirect effects 46, 51, 52–3, 55, 60informal institutions 307–9institutional effects see institutional
effectslabour-market effects 71–3, 74, 76,
77–8, 79–80, 89land use and demand forecasting
50–51land-use and transport interaction
(LUTI) models 46, 50–51lessons learned 215–18LGV movements 57life-cycle costs and project
alternatives 49–50life-cycle energy use and emissions
52–3maintenance and repairs 49–50mark-up of costs 69–70, 73–4microeconomic and macroeconomic
arguments 67–9network effects 57, 58–9, 75, 79–80new technology costs, uncertainty in
50, 58non-user benefits 56open space evaluation 51
Index 339

output elasticity 68–9passenger characteristics 41, 42, 45,
54, 56, 59, 76planning ethics 136–8policy robustness 54, 107policy transplantation 305, 306–11political distance 139power generation 55–6pricing policy 110private capital involvement 220problem analysis 107–8, 109–10,
114–15productivity levels 71, 72–3, 77–8professional penalties for inaccuracy
139project alternatives 49–50, 54public planning and cost estimation
120–44public procurement policies for
private funding and contracting318–20
public referenda 316–17public–private partnerships 79–80,
139–40, 190, 197, 318–20reference class forecasting 48, 133–6,
258risk reduction 133–6, 137–8, 140road types classification 44smog, dealing with 308spatial boundaries 43spatial computable general
equilibrium models (SCGE) 46,57, 60, 74–5, 76, 77–8, 227
specification changes 49subsidies, public sector 68system boundaries 88system dynamic models (SDM) 227,
228–30temporal boundaries 43TEN (Trans-European Network)
high-priority projects 231tenders and market situation 47, 60timetable changes 42–3, 49, 59travel time reliability 52, 61travel time savings 41, 42, 44–5, 52,
55, 58, 59, 72, 77, 78traveller benefits modelling via
logsums 59user’s option value 56value of time (VOT) 41, 49, 52
wage levels 72welfare considerations 42, 47, 60,
74–5, 76, 78, 231, 290see also large engineering projects;
‘rail’ headingstransport infrastructure projects, cost-
benefit analysis (CBA) 41–6, 139,217, 227–8, 231, 234–6
methodological issues 47–50modelling 44–6, 57–61, 227, 228–30,
234multi-criteria analysis (MCA) 41–2,
114–15optimism bias 48, 240popularity of 41strategic behaviour 48, 49wider economic benefits from mega-
projects 67–83Trujillo, L. 48tunnels
Channel 32, 79, 207, 223Cross Harbour Tunnel (CHT),
Hong Kong 197Dortmund subway tunnel, Germany
37Great Belt Bridge and Tunnel,
Denmark 216Herrentunnel, Lübeck, Germany
30market-related risks 150Netherlands 26, 200New Austrian Tunnelling Method 26Oeresund tunnel, Denmark 195, 216risk management 149road tunnels, Netherlands 200tram 33Tweede Heinenoordtunnel,
Netherlands 26Warnow tunnel, Germany 87Westerscheldt Tunnel, Netherlands
195
UKair–rail intermodality barriers 290,
298–9, 301Airtrack, London 288–9Channel Tunnel 32, 79, 207, 223Channel Tunnel Rail Link 196, 207,
216, 299Crossrail, London 78, 288
340 Index

Eddington Report (transport policy)289–90
Eurostar HST rail services 299Gatwick Airport rail link 283, 284,
297, 299Heathrow Airport, London, profile
of 285–90, 296, 297, 298–9Heathrow Connect, London 287,
288Heathrow Express, London 271,
282, 283, 284, 287, 288hospitals and schools projects 199,
200institutional transport investment
structures 312, 314, 318institutional framework 304, 309–10Jubilee Line extension, London 189light rail systems 10London Underground 189, 204, 207,
282, 283, 287Manchester airport rail link 283,
284, 289market restructuring 70, 74, 76, 77Piccadilly Line, London 282, 283,
287Planners’ Code of Ethics 137Prestwick airport rail station 283prison projects 199Private Finance Initiative (PFI) 190,
194, 196, 197, 199, 200, 205privatisation, effects of 297, 298public–private partnership (PPP)
190, 196, 200, 318, 319–20railway projects, early 215road projects 199, 200, 204Skye Bridge 196, 200south–north HST rail line, proposed
289Stansted Airport, London rail link
284, 297, 299TEN (Trans-European Network)
high-priority projects 231, 232transport infrastructure projects,
optimism bias 48water and sewage 198West Coast railway line 232
uncertaintymanagement 32–4, 35–7mega-projects and contested
information 86
transport infrastructure projects 50,58
Upton, D. 242USA
Boston, Central Artery/Tunnelproject 25–6, 37
Boston, Post Office Square 26build, operate and invest (BOT)
contracts 197cost overruns 131, 132electricity blackout (2003) 28–9human service contracting 199institutional transport investment
structures 312, 314, 316, 317,320–21
institutional framework 304light rail systems 10Massachusetts correctional facility
200Planners’ Code of Ethics 137project finance 12public–private partnership (PPP)
197, 198–9, 200rail links to airports, number of 281railway expansion, early 242San Francisco Bay Area 36, 320–21San Francisco–Oakland Bay Bridge
see technological sublime, SanFrancisco–Oakland Bay Bridge
Tacoma Narrows Bridge,Washington (Innovativetechnology) 27
technological sublime 242toll roads, California 197water and wastewater treatment
198–9, 202Yerba Buena Island 243, 244, 245,
247, 251, 252utilities 157
Van Bueren, E. 304Van de Velde, Didier 263–80Van de Graaf, H. 93Van Eeten, M. 97Van Gigch, J. 27Van Ham, J. and J. Koppenjan 191,
195, 201, 206Van Twist, M. 268Van Wee, Bert 1–20, 40–65, 120Van Wijk, M. 293
Index 341

Varga, A. 61Venables, A. 71, 72, 76, 77, 78Venables, A. and M. Gasiorek 51, 69,
75, 76Vickerman, Roger W. 66–83, 107, 235Vietnam, build, operate and invest
(BOT) contracts 197, 198Vollaard, B. and W. Witteveen 265
Wachs, M. 7, 48, 105, 131, 137Walker, B. and B. Walker 202Walker, C. and A. Smith 192Walmsley, D. and M. Pickett 121Wardman, M. 52wastewater treatment 193–4, 197, 198water management, and public–private
partnership (PPP) 189, 190, 196,198
Watson, A. 305
Watson, V. 137Webber, M. 121Wegener, M. and F. Fürst 50welfare considerations, transport
infrastructure projects 42, 47, 60,74–5, 76, 78, 231, 290
Wildavsky, A. 85, 93Winston, C. 263World Bank
appraisal optimism 7CBA categorization 44project success study 177state capability enhancement model
182
Yiftachel, O. 137
Zoeteman, A. 50, 278Zweigert, K. and H. Kötz 309
342 Index