decoupling case studies: revenue regulation implementation ... · decoupling case studies: revenue...
TRANSCRIPT
Decoupling Case Studies Revenue Regulation
Implementation in Six States
Authors
Janine Migden-Ostrander Betty Watson Dave Lamont Richard Sedano
Electronic copies of this paper and other RAP publications can be found on our website at wwwraponlineorg
To be added to our distribution list please send relevant contact information to
inforaponlineorg
Acknowledgements
The authors would like to thank many people who contributed to this document State reviewers included Calvin Timmerman from the Maryland PSC David Rubin and Bruce Smith from PGE Dennis Derricks of Integrys Group Nikki Karpavich
from the Idaho PUC Jeremy Newberger of National Grid Tim Woolf from Synapse Energy Economics Inc and James Griffin of the Hawaii PUC Frederick Weston and Jim Lazar reviewed the document and provided valuable feedback and John Gerhard provided research and support
Brenda Hausauer and Camille Kadoch provided project management and review
July 2014
How to Cite This PaperMigden-Ostrander J Watson B Lamont D and Sedano R (2014) Decoupling Case Studies Revenue Regulation Implementation in Six States
Montpelier VT The Regulatory Assistance Project Available at httpwwwraponlineorgdocumentdownloadid7209
Decoupling Case Studies Revenue Regulation Implementation in Six States
1
Introduction Policy Overview for Decoupling 3
Background Measuring the Success of DecouplingRevenue Regulation Mechanisms 5
California Pacific Gas and Electric Company 7
Idaho Idaho Power Company 11
Maryland Baltimore Gas and Electric 14
Wisconsin Wisconsin Public Service Corporation 16
Massachusetts National Grid 18
Hawaii Hawaiian Electric Company 20
Discussion of the Six Utilities Overall 24
Conclusions 37
Appendix 40
Table of Contents
1 We use the technical term revenue regulation rather than decoupling for two reasons First the term decoupling has multiple meanings within the utility sector with some natural gas utilities using this term to describe rate designs that recover all distribution costs in fixed recurring charges (typically monthly) an approach that is inconsistent with the long-run economics of the regulated energy sectors and specifically with the economics of end-use energy efficiency Second the term decoupling has multiple meanings out-side the utility sector most notably the description of an economy growing at a different (faster) rate than the rate of energy consumption a circumstance that is quite consistent
with the goals (and indeed generally describes the effects) of investment in energy efficiency but it does not describe a specific ratemaking regime Revenue regulation or ldquorevenue cap regulationrdquo in which the regulator establishes an allowed revenue requirement and adjusts collections so as to achieve that allowed or ldquotargetrdquo revenue irrespective of actual sales is well understood as distinct from traditional ldquopricerdquo (some-times ldquoprice caprdquo) regulation in which the regulator sets a price and lets revenues vary with sales volume Revenue regulation is one type in the broad category of performance-based regulation
Decoupling Case Studies Revenue Regulation1 Implementation
in Six States
Decoupling Case Studies Revenue Regulation Implementation in Six States
2
BGE Baltimore Gas and ElectricCPUC California Public Utilities CommissionCampI Commercial and IndustrialDG Distributed GenerationDPU Department of Public UtilitiesDSM Demand-Side ManagementFCA Fixed Cost AdjustmentGAAP Generally Accepted Accounting PracticesGRC General Rate Case HECO Hawaiian Electric CompanyIPC Idaho Power CompanykWh Kilowatt-HourMECO Maui Electric Company
OampM Operation and MaintenancePCA Power Cost AdjustmentPGE Portland General ElectricPGampE Pacific Gas and ElectricPSC Public Service CommissionPSCW Public Service Commission of WisconsinRAM Revenue Adjustment MechanismRBA Revenue Balancing AccountROE Return on EquityRPC Revenue Per CustomerRSM Revenue Stabilization MechanismTOU Time-Of-UseWPS Wisconsin Public Service Corporation
List of Acronyms
Table of TablesTable 1 Business Unit Included in the
Revenue Regulation Model 25Table 2 Test Year Used 25Table 3 Customer Classes Included in
Revenue Regulation Mechanism 27Table 4 Costs Excluded From Revenue
Regulation Mechanism 27Table 5 Type of Revenue Adjustment Mechanism 28Table 6 Tracking and Accrual of Difference
Between Actual and Authorized Revenue 29Table 7 Rate Case Requirements 32Table 8 Rate Adjustments 32Table 9 Allocation of Surplus or Deficit 32Table 10 Carrying Charges 33Table 11 Cap on Rate Adjustment 33Table 12 Complementary Policies for
Energy Efficiency 36
Table 13 Annual Incremental Energy Efficiency Savings as Percentage of Retail Sales 37
Table 14 PGE Revenue Regulation Rate Adjustments 1983 to 1993 40
Table 15 PGampE Revenue Regulation Adjustments 2005 to 2012 40
Table 16 IPC Revenue Regulation Adjustments 40Table 17a-e BGE Monthly Revenue Regulation
Adjustments 2008 to 2012 42Table 18 WPS Revenue Regulation Adjustments
2009 to 2011 45Table 19 National Grid Revenue Regulation
Adjustments 2011 to 2012 45Table 20 Hawaiian Electric Company
Revenue Regulation Adjustment 45
Table of FiguresFigure 1 Total Utility Revenue Regulation
Adjustment Rate Impacts 34Figure 2 IPC Revenue Regulation Adjustments 41
Decoupling Case Studies Revenue Regulation Implementation in Six States
3
Introduction Policy Overview for Decoupling
2 For an in-depth discussion of revenue regulation see Lazar J Shirley W amp Weston F (2011) Revenue regulation and decouplingMontpelier VT The Regulatory Assistance ProjectAvailable at wwwraponline orgdocumentdownloadid902
3 Bloomberg New Energy Finance (2011) Global Trends in Renewable Energy Investment 2011 UNEP SEFI Frankfurt School Global Trends in Renewable Energy Investment
Over the last several decades there have been major shifts away from the traditional utility service paradigm in which the local utility sup-plied customers with all their resource needs
and those resource needs were met through the construction and operation of power plants Some states have restructured their electric utilities so that the resource supply is a competi-tive service Others have maintained the traditional vertically integrated model while other states have developed hybrids combining features of each Also different today is the expec-tation that the customer demand for electricity will be pro-vided exclusively from power plants Energy efficiency as a substitute for new power plants to meet customer needs has been gaining acceptance in the regulatory world significantly during the last decade Moreover as the price of renewable resources used for distributed generation (DG) continues to decline there has been a growth in the adoption of on-site generation by customers as they demand a more diverse set of services The potential for deployment of customer-side resources of all types is large
Traditional regulatory practice creates an environment in which the utility is able to earn more profit by selling more electricity Because of this dynamic the utility is essentially in competition with the customer as well as with private sector companies that provide services to supply the energy needs of that customer This can greatly impede the ability of the marketplace to achieve the optimal least-cost solution for energy services A regulatory scheme that depends on increasing throughput as a means for achieving earnings is likely to be increasingly out of step with customer needs and desiresmdashand with public policy objectivesmdashin the coming years As the utility service environment changes so too must regulation as customers demand more and different services and as regulators increasingly encourage clean energy outcomes The growth in customer-sided resource options compounds the challenge of net lost distribution revenues for utilities especially as it affects their ability to maintain and upgrade their grid infrastructure Thus as nontraditional resources (that are neither supply options nor provided by the
utility) are proliferating revenue regulation while not a silver bullet becomes even more important as a means of managing revenues and removing utility barriers to adoption of these alternatives2
Although the concept of increasing energy efficiency and DG may be fairly straightforward the impact and reaction of electric utilities to engage in comprehensive energy efficiency and encourage DG is not Ask any business how it makes money and it will invariably respond that it does so through increasing the number of units of the products it is selling through growth Energy efficiency requires utilities to do the exact opposite of the traditional model and instead requires the utility to market and promote buying less of its product The net lost revenues that the utility will encounter as a result of these activities is no trivial matter especially as energy efficiency programs ramp up Many states have Energy Efficiency Resource Standards requiring cumulative reductions in consumption by 20 to 25 percent in the 2020 decade Others have commission-ordered energy efficiency portfolio requirements requiring similar reductions in consumption A new study cosponsored by The Edison Foundation Institute for Electric Innovation found that electric utility efficiency programs saved 126 terawatt-hours of electricity in 2012 If utilities were unable to collect two cents per kilowatt-hour (kWh) contribution to fixed costs as a result of these efficiency program savings they would experience a significant reduction in returns
The growth in DG will also impact utility sales and have a similar impact on revenue as energy efficiency According to a Bloomberg report financial investments in DG have grown from $19 billion in 2004 to $143 billion in 20103
Decoupling Case Studies Revenue Regulation Implementation in Six States
4
4 Technically the only truly ldquofixedrdquo costs for a utility are inter-est and depreciation Labor costs are technically variable costs but they vary little in the short-run in response to sales volumes Over a long time one or more decades some costs that are fixed in the short-term such as transformers and conductors are revealed to be volume- and usage-sensitive especially when assets and systems are replaced
5 Strictly speaking it is net lost revenue that is at issue To the extent that avoided sales avoid some amount of variable cost (low in the case of delivery services only) that avoided cost should be netted from the foregone gross revenue in order to calculate the correct amount of revenue that would have otherwise gone to cover the companyrsquos return of and return on investment Revenue regulation solves this problem auto-matically In contrast lost revenue adjustments require these calculations which predictably become quite contentious in the rate-making process
The onsite energy production from these investments will decrease utility sales from what they otherwise would have been and could result in absolute decreases in sales in states that have strong energy efficiency programs and low baseline growth As states pursue a more aggressive efficiency agenda there might come a point where the current rate-setting model is no longer sustainable Utilities have embedded investment-related and labor costs (not sensitive to volume)4 included in their rates to support investments already made and necessary for good service reliability safety and other utility services which are adjusted during periodic rate cases Without a mechanism in place to address the utility impact of reduced sales the lost revenues from energy efficiency programs and DG will make it more difficult for utilities to cover their fixed cost obligations and to reach their earnings targets for shareholders As a result various strategies to allow utilities to recapture these lost revenues have been developed Environmental imperatives including promotion of customer-side alternatives to utility supply motivate regulators to consider forms of regulation in which sales do not matter and utilities are motivated to find the best investments to meet public policy objectives irrespective of which side of the meter it resides or what degree of utility control is maintained
Lost revenue recovery allows utilities to recover the deficit in revenue resulting from reduced sales5 There are several mechanisms that accomplish this lost revenue adjustment mechanisms straight-fixed variable rates and revenue regulation Only one of these mechanisms decoupling - revenue regulation however accomplishes the dual goals of both removing the throughput incentive
and continuing to send more economically appropriate price signals to customers Both of these principles are key to successful energy efficiency programs6
Revenue regulation however is a not a single distinct mechanism Rather there are various elements that can be assembled in numerous ways based on state priorities and preferences that serve to eliminate the throughput incentive This publication will focus on six utilities Pacific Gas and Electric Company Idaho Power Company
6 Although this paper does not focus on the rationale for send-ing appropriate price signals references on this issue can be found at Lazar J Schwartz L and Allen R (2011) Pricing Dorsquos and Donrsquots Montpelier VT The Regulatory Assistance Project Available at wwwraponlineorgdocsRAP_Lazar_PricingDosandDonts_2011_04pdf and Lazar et al (2011)
7 For a detailed analysis of the economic and public policy rationales for revenue regulation see Lazar et al 2011 See also Shirley W Lazar J amp Weston F (2008) Revenue decoupling standards and criteria A report to the Minnesota Public Utilities Commission Montpelier VT The Regulatory Assistance Project Available at wwwraponlineorgdocsRAP_Shirley_DecouplingRevenueRpt_2008_06_30pdf
Rate adjustments under a revenue regulation scheme do not represent additional costs to ratepayers but are a reallocation of approved
recoverable costs to a changing base of retail sales Rates are set assuming a certain sales volume and many costs that do not vary with usage in the short run are collected through a volumetric sales rate When a utility engages in programs or policies that result in lower customer usage some revenues that should have offset some of these costs are not billed to customers as a result (and vice versa where usage increases) The revenue regulation adjustment tracks those lost revenues and allows recovery in a subsequent period In all cases the revenue regulation adjustment represents a reconciliation of revenues that were approved for collection from customers that were not collected as a result of changed sales volumes Revenue regulation adjustments can also result in reduced rates when excessive revenues are collected due to weather or other variations in sales amounts7
Decoupling Case Studies Revenue Regulation Implementation in Six States
5
8 Oregon Public Utility Commission Order No 09-020 p 27
Baltimore Gas and Electric Company Wisconsin Public Service Company National Grid and Hawaiian Electric Company and the different forms of revenue regulation their regulators have implemented These examples provide a range of options on how to implement revenue regulation After considering the decoupling mechanisms of numerous utilities across the nation these specific utilities were chosen in order to provide examples across many regions and also to contrast the different approaches taken by each utility to provide a broader overview of the options available in designing decoupling mechanisms and to describe how they have worked
Background Measuring the Success of DecouplingRevenue Regulation Mechanisms
A revenue regulation mechanism designed to promote energy efficiency may be viewed as successful if the utility is no longer concerned about increases and decreases in sales is no longer taking actions to increase sales or reduce decreases in sales and is improving the overall efficiency of its operations and management Although a particular mechanism can be designed to meet other goals (other performance goals with dedicated metrics and specific rewards and penalties attached) this paper is primarily concerned with mechanisms designed to mitigate revenue losses that can impede the desire of a utility to aggressively pursue programmatic energy efficiency By taking an in-depth look at six diverse utilities that have implemented revenue regulation this study describes the similarities and differences among the adopted mechanisms and attempts to answer the question of how each is working to achieve its goals
A second significant determinant of the success of a revenue regulation mechanism is its acceptance by the stakeholders This can be manifested by a lack of objection or support of revenue regulation by consumers and it can be manifested through changes in utility behavior that customers respond to Revenue regulation provides utilities who act prudently and in accordance with the mechanism assurance that they will collect their allowed revenues As a result they are better able to focus on other activities such as programmatic energy efficiency that reduces costs in the long run The utilities studied also found benefits to include providing customers with a lower-cost product improved customer interaction and other efforts as sanctioned by the regulator that will
produce additional revenue streams Indeed the Oregon Commission recognized as much when it commented on Portland General Electricrsquos (PGE) ability to influence individual customers through direct contacts and referrals The Commission also noted that PGE can influence usage depending on how aggressively it pursues DG whether it supports improvements to building codes and whether it provides timely useful information on energy efficiency programs8 Engaging actively in these programs can also help develop better customer relationships as the utility industry evolves to a more service-oriented business Instead of just handing customers a bill the utility can be providing them efficiency-based solutions that serve cumulatively to avoid more expensive ways to meet customer demand
Financial incentives for specified performancemdashrelating to energy efficiency achievements or improvements in customer service to name only twomdashare examples of ways to influence utility behavior in furtherance of public policy objectives If awarded such incentives are included in periodic adjustments to the allowed revenue One goal is to turn the utility from being a reluctant participant to being an enthusiastic advocate for (or at least not an active inhibitor of) energy efficiency while creating a stable regulatory environment to accomplish other complementary policies Moreover combining revenue regulation with performance incentives creates a stronger inducement for utilities to engage in least-cost planning which benefits its customers
Environmental groups will want to ensure that there are robust programs and policies in place that advance clean energy solutions Consumers will be cautious about rate impacts that will need to be addressed in the design of a decoupling mechanism (see text box on next page)
Striking a balance among competing stakeholder concerns while creating effective mechanisms to advance good public policy falls to the regulators and as will be seen in the six case studies there seems to be no generally accepted approach This demonstrates that revenue regulation is not a static one-size-fits-all policy but rather it can be fashioned in a number of ways to meet the needs of any given community
An additional way to evaluate the success of a revenue regulation mechanism is to look at the rate impacts and how manageable they are Most annual rate impacts from revenue regulation fall between plus or minus one to three
Decoupling Case Studies Revenue Regulation Implementation in Six States
6
9 Standard and Poorrsquos (2012 May 15) Poors Credit Matters Report
percent These impacts are generally manageable and may in fact be less than the fluctuations customers might otherwise experience with fuel adjustment clauses or under a variable generation rate Over the long term observers might expect to note avoided load-driven capital costs and other long-lived commitments
Another measurement of the success of decoupling is how the results of its implementation are viewed by financial institutions Revenue regulation can be a factor considered by the rating agencies in determining a bond rating for a utility With multiple mergers and the creation of holding companies with subsidiaries it becomes more difficult to measure this because there are multiple utility companies and affiliates in multiple states that are being evaluated Nevertheless Standard and Poors noted that revenue regulation mechanisms were a positive factor and that they would better align the interests of consumers
Some consumer groups have expressed concerns with decoupling because depending on how it is designed there could be future rate
adjustments that are not subject to the same rigorous review as would occur in a rate case Below is a list of considerations in designing revenue regulation mechanism that attempts to address those concerns
bull Making revenue regulation contingent on a robust energy efficiency commitment and portfolio
bull Requiring structural symmetry in the mechanism such that credits as well as surcharges flowing from a reconciliation be accounted for and refunded to customers
bull Creating a bandwidth around the amount of adjustment permitted in any given year
bull Adjusting the cost of capital or more appropriately the imputed capital structure to reflect lower risk and
bull Requiring periodic rate cases to assess the appropriate level of revenues for the utilitymdashwhich is helpful only if the utilityrsquos revenue requirement is set too high and does not account for downward adjustments in costs such as reduced labor expense
with utility shareholders by implementing rate designs that encourage energy efficiency9
Because revenue regulation reduces the utilityrsquos risk profile by providing revenue and earnings stability the upside can be a better credit rating from the major rating agencies Alternatively the utility may be able to retain the existing credit rating with a lower common equity ratio in its capital structure A better credit rating or lower equity ratio can translate into a lower financing rate which benefits the utility and ultimately the customers who pay for utility-financed construction projects These construction projects can include distribution and transmission upgrades or expansion as well as pollution control investments on existing generating units or if necessary new plant construction
Finally a more tangible means of ascertaining the success of a revenue regulation mechanism is whether there is an increase in energy efficiency and DG Although some of the incremental increases may be motivated by statutory or regulatory requirements a utility decision to increase or voluntarily go beyond the requirements through its own efforts or by assisting others especially if innovative means are used to achieve these results can be viewed as a demonstration that revenue regulation is working
This publication contains an in-depth look at six instances of revenue regulation representing a wide cross-section of such regimes in the United States We look first at each utility and provide a summary of its revenue regulation mechanism Next we discuss various components or decision points in designing a revenue regulation mechanism and look at how each state addressed that mechanism What emerges is that despite the differences in designing revenue regulation each mechanism is customized so that the pieces and parts fit together into a complete tableau This is perhaps one of the most critical lessons to be drawn from these analyses that is that there is no one right way to do revenue regulation What counts most is making sure that all the parts of a revenue regulation mechanism work together
Decoupling Case Studies Revenue Regulation Implementation in Six States
7
10 CPUC Decision 93887 12301981 From PGampE PPT Rissler
11 Assem Bill 29 ch 8 2001 Cal Stat httpwwwleginfocagovpub01-02billasmab_0001-0050abx1_29_bill_20010412_chapteredpdf
California Pacific Gas and Electric Company
Pacific Gas and Electric Companyrsquos (PGampE) revenue regulation mechanism compares authorized revenues plus annual attrition adjustments with nonndashweather-adjusted actual revenues and
reconciles any over- or under-collection annually The authorized revenues are established through a general rate case every three years based on a future test year Each of PGampErsquos functional operating areas is decoupled and the authorized revenue requirement is determined separately for each unit electric distribution gas distribution public purpose programs and the like During the general rate case authorized revenues are also established for the two years following the future test year Each year an ldquoattrition caserdquo measures changes in the approved costs that have been experienced and adjusts the test-year revenue requirement Collected revenue is tracked through balancing accounts and surplusesdeficits in these accounts are amortized and refundedcollected to or from ratepayers through rate adjustments in the following year Revenue regulation applies collectively to all of PGampErsquos customer classes (ie deviations in sales revenues relative to forecasted levels are tracked and reconciled at the system level) The revenue regulation mechanism is in addition to adjustments for PGampErsquos electric and gas energy procurement costs
AuthorityCalifornia first adopted revenue regulation for gas
utilities in 1978 By 1982 the California Public Utilities Commission (CPUC) put revenue regulation in place for its three major electric investor-owned utilities PGampE Southern California Edison and San Diego Gas amp Electric The original construct called the Electric Revenue Adjust-ment Mechanism established a revenue requirement for each utility annually and then reconciled billed revenues to authorized revenues The Commission determined that the mechanism would ldquoeliminate any disincentives PGampE may have to promote vigorous conservation measures and also be fair to ratepayers in assuring that PGampE receives no more or no less than the level of revenues intended to be earnedrdquo10 However the CPUC largely suspended the
electric revenue regulation mechanisms in 1996 owing to the implementation of electric restructuring
In 2001 the California Assembly passed Assembly Bill 29 which established programs to reduce energy usage in the wake of the Western Energy Crisis and required that ldquo[t]he commission shall ensure that errors in estimates of demand elasticity or sales do not result in material over or under-collection of the electrical corporationsrdquo11 Now incorporated into the Public Utilities Code section 73910 this required the CPUC to re-implement revenue regula-tion The CPUC first re-implemented revenue regulation for PGampE in 2004 when the company came out of Chapter 11 bankruptcy following the Western Energy Crisis
Authorized Revenue RequirementThe CPUC determines PGampErsquos authorized revenue re-
quirement through a General Rate Case (GRC) every three years Each of PGampErsquos functional operating areas is decou-pled and the Commission determines a separate authorized revenue requirement for each area
In order to determine the appropriate revenue require-ment and rates a future test year is used meaning that the costs included in the revenue requirement and sales levels used to determine rates are forecasted For example on De-cember 21 2009 PGampE filed its application for the 2011 GRC This GRC used the future test year 2011 to determine PGampErsquos authorized revenue requirements in 2011 The test year revenue requirement includes both projected expenses and capital expenditures
The electric distribution revenue requirement request was based on the costs PGampE forecasted it would incur in 2011 to
bull Own operate and maintainbull Its distribution plant
Decoupling Case Studies Revenue Regulation Implementation in Six States
8
12 Risser R (2006 August 2) Decoupling in California more than two decades of broad support and success Available at httpwwwnarucmeetingsorgPresentationsRisserpdf
bull A portion of its transmission plant providing service directly to specific customers and connecting to specific generation resources and
bull A portion of its common and general plant as well as
bull Provide services to its electric customersThe generation revenue requirement request was based
on the costs PGampE forecasted it would incur in 2011 tobull Own operate and maintain its electric generating
plant andbull Perform the transactions necessary to procure
electricity for its bundled-service electric customersBecause all customer classes are decoupled the revenue
requirement also includes costs related to serving all cus-tomers
In the 2011 GRC PGampE received a total revenue requirement of $5977 million The retail revenue require-ment for electric distribution was $3190 million for gas distribution $1131 million and for electric generation $1656 million
Rate of ReturnCPUC calculates the authorized revenue requirements
for PGampE based on a rate of return on its rate base of 879 percent which is projected to provide an 1135-percent return on equity Although intervening parties in the statersquos consolidated cost of capital proceedings have alleged that revenue regulation reduces financial risk there has been no explicit reduction of the return on equity or debt-equity ratio attributable to the implementation of revenue regula-tion
Costs Not Included in Revenue RegulationAccording to PGampE only approximately six percent of
its electric revenues are ldquoat riskrdquo meaning not decoupled or tracked through another mechanism only 42 percent of natural gas revenues are not decoupled12 In addition to en-ergy procurement costs revenue regulation does not apply to PGampErsquos FERC-regulated electric transmission revenue requirement or to a portion of PGampErsquos gas transmission and storage revenue requirement Costs not included in PGampErsquos revenue requirement include energy procurement costs
Revenue Adjustment MechanismPGampErsquos revenue adjustment mechanism allows for two
methods for changing the authorized revenue requirement between rate cases The first mechanism is the stair-step method through which adjustments to the revenue require-
ment are predetermined during the GRC Second PGampErsquos revenue adjustment mechanism allows for changes in the postndashtest-year revenue requirements in addition to the pre-determined adjustments for ldquoexogenous changesrdquo
During the GRC the CPUC also determines the autho-rized revenue requirements called postndashtest-year attrition in-creases for the two years following the test year In the 2011 GRC the Commission determined the authorized revenue requirement for the future test year 2011 in addition to the postndashtest-year attrition increases for 2012 and 2013
The annual attrition adjustments were fixed dollar amounts of $180 million in 2012 and $185 million in 2013 except for allowed exogenous changes In this con-text attrition refers to the decrease in utility revenues com-pared with costs between rate cases attrition adjustments refer to adjustments to the authorized revenue designed to allow the utility to recover the increased costs The 2012 increase includes $123 million for electric distribution $35 million for gas distribution and $22 million for electric generation The 2013 increase includes $123 million for electric distribution $35 million for gas distribution and $27 million for electric generation
Next PGampErsquos attrition mechanism allows adjustments to the postndashtest-year revenue requirements for exogenous factors limited to five factors which are determined during the GRC The five factors determined through the 2011 GRC to be applied to the 2012 and 2013 attrition adjust-ments are postage rate changes franchise fee changes income tax rate changes payroll tax rate changes and ad valorem tax changes A $10 million threshold is applicable to each factor each year
Reconciling Actual Revenue With Authorized Revenue
Since 2004 PGampE has utilized balancing accounts to implement revenue regulation Balancing accounts track the difference between billed revenue and the authorized revenue requirement each month in order to determine the total annual under- or over-collection of revenue The rev-enue balancing accounts (RBAs) are credited each month with billed retail revenue and debited each month with the total amount of authorized annual revenue divided by 12 Any surplus or deficit is tracked and all monthly surpluses and deficits are totaled at the end of the year The total
Decoupling Case Studies Revenue Regulation Implementation in Six States
9
13 PGampE Tariff Book Available at httpwwwpgecomtariffsEPSSHTML
14 PGampE (2012 August 31) Annual Electric True-up Filing Available at httpwwwpgecomnotsratestariffstm2pdfELEC_4096-Epdf
15 ACEEE California Available at httpaceeeorgenergy-effi-ciency-sectorstate-policyCalifornia1575all191
16 EIA Form EIA-861 data files Available at httpwwweiagovelectricitydataeia861
annual surplus or deficit plus interest is amortized and refunded to or collected from ratepayers in the following year through a rate adjustment PGampE uses different bal-ancing accounts to track specific revenue streams separately and recover or refund over or under-collections separately For example PGampE may over-collect distribution revenue leading to a surplus in that account and requiring a refund to ratepayers In the same period the utility could under-collect public purpose revenue leading to a deficit in that account which would be recovered from ratepayers It is possible that from a ratepayer perspective refunds from surplus accounts and recovery from deficit accounts could cancel each other out PGampE tracks numerous revenue streams through balancing accounts including13
bull Distribution Revenue Adjustment Mechanismbull Public purpose program Revenue Adjustmentbull Nuclear decommissioning Adjustment Mechanismbull Utility Generation Balancing Account andbull Regulatory Asset Revenue Adjustment MechanismGenerally rate adjustments apply equally to all customers
in all rate schedules with some exceptions For example di-rect access customers are exempt from changes in generation costs Revenue regulation rate adjustments occur annually with rate adjustments attributable to over- or under-collec-tion in a year being effective January 1 the following year CPUC requires PGampE to file an Annual Electric True-Up advice letter by September 1 of each year with its preliminary forecast of electric rate changes expected including revenue regulation and other adjustments The account balances as of December 31 will determine the final changes to rates that become effective on January 1 In its 2012 Annual Electric True-Up advice letter PGampE included 23 balancing accounts that were approved for that year14
Complementary PoliciesCalifornia has implemented energy savings goals for its
investor-owned utilities calling for approximately one-percent savings annually through 2020 The RiskReward Incentive Mechanism implemented in 2007 provides an incentive if the utility meets at least 85 percent of its sav-ings goals Utilities can receive 9 percent of net benefits if they achieve between 85 and 99 percent of savings goals and 12 percent of net benefits15 if they meet or exceed sav-ings goals up to the earnings cap of $450 million Penalties are triggered when actual energy efficiency savings are at or below 65 percent of the individual utility savings goal First utilities must reimburse ratepayers dollar-for-dollar for any negative net benefits this is considered part of the
penalty payment Utilities must also pay a per-unit penalty rate of $005kWh and $25kW The total penalty is also capped at $450 million
PGampE currently offers residential customers service under a default inclining block rate structure Residential customers may volunteer for time-of-use (TOU) rates with peak part-peak and off-peak tiers for summer and part-peak and off-peak tiers for winter Discounted rates for low-income and medically fragile customers are avail-able but they too are inclining Commercial customers take service on a Peak Day Pricing default rate but can opt out to take service under a TOU structure Peak Day Pricing is TOU pricing with a surcharge added on top during 9 to 15 peak events called during the year Each of these rate struc-tures signals customers that increased use of energy will be increasingly more expensive These rate designs create a situation in which utility revenues are greatly affected by weather whereas their investment and labor costs are not the revenue regulation mechanism buffers utility revenues and earnings from these weather effects
Some Commissions have implemented service quality programs to ensure that utilities donrsquot engage in destructive cost cutting to improve margins under revenue regulation PGampE files annual reliability reports but there is no explic-it penalty or reward associated with performance However a new initiative by the CPUC is exploring how to elevate the importance of safety in gas and electric utility rate cases which would be supported through a performance-based ratemaking platform
Energy Efficiency OutcomesBecause PGampE has been decoupled in one form or an-
other since 1984 it is very difficult to determine the effect of revenue regulation on the implementation of energy ef-ficiency programs However PGampE has reported that incre-mental energy efficiency savings have consistently exceeded one percent of retail sales over the last ten years16
Decoupling Case Studies Revenue Regulation Implementation in Six States
10
ResourcesCalifornia Division of Ratepayer AdvocatesReport on the Cost of Capital for Test Year 2013
Docket A 12-04-015 (August 6 2012)California Public Utilities CommissionDocket 09-12-020 Settlement Agreement (May 13 2011)Docket 10-07-027 Decision 11-05-018 (May 5 2011)Resolution E-3862 (April 1 2004)
Pacific Gas and Electric CompanyAdvice Letters 3896-E 3896-E-A 3896-E-B
Annual Electric True-Up and Supplemental Filings (January 23 2012)
Advice 3727-E Annual Electric True-Up Filing (September 1 2010)
General Rate Case Application of Pacific Gas and Electric Company (December 21 2009)
Decoupling Case Studies Revenue Regulation Implementation in Six States
11
Idaho Power Companyrsquos (IPC) Fixed Cost Adjustment (FCA) mechanism compares the authorized fixed-cost revenue requirement with weather-normalized sales and reconciles the difference annually for residential
and small business customers The allowed revenue is determined on a per-customer basis during the general rate case and the total fixed-cost recovery amount is adjusted based on the number of customers
AuthorityIn 2004 the Idaho Public Utilities Commission
established a case to investigate financial disincentives to investment in energy efficiency by IPC After a series of workshops in 2007 the Commission approved a three-year pilot of IPCrsquos proposed revenue regulation mechanism In 2009 the Commission extended the pilot for an additional two years starting January 1 2010 On April 2 2012 the Idaho Public Utilities Commission made the IPC pilot program permanent
Authorized Revenue RequirementDuring the general rate case the Commission establishes
the class-specific portion of IPCrsquos revenue requirement For purposes of the FCA this includes the fixed costs collected through Residential Service and Small General Service customer rates During the general rate case the Commission also establishes a fixed-cost per-customer ratemdashthe amount of fixed cost revenue the Company will recover from each customer Finally the Commission must also establish the fixed-cost per-kWh ratemdashthe portion of retail rates that covers fixed costs ldquoFixed costsrdquo are defined much more broadly than accounting standards provide including return taxes and labor expenses
Rate of ReturnIPCrsquos most recent rate case resulted in an overall
settlement The Stipulation specified an overall rate of return of 786 percent which combines return on equity (ROE) capital structure and cost of debt The Commission made no explicit adjustment to the Companyrsquos allowed rate of return
based on the implementation of the FCA
Revenue Adjustment MechanismThe revenue adjustment mechanism was designed to
be weather normalized For each customer class included in the revenue regulation mechanism the actual number of customers (CUST) is multiplied by the fixed-cost per-customer rate (FCC) to give the allowed fixed-cost recovery amount This pro forma amount is then compared to the fixed costs recovered by the company This actual fixed-cost recovery is determined by taking the weather-normalized sales for each class (NORM) and multiplying it by the cost-per-kWh rate (FCE) as determined in a general rate case The difference (allowed fixed cost recovery minus actual fixed cost recovery) determines the FCA In this way the revenue requirement is adjusted between rate cases based on the number of customers and is weather normalized leaving the weather risk with the company This difference is the FCA and is applied to each decoupled customer class
The mathematical formula is FCA = (CUST times FCC) ndash (NORM times FCE) The number of customers is determined by class on the same basis as the methodology used in the general rate case
Reconciling Actual Revenue With Authorized Revenue
Each month the actual fixed-cost recovered amount is determined based on the weather-normalized sales for each customer class multiplied by the fixed-cost per-kWh rate For reporting a monthly ldquoshapedrdquo fixed cost per kWh is used for calculating actual fixed-cost revenue This adheres to Generally Accepted Accounting Practices (GAAP) and better reflects end-of-year impacts within the year The methodology used to weather-normalize actual monthly energy used in the FCA is the same as used in the general rate case Finally the actual fixed-cost recovered amount is subtracted from the allowed fixed-cost recovery amount and the difference is recorded as a line item in the monthly Power Cost Adjustment (PCA) report provided to the Commission Differences are deferred with interest until the end of the
Idaho Idaho Power Company
Decoupling Case Studies Revenue Regulation Implementation in Six States
12
year The actual FCA balance will differ from that recorded in the monthly reports to reflect the fact that the deferral balance is calculated on an annual not monthly basis FCA balance is based on annual average prorated customer count annual weather normalized sales and non-shaped FCE rates which would affect both the balance accrual and the associated interest
Each year the Company totals the FCA results including interest for the period from January 1 to December 31 If the total is negative it represents an under-collection of revenue from customers and the amount will be recovered from ratepayers in the following year through an adder to rates (Schedule 54) Likewise if the total is positive the Company has over-collected its fixed-cost revenue and will return the excess amount to customers through an adder in rates using a credit or surcharge mechanism These adjustments are currently included in the Annual Adjustment Mechanism line item on customer bills Since July 2012 the Annual Adjustment Mechanism includes PCA and FCA to avoid customer confusion
Originally FCAs were calculated for each decoupled customer class however the FCA is now recovered proportionally between the residential and small general service customers for such reason as a lack of cost of service studies to support the underlying cost allocations and acknowledgment of the ldquoportfoliordquo approach toward energy efficiency Annual adjustments are capped at three percent and differences beyond that are rolled over until the next period Adjustments to the rate occur June 1 of the year following the previous one-year period from January 1 to December 31
IPC was initially obligated to submit its adjustment request subject to Staff audit on March 15 of each year Under the pilot program this included a detailed summary of demand-side management (DSM) activities that demonstrate an enhanced commitment to DSM resulting from implementation of the FCA ldquoEvidence of enhanced commitment will include but not be limited to broad availability of efficiency and load management programs building code improvement activity pursuit of appliance code standards expansion of DSM programs pursuit of energy savings programs beyond peak shavingload shifting programs and third party verificationrdquo (IPC-E-04-15 Settlement Stipulation p 5) However the Company is no longer required to file the separate annual report specifying ways in which it increased its investment in energy efficiency and DSM as a result of the FCA mechanism DSM is comprehensively reported in annual DSM reports filed with
the Commission
Potential ChangesThe Commission noted when approving the permanent
FCA that it ldquodoes not isolate or identify changes in cost recovery associated solely with the Companyrsquos energy efficiency programsrdquo17 The Company was required to file a proposal to adjust the FCA to address the capture of changes in load not related to energy efficiency programs In its compliance filing IPC recommended making no change to the FCA mechanism but did propose an altered mechanism in order to comply with the Commissionrsquos request The proposal would cap the annual change in per-customer consumption to two percent (up or down) The Commission Staff had previously proposed that the FCA balance be equally shared between the customers and the Company in order to account for variations in energy consumption other than weather and energy efficiency However the Commission found that neither proposal satisfied its needs stating that the Companyrsquos proposal to cap deviations in annual usage would not have had any effect on previous FCA results Additionally both IPC and the Idaho Conservation League filed comments stating that the Staffrsquos 5050 sharing proposal failed to remove the financial disincentives inherent in DSM programs The Commission finally determined to keep the FCA mechanism unchanged and continue to monitor the results
Complementary PoliciesIdaho requires its investor-owned utilities to pursue all
cost-effective energy efficiency however it does not have incentives for achieving energy efficiency savings
IPC uses inclining block rates as the default rate structure for its residential customers but there is also available an optional Time-of-Day pilot program with summer and winter peak and off-peak periods Small general service customers take service on a two-tier inclining block schedule
IPC has no filing or reporting requirements relating to service quality (except in Oregon)
Energy Efficiency OutcomesBefore IPC implemented revenue regulation in January
2007 it reported increasing incremental energy efficiency savings from 0 percent of retail load in 2003 to 05 percent of
17 Order No 32505 p 6 Available at httpwwwpucidahogovorders32599ord32505pdf
Decoupling Case Studies Revenue Regulation Implementation in Six States
13
retail load in 2006 Since the revenue regulation mechanism was implemented reported savings have increased from 06 percent in 2007 to 13 percent in 2010 (with low or no reported savings in 2009 and 2011)18 The DSM Report for 2012 shows this to be 12 percent
ResourcesIdaho Public Utilities CommissionIPC-E-04-15 - Idaho Power mdash Investigation of Financial
DisincentivesIPC-E-09-28 - Idaho Power mdash Application to Make the
Fixed Cost Adjustment PermanentIPC-E-11-19 - Idaho Power mdash Request to Convert
Schedule 54 (Fca) From Pilot to Permanent
18 EIA Form EIA-861 data files Available at httpwwweiagovelectricitydataeia861
Decoupling Case Studies Revenue Regulation Implementation in Six States
14
Baltimore Gas and Electricrsquos (BGE) revenue regulation mechanism compares actual distribution revenue to the authorized revenue adjusted for the number of customers for each applicable rate schedule The
authorized revenue including the cost of power is based on test year requirements and sales levels Over- or under-collec-tions are reconciled monthly through a rider This mechanism differs from the others we describe by having a monthly rather than annual deferral and recovery period
AuthorityBGE requested a revenue regulation mechanism in 2007
due to the expected impact on electricity sales of the com-panyrsquos conservation and demand response programs BGE stated that the revenue regulation mechanism was neces-sary to eliminate the inherent disincentive in the traditional ratemaking process with respect to conservation and demand response Under traditional ratemaking BGE pointed out that ldquoa one percent reduction in electricity use and demand on the Companyrsquos system for the residential and small com-mercial classes would cut cost recovery by approximately $4 million This first year impact on recovery is then followed by $8 million in the second year (as an equal amount of sav-ings is added) and so on the five-year loss to shareholders from this steady-state utility investment program would be more than $20 millionrdquo19 The revenue regulation mechanism proposed by BGE was based on its gas revenue regulation mechanism which has been in place since 1998
Authorized Revenue RequirementBGE initially calculated its revenue requirement per class
separately for each rate scale based on weather-normalized 2007 sales and the number of customers Because BGE pro-posed the mechanism in 2007 the test year 2007 included nine months of actual sales and three months of forecasted sales BGE used three steps to calculate the base monthly revenue requirement
1 Calculate the Customer Charge revenues by multiplying the number of customers by the
Maryland Baltimore Gas and Electric
Customer Charge for each class2 Calculate the Delivery Service revenues by
multiplying the weather-normalized sales by the Delivery Price for each class
3 Add the Customer Charge revenues and the Delivery Service revenues to determine the base revenue requirements for each class
BGErsquos residential small general service and general service customers are included in the revenue regulation mechanism
Rate of ReturnBGE was allowed a return on common equity of 975
percent applied to a common equity ratio of 5105 per-cent in its most recent rate case BGE strongly opposed the reduction of its ROE and preferred another lost revenue mechanism over revenue regulation if an ROE reduction was implemented as a result of revenue regulation
The Public Service Commission (PSC) made no adjust-ment to BGErsquos ROE when revenue regulation was first implemented in 2007 but did reduce its allowed ROE by 50 basis points in the last rate case The Commission had previously reduced the ROE of another utility by 50 basis points when it adopted a similar revenue regulation mecha-nism for that utility20 21
Revenue Adjustment MechanismOn a monthly basis the adjustment to base revenue
requirement is calculated for each rate class using the following steps
19 BGE (2007 October 26) 9111FilingConser-va102607F Available at httpwebapppscstatemdusintranetmaillogcontentcfmfilepath=C5CCasenum5CAdmin20Filings5C60000-1099995C1080615C9111FilingConserva102607Fpdf
20 Potomac Electric Power Company
21 BGErsquos gas mechanism was approved in a 1998 settlement that did not discuss any adjustment to ROE
Decoupling Case Studies Revenue Regulation Implementation in Six States
15
1 Calculate the revenue adjustment for the change in the number of customers by multiplying the change in the number of customers by the Customer Charge
2 Calculate the revenue adjustment associated with the change in sales by multiplying the change in the number of customers by the average use per customer and multiplying that product by the Delivery Price for the class
3 Calculate the target base revenues for each class for the current period by adding the two types of adjustments to the revenue requirement
The Delivery Price for each class is the delivery rate established by the PSC adjusted for the electric universal service charge nuclear decommissioning credits and the administrative credit associated with the administrative adder portion of the Standard Offer Service rates22
BGE had a full electric and gas rate case in 201023 and another one filed in 2013 and concluded in 201424 Both reset the required decoupling elementsmdashmonthly revenue requirement monthly average usage per customer and number of customers Neither case changed the mechanism
The decoupling mechanism now excludes lost sales resulting from major storms
Reconciling Actual Revenue With Authorized Revenue
On a monthly basis each rate classrsquos target base revenues are compared to the actual base revenues for the month The difference is divided by the forecasted sales for the following period to calculate the monthly rate adjustment Balancing accounts are used to record the timing differ-ences associated with when the adjustments are calculated versus when they are billed or refunded The monthly rate adjustment Rider 25 is capped at ten percent of rates Any amount beyond ten percent of the current rate will be car-ried over and reconciled in the subsequent period
Complementary PoliciesMaryland requires its electric utilities to provide energy
efficiency services to achieve a ten-percent reduction in per capita electricity use by 2015 The statersquos overall goal is a 15 percent reduction of per capita electricity use by 2015 Although the PSC is explicitly allowed to approve financial incentive mechanisms to promote energy efficiency no incentives have been approved yet25
BGErsquos default service to its standard offer residential cus-tomers (those customers who have not elected to take gen-eration service from an alternate supplier) features seasonal
ratesmdashsummer and winter BGE also offers a TOU rate as an option to standard offer residential customers and as the default rate for small general service customers
Regarding performance incentives under revenue regula-tion in October 2012 Maryland issued a four-part plan designed to speed up investments that will strengthen the statersquos distribution grid Part of that plan would set a rate-making structure that aligns customer and utility incentives by rewarding reliability that exceeds established reliability metrics and penalizing failure to reach those metrics A task force has encouraged the Maryland state regulatory com-mission to implement a performance-based ratemaking process for IOUs such as BGE linking a utilityrsquos progress or failure to meet certain reliability metrics with its authorized rate of return
Energy Efficiency OutcomesWhen BGE implemented electric revenue regulation in
mid 2007 it had not achieved incremental energy savings for several years In 2008 it reported incremental savings of 05 percent of retail load increasing to 17 percent in 2010 and 2011
ResourcesMaryland Public Service CommissionLetter Order ML 108061 (December 27 2007)Letter Orders ML 108069 (November 30 2007) Case No 9036 Order No 80460 (December 21 2005) Case No 9230 Order No 83907 (December 13 2013) Case No 9326 Order No 86060 (December 13 2013)
22 BGE (2007 October 26) 9111FilingConser-va102607F Available at httpwebapppscstatemdusintranetmaillogcontentcfmfilepath=C5CCasenum5CAdmin20Filings5C60000-1099995C1080615C9111FilingConserva102607Fpdf
23 Case No 9230 ndash See references above
24 Case No 9326 ndash See references above
25 ACEEE Maryland Available at httpaceeeorgsectorstate-policymarylandEnergy Efficiency Resource Standards
26 EIA Form EIA-861 data files Available at httpwwweiagovelectricitydataeia861
Decoupling Case Studies Revenue Regulation Implementation in Six States
16
27 The pilot extension is in effect until the effective date of a Final Decision issued by the Commission on an application for a general base rate case filed after January 1 2013
28 Except the Direct Load Control Cp - Large Commercial amp Industrial Service Cp-ND - Pilot Large Commercial amp Industrial - Day Ahead Cp-RR - Large Commercial amp Industrial Response Rewards Automatic Transfer Switch Parallel Generation Lighting Nature Wise and Real Time Market Pricing tariffs
Wisconsin Wisconsin Public Service Corporation
Wisconsin Public Service Corporationrsquos (WPS) Revenue Stabilization Mechanism (RSM) began in 2009 as a four-year revenue regulation pilot that reconciled
target marginal revenue per customer with actual marginal revenue per customer As of 2012 the pilot was extended27 albeit with some modifications This section focuses on the current iteration of the RSM
AuthorityThe Public Service Commission of Wisconsin (PSCW)
approved a revenue regulation pilot for WPS in a Decem-ber 2008 rate case order (Docket No 6690-UR-119) The revenue regulation mechanism was effective from January 1 2009 through December 31 2012 and applied to the util-ityrsquos electric and gas operations In a rate case completed in December 2012 (Docket No 6690-UR-121) the pilot was extended and a modified RSM was approved The extended RSM is in effect from January 2013 until the next rate case
Authorized Revenue RequirementThe authorized revenue requirement is determined
through a rate case The Commission uses a future test year to determine the revenue requirement The cost of fuel is not included in the revenue requirement but is addressed through a ldquoRetail Electric Fuel Rulerdquo adjustment
Rate of ReturnThe Commission authorized a rate of return on utility
common equity of 1030 percent in Docket No 6690-UR-120 This rate remained the same in Docket No 6690-UR-121 and is currently in effect
Revenue Adjustment MechanismWPS implemented a new electric RSM based on a ldquoTotal
Rate Case Marginrdquo mechanism instead of a ldquoTotal Rate Case Margin per Customerrdquo mechanism which had been the practice during the initial four-year pilot phase The revision was intended to remove the calculation sensitivities related
to sales per customer from the original RSM calculation The margin reflected in the formula equals the total revenue for each tariff less the costs associated with the annual per-kWh value established for monitored fuel costs and excluding any surcharges credits taxes or similar charges The ldquoTotal Rate Case Marginrdquo mechanism allows WPS to achieve the total margin assumed in the forecasted test year no more and no less The new RSM will be in effect on a pilot basis until the effective date of WPSrsquos next general rate order which WPS committed to filing for the 2014 andor 2015 test years The RSM applies to most tariffs except large commercial and industrial customers28
Reconciling Actual Revenue With Authorized Revenue
Each year the utility compares the total target revenue and the total actual revenue and defers the difference subject to carrying costs based on WPSrsquos last approved short-term debt rate The margin will be based on annual per-kWh value established for monitored fuel costs which is done in a rate case The margin is determined by subtracting the aver-age kWh value from the authorized energy rates
The formula for calculating an electric under-recovery or over-recovery is
Under-recovery or over-recovery equals
[actual margin minus ratecase forecasted margin established in the most recent rate proceeding]
The summation is over each tariff A positive value equals an over-recovery and a negative value equals an
Decoupling Case Studies Revenue Regulation Implementation in Six States
17
29 The required spending level was higher for the year 2011 owing to a temporary change in state policy
30 ACEEE Wisconsin Available at httpaceeeorgsectorstate-policywisconsin
31 The Cadmus Group Inc (2013)
under-recovery The margin reflected in the formula equals the total revenue for each tariff less the costs associated with the annual per-kWh value established for monitored fuel costs and excluding any surcharges credits taxes or similar charges
In the event that a true-up will cause rates to increase the Commission will provide an opportunity for a hear-ing Revenue regulation adjustments occur as a part of the general rate case
The revenue regulation adjustments are subject to a $14 million per year cap for electric excluding carrying costs Any adjustments over that amount will not be carried over and will not be collected from ratepayers Equivalently revenue over collection in excess of $14 million will not be returned to ratepayers
Complementary PoliciesWPS like all other investor-owned utilities
in Wisconsin is required to spend 12 per-cent of its annual operating revenues on en-ergy efficiency and customer-owned renew-able resource programs that are administered by a third party through the Focus on Energy program which was established in 200229 Separately through a contract the PSCW ap-proves annual electricity savings goals for the Focus on Energy program The savings goals were equivalent to 075 percent of electric sales for the participating utilities from 2011 to 2013 In addition the PSCW approved a rate of return on investments in energy efficiency for Wisconsin Power amp Light and other utilities can propose incentives as part of their rate cases However WPS has not yet proposed an incentive mechanism30
WPS offers residential customers a default flat rate but they also offer a TOU option with winter and summer on-peak off-peak and shoulder tiers For small commercial and industrial customers there are flat rates TOU rates and critical peak rates Large commercial and industrial customers can take service under a TOU rate with summer and winter on-peak and off-peak rates a TOU with criti-cal peak rate or under a special contract rate unique to the customer and approved by the Commission
The authorized level of expensed conservation costs recoverable in rates for the test year (2013) is $19778728 The level for electric utility operations consists of the conservation budget of $17669792 and an escrow adjustment of $2108936 which represents the test year amortization of the projected overspent escrow balance at
December 31 2012 over two years Wisconsin has a statute requiring filing of reliability data
but no reward or penalty system to support its revenue regulation system
Energy Efficiency OutcomesWPS implemented revenue regulation in 2009 In order
to gain approval for the original revenue regulation mecha-nism WPS agreed to fund energy efficiency and renewable energy programs at levels above their 12-percent statutory minimum contribution to Focus on Energy Focus on Energy produces an annual report of energy efficiency program activities In its 2012 report Focus on Energy reports the following outcomes achieved for WPSrsquo service territory The table below represents the savings under the statewide Focus on Energy Programs and does not represent the savings at-tributed under the funding levels above 12 percent31
Territory Segment
Customer Participation
Rate () Utility Type
Per Capita Lifecycle Bill Savings ($)
Per Capita Incentive
($)
WPS Electric Commercial $115258 3 $8330
WPS Electric Industrial $9026768 96 $892463
WPS Electric Residential $6494 36 $666
ResourcesPublic Service Commission of WisconsinApplication of Wisconsin Public Service Corporation for
Authority to Adjust Electric and Natural Gas Rates Final Decision (December 7 2012) Docket No 6690-UR-121
David J Kyto Wisconsin Public Service Corporation Application of Wisconsin Public Service Corporation for
Authority to Adjust Electric and Natural Gas Rates Supplemental Direct Testimony (May 15 2012) Docket No 6690-UR-121
Focus on EnergyThe Cadmus Group Inc (2013) Focus on Energy Calendar
Year 2012 Evaluation Report Appendixes Portland OR The Cadmus Group Inc Retrieved from httpwwwfocusonenergycomsitesdefaultfilesFOC_XC_CY201220Report20Appendices20A-O20Final2005-3-13pdf
Decoupling Case Studies Revenue Regulation Implementation in Six States
18
32 DPU 07-50 (2007)
33 DPU 07-50 (2007) pp 392ndash396
Massachusetts National Grid
The revenue regulation mechanism for National Grid (Massachusetts Electric Company and Nantucket Electric Company together doing business as National Grid) compares authorized
distribution revenue to actual distribution revenue Revenue is compared and adjustments are made separately for each customer class
AuthorityThe Massachusetts Department of Public Utilities (DPU)
adopted revenue regulation as a statewide regulatory policy in 2008 and individual utilities filed revenue regulation tariffs in response In its Investigation Into Rate Structures that will Promote Efficient Deployment of Demand Resources32 the DPU investigated rate structures and revenue recovery mechanisms that may reduce disincentives to the efficient deployment of demand resources in the state and consid-ered how the electric and natural gas distribution compa-niesrsquo existing cost recovery mechanism could be changed to better align the companiesrsquo financial incentives with policy objectives while ensuring that the companies are not finan-cially harmed by the increased use of demand resources The DPU finally concluded that revenue regulation mecha-nisms would eliminate the financial disincentives because they sever the link between the companiesrsquo revenue and reduction in sales The DPU also endorsed a revenue per customer approach but recognized that other factors could result in changes to distribution-related costs and consent-ed to consider company-specific ratemaking proposals that accounted for the impact of capital spending and inflation-ary pressures on the companyrsquos required revenue
Authorized Revenue RequirementThe authorized revenue requirement does not include
costs that are reconciled outside of base distribution rates including energy supply costs for basic service customers transmission costs the energy efficiency system benefits charge and reconciling charge and costs recovered through the residential assistance adjustment factor
Rate of ReturnThe Commission recognized the effects of revenue
regulation on ROE and determined that revenue regulation reduces volatility which reduces risk and a downward ad-justment to ROE was appropriate but did not make its ac-tual ROE adjustment for the revenue regulation mechanism explicit in its order33 The DPU determined that a return on equity equal to 1035 percent was sufficient The testimony from National Grid supporting its proposed ROE presented comparisons of allowed ROE for a set of companies that had revenue regulation or another risk management mecha-nism in place to account for an implied reduced risk profile in developing that proposal
Revenue Adjustment MechanismEach year the authorized revenue requirement is ad-
justed to account for capital expenditures in the previous year The CapEx Adjustment applies to capital expenditures incurred by National Grid for distribution system invest-ments in the previous year net of the amount recovered through depreciation expense in base rates This accounts for the material difference in expected capital expenditures compared with prior years In this way the CapEx Adjust-ment in the National Grid revenue regulation mechanism is a special case of a ldquoK Factorrdquo which characterizes an expected change in costs in the future and accounts for those changes when they occur Each year the Company files with the Department documentation in support of the capital expenditures it has incurred since the previous review The Department reviews the filings to determine the prudence of the incremental expenditures and whether the expenditures are used and useful National Grid then allocates approved expenditures to rate classes based on the cost of service study For each class the Company determines the adjustment allocated to the rate class then divides this sum by the forecasted kWh sales for the follow-
Decoupling Case Studies Revenue Regulation Implementation in Six States
19
34 DPU 07-50 (2007) p 87
35 ACEEE Massachusetts Available at httpaceeeorgsectorstate-policymassachusetts
36 Personal communication with National Grid
ing year to determine the per-kWh adjustment In order to provide a balance between providing the
Company with sufficient funds to ensure the safety and reliability of the distribution system and protecting ratepay-ers against the incentive the Company has to overinvest in infrastructure the mechanism limits the level of annual capital expenditures that is recoverable through the mecha-nism To arrive at the amount the Department set a limit of $170 million per year which is equal to the approximate three-year average of the Companyrsquos capital spending in previous years Should the Companyrsquos capital expenditures exceed this limit it may seek to include the investment in the rate base during the next base rate proceeding
The Company submits its CapEx filing no later than July 1 of each year On November 1 of each year the Company submits all other information in support of its proposed adjustment factors The factors will take effect on March 1 of each year
The authorized revenue is also adjusted to include a 50-percent sharing for earnings above the authorized ROE
Reconciling Actual Revenue With Authorized Revenue
Each year National Grid calculates on a rate class-spe-cific basis the difference between the actual distribution revenue billed to customers through distribution rates and the annual target revenue For each rate class the difference between the actual billed distribution revenue and the an-nual target revenue is summed to determine the Company-wide reconciliation amount That amount is divided by the Company-wide kWh forecasted for the upcoming year to arrive at a cent-per-kWh reconciliation charge or credit To determine the final adjustment for each rate class the Company-wide reconciliation adjustment is added to the rate class-specific adjustment resulting from the target rev-enue adjustment mechanisms
The adjustment to the authorized revenue in any year is capped at three percent of total revenues34 Any excess can be carried forward to a future year with carrying charges equal to the customer deposit rate
National Grid must report to the DPU if the difference between the year-to-date billed revenue and year-to-date annual target revenue equals or exceeds ten percent of the target revenue and the Company believes that the difference will fall outside of the ten-percent threshold in the coming months In this case interim revenue regulation adjust-ments can be made In order to avoid an interim adjust-ment too close to the scheduled annual rate adjustment
National Grid must notify the Department of variances exceeding ten percent of annual target revenue by August 31 of each year
Complementary Policies Massachusetts requires that electric utilities procure
all cost-effective energy efficiency before more expensive supply-side resources This requirement was translated into annual savings requirements for electric utilities starting from 1 percent of sales in 2009 to 14 percent in 2010 2 percent in 2011 and 24 percent in 2012 and potentially increased savings in subsequent years Utilities can earn approximately five percent of program costs for meeting or exceeding savings targets35
National Grid offers inclining block rates as the default residential rate but there is an optional TOU rate with peak and off-peak tiers also available to residential customers Small and large industrial and commercial customers can take service under flat rates inclining block rates or TOU rates
National Grid operates under a penalty and reward sys-tem for service quality established in Docket DTE 99-84 The impetus behind the DPUrsquos original establishment of the Service Quality Guidelines was to prevent Massachusetts utilities from allowing service quality to deteriorate under a new regulatory regime
Energy Efficiency OutcomesBefore Massachusetts Electric implemented revenue
regulation in 2009 it reported consistently high levels of incremental energy efficiency savings approximately 09 percent of retail load In 2010 the company reported 136 percent savings and 159 percent in 2010 and 2011 respectively36
ResourcesMassachusetts Department of Public UtilitiesDocket 09-39 Petition of Massachusetts Electric Company
(November 30 2009)
Decoupling Case Studies Revenue Regulation Implementation in Six States
20
37 Energy Agreement Among the State of Hawaii Division of Consumer Advocacy of the Department of Commerce amp Consumer Affairs and Hawaiian Electric Companies Available at httpwwwhecocomvcmcontentStaticFilespdfHCEIpdf
38 The HECO Companies described as follows in their Reply SOP in the Schedule A decoupling proceedings ldquothe
Hawaii Hawaiian Electric Company
Hawaiian Electric Company (HECO) uses a revenue regulation mechanism that compares actual revenue to target revenue in each year The target revenue is based on the authorized
revenue for the last test year adjusted for operation and maintenance (OampM) increases and rate base changes
HECO is a subsidiary of Hawaiian Electric Industries which also operates Maui Electric Company (MECO) and Hawaiian Electric Light Company these subsidiaries service the islands of Maui and Hawaii County while HECO serves Oahu (Honolulu)
Authority In 2008 the Governor of Hawaii the Division of Con-
sumer Advocacy and HECO entered into an agreement as a result of the Hawaii Clean Energy Initiative37 The agreement is intended to move Hawaii away from its dependence on imported fossil fuels for electricity and ground transporta-tion and toward locally produced renewable energy and energy efficiency In the agreement the State the Consumer Advocate and HECO committed to among other things a transition away from a model that encourages increased elec-tricity usage and to a model that implements revenue regula-tion decoupling to encourage the development of renewable energy by HECO The Commission opened Docket 2008-0274 in order to examine the features of a revenue regula-tion mechanism The Opening Order directed HECO and the Consumer Advocate to file a joint proposal on revenue regulation within 60 days This joint proposal was modeled closely after the California mechanism described earlier for PGampE with a rate-case determined revenue requirement plus annual attrition adjustments plus separate mechanisms
to recover power supply and energy efficiency costsThe Hawaii Public Utilities Commission approved
revenue regulation for HECO in August 2010 based on an investigation into the appropriateness of revenue regula-tion and its design The revenue regulation mechanism took effect on March 1 2011 This replaced a previous lost revenue adjustment mechanism
Authorized Revenue RequirementThe Commission establishes the Authorized Base Rev-
enues through a general rate case based on traditional cost-of-service ratemaking principles The Authorized Base Revenue is the annual amount of revenues required for the utility to recover its estimated OampM depreciation amorti-zation and tax expenses for the period
The Target Revenue is equal to the base revenue require-ment less any revenue being separately tracked or recov-ered through any other surcharge or tracking mechanism including revenue for fuel and purchased power expenses
The revenue regulation order also requires staggered triennial rate cases for each of the Hawaiian Electric Indus-tries Companies to determine approved baseline Revenue Adjustment Mechanism (RAM) inputs
Rate of ReturnThe Commission made no explicit adjustment to ROE
owing to the revenue regulation mechanism but noted that the allowed ROE of ten percent reflects the approval of revenue regulation and other cost-recovery mechanisms that will lower HECOrsquos business risk38 Most recently the Hawaiian Public Utilities Commission approved a 90-per-cent ROE for MECO reflecting both a lower baseline cost
Commission effectively reduced the Companiesrsquo return on common equity by 50 basis points to ldquofairly compensate ratepayersrdquo for what it perceived as the ldquorisk-reducingrdquo effects of the RBA and RAM mechanisms the Renewable Energy Infrastructure Program (lsquoREIPrdquo) Surcharge and the Purchased Power Adjustment Clause (ldquoPPACrdquo)rdquo Available at httpdmspuchawaiigovdmsDocumentViewerpid=A1001001A10L29B55326B47993
Decoupling Case Studies Revenue Regulation Implementation in Six States
21
39 Hawaii PUC Decision and Order No 31288 (2013 May 31) pp 97ndash112
40 Hawaii PUC Decision and Order No 31289 (2013 May 31)
41 Hawaii PUC Decision and Order No 31908 (2014 Feb 1)
42 February 7 2014 order on schedule A issues Available at httpdmspuchawaiigovdmsDocumentViewerpid=A1001001A14B10B22326F07922 p 42ndash47
of capital and a penalty of 050 percent associated with inadequate performance bringing renewable energy into the MECO system39 A companion Order also established new guidance on future revenue regulation mechanisms40
Revenue Adjustment MechanismThe RAM is designed to replace the need for annual rate
cases by adjusting Authorized Base Revenue levels to reflect estimated changes in the utilityrsquos cost of service The RAM is intended to via formula-driven estimates and escalators compensate the HECO Companies for changes in util-ity costs and infrastructure investment between rate cases and reduce the frequency of rate cases The RAM Period is the calendar year containing the Annual Evaluation Date (March 31 the date of the annual RAM filing) The RAM adjusts the revenue requirement according to changes in four main categories of expenses
bull Base expenses which are changes in designated OampM expenses
bull Rate base the return on incremental investment in designated rate base components41
bull The incremental depreciation and amortization expenses and
bull Exogenous tax changes changes in costs owing to significant changes in tax laws or tax regulations
Base expenses are segregated between labor and non-labor amounts The labor component is adjusted annually by the Labor Cost Escalation Rate reduced by the Labor Productiv-ity Offset (fixed at 076 percent) The non-labor component uses the Non-labor Escalation Rate to annually adjust those costs Tracked OampM expenses for fuel purchased power pension and post-employment benefits integrated resource planning DSM and other rate adjustment provisions are not adjusted in the RAM because any changes in these costs are accounted for in other cost-tracking mechanisms
The Rate Base equals the average net investment esti-mated for the RAM Period The average rate base is the rate base for the rate case test year with adjustments for changes in only four components of rate base (1) average plant-in-service (2) average Accumulated Depreciation (3) average accumulated contributions in aid of construc-tion and (4) average accumulated deferred income taxes All other components of the rate base remain the same as in the preceding rate case test year The average plant-in-service is equal to the average of the actual plant-in-service at the end of the year prior to the RAM period the Evalu-ation Year and the same year-end balance plus estimated plant additions for the RAM period Plant additions include
Baseline Capital Project plant additions and Major Capital Projects plant additions estimated to be in service by Sep-tember 30 of the RAM period
The RAM also includes an Earnings Sharing Revenue Credit mechanism in order to protect against excessive over-all utility revenue levels The RAM will escalate and update the Companyrsquos approved base revenue requirement reduced by earnings sharing credits and major project revenue credits to customers Based on the Companyrsquos achieved return on common equity for the Evaluation Year the mechanism cred-its the RBAs according to the following chart
ROE at or below the authorized ROE
First 100 basis points (1) over authorized ROE
Next 200 basis points (2) over authorized ROE
ROE exceeding 300 basis points (3) over
authorized ROE
Retained entirely by shareholders no customer credits
25 share credit to customers
50 share credit to customers
90 share credit to customers
Finally the RAM includes additional consumer protectionsbull A provision for Major Capital Projects Creditsbull A provision for Baseline Capital Projects Creditsbull Notification is provided to all affected customers of
the RAM filing in newspapers and billsbull Evaluation procedures for filing examination and any
exceptions to annual revenue regulation filingsbull Continued ability of HECO or the Consumer
Advocate to request formal rate proceedings to replace and terminate RAM at any time and
bull Formal review of revenue regulation as a part of the next round of rate case proceedings
A recent order42 added two additional consumer protections
bull A limitation that only 90 percent of the current
Decoupling Case Studies Revenue Regulation Implementation in Six States
22
43 ACEEE Hawaii Available at httpaceeeorgsectorstate-policyhawaii
RAM Period Rate Base that exceeds the Rate Base Adjustment Mechanism from the prior year can be included in the Decoupling Mechanism for baseline utility plant projects which unlike major capital projects are not subject to prior Commission review and approval and
bull A requirement to post a number of metrics online for customer review although not at this point tied to performance
This order also examined four issues with respect to the application of the RAM The Commission determined that the short-term debt rate as reflected in the most recent rate case should be used to adjust over- and under-collections The Commission also resolved its concern that without a sustainable business plan there exists no strategic frame-work under which to evaluate capital expenditure pro-grams The Commission required the parties in the Docket to further explore capital expenditure issues in conjunction with other risk-sharing mechanisms discussed elsewhere in the order The commission ordered a further evaluation of a proposed risk-sharing mechanism within the RBA Further-more the Commission ordered the parties to work together to establish appropriate metrics which the utility would report on its website
Once the total RAM Revenue Adjustment is calculated it is applied through a uniform adjustment to the per-kWh energy charge for all customer classes
Reconciling Actual Revenue with Authorized Revenue
RBAs record the monthly differences between target revenues and the adjusted recorded electric sales revenues The RBA also applies monthly interest equal to the annual rate for short-term debt from the cost of capital in each HECO Companyrsquos last base rate case to the simple average of the beginning and ending balances each month in the RBA In effect the RBA applies one-twelfth of the rate each month Finally the RBA provides for collection or return of the calendar year-end balances in the RBA and recovery of the RAM Revenue Adjustment over the subsequent May 1 through April 30 period The target revenue is the most recent Authorized Base Revenue or the re-determined Authorized Base Revenue calculated under the RAM
On or before March 28 the Company must file with the Commission a statement of the previous year-end balance in each RBA sub-account and the Authorized Base Revenue level for the current calendar year with supporting calculations An amortization of the year-end balance in the
RBA sub-accounts and the RAM Revenue Adjustment are recovered through the per-kWh RBA rate adjustments The rate adjustment occurs from May 1 of the current calendar year to April 30 of the next year
Complementary PoliciesCurrently electric utilities in Hawaii may use energy
efficiency to meet a portion of their Renewable Portfolio Standard requirements Starting in 2015 electricity savings from energy efficiency will be applied to the Statersquos Energy Efficiency Portfolio Standard which sets a target equivalent to 30-percent forecast sales by 2030 This goal is translated into a target of 14 percent annual savings HECO trans-ferred administration of all of its energy efficiency programs to a third party administrator in 2009 The administrator is compensated for satisfactory performance43
Because of its heavy dependence on petroleum as a generation fuel electricity prices in Hawaii are very high solar and wind are typically lower-cost resources for these systems HECOrsquos default residential rates are inclining block rates with a $900month customer charge and a three-block inclining rate design of $034kWh to $037kWh Residential customers can elect to take service under a TOU rate with off-peak mid-peak and priority-peak tiers Gen-eral service and large power service customers take service under a flat rate unless they opt to take service under a TOU
Hawaii is developing reliability standards in part as a response to deteriorating service quality as a result of distributed and customer-owned generation (see text box) In an effort to make electricity reliability and interconnection standards as transparent as possible the Reliability Standards Working Group was formed in the Feed-In Tariff docket and continues its work in Docket No 2011-0206 to find solutions to integrating high penetrations of renewable energy consistent with reliability and power quality standards
Energy Efficiency OutcomesHECO implemented revenue regulation in 2011 Since
2003 HECO has reported incremental energy efficiency savings between 0 and 05 percent of retail load with 131 percent savings reported in 2011 by Hawaii Energy the
Decoupling Case Studies Revenue Regulation Implementation in Six States
23
44 Hawaii PUC Decision and Order No 31288 Maui Electric Company Limited Docket No 2011-0092 (2013 May 31) Appendix C p 2
Statersquos ratepayer funded efficiency program administrator The company has not yet reported its savings for 201245 In addition HECO has seen more than a sixfold increase in renewable installations under its net metering and feed-in tariff policies since the inception of the revenue regulation plan
Revenue regulation represents a regulatory framework that removes the financial disincentive for utilities to pursue clean
energy strategies It doesnrsquot in and of itself align the utility business model with those utility policies and practices that address customer expectations In fact some commissions are concerned that it might create a dynamic in which the utility assured of its revenue needs becomes complacent and lacks motivation to innovate and develop strategies that may be more in line with the public interest
In a recent order (Docket 2011-0092 May 31 2013) the Hawaiian Public Utilities Commission addressed this big picture issue in a rate order for Maui Electric The Commission called out the management as lacking a long-term vision for creating customer value and expressed concern that ldquothe HECO Companiesrsquo over-reliance upon a link between the [Decoupling]
Agreement and utility financial health obfuscates utility performance and ultimately customer service and satisfactionrdquo44 The implementation of clean energy policies is not a singular goal but rather a policy that must be part of a larger effort to create customer value
The Commission laid out a hard path and a soft path to achieve the results they desire for consumers The hard path involves a closer examination of utility investments operations and expenditures The soft path is opened through the actions of management to create and execute a vision for the utility of the future The Commission remains committed to regulatory innovations that are in the public interest and will work with the utility consumer advocate and other stakeholders to create and implement this vision
The results of this effort will likely produce ideas and outcomes that will have applicability beyond this one utility
ResourcesHawaii Public Utilities CommissionDocket No 2008-0274 Final Decision and Order (August 31 2010)Docket No 2008-0083 Final Decision and Order (December 29 2010)Docket No 2011-0092 Final Decision and Order May 31 2013 including
Decision and Orders Nos 31288 and 31289Docket No 2013-0141 Final Decision and Order (February 1 2014) including
Decision and Order No 31908
45 EIA Form EIA-861 data files Available at httpwwweiagovelectricitydataeia861
Decoupling Case Studies Revenue Regulation Implementation in Six States
24
46 Lazar et al 2011
Discussion of the Six Utilities Overall
Authority The first step in implementing a revenue regulation
mechanism is to understand the authority of the regulating body the Public Utility Commission or PSC It is important for any Commission to clarify its justification for acting on revenue regulation in order to prevent any decisions from being overturned Over the years Utilities Commissions have relied on different justifications for implementing revenue regulation mechanisms Commissions have imple-mented revenue regulation at their own discretion justified by their directive to ensure safe reliable and economic public utility service to citizens to justify changing the regulatory environment In some cases the Commission is unable to engage on narrow issue ratemaking and rates can change only as the result of a full rate case In this case statutes must be amended to enable revenue regulation
In all of the case studies discussed here the Commis-sions first implemented revenue regulation at their own dis-cretion but each followed slightly different paths to do so The CPUC first implemented revenue regulation in 1978 at its discretion In 2001 after a period when mechanisms were suspended the California Legislature required that deviations from projected sales not result in under- or over-collections by utilities and so the CPUC re-implemented revenue regulation according to statutory requirement The Hawaii Public Utilities Commission implemented rev-enue regulation after an agreement between the utility the Governor and other stakeholders called for it In Idaho the Commission established a case in which to investigate rev-enue regulation and held a series of stakeholder workshops before implementing the policy The Massachusetts DPU adopted revenue regulation as a statewide regulatory policy and required individual utilities to file tariffs in response as the result of its general investigation into rate structures that promote demand-side resources The Maryland Com-mission implemented revenue regulation for BGE when the utility requested the mechanism Thus the impetus to develop a revenue regulation mechanism may come from different sources and the Commission may be comfortable
in moving forward under their general supervisory statutes Nevertheless specific statutory language can be helpful to shore up the existing authority
Authorized Revenue Requirement Under the traditional regulatory framework the Com-
mission (or other authority in the case of publicly owned utilities) must determine a utilityrsquos revenue requirement This function does not change under revenue regulation The revenue requirement of a utility is the aggregate of all the operating and other costs incurred to provide service to the public This typically includes operating expenses depreciation and the cost of capital invested including in-terest on debt and a ldquofairrdquo return on equity to investors The (simplistic) formula for determining revenue requirements is as follows
Revenue Requirements = (Rate Base times Rate of Return) + Operating Expenses + Depreciation +Taxes
Traditionally the revenue requirement along with sales is used to determine the rates consumers will pay for elec-tricity46 The rates are also broken down by customer class and intraclass tariffs are created based usually on a cost of service study that determines each customer class and subclass contribution to the utilityrsquos costs The (simplistic) formula for determining the rate per unit is
Rate = Revenue Requirement divide Units Sold
In this way rates are set to allow the utility to exactly recover its revenue requirement when the sales level used to calculate rates is equal to actual sales However it is important to recognize that actual expense and revenue varies with actual sales When actual sales are greater than the sales level used in ratemaking revenue increases and expenses increase by a different amount when actual sales are lower than the ratemaking sales level actual revenue
Decoupling Case Studies Revenue Regulation Implementation in Six States
25
declines and expenses decrease by a different amount Under revenue regulation rates are initially set in the same way but when actual sales differ from the level used to calculate rates the actual revenue level is maintained at the rate case amount as rates are allowed to vary inversely with salesmdashincreased sales lead to decreased rates and vice versa Because the primary expenses that change in the short run as sales levels change are power supply expenses and most regulators allow these to be tracked using a power cost adjustment mechanism revenue regulation mechanisms are generally designed to ensure recovery of the non-power costs (which do not change significantly in the short-run) as sales volumes change
Revenue regulation ensures that actual revenue is equal to the revenue requirement established by the Commission or appropriate authority Although the description above presents an overly simplified view of the revenue require-ment and its use in traditional price regulation and revenue regulation there are many variations on how a Commis-sion can establish a revenue requirement particularly when implementing revenue regulation With revenue regulation as in traditional ratemaking imprudent costs can always be removed from rates and there is no change to the ability of a Commission to impose penalties
Utility Functions to be IncludedFirst the regulator must determine which utility func-
tions will be included in the revenue regulation framework With vertically integrated utilities this usually includes a utilityrsquos regulated generation transmission and distribution units As we discuss below however it is critical to struc-ture power supply recovery mechanisms to avoid providing for double-recovery of certain power supply costs For utili-ties operating in areas of the country that have restructured electricity markets only the regulated distribution busi-ness is decoupled Utilities that also provide gas services
Pacific Gas amp Electric Future test year
Idaho Power Company Historic test year
Baltimore Gas amp Electric Hybrid test year
Wisconsin Public Service Corporation Future test year
National Grid Historic test year
Hawaiian Electric Company Future test year
Table 2
Test Year Used
may have their gas distribution business operating under revenue regulation as well
Test YearOne consideration in establishing the revenue require-
ment is what period of time will be used as a ldquotest periodrdquo or ldquotest yearrdquo The test year is the year on which the Com-mission will base its computations of the utilityrsquos total costs and sales levels A historic test year uses actual data on sales and costs from a past year Whereas a historic test year allows for the use of actual cost data it cannot account for expected variations in sales A future test year requires assumptions to be made about a utilityrsquos sales in a future year This can allow expected changes in sales like those from energy efficiency programs to be included in sales
projections however because regulators are relying on estimates provided by the utility there may be a greater risk for inaccuracy A Commission may also choose to use a test year that includes both past and future periods This may provide a sense of balance between historic and future data Furthermore as the case proceeds the Commission can require the utility to substitute historical data for projected data from the test year
Rate of ReturnAs in any rate case regulators
must determine the appropriate rate of return that a utility can earn on its investments including the cost of debt and the allowed ROE for its shareholders The approved ROE is only used to establish the return on investments that are included in the rate base when determining revenue require-
Pacific Gas amp Electric Electric generation and distribution gas distribution
Idaho Power Company Electric generation and distribution
Baltimore Gas amp Electric Electric distribution gas distribution
Wisconsin Public Service Corporation Electric generation and distribution
National Grid Electric distribution
Hawaiian Electric Company Electric generation and distribution
Table 1
Business Unit Included in the Revenue Regulation Model
Decoupling Case Studies Revenue Regulation Implementation in Six States
26
47 In a rate case the Commission determines an allowed return on equity This is used to set a price (price regulation) or an allowed revenue requirement (revenue regulation) Once set however the actual return earned by the utility is affected by anything that changes either revenue or expenses for example an increase in employee compensation a change in the number of employees or under price regulation a change in sales volumes
48 Lazar et al 2011
ments Although revenue regulation ensures that a utility recovers no more or less than its target revenue revenue regulation does not guarantee that the utility will earn the authorized ROE Depending on how a utility manages its costs between rate cases it will realize an actual ROE either higher (in the case of reduced costs) or lower (in the case of increased costs) than the authorized level47
A utilityrsquos allowed ROE generally represents the return deemed necessary to attract investment considering the level of risk of that investment Riskier investments require a higher return to attract investors and vice versa Util-ity earnings can be volatile because of short-run impacts on sales volumes and revenues which include changes in sales owing to weather economic conditions and energy efficiency and DG programs This volatility typically causes utilities to retain a higher level of equity in their capital structures so that reduced revenues do not leave them un-able to service their debt Revenue regulation can reduce this volatility by stabilizing revenues regardless of the cause Because of this reduced risk many stakeholders have proposed that the implementation of a revenue regulation mechanism be associated with a corresponding reduction in the utilityrsquos equity capital ratio (the percentage of capital supplied by common equity) This reflects the utilityrsquos more stable revenue owing to revenue regulation and reduces the overall revenue requirement that will be recovered from consumers48
An alternative option to reducing the utilityrsquos equity ratio is to reduce the ROE reflecting a lower risk level For the utilities included in these case studies only BGE and Mass Electric experienced a reduction in their ROE The Com-mission did not reduce BGErsquos ROE at the time the revenue regulation mechanism was implemented but reduced it by 50 basis points during the subsequent rate case The Mas-
sachusetts Commission did not reveal its adjustment but incorporated a lowered ROE into its decision
Absent an explicit adjustment to the cost of capital investorsrsquo expectations will adjust to the presence of rev-enue regulation if its presence is reliable The more stable earnings will likely in time contribute to a higher credit rating That in turn will lead to lower cost debt that will be revealed in future cost of capital calculations An adjust-ment to the ROE or capital structure by the regulator in a rate proceeding will be reflected immediately in lower rates to consumers simply allowing the utilityrsquos credit rating to improve over time and its cost of debt to decline will have the same effect but on a lagged basis as new bonds are is-sued at lower interest rates49
Beginning in 2004 Standard and Poorrsquos began publish-ing ldquorisk profilesrdquo for utilities which classified utilities based on their earnings variability and other risks those with more stable earnings were determined eligible for higher bond ratings at any given equity capitalization ratio (or alternatively able to retain a given bond rating with a lower equity ratio)50 One utility with a revenue regulation mechanism Northwest Natural Gas was believed to have had their business risk profile upgraded by one step in response to the benefits of the mechanism51
Effect on Bond RatingsRevenue regulation stabilizes a utilityrsquos revenue streams
reducing risk to investors this reduced risk may be a contributing factor in an increase in a utilityrsquos bond rating Bond rating agencies have recognized that revenue regula-tion mechanisms and other mechanisms that reduce net earnings volatility and risk contribute to a lower cost of capital for the utility52 Standard and Poorrsquos has explicitly stated that it ldquoviews decoupling as a positive develop-
49 Lazar et al 2011
50 Standard and Poorrsquos (2004 June 2) New Business Profile Scores Assigned for US Utility and Power Companies Financial Guidelines Revised
51 Christensen Associates (2005 March) A review of distribution margin normalization as approved by the Oregon Public Utility Commission for Northwest Natural
52 Lazar et al 2011
Decoupling Case Studies Revenue Regulation Implementation in Six States
27
This topic raises a note of caution if mechanisms are not well designed double-recovery of costs can occur for verti-cally integrated utilities that provide both power supply and distribution services For example if a per-customer
revenue regulation mechanism includes investment-related power supply costs in the revenue-per-customer formula but excludes fuel and purchased power costs that are recovered through a separate tracking mechanism double recovery of some power supply costs is likely If the utility experiences cus-tomer and sales growth the amount it recovers for investment-related power supply costs will go up However if that utility serves this growth by operat-
ing existing power plants more by selling less power on the surplus market or by purchasing power from other suppli-ers it will not incur any increases in the type of power sup-
53 Standard amp Poorrsquos (2008 February 19) Decoupling the vehicle for energy conservation
ment from a credit perspectiverdquo53 However in the case of the utilities examined in this report none experienced an improved credit rating after the implementation of revenue regulation with the exception of PGampE However PGampE came out of Chapter 11 bankruptcy in the same year that its revenue regulation mechanism was implemented mak-ing it impossible to attribute the improvement to revenue regulation alone Bond rating changes are generally slow to evolve Numerous other factors are taken into account when assigning an overall credit rating which appear to have outweighed any positive effect of revenue regulation These factors certainly include the recession of the US economy that began in 2007
Customer Classes IncludedWhen determining the target revenue for a utility rev-
enue regulation mechanism regulators must also consider which customer classes to include in the mechanism In some cases industrial customers have objected to a rev-enue regulation mechanism This is due to the wide dif-ference in rates among customers making the design of a revenue regulation mechanism more challenging If regula-tors choose to exclude a class of customers from revenue regulation they must determine the revenue requirement associated with serving only the included customer classes This generally requires a detailed cost of service study to ensure that revenue responsibility is accurately allocated by customer class
Included CostsFinally regulators may wish to exclude specific costs
from the overall revenue requirement if those costs will be tracked through another mechanism like fuel costs in a PCA mechanism energy efficiency program expenditures or smart grid costs for example Separate tracking mecha-nisms can also be used for those costs that are difficult to
Pacific Gas amp Electric All customer classes
Idaho Power Company Residential and small general service
Baltimore Gas amp Electric Residential and small general service
Wisconsin Public Service Corporation All customer classes
National Grid All customer classes
Hawaiian Electric Company All customer classes
Pacific Gas amp Electric
Idaho Power Company
Baltimore Gas amp Electric
Wisconsin Public Service Corporation
National Grid
Hawaiian Electric Company
Table 3
Customer Classes Included in Revenue Regulation Mechanism
Table 4
Costs Excluded From Revenue Regulation Mechanism
project based on historical data or costs over which the util-ity has very little control like fuel costs Although revenue regulation tracks collected revenue mechanisms like Fuel Adjustment Clauses Purchased Power Adjustments and Energy Efficiency Riders can be designed to track actual costs as well as collected revenue
Energy procurement costs
All variable costs
Energy supply costs
Energy costs
Energy supply costs for basic service customers transmission costs the energy efficiency system benefits charge and reconciling charge and costs recovered through the residential assistance adjustment factor
Fuel and purchased power
Decoupling Case Studies Revenue Regulation Implementation in Six States
28
54 We use the RAM term applied in Hawaii here to address any type of attrition or similar mechanism other than a revenue-per-customer framework that changes the allowed revenue between general rate cases
ply costs accounted for in the revenue per customer (RPC) calculation The increased power supply costs to serve that growth will be recovered through the fuel and purchased power tracking mechanism The net effect for the utility will be to recover incremental power supply costs twicemdashonce in the per-customer mechanism and again in the fuel and purchased power mechanism It is essential to make sure that the other adjustment mechanisms do not overlap the cost impacts that are treated in the revenue regulation mechanism One way to do this is to ensure that all power supply costs (investment labor fuel purchased power) are recovered through a single mechanism There are several ways to achieve this
a) A comprehensive power supply recovery mechanism that includes all power supply costs that is separate from the costs treated in the revenue regulation adjustment (eg Puget Sound Energy Washington State)
b) No power supply adjustment whatsoever with all utility costs included in an RPC mechanism (eg National Grid)
c) An annual attrition calculation with all costs reviewed for changes since the last proceeding (eg HECO)
Revenue Adjustment Mechanism in Revenue Regulation
A RAM54 is not necessary to achieve revenue regulation but provides attrition reliefmdashincreasing authorized revenue commensurate with increased costsmdashbetween rate cases Whereas revenue regulation sets a target revenue that the utility will earn regardless of sales levels the RAM adjusts the target revenue between rate cases Regulators may choose to take several different approaches to RAM
bull No RAM Regulators may choose not to implement a RAM leaving the revenue requirement unchanged between rate cases This requires the utility to request a rate case when it requires additional revenue to cover its costs
bull Stairstep Stairstep adjustments provide predetermined increases in target revenue These increases can be determined during a rate case and generally reflect forecasts of cost growth
bull Indexing Indexing ties adjustments to the target revenue to multiple factors like inflation productivity customer growth and changes in capital expenditures
bull RPC The RPC approach is a form of indexing RPC adjusts the total revenue requirement for the
number of customers served Regulators using an RPC mechanism will determine the revenue requirement per customer and the overall revenue requirement will be determined by multiplying the total number of customers by the revenue requirement per customer The amount of revenue required to serve each customer can be determined separately for customer classes and for existing and new customers This way the RPC method accounts for a utilityrsquos growth in fixed costs that is related to growth in the number of customers served RPC is useful where the correlation between cost growth and customer growth is significant It also protects customers from making up the deficit if there is a loss in customer load such as if a large business closes down or relocates
bull Hybrid Hybrid RAMs generally use stairstep increases to account for projected capital costs and indexing to account for OampM expenses
Adjustments from any type of RAM can be implemented automatically or through an attrition proceeding Some stakeholders oppose adjustments to the revenue require-ment outside of a rate case on the basis that this could allow the revenue requirement to increase significantly without examination of the impact on ratepayers or with-out due consideration of other costs and revenues For this reason some regulators choose to cap the total adjustment that can be made to the revenue requirement outside of a rate case
Table 5
Type of Revenue Adjustment Mechanism
Pacific Gas amp Electric
Idaho Power Company
Baltimore Gas amp Electric
Wisconsin Public Service Corporation
National Grid
Hawaiian Electric Company
Hybrid
RPC
RPC
RPC
No RAM potential capital expenditure adjustment
Hybrid
Decoupling Case Studies Revenue Regulation Implementation in Six States
29
55 Because this method results in changes in the price for service that are calculated after that service has been provided it fails the ldquono retroactive ratemakingrdquo statutes that guide most electricity regulators Customers are entitled to know the price of the commodity they are consuming at the time they use it
56 The closest to a current method in use for electric utilities in the BGE system of monthly reconciliation
Table 6
Tracking and Accrual of Difference BetweenActual and Authorized Revenue
Pacific Gas amp Electric
Idaho Power Company
Baltimore Gas amp Electric
Wisconsin Public Service Corporation
National Grid
Hawaiian Electric Company
Track Difference
Monthly
Monthly
Monthly
Yearly
Yearly
Monthly
Accrual Period
Year
Year
Month
Year
Year
Year
Calculation of Actual RevenueRegulators have options when ensuring that actual
revenue equals target revenue under revenue regulation First regulators must decide how to determine ldquoactual revenuerdquo In most cases actual revenue simply equals the amount of revenue a utility collects from its customers The Idaho Public Utilities Commission however has chosen to use weather-normalized revenues as the basis for utility revenues in revenue regulation Although this prevents the utility from recovering revenue lost to it owing to milder than expected weather it further complicates the revenue regulation mechanism and reduces its risk-reduction ben-efits By the same token if weather is severe and increases sales above the revenue requirements weather normaliza-tion would allow the utility to retain some of the revenues
Next regulators must determine whether to implement revenue regulation using a current or accrual method
bull Current Method With the current method of revenue regulation the target revenue for a period say a month is divided by the actual sales in that period to determine the rate per kWh The current method ensures that actual revenue equals target revenue by calculating the rate at the end of the period so that the target revenue can be recovered The current method allows for no lag in revenue recovery One effect of this method is that although customer rates vary total bills are generally more stable For example in a hotter than expected July customers will purchase more kWh but they will be charged a lower rate A milder than average winter would lead to fewer sales but at slightly increased rates This way customers do not experience the same bill variability as they would if rates were set before the sales deviations occurred On the other hand the current method does not provide customers with the ability to plan ahead based on a predictable rate for electricity This method has been used for revenue regulation of natural gas utilities55
bull Accrual Method Under the accrual method rates are set based on an assumed sales level and the differences between actual and target revenue are allowed to accrue over some period Then the total difference between actual and target revenue is reconciled through an adjustment to rates in the subsequent period this is known as the true-up process Presently all revenue regulation mechanisms for electric utilities use the accrual method56
If regulators use the accrual method of revenue
regulation they will next need to determine the period over which the difference between actual and target revenue will be allowed to accrue One year is typical however shorter periods are also used Next the frequency of comparing collected revenue to target revenue should be determined It is possible to do this comparison only once at the end of the accrual period It is common however for comparisons to occur more frequently often monthly When revenues are compared within the accrual period the differences are tracked generally for the purpose of applying interest to the difference that will be deferred until the end of the accrual period
Rate AdjustmentsIn designing a revenue regulation mechanism there are a
number of decision points that regulators need to consider to balance the interests of all the stakeholders One of the decision points revolves around the determination of the mechanism used to adjust rates The issues that regulators need to consider include the following1 Rate Case Requirements One of the often-mentioned
concerns about surcharges especially when they are numerous is how that will impact the frequency of rate cases For regulators and stakeholders rate cases provide
Decoupling Case Studies Revenue Regulation Implementation in Six States
30
the best mechanism to correctly align rates and costs but they are time-consuming and expensive for all parties This is because a rate case presents an opportunity to closely examine all of the utilityrsquos expenses and adjust rates to reflect cost increases and decreases Because under a revenue regulation mechanism the goal is to match revenues received from all customers with revenue requirements a correct determination of revenue requirements is important as is the specification of appropriate cost indices to adjust the revenue requirements As the time between rate cases increases some regulators feel the base rate case data even with adjustments need to be reexamined As a result some regulators have chosen to mandate the frequency of rate cases to address this whereas others have not It may be that in some cases where there are numerous surcharges recovering a multitude of costs there may not be as many costs subject to review in the rate case making it less significant to a regulator than a case in which most costs are being analyzed and recovered in the rate case itself
2 Collection Mechanism Integrally tied to the mechanism for recovering revenues is how the utility will collect or refund the revenues Options that are available include recovery through a rate case or periodic adjustments to rates through a surcharge mechanism As can be seen by the case studies depending on the plan in place some utilities have very discreet requirements dictating the frequency of rate cases with adjustments occurring in those cases or between those cases Other utilities have no requirements upon them with respect to the frequency of rate case filings This will be discussed in more detail below What does emerge from these case studies is that the discreet components or choices in how to execute a revenue regulation plan are carefully interwoven to create a holistic approach Each component works with the other and the value of this case study is in examining the different pathways that can be chosen As discussed previously some of the commissions have authorized revenue regulation to recover the revenue requirements in the last rate case whereas others have authorized adjustments to rates between rate cases this impacts the pathway that the adjustment mechanism takes
3 Timing How often should rates be adjusted to true up to the utilityrsquos revenue requirement States have chosen different options ranging from monthly to annually
4 Allocation of Revenue Regulation Revenue Surpluses or Deficits There are a number of decision points regarding allocation Should the revenue regulation apply to all rate classes or just the smaller customers whose usage per customer and load variations are not as dramatic as those of larger-use customer classes Should there be a different allocation to each rate class or should the allocation of costs among the classes be the same Different mechanisms accomplish different goals Some states have allocated revenue regulation revenues based on the revenues lost by customer class as a result of energy efficiency This can sometimes be a political decision to mitigate opposition to energy efficiency programs by large customers Other states recognize that the system savings resulting from energy efficiency benefit all customers so that all customers should pay equally
5 Carrying Charges Depending on the timing issue discussed previously regulators may want to consider carrying charges on any adjustments This should be symmetrical in its application however so that it applies to surcharges and refunds Consideration should be given for the basis of the carrying charge rate whether weighted average cost of capital rate of return a risk-free rate or some other mechanism should be adopted
6 Rate Caps In order to mitigate potential rate impacts a regulator may want to consider a cap on how much rates can go up when the revenue regulation adjustment is made This might be more critical if the regulator is aware of other potential rate increases that will impact customersrsquo bills If a cap is used the case in which the utilityrsquos adjustment would exceed the cap must be considered Some regulators have opted to allow the utility to carry over the excess unrecovered amount for a period of years whereas others do not This allows the utility to recover those revenues in a subsequent year when perhaps the adjustment is less As a practical matter however adjustments of greater than three percent are less common as shall be discussed later
7 Impact on At-Risk Consumers Low-income and consumer advocates have expressed concern about revenue regulation as a vehicle for annual rate increases without the scrutiny of a general rate case creating rate increases for the low-use customers doing the most to constrain usage and help achieve targeted energy savings One proposal to address this has been to impose any resulting surcharges only to above-average usage
Decoupling Case Studies Revenue Regulation Implementation in Six States
31
57 Cavanagh and Howat (2012 May 2) Finding common ground between consumer and environmental advocates Electricity Policy
58 The most common criticism of future test years is that utilities forecast costs under an assumption that all authorized personnel positions will be filled while in retrospect any large organization has some level of vacancy in its employee count A historic test year captures this effect fully
customers and any resulting credits only to below-average usage57
Rate Case RequirementRequirements as to the frequency of rate cases can be
tied to the recovery mechanism or to the entire regulatory framework for implementing revenue regulation In the cases studied two of the utilities require periodic rate cases PGampE every three years and WPS every year Two others National Grid and HECO require annual mini rate cases explained later in which adjustments are made and two others IPC and BGE have no requirements for scheduled rate cases Nevertheless if the concern is to ensure that the utilityrsquos revenue recovery meets its revenue requirements some kind of periodic rate case to examine costs is appropriate Having periodic rate cases can provide a measure of assurance to consumer advocates that the level at which the revenues and hence the rates are set is correct One of the criticisms of revenue regulation is in fact the lack of rate cases to produce a proper level of confidence in the allowed amounts Multiple surcharges are usually additive to existing rates therefore not permitting an opportunity to reduce the base rate for reductions in cost Moreover the infrequency in cases impedes the examination of rate allocations as would occur through a cost of service study
This is a particular issue where utilities are augmenting power supply with purchased power from independent power producers which is the most common method for acquiring wind and solar production today The increased cost for purchased power may flow through a fuel and purchased power adjustment mechanism while the (depreciating) investment in conventional power plants remains static in base rates
Both PGampE and WPS use a future test year that allows the utility to project revenue requirements during the time period that the rates are to be in effect The benefit to this is that it can help identify and account for projected changes in costs over the timeframe between rate cases However given that these costs are utility projections most consumer advocates have less confidence in these numbers than they would using actual numbers from a historical or only hybrid test year58 When trying to garner support for revenue regulation from more skeptical stakeholders using a future test year may not be helpful Furthermore in the case of WPS that has annual rate cases using a future test year becomes less justifiable as revenues are recalculated annually anyway
The absence of a rate case requirement can also cause consternation among detractors of revenue regulation because of the belief that the utility will be guaranteed its revenue requirements for as long as it is satisfied with that level irrespective of how well it manages However this is no different from the status quo in traditional regulation in most places The incentive to manage well is always there with or without revenue regulation as it translates into more profit for the utility
In the cases of HECO and National Grid the mini rate cases serve two purposes In the one instance it serves as a means to reconcile revenue recovery with revenue requirements and in the second instance it provides an opportunity to adjust rates in accordance with changes in costs Specifically for National Grid the revenue requirement is adjusted to reflect capital expenditures For HECO revenues are adjusted to reflect changes in the cost of service In the two examples here revenue regulation is wrapped in with other adjustments as part of a mini adjustment Given the structure for determining revenue requirements which accounts for changes in costs including revenue regulation within the mini rate cases is a workable option
These examples highlight how rate cases can be used to adjust revenue requirements either in a more controlled regulatory environment with frequent rate cases or left to the utilityrsquos discretion to decide when to adjust costs A set schedule of periodic rate cases such as that used by PGampE may strike an appropriate balance for reviewing revenue requirements however with the modification of a partial historical partial forecasted test year Frequent rate cases can depending on the resources of the regulator and stakeholders be too costly and time-intensive When there are too many rate cases stakeholders and regulators may not be able to dedicate the level of resources needed for any one proceeding and may be spread too thin Regular known rate cases at reasonable intervals may strike the best balance of adequate review and adjustment of revenue requirements
Decoupling Case Studies Revenue Regulation Implementation in Six States
32
Collection Mechanism and TimingThe collection mechanism for the differential between
actual and authorized revenue requirements varies by util-ity as well Both PGampE and WPS do not have adjustment clauses or surcharges but instead have structured their revenue regulation plans to recover their costs in a rate case with rates adjusted annually Although PGampE has rate cases every three years the utility files its preliminary forecast every September 1 for the following year including adjust-ments for revenue regulation and other costs This practice promotes transparency keeping all stakeholders aware of the current situation of the utility IPC BGE National Grid and HECO use surcharges on customer bills to collect or credit the difference between actual revenues collected and the revenue requirement Although the other three (IPC National Grid and HECO) calculate the rate adjustment annually only BGE does a more contemporaneous adjust-ment of one month Certainly where there are no regularly scheduled rate cases using an adjustment mechanism becomes more critical PGampE has created a tracking mecha-nism known as a balancing account that allows the utility to track the surpluses and deficits to help ensure accuracy at year end when rates are actually adjusted The creation of such monthly balancing accounts will make it easier at the end of the year to track what happened each month and then determine the adjustment for that year It provides a more detailed trail for review and analysis by stakeholders and regulators However other mechanisms that just look at total revenues as compared to revenue requirements at the end of the year can work as well
Table 7
Rate Case Requirements
Table 8
Rate Adjustments
Table 9
Allocation of Surplus or Deficit
Pacific Gas amp Electric
Idaho Power Company
Baltimore Gas amp Electric
Wisconsin Public Service Corporation
National Grid
Hawaiian Electric Company
Pacific Gas amp Electric
Idaho Power Company
Baltimore Gas amp Electric
Wisconsin Public Service Corporation
National Grid
Hawaiian Electric Company
Pacific Gas amp Electric
Idaho Power Company
Baltimore Gas amp Electric
Wisconsin Public Service Corporation
National Grid
Hawaiian Electric Company
Every three years annual ldquoattritionrdquo adjustments in between
No requirement
No requirement
Annual rate case
Annual capital expenditure adjustment case
Abbreviated annual rate case
Base rates adjusted annually
Annual adjustment through surcharge
Monthly adjustment through surcharge
Annual adjustment through rate case
Annual adjustment
Annual adjustment
Allocated to all customers according to business unit (eg electric distribution electric generation)
Included in the annual adjustment mechanism for each customer class
Separate for each customer class
Allocated to all customers except certain tariffs (see above)
Separate for each customer class
Separate for residential and commercialindustrial
Allocation of Revenue Regulation Revenue Surpluses or Deficits
The allocation of revenue regulation revenue surpluses or deficits should be symmetrical so that overpayments are credited to customers just as underpayments are paid by those same customers The six utilities studied fol-low that formula The application of revenue regulation however varies from utility to utility BGE and IPC ap-ply revenue regulation to the residential and commercial classes thereby excluding industrial customers In contrast however PGampE WPS National Grid and HECO allocate revenue regulation adjustments to all customer classes In terms of how the costs are allocated IPC BGE WPS National Grid and HECO allocate costs differently among the customer classes PGampE however allocates costs uni-formly among the customers Because PGampE has separated its business units it also separately calculates and allocates
Decoupling Case Studies Revenue Regulation Implementation in Six States
33
Table 10
Carrying Charges
Table 11
Cap on Rate Adjustment
Pacific Gas amp Electric
Idaho Power Company
Baltimore Gas amp Electric
Wisconsin Public Service Corporation
National Grid
Hawaiian Electric CompanyPacific Gas amp Electric
Idaho Power Company
Baltimore Gas amp Electric
Wisconsin Public Service Corporation
National Grid
Hawaiian Electric Company
None
Yes
None
Yes at the short-term debt rate
Yes at the customer deposit rate
Yes at the customer deposit rateNo
3 rate cap excess carried over to next period
10 rate cap excess carried over to next period
Cap of $14 million per year
$170 million in CapEx
No
revenue regulation surpluses and deficits among its electric distribution gas distribution and electric generation busi-nesses This illustrates that there are several ways to address revenues from revenue regulation depending on the policy outcomes that are desired
Carrying ChargesCarrying charges applied to uncollected or surplus rev-
enues can be used to account for the time value of money and the lost opportunity or value to having those revenues in hand PGampE and BGE do not accrue carrying charges On the other hand IPC WPS National Grid and HECO do For BGE given that the revenue regulation revenues are reconciled and recovered monthly it would make little sense to include a carrying cost Where carrying costs have been used they have included in the cases of these utili-ties the short-term debt rate or the customer deposit rate which for one utility is six percent and probably close to the short-term debt rate Thus the carrying charge rates are appropriately at the lower end of the spectrum reflecting their short-term nature In the application of the carrying charge symmetry should be preserved by applying it to both deficits and surpluses Application of carrying charges given the short period that costs are carried (one year) is somewhat discretionary Although it does more accurately account for costs it does add a modest level of complica-tion in tracking costs
Rate Caps and CollarsOne of the ways to protect customers in the event of sig-
nificant adjustments is to impose a rate cap (or collar) that limits the amount of a rate increase (and decrease) Some customers are sensitive to changes in foundational costs like utility bills and if costs are going to rise they benefit from a pattern of steady modest increases rather than a large step increase Any structural increases in rates attributable
to reductions in sales or increases in costs recognized by the revenue regulation plan would be eventually included in rates under any system A cap reflects a controlled way to manage customer expectations and customer impacts Structural changes can only be managed for a while until a complete rate case is needed to reset all assumptions
Typically when a rate cap is imposed if the formulaic increase exceeds the cap or collar the utility will be able to carry over any uncollected revenues until the next rate adjustment Two of the utilities studied PGampE and HECO do not have rate caps On the other hand the other four utilities do include rate caps in varying amounts National Grid has a one-percent revenue cap whereas IPC and BGE have a one-percent and a ten-percent rate cap respectively WPS unlike the others has a cap tied to the dollar amount of $14 million as opposed to a percentage Consistent with the goals of revenue regulation all of the utilities studied have a carryover provision that is important for reducing the risk that the utility will not recover its revenue require-ments
Note that National Grid differs from BGE and HECO in that its cap is on revenues whereas the other two utilities cap rates and rate impacts A revenue cap is more focused on ensuring minimal change to the revenue requirements authorized by the commission National Grid as discussed previously allows for mini rate cases to adjust the rev-enue requirements Having the one-percent cap limits the amount of increase that can occur through that process requiring revenue changes that are greater to occur in a full rate case However note also that some of the adjustments allowed in the mini rate case have their own separate cap The IPC rate cap is in line with what many other utilities with caps have in place which generally range from one to three percent The ten-percent rate cap in the BGE plan is
Decoupling Case Studies Revenue Regulation Implementation in Six States
34
59 Morgan P (2012 December) Graceful Systems LLC A decade of decoupling for US energy utilities rate impacts designs and observa-tions p5
reflective of its monthly adjustment pattern An annual ad-justment allows more time to smooth out peaks and valleys in revenues whereas a monthly adjustment will be influ-enced by more of the spikes (particularly weather-driven variation) thus the need for a larger bandwidth for the car-ryover Like a variable energy rate or fuel adjustment clause that fluctuates monthly the monthly adjustment introduces more volatility into the rates
Actual Historical AdjustmentsFor many ratepayer advocates there is a concern that
some of the utility management risk will be transferred to customers as a consequence of a policy that seeks to ensure that the utility will be made whole However the utility re-tains management risk and the requirement to demonstrate that it has acted prudently Thus the utility still has just as much of an incentive to operate efficiently as it did without revenue regulation If the utility can lower its costs it can still increase its profits Second by designing rates symmet-rically such that under- and over-recoveries are reconciled it provides customers with an opportunity to obtain credits that under traditional regulation would be retained by the utility It has often been opined that when there are large
gaps in time between utility rate cases it is because the utility is over-earning and exceeding its revenue require-ments In those instances customers never get to examine what the utility is collecting much less receive a refund Under revenue regulation with its periodic adjustments and scheduled general rate cases the revenue requirements are examined and refunds or credits allocated such that customers have a better knowledge base for understanding the utilityrsquos earnings And annual reconciliation of the util-ityrsquos actual revenues versus authorized revenues provides consumers with a tool to reign in excess revenue recovery beyond authorized amounts Third the adjustments that do occur under revenue regulation are manageable and frequently less than the adjustments customers are used to seeing on their bills for fuel or variable generation rates or for the myriad of other surcharges that can be tacked on to a customerrsquos bill such as an infrastructure (smart grid) sur-charge maintenance upgrade fee regulatory asset charge or system benefit charge
As seen in Figure 1 the range of rate impacts cluster around plus or minus two percent but can at times exceed plus or minus five percent The total of surcharges has somewhat exceeded the total of credits
Figure 1
Total Utility Decoupling Adjustment Rate Impacts59
300
250
200
150
100
50
0
Nu
mber
of
Dec
oup
lin
g A
dju
stm
ents
Over -5 -4 to -5 -3 to -4 -2 to -3 -1 to -2 0 to -1 0 to 1 1 to 2 2 to 3 3 to 4 4 to 5 Over 5
Percentage Rate Impacts
SurchargesRefunds
ResidentialAll
Other
Commercial
Total
Decoupling Case Studies Revenue Regulation Implementation in Six States
35
60 Id p 3
61 Schultz T Energy Efficiency at Idaho Power Available at httpwwwenergyidahogovenergyalliancedida_powerpdf
As can be seen with the utilities studied above the larger fluctuations are attributable to adjustment mechanisms that are reconciled more frequently such as monthly as those are less able to smooth out anomalies as an annual adjust-ment would do From a dollar perspective for the roughly 64 percent of adjustments that fall within the plus or minus two-percent range the monthly bill impact is approxi-mately $230 for average electric customers and $140 for average gas customers60
Of the six utilities studied the fluctuations in adjustment have for the most part stayed within the one- to three-per-cent range as shown below
bull PGampE from 2005 to 2012 has had annual revenue regulation adjustments ranging from minus143 percent to 415 percent with an average adjustment of 197 percent
bull For IPC the adjustments are separated between residential and commercial customers For residential customers the annual adjustments from 2007 through 2011 ranged from 077 percent to 258 percent for an average of 162 percent As for the commercial customers the annual adjustments for that same period were higher ranging from 104 percent to 424 percent with an average adjustment of 252 percent
bull BGE has monthly adjustments that ranged from minus1853 percent to 3013 percent with an average of 057 percent for residential customers from March 2008 through August 2012 For General Service Customers the monthly adjustment ranged from minus2264 percent to 2462 percent The average adjustment was 1308 percent
bull For WPS the annual adjustments from 2009 through 2011 ranged from minus145 percent to 378 percent for residential and small commercial and from minus314 percent to 899 percent for commercial Note that because of a $14 million per year cap some of these percentages were carried over The average annual adjustment for residential and small commercial and for commercial was 163 percent and 215 percent respectively with carry-overs to subsequent years
bull For Massachusetts Electric and Nantucket Electric both of which operate under National Grid the annual revenue regulation adjustment for all for 2011 and 2012 was minus0105 percent and 0315 percent for an average revenue regulation adjustment over the two years of 0105 percent
bull HECO like National Grid has one annual revenue
regulation mechanism for its customers which resulted in adjustments in 2011 and 2012 of 063 percent and 107 percent respectively for an average adjustment of 085 percent
As can be gleaned from the above information the range of average adjustments for small use customers was a low of 0105 percent for National Grid to a high of 197 percent for PGampE For larger use customers the range was a low of 0105 percent for National Grid to a high of 252 percent for IPC This demonstrates that on average for these utilities with well-developed and diversely designed revenue regula-tion proposals their adjustments on average stayed at or below approximately 25 percent
One of the metrics for determining if a revenue regula-tion program is working successfully that was discussed above was the impact on rates of a revenue regulation mechanism As can be seen by the analysis of the adjust-ment levels for each of the utilities they are within a rea-sonable range
Complementary Policies Although a revenue regulation mechanism does not need
to be accompanied by other policies energy efficiency is frequently at the root of the reason revenue regulation was proposed in the first place The states examined in this pa-per have various obligations for energy efficiency achieve-ment placed upon their utilities Only Idaho does not have an Energy Efficiency Resource Standard but energy efficiency objectives are developed through an integrated resource plan process Energy efficiency spending at IPC has increased dramatically in recent years61
In recognition of the fact that revenue regulation only removes the disincentive to pursue energy efficiency several states have instituted some form of incentives to reward the desired outcome This mechanism can not only incentivize management to aggressively pursue energy efficiency but also make shareholders supportive in the face of lost invest-ment opportunity
Rate design can also play an important part in assist-ing the utility in achieving favorable energy efficiency outcomes Inclining block rates penalize inefficient use of electricity and shorten payback times from the customer perspective Because efficiency reduces consumption at
Decoupling Case Studies Revenue Regulation Implementation in Six States
36
62 Optional rate designs for PGampE include TOU and Peak Time Pricing
63 IPC also has an optional TOU rate design
64 Optional rate designs for this utility include TOU Critical Peak Pricing and Contract
65 National Grid also offers optional TOU and flat rate designs
66 HECO also offers optional TOU and flat rate designs
67 See eg Alexander B (1996 April) How to construct a service quality index in performance-based ratemaking Electricity Policy
the tail block rate the value of kWh savings is greater than with flat rates On the other side of the spectrum declining block rates which have a reduced rate in the tail block do little to encourage conservation In fact they operate more like a discounted bulk rate by reducing the average cost of a kWh in a customerrsquos bill for the more kWh used
Performance incentives or other ways to avoid destruc-tive cost-cutting in the name of creating margins that reduce service or reliability or lessen customer value have been implemented only in Massachusetts of the six utilities illustrated here Several other states have implemented vari-ous schemes in reaction to perceived deficiencies in utility service67 Performance incentives are not unique to rev-enue regulation Commissions wishing to implement such a scheme can find many models of incentive reward and penalty mechanisms developed for other purposes
Taken together a suite of policy and program features can create an atmosphere that is conducive to achievement of energy efficiency goals within the utility and for the customers By appropriate application of these techniques regulators working with utilities and stakeholders can remove barriers and create an opportunity for energy ef-ficiency to be fully integrated into the utility supply option portfolio
Energy Efficiency OutcomesAlthough revenue regulation itself does not create an
incentive for a utility to implement energy efficiency it does address the issue of lost revenues associated with energy
Table 12
Complementary Policies for Energy Efficiency
Pacific Gas amp Electric62
Idaho Power Company63
Baltimore Gas amp Electric
Wisconsin Public Service Corporation64
National Grid65
Hawaiian Electric Company66
Energy Efficiency Requirement
1 annually
IRP
10 by 2015
075 annually
24 annually
Energy efficiency can satisfy portion of RPS
Default Residential Rate Design
Inclining block
Inclining block
TOU seasonal
Flat
Inclining block
Inclining block
Incentive Structure
Risk reward incentive mechanism
No
No
No
5 of program costs
Third-party administrator paid for contract performance
Performance Incentives
Reliability reporting only
None
Under consideration
Reliability reporting only
Service quality reward and penalty
Under consideration
efficiency and DG programs Revenue regulation should be combined with other mechanisms that require or incentiv-ize the implementation of energy efficiency by the utility or a third party The level of energy efficiency achieved can be one measure of the success of a revenue regulation mechanism as implemented in a larger program designed to achieve energy efficiency Table 13 shows the incremental annual energy efficiency savings reported by each utility with the shaded box indicating the year that the utilityrsquos revenue regulation mechanism was implemented National Grid had achieved a high level of energy efficiency savings in the years before it implemented revenue regulation
This paper has not evaluated DG outcomes to correlate with revenue regulation as it is not perceived that states and utilities have made that connection expressly in histori-cal mechanisms However it is expected that this connec-
Decoupling Case Studies Revenue Regulation Implementation in Six States
37
68 EIA Form EIA-861 data files Available at httpwwweiagovelectricitydataeia861
69 PGampE began revenue regulation in 1974 and it was later suspended and recommenced in 2001
70 WPS savings are represented by the statewide program savings from the Focus on Energy program WPS provided additional funds to Focus on Energy starting in CY10 through their territory-wide program activities
71 In 2009 Hawaii Energy a ratepayer-funded statewide energy efficiency provider began delivering services Savings reported after 2009 represent savings achieved through the programs of Hawaii Energy
Table 13
Annual Incremental Energy Efficiency Savings as Percentage of Retail Sales68
Highlighted cells are the year that utility started decoupling
Pacific Gas amp Electric69
Idaho Power Company
Baltimore Gas amp Electric
Wisconsin Public Service Corporation70
National Grid
Hawaiian Electric Company71
2004
11
01
00
03
11
00
2005
16
03
00
03
09
05
2006
10
05
00
03
12
05
2010
19
13
17
09
136
12
tion will be made in future mechanisms and furthermore it is anticipated that follow on work to this paper will want to study that connection between revenue regulation and DG performance
Conclusions
An increasing number of states are looking to increase the rate of energy efficiency investments for their long-run cost and risk advantages The benefits of energy efficiency include not only its ability to reduce system costs across the distribution transmission and generation functions but also the opportunity for customers to reduce their individ-ual energy costs for their own electric bills Nevertheless it is counterintuitive to encourage or order a utility to sell less of its product In order to encourage the proliferation of en-ergy efficiency programs as a solution that can contribute to this nationrsquos energy needs this tension between the goals of society versus the goals of the utility needs to be addressed Revenue regulation can be such a solution by removing the link between sales and revenues
There are many ways to implement revenue regulation and multiple decision points that regulators must consider in designing a revenue regulation mechanism This paper focused on six utilities each of which implemented revenue regulation in different ways in accordance with the objectives of that state Different decision points discussed include
bull Should revenue regulation apply to all functions (generation transmission and distribution) which sometimes depends on if the utility is regulated or restructured
bull Should revenue regulation apply to all customer classes
bull Should there be symmetry such that a reconciliation adjustment occurs for both over- and under-recoveries of the revenue requirements
bull Should recovery of indicated surcharges be conditioned on acceptable performance on customer service quality or energy efficiency goals
bull Should there be an attrition adjustment to account for other expenses or should the revenue regulation adjustment be limited to reconciling existing revenue requirements
bull Should there be an inflation adjustmentbull To calculate the revenue requirements should the
current or accrual method be usedbull Should the adjustments be made in rate cases or
through a riderbull How frequently should adjustments be made
monthly annually or some other time periodbull Depending on the period of time between true up and
recovery should there be carrying charges and if so how should they be calculated
2007
21
06
00
03
09
04
2008
35
10
05
09
05
05
2009
20
11
06
10
11
11
Decoupling Case Studies Revenue Regulation Implementation in Six States
38
72 Avista Utilities (2009) Washington Utilities and Transportation Commission Docket UE-090134
bull Should there be a requirement authorizing the frequency of rate case
bull Should there be an annual cap on the amount of the adjustment and if so should there be an opportunity to carry over any additional amounts and for how many years
bull Should there be an adjustment to the cost of capital to reflect the reduced risk
Other considerations for regulators whether or not they implement revenue regulation but certainly as part of a comprehensive package are other measures that can be put in place to encourage consumers and utilities alike to actively participate in energy efficiency For example an inclining block rate structure by virtue of its incentive to consume less pairs well with an energy efficiency program helps drive consumers to participate in efficiency programs and accelerates the payback of an energy efficiency investment By the same token an incentive payment to the utility helps provide its management with a good reason to excel and exceed targets for energy efficiency programs
A key point illustrated by the list of considerations above is that there is not just one static way to design and implement revenue regulation but rather there are a variety of options for doing so In this study a diverse group of utilities were reviewed The differences among the utilities included geographic diversity vertically integrated and restructured utilities different levels of energy efficiency in place and certainly differences in how the revenue regulation mechanisms were implemented No two utilities were alike and no two utilities had the same revenue regulation mechanism The key is that revenue regulation should eliminate the throughput incentive but the means for accomplishing this goal can vary and be tailored to each jurisdiction and each utility and still be successful
There are several considerations in the design of a revenue regulation mechanism that can help ensure its successful adoption To begin revenue regulation should be granted to utilities only as a precondition to implementing comprehensive energy efficiency andor DG policies Unless accompanied by a commitment to engage in providing least-cost resource options that could impact sales there is not really any good policy reason for its adoption All of the utilities studied are actively engaging in energy efficiency Furthermore as a matter of fairness the revenue regulation mechanism should be symmetrical so that any revenues above those authorized are refunded back to consumers As Figure 1 demonstrates although there are more surcharges to customers there is nevertheless a healthy amount of
credits back to consumers This is the bargain Barring imprudence or other unforeseen circumstances the utility receives its authorized revenue requirements and nothing more or less under a simple revenue regulation mechanism
Rate design plays an important role in the effectiveness of energy efficiency in concert with revenue regulation A low customer charge is preferable so that the customer can benefit from real bill reductions tied to reduced volumetric consumption Reductions in consumption not only reduce bills but also positively impact the payback period for investments in energy efficient appliances Declining block rates in which the tail block rate is lower than the first tier also do not encourage conservation Inclining block rates that reward low usage in the first block with a lower rate send the better price signals None of the six utilities studied had declining block residential rates They were inclining flat and time-varying
The revenue adjustment mechanism is also a critical decision point in terms of whether a revenue per customer mechanism is adopted that accounts for only the current revenue requirements or whether latitude is given to include an inflation adjustment or other cost increases in the revenue adjustment mechanism Three of the utilities studied adopted this approach whereas another two used a hybrid approach Finally to reduce volatility five of the six utilities opted for annual rather than monthly adjustments thereby creating a level of rate stability that customers in general prefer
Once the goals for revenue regulation are set by the regulators the next step is to design programs that will implement that goal For energy efficiency to be as successful as possible regulators may want to adopt a complement of other policies to accompany revenue regulation These can include rate designs that reward reduced use and conservation as well as incentive payments to utilities that reward them for meeting or exceeding targets Of the six utilities studied three have adopted some form of incentive One simple approach that was used in Washington was to link recovery of any surcharges under the revenue regulation mechanism to achievement of energy efficiency targets72
For the utilities examined above that have implemented revenue regulation the evidence demonstrates that revenue regulation as a strategy and a mechanism to enable
Decoupling Case Studies Revenue Regulation Implementation in Six States
39
energy efficiency has been working well The fact that each revenue regulation mechanism varies from the next demonstrates that there are many different paths that can be followed in implementing revenue regulation based on the needs of the utility and its stakeholders in a particular
region This study demonstrates that revenue regulation does work and provides examples of how it can be implemented each one different and unique because of the number of decision points to be considered in designing a revenue regulation mechanism
Decoupling Case Studies Revenue Regulation Implementation in Six States
40
Appendix
Historic Rate Adjustments
Table 14
PGampE Revenue Regulation Rate Adjustments 1983 to 199373
Table 15
PGampE Revenue Regulation Adjustments 2005 to 201274
Table 16
IPC Revenue Regulation Adjustments76
Idaho Power Company
1983 23
1984 (34)
1985 (48)
1986 19
1987 21
1988 50
1989 (43)
1990 (54)
1991 39
1992 34
1993 00
2005 8925 minus12773 minus143
2006 9933 2246 226
2007 10409 21727 209
2008 10261 4032 039
2009 11169 10355 093
2010 11224 46556 415
2011 10306 38390 373
2012 11032 40304 365
2007 Residential minus00457 590 minus077
Commercial minus00457 428 minus107
2008 Residential 00529 670 090
Commercial 00529 510 104
2009 Residential 01220 770 158
Commercial 01535 603 255
2010 Residential 01800 785 229
Commercial 02273 613 371
2011 Residential 02028 785 258
Commercial 02597 613 424
Revenue Regulation Adjustment as of
Total Rates
Delivery Revenue
Requirement ($ millions)
Adjustment Rate
Revenue Regulation Adjustment($ millions)
Retail Rate
of Delivery Revenue
Revenue Regulation Adjustment
Year
Year
73 Lesh P (2009 June 30) Rate impacts and key design elements of gas and electric utility decoupling
74 Morgan P (2012 November) A decade of decoupling for US energy utilities rate impacts designs and observations
75 Morgan P (2012 November) A decade of decoupling for US energy utilities rate impacts designs and observations
76 All numbers provided by the utility
Decoupling Case Studies Revenue Regulation Implementation in Six States
41
77 Idaho Power Company Case No IPC-E-11-19- fixed cost adjustment permanent mechanism Available at httpwwwpucidahogovinternetcaseselecIPCIPCE1119company20120928COMPLIANCE20FILINGPDF
Figure 2
IPC Revenue Regulation Adjustments77
Residential FCA Balance and Use per Customer
$10000000
$8000000
$6000000
$4000000
$2000000
$0
-$2000000
-$4000000
-$6000000
1080
1070
1060
1050
1040
1030
1020
1010
1000Res
idu
al A
uth
oriz
ed F
CA
Am
oun
t
Residual Authorized FCA Amount ($)
Monthly Use Per Customer (kWh)
kW
h U
sed
2006 2007 2008 2009 2010 2011
78 Morgan P (2012 November) A decade of decoupling for US energy utilities rate impacts designs and observations
Decoupling Case Studies Revenue Regulation Implementation in Six States
42
Table 17a
Baltimore Gas and ElectricBGE Monthly Revenue Regulation Adjustments 2008 to 201278
Table 17b
Baltimore Gas and ElectricBGE Monthly Revenue Regulation Adjustments 2008 to 201278
March Residential 000172 01477 1165General Service 000230 01526 1507
April Residential 000016 01477 0108General Service 000146 01526 0957
May Residential 000066 01477 0447General Service 000230 01526 1507
June Residential minus000066 01477 minus0447General Service 000230 01526 1507
July Residential 000158 01477 1070General Service 000230 01526 1507
August Residential minus000040 01477 minus0271General Service 000214 01526 1402
September Residential 000237 01477 1605General Service 000230 01526 1507
October Residential 000237 01477 1605General Service 000143 01526 0937
November Residential 000237 01477 1605General Service 000140 01526 0917
December Residential 000445 01477 3013General Service 000230 01526 1507
January Residential 000035 01579 0222General Service minus000073 01346 minus0542
February Residential 000025 01579 0158General Service 000230 01346 1709
March Residential minus000237 01579 minus1501General Service 000230 01346 1709
April Residential minus000237 01579 minus1501General Service 000230 01346 1709
May Residential 000234 01579 1482General Service 000132 01346 0981
June Residential 000237 01579 1501General Service 000230 01346 1709
July Residential 000237 01579 1501General Service 000230 01346 1709
August Residential 000237 01579 1501General Service 000190 01346 1412
September Residential 000237 01579 1501General Service 000230 01346 1709
October Residential 000237 01579 1501General Service 000124 01346 0921
November Residential 000237 01579 1501General Service 000230 01346 1709
December Residential 000156 01579 0988General Service 000204 01346 1516
Adjustment $kWh
Adjustment $kWh2008 2009
Retail Rate
$kWh
Retail Rate
$kWhAdjustment
Adjustment
Decoupling Case Studies Revenue Regulation Implementation in Six States
43
Table 17c
Baltimore Gas and ElectricBGE Monthly Revenue Regulation Adjustments 2008 to 201278
Table 17d
Baltimore Gas and ElectricBGE Monthly Revenue Regulation Adjustments 2008 to 201278
January Residential 000203 01465 1386General Service 000230 01261 1824
February Residential minus000142 01465 minus0969General Service 000230 01261 1824
March Residential minus000237 01465 minus1618General Service 000230 01261 1824
April Residential minus000237 01465 minus1618General Service 000230 01261 1824
May Residential 000192 01465 1311General Service 000230 01261 1824
June Residential 000191 01465 1304General Service 000230 01261 1824
July Residential 000095 01465 0648General Service 000230 01261 1824
August Residential minus000176 01465 minus1201General Service 000224 01261 1776
September Residential minus000237 01465 minus1618General Service 000116 01261 0920
October Residential minus000237 01465 minus1618General Service 000081 01261 0642
November Residential minus000237 01465 minus1618General Service 000098 01261 0777
December Residential minus000079 01465 minus0539General Service 000229 01261 1816
January Residential minus000130 01365 minus0952General Service 000230 01156 1990
February Residential minus000253 01365 minus1853General Service minus000020 01156 minus0173
March Residential minus000018 01365 minus0132General Service minus000063 01156 minus0545
April Residential 000110 01365 0806General Service minus000262 01156 minus2266
May Residential 000010 01365 0073General Service minus000160 01156 minus1384
June Residential 000226 01365 1656General Service 000042 01156 0363
July Residential 000253 01365 1853General Service 000209 01156 1808
August Residential minus000007 01365 minus0051General Service minus000157 01156 minus1358
September Residential minus000253 01365 minus1853General Service minus000177 01156 minus1531
October Residential 000228 01365 1670General Service 000262 01156 2266
November Residential minus000059 01365 minus0432General Service 000262 01156 2266
December Residential 000071 01365 0520General Service 000262 01156 2266
Adjustment $kWh
Adjustment $kWh2010 2011
Retail Rate
$kWh
Retail Rate
$kWhAdjustment
Adjustment
Decoupling Case Studies Revenue Regulation Implementation in Six States
44
Table 17e
Baltimore Gas and ElectricBGE Monthly Revenue Regulation Adjustments 2008 to 201278
January Residential 000253 01291 1960General Service 000262 01064 2462
February Residential 000253 01291 1960General Service 000262 01064 2462
March Residential 000253 01291 1960General Service 000262 01064 2462
April Residential 000253 01291 1960General Service 000262 01064 2462
May Residential 000253 01291 1960General Service 000262 01064 2462
June Residential 000253 01291 1960General Service 000262 01064 2462
July Residential 000253 01291 1960General Service 000262 01064 2462
August Residential 000253 01291 1960General Service 000160 01064 1504
Adjustment $kWh2012
Retail Rate
$kWhAdjustment
Decoupling Case Studies Revenue Regulation Implementation in Six States
45
79 Morgan P (2012 November) A decade of decoupling for US energy utilities rate impacts designs and observations
80 Morgan P (2012 November) A decade of decoupling for US energy utilities rate impacts designs and observations
Table 18
Wisconsin Public Service Corporation Revenue Regulation Adjustments 2009 to 201179
2009 ResidentialSmall Commercial 00048705 000168154 01290 378 130Commercial 00084951 000293293 00945 899 310
2010 ResidentialSmall Commercial 00033043 000166936 01291 256 129Commercial 00056630 000286103 09460 060 030
2011 ResidentialSmall Commercial (00018666) $ (000163719) 01288 minus145 minus127Commercial (00032565) $ (000285629) 01037 minus314 minus275
Derived Adjustment
$kWh
Derived Adjustment Capped $
kWh
Retail Rate
$kWh
Revenue Regulation Actual
Revenue Regulation Capped
Table 19
National Grid Revenue Regulation Adjustments 2011-201276
Massachusetts Electric and Nantucket Electric
Table 20
Hawaiian Electric Company
2011 All minus0015 1429 minus0105
2012 All 0044 1396 0315
2011 01995 3149 063
2012 03894 3641 107
Revenue Regulation Adjustment
centkWh
Revenue Regulation Adjustment
centkWhRetail Rate
centkWh
Retail Rate
Revenue Regulation Adjustment
Revenue Regulation
ldquoThe 2011 adjustment took effect June 1 but was reduced to $0 on July 26 2011 when the Commission granted HECO an interim rate increase of $532 million in a 2011 test year general rate case The 2012 Adjustment runs from June 1 2012 through May 31 2013 About 25 of the total relates to the portion of the decoupling mechanism that updates OampM and rate baserdquo (Morgan 2013)
Decoupling Case Studies Revenue Regulation Implementation in Six States
46
Revenue Regulation and Decoupling A Guide to Theory and Applicationhttpwwwraponlineorgdocumentdownloadid902
This guide was prepared to assist anyone who needs to understand both the mechanics of a regulatory tool known as decoupling and the policy issues associated with its use This would include public utility commissioners and staff utility management advocates and others with a stake in the regulated energy system While this guide is somewhat technical at points we have tried to make it accessible to a broad audience to make comprehensible the underlying concepts and the implications of different design choices This guide includes a detailed case study that demonstrates the impacts of decoupling using different pricing structures (rate designs) and usage patterns
Pricing Dorsquos and Donrsquots Designing Retail Rates as if Efficiency Countshttpwwwraponlineorgdocumentdownloadid939
Rate design is a crucial element of an overall regulatory strategy that fosters energy efficiency and sends appropriate signals about efficient system investment and operations Rate design is also fully under the control of state regulators Progressive rate design elements can guide consumers to participate in energy efficiency programs and reduce peak demand yet relatively few utilities and commissions have implemented many of these elements This RAP paper identifies some best practices Because pricing issues tie closely to utility growth incentives we also address revenue decoupling
A Decade of Decoupling for US Energy Utilities Rate Impacts Designs and Observationshttpwwwraponlineorgdocumentdownloadid6356
This report written by Pamela Morgan of Graceful Systems LLC builds on a 2009 report Now covering 25 states including 49 LDCs and 24 electric utilities this report summarizes the decoupling mechanism designs these utilities use and the rate adjustments they have made under those mechanisms In total this report estimates the retail rate impacts of 1244 decoupling mechanism adjustments since 2005
Additional Resources
The Role of Decoupling Where Energy Efficiency is Required by Lawhttpwwwraponlineorgdocumentdownloadid275
This Issuesletter gives an overview of energy efficiency resource standards the need to decouple utility profits from utility sales and explains why decoupling is needed even where a third party administers energy efficiency programs
Revenue Decoupling Standards and Criteria A Report to the Minnesota Public Utilities Commissionhttpwwwraponlineorgdocumentdownloadid850
In 2007 the Minnesota legislature enacted a new statute Section 216B2412 in which it defined an alternative approach to utility regulation decoupling and directed the Public Utilities Commission (PUC) to ldquoestablish criteria and standardsrdquo by which decoupling could be adopted for the statersquos rate-regulated utilitiesTo fulfill its obligation to develop criteria and standards for decoupling the PUC sought the advice of the Regulatory Assistance Project (RAP) This report is the output of that collaboration
Designing Distributed Generation Tariffs Wellhttpwwwraponlineorgdocumentdownloadid6898
Improvements in distributed generation economics increasing consumer preference for clean distributed energy resources and a favorable policy environment in many states have combined to produce significant increases in distributed generation adoption in the United States Regulators are looking for the well-designed tariff that compensates distributed generation adopters fairly for the value they provide to the electric system compensates the utility fairly for the grid services it provides and charges non-participating consumers fairly for the value of the services they receive This paper offers regulatory options for dealing with distributed generation The authors outline current tariffs and ponder what regulators should consider as they weigh the benefits costs and net value to distributed generation adopters non-adopters the utility and society as a whole The paper highlights the importance of deciding upon a valuation methodology so that the presence or absence of cross-subsidies can be determined Finally the paper offers rate design and ratemaking options for regulators to consider and includes recommendations for fairly implementing tariffs and ratemaking treatments to promote the public interest and ensure fair compensation
Decoupling Case Studies Revenue Regulation Implementation in Six States
47
The Regulatory Assistance Project (RAP)trade is a global non-profit team of experts focused on thelong-term economic and environmental sustainability of the power sector We provide technical and policy assistance on regulatory and market policies that promote economic efficiency environmental protection system reliability and the fair allocation of system benefits among consumers We work extensively in the US China the European Union and India Visit our website at wwwraponlineorg to learn more about our work
Rate Design Where Advanced Metering Infrastructure Has Not Been Fully Deployedhttpwwwraponlineorgdocumentdownloadid6516
This paper identifies sound practices in rate design applied around the globe using conventional metering technology Rate design for most residential and small commercial customers (mass market consumers) is most often reflected in a simple monthly access charge and a per-kWh usage rate in one or more blocks and one or more seasons A central theme across the practices highlighted in this paper is that of sending effective pricing signals through the usage-sensitive components of rates in a way that reflects the character of underlying long-run costs associated with production and usage While new technology is enabling innovations in rate design that carry some promise of better capturing opportunities for more responsive load the majority of the worldrsquos electricity usage is expected to remain under conventional pricing at least through the end of the decade and much longer in some areas Experience to date has shown that the traditional approaches to rate design persist well after the enabling technology is in place that leads to change
Time-Varying and Dynamic Rate Designhttpwwwraponlineorgdocumentdownloadid5131
This report discusses important issues in the design and deployment of time-varying rates The term time-varying rates is used in this report as encompassing traditional time-of-use rates (such as time-of-day rates and seasonal rates) as well as newer dynamic pricing rates (such as critical peak pricing and real time pricing) The discussion is primarily focused on residential customers and small commercial customers who are collectively referred to as the mass market The report also summarizes international experience with time-varying rate offerings
50 State Street Suite 3Montpelier Vermont 05602802-223-8199wwwraponlineorg
- Table of Contents
- Introduction
- California Pacific Gas and Electric Company
- Idaho Idaho Power Company
- Maryland Baltimore Gas and Electric
- Wisconsin Wisconsin Public Service Corporation
- Massachusetts National Grid
- Hawaii Hawaiian Electric Company
- Discussion of the Six Utilities Overall
- Conclusions
- Appendix
- Additional Resources
-

Decoupling Case Studies Revenue Regulation Implementation in Six States
4
4 Technically the only truly ldquofixedrdquo costs for a utility are inter-est and depreciation Labor costs are technically variable costs but they vary little in the short-run in response to sales volumes Over a long time one or more decades some costs that are fixed in the short-term such as transformers and conductors are revealed to be volume- and usage-sensitive especially when assets and systems are replaced
5 Strictly speaking it is net lost revenue that is at issue To the extent that avoided sales avoid some amount of variable cost (low in the case of delivery services only) that avoided cost should be netted from the foregone gross revenue in order to calculate the correct amount of revenue that would have otherwise gone to cover the companyrsquos return of and return on investment Revenue regulation solves this problem auto-matically In contrast lost revenue adjustments require these calculations which predictably become quite contentious in the rate-making process
The onsite energy production from these investments will decrease utility sales from what they otherwise would have been and could result in absolute decreases in sales in states that have strong energy efficiency programs and low baseline growth As states pursue a more aggressive efficiency agenda there might come a point where the current rate-setting model is no longer sustainable Utilities have embedded investment-related and labor costs (not sensitive to volume)4 included in their rates to support investments already made and necessary for good service reliability safety and other utility services which are adjusted during periodic rate cases Without a mechanism in place to address the utility impact of reduced sales the lost revenues from energy efficiency programs and DG will make it more difficult for utilities to cover their fixed cost obligations and to reach their earnings targets for shareholders As a result various strategies to allow utilities to recapture these lost revenues have been developed Environmental imperatives including promotion of customer-side alternatives to utility supply motivate regulators to consider forms of regulation in which sales do not matter and utilities are motivated to find the best investments to meet public policy objectives irrespective of which side of the meter it resides or what degree of utility control is maintained
Lost revenue recovery allows utilities to recover the deficit in revenue resulting from reduced sales5 There are several mechanisms that accomplish this lost revenue adjustment mechanisms straight-fixed variable rates and revenue regulation Only one of these mechanisms decoupling - revenue regulation however accomplishes the dual goals of both removing the throughput incentive
and continuing to send more economically appropriate price signals to customers Both of these principles are key to successful energy efficiency programs6
Revenue regulation however is a not a single distinct mechanism Rather there are various elements that can be assembled in numerous ways based on state priorities and preferences that serve to eliminate the throughput incentive This publication will focus on six utilities Pacific Gas and Electric Company Idaho Power Company
6 Although this paper does not focus on the rationale for send-ing appropriate price signals references on this issue can be found at Lazar J Schwartz L and Allen R (2011) Pricing Dorsquos and Donrsquots Montpelier VT The Regulatory Assistance Project Available at wwwraponlineorgdocsRAP_Lazar_PricingDosandDonts_2011_04pdf and Lazar et al (2011)
7 For a detailed analysis of the economic and public policy rationales for revenue regulation see Lazar et al 2011 See also Shirley W Lazar J amp Weston F (2008) Revenue decoupling standards and criteria A report to the Minnesota Public Utilities Commission Montpelier VT The Regulatory Assistance Project Available at wwwraponlineorgdocsRAP_Shirley_DecouplingRevenueRpt_2008_06_30pdf
Rate adjustments under a revenue regulation scheme do not represent additional costs to ratepayers but are a reallocation of approved
recoverable costs to a changing base of retail sales Rates are set assuming a certain sales volume and many costs that do not vary with usage in the short run are collected through a volumetric sales rate When a utility engages in programs or policies that result in lower customer usage some revenues that should have offset some of these costs are not billed to customers as a result (and vice versa where usage increases) The revenue regulation adjustment tracks those lost revenues and allows recovery in a subsequent period In all cases the revenue regulation adjustment represents a reconciliation of revenues that were approved for collection from customers that were not collected as a result of changed sales volumes Revenue regulation adjustments can also result in reduced rates when excessive revenues are collected due to weather or other variations in sales amounts7
Decoupling Case Studies Revenue Regulation Implementation in Six States
5
8 Oregon Public Utility Commission Order No 09-020 p 27
Baltimore Gas and Electric Company Wisconsin Public Service Company National Grid and Hawaiian Electric Company and the different forms of revenue regulation their regulators have implemented These examples provide a range of options on how to implement revenue regulation After considering the decoupling mechanisms of numerous utilities across the nation these specific utilities were chosen in order to provide examples across many regions and also to contrast the different approaches taken by each utility to provide a broader overview of the options available in designing decoupling mechanisms and to describe how they have worked
Background Measuring the Success of DecouplingRevenue Regulation Mechanisms
A revenue regulation mechanism designed to promote energy efficiency may be viewed as successful if the utility is no longer concerned about increases and decreases in sales is no longer taking actions to increase sales or reduce decreases in sales and is improving the overall efficiency of its operations and management Although a particular mechanism can be designed to meet other goals (other performance goals with dedicated metrics and specific rewards and penalties attached) this paper is primarily concerned with mechanisms designed to mitigate revenue losses that can impede the desire of a utility to aggressively pursue programmatic energy efficiency By taking an in-depth look at six diverse utilities that have implemented revenue regulation this study describes the similarities and differences among the adopted mechanisms and attempts to answer the question of how each is working to achieve its goals
A second significant determinant of the success of a revenue regulation mechanism is its acceptance by the stakeholders This can be manifested by a lack of objection or support of revenue regulation by consumers and it can be manifested through changes in utility behavior that customers respond to Revenue regulation provides utilities who act prudently and in accordance with the mechanism assurance that they will collect their allowed revenues As a result they are better able to focus on other activities such as programmatic energy efficiency that reduces costs in the long run The utilities studied also found benefits to include providing customers with a lower-cost product improved customer interaction and other efforts as sanctioned by the regulator that will
produce additional revenue streams Indeed the Oregon Commission recognized as much when it commented on Portland General Electricrsquos (PGE) ability to influence individual customers through direct contacts and referrals The Commission also noted that PGE can influence usage depending on how aggressively it pursues DG whether it supports improvements to building codes and whether it provides timely useful information on energy efficiency programs8 Engaging actively in these programs can also help develop better customer relationships as the utility industry evolves to a more service-oriented business Instead of just handing customers a bill the utility can be providing them efficiency-based solutions that serve cumulatively to avoid more expensive ways to meet customer demand
Financial incentives for specified performancemdashrelating to energy efficiency achievements or improvements in customer service to name only twomdashare examples of ways to influence utility behavior in furtherance of public policy objectives If awarded such incentives are included in periodic adjustments to the allowed revenue One goal is to turn the utility from being a reluctant participant to being an enthusiastic advocate for (or at least not an active inhibitor of) energy efficiency while creating a stable regulatory environment to accomplish other complementary policies Moreover combining revenue regulation with performance incentives creates a stronger inducement for utilities to engage in least-cost planning which benefits its customers
Environmental groups will want to ensure that there are robust programs and policies in place that advance clean energy solutions Consumers will be cautious about rate impacts that will need to be addressed in the design of a decoupling mechanism (see text box on next page)
Striking a balance among competing stakeholder concerns while creating effective mechanisms to advance good public policy falls to the regulators and as will be seen in the six case studies there seems to be no generally accepted approach This demonstrates that revenue regulation is not a static one-size-fits-all policy but rather it can be fashioned in a number of ways to meet the needs of any given community
An additional way to evaluate the success of a revenue regulation mechanism is to look at the rate impacts and how manageable they are Most annual rate impacts from revenue regulation fall between plus or minus one to three
Decoupling Case Studies Revenue Regulation Implementation in Six States
6
9 Standard and Poorrsquos (2012 May 15) Poors Credit Matters Report
percent These impacts are generally manageable and may in fact be less than the fluctuations customers might otherwise experience with fuel adjustment clauses or under a variable generation rate Over the long term observers might expect to note avoided load-driven capital costs and other long-lived commitments
Another measurement of the success of decoupling is how the results of its implementation are viewed by financial institutions Revenue regulation can be a factor considered by the rating agencies in determining a bond rating for a utility With multiple mergers and the creation of holding companies with subsidiaries it becomes more difficult to measure this because there are multiple utility companies and affiliates in multiple states that are being evaluated Nevertheless Standard and Poors noted that revenue regulation mechanisms were a positive factor and that they would better align the interests of consumers
Some consumer groups have expressed concerns with decoupling because depending on how it is designed there could be future rate
adjustments that are not subject to the same rigorous review as would occur in a rate case Below is a list of considerations in designing revenue regulation mechanism that attempts to address those concerns
bull Making revenue regulation contingent on a robust energy efficiency commitment and portfolio
bull Requiring structural symmetry in the mechanism such that credits as well as surcharges flowing from a reconciliation be accounted for and refunded to customers
bull Creating a bandwidth around the amount of adjustment permitted in any given year
bull Adjusting the cost of capital or more appropriately the imputed capital structure to reflect lower risk and
bull Requiring periodic rate cases to assess the appropriate level of revenues for the utilitymdashwhich is helpful only if the utilityrsquos revenue requirement is set too high and does not account for downward adjustments in costs such as reduced labor expense
with utility shareholders by implementing rate designs that encourage energy efficiency9
Because revenue regulation reduces the utilityrsquos risk profile by providing revenue and earnings stability the upside can be a better credit rating from the major rating agencies Alternatively the utility may be able to retain the existing credit rating with a lower common equity ratio in its capital structure A better credit rating or lower equity ratio can translate into a lower financing rate which benefits the utility and ultimately the customers who pay for utility-financed construction projects These construction projects can include distribution and transmission upgrades or expansion as well as pollution control investments on existing generating units or if necessary new plant construction
Finally a more tangible means of ascertaining the success of a revenue regulation mechanism is whether there is an increase in energy efficiency and DG Although some of the incremental increases may be motivated by statutory or regulatory requirements a utility decision to increase or voluntarily go beyond the requirements through its own efforts or by assisting others especially if innovative means are used to achieve these results can be viewed as a demonstration that revenue regulation is working
This publication contains an in-depth look at six instances of revenue regulation representing a wide cross-section of such regimes in the United States We look first at each utility and provide a summary of its revenue regulation mechanism Next we discuss various components or decision points in designing a revenue regulation mechanism and look at how each state addressed that mechanism What emerges is that despite the differences in designing revenue regulation each mechanism is customized so that the pieces and parts fit together into a complete tableau This is perhaps one of the most critical lessons to be drawn from these analyses that is that there is no one right way to do revenue regulation What counts most is making sure that all the parts of a revenue regulation mechanism work together
Decoupling Case Studies Revenue Regulation Implementation in Six States
7
10 CPUC Decision 93887 12301981 From PGampE PPT Rissler
11 Assem Bill 29 ch 8 2001 Cal Stat httpwwwleginfocagovpub01-02billasmab_0001-0050abx1_29_bill_20010412_chapteredpdf
California Pacific Gas and Electric Company
Pacific Gas and Electric Companyrsquos (PGampE) revenue regulation mechanism compares authorized revenues plus annual attrition adjustments with nonndashweather-adjusted actual revenues and
reconciles any over- or under-collection annually The authorized revenues are established through a general rate case every three years based on a future test year Each of PGampErsquos functional operating areas is decoupled and the authorized revenue requirement is determined separately for each unit electric distribution gas distribution public purpose programs and the like During the general rate case authorized revenues are also established for the two years following the future test year Each year an ldquoattrition caserdquo measures changes in the approved costs that have been experienced and adjusts the test-year revenue requirement Collected revenue is tracked through balancing accounts and surplusesdeficits in these accounts are amortized and refundedcollected to or from ratepayers through rate adjustments in the following year Revenue regulation applies collectively to all of PGampErsquos customer classes (ie deviations in sales revenues relative to forecasted levels are tracked and reconciled at the system level) The revenue regulation mechanism is in addition to adjustments for PGampErsquos electric and gas energy procurement costs
AuthorityCalifornia first adopted revenue regulation for gas
utilities in 1978 By 1982 the California Public Utilities Commission (CPUC) put revenue regulation in place for its three major electric investor-owned utilities PGampE Southern California Edison and San Diego Gas amp Electric The original construct called the Electric Revenue Adjust-ment Mechanism established a revenue requirement for each utility annually and then reconciled billed revenues to authorized revenues The Commission determined that the mechanism would ldquoeliminate any disincentives PGampE may have to promote vigorous conservation measures and also be fair to ratepayers in assuring that PGampE receives no more or no less than the level of revenues intended to be earnedrdquo10 However the CPUC largely suspended the
electric revenue regulation mechanisms in 1996 owing to the implementation of electric restructuring
In 2001 the California Assembly passed Assembly Bill 29 which established programs to reduce energy usage in the wake of the Western Energy Crisis and required that ldquo[t]he commission shall ensure that errors in estimates of demand elasticity or sales do not result in material over or under-collection of the electrical corporationsrdquo11 Now incorporated into the Public Utilities Code section 73910 this required the CPUC to re-implement revenue regula-tion The CPUC first re-implemented revenue regulation for PGampE in 2004 when the company came out of Chapter 11 bankruptcy following the Western Energy Crisis
Authorized Revenue RequirementThe CPUC determines PGampErsquos authorized revenue re-
quirement through a General Rate Case (GRC) every three years Each of PGampErsquos functional operating areas is decou-pled and the Commission determines a separate authorized revenue requirement for each area
In order to determine the appropriate revenue require-ment and rates a future test year is used meaning that the costs included in the revenue requirement and sales levels used to determine rates are forecasted For example on De-cember 21 2009 PGampE filed its application for the 2011 GRC This GRC used the future test year 2011 to determine PGampErsquos authorized revenue requirements in 2011 The test year revenue requirement includes both projected expenses and capital expenditures
The electric distribution revenue requirement request was based on the costs PGampE forecasted it would incur in 2011 to
bull Own operate and maintainbull Its distribution plant
Decoupling Case Studies Revenue Regulation Implementation in Six States
8
12 Risser R (2006 August 2) Decoupling in California more than two decades of broad support and success Available at httpwwwnarucmeetingsorgPresentationsRisserpdf
bull A portion of its transmission plant providing service directly to specific customers and connecting to specific generation resources and
bull A portion of its common and general plant as well as
bull Provide services to its electric customersThe generation revenue requirement request was based
on the costs PGampE forecasted it would incur in 2011 tobull Own operate and maintain its electric generating
plant andbull Perform the transactions necessary to procure
electricity for its bundled-service electric customersBecause all customer classes are decoupled the revenue
requirement also includes costs related to serving all cus-tomers
In the 2011 GRC PGampE received a total revenue requirement of $5977 million The retail revenue require-ment for electric distribution was $3190 million for gas distribution $1131 million and for electric generation $1656 million
Rate of ReturnCPUC calculates the authorized revenue requirements
for PGampE based on a rate of return on its rate base of 879 percent which is projected to provide an 1135-percent return on equity Although intervening parties in the statersquos consolidated cost of capital proceedings have alleged that revenue regulation reduces financial risk there has been no explicit reduction of the return on equity or debt-equity ratio attributable to the implementation of revenue regula-tion
Costs Not Included in Revenue RegulationAccording to PGampE only approximately six percent of
its electric revenues are ldquoat riskrdquo meaning not decoupled or tracked through another mechanism only 42 percent of natural gas revenues are not decoupled12 In addition to en-ergy procurement costs revenue regulation does not apply to PGampErsquos FERC-regulated electric transmission revenue requirement or to a portion of PGampErsquos gas transmission and storage revenue requirement Costs not included in PGampErsquos revenue requirement include energy procurement costs
Revenue Adjustment MechanismPGampErsquos revenue adjustment mechanism allows for two
methods for changing the authorized revenue requirement between rate cases The first mechanism is the stair-step method through which adjustments to the revenue require-
ment are predetermined during the GRC Second PGampErsquos revenue adjustment mechanism allows for changes in the postndashtest-year revenue requirements in addition to the pre-determined adjustments for ldquoexogenous changesrdquo
During the GRC the CPUC also determines the autho-rized revenue requirements called postndashtest-year attrition in-creases for the two years following the test year In the 2011 GRC the Commission determined the authorized revenue requirement for the future test year 2011 in addition to the postndashtest-year attrition increases for 2012 and 2013
The annual attrition adjustments were fixed dollar amounts of $180 million in 2012 and $185 million in 2013 except for allowed exogenous changes In this con-text attrition refers to the decrease in utility revenues com-pared with costs between rate cases attrition adjustments refer to adjustments to the authorized revenue designed to allow the utility to recover the increased costs The 2012 increase includes $123 million for electric distribution $35 million for gas distribution and $22 million for electric generation The 2013 increase includes $123 million for electric distribution $35 million for gas distribution and $27 million for electric generation
Next PGampErsquos attrition mechanism allows adjustments to the postndashtest-year revenue requirements for exogenous factors limited to five factors which are determined during the GRC The five factors determined through the 2011 GRC to be applied to the 2012 and 2013 attrition adjust-ments are postage rate changes franchise fee changes income tax rate changes payroll tax rate changes and ad valorem tax changes A $10 million threshold is applicable to each factor each year
Reconciling Actual Revenue With Authorized Revenue
Since 2004 PGampE has utilized balancing accounts to implement revenue regulation Balancing accounts track the difference between billed revenue and the authorized revenue requirement each month in order to determine the total annual under- or over-collection of revenue The rev-enue balancing accounts (RBAs) are credited each month with billed retail revenue and debited each month with the total amount of authorized annual revenue divided by 12 Any surplus or deficit is tracked and all monthly surpluses and deficits are totaled at the end of the year The total
Decoupling Case Studies Revenue Regulation Implementation in Six States
9
13 PGampE Tariff Book Available at httpwwwpgecomtariffsEPSSHTML
14 PGampE (2012 August 31) Annual Electric True-up Filing Available at httpwwwpgecomnotsratestariffstm2pdfELEC_4096-Epdf
15 ACEEE California Available at httpaceeeorgenergy-effi-ciency-sectorstate-policyCalifornia1575all191
16 EIA Form EIA-861 data files Available at httpwwweiagovelectricitydataeia861
annual surplus or deficit plus interest is amortized and refunded to or collected from ratepayers in the following year through a rate adjustment PGampE uses different bal-ancing accounts to track specific revenue streams separately and recover or refund over or under-collections separately For example PGampE may over-collect distribution revenue leading to a surplus in that account and requiring a refund to ratepayers In the same period the utility could under-collect public purpose revenue leading to a deficit in that account which would be recovered from ratepayers It is possible that from a ratepayer perspective refunds from surplus accounts and recovery from deficit accounts could cancel each other out PGampE tracks numerous revenue streams through balancing accounts including13
bull Distribution Revenue Adjustment Mechanismbull Public purpose program Revenue Adjustmentbull Nuclear decommissioning Adjustment Mechanismbull Utility Generation Balancing Account andbull Regulatory Asset Revenue Adjustment MechanismGenerally rate adjustments apply equally to all customers
in all rate schedules with some exceptions For example di-rect access customers are exempt from changes in generation costs Revenue regulation rate adjustments occur annually with rate adjustments attributable to over- or under-collec-tion in a year being effective January 1 the following year CPUC requires PGampE to file an Annual Electric True-Up advice letter by September 1 of each year with its preliminary forecast of electric rate changes expected including revenue regulation and other adjustments The account balances as of December 31 will determine the final changes to rates that become effective on January 1 In its 2012 Annual Electric True-Up advice letter PGampE included 23 balancing accounts that were approved for that year14
Complementary PoliciesCalifornia has implemented energy savings goals for its
investor-owned utilities calling for approximately one-percent savings annually through 2020 The RiskReward Incentive Mechanism implemented in 2007 provides an incentive if the utility meets at least 85 percent of its sav-ings goals Utilities can receive 9 percent of net benefits if they achieve between 85 and 99 percent of savings goals and 12 percent of net benefits15 if they meet or exceed sav-ings goals up to the earnings cap of $450 million Penalties are triggered when actual energy efficiency savings are at or below 65 percent of the individual utility savings goal First utilities must reimburse ratepayers dollar-for-dollar for any negative net benefits this is considered part of the
penalty payment Utilities must also pay a per-unit penalty rate of $005kWh and $25kW The total penalty is also capped at $450 million
PGampE currently offers residential customers service under a default inclining block rate structure Residential customers may volunteer for time-of-use (TOU) rates with peak part-peak and off-peak tiers for summer and part-peak and off-peak tiers for winter Discounted rates for low-income and medically fragile customers are avail-able but they too are inclining Commercial customers take service on a Peak Day Pricing default rate but can opt out to take service under a TOU structure Peak Day Pricing is TOU pricing with a surcharge added on top during 9 to 15 peak events called during the year Each of these rate struc-tures signals customers that increased use of energy will be increasingly more expensive These rate designs create a situation in which utility revenues are greatly affected by weather whereas their investment and labor costs are not the revenue regulation mechanism buffers utility revenues and earnings from these weather effects
Some Commissions have implemented service quality programs to ensure that utilities donrsquot engage in destructive cost cutting to improve margins under revenue regulation PGampE files annual reliability reports but there is no explic-it penalty or reward associated with performance However a new initiative by the CPUC is exploring how to elevate the importance of safety in gas and electric utility rate cases which would be supported through a performance-based ratemaking platform
Energy Efficiency OutcomesBecause PGampE has been decoupled in one form or an-
other since 1984 it is very difficult to determine the effect of revenue regulation on the implementation of energy ef-ficiency programs However PGampE has reported that incre-mental energy efficiency savings have consistently exceeded one percent of retail sales over the last ten years16
Decoupling Case Studies Revenue Regulation Implementation in Six States
10
ResourcesCalifornia Division of Ratepayer AdvocatesReport on the Cost of Capital for Test Year 2013
Docket A 12-04-015 (August 6 2012)California Public Utilities CommissionDocket 09-12-020 Settlement Agreement (May 13 2011)Docket 10-07-027 Decision 11-05-018 (May 5 2011)Resolution E-3862 (April 1 2004)
Pacific Gas and Electric CompanyAdvice Letters 3896-E 3896-E-A 3896-E-B
Annual Electric True-Up and Supplemental Filings (January 23 2012)
Advice 3727-E Annual Electric True-Up Filing (September 1 2010)
General Rate Case Application of Pacific Gas and Electric Company (December 21 2009)
Decoupling Case Studies Revenue Regulation Implementation in Six States
11
Idaho Power Companyrsquos (IPC) Fixed Cost Adjustment (FCA) mechanism compares the authorized fixed-cost revenue requirement with weather-normalized sales and reconciles the difference annually for residential
and small business customers The allowed revenue is determined on a per-customer basis during the general rate case and the total fixed-cost recovery amount is adjusted based on the number of customers
AuthorityIn 2004 the Idaho Public Utilities Commission
established a case to investigate financial disincentives to investment in energy efficiency by IPC After a series of workshops in 2007 the Commission approved a three-year pilot of IPCrsquos proposed revenue regulation mechanism In 2009 the Commission extended the pilot for an additional two years starting January 1 2010 On April 2 2012 the Idaho Public Utilities Commission made the IPC pilot program permanent
Authorized Revenue RequirementDuring the general rate case the Commission establishes
the class-specific portion of IPCrsquos revenue requirement For purposes of the FCA this includes the fixed costs collected through Residential Service and Small General Service customer rates During the general rate case the Commission also establishes a fixed-cost per-customer ratemdashthe amount of fixed cost revenue the Company will recover from each customer Finally the Commission must also establish the fixed-cost per-kWh ratemdashthe portion of retail rates that covers fixed costs ldquoFixed costsrdquo are defined much more broadly than accounting standards provide including return taxes and labor expenses
Rate of ReturnIPCrsquos most recent rate case resulted in an overall
settlement The Stipulation specified an overall rate of return of 786 percent which combines return on equity (ROE) capital structure and cost of debt The Commission made no explicit adjustment to the Companyrsquos allowed rate of return
based on the implementation of the FCA
Revenue Adjustment MechanismThe revenue adjustment mechanism was designed to
be weather normalized For each customer class included in the revenue regulation mechanism the actual number of customers (CUST) is multiplied by the fixed-cost per-customer rate (FCC) to give the allowed fixed-cost recovery amount This pro forma amount is then compared to the fixed costs recovered by the company This actual fixed-cost recovery is determined by taking the weather-normalized sales for each class (NORM) and multiplying it by the cost-per-kWh rate (FCE) as determined in a general rate case The difference (allowed fixed cost recovery minus actual fixed cost recovery) determines the FCA In this way the revenue requirement is adjusted between rate cases based on the number of customers and is weather normalized leaving the weather risk with the company This difference is the FCA and is applied to each decoupled customer class
The mathematical formula is FCA = (CUST times FCC) ndash (NORM times FCE) The number of customers is determined by class on the same basis as the methodology used in the general rate case
Reconciling Actual Revenue With Authorized Revenue
Each month the actual fixed-cost recovered amount is determined based on the weather-normalized sales for each customer class multiplied by the fixed-cost per-kWh rate For reporting a monthly ldquoshapedrdquo fixed cost per kWh is used for calculating actual fixed-cost revenue This adheres to Generally Accepted Accounting Practices (GAAP) and better reflects end-of-year impacts within the year The methodology used to weather-normalize actual monthly energy used in the FCA is the same as used in the general rate case Finally the actual fixed-cost recovered amount is subtracted from the allowed fixed-cost recovery amount and the difference is recorded as a line item in the monthly Power Cost Adjustment (PCA) report provided to the Commission Differences are deferred with interest until the end of the
Idaho Idaho Power Company
Decoupling Case Studies Revenue Regulation Implementation in Six States
12
year The actual FCA balance will differ from that recorded in the monthly reports to reflect the fact that the deferral balance is calculated on an annual not monthly basis FCA balance is based on annual average prorated customer count annual weather normalized sales and non-shaped FCE rates which would affect both the balance accrual and the associated interest
Each year the Company totals the FCA results including interest for the period from January 1 to December 31 If the total is negative it represents an under-collection of revenue from customers and the amount will be recovered from ratepayers in the following year through an adder to rates (Schedule 54) Likewise if the total is positive the Company has over-collected its fixed-cost revenue and will return the excess amount to customers through an adder in rates using a credit or surcharge mechanism These adjustments are currently included in the Annual Adjustment Mechanism line item on customer bills Since July 2012 the Annual Adjustment Mechanism includes PCA and FCA to avoid customer confusion
Originally FCAs were calculated for each decoupled customer class however the FCA is now recovered proportionally between the residential and small general service customers for such reason as a lack of cost of service studies to support the underlying cost allocations and acknowledgment of the ldquoportfoliordquo approach toward energy efficiency Annual adjustments are capped at three percent and differences beyond that are rolled over until the next period Adjustments to the rate occur June 1 of the year following the previous one-year period from January 1 to December 31
IPC was initially obligated to submit its adjustment request subject to Staff audit on March 15 of each year Under the pilot program this included a detailed summary of demand-side management (DSM) activities that demonstrate an enhanced commitment to DSM resulting from implementation of the FCA ldquoEvidence of enhanced commitment will include but not be limited to broad availability of efficiency and load management programs building code improvement activity pursuit of appliance code standards expansion of DSM programs pursuit of energy savings programs beyond peak shavingload shifting programs and third party verificationrdquo (IPC-E-04-15 Settlement Stipulation p 5) However the Company is no longer required to file the separate annual report specifying ways in which it increased its investment in energy efficiency and DSM as a result of the FCA mechanism DSM is comprehensively reported in annual DSM reports filed with
the Commission
Potential ChangesThe Commission noted when approving the permanent
FCA that it ldquodoes not isolate or identify changes in cost recovery associated solely with the Companyrsquos energy efficiency programsrdquo17 The Company was required to file a proposal to adjust the FCA to address the capture of changes in load not related to energy efficiency programs In its compliance filing IPC recommended making no change to the FCA mechanism but did propose an altered mechanism in order to comply with the Commissionrsquos request The proposal would cap the annual change in per-customer consumption to two percent (up or down) The Commission Staff had previously proposed that the FCA balance be equally shared between the customers and the Company in order to account for variations in energy consumption other than weather and energy efficiency However the Commission found that neither proposal satisfied its needs stating that the Companyrsquos proposal to cap deviations in annual usage would not have had any effect on previous FCA results Additionally both IPC and the Idaho Conservation League filed comments stating that the Staffrsquos 5050 sharing proposal failed to remove the financial disincentives inherent in DSM programs The Commission finally determined to keep the FCA mechanism unchanged and continue to monitor the results
Complementary PoliciesIdaho requires its investor-owned utilities to pursue all
cost-effective energy efficiency however it does not have incentives for achieving energy efficiency savings
IPC uses inclining block rates as the default rate structure for its residential customers but there is also available an optional Time-of-Day pilot program with summer and winter peak and off-peak periods Small general service customers take service on a two-tier inclining block schedule
IPC has no filing or reporting requirements relating to service quality (except in Oregon)
Energy Efficiency OutcomesBefore IPC implemented revenue regulation in January
2007 it reported increasing incremental energy efficiency savings from 0 percent of retail load in 2003 to 05 percent of
17 Order No 32505 p 6 Available at httpwwwpucidahogovorders32599ord32505pdf
Decoupling Case Studies Revenue Regulation Implementation in Six States
13
retail load in 2006 Since the revenue regulation mechanism was implemented reported savings have increased from 06 percent in 2007 to 13 percent in 2010 (with low or no reported savings in 2009 and 2011)18 The DSM Report for 2012 shows this to be 12 percent
ResourcesIdaho Public Utilities CommissionIPC-E-04-15 - Idaho Power mdash Investigation of Financial
DisincentivesIPC-E-09-28 - Idaho Power mdash Application to Make the
Fixed Cost Adjustment PermanentIPC-E-11-19 - Idaho Power mdash Request to Convert
Schedule 54 (Fca) From Pilot to Permanent
18 EIA Form EIA-861 data files Available at httpwwweiagovelectricitydataeia861
Decoupling Case Studies Revenue Regulation Implementation in Six States
14
Baltimore Gas and Electricrsquos (BGE) revenue regulation mechanism compares actual distribution revenue to the authorized revenue adjusted for the number of customers for each applicable rate schedule The
authorized revenue including the cost of power is based on test year requirements and sales levels Over- or under-collec-tions are reconciled monthly through a rider This mechanism differs from the others we describe by having a monthly rather than annual deferral and recovery period
AuthorityBGE requested a revenue regulation mechanism in 2007
due to the expected impact on electricity sales of the com-panyrsquos conservation and demand response programs BGE stated that the revenue regulation mechanism was neces-sary to eliminate the inherent disincentive in the traditional ratemaking process with respect to conservation and demand response Under traditional ratemaking BGE pointed out that ldquoa one percent reduction in electricity use and demand on the Companyrsquos system for the residential and small com-mercial classes would cut cost recovery by approximately $4 million This first year impact on recovery is then followed by $8 million in the second year (as an equal amount of sav-ings is added) and so on the five-year loss to shareholders from this steady-state utility investment program would be more than $20 millionrdquo19 The revenue regulation mechanism proposed by BGE was based on its gas revenue regulation mechanism which has been in place since 1998
Authorized Revenue RequirementBGE initially calculated its revenue requirement per class
separately for each rate scale based on weather-normalized 2007 sales and the number of customers Because BGE pro-posed the mechanism in 2007 the test year 2007 included nine months of actual sales and three months of forecasted sales BGE used three steps to calculate the base monthly revenue requirement
1 Calculate the Customer Charge revenues by multiplying the number of customers by the
Maryland Baltimore Gas and Electric
Customer Charge for each class2 Calculate the Delivery Service revenues by
multiplying the weather-normalized sales by the Delivery Price for each class
3 Add the Customer Charge revenues and the Delivery Service revenues to determine the base revenue requirements for each class
BGErsquos residential small general service and general service customers are included in the revenue regulation mechanism
Rate of ReturnBGE was allowed a return on common equity of 975
percent applied to a common equity ratio of 5105 per-cent in its most recent rate case BGE strongly opposed the reduction of its ROE and preferred another lost revenue mechanism over revenue regulation if an ROE reduction was implemented as a result of revenue regulation
The Public Service Commission (PSC) made no adjust-ment to BGErsquos ROE when revenue regulation was first implemented in 2007 but did reduce its allowed ROE by 50 basis points in the last rate case The Commission had previously reduced the ROE of another utility by 50 basis points when it adopted a similar revenue regulation mecha-nism for that utility20 21
Revenue Adjustment MechanismOn a monthly basis the adjustment to base revenue
requirement is calculated for each rate class using the following steps
19 BGE (2007 October 26) 9111FilingConser-va102607F Available at httpwebapppscstatemdusintranetmaillogcontentcfmfilepath=C5CCasenum5CAdmin20Filings5C60000-1099995C1080615C9111FilingConserva102607Fpdf
20 Potomac Electric Power Company
21 BGErsquos gas mechanism was approved in a 1998 settlement that did not discuss any adjustment to ROE
Decoupling Case Studies Revenue Regulation Implementation in Six States
15
1 Calculate the revenue adjustment for the change in the number of customers by multiplying the change in the number of customers by the Customer Charge
2 Calculate the revenue adjustment associated with the change in sales by multiplying the change in the number of customers by the average use per customer and multiplying that product by the Delivery Price for the class
3 Calculate the target base revenues for each class for the current period by adding the two types of adjustments to the revenue requirement
The Delivery Price for each class is the delivery rate established by the PSC adjusted for the electric universal service charge nuclear decommissioning credits and the administrative credit associated with the administrative adder portion of the Standard Offer Service rates22
BGE had a full electric and gas rate case in 201023 and another one filed in 2013 and concluded in 201424 Both reset the required decoupling elementsmdashmonthly revenue requirement monthly average usage per customer and number of customers Neither case changed the mechanism
The decoupling mechanism now excludes lost sales resulting from major storms
Reconciling Actual Revenue With Authorized Revenue
On a monthly basis each rate classrsquos target base revenues are compared to the actual base revenues for the month The difference is divided by the forecasted sales for the following period to calculate the monthly rate adjustment Balancing accounts are used to record the timing differ-ences associated with when the adjustments are calculated versus when they are billed or refunded The monthly rate adjustment Rider 25 is capped at ten percent of rates Any amount beyond ten percent of the current rate will be car-ried over and reconciled in the subsequent period
Complementary PoliciesMaryland requires its electric utilities to provide energy
efficiency services to achieve a ten-percent reduction in per capita electricity use by 2015 The statersquos overall goal is a 15 percent reduction of per capita electricity use by 2015 Although the PSC is explicitly allowed to approve financial incentive mechanisms to promote energy efficiency no incentives have been approved yet25
BGErsquos default service to its standard offer residential cus-tomers (those customers who have not elected to take gen-eration service from an alternate supplier) features seasonal
ratesmdashsummer and winter BGE also offers a TOU rate as an option to standard offer residential customers and as the default rate for small general service customers
Regarding performance incentives under revenue regula-tion in October 2012 Maryland issued a four-part plan designed to speed up investments that will strengthen the statersquos distribution grid Part of that plan would set a rate-making structure that aligns customer and utility incentives by rewarding reliability that exceeds established reliability metrics and penalizing failure to reach those metrics A task force has encouraged the Maryland state regulatory com-mission to implement a performance-based ratemaking process for IOUs such as BGE linking a utilityrsquos progress or failure to meet certain reliability metrics with its authorized rate of return
Energy Efficiency OutcomesWhen BGE implemented electric revenue regulation in
mid 2007 it had not achieved incremental energy savings for several years In 2008 it reported incremental savings of 05 percent of retail load increasing to 17 percent in 2010 and 2011
ResourcesMaryland Public Service CommissionLetter Order ML 108061 (December 27 2007)Letter Orders ML 108069 (November 30 2007) Case No 9036 Order No 80460 (December 21 2005) Case No 9230 Order No 83907 (December 13 2013) Case No 9326 Order No 86060 (December 13 2013)
22 BGE (2007 October 26) 9111FilingConser-va102607F Available at httpwebapppscstatemdusintranetmaillogcontentcfmfilepath=C5CCasenum5CAdmin20Filings5C60000-1099995C1080615C9111FilingConserva102607Fpdf
23 Case No 9230 ndash See references above
24 Case No 9326 ndash See references above
25 ACEEE Maryland Available at httpaceeeorgsectorstate-policymarylandEnergy Efficiency Resource Standards
26 EIA Form EIA-861 data files Available at httpwwweiagovelectricitydataeia861
Decoupling Case Studies Revenue Regulation Implementation in Six States
16
27 The pilot extension is in effect until the effective date of a Final Decision issued by the Commission on an application for a general base rate case filed after January 1 2013
28 Except the Direct Load Control Cp - Large Commercial amp Industrial Service Cp-ND - Pilot Large Commercial amp Industrial - Day Ahead Cp-RR - Large Commercial amp Industrial Response Rewards Automatic Transfer Switch Parallel Generation Lighting Nature Wise and Real Time Market Pricing tariffs
Wisconsin Wisconsin Public Service Corporation
Wisconsin Public Service Corporationrsquos (WPS) Revenue Stabilization Mechanism (RSM) began in 2009 as a four-year revenue regulation pilot that reconciled
target marginal revenue per customer with actual marginal revenue per customer As of 2012 the pilot was extended27 albeit with some modifications This section focuses on the current iteration of the RSM
AuthorityThe Public Service Commission of Wisconsin (PSCW)
approved a revenue regulation pilot for WPS in a Decem-ber 2008 rate case order (Docket No 6690-UR-119) The revenue regulation mechanism was effective from January 1 2009 through December 31 2012 and applied to the util-ityrsquos electric and gas operations In a rate case completed in December 2012 (Docket No 6690-UR-121) the pilot was extended and a modified RSM was approved The extended RSM is in effect from January 2013 until the next rate case
Authorized Revenue RequirementThe authorized revenue requirement is determined
through a rate case The Commission uses a future test year to determine the revenue requirement The cost of fuel is not included in the revenue requirement but is addressed through a ldquoRetail Electric Fuel Rulerdquo adjustment
Rate of ReturnThe Commission authorized a rate of return on utility
common equity of 1030 percent in Docket No 6690-UR-120 This rate remained the same in Docket No 6690-UR-121 and is currently in effect
Revenue Adjustment MechanismWPS implemented a new electric RSM based on a ldquoTotal
Rate Case Marginrdquo mechanism instead of a ldquoTotal Rate Case Margin per Customerrdquo mechanism which had been the practice during the initial four-year pilot phase The revision was intended to remove the calculation sensitivities related
to sales per customer from the original RSM calculation The margin reflected in the formula equals the total revenue for each tariff less the costs associated with the annual per-kWh value established for monitored fuel costs and excluding any surcharges credits taxes or similar charges The ldquoTotal Rate Case Marginrdquo mechanism allows WPS to achieve the total margin assumed in the forecasted test year no more and no less The new RSM will be in effect on a pilot basis until the effective date of WPSrsquos next general rate order which WPS committed to filing for the 2014 andor 2015 test years The RSM applies to most tariffs except large commercial and industrial customers28
Reconciling Actual Revenue With Authorized Revenue
Each year the utility compares the total target revenue and the total actual revenue and defers the difference subject to carrying costs based on WPSrsquos last approved short-term debt rate The margin will be based on annual per-kWh value established for monitored fuel costs which is done in a rate case The margin is determined by subtracting the aver-age kWh value from the authorized energy rates
The formula for calculating an electric under-recovery or over-recovery is
Under-recovery or over-recovery equals
[actual margin minus ratecase forecasted margin established in the most recent rate proceeding]
The summation is over each tariff A positive value equals an over-recovery and a negative value equals an
Decoupling Case Studies Revenue Regulation Implementation in Six States
17
29 The required spending level was higher for the year 2011 owing to a temporary change in state policy
30 ACEEE Wisconsin Available at httpaceeeorgsectorstate-policywisconsin
31 The Cadmus Group Inc (2013)
under-recovery The margin reflected in the formula equals the total revenue for each tariff less the costs associated with the annual per-kWh value established for monitored fuel costs and excluding any surcharges credits taxes or similar charges
In the event that a true-up will cause rates to increase the Commission will provide an opportunity for a hear-ing Revenue regulation adjustments occur as a part of the general rate case
The revenue regulation adjustments are subject to a $14 million per year cap for electric excluding carrying costs Any adjustments over that amount will not be carried over and will not be collected from ratepayers Equivalently revenue over collection in excess of $14 million will not be returned to ratepayers
Complementary PoliciesWPS like all other investor-owned utilities
in Wisconsin is required to spend 12 per-cent of its annual operating revenues on en-ergy efficiency and customer-owned renew-able resource programs that are administered by a third party through the Focus on Energy program which was established in 200229 Separately through a contract the PSCW ap-proves annual electricity savings goals for the Focus on Energy program The savings goals were equivalent to 075 percent of electric sales for the participating utilities from 2011 to 2013 In addition the PSCW approved a rate of return on investments in energy efficiency for Wisconsin Power amp Light and other utilities can propose incentives as part of their rate cases However WPS has not yet proposed an incentive mechanism30
WPS offers residential customers a default flat rate but they also offer a TOU option with winter and summer on-peak off-peak and shoulder tiers For small commercial and industrial customers there are flat rates TOU rates and critical peak rates Large commercial and industrial customers can take service under a TOU rate with summer and winter on-peak and off-peak rates a TOU with criti-cal peak rate or under a special contract rate unique to the customer and approved by the Commission
The authorized level of expensed conservation costs recoverable in rates for the test year (2013) is $19778728 The level for electric utility operations consists of the conservation budget of $17669792 and an escrow adjustment of $2108936 which represents the test year amortization of the projected overspent escrow balance at
December 31 2012 over two years Wisconsin has a statute requiring filing of reliability data
but no reward or penalty system to support its revenue regulation system
Energy Efficiency OutcomesWPS implemented revenue regulation in 2009 In order
to gain approval for the original revenue regulation mecha-nism WPS agreed to fund energy efficiency and renewable energy programs at levels above their 12-percent statutory minimum contribution to Focus on Energy Focus on Energy produces an annual report of energy efficiency program activities In its 2012 report Focus on Energy reports the following outcomes achieved for WPSrsquo service territory The table below represents the savings under the statewide Focus on Energy Programs and does not represent the savings at-tributed under the funding levels above 12 percent31
Territory Segment
Customer Participation
Rate () Utility Type
Per Capita Lifecycle Bill Savings ($)
Per Capita Incentive
($)
WPS Electric Commercial $115258 3 $8330
WPS Electric Industrial $9026768 96 $892463
WPS Electric Residential $6494 36 $666
ResourcesPublic Service Commission of WisconsinApplication of Wisconsin Public Service Corporation for
Authority to Adjust Electric and Natural Gas Rates Final Decision (December 7 2012) Docket No 6690-UR-121
David J Kyto Wisconsin Public Service Corporation Application of Wisconsin Public Service Corporation for
Authority to Adjust Electric and Natural Gas Rates Supplemental Direct Testimony (May 15 2012) Docket No 6690-UR-121
Focus on EnergyThe Cadmus Group Inc (2013) Focus on Energy Calendar
Year 2012 Evaluation Report Appendixes Portland OR The Cadmus Group Inc Retrieved from httpwwwfocusonenergycomsitesdefaultfilesFOC_XC_CY201220Report20Appendices20A-O20Final2005-3-13pdf
Decoupling Case Studies Revenue Regulation Implementation in Six States
18
32 DPU 07-50 (2007)
33 DPU 07-50 (2007) pp 392ndash396
Massachusetts National Grid
The revenue regulation mechanism for National Grid (Massachusetts Electric Company and Nantucket Electric Company together doing business as National Grid) compares authorized
distribution revenue to actual distribution revenue Revenue is compared and adjustments are made separately for each customer class
AuthorityThe Massachusetts Department of Public Utilities (DPU)
adopted revenue regulation as a statewide regulatory policy in 2008 and individual utilities filed revenue regulation tariffs in response In its Investigation Into Rate Structures that will Promote Efficient Deployment of Demand Resources32 the DPU investigated rate structures and revenue recovery mechanisms that may reduce disincentives to the efficient deployment of demand resources in the state and consid-ered how the electric and natural gas distribution compa-niesrsquo existing cost recovery mechanism could be changed to better align the companiesrsquo financial incentives with policy objectives while ensuring that the companies are not finan-cially harmed by the increased use of demand resources The DPU finally concluded that revenue regulation mecha-nisms would eliminate the financial disincentives because they sever the link between the companiesrsquo revenue and reduction in sales The DPU also endorsed a revenue per customer approach but recognized that other factors could result in changes to distribution-related costs and consent-ed to consider company-specific ratemaking proposals that accounted for the impact of capital spending and inflation-ary pressures on the companyrsquos required revenue
Authorized Revenue RequirementThe authorized revenue requirement does not include
costs that are reconciled outside of base distribution rates including energy supply costs for basic service customers transmission costs the energy efficiency system benefits charge and reconciling charge and costs recovered through the residential assistance adjustment factor
Rate of ReturnThe Commission recognized the effects of revenue
regulation on ROE and determined that revenue regulation reduces volatility which reduces risk and a downward ad-justment to ROE was appropriate but did not make its ac-tual ROE adjustment for the revenue regulation mechanism explicit in its order33 The DPU determined that a return on equity equal to 1035 percent was sufficient The testimony from National Grid supporting its proposed ROE presented comparisons of allowed ROE for a set of companies that had revenue regulation or another risk management mecha-nism in place to account for an implied reduced risk profile in developing that proposal
Revenue Adjustment MechanismEach year the authorized revenue requirement is ad-
justed to account for capital expenditures in the previous year The CapEx Adjustment applies to capital expenditures incurred by National Grid for distribution system invest-ments in the previous year net of the amount recovered through depreciation expense in base rates This accounts for the material difference in expected capital expenditures compared with prior years In this way the CapEx Adjust-ment in the National Grid revenue regulation mechanism is a special case of a ldquoK Factorrdquo which characterizes an expected change in costs in the future and accounts for those changes when they occur Each year the Company files with the Department documentation in support of the capital expenditures it has incurred since the previous review The Department reviews the filings to determine the prudence of the incremental expenditures and whether the expenditures are used and useful National Grid then allocates approved expenditures to rate classes based on the cost of service study For each class the Company determines the adjustment allocated to the rate class then divides this sum by the forecasted kWh sales for the follow-
Decoupling Case Studies Revenue Regulation Implementation in Six States
19
34 DPU 07-50 (2007) p 87
35 ACEEE Massachusetts Available at httpaceeeorgsectorstate-policymassachusetts
36 Personal communication with National Grid
ing year to determine the per-kWh adjustment In order to provide a balance between providing the
Company with sufficient funds to ensure the safety and reliability of the distribution system and protecting ratepay-ers against the incentive the Company has to overinvest in infrastructure the mechanism limits the level of annual capital expenditures that is recoverable through the mecha-nism To arrive at the amount the Department set a limit of $170 million per year which is equal to the approximate three-year average of the Companyrsquos capital spending in previous years Should the Companyrsquos capital expenditures exceed this limit it may seek to include the investment in the rate base during the next base rate proceeding
The Company submits its CapEx filing no later than July 1 of each year On November 1 of each year the Company submits all other information in support of its proposed adjustment factors The factors will take effect on March 1 of each year
The authorized revenue is also adjusted to include a 50-percent sharing for earnings above the authorized ROE
Reconciling Actual Revenue With Authorized Revenue
Each year National Grid calculates on a rate class-spe-cific basis the difference between the actual distribution revenue billed to customers through distribution rates and the annual target revenue For each rate class the difference between the actual billed distribution revenue and the an-nual target revenue is summed to determine the Company-wide reconciliation amount That amount is divided by the Company-wide kWh forecasted for the upcoming year to arrive at a cent-per-kWh reconciliation charge or credit To determine the final adjustment for each rate class the Company-wide reconciliation adjustment is added to the rate class-specific adjustment resulting from the target rev-enue adjustment mechanisms
The adjustment to the authorized revenue in any year is capped at three percent of total revenues34 Any excess can be carried forward to a future year with carrying charges equal to the customer deposit rate
National Grid must report to the DPU if the difference between the year-to-date billed revenue and year-to-date annual target revenue equals or exceeds ten percent of the target revenue and the Company believes that the difference will fall outside of the ten-percent threshold in the coming months In this case interim revenue regulation adjust-ments can be made In order to avoid an interim adjust-ment too close to the scheduled annual rate adjustment
National Grid must notify the Department of variances exceeding ten percent of annual target revenue by August 31 of each year
Complementary Policies Massachusetts requires that electric utilities procure
all cost-effective energy efficiency before more expensive supply-side resources This requirement was translated into annual savings requirements for electric utilities starting from 1 percent of sales in 2009 to 14 percent in 2010 2 percent in 2011 and 24 percent in 2012 and potentially increased savings in subsequent years Utilities can earn approximately five percent of program costs for meeting or exceeding savings targets35
National Grid offers inclining block rates as the default residential rate but there is an optional TOU rate with peak and off-peak tiers also available to residential customers Small and large industrial and commercial customers can take service under flat rates inclining block rates or TOU rates
National Grid operates under a penalty and reward sys-tem for service quality established in Docket DTE 99-84 The impetus behind the DPUrsquos original establishment of the Service Quality Guidelines was to prevent Massachusetts utilities from allowing service quality to deteriorate under a new regulatory regime
Energy Efficiency OutcomesBefore Massachusetts Electric implemented revenue
regulation in 2009 it reported consistently high levels of incremental energy efficiency savings approximately 09 percent of retail load In 2010 the company reported 136 percent savings and 159 percent in 2010 and 2011 respectively36
ResourcesMassachusetts Department of Public UtilitiesDocket 09-39 Petition of Massachusetts Electric Company
(November 30 2009)
Decoupling Case Studies Revenue Regulation Implementation in Six States
20
37 Energy Agreement Among the State of Hawaii Division of Consumer Advocacy of the Department of Commerce amp Consumer Affairs and Hawaiian Electric Companies Available at httpwwwhecocomvcmcontentStaticFilespdfHCEIpdf
38 The HECO Companies described as follows in their Reply SOP in the Schedule A decoupling proceedings ldquothe
Hawaii Hawaiian Electric Company
Hawaiian Electric Company (HECO) uses a revenue regulation mechanism that compares actual revenue to target revenue in each year The target revenue is based on the authorized
revenue for the last test year adjusted for operation and maintenance (OampM) increases and rate base changes
HECO is a subsidiary of Hawaiian Electric Industries which also operates Maui Electric Company (MECO) and Hawaiian Electric Light Company these subsidiaries service the islands of Maui and Hawaii County while HECO serves Oahu (Honolulu)
Authority In 2008 the Governor of Hawaii the Division of Con-
sumer Advocacy and HECO entered into an agreement as a result of the Hawaii Clean Energy Initiative37 The agreement is intended to move Hawaii away from its dependence on imported fossil fuels for electricity and ground transporta-tion and toward locally produced renewable energy and energy efficiency In the agreement the State the Consumer Advocate and HECO committed to among other things a transition away from a model that encourages increased elec-tricity usage and to a model that implements revenue regula-tion decoupling to encourage the development of renewable energy by HECO The Commission opened Docket 2008-0274 in order to examine the features of a revenue regula-tion mechanism The Opening Order directed HECO and the Consumer Advocate to file a joint proposal on revenue regulation within 60 days This joint proposal was modeled closely after the California mechanism described earlier for PGampE with a rate-case determined revenue requirement plus annual attrition adjustments plus separate mechanisms
to recover power supply and energy efficiency costsThe Hawaii Public Utilities Commission approved
revenue regulation for HECO in August 2010 based on an investigation into the appropriateness of revenue regula-tion and its design The revenue regulation mechanism took effect on March 1 2011 This replaced a previous lost revenue adjustment mechanism
Authorized Revenue RequirementThe Commission establishes the Authorized Base Rev-
enues through a general rate case based on traditional cost-of-service ratemaking principles The Authorized Base Revenue is the annual amount of revenues required for the utility to recover its estimated OampM depreciation amorti-zation and tax expenses for the period
The Target Revenue is equal to the base revenue require-ment less any revenue being separately tracked or recov-ered through any other surcharge or tracking mechanism including revenue for fuel and purchased power expenses
The revenue regulation order also requires staggered triennial rate cases for each of the Hawaiian Electric Indus-tries Companies to determine approved baseline Revenue Adjustment Mechanism (RAM) inputs
Rate of ReturnThe Commission made no explicit adjustment to ROE
owing to the revenue regulation mechanism but noted that the allowed ROE of ten percent reflects the approval of revenue regulation and other cost-recovery mechanisms that will lower HECOrsquos business risk38 Most recently the Hawaiian Public Utilities Commission approved a 90-per-cent ROE for MECO reflecting both a lower baseline cost
Commission effectively reduced the Companiesrsquo return on common equity by 50 basis points to ldquofairly compensate ratepayersrdquo for what it perceived as the ldquorisk-reducingrdquo effects of the RBA and RAM mechanisms the Renewable Energy Infrastructure Program (lsquoREIPrdquo) Surcharge and the Purchased Power Adjustment Clause (ldquoPPACrdquo)rdquo Available at httpdmspuchawaiigovdmsDocumentViewerpid=A1001001A10L29B55326B47993
Decoupling Case Studies Revenue Regulation Implementation in Six States
21
39 Hawaii PUC Decision and Order No 31288 (2013 May 31) pp 97ndash112
40 Hawaii PUC Decision and Order No 31289 (2013 May 31)
41 Hawaii PUC Decision and Order No 31908 (2014 Feb 1)
42 February 7 2014 order on schedule A issues Available at httpdmspuchawaiigovdmsDocumentViewerpid=A1001001A14B10B22326F07922 p 42ndash47
of capital and a penalty of 050 percent associated with inadequate performance bringing renewable energy into the MECO system39 A companion Order also established new guidance on future revenue regulation mechanisms40
Revenue Adjustment MechanismThe RAM is designed to replace the need for annual rate
cases by adjusting Authorized Base Revenue levels to reflect estimated changes in the utilityrsquos cost of service The RAM is intended to via formula-driven estimates and escalators compensate the HECO Companies for changes in util-ity costs and infrastructure investment between rate cases and reduce the frequency of rate cases The RAM Period is the calendar year containing the Annual Evaluation Date (March 31 the date of the annual RAM filing) The RAM adjusts the revenue requirement according to changes in four main categories of expenses
bull Base expenses which are changes in designated OampM expenses
bull Rate base the return on incremental investment in designated rate base components41
bull The incremental depreciation and amortization expenses and
bull Exogenous tax changes changes in costs owing to significant changes in tax laws or tax regulations
Base expenses are segregated between labor and non-labor amounts The labor component is adjusted annually by the Labor Cost Escalation Rate reduced by the Labor Productiv-ity Offset (fixed at 076 percent) The non-labor component uses the Non-labor Escalation Rate to annually adjust those costs Tracked OampM expenses for fuel purchased power pension and post-employment benefits integrated resource planning DSM and other rate adjustment provisions are not adjusted in the RAM because any changes in these costs are accounted for in other cost-tracking mechanisms
The Rate Base equals the average net investment esti-mated for the RAM Period The average rate base is the rate base for the rate case test year with adjustments for changes in only four components of rate base (1) average plant-in-service (2) average Accumulated Depreciation (3) average accumulated contributions in aid of construc-tion and (4) average accumulated deferred income taxes All other components of the rate base remain the same as in the preceding rate case test year The average plant-in-service is equal to the average of the actual plant-in-service at the end of the year prior to the RAM period the Evalu-ation Year and the same year-end balance plus estimated plant additions for the RAM period Plant additions include
Baseline Capital Project plant additions and Major Capital Projects plant additions estimated to be in service by Sep-tember 30 of the RAM period
The RAM also includes an Earnings Sharing Revenue Credit mechanism in order to protect against excessive over-all utility revenue levels The RAM will escalate and update the Companyrsquos approved base revenue requirement reduced by earnings sharing credits and major project revenue credits to customers Based on the Companyrsquos achieved return on common equity for the Evaluation Year the mechanism cred-its the RBAs according to the following chart
ROE at or below the authorized ROE
First 100 basis points (1) over authorized ROE
Next 200 basis points (2) over authorized ROE
ROE exceeding 300 basis points (3) over
authorized ROE
Retained entirely by shareholders no customer credits
25 share credit to customers
50 share credit to customers
90 share credit to customers
Finally the RAM includes additional consumer protectionsbull A provision for Major Capital Projects Creditsbull A provision for Baseline Capital Projects Creditsbull Notification is provided to all affected customers of
the RAM filing in newspapers and billsbull Evaluation procedures for filing examination and any
exceptions to annual revenue regulation filingsbull Continued ability of HECO or the Consumer
Advocate to request formal rate proceedings to replace and terminate RAM at any time and
bull Formal review of revenue regulation as a part of the next round of rate case proceedings
A recent order42 added two additional consumer protections
bull A limitation that only 90 percent of the current
Decoupling Case Studies Revenue Regulation Implementation in Six States
22
43 ACEEE Hawaii Available at httpaceeeorgsectorstate-policyhawaii
RAM Period Rate Base that exceeds the Rate Base Adjustment Mechanism from the prior year can be included in the Decoupling Mechanism for baseline utility plant projects which unlike major capital projects are not subject to prior Commission review and approval and
bull A requirement to post a number of metrics online for customer review although not at this point tied to performance
This order also examined four issues with respect to the application of the RAM The Commission determined that the short-term debt rate as reflected in the most recent rate case should be used to adjust over- and under-collections The Commission also resolved its concern that without a sustainable business plan there exists no strategic frame-work under which to evaluate capital expenditure pro-grams The Commission required the parties in the Docket to further explore capital expenditure issues in conjunction with other risk-sharing mechanisms discussed elsewhere in the order The commission ordered a further evaluation of a proposed risk-sharing mechanism within the RBA Further-more the Commission ordered the parties to work together to establish appropriate metrics which the utility would report on its website
Once the total RAM Revenue Adjustment is calculated it is applied through a uniform adjustment to the per-kWh energy charge for all customer classes
Reconciling Actual Revenue with Authorized Revenue
RBAs record the monthly differences between target revenues and the adjusted recorded electric sales revenues The RBA also applies monthly interest equal to the annual rate for short-term debt from the cost of capital in each HECO Companyrsquos last base rate case to the simple average of the beginning and ending balances each month in the RBA In effect the RBA applies one-twelfth of the rate each month Finally the RBA provides for collection or return of the calendar year-end balances in the RBA and recovery of the RAM Revenue Adjustment over the subsequent May 1 through April 30 period The target revenue is the most recent Authorized Base Revenue or the re-determined Authorized Base Revenue calculated under the RAM
On or before March 28 the Company must file with the Commission a statement of the previous year-end balance in each RBA sub-account and the Authorized Base Revenue level for the current calendar year with supporting calculations An amortization of the year-end balance in the
RBA sub-accounts and the RAM Revenue Adjustment are recovered through the per-kWh RBA rate adjustments The rate adjustment occurs from May 1 of the current calendar year to April 30 of the next year
Complementary PoliciesCurrently electric utilities in Hawaii may use energy
efficiency to meet a portion of their Renewable Portfolio Standard requirements Starting in 2015 electricity savings from energy efficiency will be applied to the Statersquos Energy Efficiency Portfolio Standard which sets a target equivalent to 30-percent forecast sales by 2030 This goal is translated into a target of 14 percent annual savings HECO trans-ferred administration of all of its energy efficiency programs to a third party administrator in 2009 The administrator is compensated for satisfactory performance43
Because of its heavy dependence on petroleum as a generation fuel electricity prices in Hawaii are very high solar and wind are typically lower-cost resources for these systems HECOrsquos default residential rates are inclining block rates with a $900month customer charge and a three-block inclining rate design of $034kWh to $037kWh Residential customers can elect to take service under a TOU rate with off-peak mid-peak and priority-peak tiers Gen-eral service and large power service customers take service under a flat rate unless they opt to take service under a TOU
Hawaii is developing reliability standards in part as a response to deteriorating service quality as a result of distributed and customer-owned generation (see text box) In an effort to make electricity reliability and interconnection standards as transparent as possible the Reliability Standards Working Group was formed in the Feed-In Tariff docket and continues its work in Docket No 2011-0206 to find solutions to integrating high penetrations of renewable energy consistent with reliability and power quality standards
Energy Efficiency OutcomesHECO implemented revenue regulation in 2011 Since
2003 HECO has reported incremental energy efficiency savings between 0 and 05 percent of retail load with 131 percent savings reported in 2011 by Hawaii Energy the
Decoupling Case Studies Revenue Regulation Implementation in Six States
23
44 Hawaii PUC Decision and Order No 31288 Maui Electric Company Limited Docket No 2011-0092 (2013 May 31) Appendix C p 2
Statersquos ratepayer funded efficiency program administrator The company has not yet reported its savings for 201245 In addition HECO has seen more than a sixfold increase in renewable installations under its net metering and feed-in tariff policies since the inception of the revenue regulation plan
Revenue regulation represents a regulatory framework that removes the financial disincentive for utilities to pursue clean
energy strategies It doesnrsquot in and of itself align the utility business model with those utility policies and practices that address customer expectations In fact some commissions are concerned that it might create a dynamic in which the utility assured of its revenue needs becomes complacent and lacks motivation to innovate and develop strategies that may be more in line with the public interest
In a recent order (Docket 2011-0092 May 31 2013) the Hawaiian Public Utilities Commission addressed this big picture issue in a rate order for Maui Electric The Commission called out the management as lacking a long-term vision for creating customer value and expressed concern that ldquothe HECO Companiesrsquo over-reliance upon a link between the [Decoupling]
Agreement and utility financial health obfuscates utility performance and ultimately customer service and satisfactionrdquo44 The implementation of clean energy policies is not a singular goal but rather a policy that must be part of a larger effort to create customer value
The Commission laid out a hard path and a soft path to achieve the results they desire for consumers The hard path involves a closer examination of utility investments operations and expenditures The soft path is opened through the actions of management to create and execute a vision for the utility of the future The Commission remains committed to regulatory innovations that are in the public interest and will work with the utility consumer advocate and other stakeholders to create and implement this vision
The results of this effort will likely produce ideas and outcomes that will have applicability beyond this one utility
ResourcesHawaii Public Utilities CommissionDocket No 2008-0274 Final Decision and Order (August 31 2010)Docket No 2008-0083 Final Decision and Order (December 29 2010)Docket No 2011-0092 Final Decision and Order May 31 2013 including
Decision and Orders Nos 31288 and 31289Docket No 2013-0141 Final Decision and Order (February 1 2014) including
Decision and Order No 31908
45 EIA Form EIA-861 data files Available at httpwwweiagovelectricitydataeia861
Decoupling Case Studies Revenue Regulation Implementation in Six States
24
46 Lazar et al 2011
Discussion of the Six Utilities Overall
Authority The first step in implementing a revenue regulation
mechanism is to understand the authority of the regulating body the Public Utility Commission or PSC It is important for any Commission to clarify its justification for acting on revenue regulation in order to prevent any decisions from being overturned Over the years Utilities Commissions have relied on different justifications for implementing revenue regulation mechanisms Commissions have imple-mented revenue regulation at their own discretion justified by their directive to ensure safe reliable and economic public utility service to citizens to justify changing the regulatory environment In some cases the Commission is unable to engage on narrow issue ratemaking and rates can change only as the result of a full rate case In this case statutes must be amended to enable revenue regulation
In all of the case studies discussed here the Commis-sions first implemented revenue regulation at their own dis-cretion but each followed slightly different paths to do so The CPUC first implemented revenue regulation in 1978 at its discretion In 2001 after a period when mechanisms were suspended the California Legislature required that deviations from projected sales not result in under- or over-collections by utilities and so the CPUC re-implemented revenue regulation according to statutory requirement The Hawaii Public Utilities Commission implemented rev-enue regulation after an agreement between the utility the Governor and other stakeholders called for it In Idaho the Commission established a case in which to investigate rev-enue regulation and held a series of stakeholder workshops before implementing the policy The Massachusetts DPU adopted revenue regulation as a statewide regulatory policy and required individual utilities to file tariffs in response as the result of its general investigation into rate structures that promote demand-side resources The Maryland Com-mission implemented revenue regulation for BGE when the utility requested the mechanism Thus the impetus to develop a revenue regulation mechanism may come from different sources and the Commission may be comfortable
in moving forward under their general supervisory statutes Nevertheless specific statutory language can be helpful to shore up the existing authority
Authorized Revenue Requirement Under the traditional regulatory framework the Com-
mission (or other authority in the case of publicly owned utilities) must determine a utilityrsquos revenue requirement This function does not change under revenue regulation The revenue requirement of a utility is the aggregate of all the operating and other costs incurred to provide service to the public This typically includes operating expenses depreciation and the cost of capital invested including in-terest on debt and a ldquofairrdquo return on equity to investors The (simplistic) formula for determining revenue requirements is as follows
Revenue Requirements = (Rate Base times Rate of Return) + Operating Expenses + Depreciation +Taxes
Traditionally the revenue requirement along with sales is used to determine the rates consumers will pay for elec-tricity46 The rates are also broken down by customer class and intraclass tariffs are created based usually on a cost of service study that determines each customer class and subclass contribution to the utilityrsquos costs The (simplistic) formula for determining the rate per unit is
Rate = Revenue Requirement divide Units Sold
In this way rates are set to allow the utility to exactly recover its revenue requirement when the sales level used to calculate rates is equal to actual sales However it is important to recognize that actual expense and revenue varies with actual sales When actual sales are greater than the sales level used in ratemaking revenue increases and expenses increase by a different amount when actual sales are lower than the ratemaking sales level actual revenue
Decoupling Case Studies Revenue Regulation Implementation in Six States
25
declines and expenses decrease by a different amount Under revenue regulation rates are initially set in the same way but when actual sales differ from the level used to calculate rates the actual revenue level is maintained at the rate case amount as rates are allowed to vary inversely with salesmdashincreased sales lead to decreased rates and vice versa Because the primary expenses that change in the short run as sales levels change are power supply expenses and most regulators allow these to be tracked using a power cost adjustment mechanism revenue regulation mechanisms are generally designed to ensure recovery of the non-power costs (which do not change significantly in the short-run) as sales volumes change
Revenue regulation ensures that actual revenue is equal to the revenue requirement established by the Commission or appropriate authority Although the description above presents an overly simplified view of the revenue require-ment and its use in traditional price regulation and revenue regulation there are many variations on how a Commis-sion can establish a revenue requirement particularly when implementing revenue regulation With revenue regulation as in traditional ratemaking imprudent costs can always be removed from rates and there is no change to the ability of a Commission to impose penalties
Utility Functions to be IncludedFirst the regulator must determine which utility func-
tions will be included in the revenue regulation framework With vertically integrated utilities this usually includes a utilityrsquos regulated generation transmission and distribution units As we discuss below however it is critical to struc-ture power supply recovery mechanisms to avoid providing for double-recovery of certain power supply costs For utili-ties operating in areas of the country that have restructured electricity markets only the regulated distribution busi-ness is decoupled Utilities that also provide gas services
Pacific Gas amp Electric Future test year
Idaho Power Company Historic test year
Baltimore Gas amp Electric Hybrid test year
Wisconsin Public Service Corporation Future test year
National Grid Historic test year
Hawaiian Electric Company Future test year
Table 2
Test Year Used
may have their gas distribution business operating under revenue regulation as well
Test YearOne consideration in establishing the revenue require-
ment is what period of time will be used as a ldquotest periodrdquo or ldquotest yearrdquo The test year is the year on which the Com-mission will base its computations of the utilityrsquos total costs and sales levels A historic test year uses actual data on sales and costs from a past year Whereas a historic test year allows for the use of actual cost data it cannot account for expected variations in sales A future test year requires assumptions to be made about a utilityrsquos sales in a future year This can allow expected changes in sales like those from energy efficiency programs to be included in sales
projections however because regulators are relying on estimates provided by the utility there may be a greater risk for inaccuracy A Commission may also choose to use a test year that includes both past and future periods This may provide a sense of balance between historic and future data Furthermore as the case proceeds the Commission can require the utility to substitute historical data for projected data from the test year
Rate of ReturnAs in any rate case regulators
must determine the appropriate rate of return that a utility can earn on its investments including the cost of debt and the allowed ROE for its shareholders The approved ROE is only used to establish the return on investments that are included in the rate base when determining revenue require-
Pacific Gas amp Electric Electric generation and distribution gas distribution
Idaho Power Company Electric generation and distribution
Baltimore Gas amp Electric Electric distribution gas distribution
Wisconsin Public Service Corporation Electric generation and distribution
National Grid Electric distribution
Hawaiian Electric Company Electric generation and distribution
Table 1
Business Unit Included in the Revenue Regulation Model
Decoupling Case Studies Revenue Regulation Implementation in Six States
26
47 In a rate case the Commission determines an allowed return on equity This is used to set a price (price regulation) or an allowed revenue requirement (revenue regulation) Once set however the actual return earned by the utility is affected by anything that changes either revenue or expenses for example an increase in employee compensation a change in the number of employees or under price regulation a change in sales volumes
48 Lazar et al 2011
ments Although revenue regulation ensures that a utility recovers no more or less than its target revenue revenue regulation does not guarantee that the utility will earn the authorized ROE Depending on how a utility manages its costs between rate cases it will realize an actual ROE either higher (in the case of reduced costs) or lower (in the case of increased costs) than the authorized level47
A utilityrsquos allowed ROE generally represents the return deemed necessary to attract investment considering the level of risk of that investment Riskier investments require a higher return to attract investors and vice versa Util-ity earnings can be volatile because of short-run impacts on sales volumes and revenues which include changes in sales owing to weather economic conditions and energy efficiency and DG programs This volatility typically causes utilities to retain a higher level of equity in their capital structures so that reduced revenues do not leave them un-able to service their debt Revenue regulation can reduce this volatility by stabilizing revenues regardless of the cause Because of this reduced risk many stakeholders have proposed that the implementation of a revenue regulation mechanism be associated with a corresponding reduction in the utilityrsquos equity capital ratio (the percentage of capital supplied by common equity) This reflects the utilityrsquos more stable revenue owing to revenue regulation and reduces the overall revenue requirement that will be recovered from consumers48
An alternative option to reducing the utilityrsquos equity ratio is to reduce the ROE reflecting a lower risk level For the utilities included in these case studies only BGE and Mass Electric experienced a reduction in their ROE The Com-mission did not reduce BGErsquos ROE at the time the revenue regulation mechanism was implemented but reduced it by 50 basis points during the subsequent rate case The Mas-
sachusetts Commission did not reveal its adjustment but incorporated a lowered ROE into its decision
Absent an explicit adjustment to the cost of capital investorsrsquo expectations will adjust to the presence of rev-enue regulation if its presence is reliable The more stable earnings will likely in time contribute to a higher credit rating That in turn will lead to lower cost debt that will be revealed in future cost of capital calculations An adjust-ment to the ROE or capital structure by the regulator in a rate proceeding will be reflected immediately in lower rates to consumers simply allowing the utilityrsquos credit rating to improve over time and its cost of debt to decline will have the same effect but on a lagged basis as new bonds are is-sued at lower interest rates49
Beginning in 2004 Standard and Poorrsquos began publish-ing ldquorisk profilesrdquo for utilities which classified utilities based on their earnings variability and other risks those with more stable earnings were determined eligible for higher bond ratings at any given equity capitalization ratio (or alternatively able to retain a given bond rating with a lower equity ratio)50 One utility with a revenue regulation mechanism Northwest Natural Gas was believed to have had their business risk profile upgraded by one step in response to the benefits of the mechanism51
Effect on Bond RatingsRevenue regulation stabilizes a utilityrsquos revenue streams
reducing risk to investors this reduced risk may be a contributing factor in an increase in a utilityrsquos bond rating Bond rating agencies have recognized that revenue regula-tion mechanisms and other mechanisms that reduce net earnings volatility and risk contribute to a lower cost of capital for the utility52 Standard and Poorrsquos has explicitly stated that it ldquoviews decoupling as a positive develop-
49 Lazar et al 2011
50 Standard and Poorrsquos (2004 June 2) New Business Profile Scores Assigned for US Utility and Power Companies Financial Guidelines Revised
51 Christensen Associates (2005 March) A review of distribution margin normalization as approved by the Oregon Public Utility Commission for Northwest Natural
52 Lazar et al 2011
Decoupling Case Studies Revenue Regulation Implementation in Six States
27
This topic raises a note of caution if mechanisms are not well designed double-recovery of costs can occur for verti-cally integrated utilities that provide both power supply and distribution services For example if a per-customer
revenue regulation mechanism includes investment-related power supply costs in the revenue-per-customer formula but excludes fuel and purchased power costs that are recovered through a separate tracking mechanism double recovery of some power supply costs is likely If the utility experiences cus-tomer and sales growth the amount it recovers for investment-related power supply costs will go up However if that utility serves this growth by operat-
ing existing power plants more by selling less power on the surplus market or by purchasing power from other suppli-ers it will not incur any increases in the type of power sup-
53 Standard amp Poorrsquos (2008 February 19) Decoupling the vehicle for energy conservation
ment from a credit perspectiverdquo53 However in the case of the utilities examined in this report none experienced an improved credit rating after the implementation of revenue regulation with the exception of PGampE However PGampE came out of Chapter 11 bankruptcy in the same year that its revenue regulation mechanism was implemented mak-ing it impossible to attribute the improvement to revenue regulation alone Bond rating changes are generally slow to evolve Numerous other factors are taken into account when assigning an overall credit rating which appear to have outweighed any positive effect of revenue regulation These factors certainly include the recession of the US economy that began in 2007
Customer Classes IncludedWhen determining the target revenue for a utility rev-
enue regulation mechanism regulators must also consider which customer classes to include in the mechanism In some cases industrial customers have objected to a rev-enue regulation mechanism This is due to the wide dif-ference in rates among customers making the design of a revenue regulation mechanism more challenging If regula-tors choose to exclude a class of customers from revenue regulation they must determine the revenue requirement associated with serving only the included customer classes This generally requires a detailed cost of service study to ensure that revenue responsibility is accurately allocated by customer class
Included CostsFinally regulators may wish to exclude specific costs
from the overall revenue requirement if those costs will be tracked through another mechanism like fuel costs in a PCA mechanism energy efficiency program expenditures or smart grid costs for example Separate tracking mecha-nisms can also be used for those costs that are difficult to
Pacific Gas amp Electric All customer classes
Idaho Power Company Residential and small general service
Baltimore Gas amp Electric Residential and small general service
Wisconsin Public Service Corporation All customer classes
National Grid All customer classes
Hawaiian Electric Company All customer classes
Pacific Gas amp Electric
Idaho Power Company
Baltimore Gas amp Electric
Wisconsin Public Service Corporation
National Grid
Hawaiian Electric Company
Table 3
Customer Classes Included in Revenue Regulation Mechanism
Table 4
Costs Excluded From Revenue Regulation Mechanism
project based on historical data or costs over which the util-ity has very little control like fuel costs Although revenue regulation tracks collected revenue mechanisms like Fuel Adjustment Clauses Purchased Power Adjustments and Energy Efficiency Riders can be designed to track actual costs as well as collected revenue
Energy procurement costs
All variable costs
Energy supply costs
Energy costs
Energy supply costs for basic service customers transmission costs the energy efficiency system benefits charge and reconciling charge and costs recovered through the residential assistance adjustment factor
Fuel and purchased power
Decoupling Case Studies Revenue Regulation Implementation in Six States
28
54 We use the RAM term applied in Hawaii here to address any type of attrition or similar mechanism other than a revenue-per-customer framework that changes the allowed revenue between general rate cases
ply costs accounted for in the revenue per customer (RPC) calculation The increased power supply costs to serve that growth will be recovered through the fuel and purchased power tracking mechanism The net effect for the utility will be to recover incremental power supply costs twicemdashonce in the per-customer mechanism and again in the fuel and purchased power mechanism It is essential to make sure that the other adjustment mechanisms do not overlap the cost impacts that are treated in the revenue regulation mechanism One way to do this is to ensure that all power supply costs (investment labor fuel purchased power) are recovered through a single mechanism There are several ways to achieve this
a) A comprehensive power supply recovery mechanism that includes all power supply costs that is separate from the costs treated in the revenue regulation adjustment (eg Puget Sound Energy Washington State)
b) No power supply adjustment whatsoever with all utility costs included in an RPC mechanism (eg National Grid)
c) An annual attrition calculation with all costs reviewed for changes since the last proceeding (eg HECO)
Revenue Adjustment Mechanism in Revenue Regulation
A RAM54 is not necessary to achieve revenue regulation but provides attrition reliefmdashincreasing authorized revenue commensurate with increased costsmdashbetween rate cases Whereas revenue regulation sets a target revenue that the utility will earn regardless of sales levels the RAM adjusts the target revenue between rate cases Regulators may choose to take several different approaches to RAM
bull No RAM Regulators may choose not to implement a RAM leaving the revenue requirement unchanged between rate cases This requires the utility to request a rate case when it requires additional revenue to cover its costs
bull Stairstep Stairstep adjustments provide predetermined increases in target revenue These increases can be determined during a rate case and generally reflect forecasts of cost growth
bull Indexing Indexing ties adjustments to the target revenue to multiple factors like inflation productivity customer growth and changes in capital expenditures
bull RPC The RPC approach is a form of indexing RPC adjusts the total revenue requirement for the
number of customers served Regulators using an RPC mechanism will determine the revenue requirement per customer and the overall revenue requirement will be determined by multiplying the total number of customers by the revenue requirement per customer The amount of revenue required to serve each customer can be determined separately for customer classes and for existing and new customers This way the RPC method accounts for a utilityrsquos growth in fixed costs that is related to growth in the number of customers served RPC is useful where the correlation between cost growth and customer growth is significant It also protects customers from making up the deficit if there is a loss in customer load such as if a large business closes down or relocates
bull Hybrid Hybrid RAMs generally use stairstep increases to account for projected capital costs and indexing to account for OampM expenses
Adjustments from any type of RAM can be implemented automatically or through an attrition proceeding Some stakeholders oppose adjustments to the revenue require-ment outside of a rate case on the basis that this could allow the revenue requirement to increase significantly without examination of the impact on ratepayers or with-out due consideration of other costs and revenues For this reason some regulators choose to cap the total adjustment that can be made to the revenue requirement outside of a rate case
Table 5
Type of Revenue Adjustment Mechanism
Pacific Gas amp Electric
Idaho Power Company
Baltimore Gas amp Electric
Wisconsin Public Service Corporation
National Grid
Hawaiian Electric Company
Hybrid
RPC
RPC
RPC
No RAM potential capital expenditure adjustment
Hybrid
Decoupling Case Studies Revenue Regulation Implementation in Six States
29
55 Because this method results in changes in the price for service that are calculated after that service has been provided it fails the ldquono retroactive ratemakingrdquo statutes that guide most electricity regulators Customers are entitled to know the price of the commodity they are consuming at the time they use it
56 The closest to a current method in use for electric utilities in the BGE system of monthly reconciliation
Table 6
Tracking and Accrual of Difference BetweenActual and Authorized Revenue
Pacific Gas amp Electric
Idaho Power Company
Baltimore Gas amp Electric
Wisconsin Public Service Corporation
National Grid
Hawaiian Electric Company
Track Difference
Monthly
Monthly
Monthly
Yearly
Yearly
Monthly
Accrual Period
Year
Year
Month
Year
Year
Year
Calculation of Actual RevenueRegulators have options when ensuring that actual
revenue equals target revenue under revenue regulation First regulators must decide how to determine ldquoactual revenuerdquo In most cases actual revenue simply equals the amount of revenue a utility collects from its customers The Idaho Public Utilities Commission however has chosen to use weather-normalized revenues as the basis for utility revenues in revenue regulation Although this prevents the utility from recovering revenue lost to it owing to milder than expected weather it further complicates the revenue regulation mechanism and reduces its risk-reduction ben-efits By the same token if weather is severe and increases sales above the revenue requirements weather normaliza-tion would allow the utility to retain some of the revenues
Next regulators must determine whether to implement revenue regulation using a current or accrual method
bull Current Method With the current method of revenue regulation the target revenue for a period say a month is divided by the actual sales in that period to determine the rate per kWh The current method ensures that actual revenue equals target revenue by calculating the rate at the end of the period so that the target revenue can be recovered The current method allows for no lag in revenue recovery One effect of this method is that although customer rates vary total bills are generally more stable For example in a hotter than expected July customers will purchase more kWh but they will be charged a lower rate A milder than average winter would lead to fewer sales but at slightly increased rates This way customers do not experience the same bill variability as they would if rates were set before the sales deviations occurred On the other hand the current method does not provide customers with the ability to plan ahead based on a predictable rate for electricity This method has been used for revenue regulation of natural gas utilities55
bull Accrual Method Under the accrual method rates are set based on an assumed sales level and the differences between actual and target revenue are allowed to accrue over some period Then the total difference between actual and target revenue is reconciled through an adjustment to rates in the subsequent period this is known as the true-up process Presently all revenue regulation mechanisms for electric utilities use the accrual method56
If regulators use the accrual method of revenue
regulation they will next need to determine the period over which the difference between actual and target revenue will be allowed to accrue One year is typical however shorter periods are also used Next the frequency of comparing collected revenue to target revenue should be determined It is possible to do this comparison only once at the end of the accrual period It is common however for comparisons to occur more frequently often monthly When revenues are compared within the accrual period the differences are tracked generally for the purpose of applying interest to the difference that will be deferred until the end of the accrual period
Rate AdjustmentsIn designing a revenue regulation mechanism there are a
number of decision points that regulators need to consider to balance the interests of all the stakeholders One of the decision points revolves around the determination of the mechanism used to adjust rates The issues that regulators need to consider include the following1 Rate Case Requirements One of the often-mentioned
concerns about surcharges especially when they are numerous is how that will impact the frequency of rate cases For regulators and stakeholders rate cases provide
Decoupling Case Studies Revenue Regulation Implementation in Six States
30
the best mechanism to correctly align rates and costs but they are time-consuming and expensive for all parties This is because a rate case presents an opportunity to closely examine all of the utilityrsquos expenses and adjust rates to reflect cost increases and decreases Because under a revenue regulation mechanism the goal is to match revenues received from all customers with revenue requirements a correct determination of revenue requirements is important as is the specification of appropriate cost indices to adjust the revenue requirements As the time between rate cases increases some regulators feel the base rate case data even with adjustments need to be reexamined As a result some regulators have chosen to mandate the frequency of rate cases to address this whereas others have not It may be that in some cases where there are numerous surcharges recovering a multitude of costs there may not be as many costs subject to review in the rate case making it less significant to a regulator than a case in which most costs are being analyzed and recovered in the rate case itself
2 Collection Mechanism Integrally tied to the mechanism for recovering revenues is how the utility will collect or refund the revenues Options that are available include recovery through a rate case or periodic adjustments to rates through a surcharge mechanism As can be seen by the case studies depending on the plan in place some utilities have very discreet requirements dictating the frequency of rate cases with adjustments occurring in those cases or between those cases Other utilities have no requirements upon them with respect to the frequency of rate case filings This will be discussed in more detail below What does emerge from these case studies is that the discreet components or choices in how to execute a revenue regulation plan are carefully interwoven to create a holistic approach Each component works with the other and the value of this case study is in examining the different pathways that can be chosen As discussed previously some of the commissions have authorized revenue regulation to recover the revenue requirements in the last rate case whereas others have authorized adjustments to rates between rate cases this impacts the pathway that the adjustment mechanism takes
3 Timing How often should rates be adjusted to true up to the utilityrsquos revenue requirement States have chosen different options ranging from monthly to annually
4 Allocation of Revenue Regulation Revenue Surpluses or Deficits There are a number of decision points regarding allocation Should the revenue regulation apply to all rate classes or just the smaller customers whose usage per customer and load variations are not as dramatic as those of larger-use customer classes Should there be a different allocation to each rate class or should the allocation of costs among the classes be the same Different mechanisms accomplish different goals Some states have allocated revenue regulation revenues based on the revenues lost by customer class as a result of energy efficiency This can sometimes be a political decision to mitigate opposition to energy efficiency programs by large customers Other states recognize that the system savings resulting from energy efficiency benefit all customers so that all customers should pay equally
5 Carrying Charges Depending on the timing issue discussed previously regulators may want to consider carrying charges on any adjustments This should be symmetrical in its application however so that it applies to surcharges and refunds Consideration should be given for the basis of the carrying charge rate whether weighted average cost of capital rate of return a risk-free rate or some other mechanism should be adopted
6 Rate Caps In order to mitigate potential rate impacts a regulator may want to consider a cap on how much rates can go up when the revenue regulation adjustment is made This might be more critical if the regulator is aware of other potential rate increases that will impact customersrsquo bills If a cap is used the case in which the utilityrsquos adjustment would exceed the cap must be considered Some regulators have opted to allow the utility to carry over the excess unrecovered amount for a period of years whereas others do not This allows the utility to recover those revenues in a subsequent year when perhaps the adjustment is less As a practical matter however adjustments of greater than three percent are less common as shall be discussed later
7 Impact on At-Risk Consumers Low-income and consumer advocates have expressed concern about revenue regulation as a vehicle for annual rate increases without the scrutiny of a general rate case creating rate increases for the low-use customers doing the most to constrain usage and help achieve targeted energy savings One proposal to address this has been to impose any resulting surcharges only to above-average usage
Decoupling Case Studies Revenue Regulation Implementation in Six States
31
57 Cavanagh and Howat (2012 May 2) Finding common ground between consumer and environmental advocates Electricity Policy
58 The most common criticism of future test years is that utilities forecast costs under an assumption that all authorized personnel positions will be filled while in retrospect any large organization has some level of vacancy in its employee count A historic test year captures this effect fully
customers and any resulting credits only to below-average usage57
Rate Case RequirementRequirements as to the frequency of rate cases can be
tied to the recovery mechanism or to the entire regulatory framework for implementing revenue regulation In the cases studied two of the utilities require periodic rate cases PGampE every three years and WPS every year Two others National Grid and HECO require annual mini rate cases explained later in which adjustments are made and two others IPC and BGE have no requirements for scheduled rate cases Nevertheless if the concern is to ensure that the utilityrsquos revenue recovery meets its revenue requirements some kind of periodic rate case to examine costs is appropriate Having periodic rate cases can provide a measure of assurance to consumer advocates that the level at which the revenues and hence the rates are set is correct One of the criticisms of revenue regulation is in fact the lack of rate cases to produce a proper level of confidence in the allowed amounts Multiple surcharges are usually additive to existing rates therefore not permitting an opportunity to reduce the base rate for reductions in cost Moreover the infrequency in cases impedes the examination of rate allocations as would occur through a cost of service study
This is a particular issue where utilities are augmenting power supply with purchased power from independent power producers which is the most common method for acquiring wind and solar production today The increased cost for purchased power may flow through a fuel and purchased power adjustment mechanism while the (depreciating) investment in conventional power plants remains static in base rates
Both PGampE and WPS use a future test year that allows the utility to project revenue requirements during the time period that the rates are to be in effect The benefit to this is that it can help identify and account for projected changes in costs over the timeframe between rate cases However given that these costs are utility projections most consumer advocates have less confidence in these numbers than they would using actual numbers from a historical or only hybrid test year58 When trying to garner support for revenue regulation from more skeptical stakeholders using a future test year may not be helpful Furthermore in the case of WPS that has annual rate cases using a future test year becomes less justifiable as revenues are recalculated annually anyway
The absence of a rate case requirement can also cause consternation among detractors of revenue regulation because of the belief that the utility will be guaranteed its revenue requirements for as long as it is satisfied with that level irrespective of how well it manages However this is no different from the status quo in traditional regulation in most places The incentive to manage well is always there with or without revenue regulation as it translates into more profit for the utility
In the cases of HECO and National Grid the mini rate cases serve two purposes In the one instance it serves as a means to reconcile revenue recovery with revenue requirements and in the second instance it provides an opportunity to adjust rates in accordance with changes in costs Specifically for National Grid the revenue requirement is adjusted to reflect capital expenditures For HECO revenues are adjusted to reflect changes in the cost of service In the two examples here revenue regulation is wrapped in with other adjustments as part of a mini adjustment Given the structure for determining revenue requirements which accounts for changes in costs including revenue regulation within the mini rate cases is a workable option
These examples highlight how rate cases can be used to adjust revenue requirements either in a more controlled regulatory environment with frequent rate cases or left to the utilityrsquos discretion to decide when to adjust costs A set schedule of periodic rate cases such as that used by PGampE may strike an appropriate balance for reviewing revenue requirements however with the modification of a partial historical partial forecasted test year Frequent rate cases can depending on the resources of the regulator and stakeholders be too costly and time-intensive When there are too many rate cases stakeholders and regulators may not be able to dedicate the level of resources needed for any one proceeding and may be spread too thin Regular known rate cases at reasonable intervals may strike the best balance of adequate review and adjustment of revenue requirements
Decoupling Case Studies Revenue Regulation Implementation in Six States
32
Collection Mechanism and TimingThe collection mechanism for the differential between
actual and authorized revenue requirements varies by util-ity as well Both PGampE and WPS do not have adjustment clauses or surcharges but instead have structured their revenue regulation plans to recover their costs in a rate case with rates adjusted annually Although PGampE has rate cases every three years the utility files its preliminary forecast every September 1 for the following year including adjust-ments for revenue regulation and other costs This practice promotes transparency keeping all stakeholders aware of the current situation of the utility IPC BGE National Grid and HECO use surcharges on customer bills to collect or credit the difference between actual revenues collected and the revenue requirement Although the other three (IPC National Grid and HECO) calculate the rate adjustment annually only BGE does a more contemporaneous adjust-ment of one month Certainly where there are no regularly scheduled rate cases using an adjustment mechanism becomes more critical PGampE has created a tracking mecha-nism known as a balancing account that allows the utility to track the surpluses and deficits to help ensure accuracy at year end when rates are actually adjusted The creation of such monthly balancing accounts will make it easier at the end of the year to track what happened each month and then determine the adjustment for that year It provides a more detailed trail for review and analysis by stakeholders and regulators However other mechanisms that just look at total revenues as compared to revenue requirements at the end of the year can work as well
Table 7
Rate Case Requirements
Table 8
Rate Adjustments
Table 9
Allocation of Surplus or Deficit
Pacific Gas amp Electric
Idaho Power Company
Baltimore Gas amp Electric
Wisconsin Public Service Corporation
National Grid
Hawaiian Electric Company
Pacific Gas amp Electric
Idaho Power Company
Baltimore Gas amp Electric
Wisconsin Public Service Corporation
National Grid
Hawaiian Electric Company
Pacific Gas amp Electric
Idaho Power Company
Baltimore Gas amp Electric
Wisconsin Public Service Corporation
National Grid
Hawaiian Electric Company
Every three years annual ldquoattritionrdquo adjustments in between
No requirement
No requirement
Annual rate case
Annual capital expenditure adjustment case
Abbreviated annual rate case
Base rates adjusted annually
Annual adjustment through surcharge
Monthly adjustment through surcharge
Annual adjustment through rate case
Annual adjustment
Annual adjustment
Allocated to all customers according to business unit (eg electric distribution electric generation)
Included in the annual adjustment mechanism for each customer class
Separate for each customer class
Allocated to all customers except certain tariffs (see above)
Separate for each customer class
Separate for residential and commercialindustrial
Allocation of Revenue Regulation Revenue Surpluses or Deficits
The allocation of revenue regulation revenue surpluses or deficits should be symmetrical so that overpayments are credited to customers just as underpayments are paid by those same customers The six utilities studied fol-low that formula The application of revenue regulation however varies from utility to utility BGE and IPC ap-ply revenue regulation to the residential and commercial classes thereby excluding industrial customers In contrast however PGampE WPS National Grid and HECO allocate revenue regulation adjustments to all customer classes In terms of how the costs are allocated IPC BGE WPS National Grid and HECO allocate costs differently among the customer classes PGampE however allocates costs uni-formly among the customers Because PGampE has separated its business units it also separately calculates and allocates
Decoupling Case Studies Revenue Regulation Implementation in Six States
33
Table 10
Carrying Charges
Table 11
Cap on Rate Adjustment
Pacific Gas amp Electric
Idaho Power Company
Baltimore Gas amp Electric
Wisconsin Public Service Corporation
National Grid
Hawaiian Electric CompanyPacific Gas amp Electric
Idaho Power Company
Baltimore Gas amp Electric
Wisconsin Public Service Corporation
National Grid
Hawaiian Electric Company
None
Yes
None
Yes at the short-term debt rate
Yes at the customer deposit rate
Yes at the customer deposit rateNo
3 rate cap excess carried over to next period
10 rate cap excess carried over to next period
Cap of $14 million per year
$170 million in CapEx
No
revenue regulation surpluses and deficits among its electric distribution gas distribution and electric generation busi-nesses This illustrates that there are several ways to address revenues from revenue regulation depending on the policy outcomes that are desired
Carrying ChargesCarrying charges applied to uncollected or surplus rev-
enues can be used to account for the time value of money and the lost opportunity or value to having those revenues in hand PGampE and BGE do not accrue carrying charges On the other hand IPC WPS National Grid and HECO do For BGE given that the revenue regulation revenues are reconciled and recovered monthly it would make little sense to include a carrying cost Where carrying costs have been used they have included in the cases of these utili-ties the short-term debt rate or the customer deposit rate which for one utility is six percent and probably close to the short-term debt rate Thus the carrying charge rates are appropriately at the lower end of the spectrum reflecting their short-term nature In the application of the carrying charge symmetry should be preserved by applying it to both deficits and surpluses Application of carrying charges given the short period that costs are carried (one year) is somewhat discretionary Although it does more accurately account for costs it does add a modest level of complica-tion in tracking costs
Rate Caps and CollarsOne of the ways to protect customers in the event of sig-
nificant adjustments is to impose a rate cap (or collar) that limits the amount of a rate increase (and decrease) Some customers are sensitive to changes in foundational costs like utility bills and if costs are going to rise they benefit from a pattern of steady modest increases rather than a large step increase Any structural increases in rates attributable
to reductions in sales or increases in costs recognized by the revenue regulation plan would be eventually included in rates under any system A cap reflects a controlled way to manage customer expectations and customer impacts Structural changes can only be managed for a while until a complete rate case is needed to reset all assumptions
Typically when a rate cap is imposed if the formulaic increase exceeds the cap or collar the utility will be able to carry over any uncollected revenues until the next rate adjustment Two of the utilities studied PGampE and HECO do not have rate caps On the other hand the other four utilities do include rate caps in varying amounts National Grid has a one-percent revenue cap whereas IPC and BGE have a one-percent and a ten-percent rate cap respectively WPS unlike the others has a cap tied to the dollar amount of $14 million as opposed to a percentage Consistent with the goals of revenue regulation all of the utilities studied have a carryover provision that is important for reducing the risk that the utility will not recover its revenue require-ments
Note that National Grid differs from BGE and HECO in that its cap is on revenues whereas the other two utilities cap rates and rate impacts A revenue cap is more focused on ensuring minimal change to the revenue requirements authorized by the commission National Grid as discussed previously allows for mini rate cases to adjust the rev-enue requirements Having the one-percent cap limits the amount of increase that can occur through that process requiring revenue changes that are greater to occur in a full rate case However note also that some of the adjustments allowed in the mini rate case have their own separate cap The IPC rate cap is in line with what many other utilities with caps have in place which generally range from one to three percent The ten-percent rate cap in the BGE plan is
Decoupling Case Studies Revenue Regulation Implementation in Six States
34
59 Morgan P (2012 December) Graceful Systems LLC A decade of decoupling for US energy utilities rate impacts designs and observa-tions p5
reflective of its monthly adjustment pattern An annual ad-justment allows more time to smooth out peaks and valleys in revenues whereas a monthly adjustment will be influ-enced by more of the spikes (particularly weather-driven variation) thus the need for a larger bandwidth for the car-ryover Like a variable energy rate or fuel adjustment clause that fluctuates monthly the monthly adjustment introduces more volatility into the rates
Actual Historical AdjustmentsFor many ratepayer advocates there is a concern that
some of the utility management risk will be transferred to customers as a consequence of a policy that seeks to ensure that the utility will be made whole However the utility re-tains management risk and the requirement to demonstrate that it has acted prudently Thus the utility still has just as much of an incentive to operate efficiently as it did without revenue regulation If the utility can lower its costs it can still increase its profits Second by designing rates symmet-rically such that under- and over-recoveries are reconciled it provides customers with an opportunity to obtain credits that under traditional regulation would be retained by the utility It has often been opined that when there are large
gaps in time between utility rate cases it is because the utility is over-earning and exceeding its revenue require-ments In those instances customers never get to examine what the utility is collecting much less receive a refund Under revenue regulation with its periodic adjustments and scheduled general rate cases the revenue requirements are examined and refunds or credits allocated such that customers have a better knowledge base for understanding the utilityrsquos earnings And annual reconciliation of the util-ityrsquos actual revenues versus authorized revenues provides consumers with a tool to reign in excess revenue recovery beyond authorized amounts Third the adjustments that do occur under revenue regulation are manageable and frequently less than the adjustments customers are used to seeing on their bills for fuel or variable generation rates or for the myriad of other surcharges that can be tacked on to a customerrsquos bill such as an infrastructure (smart grid) sur-charge maintenance upgrade fee regulatory asset charge or system benefit charge
As seen in Figure 1 the range of rate impacts cluster around plus or minus two percent but can at times exceed plus or minus five percent The total of surcharges has somewhat exceeded the total of credits
Figure 1
Total Utility Decoupling Adjustment Rate Impacts59
300
250
200
150
100
50
0
Nu
mber
of
Dec
oup
lin
g A
dju
stm
ents
Over -5 -4 to -5 -3 to -4 -2 to -3 -1 to -2 0 to -1 0 to 1 1 to 2 2 to 3 3 to 4 4 to 5 Over 5
Percentage Rate Impacts
SurchargesRefunds
ResidentialAll
Other
Commercial
Total
Decoupling Case Studies Revenue Regulation Implementation in Six States
35
60 Id p 3
61 Schultz T Energy Efficiency at Idaho Power Available at httpwwwenergyidahogovenergyalliancedida_powerpdf
As can be seen with the utilities studied above the larger fluctuations are attributable to adjustment mechanisms that are reconciled more frequently such as monthly as those are less able to smooth out anomalies as an annual adjust-ment would do From a dollar perspective for the roughly 64 percent of adjustments that fall within the plus or minus two-percent range the monthly bill impact is approxi-mately $230 for average electric customers and $140 for average gas customers60
Of the six utilities studied the fluctuations in adjustment have for the most part stayed within the one- to three-per-cent range as shown below
bull PGampE from 2005 to 2012 has had annual revenue regulation adjustments ranging from minus143 percent to 415 percent with an average adjustment of 197 percent
bull For IPC the adjustments are separated between residential and commercial customers For residential customers the annual adjustments from 2007 through 2011 ranged from 077 percent to 258 percent for an average of 162 percent As for the commercial customers the annual adjustments for that same period were higher ranging from 104 percent to 424 percent with an average adjustment of 252 percent
bull BGE has monthly adjustments that ranged from minus1853 percent to 3013 percent with an average of 057 percent for residential customers from March 2008 through August 2012 For General Service Customers the monthly adjustment ranged from minus2264 percent to 2462 percent The average adjustment was 1308 percent
bull For WPS the annual adjustments from 2009 through 2011 ranged from minus145 percent to 378 percent for residential and small commercial and from minus314 percent to 899 percent for commercial Note that because of a $14 million per year cap some of these percentages were carried over The average annual adjustment for residential and small commercial and for commercial was 163 percent and 215 percent respectively with carry-overs to subsequent years
bull For Massachusetts Electric and Nantucket Electric both of which operate under National Grid the annual revenue regulation adjustment for all for 2011 and 2012 was minus0105 percent and 0315 percent for an average revenue regulation adjustment over the two years of 0105 percent
bull HECO like National Grid has one annual revenue
regulation mechanism for its customers which resulted in adjustments in 2011 and 2012 of 063 percent and 107 percent respectively for an average adjustment of 085 percent
As can be gleaned from the above information the range of average adjustments for small use customers was a low of 0105 percent for National Grid to a high of 197 percent for PGampE For larger use customers the range was a low of 0105 percent for National Grid to a high of 252 percent for IPC This demonstrates that on average for these utilities with well-developed and diversely designed revenue regula-tion proposals their adjustments on average stayed at or below approximately 25 percent
One of the metrics for determining if a revenue regula-tion program is working successfully that was discussed above was the impact on rates of a revenue regulation mechanism As can be seen by the analysis of the adjust-ment levels for each of the utilities they are within a rea-sonable range
Complementary Policies Although a revenue regulation mechanism does not need
to be accompanied by other policies energy efficiency is frequently at the root of the reason revenue regulation was proposed in the first place The states examined in this pa-per have various obligations for energy efficiency achieve-ment placed upon their utilities Only Idaho does not have an Energy Efficiency Resource Standard but energy efficiency objectives are developed through an integrated resource plan process Energy efficiency spending at IPC has increased dramatically in recent years61
In recognition of the fact that revenue regulation only removes the disincentive to pursue energy efficiency several states have instituted some form of incentives to reward the desired outcome This mechanism can not only incentivize management to aggressively pursue energy efficiency but also make shareholders supportive in the face of lost invest-ment opportunity
Rate design can also play an important part in assist-ing the utility in achieving favorable energy efficiency outcomes Inclining block rates penalize inefficient use of electricity and shorten payback times from the customer perspective Because efficiency reduces consumption at
Decoupling Case Studies Revenue Regulation Implementation in Six States
36
62 Optional rate designs for PGampE include TOU and Peak Time Pricing
63 IPC also has an optional TOU rate design
64 Optional rate designs for this utility include TOU Critical Peak Pricing and Contract
65 National Grid also offers optional TOU and flat rate designs
66 HECO also offers optional TOU and flat rate designs
67 See eg Alexander B (1996 April) How to construct a service quality index in performance-based ratemaking Electricity Policy
the tail block rate the value of kWh savings is greater than with flat rates On the other side of the spectrum declining block rates which have a reduced rate in the tail block do little to encourage conservation In fact they operate more like a discounted bulk rate by reducing the average cost of a kWh in a customerrsquos bill for the more kWh used
Performance incentives or other ways to avoid destruc-tive cost-cutting in the name of creating margins that reduce service or reliability or lessen customer value have been implemented only in Massachusetts of the six utilities illustrated here Several other states have implemented vari-ous schemes in reaction to perceived deficiencies in utility service67 Performance incentives are not unique to rev-enue regulation Commissions wishing to implement such a scheme can find many models of incentive reward and penalty mechanisms developed for other purposes
Taken together a suite of policy and program features can create an atmosphere that is conducive to achievement of energy efficiency goals within the utility and for the customers By appropriate application of these techniques regulators working with utilities and stakeholders can remove barriers and create an opportunity for energy ef-ficiency to be fully integrated into the utility supply option portfolio
Energy Efficiency OutcomesAlthough revenue regulation itself does not create an
incentive for a utility to implement energy efficiency it does address the issue of lost revenues associated with energy
Table 12
Complementary Policies for Energy Efficiency
Pacific Gas amp Electric62
Idaho Power Company63
Baltimore Gas amp Electric
Wisconsin Public Service Corporation64
National Grid65
Hawaiian Electric Company66
Energy Efficiency Requirement
1 annually
IRP
10 by 2015
075 annually
24 annually
Energy efficiency can satisfy portion of RPS
Default Residential Rate Design
Inclining block
Inclining block
TOU seasonal
Flat
Inclining block
Inclining block
Incentive Structure
Risk reward incentive mechanism
No
No
No
5 of program costs
Third-party administrator paid for contract performance
Performance Incentives
Reliability reporting only
None
Under consideration
Reliability reporting only
Service quality reward and penalty
Under consideration
efficiency and DG programs Revenue regulation should be combined with other mechanisms that require or incentiv-ize the implementation of energy efficiency by the utility or a third party The level of energy efficiency achieved can be one measure of the success of a revenue regulation mechanism as implemented in a larger program designed to achieve energy efficiency Table 13 shows the incremental annual energy efficiency savings reported by each utility with the shaded box indicating the year that the utilityrsquos revenue regulation mechanism was implemented National Grid had achieved a high level of energy efficiency savings in the years before it implemented revenue regulation
This paper has not evaluated DG outcomes to correlate with revenue regulation as it is not perceived that states and utilities have made that connection expressly in histori-cal mechanisms However it is expected that this connec-
Decoupling Case Studies Revenue Regulation Implementation in Six States
37
68 EIA Form EIA-861 data files Available at httpwwweiagovelectricitydataeia861
69 PGampE began revenue regulation in 1974 and it was later suspended and recommenced in 2001
70 WPS savings are represented by the statewide program savings from the Focus on Energy program WPS provided additional funds to Focus on Energy starting in CY10 through their territory-wide program activities
71 In 2009 Hawaii Energy a ratepayer-funded statewide energy efficiency provider began delivering services Savings reported after 2009 represent savings achieved through the programs of Hawaii Energy
Table 13
Annual Incremental Energy Efficiency Savings as Percentage of Retail Sales68
Highlighted cells are the year that utility started decoupling
Pacific Gas amp Electric69
Idaho Power Company
Baltimore Gas amp Electric
Wisconsin Public Service Corporation70
National Grid
Hawaiian Electric Company71
2004
11
01
00
03
11
00
2005
16
03
00
03
09
05
2006
10
05
00
03
12
05
2010
19
13
17
09
136
12
tion will be made in future mechanisms and furthermore it is anticipated that follow on work to this paper will want to study that connection between revenue regulation and DG performance
Conclusions
An increasing number of states are looking to increase the rate of energy efficiency investments for their long-run cost and risk advantages The benefits of energy efficiency include not only its ability to reduce system costs across the distribution transmission and generation functions but also the opportunity for customers to reduce their individ-ual energy costs for their own electric bills Nevertheless it is counterintuitive to encourage or order a utility to sell less of its product In order to encourage the proliferation of en-ergy efficiency programs as a solution that can contribute to this nationrsquos energy needs this tension between the goals of society versus the goals of the utility needs to be addressed Revenue regulation can be such a solution by removing the link between sales and revenues
There are many ways to implement revenue regulation and multiple decision points that regulators must consider in designing a revenue regulation mechanism This paper focused on six utilities each of which implemented revenue regulation in different ways in accordance with the objectives of that state Different decision points discussed include
bull Should revenue regulation apply to all functions (generation transmission and distribution) which sometimes depends on if the utility is regulated or restructured
bull Should revenue regulation apply to all customer classes
bull Should there be symmetry such that a reconciliation adjustment occurs for both over- and under-recoveries of the revenue requirements
bull Should recovery of indicated surcharges be conditioned on acceptable performance on customer service quality or energy efficiency goals
bull Should there be an attrition adjustment to account for other expenses or should the revenue regulation adjustment be limited to reconciling existing revenue requirements
bull Should there be an inflation adjustmentbull To calculate the revenue requirements should the
current or accrual method be usedbull Should the adjustments be made in rate cases or
through a riderbull How frequently should adjustments be made
monthly annually or some other time periodbull Depending on the period of time between true up and
recovery should there be carrying charges and if so how should they be calculated
2007
21
06
00
03
09
04
2008
35
10
05
09
05
05
2009
20
11
06
10
11
11
Decoupling Case Studies Revenue Regulation Implementation in Six States
38
72 Avista Utilities (2009) Washington Utilities and Transportation Commission Docket UE-090134
bull Should there be a requirement authorizing the frequency of rate case
bull Should there be an annual cap on the amount of the adjustment and if so should there be an opportunity to carry over any additional amounts and for how many years
bull Should there be an adjustment to the cost of capital to reflect the reduced risk
Other considerations for regulators whether or not they implement revenue regulation but certainly as part of a comprehensive package are other measures that can be put in place to encourage consumers and utilities alike to actively participate in energy efficiency For example an inclining block rate structure by virtue of its incentive to consume less pairs well with an energy efficiency program helps drive consumers to participate in efficiency programs and accelerates the payback of an energy efficiency investment By the same token an incentive payment to the utility helps provide its management with a good reason to excel and exceed targets for energy efficiency programs
A key point illustrated by the list of considerations above is that there is not just one static way to design and implement revenue regulation but rather there are a variety of options for doing so In this study a diverse group of utilities were reviewed The differences among the utilities included geographic diversity vertically integrated and restructured utilities different levels of energy efficiency in place and certainly differences in how the revenue regulation mechanisms were implemented No two utilities were alike and no two utilities had the same revenue regulation mechanism The key is that revenue regulation should eliminate the throughput incentive but the means for accomplishing this goal can vary and be tailored to each jurisdiction and each utility and still be successful
There are several considerations in the design of a revenue regulation mechanism that can help ensure its successful adoption To begin revenue regulation should be granted to utilities only as a precondition to implementing comprehensive energy efficiency andor DG policies Unless accompanied by a commitment to engage in providing least-cost resource options that could impact sales there is not really any good policy reason for its adoption All of the utilities studied are actively engaging in energy efficiency Furthermore as a matter of fairness the revenue regulation mechanism should be symmetrical so that any revenues above those authorized are refunded back to consumers As Figure 1 demonstrates although there are more surcharges to customers there is nevertheless a healthy amount of
credits back to consumers This is the bargain Barring imprudence or other unforeseen circumstances the utility receives its authorized revenue requirements and nothing more or less under a simple revenue regulation mechanism
Rate design plays an important role in the effectiveness of energy efficiency in concert with revenue regulation A low customer charge is preferable so that the customer can benefit from real bill reductions tied to reduced volumetric consumption Reductions in consumption not only reduce bills but also positively impact the payback period for investments in energy efficient appliances Declining block rates in which the tail block rate is lower than the first tier also do not encourage conservation Inclining block rates that reward low usage in the first block with a lower rate send the better price signals None of the six utilities studied had declining block residential rates They were inclining flat and time-varying
The revenue adjustment mechanism is also a critical decision point in terms of whether a revenue per customer mechanism is adopted that accounts for only the current revenue requirements or whether latitude is given to include an inflation adjustment or other cost increases in the revenue adjustment mechanism Three of the utilities studied adopted this approach whereas another two used a hybrid approach Finally to reduce volatility five of the six utilities opted for annual rather than monthly adjustments thereby creating a level of rate stability that customers in general prefer
Once the goals for revenue regulation are set by the regulators the next step is to design programs that will implement that goal For energy efficiency to be as successful as possible regulators may want to adopt a complement of other policies to accompany revenue regulation These can include rate designs that reward reduced use and conservation as well as incentive payments to utilities that reward them for meeting or exceeding targets Of the six utilities studied three have adopted some form of incentive One simple approach that was used in Washington was to link recovery of any surcharges under the revenue regulation mechanism to achievement of energy efficiency targets72
For the utilities examined above that have implemented revenue regulation the evidence demonstrates that revenue regulation as a strategy and a mechanism to enable
Decoupling Case Studies Revenue Regulation Implementation in Six States
39
energy efficiency has been working well The fact that each revenue regulation mechanism varies from the next demonstrates that there are many different paths that can be followed in implementing revenue regulation based on the needs of the utility and its stakeholders in a particular
region This study demonstrates that revenue regulation does work and provides examples of how it can be implemented each one different and unique because of the number of decision points to be considered in designing a revenue regulation mechanism
Decoupling Case Studies Revenue Regulation Implementation in Six States
40
Appendix
Historic Rate Adjustments
Table 14
PGampE Revenue Regulation Rate Adjustments 1983 to 199373
Table 15
PGampE Revenue Regulation Adjustments 2005 to 201274
Table 16
IPC Revenue Regulation Adjustments76
Idaho Power Company
1983 23
1984 (34)
1985 (48)
1986 19
1987 21
1988 50
1989 (43)
1990 (54)
1991 39
1992 34
1993 00
2005 8925 minus12773 minus143
2006 9933 2246 226
2007 10409 21727 209
2008 10261 4032 039
2009 11169 10355 093
2010 11224 46556 415
2011 10306 38390 373
2012 11032 40304 365
2007 Residential minus00457 590 minus077
Commercial minus00457 428 minus107
2008 Residential 00529 670 090
Commercial 00529 510 104
2009 Residential 01220 770 158
Commercial 01535 603 255
2010 Residential 01800 785 229
Commercial 02273 613 371
2011 Residential 02028 785 258
Commercial 02597 613 424
Revenue Regulation Adjustment as of
Total Rates
Delivery Revenue
Requirement ($ millions)
Adjustment Rate
Revenue Regulation Adjustment($ millions)
Retail Rate
of Delivery Revenue
Revenue Regulation Adjustment
Year
Year
73 Lesh P (2009 June 30) Rate impacts and key design elements of gas and electric utility decoupling
74 Morgan P (2012 November) A decade of decoupling for US energy utilities rate impacts designs and observations
75 Morgan P (2012 November) A decade of decoupling for US energy utilities rate impacts designs and observations
76 All numbers provided by the utility
Decoupling Case Studies Revenue Regulation Implementation in Six States
41
77 Idaho Power Company Case No IPC-E-11-19- fixed cost adjustment permanent mechanism Available at httpwwwpucidahogovinternetcaseselecIPCIPCE1119company20120928COMPLIANCE20FILINGPDF
Figure 2
IPC Revenue Regulation Adjustments77
Residential FCA Balance and Use per Customer
$10000000
$8000000
$6000000
$4000000
$2000000
$0
-$2000000
-$4000000
-$6000000
1080
1070
1060
1050
1040
1030
1020
1010
1000Res
idu
al A
uth
oriz
ed F
CA
Am
oun
t
Residual Authorized FCA Amount ($)
Monthly Use Per Customer (kWh)
kW
h U
sed
2006 2007 2008 2009 2010 2011
78 Morgan P (2012 November) A decade of decoupling for US energy utilities rate impacts designs and observations
Decoupling Case Studies Revenue Regulation Implementation in Six States
42
Table 17a
Baltimore Gas and ElectricBGE Monthly Revenue Regulation Adjustments 2008 to 201278
Table 17b
Baltimore Gas and ElectricBGE Monthly Revenue Regulation Adjustments 2008 to 201278
March Residential 000172 01477 1165General Service 000230 01526 1507
April Residential 000016 01477 0108General Service 000146 01526 0957
May Residential 000066 01477 0447General Service 000230 01526 1507
June Residential minus000066 01477 minus0447General Service 000230 01526 1507
July Residential 000158 01477 1070General Service 000230 01526 1507
August Residential minus000040 01477 minus0271General Service 000214 01526 1402
September Residential 000237 01477 1605General Service 000230 01526 1507
October Residential 000237 01477 1605General Service 000143 01526 0937
November Residential 000237 01477 1605General Service 000140 01526 0917
December Residential 000445 01477 3013General Service 000230 01526 1507
January Residential 000035 01579 0222General Service minus000073 01346 minus0542
February Residential 000025 01579 0158General Service 000230 01346 1709
March Residential minus000237 01579 minus1501General Service 000230 01346 1709
April Residential minus000237 01579 minus1501General Service 000230 01346 1709
May Residential 000234 01579 1482General Service 000132 01346 0981
June Residential 000237 01579 1501General Service 000230 01346 1709
July Residential 000237 01579 1501General Service 000230 01346 1709
August Residential 000237 01579 1501General Service 000190 01346 1412
September Residential 000237 01579 1501General Service 000230 01346 1709
October Residential 000237 01579 1501General Service 000124 01346 0921
November Residential 000237 01579 1501General Service 000230 01346 1709
December Residential 000156 01579 0988General Service 000204 01346 1516
Adjustment $kWh
Adjustment $kWh2008 2009
Retail Rate
$kWh
Retail Rate
$kWhAdjustment
Adjustment
Decoupling Case Studies Revenue Regulation Implementation in Six States
43
Table 17c
Baltimore Gas and ElectricBGE Monthly Revenue Regulation Adjustments 2008 to 201278
Table 17d
Baltimore Gas and ElectricBGE Monthly Revenue Regulation Adjustments 2008 to 201278
January Residential 000203 01465 1386General Service 000230 01261 1824
February Residential minus000142 01465 minus0969General Service 000230 01261 1824
March Residential minus000237 01465 minus1618General Service 000230 01261 1824
April Residential minus000237 01465 minus1618General Service 000230 01261 1824
May Residential 000192 01465 1311General Service 000230 01261 1824
June Residential 000191 01465 1304General Service 000230 01261 1824
July Residential 000095 01465 0648General Service 000230 01261 1824
August Residential minus000176 01465 minus1201General Service 000224 01261 1776
September Residential minus000237 01465 minus1618General Service 000116 01261 0920
October Residential minus000237 01465 minus1618General Service 000081 01261 0642
November Residential minus000237 01465 minus1618General Service 000098 01261 0777
December Residential minus000079 01465 minus0539General Service 000229 01261 1816
January Residential minus000130 01365 minus0952General Service 000230 01156 1990
February Residential minus000253 01365 minus1853General Service minus000020 01156 minus0173
March Residential minus000018 01365 minus0132General Service minus000063 01156 minus0545
April Residential 000110 01365 0806General Service minus000262 01156 minus2266
May Residential 000010 01365 0073General Service minus000160 01156 minus1384
June Residential 000226 01365 1656General Service 000042 01156 0363
July Residential 000253 01365 1853General Service 000209 01156 1808
August Residential minus000007 01365 minus0051General Service minus000157 01156 minus1358
September Residential minus000253 01365 minus1853General Service minus000177 01156 minus1531
October Residential 000228 01365 1670General Service 000262 01156 2266
November Residential minus000059 01365 minus0432General Service 000262 01156 2266
December Residential 000071 01365 0520General Service 000262 01156 2266
Adjustment $kWh
Adjustment $kWh2010 2011
Retail Rate
$kWh
Retail Rate
$kWhAdjustment
Adjustment
Decoupling Case Studies Revenue Regulation Implementation in Six States
44
Table 17e
Baltimore Gas and ElectricBGE Monthly Revenue Regulation Adjustments 2008 to 201278
January Residential 000253 01291 1960General Service 000262 01064 2462
February Residential 000253 01291 1960General Service 000262 01064 2462
March Residential 000253 01291 1960General Service 000262 01064 2462
April Residential 000253 01291 1960General Service 000262 01064 2462
May Residential 000253 01291 1960General Service 000262 01064 2462
June Residential 000253 01291 1960General Service 000262 01064 2462
July Residential 000253 01291 1960General Service 000262 01064 2462
August Residential 000253 01291 1960General Service 000160 01064 1504
Adjustment $kWh2012
Retail Rate
$kWhAdjustment
Decoupling Case Studies Revenue Regulation Implementation in Six States
45
79 Morgan P (2012 November) A decade of decoupling for US energy utilities rate impacts designs and observations
80 Morgan P (2012 November) A decade of decoupling for US energy utilities rate impacts designs and observations
Table 18
Wisconsin Public Service Corporation Revenue Regulation Adjustments 2009 to 201179
2009 ResidentialSmall Commercial 00048705 000168154 01290 378 130Commercial 00084951 000293293 00945 899 310
2010 ResidentialSmall Commercial 00033043 000166936 01291 256 129Commercial 00056630 000286103 09460 060 030
2011 ResidentialSmall Commercial (00018666) $ (000163719) 01288 minus145 minus127Commercial (00032565) $ (000285629) 01037 minus314 minus275
Derived Adjustment
$kWh
Derived Adjustment Capped $
kWh
Retail Rate
$kWh
Revenue Regulation Actual
Revenue Regulation Capped
Table 19
National Grid Revenue Regulation Adjustments 2011-201276
Massachusetts Electric and Nantucket Electric
Table 20
Hawaiian Electric Company
2011 All minus0015 1429 minus0105
2012 All 0044 1396 0315
2011 01995 3149 063
2012 03894 3641 107
Revenue Regulation Adjustment
centkWh
Revenue Regulation Adjustment
centkWhRetail Rate
centkWh
Retail Rate
Revenue Regulation Adjustment
Revenue Regulation
ldquoThe 2011 adjustment took effect June 1 but was reduced to $0 on July 26 2011 when the Commission granted HECO an interim rate increase of $532 million in a 2011 test year general rate case The 2012 Adjustment runs from June 1 2012 through May 31 2013 About 25 of the total relates to the portion of the decoupling mechanism that updates OampM and rate baserdquo (Morgan 2013)
Decoupling Case Studies Revenue Regulation Implementation in Six States
46
Revenue Regulation and Decoupling A Guide to Theory and Applicationhttpwwwraponlineorgdocumentdownloadid902
This guide was prepared to assist anyone who needs to understand both the mechanics of a regulatory tool known as decoupling and the policy issues associated with its use This would include public utility commissioners and staff utility management advocates and others with a stake in the regulated energy system While this guide is somewhat technical at points we have tried to make it accessible to a broad audience to make comprehensible the underlying concepts and the implications of different design choices This guide includes a detailed case study that demonstrates the impacts of decoupling using different pricing structures (rate designs) and usage patterns
Pricing Dorsquos and Donrsquots Designing Retail Rates as if Efficiency Countshttpwwwraponlineorgdocumentdownloadid939
Rate design is a crucial element of an overall regulatory strategy that fosters energy efficiency and sends appropriate signals about efficient system investment and operations Rate design is also fully under the control of state regulators Progressive rate design elements can guide consumers to participate in energy efficiency programs and reduce peak demand yet relatively few utilities and commissions have implemented many of these elements This RAP paper identifies some best practices Because pricing issues tie closely to utility growth incentives we also address revenue decoupling
A Decade of Decoupling for US Energy Utilities Rate Impacts Designs and Observationshttpwwwraponlineorgdocumentdownloadid6356
This report written by Pamela Morgan of Graceful Systems LLC builds on a 2009 report Now covering 25 states including 49 LDCs and 24 electric utilities this report summarizes the decoupling mechanism designs these utilities use and the rate adjustments they have made under those mechanisms In total this report estimates the retail rate impacts of 1244 decoupling mechanism adjustments since 2005
Additional Resources
The Role of Decoupling Where Energy Efficiency is Required by Lawhttpwwwraponlineorgdocumentdownloadid275
This Issuesletter gives an overview of energy efficiency resource standards the need to decouple utility profits from utility sales and explains why decoupling is needed even where a third party administers energy efficiency programs
Revenue Decoupling Standards and Criteria A Report to the Minnesota Public Utilities Commissionhttpwwwraponlineorgdocumentdownloadid850
In 2007 the Minnesota legislature enacted a new statute Section 216B2412 in which it defined an alternative approach to utility regulation decoupling and directed the Public Utilities Commission (PUC) to ldquoestablish criteria and standardsrdquo by which decoupling could be adopted for the statersquos rate-regulated utilitiesTo fulfill its obligation to develop criteria and standards for decoupling the PUC sought the advice of the Regulatory Assistance Project (RAP) This report is the output of that collaboration
Designing Distributed Generation Tariffs Wellhttpwwwraponlineorgdocumentdownloadid6898
Improvements in distributed generation economics increasing consumer preference for clean distributed energy resources and a favorable policy environment in many states have combined to produce significant increases in distributed generation adoption in the United States Regulators are looking for the well-designed tariff that compensates distributed generation adopters fairly for the value they provide to the electric system compensates the utility fairly for the grid services it provides and charges non-participating consumers fairly for the value of the services they receive This paper offers regulatory options for dealing with distributed generation The authors outline current tariffs and ponder what regulators should consider as they weigh the benefits costs and net value to distributed generation adopters non-adopters the utility and society as a whole The paper highlights the importance of deciding upon a valuation methodology so that the presence or absence of cross-subsidies can be determined Finally the paper offers rate design and ratemaking options for regulators to consider and includes recommendations for fairly implementing tariffs and ratemaking treatments to promote the public interest and ensure fair compensation
Decoupling Case Studies Revenue Regulation Implementation in Six States
47
The Regulatory Assistance Project (RAP)trade is a global non-profit team of experts focused on thelong-term economic and environmental sustainability of the power sector We provide technical and policy assistance on regulatory and market policies that promote economic efficiency environmental protection system reliability and the fair allocation of system benefits among consumers We work extensively in the US China the European Union and India Visit our website at wwwraponlineorg to learn more about our work
Rate Design Where Advanced Metering Infrastructure Has Not Been Fully Deployedhttpwwwraponlineorgdocumentdownloadid6516
This paper identifies sound practices in rate design applied around the globe using conventional metering technology Rate design for most residential and small commercial customers (mass market consumers) is most often reflected in a simple monthly access charge and a per-kWh usage rate in one or more blocks and one or more seasons A central theme across the practices highlighted in this paper is that of sending effective pricing signals through the usage-sensitive components of rates in a way that reflects the character of underlying long-run costs associated with production and usage While new technology is enabling innovations in rate design that carry some promise of better capturing opportunities for more responsive load the majority of the worldrsquos electricity usage is expected to remain under conventional pricing at least through the end of the decade and much longer in some areas Experience to date has shown that the traditional approaches to rate design persist well after the enabling technology is in place that leads to change
Time-Varying and Dynamic Rate Designhttpwwwraponlineorgdocumentdownloadid5131
This report discusses important issues in the design and deployment of time-varying rates The term time-varying rates is used in this report as encompassing traditional time-of-use rates (such as time-of-day rates and seasonal rates) as well as newer dynamic pricing rates (such as critical peak pricing and real time pricing) The discussion is primarily focused on residential customers and small commercial customers who are collectively referred to as the mass market The report also summarizes international experience with time-varying rate offerings
50 State Street Suite 3Montpelier Vermont 05602802-223-8199wwwraponlineorg
- Table of Contents
- Introduction
- California Pacific Gas and Electric Company
- Idaho Idaho Power Company
- Maryland Baltimore Gas and Electric
- Wisconsin Wisconsin Public Service Corporation
- Massachusetts National Grid
- Hawaii Hawaiian Electric Company
- Discussion of the Six Utilities Overall
- Conclusions
- Appendix
- Additional Resources
-
Decoupling Case Studies Revenue Regulation Implementation in Six States
9
13 PGampE Tariff Book Available at httpwwwpgecomtariffsEPSSHTML
14 PGampE (2012 August 31) Annual Electric True-up Filing Available at httpwwwpgecomnotsratestariffstm2pdfELEC_4096-Epdf
15 ACEEE California Available at httpaceeeorgenergy-effi-ciency-sectorstate-policyCalifornia1575all191
16 EIA Form EIA-861 data files Available at httpwwweiagovelectricitydataeia861
annual surplus or deficit plus interest is amortized and refunded to or collected from ratepayers in the following year through a rate adjustment PGampE uses different bal-ancing accounts to track specific revenue streams separately and recover or refund over or under-collections separately For example PGampE may over-collect distribution revenue leading to a surplus in that account and requiring a refund to ratepayers In the same period the utility could under-collect public purpose revenue leading to a deficit in that account which would be recovered from ratepayers It is possible that from a ratepayer perspective refunds from surplus accounts and recovery from deficit accounts could cancel each other out PGampE tracks numerous revenue streams through balancing accounts including13
bull Distribution Revenue Adjustment Mechanismbull Public purpose program Revenue Adjustmentbull Nuclear decommissioning Adjustment Mechanismbull Utility Generation Balancing Account andbull Regulatory Asset Revenue Adjustment MechanismGenerally rate adjustments apply equally to all customers
in all rate schedules with some exceptions For example di-rect access customers are exempt from changes in generation costs Revenue regulation rate adjustments occur annually with rate adjustments attributable to over- or under-collec-tion in a year being effective January 1 the following year CPUC requires PGampE to file an Annual Electric True-Up advice letter by September 1 of each year with its preliminary forecast of electric rate changes expected including revenue regulation and other adjustments The account balances as of December 31 will determine the final changes to rates that become effective on January 1 In its 2012 Annual Electric True-Up advice letter PGampE included 23 balancing accounts that were approved for that year14
Complementary PoliciesCalifornia has implemented energy savings goals for its
investor-owned utilities calling for approximately one-percent savings annually through 2020 The RiskReward Incentive Mechanism implemented in 2007 provides an incentive if the utility meets at least 85 percent of its sav-ings goals Utilities can receive 9 percent of net benefits if they achieve between 85 and 99 percent of savings goals and 12 percent of net benefits15 if they meet or exceed sav-ings goals up to the earnings cap of $450 million Penalties are triggered when actual energy efficiency savings are at or below 65 percent of the individual utility savings goal First utilities must reimburse ratepayers dollar-for-dollar for any negative net benefits this is considered part of the
penalty payment Utilities must also pay a per-unit penalty rate of $005kWh and $25kW The total penalty is also capped at $450 million
PGampE currently offers residential customers service under a default inclining block rate structure Residential customers may volunteer for time-of-use (TOU) rates with peak part-peak and off-peak tiers for summer and part-peak and off-peak tiers for winter Discounted rates for low-income and medically fragile customers are avail-able but they too are inclining Commercial customers take service on a Peak Day Pricing default rate but can opt out to take service under a TOU structure Peak Day Pricing is TOU pricing with a surcharge added on top during 9 to 15 peak events called during the year Each of these rate struc-tures signals customers that increased use of energy will be increasingly more expensive These rate designs create a situation in which utility revenues are greatly affected by weather whereas their investment and labor costs are not the revenue regulation mechanism buffers utility revenues and earnings from these weather effects
Some Commissions have implemented service quality programs to ensure that utilities donrsquot engage in destructive cost cutting to improve margins under revenue regulation PGampE files annual reliability reports but there is no explic-it penalty or reward associated with performance However a new initiative by the CPUC is exploring how to elevate the importance of safety in gas and electric utility rate cases which would be supported through a performance-based ratemaking platform
Energy Efficiency OutcomesBecause PGampE has been decoupled in one form or an-
other since 1984 it is very difficult to determine the effect of revenue regulation on the implementation of energy ef-ficiency programs However PGampE has reported that incre-mental energy efficiency savings have consistently exceeded one percent of retail sales over the last ten years16
Decoupling Case Studies Revenue Regulation Implementation in Six States
10
ResourcesCalifornia Division of Ratepayer AdvocatesReport on the Cost of Capital for Test Year 2013
Docket A 12-04-015 (August 6 2012)California Public Utilities CommissionDocket 09-12-020 Settlement Agreement (May 13 2011)Docket 10-07-027 Decision 11-05-018 (May 5 2011)Resolution E-3862 (April 1 2004)
Pacific Gas and Electric CompanyAdvice Letters 3896-E 3896-E-A 3896-E-B
Annual Electric True-Up and Supplemental Filings (January 23 2012)
Advice 3727-E Annual Electric True-Up Filing (September 1 2010)
General Rate Case Application of Pacific Gas and Electric Company (December 21 2009)
Decoupling Case Studies Revenue Regulation Implementation in Six States
11
Idaho Power Companyrsquos (IPC) Fixed Cost Adjustment (FCA) mechanism compares the authorized fixed-cost revenue requirement with weather-normalized sales and reconciles the difference annually for residential
and small business customers The allowed revenue is determined on a per-customer basis during the general rate case and the total fixed-cost recovery amount is adjusted based on the number of customers
AuthorityIn 2004 the Idaho Public Utilities Commission
established a case to investigate financial disincentives to investment in energy efficiency by IPC After a series of workshops in 2007 the Commission approved a three-year pilot of IPCrsquos proposed revenue regulation mechanism In 2009 the Commission extended the pilot for an additional two years starting January 1 2010 On April 2 2012 the Idaho Public Utilities Commission made the IPC pilot program permanent
Authorized Revenue RequirementDuring the general rate case the Commission establishes
the class-specific portion of IPCrsquos revenue requirement For purposes of the FCA this includes the fixed costs collected through Residential Service and Small General Service customer rates During the general rate case the Commission also establishes a fixed-cost per-customer ratemdashthe amount of fixed cost revenue the Company will recover from each customer Finally the Commission must also establish the fixed-cost per-kWh ratemdashthe portion of retail rates that covers fixed costs ldquoFixed costsrdquo are defined much more broadly than accounting standards provide including return taxes and labor expenses
Rate of ReturnIPCrsquos most recent rate case resulted in an overall
settlement The Stipulation specified an overall rate of return of 786 percent which combines return on equity (ROE) capital structure and cost of debt The Commission made no explicit adjustment to the Companyrsquos allowed rate of return
based on the implementation of the FCA
Revenue Adjustment MechanismThe revenue adjustment mechanism was designed to
be weather normalized For each customer class included in the revenue regulation mechanism the actual number of customers (CUST) is multiplied by the fixed-cost per-customer rate (FCC) to give the allowed fixed-cost recovery amount This pro forma amount is then compared to the fixed costs recovered by the company This actual fixed-cost recovery is determined by taking the weather-normalized sales for each class (NORM) and multiplying it by the cost-per-kWh rate (FCE) as determined in a general rate case The difference (allowed fixed cost recovery minus actual fixed cost recovery) determines the FCA In this way the revenue requirement is adjusted between rate cases based on the number of customers and is weather normalized leaving the weather risk with the company This difference is the FCA and is applied to each decoupled customer class
The mathematical formula is FCA = (CUST times FCC) ndash (NORM times FCE) The number of customers is determined by class on the same basis as the methodology used in the general rate case
Reconciling Actual Revenue With Authorized Revenue
Each month the actual fixed-cost recovered amount is determined based on the weather-normalized sales for each customer class multiplied by the fixed-cost per-kWh rate For reporting a monthly ldquoshapedrdquo fixed cost per kWh is used for calculating actual fixed-cost revenue This adheres to Generally Accepted Accounting Practices (GAAP) and better reflects end-of-year impacts within the year The methodology used to weather-normalize actual monthly energy used in the FCA is the same as used in the general rate case Finally the actual fixed-cost recovered amount is subtracted from the allowed fixed-cost recovery amount and the difference is recorded as a line item in the monthly Power Cost Adjustment (PCA) report provided to the Commission Differences are deferred with interest until the end of the
Idaho Idaho Power Company
Decoupling Case Studies Revenue Regulation Implementation in Six States
12
year The actual FCA balance will differ from that recorded in the monthly reports to reflect the fact that the deferral balance is calculated on an annual not monthly basis FCA balance is based on annual average prorated customer count annual weather normalized sales and non-shaped FCE rates which would affect both the balance accrual and the associated interest
Each year the Company totals the FCA results including interest for the period from January 1 to December 31 If the total is negative it represents an under-collection of revenue from customers and the amount will be recovered from ratepayers in the following year through an adder to rates (Schedule 54) Likewise if the total is positive the Company has over-collected its fixed-cost revenue and will return the excess amount to customers through an adder in rates using a credit or surcharge mechanism These adjustments are currently included in the Annual Adjustment Mechanism line item on customer bills Since July 2012 the Annual Adjustment Mechanism includes PCA and FCA to avoid customer confusion
Originally FCAs were calculated for each decoupled customer class however the FCA is now recovered proportionally between the residential and small general service customers for such reason as a lack of cost of service studies to support the underlying cost allocations and acknowledgment of the ldquoportfoliordquo approach toward energy efficiency Annual adjustments are capped at three percent and differences beyond that are rolled over until the next period Adjustments to the rate occur June 1 of the year following the previous one-year period from January 1 to December 31
IPC was initially obligated to submit its adjustment request subject to Staff audit on March 15 of each year Under the pilot program this included a detailed summary of demand-side management (DSM) activities that demonstrate an enhanced commitment to DSM resulting from implementation of the FCA ldquoEvidence of enhanced commitment will include but not be limited to broad availability of efficiency and load management programs building code improvement activity pursuit of appliance code standards expansion of DSM programs pursuit of energy savings programs beyond peak shavingload shifting programs and third party verificationrdquo (IPC-E-04-15 Settlement Stipulation p 5) However the Company is no longer required to file the separate annual report specifying ways in which it increased its investment in energy efficiency and DSM as a result of the FCA mechanism DSM is comprehensively reported in annual DSM reports filed with
the Commission
Potential ChangesThe Commission noted when approving the permanent
FCA that it ldquodoes not isolate or identify changes in cost recovery associated solely with the Companyrsquos energy efficiency programsrdquo17 The Company was required to file a proposal to adjust the FCA to address the capture of changes in load not related to energy efficiency programs In its compliance filing IPC recommended making no change to the FCA mechanism but did propose an altered mechanism in order to comply with the Commissionrsquos request The proposal would cap the annual change in per-customer consumption to two percent (up or down) The Commission Staff had previously proposed that the FCA balance be equally shared between the customers and the Company in order to account for variations in energy consumption other than weather and energy efficiency However the Commission found that neither proposal satisfied its needs stating that the Companyrsquos proposal to cap deviations in annual usage would not have had any effect on previous FCA results Additionally both IPC and the Idaho Conservation League filed comments stating that the Staffrsquos 5050 sharing proposal failed to remove the financial disincentives inherent in DSM programs The Commission finally determined to keep the FCA mechanism unchanged and continue to monitor the results
Complementary PoliciesIdaho requires its investor-owned utilities to pursue all
cost-effective energy efficiency however it does not have incentives for achieving energy efficiency savings
IPC uses inclining block rates as the default rate structure for its residential customers but there is also available an optional Time-of-Day pilot program with summer and winter peak and off-peak periods Small general service customers take service on a two-tier inclining block schedule
IPC has no filing or reporting requirements relating to service quality (except in Oregon)
Energy Efficiency OutcomesBefore IPC implemented revenue regulation in January
2007 it reported increasing incremental energy efficiency savings from 0 percent of retail load in 2003 to 05 percent of
17 Order No 32505 p 6 Available at httpwwwpucidahogovorders32599ord32505pdf
Decoupling Case Studies Revenue Regulation Implementation in Six States
13
retail load in 2006 Since the revenue regulation mechanism was implemented reported savings have increased from 06 percent in 2007 to 13 percent in 2010 (with low or no reported savings in 2009 and 2011)18 The DSM Report for 2012 shows this to be 12 percent
ResourcesIdaho Public Utilities CommissionIPC-E-04-15 - Idaho Power mdash Investigation of Financial
DisincentivesIPC-E-09-28 - Idaho Power mdash Application to Make the
Fixed Cost Adjustment PermanentIPC-E-11-19 - Idaho Power mdash Request to Convert
Schedule 54 (Fca) From Pilot to Permanent
18 EIA Form EIA-861 data files Available at httpwwweiagovelectricitydataeia861
Decoupling Case Studies Revenue Regulation Implementation in Six States
14
Baltimore Gas and Electricrsquos (BGE) revenue regulation mechanism compares actual distribution revenue to the authorized revenue adjusted for the number of customers for each applicable rate schedule The
authorized revenue including the cost of power is based on test year requirements and sales levels Over- or under-collec-tions are reconciled monthly through a rider This mechanism differs from the others we describe by having a monthly rather than annual deferral and recovery period
AuthorityBGE requested a revenue regulation mechanism in 2007
due to the expected impact on electricity sales of the com-panyrsquos conservation and demand response programs BGE stated that the revenue regulation mechanism was neces-sary to eliminate the inherent disincentive in the traditional ratemaking process with respect to conservation and demand response Under traditional ratemaking BGE pointed out that ldquoa one percent reduction in electricity use and demand on the Companyrsquos system for the residential and small com-mercial classes would cut cost recovery by approximately $4 million This first year impact on recovery is then followed by $8 million in the second year (as an equal amount of sav-ings is added) and so on the five-year loss to shareholders from this steady-state utility investment program would be more than $20 millionrdquo19 The revenue regulation mechanism proposed by BGE was based on its gas revenue regulation mechanism which has been in place since 1998
Authorized Revenue RequirementBGE initially calculated its revenue requirement per class
separately for each rate scale based on weather-normalized 2007 sales and the number of customers Because BGE pro-posed the mechanism in 2007 the test year 2007 included nine months of actual sales and three months of forecasted sales BGE used three steps to calculate the base monthly revenue requirement
1 Calculate the Customer Charge revenues by multiplying the number of customers by the
Maryland Baltimore Gas and Electric
Customer Charge for each class2 Calculate the Delivery Service revenues by
multiplying the weather-normalized sales by the Delivery Price for each class
3 Add the Customer Charge revenues and the Delivery Service revenues to determine the base revenue requirements for each class
BGErsquos residential small general service and general service customers are included in the revenue regulation mechanism
Rate of ReturnBGE was allowed a return on common equity of 975
percent applied to a common equity ratio of 5105 per-cent in its most recent rate case BGE strongly opposed the reduction of its ROE and preferred another lost revenue mechanism over revenue regulation if an ROE reduction was implemented as a result of revenue regulation
The Public Service Commission (PSC) made no adjust-ment to BGErsquos ROE when revenue regulation was first implemented in 2007 but did reduce its allowed ROE by 50 basis points in the last rate case The Commission had previously reduced the ROE of another utility by 50 basis points when it adopted a similar revenue regulation mecha-nism for that utility20 21
Revenue Adjustment MechanismOn a monthly basis the adjustment to base revenue
requirement is calculated for each rate class using the following steps
19 BGE (2007 October 26) 9111FilingConser-va102607F Available at httpwebapppscstatemdusintranetmaillogcontentcfmfilepath=C5CCasenum5CAdmin20Filings5C60000-1099995C1080615C9111FilingConserva102607Fpdf
20 Potomac Electric Power Company
21 BGErsquos gas mechanism was approved in a 1998 settlement that did not discuss any adjustment to ROE
Decoupling Case Studies Revenue Regulation Implementation in Six States
15
1 Calculate the revenue adjustment for the change in the number of customers by multiplying the change in the number of customers by the Customer Charge
2 Calculate the revenue adjustment associated with the change in sales by multiplying the change in the number of customers by the average use per customer and multiplying that product by the Delivery Price for the class
3 Calculate the target base revenues for each class for the current period by adding the two types of adjustments to the revenue requirement
The Delivery Price for each class is the delivery rate established by the PSC adjusted for the electric universal service charge nuclear decommissioning credits and the administrative credit associated with the administrative adder portion of the Standard Offer Service rates22
BGE had a full electric and gas rate case in 201023 and another one filed in 2013 and concluded in 201424 Both reset the required decoupling elementsmdashmonthly revenue requirement monthly average usage per customer and number of customers Neither case changed the mechanism
The decoupling mechanism now excludes lost sales resulting from major storms
Reconciling Actual Revenue With Authorized Revenue
On a monthly basis each rate classrsquos target base revenues are compared to the actual base revenues for the month The difference is divided by the forecasted sales for the following period to calculate the monthly rate adjustment Balancing accounts are used to record the timing differ-ences associated with when the adjustments are calculated versus when they are billed or refunded The monthly rate adjustment Rider 25 is capped at ten percent of rates Any amount beyond ten percent of the current rate will be car-ried over and reconciled in the subsequent period
Complementary PoliciesMaryland requires its electric utilities to provide energy
efficiency services to achieve a ten-percent reduction in per capita electricity use by 2015 The statersquos overall goal is a 15 percent reduction of per capita electricity use by 2015 Although the PSC is explicitly allowed to approve financial incentive mechanisms to promote energy efficiency no incentives have been approved yet25
BGErsquos default service to its standard offer residential cus-tomers (those customers who have not elected to take gen-eration service from an alternate supplier) features seasonal
ratesmdashsummer and winter BGE also offers a TOU rate as an option to standard offer residential customers and as the default rate for small general service customers
Regarding performance incentives under revenue regula-tion in October 2012 Maryland issued a four-part plan designed to speed up investments that will strengthen the statersquos distribution grid Part of that plan would set a rate-making structure that aligns customer and utility incentives by rewarding reliability that exceeds established reliability metrics and penalizing failure to reach those metrics A task force has encouraged the Maryland state regulatory com-mission to implement a performance-based ratemaking process for IOUs such as BGE linking a utilityrsquos progress or failure to meet certain reliability metrics with its authorized rate of return
Energy Efficiency OutcomesWhen BGE implemented electric revenue regulation in
mid 2007 it had not achieved incremental energy savings for several years In 2008 it reported incremental savings of 05 percent of retail load increasing to 17 percent in 2010 and 2011
ResourcesMaryland Public Service CommissionLetter Order ML 108061 (December 27 2007)Letter Orders ML 108069 (November 30 2007) Case No 9036 Order No 80460 (December 21 2005) Case No 9230 Order No 83907 (December 13 2013) Case No 9326 Order No 86060 (December 13 2013)
22 BGE (2007 October 26) 9111FilingConser-va102607F Available at httpwebapppscstatemdusintranetmaillogcontentcfmfilepath=C5CCasenum5CAdmin20Filings5C60000-1099995C1080615C9111FilingConserva102607Fpdf
23 Case No 9230 ndash See references above
24 Case No 9326 ndash See references above
25 ACEEE Maryland Available at httpaceeeorgsectorstate-policymarylandEnergy Efficiency Resource Standards
26 EIA Form EIA-861 data files Available at httpwwweiagovelectricitydataeia861
Decoupling Case Studies Revenue Regulation Implementation in Six States
16
27 The pilot extension is in effect until the effective date of a Final Decision issued by the Commission on an application for a general base rate case filed after January 1 2013
28 Except the Direct Load Control Cp - Large Commercial amp Industrial Service Cp-ND - Pilot Large Commercial amp Industrial - Day Ahead Cp-RR - Large Commercial amp Industrial Response Rewards Automatic Transfer Switch Parallel Generation Lighting Nature Wise and Real Time Market Pricing tariffs
Wisconsin Wisconsin Public Service Corporation
Wisconsin Public Service Corporationrsquos (WPS) Revenue Stabilization Mechanism (RSM) began in 2009 as a four-year revenue regulation pilot that reconciled
target marginal revenue per customer with actual marginal revenue per customer As of 2012 the pilot was extended27 albeit with some modifications This section focuses on the current iteration of the RSM
AuthorityThe Public Service Commission of Wisconsin (PSCW)
approved a revenue regulation pilot for WPS in a Decem-ber 2008 rate case order (Docket No 6690-UR-119) The revenue regulation mechanism was effective from January 1 2009 through December 31 2012 and applied to the util-ityrsquos electric and gas operations In a rate case completed in December 2012 (Docket No 6690-UR-121) the pilot was extended and a modified RSM was approved The extended RSM is in effect from January 2013 until the next rate case
Authorized Revenue RequirementThe authorized revenue requirement is determined
through a rate case The Commission uses a future test year to determine the revenue requirement The cost of fuel is not included in the revenue requirement but is addressed through a ldquoRetail Electric Fuel Rulerdquo adjustment
Rate of ReturnThe Commission authorized a rate of return on utility
common equity of 1030 percent in Docket No 6690-UR-120 This rate remained the same in Docket No 6690-UR-121 and is currently in effect
Revenue Adjustment MechanismWPS implemented a new electric RSM based on a ldquoTotal
Rate Case Marginrdquo mechanism instead of a ldquoTotal Rate Case Margin per Customerrdquo mechanism which had been the practice during the initial four-year pilot phase The revision was intended to remove the calculation sensitivities related
to sales per customer from the original RSM calculation The margin reflected in the formula equals the total revenue for each tariff less the costs associated with the annual per-kWh value established for monitored fuel costs and excluding any surcharges credits taxes or similar charges The ldquoTotal Rate Case Marginrdquo mechanism allows WPS to achieve the total margin assumed in the forecasted test year no more and no less The new RSM will be in effect on a pilot basis until the effective date of WPSrsquos next general rate order which WPS committed to filing for the 2014 andor 2015 test years The RSM applies to most tariffs except large commercial and industrial customers28
Reconciling Actual Revenue With Authorized Revenue
Each year the utility compares the total target revenue and the total actual revenue and defers the difference subject to carrying costs based on WPSrsquos last approved short-term debt rate The margin will be based on annual per-kWh value established for monitored fuel costs which is done in a rate case The margin is determined by subtracting the aver-age kWh value from the authorized energy rates
The formula for calculating an electric under-recovery or over-recovery is
Under-recovery or over-recovery equals
[actual margin minus ratecase forecasted margin established in the most recent rate proceeding]
The summation is over each tariff A positive value equals an over-recovery and a negative value equals an
Decoupling Case Studies Revenue Regulation Implementation in Six States
17
29 The required spending level was higher for the year 2011 owing to a temporary change in state policy
30 ACEEE Wisconsin Available at httpaceeeorgsectorstate-policywisconsin
31 The Cadmus Group Inc (2013)
under-recovery The margin reflected in the formula equals the total revenue for each tariff less the costs associated with the annual per-kWh value established for monitored fuel costs and excluding any surcharges credits taxes or similar charges
In the event that a true-up will cause rates to increase the Commission will provide an opportunity for a hear-ing Revenue regulation adjustments occur as a part of the general rate case
The revenue regulation adjustments are subject to a $14 million per year cap for electric excluding carrying costs Any adjustments over that amount will not be carried over and will not be collected from ratepayers Equivalently revenue over collection in excess of $14 million will not be returned to ratepayers
Complementary PoliciesWPS like all other investor-owned utilities
in Wisconsin is required to spend 12 per-cent of its annual operating revenues on en-ergy efficiency and customer-owned renew-able resource programs that are administered by a third party through the Focus on Energy program which was established in 200229 Separately through a contract the PSCW ap-proves annual electricity savings goals for the Focus on Energy program The savings goals were equivalent to 075 percent of electric sales for the participating utilities from 2011 to 2013 In addition the PSCW approved a rate of return on investments in energy efficiency for Wisconsin Power amp Light and other utilities can propose incentives as part of their rate cases However WPS has not yet proposed an incentive mechanism30
WPS offers residential customers a default flat rate but they also offer a TOU option with winter and summer on-peak off-peak and shoulder tiers For small commercial and industrial customers there are flat rates TOU rates and critical peak rates Large commercial and industrial customers can take service under a TOU rate with summer and winter on-peak and off-peak rates a TOU with criti-cal peak rate or under a special contract rate unique to the customer and approved by the Commission
The authorized level of expensed conservation costs recoverable in rates for the test year (2013) is $19778728 The level for electric utility operations consists of the conservation budget of $17669792 and an escrow adjustment of $2108936 which represents the test year amortization of the projected overspent escrow balance at
December 31 2012 over two years Wisconsin has a statute requiring filing of reliability data
but no reward or penalty system to support its revenue regulation system
Energy Efficiency OutcomesWPS implemented revenue regulation in 2009 In order
to gain approval for the original revenue regulation mecha-nism WPS agreed to fund energy efficiency and renewable energy programs at levels above their 12-percent statutory minimum contribution to Focus on Energy Focus on Energy produces an annual report of energy efficiency program activities In its 2012 report Focus on Energy reports the following outcomes achieved for WPSrsquo service territory The table below represents the savings under the statewide Focus on Energy Programs and does not represent the savings at-tributed under the funding levels above 12 percent31
Territory Segment
Customer Participation
Rate () Utility Type
Per Capita Lifecycle Bill Savings ($)
Per Capita Incentive
($)
WPS Electric Commercial $115258 3 $8330
WPS Electric Industrial $9026768 96 $892463
WPS Electric Residential $6494 36 $666
ResourcesPublic Service Commission of WisconsinApplication of Wisconsin Public Service Corporation for
Authority to Adjust Electric and Natural Gas Rates Final Decision (December 7 2012) Docket No 6690-UR-121
David J Kyto Wisconsin Public Service Corporation Application of Wisconsin Public Service Corporation for
Authority to Adjust Electric and Natural Gas Rates Supplemental Direct Testimony (May 15 2012) Docket No 6690-UR-121
Focus on EnergyThe Cadmus Group Inc (2013) Focus on Energy Calendar
Year 2012 Evaluation Report Appendixes Portland OR The Cadmus Group Inc Retrieved from httpwwwfocusonenergycomsitesdefaultfilesFOC_XC_CY201220Report20Appendices20A-O20Final2005-3-13pdf
Decoupling Case Studies Revenue Regulation Implementation in Six States
18
32 DPU 07-50 (2007)
33 DPU 07-50 (2007) pp 392ndash396
Massachusetts National Grid
The revenue regulation mechanism for National Grid (Massachusetts Electric Company and Nantucket Electric Company together doing business as National Grid) compares authorized
distribution revenue to actual distribution revenue Revenue is compared and adjustments are made separately for each customer class
AuthorityThe Massachusetts Department of Public Utilities (DPU)
adopted revenue regulation as a statewide regulatory policy in 2008 and individual utilities filed revenue regulation tariffs in response In its Investigation Into Rate Structures that will Promote Efficient Deployment of Demand Resources32 the DPU investigated rate structures and revenue recovery mechanisms that may reduce disincentives to the efficient deployment of demand resources in the state and consid-ered how the electric and natural gas distribution compa-niesrsquo existing cost recovery mechanism could be changed to better align the companiesrsquo financial incentives with policy objectives while ensuring that the companies are not finan-cially harmed by the increased use of demand resources The DPU finally concluded that revenue regulation mecha-nisms would eliminate the financial disincentives because they sever the link between the companiesrsquo revenue and reduction in sales The DPU also endorsed a revenue per customer approach but recognized that other factors could result in changes to distribution-related costs and consent-ed to consider company-specific ratemaking proposals that accounted for the impact of capital spending and inflation-ary pressures on the companyrsquos required revenue
Authorized Revenue RequirementThe authorized revenue requirement does not include
costs that are reconciled outside of base distribution rates including energy supply costs for basic service customers transmission costs the energy efficiency system benefits charge and reconciling charge and costs recovered through the residential assistance adjustment factor
Rate of ReturnThe Commission recognized the effects of revenue
regulation on ROE and determined that revenue regulation reduces volatility which reduces risk and a downward ad-justment to ROE was appropriate but did not make its ac-tual ROE adjustment for the revenue regulation mechanism explicit in its order33 The DPU determined that a return on equity equal to 1035 percent was sufficient The testimony from National Grid supporting its proposed ROE presented comparisons of allowed ROE for a set of companies that had revenue regulation or another risk management mecha-nism in place to account for an implied reduced risk profile in developing that proposal
Revenue Adjustment MechanismEach year the authorized revenue requirement is ad-
justed to account for capital expenditures in the previous year The CapEx Adjustment applies to capital expenditures incurred by National Grid for distribution system invest-ments in the previous year net of the amount recovered through depreciation expense in base rates This accounts for the material difference in expected capital expenditures compared with prior years In this way the CapEx Adjust-ment in the National Grid revenue regulation mechanism is a special case of a ldquoK Factorrdquo which characterizes an expected change in costs in the future and accounts for those changes when they occur Each year the Company files with the Department documentation in support of the capital expenditures it has incurred since the previous review The Department reviews the filings to determine the prudence of the incremental expenditures and whether the expenditures are used and useful National Grid then allocates approved expenditures to rate classes based on the cost of service study For each class the Company determines the adjustment allocated to the rate class then divides this sum by the forecasted kWh sales for the follow-
Decoupling Case Studies Revenue Regulation Implementation in Six States
19
34 DPU 07-50 (2007) p 87
35 ACEEE Massachusetts Available at httpaceeeorgsectorstate-policymassachusetts
36 Personal communication with National Grid
ing year to determine the per-kWh adjustment In order to provide a balance between providing the
Company with sufficient funds to ensure the safety and reliability of the distribution system and protecting ratepay-ers against the incentive the Company has to overinvest in infrastructure the mechanism limits the level of annual capital expenditures that is recoverable through the mecha-nism To arrive at the amount the Department set a limit of $170 million per year which is equal to the approximate three-year average of the Companyrsquos capital spending in previous years Should the Companyrsquos capital expenditures exceed this limit it may seek to include the investment in the rate base during the next base rate proceeding
The Company submits its CapEx filing no later than July 1 of each year On November 1 of each year the Company submits all other information in support of its proposed adjustment factors The factors will take effect on March 1 of each year
The authorized revenue is also adjusted to include a 50-percent sharing for earnings above the authorized ROE
Reconciling Actual Revenue With Authorized Revenue
Each year National Grid calculates on a rate class-spe-cific basis the difference between the actual distribution revenue billed to customers through distribution rates and the annual target revenue For each rate class the difference between the actual billed distribution revenue and the an-nual target revenue is summed to determine the Company-wide reconciliation amount That amount is divided by the Company-wide kWh forecasted for the upcoming year to arrive at a cent-per-kWh reconciliation charge or credit To determine the final adjustment for each rate class the Company-wide reconciliation adjustment is added to the rate class-specific adjustment resulting from the target rev-enue adjustment mechanisms
The adjustment to the authorized revenue in any year is capped at three percent of total revenues34 Any excess can be carried forward to a future year with carrying charges equal to the customer deposit rate
National Grid must report to the DPU if the difference between the year-to-date billed revenue and year-to-date annual target revenue equals or exceeds ten percent of the target revenue and the Company believes that the difference will fall outside of the ten-percent threshold in the coming months In this case interim revenue regulation adjust-ments can be made In order to avoid an interim adjust-ment too close to the scheduled annual rate adjustment
National Grid must notify the Department of variances exceeding ten percent of annual target revenue by August 31 of each year
Complementary Policies Massachusetts requires that electric utilities procure
all cost-effective energy efficiency before more expensive supply-side resources This requirement was translated into annual savings requirements for electric utilities starting from 1 percent of sales in 2009 to 14 percent in 2010 2 percent in 2011 and 24 percent in 2012 and potentially increased savings in subsequent years Utilities can earn approximately five percent of program costs for meeting or exceeding savings targets35
National Grid offers inclining block rates as the default residential rate but there is an optional TOU rate with peak and off-peak tiers also available to residential customers Small and large industrial and commercial customers can take service under flat rates inclining block rates or TOU rates
National Grid operates under a penalty and reward sys-tem for service quality established in Docket DTE 99-84 The impetus behind the DPUrsquos original establishment of the Service Quality Guidelines was to prevent Massachusetts utilities from allowing service quality to deteriorate under a new regulatory regime
Energy Efficiency OutcomesBefore Massachusetts Electric implemented revenue
regulation in 2009 it reported consistently high levels of incremental energy efficiency savings approximately 09 percent of retail load In 2010 the company reported 136 percent savings and 159 percent in 2010 and 2011 respectively36
ResourcesMassachusetts Department of Public UtilitiesDocket 09-39 Petition of Massachusetts Electric Company
(November 30 2009)
Decoupling Case Studies Revenue Regulation Implementation in Six States
20
37 Energy Agreement Among the State of Hawaii Division of Consumer Advocacy of the Department of Commerce amp Consumer Affairs and Hawaiian Electric Companies Available at httpwwwhecocomvcmcontentStaticFilespdfHCEIpdf
38 The HECO Companies described as follows in their Reply SOP in the Schedule A decoupling proceedings ldquothe
Hawaii Hawaiian Electric Company
Hawaiian Electric Company (HECO) uses a revenue regulation mechanism that compares actual revenue to target revenue in each year The target revenue is based on the authorized
revenue for the last test year adjusted for operation and maintenance (OampM) increases and rate base changes
HECO is a subsidiary of Hawaiian Electric Industries which also operates Maui Electric Company (MECO) and Hawaiian Electric Light Company these subsidiaries service the islands of Maui and Hawaii County while HECO serves Oahu (Honolulu)
Authority In 2008 the Governor of Hawaii the Division of Con-
sumer Advocacy and HECO entered into an agreement as a result of the Hawaii Clean Energy Initiative37 The agreement is intended to move Hawaii away from its dependence on imported fossil fuels for electricity and ground transporta-tion and toward locally produced renewable energy and energy efficiency In the agreement the State the Consumer Advocate and HECO committed to among other things a transition away from a model that encourages increased elec-tricity usage and to a model that implements revenue regula-tion decoupling to encourage the development of renewable energy by HECO The Commission opened Docket 2008-0274 in order to examine the features of a revenue regula-tion mechanism The Opening Order directed HECO and the Consumer Advocate to file a joint proposal on revenue regulation within 60 days This joint proposal was modeled closely after the California mechanism described earlier for PGampE with a rate-case determined revenue requirement plus annual attrition adjustments plus separate mechanisms
to recover power supply and energy efficiency costsThe Hawaii Public Utilities Commission approved
revenue regulation for HECO in August 2010 based on an investigation into the appropriateness of revenue regula-tion and its design The revenue regulation mechanism took effect on March 1 2011 This replaced a previous lost revenue adjustment mechanism
Authorized Revenue RequirementThe Commission establishes the Authorized Base Rev-
enues through a general rate case based on traditional cost-of-service ratemaking principles The Authorized Base Revenue is the annual amount of revenues required for the utility to recover its estimated OampM depreciation amorti-zation and tax expenses for the period
The Target Revenue is equal to the base revenue require-ment less any revenue being separately tracked or recov-ered through any other surcharge or tracking mechanism including revenue for fuel and purchased power expenses
The revenue regulation order also requires staggered triennial rate cases for each of the Hawaiian Electric Indus-tries Companies to determine approved baseline Revenue Adjustment Mechanism (RAM) inputs
Rate of ReturnThe Commission made no explicit adjustment to ROE
owing to the revenue regulation mechanism but noted that the allowed ROE of ten percent reflects the approval of revenue regulation and other cost-recovery mechanisms that will lower HECOrsquos business risk38 Most recently the Hawaiian Public Utilities Commission approved a 90-per-cent ROE for MECO reflecting both a lower baseline cost
Commission effectively reduced the Companiesrsquo return on common equity by 50 basis points to ldquofairly compensate ratepayersrdquo for what it perceived as the ldquorisk-reducingrdquo effects of the RBA and RAM mechanisms the Renewable Energy Infrastructure Program (lsquoREIPrdquo) Surcharge and the Purchased Power Adjustment Clause (ldquoPPACrdquo)rdquo Available at httpdmspuchawaiigovdmsDocumentViewerpid=A1001001A10L29B55326B47993
Decoupling Case Studies Revenue Regulation Implementation in Six States
21
39 Hawaii PUC Decision and Order No 31288 (2013 May 31) pp 97ndash112
40 Hawaii PUC Decision and Order No 31289 (2013 May 31)
41 Hawaii PUC Decision and Order No 31908 (2014 Feb 1)
42 February 7 2014 order on schedule A issues Available at httpdmspuchawaiigovdmsDocumentViewerpid=A1001001A14B10B22326F07922 p 42ndash47
of capital and a penalty of 050 percent associated with inadequate performance bringing renewable energy into the MECO system39 A companion Order also established new guidance on future revenue regulation mechanisms40
Revenue Adjustment MechanismThe RAM is designed to replace the need for annual rate
cases by adjusting Authorized Base Revenue levels to reflect estimated changes in the utilityrsquos cost of service The RAM is intended to via formula-driven estimates and escalators compensate the HECO Companies for changes in util-ity costs and infrastructure investment between rate cases and reduce the frequency of rate cases The RAM Period is the calendar year containing the Annual Evaluation Date (March 31 the date of the annual RAM filing) The RAM adjusts the revenue requirement according to changes in four main categories of expenses
bull Base expenses which are changes in designated OampM expenses
bull Rate base the return on incremental investment in designated rate base components41
bull The incremental depreciation and amortization expenses and
bull Exogenous tax changes changes in costs owing to significant changes in tax laws or tax regulations
Base expenses are segregated between labor and non-labor amounts The labor component is adjusted annually by the Labor Cost Escalation Rate reduced by the Labor Productiv-ity Offset (fixed at 076 percent) The non-labor component uses the Non-labor Escalation Rate to annually adjust those costs Tracked OampM expenses for fuel purchased power pension and post-employment benefits integrated resource planning DSM and other rate adjustment provisions are not adjusted in the RAM because any changes in these costs are accounted for in other cost-tracking mechanisms
The Rate Base equals the average net investment esti-mated for the RAM Period The average rate base is the rate base for the rate case test year with adjustments for changes in only four components of rate base (1) average plant-in-service (2) average Accumulated Depreciation (3) average accumulated contributions in aid of construc-tion and (4) average accumulated deferred income taxes All other components of the rate base remain the same as in the preceding rate case test year The average plant-in-service is equal to the average of the actual plant-in-service at the end of the year prior to the RAM period the Evalu-ation Year and the same year-end balance plus estimated plant additions for the RAM period Plant additions include
Baseline Capital Project plant additions and Major Capital Projects plant additions estimated to be in service by Sep-tember 30 of the RAM period
The RAM also includes an Earnings Sharing Revenue Credit mechanism in order to protect against excessive over-all utility revenue levels The RAM will escalate and update the Companyrsquos approved base revenue requirement reduced by earnings sharing credits and major project revenue credits to customers Based on the Companyrsquos achieved return on common equity for the Evaluation Year the mechanism cred-its the RBAs according to the following chart
ROE at or below the authorized ROE
First 100 basis points (1) over authorized ROE
Next 200 basis points (2) over authorized ROE
ROE exceeding 300 basis points (3) over
authorized ROE
Retained entirely by shareholders no customer credits
25 share credit to customers
50 share credit to customers
90 share credit to customers
Finally the RAM includes additional consumer protectionsbull A provision for Major Capital Projects Creditsbull A provision for Baseline Capital Projects Creditsbull Notification is provided to all affected customers of
the RAM filing in newspapers and billsbull Evaluation procedures for filing examination and any
exceptions to annual revenue regulation filingsbull Continued ability of HECO or the Consumer
Advocate to request formal rate proceedings to replace and terminate RAM at any time and
bull Formal review of revenue regulation as a part of the next round of rate case proceedings
A recent order42 added two additional consumer protections
bull A limitation that only 90 percent of the current
Decoupling Case Studies Revenue Regulation Implementation in Six States
22
43 ACEEE Hawaii Available at httpaceeeorgsectorstate-policyhawaii
RAM Period Rate Base that exceeds the Rate Base Adjustment Mechanism from the prior year can be included in the Decoupling Mechanism for baseline utility plant projects which unlike major capital projects are not subject to prior Commission review and approval and
bull A requirement to post a number of metrics online for customer review although not at this point tied to performance
This order also examined four issues with respect to the application of the RAM The Commission determined that the short-term debt rate as reflected in the most recent rate case should be used to adjust over- and under-collections The Commission also resolved its concern that without a sustainable business plan there exists no strategic frame-work under which to evaluate capital expenditure pro-grams The Commission required the parties in the Docket to further explore capital expenditure issues in conjunction with other risk-sharing mechanisms discussed elsewhere in the order The commission ordered a further evaluation of a proposed risk-sharing mechanism within the RBA Further-more the Commission ordered the parties to work together to establish appropriate metrics which the utility would report on its website
Once the total RAM Revenue Adjustment is calculated it is applied through a uniform adjustment to the per-kWh energy charge for all customer classes
Reconciling Actual Revenue with Authorized Revenue
RBAs record the monthly differences between target revenues and the adjusted recorded electric sales revenues The RBA also applies monthly interest equal to the annual rate for short-term debt from the cost of capital in each HECO Companyrsquos last base rate case to the simple average of the beginning and ending balances each month in the RBA In effect the RBA applies one-twelfth of the rate each month Finally the RBA provides for collection or return of the calendar year-end balances in the RBA and recovery of the RAM Revenue Adjustment over the subsequent May 1 through April 30 period The target revenue is the most recent Authorized Base Revenue or the re-determined Authorized Base Revenue calculated under the RAM
On or before March 28 the Company must file with the Commission a statement of the previous year-end balance in each RBA sub-account and the Authorized Base Revenue level for the current calendar year with supporting calculations An amortization of the year-end balance in the
RBA sub-accounts and the RAM Revenue Adjustment are recovered through the per-kWh RBA rate adjustments The rate adjustment occurs from May 1 of the current calendar year to April 30 of the next year
Complementary PoliciesCurrently electric utilities in Hawaii may use energy
efficiency to meet a portion of their Renewable Portfolio Standard requirements Starting in 2015 electricity savings from energy efficiency will be applied to the Statersquos Energy Efficiency Portfolio Standard which sets a target equivalent to 30-percent forecast sales by 2030 This goal is translated into a target of 14 percent annual savings HECO trans-ferred administration of all of its energy efficiency programs to a third party administrator in 2009 The administrator is compensated for satisfactory performance43
Because of its heavy dependence on petroleum as a generation fuel electricity prices in Hawaii are very high solar and wind are typically lower-cost resources for these systems HECOrsquos default residential rates are inclining block rates with a $900month customer charge and a three-block inclining rate design of $034kWh to $037kWh Residential customers can elect to take service under a TOU rate with off-peak mid-peak and priority-peak tiers Gen-eral service and large power service customers take service under a flat rate unless they opt to take service under a TOU
Hawaii is developing reliability standards in part as a response to deteriorating service quality as a result of distributed and customer-owned generation (see text box) In an effort to make electricity reliability and interconnection standards as transparent as possible the Reliability Standards Working Group was formed in the Feed-In Tariff docket and continues its work in Docket No 2011-0206 to find solutions to integrating high penetrations of renewable energy consistent with reliability and power quality standards
Energy Efficiency OutcomesHECO implemented revenue regulation in 2011 Since
2003 HECO has reported incremental energy efficiency savings between 0 and 05 percent of retail load with 131 percent savings reported in 2011 by Hawaii Energy the
Decoupling Case Studies Revenue Regulation Implementation in Six States
23
44 Hawaii PUC Decision and Order No 31288 Maui Electric Company Limited Docket No 2011-0092 (2013 May 31) Appendix C p 2
Statersquos ratepayer funded efficiency program administrator The company has not yet reported its savings for 201245 In addition HECO has seen more than a sixfold increase in renewable installations under its net metering and feed-in tariff policies since the inception of the revenue regulation plan
Revenue regulation represents a regulatory framework that removes the financial disincentive for utilities to pursue clean
energy strategies It doesnrsquot in and of itself align the utility business model with those utility policies and practices that address customer expectations In fact some commissions are concerned that it might create a dynamic in which the utility assured of its revenue needs becomes complacent and lacks motivation to innovate and develop strategies that may be more in line with the public interest
In a recent order (Docket 2011-0092 May 31 2013) the Hawaiian Public Utilities Commission addressed this big picture issue in a rate order for Maui Electric The Commission called out the management as lacking a long-term vision for creating customer value and expressed concern that ldquothe HECO Companiesrsquo over-reliance upon a link between the [Decoupling]
Agreement and utility financial health obfuscates utility performance and ultimately customer service and satisfactionrdquo44 The implementation of clean energy policies is not a singular goal but rather a policy that must be part of a larger effort to create customer value
The Commission laid out a hard path and a soft path to achieve the results they desire for consumers The hard path involves a closer examination of utility investments operations and expenditures The soft path is opened through the actions of management to create and execute a vision for the utility of the future The Commission remains committed to regulatory innovations that are in the public interest and will work with the utility consumer advocate and other stakeholders to create and implement this vision
The results of this effort will likely produce ideas and outcomes that will have applicability beyond this one utility
ResourcesHawaii Public Utilities CommissionDocket No 2008-0274 Final Decision and Order (August 31 2010)Docket No 2008-0083 Final Decision and Order (December 29 2010)Docket No 2011-0092 Final Decision and Order May 31 2013 including
Decision and Orders Nos 31288 and 31289Docket No 2013-0141 Final Decision and Order (February 1 2014) including
Decision and Order No 31908
45 EIA Form EIA-861 data files Available at httpwwweiagovelectricitydataeia861
Decoupling Case Studies Revenue Regulation Implementation in Six States
24
46 Lazar et al 2011
Discussion of the Six Utilities Overall
Authority The first step in implementing a revenue regulation
mechanism is to understand the authority of the regulating body the Public Utility Commission or PSC It is important for any Commission to clarify its justification for acting on revenue regulation in order to prevent any decisions from being overturned Over the years Utilities Commissions have relied on different justifications for implementing revenue regulation mechanisms Commissions have imple-mented revenue regulation at their own discretion justified by their directive to ensure safe reliable and economic public utility service to citizens to justify changing the regulatory environment In some cases the Commission is unable to engage on narrow issue ratemaking and rates can change only as the result of a full rate case In this case statutes must be amended to enable revenue regulation
In all of the case studies discussed here the Commis-sions first implemented revenue regulation at their own dis-cretion but each followed slightly different paths to do so The CPUC first implemented revenue regulation in 1978 at its discretion In 2001 after a period when mechanisms were suspended the California Legislature required that deviations from projected sales not result in under- or over-collections by utilities and so the CPUC re-implemented revenue regulation according to statutory requirement The Hawaii Public Utilities Commission implemented rev-enue regulation after an agreement between the utility the Governor and other stakeholders called for it In Idaho the Commission established a case in which to investigate rev-enue regulation and held a series of stakeholder workshops before implementing the policy The Massachusetts DPU adopted revenue regulation as a statewide regulatory policy and required individual utilities to file tariffs in response as the result of its general investigation into rate structures that promote demand-side resources The Maryland Com-mission implemented revenue regulation for BGE when the utility requested the mechanism Thus the impetus to develop a revenue regulation mechanism may come from different sources and the Commission may be comfortable
in moving forward under their general supervisory statutes Nevertheless specific statutory language can be helpful to shore up the existing authority
Authorized Revenue Requirement Under the traditional regulatory framework the Com-
mission (or other authority in the case of publicly owned utilities) must determine a utilityrsquos revenue requirement This function does not change under revenue regulation The revenue requirement of a utility is the aggregate of all the operating and other costs incurred to provide service to the public This typically includes operating expenses depreciation and the cost of capital invested including in-terest on debt and a ldquofairrdquo return on equity to investors The (simplistic) formula for determining revenue requirements is as follows
Revenue Requirements = (Rate Base times Rate of Return) + Operating Expenses + Depreciation +Taxes
Traditionally the revenue requirement along with sales is used to determine the rates consumers will pay for elec-tricity46 The rates are also broken down by customer class and intraclass tariffs are created based usually on a cost of service study that determines each customer class and subclass contribution to the utilityrsquos costs The (simplistic) formula for determining the rate per unit is
Rate = Revenue Requirement divide Units Sold
In this way rates are set to allow the utility to exactly recover its revenue requirement when the sales level used to calculate rates is equal to actual sales However it is important to recognize that actual expense and revenue varies with actual sales When actual sales are greater than the sales level used in ratemaking revenue increases and expenses increase by a different amount when actual sales are lower than the ratemaking sales level actual revenue
Decoupling Case Studies Revenue Regulation Implementation in Six States
25
declines and expenses decrease by a different amount Under revenue regulation rates are initially set in the same way but when actual sales differ from the level used to calculate rates the actual revenue level is maintained at the rate case amount as rates are allowed to vary inversely with salesmdashincreased sales lead to decreased rates and vice versa Because the primary expenses that change in the short run as sales levels change are power supply expenses and most regulators allow these to be tracked using a power cost adjustment mechanism revenue regulation mechanisms are generally designed to ensure recovery of the non-power costs (which do not change significantly in the short-run) as sales volumes change
Revenue regulation ensures that actual revenue is equal to the revenue requirement established by the Commission or appropriate authority Although the description above presents an overly simplified view of the revenue require-ment and its use in traditional price regulation and revenue regulation there are many variations on how a Commis-sion can establish a revenue requirement particularly when implementing revenue regulation With revenue regulation as in traditional ratemaking imprudent costs can always be removed from rates and there is no change to the ability of a Commission to impose penalties
Utility Functions to be IncludedFirst the regulator must determine which utility func-
tions will be included in the revenue regulation framework With vertically integrated utilities this usually includes a utilityrsquos regulated generation transmission and distribution units As we discuss below however it is critical to struc-ture power supply recovery mechanisms to avoid providing for double-recovery of certain power supply costs For utili-ties operating in areas of the country that have restructured electricity markets only the regulated distribution busi-ness is decoupled Utilities that also provide gas services
Pacific Gas amp Electric Future test year
Idaho Power Company Historic test year
Baltimore Gas amp Electric Hybrid test year
Wisconsin Public Service Corporation Future test year
National Grid Historic test year
Hawaiian Electric Company Future test year
Table 2
Test Year Used
may have their gas distribution business operating under revenue regulation as well
Test YearOne consideration in establishing the revenue require-
ment is what period of time will be used as a ldquotest periodrdquo or ldquotest yearrdquo The test year is the year on which the Com-mission will base its computations of the utilityrsquos total costs and sales levels A historic test year uses actual data on sales and costs from a past year Whereas a historic test year allows for the use of actual cost data it cannot account for expected variations in sales A future test year requires assumptions to be made about a utilityrsquos sales in a future year This can allow expected changes in sales like those from energy efficiency programs to be included in sales
projections however because regulators are relying on estimates provided by the utility there may be a greater risk for inaccuracy A Commission may also choose to use a test year that includes both past and future periods This may provide a sense of balance between historic and future data Furthermore as the case proceeds the Commission can require the utility to substitute historical data for projected data from the test year
Rate of ReturnAs in any rate case regulators
must determine the appropriate rate of return that a utility can earn on its investments including the cost of debt and the allowed ROE for its shareholders The approved ROE is only used to establish the return on investments that are included in the rate base when determining revenue require-
Pacific Gas amp Electric Electric generation and distribution gas distribution
Idaho Power Company Electric generation and distribution
Baltimore Gas amp Electric Electric distribution gas distribution
Wisconsin Public Service Corporation Electric generation and distribution
National Grid Electric distribution
Hawaiian Electric Company Electric generation and distribution
Table 1
Business Unit Included in the Revenue Regulation Model
Decoupling Case Studies Revenue Regulation Implementation in Six States
26
47 In a rate case the Commission determines an allowed return on equity This is used to set a price (price regulation) or an allowed revenue requirement (revenue regulation) Once set however the actual return earned by the utility is affected by anything that changes either revenue or expenses for example an increase in employee compensation a change in the number of employees or under price regulation a change in sales volumes
48 Lazar et al 2011
ments Although revenue regulation ensures that a utility recovers no more or less than its target revenue revenue regulation does not guarantee that the utility will earn the authorized ROE Depending on how a utility manages its costs between rate cases it will realize an actual ROE either higher (in the case of reduced costs) or lower (in the case of increased costs) than the authorized level47
A utilityrsquos allowed ROE generally represents the return deemed necessary to attract investment considering the level of risk of that investment Riskier investments require a higher return to attract investors and vice versa Util-ity earnings can be volatile because of short-run impacts on sales volumes and revenues which include changes in sales owing to weather economic conditions and energy efficiency and DG programs This volatility typically causes utilities to retain a higher level of equity in their capital structures so that reduced revenues do not leave them un-able to service their debt Revenue regulation can reduce this volatility by stabilizing revenues regardless of the cause Because of this reduced risk many stakeholders have proposed that the implementation of a revenue regulation mechanism be associated with a corresponding reduction in the utilityrsquos equity capital ratio (the percentage of capital supplied by common equity) This reflects the utilityrsquos more stable revenue owing to revenue regulation and reduces the overall revenue requirement that will be recovered from consumers48
An alternative option to reducing the utilityrsquos equity ratio is to reduce the ROE reflecting a lower risk level For the utilities included in these case studies only BGE and Mass Electric experienced a reduction in their ROE The Com-mission did not reduce BGErsquos ROE at the time the revenue regulation mechanism was implemented but reduced it by 50 basis points during the subsequent rate case The Mas-
sachusetts Commission did not reveal its adjustment but incorporated a lowered ROE into its decision
Absent an explicit adjustment to the cost of capital investorsrsquo expectations will adjust to the presence of rev-enue regulation if its presence is reliable The more stable earnings will likely in time contribute to a higher credit rating That in turn will lead to lower cost debt that will be revealed in future cost of capital calculations An adjust-ment to the ROE or capital structure by the regulator in a rate proceeding will be reflected immediately in lower rates to consumers simply allowing the utilityrsquos credit rating to improve over time and its cost of debt to decline will have the same effect but on a lagged basis as new bonds are is-sued at lower interest rates49
Beginning in 2004 Standard and Poorrsquos began publish-ing ldquorisk profilesrdquo for utilities which classified utilities based on their earnings variability and other risks those with more stable earnings were determined eligible for higher bond ratings at any given equity capitalization ratio (or alternatively able to retain a given bond rating with a lower equity ratio)50 One utility with a revenue regulation mechanism Northwest Natural Gas was believed to have had their business risk profile upgraded by one step in response to the benefits of the mechanism51
Effect on Bond RatingsRevenue regulation stabilizes a utilityrsquos revenue streams
reducing risk to investors this reduced risk may be a contributing factor in an increase in a utilityrsquos bond rating Bond rating agencies have recognized that revenue regula-tion mechanisms and other mechanisms that reduce net earnings volatility and risk contribute to a lower cost of capital for the utility52 Standard and Poorrsquos has explicitly stated that it ldquoviews decoupling as a positive develop-
49 Lazar et al 2011
50 Standard and Poorrsquos (2004 June 2) New Business Profile Scores Assigned for US Utility and Power Companies Financial Guidelines Revised
51 Christensen Associates (2005 March) A review of distribution margin normalization as approved by the Oregon Public Utility Commission for Northwest Natural
52 Lazar et al 2011
Decoupling Case Studies Revenue Regulation Implementation in Six States
27
This topic raises a note of caution if mechanisms are not well designed double-recovery of costs can occur for verti-cally integrated utilities that provide both power supply and distribution services For example if a per-customer
revenue regulation mechanism includes investment-related power supply costs in the revenue-per-customer formula but excludes fuel and purchased power costs that are recovered through a separate tracking mechanism double recovery of some power supply costs is likely If the utility experiences cus-tomer and sales growth the amount it recovers for investment-related power supply costs will go up However if that utility serves this growth by operat-
ing existing power plants more by selling less power on the surplus market or by purchasing power from other suppli-ers it will not incur any increases in the type of power sup-
53 Standard amp Poorrsquos (2008 February 19) Decoupling the vehicle for energy conservation
ment from a credit perspectiverdquo53 However in the case of the utilities examined in this report none experienced an improved credit rating after the implementation of revenue regulation with the exception of PGampE However PGampE came out of Chapter 11 bankruptcy in the same year that its revenue regulation mechanism was implemented mak-ing it impossible to attribute the improvement to revenue regulation alone Bond rating changes are generally slow to evolve Numerous other factors are taken into account when assigning an overall credit rating which appear to have outweighed any positive effect of revenue regulation These factors certainly include the recession of the US economy that began in 2007
Customer Classes IncludedWhen determining the target revenue for a utility rev-
enue regulation mechanism regulators must also consider which customer classes to include in the mechanism In some cases industrial customers have objected to a rev-enue regulation mechanism This is due to the wide dif-ference in rates among customers making the design of a revenue regulation mechanism more challenging If regula-tors choose to exclude a class of customers from revenue regulation they must determine the revenue requirement associated with serving only the included customer classes This generally requires a detailed cost of service study to ensure that revenue responsibility is accurately allocated by customer class
Included CostsFinally regulators may wish to exclude specific costs
from the overall revenue requirement if those costs will be tracked through another mechanism like fuel costs in a PCA mechanism energy efficiency program expenditures or smart grid costs for example Separate tracking mecha-nisms can also be used for those costs that are difficult to
Pacific Gas amp Electric All customer classes
Idaho Power Company Residential and small general service
Baltimore Gas amp Electric Residential and small general service
Wisconsin Public Service Corporation All customer classes
National Grid All customer classes
Hawaiian Electric Company All customer classes
Pacific Gas amp Electric
Idaho Power Company
Baltimore Gas amp Electric
Wisconsin Public Service Corporation
National Grid
Hawaiian Electric Company
Table 3
Customer Classes Included in Revenue Regulation Mechanism
Table 4
Costs Excluded From Revenue Regulation Mechanism
project based on historical data or costs over which the util-ity has very little control like fuel costs Although revenue regulation tracks collected revenue mechanisms like Fuel Adjustment Clauses Purchased Power Adjustments and Energy Efficiency Riders can be designed to track actual costs as well as collected revenue
Energy procurement costs
All variable costs
Energy supply costs
Energy costs
Energy supply costs for basic service customers transmission costs the energy efficiency system benefits charge and reconciling charge and costs recovered through the residential assistance adjustment factor
Fuel and purchased power
Decoupling Case Studies Revenue Regulation Implementation in Six States
28
54 We use the RAM term applied in Hawaii here to address any type of attrition or similar mechanism other than a revenue-per-customer framework that changes the allowed revenue between general rate cases
ply costs accounted for in the revenue per customer (RPC) calculation The increased power supply costs to serve that growth will be recovered through the fuel and purchased power tracking mechanism The net effect for the utility will be to recover incremental power supply costs twicemdashonce in the per-customer mechanism and again in the fuel and purchased power mechanism It is essential to make sure that the other adjustment mechanisms do not overlap the cost impacts that are treated in the revenue regulation mechanism One way to do this is to ensure that all power supply costs (investment labor fuel purchased power) are recovered through a single mechanism There are several ways to achieve this
a) A comprehensive power supply recovery mechanism that includes all power supply costs that is separate from the costs treated in the revenue regulation adjustment (eg Puget Sound Energy Washington State)
b) No power supply adjustment whatsoever with all utility costs included in an RPC mechanism (eg National Grid)
c) An annual attrition calculation with all costs reviewed for changes since the last proceeding (eg HECO)
Revenue Adjustment Mechanism in Revenue Regulation
A RAM54 is not necessary to achieve revenue regulation but provides attrition reliefmdashincreasing authorized revenue commensurate with increased costsmdashbetween rate cases Whereas revenue regulation sets a target revenue that the utility will earn regardless of sales levels the RAM adjusts the target revenue between rate cases Regulators may choose to take several different approaches to RAM
bull No RAM Regulators may choose not to implement a RAM leaving the revenue requirement unchanged between rate cases This requires the utility to request a rate case when it requires additional revenue to cover its costs
bull Stairstep Stairstep adjustments provide predetermined increases in target revenue These increases can be determined during a rate case and generally reflect forecasts of cost growth
bull Indexing Indexing ties adjustments to the target revenue to multiple factors like inflation productivity customer growth and changes in capital expenditures
bull RPC The RPC approach is a form of indexing RPC adjusts the total revenue requirement for the
number of customers served Regulators using an RPC mechanism will determine the revenue requirement per customer and the overall revenue requirement will be determined by multiplying the total number of customers by the revenue requirement per customer The amount of revenue required to serve each customer can be determined separately for customer classes and for existing and new customers This way the RPC method accounts for a utilityrsquos growth in fixed costs that is related to growth in the number of customers served RPC is useful where the correlation between cost growth and customer growth is significant It also protects customers from making up the deficit if there is a loss in customer load such as if a large business closes down or relocates
bull Hybrid Hybrid RAMs generally use stairstep increases to account for projected capital costs and indexing to account for OampM expenses
Adjustments from any type of RAM can be implemented automatically or through an attrition proceeding Some stakeholders oppose adjustments to the revenue require-ment outside of a rate case on the basis that this could allow the revenue requirement to increase significantly without examination of the impact on ratepayers or with-out due consideration of other costs and revenues For this reason some regulators choose to cap the total adjustment that can be made to the revenue requirement outside of a rate case
Table 5
Type of Revenue Adjustment Mechanism
Pacific Gas amp Electric
Idaho Power Company
Baltimore Gas amp Electric
Wisconsin Public Service Corporation
National Grid
Hawaiian Electric Company
Hybrid
RPC
RPC
RPC
No RAM potential capital expenditure adjustment
Hybrid
Decoupling Case Studies Revenue Regulation Implementation in Six States
29
55 Because this method results in changes in the price for service that are calculated after that service has been provided it fails the ldquono retroactive ratemakingrdquo statutes that guide most electricity regulators Customers are entitled to know the price of the commodity they are consuming at the time they use it
56 The closest to a current method in use for electric utilities in the BGE system of monthly reconciliation
Table 6
Tracking and Accrual of Difference BetweenActual and Authorized Revenue
Pacific Gas amp Electric
Idaho Power Company
Baltimore Gas amp Electric
Wisconsin Public Service Corporation
National Grid
Hawaiian Electric Company
Track Difference
Monthly
Monthly
Monthly
Yearly
Yearly
Monthly
Accrual Period
Year
Year
Month
Year
Year
Year
Calculation of Actual RevenueRegulators have options when ensuring that actual
revenue equals target revenue under revenue regulation First regulators must decide how to determine ldquoactual revenuerdquo In most cases actual revenue simply equals the amount of revenue a utility collects from its customers The Idaho Public Utilities Commission however has chosen to use weather-normalized revenues as the basis for utility revenues in revenue regulation Although this prevents the utility from recovering revenue lost to it owing to milder than expected weather it further complicates the revenue regulation mechanism and reduces its risk-reduction ben-efits By the same token if weather is severe and increases sales above the revenue requirements weather normaliza-tion would allow the utility to retain some of the revenues
Next regulators must determine whether to implement revenue regulation using a current or accrual method
bull Current Method With the current method of revenue regulation the target revenue for a period say a month is divided by the actual sales in that period to determine the rate per kWh The current method ensures that actual revenue equals target revenue by calculating the rate at the end of the period so that the target revenue can be recovered The current method allows for no lag in revenue recovery One effect of this method is that although customer rates vary total bills are generally more stable For example in a hotter than expected July customers will purchase more kWh but they will be charged a lower rate A milder than average winter would lead to fewer sales but at slightly increased rates This way customers do not experience the same bill variability as they would if rates were set before the sales deviations occurred On the other hand the current method does not provide customers with the ability to plan ahead based on a predictable rate for electricity This method has been used for revenue regulation of natural gas utilities55
bull Accrual Method Under the accrual method rates are set based on an assumed sales level and the differences between actual and target revenue are allowed to accrue over some period Then the total difference between actual and target revenue is reconciled through an adjustment to rates in the subsequent period this is known as the true-up process Presently all revenue regulation mechanisms for electric utilities use the accrual method56
If regulators use the accrual method of revenue
regulation they will next need to determine the period over which the difference between actual and target revenue will be allowed to accrue One year is typical however shorter periods are also used Next the frequency of comparing collected revenue to target revenue should be determined It is possible to do this comparison only once at the end of the accrual period It is common however for comparisons to occur more frequently often monthly When revenues are compared within the accrual period the differences are tracked generally for the purpose of applying interest to the difference that will be deferred until the end of the accrual period
Rate AdjustmentsIn designing a revenue regulation mechanism there are a
number of decision points that regulators need to consider to balance the interests of all the stakeholders One of the decision points revolves around the determination of the mechanism used to adjust rates The issues that regulators need to consider include the following1 Rate Case Requirements One of the often-mentioned
concerns about surcharges especially when they are numerous is how that will impact the frequency of rate cases For regulators and stakeholders rate cases provide
Decoupling Case Studies Revenue Regulation Implementation in Six States
30
the best mechanism to correctly align rates and costs but they are time-consuming and expensive for all parties This is because a rate case presents an opportunity to closely examine all of the utilityrsquos expenses and adjust rates to reflect cost increases and decreases Because under a revenue regulation mechanism the goal is to match revenues received from all customers with revenue requirements a correct determination of revenue requirements is important as is the specification of appropriate cost indices to adjust the revenue requirements As the time between rate cases increases some regulators feel the base rate case data even with adjustments need to be reexamined As a result some regulators have chosen to mandate the frequency of rate cases to address this whereas others have not It may be that in some cases where there are numerous surcharges recovering a multitude of costs there may not be as many costs subject to review in the rate case making it less significant to a regulator than a case in which most costs are being analyzed and recovered in the rate case itself
2 Collection Mechanism Integrally tied to the mechanism for recovering revenues is how the utility will collect or refund the revenues Options that are available include recovery through a rate case or periodic adjustments to rates through a surcharge mechanism As can be seen by the case studies depending on the plan in place some utilities have very discreet requirements dictating the frequency of rate cases with adjustments occurring in those cases or between those cases Other utilities have no requirements upon them with respect to the frequency of rate case filings This will be discussed in more detail below What does emerge from these case studies is that the discreet components or choices in how to execute a revenue regulation plan are carefully interwoven to create a holistic approach Each component works with the other and the value of this case study is in examining the different pathways that can be chosen As discussed previously some of the commissions have authorized revenue regulation to recover the revenue requirements in the last rate case whereas others have authorized adjustments to rates between rate cases this impacts the pathway that the adjustment mechanism takes
3 Timing How often should rates be adjusted to true up to the utilityrsquos revenue requirement States have chosen different options ranging from monthly to annually
4 Allocation of Revenue Regulation Revenue Surpluses or Deficits There are a number of decision points regarding allocation Should the revenue regulation apply to all rate classes or just the smaller customers whose usage per customer and load variations are not as dramatic as those of larger-use customer classes Should there be a different allocation to each rate class or should the allocation of costs among the classes be the same Different mechanisms accomplish different goals Some states have allocated revenue regulation revenues based on the revenues lost by customer class as a result of energy efficiency This can sometimes be a political decision to mitigate opposition to energy efficiency programs by large customers Other states recognize that the system savings resulting from energy efficiency benefit all customers so that all customers should pay equally
5 Carrying Charges Depending on the timing issue discussed previously regulators may want to consider carrying charges on any adjustments This should be symmetrical in its application however so that it applies to surcharges and refunds Consideration should be given for the basis of the carrying charge rate whether weighted average cost of capital rate of return a risk-free rate or some other mechanism should be adopted
6 Rate Caps In order to mitigate potential rate impacts a regulator may want to consider a cap on how much rates can go up when the revenue regulation adjustment is made This might be more critical if the regulator is aware of other potential rate increases that will impact customersrsquo bills If a cap is used the case in which the utilityrsquos adjustment would exceed the cap must be considered Some regulators have opted to allow the utility to carry over the excess unrecovered amount for a period of years whereas others do not This allows the utility to recover those revenues in a subsequent year when perhaps the adjustment is less As a practical matter however adjustments of greater than three percent are less common as shall be discussed later
7 Impact on At-Risk Consumers Low-income and consumer advocates have expressed concern about revenue regulation as a vehicle for annual rate increases without the scrutiny of a general rate case creating rate increases for the low-use customers doing the most to constrain usage and help achieve targeted energy savings One proposal to address this has been to impose any resulting surcharges only to above-average usage
Decoupling Case Studies Revenue Regulation Implementation in Six States
31
57 Cavanagh and Howat (2012 May 2) Finding common ground between consumer and environmental advocates Electricity Policy
58 The most common criticism of future test years is that utilities forecast costs under an assumption that all authorized personnel positions will be filled while in retrospect any large organization has some level of vacancy in its employee count A historic test year captures this effect fully
customers and any resulting credits only to below-average usage57
Rate Case RequirementRequirements as to the frequency of rate cases can be
tied to the recovery mechanism or to the entire regulatory framework for implementing revenue regulation In the cases studied two of the utilities require periodic rate cases PGampE every three years and WPS every year Two others National Grid and HECO require annual mini rate cases explained later in which adjustments are made and two others IPC and BGE have no requirements for scheduled rate cases Nevertheless if the concern is to ensure that the utilityrsquos revenue recovery meets its revenue requirements some kind of periodic rate case to examine costs is appropriate Having periodic rate cases can provide a measure of assurance to consumer advocates that the level at which the revenues and hence the rates are set is correct One of the criticisms of revenue regulation is in fact the lack of rate cases to produce a proper level of confidence in the allowed amounts Multiple surcharges are usually additive to existing rates therefore not permitting an opportunity to reduce the base rate for reductions in cost Moreover the infrequency in cases impedes the examination of rate allocations as would occur through a cost of service study
This is a particular issue where utilities are augmenting power supply with purchased power from independent power producers which is the most common method for acquiring wind and solar production today The increased cost for purchased power may flow through a fuel and purchased power adjustment mechanism while the (depreciating) investment in conventional power plants remains static in base rates
Both PGampE and WPS use a future test year that allows the utility to project revenue requirements during the time period that the rates are to be in effect The benefit to this is that it can help identify and account for projected changes in costs over the timeframe between rate cases However given that these costs are utility projections most consumer advocates have less confidence in these numbers than they would using actual numbers from a historical or only hybrid test year58 When trying to garner support for revenue regulation from more skeptical stakeholders using a future test year may not be helpful Furthermore in the case of WPS that has annual rate cases using a future test year becomes less justifiable as revenues are recalculated annually anyway
The absence of a rate case requirement can also cause consternation among detractors of revenue regulation because of the belief that the utility will be guaranteed its revenue requirements for as long as it is satisfied with that level irrespective of how well it manages However this is no different from the status quo in traditional regulation in most places The incentive to manage well is always there with or without revenue regulation as it translates into more profit for the utility
In the cases of HECO and National Grid the mini rate cases serve two purposes In the one instance it serves as a means to reconcile revenue recovery with revenue requirements and in the second instance it provides an opportunity to adjust rates in accordance with changes in costs Specifically for National Grid the revenue requirement is adjusted to reflect capital expenditures For HECO revenues are adjusted to reflect changes in the cost of service In the two examples here revenue regulation is wrapped in with other adjustments as part of a mini adjustment Given the structure for determining revenue requirements which accounts for changes in costs including revenue regulation within the mini rate cases is a workable option
These examples highlight how rate cases can be used to adjust revenue requirements either in a more controlled regulatory environment with frequent rate cases or left to the utilityrsquos discretion to decide when to adjust costs A set schedule of periodic rate cases such as that used by PGampE may strike an appropriate balance for reviewing revenue requirements however with the modification of a partial historical partial forecasted test year Frequent rate cases can depending on the resources of the regulator and stakeholders be too costly and time-intensive When there are too many rate cases stakeholders and regulators may not be able to dedicate the level of resources needed for any one proceeding and may be spread too thin Regular known rate cases at reasonable intervals may strike the best balance of adequate review and adjustment of revenue requirements
Decoupling Case Studies Revenue Regulation Implementation in Six States
32
Collection Mechanism and TimingThe collection mechanism for the differential between
actual and authorized revenue requirements varies by util-ity as well Both PGampE and WPS do not have adjustment clauses or surcharges but instead have structured their revenue regulation plans to recover their costs in a rate case with rates adjusted annually Although PGampE has rate cases every three years the utility files its preliminary forecast every September 1 for the following year including adjust-ments for revenue regulation and other costs This practice promotes transparency keeping all stakeholders aware of the current situation of the utility IPC BGE National Grid and HECO use surcharges on customer bills to collect or credit the difference between actual revenues collected and the revenue requirement Although the other three (IPC National Grid and HECO) calculate the rate adjustment annually only BGE does a more contemporaneous adjust-ment of one month Certainly where there are no regularly scheduled rate cases using an adjustment mechanism becomes more critical PGampE has created a tracking mecha-nism known as a balancing account that allows the utility to track the surpluses and deficits to help ensure accuracy at year end when rates are actually adjusted The creation of such monthly balancing accounts will make it easier at the end of the year to track what happened each month and then determine the adjustment for that year It provides a more detailed trail for review and analysis by stakeholders and regulators However other mechanisms that just look at total revenues as compared to revenue requirements at the end of the year can work as well
Table 7
Rate Case Requirements
Table 8
Rate Adjustments
Table 9
Allocation of Surplus or Deficit
Pacific Gas amp Electric
Idaho Power Company
Baltimore Gas amp Electric
Wisconsin Public Service Corporation
National Grid
Hawaiian Electric Company
Pacific Gas amp Electric
Idaho Power Company
Baltimore Gas amp Electric
Wisconsin Public Service Corporation
National Grid
Hawaiian Electric Company
Pacific Gas amp Electric
Idaho Power Company
Baltimore Gas amp Electric
Wisconsin Public Service Corporation
National Grid
Hawaiian Electric Company
Every three years annual ldquoattritionrdquo adjustments in between
No requirement
No requirement
Annual rate case
Annual capital expenditure adjustment case
Abbreviated annual rate case
Base rates adjusted annually
Annual adjustment through surcharge
Monthly adjustment through surcharge
Annual adjustment through rate case
Annual adjustment
Annual adjustment
Allocated to all customers according to business unit (eg electric distribution electric generation)
Included in the annual adjustment mechanism for each customer class
Separate for each customer class
Allocated to all customers except certain tariffs (see above)
Separate for each customer class
Separate for residential and commercialindustrial
Allocation of Revenue Regulation Revenue Surpluses or Deficits
The allocation of revenue regulation revenue surpluses or deficits should be symmetrical so that overpayments are credited to customers just as underpayments are paid by those same customers The six utilities studied fol-low that formula The application of revenue regulation however varies from utility to utility BGE and IPC ap-ply revenue regulation to the residential and commercial classes thereby excluding industrial customers In contrast however PGampE WPS National Grid and HECO allocate revenue regulation adjustments to all customer classes In terms of how the costs are allocated IPC BGE WPS National Grid and HECO allocate costs differently among the customer classes PGampE however allocates costs uni-formly among the customers Because PGampE has separated its business units it also separately calculates and allocates
Decoupling Case Studies Revenue Regulation Implementation in Six States
33
Table 10
Carrying Charges
Table 11
Cap on Rate Adjustment
Pacific Gas amp Electric
Idaho Power Company
Baltimore Gas amp Electric
Wisconsin Public Service Corporation
National Grid
Hawaiian Electric CompanyPacific Gas amp Electric
Idaho Power Company
Baltimore Gas amp Electric
Wisconsin Public Service Corporation
National Grid
Hawaiian Electric Company
None
Yes
None
Yes at the short-term debt rate
Yes at the customer deposit rate
Yes at the customer deposit rateNo
3 rate cap excess carried over to next period
10 rate cap excess carried over to next period
Cap of $14 million per year
$170 million in CapEx
No
revenue regulation surpluses and deficits among its electric distribution gas distribution and electric generation busi-nesses This illustrates that there are several ways to address revenues from revenue regulation depending on the policy outcomes that are desired
Carrying ChargesCarrying charges applied to uncollected or surplus rev-
enues can be used to account for the time value of money and the lost opportunity or value to having those revenues in hand PGampE and BGE do not accrue carrying charges On the other hand IPC WPS National Grid and HECO do For BGE given that the revenue regulation revenues are reconciled and recovered monthly it would make little sense to include a carrying cost Where carrying costs have been used they have included in the cases of these utili-ties the short-term debt rate or the customer deposit rate which for one utility is six percent and probably close to the short-term debt rate Thus the carrying charge rates are appropriately at the lower end of the spectrum reflecting their short-term nature In the application of the carrying charge symmetry should be preserved by applying it to both deficits and surpluses Application of carrying charges given the short period that costs are carried (one year) is somewhat discretionary Although it does more accurately account for costs it does add a modest level of complica-tion in tracking costs
Rate Caps and CollarsOne of the ways to protect customers in the event of sig-
nificant adjustments is to impose a rate cap (or collar) that limits the amount of a rate increase (and decrease) Some customers are sensitive to changes in foundational costs like utility bills and if costs are going to rise they benefit from a pattern of steady modest increases rather than a large step increase Any structural increases in rates attributable
to reductions in sales or increases in costs recognized by the revenue regulation plan would be eventually included in rates under any system A cap reflects a controlled way to manage customer expectations and customer impacts Structural changes can only be managed for a while until a complete rate case is needed to reset all assumptions
Typically when a rate cap is imposed if the formulaic increase exceeds the cap or collar the utility will be able to carry over any uncollected revenues until the next rate adjustment Two of the utilities studied PGampE and HECO do not have rate caps On the other hand the other four utilities do include rate caps in varying amounts National Grid has a one-percent revenue cap whereas IPC and BGE have a one-percent and a ten-percent rate cap respectively WPS unlike the others has a cap tied to the dollar amount of $14 million as opposed to a percentage Consistent with the goals of revenue regulation all of the utilities studied have a carryover provision that is important for reducing the risk that the utility will not recover its revenue require-ments
Note that National Grid differs from BGE and HECO in that its cap is on revenues whereas the other two utilities cap rates and rate impacts A revenue cap is more focused on ensuring minimal change to the revenue requirements authorized by the commission National Grid as discussed previously allows for mini rate cases to adjust the rev-enue requirements Having the one-percent cap limits the amount of increase that can occur through that process requiring revenue changes that are greater to occur in a full rate case However note also that some of the adjustments allowed in the mini rate case have their own separate cap The IPC rate cap is in line with what many other utilities with caps have in place which generally range from one to three percent The ten-percent rate cap in the BGE plan is
Decoupling Case Studies Revenue Regulation Implementation in Six States
34
59 Morgan P (2012 December) Graceful Systems LLC A decade of decoupling for US energy utilities rate impacts designs and observa-tions p5
reflective of its monthly adjustment pattern An annual ad-justment allows more time to smooth out peaks and valleys in revenues whereas a monthly adjustment will be influ-enced by more of the spikes (particularly weather-driven variation) thus the need for a larger bandwidth for the car-ryover Like a variable energy rate or fuel adjustment clause that fluctuates monthly the monthly adjustment introduces more volatility into the rates
Actual Historical AdjustmentsFor many ratepayer advocates there is a concern that
some of the utility management risk will be transferred to customers as a consequence of a policy that seeks to ensure that the utility will be made whole However the utility re-tains management risk and the requirement to demonstrate that it has acted prudently Thus the utility still has just as much of an incentive to operate efficiently as it did without revenue regulation If the utility can lower its costs it can still increase its profits Second by designing rates symmet-rically such that under- and over-recoveries are reconciled it provides customers with an opportunity to obtain credits that under traditional regulation would be retained by the utility It has often been opined that when there are large
gaps in time between utility rate cases it is because the utility is over-earning and exceeding its revenue require-ments In those instances customers never get to examine what the utility is collecting much less receive a refund Under revenue regulation with its periodic adjustments and scheduled general rate cases the revenue requirements are examined and refunds or credits allocated such that customers have a better knowledge base for understanding the utilityrsquos earnings And annual reconciliation of the util-ityrsquos actual revenues versus authorized revenues provides consumers with a tool to reign in excess revenue recovery beyond authorized amounts Third the adjustments that do occur under revenue regulation are manageable and frequently less than the adjustments customers are used to seeing on their bills for fuel or variable generation rates or for the myriad of other surcharges that can be tacked on to a customerrsquos bill such as an infrastructure (smart grid) sur-charge maintenance upgrade fee regulatory asset charge or system benefit charge
As seen in Figure 1 the range of rate impacts cluster around plus or minus two percent but can at times exceed plus or minus five percent The total of surcharges has somewhat exceeded the total of credits
Figure 1
Total Utility Decoupling Adjustment Rate Impacts59
300
250
200
150
100
50
0
Nu
mber
of
Dec
oup
lin
g A
dju
stm
ents
Over -5 -4 to -5 -3 to -4 -2 to -3 -1 to -2 0 to -1 0 to 1 1 to 2 2 to 3 3 to 4 4 to 5 Over 5
Percentage Rate Impacts
SurchargesRefunds
ResidentialAll
Other
Commercial
Total
Decoupling Case Studies Revenue Regulation Implementation in Six States
35
60 Id p 3
61 Schultz T Energy Efficiency at Idaho Power Available at httpwwwenergyidahogovenergyalliancedida_powerpdf
As can be seen with the utilities studied above the larger fluctuations are attributable to adjustment mechanisms that are reconciled more frequently such as monthly as those are less able to smooth out anomalies as an annual adjust-ment would do From a dollar perspective for the roughly 64 percent of adjustments that fall within the plus or minus two-percent range the monthly bill impact is approxi-mately $230 for average electric customers and $140 for average gas customers60
Of the six utilities studied the fluctuations in adjustment have for the most part stayed within the one- to three-per-cent range as shown below
bull PGampE from 2005 to 2012 has had annual revenue regulation adjustments ranging from minus143 percent to 415 percent with an average adjustment of 197 percent
bull For IPC the adjustments are separated between residential and commercial customers For residential customers the annual adjustments from 2007 through 2011 ranged from 077 percent to 258 percent for an average of 162 percent As for the commercial customers the annual adjustments for that same period were higher ranging from 104 percent to 424 percent with an average adjustment of 252 percent
bull BGE has monthly adjustments that ranged from minus1853 percent to 3013 percent with an average of 057 percent for residential customers from March 2008 through August 2012 For General Service Customers the monthly adjustment ranged from minus2264 percent to 2462 percent The average adjustment was 1308 percent
bull For WPS the annual adjustments from 2009 through 2011 ranged from minus145 percent to 378 percent for residential and small commercial and from minus314 percent to 899 percent for commercial Note that because of a $14 million per year cap some of these percentages were carried over The average annual adjustment for residential and small commercial and for commercial was 163 percent and 215 percent respectively with carry-overs to subsequent years
bull For Massachusetts Electric and Nantucket Electric both of which operate under National Grid the annual revenue regulation adjustment for all for 2011 and 2012 was minus0105 percent and 0315 percent for an average revenue regulation adjustment over the two years of 0105 percent
bull HECO like National Grid has one annual revenue
regulation mechanism for its customers which resulted in adjustments in 2011 and 2012 of 063 percent and 107 percent respectively for an average adjustment of 085 percent
As can be gleaned from the above information the range of average adjustments for small use customers was a low of 0105 percent for National Grid to a high of 197 percent for PGampE For larger use customers the range was a low of 0105 percent for National Grid to a high of 252 percent for IPC This demonstrates that on average for these utilities with well-developed and diversely designed revenue regula-tion proposals their adjustments on average stayed at or below approximately 25 percent
One of the metrics for determining if a revenue regula-tion program is working successfully that was discussed above was the impact on rates of a revenue regulation mechanism As can be seen by the analysis of the adjust-ment levels for each of the utilities they are within a rea-sonable range
Complementary Policies Although a revenue regulation mechanism does not need
to be accompanied by other policies energy efficiency is frequently at the root of the reason revenue regulation was proposed in the first place The states examined in this pa-per have various obligations for energy efficiency achieve-ment placed upon their utilities Only Idaho does not have an Energy Efficiency Resource Standard but energy efficiency objectives are developed through an integrated resource plan process Energy efficiency spending at IPC has increased dramatically in recent years61
In recognition of the fact that revenue regulation only removes the disincentive to pursue energy efficiency several states have instituted some form of incentives to reward the desired outcome This mechanism can not only incentivize management to aggressively pursue energy efficiency but also make shareholders supportive in the face of lost invest-ment opportunity
Rate design can also play an important part in assist-ing the utility in achieving favorable energy efficiency outcomes Inclining block rates penalize inefficient use of electricity and shorten payback times from the customer perspective Because efficiency reduces consumption at
Decoupling Case Studies Revenue Regulation Implementation in Six States
36
62 Optional rate designs for PGampE include TOU and Peak Time Pricing
63 IPC also has an optional TOU rate design
64 Optional rate designs for this utility include TOU Critical Peak Pricing and Contract
65 National Grid also offers optional TOU and flat rate designs
66 HECO also offers optional TOU and flat rate designs
67 See eg Alexander B (1996 April) How to construct a service quality index in performance-based ratemaking Electricity Policy
the tail block rate the value of kWh savings is greater than with flat rates On the other side of the spectrum declining block rates which have a reduced rate in the tail block do little to encourage conservation In fact they operate more like a discounted bulk rate by reducing the average cost of a kWh in a customerrsquos bill for the more kWh used
Performance incentives or other ways to avoid destruc-tive cost-cutting in the name of creating margins that reduce service or reliability or lessen customer value have been implemented only in Massachusetts of the six utilities illustrated here Several other states have implemented vari-ous schemes in reaction to perceived deficiencies in utility service67 Performance incentives are not unique to rev-enue regulation Commissions wishing to implement such a scheme can find many models of incentive reward and penalty mechanisms developed for other purposes
Taken together a suite of policy and program features can create an atmosphere that is conducive to achievement of energy efficiency goals within the utility and for the customers By appropriate application of these techniques regulators working with utilities and stakeholders can remove barriers and create an opportunity for energy ef-ficiency to be fully integrated into the utility supply option portfolio
Energy Efficiency OutcomesAlthough revenue regulation itself does not create an
incentive for a utility to implement energy efficiency it does address the issue of lost revenues associated with energy
Table 12
Complementary Policies for Energy Efficiency
Pacific Gas amp Electric62
Idaho Power Company63
Baltimore Gas amp Electric
Wisconsin Public Service Corporation64
National Grid65
Hawaiian Electric Company66
Energy Efficiency Requirement
1 annually
IRP
10 by 2015
075 annually
24 annually
Energy efficiency can satisfy portion of RPS
Default Residential Rate Design
Inclining block
Inclining block
TOU seasonal
Flat
Inclining block
Inclining block
Incentive Structure
Risk reward incentive mechanism
No
No
No
5 of program costs
Third-party administrator paid for contract performance
Performance Incentives
Reliability reporting only
None
Under consideration
Reliability reporting only
Service quality reward and penalty
Under consideration
efficiency and DG programs Revenue regulation should be combined with other mechanisms that require or incentiv-ize the implementation of energy efficiency by the utility or a third party The level of energy efficiency achieved can be one measure of the success of a revenue regulation mechanism as implemented in a larger program designed to achieve energy efficiency Table 13 shows the incremental annual energy efficiency savings reported by each utility with the shaded box indicating the year that the utilityrsquos revenue regulation mechanism was implemented National Grid had achieved a high level of energy efficiency savings in the years before it implemented revenue regulation
This paper has not evaluated DG outcomes to correlate with revenue regulation as it is not perceived that states and utilities have made that connection expressly in histori-cal mechanisms However it is expected that this connec-
Decoupling Case Studies Revenue Regulation Implementation in Six States
37
68 EIA Form EIA-861 data files Available at httpwwweiagovelectricitydataeia861
69 PGampE began revenue regulation in 1974 and it was later suspended and recommenced in 2001
70 WPS savings are represented by the statewide program savings from the Focus on Energy program WPS provided additional funds to Focus on Energy starting in CY10 through their territory-wide program activities
71 In 2009 Hawaii Energy a ratepayer-funded statewide energy efficiency provider began delivering services Savings reported after 2009 represent savings achieved through the programs of Hawaii Energy
Table 13
Annual Incremental Energy Efficiency Savings as Percentage of Retail Sales68
Highlighted cells are the year that utility started decoupling
Pacific Gas amp Electric69
Idaho Power Company
Baltimore Gas amp Electric
Wisconsin Public Service Corporation70
National Grid
Hawaiian Electric Company71
2004
11
01
00
03
11
00
2005
16
03
00
03
09
05
2006
10
05
00
03
12
05
2010
19
13
17
09
136
12
tion will be made in future mechanisms and furthermore it is anticipated that follow on work to this paper will want to study that connection between revenue regulation and DG performance
Conclusions
An increasing number of states are looking to increase the rate of energy efficiency investments for their long-run cost and risk advantages The benefits of energy efficiency include not only its ability to reduce system costs across the distribution transmission and generation functions but also the opportunity for customers to reduce their individ-ual energy costs for their own electric bills Nevertheless it is counterintuitive to encourage or order a utility to sell less of its product In order to encourage the proliferation of en-ergy efficiency programs as a solution that can contribute to this nationrsquos energy needs this tension between the goals of society versus the goals of the utility needs to be addressed Revenue regulation can be such a solution by removing the link between sales and revenues
There are many ways to implement revenue regulation and multiple decision points that regulators must consider in designing a revenue regulation mechanism This paper focused on six utilities each of which implemented revenue regulation in different ways in accordance with the objectives of that state Different decision points discussed include
bull Should revenue regulation apply to all functions (generation transmission and distribution) which sometimes depends on if the utility is regulated or restructured
bull Should revenue regulation apply to all customer classes
bull Should there be symmetry such that a reconciliation adjustment occurs for both over- and under-recoveries of the revenue requirements
bull Should recovery of indicated surcharges be conditioned on acceptable performance on customer service quality or energy efficiency goals
bull Should there be an attrition adjustment to account for other expenses or should the revenue regulation adjustment be limited to reconciling existing revenue requirements
bull Should there be an inflation adjustmentbull To calculate the revenue requirements should the
current or accrual method be usedbull Should the adjustments be made in rate cases or
through a riderbull How frequently should adjustments be made
monthly annually or some other time periodbull Depending on the period of time between true up and
recovery should there be carrying charges and if so how should they be calculated
2007
21
06
00
03
09
04
2008
35
10
05
09
05
05
2009
20
11
06
10
11
11
Decoupling Case Studies Revenue Regulation Implementation in Six States
38
72 Avista Utilities (2009) Washington Utilities and Transportation Commission Docket UE-090134
bull Should there be a requirement authorizing the frequency of rate case
bull Should there be an annual cap on the amount of the adjustment and if so should there be an opportunity to carry over any additional amounts and for how many years
bull Should there be an adjustment to the cost of capital to reflect the reduced risk
Other considerations for regulators whether or not they implement revenue regulation but certainly as part of a comprehensive package are other measures that can be put in place to encourage consumers and utilities alike to actively participate in energy efficiency For example an inclining block rate structure by virtue of its incentive to consume less pairs well with an energy efficiency program helps drive consumers to participate in efficiency programs and accelerates the payback of an energy efficiency investment By the same token an incentive payment to the utility helps provide its management with a good reason to excel and exceed targets for energy efficiency programs
A key point illustrated by the list of considerations above is that there is not just one static way to design and implement revenue regulation but rather there are a variety of options for doing so In this study a diverse group of utilities were reviewed The differences among the utilities included geographic diversity vertically integrated and restructured utilities different levels of energy efficiency in place and certainly differences in how the revenue regulation mechanisms were implemented No two utilities were alike and no two utilities had the same revenue regulation mechanism The key is that revenue regulation should eliminate the throughput incentive but the means for accomplishing this goal can vary and be tailored to each jurisdiction and each utility and still be successful
There are several considerations in the design of a revenue regulation mechanism that can help ensure its successful adoption To begin revenue regulation should be granted to utilities only as a precondition to implementing comprehensive energy efficiency andor DG policies Unless accompanied by a commitment to engage in providing least-cost resource options that could impact sales there is not really any good policy reason for its adoption All of the utilities studied are actively engaging in energy efficiency Furthermore as a matter of fairness the revenue regulation mechanism should be symmetrical so that any revenues above those authorized are refunded back to consumers As Figure 1 demonstrates although there are more surcharges to customers there is nevertheless a healthy amount of
credits back to consumers This is the bargain Barring imprudence or other unforeseen circumstances the utility receives its authorized revenue requirements and nothing more or less under a simple revenue regulation mechanism
Rate design plays an important role in the effectiveness of energy efficiency in concert with revenue regulation A low customer charge is preferable so that the customer can benefit from real bill reductions tied to reduced volumetric consumption Reductions in consumption not only reduce bills but also positively impact the payback period for investments in energy efficient appliances Declining block rates in which the tail block rate is lower than the first tier also do not encourage conservation Inclining block rates that reward low usage in the first block with a lower rate send the better price signals None of the six utilities studied had declining block residential rates They were inclining flat and time-varying
The revenue adjustment mechanism is also a critical decision point in terms of whether a revenue per customer mechanism is adopted that accounts for only the current revenue requirements or whether latitude is given to include an inflation adjustment or other cost increases in the revenue adjustment mechanism Three of the utilities studied adopted this approach whereas another two used a hybrid approach Finally to reduce volatility five of the six utilities opted for annual rather than monthly adjustments thereby creating a level of rate stability that customers in general prefer
Once the goals for revenue regulation are set by the regulators the next step is to design programs that will implement that goal For energy efficiency to be as successful as possible regulators may want to adopt a complement of other policies to accompany revenue regulation These can include rate designs that reward reduced use and conservation as well as incentive payments to utilities that reward them for meeting or exceeding targets Of the six utilities studied three have adopted some form of incentive One simple approach that was used in Washington was to link recovery of any surcharges under the revenue regulation mechanism to achievement of energy efficiency targets72
For the utilities examined above that have implemented revenue regulation the evidence demonstrates that revenue regulation as a strategy and a mechanism to enable
Decoupling Case Studies Revenue Regulation Implementation in Six States
39
energy efficiency has been working well The fact that each revenue regulation mechanism varies from the next demonstrates that there are many different paths that can be followed in implementing revenue regulation based on the needs of the utility and its stakeholders in a particular
region This study demonstrates that revenue regulation does work and provides examples of how it can be implemented each one different and unique because of the number of decision points to be considered in designing a revenue regulation mechanism
Decoupling Case Studies Revenue Regulation Implementation in Six States
40
Appendix
Historic Rate Adjustments
Table 14
PGampE Revenue Regulation Rate Adjustments 1983 to 199373
Table 15
PGampE Revenue Regulation Adjustments 2005 to 201274
Table 16
IPC Revenue Regulation Adjustments76
Idaho Power Company
1983 23
1984 (34)
1985 (48)
1986 19
1987 21
1988 50
1989 (43)
1990 (54)
1991 39
1992 34
1993 00
2005 8925 minus12773 minus143
2006 9933 2246 226
2007 10409 21727 209
2008 10261 4032 039
2009 11169 10355 093
2010 11224 46556 415
2011 10306 38390 373
2012 11032 40304 365
2007 Residential minus00457 590 minus077
Commercial minus00457 428 minus107
2008 Residential 00529 670 090
Commercial 00529 510 104
2009 Residential 01220 770 158
Commercial 01535 603 255
2010 Residential 01800 785 229
Commercial 02273 613 371
2011 Residential 02028 785 258
Commercial 02597 613 424
Revenue Regulation Adjustment as of
Total Rates
Delivery Revenue
Requirement ($ millions)
Adjustment Rate
Revenue Regulation Adjustment($ millions)
Retail Rate
of Delivery Revenue
Revenue Regulation Adjustment
Year
Year
73 Lesh P (2009 June 30) Rate impacts and key design elements of gas and electric utility decoupling
74 Morgan P (2012 November) A decade of decoupling for US energy utilities rate impacts designs and observations
75 Morgan P (2012 November) A decade of decoupling for US energy utilities rate impacts designs and observations
76 All numbers provided by the utility
Decoupling Case Studies Revenue Regulation Implementation in Six States
41
77 Idaho Power Company Case No IPC-E-11-19- fixed cost adjustment permanent mechanism Available at httpwwwpucidahogovinternetcaseselecIPCIPCE1119company20120928COMPLIANCE20FILINGPDF
Figure 2
IPC Revenue Regulation Adjustments77
Residential FCA Balance and Use per Customer
$10000000
$8000000
$6000000
$4000000
$2000000
$0
-$2000000
-$4000000
-$6000000
1080
1070
1060
1050
1040
1030
1020
1010
1000Res
idu
al A
uth
oriz
ed F
CA
Am
oun
t
Residual Authorized FCA Amount ($)
Monthly Use Per Customer (kWh)
kW
h U
sed
2006 2007 2008 2009 2010 2011
78 Morgan P (2012 November) A decade of decoupling for US energy utilities rate impacts designs and observations
Decoupling Case Studies Revenue Regulation Implementation in Six States
42
Table 17a
Baltimore Gas and ElectricBGE Monthly Revenue Regulation Adjustments 2008 to 201278
Table 17b
Baltimore Gas and ElectricBGE Monthly Revenue Regulation Adjustments 2008 to 201278
March Residential 000172 01477 1165General Service 000230 01526 1507
April Residential 000016 01477 0108General Service 000146 01526 0957
May Residential 000066 01477 0447General Service 000230 01526 1507
June Residential minus000066 01477 minus0447General Service 000230 01526 1507
July Residential 000158 01477 1070General Service 000230 01526 1507
August Residential minus000040 01477 minus0271General Service 000214 01526 1402
September Residential 000237 01477 1605General Service 000230 01526 1507
October Residential 000237 01477 1605General Service 000143 01526 0937
November Residential 000237 01477 1605General Service 000140 01526 0917
December Residential 000445 01477 3013General Service 000230 01526 1507
January Residential 000035 01579 0222General Service minus000073 01346 minus0542
February Residential 000025 01579 0158General Service 000230 01346 1709
March Residential minus000237 01579 minus1501General Service 000230 01346 1709
April Residential minus000237 01579 minus1501General Service 000230 01346 1709
May Residential 000234 01579 1482General Service 000132 01346 0981
June Residential 000237 01579 1501General Service 000230 01346 1709
July Residential 000237 01579 1501General Service 000230 01346 1709
August Residential 000237 01579 1501General Service 000190 01346 1412
September Residential 000237 01579 1501General Service 000230 01346 1709
October Residential 000237 01579 1501General Service 000124 01346 0921
November Residential 000237 01579 1501General Service 000230 01346 1709
December Residential 000156 01579 0988General Service 000204 01346 1516
Adjustment $kWh
Adjustment $kWh2008 2009
Retail Rate
$kWh
Retail Rate
$kWhAdjustment
Adjustment
Decoupling Case Studies Revenue Regulation Implementation in Six States
43
Table 17c
Baltimore Gas and ElectricBGE Monthly Revenue Regulation Adjustments 2008 to 201278
Table 17d
Baltimore Gas and ElectricBGE Monthly Revenue Regulation Adjustments 2008 to 201278
January Residential 000203 01465 1386General Service 000230 01261 1824
February Residential minus000142 01465 minus0969General Service 000230 01261 1824
March Residential minus000237 01465 minus1618General Service 000230 01261 1824
April Residential minus000237 01465 minus1618General Service 000230 01261 1824
May Residential 000192 01465 1311General Service 000230 01261 1824
June Residential 000191 01465 1304General Service 000230 01261 1824
July Residential 000095 01465 0648General Service 000230 01261 1824
August Residential minus000176 01465 minus1201General Service 000224 01261 1776
September Residential minus000237 01465 minus1618General Service 000116 01261 0920
October Residential minus000237 01465 minus1618General Service 000081 01261 0642
November Residential minus000237 01465 minus1618General Service 000098 01261 0777
December Residential minus000079 01465 minus0539General Service 000229 01261 1816
January Residential minus000130 01365 minus0952General Service 000230 01156 1990
February Residential minus000253 01365 minus1853General Service minus000020 01156 minus0173
March Residential minus000018 01365 minus0132General Service minus000063 01156 minus0545
April Residential 000110 01365 0806General Service minus000262 01156 minus2266
May Residential 000010 01365 0073General Service minus000160 01156 minus1384
June Residential 000226 01365 1656General Service 000042 01156 0363
July Residential 000253 01365 1853General Service 000209 01156 1808
August Residential minus000007 01365 minus0051General Service minus000157 01156 minus1358
September Residential minus000253 01365 minus1853General Service minus000177 01156 minus1531
October Residential 000228 01365 1670General Service 000262 01156 2266
November Residential minus000059 01365 minus0432General Service 000262 01156 2266
December Residential 000071 01365 0520General Service 000262 01156 2266
Adjustment $kWh
Adjustment $kWh2010 2011
Retail Rate
$kWh
Retail Rate
$kWhAdjustment
Adjustment
Decoupling Case Studies Revenue Regulation Implementation in Six States
44
Table 17e
Baltimore Gas and ElectricBGE Monthly Revenue Regulation Adjustments 2008 to 201278
January Residential 000253 01291 1960General Service 000262 01064 2462
February Residential 000253 01291 1960General Service 000262 01064 2462
March Residential 000253 01291 1960General Service 000262 01064 2462
April Residential 000253 01291 1960General Service 000262 01064 2462
May Residential 000253 01291 1960General Service 000262 01064 2462
June Residential 000253 01291 1960General Service 000262 01064 2462
July Residential 000253 01291 1960General Service 000262 01064 2462
August Residential 000253 01291 1960General Service 000160 01064 1504
Adjustment $kWh2012
Retail Rate
$kWhAdjustment
Decoupling Case Studies Revenue Regulation Implementation in Six States
45
79 Morgan P (2012 November) A decade of decoupling for US energy utilities rate impacts designs and observations
80 Morgan P (2012 November) A decade of decoupling for US energy utilities rate impacts designs and observations
Table 18
Wisconsin Public Service Corporation Revenue Regulation Adjustments 2009 to 201179
2009 ResidentialSmall Commercial 00048705 000168154 01290 378 130Commercial 00084951 000293293 00945 899 310
2010 ResidentialSmall Commercial 00033043 000166936 01291 256 129Commercial 00056630 000286103 09460 060 030
2011 ResidentialSmall Commercial (00018666) $ (000163719) 01288 minus145 minus127Commercial (00032565) $ (000285629) 01037 minus314 minus275
Derived Adjustment
$kWh
Derived Adjustment Capped $
kWh
Retail Rate
$kWh
Revenue Regulation Actual
Revenue Regulation Capped
Table 19
National Grid Revenue Regulation Adjustments 2011-201276
Massachusetts Electric and Nantucket Electric
Table 20
Hawaiian Electric Company
2011 All minus0015 1429 minus0105
2012 All 0044 1396 0315
2011 01995 3149 063
2012 03894 3641 107
Revenue Regulation Adjustment
centkWh
Revenue Regulation Adjustment
centkWhRetail Rate
centkWh
Retail Rate
Revenue Regulation Adjustment
Revenue Regulation
ldquoThe 2011 adjustment took effect June 1 but was reduced to $0 on July 26 2011 when the Commission granted HECO an interim rate increase of $532 million in a 2011 test year general rate case The 2012 Adjustment runs from June 1 2012 through May 31 2013 About 25 of the total relates to the portion of the decoupling mechanism that updates OampM and rate baserdquo (Morgan 2013)
Decoupling Case Studies Revenue Regulation Implementation in Six States
46
Revenue Regulation and Decoupling A Guide to Theory and Applicationhttpwwwraponlineorgdocumentdownloadid902
This guide was prepared to assist anyone who needs to understand both the mechanics of a regulatory tool known as decoupling and the policy issues associated with its use This would include public utility commissioners and staff utility management advocates and others with a stake in the regulated energy system While this guide is somewhat technical at points we have tried to make it accessible to a broad audience to make comprehensible the underlying concepts and the implications of different design choices This guide includes a detailed case study that demonstrates the impacts of decoupling using different pricing structures (rate designs) and usage patterns
Pricing Dorsquos and Donrsquots Designing Retail Rates as if Efficiency Countshttpwwwraponlineorgdocumentdownloadid939
Rate design is a crucial element of an overall regulatory strategy that fosters energy efficiency and sends appropriate signals about efficient system investment and operations Rate design is also fully under the control of state regulators Progressive rate design elements can guide consumers to participate in energy efficiency programs and reduce peak demand yet relatively few utilities and commissions have implemented many of these elements This RAP paper identifies some best practices Because pricing issues tie closely to utility growth incentives we also address revenue decoupling
A Decade of Decoupling for US Energy Utilities Rate Impacts Designs and Observationshttpwwwraponlineorgdocumentdownloadid6356
This report written by Pamela Morgan of Graceful Systems LLC builds on a 2009 report Now covering 25 states including 49 LDCs and 24 electric utilities this report summarizes the decoupling mechanism designs these utilities use and the rate adjustments they have made under those mechanisms In total this report estimates the retail rate impacts of 1244 decoupling mechanism adjustments since 2005
Additional Resources
The Role of Decoupling Where Energy Efficiency is Required by Lawhttpwwwraponlineorgdocumentdownloadid275
This Issuesletter gives an overview of energy efficiency resource standards the need to decouple utility profits from utility sales and explains why decoupling is needed even where a third party administers energy efficiency programs
Revenue Decoupling Standards and Criteria A Report to the Minnesota Public Utilities Commissionhttpwwwraponlineorgdocumentdownloadid850
In 2007 the Minnesota legislature enacted a new statute Section 216B2412 in which it defined an alternative approach to utility regulation decoupling and directed the Public Utilities Commission (PUC) to ldquoestablish criteria and standardsrdquo by which decoupling could be adopted for the statersquos rate-regulated utilitiesTo fulfill its obligation to develop criteria and standards for decoupling the PUC sought the advice of the Regulatory Assistance Project (RAP) This report is the output of that collaboration
Designing Distributed Generation Tariffs Wellhttpwwwraponlineorgdocumentdownloadid6898
Improvements in distributed generation economics increasing consumer preference for clean distributed energy resources and a favorable policy environment in many states have combined to produce significant increases in distributed generation adoption in the United States Regulators are looking for the well-designed tariff that compensates distributed generation adopters fairly for the value they provide to the electric system compensates the utility fairly for the grid services it provides and charges non-participating consumers fairly for the value of the services they receive This paper offers regulatory options for dealing with distributed generation The authors outline current tariffs and ponder what regulators should consider as they weigh the benefits costs and net value to distributed generation adopters non-adopters the utility and society as a whole The paper highlights the importance of deciding upon a valuation methodology so that the presence or absence of cross-subsidies can be determined Finally the paper offers rate design and ratemaking options for regulators to consider and includes recommendations for fairly implementing tariffs and ratemaking treatments to promote the public interest and ensure fair compensation
Decoupling Case Studies Revenue Regulation Implementation in Six States
47
The Regulatory Assistance Project (RAP)trade is a global non-profit team of experts focused on thelong-term economic and environmental sustainability of the power sector We provide technical and policy assistance on regulatory and market policies that promote economic efficiency environmental protection system reliability and the fair allocation of system benefits among consumers We work extensively in the US China the European Union and India Visit our website at wwwraponlineorg to learn more about our work
Rate Design Where Advanced Metering Infrastructure Has Not Been Fully Deployedhttpwwwraponlineorgdocumentdownloadid6516
This paper identifies sound practices in rate design applied around the globe using conventional metering technology Rate design for most residential and small commercial customers (mass market consumers) is most often reflected in a simple monthly access charge and a per-kWh usage rate in one or more blocks and one or more seasons A central theme across the practices highlighted in this paper is that of sending effective pricing signals through the usage-sensitive components of rates in a way that reflects the character of underlying long-run costs associated with production and usage While new technology is enabling innovations in rate design that carry some promise of better capturing opportunities for more responsive load the majority of the worldrsquos electricity usage is expected to remain under conventional pricing at least through the end of the decade and much longer in some areas Experience to date has shown that the traditional approaches to rate design persist well after the enabling technology is in place that leads to change
Time-Varying and Dynamic Rate Designhttpwwwraponlineorgdocumentdownloadid5131
This report discusses important issues in the design and deployment of time-varying rates The term time-varying rates is used in this report as encompassing traditional time-of-use rates (such as time-of-day rates and seasonal rates) as well as newer dynamic pricing rates (such as critical peak pricing and real time pricing) The discussion is primarily focused on residential customers and small commercial customers who are collectively referred to as the mass market The report also summarizes international experience with time-varying rate offerings
50 State Street Suite 3Montpelier Vermont 05602802-223-8199wwwraponlineorg
- Table of Contents
- Introduction
- California Pacific Gas and Electric Company
- Idaho Idaho Power Company
- Maryland Baltimore Gas and Electric
- Wisconsin Wisconsin Public Service Corporation
- Massachusetts National Grid
- Hawaii Hawaiian Electric Company
- Discussion of the Six Utilities Overall
- Conclusions
- Appendix
- Additional Resources
-

Decoupling Case Studies Revenue Regulation Implementation in Six States
10
ResourcesCalifornia Division of Ratepayer AdvocatesReport on the Cost of Capital for Test Year 2013
Docket A 12-04-015 (August 6 2012)California Public Utilities CommissionDocket 09-12-020 Settlement Agreement (May 13 2011)Docket 10-07-027 Decision 11-05-018 (May 5 2011)Resolution E-3862 (April 1 2004)
Pacific Gas and Electric CompanyAdvice Letters 3896-E 3896-E-A 3896-E-B
Annual Electric True-Up and Supplemental Filings (January 23 2012)
Advice 3727-E Annual Electric True-Up Filing (September 1 2010)
General Rate Case Application of Pacific Gas and Electric Company (December 21 2009)
Decoupling Case Studies Revenue Regulation Implementation in Six States
11
Idaho Power Companyrsquos (IPC) Fixed Cost Adjustment (FCA) mechanism compares the authorized fixed-cost revenue requirement with weather-normalized sales and reconciles the difference annually for residential
and small business customers The allowed revenue is determined on a per-customer basis during the general rate case and the total fixed-cost recovery amount is adjusted based on the number of customers
AuthorityIn 2004 the Idaho Public Utilities Commission
established a case to investigate financial disincentives to investment in energy efficiency by IPC After a series of workshops in 2007 the Commission approved a three-year pilot of IPCrsquos proposed revenue regulation mechanism In 2009 the Commission extended the pilot for an additional two years starting January 1 2010 On April 2 2012 the Idaho Public Utilities Commission made the IPC pilot program permanent
Authorized Revenue RequirementDuring the general rate case the Commission establishes
the class-specific portion of IPCrsquos revenue requirement For purposes of the FCA this includes the fixed costs collected through Residential Service and Small General Service customer rates During the general rate case the Commission also establishes a fixed-cost per-customer ratemdashthe amount of fixed cost revenue the Company will recover from each customer Finally the Commission must also establish the fixed-cost per-kWh ratemdashthe portion of retail rates that covers fixed costs ldquoFixed costsrdquo are defined much more broadly than accounting standards provide including return taxes and labor expenses
Rate of ReturnIPCrsquos most recent rate case resulted in an overall
settlement The Stipulation specified an overall rate of return of 786 percent which combines return on equity (ROE) capital structure and cost of debt The Commission made no explicit adjustment to the Companyrsquos allowed rate of return
based on the implementation of the FCA
Revenue Adjustment MechanismThe revenue adjustment mechanism was designed to
be weather normalized For each customer class included in the revenue regulation mechanism the actual number of customers (CUST) is multiplied by the fixed-cost per-customer rate (FCC) to give the allowed fixed-cost recovery amount This pro forma amount is then compared to the fixed costs recovered by the company This actual fixed-cost recovery is determined by taking the weather-normalized sales for each class (NORM) and multiplying it by the cost-per-kWh rate (FCE) as determined in a general rate case The difference (allowed fixed cost recovery minus actual fixed cost recovery) determines the FCA In this way the revenue requirement is adjusted between rate cases based on the number of customers and is weather normalized leaving the weather risk with the company This difference is the FCA and is applied to each decoupled customer class
The mathematical formula is FCA = (CUST times FCC) ndash (NORM times FCE) The number of customers is determined by class on the same basis as the methodology used in the general rate case
Reconciling Actual Revenue With Authorized Revenue
Each month the actual fixed-cost recovered amount is determined based on the weather-normalized sales for each customer class multiplied by the fixed-cost per-kWh rate For reporting a monthly ldquoshapedrdquo fixed cost per kWh is used for calculating actual fixed-cost revenue This adheres to Generally Accepted Accounting Practices (GAAP) and better reflects end-of-year impacts within the year The methodology used to weather-normalize actual monthly energy used in the FCA is the same as used in the general rate case Finally the actual fixed-cost recovered amount is subtracted from the allowed fixed-cost recovery amount and the difference is recorded as a line item in the monthly Power Cost Adjustment (PCA) report provided to the Commission Differences are deferred with interest until the end of the
Idaho Idaho Power Company
Decoupling Case Studies Revenue Regulation Implementation in Six States
12
year The actual FCA balance will differ from that recorded in the monthly reports to reflect the fact that the deferral balance is calculated on an annual not monthly basis FCA balance is based on annual average prorated customer count annual weather normalized sales and non-shaped FCE rates which would affect both the balance accrual and the associated interest
Each year the Company totals the FCA results including interest for the period from January 1 to December 31 If the total is negative it represents an under-collection of revenue from customers and the amount will be recovered from ratepayers in the following year through an adder to rates (Schedule 54) Likewise if the total is positive the Company has over-collected its fixed-cost revenue and will return the excess amount to customers through an adder in rates using a credit or surcharge mechanism These adjustments are currently included in the Annual Adjustment Mechanism line item on customer bills Since July 2012 the Annual Adjustment Mechanism includes PCA and FCA to avoid customer confusion
Originally FCAs were calculated for each decoupled customer class however the FCA is now recovered proportionally between the residential and small general service customers for such reason as a lack of cost of service studies to support the underlying cost allocations and acknowledgment of the ldquoportfoliordquo approach toward energy efficiency Annual adjustments are capped at three percent and differences beyond that are rolled over until the next period Adjustments to the rate occur June 1 of the year following the previous one-year period from January 1 to December 31
IPC was initially obligated to submit its adjustment request subject to Staff audit on March 15 of each year Under the pilot program this included a detailed summary of demand-side management (DSM) activities that demonstrate an enhanced commitment to DSM resulting from implementation of the FCA ldquoEvidence of enhanced commitment will include but not be limited to broad availability of efficiency and load management programs building code improvement activity pursuit of appliance code standards expansion of DSM programs pursuit of energy savings programs beyond peak shavingload shifting programs and third party verificationrdquo (IPC-E-04-15 Settlement Stipulation p 5) However the Company is no longer required to file the separate annual report specifying ways in which it increased its investment in energy efficiency and DSM as a result of the FCA mechanism DSM is comprehensively reported in annual DSM reports filed with
the Commission
Potential ChangesThe Commission noted when approving the permanent
FCA that it ldquodoes not isolate or identify changes in cost recovery associated solely with the Companyrsquos energy efficiency programsrdquo17 The Company was required to file a proposal to adjust the FCA to address the capture of changes in load not related to energy efficiency programs In its compliance filing IPC recommended making no change to the FCA mechanism but did propose an altered mechanism in order to comply with the Commissionrsquos request The proposal would cap the annual change in per-customer consumption to two percent (up or down) The Commission Staff had previously proposed that the FCA balance be equally shared between the customers and the Company in order to account for variations in energy consumption other than weather and energy efficiency However the Commission found that neither proposal satisfied its needs stating that the Companyrsquos proposal to cap deviations in annual usage would not have had any effect on previous FCA results Additionally both IPC and the Idaho Conservation League filed comments stating that the Staffrsquos 5050 sharing proposal failed to remove the financial disincentives inherent in DSM programs The Commission finally determined to keep the FCA mechanism unchanged and continue to monitor the results
Complementary PoliciesIdaho requires its investor-owned utilities to pursue all
cost-effective energy efficiency however it does not have incentives for achieving energy efficiency savings
IPC uses inclining block rates as the default rate structure for its residential customers but there is also available an optional Time-of-Day pilot program with summer and winter peak and off-peak periods Small general service customers take service on a two-tier inclining block schedule
IPC has no filing or reporting requirements relating to service quality (except in Oregon)
Energy Efficiency OutcomesBefore IPC implemented revenue regulation in January
2007 it reported increasing incremental energy efficiency savings from 0 percent of retail load in 2003 to 05 percent of
17 Order No 32505 p 6 Available at httpwwwpucidahogovorders32599ord32505pdf
Decoupling Case Studies Revenue Regulation Implementation in Six States
13
retail load in 2006 Since the revenue regulation mechanism was implemented reported savings have increased from 06 percent in 2007 to 13 percent in 2010 (with low or no reported savings in 2009 and 2011)18 The DSM Report for 2012 shows this to be 12 percent
ResourcesIdaho Public Utilities CommissionIPC-E-04-15 - Idaho Power mdash Investigation of Financial
DisincentivesIPC-E-09-28 - Idaho Power mdash Application to Make the
Fixed Cost Adjustment PermanentIPC-E-11-19 - Idaho Power mdash Request to Convert
Schedule 54 (Fca) From Pilot to Permanent
18 EIA Form EIA-861 data files Available at httpwwweiagovelectricitydataeia861
Decoupling Case Studies Revenue Regulation Implementation in Six States
14
Baltimore Gas and Electricrsquos (BGE) revenue regulation mechanism compares actual distribution revenue to the authorized revenue adjusted for the number of customers for each applicable rate schedule The
authorized revenue including the cost of power is based on test year requirements and sales levels Over- or under-collec-tions are reconciled monthly through a rider This mechanism differs from the others we describe by having a monthly rather than annual deferral and recovery period
AuthorityBGE requested a revenue regulation mechanism in 2007
due to the expected impact on electricity sales of the com-panyrsquos conservation and demand response programs BGE stated that the revenue regulation mechanism was neces-sary to eliminate the inherent disincentive in the traditional ratemaking process with respect to conservation and demand response Under traditional ratemaking BGE pointed out that ldquoa one percent reduction in electricity use and demand on the Companyrsquos system for the residential and small com-mercial classes would cut cost recovery by approximately $4 million This first year impact on recovery is then followed by $8 million in the second year (as an equal amount of sav-ings is added) and so on the five-year loss to shareholders from this steady-state utility investment program would be more than $20 millionrdquo19 The revenue regulation mechanism proposed by BGE was based on its gas revenue regulation mechanism which has been in place since 1998
Authorized Revenue RequirementBGE initially calculated its revenue requirement per class
separately for each rate scale based on weather-normalized 2007 sales and the number of customers Because BGE pro-posed the mechanism in 2007 the test year 2007 included nine months of actual sales and three months of forecasted sales BGE used three steps to calculate the base monthly revenue requirement
1 Calculate the Customer Charge revenues by multiplying the number of customers by the
Maryland Baltimore Gas and Electric
Customer Charge for each class2 Calculate the Delivery Service revenues by
multiplying the weather-normalized sales by the Delivery Price for each class
3 Add the Customer Charge revenues and the Delivery Service revenues to determine the base revenue requirements for each class
BGErsquos residential small general service and general service customers are included in the revenue regulation mechanism
Rate of ReturnBGE was allowed a return on common equity of 975
percent applied to a common equity ratio of 5105 per-cent in its most recent rate case BGE strongly opposed the reduction of its ROE and preferred another lost revenue mechanism over revenue regulation if an ROE reduction was implemented as a result of revenue regulation
The Public Service Commission (PSC) made no adjust-ment to BGErsquos ROE when revenue regulation was first implemented in 2007 but did reduce its allowed ROE by 50 basis points in the last rate case The Commission had previously reduced the ROE of another utility by 50 basis points when it adopted a similar revenue regulation mecha-nism for that utility20 21
Revenue Adjustment MechanismOn a monthly basis the adjustment to base revenue
requirement is calculated for each rate class using the following steps
19 BGE (2007 October 26) 9111FilingConser-va102607F Available at httpwebapppscstatemdusintranetmaillogcontentcfmfilepath=C5CCasenum5CAdmin20Filings5C60000-1099995C1080615C9111FilingConserva102607Fpdf
20 Potomac Electric Power Company
21 BGErsquos gas mechanism was approved in a 1998 settlement that did not discuss any adjustment to ROE
Decoupling Case Studies Revenue Regulation Implementation in Six States
15
1 Calculate the revenue adjustment for the change in the number of customers by multiplying the change in the number of customers by the Customer Charge
2 Calculate the revenue adjustment associated with the change in sales by multiplying the change in the number of customers by the average use per customer and multiplying that product by the Delivery Price for the class
3 Calculate the target base revenues for each class for the current period by adding the two types of adjustments to the revenue requirement
The Delivery Price for each class is the delivery rate established by the PSC adjusted for the electric universal service charge nuclear decommissioning credits and the administrative credit associated with the administrative adder portion of the Standard Offer Service rates22
BGE had a full electric and gas rate case in 201023 and another one filed in 2013 and concluded in 201424 Both reset the required decoupling elementsmdashmonthly revenue requirement monthly average usage per customer and number of customers Neither case changed the mechanism
The decoupling mechanism now excludes lost sales resulting from major storms
Reconciling Actual Revenue With Authorized Revenue
On a monthly basis each rate classrsquos target base revenues are compared to the actual base revenues for the month The difference is divided by the forecasted sales for the following period to calculate the monthly rate adjustment Balancing accounts are used to record the timing differ-ences associated with when the adjustments are calculated versus when they are billed or refunded The monthly rate adjustment Rider 25 is capped at ten percent of rates Any amount beyond ten percent of the current rate will be car-ried over and reconciled in the subsequent period
Complementary PoliciesMaryland requires its electric utilities to provide energy
efficiency services to achieve a ten-percent reduction in per capita electricity use by 2015 The statersquos overall goal is a 15 percent reduction of per capita electricity use by 2015 Although the PSC is explicitly allowed to approve financial incentive mechanisms to promote energy efficiency no incentives have been approved yet25
BGErsquos default service to its standard offer residential cus-tomers (those customers who have not elected to take gen-eration service from an alternate supplier) features seasonal
ratesmdashsummer and winter BGE also offers a TOU rate as an option to standard offer residential customers and as the default rate for small general service customers
Regarding performance incentives under revenue regula-tion in October 2012 Maryland issued a four-part plan designed to speed up investments that will strengthen the statersquos distribution grid Part of that plan would set a rate-making structure that aligns customer and utility incentives by rewarding reliability that exceeds established reliability metrics and penalizing failure to reach those metrics A task force has encouraged the Maryland state regulatory com-mission to implement a performance-based ratemaking process for IOUs such as BGE linking a utilityrsquos progress or failure to meet certain reliability metrics with its authorized rate of return
Energy Efficiency OutcomesWhen BGE implemented electric revenue regulation in
mid 2007 it had not achieved incremental energy savings for several years In 2008 it reported incremental savings of 05 percent of retail load increasing to 17 percent in 2010 and 2011
ResourcesMaryland Public Service CommissionLetter Order ML 108061 (December 27 2007)Letter Orders ML 108069 (November 30 2007) Case No 9036 Order No 80460 (December 21 2005) Case No 9230 Order No 83907 (December 13 2013) Case No 9326 Order No 86060 (December 13 2013)
22 BGE (2007 October 26) 9111FilingConser-va102607F Available at httpwebapppscstatemdusintranetmaillogcontentcfmfilepath=C5CCasenum5CAdmin20Filings5C60000-1099995C1080615C9111FilingConserva102607Fpdf
23 Case No 9230 ndash See references above
24 Case No 9326 ndash See references above
25 ACEEE Maryland Available at httpaceeeorgsectorstate-policymarylandEnergy Efficiency Resource Standards
26 EIA Form EIA-861 data files Available at httpwwweiagovelectricitydataeia861
Decoupling Case Studies Revenue Regulation Implementation in Six States
16
27 The pilot extension is in effect until the effective date of a Final Decision issued by the Commission on an application for a general base rate case filed after January 1 2013
28 Except the Direct Load Control Cp - Large Commercial amp Industrial Service Cp-ND - Pilot Large Commercial amp Industrial - Day Ahead Cp-RR - Large Commercial amp Industrial Response Rewards Automatic Transfer Switch Parallel Generation Lighting Nature Wise and Real Time Market Pricing tariffs
Wisconsin Wisconsin Public Service Corporation
Wisconsin Public Service Corporationrsquos (WPS) Revenue Stabilization Mechanism (RSM) began in 2009 as a four-year revenue regulation pilot that reconciled
target marginal revenue per customer with actual marginal revenue per customer As of 2012 the pilot was extended27 albeit with some modifications This section focuses on the current iteration of the RSM
AuthorityThe Public Service Commission of Wisconsin (PSCW)
approved a revenue regulation pilot for WPS in a Decem-ber 2008 rate case order (Docket No 6690-UR-119) The revenue regulation mechanism was effective from January 1 2009 through December 31 2012 and applied to the util-ityrsquos electric and gas operations In a rate case completed in December 2012 (Docket No 6690-UR-121) the pilot was extended and a modified RSM was approved The extended RSM is in effect from January 2013 until the next rate case
Authorized Revenue RequirementThe authorized revenue requirement is determined
through a rate case The Commission uses a future test year to determine the revenue requirement The cost of fuel is not included in the revenue requirement but is addressed through a ldquoRetail Electric Fuel Rulerdquo adjustment
Rate of ReturnThe Commission authorized a rate of return on utility
common equity of 1030 percent in Docket No 6690-UR-120 This rate remained the same in Docket No 6690-UR-121 and is currently in effect
Revenue Adjustment MechanismWPS implemented a new electric RSM based on a ldquoTotal
Rate Case Marginrdquo mechanism instead of a ldquoTotal Rate Case Margin per Customerrdquo mechanism which had been the practice during the initial four-year pilot phase The revision was intended to remove the calculation sensitivities related
to sales per customer from the original RSM calculation The margin reflected in the formula equals the total revenue for each tariff less the costs associated with the annual per-kWh value established for monitored fuel costs and excluding any surcharges credits taxes or similar charges The ldquoTotal Rate Case Marginrdquo mechanism allows WPS to achieve the total margin assumed in the forecasted test year no more and no less The new RSM will be in effect on a pilot basis until the effective date of WPSrsquos next general rate order which WPS committed to filing for the 2014 andor 2015 test years The RSM applies to most tariffs except large commercial and industrial customers28
Reconciling Actual Revenue With Authorized Revenue
Each year the utility compares the total target revenue and the total actual revenue and defers the difference subject to carrying costs based on WPSrsquos last approved short-term debt rate The margin will be based on annual per-kWh value established for monitored fuel costs which is done in a rate case The margin is determined by subtracting the aver-age kWh value from the authorized energy rates
The formula for calculating an electric under-recovery or over-recovery is
Under-recovery or over-recovery equals
[actual margin minus ratecase forecasted margin established in the most recent rate proceeding]
The summation is over each tariff A positive value equals an over-recovery and a negative value equals an
Decoupling Case Studies Revenue Regulation Implementation in Six States
17
29 The required spending level was higher for the year 2011 owing to a temporary change in state policy
30 ACEEE Wisconsin Available at httpaceeeorgsectorstate-policywisconsin
31 The Cadmus Group Inc (2013)
under-recovery The margin reflected in the formula equals the total revenue for each tariff less the costs associated with the annual per-kWh value established for monitored fuel costs and excluding any surcharges credits taxes or similar charges
In the event that a true-up will cause rates to increase the Commission will provide an opportunity for a hear-ing Revenue regulation adjustments occur as a part of the general rate case
The revenue regulation adjustments are subject to a $14 million per year cap for electric excluding carrying costs Any adjustments over that amount will not be carried over and will not be collected from ratepayers Equivalently revenue over collection in excess of $14 million will not be returned to ratepayers
Complementary PoliciesWPS like all other investor-owned utilities
in Wisconsin is required to spend 12 per-cent of its annual operating revenues on en-ergy efficiency and customer-owned renew-able resource programs that are administered by a third party through the Focus on Energy program which was established in 200229 Separately through a contract the PSCW ap-proves annual electricity savings goals for the Focus on Energy program The savings goals were equivalent to 075 percent of electric sales for the participating utilities from 2011 to 2013 In addition the PSCW approved a rate of return on investments in energy efficiency for Wisconsin Power amp Light and other utilities can propose incentives as part of their rate cases However WPS has not yet proposed an incentive mechanism30
WPS offers residential customers a default flat rate but they also offer a TOU option with winter and summer on-peak off-peak and shoulder tiers For small commercial and industrial customers there are flat rates TOU rates and critical peak rates Large commercial and industrial customers can take service under a TOU rate with summer and winter on-peak and off-peak rates a TOU with criti-cal peak rate or under a special contract rate unique to the customer and approved by the Commission
The authorized level of expensed conservation costs recoverable in rates for the test year (2013) is $19778728 The level for electric utility operations consists of the conservation budget of $17669792 and an escrow adjustment of $2108936 which represents the test year amortization of the projected overspent escrow balance at
December 31 2012 over two years Wisconsin has a statute requiring filing of reliability data
but no reward or penalty system to support its revenue regulation system
Energy Efficiency OutcomesWPS implemented revenue regulation in 2009 In order
to gain approval for the original revenue regulation mecha-nism WPS agreed to fund energy efficiency and renewable energy programs at levels above their 12-percent statutory minimum contribution to Focus on Energy Focus on Energy produces an annual report of energy efficiency program activities In its 2012 report Focus on Energy reports the following outcomes achieved for WPSrsquo service territory The table below represents the savings under the statewide Focus on Energy Programs and does not represent the savings at-tributed under the funding levels above 12 percent31
Territory Segment
Customer Participation
Rate () Utility Type
Per Capita Lifecycle Bill Savings ($)
Per Capita Incentive
($)
WPS Electric Commercial $115258 3 $8330
WPS Electric Industrial $9026768 96 $892463
WPS Electric Residential $6494 36 $666
ResourcesPublic Service Commission of WisconsinApplication of Wisconsin Public Service Corporation for
Authority to Adjust Electric and Natural Gas Rates Final Decision (December 7 2012) Docket No 6690-UR-121
David J Kyto Wisconsin Public Service Corporation Application of Wisconsin Public Service Corporation for
Authority to Adjust Electric and Natural Gas Rates Supplemental Direct Testimony (May 15 2012) Docket No 6690-UR-121
Focus on EnergyThe Cadmus Group Inc (2013) Focus on Energy Calendar
Year 2012 Evaluation Report Appendixes Portland OR The Cadmus Group Inc Retrieved from httpwwwfocusonenergycomsitesdefaultfilesFOC_XC_CY201220Report20Appendices20A-O20Final2005-3-13pdf
Decoupling Case Studies Revenue Regulation Implementation in Six States
18
32 DPU 07-50 (2007)
33 DPU 07-50 (2007) pp 392ndash396
Massachusetts National Grid
The revenue regulation mechanism for National Grid (Massachusetts Electric Company and Nantucket Electric Company together doing business as National Grid) compares authorized
distribution revenue to actual distribution revenue Revenue is compared and adjustments are made separately for each customer class
AuthorityThe Massachusetts Department of Public Utilities (DPU)
adopted revenue regulation as a statewide regulatory policy in 2008 and individual utilities filed revenue regulation tariffs in response In its Investigation Into Rate Structures that will Promote Efficient Deployment of Demand Resources32 the DPU investigated rate structures and revenue recovery mechanisms that may reduce disincentives to the efficient deployment of demand resources in the state and consid-ered how the electric and natural gas distribution compa-niesrsquo existing cost recovery mechanism could be changed to better align the companiesrsquo financial incentives with policy objectives while ensuring that the companies are not finan-cially harmed by the increased use of demand resources The DPU finally concluded that revenue regulation mecha-nisms would eliminate the financial disincentives because they sever the link between the companiesrsquo revenue and reduction in sales The DPU also endorsed a revenue per customer approach but recognized that other factors could result in changes to distribution-related costs and consent-ed to consider company-specific ratemaking proposals that accounted for the impact of capital spending and inflation-ary pressures on the companyrsquos required revenue
Authorized Revenue RequirementThe authorized revenue requirement does not include
costs that are reconciled outside of base distribution rates including energy supply costs for basic service customers transmission costs the energy efficiency system benefits charge and reconciling charge and costs recovered through the residential assistance adjustment factor
Rate of ReturnThe Commission recognized the effects of revenue
regulation on ROE and determined that revenue regulation reduces volatility which reduces risk and a downward ad-justment to ROE was appropriate but did not make its ac-tual ROE adjustment for the revenue regulation mechanism explicit in its order33 The DPU determined that a return on equity equal to 1035 percent was sufficient The testimony from National Grid supporting its proposed ROE presented comparisons of allowed ROE for a set of companies that had revenue regulation or another risk management mecha-nism in place to account for an implied reduced risk profile in developing that proposal
Revenue Adjustment MechanismEach year the authorized revenue requirement is ad-
justed to account for capital expenditures in the previous year The CapEx Adjustment applies to capital expenditures incurred by National Grid for distribution system invest-ments in the previous year net of the amount recovered through depreciation expense in base rates This accounts for the material difference in expected capital expenditures compared with prior years In this way the CapEx Adjust-ment in the National Grid revenue regulation mechanism is a special case of a ldquoK Factorrdquo which characterizes an expected change in costs in the future and accounts for those changes when they occur Each year the Company files with the Department documentation in support of the capital expenditures it has incurred since the previous review The Department reviews the filings to determine the prudence of the incremental expenditures and whether the expenditures are used and useful National Grid then allocates approved expenditures to rate classes based on the cost of service study For each class the Company determines the adjustment allocated to the rate class then divides this sum by the forecasted kWh sales for the follow-
Decoupling Case Studies Revenue Regulation Implementation in Six States
19
34 DPU 07-50 (2007) p 87
35 ACEEE Massachusetts Available at httpaceeeorgsectorstate-policymassachusetts
36 Personal communication with National Grid
ing year to determine the per-kWh adjustment In order to provide a balance between providing the
Company with sufficient funds to ensure the safety and reliability of the distribution system and protecting ratepay-ers against the incentive the Company has to overinvest in infrastructure the mechanism limits the level of annual capital expenditures that is recoverable through the mecha-nism To arrive at the amount the Department set a limit of $170 million per year which is equal to the approximate three-year average of the Companyrsquos capital spending in previous years Should the Companyrsquos capital expenditures exceed this limit it may seek to include the investment in the rate base during the next base rate proceeding
The Company submits its CapEx filing no later than July 1 of each year On November 1 of each year the Company submits all other information in support of its proposed adjustment factors The factors will take effect on March 1 of each year
The authorized revenue is also adjusted to include a 50-percent sharing for earnings above the authorized ROE
Reconciling Actual Revenue With Authorized Revenue
Each year National Grid calculates on a rate class-spe-cific basis the difference between the actual distribution revenue billed to customers through distribution rates and the annual target revenue For each rate class the difference between the actual billed distribution revenue and the an-nual target revenue is summed to determine the Company-wide reconciliation amount That amount is divided by the Company-wide kWh forecasted for the upcoming year to arrive at a cent-per-kWh reconciliation charge or credit To determine the final adjustment for each rate class the Company-wide reconciliation adjustment is added to the rate class-specific adjustment resulting from the target rev-enue adjustment mechanisms
The adjustment to the authorized revenue in any year is capped at three percent of total revenues34 Any excess can be carried forward to a future year with carrying charges equal to the customer deposit rate
National Grid must report to the DPU if the difference between the year-to-date billed revenue and year-to-date annual target revenue equals or exceeds ten percent of the target revenue and the Company believes that the difference will fall outside of the ten-percent threshold in the coming months In this case interim revenue regulation adjust-ments can be made In order to avoid an interim adjust-ment too close to the scheduled annual rate adjustment
National Grid must notify the Department of variances exceeding ten percent of annual target revenue by August 31 of each year
Complementary Policies Massachusetts requires that electric utilities procure
all cost-effective energy efficiency before more expensive supply-side resources This requirement was translated into annual savings requirements for electric utilities starting from 1 percent of sales in 2009 to 14 percent in 2010 2 percent in 2011 and 24 percent in 2012 and potentially increased savings in subsequent years Utilities can earn approximately five percent of program costs for meeting or exceeding savings targets35
National Grid offers inclining block rates as the default residential rate but there is an optional TOU rate with peak and off-peak tiers also available to residential customers Small and large industrial and commercial customers can take service under flat rates inclining block rates or TOU rates
National Grid operates under a penalty and reward sys-tem for service quality established in Docket DTE 99-84 The impetus behind the DPUrsquos original establishment of the Service Quality Guidelines was to prevent Massachusetts utilities from allowing service quality to deteriorate under a new regulatory regime
Energy Efficiency OutcomesBefore Massachusetts Electric implemented revenue
regulation in 2009 it reported consistently high levels of incremental energy efficiency savings approximately 09 percent of retail load In 2010 the company reported 136 percent savings and 159 percent in 2010 and 2011 respectively36
ResourcesMassachusetts Department of Public UtilitiesDocket 09-39 Petition of Massachusetts Electric Company
(November 30 2009)
Decoupling Case Studies Revenue Regulation Implementation in Six States
20
37 Energy Agreement Among the State of Hawaii Division of Consumer Advocacy of the Department of Commerce amp Consumer Affairs and Hawaiian Electric Companies Available at httpwwwhecocomvcmcontentStaticFilespdfHCEIpdf
38 The HECO Companies described as follows in their Reply SOP in the Schedule A decoupling proceedings ldquothe
Hawaii Hawaiian Electric Company
Hawaiian Electric Company (HECO) uses a revenue regulation mechanism that compares actual revenue to target revenue in each year The target revenue is based on the authorized
revenue for the last test year adjusted for operation and maintenance (OampM) increases and rate base changes
HECO is a subsidiary of Hawaiian Electric Industries which also operates Maui Electric Company (MECO) and Hawaiian Electric Light Company these subsidiaries service the islands of Maui and Hawaii County while HECO serves Oahu (Honolulu)
Authority In 2008 the Governor of Hawaii the Division of Con-
sumer Advocacy and HECO entered into an agreement as a result of the Hawaii Clean Energy Initiative37 The agreement is intended to move Hawaii away from its dependence on imported fossil fuels for electricity and ground transporta-tion and toward locally produced renewable energy and energy efficiency In the agreement the State the Consumer Advocate and HECO committed to among other things a transition away from a model that encourages increased elec-tricity usage and to a model that implements revenue regula-tion decoupling to encourage the development of renewable energy by HECO The Commission opened Docket 2008-0274 in order to examine the features of a revenue regula-tion mechanism The Opening Order directed HECO and the Consumer Advocate to file a joint proposal on revenue regulation within 60 days This joint proposal was modeled closely after the California mechanism described earlier for PGampE with a rate-case determined revenue requirement plus annual attrition adjustments plus separate mechanisms
to recover power supply and energy efficiency costsThe Hawaii Public Utilities Commission approved
revenue regulation for HECO in August 2010 based on an investigation into the appropriateness of revenue regula-tion and its design The revenue regulation mechanism took effect on March 1 2011 This replaced a previous lost revenue adjustment mechanism
Authorized Revenue RequirementThe Commission establishes the Authorized Base Rev-
enues through a general rate case based on traditional cost-of-service ratemaking principles The Authorized Base Revenue is the annual amount of revenues required for the utility to recover its estimated OampM depreciation amorti-zation and tax expenses for the period
The Target Revenue is equal to the base revenue require-ment less any revenue being separately tracked or recov-ered through any other surcharge or tracking mechanism including revenue for fuel and purchased power expenses
The revenue regulation order also requires staggered triennial rate cases for each of the Hawaiian Electric Indus-tries Companies to determine approved baseline Revenue Adjustment Mechanism (RAM) inputs
Rate of ReturnThe Commission made no explicit adjustment to ROE
owing to the revenue regulation mechanism but noted that the allowed ROE of ten percent reflects the approval of revenue regulation and other cost-recovery mechanisms that will lower HECOrsquos business risk38 Most recently the Hawaiian Public Utilities Commission approved a 90-per-cent ROE for MECO reflecting both a lower baseline cost
Commission effectively reduced the Companiesrsquo return on common equity by 50 basis points to ldquofairly compensate ratepayersrdquo for what it perceived as the ldquorisk-reducingrdquo effects of the RBA and RAM mechanisms the Renewable Energy Infrastructure Program (lsquoREIPrdquo) Surcharge and the Purchased Power Adjustment Clause (ldquoPPACrdquo)rdquo Available at httpdmspuchawaiigovdmsDocumentViewerpid=A1001001A10L29B55326B47993
Decoupling Case Studies Revenue Regulation Implementation in Six States
21
39 Hawaii PUC Decision and Order No 31288 (2013 May 31) pp 97ndash112
40 Hawaii PUC Decision and Order No 31289 (2013 May 31)
41 Hawaii PUC Decision and Order No 31908 (2014 Feb 1)
42 February 7 2014 order on schedule A issues Available at httpdmspuchawaiigovdmsDocumentViewerpid=A1001001A14B10B22326F07922 p 42ndash47
of capital and a penalty of 050 percent associated with inadequate performance bringing renewable energy into the MECO system39 A companion Order also established new guidance on future revenue regulation mechanisms40
Revenue Adjustment MechanismThe RAM is designed to replace the need for annual rate
cases by adjusting Authorized Base Revenue levels to reflect estimated changes in the utilityrsquos cost of service The RAM is intended to via formula-driven estimates and escalators compensate the HECO Companies for changes in util-ity costs and infrastructure investment between rate cases and reduce the frequency of rate cases The RAM Period is the calendar year containing the Annual Evaluation Date (March 31 the date of the annual RAM filing) The RAM adjusts the revenue requirement according to changes in four main categories of expenses
bull Base expenses which are changes in designated OampM expenses
bull Rate base the return on incremental investment in designated rate base components41
bull The incremental depreciation and amortization expenses and
bull Exogenous tax changes changes in costs owing to significant changes in tax laws or tax regulations
Base expenses are segregated between labor and non-labor amounts The labor component is adjusted annually by the Labor Cost Escalation Rate reduced by the Labor Productiv-ity Offset (fixed at 076 percent) The non-labor component uses the Non-labor Escalation Rate to annually adjust those costs Tracked OampM expenses for fuel purchased power pension and post-employment benefits integrated resource planning DSM and other rate adjustment provisions are not adjusted in the RAM because any changes in these costs are accounted for in other cost-tracking mechanisms
The Rate Base equals the average net investment esti-mated for the RAM Period The average rate base is the rate base for the rate case test year with adjustments for changes in only four components of rate base (1) average plant-in-service (2) average Accumulated Depreciation (3) average accumulated contributions in aid of construc-tion and (4) average accumulated deferred income taxes All other components of the rate base remain the same as in the preceding rate case test year The average plant-in-service is equal to the average of the actual plant-in-service at the end of the year prior to the RAM period the Evalu-ation Year and the same year-end balance plus estimated plant additions for the RAM period Plant additions include
Baseline Capital Project plant additions and Major Capital Projects plant additions estimated to be in service by Sep-tember 30 of the RAM period
The RAM also includes an Earnings Sharing Revenue Credit mechanism in order to protect against excessive over-all utility revenue levels The RAM will escalate and update the Companyrsquos approved base revenue requirement reduced by earnings sharing credits and major project revenue credits to customers Based on the Companyrsquos achieved return on common equity for the Evaluation Year the mechanism cred-its the RBAs according to the following chart
ROE at or below the authorized ROE
First 100 basis points (1) over authorized ROE
Next 200 basis points (2) over authorized ROE
ROE exceeding 300 basis points (3) over
authorized ROE
Retained entirely by shareholders no customer credits
25 share credit to customers
50 share credit to customers
90 share credit to customers
Finally the RAM includes additional consumer protectionsbull A provision for Major Capital Projects Creditsbull A provision for Baseline Capital Projects Creditsbull Notification is provided to all affected customers of
the RAM filing in newspapers and billsbull Evaluation procedures for filing examination and any
exceptions to annual revenue regulation filingsbull Continued ability of HECO or the Consumer
Advocate to request formal rate proceedings to replace and terminate RAM at any time and
bull Formal review of revenue regulation as a part of the next round of rate case proceedings
A recent order42 added two additional consumer protections
bull A limitation that only 90 percent of the current
Decoupling Case Studies Revenue Regulation Implementation in Six States
22
43 ACEEE Hawaii Available at httpaceeeorgsectorstate-policyhawaii
RAM Period Rate Base that exceeds the Rate Base Adjustment Mechanism from the prior year can be included in the Decoupling Mechanism for baseline utility plant projects which unlike major capital projects are not subject to prior Commission review and approval and
bull A requirement to post a number of metrics online for customer review although not at this point tied to performance
This order also examined four issues with respect to the application of the RAM The Commission determined that the short-term debt rate as reflected in the most recent rate case should be used to adjust over- and under-collections The Commission also resolved its concern that without a sustainable business plan there exists no strategic frame-work under which to evaluate capital expenditure pro-grams The Commission required the parties in the Docket to further explore capital expenditure issues in conjunction with other risk-sharing mechanisms discussed elsewhere in the order The commission ordered a further evaluation of a proposed risk-sharing mechanism within the RBA Further-more the Commission ordered the parties to work together to establish appropriate metrics which the utility would report on its website
Once the total RAM Revenue Adjustment is calculated it is applied through a uniform adjustment to the per-kWh energy charge for all customer classes
Reconciling Actual Revenue with Authorized Revenue
RBAs record the monthly differences between target revenues and the adjusted recorded electric sales revenues The RBA also applies monthly interest equal to the annual rate for short-term debt from the cost of capital in each HECO Companyrsquos last base rate case to the simple average of the beginning and ending balances each month in the RBA In effect the RBA applies one-twelfth of the rate each month Finally the RBA provides for collection or return of the calendar year-end balances in the RBA and recovery of the RAM Revenue Adjustment over the subsequent May 1 through April 30 period The target revenue is the most recent Authorized Base Revenue or the re-determined Authorized Base Revenue calculated under the RAM
On or before March 28 the Company must file with the Commission a statement of the previous year-end balance in each RBA sub-account and the Authorized Base Revenue level for the current calendar year with supporting calculations An amortization of the year-end balance in the
RBA sub-accounts and the RAM Revenue Adjustment are recovered through the per-kWh RBA rate adjustments The rate adjustment occurs from May 1 of the current calendar year to April 30 of the next year
Complementary PoliciesCurrently electric utilities in Hawaii may use energy
efficiency to meet a portion of their Renewable Portfolio Standard requirements Starting in 2015 electricity savings from energy efficiency will be applied to the Statersquos Energy Efficiency Portfolio Standard which sets a target equivalent to 30-percent forecast sales by 2030 This goal is translated into a target of 14 percent annual savings HECO trans-ferred administration of all of its energy efficiency programs to a third party administrator in 2009 The administrator is compensated for satisfactory performance43
Because of its heavy dependence on petroleum as a generation fuel electricity prices in Hawaii are very high solar and wind are typically lower-cost resources for these systems HECOrsquos default residential rates are inclining block rates with a $900month customer charge and a three-block inclining rate design of $034kWh to $037kWh Residential customers can elect to take service under a TOU rate with off-peak mid-peak and priority-peak tiers Gen-eral service and large power service customers take service under a flat rate unless they opt to take service under a TOU
Hawaii is developing reliability standards in part as a response to deteriorating service quality as a result of distributed and customer-owned generation (see text box) In an effort to make electricity reliability and interconnection standards as transparent as possible the Reliability Standards Working Group was formed in the Feed-In Tariff docket and continues its work in Docket No 2011-0206 to find solutions to integrating high penetrations of renewable energy consistent with reliability and power quality standards
Energy Efficiency OutcomesHECO implemented revenue regulation in 2011 Since
2003 HECO has reported incremental energy efficiency savings between 0 and 05 percent of retail load with 131 percent savings reported in 2011 by Hawaii Energy the
Decoupling Case Studies Revenue Regulation Implementation in Six States
23
44 Hawaii PUC Decision and Order No 31288 Maui Electric Company Limited Docket No 2011-0092 (2013 May 31) Appendix C p 2
Statersquos ratepayer funded efficiency program administrator The company has not yet reported its savings for 201245 In addition HECO has seen more than a sixfold increase in renewable installations under its net metering and feed-in tariff policies since the inception of the revenue regulation plan
Revenue regulation represents a regulatory framework that removes the financial disincentive for utilities to pursue clean
energy strategies It doesnrsquot in and of itself align the utility business model with those utility policies and practices that address customer expectations In fact some commissions are concerned that it might create a dynamic in which the utility assured of its revenue needs becomes complacent and lacks motivation to innovate and develop strategies that may be more in line with the public interest
In a recent order (Docket 2011-0092 May 31 2013) the Hawaiian Public Utilities Commission addressed this big picture issue in a rate order for Maui Electric The Commission called out the management as lacking a long-term vision for creating customer value and expressed concern that ldquothe HECO Companiesrsquo over-reliance upon a link between the [Decoupling]
Agreement and utility financial health obfuscates utility performance and ultimately customer service and satisfactionrdquo44 The implementation of clean energy policies is not a singular goal but rather a policy that must be part of a larger effort to create customer value
The Commission laid out a hard path and a soft path to achieve the results they desire for consumers The hard path involves a closer examination of utility investments operations and expenditures The soft path is opened through the actions of management to create and execute a vision for the utility of the future The Commission remains committed to regulatory innovations that are in the public interest and will work with the utility consumer advocate and other stakeholders to create and implement this vision
The results of this effort will likely produce ideas and outcomes that will have applicability beyond this one utility
ResourcesHawaii Public Utilities CommissionDocket No 2008-0274 Final Decision and Order (August 31 2010)Docket No 2008-0083 Final Decision and Order (December 29 2010)Docket No 2011-0092 Final Decision and Order May 31 2013 including
Decision and Orders Nos 31288 and 31289Docket No 2013-0141 Final Decision and Order (February 1 2014) including
Decision and Order No 31908
45 EIA Form EIA-861 data files Available at httpwwweiagovelectricitydataeia861
Decoupling Case Studies Revenue Regulation Implementation in Six States
24
46 Lazar et al 2011
Discussion of the Six Utilities Overall
Authority The first step in implementing a revenue regulation
mechanism is to understand the authority of the regulating body the Public Utility Commission or PSC It is important for any Commission to clarify its justification for acting on revenue regulation in order to prevent any decisions from being overturned Over the years Utilities Commissions have relied on different justifications for implementing revenue regulation mechanisms Commissions have imple-mented revenue regulation at their own discretion justified by their directive to ensure safe reliable and economic public utility service to citizens to justify changing the regulatory environment In some cases the Commission is unable to engage on narrow issue ratemaking and rates can change only as the result of a full rate case In this case statutes must be amended to enable revenue regulation
In all of the case studies discussed here the Commis-sions first implemented revenue regulation at their own dis-cretion but each followed slightly different paths to do so The CPUC first implemented revenue regulation in 1978 at its discretion In 2001 after a period when mechanisms were suspended the California Legislature required that deviations from projected sales not result in under- or over-collections by utilities and so the CPUC re-implemented revenue regulation according to statutory requirement The Hawaii Public Utilities Commission implemented rev-enue regulation after an agreement between the utility the Governor and other stakeholders called for it In Idaho the Commission established a case in which to investigate rev-enue regulation and held a series of stakeholder workshops before implementing the policy The Massachusetts DPU adopted revenue regulation as a statewide regulatory policy and required individual utilities to file tariffs in response as the result of its general investigation into rate structures that promote demand-side resources The Maryland Com-mission implemented revenue regulation for BGE when the utility requested the mechanism Thus the impetus to develop a revenue regulation mechanism may come from different sources and the Commission may be comfortable
in moving forward under their general supervisory statutes Nevertheless specific statutory language can be helpful to shore up the existing authority
Authorized Revenue Requirement Under the traditional regulatory framework the Com-
mission (or other authority in the case of publicly owned utilities) must determine a utilityrsquos revenue requirement This function does not change under revenue regulation The revenue requirement of a utility is the aggregate of all the operating and other costs incurred to provide service to the public This typically includes operating expenses depreciation and the cost of capital invested including in-terest on debt and a ldquofairrdquo return on equity to investors The (simplistic) formula for determining revenue requirements is as follows
Revenue Requirements = (Rate Base times Rate of Return) + Operating Expenses + Depreciation +Taxes
Traditionally the revenue requirement along with sales is used to determine the rates consumers will pay for elec-tricity46 The rates are also broken down by customer class and intraclass tariffs are created based usually on a cost of service study that determines each customer class and subclass contribution to the utilityrsquos costs The (simplistic) formula for determining the rate per unit is
Rate = Revenue Requirement divide Units Sold
In this way rates are set to allow the utility to exactly recover its revenue requirement when the sales level used to calculate rates is equal to actual sales However it is important to recognize that actual expense and revenue varies with actual sales When actual sales are greater than the sales level used in ratemaking revenue increases and expenses increase by a different amount when actual sales are lower than the ratemaking sales level actual revenue
Decoupling Case Studies Revenue Regulation Implementation in Six States
25
declines and expenses decrease by a different amount Under revenue regulation rates are initially set in the same way but when actual sales differ from the level used to calculate rates the actual revenue level is maintained at the rate case amount as rates are allowed to vary inversely with salesmdashincreased sales lead to decreased rates and vice versa Because the primary expenses that change in the short run as sales levels change are power supply expenses and most regulators allow these to be tracked using a power cost adjustment mechanism revenue regulation mechanisms are generally designed to ensure recovery of the non-power costs (which do not change significantly in the short-run) as sales volumes change
Revenue regulation ensures that actual revenue is equal to the revenue requirement established by the Commission or appropriate authority Although the description above presents an overly simplified view of the revenue require-ment and its use in traditional price regulation and revenue regulation there are many variations on how a Commis-sion can establish a revenue requirement particularly when implementing revenue regulation With revenue regulation as in traditional ratemaking imprudent costs can always be removed from rates and there is no change to the ability of a Commission to impose penalties
Utility Functions to be IncludedFirst the regulator must determine which utility func-
tions will be included in the revenue regulation framework With vertically integrated utilities this usually includes a utilityrsquos regulated generation transmission and distribution units As we discuss below however it is critical to struc-ture power supply recovery mechanisms to avoid providing for double-recovery of certain power supply costs For utili-ties operating in areas of the country that have restructured electricity markets only the regulated distribution busi-ness is decoupled Utilities that also provide gas services
Pacific Gas amp Electric Future test year
Idaho Power Company Historic test year
Baltimore Gas amp Electric Hybrid test year
Wisconsin Public Service Corporation Future test year
National Grid Historic test year
Hawaiian Electric Company Future test year
Table 2
Test Year Used
may have their gas distribution business operating under revenue regulation as well
Test YearOne consideration in establishing the revenue require-
ment is what period of time will be used as a ldquotest periodrdquo or ldquotest yearrdquo The test year is the year on which the Com-mission will base its computations of the utilityrsquos total costs and sales levels A historic test year uses actual data on sales and costs from a past year Whereas a historic test year allows for the use of actual cost data it cannot account for expected variations in sales A future test year requires assumptions to be made about a utilityrsquos sales in a future year This can allow expected changes in sales like those from energy efficiency programs to be included in sales
projections however because regulators are relying on estimates provided by the utility there may be a greater risk for inaccuracy A Commission may also choose to use a test year that includes both past and future periods This may provide a sense of balance between historic and future data Furthermore as the case proceeds the Commission can require the utility to substitute historical data for projected data from the test year
Rate of ReturnAs in any rate case regulators
must determine the appropriate rate of return that a utility can earn on its investments including the cost of debt and the allowed ROE for its shareholders The approved ROE is only used to establish the return on investments that are included in the rate base when determining revenue require-
Pacific Gas amp Electric Electric generation and distribution gas distribution
Idaho Power Company Electric generation and distribution
Baltimore Gas amp Electric Electric distribution gas distribution
Wisconsin Public Service Corporation Electric generation and distribution
National Grid Electric distribution
Hawaiian Electric Company Electric generation and distribution
Table 1
Business Unit Included in the Revenue Regulation Model
Decoupling Case Studies Revenue Regulation Implementation in Six States
26
47 In a rate case the Commission determines an allowed return on equity This is used to set a price (price regulation) or an allowed revenue requirement (revenue regulation) Once set however the actual return earned by the utility is affected by anything that changes either revenue or expenses for example an increase in employee compensation a change in the number of employees or under price regulation a change in sales volumes
48 Lazar et al 2011
ments Although revenue regulation ensures that a utility recovers no more or less than its target revenue revenue regulation does not guarantee that the utility will earn the authorized ROE Depending on how a utility manages its costs between rate cases it will realize an actual ROE either higher (in the case of reduced costs) or lower (in the case of increased costs) than the authorized level47
A utilityrsquos allowed ROE generally represents the return deemed necessary to attract investment considering the level of risk of that investment Riskier investments require a higher return to attract investors and vice versa Util-ity earnings can be volatile because of short-run impacts on sales volumes and revenues which include changes in sales owing to weather economic conditions and energy efficiency and DG programs This volatility typically causes utilities to retain a higher level of equity in their capital structures so that reduced revenues do not leave them un-able to service their debt Revenue regulation can reduce this volatility by stabilizing revenues regardless of the cause Because of this reduced risk many stakeholders have proposed that the implementation of a revenue regulation mechanism be associated with a corresponding reduction in the utilityrsquos equity capital ratio (the percentage of capital supplied by common equity) This reflects the utilityrsquos more stable revenue owing to revenue regulation and reduces the overall revenue requirement that will be recovered from consumers48
An alternative option to reducing the utilityrsquos equity ratio is to reduce the ROE reflecting a lower risk level For the utilities included in these case studies only BGE and Mass Electric experienced a reduction in their ROE The Com-mission did not reduce BGErsquos ROE at the time the revenue regulation mechanism was implemented but reduced it by 50 basis points during the subsequent rate case The Mas-
sachusetts Commission did not reveal its adjustment but incorporated a lowered ROE into its decision
Absent an explicit adjustment to the cost of capital investorsrsquo expectations will adjust to the presence of rev-enue regulation if its presence is reliable The more stable earnings will likely in time contribute to a higher credit rating That in turn will lead to lower cost debt that will be revealed in future cost of capital calculations An adjust-ment to the ROE or capital structure by the regulator in a rate proceeding will be reflected immediately in lower rates to consumers simply allowing the utilityrsquos credit rating to improve over time and its cost of debt to decline will have the same effect but on a lagged basis as new bonds are is-sued at lower interest rates49
Beginning in 2004 Standard and Poorrsquos began publish-ing ldquorisk profilesrdquo for utilities which classified utilities based on their earnings variability and other risks those with more stable earnings were determined eligible for higher bond ratings at any given equity capitalization ratio (or alternatively able to retain a given bond rating with a lower equity ratio)50 One utility with a revenue regulation mechanism Northwest Natural Gas was believed to have had their business risk profile upgraded by one step in response to the benefits of the mechanism51
Effect on Bond RatingsRevenue regulation stabilizes a utilityrsquos revenue streams
reducing risk to investors this reduced risk may be a contributing factor in an increase in a utilityrsquos bond rating Bond rating agencies have recognized that revenue regula-tion mechanisms and other mechanisms that reduce net earnings volatility and risk contribute to a lower cost of capital for the utility52 Standard and Poorrsquos has explicitly stated that it ldquoviews decoupling as a positive develop-
49 Lazar et al 2011
50 Standard and Poorrsquos (2004 June 2) New Business Profile Scores Assigned for US Utility and Power Companies Financial Guidelines Revised
51 Christensen Associates (2005 March) A review of distribution margin normalization as approved by the Oregon Public Utility Commission for Northwest Natural
52 Lazar et al 2011
Decoupling Case Studies Revenue Regulation Implementation in Six States
27
This topic raises a note of caution if mechanisms are not well designed double-recovery of costs can occur for verti-cally integrated utilities that provide both power supply and distribution services For example if a per-customer
revenue regulation mechanism includes investment-related power supply costs in the revenue-per-customer formula but excludes fuel and purchased power costs that are recovered through a separate tracking mechanism double recovery of some power supply costs is likely If the utility experiences cus-tomer and sales growth the amount it recovers for investment-related power supply costs will go up However if that utility serves this growth by operat-
ing existing power plants more by selling less power on the surplus market or by purchasing power from other suppli-ers it will not incur any increases in the type of power sup-
53 Standard amp Poorrsquos (2008 February 19) Decoupling the vehicle for energy conservation
ment from a credit perspectiverdquo53 However in the case of the utilities examined in this report none experienced an improved credit rating after the implementation of revenue regulation with the exception of PGampE However PGampE came out of Chapter 11 bankruptcy in the same year that its revenue regulation mechanism was implemented mak-ing it impossible to attribute the improvement to revenue regulation alone Bond rating changes are generally slow to evolve Numerous other factors are taken into account when assigning an overall credit rating which appear to have outweighed any positive effect of revenue regulation These factors certainly include the recession of the US economy that began in 2007
Customer Classes IncludedWhen determining the target revenue for a utility rev-
enue regulation mechanism regulators must also consider which customer classes to include in the mechanism In some cases industrial customers have objected to a rev-enue regulation mechanism This is due to the wide dif-ference in rates among customers making the design of a revenue regulation mechanism more challenging If regula-tors choose to exclude a class of customers from revenue regulation they must determine the revenue requirement associated with serving only the included customer classes This generally requires a detailed cost of service study to ensure that revenue responsibility is accurately allocated by customer class
Included CostsFinally regulators may wish to exclude specific costs
from the overall revenue requirement if those costs will be tracked through another mechanism like fuel costs in a PCA mechanism energy efficiency program expenditures or smart grid costs for example Separate tracking mecha-nisms can also be used for those costs that are difficult to
Pacific Gas amp Electric All customer classes
Idaho Power Company Residential and small general service
Baltimore Gas amp Electric Residential and small general service
Wisconsin Public Service Corporation All customer classes
National Grid All customer classes
Hawaiian Electric Company All customer classes
Pacific Gas amp Electric
Idaho Power Company
Baltimore Gas amp Electric
Wisconsin Public Service Corporation
National Grid
Hawaiian Electric Company
Table 3
Customer Classes Included in Revenue Regulation Mechanism
Table 4
Costs Excluded From Revenue Regulation Mechanism
project based on historical data or costs over which the util-ity has very little control like fuel costs Although revenue regulation tracks collected revenue mechanisms like Fuel Adjustment Clauses Purchased Power Adjustments and Energy Efficiency Riders can be designed to track actual costs as well as collected revenue
Energy procurement costs
All variable costs
Energy supply costs
Energy costs
Energy supply costs for basic service customers transmission costs the energy efficiency system benefits charge and reconciling charge and costs recovered through the residential assistance adjustment factor
Fuel and purchased power
Decoupling Case Studies Revenue Regulation Implementation in Six States
28
54 We use the RAM term applied in Hawaii here to address any type of attrition or similar mechanism other than a revenue-per-customer framework that changes the allowed revenue between general rate cases
ply costs accounted for in the revenue per customer (RPC) calculation The increased power supply costs to serve that growth will be recovered through the fuel and purchased power tracking mechanism The net effect for the utility will be to recover incremental power supply costs twicemdashonce in the per-customer mechanism and again in the fuel and purchased power mechanism It is essential to make sure that the other adjustment mechanisms do not overlap the cost impacts that are treated in the revenue regulation mechanism One way to do this is to ensure that all power supply costs (investment labor fuel purchased power) are recovered through a single mechanism There are several ways to achieve this
a) A comprehensive power supply recovery mechanism that includes all power supply costs that is separate from the costs treated in the revenue regulation adjustment (eg Puget Sound Energy Washington State)
b) No power supply adjustment whatsoever with all utility costs included in an RPC mechanism (eg National Grid)
c) An annual attrition calculation with all costs reviewed for changes since the last proceeding (eg HECO)
Revenue Adjustment Mechanism in Revenue Regulation
A RAM54 is not necessary to achieve revenue regulation but provides attrition reliefmdashincreasing authorized revenue commensurate with increased costsmdashbetween rate cases Whereas revenue regulation sets a target revenue that the utility will earn regardless of sales levels the RAM adjusts the target revenue between rate cases Regulators may choose to take several different approaches to RAM
bull No RAM Regulators may choose not to implement a RAM leaving the revenue requirement unchanged between rate cases This requires the utility to request a rate case when it requires additional revenue to cover its costs
bull Stairstep Stairstep adjustments provide predetermined increases in target revenue These increases can be determined during a rate case and generally reflect forecasts of cost growth
bull Indexing Indexing ties adjustments to the target revenue to multiple factors like inflation productivity customer growth and changes in capital expenditures
bull RPC The RPC approach is a form of indexing RPC adjusts the total revenue requirement for the
number of customers served Regulators using an RPC mechanism will determine the revenue requirement per customer and the overall revenue requirement will be determined by multiplying the total number of customers by the revenue requirement per customer The amount of revenue required to serve each customer can be determined separately for customer classes and for existing and new customers This way the RPC method accounts for a utilityrsquos growth in fixed costs that is related to growth in the number of customers served RPC is useful where the correlation between cost growth and customer growth is significant It also protects customers from making up the deficit if there is a loss in customer load such as if a large business closes down or relocates
bull Hybrid Hybrid RAMs generally use stairstep increases to account for projected capital costs and indexing to account for OampM expenses
Adjustments from any type of RAM can be implemented automatically or through an attrition proceeding Some stakeholders oppose adjustments to the revenue require-ment outside of a rate case on the basis that this could allow the revenue requirement to increase significantly without examination of the impact on ratepayers or with-out due consideration of other costs and revenues For this reason some regulators choose to cap the total adjustment that can be made to the revenue requirement outside of a rate case
Table 5
Type of Revenue Adjustment Mechanism
Pacific Gas amp Electric
Idaho Power Company
Baltimore Gas amp Electric
Wisconsin Public Service Corporation
National Grid
Hawaiian Electric Company
Hybrid
RPC
RPC
RPC
No RAM potential capital expenditure adjustment
Hybrid
Decoupling Case Studies Revenue Regulation Implementation in Six States
29
55 Because this method results in changes in the price for service that are calculated after that service has been provided it fails the ldquono retroactive ratemakingrdquo statutes that guide most electricity regulators Customers are entitled to know the price of the commodity they are consuming at the time they use it
56 The closest to a current method in use for electric utilities in the BGE system of monthly reconciliation
Table 6
Tracking and Accrual of Difference BetweenActual and Authorized Revenue
Pacific Gas amp Electric
Idaho Power Company
Baltimore Gas amp Electric
Wisconsin Public Service Corporation
National Grid
Hawaiian Electric Company
Track Difference
Monthly
Monthly
Monthly
Yearly
Yearly
Monthly
Accrual Period
Year
Year
Month
Year
Year
Year
Calculation of Actual RevenueRegulators have options when ensuring that actual
revenue equals target revenue under revenue regulation First regulators must decide how to determine ldquoactual revenuerdquo In most cases actual revenue simply equals the amount of revenue a utility collects from its customers The Idaho Public Utilities Commission however has chosen to use weather-normalized revenues as the basis for utility revenues in revenue regulation Although this prevents the utility from recovering revenue lost to it owing to milder than expected weather it further complicates the revenue regulation mechanism and reduces its risk-reduction ben-efits By the same token if weather is severe and increases sales above the revenue requirements weather normaliza-tion would allow the utility to retain some of the revenues
Next regulators must determine whether to implement revenue regulation using a current or accrual method
bull Current Method With the current method of revenue regulation the target revenue for a period say a month is divided by the actual sales in that period to determine the rate per kWh The current method ensures that actual revenue equals target revenue by calculating the rate at the end of the period so that the target revenue can be recovered The current method allows for no lag in revenue recovery One effect of this method is that although customer rates vary total bills are generally more stable For example in a hotter than expected July customers will purchase more kWh but they will be charged a lower rate A milder than average winter would lead to fewer sales but at slightly increased rates This way customers do not experience the same bill variability as they would if rates were set before the sales deviations occurred On the other hand the current method does not provide customers with the ability to plan ahead based on a predictable rate for electricity This method has been used for revenue regulation of natural gas utilities55
bull Accrual Method Under the accrual method rates are set based on an assumed sales level and the differences between actual and target revenue are allowed to accrue over some period Then the total difference between actual and target revenue is reconciled through an adjustment to rates in the subsequent period this is known as the true-up process Presently all revenue regulation mechanisms for electric utilities use the accrual method56
If regulators use the accrual method of revenue
regulation they will next need to determine the period over which the difference between actual and target revenue will be allowed to accrue One year is typical however shorter periods are also used Next the frequency of comparing collected revenue to target revenue should be determined It is possible to do this comparison only once at the end of the accrual period It is common however for comparisons to occur more frequently often monthly When revenues are compared within the accrual period the differences are tracked generally for the purpose of applying interest to the difference that will be deferred until the end of the accrual period
Rate AdjustmentsIn designing a revenue regulation mechanism there are a
number of decision points that regulators need to consider to balance the interests of all the stakeholders One of the decision points revolves around the determination of the mechanism used to adjust rates The issues that regulators need to consider include the following1 Rate Case Requirements One of the often-mentioned
concerns about surcharges especially when they are numerous is how that will impact the frequency of rate cases For regulators and stakeholders rate cases provide
Decoupling Case Studies Revenue Regulation Implementation in Six States
30
the best mechanism to correctly align rates and costs but they are time-consuming and expensive for all parties This is because a rate case presents an opportunity to closely examine all of the utilityrsquos expenses and adjust rates to reflect cost increases and decreases Because under a revenue regulation mechanism the goal is to match revenues received from all customers with revenue requirements a correct determination of revenue requirements is important as is the specification of appropriate cost indices to adjust the revenue requirements As the time between rate cases increases some regulators feel the base rate case data even with adjustments need to be reexamined As a result some regulators have chosen to mandate the frequency of rate cases to address this whereas others have not It may be that in some cases where there are numerous surcharges recovering a multitude of costs there may not be as many costs subject to review in the rate case making it less significant to a regulator than a case in which most costs are being analyzed and recovered in the rate case itself
2 Collection Mechanism Integrally tied to the mechanism for recovering revenues is how the utility will collect or refund the revenues Options that are available include recovery through a rate case or periodic adjustments to rates through a surcharge mechanism As can be seen by the case studies depending on the plan in place some utilities have very discreet requirements dictating the frequency of rate cases with adjustments occurring in those cases or between those cases Other utilities have no requirements upon them with respect to the frequency of rate case filings This will be discussed in more detail below What does emerge from these case studies is that the discreet components or choices in how to execute a revenue regulation plan are carefully interwoven to create a holistic approach Each component works with the other and the value of this case study is in examining the different pathways that can be chosen As discussed previously some of the commissions have authorized revenue regulation to recover the revenue requirements in the last rate case whereas others have authorized adjustments to rates between rate cases this impacts the pathway that the adjustment mechanism takes
3 Timing How often should rates be adjusted to true up to the utilityrsquos revenue requirement States have chosen different options ranging from monthly to annually
4 Allocation of Revenue Regulation Revenue Surpluses or Deficits There are a number of decision points regarding allocation Should the revenue regulation apply to all rate classes or just the smaller customers whose usage per customer and load variations are not as dramatic as those of larger-use customer classes Should there be a different allocation to each rate class or should the allocation of costs among the classes be the same Different mechanisms accomplish different goals Some states have allocated revenue regulation revenues based on the revenues lost by customer class as a result of energy efficiency This can sometimes be a political decision to mitigate opposition to energy efficiency programs by large customers Other states recognize that the system savings resulting from energy efficiency benefit all customers so that all customers should pay equally
5 Carrying Charges Depending on the timing issue discussed previously regulators may want to consider carrying charges on any adjustments This should be symmetrical in its application however so that it applies to surcharges and refunds Consideration should be given for the basis of the carrying charge rate whether weighted average cost of capital rate of return a risk-free rate or some other mechanism should be adopted
6 Rate Caps In order to mitigate potential rate impacts a regulator may want to consider a cap on how much rates can go up when the revenue regulation adjustment is made This might be more critical if the regulator is aware of other potential rate increases that will impact customersrsquo bills If a cap is used the case in which the utilityrsquos adjustment would exceed the cap must be considered Some regulators have opted to allow the utility to carry over the excess unrecovered amount for a period of years whereas others do not This allows the utility to recover those revenues in a subsequent year when perhaps the adjustment is less As a practical matter however adjustments of greater than three percent are less common as shall be discussed later
7 Impact on At-Risk Consumers Low-income and consumer advocates have expressed concern about revenue regulation as a vehicle for annual rate increases without the scrutiny of a general rate case creating rate increases for the low-use customers doing the most to constrain usage and help achieve targeted energy savings One proposal to address this has been to impose any resulting surcharges only to above-average usage
Decoupling Case Studies Revenue Regulation Implementation in Six States
31
57 Cavanagh and Howat (2012 May 2) Finding common ground between consumer and environmental advocates Electricity Policy
58 The most common criticism of future test years is that utilities forecast costs under an assumption that all authorized personnel positions will be filled while in retrospect any large organization has some level of vacancy in its employee count A historic test year captures this effect fully
customers and any resulting credits only to below-average usage57
Rate Case RequirementRequirements as to the frequency of rate cases can be
tied to the recovery mechanism or to the entire regulatory framework for implementing revenue regulation In the cases studied two of the utilities require periodic rate cases PGampE every three years and WPS every year Two others National Grid and HECO require annual mini rate cases explained later in which adjustments are made and two others IPC and BGE have no requirements for scheduled rate cases Nevertheless if the concern is to ensure that the utilityrsquos revenue recovery meets its revenue requirements some kind of periodic rate case to examine costs is appropriate Having periodic rate cases can provide a measure of assurance to consumer advocates that the level at which the revenues and hence the rates are set is correct One of the criticisms of revenue regulation is in fact the lack of rate cases to produce a proper level of confidence in the allowed amounts Multiple surcharges are usually additive to existing rates therefore not permitting an opportunity to reduce the base rate for reductions in cost Moreover the infrequency in cases impedes the examination of rate allocations as would occur through a cost of service study
This is a particular issue where utilities are augmenting power supply with purchased power from independent power producers which is the most common method for acquiring wind and solar production today The increased cost for purchased power may flow through a fuel and purchased power adjustment mechanism while the (depreciating) investment in conventional power plants remains static in base rates
Both PGampE and WPS use a future test year that allows the utility to project revenue requirements during the time period that the rates are to be in effect The benefit to this is that it can help identify and account for projected changes in costs over the timeframe between rate cases However given that these costs are utility projections most consumer advocates have less confidence in these numbers than they would using actual numbers from a historical or only hybrid test year58 When trying to garner support for revenue regulation from more skeptical stakeholders using a future test year may not be helpful Furthermore in the case of WPS that has annual rate cases using a future test year becomes less justifiable as revenues are recalculated annually anyway
The absence of a rate case requirement can also cause consternation among detractors of revenue regulation because of the belief that the utility will be guaranteed its revenue requirements for as long as it is satisfied with that level irrespective of how well it manages However this is no different from the status quo in traditional regulation in most places The incentive to manage well is always there with or without revenue regulation as it translates into more profit for the utility
In the cases of HECO and National Grid the mini rate cases serve two purposes In the one instance it serves as a means to reconcile revenue recovery with revenue requirements and in the second instance it provides an opportunity to adjust rates in accordance with changes in costs Specifically for National Grid the revenue requirement is adjusted to reflect capital expenditures For HECO revenues are adjusted to reflect changes in the cost of service In the two examples here revenue regulation is wrapped in with other adjustments as part of a mini adjustment Given the structure for determining revenue requirements which accounts for changes in costs including revenue regulation within the mini rate cases is a workable option
These examples highlight how rate cases can be used to adjust revenue requirements either in a more controlled regulatory environment with frequent rate cases or left to the utilityrsquos discretion to decide when to adjust costs A set schedule of periodic rate cases such as that used by PGampE may strike an appropriate balance for reviewing revenue requirements however with the modification of a partial historical partial forecasted test year Frequent rate cases can depending on the resources of the regulator and stakeholders be too costly and time-intensive When there are too many rate cases stakeholders and regulators may not be able to dedicate the level of resources needed for any one proceeding and may be spread too thin Regular known rate cases at reasonable intervals may strike the best balance of adequate review and adjustment of revenue requirements
Decoupling Case Studies Revenue Regulation Implementation in Six States
32
Collection Mechanism and TimingThe collection mechanism for the differential between
actual and authorized revenue requirements varies by util-ity as well Both PGampE and WPS do not have adjustment clauses or surcharges but instead have structured their revenue regulation plans to recover their costs in a rate case with rates adjusted annually Although PGampE has rate cases every three years the utility files its preliminary forecast every September 1 for the following year including adjust-ments for revenue regulation and other costs This practice promotes transparency keeping all stakeholders aware of the current situation of the utility IPC BGE National Grid and HECO use surcharges on customer bills to collect or credit the difference between actual revenues collected and the revenue requirement Although the other three (IPC National Grid and HECO) calculate the rate adjustment annually only BGE does a more contemporaneous adjust-ment of one month Certainly where there are no regularly scheduled rate cases using an adjustment mechanism becomes more critical PGampE has created a tracking mecha-nism known as a balancing account that allows the utility to track the surpluses and deficits to help ensure accuracy at year end when rates are actually adjusted The creation of such monthly balancing accounts will make it easier at the end of the year to track what happened each month and then determine the adjustment for that year It provides a more detailed trail for review and analysis by stakeholders and regulators However other mechanisms that just look at total revenues as compared to revenue requirements at the end of the year can work as well
Table 7
Rate Case Requirements
Table 8
Rate Adjustments
Table 9
Allocation of Surplus or Deficit
Pacific Gas amp Electric
Idaho Power Company
Baltimore Gas amp Electric
Wisconsin Public Service Corporation
National Grid
Hawaiian Electric Company
Pacific Gas amp Electric
Idaho Power Company
Baltimore Gas amp Electric
Wisconsin Public Service Corporation
National Grid
Hawaiian Electric Company
Pacific Gas amp Electric
Idaho Power Company
Baltimore Gas amp Electric
Wisconsin Public Service Corporation
National Grid
Hawaiian Electric Company
Every three years annual ldquoattritionrdquo adjustments in between
No requirement
No requirement
Annual rate case
Annual capital expenditure adjustment case
Abbreviated annual rate case
Base rates adjusted annually
Annual adjustment through surcharge
Monthly adjustment through surcharge
Annual adjustment through rate case
Annual adjustment
Annual adjustment
Allocated to all customers according to business unit (eg electric distribution electric generation)
Included in the annual adjustment mechanism for each customer class
Separate for each customer class
Allocated to all customers except certain tariffs (see above)
Separate for each customer class
Separate for residential and commercialindustrial
Allocation of Revenue Regulation Revenue Surpluses or Deficits
The allocation of revenue regulation revenue surpluses or deficits should be symmetrical so that overpayments are credited to customers just as underpayments are paid by those same customers The six utilities studied fol-low that formula The application of revenue regulation however varies from utility to utility BGE and IPC ap-ply revenue regulation to the residential and commercial classes thereby excluding industrial customers In contrast however PGampE WPS National Grid and HECO allocate revenue regulation adjustments to all customer classes In terms of how the costs are allocated IPC BGE WPS National Grid and HECO allocate costs differently among the customer classes PGampE however allocates costs uni-formly among the customers Because PGampE has separated its business units it also separately calculates and allocates
Decoupling Case Studies Revenue Regulation Implementation in Six States
33
Table 10
Carrying Charges
Table 11
Cap on Rate Adjustment
Pacific Gas amp Electric
Idaho Power Company
Baltimore Gas amp Electric
Wisconsin Public Service Corporation
National Grid
Hawaiian Electric CompanyPacific Gas amp Electric
Idaho Power Company
Baltimore Gas amp Electric
Wisconsin Public Service Corporation
National Grid
Hawaiian Electric Company
None
Yes
None
Yes at the short-term debt rate
Yes at the customer deposit rate
Yes at the customer deposit rateNo
3 rate cap excess carried over to next period
10 rate cap excess carried over to next period
Cap of $14 million per year
$170 million in CapEx
No
revenue regulation surpluses and deficits among its electric distribution gas distribution and electric generation busi-nesses This illustrates that there are several ways to address revenues from revenue regulation depending on the policy outcomes that are desired
Carrying ChargesCarrying charges applied to uncollected or surplus rev-
enues can be used to account for the time value of money and the lost opportunity or value to having those revenues in hand PGampE and BGE do not accrue carrying charges On the other hand IPC WPS National Grid and HECO do For BGE given that the revenue regulation revenues are reconciled and recovered monthly it would make little sense to include a carrying cost Where carrying costs have been used they have included in the cases of these utili-ties the short-term debt rate or the customer deposit rate which for one utility is six percent and probably close to the short-term debt rate Thus the carrying charge rates are appropriately at the lower end of the spectrum reflecting their short-term nature In the application of the carrying charge symmetry should be preserved by applying it to both deficits and surpluses Application of carrying charges given the short period that costs are carried (one year) is somewhat discretionary Although it does more accurately account for costs it does add a modest level of complica-tion in tracking costs
Rate Caps and CollarsOne of the ways to protect customers in the event of sig-
nificant adjustments is to impose a rate cap (or collar) that limits the amount of a rate increase (and decrease) Some customers are sensitive to changes in foundational costs like utility bills and if costs are going to rise they benefit from a pattern of steady modest increases rather than a large step increase Any structural increases in rates attributable
to reductions in sales or increases in costs recognized by the revenue regulation plan would be eventually included in rates under any system A cap reflects a controlled way to manage customer expectations and customer impacts Structural changes can only be managed for a while until a complete rate case is needed to reset all assumptions
Typically when a rate cap is imposed if the formulaic increase exceeds the cap or collar the utility will be able to carry over any uncollected revenues until the next rate adjustment Two of the utilities studied PGampE and HECO do not have rate caps On the other hand the other four utilities do include rate caps in varying amounts National Grid has a one-percent revenue cap whereas IPC and BGE have a one-percent and a ten-percent rate cap respectively WPS unlike the others has a cap tied to the dollar amount of $14 million as opposed to a percentage Consistent with the goals of revenue regulation all of the utilities studied have a carryover provision that is important for reducing the risk that the utility will not recover its revenue require-ments
Note that National Grid differs from BGE and HECO in that its cap is on revenues whereas the other two utilities cap rates and rate impacts A revenue cap is more focused on ensuring minimal change to the revenue requirements authorized by the commission National Grid as discussed previously allows for mini rate cases to adjust the rev-enue requirements Having the one-percent cap limits the amount of increase that can occur through that process requiring revenue changes that are greater to occur in a full rate case However note also that some of the adjustments allowed in the mini rate case have their own separate cap The IPC rate cap is in line with what many other utilities with caps have in place which generally range from one to three percent The ten-percent rate cap in the BGE plan is
Decoupling Case Studies Revenue Regulation Implementation in Six States
34
59 Morgan P (2012 December) Graceful Systems LLC A decade of decoupling for US energy utilities rate impacts designs and observa-tions p5
reflective of its monthly adjustment pattern An annual ad-justment allows more time to smooth out peaks and valleys in revenues whereas a monthly adjustment will be influ-enced by more of the spikes (particularly weather-driven variation) thus the need for a larger bandwidth for the car-ryover Like a variable energy rate or fuel adjustment clause that fluctuates monthly the monthly adjustment introduces more volatility into the rates
Actual Historical AdjustmentsFor many ratepayer advocates there is a concern that
some of the utility management risk will be transferred to customers as a consequence of a policy that seeks to ensure that the utility will be made whole However the utility re-tains management risk and the requirement to demonstrate that it has acted prudently Thus the utility still has just as much of an incentive to operate efficiently as it did without revenue regulation If the utility can lower its costs it can still increase its profits Second by designing rates symmet-rically such that under- and over-recoveries are reconciled it provides customers with an opportunity to obtain credits that under traditional regulation would be retained by the utility It has often been opined that when there are large
gaps in time between utility rate cases it is because the utility is over-earning and exceeding its revenue require-ments In those instances customers never get to examine what the utility is collecting much less receive a refund Under revenue regulation with its periodic adjustments and scheduled general rate cases the revenue requirements are examined and refunds or credits allocated such that customers have a better knowledge base for understanding the utilityrsquos earnings And annual reconciliation of the util-ityrsquos actual revenues versus authorized revenues provides consumers with a tool to reign in excess revenue recovery beyond authorized amounts Third the adjustments that do occur under revenue regulation are manageable and frequently less than the adjustments customers are used to seeing on their bills for fuel or variable generation rates or for the myriad of other surcharges that can be tacked on to a customerrsquos bill such as an infrastructure (smart grid) sur-charge maintenance upgrade fee regulatory asset charge or system benefit charge
As seen in Figure 1 the range of rate impacts cluster around plus or minus two percent but can at times exceed plus or minus five percent The total of surcharges has somewhat exceeded the total of credits
Figure 1
Total Utility Decoupling Adjustment Rate Impacts59
300
250
200
150
100
50
0
Nu
mber
of
Dec
oup
lin
g A
dju
stm
ents
Over -5 -4 to -5 -3 to -4 -2 to -3 -1 to -2 0 to -1 0 to 1 1 to 2 2 to 3 3 to 4 4 to 5 Over 5
Percentage Rate Impacts
SurchargesRefunds
ResidentialAll
Other
Commercial
Total
Decoupling Case Studies Revenue Regulation Implementation in Six States
35
60 Id p 3
61 Schultz T Energy Efficiency at Idaho Power Available at httpwwwenergyidahogovenergyalliancedida_powerpdf
As can be seen with the utilities studied above the larger fluctuations are attributable to adjustment mechanisms that are reconciled more frequently such as monthly as those are less able to smooth out anomalies as an annual adjust-ment would do From a dollar perspective for the roughly 64 percent of adjustments that fall within the plus or minus two-percent range the monthly bill impact is approxi-mately $230 for average electric customers and $140 for average gas customers60
Of the six utilities studied the fluctuations in adjustment have for the most part stayed within the one- to three-per-cent range as shown below
bull PGampE from 2005 to 2012 has had annual revenue regulation adjustments ranging from minus143 percent to 415 percent with an average adjustment of 197 percent
bull For IPC the adjustments are separated between residential and commercial customers For residential customers the annual adjustments from 2007 through 2011 ranged from 077 percent to 258 percent for an average of 162 percent As for the commercial customers the annual adjustments for that same period were higher ranging from 104 percent to 424 percent with an average adjustment of 252 percent
bull BGE has monthly adjustments that ranged from minus1853 percent to 3013 percent with an average of 057 percent for residential customers from March 2008 through August 2012 For General Service Customers the monthly adjustment ranged from minus2264 percent to 2462 percent The average adjustment was 1308 percent
bull For WPS the annual adjustments from 2009 through 2011 ranged from minus145 percent to 378 percent for residential and small commercial and from minus314 percent to 899 percent for commercial Note that because of a $14 million per year cap some of these percentages were carried over The average annual adjustment for residential and small commercial and for commercial was 163 percent and 215 percent respectively with carry-overs to subsequent years
bull For Massachusetts Electric and Nantucket Electric both of which operate under National Grid the annual revenue regulation adjustment for all for 2011 and 2012 was minus0105 percent and 0315 percent for an average revenue regulation adjustment over the two years of 0105 percent
bull HECO like National Grid has one annual revenue
regulation mechanism for its customers which resulted in adjustments in 2011 and 2012 of 063 percent and 107 percent respectively for an average adjustment of 085 percent
As can be gleaned from the above information the range of average adjustments for small use customers was a low of 0105 percent for National Grid to a high of 197 percent for PGampE For larger use customers the range was a low of 0105 percent for National Grid to a high of 252 percent for IPC This demonstrates that on average for these utilities with well-developed and diversely designed revenue regula-tion proposals their adjustments on average stayed at or below approximately 25 percent
One of the metrics for determining if a revenue regula-tion program is working successfully that was discussed above was the impact on rates of a revenue regulation mechanism As can be seen by the analysis of the adjust-ment levels for each of the utilities they are within a rea-sonable range
Complementary Policies Although a revenue regulation mechanism does not need
to be accompanied by other policies energy efficiency is frequently at the root of the reason revenue regulation was proposed in the first place The states examined in this pa-per have various obligations for energy efficiency achieve-ment placed upon their utilities Only Idaho does not have an Energy Efficiency Resource Standard but energy efficiency objectives are developed through an integrated resource plan process Energy efficiency spending at IPC has increased dramatically in recent years61
In recognition of the fact that revenue regulation only removes the disincentive to pursue energy efficiency several states have instituted some form of incentives to reward the desired outcome This mechanism can not only incentivize management to aggressively pursue energy efficiency but also make shareholders supportive in the face of lost invest-ment opportunity
Rate design can also play an important part in assist-ing the utility in achieving favorable energy efficiency outcomes Inclining block rates penalize inefficient use of electricity and shorten payback times from the customer perspective Because efficiency reduces consumption at
Decoupling Case Studies Revenue Regulation Implementation in Six States
36
62 Optional rate designs for PGampE include TOU and Peak Time Pricing
63 IPC also has an optional TOU rate design
64 Optional rate designs for this utility include TOU Critical Peak Pricing and Contract
65 National Grid also offers optional TOU and flat rate designs
66 HECO also offers optional TOU and flat rate designs
67 See eg Alexander B (1996 April) How to construct a service quality index in performance-based ratemaking Electricity Policy
the tail block rate the value of kWh savings is greater than with flat rates On the other side of the spectrum declining block rates which have a reduced rate in the tail block do little to encourage conservation In fact they operate more like a discounted bulk rate by reducing the average cost of a kWh in a customerrsquos bill for the more kWh used
Performance incentives or other ways to avoid destruc-tive cost-cutting in the name of creating margins that reduce service or reliability or lessen customer value have been implemented only in Massachusetts of the six utilities illustrated here Several other states have implemented vari-ous schemes in reaction to perceived deficiencies in utility service67 Performance incentives are not unique to rev-enue regulation Commissions wishing to implement such a scheme can find many models of incentive reward and penalty mechanisms developed for other purposes
Taken together a suite of policy and program features can create an atmosphere that is conducive to achievement of energy efficiency goals within the utility and for the customers By appropriate application of these techniques regulators working with utilities and stakeholders can remove barriers and create an opportunity for energy ef-ficiency to be fully integrated into the utility supply option portfolio
Energy Efficiency OutcomesAlthough revenue regulation itself does not create an
incentive for a utility to implement energy efficiency it does address the issue of lost revenues associated with energy
Table 12
Complementary Policies for Energy Efficiency
Pacific Gas amp Electric62
Idaho Power Company63
Baltimore Gas amp Electric
Wisconsin Public Service Corporation64
National Grid65
Hawaiian Electric Company66
Energy Efficiency Requirement
1 annually
IRP
10 by 2015
075 annually
24 annually
Energy efficiency can satisfy portion of RPS
Default Residential Rate Design
Inclining block
Inclining block
TOU seasonal
Flat
Inclining block
Inclining block
Incentive Structure
Risk reward incentive mechanism
No
No
No
5 of program costs
Third-party administrator paid for contract performance
Performance Incentives
Reliability reporting only
None
Under consideration
Reliability reporting only
Service quality reward and penalty
Under consideration
efficiency and DG programs Revenue regulation should be combined with other mechanisms that require or incentiv-ize the implementation of energy efficiency by the utility or a third party The level of energy efficiency achieved can be one measure of the success of a revenue regulation mechanism as implemented in a larger program designed to achieve energy efficiency Table 13 shows the incremental annual energy efficiency savings reported by each utility with the shaded box indicating the year that the utilityrsquos revenue regulation mechanism was implemented National Grid had achieved a high level of energy efficiency savings in the years before it implemented revenue regulation
This paper has not evaluated DG outcomes to correlate with revenue regulation as it is not perceived that states and utilities have made that connection expressly in histori-cal mechanisms However it is expected that this connec-
Decoupling Case Studies Revenue Regulation Implementation in Six States
37
68 EIA Form EIA-861 data files Available at httpwwweiagovelectricitydataeia861
69 PGampE began revenue regulation in 1974 and it was later suspended and recommenced in 2001
70 WPS savings are represented by the statewide program savings from the Focus on Energy program WPS provided additional funds to Focus on Energy starting in CY10 through their territory-wide program activities
71 In 2009 Hawaii Energy a ratepayer-funded statewide energy efficiency provider began delivering services Savings reported after 2009 represent savings achieved through the programs of Hawaii Energy
Table 13
Annual Incremental Energy Efficiency Savings as Percentage of Retail Sales68
Highlighted cells are the year that utility started decoupling
Pacific Gas amp Electric69
Idaho Power Company
Baltimore Gas amp Electric
Wisconsin Public Service Corporation70
National Grid
Hawaiian Electric Company71
2004
11
01
00
03
11
00
2005
16
03
00
03
09
05
2006
10
05
00
03
12
05
2010
19
13
17
09
136
12
tion will be made in future mechanisms and furthermore it is anticipated that follow on work to this paper will want to study that connection between revenue regulation and DG performance
Conclusions
An increasing number of states are looking to increase the rate of energy efficiency investments for their long-run cost and risk advantages The benefits of energy efficiency include not only its ability to reduce system costs across the distribution transmission and generation functions but also the opportunity for customers to reduce their individ-ual energy costs for their own electric bills Nevertheless it is counterintuitive to encourage or order a utility to sell less of its product In order to encourage the proliferation of en-ergy efficiency programs as a solution that can contribute to this nationrsquos energy needs this tension between the goals of society versus the goals of the utility needs to be addressed Revenue regulation can be such a solution by removing the link between sales and revenues
There are many ways to implement revenue regulation and multiple decision points that regulators must consider in designing a revenue regulation mechanism This paper focused on six utilities each of which implemented revenue regulation in different ways in accordance with the objectives of that state Different decision points discussed include
bull Should revenue regulation apply to all functions (generation transmission and distribution) which sometimes depends on if the utility is regulated or restructured
bull Should revenue regulation apply to all customer classes
bull Should there be symmetry such that a reconciliation adjustment occurs for both over- and under-recoveries of the revenue requirements
bull Should recovery of indicated surcharges be conditioned on acceptable performance on customer service quality or energy efficiency goals
bull Should there be an attrition adjustment to account for other expenses or should the revenue regulation adjustment be limited to reconciling existing revenue requirements
bull Should there be an inflation adjustmentbull To calculate the revenue requirements should the
current or accrual method be usedbull Should the adjustments be made in rate cases or
through a riderbull How frequently should adjustments be made
monthly annually or some other time periodbull Depending on the period of time between true up and
recovery should there be carrying charges and if so how should they be calculated
2007
21
06
00
03
09
04
2008
35
10
05
09
05
05
2009
20
11
06
10
11
11
Decoupling Case Studies Revenue Regulation Implementation in Six States
38
72 Avista Utilities (2009) Washington Utilities and Transportation Commission Docket UE-090134
bull Should there be a requirement authorizing the frequency of rate case
bull Should there be an annual cap on the amount of the adjustment and if so should there be an opportunity to carry over any additional amounts and for how many years
bull Should there be an adjustment to the cost of capital to reflect the reduced risk
Other considerations for regulators whether or not they implement revenue regulation but certainly as part of a comprehensive package are other measures that can be put in place to encourage consumers and utilities alike to actively participate in energy efficiency For example an inclining block rate structure by virtue of its incentive to consume less pairs well with an energy efficiency program helps drive consumers to participate in efficiency programs and accelerates the payback of an energy efficiency investment By the same token an incentive payment to the utility helps provide its management with a good reason to excel and exceed targets for energy efficiency programs
A key point illustrated by the list of considerations above is that there is not just one static way to design and implement revenue regulation but rather there are a variety of options for doing so In this study a diverse group of utilities were reviewed The differences among the utilities included geographic diversity vertically integrated and restructured utilities different levels of energy efficiency in place and certainly differences in how the revenue regulation mechanisms were implemented No two utilities were alike and no two utilities had the same revenue regulation mechanism The key is that revenue regulation should eliminate the throughput incentive but the means for accomplishing this goal can vary and be tailored to each jurisdiction and each utility and still be successful
There are several considerations in the design of a revenue regulation mechanism that can help ensure its successful adoption To begin revenue regulation should be granted to utilities only as a precondition to implementing comprehensive energy efficiency andor DG policies Unless accompanied by a commitment to engage in providing least-cost resource options that could impact sales there is not really any good policy reason for its adoption All of the utilities studied are actively engaging in energy efficiency Furthermore as a matter of fairness the revenue regulation mechanism should be symmetrical so that any revenues above those authorized are refunded back to consumers As Figure 1 demonstrates although there are more surcharges to customers there is nevertheless a healthy amount of
credits back to consumers This is the bargain Barring imprudence or other unforeseen circumstances the utility receives its authorized revenue requirements and nothing more or less under a simple revenue regulation mechanism
Rate design plays an important role in the effectiveness of energy efficiency in concert with revenue regulation A low customer charge is preferable so that the customer can benefit from real bill reductions tied to reduced volumetric consumption Reductions in consumption not only reduce bills but also positively impact the payback period for investments in energy efficient appliances Declining block rates in which the tail block rate is lower than the first tier also do not encourage conservation Inclining block rates that reward low usage in the first block with a lower rate send the better price signals None of the six utilities studied had declining block residential rates They were inclining flat and time-varying
The revenue adjustment mechanism is also a critical decision point in terms of whether a revenue per customer mechanism is adopted that accounts for only the current revenue requirements or whether latitude is given to include an inflation adjustment or other cost increases in the revenue adjustment mechanism Three of the utilities studied adopted this approach whereas another two used a hybrid approach Finally to reduce volatility five of the six utilities opted for annual rather than monthly adjustments thereby creating a level of rate stability that customers in general prefer
Once the goals for revenue regulation are set by the regulators the next step is to design programs that will implement that goal For energy efficiency to be as successful as possible regulators may want to adopt a complement of other policies to accompany revenue regulation These can include rate designs that reward reduced use and conservation as well as incentive payments to utilities that reward them for meeting or exceeding targets Of the six utilities studied three have adopted some form of incentive One simple approach that was used in Washington was to link recovery of any surcharges under the revenue regulation mechanism to achievement of energy efficiency targets72
For the utilities examined above that have implemented revenue regulation the evidence demonstrates that revenue regulation as a strategy and a mechanism to enable
Decoupling Case Studies Revenue Regulation Implementation in Six States
39
energy efficiency has been working well The fact that each revenue regulation mechanism varies from the next demonstrates that there are many different paths that can be followed in implementing revenue regulation based on the needs of the utility and its stakeholders in a particular
region This study demonstrates that revenue regulation does work and provides examples of how it can be implemented each one different and unique because of the number of decision points to be considered in designing a revenue regulation mechanism
Decoupling Case Studies Revenue Regulation Implementation in Six States
40
Appendix
Historic Rate Adjustments
Table 14
PGampE Revenue Regulation Rate Adjustments 1983 to 199373
Table 15
PGampE Revenue Regulation Adjustments 2005 to 201274
Table 16
IPC Revenue Regulation Adjustments76
Idaho Power Company
1983 23
1984 (34)
1985 (48)
1986 19
1987 21
1988 50
1989 (43)
1990 (54)
1991 39
1992 34
1993 00
2005 8925 minus12773 minus143
2006 9933 2246 226
2007 10409 21727 209
2008 10261 4032 039
2009 11169 10355 093
2010 11224 46556 415
2011 10306 38390 373
2012 11032 40304 365
2007 Residential minus00457 590 minus077
Commercial minus00457 428 minus107
2008 Residential 00529 670 090
Commercial 00529 510 104
2009 Residential 01220 770 158
Commercial 01535 603 255
2010 Residential 01800 785 229
Commercial 02273 613 371
2011 Residential 02028 785 258
Commercial 02597 613 424
Revenue Regulation Adjustment as of
Total Rates
Delivery Revenue
Requirement ($ millions)
Adjustment Rate
Revenue Regulation Adjustment($ millions)
Retail Rate
of Delivery Revenue
Revenue Regulation Adjustment
Year
Year
73 Lesh P (2009 June 30) Rate impacts and key design elements of gas and electric utility decoupling
74 Morgan P (2012 November) A decade of decoupling for US energy utilities rate impacts designs and observations
75 Morgan P (2012 November) A decade of decoupling for US energy utilities rate impacts designs and observations
76 All numbers provided by the utility
Decoupling Case Studies Revenue Regulation Implementation in Six States
41
77 Idaho Power Company Case No IPC-E-11-19- fixed cost adjustment permanent mechanism Available at httpwwwpucidahogovinternetcaseselecIPCIPCE1119company20120928COMPLIANCE20FILINGPDF
Figure 2
IPC Revenue Regulation Adjustments77
Residential FCA Balance and Use per Customer
$10000000
$8000000
$6000000
$4000000
$2000000
$0
-$2000000
-$4000000
-$6000000
1080
1070
1060
1050
1040
1030
1020
1010
1000Res
idu
al A
uth
oriz
ed F
CA
Am
oun
t
Residual Authorized FCA Amount ($)
Monthly Use Per Customer (kWh)
kW
h U
sed
2006 2007 2008 2009 2010 2011
78 Morgan P (2012 November) A decade of decoupling for US energy utilities rate impacts designs and observations
Decoupling Case Studies Revenue Regulation Implementation in Six States
42
Table 17a
Baltimore Gas and ElectricBGE Monthly Revenue Regulation Adjustments 2008 to 201278
Table 17b
Baltimore Gas and ElectricBGE Monthly Revenue Regulation Adjustments 2008 to 201278
March Residential 000172 01477 1165General Service 000230 01526 1507
April Residential 000016 01477 0108General Service 000146 01526 0957
May Residential 000066 01477 0447General Service 000230 01526 1507
June Residential minus000066 01477 minus0447General Service 000230 01526 1507
July Residential 000158 01477 1070General Service 000230 01526 1507
August Residential minus000040 01477 minus0271General Service 000214 01526 1402
September Residential 000237 01477 1605General Service 000230 01526 1507
October Residential 000237 01477 1605General Service 000143 01526 0937
November Residential 000237 01477 1605General Service 000140 01526 0917
December Residential 000445 01477 3013General Service 000230 01526 1507
January Residential 000035 01579 0222General Service minus000073 01346 minus0542
February Residential 000025 01579 0158General Service 000230 01346 1709
March Residential minus000237 01579 minus1501General Service 000230 01346 1709
April Residential minus000237 01579 minus1501General Service 000230 01346 1709
May Residential 000234 01579 1482General Service 000132 01346 0981
June Residential 000237 01579 1501General Service 000230 01346 1709
July Residential 000237 01579 1501General Service 000230 01346 1709
August Residential 000237 01579 1501General Service 000190 01346 1412
September Residential 000237 01579 1501General Service 000230 01346 1709
October Residential 000237 01579 1501General Service 000124 01346 0921
November Residential 000237 01579 1501General Service 000230 01346 1709
December Residential 000156 01579 0988General Service 000204 01346 1516
Adjustment $kWh
Adjustment $kWh2008 2009
Retail Rate
$kWh
Retail Rate
$kWhAdjustment
Adjustment
Decoupling Case Studies Revenue Regulation Implementation in Six States
43
Table 17c
Baltimore Gas and ElectricBGE Monthly Revenue Regulation Adjustments 2008 to 201278
Table 17d
Baltimore Gas and ElectricBGE Monthly Revenue Regulation Adjustments 2008 to 201278
January Residential 000203 01465 1386General Service 000230 01261 1824
February Residential minus000142 01465 minus0969General Service 000230 01261 1824
March Residential minus000237 01465 minus1618General Service 000230 01261 1824
April Residential minus000237 01465 minus1618General Service 000230 01261 1824
May Residential 000192 01465 1311General Service 000230 01261 1824
June Residential 000191 01465 1304General Service 000230 01261 1824
July Residential 000095 01465 0648General Service 000230 01261 1824
August Residential minus000176 01465 minus1201General Service 000224 01261 1776
September Residential minus000237 01465 minus1618General Service 000116 01261 0920
October Residential minus000237 01465 minus1618General Service 000081 01261 0642
November Residential minus000237 01465 minus1618General Service 000098 01261 0777
December Residential minus000079 01465 minus0539General Service 000229 01261 1816
January Residential minus000130 01365 minus0952General Service 000230 01156 1990
February Residential minus000253 01365 minus1853General Service minus000020 01156 minus0173
March Residential minus000018 01365 minus0132General Service minus000063 01156 minus0545
April Residential 000110 01365 0806General Service minus000262 01156 minus2266
May Residential 000010 01365 0073General Service minus000160 01156 minus1384
June Residential 000226 01365 1656General Service 000042 01156 0363
July Residential 000253 01365 1853General Service 000209 01156 1808
August Residential minus000007 01365 minus0051General Service minus000157 01156 minus1358
September Residential minus000253 01365 minus1853General Service minus000177 01156 minus1531
October Residential 000228 01365 1670General Service 000262 01156 2266
November Residential minus000059 01365 minus0432General Service 000262 01156 2266
December Residential 000071 01365 0520General Service 000262 01156 2266
Adjustment $kWh
Adjustment $kWh2010 2011
Retail Rate
$kWh
Retail Rate
$kWhAdjustment
Adjustment
Decoupling Case Studies Revenue Regulation Implementation in Six States
44
Table 17e
Baltimore Gas and ElectricBGE Monthly Revenue Regulation Adjustments 2008 to 201278
January Residential 000253 01291 1960General Service 000262 01064 2462
February Residential 000253 01291 1960General Service 000262 01064 2462
March Residential 000253 01291 1960General Service 000262 01064 2462
April Residential 000253 01291 1960General Service 000262 01064 2462
May Residential 000253 01291 1960General Service 000262 01064 2462
June Residential 000253 01291 1960General Service 000262 01064 2462
July Residential 000253 01291 1960General Service 000262 01064 2462
August Residential 000253 01291 1960General Service 000160 01064 1504
Adjustment $kWh2012
Retail Rate
$kWhAdjustment
Decoupling Case Studies Revenue Regulation Implementation in Six States
45
79 Morgan P (2012 November) A decade of decoupling for US energy utilities rate impacts designs and observations
80 Morgan P (2012 November) A decade of decoupling for US energy utilities rate impacts designs and observations
Table 18
Wisconsin Public Service Corporation Revenue Regulation Adjustments 2009 to 201179
2009 ResidentialSmall Commercial 00048705 000168154 01290 378 130Commercial 00084951 000293293 00945 899 310
2010 ResidentialSmall Commercial 00033043 000166936 01291 256 129Commercial 00056630 000286103 09460 060 030
2011 ResidentialSmall Commercial (00018666) $ (000163719) 01288 minus145 minus127Commercial (00032565) $ (000285629) 01037 minus314 minus275
Derived Adjustment
$kWh
Derived Adjustment Capped $
kWh
Retail Rate
$kWh
Revenue Regulation Actual
Revenue Regulation Capped
Table 19
National Grid Revenue Regulation Adjustments 2011-201276
Massachusetts Electric and Nantucket Electric
Table 20
Hawaiian Electric Company
2011 All minus0015 1429 minus0105
2012 All 0044 1396 0315
2011 01995 3149 063
2012 03894 3641 107
Revenue Regulation Adjustment
centkWh
Revenue Regulation Adjustment
centkWhRetail Rate
centkWh
Retail Rate
Revenue Regulation Adjustment
Revenue Regulation
ldquoThe 2011 adjustment took effect June 1 but was reduced to $0 on July 26 2011 when the Commission granted HECO an interim rate increase of $532 million in a 2011 test year general rate case The 2012 Adjustment runs from June 1 2012 through May 31 2013 About 25 of the total relates to the portion of the decoupling mechanism that updates OampM and rate baserdquo (Morgan 2013)
Decoupling Case Studies Revenue Regulation Implementation in Six States
46
Revenue Regulation and Decoupling A Guide to Theory and Applicationhttpwwwraponlineorgdocumentdownloadid902
This guide was prepared to assist anyone who needs to understand both the mechanics of a regulatory tool known as decoupling and the policy issues associated with its use This would include public utility commissioners and staff utility management advocates and others with a stake in the regulated energy system While this guide is somewhat technical at points we have tried to make it accessible to a broad audience to make comprehensible the underlying concepts and the implications of different design choices This guide includes a detailed case study that demonstrates the impacts of decoupling using different pricing structures (rate designs) and usage patterns
Pricing Dorsquos and Donrsquots Designing Retail Rates as if Efficiency Countshttpwwwraponlineorgdocumentdownloadid939
Rate design is a crucial element of an overall regulatory strategy that fosters energy efficiency and sends appropriate signals about efficient system investment and operations Rate design is also fully under the control of state regulators Progressive rate design elements can guide consumers to participate in energy efficiency programs and reduce peak demand yet relatively few utilities and commissions have implemented many of these elements This RAP paper identifies some best practices Because pricing issues tie closely to utility growth incentives we also address revenue decoupling
A Decade of Decoupling for US Energy Utilities Rate Impacts Designs and Observationshttpwwwraponlineorgdocumentdownloadid6356
This report written by Pamela Morgan of Graceful Systems LLC builds on a 2009 report Now covering 25 states including 49 LDCs and 24 electric utilities this report summarizes the decoupling mechanism designs these utilities use and the rate adjustments they have made under those mechanisms In total this report estimates the retail rate impacts of 1244 decoupling mechanism adjustments since 2005
Additional Resources
The Role of Decoupling Where Energy Efficiency is Required by Lawhttpwwwraponlineorgdocumentdownloadid275
This Issuesletter gives an overview of energy efficiency resource standards the need to decouple utility profits from utility sales and explains why decoupling is needed even where a third party administers energy efficiency programs
Revenue Decoupling Standards and Criteria A Report to the Minnesota Public Utilities Commissionhttpwwwraponlineorgdocumentdownloadid850
In 2007 the Minnesota legislature enacted a new statute Section 216B2412 in which it defined an alternative approach to utility regulation decoupling and directed the Public Utilities Commission (PUC) to ldquoestablish criteria and standardsrdquo by which decoupling could be adopted for the statersquos rate-regulated utilitiesTo fulfill its obligation to develop criteria and standards for decoupling the PUC sought the advice of the Regulatory Assistance Project (RAP) This report is the output of that collaboration
Designing Distributed Generation Tariffs Wellhttpwwwraponlineorgdocumentdownloadid6898
Improvements in distributed generation economics increasing consumer preference for clean distributed energy resources and a favorable policy environment in many states have combined to produce significant increases in distributed generation adoption in the United States Regulators are looking for the well-designed tariff that compensates distributed generation adopters fairly for the value they provide to the electric system compensates the utility fairly for the grid services it provides and charges non-participating consumers fairly for the value of the services they receive This paper offers regulatory options for dealing with distributed generation The authors outline current tariffs and ponder what regulators should consider as they weigh the benefits costs and net value to distributed generation adopters non-adopters the utility and society as a whole The paper highlights the importance of deciding upon a valuation methodology so that the presence or absence of cross-subsidies can be determined Finally the paper offers rate design and ratemaking options for regulators to consider and includes recommendations for fairly implementing tariffs and ratemaking treatments to promote the public interest and ensure fair compensation
Decoupling Case Studies Revenue Regulation Implementation in Six States
47
The Regulatory Assistance Project (RAP)trade is a global non-profit team of experts focused on thelong-term economic and environmental sustainability of the power sector We provide technical and policy assistance on regulatory and market policies that promote economic efficiency environmental protection system reliability and the fair allocation of system benefits among consumers We work extensively in the US China the European Union and India Visit our website at wwwraponlineorg to learn more about our work
Rate Design Where Advanced Metering Infrastructure Has Not Been Fully Deployedhttpwwwraponlineorgdocumentdownloadid6516
This paper identifies sound practices in rate design applied around the globe using conventional metering technology Rate design for most residential and small commercial customers (mass market consumers) is most often reflected in a simple monthly access charge and a per-kWh usage rate in one or more blocks and one or more seasons A central theme across the practices highlighted in this paper is that of sending effective pricing signals through the usage-sensitive components of rates in a way that reflects the character of underlying long-run costs associated with production and usage While new technology is enabling innovations in rate design that carry some promise of better capturing opportunities for more responsive load the majority of the worldrsquos electricity usage is expected to remain under conventional pricing at least through the end of the decade and much longer in some areas Experience to date has shown that the traditional approaches to rate design persist well after the enabling technology is in place that leads to change
Time-Varying and Dynamic Rate Designhttpwwwraponlineorgdocumentdownloadid5131
This report discusses important issues in the design and deployment of time-varying rates The term time-varying rates is used in this report as encompassing traditional time-of-use rates (such as time-of-day rates and seasonal rates) as well as newer dynamic pricing rates (such as critical peak pricing and real time pricing) The discussion is primarily focused on residential customers and small commercial customers who are collectively referred to as the mass market The report also summarizes international experience with time-varying rate offerings
50 State Street Suite 3Montpelier Vermont 05602802-223-8199wwwraponlineorg
- Table of Contents
- Introduction
- California Pacific Gas and Electric Company
- Idaho Idaho Power Company
- Maryland Baltimore Gas and Electric
- Wisconsin Wisconsin Public Service Corporation
- Massachusetts National Grid
- Hawaii Hawaiian Electric Company
- Discussion of the Six Utilities Overall
- Conclusions
- Appendix
- Additional Resources
-
Decoupling Case Studies Revenue Regulation Implementation in Six States
11
Idaho Power Companyrsquos (IPC) Fixed Cost Adjustment (FCA) mechanism compares the authorized fixed-cost revenue requirement with weather-normalized sales and reconciles the difference annually for residential
and small business customers The allowed revenue is determined on a per-customer basis during the general rate case and the total fixed-cost recovery amount is adjusted based on the number of customers
AuthorityIn 2004 the Idaho Public Utilities Commission
established a case to investigate financial disincentives to investment in energy efficiency by IPC After a series of workshops in 2007 the Commission approved a three-year pilot of IPCrsquos proposed revenue regulation mechanism In 2009 the Commission extended the pilot for an additional two years starting January 1 2010 On April 2 2012 the Idaho Public Utilities Commission made the IPC pilot program permanent
Authorized Revenue RequirementDuring the general rate case the Commission establishes
the class-specific portion of IPCrsquos revenue requirement For purposes of the FCA this includes the fixed costs collected through Residential Service and Small General Service customer rates During the general rate case the Commission also establishes a fixed-cost per-customer ratemdashthe amount of fixed cost revenue the Company will recover from each customer Finally the Commission must also establish the fixed-cost per-kWh ratemdashthe portion of retail rates that covers fixed costs ldquoFixed costsrdquo are defined much more broadly than accounting standards provide including return taxes and labor expenses
Rate of ReturnIPCrsquos most recent rate case resulted in an overall
settlement The Stipulation specified an overall rate of return of 786 percent which combines return on equity (ROE) capital structure and cost of debt The Commission made no explicit adjustment to the Companyrsquos allowed rate of return
based on the implementation of the FCA
Revenue Adjustment MechanismThe revenue adjustment mechanism was designed to
be weather normalized For each customer class included in the revenue regulation mechanism the actual number of customers (CUST) is multiplied by the fixed-cost per-customer rate (FCC) to give the allowed fixed-cost recovery amount This pro forma amount is then compared to the fixed costs recovered by the company This actual fixed-cost recovery is determined by taking the weather-normalized sales for each class (NORM) and multiplying it by the cost-per-kWh rate (FCE) as determined in a general rate case The difference (allowed fixed cost recovery minus actual fixed cost recovery) determines the FCA In this way the revenue requirement is adjusted between rate cases based on the number of customers and is weather normalized leaving the weather risk with the company This difference is the FCA and is applied to each decoupled customer class
The mathematical formula is FCA = (CUST times FCC) ndash (NORM times FCE) The number of customers is determined by class on the same basis as the methodology used in the general rate case
Reconciling Actual Revenue With Authorized Revenue
Each month the actual fixed-cost recovered amount is determined based on the weather-normalized sales for each customer class multiplied by the fixed-cost per-kWh rate For reporting a monthly ldquoshapedrdquo fixed cost per kWh is used for calculating actual fixed-cost revenue This adheres to Generally Accepted Accounting Practices (GAAP) and better reflects end-of-year impacts within the year The methodology used to weather-normalize actual monthly energy used in the FCA is the same as used in the general rate case Finally the actual fixed-cost recovered amount is subtracted from the allowed fixed-cost recovery amount and the difference is recorded as a line item in the monthly Power Cost Adjustment (PCA) report provided to the Commission Differences are deferred with interest until the end of the
Idaho Idaho Power Company
Decoupling Case Studies Revenue Regulation Implementation in Six States
12
year The actual FCA balance will differ from that recorded in the monthly reports to reflect the fact that the deferral balance is calculated on an annual not monthly basis FCA balance is based on annual average prorated customer count annual weather normalized sales and non-shaped FCE rates which would affect both the balance accrual and the associated interest
Each year the Company totals the FCA results including interest for the period from January 1 to December 31 If the total is negative it represents an under-collection of revenue from customers and the amount will be recovered from ratepayers in the following year through an adder to rates (Schedule 54) Likewise if the total is positive the Company has over-collected its fixed-cost revenue and will return the excess amount to customers through an adder in rates using a credit or surcharge mechanism These adjustments are currently included in the Annual Adjustment Mechanism line item on customer bills Since July 2012 the Annual Adjustment Mechanism includes PCA and FCA to avoid customer confusion
Originally FCAs were calculated for each decoupled customer class however the FCA is now recovered proportionally between the residential and small general service customers for such reason as a lack of cost of service studies to support the underlying cost allocations and acknowledgment of the ldquoportfoliordquo approach toward energy efficiency Annual adjustments are capped at three percent and differences beyond that are rolled over until the next period Adjustments to the rate occur June 1 of the year following the previous one-year period from January 1 to December 31
IPC was initially obligated to submit its adjustment request subject to Staff audit on March 15 of each year Under the pilot program this included a detailed summary of demand-side management (DSM) activities that demonstrate an enhanced commitment to DSM resulting from implementation of the FCA ldquoEvidence of enhanced commitment will include but not be limited to broad availability of efficiency and load management programs building code improvement activity pursuit of appliance code standards expansion of DSM programs pursuit of energy savings programs beyond peak shavingload shifting programs and third party verificationrdquo (IPC-E-04-15 Settlement Stipulation p 5) However the Company is no longer required to file the separate annual report specifying ways in which it increased its investment in energy efficiency and DSM as a result of the FCA mechanism DSM is comprehensively reported in annual DSM reports filed with
the Commission
Potential ChangesThe Commission noted when approving the permanent
FCA that it ldquodoes not isolate or identify changes in cost recovery associated solely with the Companyrsquos energy efficiency programsrdquo17 The Company was required to file a proposal to adjust the FCA to address the capture of changes in load not related to energy efficiency programs In its compliance filing IPC recommended making no change to the FCA mechanism but did propose an altered mechanism in order to comply with the Commissionrsquos request The proposal would cap the annual change in per-customer consumption to two percent (up or down) The Commission Staff had previously proposed that the FCA balance be equally shared between the customers and the Company in order to account for variations in energy consumption other than weather and energy efficiency However the Commission found that neither proposal satisfied its needs stating that the Companyrsquos proposal to cap deviations in annual usage would not have had any effect on previous FCA results Additionally both IPC and the Idaho Conservation League filed comments stating that the Staffrsquos 5050 sharing proposal failed to remove the financial disincentives inherent in DSM programs The Commission finally determined to keep the FCA mechanism unchanged and continue to monitor the results
Complementary PoliciesIdaho requires its investor-owned utilities to pursue all
cost-effective energy efficiency however it does not have incentives for achieving energy efficiency savings
IPC uses inclining block rates as the default rate structure for its residential customers but there is also available an optional Time-of-Day pilot program with summer and winter peak and off-peak periods Small general service customers take service on a two-tier inclining block schedule
IPC has no filing or reporting requirements relating to service quality (except in Oregon)
Energy Efficiency OutcomesBefore IPC implemented revenue regulation in January
2007 it reported increasing incremental energy efficiency savings from 0 percent of retail load in 2003 to 05 percent of
17 Order No 32505 p 6 Available at httpwwwpucidahogovorders32599ord32505pdf
Decoupling Case Studies Revenue Regulation Implementation in Six States
13
retail load in 2006 Since the revenue regulation mechanism was implemented reported savings have increased from 06 percent in 2007 to 13 percent in 2010 (with low or no reported savings in 2009 and 2011)18 The DSM Report for 2012 shows this to be 12 percent
ResourcesIdaho Public Utilities CommissionIPC-E-04-15 - Idaho Power mdash Investigation of Financial
DisincentivesIPC-E-09-28 - Idaho Power mdash Application to Make the
Fixed Cost Adjustment PermanentIPC-E-11-19 - Idaho Power mdash Request to Convert
Schedule 54 (Fca) From Pilot to Permanent
18 EIA Form EIA-861 data files Available at httpwwweiagovelectricitydataeia861
Decoupling Case Studies Revenue Regulation Implementation in Six States
14
Baltimore Gas and Electricrsquos (BGE) revenue regulation mechanism compares actual distribution revenue to the authorized revenue adjusted for the number of customers for each applicable rate schedule The
authorized revenue including the cost of power is based on test year requirements and sales levels Over- or under-collec-tions are reconciled monthly through a rider This mechanism differs from the others we describe by having a monthly rather than annual deferral and recovery period
AuthorityBGE requested a revenue regulation mechanism in 2007
due to the expected impact on electricity sales of the com-panyrsquos conservation and demand response programs BGE stated that the revenue regulation mechanism was neces-sary to eliminate the inherent disincentive in the traditional ratemaking process with respect to conservation and demand response Under traditional ratemaking BGE pointed out that ldquoa one percent reduction in electricity use and demand on the Companyrsquos system for the residential and small com-mercial classes would cut cost recovery by approximately $4 million This first year impact on recovery is then followed by $8 million in the second year (as an equal amount of sav-ings is added) and so on the five-year loss to shareholders from this steady-state utility investment program would be more than $20 millionrdquo19 The revenue regulation mechanism proposed by BGE was based on its gas revenue regulation mechanism which has been in place since 1998
Authorized Revenue RequirementBGE initially calculated its revenue requirement per class
separately for each rate scale based on weather-normalized 2007 sales and the number of customers Because BGE pro-posed the mechanism in 2007 the test year 2007 included nine months of actual sales and three months of forecasted sales BGE used three steps to calculate the base monthly revenue requirement
1 Calculate the Customer Charge revenues by multiplying the number of customers by the
Maryland Baltimore Gas and Electric
Customer Charge for each class2 Calculate the Delivery Service revenues by
multiplying the weather-normalized sales by the Delivery Price for each class
3 Add the Customer Charge revenues and the Delivery Service revenues to determine the base revenue requirements for each class
BGErsquos residential small general service and general service customers are included in the revenue regulation mechanism
Rate of ReturnBGE was allowed a return on common equity of 975
percent applied to a common equity ratio of 5105 per-cent in its most recent rate case BGE strongly opposed the reduction of its ROE and preferred another lost revenue mechanism over revenue regulation if an ROE reduction was implemented as a result of revenue regulation
The Public Service Commission (PSC) made no adjust-ment to BGErsquos ROE when revenue regulation was first implemented in 2007 but did reduce its allowed ROE by 50 basis points in the last rate case The Commission had previously reduced the ROE of another utility by 50 basis points when it adopted a similar revenue regulation mecha-nism for that utility20 21
Revenue Adjustment MechanismOn a monthly basis the adjustment to base revenue
requirement is calculated for each rate class using the following steps
19 BGE (2007 October 26) 9111FilingConser-va102607F Available at httpwebapppscstatemdusintranetmaillogcontentcfmfilepath=C5CCasenum5CAdmin20Filings5C60000-1099995C1080615C9111FilingConserva102607Fpdf
20 Potomac Electric Power Company
21 BGErsquos gas mechanism was approved in a 1998 settlement that did not discuss any adjustment to ROE
Decoupling Case Studies Revenue Regulation Implementation in Six States
15
1 Calculate the revenue adjustment for the change in the number of customers by multiplying the change in the number of customers by the Customer Charge
2 Calculate the revenue adjustment associated with the change in sales by multiplying the change in the number of customers by the average use per customer and multiplying that product by the Delivery Price for the class
3 Calculate the target base revenues for each class for the current period by adding the two types of adjustments to the revenue requirement
The Delivery Price for each class is the delivery rate established by the PSC adjusted for the electric universal service charge nuclear decommissioning credits and the administrative credit associated with the administrative adder portion of the Standard Offer Service rates22
BGE had a full electric and gas rate case in 201023 and another one filed in 2013 and concluded in 201424 Both reset the required decoupling elementsmdashmonthly revenue requirement monthly average usage per customer and number of customers Neither case changed the mechanism
The decoupling mechanism now excludes lost sales resulting from major storms
Reconciling Actual Revenue With Authorized Revenue
On a monthly basis each rate classrsquos target base revenues are compared to the actual base revenues for the month The difference is divided by the forecasted sales for the following period to calculate the monthly rate adjustment Balancing accounts are used to record the timing differ-ences associated with when the adjustments are calculated versus when they are billed or refunded The monthly rate adjustment Rider 25 is capped at ten percent of rates Any amount beyond ten percent of the current rate will be car-ried over and reconciled in the subsequent period
Complementary PoliciesMaryland requires its electric utilities to provide energy
efficiency services to achieve a ten-percent reduction in per capita electricity use by 2015 The statersquos overall goal is a 15 percent reduction of per capita electricity use by 2015 Although the PSC is explicitly allowed to approve financial incentive mechanisms to promote energy efficiency no incentives have been approved yet25
BGErsquos default service to its standard offer residential cus-tomers (those customers who have not elected to take gen-eration service from an alternate supplier) features seasonal
ratesmdashsummer and winter BGE also offers a TOU rate as an option to standard offer residential customers and as the default rate for small general service customers
Regarding performance incentives under revenue regula-tion in October 2012 Maryland issued a four-part plan designed to speed up investments that will strengthen the statersquos distribution grid Part of that plan would set a rate-making structure that aligns customer and utility incentives by rewarding reliability that exceeds established reliability metrics and penalizing failure to reach those metrics A task force has encouraged the Maryland state regulatory com-mission to implement a performance-based ratemaking process for IOUs such as BGE linking a utilityrsquos progress or failure to meet certain reliability metrics with its authorized rate of return
Energy Efficiency OutcomesWhen BGE implemented electric revenue regulation in
mid 2007 it had not achieved incremental energy savings for several years In 2008 it reported incremental savings of 05 percent of retail load increasing to 17 percent in 2010 and 2011
ResourcesMaryland Public Service CommissionLetter Order ML 108061 (December 27 2007)Letter Orders ML 108069 (November 30 2007) Case No 9036 Order No 80460 (December 21 2005) Case No 9230 Order No 83907 (December 13 2013) Case No 9326 Order No 86060 (December 13 2013)
22 BGE (2007 October 26) 9111FilingConser-va102607F Available at httpwebapppscstatemdusintranetmaillogcontentcfmfilepath=C5CCasenum5CAdmin20Filings5C60000-1099995C1080615C9111FilingConserva102607Fpdf
23 Case No 9230 ndash See references above
24 Case No 9326 ndash See references above
25 ACEEE Maryland Available at httpaceeeorgsectorstate-policymarylandEnergy Efficiency Resource Standards
26 EIA Form EIA-861 data files Available at httpwwweiagovelectricitydataeia861
Decoupling Case Studies Revenue Regulation Implementation in Six States
16
27 The pilot extension is in effect until the effective date of a Final Decision issued by the Commission on an application for a general base rate case filed after January 1 2013
28 Except the Direct Load Control Cp - Large Commercial amp Industrial Service Cp-ND - Pilot Large Commercial amp Industrial - Day Ahead Cp-RR - Large Commercial amp Industrial Response Rewards Automatic Transfer Switch Parallel Generation Lighting Nature Wise and Real Time Market Pricing tariffs
Wisconsin Wisconsin Public Service Corporation
Wisconsin Public Service Corporationrsquos (WPS) Revenue Stabilization Mechanism (RSM) began in 2009 as a four-year revenue regulation pilot that reconciled
target marginal revenue per customer with actual marginal revenue per customer As of 2012 the pilot was extended27 albeit with some modifications This section focuses on the current iteration of the RSM
AuthorityThe Public Service Commission of Wisconsin (PSCW)
approved a revenue regulation pilot for WPS in a Decem-ber 2008 rate case order (Docket No 6690-UR-119) The revenue regulation mechanism was effective from January 1 2009 through December 31 2012 and applied to the util-ityrsquos electric and gas operations In a rate case completed in December 2012 (Docket No 6690-UR-121) the pilot was extended and a modified RSM was approved The extended RSM is in effect from January 2013 until the next rate case
Authorized Revenue RequirementThe authorized revenue requirement is determined
through a rate case The Commission uses a future test year to determine the revenue requirement The cost of fuel is not included in the revenue requirement but is addressed through a ldquoRetail Electric Fuel Rulerdquo adjustment
Rate of ReturnThe Commission authorized a rate of return on utility
common equity of 1030 percent in Docket No 6690-UR-120 This rate remained the same in Docket No 6690-UR-121 and is currently in effect
Revenue Adjustment MechanismWPS implemented a new electric RSM based on a ldquoTotal
Rate Case Marginrdquo mechanism instead of a ldquoTotal Rate Case Margin per Customerrdquo mechanism which had been the practice during the initial four-year pilot phase The revision was intended to remove the calculation sensitivities related
to sales per customer from the original RSM calculation The margin reflected in the formula equals the total revenue for each tariff less the costs associated with the annual per-kWh value established for monitored fuel costs and excluding any surcharges credits taxes or similar charges The ldquoTotal Rate Case Marginrdquo mechanism allows WPS to achieve the total margin assumed in the forecasted test year no more and no less The new RSM will be in effect on a pilot basis until the effective date of WPSrsquos next general rate order which WPS committed to filing for the 2014 andor 2015 test years The RSM applies to most tariffs except large commercial and industrial customers28
Reconciling Actual Revenue With Authorized Revenue
Each year the utility compares the total target revenue and the total actual revenue and defers the difference subject to carrying costs based on WPSrsquos last approved short-term debt rate The margin will be based on annual per-kWh value established for monitored fuel costs which is done in a rate case The margin is determined by subtracting the aver-age kWh value from the authorized energy rates
The formula for calculating an electric under-recovery or over-recovery is
Under-recovery or over-recovery equals
[actual margin minus ratecase forecasted margin established in the most recent rate proceeding]
The summation is over each tariff A positive value equals an over-recovery and a negative value equals an
Decoupling Case Studies Revenue Regulation Implementation in Six States
17
29 The required spending level was higher for the year 2011 owing to a temporary change in state policy
30 ACEEE Wisconsin Available at httpaceeeorgsectorstate-policywisconsin
31 The Cadmus Group Inc (2013)
under-recovery The margin reflected in the formula equals the total revenue for each tariff less the costs associated with the annual per-kWh value established for monitored fuel costs and excluding any surcharges credits taxes or similar charges
In the event that a true-up will cause rates to increase the Commission will provide an opportunity for a hear-ing Revenue regulation adjustments occur as a part of the general rate case
The revenue regulation adjustments are subject to a $14 million per year cap for electric excluding carrying costs Any adjustments over that amount will not be carried over and will not be collected from ratepayers Equivalently revenue over collection in excess of $14 million will not be returned to ratepayers
Complementary PoliciesWPS like all other investor-owned utilities
in Wisconsin is required to spend 12 per-cent of its annual operating revenues on en-ergy efficiency and customer-owned renew-able resource programs that are administered by a third party through the Focus on Energy program which was established in 200229 Separately through a contract the PSCW ap-proves annual electricity savings goals for the Focus on Energy program The savings goals were equivalent to 075 percent of electric sales for the participating utilities from 2011 to 2013 In addition the PSCW approved a rate of return on investments in energy efficiency for Wisconsin Power amp Light and other utilities can propose incentives as part of their rate cases However WPS has not yet proposed an incentive mechanism30
WPS offers residential customers a default flat rate but they also offer a TOU option with winter and summer on-peak off-peak and shoulder tiers For small commercial and industrial customers there are flat rates TOU rates and critical peak rates Large commercial and industrial customers can take service under a TOU rate with summer and winter on-peak and off-peak rates a TOU with criti-cal peak rate or under a special contract rate unique to the customer and approved by the Commission
The authorized level of expensed conservation costs recoverable in rates for the test year (2013) is $19778728 The level for electric utility operations consists of the conservation budget of $17669792 and an escrow adjustment of $2108936 which represents the test year amortization of the projected overspent escrow balance at
December 31 2012 over two years Wisconsin has a statute requiring filing of reliability data
but no reward or penalty system to support its revenue regulation system
Energy Efficiency OutcomesWPS implemented revenue regulation in 2009 In order
to gain approval for the original revenue regulation mecha-nism WPS agreed to fund energy efficiency and renewable energy programs at levels above their 12-percent statutory minimum contribution to Focus on Energy Focus on Energy produces an annual report of energy efficiency program activities In its 2012 report Focus on Energy reports the following outcomes achieved for WPSrsquo service territory The table below represents the savings under the statewide Focus on Energy Programs and does not represent the savings at-tributed under the funding levels above 12 percent31
Territory Segment
Customer Participation
Rate () Utility Type
Per Capita Lifecycle Bill Savings ($)
Per Capita Incentive
($)
WPS Electric Commercial $115258 3 $8330
WPS Electric Industrial $9026768 96 $892463
WPS Electric Residential $6494 36 $666
ResourcesPublic Service Commission of WisconsinApplication of Wisconsin Public Service Corporation for
Authority to Adjust Electric and Natural Gas Rates Final Decision (December 7 2012) Docket No 6690-UR-121
David J Kyto Wisconsin Public Service Corporation Application of Wisconsin Public Service Corporation for
Authority to Adjust Electric and Natural Gas Rates Supplemental Direct Testimony (May 15 2012) Docket No 6690-UR-121
Focus on EnergyThe Cadmus Group Inc (2013) Focus on Energy Calendar
Year 2012 Evaluation Report Appendixes Portland OR The Cadmus Group Inc Retrieved from httpwwwfocusonenergycomsitesdefaultfilesFOC_XC_CY201220Report20Appendices20A-O20Final2005-3-13pdf
Decoupling Case Studies Revenue Regulation Implementation in Six States
18
32 DPU 07-50 (2007)
33 DPU 07-50 (2007) pp 392ndash396
Massachusetts National Grid
The revenue regulation mechanism for National Grid (Massachusetts Electric Company and Nantucket Electric Company together doing business as National Grid) compares authorized
distribution revenue to actual distribution revenue Revenue is compared and adjustments are made separately for each customer class
AuthorityThe Massachusetts Department of Public Utilities (DPU)
adopted revenue regulation as a statewide regulatory policy in 2008 and individual utilities filed revenue regulation tariffs in response In its Investigation Into Rate Structures that will Promote Efficient Deployment of Demand Resources32 the DPU investigated rate structures and revenue recovery mechanisms that may reduce disincentives to the efficient deployment of demand resources in the state and consid-ered how the electric and natural gas distribution compa-niesrsquo existing cost recovery mechanism could be changed to better align the companiesrsquo financial incentives with policy objectives while ensuring that the companies are not finan-cially harmed by the increased use of demand resources The DPU finally concluded that revenue regulation mecha-nisms would eliminate the financial disincentives because they sever the link between the companiesrsquo revenue and reduction in sales The DPU also endorsed a revenue per customer approach but recognized that other factors could result in changes to distribution-related costs and consent-ed to consider company-specific ratemaking proposals that accounted for the impact of capital spending and inflation-ary pressures on the companyrsquos required revenue
Authorized Revenue RequirementThe authorized revenue requirement does not include
costs that are reconciled outside of base distribution rates including energy supply costs for basic service customers transmission costs the energy efficiency system benefits charge and reconciling charge and costs recovered through the residential assistance adjustment factor
Rate of ReturnThe Commission recognized the effects of revenue
regulation on ROE and determined that revenue regulation reduces volatility which reduces risk and a downward ad-justment to ROE was appropriate but did not make its ac-tual ROE adjustment for the revenue regulation mechanism explicit in its order33 The DPU determined that a return on equity equal to 1035 percent was sufficient The testimony from National Grid supporting its proposed ROE presented comparisons of allowed ROE for a set of companies that had revenue regulation or another risk management mecha-nism in place to account for an implied reduced risk profile in developing that proposal
Revenue Adjustment MechanismEach year the authorized revenue requirement is ad-
justed to account for capital expenditures in the previous year The CapEx Adjustment applies to capital expenditures incurred by National Grid for distribution system invest-ments in the previous year net of the amount recovered through depreciation expense in base rates This accounts for the material difference in expected capital expenditures compared with prior years In this way the CapEx Adjust-ment in the National Grid revenue regulation mechanism is a special case of a ldquoK Factorrdquo which characterizes an expected change in costs in the future and accounts for those changes when they occur Each year the Company files with the Department documentation in support of the capital expenditures it has incurred since the previous review The Department reviews the filings to determine the prudence of the incremental expenditures and whether the expenditures are used and useful National Grid then allocates approved expenditures to rate classes based on the cost of service study For each class the Company determines the adjustment allocated to the rate class then divides this sum by the forecasted kWh sales for the follow-
Decoupling Case Studies Revenue Regulation Implementation in Six States
19
34 DPU 07-50 (2007) p 87
35 ACEEE Massachusetts Available at httpaceeeorgsectorstate-policymassachusetts
36 Personal communication with National Grid
ing year to determine the per-kWh adjustment In order to provide a balance between providing the
Company with sufficient funds to ensure the safety and reliability of the distribution system and protecting ratepay-ers against the incentive the Company has to overinvest in infrastructure the mechanism limits the level of annual capital expenditures that is recoverable through the mecha-nism To arrive at the amount the Department set a limit of $170 million per year which is equal to the approximate three-year average of the Companyrsquos capital spending in previous years Should the Companyrsquos capital expenditures exceed this limit it may seek to include the investment in the rate base during the next base rate proceeding
The Company submits its CapEx filing no later than July 1 of each year On November 1 of each year the Company submits all other information in support of its proposed adjustment factors The factors will take effect on March 1 of each year
The authorized revenue is also adjusted to include a 50-percent sharing for earnings above the authorized ROE
Reconciling Actual Revenue With Authorized Revenue
Each year National Grid calculates on a rate class-spe-cific basis the difference between the actual distribution revenue billed to customers through distribution rates and the annual target revenue For each rate class the difference between the actual billed distribution revenue and the an-nual target revenue is summed to determine the Company-wide reconciliation amount That amount is divided by the Company-wide kWh forecasted for the upcoming year to arrive at a cent-per-kWh reconciliation charge or credit To determine the final adjustment for each rate class the Company-wide reconciliation adjustment is added to the rate class-specific adjustment resulting from the target rev-enue adjustment mechanisms
The adjustment to the authorized revenue in any year is capped at three percent of total revenues34 Any excess can be carried forward to a future year with carrying charges equal to the customer deposit rate
National Grid must report to the DPU if the difference between the year-to-date billed revenue and year-to-date annual target revenue equals or exceeds ten percent of the target revenue and the Company believes that the difference will fall outside of the ten-percent threshold in the coming months In this case interim revenue regulation adjust-ments can be made In order to avoid an interim adjust-ment too close to the scheduled annual rate adjustment
National Grid must notify the Department of variances exceeding ten percent of annual target revenue by August 31 of each year
Complementary Policies Massachusetts requires that electric utilities procure
all cost-effective energy efficiency before more expensive supply-side resources This requirement was translated into annual savings requirements for electric utilities starting from 1 percent of sales in 2009 to 14 percent in 2010 2 percent in 2011 and 24 percent in 2012 and potentially increased savings in subsequent years Utilities can earn approximately five percent of program costs for meeting or exceeding savings targets35
National Grid offers inclining block rates as the default residential rate but there is an optional TOU rate with peak and off-peak tiers also available to residential customers Small and large industrial and commercial customers can take service under flat rates inclining block rates or TOU rates
National Grid operates under a penalty and reward sys-tem for service quality established in Docket DTE 99-84 The impetus behind the DPUrsquos original establishment of the Service Quality Guidelines was to prevent Massachusetts utilities from allowing service quality to deteriorate under a new regulatory regime
Energy Efficiency OutcomesBefore Massachusetts Electric implemented revenue
regulation in 2009 it reported consistently high levels of incremental energy efficiency savings approximately 09 percent of retail load In 2010 the company reported 136 percent savings and 159 percent in 2010 and 2011 respectively36
ResourcesMassachusetts Department of Public UtilitiesDocket 09-39 Petition of Massachusetts Electric Company
(November 30 2009)
Decoupling Case Studies Revenue Regulation Implementation in Six States
20
37 Energy Agreement Among the State of Hawaii Division of Consumer Advocacy of the Department of Commerce amp Consumer Affairs and Hawaiian Electric Companies Available at httpwwwhecocomvcmcontentStaticFilespdfHCEIpdf
38 The HECO Companies described as follows in their Reply SOP in the Schedule A decoupling proceedings ldquothe
Hawaii Hawaiian Electric Company
Hawaiian Electric Company (HECO) uses a revenue regulation mechanism that compares actual revenue to target revenue in each year The target revenue is based on the authorized
revenue for the last test year adjusted for operation and maintenance (OampM) increases and rate base changes
HECO is a subsidiary of Hawaiian Electric Industries which also operates Maui Electric Company (MECO) and Hawaiian Electric Light Company these subsidiaries service the islands of Maui and Hawaii County while HECO serves Oahu (Honolulu)
Authority In 2008 the Governor of Hawaii the Division of Con-
sumer Advocacy and HECO entered into an agreement as a result of the Hawaii Clean Energy Initiative37 The agreement is intended to move Hawaii away from its dependence on imported fossil fuels for electricity and ground transporta-tion and toward locally produced renewable energy and energy efficiency In the agreement the State the Consumer Advocate and HECO committed to among other things a transition away from a model that encourages increased elec-tricity usage and to a model that implements revenue regula-tion decoupling to encourage the development of renewable energy by HECO The Commission opened Docket 2008-0274 in order to examine the features of a revenue regula-tion mechanism The Opening Order directed HECO and the Consumer Advocate to file a joint proposal on revenue regulation within 60 days This joint proposal was modeled closely after the California mechanism described earlier for PGampE with a rate-case determined revenue requirement plus annual attrition adjustments plus separate mechanisms
to recover power supply and energy efficiency costsThe Hawaii Public Utilities Commission approved
revenue regulation for HECO in August 2010 based on an investigation into the appropriateness of revenue regula-tion and its design The revenue regulation mechanism took effect on March 1 2011 This replaced a previous lost revenue adjustment mechanism
Authorized Revenue RequirementThe Commission establishes the Authorized Base Rev-
enues through a general rate case based on traditional cost-of-service ratemaking principles The Authorized Base Revenue is the annual amount of revenues required for the utility to recover its estimated OampM depreciation amorti-zation and tax expenses for the period
The Target Revenue is equal to the base revenue require-ment less any revenue being separately tracked or recov-ered through any other surcharge or tracking mechanism including revenue for fuel and purchased power expenses
The revenue regulation order also requires staggered triennial rate cases for each of the Hawaiian Electric Indus-tries Companies to determine approved baseline Revenue Adjustment Mechanism (RAM) inputs
Rate of ReturnThe Commission made no explicit adjustment to ROE
owing to the revenue regulation mechanism but noted that the allowed ROE of ten percent reflects the approval of revenue regulation and other cost-recovery mechanisms that will lower HECOrsquos business risk38 Most recently the Hawaiian Public Utilities Commission approved a 90-per-cent ROE for MECO reflecting both a lower baseline cost
Commission effectively reduced the Companiesrsquo return on common equity by 50 basis points to ldquofairly compensate ratepayersrdquo for what it perceived as the ldquorisk-reducingrdquo effects of the RBA and RAM mechanisms the Renewable Energy Infrastructure Program (lsquoREIPrdquo) Surcharge and the Purchased Power Adjustment Clause (ldquoPPACrdquo)rdquo Available at httpdmspuchawaiigovdmsDocumentViewerpid=A1001001A10L29B55326B47993
Decoupling Case Studies Revenue Regulation Implementation in Six States
21
39 Hawaii PUC Decision and Order No 31288 (2013 May 31) pp 97ndash112
40 Hawaii PUC Decision and Order No 31289 (2013 May 31)
41 Hawaii PUC Decision and Order No 31908 (2014 Feb 1)
42 February 7 2014 order on schedule A issues Available at httpdmspuchawaiigovdmsDocumentViewerpid=A1001001A14B10B22326F07922 p 42ndash47
of capital and a penalty of 050 percent associated with inadequate performance bringing renewable energy into the MECO system39 A companion Order also established new guidance on future revenue regulation mechanisms40
Revenue Adjustment MechanismThe RAM is designed to replace the need for annual rate
cases by adjusting Authorized Base Revenue levels to reflect estimated changes in the utilityrsquos cost of service The RAM is intended to via formula-driven estimates and escalators compensate the HECO Companies for changes in util-ity costs and infrastructure investment between rate cases and reduce the frequency of rate cases The RAM Period is the calendar year containing the Annual Evaluation Date (March 31 the date of the annual RAM filing) The RAM adjusts the revenue requirement according to changes in four main categories of expenses
bull Base expenses which are changes in designated OampM expenses
bull Rate base the return on incremental investment in designated rate base components41
bull The incremental depreciation and amortization expenses and
bull Exogenous tax changes changes in costs owing to significant changes in tax laws or tax regulations
Base expenses are segregated between labor and non-labor amounts The labor component is adjusted annually by the Labor Cost Escalation Rate reduced by the Labor Productiv-ity Offset (fixed at 076 percent) The non-labor component uses the Non-labor Escalation Rate to annually adjust those costs Tracked OampM expenses for fuel purchased power pension and post-employment benefits integrated resource planning DSM and other rate adjustment provisions are not adjusted in the RAM because any changes in these costs are accounted for in other cost-tracking mechanisms
The Rate Base equals the average net investment esti-mated for the RAM Period The average rate base is the rate base for the rate case test year with adjustments for changes in only four components of rate base (1) average plant-in-service (2) average Accumulated Depreciation (3) average accumulated contributions in aid of construc-tion and (4) average accumulated deferred income taxes All other components of the rate base remain the same as in the preceding rate case test year The average plant-in-service is equal to the average of the actual plant-in-service at the end of the year prior to the RAM period the Evalu-ation Year and the same year-end balance plus estimated plant additions for the RAM period Plant additions include
Baseline Capital Project plant additions and Major Capital Projects plant additions estimated to be in service by Sep-tember 30 of the RAM period
The RAM also includes an Earnings Sharing Revenue Credit mechanism in order to protect against excessive over-all utility revenue levels The RAM will escalate and update the Companyrsquos approved base revenue requirement reduced by earnings sharing credits and major project revenue credits to customers Based on the Companyrsquos achieved return on common equity for the Evaluation Year the mechanism cred-its the RBAs according to the following chart
ROE at or below the authorized ROE
First 100 basis points (1) over authorized ROE
Next 200 basis points (2) over authorized ROE
ROE exceeding 300 basis points (3) over
authorized ROE
Retained entirely by shareholders no customer credits
25 share credit to customers
50 share credit to customers
90 share credit to customers
Finally the RAM includes additional consumer protectionsbull A provision for Major Capital Projects Creditsbull A provision for Baseline Capital Projects Creditsbull Notification is provided to all affected customers of
the RAM filing in newspapers and billsbull Evaluation procedures for filing examination and any
exceptions to annual revenue regulation filingsbull Continued ability of HECO or the Consumer
Advocate to request formal rate proceedings to replace and terminate RAM at any time and
bull Formal review of revenue regulation as a part of the next round of rate case proceedings
A recent order42 added two additional consumer protections
bull A limitation that only 90 percent of the current
Decoupling Case Studies Revenue Regulation Implementation in Six States
22
43 ACEEE Hawaii Available at httpaceeeorgsectorstate-policyhawaii
RAM Period Rate Base that exceeds the Rate Base Adjustment Mechanism from the prior year can be included in the Decoupling Mechanism for baseline utility plant projects which unlike major capital projects are not subject to prior Commission review and approval and
bull A requirement to post a number of metrics online for customer review although not at this point tied to performance
This order also examined four issues with respect to the application of the RAM The Commission determined that the short-term debt rate as reflected in the most recent rate case should be used to adjust over- and under-collections The Commission also resolved its concern that without a sustainable business plan there exists no strategic frame-work under which to evaluate capital expenditure pro-grams The Commission required the parties in the Docket to further explore capital expenditure issues in conjunction with other risk-sharing mechanisms discussed elsewhere in the order The commission ordered a further evaluation of a proposed risk-sharing mechanism within the RBA Further-more the Commission ordered the parties to work together to establish appropriate metrics which the utility would report on its website
Once the total RAM Revenue Adjustment is calculated it is applied through a uniform adjustment to the per-kWh energy charge for all customer classes
Reconciling Actual Revenue with Authorized Revenue
RBAs record the monthly differences between target revenues and the adjusted recorded electric sales revenues The RBA also applies monthly interest equal to the annual rate for short-term debt from the cost of capital in each HECO Companyrsquos last base rate case to the simple average of the beginning and ending balances each month in the RBA In effect the RBA applies one-twelfth of the rate each month Finally the RBA provides for collection or return of the calendar year-end balances in the RBA and recovery of the RAM Revenue Adjustment over the subsequent May 1 through April 30 period The target revenue is the most recent Authorized Base Revenue or the re-determined Authorized Base Revenue calculated under the RAM
On or before March 28 the Company must file with the Commission a statement of the previous year-end balance in each RBA sub-account and the Authorized Base Revenue level for the current calendar year with supporting calculations An amortization of the year-end balance in the
RBA sub-accounts and the RAM Revenue Adjustment are recovered through the per-kWh RBA rate adjustments The rate adjustment occurs from May 1 of the current calendar year to April 30 of the next year
Complementary PoliciesCurrently electric utilities in Hawaii may use energy
efficiency to meet a portion of their Renewable Portfolio Standard requirements Starting in 2015 electricity savings from energy efficiency will be applied to the Statersquos Energy Efficiency Portfolio Standard which sets a target equivalent to 30-percent forecast sales by 2030 This goal is translated into a target of 14 percent annual savings HECO trans-ferred administration of all of its energy efficiency programs to a third party administrator in 2009 The administrator is compensated for satisfactory performance43
Because of its heavy dependence on petroleum as a generation fuel electricity prices in Hawaii are very high solar and wind are typically lower-cost resources for these systems HECOrsquos default residential rates are inclining block rates with a $900month customer charge and a three-block inclining rate design of $034kWh to $037kWh Residential customers can elect to take service under a TOU rate with off-peak mid-peak and priority-peak tiers Gen-eral service and large power service customers take service under a flat rate unless they opt to take service under a TOU
Hawaii is developing reliability standards in part as a response to deteriorating service quality as a result of distributed and customer-owned generation (see text box) In an effort to make electricity reliability and interconnection standards as transparent as possible the Reliability Standards Working Group was formed in the Feed-In Tariff docket and continues its work in Docket No 2011-0206 to find solutions to integrating high penetrations of renewable energy consistent with reliability and power quality standards
Energy Efficiency OutcomesHECO implemented revenue regulation in 2011 Since
2003 HECO has reported incremental energy efficiency savings between 0 and 05 percent of retail load with 131 percent savings reported in 2011 by Hawaii Energy the
Decoupling Case Studies Revenue Regulation Implementation in Six States
23
44 Hawaii PUC Decision and Order No 31288 Maui Electric Company Limited Docket No 2011-0092 (2013 May 31) Appendix C p 2
Statersquos ratepayer funded efficiency program administrator The company has not yet reported its savings for 201245 In addition HECO has seen more than a sixfold increase in renewable installations under its net metering and feed-in tariff policies since the inception of the revenue regulation plan
Revenue regulation represents a regulatory framework that removes the financial disincentive for utilities to pursue clean
energy strategies It doesnrsquot in and of itself align the utility business model with those utility policies and practices that address customer expectations In fact some commissions are concerned that it might create a dynamic in which the utility assured of its revenue needs becomes complacent and lacks motivation to innovate and develop strategies that may be more in line with the public interest
In a recent order (Docket 2011-0092 May 31 2013) the Hawaiian Public Utilities Commission addressed this big picture issue in a rate order for Maui Electric The Commission called out the management as lacking a long-term vision for creating customer value and expressed concern that ldquothe HECO Companiesrsquo over-reliance upon a link between the [Decoupling]
Agreement and utility financial health obfuscates utility performance and ultimately customer service and satisfactionrdquo44 The implementation of clean energy policies is not a singular goal but rather a policy that must be part of a larger effort to create customer value
The Commission laid out a hard path and a soft path to achieve the results they desire for consumers The hard path involves a closer examination of utility investments operations and expenditures The soft path is opened through the actions of management to create and execute a vision for the utility of the future The Commission remains committed to regulatory innovations that are in the public interest and will work with the utility consumer advocate and other stakeholders to create and implement this vision
The results of this effort will likely produce ideas and outcomes that will have applicability beyond this one utility
ResourcesHawaii Public Utilities CommissionDocket No 2008-0274 Final Decision and Order (August 31 2010)Docket No 2008-0083 Final Decision and Order (December 29 2010)Docket No 2011-0092 Final Decision and Order May 31 2013 including
Decision and Orders Nos 31288 and 31289Docket No 2013-0141 Final Decision and Order (February 1 2014) including
Decision and Order No 31908
45 EIA Form EIA-861 data files Available at httpwwweiagovelectricitydataeia861
Decoupling Case Studies Revenue Regulation Implementation in Six States
24
46 Lazar et al 2011
Discussion of the Six Utilities Overall
Authority The first step in implementing a revenue regulation
mechanism is to understand the authority of the regulating body the Public Utility Commission or PSC It is important for any Commission to clarify its justification for acting on revenue regulation in order to prevent any decisions from being overturned Over the years Utilities Commissions have relied on different justifications for implementing revenue regulation mechanisms Commissions have imple-mented revenue regulation at their own discretion justified by their directive to ensure safe reliable and economic public utility service to citizens to justify changing the regulatory environment In some cases the Commission is unable to engage on narrow issue ratemaking and rates can change only as the result of a full rate case In this case statutes must be amended to enable revenue regulation
In all of the case studies discussed here the Commis-sions first implemented revenue regulation at their own dis-cretion but each followed slightly different paths to do so The CPUC first implemented revenue regulation in 1978 at its discretion In 2001 after a period when mechanisms were suspended the California Legislature required that deviations from projected sales not result in under- or over-collections by utilities and so the CPUC re-implemented revenue regulation according to statutory requirement The Hawaii Public Utilities Commission implemented rev-enue regulation after an agreement between the utility the Governor and other stakeholders called for it In Idaho the Commission established a case in which to investigate rev-enue regulation and held a series of stakeholder workshops before implementing the policy The Massachusetts DPU adopted revenue regulation as a statewide regulatory policy and required individual utilities to file tariffs in response as the result of its general investigation into rate structures that promote demand-side resources The Maryland Com-mission implemented revenue regulation for BGE when the utility requested the mechanism Thus the impetus to develop a revenue regulation mechanism may come from different sources and the Commission may be comfortable
in moving forward under their general supervisory statutes Nevertheless specific statutory language can be helpful to shore up the existing authority
Authorized Revenue Requirement Under the traditional regulatory framework the Com-
mission (or other authority in the case of publicly owned utilities) must determine a utilityrsquos revenue requirement This function does not change under revenue regulation The revenue requirement of a utility is the aggregate of all the operating and other costs incurred to provide service to the public This typically includes operating expenses depreciation and the cost of capital invested including in-terest on debt and a ldquofairrdquo return on equity to investors The (simplistic) formula for determining revenue requirements is as follows
Revenue Requirements = (Rate Base times Rate of Return) + Operating Expenses + Depreciation +Taxes
Traditionally the revenue requirement along with sales is used to determine the rates consumers will pay for elec-tricity46 The rates are also broken down by customer class and intraclass tariffs are created based usually on a cost of service study that determines each customer class and subclass contribution to the utilityrsquos costs The (simplistic) formula for determining the rate per unit is
Rate = Revenue Requirement divide Units Sold
In this way rates are set to allow the utility to exactly recover its revenue requirement when the sales level used to calculate rates is equal to actual sales However it is important to recognize that actual expense and revenue varies with actual sales When actual sales are greater than the sales level used in ratemaking revenue increases and expenses increase by a different amount when actual sales are lower than the ratemaking sales level actual revenue
Decoupling Case Studies Revenue Regulation Implementation in Six States
25
declines and expenses decrease by a different amount Under revenue regulation rates are initially set in the same way but when actual sales differ from the level used to calculate rates the actual revenue level is maintained at the rate case amount as rates are allowed to vary inversely with salesmdashincreased sales lead to decreased rates and vice versa Because the primary expenses that change in the short run as sales levels change are power supply expenses and most regulators allow these to be tracked using a power cost adjustment mechanism revenue regulation mechanisms are generally designed to ensure recovery of the non-power costs (which do not change significantly in the short-run) as sales volumes change
Revenue regulation ensures that actual revenue is equal to the revenue requirement established by the Commission or appropriate authority Although the description above presents an overly simplified view of the revenue require-ment and its use in traditional price regulation and revenue regulation there are many variations on how a Commis-sion can establish a revenue requirement particularly when implementing revenue regulation With revenue regulation as in traditional ratemaking imprudent costs can always be removed from rates and there is no change to the ability of a Commission to impose penalties
Utility Functions to be IncludedFirst the regulator must determine which utility func-
tions will be included in the revenue regulation framework With vertically integrated utilities this usually includes a utilityrsquos regulated generation transmission and distribution units As we discuss below however it is critical to struc-ture power supply recovery mechanisms to avoid providing for double-recovery of certain power supply costs For utili-ties operating in areas of the country that have restructured electricity markets only the regulated distribution busi-ness is decoupled Utilities that also provide gas services
Pacific Gas amp Electric Future test year
Idaho Power Company Historic test year
Baltimore Gas amp Electric Hybrid test year
Wisconsin Public Service Corporation Future test year
National Grid Historic test year
Hawaiian Electric Company Future test year
Table 2
Test Year Used
may have their gas distribution business operating under revenue regulation as well
Test YearOne consideration in establishing the revenue require-
ment is what period of time will be used as a ldquotest periodrdquo or ldquotest yearrdquo The test year is the year on which the Com-mission will base its computations of the utilityrsquos total costs and sales levels A historic test year uses actual data on sales and costs from a past year Whereas a historic test year allows for the use of actual cost data it cannot account for expected variations in sales A future test year requires assumptions to be made about a utilityrsquos sales in a future year This can allow expected changes in sales like those from energy efficiency programs to be included in sales
projections however because regulators are relying on estimates provided by the utility there may be a greater risk for inaccuracy A Commission may also choose to use a test year that includes both past and future periods This may provide a sense of balance between historic and future data Furthermore as the case proceeds the Commission can require the utility to substitute historical data for projected data from the test year
Rate of ReturnAs in any rate case regulators
must determine the appropriate rate of return that a utility can earn on its investments including the cost of debt and the allowed ROE for its shareholders The approved ROE is only used to establish the return on investments that are included in the rate base when determining revenue require-
Pacific Gas amp Electric Electric generation and distribution gas distribution
Idaho Power Company Electric generation and distribution
Baltimore Gas amp Electric Electric distribution gas distribution
Wisconsin Public Service Corporation Electric generation and distribution
National Grid Electric distribution
Hawaiian Electric Company Electric generation and distribution
Table 1
Business Unit Included in the Revenue Regulation Model
Decoupling Case Studies Revenue Regulation Implementation in Six States
26
47 In a rate case the Commission determines an allowed return on equity This is used to set a price (price regulation) or an allowed revenue requirement (revenue regulation) Once set however the actual return earned by the utility is affected by anything that changes either revenue or expenses for example an increase in employee compensation a change in the number of employees or under price regulation a change in sales volumes
48 Lazar et al 2011
ments Although revenue regulation ensures that a utility recovers no more or less than its target revenue revenue regulation does not guarantee that the utility will earn the authorized ROE Depending on how a utility manages its costs between rate cases it will realize an actual ROE either higher (in the case of reduced costs) or lower (in the case of increased costs) than the authorized level47
A utilityrsquos allowed ROE generally represents the return deemed necessary to attract investment considering the level of risk of that investment Riskier investments require a higher return to attract investors and vice versa Util-ity earnings can be volatile because of short-run impacts on sales volumes and revenues which include changes in sales owing to weather economic conditions and energy efficiency and DG programs This volatility typically causes utilities to retain a higher level of equity in their capital structures so that reduced revenues do not leave them un-able to service their debt Revenue regulation can reduce this volatility by stabilizing revenues regardless of the cause Because of this reduced risk many stakeholders have proposed that the implementation of a revenue regulation mechanism be associated with a corresponding reduction in the utilityrsquos equity capital ratio (the percentage of capital supplied by common equity) This reflects the utilityrsquos more stable revenue owing to revenue regulation and reduces the overall revenue requirement that will be recovered from consumers48
An alternative option to reducing the utilityrsquos equity ratio is to reduce the ROE reflecting a lower risk level For the utilities included in these case studies only BGE and Mass Electric experienced a reduction in their ROE The Com-mission did not reduce BGErsquos ROE at the time the revenue regulation mechanism was implemented but reduced it by 50 basis points during the subsequent rate case The Mas-
sachusetts Commission did not reveal its adjustment but incorporated a lowered ROE into its decision
Absent an explicit adjustment to the cost of capital investorsrsquo expectations will adjust to the presence of rev-enue regulation if its presence is reliable The more stable earnings will likely in time contribute to a higher credit rating That in turn will lead to lower cost debt that will be revealed in future cost of capital calculations An adjust-ment to the ROE or capital structure by the regulator in a rate proceeding will be reflected immediately in lower rates to consumers simply allowing the utilityrsquos credit rating to improve over time and its cost of debt to decline will have the same effect but on a lagged basis as new bonds are is-sued at lower interest rates49
Beginning in 2004 Standard and Poorrsquos began publish-ing ldquorisk profilesrdquo for utilities which classified utilities based on their earnings variability and other risks those with more stable earnings were determined eligible for higher bond ratings at any given equity capitalization ratio (or alternatively able to retain a given bond rating with a lower equity ratio)50 One utility with a revenue regulation mechanism Northwest Natural Gas was believed to have had their business risk profile upgraded by one step in response to the benefits of the mechanism51
Effect on Bond RatingsRevenue regulation stabilizes a utilityrsquos revenue streams
reducing risk to investors this reduced risk may be a contributing factor in an increase in a utilityrsquos bond rating Bond rating agencies have recognized that revenue regula-tion mechanisms and other mechanisms that reduce net earnings volatility and risk contribute to a lower cost of capital for the utility52 Standard and Poorrsquos has explicitly stated that it ldquoviews decoupling as a positive develop-
49 Lazar et al 2011
50 Standard and Poorrsquos (2004 June 2) New Business Profile Scores Assigned for US Utility and Power Companies Financial Guidelines Revised
51 Christensen Associates (2005 March) A review of distribution margin normalization as approved by the Oregon Public Utility Commission for Northwest Natural
52 Lazar et al 2011
Decoupling Case Studies Revenue Regulation Implementation in Six States
27
This topic raises a note of caution if mechanisms are not well designed double-recovery of costs can occur for verti-cally integrated utilities that provide both power supply and distribution services For example if a per-customer
revenue regulation mechanism includes investment-related power supply costs in the revenue-per-customer formula but excludes fuel and purchased power costs that are recovered through a separate tracking mechanism double recovery of some power supply costs is likely If the utility experiences cus-tomer and sales growth the amount it recovers for investment-related power supply costs will go up However if that utility serves this growth by operat-
ing existing power plants more by selling less power on the surplus market or by purchasing power from other suppli-ers it will not incur any increases in the type of power sup-
53 Standard amp Poorrsquos (2008 February 19) Decoupling the vehicle for energy conservation
ment from a credit perspectiverdquo53 However in the case of the utilities examined in this report none experienced an improved credit rating after the implementation of revenue regulation with the exception of PGampE However PGampE came out of Chapter 11 bankruptcy in the same year that its revenue regulation mechanism was implemented mak-ing it impossible to attribute the improvement to revenue regulation alone Bond rating changes are generally slow to evolve Numerous other factors are taken into account when assigning an overall credit rating which appear to have outweighed any positive effect of revenue regulation These factors certainly include the recession of the US economy that began in 2007
Customer Classes IncludedWhen determining the target revenue for a utility rev-
enue regulation mechanism regulators must also consider which customer classes to include in the mechanism In some cases industrial customers have objected to a rev-enue regulation mechanism This is due to the wide dif-ference in rates among customers making the design of a revenue regulation mechanism more challenging If regula-tors choose to exclude a class of customers from revenue regulation they must determine the revenue requirement associated with serving only the included customer classes This generally requires a detailed cost of service study to ensure that revenue responsibility is accurately allocated by customer class
Included CostsFinally regulators may wish to exclude specific costs
from the overall revenue requirement if those costs will be tracked through another mechanism like fuel costs in a PCA mechanism energy efficiency program expenditures or smart grid costs for example Separate tracking mecha-nisms can also be used for those costs that are difficult to
Pacific Gas amp Electric All customer classes
Idaho Power Company Residential and small general service
Baltimore Gas amp Electric Residential and small general service
Wisconsin Public Service Corporation All customer classes
National Grid All customer classes
Hawaiian Electric Company All customer classes
Pacific Gas amp Electric
Idaho Power Company
Baltimore Gas amp Electric
Wisconsin Public Service Corporation
National Grid
Hawaiian Electric Company
Table 3
Customer Classes Included in Revenue Regulation Mechanism
Table 4
Costs Excluded From Revenue Regulation Mechanism
project based on historical data or costs over which the util-ity has very little control like fuel costs Although revenue regulation tracks collected revenue mechanisms like Fuel Adjustment Clauses Purchased Power Adjustments and Energy Efficiency Riders can be designed to track actual costs as well as collected revenue
Energy procurement costs
All variable costs
Energy supply costs
Energy costs
Energy supply costs for basic service customers transmission costs the energy efficiency system benefits charge and reconciling charge and costs recovered through the residential assistance adjustment factor
Fuel and purchased power
Decoupling Case Studies Revenue Regulation Implementation in Six States
28
54 We use the RAM term applied in Hawaii here to address any type of attrition or similar mechanism other than a revenue-per-customer framework that changes the allowed revenue between general rate cases
ply costs accounted for in the revenue per customer (RPC) calculation The increased power supply costs to serve that growth will be recovered through the fuel and purchased power tracking mechanism The net effect for the utility will be to recover incremental power supply costs twicemdashonce in the per-customer mechanism and again in the fuel and purchased power mechanism It is essential to make sure that the other adjustment mechanisms do not overlap the cost impacts that are treated in the revenue regulation mechanism One way to do this is to ensure that all power supply costs (investment labor fuel purchased power) are recovered through a single mechanism There are several ways to achieve this
a) A comprehensive power supply recovery mechanism that includes all power supply costs that is separate from the costs treated in the revenue regulation adjustment (eg Puget Sound Energy Washington State)
b) No power supply adjustment whatsoever with all utility costs included in an RPC mechanism (eg National Grid)
c) An annual attrition calculation with all costs reviewed for changes since the last proceeding (eg HECO)
Revenue Adjustment Mechanism in Revenue Regulation
A RAM54 is not necessary to achieve revenue regulation but provides attrition reliefmdashincreasing authorized revenue commensurate with increased costsmdashbetween rate cases Whereas revenue regulation sets a target revenue that the utility will earn regardless of sales levels the RAM adjusts the target revenue between rate cases Regulators may choose to take several different approaches to RAM
bull No RAM Regulators may choose not to implement a RAM leaving the revenue requirement unchanged between rate cases This requires the utility to request a rate case when it requires additional revenue to cover its costs
bull Stairstep Stairstep adjustments provide predetermined increases in target revenue These increases can be determined during a rate case and generally reflect forecasts of cost growth
bull Indexing Indexing ties adjustments to the target revenue to multiple factors like inflation productivity customer growth and changes in capital expenditures
bull RPC The RPC approach is a form of indexing RPC adjusts the total revenue requirement for the
number of customers served Regulators using an RPC mechanism will determine the revenue requirement per customer and the overall revenue requirement will be determined by multiplying the total number of customers by the revenue requirement per customer The amount of revenue required to serve each customer can be determined separately for customer classes and for existing and new customers This way the RPC method accounts for a utilityrsquos growth in fixed costs that is related to growth in the number of customers served RPC is useful where the correlation between cost growth and customer growth is significant It also protects customers from making up the deficit if there is a loss in customer load such as if a large business closes down or relocates
bull Hybrid Hybrid RAMs generally use stairstep increases to account for projected capital costs and indexing to account for OampM expenses
Adjustments from any type of RAM can be implemented automatically or through an attrition proceeding Some stakeholders oppose adjustments to the revenue require-ment outside of a rate case on the basis that this could allow the revenue requirement to increase significantly without examination of the impact on ratepayers or with-out due consideration of other costs and revenues For this reason some regulators choose to cap the total adjustment that can be made to the revenue requirement outside of a rate case
Table 5
Type of Revenue Adjustment Mechanism
Pacific Gas amp Electric
Idaho Power Company
Baltimore Gas amp Electric
Wisconsin Public Service Corporation
National Grid
Hawaiian Electric Company
Hybrid
RPC
RPC
RPC
No RAM potential capital expenditure adjustment
Hybrid
Decoupling Case Studies Revenue Regulation Implementation in Six States
29
55 Because this method results in changes in the price for service that are calculated after that service has been provided it fails the ldquono retroactive ratemakingrdquo statutes that guide most electricity regulators Customers are entitled to know the price of the commodity they are consuming at the time they use it
56 The closest to a current method in use for electric utilities in the BGE system of monthly reconciliation
Table 6
Tracking and Accrual of Difference BetweenActual and Authorized Revenue
Pacific Gas amp Electric
Idaho Power Company
Baltimore Gas amp Electric
Wisconsin Public Service Corporation
National Grid
Hawaiian Electric Company
Track Difference
Monthly
Monthly
Monthly
Yearly
Yearly
Monthly
Accrual Period
Year
Year
Month
Year
Year
Year
Calculation of Actual RevenueRegulators have options when ensuring that actual
revenue equals target revenue under revenue regulation First regulators must decide how to determine ldquoactual revenuerdquo In most cases actual revenue simply equals the amount of revenue a utility collects from its customers The Idaho Public Utilities Commission however has chosen to use weather-normalized revenues as the basis for utility revenues in revenue regulation Although this prevents the utility from recovering revenue lost to it owing to milder than expected weather it further complicates the revenue regulation mechanism and reduces its risk-reduction ben-efits By the same token if weather is severe and increases sales above the revenue requirements weather normaliza-tion would allow the utility to retain some of the revenues
Next regulators must determine whether to implement revenue regulation using a current or accrual method
bull Current Method With the current method of revenue regulation the target revenue for a period say a month is divided by the actual sales in that period to determine the rate per kWh The current method ensures that actual revenue equals target revenue by calculating the rate at the end of the period so that the target revenue can be recovered The current method allows for no lag in revenue recovery One effect of this method is that although customer rates vary total bills are generally more stable For example in a hotter than expected July customers will purchase more kWh but they will be charged a lower rate A milder than average winter would lead to fewer sales but at slightly increased rates This way customers do not experience the same bill variability as they would if rates were set before the sales deviations occurred On the other hand the current method does not provide customers with the ability to plan ahead based on a predictable rate for electricity This method has been used for revenue regulation of natural gas utilities55
bull Accrual Method Under the accrual method rates are set based on an assumed sales level and the differences between actual and target revenue are allowed to accrue over some period Then the total difference between actual and target revenue is reconciled through an adjustment to rates in the subsequent period this is known as the true-up process Presently all revenue regulation mechanisms for electric utilities use the accrual method56
If regulators use the accrual method of revenue
regulation they will next need to determine the period over which the difference between actual and target revenue will be allowed to accrue One year is typical however shorter periods are also used Next the frequency of comparing collected revenue to target revenue should be determined It is possible to do this comparison only once at the end of the accrual period It is common however for comparisons to occur more frequently often monthly When revenues are compared within the accrual period the differences are tracked generally for the purpose of applying interest to the difference that will be deferred until the end of the accrual period
Rate AdjustmentsIn designing a revenue regulation mechanism there are a
number of decision points that regulators need to consider to balance the interests of all the stakeholders One of the decision points revolves around the determination of the mechanism used to adjust rates The issues that regulators need to consider include the following1 Rate Case Requirements One of the often-mentioned
concerns about surcharges especially when they are numerous is how that will impact the frequency of rate cases For regulators and stakeholders rate cases provide
Decoupling Case Studies Revenue Regulation Implementation in Six States
30
the best mechanism to correctly align rates and costs but they are time-consuming and expensive for all parties This is because a rate case presents an opportunity to closely examine all of the utilityrsquos expenses and adjust rates to reflect cost increases and decreases Because under a revenue regulation mechanism the goal is to match revenues received from all customers with revenue requirements a correct determination of revenue requirements is important as is the specification of appropriate cost indices to adjust the revenue requirements As the time between rate cases increases some regulators feel the base rate case data even with adjustments need to be reexamined As a result some regulators have chosen to mandate the frequency of rate cases to address this whereas others have not It may be that in some cases where there are numerous surcharges recovering a multitude of costs there may not be as many costs subject to review in the rate case making it less significant to a regulator than a case in which most costs are being analyzed and recovered in the rate case itself
2 Collection Mechanism Integrally tied to the mechanism for recovering revenues is how the utility will collect or refund the revenues Options that are available include recovery through a rate case or periodic adjustments to rates through a surcharge mechanism As can be seen by the case studies depending on the plan in place some utilities have very discreet requirements dictating the frequency of rate cases with adjustments occurring in those cases or between those cases Other utilities have no requirements upon them with respect to the frequency of rate case filings This will be discussed in more detail below What does emerge from these case studies is that the discreet components or choices in how to execute a revenue regulation plan are carefully interwoven to create a holistic approach Each component works with the other and the value of this case study is in examining the different pathways that can be chosen As discussed previously some of the commissions have authorized revenue regulation to recover the revenue requirements in the last rate case whereas others have authorized adjustments to rates between rate cases this impacts the pathway that the adjustment mechanism takes
3 Timing How often should rates be adjusted to true up to the utilityrsquos revenue requirement States have chosen different options ranging from monthly to annually
4 Allocation of Revenue Regulation Revenue Surpluses or Deficits There are a number of decision points regarding allocation Should the revenue regulation apply to all rate classes or just the smaller customers whose usage per customer and load variations are not as dramatic as those of larger-use customer classes Should there be a different allocation to each rate class or should the allocation of costs among the classes be the same Different mechanisms accomplish different goals Some states have allocated revenue regulation revenues based on the revenues lost by customer class as a result of energy efficiency This can sometimes be a political decision to mitigate opposition to energy efficiency programs by large customers Other states recognize that the system savings resulting from energy efficiency benefit all customers so that all customers should pay equally
5 Carrying Charges Depending on the timing issue discussed previously regulators may want to consider carrying charges on any adjustments This should be symmetrical in its application however so that it applies to surcharges and refunds Consideration should be given for the basis of the carrying charge rate whether weighted average cost of capital rate of return a risk-free rate or some other mechanism should be adopted
6 Rate Caps In order to mitigate potential rate impacts a regulator may want to consider a cap on how much rates can go up when the revenue regulation adjustment is made This might be more critical if the regulator is aware of other potential rate increases that will impact customersrsquo bills If a cap is used the case in which the utilityrsquos adjustment would exceed the cap must be considered Some regulators have opted to allow the utility to carry over the excess unrecovered amount for a period of years whereas others do not This allows the utility to recover those revenues in a subsequent year when perhaps the adjustment is less As a practical matter however adjustments of greater than three percent are less common as shall be discussed later
7 Impact on At-Risk Consumers Low-income and consumer advocates have expressed concern about revenue regulation as a vehicle for annual rate increases without the scrutiny of a general rate case creating rate increases for the low-use customers doing the most to constrain usage and help achieve targeted energy savings One proposal to address this has been to impose any resulting surcharges only to above-average usage
Decoupling Case Studies Revenue Regulation Implementation in Six States
31
57 Cavanagh and Howat (2012 May 2) Finding common ground between consumer and environmental advocates Electricity Policy
58 The most common criticism of future test years is that utilities forecast costs under an assumption that all authorized personnel positions will be filled while in retrospect any large organization has some level of vacancy in its employee count A historic test year captures this effect fully
customers and any resulting credits only to below-average usage57
Rate Case RequirementRequirements as to the frequency of rate cases can be
tied to the recovery mechanism or to the entire regulatory framework for implementing revenue regulation In the cases studied two of the utilities require periodic rate cases PGampE every three years and WPS every year Two others National Grid and HECO require annual mini rate cases explained later in which adjustments are made and two others IPC and BGE have no requirements for scheduled rate cases Nevertheless if the concern is to ensure that the utilityrsquos revenue recovery meets its revenue requirements some kind of periodic rate case to examine costs is appropriate Having periodic rate cases can provide a measure of assurance to consumer advocates that the level at which the revenues and hence the rates are set is correct One of the criticisms of revenue regulation is in fact the lack of rate cases to produce a proper level of confidence in the allowed amounts Multiple surcharges are usually additive to existing rates therefore not permitting an opportunity to reduce the base rate for reductions in cost Moreover the infrequency in cases impedes the examination of rate allocations as would occur through a cost of service study
This is a particular issue where utilities are augmenting power supply with purchased power from independent power producers which is the most common method for acquiring wind and solar production today The increased cost for purchased power may flow through a fuel and purchased power adjustment mechanism while the (depreciating) investment in conventional power plants remains static in base rates
Both PGampE and WPS use a future test year that allows the utility to project revenue requirements during the time period that the rates are to be in effect The benefit to this is that it can help identify and account for projected changes in costs over the timeframe between rate cases However given that these costs are utility projections most consumer advocates have less confidence in these numbers than they would using actual numbers from a historical or only hybrid test year58 When trying to garner support for revenue regulation from more skeptical stakeholders using a future test year may not be helpful Furthermore in the case of WPS that has annual rate cases using a future test year becomes less justifiable as revenues are recalculated annually anyway
The absence of a rate case requirement can also cause consternation among detractors of revenue regulation because of the belief that the utility will be guaranteed its revenue requirements for as long as it is satisfied with that level irrespective of how well it manages However this is no different from the status quo in traditional regulation in most places The incentive to manage well is always there with or without revenue regulation as it translates into more profit for the utility
In the cases of HECO and National Grid the mini rate cases serve two purposes In the one instance it serves as a means to reconcile revenue recovery with revenue requirements and in the second instance it provides an opportunity to adjust rates in accordance with changes in costs Specifically for National Grid the revenue requirement is adjusted to reflect capital expenditures For HECO revenues are adjusted to reflect changes in the cost of service In the two examples here revenue regulation is wrapped in with other adjustments as part of a mini adjustment Given the structure for determining revenue requirements which accounts for changes in costs including revenue regulation within the mini rate cases is a workable option
These examples highlight how rate cases can be used to adjust revenue requirements either in a more controlled regulatory environment with frequent rate cases or left to the utilityrsquos discretion to decide when to adjust costs A set schedule of periodic rate cases such as that used by PGampE may strike an appropriate balance for reviewing revenue requirements however with the modification of a partial historical partial forecasted test year Frequent rate cases can depending on the resources of the regulator and stakeholders be too costly and time-intensive When there are too many rate cases stakeholders and regulators may not be able to dedicate the level of resources needed for any one proceeding and may be spread too thin Regular known rate cases at reasonable intervals may strike the best balance of adequate review and adjustment of revenue requirements
Decoupling Case Studies Revenue Regulation Implementation in Six States
32
Collection Mechanism and TimingThe collection mechanism for the differential between
actual and authorized revenue requirements varies by util-ity as well Both PGampE and WPS do not have adjustment clauses or surcharges but instead have structured their revenue regulation plans to recover their costs in a rate case with rates adjusted annually Although PGampE has rate cases every three years the utility files its preliminary forecast every September 1 for the following year including adjust-ments for revenue regulation and other costs This practice promotes transparency keeping all stakeholders aware of the current situation of the utility IPC BGE National Grid and HECO use surcharges on customer bills to collect or credit the difference between actual revenues collected and the revenue requirement Although the other three (IPC National Grid and HECO) calculate the rate adjustment annually only BGE does a more contemporaneous adjust-ment of one month Certainly where there are no regularly scheduled rate cases using an adjustment mechanism becomes more critical PGampE has created a tracking mecha-nism known as a balancing account that allows the utility to track the surpluses and deficits to help ensure accuracy at year end when rates are actually adjusted The creation of such monthly balancing accounts will make it easier at the end of the year to track what happened each month and then determine the adjustment for that year It provides a more detailed trail for review and analysis by stakeholders and regulators However other mechanisms that just look at total revenues as compared to revenue requirements at the end of the year can work as well
Table 7
Rate Case Requirements
Table 8
Rate Adjustments
Table 9
Allocation of Surplus or Deficit
Pacific Gas amp Electric
Idaho Power Company
Baltimore Gas amp Electric
Wisconsin Public Service Corporation
National Grid
Hawaiian Electric Company
Pacific Gas amp Electric
Idaho Power Company
Baltimore Gas amp Electric
Wisconsin Public Service Corporation
National Grid
Hawaiian Electric Company
Pacific Gas amp Electric
Idaho Power Company
Baltimore Gas amp Electric
Wisconsin Public Service Corporation
National Grid
Hawaiian Electric Company
Every three years annual ldquoattritionrdquo adjustments in between
No requirement
No requirement
Annual rate case
Annual capital expenditure adjustment case
Abbreviated annual rate case
Base rates adjusted annually
Annual adjustment through surcharge
Monthly adjustment through surcharge
Annual adjustment through rate case
Annual adjustment
Annual adjustment
Allocated to all customers according to business unit (eg electric distribution electric generation)
Included in the annual adjustment mechanism for each customer class
Separate for each customer class
Allocated to all customers except certain tariffs (see above)
Separate for each customer class
Separate for residential and commercialindustrial
Allocation of Revenue Regulation Revenue Surpluses or Deficits
The allocation of revenue regulation revenue surpluses or deficits should be symmetrical so that overpayments are credited to customers just as underpayments are paid by those same customers The six utilities studied fol-low that formula The application of revenue regulation however varies from utility to utility BGE and IPC ap-ply revenue regulation to the residential and commercial classes thereby excluding industrial customers In contrast however PGampE WPS National Grid and HECO allocate revenue regulation adjustments to all customer classes In terms of how the costs are allocated IPC BGE WPS National Grid and HECO allocate costs differently among the customer classes PGampE however allocates costs uni-formly among the customers Because PGampE has separated its business units it also separately calculates and allocates
Decoupling Case Studies Revenue Regulation Implementation in Six States
33
Table 10
Carrying Charges
Table 11
Cap on Rate Adjustment
Pacific Gas amp Electric
Idaho Power Company
Baltimore Gas amp Electric
Wisconsin Public Service Corporation
National Grid
Hawaiian Electric CompanyPacific Gas amp Electric
Idaho Power Company
Baltimore Gas amp Electric
Wisconsin Public Service Corporation
National Grid
Hawaiian Electric Company
None
Yes
None
Yes at the short-term debt rate
Yes at the customer deposit rate
Yes at the customer deposit rateNo
3 rate cap excess carried over to next period
10 rate cap excess carried over to next period
Cap of $14 million per year
$170 million in CapEx
No
revenue regulation surpluses and deficits among its electric distribution gas distribution and electric generation busi-nesses This illustrates that there are several ways to address revenues from revenue regulation depending on the policy outcomes that are desired
Carrying ChargesCarrying charges applied to uncollected or surplus rev-
enues can be used to account for the time value of money and the lost opportunity or value to having those revenues in hand PGampE and BGE do not accrue carrying charges On the other hand IPC WPS National Grid and HECO do For BGE given that the revenue regulation revenues are reconciled and recovered monthly it would make little sense to include a carrying cost Where carrying costs have been used they have included in the cases of these utili-ties the short-term debt rate or the customer deposit rate which for one utility is six percent and probably close to the short-term debt rate Thus the carrying charge rates are appropriately at the lower end of the spectrum reflecting their short-term nature In the application of the carrying charge symmetry should be preserved by applying it to both deficits and surpluses Application of carrying charges given the short period that costs are carried (one year) is somewhat discretionary Although it does more accurately account for costs it does add a modest level of complica-tion in tracking costs
Rate Caps and CollarsOne of the ways to protect customers in the event of sig-
nificant adjustments is to impose a rate cap (or collar) that limits the amount of a rate increase (and decrease) Some customers are sensitive to changes in foundational costs like utility bills and if costs are going to rise they benefit from a pattern of steady modest increases rather than a large step increase Any structural increases in rates attributable
to reductions in sales or increases in costs recognized by the revenue regulation plan would be eventually included in rates under any system A cap reflects a controlled way to manage customer expectations and customer impacts Structural changes can only be managed for a while until a complete rate case is needed to reset all assumptions
Typically when a rate cap is imposed if the formulaic increase exceeds the cap or collar the utility will be able to carry over any uncollected revenues until the next rate adjustment Two of the utilities studied PGampE and HECO do not have rate caps On the other hand the other four utilities do include rate caps in varying amounts National Grid has a one-percent revenue cap whereas IPC and BGE have a one-percent and a ten-percent rate cap respectively WPS unlike the others has a cap tied to the dollar amount of $14 million as opposed to a percentage Consistent with the goals of revenue regulation all of the utilities studied have a carryover provision that is important for reducing the risk that the utility will not recover its revenue require-ments
Note that National Grid differs from BGE and HECO in that its cap is on revenues whereas the other two utilities cap rates and rate impacts A revenue cap is more focused on ensuring minimal change to the revenue requirements authorized by the commission National Grid as discussed previously allows for mini rate cases to adjust the rev-enue requirements Having the one-percent cap limits the amount of increase that can occur through that process requiring revenue changes that are greater to occur in a full rate case However note also that some of the adjustments allowed in the mini rate case have their own separate cap The IPC rate cap is in line with what many other utilities with caps have in place which generally range from one to three percent The ten-percent rate cap in the BGE plan is
Decoupling Case Studies Revenue Regulation Implementation in Six States
34
59 Morgan P (2012 December) Graceful Systems LLC A decade of decoupling for US energy utilities rate impacts designs and observa-tions p5
reflective of its monthly adjustment pattern An annual ad-justment allows more time to smooth out peaks and valleys in revenues whereas a monthly adjustment will be influ-enced by more of the spikes (particularly weather-driven variation) thus the need for a larger bandwidth for the car-ryover Like a variable energy rate or fuel adjustment clause that fluctuates monthly the monthly adjustment introduces more volatility into the rates
Actual Historical AdjustmentsFor many ratepayer advocates there is a concern that
some of the utility management risk will be transferred to customers as a consequence of a policy that seeks to ensure that the utility will be made whole However the utility re-tains management risk and the requirement to demonstrate that it has acted prudently Thus the utility still has just as much of an incentive to operate efficiently as it did without revenue regulation If the utility can lower its costs it can still increase its profits Second by designing rates symmet-rically such that under- and over-recoveries are reconciled it provides customers with an opportunity to obtain credits that under traditional regulation would be retained by the utility It has often been opined that when there are large
gaps in time between utility rate cases it is because the utility is over-earning and exceeding its revenue require-ments In those instances customers never get to examine what the utility is collecting much less receive a refund Under revenue regulation with its periodic adjustments and scheduled general rate cases the revenue requirements are examined and refunds or credits allocated such that customers have a better knowledge base for understanding the utilityrsquos earnings And annual reconciliation of the util-ityrsquos actual revenues versus authorized revenues provides consumers with a tool to reign in excess revenue recovery beyond authorized amounts Third the adjustments that do occur under revenue regulation are manageable and frequently less than the adjustments customers are used to seeing on their bills for fuel or variable generation rates or for the myriad of other surcharges that can be tacked on to a customerrsquos bill such as an infrastructure (smart grid) sur-charge maintenance upgrade fee regulatory asset charge or system benefit charge
As seen in Figure 1 the range of rate impacts cluster around plus or minus two percent but can at times exceed plus or minus five percent The total of surcharges has somewhat exceeded the total of credits
Figure 1
Total Utility Decoupling Adjustment Rate Impacts59
300
250
200
150
100
50
0
Nu
mber
of
Dec
oup
lin
g A
dju
stm
ents
Over -5 -4 to -5 -3 to -4 -2 to -3 -1 to -2 0 to -1 0 to 1 1 to 2 2 to 3 3 to 4 4 to 5 Over 5
Percentage Rate Impacts
SurchargesRefunds
ResidentialAll
Other
Commercial
Total
Decoupling Case Studies Revenue Regulation Implementation in Six States
35
60 Id p 3
61 Schultz T Energy Efficiency at Idaho Power Available at httpwwwenergyidahogovenergyalliancedida_powerpdf
As can be seen with the utilities studied above the larger fluctuations are attributable to adjustment mechanisms that are reconciled more frequently such as monthly as those are less able to smooth out anomalies as an annual adjust-ment would do From a dollar perspective for the roughly 64 percent of adjustments that fall within the plus or minus two-percent range the monthly bill impact is approxi-mately $230 for average electric customers and $140 for average gas customers60
Of the six utilities studied the fluctuations in adjustment have for the most part stayed within the one- to three-per-cent range as shown below
bull PGampE from 2005 to 2012 has had annual revenue regulation adjustments ranging from minus143 percent to 415 percent with an average adjustment of 197 percent
bull For IPC the adjustments are separated between residential and commercial customers For residential customers the annual adjustments from 2007 through 2011 ranged from 077 percent to 258 percent for an average of 162 percent As for the commercial customers the annual adjustments for that same period were higher ranging from 104 percent to 424 percent with an average adjustment of 252 percent
bull BGE has monthly adjustments that ranged from minus1853 percent to 3013 percent with an average of 057 percent for residential customers from March 2008 through August 2012 For General Service Customers the monthly adjustment ranged from minus2264 percent to 2462 percent The average adjustment was 1308 percent
bull For WPS the annual adjustments from 2009 through 2011 ranged from minus145 percent to 378 percent for residential and small commercial and from minus314 percent to 899 percent for commercial Note that because of a $14 million per year cap some of these percentages were carried over The average annual adjustment for residential and small commercial and for commercial was 163 percent and 215 percent respectively with carry-overs to subsequent years
bull For Massachusetts Electric and Nantucket Electric both of which operate under National Grid the annual revenue regulation adjustment for all for 2011 and 2012 was minus0105 percent and 0315 percent for an average revenue regulation adjustment over the two years of 0105 percent
bull HECO like National Grid has one annual revenue
regulation mechanism for its customers which resulted in adjustments in 2011 and 2012 of 063 percent and 107 percent respectively for an average adjustment of 085 percent
As can be gleaned from the above information the range of average adjustments for small use customers was a low of 0105 percent for National Grid to a high of 197 percent for PGampE For larger use customers the range was a low of 0105 percent for National Grid to a high of 252 percent for IPC This demonstrates that on average for these utilities with well-developed and diversely designed revenue regula-tion proposals their adjustments on average stayed at or below approximately 25 percent
One of the metrics for determining if a revenue regula-tion program is working successfully that was discussed above was the impact on rates of a revenue regulation mechanism As can be seen by the analysis of the adjust-ment levels for each of the utilities they are within a rea-sonable range
Complementary Policies Although a revenue regulation mechanism does not need
to be accompanied by other policies energy efficiency is frequently at the root of the reason revenue regulation was proposed in the first place The states examined in this pa-per have various obligations for energy efficiency achieve-ment placed upon their utilities Only Idaho does not have an Energy Efficiency Resource Standard but energy efficiency objectives are developed through an integrated resource plan process Energy efficiency spending at IPC has increased dramatically in recent years61
In recognition of the fact that revenue regulation only removes the disincentive to pursue energy efficiency several states have instituted some form of incentives to reward the desired outcome This mechanism can not only incentivize management to aggressively pursue energy efficiency but also make shareholders supportive in the face of lost invest-ment opportunity
Rate design can also play an important part in assist-ing the utility in achieving favorable energy efficiency outcomes Inclining block rates penalize inefficient use of electricity and shorten payback times from the customer perspective Because efficiency reduces consumption at
Decoupling Case Studies Revenue Regulation Implementation in Six States
36
62 Optional rate designs for PGampE include TOU and Peak Time Pricing
63 IPC also has an optional TOU rate design
64 Optional rate designs for this utility include TOU Critical Peak Pricing and Contract
65 National Grid also offers optional TOU and flat rate designs
66 HECO also offers optional TOU and flat rate designs
67 See eg Alexander B (1996 April) How to construct a service quality index in performance-based ratemaking Electricity Policy
the tail block rate the value of kWh savings is greater than with flat rates On the other side of the spectrum declining block rates which have a reduced rate in the tail block do little to encourage conservation In fact they operate more like a discounted bulk rate by reducing the average cost of a kWh in a customerrsquos bill for the more kWh used
Performance incentives or other ways to avoid destruc-tive cost-cutting in the name of creating margins that reduce service or reliability or lessen customer value have been implemented only in Massachusetts of the six utilities illustrated here Several other states have implemented vari-ous schemes in reaction to perceived deficiencies in utility service67 Performance incentives are not unique to rev-enue regulation Commissions wishing to implement such a scheme can find many models of incentive reward and penalty mechanisms developed for other purposes
Taken together a suite of policy and program features can create an atmosphere that is conducive to achievement of energy efficiency goals within the utility and for the customers By appropriate application of these techniques regulators working with utilities and stakeholders can remove barriers and create an opportunity for energy ef-ficiency to be fully integrated into the utility supply option portfolio
Energy Efficiency OutcomesAlthough revenue regulation itself does not create an
incentive for a utility to implement energy efficiency it does address the issue of lost revenues associated with energy
Table 12
Complementary Policies for Energy Efficiency
Pacific Gas amp Electric62
Idaho Power Company63
Baltimore Gas amp Electric
Wisconsin Public Service Corporation64
National Grid65
Hawaiian Electric Company66
Energy Efficiency Requirement
1 annually
IRP
10 by 2015
075 annually
24 annually
Energy efficiency can satisfy portion of RPS
Default Residential Rate Design
Inclining block
Inclining block
TOU seasonal
Flat
Inclining block
Inclining block
Incentive Structure
Risk reward incentive mechanism
No
No
No
5 of program costs
Third-party administrator paid for contract performance
Performance Incentives
Reliability reporting only
None
Under consideration
Reliability reporting only
Service quality reward and penalty
Under consideration
efficiency and DG programs Revenue regulation should be combined with other mechanisms that require or incentiv-ize the implementation of energy efficiency by the utility or a third party The level of energy efficiency achieved can be one measure of the success of a revenue regulation mechanism as implemented in a larger program designed to achieve energy efficiency Table 13 shows the incremental annual energy efficiency savings reported by each utility with the shaded box indicating the year that the utilityrsquos revenue regulation mechanism was implemented National Grid had achieved a high level of energy efficiency savings in the years before it implemented revenue regulation
This paper has not evaluated DG outcomes to correlate with revenue regulation as it is not perceived that states and utilities have made that connection expressly in histori-cal mechanisms However it is expected that this connec-
Decoupling Case Studies Revenue Regulation Implementation in Six States
37
68 EIA Form EIA-861 data files Available at httpwwweiagovelectricitydataeia861
69 PGampE began revenue regulation in 1974 and it was later suspended and recommenced in 2001
70 WPS savings are represented by the statewide program savings from the Focus on Energy program WPS provided additional funds to Focus on Energy starting in CY10 through their territory-wide program activities
71 In 2009 Hawaii Energy a ratepayer-funded statewide energy efficiency provider began delivering services Savings reported after 2009 represent savings achieved through the programs of Hawaii Energy
Table 13
Annual Incremental Energy Efficiency Savings as Percentage of Retail Sales68
Highlighted cells are the year that utility started decoupling
Pacific Gas amp Electric69
Idaho Power Company
Baltimore Gas amp Electric
Wisconsin Public Service Corporation70
National Grid
Hawaiian Electric Company71
2004
11
01
00
03
11
00
2005
16
03
00
03
09
05
2006
10
05
00
03
12
05
2010
19
13
17
09
136
12
tion will be made in future mechanisms and furthermore it is anticipated that follow on work to this paper will want to study that connection between revenue regulation and DG performance
Conclusions
An increasing number of states are looking to increase the rate of energy efficiency investments for their long-run cost and risk advantages The benefits of energy efficiency include not only its ability to reduce system costs across the distribution transmission and generation functions but also the opportunity for customers to reduce their individ-ual energy costs for their own electric bills Nevertheless it is counterintuitive to encourage or order a utility to sell less of its product In order to encourage the proliferation of en-ergy efficiency programs as a solution that can contribute to this nationrsquos energy needs this tension between the goals of society versus the goals of the utility needs to be addressed Revenue regulation can be such a solution by removing the link between sales and revenues
There are many ways to implement revenue regulation and multiple decision points that regulators must consider in designing a revenue regulation mechanism This paper focused on six utilities each of which implemented revenue regulation in different ways in accordance with the objectives of that state Different decision points discussed include
bull Should revenue regulation apply to all functions (generation transmission and distribution) which sometimes depends on if the utility is regulated or restructured
bull Should revenue regulation apply to all customer classes
bull Should there be symmetry such that a reconciliation adjustment occurs for both over- and under-recoveries of the revenue requirements
bull Should recovery of indicated surcharges be conditioned on acceptable performance on customer service quality or energy efficiency goals
bull Should there be an attrition adjustment to account for other expenses or should the revenue regulation adjustment be limited to reconciling existing revenue requirements
bull Should there be an inflation adjustmentbull To calculate the revenue requirements should the
current or accrual method be usedbull Should the adjustments be made in rate cases or
through a riderbull How frequently should adjustments be made
monthly annually or some other time periodbull Depending on the period of time between true up and
recovery should there be carrying charges and if so how should they be calculated
2007
21
06
00
03
09
04
2008
35
10
05
09
05
05
2009
20
11
06
10
11
11
Decoupling Case Studies Revenue Regulation Implementation in Six States
38
72 Avista Utilities (2009) Washington Utilities and Transportation Commission Docket UE-090134
bull Should there be a requirement authorizing the frequency of rate case
bull Should there be an annual cap on the amount of the adjustment and if so should there be an opportunity to carry over any additional amounts and for how many years
bull Should there be an adjustment to the cost of capital to reflect the reduced risk
Other considerations for regulators whether or not they implement revenue regulation but certainly as part of a comprehensive package are other measures that can be put in place to encourage consumers and utilities alike to actively participate in energy efficiency For example an inclining block rate structure by virtue of its incentive to consume less pairs well with an energy efficiency program helps drive consumers to participate in efficiency programs and accelerates the payback of an energy efficiency investment By the same token an incentive payment to the utility helps provide its management with a good reason to excel and exceed targets for energy efficiency programs
A key point illustrated by the list of considerations above is that there is not just one static way to design and implement revenue regulation but rather there are a variety of options for doing so In this study a diverse group of utilities were reviewed The differences among the utilities included geographic diversity vertically integrated and restructured utilities different levels of energy efficiency in place and certainly differences in how the revenue regulation mechanisms were implemented No two utilities were alike and no two utilities had the same revenue regulation mechanism The key is that revenue regulation should eliminate the throughput incentive but the means for accomplishing this goal can vary and be tailored to each jurisdiction and each utility and still be successful
There are several considerations in the design of a revenue regulation mechanism that can help ensure its successful adoption To begin revenue regulation should be granted to utilities only as a precondition to implementing comprehensive energy efficiency andor DG policies Unless accompanied by a commitment to engage in providing least-cost resource options that could impact sales there is not really any good policy reason for its adoption All of the utilities studied are actively engaging in energy efficiency Furthermore as a matter of fairness the revenue regulation mechanism should be symmetrical so that any revenues above those authorized are refunded back to consumers As Figure 1 demonstrates although there are more surcharges to customers there is nevertheless a healthy amount of
credits back to consumers This is the bargain Barring imprudence or other unforeseen circumstances the utility receives its authorized revenue requirements and nothing more or less under a simple revenue regulation mechanism
Rate design plays an important role in the effectiveness of energy efficiency in concert with revenue regulation A low customer charge is preferable so that the customer can benefit from real bill reductions tied to reduced volumetric consumption Reductions in consumption not only reduce bills but also positively impact the payback period for investments in energy efficient appliances Declining block rates in which the tail block rate is lower than the first tier also do not encourage conservation Inclining block rates that reward low usage in the first block with a lower rate send the better price signals None of the six utilities studied had declining block residential rates They were inclining flat and time-varying
The revenue adjustment mechanism is also a critical decision point in terms of whether a revenue per customer mechanism is adopted that accounts for only the current revenue requirements or whether latitude is given to include an inflation adjustment or other cost increases in the revenue adjustment mechanism Three of the utilities studied adopted this approach whereas another two used a hybrid approach Finally to reduce volatility five of the six utilities opted for annual rather than monthly adjustments thereby creating a level of rate stability that customers in general prefer
Once the goals for revenue regulation are set by the regulators the next step is to design programs that will implement that goal For energy efficiency to be as successful as possible regulators may want to adopt a complement of other policies to accompany revenue regulation These can include rate designs that reward reduced use and conservation as well as incentive payments to utilities that reward them for meeting or exceeding targets Of the six utilities studied three have adopted some form of incentive One simple approach that was used in Washington was to link recovery of any surcharges under the revenue regulation mechanism to achievement of energy efficiency targets72
For the utilities examined above that have implemented revenue regulation the evidence demonstrates that revenue regulation as a strategy and a mechanism to enable
Decoupling Case Studies Revenue Regulation Implementation in Six States
39
energy efficiency has been working well The fact that each revenue regulation mechanism varies from the next demonstrates that there are many different paths that can be followed in implementing revenue regulation based on the needs of the utility and its stakeholders in a particular
region This study demonstrates that revenue regulation does work and provides examples of how it can be implemented each one different and unique because of the number of decision points to be considered in designing a revenue regulation mechanism
Decoupling Case Studies Revenue Regulation Implementation in Six States
40
Appendix
Historic Rate Adjustments
Table 14
PGampE Revenue Regulation Rate Adjustments 1983 to 199373
Table 15
PGampE Revenue Regulation Adjustments 2005 to 201274
Table 16
IPC Revenue Regulation Adjustments76
Idaho Power Company
1983 23
1984 (34)
1985 (48)
1986 19
1987 21
1988 50
1989 (43)
1990 (54)
1991 39
1992 34
1993 00
2005 8925 minus12773 minus143
2006 9933 2246 226
2007 10409 21727 209
2008 10261 4032 039
2009 11169 10355 093
2010 11224 46556 415
2011 10306 38390 373
2012 11032 40304 365
2007 Residential minus00457 590 minus077
Commercial minus00457 428 minus107
2008 Residential 00529 670 090
Commercial 00529 510 104
2009 Residential 01220 770 158
Commercial 01535 603 255
2010 Residential 01800 785 229
Commercial 02273 613 371
2011 Residential 02028 785 258
Commercial 02597 613 424
Revenue Regulation Adjustment as of
Total Rates
Delivery Revenue
Requirement ($ millions)
Adjustment Rate
Revenue Regulation Adjustment($ millions)
Retail Rate
of Delivery Revenue
Revenue Regulation Adjustment
Year
Year
73 Lesh P (2009 June 30) Rate impacts and key design elements of gas and electric utility decoupling
74 Morgan P (2012 November) A decade of decoupling for US energy utilities rate impacts designs and observations
75 Morgan P (2012 November) A decade of decoupling for US energy utilities rate impacts designs and observations
76 All numbers provided by the utility
Decoupling Case Studies Revenue Regulation Implementation in Six States
41
77 Idaho Power Company Case No IPC-E-11-19- fixed cost adjustment permanent mechanism Available at httpwwwpucidahogovinternetcaseselecIPCIPCE1119company20120928COMPLIANCE20FILINGPDF
Figure 2
IPC Revenue Regulation Adjustments77
Residential FCA Balance and Use per Customer
$10000000
$8000000
$6000000
$4000000
$2000000
$0
-$2000000
-$4000000
-$6000000
1080
1070
1060
1050
1040
1030
1020
1010
1000Res
idu
al A
uth
oriz
ed F
CA
Am
oun
t
Residual Authorized FCA Amount ($)
Monthly Use Per Customer (kWh)
kW
h U
sed
2006 2007 2008 2009 2010 2011
78 Morgan P (2012 November) A decade of decoupling for US energy utilities rate impacts designs and observations
Decoupling Case Studies Revenue Regulation Implementation in Six States
42
Table 17a
Baltimore Gas and ElectricBGE Monthly Revenue Regulation Adjustments 2008 to 201278
Table 17b
Baltimore Gas and ElectricBGE Monthly Revenue Regulation Adjustments 2008 to 201278
March Residential 000172 01477 1165General Service 000230 01526 1507
April Residential 000016 01477 0108General Service 000146 01526 0957
May Residential 000066 01477 0447General Service 000230 01526 1507
June Residential minus000066 01477 minus0447General Service 000230 01526 1507
July Residential 000158 01477 1070General Service 000230 01526 1507
August Residential minus000040 01477 minus0271General Service 000214 01526 1402
September Residential 000237 01477 1605General Service 000230 01526 1507
October Residential 000237 01477 1605General Service 000143 01526 0937
November Residential 000237 01477 1605General Service 000140 01526 0917
December Residential 000445 01477 3013General Service 000230 01526 1507
January Residential 000035 01579 0222General Service minus000073 01346 minus0542
February Residential 000025 01579 0158General Service 000230 01346 1709
March Residential minus000237 01579 minus1501General Service 000230 01346 1709
April Residential minus000237 01579 minus1501General Service 000230 01346 1709
May Residential 000234 01579 1482General Service 000132 01346 0981
June Residential 000237 01579 1501General Service 000230 01346 1709
July Residential 000237 01579 1501General Service 000230 01346 1709
August Residential 000237 01579 1501General Service 000190 01346 1412
September Residential 000237 01579 1501General Service 000230 01346 1709
October Residential 000237 01579 1501General Service 000124 01346 0921
November Residential 000237 01579 1501General Service 000230 01346 1709
December Residential 000156 01579 0988General Service 000204 01346 1516
Adjustment $kWh
Adjustment $kWh2008 2009
Retail Rate
$kWh
Retail Rate
$kWhAdjustment
Adjustment
Decoupling Case Studies Revenue Regulation Implementation in Six States
43
Table 17c
Baltimore Gas and ElectricBGE Monthly Revenue Regulation Adjustments 2008 to 201278
Table 17d
Baltimore Gas and ElectricBGE Monthly Revenue Regulation Adjustments 2008 to 201278
January Residential 000203 01465 1386General Service 000230 01261 1824
February Residential minus000142 01465 minus0969General Service 000230 01261 1824
March Residential minus000237 01465 minus1618General Service 000230 01261 1824
April Residential minus000237 01465 minus1618General Service 000230 01261 1824
May Residential 000192 01465 1311General Service 000230 01261 1824
June Residential 000191 01465 1304General Service 000230 01261 1824
July Residential 000095 01465 0648General Service 000230 01261 1824
August Residential minus000176 01465 minus1201General Service 000224 01261 1776
September Residential minus000237 01465 minus1618General Service 000116 01261 0920
October Residential minus000237 01465 minus1618General Service 000081 01261 0642
November Residential minus000237 01465 minus1618General Service 000098 01261 0777
December Residential minus000079 01465 minus0539General Service 000229 01261 1816
January Residential minus000130 01365 minus0952General Service 000230 01156 1990
February Residential minus000253 01365 minus1853General Service minus000020 01156 minus0173
March Residential minus000018 01365 minus0132General Service minus000063 01156 minus0545
April Residential 000110 01365 0806General Service minus000262 01156 minus2266
May Residential 000010 01365 0073General Service minus000160 01156 minus1384
June Residential 000226 01365 1656General Service 000042 01156 0363
July Residential 000253 01365 1853General Service 000209 01156 1808
August Residential minus000007 01365 minus0051General Service minus000157 01156 minus1358
September Residential minus000253 01365 minus1853General Service minus000177 01156 minus1531
October Residential 000228 01365 1670General Service 000262 01156 2266
November Residential minus000059 01365 minus0432General Service 000262 01156 2266
December Residential 000071 01365 0520General Service 000262 01156 2266
Adjustment $kWh
Adjustment $kWh2010 2011
Retail Rate
$kWh
Retail Rate
$kWhAdjustment
Adjustment
Decoupling Case Studies Revenue Regulation Implementation in Six States
44
Table 17e
Baltimore Gas and ElectricBGE Monthly Revenue Regulation Adjustments 2008 to 201278
January Residential 000253 01291 1960General Service 000262 01064 2462
February Residential 000253 01291 1960General Service 000262 01064 2462
March Residential 000253 01291 1960General Service 000262 01064 2462
April Residential 000253 01291 1960General Service 000262 01064 2462
May Residential 000253 01291 1960General Service 000262 01064 2462
June Residential 000253 01291 1960General Service 000262 01064 2462
July Residential 000253 01291 1960General Service 000262 01064 2462
August Residential 000253 01291 1960General Service 000160 01064 1504
Adjustment $kWh2012
Retail Rate
$kWhAdjustment
Decoupling Case Studies Revenue Regulation Implementation in Six States
45
79 Morgan P (2012 November) A decade of decoupling for US energy utilities rate impacts designs and observations
80 Morgan P (2012 November) A decade of decoupling for US energy utilities rate impacts designs and observations
Table 18
Wisconsin Public Service Corporation Revenue Regulation Adjustments 2009 to 201179
2009 ResidentialSmall Commercial 00048705 000168154 01290 378 130Commercial 00084951 000293293 00945 899 310
2010 ResidentialSmall Commercial 00033043 000166936 01291 256 129Commercial 00056630 000286103 09460 060 030
2011 ResidentialSmall Commercial (00018666) $ (000163719) 01288 minus145 minus127Commercial (00032565) $ (000285629) 01037 minus314 minus275
Derived Adjustment
$kWh
Derived Adjustment Capped $
kWh
Retail Rate
$kWh
Revenue Regulation Actual
Revenue Regulation Capped
Table 19
National Grid Revenue Regulation Adjustments 2011-201276
Massachusetts Electric and Nantucket Electric
Table 20
Hawaiian Electric Company
2011 All minus0015 1429 minus0105
2012 All 0044 1396 0315
2011 01995 3149 063
2012 03894 3641 107
Revenue Regulation Adjustment
centkWh
Revenue Regulation Adjustment
centkWhRetail Rate
centkWh
Retail Rate
Revenue Regulation Adjustment
Revenue Regulation
ldquoThe 2011 adjustment took effect June 1 but was reduced to $0 on July 26 2011 when the Commission granted HECO an interim rate increase of $532 million in a 2011 test year general rate case The 2012 Adjustment runs from June 1 2012 through May 31 2013 About 25 of the total relates to the portion of the decoupling mechanism that updates OampM and rate baserdquo (Morgan 2013)
Decoupling Case Studies Revenue Regulation Implementation in Six States
46
Revenue Regulation and Decoupling A Guide to Theory and Applicationhttpwwwraponlineorgdocumentdownloadid902
This guide was prepared to assist anyone who needs to understand both the mechanics of a regulatory tool known as decoupling and the policy issues associated with its use This would include public utility commissioners and staff utility management advocates and others with a stake in the regulated energy system While this guide is somewhat technical at points we have tried to make it accessible to a broad audience to make comprehensible the underlying concepts and the implications of different design choices This guide includes a detailed case study that demonstrates the impacts of decoupling using different pricing structures (rate designs) and usage patterns
Pricing Dorsquos and Donrsquots Designing Retail Rates as if Efficiency Countshttpwwwraponlineorgdocumentdownloadid939
Rate design is a crucial element of an overall regulatory strategy that fosters energy efficiency and sends appropriate signals about efficient system investment and operations Rate design is also fully under the control of state regulators Progressive rate design elements can guide consumers to participate in energy efficiency programs and reduce peak demand yet relatively few utilities and commissions have implemented many of these elements This RAP paper identifies some best practices Because pricing issues tie closely to utility growth incentives we also address revenue decoupling
A Decade of Decoupling for US Energy Utilities Rate Impacts Designs and Observationshttpwwwraponlineorgdocumentdownloadid6356
This report written by Pamela Morgan of Graceful Systems LLC builds on a 2009 report Now covering 25 states including 49 LDCs and 24 electric utilities this report summarizes the decoupling mechanism designs these utilities use and the rate adjustments they have made under those mechanisms In total this report estimates the retail rate impacts of 1244 decoupling mechanism adjustments since 2005
Additional Resources
The Role of Decoupling Where Energy Efficiency is Required by Lawhttpwwwraponlineorgdocumentdownloadid275
This Issuesletter gives an overview of energy efficiency resource standards the need to decouple utility profits from utility sales and explains why decoupling is needed even where a third party administers energy efficiency programs
Revenue Decoupling Standards and Criteria A Report to the Minnesota Public Utilities Commissionhttpwwwraponlineorgdocumentdownloadid850
In 2007 the Minnesota legislature enacted a new statute Section 216B2412 in which it defined an alternative approach to utility regulation decoupling and directed the Public Utilities Commission (PUC) to ldquoestablish criteria and standardsrdquo by which decoupling could be adopted for the statersquos rate-regulated utilitiesTo fulfill its obligation to develop criteria and standards for decoupling the PUC sought the advice of the Regulatory Assistance Project (RAP) This report is the output of that collaboration
Designing Distributed Generation Tariffs Wellhttpwwwraponlineorgdocumentdownloadid6898
Improvements in distributed generation economics increasing consumer preference for clean distributed energy resources and a favorable policy environment in many states have combined to produce significant increases in distributed generation adoption in the United States Regulators are looking for the well-designed tariff that compensates distributed generation adopters fairly for the value they provide to the electric system compensates the utility fairly for the grid services it provides and charges non-participating consumers fairly for the value of the services they receive This paper offers regulatory options for dealing with distributed generation The authors outline current tariffs and ponder what regulators should consider as they weigh the benefits costs and net value to distributed generation adopters non-adopters the utility and society as a whole The paper highlights the importance of deciding upon a valuation methodology so that the presence or absence of cross-subsidies can be determined Finally the paper offers rate design and ratemaking options for regulators to consider and includes recommendations for fairly implementing tariffs and ratemaking treatments to promote the public interest and ensure fair compensation
Decoupling Case Studies Revenue Regulation Implementation in Six States
47
The Regulatory Assistance Project (RAP)trade is a global non-profit team of experts focused on thelong-term economic and environmental sustainability of the power sector We provide technical and policy assistance on regulatory and market policies that promote economic efficiency environmental protection system reliability and the fair allocation of system benefits among consumers We work extensively in the US China the European Union and India Visit our website at wwwraponlineorg to learn more about our work
Rate Design Where Advanced Metering Infrastructure Has Not Been Fully Deployedhttpwwwraponlineorgdocumentdownloadid6516
This paper identifies sound practices in rate design applied around the globe using conventional metering technology Rate design for most residential and small commercial customers (mass market consumers) is most often reflected in a simple monthly access charge and a per-kWh usage rate in one or more blocks and one or more seasons A central theme across the practices highlighted in this paper is that of sending effective pricing signals through the usage-sensitive components of rates in a way that reflects the character of underlying long-run costs associated with production and usage While new technology is enabling innovations in rate design that carry some promise of better capturing opportunities for more responsive load the majority of the worldrsquos electricity usage is expected to remain under conventional pricing at least through the end of the decade and much longer in some areas Experience to date has shown that the traditional approaches to rate design persist well after the enabling technology is in place that leads to change
Time-Varying and Dynamic Rate Designhttpwwwraponlineorgdocumentdownloadid5131
This report discusses important issues in the design and deployment of time-varying rates The term time-varying rates is used in this report as encompassing traditional time-of-use rates (such as time-of-day rates and seasonal rates) as well as newer dynamic pricing rates (such as critical peak pricing and real time pricing) The discussion is primarily focused on residential customers and small commercial customers who are collectively referred to as the mass market The report also summarizes international experience with time-varying rate offerings
50 State Street Suite 3Montpelier Vermont 05602802-223-8199wwwraponlineorg
- Table of Contents
- Introduction
- California Pacific Gas and Electric Company
- Idaho Idaho Power Company
- Maryland Baltimore Gas and Electric
- Wisconsin Wisconsin Public Service Corporation
- Massachusetts National Grid
- Hawaii Hawaiian Electric Company
- Discussion of the Six Utilities Overall
- Conclusions
- Appendix
- Additional Resources
-

Decoupling Case Studies Revenue Regulation Implementation in Six States
12
year The actual FCA balance will differ from that recorded in the monthly reports to reflect the fact that the deferral balance is calculated on an annual not monthly basis FCA balance is based on annual average prorated customer count annual weather normalized sales and non-shaped FCE rates which would affect both the balance accrual and the associated interest
Each year the Company totals the FCA results including interest for the period from January 1 to December 31 If the total is negative it represents an under-collection of revenue from customers and the amount will be recovered from ratepayers in the following year through an adder to rates (Schedule 54) Likewise if the total is positive the Company has over-collected its fixed-cost revenue and will return the excess amount to customers through an adder in rates using a credit or surcharge mechanism These adjustments are currently included in the Annual Adjustment Mechanism line item on customer bills Since July 2012 the Annual Adjustment Mechanism includes PCA and FCA to avoid customer confusion
Originally FCAs were calculated for each decoupled customer class however the FCA is now recovered proportionally between the residential and small general service customers for such reason as a lack of cost of service studies to support the underlying cost allocations and acknowledgment of the ldquoportfoliordquo approach toward energy efficiency Annual adjustments are capped at three percent and differences beyond that are rolled over until the next period Adjustments to the rate occur June 1 of the year following the previous one-year period from January 1 to December 31
IPC was initially obligated to submit its adjustment request subject to Staff audit on March 15 of each year Under the pilot program this included a detailed summary of demand-side management (DSM) activities that demonstrate an enhanced commitment to DSM resulting from implementation of the FCA ldquoEvidence of enhanced commitment will include but not be limited to broad availability of efficiency and load management programs building code improvement activity pursuit of appliance code standards expansion of DSM programs pursuit of energy savings programs beyond peak shavingload shifting programs and third party verificationrdquo (IPC-E-04-15 Settlement Stipulation p 5) However the Company is no longer required to file the separate annual report specifying ways in which it increased its investment in energy efficiency and DSM as a result of the FCA mechanism DSM is comprehensively reported in annual DSM reports filed with
the Commission
Potential ChangesThe Commission noted when approving the permanent
FCA that it ldquodoes not isolate or identify changes in cost recovery associated solely with the Companyrsquos energy efficiency programsrdquo17 The Company was required to file a proposal to adjust the FCA to address the capture of changes in load not related to energy efficiency programs In its compliance filing IPC recommended making no change to the FCA mechanism but did propose an altered mechanism in order to comply with the Commissionrsquos request The proposal would cap the annual change in per-customer consumption to two percent (up or down) The Commission Staff had previously proposed that the FCA balance be equally shared between the customers and the Company in order to account for variations in energy consumption other than weather and energy efficiency However the Commission found that neither proposal satisfied its needs stating that the Companyrsquos proposal to cap deviations in annual usage would not have had any effect on previous FCA results Additionally both IPC and the Idaho Conservation League filed comments stating that the Staffrsquos 5050 sharing proposal failed to remove the financial disincentives inherent in DSM programs The Commission finally determined to keep the FCA mechanism unchanged and continue to monitor the results
Complementary PoliciesIdaho requires its investor-owned utilities to pursue all
cost-effective energy efficiency however it does not have incentives for achieving energy efficiency savings
IPC uses inclining block rates as the default rate structure for its residential customers but there is also available an optional Time-of-Day pilot program with summer and winter peak and off-peak periods Small general service customers take service on a two-tier inclining block schedule
IPC has no filing or reporting requirements relating to service quality (except in Oregon)
Energy Efficiency OutcomesBefore IPC implemented revenue regulation in January
2007 it reported increasing incremental energy efficiency savings from 0 percent of retail load in 2003 to 05 percent of
17 Order No 32505 p 6 Available at httpwwwpucidahogovorders32599ord32505pdf
Decoupling Case Studies Revenue Regulation Implementation in Six States
13
retail load in 2006 Since the revenue regulation mechanism was implemented reported savings have increased from 06 percent in 2007 to 13 percent in 2010 (with low or no reported savings in 2009 and 2011)18 The DSM Report for 2012 shows this to be 12 percent
ResourcesIdaho Public Utilities CommissionIPC-E-04-15 - Idaho Power mdash Investigation of Financial
DisincentivesIPC-E-09-28 - Idaho Power mdash Application to Make the
Fixed Cost Adjustment PermanentIPC-E-11-19 - Idaho Power mdash Request to Convert
Schedule 54 (Fca) From Pilot to Permanent
18 EIA Form EIA-861 data files Available at httpwwweiagovelectricitydataeia861
Decoupling Case Studies Revenue Regulation Implementation in Six States
14
Baltimore Gas and Electricrsquos (BGE) revenue regulation mechanism compares actual distribution revenue to the authorized revenue adjusted for the number of customers for each applicable rate schedule The
authorized revenue including the cost of power is based on test year requirements and sales levels Over- or under-collec-tions are reconciled monthly through a rider This mechanism differs from the others we describe by having a monthly rather than annual deferral and recovery period
AuthorityBGE requested a revenue regulation mechanism in 2007
due to the expected impact on electricity sales of the com-panyrsquos conservation and demand response programs BGE stated that the revenue regulation mechanism was neces-sary to eliminate the inherent disincentive in the traditional ratemaking process with respect to conservation and demand response Under traditional ratemaking BGE pointed out that ldquoa one percent reduction in electricity use and demand on the Companyrsquos system for the residential and small com-mercial classes would cut cost recovery by approximately $4 million This first year impact on recovery is then followed by $8 million in the second year (as an equal amount of sav-ings is added) and so on the five-year loss to shareholders from this steady-state utility investment program would be more than $20 millionrdquo19 The revenue regulation mechanism proposed by BGE was based on its gas revenue regulation mechanism which has been in place since 1998
Authorized Revenue RequirementBGE initially calculated its revenue requirement per class
separately for each rate scale based on weather-normalized 2007 sales and the number of customers Because BGE pro-posed the mechanism in 2007 the test year 2007 included nine months of actual sales and three months of forecasted sales BGE used three steps to calculate the base monthly revenue requirement
1 Calculate the Customer Charge revenues by multiplying the number of customers by the
Maryland Baltimore Gas and Electric
Customer Charge for each class2 Calculate the Delivery Service revenues by
multiplying the weather-normalized sales by the Delivery Price for each class
3 Add the Customer Charge revenues and the Delivery Service revenues to determine the base revenue requirements for each class
BGErsquos residential small general service and general service customers are included in the revenue regulation mechanism
Rate of ReturnBGE was allowed a return on common equity of 975
percent applied to a common equity ratio of 5105 per-cent in its most recent rate case BGE strongly opposed the reduction of its ROE and preferred another lost revenue mechanism over revenue regulation if an ROE reduction was implemented as a result of revenue regulation
The Public Service Commission (PSC) made no adjust-ment to BGErsquos ROE when revenue regulation was first implemented in 2007 but did reduce its allowed ROE by 50 basis points in the last rate case The Commission had previously reduced the ROE of another utility by 50 basis points when it adopted a similar revenue regulation mecha-nism for that utility20 21
Revenue Adjustment MechanismOn a monthly basis the adjustment to base revenue
requirement is calculated for each rate class using the following steps
19 BGE (2007 October 26) 9111FilingConser-va102607F Available at httpwebapppscstatemdusintranetmaillogcontentcfmfilepath=C5CCasenum5CAdmin20Filings5C60000-1099995C1080615C9111FilingConserva102607Fpdf
20 Potomac Electric Power Company
21 BGErsquos gas mechanism was approved in a 1998 settlement that did not discuss any adjustment to ROE
Decoupling Case Studies Revenue Regulation Implementation in Six States
15
1 Calculate the revenue adjustment for the change in the number of customers by multiplying the change in the number of customers by the Customer Charge
2 Calculate the revenue adjustment associated with the change in sales by multiplying the change in the number of customers by the average use per customer and multiplying that product by the Delivery Price for the class
3 Calculate the target base revenues for each class for the current period by adding the two types of adjustments to the revenue requirement
The Delivery Price for each class is the delivery rate established by the PSC adjusted for the electric universal service charge nuclear decommissioning credits and the administrative credit associated with the administrative adder portion of the Standard Offer Service rates22
BGE had a full electric and gas rate case in 201023 and another one filed in 2013 and concluded in 201424 Both reset the required decoupling elementsmdashmonthly revenue requirement monthly average usage per customer and number of customers Neither case changed the mechanism
The decoupling mechanism now excludes lost sales resulting from major storms
Reconciling Actual Revenue With Authorized Revenue
On a monthly basis each rate classrsquos target base revenues are compared to the actual base revenues for the month The difference is divided by the forecasted sales for the following period to calculate the monthly rate adjustment Balancing accounts are used to record the timing differ-ences associated with when the adjustments are calculated versus when they are billed or refunded The monthly rate adjustment Rider 25 is capped at ten percent of rates Any amount beyond ten percent of the current rate will be car-ried over and reconciled in the subsequent period
Complementary PoliciesMaryland requires its electric utilities to provide energy
efficiency services to achieve a ten-percent reduction in per capita electricity use by 2015 The statersquos overall goal is a 15 percent reduction of per capita electricity use by 2015 Although the PSC is explicitly allowed to approve financial incentive mechanisms to promote energy efficiency no incentives have been approved yet25
BGErsquos default service to its standard offer residential cus-tomers (those customers who have not elected to take gen-eration service from an alternate supplier) features seasonal
ratesmdashsummer and winter BGE also offers a TOU rate as an option to standard offer residential customers and as the default rate for small general service customers
Regarding performance incentives under revenue regula-tion in October 2012 Maryland issued a four-part plan designed to speed up investments that will strengthen the statersquos distribution grid Part of that plan would set a rate-making structure that aligns customer and utility incentives by rewarding reliability that exceeds established reliability metrics and penalizing failure to reach those metrics A task force has encouraged the Maryland state regulatory com-mission to implement a performance-based ratemaking process for IOUs such as BGE linking a utilityrsquos progress or failure to meet certain reliability metrics with its authorized rate of return
Energy Efficiency OutcomesWhen BGE implemented electric revenue regulation in
mid 2007 it had not achieved incremental energy savings for several years In 2008 it reported incremental savings of 05 percent of retail load increasing to 17 percent in 2010 and 2011
ResourcesMaryland Public Service CommissionLetter Order ML 108061 (December 27 2007)Letter Orders ML 108069 (November 30 2007) Case No 9036 Order No 80460 (December 21 2005) Case No 9230 Order No 83907 (December 13 2013) Case No 9326 Order No 86060 (December 13 2013)
22 BGE (2007 October 26) 9111FilingConser-va102607F Available at httpwebapppscstatemdusintranetmaillogcontentcfmfilepath=C5CCasenum5CAdmin20Filings5C60000-1099995C1080615C9111FilingConserva102607Fpdf
23 Case No 9230 ndash See references above
24 Case No 9326 ndash See references above
25 ACEEE Maryland Available at httpaceeeorgsectorstate-policymarylandEnergy Efficiency Resource Standards
26 EIA Form EIA-861 data files Available at httpwwweiagovelectricitydataeia861
Decoupling Case Studies Revenue Regulation Implementation in Six States
16
27 The pilot extension is in effect until the effective date of a Final Decision issued by the Commission on an application for a general base rate case filed after January 1 2013
28 Except the Direct Load Control Cp - Large Commercial amp Industrial Service Cp-ND - Pilot Large Commercial amp Industrial - Day Ahead Cp-RR - Large Commercial amp Industrial Response Rewards Automatic Transfer Switch Parallel Generation Lighting Nature Wise and Real Time Market Pricing tariffs
Wisconsin Wisconsin Public Service Corporation
Wisconsin Public Service Corporationrsquos (WPS) Revenue Stabilization Mechanism (RSM) began in 2009 as a four-year revenue regulation pilot that reconciled
target marginal revenue per customer with actual marginal revenue per customer As of 2012 the pilot was extended27 albeit with some modifications This section focuses on the current iteration of the RSM
AuthorityThe Public Service Commission of Wisconsin (PSCW)
approved a revenue regulation pilot for WPS in a Decem-ber 2008 rate case order (Docket No 6690-UR-119) The revenue regulation mechanism was effective from January 1 2009 through December 31 2012 and applied to the util-ityrsquos electric and gas operations In a rate case completed in December 2012 (Docket No 6690-UR-121) the pilot was extended and a modified RSM was approved The extended RSM is in effect from January 2013 until the next rate case
Authorized Revenue RequirementThe authorized revenue requirement is determined
through a rate case The Commission uses a future test year to determine the revenue requirement The cost of fuel is not included in the revenue requirement but is addressed through a ldquoRetail Electric Fuel Rulerdquo adjustment
Rate of ReturnThe Commission authorized a rate of return on utility
common equity of 1030 percent in Docket No 6690-UR-120 This rate remained the same in Docket No 6690-UR-121 and is currently in effect
Revenue Adjustment MechanismWPS implemented a new electric RSM based on a ldquoTotal
Rate Case Marginrdquo mechanism instead of a ldquoTotal Rate Case Margin per Customerrdquo mechanism which had been the practice during the initial four-year pilot phase The revision was intended to remove the calculation sensitivities related
to sales per customer from the original RSM calculation The margin reflected in the formula equals the total revenue for each tariff less the costs associated with the annual per-kWh value established for monitored fuel costs and excluding any surcharges credits taxes or similar charges The ldquoTotal Rate Case Marginrdquo mechanism allows WPS to achieve the total margin assumed in the forecasted test year no more and no less The new RSM will be in effect on a pilot basis until the effective date of WPSrsquos next general rate order which WPS committed to filing for the 2014 andor 2015 test years The RSM applies to most tariffs except large commercial and industrial customers28
Reconciling Actual Revenue With Authorized Revenue
Each year the utility compares the total target revenue and the total actual revenue and defers the difference subject to carrying costs based on WPSrsquos last approved short-term debt rate The margin will be based on annual per-kWh value established for monitored fuel costs which is done in a rate case The margin is determined by subtracting the aver-age kWh value from the authorized energy rates
The formula for calculating an electric under-recovery or over-recovery is
Under-recovery or over-recovery equals
[actual margin minus ratecase forecasted margin established in the most recent rate proceeding]
The summation is over each tariff A positive value equals an over-recovery and a negative value equals an
Decoupling Case Studies Revenue Regulation Implementation in Six States
17
29 The required spending level was higher for the year 2011 owing to a temporary change in state policy
30 ACEEE Wisconsin Available at httpaceeeorgsectorstate-policywisconsin
31 The Cadmus Group Inc (2013)
under-recovery The margin reflected in the formula equals the total revenue for each tariff less the costs associated with the annual per-kWh value established for monitored fuel costs and excluding any surcharges credits taxes or similar charges
In the event that a true-up will cause rates to increase the Commission will provide an opportunity for a hear-ing Revenue regulation adjustments occur as a part of the general rate case
The revenue regulation adjustments are subject to a $14 million per year cap for electric excluding carrying costs Any adjustments over that amount will not be carried over and will not be collected from ratepayers Equivalently revenue over collection in excess of $14 million will not be returned to ratepayers
Complementary PoliciesWPS like all other investor-owned utilities
in Wisconsin is required to spend 12 per-cent of its annual operating revenues on en-ergy efficiency and customer-owned renew-able resource programs that are administered by a third party through the Focus on Energy program which was established in 200229 Separately through a contract the PSCW ap-proves annual electricity savings goals for the Focus on Energy program The savings goals were equivalent to 075 percent of electric sales for the participating utilities from 2011 to 2013 In addition the PSCW approved a rate of return on investments in energy efficiency for Wisconsin Power amp Light and other utilities can propose incentives as part of their rate cases However WPS has not yet proposed an incentive mechanism30
WPS offers residential customers a default flat rate but they also offer a TOU option with winter and summer on-peak off-peak and shoulder tiers For small commercial and industrial customers there are flat rates TOU rates and critical peak rates Large commercial and industrial customers can take service under a TOU rate with summer and winter on-peak and off-peak rates a TOU with criti-cal peak rate or under a special contract rate unique to the customer and approved by the Commission
The authorized level of expensed conservation costs recoverable in rates for the test year (2013) is $19778728 The level for electric utility operations consists of the conservation budget of $17669792 and an escrow adjustment of $2108936 which represents the test year amortization of the projected overspent escrow balance at
December 31 2012 over two years Wisconsin has a statute requiring filing of reliability data
but no reward or penalty system to support its revenue regulation system
Energy Efficiency OutcomesWPS implemented revenue regulation in 2009 In order
to gain approval for the original revenue regulation mecha-nism WPS agreed to fund energy efficiency and renewable energy programs at levels above their 12-percent statutory minimum contribution to Focus on Energy Focus on Energy produces an annual report of energy efficiency program activities In its 2012 report Focus on Energy reports the following outcomes achieved for WPSrsquo service territory The table below represents the savings under the statewide Focus on Energy Programs and does not represent the savings at-tributed under the funding levels above 12 percent31
Territory Segment
Customer Participation
Rate () Utility Type
Per Capita Lifecycle Bill Savings ($)
Per Capita Incentive
($)
WPS Electric Commercial $115258 3 $8330
WPS Electric Industrial $9026768 96 $892463
WPS Electric Residential $6494 36 $666
ResourcesPublic Service Commission of WisconsinApplication of Wisconsin Public Service Corporation for
Authority to Adjust Electric and Natural Gas Rates Final Decision (December 7 2012) Docket No 6690-UR-121
David J Kyto Wisconsin Public Service Corporation Application of Wisconsin Public Service Corporation for
Authority to Adjust Electric and Natural Gas Rates Supplemental Direct Testimony (May 15 2012) Docket No 6690-UR-121
Focus on EnergyThe Cadmus Group Inc (2013) Focus on Energy Calendar
Year 2012 Evaluation Report Appendixes Portland OR The Cadmus Group Inc Retrieved from httpwwwfocusonenergycomsitesdefaultfilesFOC_XC_CY201220Report20Appendices20A-O20Final2005-3-13pdf
Decoupling Case Studies Revenue Regulation Implementation in Six States
18
32 DPU 07-50 (2007)
33 DPU 07-50 (2007) pp 392ndash396
Massachusetts National Grid
The revenue regulation mechanism for National Grid (Massachusetts Electric Company and Nantucket Electric Company together doing business as National Grid) compares authorized
distribution revenue to actual distribution revenue Revenue is compared and adjustments are made separately for each customer class
AuthorityThe Massachusetts Department of Public Utilities (DPU)
adopted revenue regulation as a statewide regulatory policy in 2008 and individual utilities filed revenue regulation tariffs in response In its Investigation Into Rate Structures that will Promote Efficient Deployment of Demand Resources32 the DPU investigated rate structures and revenue recovery mechanisms that may reduce disincentives to the efficient deployment of demand resources in the state and consid-ered how the electric and natural gas distribution compa-niesrsquo existing cost recovery mechanism could be changed to better align the companiesrsquo financial incentives with policy objectives while ensuring that the companies are not finan-cially harmed by the increased use of demand resources The DPU finally concluded that revenue regulation mecha-nisms would eliminate the financial disincentives because they sever the link between the companiesrsquo revenue and reduction in sales The DPU also endorsed a revenue per customer approach but recognized that other factors could result in changes to distribution-related costs and consent-ed to consider company-specific ratemaking proposals that accounted for the impact of capital spending and inflation-ary pressures on the companyrsquos required revenue
Authorized Revenue RequirementThe authorized revenue requirement does not include
costs that are reconciled outside of base distribution rates including energy supply costs for basic service customers transmission costs the energy efficiency system benefits charge and reconciling charge and costs recovered through the residential assistance adjustment factor
Rate of ReturnThe Commission recognized the effects of revenue
regulation on ROE and determined that revenue regulation reduces volatility which reduces risk and a downward ad-justment to ROE was appropriate but did not make its ac-tual ROE adjustment for the revenue regulation mechanism explicit in its order33 The DPU determined that a return on equity equal to 1035 percent was sufficient The testimony from National Grid supporting its proposed ROE presented comparisons of allowed ROE for a set of companies that had revenue regulation or another risk management mecha-nism in place to account for an implied reduced risk profile in developing that proposal
Revenue Adjustment MechanismEach year the authorized revenue requirement is ad-
justed to account for capital expenditures in the previous year The CapEx Adjustment applies to capital expenditures incurred by National Grid for distribution system invest-ments in the previous year net of the amount recovered through depreciation expense in base rates This accounts for the material difference in expected capital expenditures compared with prior years In this way the CapEx Adjust-ment in the National Grid revenue regulation mechanism is a special case of a ldquoK Factorrdquo which characterizes an expected change in costs in the future and accounts for those changes when they occur Each year the Company files with the Department documentation in support of the capital expenditures it has incurred since the previous review The Department reviews the filings to determine the prudence of the incremental expenditures and whether the expenditures are used and useful National Grid then allocates approved expenditures to rate classes based on the cost of service study For each class the Company determines the adjustment allocated to the rate class then divides this sum by the forecasted kWh sales for the follow-
Decoupling Case Studies Revenue Regulation Implementation in Six States
19
34 DPU 07-50 (2007) p 87
35 ACEEE Massachusetts Available at httpaceeeorgsectorstate-policymassachusetts
36 Personal communication with National Grid
ing year to determine the per-kWh adjustment In order to provide a balance between providing the
Company with sufficient funds to ensure the safety and reliability of the distribution system and protecting ratepay-ers against the incentive the Company has to overinvest in infrastructure the mechanism limits the level of annual capital expenditures that is recoverable through the mecha-nism To arrive at the amount the Department set a limit of $170 million per year which is equal to the approximate three-year average of the Companyrsquos capital spending in previous years Should the Companyrsquos capital expenditures exceed this limit it may seek to include the investment in the rate base during the next base rate proceeding
The Company submits its CapEx filing no later than July 1 of each year On November 1 of each year the Company submits all other information in support of its proposed adjustment factors The factors will take effect on March 1 of each year
The authorized revenue is also adjusted to include a 50-percent sharing for earnings above the authorized ROE
Reconciling Actual Revenue With Authorized Revenue
Each year National Grid calculates on a rate class-spe-cific basis the difference between the actual distribution revenue billed to customers through distribution rates and the annual target revenue For each rate class the difference between the actual billed distribution revenue and the an-nual target revenue is summed to determine the Company-wide reconciliation amount That amount is divided by the Company-wide kWh forecasted for the upcoming year to arrive at a cent-per-kWh reconciliation charge or credit To determine the final adjustment for each rate class the Company-wide reconciliation adjustment is added to the rate class-specific adjustment resulting from the target rev-enue adjustment mechanisms
The adjustment to the authorized revenue in any year is capped at three percent of total revenues34 Any excess can be carried forward to a future year with carrying charges equal to the customer deposit rate
National Grid must report to the DPU if the difference between the year-to-date billed revenue and year-to-date annual target revenue equals or exceeds ten percent of the target revenue and the Company believes that the difference will fall outside of the ten-percent threshold in the coming months In this case interim revenue regulation adjust-ments can be made In order to avoid an interim adjust-ment too close to the scheduled annual rate adjustment
National Grid must notify the Department of variances exceeding ten percent of annual target revenue by August 31 of each year
Complementary Policies Massachusetts requires that electric utilities procure
all cost-effective energy efficiency before more expensive supply-side resources This requirement was translated into annual savings requirements for electric utilities starting from 1 percent of sales in 2009 to 14 percent in 2010 2 percent in 2011 and 24 percent in 2012 and potentially increased savings in subsequent years Utilities can earn approximately five percent of program costs for meeting or exceeding savings targets35
National Grid offers inclining block rates as the default residential rate but there is an optional TOU rate with peak and off-peak tiers also available to residential customers Small and large industrial and commercial customers can take service under flat rates inclining block rates or TOU rates
National Grid operates under a penalty and reward sys-tem for service quality established in Docket DTE 99-84 The impetus behind the DPUrsquos original establishment of the Service Quality Guidelines was to prevent Massachusetts utilities from allowing service quality to deteriorate under a new regulatory regime
Energy Efficiency OutcomesBefore Massachusetts Electric implemented revenue
regulation in 2009 it reported consistently high levels of incremental energy efficiency savings approximately 09 percent of retail load In 2010 the company reported 136 percent savings and 159 percent in 2010 and 2011 respectively36
ResourcesMassachusetts Department of Public UtilitiesDocket 09-39 Petition of Massachusetts Electric Company
(November 30 2009)
Decoupling Case Studies Revenue Regulation Implementation in Six States
20
37 Energy Agreement Among the State of Hawaii Division of Consumer Advocacy of the Department of Commerce amp Consumer Affairs and Hawaiian Electric Companies Available at httpwwwhecocomvcmcontentStaticFilespdfHCEIpdf
38 The HECO Companies described as follows in their Reply SOP in the Schedule A decoupling proceedings ldquothe
Hawaii Hawaiian Electric Company
Hawaiian Electric Company (HECO) uses a revenue regulation mechanism that compares actual revenue to target revenue in each year The target revenue is based on the authorized
revenue for the last test year adjusted for operation and maintenance (OampM) increases and rate base changes
HECO is a subsidiary of Hawaiian Electric Industries which also operates Maui Electric Company (MECO) and Hawaiian Electric Light Company these subsidiaries service the islands of Maui and Hawaii County while HECO serves Oahu (Honolulu)
Authority In 2008 the Governor of Hawaii the Division of Con-
sumer Advocacy and HECO entered into an agreement as a result of the Hawaii Clean Energy Initiative37 The agreement is intended to move Hawaii away from its dependence on imported fossil fuels for electricity and ground transporta-tion and toward locally produced renewable energy and energy efficiency In the agreement the State the Consumer Advocate and HECO committed to among other things a transition away from a model that encourages increased elec-tricity usage and to a model that implements revenue regula-tion decoupling to encourage the development of renewable energy by HECO The Commission opened Docket 2008-0274 in order to examine the features of a revenue regula-tion mechanism The Opening Order directed HECO and the Consumer Advocate to file a joint proposal on revenue regulation within 60 days This joint proposal was modeled closely after the California mechanism described earlier for PGampE with a rate-case determined revenue requirement plus annual attrition adjustments plus separate mechanisms
to recover power supply and energy efficiency costsThe Hawaii Public Utilities Commission approved
revenue regulation for HECO in August 2010 based on an investigation into the appropriateness of revenue regula-tion and its design The revenue regulation mechanism took effect on March 1 2011 This replaced a previous lost revenue adjustment mechanism
Authorized Revenue RequirementThe Commission establishes the Authorized Base Rev-
enues through a general rate case based on traditional cost-of-service ratemaking principles The Authorized Base Revenue is the annual amount of revenues required for the utility to recover its estimated OampM depreciation amorti-zation and tax expenses for the period
The Target Revenue is equal to the base revenue require-ment less any revenue being separately tracked or recov-ered through any other surcharge or tracking mechanism including revenue for fuel and purchased power expenses
The revenue regulation order also requires staggered triennial rate cases for each of the Hawaiian Electric Indus-tries Companies to determine approved baseline Revenue Adjustment Mechanism (RAM) inputs
Rate of ReturnThe Commission made no explicit adjustment to ROE
owing to the revenue regulation mechanism but noted that the allowed ROE of ten percent reflects the approval of revenue regulation and other cost-recovery mechanisms that will lower HECOrsquos business risk38 Most recently the Hawaiian Public Utilities Commission approved a 90-per-cent ROE for MECO reflecting both a lower baseline cost
Commission effectively reduced the Companiesrsquo return on common equity by 50 basis points to ldquofairly compensate ratepayersrdquo for what it perceived as the ldquorisk-reducingrdquo effects of the RBA and RAM mechanisms the Renewable Energy Infrastructure Program (lsquoREIPrdquo) Surcharge and the Purchased Power Adjustment Clause (ldquoPPACrdquo)rdquo Available at httpdmspuchawaiigovdmsDocumentViewerpid=A1001001A10L29B55326B47993
Decoupling Case Studies Revenue Regulation Implementation in Six States
21
39 Hawaii PUC Decision and Order No 31288 (2013 May 31) pp 97ndash112
40 Hawaii PUC Decision and Order No 31289 (2013 May 31)
41 Hawaii PUC Decision and Order No 31908 (2014 Feb 1)
42 February 7 2014 order on schedule A issues Available at httpdmspuchawaiigovdmsDocumentViewerpid=A1001001A14B10B22326F07922 p 42ndash47
of capital and a penalty of 050 percent associated with inadequate performance bringing renewable energy into the MECO system39 A companion Order also established new guidance on future revenue regulation mechanisms40
Revenue Adjustment MechanismThe RAM is designed to replace the need for annual rate
cases by adjusting Authorized Base Revenue levels to reflect estimated changes in the utilityrsquos cost of service The RAM is intended to via formula-driven estimates and escalators compensate the HECO Companies for changes in util-ity costs and infrastructure investment between rate cases and reduce the frequency of rate cases The RAM Period is the calendar year containing the Annual Evaluation Date (March 31 the date of the annual RAM filing) The RAM adjusts the revenue requirement according to changes in four main categories of expenses
bull Base expenses which are changes in designated OampM expenses
bull Rate base the return on incremental investment in designated rate base components41
bull The incremental depreciation and amortization expenses and
bull Exogenous tax changes changes in costs owing to significant changes in tax laws or tax regulations
Base expenses are segregated between labor and non-labor amounts The labor component is adjusted annually by the Labor Cost Escalation Rate reduced by the Labor Productiv-ity Offset (fixed at 076 percent) The non-labor component uses the Non-labor Escalation Rate to annually adjust those costs Tracked OampM expenses for fuel purchased power pension and post-employment benefits integrated resource planning DSM and other rate adjustment provisions are not adjusted in the RAM because any changes in these costs are accounted for in other cost-tracking mechanisms
The Rate Base equals the average net investment esti-mated for the RAM Period The average rate base is the rate base for the rate case test year with adjustments for changes in only four components of rate base (1) average plant-in-service (2) average Accumulated Depreciation (3) average accumulated contributions in aid of construc-tion and (4) average accumulated deferred income taxes All other components of the rate base remain the same as in the preceding rate case test year The average plant-in-service is equal to the average of the actual plant-in-service at the end of the year prior to the RAM period the Evalu-ation Year and the same year-end balance plus estimated plant additions for the RAM period Plant additions include
Baseline Capital Project plant additions and Major Capital Projects plant additions estimated to be in service by Sep-tember 30 of the RAM period
The RAM also includes an Earnings Sharing Revenue Credit mechanism in order to protect against excessive over-all utility revenue levels The RAM will escalate and update the Companyrsquos approved base revenue requirement reduced by earnings sharing credits and major project revenue credits to customers Based on the Companyrsquos achieved return on common equity for the Evaluation Year the mechanism cred-its the RBAs according to the following chart
ROE at or below the authorized ROE
First 100 basis points (1) over authorized ROE
Next 200 basis points (2) over authorized ROE
ROE exceeding 300 basis points (3) over
authorized ROE
Retained entirely by shareholders no customer credits
25 share credit to customers
50 share credit to customers
90 share credit to customers
Finally the RAM includes additional consumer protectionsbull A provision for Major Capital Projects Creditsbull A provision for Baseline Capital Projects Creditsbull Notification is provided to all affected customers of
the RAM filing in newspapers and billsbull Evaluation procedures for filing examination and any
exceptions to annual revenue regulation filingsbull Continued ability of HECO or the Consumer
Advocate to request formal rate proceedings to replace and terminate RAM at any time and
bull Formal review of revenue regulation as a part of the next round of rate case proceedings
A recent order42 added two additional consumer protections
bull A limitation that only 90 percent of the current
Decoupling Case Studies Revenue Regulation Implementation in Six States
22
43 ACEEE Hawaii Available at httpaceeeorgsectorstate-policyhawaii
RAM Period Rate Base that exceeds the Rate Base Adjustment Mechanism from the prior year can be included in the Decoupling Mechanism for baseline utility plant projects which unlike major capital projects are not subject to prior Commission review and approval and
bull A requirement to post a number of metrics online for customer review although not at this point tied to performance
This order also examined four issues with respect to the application of the RAM The Commission determined that the short-term debt rate as reflected in the most recent rate case should be used to adjust over- and under-collections The Commission also resolved its concern that without a sustainable business plan there exists no strategic frame-work under which to evaluate capital expenditure pro-grams The Commission required the parties in the Docket to further explore capital expenditure issues in conjunction with other risk-sharing mechanisms discussed elsewhere in the order The commission ordered a further evaluation of a proposed risk-sharing mechanism within the RBA Further-more the Commission ordered the parties to work together to establish appropriate metrics which the utility would report on its website
Once the total RAM Revenue Adjustment is calculated it is applied through a uniform adjustment to the per-kWh energy charge for all customer classes
Reconciling Actual Revenue with Authorized Revenue
RBAs record the monthly differences between target revenues and the adjusted recorded electric sales revenues The RBA also applies monthly interest equal to the annual rate for short-term debt from the cost of capital in each HECO Companyrsquos last base rate case to the simple average of the beginning and ending balances each month in the RBA In effect the RBA applies one-twelfth of the rate each month Finally the RBA provides for collection or return of the calendar year-end balances in the RBA and recovery of the RAM Revenue Adjustment over the subsequent May 1 through April 30 period The target revenue is the most recent Authorized Base Revenue or the re-determined Authorized Base Revenue calculated under the RAM
On or before March 28 the Company must file with the Commission a statement of the previous year-end balance in each RBA sub-account and the Authorized Base Revenue level for the current calendar year with supporting calculations An amortization of the year-end balance in the
RBA sub-accounts and the RAM Revenue Adjustment are recovered through the per-kWh RBA rate adjustments The rate adjustment occurs from May 1 of the current calendar year to April 30 of the next year
Complementary PoliciesCurrently electric utilities in Hawaii may use energy
efficiency to meet a portion of their Renewable Portfolio Standard requirements Starting in 2015 electricity savings from energy efficiency will be applied to the Statersquos Energy Efficiency Portfolio Standard which sets a target equivalent to 30-percent forecast sales by 2030 This goal is translated into a target of 14 percent annual savings HECO trans-ferred administration of all of its energy efficiency programs to a third party administrator in 2009 The administrator is compensated for satisfactory performance43
Because of its heavy dependence on petroleum as a generation fuel electricity prices in Hawaii are very high solar and wind are typically lower-cost resources for these systems HECOrsquos default residential rates are inclining block rates with a $900month customer charge and a three-block inclining rate design of $034kWh to $037kWh Residential customers can elect to take service under a TOU rate with off-peak mid-peak and priority-peak tiers Gen-eral service and large power service customers take service under a flat rate unless they opt to take service under a TOU
Hawaii is developing reliability standards in part as a response to deteriorating service quality as a result of distributed and customer-owned generation (see text box) In an effort to make electricity reliability and interconnection standards as transparent as possible the Reliability Standards Working Group was formed in the Feed-In Tariff docket and continues its work in Docket No 2011-0206 to find solutions to integrating high penetrations of renewable energy consistent with reliability and power quality standards
Energy Efficiency OutcomesHECO implemented revenue regulation in 2011 Since
2003 HECO has reported incremental energy efficiency savings between 0 and 05 percent of retail load with 131 percent savings reported in 2011 by Hawaii Energy the
Decoupling Case Studies Revenue Regulation Implementation in Six States
23
44 Hawaii PUC Decision and Order No 31288 Maui Electric Company Limited Docket No 2011-0092 (2013 May 31) Appendix C p 2
Statersquos ratepayer funded efficiency program administrator The company has not yet reported its savings for 201245 In addition HECO has seen more than a sixfold increase in renewable installations under its net metering and feed-in tariff policies since the inception of the revenue regulation plan
Revenue regulation represents a regulatory framework that removes the financial disincentive for utilities to pursue clean
energy strategies It doesnrsquot in and of itself align the utility business model with those utility policies and practices that address customer expectations In fact some commissions are concerned that it might create a dynamic in which the utility assured of its revenue needs becomes complacent and lacks motivation to innovate and develop strategies that may be more in line with the public interest
In a recent order (Docket 2011-0092 May 31 2013) the Hawaiian Public Utilities Commission addressed this big picture issue in a rate order for Maui Electric The Commission called out the management as lacking a long-term vision for creating customer value and expressed concern that ldquothe HECO Companiesrsquo over-reliance upon a link between the [Decoupling]
Agreement and utility financial health obfuscates utility performance and ultimately customer service and satisfactionrdquo44 The implementation of clean energy policies is not a singular goal but rather a policy that must be part of a larger effort to create customer value
The Commission laid out a hard path and a soft path to achieve the results they desire for consumers The hard path involves a closer examination of utility investments operations and expenditures The soft path is opened through the actions of management to create and execute a vision for the utility of the future The Commission remains committed to regulatory innovations that are in the public interest and will work with the utility consumer advocate and other stakeholders to create and implement this vision
The results of this effort will likely produce ideas and outcomes that will have applicability beyond this one utility
ResourcesHawaii Public Utilities CommissionDocket No 2008-0274 Final Decision and Order (August 31 2010)Docket No 2008-0083 Final Decision and Order (December 29 2010)Docket No 2011-0092 Final Decision and Order May 31 2013 including
Decision and Orders Nos 31288 and 31289Docket No 2013-0141 Final Decision and Order (February 1 2014) including
Decision and Order No 31908
45 EIA Form EIA-861 data files Available at httpwwweiagovelectricitydataeia861
Decoupling Case Studies Revenue Regulation Implementation in Six States
24
46 Lazar et al 2011
Discussion of the Six Utilities Overall
Authority The first step in implementing a revenue regulation
mechanism is to understand the authority of the regulating body the Public Utility Commission or PSC It is important for any Commission to clarify its justification for acting on revenue regulation in order to prevent any decisions from being overturned Over the years Utilities Commissions have relied on different justifications for implementing revenue regulation mechanisms Commissions have imple-mented revenue regulation at their own discretion justified by their directive to ensure safe reliable and economic public utility service to citizens to justify changing the regulatory environment In some cases the Commission is unable to engage on narrow issue ratemaking and rates can change only as the result of a full rate case In this case statutes must be amended to enable revenue regulation
In all of the case studies discussed here the Commis-sions first implemented revenue regulation at their own dis-cretion but each followed slightly different paths to do so The CPUC first implemented revenue regulation in 1978 at its discretion In 2001 after a period when mechanisms were suspended the California Legislature required that deviations from projected sales not result in under- or over-collections by utilities and so the CPUC re-implemented revenue regulation according to statutory requirement The Hawaii Public Utilities Commission implemented rev-enue regulation after an agreement between the utility the Governor and other stakeholders called for it In Idaho the Commission established a case in which to investigate rev-enue regulation and held a series of stakeholder workshops before implementing the policy The Massachusetts DPU adopted revenue regulation as a statewide regulatory policy and required individual utilities to file tariffs in response as the result of its general investigation into rate structures that promote demand-side resources The Maryland Com-mission implemented revenue regulation for BGE when the utility requested the mechanism Thus the impetus to develop a revenue regulation mechanism may come from different sources and the Commission may be comfortable
in moving forward under their general supervisory statutes Nevertheless specific statutory language can be helpful to shore up the existing authority
Authorized Revenue Requirement Under the traditional regulatory framework the Com-
mission (or other authority in the case of publicly owned utilities) must determine a utilityrsquos revenue requirement This function does not change under revenue regulation The revenue requirement of a utility is the aggregate of all the operating and other costs incurred to provide service to the public This typically includes operating expenses depreciation and the cost of capital invested including in-terest on debt and a ldquofairrdquo return on equity to investors The (simplistic) formula for determining revenue requirements is as follows
Revenue Requirements = (Rate Base times Rate of Return) + Operating Expenses + Depreciation +Taxes
Traditionally the revenue requirement along with sales is used to determine the rates consumers will pay for elec-tricity46 The rates are also broken down by customer class and intraclass tariffs are created based usually on a cost of service study that determines each customer class and subclass contribution to the utilityrsquos costs The (simplistic) formula for determining the rate per unit is
Rate = Revenue Requirement divide Units Sold
In this way rates are set to allow the utility to exactly recover its revenue requirement when the sales level used to calculate rates is equal to actual sales However it is important to recognize that actual expense and revenue varies with actual sales When actual sales are greater than the sales level used in ratemaking revenue increases and expenses increase by a different amount when actual sales are lower than the ratemaking sales level actual revenue
Decoupling Case Studies Revenue Regulation Implementation in Six States
25
declines and expenses decrease by a different amount Under revenue regulation rates are initially set in the same way but when actual sales differ from the level used to calculate rates the actual revenue level is maintained at the rate case amount as rates are allowed to vary inversely with salesmdashincreased sales lead to decreased rates and vice versa Because the primary expenses that change in the short run as sales levels change are power supply expenses and most regulators allow these to be tracked using a power cost adjustment mechanism revenue regulation mechanisms are generally designed to ensure recovery of the non-power costs (which do not change significantly in the short-run) as sales volumes change
Revenue regulation ensures that actual revenue is equal to the revenue requirement established by the Commission or appropriate authority Although the description above presents an overly simplified view of the revenue require-ment and its use in traditional price regulation and revenue regulation there are many variations on how a Commis-sion can establish a revenue requirement particularly when implementing revenue regulation With revenue regulation as in traditional ratemaking imprudent costs can always be removed from rates and there is no change to the ability of a Commission to impose penalties
Utility Functions to be IncludedFirst the regulator must determine which utility func-
tions will be included in the revenue regulation framework With vertically integrated utilities this usually includes a utilityrsquos regulated generation transmission and distribution units As we discuss below however it is critical to struc-ture power supply recovery mechanisms to avoid providing for double-recovery of certain power supply costs For utili-ties operating in areas of the country that have restructured electricity markets only the regulated distribution busi-ness is decoupled Utilities that also provide gas services
Pacific Gas amp Electric Future test year
Idaho Power Company Historic test year
Baltimore Gas amp Electric Hybrid test year
Wisconsin Public Service Corporation Future test year
National Grid Historic test year
Hawaiian Electric Company Future test year
Table 2
Test Year Used
may have their gas distribution business operating under revenue regulation as well
Test YearOne consideration in establishing the revenue require-
ment is what period of time will be used as a ldquotest periodrdquo or ldquotest yearrdquo The test year is the year on which the Com-mission will base its computations of the utilityrsquos total costs and sales levels A historic test year uses actual data on sales and costs from a past year Whereas a historic test year allows for the use of actual cost data it cannot account for expected variations in sales A future test year requires assumptions to be made about a utilityrsquos sales in a future year This can allow expected changes in sales like those from energy efficiency programs to be included in sales
projections however because regulators are relying on estimates provided by the utility there may be a greater risk for inaccuracy A Commission may also choose to use a test year that includes both past and future periods This may provide a sense of balance between historic and future data Furthermore as the case proceeds the Commission can require the utility to substitute historical data for projected data from the test year
Rate of ReturnAs in any rate case regulators
must determine the appropriate rate of return that a utility can earn on its investments including the cost of debt and the allowed ROE for its shareholders The approved ROE is only used to establish the return on investments that are included in the rate base when determining revenue require-
Pacific Gas amp Electric Electric generation and distribution gas distribution
Idaho Power Company Electric generation and distribution
Baltimore Gas amp Electric Electric distribution gas distribution
Wisconsin Public Service Corporation Electric generation and distribution
National Grid Electric distribution
Hawaiian Electric Company Electric generation and distribution
Table 1
Business Unit Included in the Revenue Regulation Model
Decoupling Case Studies Revenue Regulation Implementation in Six States
26
47 In a rate case the Commission determines an allowed return on equity This is used to set a price (price regulation) or an allowed revenue requirement (revenue regulation) Once set however the actual return earned by the utility is affected by anything that changes either revenue or expenses for example an increase in employee compensation a change in the number of employees or under price regulation a change in sales volumes
48 Lazar et al 2011
ments Although revenue regulation ensures that a utility recovers no more or less than its target revenue revenue regulation does not guarantee that the utility will earn the authorized ROE Depending on how a utility manages its costs between rate cases it will realize an actual ROE either higher (in the case of reduced costs) or lower (in the case of increased costs) than the authorized level47
A utilityrsquos allowed ROE generally represents the return deemed necessary to attract investment considering the level of risk of that investment Riskier investments require a higher return to attract investors and vice versa Util-ity earnings can be volatile because of short-run impacts on sales volumes and revenues which include changes in sales owing to weather economic conditions and energy efficiency and DG programs This volatility typically causes utilities to retain a higher level of equity in their capital structures so that reduced revenues do not leave them un-able to service their debt Revenue regulation can reduce this volatility by stabilizing revenues regardless of the cause Because of this reduced risk many stakeholders have proposed that the implementation of a revenue regulation mechanism be associated with a corresponding reduction in the utilityrsquos equity capital ratio (the percentage of capital supplied by common equity) This reflects the utilityrsquos more stable revenue owing to revenue regulation and reduces the overall revenue requirement that will be recovered from consumers48
An alternative option to reducing the utilityrsquos equity ratio is to reduce the ROE reflecting a lower risk level For the utilities included in these case studies only BGE and Mass Electric experienced a reduction in their ROE The Com-mission did not reduce BGErsquos ROE at the time the revenue regulation mechanism was implemented but reduced it by 50 basis points during the subsequent rate case The Mas-
sachusetts Commission did not reveal its adjustment but incorporated a lowered ROE into its decision
Absent an explicit adjustment to the cost of capital investorsrsquo expectations will adjust to the presence of rev-enue regulation if its presence is reliable The more stable earnings will likely in time contribute to a higher credit rating That in turn will lead to lower cost debt that will be revealed in future cost of capital calculations An adjust-ment to the ROE or capital structure by the regulator in a rate proceeding will be reflected immediately in lower rates to consumers simply allowing the utilityrsquos credit rating to improve over time and its cost of debt to decline will have the same effect but on a lagged basis as new bonds are is-sued at lower interest rates49
Beginning in 2004 Standard and Poorrsquos began publish-ing ldquorisk profilesrdquo for utilities which classified utilities based on their earnings variability and other risks those with more stable earnings were determined eligible for higher bond ratings at any given equity capitalization ratio (or alternatively able to retain a given bond rating with a lower equity ratio)50 One utility with a revenue regulation mechanism Northwest Natural Gas was believed to have had their business risk profile upgraded by one step in response to the benefits of the mechanism51
Effect on Bond RatingsRevenue regulation stabilizes a utilityrsquos revenue streams
reducing risk to investors this reduced risk may be a contributing factor in an increase in a utilityrsquos bond rating Bond rating agencies have recognized that revenue regula-tion mechanisms and other mechanisms that reduce net earnings volatility and risk contribute to a lower cost of capital for the utility52 Standard and Poorrsquos has explicitly stated that it ldquoviews decoupling as a positive develop-
49 Lazar et al 2011
50 Standard and Poorrsquos (2004 June 2) New Business Profile Scores Assigned for US Utility and Power Companies Financial Guidelines Revised
51 Christensen Associates (2005 March) A review of distribution margin normalization as approved by the Oregon Public Utility Commission for Northwest Natural
52 Lazar et al 2011
Decoupling Case Studies Revenue Regulation Implementation in Six States
27
This topic raises a note of caution if mechanisms are not well designed double-recovery of costs can occur for verti-cally integrated utilities that provide both power supply and distribution services For example if a per-customer
revenue regulation mechanism includes investment-related power supply costs in the revenue-per-customer formula but excludes fuel and purchased power costs that are recovered through a separate tracking mechanism double recovery of some power supply costs is likely If the utility experiences cus-tomer and sales growth the amount it recovers for investment-related power supply costs will go up However if that utility serves this growth by operat-
ing existing power plants more by selling less power on the surplus market or by purchasing power from other suppli-ers it will not incur any increases in the type of power sup-
53 Standard amp Poorrsquos (2008 February 19) Decoupling the vehicle for energy conservation
ment from a credit perspectiverdquo53 However in the case of the utilities examined in this report none experienced an improved credit rating after the implementation of revenue regulation with the exception of PGampE However PGampE came out of Chapter 11 bankruptcy in the same year that its revenue regulation mechanism was implemented mak-ing it impossible to attribute the improvement to revenue regulation alone Bond rating changes are generally slow to evolve Numerous other factors are taken into account when assigning an overall credit rating which appear to have outweighed any positive effect of revenue regulation These factors certainly include the recession of the US economy that began in 2007
Customer Classes IncludedWhen determining the target revenue for a utility rev-
enue regulation mechanism regulators must also consider which customer classes to include in the mechanism In some cases industrial customers have objected to a rev-enue regulation mechanism This is due to the wide dif-ference in rates among customers making the design of a revenue regulation mechanism more challenging If regula-tors choose to exclude a class of customers from revenue regulation they must determine the revenue requirement associated with serving only the included customer classes This generally requires a detailed cost of service study to ensure that revenue responsibility is accurately allocated by customer class
Included CostsFinally regulators may wish to exclude specific costs
from the overall revenue requirement if those costs will be tracked through another mechanism like fuel costs in a PCA mechanism energy efficiency program expenditures or smart grid costs for example Separate tracking mecha-nisms can also be used for those costs that are difficult to
Pacific Gas amp Electric All customer classes
Idaho Power Company Residential and small general service
Baltimore Gas amp Electric Residential and small general service
Wisconsin Public Service Corporation All customer classes
National Grid All customer classes
Hawaiian Electric Company All customer classes
Pacific Gas amp Electric
Idaho Power Company
Baltimore Gas amp Electric
Wisconsin Public Service Corporation
National Grid
Hawaiian Electric Company
Table 3
Customer Classes Included in Revenue Regulation Mechanism
Table 4
Costs Excluded From Revenue Regulation Mechanism
project based on historical data or costs over which the util-ity has very little control like fuel costs Although revenue regulation tracks collected revenue mechanisms like Fuel Adjustment Clauses Purchased Power Adjustments and Energy Efficiency Riders can be designed to track actual costs as well as collected revenue
Energy procurement costs
All variable costs
Energy supply costs
Energy costs
Energy supply costs for basic service customers transmission costs the energy efficiency system benefits charge and reconciling charge and costs recovered through the residential assistance adjustment factor
Fuel and purchased power
Decoupling Case Studies Revenue Regulation Implementation in Six States
28
54 We use the RAM term applied in Hawaii here to address any type of attrition or similar mechanism other than a revenue-per-customer framework that changes the allowed revenue between general rate cases
ply costs accounted for in the revenue per customer (RPC) calculation The increased power supply costs to serve that growth will be recovered through the fuel and purchased power tracking mechanism The net effect for the utility will be to recover incremental power supply costs twicemdashonce in the per-customer mechanism and again in the fuel and purchased power mechanism It is essential to make sure that the other adjustment mechanisms do not overlap the cost impacts that are treated in the revenue regulation mechanism One way to do this is to ensure that all power supply costs (investment labor fuel purchased power) are recovered through a single mechanism There are several ways to achieve this
a) A comprehensive power supply recovery mechanism that includes all power supply costs that is separate from the costs treated in the revenue regulation adjustment (eg Puget Sound Energy Washington State)
b) No power supply adjustment whatsoever with all utility costs included in an RPC mechanism (eg National Grid)
c) An annual attrition calculation with all costs reviewed for changes since the last proceeding (eg HECO)
Revenue Adjustment Mechanism in Revenue Regulation
A RAM54 is not necessary to achieve revenue regulation but provides attrition reliefmdashincreasing authorized revenue commensurate with increased costsmdashbetween rate cases Whereas revenue regulation sets a target revenue that the utility will earn regardless of sales levels the RAM adjusts the target revenue between rate cases Regulators may choose to take several different approaches to RAM
bull No RAM Regulators may choose not to implement a RAM leaving the revenue requirement unchanged between rate cases This requires the utility to request a rate case when it requires additional revenue to cover its costs
bull Stairstep Stairstep adjustments provide predetermined increases in target revenue These increases can be determined during a rate case and generally reflect forecasts of cost growth
bull Indexing Indexing ties adjustments to the target revenue to multiple factors like inflation productivity customer growth and changes in capital expenditures
bull RPC The RPC approach is a form of indexing RPC adjusts the total revenue requirement for the
number of customers served Regulators using an RPC mechanism will determine the revenue requirement per customer and the overall revenue requirement will be determined by multiplying the total number of customers by the revenue requirement per customer The amount of revenue required to serve each customer can be determined separately for customer classes and for existing and new customers This way the RPC method accounts for a utilityrsquos growth in fixed costs that is related to growth in the number of customers served RPC is useful where the correlation between cost growth and customer growth is significant It also protects customers from making up the deficit if there is a loss in customer load such as if a large business closes down or relocates
bull Hybrid Hybrid RAMs generally use stairstep increases to account for projected capital costs and indexing to account for OampM expenses
Adjustments from any type of RAM can be implemented automatically or through an attrition proceeding Some stakeholders oppose adjustments to the revenue require-ment outside of a rate case on the basis that this could allow the revenue requirement to increase significantly without examination of the impact on ratepayers or with-out due consideration of other costs and revenues For this reason some regulators choose to cap the total adjustment that can be made to the revenue requirement outside of a rate case
Table 5
Type of Revenue Adjustment Mechanism
Pacific Gas amp Electric
Idaho Power Company
Baltimore Gas amp Electric
Wisconsin Public Service Corporation
National Grid
Hawaiian Electric Company
Hybrid
RPC
RPC
RPC
No RAM potential capital expenditure adjustment
Hybrid
Decoupling Case Studies Revenue Regulation Implementation in Six States
29
55 Because this method results in changes in the price for service that are calculated after that service has been provided it fails the ldquono retroactive ratemakingrdquo statutes that guide most electricity regulators Customers are entitled to know the price of the commodity they are consuming at the time they use it
56 The closest to a current method in use for electric utilities in the BGE system of monthly reconciliation
Table 6
Tracking and Accrual of Difference BetweenActual and Authorized Revenue
Pacific Gas amp Electric
Idaho Power Company
Baltimore Gas amp Electric
Wisconsin Public Service Corporation
National Grid
Hawaiian Electric Company
Track Difference
Monthly
Monthly
Monthly
Yearly
Yearly
Monthly
Accrual Period
Year
Year
Month
Year
Year
Year
Calculation of Actual RevenueRegulators have options when ensuring that actual
revenue equals target revenue under revenue regulation First regulators must decide how to determine ldquoactual revenuerdquo In most cases actual revenue simply equals the amount of revenue a utility collects from its customers The Idaho Public Utilities Commission however has chosen to use weather-normalized revenues as the basis for utility revenues in revenue regulation Although this prevents the utility from recovering revenue lost to it owing to milder than expected weather it further complicates the revenue regulation mechanism and reduces its risk-reduction ben-efits By the same token if weather is severe and increases sales above the revenue requirements weather normaliza-tion would allow the utility to retain some of the revenues
Next regulators must determine whether to implement revenue regulation using a current or accrual method
bull Current Method With the current method of revenue regulation the target revenue for a period say a month is divided by the actual sales in that period to determine the rate per kWh The current method ensures that actual revenue equals target revenue by calculating the rate at the end of the period so that the target revenue can be recovered The current method allows for no lag in revenue recovery One effect of this method is that although customer rates vary total bills are generally more stable For example in a hotter than expected July customers will purchase more kWh but they will be charged a lower rate A milder than average winter would lead to fewer sales but at slightly increased rates This way customers do not experience the same bill variability as they would if rates were set before the sales deviations occurred On the other hand the current method does not provide customers with the ability to plan ahead based on a predictable rate for electricity This method has been used for revenue regulation of natural gas utilities55
bull Accrual Method Under the accrual method rates are set based on an assumed sales level and the differences between actual and target revenue are allowed to accrue over some period Then the total difference between actual and target revenue is reconciled through an adjustment to rates in the subsequent period this is known as the true-up process Presently all revenue regulation mechanisms for electric utilities use the accrual method56
If regulators use the accrual method of revenue
regulation they will next need to determine the period over which the difference between actual and target revenue will be allowed to accrue One year is typical however shorter periods are also used Next the frequency of comparing collected revenue to target revenue should be determined It is possible to do this comparison only once at the end of the accrual period It is common however for comparisons to occur more frequently often monthly When revenues are compared within the accrual period the differences are tracked generally for the purpose of applying interest to the difference that will be deferred until the end of the accrual period
Rate AdjustmentsIn designing a revenue regulation mechanism there are a
number of decision points that regulators need to consider to balance the interests of all the stakeholders One of the decision points revolves around the determination of the mechanism used to adjust rates The issues that regulators need to consider include the following1 Rate Case Requirements One of the often-mentioned
concerns about surcharges especially when they are numerous is how that will impact the frequency of rate cases For regulators and stakeholders rate cases provide
Decoupling Case Studies Revenue Regulation Implementation in Six States
30
the best mechanism to correctly align rates and costs but they are time-consuming and expensive for all parties This is because a rate case presents an opportunity to closely examine all of the utilityrsquos expenses and adjust rates to reflect cost increases and decreases Because under a revenue regulation mechanism the goal is to match revenues received from all customers with revenue requirements a correct determination of revenue requirements is important as is the specification of appropriate cost indices to adjust the revenue requirements As the time between rate cases increases some regulators feel the base rate case data even with adjustments need to be reexamined As a result some regulators have chosen to mandate the frequency of rate cases to address this whereas others have not It may be that in some cases where there are numerous surcharges recovering a multitude of costs there may not be as many costs subject to review in the rate case making it less significant to a regulator than a case in which most costs are being analyzed and recovered in the rate case itself
2 Collection Mechanism Integrally tied to the mechanism for recovering revenues is how the utility will collect or refund the revenues Options that are available include recovery through a rate case or periodic adjustments to rates through a surcharge mechanism As can be seen by the case studies depending on the plan in place some utilities have very discreet requirements dictating the frequency of rate cases with adjustments occurring in those cases or between those cases Other utilities have no requirements upon them with respect to the frequency of rate case filings This will be discussed in more detail below What does emerge from these case studies is that the discreet components or choices in how to execute a revenue regulation plan are carefully interwoven to create a holistic approach Each component works with the other and the value of this case study is in examining the different pathways that can be chosen As discussed previously some of the commissions have authorized revenue regulation to recover the revenue requirements in the last rate case whereas others have authorized adjustments to rates between rate cases this impacts the pathway that the adjustment mechanism takes
3 Timing How often should rates be adjusted to true up to the utilityrsquos revenue requirement States have chosen different options ranging from monthly to annually
4 Allocation of Revenue Regulation Revenue Surpluses or Deficits There are a number of decision points regarding allocation Should the revenue regulation apply to all rate classes or just the smaller customers whose usage per customer and load variations are not as dramatic as those of larger-use customer classes Should there be a different allocation to each rate class or should the allocation of costs among the classes be the same Different mechanisms accomplish different goals Some states have allocated revenue regulation revenues based on the revenues lost by customer class as a result of energy efficiency This can sometimes be a political decision to mitigate opposition to energy efficiency programs by large customers Other states recognize that the system savings resulting from energy efficiency benefit all customers so that all customers should pay equally
5 Carrying Charges Depending on the timing issue discussed previously regulators may want to consider carrying charges on any adjustments This should be symmetrical in its application however so that it applies to surcharges and refunds Consideration should be given for the basis of the carrying charge rate whether weighted average cost of capital rate of return a risk-free rate or some other mechanism should be adopted
6 Rate Caps In order to mitigate potential rate impacts a regulator may want to consider a cap on how much rates can go up when the revenue regulation adjustment is made This might be more critical if the regulator is aware of other potential rate increases that will impact customersrsquo bills If a cap is used the case in which the utilityrsquos adjustment would exceed the cap must be considered Some regulators have opted to allow the utility to carry over the excess unrecovered amount for a period of years whereas others do not This allows the utility to recover those revenues in a subsequent year when perhaps the adjustment is less As a practical matter however adjustments of greater than three percent are less common as shall be discussed later
7 Impact on At-Risk Consumers Low-income and consumer advocates have expressed concern about revenue regulation as a vehicle for annual rate increases without the scrutiny of a general rate case creating rate increases for the low-use customers doing the most to constrain usage and help achieve targeted energy savings One proposal to address this has been to impose any resulting surcharges only to above-average usage
Decoupling Case Studies Revenue Regulation Implementation in Six States
31
57 Cavanagh and Howat (2012 May 2) Finding common ground between consumer and environmental advocates Electricity Policy
58 The most common criticism of future test years is that utilities forecast costs under an assumption that all authorized personnel positions will be filled while in retrospect any large organization has some level of vacancy in its employee count A historic test year captures this effect fully
customers and any resulting credits only to below-average usage57
Rate Case RequirementRequirements as to the frequency of rate cases can be
tied to the recovery mechanism or to the entire regulatory framework for implementing revenue regulation In the cases studied two of the utilities require periodic rate cases PGampE every three years and WPS every year Two others National Grid and HECO require annual mini rate cases explained later in which adjustments are made and two others IPC and BGE have no requirements for scheduled rate cases Nevertheless if the concern is to ensure that the utilityrsquos revenue recovery meets its revenue requirements some kind of periodic rate case to examine costs is appropriate Having periodic rate cases can provide a measure of assurance to consumer advocates that the level at which the revenues and hence the rates are set is correct One of the criticisms of revenue regulation is in fact the lack of rate cases to produce a proper level of confidence in the allowed amounts Multiple surcharges are usually additive to existing rates therefore not permitting an opportunity to reduce the base rate for reductions in cost Moreover the infrequency in cases impedes the examination of rate allocations as would occur through a cost of service study
This is a particular issue where utilities are augmenting power supply with purchased power from independent power producers which is the most common method for acquiring wind and solar production today The increased cost for purchased power may flow through a fuel and purchased power adjustment mechanism while the (depreciating) investment in conventional power plants remains static in base rates
Both PGampE and WPS use a future test year that allows the utility to project revenue requirements during the time period that the rates are to be in effect The benefit to this is that it can help identify and account for projected changes in costs over the timeframe between rate cases However given that these costs are utility projections most consumer advocates have less confidence in these numbers than they would using actual numbers from a historical or only hybrid test year58 When trying to garner support for revenue regulation from more skeptical stakeholders using a future test year may not be helpful Furthermore in the case of WPS that has annual rate cases using a future test year becomes less justifiable as revenues are recalculated annually anyway
The absence of a rate case requirement can also cause consternation among detractors of revenue regulation because of the belief that the utility will be guaranteed its revenue requirements for as long as it is satisfied with that level irrespective of how well it manages However this is no different from the status quo in traditional regulation in most places The incentive to manage well is always there with or without revenue regulation as it translates into more profit for the utility
In the cases of HECO and National Grid the mini rate cases serve two purposes In the one instance it serves as a means to reconcile revenue recovery with revenue requirements and in the second instance it provides an opportunity to adjust rates in accordance with changes in costs Specifically for National Grid the revenue requirement is adjusted to reflect capital expenditures For HECO revenues are adjusted to reflect changes in the cost of service In the two examples here revenue regulation is wrapped in with other adjustments as part of a mini adjustment Given the structure for determining revenue requirements which accounts for changes in costs including revenue regulation within the mini rate cases is a workable option
These examples highlight how rate cases can be used to adjust revenue requirements either in a more controlled regulatory environment with frequent rate cases or left to the utilityrsquos discretion to decide when to adjust costs A set schedule of periodic rate cases such as that used by PGampE may strike an appropriate balance for reviewing revenue requirements however with the modification of a partial historical partial forecasted test year Frequent rate cases can depending on the resources of the regulator and stakeholders be too costly and time-intensive When there are too many rate cases stakeholders and regulators may not be able to dedicate the level of resources needed for any one proceeding and may be spread too thin Regular known rate cases at reasonable intervals may strike the best balance of adequate review and adjustment of revenue requirements
Decoupling Case Studies Revenue Regulation Implementation in Six States
32
Collection Mechanism and TimingThe collection mechanism for the differential between
actual and authorized revenue requirements varies by util-ity as well Both PGampE and WPS do not have adjustment clauses or surcharges but instead have structured their revenue regulation plans to recover their costs in a rate case with rates adjusted annually Although PGampE has rate cases every three years the utility files its preliminary forecast every September 1 for the following year including adjust-ments for revenue regulation and other costs This practice promotes transparency keeping all stakeholders aware of the current situation of the utility IPC BGE National Grid and HECO use surcharges on customer bills to collect or credit the difference between actual revenues collected and the revenue requirement Although the other three (IPC National Grid and HECO) calculate the rate adjustment annually only BGE does a more contemporaneous adjust-ment of one month Certainly where there are no regularly scheduled rate cases using an adjustment mechanism becomes more critical PGampE has created a tracking mecha-nism known as a balancing account that allows the utility to track the surpluses and deficits to help ensure accuracy at year end when rates are actually adjusted The creation of such monthly balancing accounts will make it easier at the end of the year to track what happened each month and then determine the adjustment for that year It provides a more detailed trail for review and analysis by stakeholders and regulators However other mechanisms that just look at total revenues as compared to revenue requirements at the end of the year can work as well
Table 7
Rate Case Requirements
Table 8
Rate Adjustments
Table 9
Allocation of Surplus or Deficit
Pacific Gas amp Electric
Idaho Power Company
Baltimore Gas amp Electric
Wisconsin Public Service Corporation
National Grid
Hawaiian Electric Company
Pacific Gas amp Electric
Idaho Power Company
Baltimore Gas amp Electric
Wisconsin Public Service Corporation
National Grid
Hawaiian Electric Company
Pacific Gas amp Electric
Idaho Power Company
Baltimore Gas amp Electric
Wisconsin Public Service Corporation
National Grid
Hawaiian Electric Company
Every three years annual ldquoattritionrdquo adjustments in between
No requirement
No requirement
Annual rate case
Annual capital expenditure adjustment case
Abbreviated annual rate case
Base rates adjusted annually
Annual adjustment through surcharge
Monthly adjustment through surcharge
Annual adjustment through rate case
Annual adjustment
Annual adjustment
Allocated to all customers according to business unit (eg electric distribution electric generation)
Included in the annual adjustment mechanism for each customer class
Separate for each customer class
Allocated to all customers except certain tariffs (see above)
Separate for each customer class
Separate for residential and commercialindustrial
Allocation of Revenue Regulation Revenue Surpluses or Deficits
The allocation of revenue regulation revenue surpluses or deficits should be symmetrical so that overpayments are credited to customers just as underpayments are paid by those same customers The six utilities studied fol-low that formula The application of revenue regulation however varies from utility to utility BGE and IPC ap-ply revenue regulation to the residential and commercial classes thereby excluding industrial customers In contrast however PGampE WPS National Grid and HECO allocate revenue regulation adjustments to all customer classes In terms of how the costs are allocated IPC BGE WPS National Grid and HECO allocate costs differently among the customer classes PGampE however allocates costs uni-formly among the customers Because PGampE has separated its business units it also separately calculates and allocates
Decoupling Case Studies Revenue Regulation Implementation in Six States
33
Table 10
Carrying Charges
Table 11
Cap on Rate Adjustment
Pacific Gas amp Electric
Idaho Power Company
Baltimore Gas amp Electric
Wisconsin Public Service Corporation
National Grid
Hawaiian Electric CompanyPacific Gas amp Electric
Idaho Power Company
Baltimore Gas amp Electric
Wisconsin Public Service Corporation
National Grid
Hawaiian Electric Company
None
Yes
None
Yes at the short-term debt rate
Yes at the customer deposit rate
Yes at the customer deposit rateNo
3 rate cap excess carried over to next period
10 rate cap excess carried over to next period
Cap of $14 million per year
$170 million in CapEx
No
revenue regulation surpluses and deficits among its electric distribution gas distribution and electric generation busi-nesses This illustrates that there are several ways to address revenues from revenue regulation depending on the policy outcomes that are desired
Carrying ChargesCarrying charges applied to uncollected or surplus rev-
enues can be used to account for the time value of money and the lost opportunity or value to having those revenues in hand PGampE and BGE do not accrue carrying charges On the other hand IPC WPS National Grid and HECO do For BGE given that the revenue regulation revenues are reconciled and recovered monthly it would make little sense to include a carrying cost Where carrying costs have been used they have included in the cases of these utili-ties the short-term debt rate or the customer deposit rate which for one utility is six percent and probably close to the short-term debt rate Thus the carrying charge rates are appropriately at the lower end of the spectrum reflecting their short-term nature In the application of the carrying charge symmetry should be preserved by applying it to both deficits and surpluses Application of carrying charges given the short period that costs are carried (one year) is somewhat discretionary Although it does more accurately account for costs it does add a modest level of complica-tion in tracking costs
Rate Caps and CollarsOne of the ways to protect customers in the event of sig-
nificant adjustments is to impose a rate cap (or collar) that limits the amount of a rate increase (and decrease) Some customers are sensitive to changes in foundational costs like utility bills and if costs are going to rise they benefit from a pattern of steady modest increases rather than a large step increase Any structural increases in rates attributable
to reductions in sales or increases in costs recognized by the revenue regulation plan would be eventually included in rates under any system A cap reflects a controlled way to manage customer expectations and customer impacts Structural changes can only be managed for a while until a complete rate case is needed to reset all assumptions
Typically when a rate cap is imposed if the formulaic increase exceeds the cap or collar the utility will be able to carry over any uncollected revenues until the next rate adjustment Two of the utilities studied PGampE and HECO do not have rate caps On the other hand the other four utilities do include rate caps in varying amounts National Grid has a one-percent revenue cap whereas IPC and BGE have a one-percent and a ten-percent rate cap respectively WPS unlike the others has a cap tied to the dollar amount of $14 million as opposed to a percentage Consistent with the goals of revenue regulation all of the utilities studied have a carryover provision that is important for reducing the risk that the utility will not recover its revenue require-ments
Note that National Grid differs from BGE and HECO in that its cap is on revenues whereas the other two utilities cap rates and rate impacts A revenue cap is more focused on ensuring minimal change to the revenue requirements authorized by the commission National Grid as discussed previously allows for mini rate cases to adjust the rev-enue requirements Having the one-percent cap limits the amount of increase that can occur through that process requiring revenue changes that are greater to occur in a full rate case However note also that some of the adjustments allowed in the mini rate case have their own separate cap The IPC rate cap is in line with what many other utilities with caps have in place which generally range from one to three percent The ten-percent rate cap in the BGE plan is
Decoupling Case Studies Revenue Regulation Implementation in Six States
34
59 Morgan P (2012 December) Graceful Systems LLC A decade of decoupling for US energy utilities rate impacts designs and observa-tions p5
reflective of its monthly adjustment pattern An annual ad-justment allows more time to smooth out peaks and valleys in revenues whereas a monthly adjustment will be influ-enced by more of the spikes (particularly weather-driven variation) thus the need for a larger bandwidth for the car-ryover Like a variable energy rate or fuel adjustment clause that fluctuates monthly the monthly adjustment introduces more volatility into the rates
Actual Historical AdjustmentsFor many ratepayer advocates there is a concern that
some of the utility management risk will be transferred to customers as a consequence of a policy that seeks to ensure that the utility will be made whole However the utility re-tains management risk and the requirement to demonstrate that it has acted prudently Thus the utility still has just as much of an incentive to operate efficiently as it did without revenue regulation If the utility can lower its costs it can still increase its profits Second by designing rates symmet-rically such that under- and over-recoveries are reconciled it provides customers with an opportunity to obtain credits that under traditional regulation would be retained by the utility It has often been opined that when there are large
gaps in time between utility rate cases it is because the utility is over-earning and exceeding its revenue require-ments In those instances customers never get to examine what the utility is collecting much less receive a refund Under revenue regulation with its periodic adjustments and scheduled general rate cases the revenue requirements are examined and refunds or credits allocated such that customers have a better knowledge base for understanding the utilityrsquos earnings And annual reconciliation of the util-ityrsquos actual revenues versus authorized revenues provides consumers with a tool to reign in excess revenue recovery beyond authorized amounts Third the adjustments that do occur under revenue regulation are manageable and frequently less than the adjustments customers are used to seeing on their bills for fuel or variable generation rates or for the myriad of other surcharges that can be tacked on to a customerrsquos bill such as an infrastructure (smart grid) sur-charge maintenance upgrade fee regulatory asset charge or system benefit charge
As seen in Figure 1 the range of rate impacts cluster around plus or minus two percent but can at times exceed plus or minus five percent The total of surcharges has somewhat exceeded the total of credits
Figure 1
Total Utility Decoupling Adjustment Rate Impacts59
300
250
200
150
100
50
0
Nu
mber
of
Dec
oup
lin
g A
dju
stm
ents
Over -5 -4 to -5 -3 to -4 -2 to -3 -1 to -2 0 to -1 0 to 1 1 to 2 2 to 3 3 to 4 4 to 5 Over 5
Percentage Rate Impacts
SurchargesRefunds
ResidentialAll
Other
Commercial
Total
Decoupling Case Studies Revenue Regulation Implementation in Six States
35
60 Id p 3
61 Schultz T Energy Efficiency at Idaho Power Available at httpwwwenergyidahogovenergyalliancedida_powerpdf
As can be seen with the utilities studied above the larger fluctuations are attributable to adjustment mechanisms that are reconciled more frequently such as monthly as those are less able to smooth out anomalies as an annual adjust-ment would do From a dollar perspective for the roughly 64 percent of adjustments that fall within the plus or minus two-percent range the monthly bill impact is approxi-mately $230 for average electric customers and $140 for average gas customers60
Of the six utilities studied the fluctuations in adjustment have for the most part stayed within the one- to three-per-cent range as shown below
bull PGampE from 2005 to 2012 has had annual revenue regulation adjustments ranging from minus143 percent to 415 percent with an average adjustment of 197 percent
bull For IPC the adjustments are separated between residential and commercial customers For residential customers the annual adjustments from 2007 through 2011 ranged from 077 percent to 258 percent for an average of 162 percent As for the commercial customers the annual adjustments for that same period were higher ranging from 104 percent to 424 percent with an average adjustment of 252 percent
bull BGE has monthly adjustments that ranged from minus1853 percent to 3013 percent with an average of 057 percent for residential customers from March 2008 through August 2012 For General Service Customers the monthly adjustment ranged from minus2264 percent to 2462 percent The average adjustment was 1308 percent
bull For WPS the annual adjustments from 2009 through 2011 ranged from minus145 percent to 378 percent for residential and small commercial and from minus314 percent to 899 percent for commercial Note that because of a $14 million per year cap some of these percentages were carried over The average annual adjustment for residential and small commercial and for commercial was 163 percent and 215 percent respectively with carry-overs to subsequent years
bull For Massachusetts Electric and Nantucket Electric both of which operate under National Grid the annual revenue regulation adjustment for all for 2011 and 2012 was minus0105 percent and 0315 percent for an average revenue regulation adjustment over the two years of 0105 percent
bull HECO like National Grid has one annual revenue
regulation mechanism for its customers which resulted in adjustments in 2011 and 2012 of 063 percent and 107 percent respectively for an average adjustment of 085 percent
As can be gleaned from the above information the range of average adjustments for small use customers was a low of 0105 percent for National Grid to a high of 197 percent for PGampE For larger use customers the range was a low of 0105 percent for National Grid to a high of 252 percent for IPC This demonstrates that on average for these utilities with well-developed and diversely designed revenue regula-tion proposals their adjustments on average stayed at or below approximately 25 percent
One of the metrics for determining if a revenue regula-tion program is working successfully that was discussed above was the impact on rates of a revenue regulation mechanism As can be seen by the analysis of the adjust-ment levels for each of the utilities they are within a rea-sonable range
Complementary Policies Although a revenue regulation mechanism does not need
to be accompanied by other policies energy efficiency is frequently at the root of the reason revenue regulation was proposed in the first place The states examined in this pa-per have various obligations for energy efficiency achieve-ment placed upon their utilities Only Idaho does not have an Energy Efficiency Resource Standard but energy efficiency objectives are developed through an integrated resource plan process Energy efficiency spending at IPC has increased dramatically in recent years61
In recognition of the fact that revenue regulation only removes the disincentive to pursue energy efficiency several states have instituted some form of incentives to reward the desired outcome This mechanism can not only incentivize management to aggressively pursue energy efficiency but also make shareholders supportive in the face of lost invest-ment opportunity
Rate design can also play an important part in assist-ing the utility in achieving favorable energy efficiency outcomes Inclining block rates penalize inefficient use of electricity and shorten payback times from the customer perspective Because efficiency reduces consumption at
Decoupling Case Studies Revenue Regulation Implementation in Six States
36
62 Optional rate designs for PGampE include TOU and Peak Time Pricing
63 IPC also has an optional TOU rate design
64 Optional rate designs for this utility include TOU Critical Peak Pricing and Contract
65 National Grid also offers optional TOU and flat rate designs
66 HECO also offers optional TOU and flat rate designs
67 See eg Alexander B (1996 April) How to construct a service quality index in performance-based ratemaking Electricity Policy
the tail block rate the value of kWh savings is greater than with flat rates On the other side of the spectrum declining block rates which have a reduced rate in the tail block do little to encourage conservation In fact they operate more like a discounted bulk rate by reducing the average cost of a kWh in a customerrsquos bill for the more kWh used
Performance incentives or other ways to avoid destruc-tive cost-cutting in the name of creating margins that reduce service or reliability or lessen customer value have been implemented only in Massachusetts of the six utilities illustrated here Several other states have implemented vari-ous schemes in reaction to perceived deficiencies in utility service67 Performance incentives are not unique to rev-enue regulation Commissions wishing to implement such a scheme can find many models of incentive reward and penalty mechanisms developed for other purposes
Taken together a suite of policy and program features can create an atmosphere that is conducive to achievement of energy efficiency goals within the utility and for the customers By appropriate application of these techniques regulators working with utilities and stakeholders can remove barriers and create an opportunity for energy ef-ficiency to be fully integrated into the utility supply option portfolio
Energy Efficiency OutcomesAlthough revenue regulation itself does not create an
incentive for a utility to implement energy efficiency it does address the issue of lost revenues associated with energy
Table 12
Complementary Policies for Energy Efficiency
Pacific Gas amp Electric62
Idaho Power Company63
Baltimore Gas amp Electric
Wisconsin Public Service Corporation64
National Grid65
Hawaiian Electric Company66
Energy Efficiency Requirement
1 annually
IRP
10 by 2015
075 annually
24 annually
Energy efficiency can satisfy portion of RPS
Default Residential Rate Design
Inclining block
Inclining block
TOU seasonal
Flat
Inclining block
Inclining block
Incentive Structure
Risk reward incentive mechanism
No
No
No
5 of program costs
Third-party administrator paid for contract performance
Performance Incentives
Reliability reporting only
None
Under consideration
Reliability reporting only
Service quality reward and penalty
Under consideration
efficiency and DG programs Revenue regulation should be combined with other mechanisms that require or incentiv-ize the implementation of energy efficiency by the utility or a third party The level of energy efficiency achieved can be one measure of the success of a revenue regulation mechanism as implemented in a larger program designed to achieve energy efficiency Table 13 shows the incremental annual energy efficiency savings reported by each utility with the shaded box indicating the year that the utilityrsquos revenue regulation mechanism was implemented National Grid had achieved a high level of energy efficiency savings in the years before it implemented revenue regulation
This paper has not evaluated DG outcomes to correlate with revenue regulation as it is not perceived that states and utilities have made that connection expressly in histori-cal mechanisms However it is expected that this connec-
Decoupling Case Studies Revenue Regulation Implementation in Six States
37
68 EIA Form EIA-861 data files Available at httpwwweiagovelectricitydataeia861
69 PGampE began revenue regulation in 1974 and it was later suspended and recommenced in 2001
70 WPS savings are represented by the statewide program savings from the Focus on Energy program WPS provided additional funds to Focus on Energy starting in CY10 through their territory-wide program activities
71 In 2009 Hawaii Energy a ratepayer-funded statewide energy efficiency provider began delivering services Savings reported after 2009 represent savings achieved through the programs of Hawaii Energy
Table 13
Annual Incremental Energy Efficiency Savings as Percentage of Retail Sales68
Highlighted cells are the year that utility started decoupling
Pacific Gas amp Electric69
Idaho Power Company
Baltimore Gas amp Electric
Wisconsin Public Service Corporation70
National Grid
Hawaiian Electric Company71
2004
11
01
00
03
11
00
2005
16
03
00
03
09
05
2006
10
05
00
03
12
05
2010
19
13
17
09
136
12
tion will be made in future mechanisms and furthermore it is anticipated that follow on work to this paper will want to study that connection between revenue regulation and DG performance
Conclusions
An increasing number of states are looking to increase the rate of energy efficiency investments for their long-run cost and risk advantages The benefits of energy efficiency include not only its ability to reduce system costs across the distribution transmission and generation functions but also the opportunity for customers to reduce their individ-ual energy costs for their own electric bills Nevertheless it is counterintuitive to encourage or order a utility to sell less of its product In order to encourage the proliferation of en-ergy efficiency programs as a solution that can contribute to this nationrsquos energy needs this tension between the goals of society versus the goals of the utility needs to be addressed Revenue regulation can be such a solution by removing the link between sales and revenues
There are many ways to implement revenue regulation and multiple decision points that regulators must consider in designing a revenue regulation mechanism This paper focused on six utilities each of which implemented revenue regulation in different ways in accordance with the objectives of that state Different decision points discussed include
bull Should revenue regulation apply to all functions (generation transmission and distribution) which sometimes depends on if the utility is regulated or restructured
bull Should revenue regulation apply to all customer classes
bull Should there be symmetry such that a reconciliation adjustment occurs for both over- and under-recoveries of the revenue requirements
bull Should recovery of indicated surcharges be conditioned on acceptable performance on customer service quality or energy efficiency goals
bull Should there be an attrition adjustment to account for other expenses or should the revenue regulation adjustment be limited to reconciling existing revenue requirements
bull Should there be an inflation adjustmentbull To calculate the revenue requirements should the
current or accrual method be usedbull Should the adjustments be made in rate cases or
through a riderbull How frequently should adjustments be made
monthly annually or some other time periodbull Depending on the period of time between true up and
recovery should there be carrying charges and if so how should they be calculated
2007
21
06
00
03
09
04
2008
35
10
05
09
05
05
2009
20
11
06
10
11
11
Decoupling Case Studies Revenue Regulation Implementation in Six States
38
72 Avista Utilities (2009) Washington Utilities and Transportation Commission Docket UE-090134
bull Should there be a requirement authorizing the frequency of rate case
bull Should there be an annual cap on the amount of the adjustment and if so should there be an opportunity to carry over any additional amounts and for how many years
bull Should there be an adjustment to the cost of capital to reflect the reduced risk
Other considerations for regulators whether or not they implement revenue regulation but certainly as part of a comprehensive package are other measures that can be put in place to encourage consumers and utilities alike to actively participate in energy efficiency For example an inclining block rate structure by virtue of its incentive to consume less pairs well with an energy efficiency program helps drive consumers to participate in efficiency programs and accelerates the payback of an energy efficiency investment By the same token an incentive payment to the utility helps provide its management with a good reason to excel and exceed targets for energy efficiency programs
A key point illustrated by the list of considerations above is that there is not just one static way to design and implement revenue regulation but rather there are a variety of options for doing so In this study a diverse group of utilities were reviewed The differences among the utilities included geographic diversity vertically integrated and restructured utilities different levels of energy efficiency in place and certainly differences in how the revenue regulation mechanisms were implemented No two utilities were alike and no two utilities had the same revenue regulation mechanism The key is that revenue regulation should eliminate the throughput incentive but the means for accomplishing this goal can vary and be tailored to each jurisdiction and each utility and still be successful
There are several considerations in the design of a revenue regulation mechanism that can help ensure its successful adoption To begin revenue regulation should be granted to utilities only as a precondition to implementing comprehensive energy efficiency andor DG policies Unless accompanied by a commitment to engage in providing least-cost resource options that could impact sales there is not really any good policy reason for its adoption All of the utilities studied are actively engaging in energy efficiency Furthermore as a matter of fairness the revenue regulation mechanism should be symmetrical so that any revenues above those authorized are refunded back to consumers As Figure 1 demonstrates although there are more surcharges to customers there is nevertheless a healthy amount of
credits back to consumers This is the bargain Barring imprudence or other unforeseen circumstances the utility receives its authorized revenue requirements and nothing more or less under a simple revenue regulation mechanism
Rate design plays an important role in the effectiveness of energy efficiency in concert with revenue regulation A low customer charge is preferable so that the customer can benefit from real bill reductions tied to reduced volumetric consumption Reductions in consumption not only reduce bills but also positively impact the payback period for investments in energy efficient appliances Declining block rates in which the tail block rate is lower than the first tier also do not encourage conservation Inclining block rates that reward low usage in the first block with a lower rate send the better price signals None of the six utilities studied had declining block residential rates They were inclining flat and time-varying
The revenue adjustment mechanism is also a critical decision point in terms of whether a revenue per customer mechanism is adopted that accounts for only the current revenue requirements or whether latitude is given to include an inflation adjustment or other cost increases in the revenue adjustment mechanism Three of the utilities studied adopted this approach whereas another two used a hybrid approach Finally to reduce volatility five of the six utilities opted for annual rather than monthly adjustments thereby creating a level of rate stability that customers in general prefer
Once the goals for revenue regulation are set by the regulators the next step is to design programs that will implement that goal For energy efficiency to be as successful as possible regulators may want to adopt a complement of other policies to accompany revenue regulation These can include rate designs that reward reduced use and conservation as well as incentive payments to utilities that reward them for meeting or exceeding targets Of the six utilities studied three have adopted some form of incentive One simple approach that was used in Washington was to link recovery of any surcharges under the revenue regulation mechanism to achievement of energy efficiency targets72
For the utilities examined above that have implemented revenue regulation the evidence demonstrates that revenue regulation as a strategy and a mechanism to enable
Decoupling Case Studies Revenue Regulation Implementation in Six States
39
energy efficiency has been working well The fact that each revenue regulation mechanism varies from the next demonstrates that there are many different paths that can be followed in implementing revenue regulation based on the needs of the utility and its stakeholders in a particular
region This study demonstrates that revenue regulation does work and provides examples of how it can be implemented each one different and unique because of the number of decision points to be considered in designing a revenue regulation mechanism
Decoupling Case Studies Revenue Regulation Implementation in Six States
40
Appendix
Historic Rate Adjustments
Table 14
PGampE Revenue Regulation Rate Adjustments 1983 to 199373
Table 15
PGampE Revenue Regulation Adjustments 2005 to 201274
Table 16
IPC Revenue Regulation Adjustments76
Idaho Power Company
1983 23
1984 (34)
1985 (48)
1986 19
1987 21
1988 50
1989 (43)
1990 (54)
1991 39
1992 34
1993 00
2005 8925 minus12773 minus143
2006 9933 2246 226
2007 10409 21727 209
2008 10261 4032 039
2009 11169 10355 093
2010 11224 46556 415
2011 10306 38390 373
2012 11032 40304 365
2007 Residential minus00457 590 minus077
Commercial minus00457 428 minus107
2008 Residential 00529 670 090
Commercial 00529 510 104
2009 Residential 01220 770 158
Commercial 01535 603 255
2010 Residential 01800 785 229
Commercial 02273 613 371
2011 Residential 02028 785 258
Commercial 02597 613 424
Revenue Regulation Adjustment as of
Total Rates
Delivery Revenue
Requirement ($ millions)
Adjustment Rate
Revenue Regulation Adjustment($ millions)
Retail Rate
of Delivery Revenue
Revenue Regulation Adjustment
Year
Year
73 Lesh P (2009 June 30) Rate impacts and key design elements of gas and electric utility decoupling
74 Morgan P (2012 November) A decade of decoupling for US energy utilities rate impacts designs and observations
75 Morgan P (2012 November) A decade of decoupling for US energy utilities rate impacts designs and observations
76 All numbers provided by the utility
Decoupling Case Studies Revenue Regulation Implementation in Six States
41
77 Idaho Power Company Case No IPC-E-11-19- fixed cost adjustment permanent mechanism Available at httpwwwpucidahogovinternetcaseselecIPCIPCE1119company20120928COMPLIANCE20FILINGPDF
Figure 2
IPC Revenue Regulation Adjustments77
Residential FCA Balance and Use per Customer
$10000000
$8000000
$6000000
$4000000
$2000000
$0
-$2000000
-$4000000
-$6000000
1080
1070
1060
1050
1040
1030
1020
1010
1000Res
idu
al A
uth
oriz
ed F
CA
Am
oun
t
Residual Authorized FCA Amount ($)
Monthly Use Per Customer (kWh)
kW
h U
sed
2006 2007 2008 2009 2010 2011
78 Morgan P (2012 November) A decade of decoupling for US energy utilities rate impacts designs and observations
Decoupling Case Studies Revenue Regulation Implementation in Six States
42
Table 17a
Baltimore Gas and ElectricBGE Monthly Revenue Regulation Adjustments 2008 to 201278
Table 17b
Baltimore Gas and ElectricBGE Monthly Revenue Regulation Adjustments 2008 to 201278
March Residential 000172 01477 1165General Service 000230 01526 1507
April Residential 000016 01477 0108General Service 000146 01526 0957
May Residential 000066 01477 0447General Service 000230 01526 1507
June Residential minus000066 01477 minus0447General Service 000230 01526 1507
July Residential 000158 01477 1070General Service 000230 01526 1507
August Residential minus000040 01477 minus0271General Service 000214 01526 1402
September Residential 000237 01477 1605General Service 000230 01526 1507
October Residential 000237 01477 1605General Service 000143 01526 0937
November Residential 000237 01477 1605General Service 000140 01526 0917
December Residential 000445 01477 3013General Service 000230 01526 1507
January Residential 000035 01579 0222General Service minus000073 01346 minus0542
February Residential 000025 01579 0158General Service 000230 01346 1709
March Residential minus000237 01579 minus1501General Service 000230 01346 1709
April Residential minus000237 01579 minus1501General Service 000230 01346 1709
May Residential 000234 01579 1482General Service 000132 01346 0981
June Residential 000237 01579 1501General Service 000230 01346 1709
July Residential 000237 01579 1501General Service 000230 01346 1709
August Residential 000237 01579 1501General Service 000190 01346 1412
September Residential 000237 01579 1501General Service 000230 01346 1709
October Residential 000237 01579 1501General Service 000124 01346 0921
November Residential 000237 01579 1501General Service 000230 01346 1709
December Residential 000156 01579 0988General Service 000204 01346 1516
Adjustment $kWh
Adjustment $kWh2008 2009
Retail Rate
$kWh
Retail Rate
$kWhAdjustment
Adjustment
Decoupling Case Studies Revenue Regulation Implementation in Six States
43
Table 17c
Baltimore Gas and ElectricBGE Monthly Revenue Regulation Adjustments 2008 to 201278
Table 17d
Baltimore Gas and ElectricBGE Monthly Revenue Regulation Adjustments 2008 to 201278
January Residential 000203 01465 1386General Service 000230 01261 1824
February Residential minus000142 01465 minus0969General Service 000230 01261 1824
March Residential minus000237 01465 minus1618General Service 000230 01261 1824
April Residential minus000237 01465 minus1618General Service 000230 01261 1824
May Residential 000192 01465 1311General Service 000230 01261 1824
June Residential 000191 01465 1304General Service 000230 01261 1824
July Residential 000095 01465 0648General Service 000230 01261 1824
August Residential minus000176 01465 minus1201General Service 000224 01261 1776
September Residential minus000237 01465 minus1618General Service 000116 01261 0920
October Residential minus000237 01465 minus1618General Service 000081 01261 0642
November Residential minus000237 01465 minus1618General Service 000098 01261 0777
December Residential minus000079 01465 minus0539General Service 000229 01261 1816
January Residential minus000130 01365 minus0952General Service 000230 01156 1990
February Residential minus000253 01365 minus1853General Service minus000020 01156 minus0173
March Residential minus000018 01365 minus0132General Service minus000063 01156 minus0545
April Residential 000110 01365 0806General Service minus000262 01156 minus2266
May Residential 000010 01365 0073General Service minus000160 01156 minus1384
June Residential 000226 01365 1656General Service 000042 01156 0363
July Residential 000253 01365 1853General Service 000209 01156 1808
August Residential minus000007 01365 minus0051General Service minus000157 01156 minus1358
September Residential minus000253 01365 minus1853General Service minus000177 01156 minus1531
October Residential 000228 01365 1670General Service 000262 01156 2266
November Residential minus000059 01365 minus0432General Service 000262 01156 2266
December Residential 000071 01365 0520General Service 000262 01156 2266
Adjustment $kWh
Adjustment $kWh2010 2011
Retail Rate
$kWh
Retail Rate
$kWhAdjustment
Adjustment
Decoupling Case Studies Revenue Regulation Implementation in Six States
44
Table 17e
Baltimore Gas and ElectricBGE Monthly Revenue Regulation Adjustments 2008 to 201278
January Residential 000253 01291 1960General Service 000262 01064 2462
February Residential 000253 01291 1960General Service 000262 01064 2462
March Residential 000253 01291 1960General Service 000262 01064 2462
April Residential 000253 01291 1960General Service 000262 01064 2462
May Residential 000253 01291 1960General Service 000262 01064 2462
June Residential 000253 01291 1960General Service 000262 01064 2462
July Residential 000253 01291 1960General Service 000262 01064 2462
August Residential 000253 01291 1960General Service 000160 01064 1504
Adjustment $kWh2012
Retail Rate
$kWhAdjustment
Decoupling Case Studies Revenue Regulation Implementation in Six States
45
79 Morgan P (2012 November) A decade of decoupling for US energy utilities rate impacts designs and observations
80 Morgan P (2012 November) A decade of decoupling for US energy utilities rate impacts designs and observations
Table 18
Wisconsin Public Service Corporation Revenue Regulation Adjustments 2009 to 201179
2009 ResidentialSmall Commercial 00048705 000168154 01290 378 130Commercial 00084951 000293293 00945 899 310
2010 ResidentialSmall Commercial 00033043 000166936 01291 256 129Commercial 00056630 000286103 09460 060 030
2011 ResidentialSmall Commercial (00018666) $ (000163719) 01288 minus145 minus127Commercial (00032565) $ (000285629) 01037 minus314 minus275
Derived Adjustment
$kWh
Derived Adjustment Capped $
kWh
Retail Rate
$kWh
Revenue Regulation Actual
Revenue Regulation Capped
Table 19
National Grid Revenue Regulation Adjustments 2011-201276
Massachusetts Electric and Nantucket Electric
Table 20
Hawaiian Electric Company
2011 All minus0015 1429 minus0105
2012 All 0044 1396 0315
2011 01995 3149 063
2012 03894 3641 107
Revenue Regulation Adjustment
centkWh
Revenue Regulation Adjustment
centkWhRetail Rate
centkWh
Retail Rate
Revenue Regulation Adjustment
Revenue Regulation
ldquoThe 2011 adjustment took effect June 1 but was reduced to $0 on July 26 2011 when the Commission granted HECO an interim rate increase of $532 million in a 2011 test year general rate case The 2012 Adjustment runs from June 1 2012 through May 31 2013 About 25 of the total relates to the portion of the decoupling mechanism that updates OampM and rate baserdquo (Morgan 2013)
Decoupling Case Studies Revenue Regulation Implementation in Six States
46
Revenue Regulation and Decoupling A Guide to Theory and Applicationhttpwwwraponlineorgdocumentdownloadid902
This guide was prepared to assist anyone who needs to understand both the mechanics of a regulatory tool known as decoupling and the policy issues associated with its use This would include public utility commissioners and staff utility management advocates and others with a stake in the regulated energy system While this guide is somewhat technical at points we have tried to make it accessible to a broad audience to make comprehensible the underlying concepts and the implications of different design choices This guide includes a detailed case study that demonstrates the impacts of decoupling using different pricing structures (rate designs) and usage patterns
Pricing Dorsquos and Donrsquots Designing Retail Rates as if Efficiency Countshttpwwwraponlineorgdocumentdownloadid939
Rate design is a crucial element of an overall regulatory strategy that fosters energy efficiency and sends appropriate signals about efficient system investment and operations Rate design is also fully under the control of state regulators Progressive rate design elements can guide consumers to participate in energy efficiency programs and reduce peak demand yet relatively few utilities and commissions have implemented many of these elements This RAP paper identifies some best practices Because pricing issues tie closely to utility growth incentives we also address revenue decoupling
A Decade of Decoupling for US Energy Utilities Rate Impacts Designs and Observationshttpwwwraponlineorgdocumentdownloadid6356
This report written by Pamela Morgan of Graceful Systems LLC builds on a 2009 report Now covering 25 states including 49 LDCs and 24 electric utilities this report summarizes the decoupling mechanism designs these utilities use and the rate adjustments they have made under those mechanisms In total this report estimates the retail rate impacts of 1244 decoupling mechanism adjustments since 2005
Additional Resources
The Role of Decoupling Where Energy Efficiency is Required by Lawhttpwwwraponlineorgdocumentdownloadid275
This Issuesletter gives an overview of energy efficiency resource standards the need to decouple utility profits from utility sales and explains why decoupling is needed even where a third party administers energy efficiency programs
Revenue Decoupling Standards and Criteria A Report to the Minnesota Public Utilities Commissionhttpwwwraponlineorgdocumentdownloadid850
In 2007 the Minnesota legislature enacted a new statute Section 216B2412 in which it defined an alternative approach to utility regulation decoupling and directed the Public Utilities Commission (PUC) to ldquoestablish criteria and standardsrdquo by which decoupling could be adopted for the statersquos rate-regulated utilitiesTo fulfill its obligation to develop criteria and standards for decoupling the PUC sought the advice of the Regulatory Assistance Project (RAP) This report is the output of that collaboration
Designing Distributed Generation Tariffs Wellhttpwwwraponlineorgdocumentdownloadid6898
Improvements in distributed generation economics increasing consumer preference for clean distributed energy resources and a favorable policy environment in many states have combined to produce significant increases in distributed generation adoption in the United States Regulators are looking for the well-designed tariff that compensates distributed generation adopters fairly for the value they provide to the electric system compensates the utility fairly for the grid services it provides and charges non-participating consumers fairly for the value of the services they receive This paper offers regulatory options for dealing with distributed generation The authors outline current tariffs and ponder what regulators should consider as they weigh the benefits costs and net value to distributed generation adopters non-adopters the utility and society as a whole The paper highlights the importance of deciding upon a valuation methodology so that the presence or absence of cross-subsidies can be determined Finally the paper offers rate design and ratemaking options for regulators to consider and includes recommendations for fairly implementing tariffs and ratemaking treatments to promote the public interest and ensure fair compensation
Decoupling Case Studies Revenue Regulation Implementation in Six States
47
The Regulatory Assistance Project (RAP)trade is a global non-profit team of experts focused on thelong-term economic and environmental sustainability of the power sector We provide technical and policy assistance on regulatory and market policies that promote economic efficiency environmental protection system reliability and the fair allocation of system benefits among consumers We work extensively in the US China the European Union and India Visit our website at wwwraponlineorg to learn more about our work
Rate Design Where Advanced Metering Infrastructure Has Not Been Fully Deployedhttpwwwraponlineorgdocumentdownloadid6516
This paper identifies sound practices in rate design applied around the globe using conventional metering technology Rate design for most residential and small commercial customers (mass market consumers) is most often reflected in a simple monthly access charge and a per-kWh usage rate in one or more blocks and one or more seasons A central theme across the practices highlighted in this paper is that of sending effective pricing signals through the usage-sensitive components of rates in a way that reflects the character of underlying long-run costs associated with production and usage While new technology is enabling innovations in rate design that carry some promise of better capturing opportunities for more responsive load the majority of the worldrsquos electricity usage is expected to remain under conventional pricing at least through the end of the decade and much longer in some areas Experience to date has shown that the traditional approaches to rate design persist well after the enabling technology is in place that leads to change
Time-Varying and Dynamic Rate Designhttpwwwraponlineorgdocumentdownloadid5131
This report discusses important issues in the design and deployment of time-varying rates The term time-varying rates is used in this report as encompassing traditional time-of-use rates (such as time-of-day rates and seasonal rates) as well as newer dynamic pricing rates (such as critical peak pricing and real time pricing) The discussion is primarily focused on residential customers and small commercial customers who are collectively referred to as the mass market The report also summarizes international experience with time-varying rate offerings
50 State Street Suite 3Montpelier Vermont 05602802-223-8199wwwraponlineorg
- Table of Contents
- Introduction
- California Pacific Gas and Electric Company
- Idaho Idaho Power Company
- Maryland Baltimore Gas and Electric
- Wisconsin Wisconsin Public Service Corporation
- Massachusetts National Grid
- Hawaii Hawaiian Electric Company
- Discussion of the Six Utilities Overall
- Conclusions
- Appendix
- Additional Resources
-

Decoupling Case Studies Revenue Regulation Implementation in Six States
13
retail load in 2006 Since the revenue regulation mechanism was implemented reported savings have increased from 06 percent in 2007 to 13 percent in 2010 (with low or no reported savings in 2009 and 2011)18 The DSM Report for 2012 shows this to be 12 percent
ResourcesIdaho Public Utilities CommissionIPC-E-04-15 - Idaho Power mdash Investigation of Financial
DisincentivesIPC-E-09-28 - Idaho Power mdash Application to Make the
Fixed Cost Adjustment PermanentIPC-E-11-19 - Idaho Power mdash Request to Convert
Schedule 54 (Fca) From Pilot to Permanent
18 EIA Form EIA-861 data files Available at httpwwweiagovelectricitydataeia861
Decoupling Case Studies Revenue Regulation Implementation in Six States
14
Baltimore Gas and Electricrsquos (BGE) revenue regulation mechanism compares actual distribution revenue to the authorized revenue adjusted for the number of customers for each applicable rate schedule The
authorized revenue including the cost of power is based on test year requirements and sales levels Over- or under-collec-tions are reconciled monthly through a rider This mechanism differs from the others we describe by having a monthly rather than annual deferral and recovery period
AuthorityBGE requested a revenue regulation mechanism in 2007
due to the expected impact on electricity sales of the com-panyrsquos conservation and demand response programs BGE stated that the revenue regulation mechanism was neces-sary to eliminate the inherent disincentive in the traditional ratemaking process with respect to conservation and demand response Under traditional ratemaking BGE pointed out that ldquoa one percent reduction in electricity use and demand on the Companyrsquos system for the residential and small com-mercial classes would cut cost recovery by approximately $4 million This first year impact on recovery is then followed by $8 million in the second year (as an equal amount of sav-ings is added) and so on the five-year loss to shareholders from this steady-state utility investment program would be more than $20 millionrdquo19 The revenue regulation mechanism proposed by BGE was based on its gas revenue regulation mechanism which has been in place since 1998
Authorized Revenue RequirementBGE initially calculated its revenue requirement per class
separately for each rate scale based on weather-normalized 2007 sales and the number of customers Because BGE pro-posed the mechanism in 2007 the test year 2007 included nine months of actual sales and three months of forecasted sales BGE used three steps to calculate the base monthly revenue requirement
1 Calculate the Customer Charge revenues by multiplying the number of customers by the
Maryland Baltimore Gas and Electric
Customer Charge for each class2 Calculate the Delivery Service revenues by
multiplying the weather-normalized sales by the Delivery Price for each class
3 Add the Customer Charge revenues and the Delivery Service revenues to determine the base revenue requirements for each class
BGErsquos residential small general service and general service customers are included in the revenue regulation mechanism
Rate of ReturnBGE was allowed a return on common equity of 975
percent applied to a common equity ratio of 5105 per-cent in its most recent rate case BGE strongly opposed the reduction of its ROE and preferred another lost revenue mechanism over revenue regulation if an ROE reduction was implemented as a result of revenue regulation
The Public Service Commission (PSC) made no adjust-ment to BGErsquos ROE when revenue regulation was first implemented in 2007 but did reduce its allowed ROE by 50 basis points in the last rate case The Commission had previously reduced the ROE of another utility by 50 basis points when it adopted a similar revenue regulation mecha-nism for that utility20 21
Revenue Adjustment MechanismOn a monthly basis the adjustment to base revenue
requirement is calculated for each rate class using the following steps
19 BGE (2007 October 26) 9111FilingConser-va102607F Available at httpwebapppscstatemdusintranetmaillogcontentcfmfilepath=C5CCasenum5CAdmin20Filings5C60000-1099995C1080615C9111FilingConserva102607Fpdf
20 Potomac Electric Power Company
21 BGErsquos gas mechanism was approved in a 1998 settlement that did not discuss any adjustment to ROE
Decoupling Case Studies Revenue Regulation Implementation in Six States
15
1 Calculate the revenue adjustment for the change in the number of customers by multiplying the change in the number of customers by the Customer Charge
2 Calculate the revenue adjustment associated with the change in sales by multiplying the change in the number of customers by the average use per customer and multiplying that product by the Delivery Price for the class
3 Calculate the target base revenues for each class for the current period by adding the two types of adjustments to the revenue requirement
The Delivery Price for each class is the delivery rate established by the PSC adjusted for the electric universal service charge nuclear decommissioning credits and the administrative credit associated with the administrative adder portion of the Standard Offer Service rates22
BGE had a full electric and gas rate case in 201023 and another one filed in 2013 and concluded in 201424 Both reset the required decoupling elementsmdashmonthly revenue requirement monthly average usage per customer and number of customers Neither case changed the mechanism
The decoupling mechanism now excludes lost sales resulting from major storms
Reconciling Actual Revenue With Authorized Revenue
On a monthly basis each rate classrsquos target base revenues are compared to the actual base revenues for the month The difference is divided by the forecasted sales for the following period to calculate the monthly rate adjustment Balancing accounts are used to record the timing differ-ences associated with when the adjustments are calculated versus when they are billed or refunded The monthly rate adjustment Rider 25 is capped at ten percent of rates Any amount beyond ten percent of the current rate will be car-ried over and reconciled in the subsequent period
Complementary PoliciesMaryland requires its electric utilities to provide energy
efficiency services to achieve a ten-percent reduction in per capita electricity use by 2015 The statersquos overall goal is a 15 percent reduction of per capita electricity use by 2015 Although the PSC is explicitly allowed to approve financial incentive mechanisms to promote energy efficiency no incentives have been approved yet25
BGErsquos default service to its standard offer residential cus-tomers (those customers who have not elected to take gen-eration service from an alternate supplier) features seasonal
ratesmdashsummer and winter BGE also offers a TOU rate as an option to standard offer residential customers and as the default rate for small general service customers
Regarding performance incentives under revenue regula-tion in October 2012 Maryland issued a four-part plan designed to speed up investments that will strengthen the statersquos distribution grid Part of that plan would set a rate-making structure that aligns customer and utility incentives by rewarding reliability that exceeds established reliability metrics and penalizing failure to reach those metrics A task force has encouraged the Maryland state regulatory com-mission to implement a performance-based ratemaking process for IOUs such as BGE linking a utilityrsquos progress or failure to meet certain reliability metrics with its authorized rate of return
Energy Efficiency OutcomesWhen BGE implemented electric revenue regulation in
mid 2007 it had not achieved incremental energy savings for several years In 2008 it reported incremental savings of 05 percent of retail load increasing to 17 percent in 2010 and 2011
ResourcesMaryland Public Service CommissionLetter Order ML 108061 (December 27 2007)Letter Orders ML 108069 (November 30 2007) Case No 9036 Order No 80460 (December 21 2005) Case No 9230 Order No 83907 (December 13 2013) Case No 9326 Order No 86060 (December 13 2013)
22 BGE (2007 October 26) 9111FilingConser-va102607F Available at httpwebapppscstatemdusintranetmaillogcontentcfmfilepath=C5CCasenum5CAdmin20Filings5C60000-1099995C1080615C9111FilingConserva102607Fpdf
23 Case No 9230 ndash See references above
24 Case No 9326 ndash See references above
25 ACEEE Maryland Available at httpaceeeorgsectorstate-policymarylandEnergy Efficiency Resource Standards
26 EIA Form EIA-861 data files Available at httpwwweiagovelectricitydataeia861
Decoupling Case Studies Revenue Regulation Implementation in Six States
16
27 The pilot extension is in effect until the effective date of a Final Decision issued by the Commission on an application for a general base rate case filed after January 1 2013
28 Except the Direct Load Control Cp - Large Commercial amp Industrial Service Cp-ND - Pilot Large Commercial amp Industrial - Day Ahead Cp-RR - Large Commercial amp Industrial Response Rewards Automatic Transfer Switch Parallel Generation Lighting Nature Wise and Real Time Market Pricing tariffs
Wisconsin Wisconsin Public Service Corporation
Wisconsin Public Service Corporationrsquos (WPS) Revenue Stabilization Mechanism (RSM) began in 2009 as a four-year revenue regulation pilot that reconciled
target marginal revenue per customer with actual marginal revenue per customer As of 2012 the pilot was extended27 albeit with some modifications This section focuses on the current iteration of the RSM
AuthorityThe Public Service Commission of Wisconsin (PSCW)
approved a revenue regulation pilot for WPS in a Decem-ber 2008 rate case order (Docket No 6690-UR-119) The revenue regulation mechanism was effective from January 1 2009 through December 31 2012 and applied to the util-ityrsquos electric and gas operations In a rate case completed in December 2012 (Docket No 6690-UR-121) the pilot was extended and a modified RSM was approved The extended RSM is in effect from January 2013 until the next rate case
Authorized Revenue RequirementThe authorized revenue requirement is determined
through a rate case The Commission uses a future test year to determine the revenue requirement The cost of fuel is not included in the revenue requirement but is addressed through a ldquoRetail Electric Fuel Rulerdquo adjustment
Rate of ReturnThe Commission authorized a rate of return on utility
common equity of 1030 percent in Docket No 6690-UR-120 This rate remained the same in Docket No 6690-UR-121 and is currently in effect
Revenue Adjustment MechanismWPS implemented a new electric RSM based on a ldquoTotal
Rate Case Marginrdquo mechanism instead of a ldquoTotal Rate Case Margin per Customerrdquo mechanism which had been the practice during the initial four-year pilot phase The revision was intended to remove the calculation sensitivities related
to sales per customer from the original RSM calculation The margin reflected in the formula equals the total revenue for each tariff less the costs associated with the annual per-kWh value established for monitored fuel costs and excluding any surcharges credits taxes or similar charges The ldquoTotal Rate Case Marginrdquo mechanism allows WPS to achieve the total margin assumed in the forecasted test year no more and no less The new RSM will be in effect on a pilot basis until the effective date of WPSrsquos next general rate order which WPS committed to filing for the 2014 andor 2015 test years The RSM applies to most tariffs except large commercial and industrial customers28
Reconciling Actual Revenue With Authorized Revenue
Each year the utility compares the total target revenue and the total actual revenue and defers the difference subject to carrying costs based on WPSrsquos last approved short-term debt rate The margin will be based on annual per-kWh value established for monitored fuel costs which is done in a rate case The margin is determined by subtracting the aver-age kWh value from the authorized energy rates
The formula for calculating an electric under-recovery or over-recovery is
Under-recovery or over-recovery equals
[actual margin minus ratecase forecasted margin established in the most recent rate proceeding]
The summation is over each tariff A positive value equals an over-recovery and a negative value equals an
Decoupling Case Studies Revenue Regulation Implementation in Six States
17
29 The required spending level was higher for the year 2011 owing to a temporary change in state policy
30 ACEEE Wisconsin Available at httpaceeeorgsectorstate-policywisconsin
31 The Cadmus Group Inc (2013)
under-recovery The margin reflected in the formula equals the total revenue for each tariff less the costs associated with the annual per-kWh value established for monitored fuel costs and excluding any surcharges credits taxes or similar charges
In the event that a true-up will cause rates to increase the Commission will provide an opportunity for a hear-ing Revenue regulation adjustments occur as a part of the general rate case
The revenue regulation adjustments are subject to a $14 million per year cap for electric excluding carrying costs Any adjustments over that amount will not be carried over and will not be collected from ratepayers Equivalently revenue over collection in excess of $14 million will not be returned to ratepayers
Complementary PoliciesWPS like all other investor-owned utilities
in Wisconsin is required to spend 12 per-cent of its annual operating revenues on en-ergy efficiency and customer-owned renew-able resource programs that are administered by a third party through the Focus on Energy program which was established in 200229 Separately through a contract the PSCW ap-proves annual electricity savings goals for the Focus on Energy program The savings goals were equivalent to 075 percent of electric sales for the participating utilities from 2011 to 2013 In addition the PSCW approved a rate of return on investments in energy efficiency for Wisconsin Power amp Light and other utilities can propose incentives as part of their rate cases However WPS has not yet proposed an incentive mechanism30
WPS offers residential customers a default flat rate but they also offer a TOU option with winter and summer on-peak off-peak and shoulder tiers For small commercial and industrial customers there are flat rates TOU rates and critical peak rates Large commercial and industrial customers can take service under a TOU rate with summer and winter on-peak and off-peak rates a TOU with criti-cal peak rate or under a special contract rate unique to the customer and approved by the Commission
The authorized level of expensed conservation costs recoverable in rates for the test year (2013) is $19778728 The level for electric utility operations consists of the conservation budget of $17669792 and an escrow adjustment of $2108936 which represents the test year amortization of the projected overspent escrow balance at
December 31 2012 over two years Wisconsin has a statute requiring filing of reliability data
but no reward or penalty system to support its revenue regulation system
Energy Efficiency OutcomesWPS implemented revenue regulation in 2009 In order
to gain approval for the original revenue regulation mecha-nism WPS agreed to fund energy efficiency and renewable energy programs at levels above their 12-percent statutory minimum contribution to Focus on Energy Focus on Energy produces an annual report of energy efficiency program activities In its 2012 report Focus on Energy reports the following outcomes achieved for WPSrsquo service territory The table below represents the savings under the statewide Focus on Energy Programs and does not represent the savings at-tributed under the funding levels above 12 percent31
Territory Segment
Customer Participation
Rate () Utility Type
Per Capita Lifecycle Bill Savings ($)
Per Capita Incentive
($)
WPS Electric Commercial $115258 3 $8330
WPS Electric Industrial $9026768 96 $892463
WPS Electric Residential $6494 36 $666
ResourcesPublic Service Commission of WisconsinApplication of Wisconsin Public Service Corporation for
Authority to Adjust Electric and Natural Gas Rates Final Decision (December 7 2012) Docket No 6690-UR-121
David J Kyto Wisconsin Public Service Corporation Application of Wisconsin Public Service Corporation for
Authority to Adjust Electric and Natural Gas Rates Supplemental Direct Testimony (May 15 2012) Docket No 6690-UR-121
Focus on EnergyThe Cadmus Group Inc (2013) Focus on Energy Calendar
Year 2012 Evaluation Report Appendixes Portland OR The Cadmus Group Inc Retrieved from httpwwwfocusonenergycomsitesdefaultfilesFOC_XC_CY201220Report20Appendices20A-O20Final2005-3-13pdf
Decoupling Case Studies Revenue Regulation Implementation in Six States
18
32 DPU 07-50 (2007)
33 DPU 07-50 (2007) pp 392ndash396
Massachusetts National Grid
The revenue regulation mechanism for National Grid (Massachusetts Electric Company and Nantucket Electric Company together doing business as National Grid) compares authorized
distribution revenue to actual distribution revenue Revenue is compared and adjustments are made separately for each customer class
AuthorityThe Massachusetts Department of Public Utilities (DPU)
adopted revenue regulation as a statewide regulatory policy in 2008 and individual utilities filed revenue regulation tariffs in response In its Investigation Into Rate Structures that will Promote Efficient Deployment of Demand Resources32 the DPU investigated rate structures and revenue recovery mechanisms that may reduce disincentives to the efficient deployment of demand resources in the state and consid-ered how the electric and natural gas distribution compa-niesrsquo existing cost recovery mechanism could be changed to better align the companiesrsquo financial incentives with policy objectives while ensuring that the companies are not finan-cially harmed by the increased use of demand resources The DPU finally concluded that revenue regulation mecha-nisms would eliminate the financial disincentives because they sever the link between the companiesrsquo revenue and reduction in sales The DPU also endorsed a revenue per customer approach but recognized that other factors could result in changes to distribution-related costs and consent-ed to consider company-specific ratemaking proposals that accounted for the impact of capital spending and inflation-ary pressures on the companyrsquos required revenue
Authorized Revenue RequirementThe authorized revenue requirement does not include
costs that are reconciled outside of base distribution rates including energy supply costs for basic service customers transmission costs the energy efficiency system benefits charge and reconciling charge and costs recovered through the residential assistance adjustment factor
Rate of ReturnThe Commission recognized the effects of revenue
regulation on ROE and determined that revenue regulation reduces volatility which reduces risk and a downward ad-justment to ROE was appropriate but did not make its ac-tual ROE adjustment for the revenue regulation mechanism explicit in its order33 The DPU determined that a return on equity equal to 1035 percent was sufficient The testimony from National Grid supporting its proposed ROE presented comparisons of allowed ROE for a set of companies that had revenue regulation or another risk management mecha-nism in place to account for an implied reduced risk profile in developing that proposal
Revenue Adjustment MechanismEach year the authorized revenue requirement is ad-
justed to account for capital expenditures in the previous year The CapEx Adjustment applies to capital expenditures incurred by National Grid for distribution system invest-ments in the previous year net of the amount recovered through depreciation expense in base rates This accounts for the material difference in expected capital expenditures compared with prior years In this way the CapEx Adjust-ment in the National Grid revenue regulation mechanism is a special case of a ldquoK Factorrdquo which characterizes an expected change in costs in the future and accounts for those changes when they occur Each year the Company files with the Department documentation in support of the capital expenditures it has incurred since the previous review The Department reviews the filings to determine the prudence of the incremental expenditures and whether the expenditures are used and useful National Grid then allocates approved expenditures to rate classes based on the cost of service study For each class the Company determines the adjustment allocated to the rate class then divides this sum by the forecasted kWh sales for the follow-
Decoupling Case Studies Revenue Regulation Implementation in Six States
19
34 DPU 07-50 (2007) p 87
35 ACEEE Massachusetts Available at httpaceeeorgsectorstate-policymassachusetts
36 Personal communication with National Grid
ing year to determine the per-kWh adjustment In order to provide a balance between providing the
Company with sufficient funds to ensure the safety and reliability of the distribution system and protecting ratepay-ers against the incentive the Company has to overinvest in infrastructure the mechanism limits the level of annual capital expenditures that is recoverable through the mecha-nism To arrive at the amount the Department set a limit of $170 million per year which is equal to the approximate three-year average of the Companyrsquos capital spending in previous years Should the Companyrsquos capital expenditures exceed this limit it may seek to include the investment in the rate base during the next base rate proceeding
The Company submits its CapEx filing no later than July 1 of each year On November 1 of each year the Company submits all other information in support of its proposed adjustment factors The factors will take effect on March 1 of each year
The authorized revenue is also adjusted to include a 50-percent sharing for earnings above the authorized ROE
Reconciling Actual Revenue With Authorized Revenue
Each year National Grid calculates on a rate class-spe-cific basis the difference between the actual distribution revenue billed to customers through distribution rates and the annual target revenue For each rate class the difference between the actual billed distribution revenue and the an-nual target revenue is summed to determine the Company-wide reconciliation amount That amount is divided by the Company-wide kWh forecasted for the upcoming year to arrive at a cent-per-kWh reconciliation charge or credit To determine the final adjustment for each rate class the Company-wide reconciliation adjustment is added to the rate class-specific adjustment resulting from the target rev-enue adjustment mechanisms
The adjustment to the authorized revenue in any year is capped at three percent of total revenues34 Any excess can be carried forward to a future year with carrying charges equal to the customer deposit rate
National Grid must report to the DPU if the difference between the year-to-date billed revenue and year-to-date annual target revenue equals or exceeds ten percent of the target revenue and the Company believes that the difference will fall outside of the ten-percent threshold in the coming months In this case interim revenue regulation adjust-ments can be made In order to avoid an interim adjust-ment too close to the scheduled annual rate adjustment
National Grid must notify the Department of variances exceeding ten percent of annual target revenue by August 31 of each year
Complementary Policies Massachusetts requires that electric utilities procure
all cost-effective energy efficiency before more expensive supply-side resources This requirement was translated into annual savings requirements for electric utilities starting from 1 percent of sales in 2009 to 14 percent in 2010 2 percent in 2011 and 24 percent in 2012 and potentially increased savings in subsequent years Utilities can earn approximately five percent of program costs for meeting or exceeding savings targets35
National Grid offers inclining block rates as the default residential rate but there is an optional TOU rate with peak and off-peak tiers also available to residential customers Small and large industrial and commercial customers can take service under flat rates inclining block rates or TOU rates
National Grid operates under a penalty and reward sys-tem for service quality established in Docket DTE 99-84 The impetus behind the DPUrsquos original establishment of the Service Quality Guidelines was to prevent Massachusetts utilities from allowing service quality to deteriorate under a new regulatory regime
Energy Efficiency OutcomesBefore Massachusetts Electric implemented revenue
regulation in 2009 it reported consistently high levels of incremental energy efficiency savings approximately 09 percent of retail load In 2010 the company reported 136 percent savings and 159 percent in 2010 and 2011 respectively36
ResourcesMassachusetts Department of Public UtilitiesDocket 09-39 Petition of Massachusetts Electric Company
(November 30 2009)
Decoupling Case Studies Revenue Regulation Implementation in Six States
20
37 Energy Agreement Among the State of Hawaii Division of Consumer Advocacy of the Department of Commerce amp Consumer Affairs and Hawaiian Electric Companies Available at httpwwwhecocomvcmcontentStaticFilespdfHCEIpdf
38 The HECO Companies described as follows in their Reply SOP in the Schedule A decoupling proceedings ldquothe
Hawaii Hawaiian Electric Company
Hawaiian Electric Company (HECO) uses a revenue regulation mechanism that compares actual revenue to target revenue in each year The target revenue is based on the authorized
revenue for the last test year adjusted for operation and maintenance (OampM) increases and rate base changes
HECO is a subsidiary of Hawaiian Electric Industries which also operates Maui Electric Company (MECO) and Hawaiian Electric Light Company these subsidiaries service the islands of Maui and Hawaii County while HECO serves Oahu (Honolulu)
Authority In 2008 the Governor of Hawaii the Division of Con-
sumer Advocacy and HECO entered into an agreement as a result of the Hawaii Clean Energy Initiative37 The agreement is intended to move Hawaii away from its dependence on imported fossil fuels for electricity and ground transporta-tion and toward locally produced renewable energy and energy efficiency In the agreement the State the Consumer Advocate and HECO committed to among other things a transition away from a model that encourages increased elec-tricity usage and to a model that implements revenue regula-tion decoupling to encourage the development of renewable energy by HECO The Commission opened Docket 2008-0274 in order to examine the features of a revenue regula-tion mechanism The Opening Order directed HECO and the Consumer Advocate to file a joint proposal on revenue regulation within 60 days This joint proposal was modeled closely after the California mechanism described earlier for PGampE with a rate-case determined revenue requirement plus annual attrition adjustments plus separate mechanisms
to recover power supply and energy efficiency costsThe Hawaii Public Utilities Commission approved
revenue regulation for HECO in August 2010 based on an investigation into the appropriateness of revenue regula-tion and its design The revenue regulation mechanism took effect on March 1 2011 This replaced a previous lost revenue adjustment mechanism
Authorized Revenue RequirementThe Commission establishes the Authorized Base Rev-
enues through a general rate case based on traditional cost-of-service ratemaking principles The Authorized Base Revenue is the annual amount of revenues required for the utility to recover its estimated OampM depreciation amorti-zation and tax expenses for the period
The Target Revenue is equal to the base revenue require-ment less any revenue being separately tracked or recov-ered through any other surcharge or tracking mechanism including revenue for fuel and purchased power expenses
The revenue regulation order also requires staggered triennial rate cases for each of the Hawaiian Electric Indus-tries Companies to determine approved baseline Revenue Adjustment Mechanism (RAM) inputs
Rate of ReturnThe Commission made no explicit adjustment to ROE
owing to the revenue regulation mechanism but noted that the allowed ROE of ten percent reflects the approval of revenue regulation and other cost-recovery mechanisms that will lower HECOrsquos business risk38 Most recently the Hawaiian Public Utilities Commission approved a 90-per-cent ROE for MECO reflecting both a lower baseline cost
Commission effectively reduced the Companiesrsquo return on common equity by 50 basis points to ldquofairly compensate ratepayersrdquo for what it perceived as the ldquorisk-reducingrdquo effects of the RBA and RAM mechanisms the Renewable Energy Infrastructure Program (lsquoREIPrdquo) Surcharge and the Purchased Power Adjustment Clause (ldquoPPACrdquo)rdquo Available at httpdmspuchawaiigovdmsDocumentViewerpid=A1001001A10L29B55326B47993
Decoupling Case Studies Revenue Regulation Implementation in Six States
21
39 Hawaii PUC Decision and Order No 31288 (2013 May 31) pp 97ndash112
40 Hawaii PUC Decision and Order No 31289 (2013 May 31)
41 Hawaii PUC Decision and Order No 31908 (2014 Feb 1)
42 February 7 2014 order on schedule A issues Available at httpdmspuchawaiigovdmsDocumentViewerpid=A1001001A14B10B22326F07922 p 42ndash47
of capital and a penalty of 050 percent associated with inadequate performance bringing renewable energy into the MECO system39 A companion Order also established new guidance on future revenue regulation mechanisms40
Revenue Adjustment MechanismThe RAM is designed to replace the need for annual rate
cases by adjusting Authorized Base Revenue levels to reflect estimated changes in the utilityrsquos cost of service The RAM is intended to via formula-driven estimates and escalators compensate the HECO Companies for changes in util-ity costs and infrastructure investment between rate cases and reduce the frequency of rate cases The RAM Period is the calendar year containing the Annual Evaluation Date (March 31 the date of the annual RAM filing) The RAM adjusts the revenue requirement according to changes in four main categories of expenses
bull Base expenses which are changes in designated OampM expenses
bull Rate base the return on incremental investment in designated rate base components41
bull The incremental depreciation and amortization expenses and
bull Exogenous tax changes changes in costs owing to significant changes in tax laws or tax regulations
Base expenses are segregated between labor and non-labor amounts The labor component is adjusted annually by the Labor Cost Escalation Rate reduced by the Labor Productiv-ity Offset (fixed at 076 percent) The non-labor component uses the Non-labor Escalation Rate to annually adjust those costs Tracked OampM expenses for fuel purchased power pension and post-employment benefits integrated resource planning DSM and other rate adjustment provisions are not adjusted in the RAM because any changes in these costs are accounted for in other cost-tracking mechanisms
The Rate Base equals the average net investment esti-mated for the RAM Period The average rate base is the rate base for the rate case test year with adjustments for changes in only four components of rate base (1) average plant-in-service (2) average Accumulated Depreciation (3) average accumulated contributions in aid of construc-tion and (4) average accumulated deferred income taxes All other components of the rate base remain the same as in the preceding rate case test year The average plant-in-service is equal to the average of the actual plant-in-service at the end of the year prior to the RAM period the Evalu-ation Year and the same year-end balance plus estimated plant additions for the RAM period Plant additions include
Baseline Capital Project plant additions and Major Capital Projects plant additions estimated to be in service by Sep-tember 30 of the RAM period
The RAM also includes an Earnings Sharing Revenue Credit mechanism in order to protect against excessive over-all utility revenue levels The RAM will escalate and update the Companyrsquos approved base revenue requirement reduced by earnings sharing credits and major project revenue credits to customers Based on the Companyrsquos achieved return on common equity for the Evaluation Year the mechanism cred-its the RBAs according to the following chart
ROE at or below the authorized ROE
First 100 basis points (1) over authorized ROE
Next 200 basis points (2) over authorized ROE
ROE exceeding 300 basis points (3) over
authorized ROE
Retained entirely by shareholders no customer credits
25 share credit to customers
50 share credit to customers
90 share credit to customers
Finally the RAM includes additional consumer protectionsbull A provision for Major Capital Projects Creditsbull A provision for Baseline Capital Projects Creditsbull Notification is provided to all affected customers of
the RAM filing in newspapers and billsbull Evaluation procedures for filing examination and any
exceptions to annual revenue regulation filingsbull Continued ability of HECO or the Consumer
Advocate to request formal rate proceedings to replace and terminate RAM at any time and
bull Formal review of revenue regulation as a part of the next round of rate case proceedings
A recent order42 added two additional consumer protections
bull A limitation that only 90 percent of the current
Decoupling Case Studies Revenue Regulation Implementation in Six States
22
43 ACEEE Hawaii Available at httpaceeeorgsectorstate-policyhawaii
RAM Period Rate Base that exceeds the Rate Base Adjustment Mechanism from the prior year can be included in the Decoupling Mechanism for baseline utility plant projects which unlike major capital projects are not subject to prior Commission review and approval and
bull A requirement to post a number of metrics online for customer review although not at this point tied to performance
This order also examined four issues with respect to the application of the RAM The Commission determined that the short-term debt rate as reflected in the most recent rate case should be used to adjust over- and under-collections The Commission also resolved its concern that without a sustainable business plan there exists no strategic frame-work under which to evaluate capital expenditure pro-grams The Commission required the parties in the Docket to further explore capital expenditure issues in conjunction with other risk-sharing mechanisms discussed elsewhere in the order The commission ordered a further evaluation of a proposed risk-sharing mechanism within the RBA Further-more the Commission ordered the parties to work together to establish appropriate metrics which the utility would report on its website
Once the total RAM Revenue Adjustment is calculated it is applied through a uniform adjustment to the per-kWh energy charge for all customer classes
Reconciling Actual Revenue with Authorized Revenue
RBAs record the monthly differences between target revenues and the adjusted recorded electric sales revenues The RBA also applies monthly interest equal to the annual rate for short-term debt from the cost of capital in each HECO Companyrsquos last base rate case to the simple average of the beginning and ending balances each month in the RBA In effect the RBA applies one-twelfth of the rate each month Finally the RBA provides for collection or return of the calendar year-end balances in the RBA and recovery of the RAM Revenue Adjustment over the subsequent May 1 through April 30 period The target revenue is the most recent Authorized Base Revenue or the re-determined Authorized Base Revenue calculated under the RAM
On or before March 28 the Company must file with the Commission a statement of the previous year-end balance in each RBA sub-account and the Authorized Base Revenue level for the current calendar year with supporting calculations An amortization of the year-end balance in the
RBA sub-accounts and the RAM Revenue Adjustment are recovered through the per-kWh RBA rate adjustments The rate adjustment occurs from May 1 of the current calendar year to April 30 of the next year
Complementary PoliciesCurrently electric utilities in Hawaii may use energy
efficiency to meet a portion of their Renewable Portfolio Standard requirements Starting in 2015 electricity savings from energy efficiency will be applied to the Statersquos Energy Efficiency Portfolio Standard which sets a target equivalent to 30-percent forecast sales by 2030 This goal is translated into a target of 14 percent annual savings HECO trans-ferred administration of all of its energy efficiency programs to a third party administrator in 2009 The administrator is compensated for satisfactory performance43
Because of its heavy dependence on petroleum as a generation fuel electricity prices in Hawaii are very high solar and wind are typically lower-cost resources for these systems HECOrsquos default residential rates are inclining block rates with a $900month customer charge and a three-block inclining rate design of $034kWh to $037kWh Residential customers can elect to take service under a TOU rate with off-peak mid-peak and priority-peak tiers Gen-eral service and large power service customers take service under a flat rate unless they opt to take service under a TOU
Hawaii is developing reliability standards in part as a response to deteriorating service quality as a result of distributed and customer-owned generation (see text box) In an effort to make electricity reliability and interconnection standards as transparent as possible the Reliability Standards Working Group was formed in the Feed-In Tariff docket and continues its work in Docket No 2011-0206 to find solutions to integrating high penetrations of renewable energy consistent with reliability and power quality standards
Energy Efficiency OutcomesHECO implemented revenue regulation in 2011 Since
2003 HECO has reported incremental energy efficiency savings between 0 and 05 percent of retail load with 131 percent savings reported in 2011 by Hawaii Energy the
Decoupling Case Studies Revenue Regulation Implementation in Six States
23
44 Hawaii PUC Decision and Order No 31288 Maui Electric Company Limited Docket No 2011-0092 (2013 May 31) Appendix C p 2
Statersquos ratepayer funded efficiency program administrator The company has not yet reported its savings for 201245 In addition HECO has seen more than a sixfold increase in renewable installations under its net metering and feed-in tariff policies since the inception of the revenue regulation plan
Revenue regulation represents a regulatory framework that removes the financial disincentive for utilities to pursue clean
energy strategies It doesnrsquot in and of itself align the utility business model with those utility policies and practices that address customer expectations In fact some commissions are concerned that it might create a dynamic in which the utility assured of its revenue needs becomes complacent and lacks motivation to innovate and develop strategies that may be more in line with the public interest
In a recent order (Docket 2011-0092 May 31 2013) the Hawaiian Public Utilities Commission addressed this big picture issue in a rate order for Maui Electric The Commission called out the management as lacking a long-term vision for creating customer value and expressed concern that ldquothe HECO Companiesrsquo over-reliance upon a link between the [Decoupling]
Agreement and utility financial health obfuscates utility performance and ultimately customer service and satisfactionrdquo44 The implementation of clean energy policies is not a singular goal but rather a policy that must be part of a larger effort to create customer value
The Commission laid out a hard path and a soft path to achieve the results they desire for consumers The hard path involves a closer examination of utility investments operations and expenditures The soft path is opened through the actions of management to create and execute a vision for the utility of the future The Commission remains committed to regulatory innovations that are in the public interest and will work with the utility consumer advocate and other stakeholders to create and implement this vision
The results of this effort will likely produce ideas and outcomes that will have applicability beyond this one utility
ResourcesHawaii Public Utilities CommissionDocket No 2008-0274 Final Decision and Order (August 31 2010)Docket No 2008-0083 Final Decision and Order (December 29 2010)Docket No 2011-0092 Final Decision and Order May 31 2013 including
Decision and Orders Nos 31288 and 31289Docket No 2013-0141 Final Decision and Order (February 1 2014) including
Decision and Order No 31908
45 EIA Form EIA-861 data files Available at httpwwweiagovelectricitydataeia861
Decoupling Case Studies Revenue Regulation Implementation in Six States
24
46 Lazar et al 2011
Discussion of the Six Utilities Overall
Authority The first step in implementing a revenue regulation
mechanism is to understand the authority of the regulating body the Public Utility Commission or PSC It is important for any Commission to clarify its justification for acting on revenue regulation in order to prevent any decisions from being overturned Over the years Utilities Commissions have relied on different justifications for implementing revenue regulation mechanisms Commissions have imple-mented revenue regulation at their own discretion justified by their directive to ensure safe reliable and economic public utility service to citizens to justify changing the regulatory environment In some cases the Commission is unable to engage on narrow issue ratemaking and rates can change only as the result of a full rate case In this case statutes must be amended to enable revenue regulation
In all of the case studies discussed here the Commis-sions first implemented revenue regulation at their own dis-cretion but each followed slightly different paths to do so The CPUC first implemented revenue regulation in 1978 at its discretion In 2001 after a period when mechanisms were suspended the California Legislature required that deviations from projected sales not result in under- or over-collections by utilities and so the CPUC re-implemented revenue regulation according to statutory requirement The Hawaii Public Utilities Commission implemented rev-enue regulation after an agreement between the utility the Governor and other stakeholders called for it In Idaho the Commission established a case in which to investigate rev-enue regulation and held a series of stakeholder workshops before implementing the policy The Massachusetts DPU adopted revenue regulation as a statewide regulatory policy and required individual utilities to file tariffs in response as the result of its general investigation into rate structures that promote demand-side resources The Maryland Com-mission implemented revenue regulation for BGE when the utility requested the mechanism Thus the impetus to develop a revenue regulation mechanism may come from different sources and the Commission may be comfortable
in moving forward under their general supervisory statutes Nevertheless specific statutory language can be helpful to shore up the existing authority
Authorized Revenue Requirement Under the traditional regulatory framework the Com-
mission (or other authority in the case of publicly owned utilities) must determine a utilityrsquos revenue requirement This function does not change under revenue regulation The revenue requirement of a utility is the aggregate of all the operating and other costs incurred to provide service to the public This typically includes operating expenses depreciation and the cost of capital invested including in-terest on debt and a ldquofairrdquo return on equity to investors The (simplistic) formula for determining revenue requirements is as follows
Revenue Requirements = (Rate Base times Rate of Return) + Operating Expenses + Depreciation +Taxes
Traditionally the revenue requirement along with sales is used to determine the rates consumers will pay for elec-tricity46 The rates are also broken down by customer class and intraclass tariffs are created based usually on a cost of service study that determines each customer class and subclass contribution to the utilityrsquos costs The (simplistic) formula for determining the rate per unit is
Rate = Revenue Requirement divide Units Sold
In this way rates are set to allow the utility to exactly recover its revenue requirement when the sales level used to calculate rates is equal to actual sales However it is important to recognize that actual expense and revenue varies with actual sales When actual sales are greater than the sales level used in ratemaking revenue increases and expenses increase by a different amount when actual sales are lower than the ratemaking sales level actual revenue
Decoupling Case Studies Revenue Regulation Implementation in Six States
25
declines and expenses decrease by a different amount Under revenue regulation rates are initially set in the same way but when actual sales differ from the level used to calculate rates the actual revenue level is maintained at the rate case amount as rates are allowed to vary inversely with salesmdashincreased sales lead to decreased rates and vice versa Because the primary expenses that change in the short run as sales levels change are power supply expenses and most regulators allow these to be tracked using a power cost adjustment mechanism revenue regulation mechanisms are generally designed to ensure recovery of the non-power costs (which do not change significantly in the short-run) as sales volumes change
Revenue regulation ensures that actual revenue is equal to the revenue requirement established by the Commission or appropriate authority Although the description above presents an overly simplified view of the revenue require-ment and its use in traditional price regulation and revenue regulation there are many variations on how a Commis-sion can establish a revenue requirement particularly when implementing revenue regulation With revenue regulation as in traditional ratemaking imprudent costs can always be removed from rates and there is no change to the ability of a Commission to impose penalties
Utility Functions to be IncludedFirst the regulator must determine which utility func-
tions will be included in the revenue regulation framework With vertically integrated utilities this usually includes a utilityrsquos regulated generation transmission and distribution units As we discuss below however it is critical to struc-ture power supply recovery mechanisms to avoid providing for double-recovery of certain power supply costs For utili-ties operating in areas of the country that have restructured electricity markets only the regulated distribution busi-ness is decoupled Utilities that also provide gas services
Pacific Gas amp Electric Future test year
Idaho Power Company Historic test year
Baltimore Gas amp Electric Hybrid test year
Wisconsin Public Service Corporation Future test year
National Grid Historic test year
Hawaiian Electric Company Future test year
Table 2
Test Year Used
may have their gas distribution business operating under revenue regulation as well
Test YearOne consideration in establishing the revenue require-
ment is what period of time will be used as a ldquotest periodrdquo or ldquotest yearrdquo The test year is the year on which the Com-mission will base its computations of the utilityrsquos total costs and sales levels A historic test year uses actual data on sales and costs from a past year Whereas a historic test year allows for the use of actual cost data it cannot account for expected variations in sales A future test year requires assumptions to be made about a utilityrsquos sales in a future year This can allow expected changes in sales like those from energy efficiency programs to be included in sales
projections however because regulators are relying on estimates provided by the utility there may be a greater risk for inaccuracy A Commission may also choose to use a test year that includes both past and future periods This may provide a sense of balance between historic and future data Furthermore as the case proceeds the Commission can require the utility to substitute historical data for projected data from the test year
Rate of ReturnAs in any rate case regulators
must determine the appropriate rate of return that a utility can earn on its investments including the cost of debt and the allowed ROE for its shareholders The approved ROE is only used to establish the return on investments that are included in the rate base when determining revenue require-
Pacific Gas amp Electric Electric generation and distribution gas distribution
Idaho Power Company Electric generation and distribution
Baltimore Gas amp Electric Electric distribution gas distribution
Wisconsin Public Service Corporation Electric generation and distribution
National Grid Electric distribution
Hawaiian Electric Company Electric generation and distribution
Table 1
Business Unit Included in the Revenue Regulation Model
Decoupling Case Studies Revenue Regulation Implementation in Six States
26
47 In a rate case the Commission determines an allowed return on equity This is used to set a price (price regulation) or an allowed revenue requirement (revenue regulation) Once set however the actual return earned by the utility is affected by anything that changes either revenue or expenses for example an increase in employee compensation a change in the number of employees or under price regulation a change in sales volumes
48 Lazar et al 2011
ments Although revenue regulation ensures that a utility recovers no more or less than its target revenue revenue regulation does not guarantee that the utility will earn the authorized ROE Depending on how a utility manages its costs between rate cases it will realize an actual ROE either higher (in the case of reduced costs) or lower (in the case of increased costs) than the authorized level47
A utilityrsquos allowed ROE generally represents the return deemed necessary to attract investment considering the level of risk of that investment Riskier investments require a higher return to attract investors and vice versa Util-ity earnings can be volatile because of short-run impacts on sales volumes and revenues which include changes in sales owing to weather economic conditions and energy efficiency and DG programs This volatility typically causes utilities to retain a higher level of equity in their capital structures so that reduced revenues do not leave them un-able to service their debt Revenue regulation can reduce this volatility by stabilizing revenues regardless of the cause Because of this reduced risk many stakeholders have proposed that the implementation of a revenue regulation mechanism be associated with a corresponding reduction in the utilityrsquos equity capital ratio (the percentage of capital supplied by common equity) This reflects the utilityrsquos more stable revenue owing to revenue regulation and reduces the overall revenue requirement that will be recovered from consumers48
An alternative option to reducing the utilityrsquos equity ratio is to reduce the ROE reflecting a lower risk level For the utilities included in these case studies only BGE and Mass Electric experienced a reduction in their ROE The Com-mission did not reduce BGErsquos ROE at the time the revenue regulation mechanism was implemented but reduced it by 50 basis points during the subsequent rate case The Mas-
sachusetts Commission did not reveal its adjustment but incorporated a lowered ROE into its decision
Absent an explicit adjustment to the cost of capital investorsrsquo expectations will adjust to the presence of rev-enue regulation if its presence is reliable The more stable earnings will likely in time contribute to a higher credit rating That in turn will lead to lower cost debt that will be revealed in future cost of capital calculations An adjust-ment to the ROE or capital structure by the regulator in a rate proceeding will be reflected immediately in lower rates to consumers simply allowing the utilityrsquos credit rating to improve over time and its cost of debt to decline will have the same effect but on a lagged basis as new bonds are is-sued at lower interest rates49
Beginning in 2004 Standard and Poorrsquos began publish-ing ldquorisk profilesrdquo for utilities which classified utilities based on their earnings variability and other risks those with more stable earnings were determined eligible for higher bond ratings at any given equity capitalization ratio (or alternatively able to retain a given bond rating with a lower equity ratio)50 One utility with a revenue regulation mechanism Northwest Natural Gas was believed to have had their business risk profile upgraded by one step in response to the benefits of the mechanism51
Effect on Bond RatingsRevenue regulation stabilizes a utilityrsquos revenue streams
reducing risk to investors this reduced risk may be a contributing factor in an increase in a utilityrsquos bond rating Bond rating agencies have recognized that revenue regula-tion mechanisms and other mechanisms that reduce net earnings volatility and risk contribute to a lower cost of capital for the utility52 Standard and Poorrsquos has explicitly stated that it ldquoviews decoupling as a positive develop-
49 Lazar et al 2011
50 Standard and Poorrsquos (2004 June 2) New Business Profile Scores Assigned for US Utility and Power Companies Financial Guidelines Revised
51 Christensen Associates (2005 March) A review of distribution margin normalization as approved by the Oregon Public Utility Commission for Northwest Natural
52 Lazar et al 2011
Decoupling Case Studies Revenue Regulation Implementation in Six States
27
This topic raises a note of caution if mechanisms are not well designed double-recovery of costs can occur for verti-cally integrated utilities that provide both power supply and distribution services For example if a per-customer
revenue regulation mechanism includes investment-related power supply costs in the revenue-per-customer formula but excludes fuel and purchased power costs that are recovered through a separate tracking mechanism double recovery of some power supply costs is likely If the utility experiences cus-tomer and sales growth the amount it recovers for investment-related power supply costs will go up However if that utility serves this growth by operat-
ing existing power plants more by selling less power on the surplus market or by purchasing power from other suppli-ers it will not incur any increases in the type of power sup-
53 Standard amp Poorrsquos (2008 February 19) Decoupling the vehicle for energy conservation
ment from a credit perspectiverdquo53 However in the case of the utilities examined in this report none experienced an improved credit rating after the implementation of revenue regulation with the exception of PGampE However PGampE came out of Chapter 11 bankruptcy in the same year that its revenue regulation mechanism was implemented mak-ing it impossible to attribute the improvement to revenue regulation alone Bond rating changes are generally slow to evolve Numerous other factors are taken into account when assigning an overall credit rating which appear to have outweighed any positive effect of revenue regulation These factors certainly include the recession of the US economy that began in 2007
Customer Classes IncludedWhen determining the target revenue for a utility rev-
enue regulation mechanism regulators must also consider which customer classes to include in the mechanism In some cases industrial customers have objected to a rev-enue regulation mechanism This is due to the wide dif-ference in rates among customers making the design of a revenue regulation mechanism more challenging If regula-tors choose to exclude a class of customers from revenue regulation they must determine the revenue requirement associated with serving only the included customer classes This generally requires a detailed cost of service study to ensure that revenue responsibility is accurately allocated by customer class
Included CostsFinally regulators may wish to exclude specific costs
from the overall revenue requirement if those costs will be tracked through another mechanism like fuel costs in a PCA mechanism energy efficiency program expenditures or smart grid costs for example Separate tracking mecha-nisms can also be used for those costs that are difficult to
Pacific Gas amp Electric All customer classes
Idaho Power Company Residential and small general service
Baltimore Gas amp Electric Residential and small general service
Wisconsin Public Service Corporation All customer classes
National Grid All customer classes
Hawaiian Electric Company All customer classes
Pacific Gas amp Electric
Idaho Power Company
Baltimore Gas amp Electric
Wisconsin Public Service Corporation
National Grid
Hawaiian Electric Company
Table 3
Customer Classes Included in Revenue Regulation Mechanism
Table 4
Costs Excluded From Revenue Regulation Mechanism
project based on historical data or costs over which the util-ity has very little control like fuel costs Although revenue regulation tracks collected revenue mechanisms like Fuel Adjustment Clauses Purchased Power Adjustments and Energy Efficiency Riders can be designed to track actual costs as well as collected revenue
Energy procurement costs
All variable costs
Energy supply costs
Energy costs
Energy supply costs for basic service customers transmission costs the energy efficiency system benefits charge and reconciling charge and costs recovered through the residential assistance adjustment factor
Fuel and purchased power
Decoupling Case Studies Revenue Regulation Implementation in Six States
28
54 We use the RAM term applied in Hawaii here to address any type of attrition or similar mechanism other than a revenue-per-customer framework that changes the allowed revenue between general rate cases
ply costs accounted for in the revenue per customer (RPC) calculation The increased power supply costs to serve that growth will be recovered through the fuel and purchased power tracking mechanism The net effect for the utility will be to recover incremental power supply costs twicemdashonce in the per-customer mechanism and again in the fuel and purchased power mechanism It is essential to make sure that the other adjustment mechanisms do not overlap the cost impacts that are treated in the revenue regulation mechanism One way to do this is to ensure that all power supply costs (investment labor fuel purchased power) are recovered through a single mechanism There are several ways to achieve this
a) A comprehensive power supply recovery mechanism that includes all power supply costs that is separate from the costs treated in the revenue regulation adjustment (eg Puget Sound Energy Washington State)
b) No power supply adjustment whatsoever with all utility costs included in an RPC mechanism (eg National Grid)
c) An annual attrition calculation with all costs reviewed for changes since the last proceeding (eg HECO)
Revenue Adjustment Mechanism in Revenue Regulation
A RAM54 is not necessary to achieve revenue regulation but provides attrition reliefmdashincreasing authorized revenue commensurate with increased costsmdashbetween rate cases Whereas revenue regulation sets a target revenue that the utility will earn regardless of sales levels the RAM adjusts the target revenue between rate cases Regulators may choose to take several different approaches to RAM
bull No RAM Regulators may choose not to implement a RAM leaving the revenue requirement unchanged between rate cases This requires the utility to request a rate case when it requires additional revenue to cover its costs
bull Stairstep Stairstep adjustments provide predetermined increases in target revenue These increases can be determined during a rate case and generally reflect forecasts of cost growth
bull Indexing Indexing ties adjustments to the target revenue to multiple factors like inflation productivity customer growth and changes in capital expenditures
bull RPC The RPC approach is a form of indexing RPC adjusts the total revenue requirement for the
number of customers served Regulators using an RPC mechanism will determine the revenue requirement per customer and the overall revenue requirement will be determined by multiplying the total number of customers by the revenue requirement per customer The amount of revenue required to serve each customer can be determined separately for customer classes and for existing and new customers This way the RPC method accounts for a utilityrsquos growth in fixed costs that is related to growth in the number of customers served RPC is useful where the correlation between cost growth and customer growth is significant It also protects customers from making up the deficit if there is a loss in customer load such as if a large business closes down or relocates
bull Hybrid Hybrid RAMs generally use stairstep increases to account for projected capital costs and indexing to account for OampM expenses
Adjustments from any type of RAM can be implemented automatically or through an attrition proceeding Some stakeholders oppose adjustments to the revenue require-ment outside of a rate case on the basis that this could allow the revenue requirement to increase significantly without examination of the impact on ratepayers or with-out due consideration of other costs and revenues For this reason some regulators choose to cap the total adjustment that can be made to the revenue requirement outside of a rate case
Table 5
Type of Revenue Adjustment Mechanism
Pacific Gas amp Electric
Idaho Power Company
Baltimore Gas amp Electric
Wisconsin Public Service Corporation
National Grid
Hawaiian Electric Company
Hybrid
RPC
RPC
RPC
No RAM potential capital expenditure adjustment
Hybrid
Decoupling Case Studies Revenue Regulation Implementation in Six States
29
55 Because this method results in changes in the price for service that are calculated after that service has been provided it fails the ldquono retroactive ratemakingrdquo statutes that guide most electricity regulators Customers are entitled to know the price of the commodity they are consuming at the time they use it
56 The closest to a current method in use for electric utilities in the BGE system of monthly reconciliation
Table 6
Tracking and Accrual of Difference BetweenActual and Authorized Revenue
Pacific Gas amp Electric
Idaho Power Company
Baltimore Gas amp Electric
Wisconsin Public Service Corporation
National Grid
Hawaiian Electric Company
Track Difference
Monthly
Monthly
Monthly
Yearly
Yearly
Monthly
Accrual Period
Year
Year
Month
Year
Year
Year
Calculation of Actual RevenueRegulators have options when ensuring that actual
revenue equals target revenue under revenue regulation First regulators must decide how to determine ldquoactual revenuerdquo In most cases actual revenue simply equals the amount of revenue a utility collects from its customers The Idaho Public Utilities Commission however has chosen to use weather-normalized revenues as the basis for utility revenues in revenue regulation Although this prevents the utility from recovering revenue lost to it owing to milder than expected weather it further complicates the revenue regulation mechanism and reduces its risk-reduction ben-efits By the same token if weather is severe and increases sales above the revenue requirements weather normaliza-tion would allow the utility to retain some of the revenues
Next regulators must determine whether to implement revenue regulation using a current or accrual method
bull Current Method With the current method of revenue regulation the target revenue for a period say a month is divided by the actual sales in that period to determine the rate per kWh The current method ensures that actual revenue equals target revenue by calculating the rate at the end of the period so that the target revenue can be recovered The current method allows for no lag in revenue recovery One effect of this method is that although customer rates vary total bills are generally more stable For example in a hotter than expected July customers will purchase more kWh but they will be charged a lower rate A milder than average winter would lead to fewer sales but at slightly increased rates This way customers do not experience the same bill variability as they would if rates were set before the sales deviations occurred On the other hand the current method does not provide customers with the ability to plan ahead based on a predictable rate for electricity This method has been used for revenue regulation of natural gas utilities55
bull Accrual Method Under the accrual method rates are set based on an assumed sales level and the differences between actual and target revenue are allowed to accrue over some period Then the total difference between actual and target revenue is reconciled through an adjustment to rates in the subsequent period this is known as the true-up process Presently all revenue regulation mechanisms for electric utilities use the accrual method56
If regulators use the accrual method of revenue
regulation they will next need to determine the period over which the difference between actual and target revenue will be allowed to accrue One year is typical however shorter periods are also used Next the frequency of comparing collected revenue to target revenue should be determined It is possible to do this comparison only once at the end of the accrual period It is common however for comparisons to occur more frequently often monthly When revenues are compared within the accrual period the differences are tracked generally for the purpose of applying interest to the difference that will be deferred until the end of the accrual period
Rate AdjustmentsIn designing a revenue regulation mechanism there are a
number of decision points that regulators need to consider to balance the interests of all the stakeholders One of the decision points revolves around the determination of the mechanism used to adjust rates The issues that regulators need to consider include the following1 Rate Case Requirements One of the often-mentioned
concerns about surcharges especially when they are numerous is how that will impact the frequency of rate cases For regulators and stakeholders rate cases provide
Decoupling Case Studies Revenue Regulation Implementation in Six States
30
the best mechanism to correctly align rates and costs but they are time-consuming and expensive for all parties This is because a rate case presents an opportunity to closely examine all of the utilityrsquos expenses and adjust rates to reflect cost increases and decreases Because under a revenue regulation mechanism the goal is to match revenues received from all customers with revenue requirements a correct determination of revenue requirements is important as is the specification of appropriate cost indices to adjust the revenue requirements As the time between rate cases increases some regulators feel the base rate case data even with adjustments need to be reexamined As a result some regulators have chosen to mandate the frequency of rate cases to address this whereas others have not It may be that in some cases where there are numerous surcharges recovering a multitude of costs there may not be as many costs subject to review in the rate case making it less significant to a regulator than a case in which most costs are being analyzed and recovered in the rate case itself
2 Collection Mechanism Integrally tied to the mechanism for recovering revenues is how the utility will collect or refund the revenues Options that are available include recovery through a rate case or periodic adjustments to rates through a surcharge mechanism As can be seen by the case studies depending on the plan in place some utilities have very discreet requirements dictating the frequency of rate cases with adjustments occurring in those cases or between those cases Other utilities have no requirements upon them with respect to the frequency of rate case filings This will be discussed in more detail below What does emerge from these case studies is that the discreet components or choices in how to execute a revenue regulation plan are carefully interwoven to create a holistic approach Each component works with the other and the value of this case study is in examining the different pathways that can be chosen As discussed previously some of the commissions have authorized revenue regulation to recover the revenue requirements in the last rate case whereas others have authorized adjustments to rates between rate cases this impacts the pathway that the adjustment mechanism takes
3 Timing How often should rates be adjusted to true up to the utilityrsquos revenue requirement States have chosen different options ranging from monthly to annually
4 Allocation of Revenue Regulation Revenue Surpluses or Deficits There are a number of decision points regarding allocation Should the revenue regulation apply to all rate classes or just the smaller customers whose usage per customer and load variations are not as dramatic as those of larger-use customer classes Should there be a different allocation to each rate class or should the allocation of costs among the classes be the same Different mechanisms accomplish different goals Some states have allocated revenue regulation revenues based on the revenues lost by customer class as a result of energy efficiency This can sometimes be a political decision to mitigate opposition to energy efficiency programs by large customers Other states recognize that the system savings resulting from energy efficiency benefit all customers so that all customers should pay equally
5 Carrying Charges Depending on the timing issue discussed previously regulators may want to consider carrying charges on any adjustments This should be symmetrical in its application however so that it applies to surcharges and refunds Consideration should be given for the basis of the carrying charge rate whether weighted average cost of capital rate of return a risk-free rate or some other mechanism should be adopted
6 Rate Caps In order to mitigate potential rate impacts a regulator may want to consider a cap on how much rates can go up when the revenue regulation adjustment is made This might be more critical if the regulator is aware of other potential rate increases that will impact customersrsquo bills If a cap is used the case in which the utilityrsquos adjustment would exceed the cap must be considered Some regulators have opted to allow the utility to carry over the excess unrecovered amount for a period of years whereas others do not This allows the utility to recover those revenues in a subsequent year when perhaps the adjustment is less As a practical matter however adjustments of greater than three percent are less common as shall be discussed later
7 Impact on At-Risk Consumers Low-income and consumer advocates have expressed concern about revenue regulation as a vehicle for annual rate increases without the scrutiny of a general rate case creating rate increases for the low-use customers doing the most to constrain usage and help achieve targeted energy savings One proposal to address this has been to impose any resulting surcharges only to above-average usage
Decoupling Case Studies Revenue Regulation Implementation in Six States
31
57 Cavanagh and Howat (2012 May 2) Finding common ground between consumer and environmental advocates Electricity Policy
58 The most common criticism of future test years is that utilities forecast costs under an assumption that all authorized personnel positions will be filled while in retrospect any large organization has some level of vacancy in its employee count A historic test year captures this effect fully
customers and any resulting credits only to below-average usage57
Rate Case RequirementRequirements as to the frequency of rate cases can be
tied to the recovery mechanism or to the entire regulatory framework for implementing revenue regulation In the cases studied two of the utilities require periodic rate cases PGampE every three years and WPS every year Two others National Grid and HECO require annual mini rate cases explained later in which adjustments are made and two others IPC and BGE have no requirements for scheduled rate cases Nevertheless if the concern is to ensure that the utilityrsquos revenue recovery meets its revenue requirements some kind of periodic rate case to examine costs is appropriate Having periodic rate cases can provide a measure of assurance to consumer advocates that the level at which the revenues and hence the rates are set is correct One of the criticisms of revenue regulation is in fact the lack of rate cases to produce a proper level of confidence in the allowed amounts Multiple surcharges are usually additive to existing rates therefore not permitting an opportunity to reduce the base rate for reductions in cost Moreover the infrequency in cases impedes the examination of rate allocations as would occur through a cost of service study
This is a particular issue where utilities are augmenting power supply with purchased power from independent power producers which is the most common method for acquiring wind and solar production today The increased cost for purchased power may flow through a fuel and purchased power adjustment mechanism while the (depreciating) investment in conventional power plants remains static in base rates
Both PGampE and WPS use a future test year that allows the utility to project revenue requirements during the time period that the rates are to be in effect The benefit to this is that it can help identify and account for projected changes in costs over the timeframe between rate cases However given that these costs are utility projections most consumer advocates have less confidence in these numbers than they would using actual numbers from a historical or only hybrid test year58 When trying to garner support for revenue regulation from more skeptical stakeholders using a future test year may not be helpful Furthermore in the case of WPS that has annual rate cases using a future test year becomes less justifiable as revenues are recalculated annually anyway
The absence of a rate case requirement can also cause consternation among detractors of revenue regulation because of the belief that the utility will be guaranteed its revenue requirements for as long as it is satisfied with that level irrespective of how well it manages However this is no different from the status quo in traditional regulation in most places The incentive to manage well is always there with or without revenue regulation as it translates into more profit for the utility
In the cases of HECO and National Grid the mini rate cases serve two purposes In the one instance it serves as a means to reconcile revenue recovery with revenue requirements and in the second instance it provides an opportunity to adjust rates in accordance with changes in costs Specifically for National Grid the revenue requirement is adjusted to reflect capital expenditures For HECO revenues are adjusted to reflect changes in the cost of service In the two examples here revenue regulation is wrapped in with other adjustments as part of a mini adjustment Given the structure for determining revenue requirements which accounts for changes in costs including revenue regulation within the mini rate cases is a workable option
These examples highlight how rate cases can be used to adjust revenue requirements either in a more controlled regulatory environment with frequent rate cases or left to the utilityrsquos discretion to decide when to adjust costs A set schedule of periodic rate cases such as that used by PGampE may strike an appropriate balance for reviewing revenue requirements however with the modification of a partial historical partial forecasted test year Frequent rate cases can depending on the resources of the regulator and stakeholders be too costly and time-intensive When there are too many rate cases stakeholders and regulators may not be able to dedicate the level of resources needed for any one proceeding and may be spread too thin Regular known rate cases at reasonable intervals may strike the best balance of adequate review and adjustment of revenue requirements
Decoupling Case Studies Revenue Regulation Implementation in Six States
32
Collection Mechanism and TimingThe collection mechanism for the differential between
actual and authorized revenue requirements varies by util-ity as well Both PGampE and WPS do not have adjustment clauses or surcharges but instead have structured their revenue regulation plans to recover their costs in a rate case with rates adjusted annually Although PGampE has rate cases every three years the utility files its preliminary forecast every September 1 for the following year including adjust-ments for revenue regulation and other costs This practice promotes transparency keeping all stakeholders aware of the current situation of the utility IPC BGE National Grid and HECO use surcharges on customer bills to collect or credit the difference between actual revenues collected and the revenue requirement Although the other three (IPC National Grid and HECO) calculate the rate adjustment annually only BGE does a more contemporaneous adjust-ment of one month Certainly where there are no regularly scheduled rate cases using an adjustment mechanism becomes more critical PGampE has created a tracking mecha-nism known as a balancing account that allows the utility to track the surpluses and deficits to help ensure accuracy at year end when rates are actually adjusted The creation of such monthly balancing accounts will make it easier at the end of the year to track what happened each month and then determine the adjustment for that year It provides a more detailed trail for review and analysis by stakeholders and regulators However other mechanisms that just look at total revenues as compared to revenue requirements at the end of the year can work as well
Table 7
Rate Case Requirements
Table 8
Rate Adjustments
Table 9
Allocation of Surplus or Deficit
Pacific Gas amp Electric
Idaho Power Company
Baltimore Gas amp Electric
Wisconsin Public Service Corporation
National Grid
Hawaiian Electric Company
Pacific Gas amp Electric
Idaho Power Company
Baltimore Gas amp Electric
Wisconsin Public Service Corporation
National Grid
Hawaiian Electric Company
Pacific Gas amp Electric
Idaho Power Company
Baltimore Gas amp Electric
Wisconsin Public Service Corporation
National Grid
Hawaiian Electric Company
Every three years annual ldquoattritionrdquo adjustments in between
No requirement
No requirement
Annual rate case
Annual capital expenditure adjustment case
Abbreviated annual rate case
Base rates adjusted annually
Annual adjustment through surcharge
Monthly adjustment through surcharge
Annual adjustment through rate case
Annual adjustment
Annual adjustment
Allocated to all customers according to business unit (eg electric distribution electric generation)
Included in the annual adjustment mechanism for each customer class
Separate for each customer class
Allocated to all customers except certain tariffs (see above)
Separate for each customer class
Separate for residential and commercialindustrial
Allocation of Revenue Regulation Revenue Surpluses or Deficits
The allocation of revenue regulation revenue surpluses or deficits should be symmetrical so that overpayments are credited to customers just as underpayments are paid by those same customers The six utilities studied fol-low that formula The application of revenue regulation however varies from utility to utility BGE and IPC ap-ply revenue regulation to the residential and commercial classes thereby excluding industrial customers In contrast however PGampE WPS National Grid and HECO allocate revenue regulation adjustments to all customer classes In terms of how the costs are allocated IPC BGE WPS National Grid and HECO allocate costs differently among the customer classes PGampE however allocates costs uni-formly among the customers Because PGampE has separated its business units it also separately calculates and allocates
Decoupling Case Studies Revenue Regulation Implementation in Six States
33
Table 10
Carrying Charges
Table 11
Cap on Rate Adjustment
Pacific Gas amp Electric
Idaho Power Company
Baltimore Gas amp Electric
Wisconsin Public Service Corporation
National Grid
Hawaiian Electric CompanyPacific Gas amp Electric
Idaho Power Company
Baltimore Gas amp Electric
Wisconsin Public Service Corporation
National Grid
Hawaiian Electric Company
None
Yes
None
Yes at the short-term debt rate
Yes at the customer deposit rate
Yes at the customer deposit rateNo
3 rate cap excess carried over to next period
10 rate cap excess carried over to next period
Cap of $14 million per year
$170 million in CapEx
No
revenue regulation surpluses and deficits among its electric distribution gas distribution and electric generation busi-nesses This illustrates that there are several ways to address revenues from revenue regulation depending on the policy outcomes that are desired
Carrying ChargesCarrying charges applied to uncollected or surplus rev-
enues can be used to account for the time value of money and the lost opportunity or value to having those revenues in hand PGampE and BGE do not accrue carrying charges On the other hand IPC WPS National Grid and HECO do For BGE given that the revenue regulation revenues are reconciled and recovered monthly it would make little sense to include a carrying cost Where carrying costs have been used they have included in the cases of these utili-ties the short-term debt rate or the customer deposit rate which for one utility is six percent and probably close to the short-term debt rate Thus the carrying charge rates are appropriately at the lower end of the spectrum reflecting their short-term nature In the application of the carrying charge symmetry should be preserved by applying it to both deficits and surpluses Application of carrying charges given the short period that costs are carried (one year) is somewhat discretionary Although it does more accurately account for costs it does add a modest level of complica-tion in tracking costs
Rate Caps and CollarsOne of the ways to protect customers in the event of sig-
nificant adjustments is to impose a rate cap (or collar) that limits the amount of a rate increase (and decrease) Some customers are sensitive to changes in foundational costs like utility bills and if costs are going to rise they benefit from a pattern of steady modest increases rather than a large step increase Any structural increases in rates attributable
to reductions in sales or increases in costs recognized by the revenue regulation plan would be eventually included in rates under any system A cap reflects a controlled way to manage customer expectations and customer impacts Structural changes can only be managed for a while until a complete rate case is needed to reset all assumptions
Typically when a rate cap is imposed if the formulaic increase exceeds the cap or collar the utility will be able to carry over any uncollected revenues until the next rate adjustment Two of the utilities studied PGampE and HECO do not have rate caps On the other hand the other four utilities do include rate caps in varying amounts National Grid has a one-percent revenue cap whereas IPC and BGE have a one-percent and a ten-percent rate cap respectively WPS unlike the others has a cap tied to the dollar amount of $14 million as opposed to a percentage Consistent with the goals of revenue regulation all of the utilities studied have a carryover provision that is important for reducing the risk that the utility will not recover its revenue require-ments
Note that National Grid differs from BGE and HECO in that its cap is on revenues whereas the other two utilities cap rates and rate impacts A revenue cap is more focused on ensuring minimal change to the revenue requirements authorized by the commission National Grid as discussed previously allows for mini rate cases to adjust the rev-enue requirements Having the one-percent cap limits the amount of increase that can occur through that process requiring revenue changes that are greater to occur in a full rate case However note also that some of the adjustments allowed in the mini rate case have their own separate cap The IPC rate cap is in line with what many other utilities with caps have in place which generally range from one to three percent The ten-percent rate cap in the BGE plan is
Decoupling Case Studies Revenue Regulation Implementation in Six States
34
59 Morgan P (2012 December) Graceful Systems LLC A decade of decoupling for US energy utilities rate impacts designs and observa-tions p5
reflective of its monthly adjustment pattern An annual ad-justment allows more time to smooth out peaks and valleys in revenues whereas a monthly adjustment will be influ-enced by more of the spikes (particularly weather-driven variation) thus the need for a larger bandwidth for the car-ryover Like a variable energy rate or fuel adjustment clause that fluctuates monthly the monthly adjustment introduces more volatility into the rates
Actual Historical AdjustmentsFor many ratepayer advocates there is a concern that
some of the utility management risk will be transferred to customers as a consequence of a policy that seeks to ensure that the utility will be made whole However the utility re-tains management risk and the requirement to demonstrate that it has acted prudently Thus the utility still has just as much of an incentive to operate efficiently as it did without revenue regulation If the utility can lower its costs it can still increase its profits Second by designing rates symmet-rically such that under- and over-recoveries are reconciled it provides customers with an opportunity to obtain credits that under traditional regulation would be retained by the utility It has often been opined that when there are large
gaps in time between utility rate cases it is because the utility is over-earning and exceeding its revenue require-ments In those instances customers never get to examine what the utility is collecting much less receive a refund Under revenue regulation with its periodic adjustments and scheduled general rate cases the revenue requirements are examined and refunds or credits allocated such that customers have a better knowledge base for understanding the utilityrsquos earnings And annual reconciliation of the util-ityrsquos actual revenues versus authorized revenues provides consumers with a tool to reign in excess revenue recovery beyond authorized amounts Third the adjustments that do occur under revenue regulation are manageable and frequently less than the adjustments customers are used to seeing on their bills for fuel or variable generation rates or for the myriad of other surcharges that can be tacked on to a customerrsquos bill such as an infrastructure (smart grid) sur-charge maintenance upgrade fee regulatory asset charge or system benefit charge
As seen in Figure 1 the range of rate impacts cluster around plus or minus two percent but can at times exceed plus or minus five percent The total of surcharges has somewhat exceeded the total of credits
Figure 1
Total Utility Decoupling Adjustment Rate Impacts59
300
250
200
150
100
50
0
Nu
mber
of
Dec
oup
lin
g A
dju
stm
ents
Over -5 -4 to -5 -3 to -4 -2 to -3 -1 to -2 0 to -1 0 to 1 1 to 2 2 to 3 3 to 4 4 to 5 Over 5
Percentage Rate Impacts
SurchargesRefunds
ResidentialAll
Other
Commercial
Total
Decoupling Case Studies Revenue Regulation Implementation in Six States
35
60 Id p 3
61 Schultz T Energy Efficiency at Idaho Power Available at httpwwwenergyidahogovenergyalliancedida_powerpdf
As can be seen with the utilities studied above the larger fluctuations are attributable to adjustment mechanisms that are reconciled more frequently such as monthly as those are less able to smooth out anomalies as an annual adjust-ment would do From a dollar perspective for the roughly 64 percent of adjustments that fall within the plus or minus two-percent range the monthly bill impact is approxi-mately $230 for average electric customers and $140 for average gas customers60
Of the six utilities studied the fluctuations in adjustment have for the most part stayed within the one- to three-per-cent range as shown below
bull PGampE from 2005 to 2012 has had annual revenue regulation adjustments ranging from minus143 percent to 415 percent with an average adjustment of 197 percent
bull For IPC the adjustments are separated between residential and commercial customers For residential customers the annual adjustments from 2007 through 2011 ranged from 077 percent to 258 percent for an average of 162 percent As for the commercial customers the annual adjustments for that same period were higher ranging from 104 percent to 424 percent with an average adjustment of 252 percent
bull BGE has monthly adjustments that ranged from minus1853 percent to 3013 percent with an average of 057 percent for residential customers from March 2008 through August 2012 For General Service Customers the monthly adjustment ranged from minus2264 percent to 2462 percent The average adjustment was 1308 percent
bull For WPS the annual adjustments from 2009 through 2011 ranged from minus145 percent to 378 percent for residential and small commercial and from minus314 percent to 899 percent for commercial Note that because of a $14 million per year cap some of these percentages were carried over The average annual adjustment for residential and small commercial and for commercial was 163 percent and 215 percent respectively with carry-overs to subsequent years
bull For Massachusetts Electric and Nantucket Electric both of which operate under National Grid the annual revenue regulation adjustment for all for 2011 and 2012 was minus0105 percent and 0315 percent for an average revenue regulation adjustment over the two years of 0105 percent
bull HECO like National Grid has one annual revenue
regulation mechanism for its customers which resulted in adjustments in 2011 and 2012 of 063 percent and 107 percent respectively for an average adjustment of 085 percent
As can be gleaned from the above information the range of average adjustments for small use customers was a low of 0105 percent for National Grid to a high of 197 percent for PGampE For larger use customers the range was a low of 0105 percent for National Grid to a high of 252 percent for IPC This demonstrates that on average for these utilities with well-developed and diversely designed revenue regula-tion proposals their adjustments on average stayed at or below approximately 25 percent
One of the metrics for determining if a revenue regula-tion program is working successfully that was discussed above was the impact on rates of a revenue regulation mechanism As can be seen by the analysis of the adjust-ment levels for each of the utilities they are within a rea-sonable range
Complementary Policies Although a revenue regulation mechanism does not need
to be accompanied by other policies energy efficiency is frequently at the root of the reason revenue regulation was proposed in the first place The states examined in this pa-per have various obligations for energy efficiency achieve-ment placed upon their utilities Only Idaho does not have an Energy Efficiency Resource Standard but energy efficiency objectives are developed through an integrated resource plan process Energy efficiency spending at IPC has increased dramatically in recent years61
In recognition of the fact that revenue regulation only removes the disincentive to pursue energy efficiency several states have instituted some form of incentives to reward the desired outcome This mechanism can not only incentivize management to aggressively pursue energy efficiency but also make shareholders supportive in the face of lost invest-ment opportunity
Rate design can also play an important part in assist-ing the utility in achieving favorable energy efficiency outcomes Inclining block rates penalize inefficient use of electricity and shorten payback times from the customer perspective Because efficiency reduces consumption at
Decoupling Case Studies Revenue Regulation Implementation in Six States
36
62 Optional rate designs for PGampE include TOU and Peak Time Pricing
63 IPC also has an optional TOU rate design
64 Optional rate designs for this utility include TOU Critical Peak Pricing and Contract
65 National Grid also offers optional TOU and flat rate designs
66 HECO also offers optional TOU and flat rate designs
67 See eg Alexander B (1996 April) How to construct a service quality index in performance-based ratemaking Electricity Policy
the tail block rate the value of kWh savings is greater than with flat rates On the other side of the spectrum declining block rates which have a reduced rate in the tail block do little to encourage conservation In fact they operate more like a discounted bulk rate by reducing the average cost of a kWh in a customerrsquos bill for the more kWh used
Performance incentives or other ways to avoid destruc-tive cost-cutting in the name of creating margins that reduce service or reliability or lessen customer value have been implemented only in Massachusetts of the six utilities illustrated here Several other states have implemented vari-ous schemes in reaction to perceived deficiencies in utility service67 Performance incentives are not unique to rev-enue regulation Commissions wishing to implement such a scheme can find many models of incentive reward and penalty mechanisms developed for other purposes
Taken together a suite of policy and program features can create an atmosphere that is conducive to achievement of energy efficiency goals within the utility and for the customers By appropriate application of these techniques regulators working with utilities and stakeholders can remove barriers and create an opportunity for energy ef-ficiency to be fully integrated into the utility supply option portfolio
Energy Efficiency OutcomesAlthough revenue regulation itself does not create an
incentive for a utility to implement energy efficiency it does address the issue of lost revenues associated with energy
Table 12
Complementary Policies for Energy Efficiency
Pacific Gas amp Electric62
Idaho Power Company63
Baltimore Gas amp Electric
Wisconsin Public Service Corporation64
National Grid65
Hawaiian Electric Company66
Energy Efficiency Requirement
1 annually
IRP
10 by 2015
075 annually
24 annually
Energy efficiency can satisfy portion of RPS
Default Residential Rate Design
Inclining block
Inclining block
TOU seasonal
Flat
Inclining block
Inclining block
Incentive Structure
Risk reward incentive mechanism
No
No
No
5 of program costs
Third-party administrator paid for contract performance
Performance Incentives
Reliability reporting only
None
Under consideration
Reliability reporting only
Service quality reward and penalty
Under consideration
efficiency and DG programs Revenue regulation should be combined with other mechanisms that require or incentiv-ize the implementation of energy efficiency by the utility or a third party The level of energy efficiency achieved can be one measure of the success of a revenue regulation mechanism as implemented in a larger program designed to achieve energy efficiency Table 13 shows the incremental annual energy efficiency savings reported by each utility with the shaded box indicating the year that the utilityrsquos revenue regulation mechanism was implemented National Grid had achieved a high level of energy efficiency savings in the years before it implemented revenue regulation
This paper has not evaluated DG outcomes to correlate with revenue regulation as it is not perceived that states and utilities have made that connection expressly in histori-cal mechanisms However it is expected that this connec-
Decoupling Case Studies Revenue Regulation Implementation in Six States
37
68 EIA Form EIA-861 data files Available at httpwwweiagovelectricitydataeia861
69 PGampE began revenue regulation in 1974 and it was later suspended and recommenced in 2001
70 WPS savings are represented by the statewide program savings from the Focus on Energy program WPS provided additional funds to Focus on Energy starting in CY10 through their territory-wide program activities
71 In 2009 Hawaii Energy a ratepayer-funded statewide energy efficiency provider began delivering services Savings reported after 2009 represent savings achieved through the programs of Hawaii Energy
Table 13
Annual Incremental Energy Efficiency Savings as Percentage of Retail Sales68
Highlighted cells are the year that utility started decoupling
Pacific Gas amp Electric69
Idaho Power Company
Baltimore Gas amp Electric
Wisconsin Public Service Corporation70
National Grid
Hawaiian Electric Company71
2004
11
01
00
03
11
00
2005
16
03
00
03
09
05
2006
10
05
00
03
12
05
2010
19
13
17
09
136
12
tion will be made in future mechanisms and furthermore it is anticipated that follow on work to this paper will want to study that connection between revenue regulation and DG performance
Conclusions
An increasing number of states are looking to increase the rate of energy efficiency investments for their long-run cost and risk advantages The benefits of energy efficiency include not only its ability to reduce system costs across the distribution transmission and generation functions but also the opportunity for customers to reduce their individ-ual energy costs for their own electric bills Nevertheless it is counterintuitive to encourage or order a utility to sell less of its product In order to encourage the proliferation of en-ergy efficiency programs as a solution that can contribute to this nationrsquos energy needs this tension between the goals of society versus the goals of the utility needs to be addressed Revenue regulation can be such a solution by removing the link between sales and revenues
There are many ways to implement revenue regulation and multiple decision points that regulators must consider in designing a revenue regulation mechanism This paper focused on six utilities each of which implemented revenue regulation in different ways in accordance with the objectives of that state Different decision points discussed include
bull Should revenue regulation apply to all functions (generation transmission and distribution) which sometimes depends on if the utility is regulated or restructured
bull Should revenue regulation apply to all customer classes
bull Should there be symmetry such that a reconciliation adjustment occurs for both over- and under-recoveries of the revenue requirements
bull Should recovery of indicated surcharges be conditioned on acceptable performance on customer service quality or energy efficiency goals
bull Should there be an attrition adjustment to account for other expenses or should the revenue regulation adjustment be limited to reconciling existing revenue requirements
bull Should there be an inflation adjustmentbull To calculate the revenue requirements should the
current or accrual method be usedbull Should the adjustments be made in rate cases or
through a riderbull How frequently should adjustments be made
monthly annually or some other time periodbull Depending on the period of time between true up and
recovery should there be carrying charges and if so how should they be calculated
2007
21
06
00
03
09
04
2008
35
10
05
09
05
05
2009
20
11
06
10
11
11
Decoupling Case Studies Revenue Regulation Implementation in Six States
38
72 Avista Utilities (2009) Washington Utilities and Transportation Commission Docket UE-090134
bull Should there be a requirement authorizing the frequency of rate case
bull Should there be an annual cap on the amount of the adjustment and if so should there be an opportunity to carry over any additional amounts and for how many years
bull Should there be an adjustment to the cost of capital to reflect the reduced risk
Other considerations for regulators whether or not they implement revenue regulation but certainly as part of a comprehensive package are other measures that can be put in place to encourage consumers and utilities alike to actively participate in energy efficiency For example an inclining block rate structure by virtue of its incentive to consume less pairs well with an energy efficiency program helps drive consumers to participate in efficiency programs and accelerates the payback of an energy efficiency investment By the same token an incentive payment to the utility helps provide its management with a good reason to excel and exceed targets for energy efficiency programs
A key point illustrated by the list of considerations above is that there is not just one static way to design and implement revenue regulation but rather there are a variety of options for doing so In this study a diverse group of utilities were reviewed The differences among the utilities included geographic diversity vertically integrated and restructured utilities different levels of energy efficiency in place and certainly differences in how the revenue regulation mechanisms were implemented No two utilities were alike and no two utilities had the same revenue regulation mechanism The key is that revenue regulation should eliminate the throughput incentive but the means for accomplishing this goal can vary and be tailored to each jurisdiction and each utility and still be successful
There are several considerations in the design of a revenue regulation mechanism that can help ensure its successful adoption To begin revenue regulation should be granted to utilities only as a precondition to implementing comprehensive energy efficiency andor DG policies Unless accompanied by a commitment to engage in providing least-cost resource options that could impact sales there is not really any good policy reason for its adoption All of the utilities studied are actively engaging in energy efficiency Furthermore as a matter of fairness the revenue regulation mechanism should be symmetrical so that any revenues above those authorized are refunded back to consumers As Figure 1 demonstrates although there are more surcharges to customers there is nevertheless a healthy amount of
credits back to consumers This is the bargain Barring imprudence or other unforeseen circumstances the utility receives its authorized revenue requirements and nothing more or less under a simple revenue regulation mechanism
Rate design plays an important role in the effectiveness of energy efficiency in concert with revenue regulation A low customer charge is preferable so that the customer can benefit from real bill reductions tied to reduced volumetric consumption Reductions in consumption not only reduce bills but also positively impact the payback period for investments in energy efficient appliances Declining block rates in which the tail block rate is lower than the first tier also do not encourage conservation Inclining block rates that reward low usage in the first block with a lower rate send the better price signals None of the six utilities studied had declining block residential rates They were inclining flat and time-varying
The revenue adjustment mechanism is also a critical decision point in terms of whether a revenue per customer mechanism is adopted that accounts for only the current revenue requirements or whether latitude is given to include an inflation adjustment or other cost increases in the revenue adjustment mechanism Three of the utilities studied adopted this approach whereas another two used a hybrid approach Finally to reduce volatility five of the six utilities opted for annual rather than monthly adjustments thereby creating a level of rate stability that customers in general prefer
Once the goals for revenue regulation are set by the regulators the next step is to design programs that will implement that goal For energy efficiency to be as successful as possible regulators may want to adopt a complement of other policies to accompany revenue regulation These can include rate designs that reward reduced use and conservation as well as incentive payments to utilities that reward them for meeting or exceeding targets Of the six utilities studied three have adopted some form of incentive One simple approach that was used in Washington was to link recovery of any surcharges under the revenue regulation mechanism to achievement of energy efficiency targets72
For the utilities examined above that have implemented revenue regulation the evidence demonstrates that revenue regulation as a strategy and a mechanism to enable
Decoupling Case Studies Revenue Regulation Implementation in Six States
39
energy efficiency has been working well The fact that each revenue regulation mechanism varies from the next demonstrates that there are many different paths that can be followed in implementing revenue regulation based on the needs of the utility and its stakeholders in a particular
region This study demonstrates that revenue regulation does work and provides examples of how it can be implemented each one different and unique because of the number of decision points to be considered in designing a revenue regulation mechanism
Decoupling Case Studies Revenue Regulation Implementation in Six States
40
Appendix
Historic Rate Adjustments
Table 14
PGampE Revenue Regulation Rate Adjustments 1983 to 199373
Table 15
PGampE Revenue Regulation Adjustments 2005 to 201274
Table 16
IPC Revenue Regulation Adjustments76
Idaho Power Company
1983 23
1984 (34)
1985 (48)
1986 19
1987 21
1988 50
1989 (43)
1990 (54)
1991 39
1992 34
1993 00
2005 8925 minus12773 minus143
2006 9933 2246 226
2007 10409 21727 209
2008 10261 4032 039
2009 11169 10355 093
2010 11224 46556 415
2011 10306 38390 373
2012 11032 40304 365
2007 Residential minus00457 590 minus077
Commercial minus00457 428 minus107
2008 Residential 00529 670 090
Commercial 00529 510 104
2009 Residential 01220 770 158
Commercial 01535 603 255
2010 Residential 01800 785 229
Commercial 02273 613 371
2011 Residential 02028 785 258
Commercial 02597 613 424
Revenue Regulation Adjustment as of
Total Rates
Delivery Revenue
Requirement ($ millions)
Adjustment Rate
Revenue Regulation Adjustment($ millions)
Retail Rate
of Delivery Revenue
Revenue Regulation Adjustment
Year
Year
73 Lesh P (2009 June 30) Rate impacts and key design elements of gas and electric utility decoupling
74 Morgan P (2012 November) A decade of decoupling for US energy utilities rate impacts designs and observations
75 Morgan P (2012 November) A decade of decoupling for US energy utilities rate impacts designs and observations
76 All numbers provided by the utility
Decoupling Case Studies Revenue Regulation Implementation in Six States
41
77 Idaho Power Company Case No IPC-E-11-19- fixed cost adjustment permanent mechanism Available at httpwwwpucidahogovinternetcaseselecIPCIPCE1119company20120928COMPLIANCE20FILINGPDF
Figure 2
IPC Revenue Regulation Adjustments77
Residential FCA Balance and Use per Customer
$10000000
$8000000
$6000000
$4000000
$2000000
$0
-$2000000
-$4000000
-$6000000
1080
1070
1060
1050
1040
1030
1020
1010
1000Res
idu
al A
uth
oriz
ed F
CA
Am
oun
t
Residual Authorized FCA Amount ($)
Monthly Use Per Customer (kWh)
kW
h U
sed
2006 2007 2008 2009 2010 2011
78 Morgan P (2012 November) A decade of decoupling for US energy utilities rate impacts designs and observations
Decoupling Case Studies Revenue Regulation Implementation in Six States
42
Table 17a
Baltimore Gas and ElectricBGE Monthly Revenue Regulation Adjustments 2008 to 201278
Table 17b
Baltimore Gas and ElectricBGE Monthly Revenue Regulation Adjustments 2008 to 201278
March Residential 000172 01477 1165General Service 000230 01526 1507
April Residential 000016 01477 0108General Service 000146 01526 0957
May Residential 000066 01477 0447General Service 000230 01526 1507
June Residential minus000066 01477 minus0447General Service 000230 01526 1507
July Residential 000158 01477 1070General Service 000230 01526 1507
August Residential minus000040 01477 minus0271General Service 000214 01526 1402
September Residential 000237 01477 1605General Service 000230 01526 1507
October Residential 000237 01477 1605General Service 000143 01526 0937
November Residential 000237 01477 1605General Service 000140 01526 0917
December Residential 000445 01477 3013General Service 000230 01526 1507
January Residential 000035 01579 0222General Service minus000073 01346 minus0542
February Residential 000025 01579 0158General Service 000230 01346 1709
March Residential minus000237 01579 minus1501General Service 000230 01346 1709
April Residential minus000237 01579 minus1501General Service 000230 01346 1709
May Residential 000234 01579 1482General Service 000132 01346 0981
June Residential 000237 01579 1501General Service 000230 01346 1709
July Residential 000237 01579 1501General Service 000230 01346 1709
August Residential 000237 01579 1501General Service 000190 01346 1412
September Residential 000237 01579 1501General Service 000230 01346 1709
October Residential 000237 01579 1501General Service 000124 01346 0921
November Residential 000237 01579 1501General Service 000230 01346 1709
December Residential 000156 01579 0988General Service 000204 01346 1516
Adjustment $kWh
Adjustment $kWh2008 2009
Retail Rate
$kWh
Retail Rate
$kWhAdjustment
Adjustment
Decoupling Case Studies Revenue Regulation Implementation in Six States
43
Table 17c
Baltimore Gas and ElectricBGE Monthly Revenue Regulation Adjustments 2008 to 201278
Table 17d
Baltimore Gas and ElectricBGE Monthly Revenue Regulation Adjustments 2008 to 201278
January Residential 000203 01465 1386General Service 000230 01261 1824
February Residential minus000142 01465 minus0969General Service 000230 01261 1824
March Residential minus000237 01465 minus1618General Service 000230 01261 1824
April Residential minus000237 01465 minus1618General Service 000230 01261 1824
May Residential 000192 01465 1311General Service 000230 01261 1824
June Residential 000191 01465 1304General Service 000230 01261 1824
July Residential 000095 01465 0648General Service 000230 01261 1824
August Residential minus000176 01465 minus1201General Service 000224 01261 1776
September Residential minus000237 01465 minus1618General Service 000116 01261 0920
October Residential minus000237 01465 minus1618General Service 000081 01261 0642
November Residential minus000237 01465 minus1618General Service 000098 01261 0777
December Residential minus000079 01465 minus0539General Service 000229 01261 1816
January Residential minus000130 01365 minus0952General Service 000230 01156 1990
February Residential minus000253 01365 minus1853General Service minus000020 01156 minus0173
March Residential minus000018 01365 minus0132General Service minus000063 01156 minus0545
April Residential 000110 01365 0806General Service minus000262 01156 minus2266
May Residential 000010 01365 0073General Service minus000160 01156 minus1384
June Residential 000226 01365 1656General Service 000042 01156 0363
July Residential 000253 01365 1853General Service 000209 01156 1808
August Residential minus000007 01365 minus0051General Service minus000157 01156 minus1358
September Residential minus000253 01365 minus1853General Service minus000177 01156 minus1531
October Residential 000228 01365 1670General Service 000262 01156 2266
November Residential minus000059 01365 minus0432General Service 000262 01156 2266
December Residential 000071 01365 0520General Service 000262 01156 2266
Adjustment $kWh
Adjustment $kWh2010 2011
Retail Rate
$kWh
Retail Rate
$kWhAdjustment
Adjustment
Decoupling Case Studies Revenue Regulation Implementation in Six States
44
Table 17e
Baltimore Gas and ElectricBGE Monthly Revenue Regulation Adjustments 2008 to 201278
January Residential 000253 01291 1960General Service 000262 01064 2462
February Residential 000253 01291 1960General Service 000262 01064 2462
March Residential 000253 01291 1960General Service 000262 01064 2462
April Residential 000253 01291 1960General Service 000262 01064 2462
May Residential 000253 01291 1960General Service 000262 01064 2462
June Residential 000253 01291 1960General Service 000262 01064 2462
July Residential 000253 01291 1960General Service 000262 01064 2462
August Residential 000253 01291 1960General Service 000160 01064 1504
Adjustment $kWh2012
Retail Rate
$kWhAdjustment
Decoupling Case Studies Revenue Regulation Implementation in Six States
45
79 Morgan P (2012 November) A decade of decoupling for US energy utilities rate impacts designs and observations
80 Morgan P (2012 November) A decade of decoupling for US energy utilities rate impacts designs and observations
Table 18
Wisconsin Public Service Corporation Revenue Regulation Adjustments 2009 to 201179
2009 ResidentialSmall Commercial 00048705 000168154 01290 378 130Commercial 00084951 000293293 00945 899 310
2010 ResidentialSmall Commercial 00033043 000166936 01291 256 129Commercial 00056630 000286103 09460 060 030
2011 ResidentialSmall Commercial (00018666) $ (000163719) 01288 minus145 minus127Commercial (00032565) $ (000285629) 01037 minus314 minus275
Derived Adjustment
$kWh
Derived Adjustment Capped $
kWh
Retail Rate
$kWh
Revenue Regulation Actual
Revenue Regulation Capped
Table 19
National Grid Revenue Regulation Adjustments 2011-201276
Massachusetts Electric and Nantucket Electric
Table 20
Hawaiian Electric Company
2011 All minus0015 1429 minus0105
2012 All 0044 1396 0315
2011 01995 3149 063
2012 03894 3641 107
Revenue Regulation Adjustment
centkWh
Revenue Regulation Adjustment
centkWhRetail Rate
centkWh
Retail Rate
Revenue Regulation Adjustment
Revenue Regulation
ldquoThe 2011 adjustment took effect June 1 but was reduced to $0 on July 26 2011 when the Commission granted HECO an interim rate increase of $532 million in a 2011 test year general rate case The 2012 Adjustment runs from June 1 2012 through May 31 2013 About 25 of the total relates to the portion of the decoupling mechanism that updates OampM and rate baserdquo (Morgan 2013)
Decoupling Case Studies Revenue Regulation Implementation in Six States
46
Revenue Regulation and Decoupling A Guide to Theory and Applicationhttpwwwraponlineorgdocumentdownloadid902
This guide was prepared to assist anyone who needs to understand both the mechanics of a regulatory tool known as decoupling and the policy issues associated with its use This would include public utility commissioners and staff utility management advocates and others with a stake in the regulated energy system While this guide is somewhat technical at points we have tried to make it accessible to a broad audience to make comprehensible the underlying concepts and the implications of different design choices This guide includes a detailed case study that demonstrates the impacts of decoupling using different pricing structures (rate designs) and usage patterns
Pricing Dorsquos and Donrsquots Designing Retail Rates as if Efficiency Countshttpwwwraponlineorgdocumentdownloadid939
Rate design is a crucial element of an overall regulatory strategy that fosters energy efficiency and sends appropriate signals about efficient system investment and operations Rate design is also fully under the control of state regulators Progressive rate design elements can guide consumers to participate in energy efficiency programs and reduce peak demand yet relatively few utilities and commissions have implemented many of these elements This RAP paper identifies some best practices Because pricing issues tie closely to utility growth incentives we also address revenue decoupling
A Decade of Decoupling for US Energy Utilities Rate Impacts Designs and Observationshttpwwwraponlineorgdocumentdownloadid6356
This report written by Pamela Morgan of Graceful Systems LLC builds on a 2009 report Now covering 25 states including 49 LDCs and 24 electric utilities this report summarizes the decoupling mechanism designs these utilities use and the rate adjustments they have made under those mechanisms In total this report estimates the retail rate impacts of 1244 decoupling mechanism adjustments since 2005
Additional Resources
The Role of Decoupling Where Energy Efficiency is Required by Lawhttpwwwraponlineorgdocumentdownloadid275
This Issuesletter gives an overview of energy efficiency resource standards the need to decouple utility profits from utility sales and explains why decoupling is needed even where a third party administers energy efficiency programs
Revenue Decoupling Standards and Criteria A Report to the Minnesota Public Utilities Commissionhttpwwwraponlineorgdocumentdownloadid850
In 2007 the Minnesota legislature enacted a new statute Section 216B2412 in which it defined an alternative approach to utility regulation decoupling and directed the Public Utilities Commission (PUC) to ldquoestablish criteria and standardsrdquo by which decoupling could be adopted for the statersquos rate-regulated utilitiesTo fulfill its obligation to develop criteria and standards for decoupling the PUC sought the advice of the Regulatory Assistance Project (RAP) This report is the output of that collaboration
Designing Distributed Generation Tariffs Wellhttpwwwraponlineorgdocumentdownloadid6898
Improvements in distributed generation economics increasing consumer preference for clean distributed energy resources and a favorable policy environment in many states have combined to produce significant increases in distributed generation adoption in the United States Regulators are looking for the well-designed tariff that compensates distributed generation adopters fairly for the value they provide to the electric system compensates the utility fairly for the grid services it provides and charges non-participating consumers fairly for the value of the services they receive This paper offers regulatory options for dealing with distributed generation The authors outline current tariffs and ponder what regulators should consider as they weigh the benefits costs and net value to distributed generation adopters non-adopters the utility and society as a whole The paper highlights the importance of deciding upon a valuation methodology so that the presence or absence of cross-subsidies can be determined Finally the paper offers rate design and ratemaking options for regulators to consider and includes recommendations for fairly implementing tariffs and ratemaking treatments to promote the public interest and ensure fair compensation
Decoupling Case Studies Revenue Regulation Implementation in Six States
47
The Regulatory Assistance Project (RAP)trade is a global non-profit team of experts focused on thelong-term economic and environmental sustainability of the power sector We provide technical and policy assistance on regulatory and market policies that promote economic efficiency environmental protection system reliability and the fair allocation of system benefits among consumers We work extensively in the US China the European Union and India Visit our website at wwwraponlineorg to learn more about our work
Rate Design Where Advanced Metering Infrastructure Has Not Been Fully Deployedhttpwwwraponlineorgdocumentdownloadid6516
This paper identifies sound practices in rate design applied around the globe using conventional metering technology Rate design for most residential and small commercial customers (mass market consumers) is most often reflected in a simple monthly access charge and a per-kWh usage rate in one or more blocks and one or more seasons A central theme across the practices highlighted in this paper is that of sending effective pricing signals through the usage-sensitive components of rates in a way that reflects the character of underlying long-run costs associated with production and usage While new technology is enabling innovations in rate design that carry some promise of better capturing opportunities for more responsive load the majority of the worldrsquos electricity usage is expected to remain under conventional pricing at least through the end of the decade and much longer in some areas Experience to date has shown that the traditional approaches to rate design persist well after the enabling technology is in place that leads to change
Time-Varying and Dynamic Rate Designhttpwwwraponlineorgdocumentdownloadid5131
This report discusses important issues in the design and deployment of time-varying rates The term time-varying rates is used in this report as encompassing traditional time-of-use rates (such as time-of-day rates and seasonal rates) as well as newer dynamic pricing rates (such as critical peak pricing and real time pricing) The discussion is primarily focused on residential customers and small commercial customers who are collectively referred to as the mass market The report also summarizes international experience with time-varying rate offerings
50 State Street Suite 3Montpelier Vermont 05602802-223-8199wwwraponlineorg
- Table of Contents
- Introduction
- California Pacific Gas and Electric Company
- Idaho Idaho Power Company
- Maryland Baltimore Gas and Electric
- Wisconsin Wisconsin Public Service Corporation
- Massachusetts National Grid
- Hawaii Hawaiian Electric Company
- Discussion of the Six Utilities Overall
- Conclusions
- Appendix
- Additional Resources
-

Decoupling Case Studies Revenue Regulation Implementation in Six States
14
Baltimore Gas and Electricrsquos (BGE) revenue regulation mechanism compares actual distribution revenue to the authorized revenue adjusted for the number of customers for each applicable rate schedule The
authorized revenue including the cost of power is based on test year requirements and sales levels Over- or under-collec-tions are reconciled monthly through a rider This mechanism differs from the others we describe by having a monthly rather than annual deferral and recovery period
AuthorityBGE requested a revenue regulation mechanism in 2007
due to the expected impact on electricity sales of the com-panyrsquos conservation and demand response programs BGE stated that the revenue regulation mechanism was neces-sary to eliminate the inherent disincentive in the traditional ratemaking process with respect to conservation and demand response Under traditional ratemaking BGE pointed out that ldquoa one percent reduction in electricity use and demand on the Companyrsquos system for the residential and small com-mercial classes would cut cost recovery by approximately $4 million This first year impact on recovery is then followed by $8 million in the second year (as an equal amount of sav-ings is added) and so on the five-year loss to shareholders from this steady-state utility investment program would be more than $20 millionrdquo19 The revenue regulation mechanism proposed by BGE was based on its gas revenue regulation mechanism which has been in place since 1998
Authorized Revenue RequirementBGE initially calculated its revenue requirement per class
separately for each rate scale based on weather-normalized 2007 sales and the number of customers Because BGE pro-posed the mechanism in 2007 the test year 2007 included nine months of actual sales and three months of forecasted sales BGE used three steps to calculate the base monthly revenue requirement
1 Calculate the Customer Charge revenues by multiplying the number of customers by the
Maryland Baltimore Gas and Electric
Customer Charge for each class2 Calculate the Delivery Service revenues by
multiplying the weather-normalized sales by the Delivery Price for each class
3 Add the Customer Charge revenues and the Delivery Service revenues to determine the base revenue requirements for each class
BGErsquos residential small general service and general service customers are included in the revenue regulation mechanism
Rate of ReturnBGE was allowed a return on common equity of 975
percent applied to a common equity ratio of 5105 per-cent in its most recent rate case BGE strongly opposed the reduction of its ROE and preferred another lost revenue mechanism over revenue regulation if an ROE reduction was implemented as a result of revenue regulation
The Public Service Commission (PSC) made no adjust-ment to BGErsquos ROE when revenue regulation was first implemented in 2007 but did reduce its allowed ROE by 50 basis points in the last rate case The Commission had previously reduced the ROE of another utility by 50 basis points when it adopted a similar revenue regulation mecha-nism for that utility20 21
Revenue Adjustment MechanismOn a monthly basis the adjustment to base revenue
requirement is calculated for each rate class using the following steps
19 BGE (2007 October 26) 9111FilingConser-va102607F Available at httpwebapppscstatemdusintranetmaillogcontentcfmfilepath=C5CCasenum5CAdmin20Filings5C60000-1099995C1080615C9111FilingConserva102607Fpdf
20 Potomac Electric Power Company
21 BGErsquos gas mechanism was approved in a 1998 settlement that did not discuss any adjustment to ROE
Decoupling Case Studies Revenue Regulation Implementation in Six States
15
1 Calculate the revenue adjustment for the change in the number of customers by multiplying the change in the number of customers by the Customer Charge
2 Calculate the revenue adjustment associated with the change in sales by multiplying the change in the number of customers by the average use per customer and multiplying that product by the Delivery Price for the class
3 Calculate the target base revenues for each class for the current period by adding the two types of adjustments to the revenue requirement
The Delivery Price for each class is the delivery rate established by the PSC adjusted for the electric universal service charge nuclear decommissioning credits and the administrative credit associated with the administrative adder portion of the Standard Offer Service rates22
BGE had a full electric and gas rate case in 201023 and another one filed in 2013 and concluded in 201424 Both reset the required decoupling elementsmdashmonthly revenue requirement monthly average usage per customer and number of customers Neither case changed the mechanism
The decoupling mechanism now excludes lost sales resulting from major storms
Reconciling Actual Revenue With Authorized Revenue
On a monthly basis each rate classrsquos target base revenues are compared to the actual base revenues for the month The difference is divided by the forecasted sales for the following period to calculate the monthly rate adjustment Balancing accounts are used to record the timing differ-ences associated with when the adjustments are calculated versus when they are billed or refunded The monthly rate adjustment Rider 25 is capped at ten percent of rates Any amount beyond ten percent of the current rate will be car-ried over and reconciled in the subsequent period
Complementary PoliciesMaryland requires its electric utilities to provide energy
efficiency services to achieve a ten-percent reduction in per capita electricity use by 2015 The statersquos overall goal is a 15 percent reduction of per capita electricity use by 2015 Although the PSC is explicitly allowed to approve financial incentive mechanisms to promote energy efficiency no incentives have been approved yet25
BGErsquos default service to its standard offer residential cus-tomers (those customers who have not elected to take gen-eration service from an alternate supplier) features seasonal
ratesmdashsummer and winter BGE also offers a TOU rate as an option to standard offer residential customers and as the default rate for small general service customers
Regarding performance incentives under revenue regula-tion in October 2012 Maryland issued a four-part plan designed to speed up investments that will strengthen the statersquos distribution grid Part of that plan would set a rate-making structure that aligns customer and utility incentives by rewarding reliability that exceeds established reliability metrics and penalizing failure to reach those metrics A task force has encouraged the Maryland state regulatory com-mission to implement a performance-based ratemaking process for IOUs such as BGE linking a utilityrsquos progress or failure to meet certain reliability metrics with its authorized rate of return
Energy Efficiency OutcomesWhen BGE implemented electric revenue regulation in
mid 2007 it had not achieved incremental energy savings for several years In 2008 it reported incremental savings of 05 percent of retail load increasing to 17 percent in 2010 and 2011
ResourcesMaryland Public Service CommissionLetter Order ML 108061 (December 27 2007)Letter Orders ML 108069 (November 30 2007) Case No 9036 Order No 80460 (December 21 2005) Case No 9230 Order No 83907 (December 13 2013) Case No 9326 Order No 86060 (December 13 2013)
22 BGE (2007 October 26) 9111FilingConser-va102607F Available at httpwebapppscstatemdusintranetmaillogcontentcfmfilepath=C5CCasenum5CAdmin20Filings5C60000-1099995C1080615C9111FilingConserva102607Fpdf
23 Case No 9230 ndash See references above
24 Case No 9326 ndash See references above
25 ACEEE Maryland Available at httpaceeeorgsectorstate-policymarylandEnergy Efficiency Resource Standards
26 EIA Form EIA-861 data files Available at httpwwweiagovelectricitydataeia861
Decoupling Case Studies Revenue Regulation Implementation in Six States
16
27 The pilot extension is in effect until the effective date of a Final Decision issued by the Commission on an application for a general base rate case filed after January 1 2013
28 Except the Direct Load Control Cp - Large Commercial amp Industrial Service Cp-ND - Pilot Large Commercial amp Industrial - Day Ahead Cp-RR - Large Commercial amp Industrial Response Rewards Automatic Transfer Switch Parallel Generation Lighting Nature Wise and Real Time Market Pricing tariffs
Wisconsin Wisconsin Public Service Corporation
Wisconsin Public Service Corporationrsquos (WPS) Revenue Stabilization Mechanism (RSM) began in 2009 as a four-year revenue regulation pilot that reconciled
target marginal revenue per customer with actual marginal revenue per customer As of 2012 the pilot was extended27 albeit with some modifications This section focuses on the current iteration of the RSM
AuthorityThe Public Service Commission of Wisconsin (PSCW)
approved a revenue regulation pilot for WPS in a Decem-ber 2008 rate case order (Docket No 6690-UR-119) The revenue regulation mechanism was effective from January 1 2009 through December 31 2012 and applied to the util-ityrsquos electric and gas operations In a rate case completed in December 2012 (Docket No 6690-UR-121) the pilot was extended and a modified RSM was approved The extended RSM is in effect from January 2013 until the next rate case
Authorized Revenue RequirementThe authorized revenue requirement is determined
through a rate case The Commission uses a future test year to determine the revenue requirement The cost of fuel is not included in the revenue requirement but is addressed through a ldquoRetail Electric Fuel Rulerdquo adjustment
Rate of ReturnThe Commission authorized a rate of return on utility
common equity of 1030 percent in Docket No 6690-UR-120 This rate remained the same in Docket No 6690-UR-121 and is currently in effect
Revenue Adjustment MechanismWPS implemented a new electric RSM based on a ldquoTotal
Rate Case Marginrdquo mechanism instead of a ldquoTotal Rate Case Margin per Customerrdquo mechanism which had been the practice during the initial four-year pilot phase The revision was intended to remove the calculation sensitivities related
to sales per customer from the original RSM calculation The margin reflected in the formula equals the total revenue for each tariff less the costs associated with the annual per-kWh value established for monitored fuel costs and excluding any surcharges credits taxes or similar charges The ldquoTotal Rate Case Marginrdquo mechanism allows WPS to achieve the total margin assumed in the forecasted test year no more and no less The new RSM will be in effect on a pilot basis until the effective date of WPSrsquos next general rate order which WPS committed to filing for the 2014 andor 2015 test years The RSM applies to most tariffs except large commercial and industrial customers28
Reconciling Actual Revenue With Authorized Revenue
Each year the utility compares the total target revenue and the total actual revenue and defers the difference subject to carrying costs based on WPSrsquos last approved short-term debt rate The margin will be based on annual per-kWh value established for monitored fuel costs which is done in a rate case The margin is determined by subtracting the aver-age kWh value from the authorized energy rates
The formula for calculating an electric under-recovery or over-recovery is
Under-recovery or over-recovery equals
[actual margin minus ratecase forecasted margin established in the most recent rate proceeding]
The summation is over each tariff A positive value equals an over-recovery and a negative value equals an
Decoupling Case Studies Revenue Regulation Implementation in Six States
17
29 The required spending level was higher for the year 2011 owing to a temporary change in state policy
30 ACEEE Wisconsin Available at httpaceeeorgsectorstate-policywisconsin
31 The Cadmus Group Inc (2013)
under-recovery The margin reflected in the formula equals the total revenue for each tariff less the costs associated with the annual per-kWh value established for monitored fuel costs and excluding any surcharges credits taxes or similar charges
In the event that a true-up will cause rates to increase the Commission will provide an opportunity for a hear-ing Revenue regulation adjustments occur as a part of the general rate case
The revenue regulation adjustments are subject to a $14 million per year cap for electric excluding carrying costs Any adjustments over that amount will not be carried over and will not be collected from ratepayers Equivalently revenue over collection in excess of $14 million will not be returned to ratepayers
Complementary PoliciesWPS like all other investor-owned utilities
in Wisconsin is required to spend 12 per-cent of its annual operating revenues on en-ergy efficiency and customer-owned renew-able resource programs that are administered by a third party through the Focus on Energy program which was established in 200229 Separately through a contract the PSCW ap-proves annual electricity savings goals for the Focus on Energy program The savings goals were equivalent to 075 percent of electric sales for the participating utilities from 2011 to 2013 In addition the PSCW approved a rate of return on investments in energy efficiency for Wisconsin Power amp Light and other utilities can propose incentives as part of their rate cases However WPS has not yet proposed an incentive mechanism30
WPS offers residential customers a default flat rate but they also offer a TOU option with winter and summer on-peak off-peak and shoulder tiers For small commercial and industrial customers there are flat rates TOU rates and critical peak rates Large commercial and industrial customers can take service under a TOU rate with summer and winter on-peak and off-peak rates a TOU with criti-cal peak rate or under a special contract rate unique to the customer and approved by the Commission
The authorized level of expensed conservation costs recoverable in rates for the test year (2013) is $19778728 The level for electric utility operations consists of the conservation budget of $17669792 and an escrow adjustment of $2108936 which represents the test year amortization of the projected overspent escrow balance at
December 31 2012 over two years Wisconsin has a statute requiring filing of reliability data
but no reward or penalty system to support its revenue regulation system
Energy Efficiency OutcomesWPS implemented revenue regulation in 2009 In order
to gain approval for the original revenue regulation mecha-nism WPS agreed to fund energy efficiency and renewable energy programs at levels above their 12-percent statutory minimum contribution to Focus on Energy Focus on Energy produces an annual report of energy efficiency program activities In its 2012 report Focus on Energy reports the following outcomes achieved for WPSrsquo service territory The table below represents the savings under the statewide Focus on Energy Programs and does not represent the savings at-tributed under the funding levels above 12 percent31
Territory Segment
Customer Participation
Rate () Utility Type
Per Capita Lifecycle Bill Savings ($)
Per Capita Incentive
($)
WPS Electric Commercial $115258 3 $8330
WPS Electric Industrial $9026768 96 $892463
WPS Electric Residential $6494 36 $666
ResourcesPublic Service Commission of WisconsinApplication of Wisconsin Public Service Corporation for
Authority to Adjust Electric and Natural Gas Rates Final Decision (December 7 2012) Docket No 6690-UR-121
David J Kyto Wisconsin Public Service Corporation Application of Wisconsin Public Service Corporation for
Authority to Adjust Electric and Natural Gas Rates Supplemental Direct Testimony (May 15 2012) Docket No 6690-UR-121
Focus on EnergyThe Cadmus Group Inc (2013) Focus on Energy Calendar
Year 2012 Evaluation Report Appendixes Portland OR The Cadmus Group Inc Retrieved from httpwwwfocusonenergycomsitesdefaultfilesFOC_XC_CY201220Report20Appendices20A-O20Final2005-3-13pdf
Decoupling Case Studies Revenue Regulation Implementation in Six States
18
32 DPU 07-50 (2007)
33 DPU 07-50 (2007) pp 392ndash396
Massachusetts National Grid
The revenue regulation mechanism for National Grid (Massachusetts Electric Company and Nantucket Electric Company together doing business as National Grid) compares authorized
distribution revenue to actual distribution revenue Revenue is compared and adjustments are made separately for each customer class
AuthorityThe Massachusetts Department of Public Utilities (DPU)
adopted revenue regulation as a statewide regulatory policy in 2008 and individual utilities filed revenue regulation tariffs in response In its Investigation Into Rate Structures that will Promote Efficient Deployment of Demand Resources32 the DPU investigated rate structures and revenue recovery mechanisms that may reduce disincentives to the efficient deployment of demand resources in the state and consid-ered how the electric and natural gas distribution compa-niesrsquo existing cost recovery mechanism could be changed to better align the companiesrsquo financial incentives with policy objectives while ensuring that the companies are not finan-cially harmed by the increased use of demand resources The DPU finally concluded that revenue regulation mecha-nisms would eliminate the financial disincentives because they sever the link between the companiesrsquo revenue and reduction in sales The DPU also endorsed a revenue per customer approach but recognized that other factors could result in changes to distribution-related costs and consent-ed to consider company-specific ratemaking proposals that accounted for the impact of capital spending and inflation-ary pressures on the companyrsquos required revenue
Authorized Revenue RequirementThe authorized revenue requirement does not include
costs that are reconciled outside of base distribution rates including energy supply costs for basic service customers transmission costs the energy efficiency system benefits charge and reconciling charge and costs recovered through the residential assistance adjustment factor
Rate of ReturnThe Commission recognized the effects of revenue
regulation on ROE and determined that revenue regulation reduces volatility which reduces risk and a downward ad-justment to ROE was appropriate but did not make its ac-tual ROE adjustment for the revenue regulation mechanism explicit in its order33 The DPU determined that a return on equity equal to 1035 percent was sufficient The testimony from National Grid supporting its proposed ROE presented comparisons of allowed ROE for a set of companies that had revenue regulation or another risk management mecha-nism in place to account for an implied reduced risk profile in developing that proposal
Revenue Adjustment MechanismEach year the authorized revenue requirement is ad-
justed to account for capital expenditures in the previous year The CapEx Adjustment applies to capital expenditures incurred by National Grid for distribution system invest-ments in the previous year net of the amount recovered through depreciation expense in base rates This accounts for the material difference in expected capital expenditures compared with prior years In this way the CapEx Adjust-ment in the National Grid revenue regulation mechanism is a special case of a ldquoK Factorrdquo which characterizes an expected change in costs in the future and accounts for those changes when they occur Each year the Company files with the Department documentation in support of the capital expenditures it has incurred since the previous review The Department reviews the filings to determine the prudence of the incremental expenditures and whether the expenditures are used and useful National Grid then allocates approved expenditures to rate classes based on the cost of service study For each class the Company determines the adjustment allocated to the rate class then divides this sum by the forecasted kWh sales for the follow-
Decoupling Case Studies Revenue Regulation Implementation in Six States
19
34 DPU 07-50 (2007) p 87
35 ACEEE Massachusetts Available at httpaceeeorgsectorstate-policymassachusetts
36 Personal communication with National Grid
ing year to determine the per-kWh adjustment In order to provide a balance between providing the
Company with sufficient funds to ensure the safety and reliability of the distribution system and protecting ratepay-ers against the incentive the Company has to overinvest in infrastructure the mechanism limits the level of annual capital expenditures that is recoverable through the mecha-nism To arrive at the amount the Department set a limit of $170 million per year which is equal to the approximate three-year average of the Companyrsquos capital spending in previous years Should the Companyrsquos capital expenditures exceed this limit it may seek to include the investment in the rate base during the next base rate proceeding
The Company submits its CapEx filing no later than July 1 of each year On November 1 of each year the Company submits all other information in support of its proposed adjustment factors The factors will take effect on March 1 of each year
The authorized revenue is also adjusted to include a 50-percent sharing for earnings above the authorized ROE
Reconciling Actual Revenue With Authorized Revenue
Each year National Grid calculates on a rate class-spe-cific basis the difference between the actual distribution revenue billed to customers through distribution rates and the annual target revenue For each rate class the difference between the actual billed distribution revenue and the an-nual target revenue is summed to determine the Company-wide reconciliation amount That amount is divided by the Company-wide kWh forecasted for the upcoming year to arrive at a cent-per-kWh reconciliation charge or credit To determine the final adjustment for each rate class the Company-wide reconciliation adjustment is added to the rate class-specific adjustment resulting from the target rev-enue adjustment mechanisms
The adjustment to the authorized revenue in any year is capped at three percent of total revenues34 Any excess can be carried forward to a future year with carrying charges equal to the customer deposit rate
National Grid must report to the DPU if the difference between the year-to-date billed revenue and year-to-date annual target revenue equals or exceeds ten percent of the target revenue and the Company believes that the difference will fall outside of the ten-percent threshold in the coming months In this case interim revenue regulation adjust-ments can be made In order to avoid an interim adjust-ment too close to the scheduled annual rate adjustment
National Grid must notify the Department of variances exceeding ten percent of annual target revenue by August 31 of each year
Complementary Policies Massachusetts requires that electric utilities procure
all cost-effective energy efficiency before more expensive supply-side resources This requirement was translated into annual savings requirements for electric utilities starting from 1 percent of sales in 2009 to 14 percent in 2010 2 percent in 2011 and 24 percent in 2012 and potentially increased savings in subsequent years Utilities can earn approximately five percent of program costs for meeting or exceeding savings targets35
National Grid offers inclining block rates as the default residential rate but there is an optional TOU rate with peak and off-peak tiers also available to residential customers Small and large industrial and commercial customers can take service under flat rates inclining block rates or TOU rates
National Grid operates under a penalty and reward sys-tem for service quality established in Docket DTE 99-84 The impetus behind the DPUrsquos original establishment of the Service Quality Guidelines was to prevent Massachusetts utilities from allowing service quality to deteriorate under a new regulatory regime
Energy Efficiency OutcomesBefore Massachusetts Electric implemented revenue
regulation in 2009 it reported consistently high levels of incremental energy efficiency savings approximately 09 percent of retail load In 2010 the company reported 136 percent savings and 159 percent in 2010 and 2011 respectively36
ResourcesMassachusetts Department of Public UtilitiesDocket 09-39 Petition of Massachusetts Electric Company
(November 30 2009)
Decoupling Case Studies Revenue Regulation Implementation in Six States
20
37 Energy Agreement Among the State of Hawaii Division of Consumer Advocacy of the Department of Commerce amp Consumer Affairs and Hawaiian Electric Companies Available at httpwwwhecocomvcmcontentStaticFilespdfHCEIpdf
38 The HECO Companies described as follows in their Reply SOP in the Schedule A decoupling proceedings ldquothe
Hawaii Hawaiian Electric Company
Hawaiian Electric Company (HECO) uses a revenue regulation mechanism that compares actual revenue to target revenue in each year The target revenue is based on the authorized
revenue for the last test year adjusted for operation and maintenance (OampM) increases and rate base changes
HECO is a subsidiary of Hawaiian Electric Industries which also operates Maui Electric Company (MECO) and Hawaiian Electric Light Company these subsidiaries service the islands of Maui and Hawaii County while HECO serves Oahu (Honolulu)
Authority In 2008 the Governor of Hawaii the Division of Con-
sumer Advocacy and HECO entered into an agreement as a result of the Hawaii Clean Energy Initiative37 The agreement is intended to move Hawaii away from its dependence on imported fossil fuels for electricity and ground transporta-tion and toward locally produced renewable energy and energy efficiency In the agreement the State the Consumer Advocate and HECO committed to among other things a transition away from a model that encourages increased elec-tricity usage and to a model that implements revenue regula-tion decoupling to encourage the development of renewable energy by HECO The Commission opened Docket 2008-0274 in order to examine the features of a revenue regula-tion mechanism The Opening Order directed HECO and the Consumer Advocate to file a joint proposal on revenue regulation within 60 days This joint proposal was modeled closely after the California mechanism described earlier for PGampE with a rate-case determined revenue requirement plus annual attrition adjustments plus separate mechanisms
to recover power supply and energy efficiency costsThe Hawaii Public Utilities Commission approved
revenue regulation for HECO in August 2010 based on an investigation into the appropriateness of revenue regula-tion and its design The revenue regulation mechanism took effect on March 1 2011 This replaced a previous lost revenue adjustment mechanism
Authorized Revenue RequirementThe Commission establishes the Authorized Base Rev-
enues through a general rate case based on traditional cost-of-service ratemaking principles The Authorized Base Revenue is the annual amount of revenues required for the utility to recover its estimated OampM depreciation amorti-zation and tax expenses for the period
The Target Revenue is equal to the base revenue require-ment less any revenue being separately tracked or recov-ered through any other surcharge or tracking mechanism including revenue for fuel and purchased power expenses
The revenue regulation order also requires staggered triennial rate cases for each of the Hawaiian Electric Indus-tries Companies to determine approved baseline Revenue Adjustment Mechanism (RAM) inputs
Rate of ReturnThe Commission made no explicit adjustment to ROE
owing to the revenue regulation mechanism but noted that the allowed ROE of ten percent reflects the approval of revenue regulation and other cost-recovery mechanisms that will lower HECOrsquos business risk38 Most recently the Hawaiian Public Utilities Commission approved a 90-per-cent ROE for MECO reflecting both a lower baseline cost
Commission effectively reduced the Companiesrsquo return on common equity by 50 basis points to ldquofairly compensate ratepayersrdquo for what it perceived as the ldquorisk-reducingrdquo effects of the RBA and RAM mechanisms the Renewable Energy Infrastructure Program (lsquoREIPrdquo) Surcharge and the Purchased Power Adjustment Clause (ldquoPPACrdquo)rdquo Available at httpdmspuchawaiigovdmsDocumentViewerpid=A1001001A10L29B55326B47993
Decoupling Case Studies Revenue Regulation Implementation in Six States
21
39 Hawaii PUC Decision and Order No 31288 (2013 May 31) pp 97ndash112
40 Hawaii PUC Decision and Order No 31289 (2013 May 31)
41 Hawaii PUC Decision and Order No 31908 (2014 Feb 1)
42 February 7 2014 order on schedule A issues Available at httpdmspuchawaiigovdmsDocumentViewerpid=A1001001A14B10B22326F07922 p 42ndash47
of capital and a penalty of 050 percent associated with inadequate performance bringing renewable energy into the MECO system39 A companion Order also established new guidance on future revenue regulation mechanisms40
Revenue Adjustment MechanismThe RAM is designed to replace the need for annual rate
cases by adjusting Authorized Base Revenue levels to reflect estimated changes in the utilityrsquos cost of service The RAM is intended to via formula-driven estimates and escalators compensate the HECO Companies for changes in util-ity costs and infrastructure investment between rate cases and reduce the frequency of rate cases The RAM Period is the calendar year containing the Annual Evaluation Date (March 31 the date of the annual RAM filing) The RAM adjusts the revenue requirement according to changes in four main categories of expenses
bull Base expenses which are changes in designated OampM expenses
bull Rate base the return on incremental investment in designated rate base components41
bull The incremental depreciation and amortization expenses and
bull Exogenous tax changes changes in costs owing to significant changes in tax laws or tax regulations
Base expenses are segregated between labor and non-labor amounts The labor component is adjusted annually by the Labor Cost Escalation Rate reduced by the Labor Productiv-ity Offset (fixed at 076 percent) The non-labor component uses the Non-labor Escalation Rate to annually adjust those costs Tracked OampM expenses for fuel purchased power pension and post-employment benefits integrated resource planning DSM and other rate adjustment provisions are not adjusted in the RAM because any changes in these costs are accounted for in other cost-tracking mechanisms
The Rate Base equals the average net investment esti-mated for the RAM Period The average rate base is the rate base for the rate case test year with adjustments for changes in only four components of rate base (1) average plant-in-service (2) average Accumulated Depreciation (3) average accumulated contributions in aid of construc-tion and (4) average accumulated deferred income taxes All other components of the rate base remain the same as in the preceding rate case test year The average plant-in-service is equal to the average of the actual plant-in-service at the end of the year prior to the RAM period the Evalu-ation Year and the same year-end balance plus estimated plant additions for the RAM period Plant additions include
Baseline Capital Project plant additions and Major Capital Projects plant additions estimated to be in service by Sep-tember 30 of the RAM period
The RAM also includes an Earnings Sharing Revenue Credit mechanism in order to protect against excessive over-all utility revenue levels The RAM will escalate and update the Companyrsquos approved base revenue requirement reduced by earnings sharing credits and major project revenue credits to customers Based on the Companyrsquos achieved return on common equity for the Evaluation Year the mechanism cred-its the RBAs according to the following chart
ROE at or below the authorized ROE
First 100 basis points (1) over authorized ROE
Next 200 basis points (2) over authorized ROE
ROE exceeding 300 basis points (3) over
authorized ROE
Retained entirely by shareholders no customer credits
25 share credit to customers
50 share credit to customers
90 share credit to customers
Finally the RAM includes additional consumer protectionsbull A provision for Major Capital Projects Creditsbull A provision for Baseline Capital Projects Creditsbull Notification is provided to all affected customers of
the RAM filing in newspapers and billsbull Evaluation procedures for filing examination and any
exceptions to annual revenue regulation filingsbull Continued ability of HECO or the Consumer
Advocate to request formal rate proceedings to replace and terminate RAM at any time and
bull Formal review of revenue regulation as a part of the next round of rate case proceedings
A recent order42 added two additional consumer protections
bull A limitation that only 90 percent of the current
Decoupling Case Studies Revenue Regulation Implementation in Six States
22
43 ACEEE Hawaii Available at httpaceeeorgsectorstate-policyhawaii
RAM Period Rate Base that exceeds the Rate Base Adjustment Mechanism from the prior year can be included in the Decoupling Mechanism for baseline utility plant projects which unlike major capital projects are not subject to prior Commission review and approval and
bull A requirement to post a number of metrics online for customer review although not at this point tied to performance
This order also examined four issues with respect to the application of the RAM The Commission determined that the short-term debt rate as reflected in the most recent rate case should be used to adjust over- and under-collections The Commission also resolved its concern that without a sustainable business plan there exists no strategic frame-work under which to evaluate capital expenditure pro-grams The Commission required the parties in the Docket to further explore capital expenditure issues in conjunction with other risk-sharing mechanisms discussed elsewhere in the order The commission ordered a further evaluation of a proposed risk-sharing mechanism within the RBA Further-more the Commission ordered the parties to work together to establish appropriate metrics which the utility would report on its website
Once the total RAM Revenue Adjustment is calculated it is applied through a uniform adjustment to the per-kWh energy charge for all customer classes
Reconciling Actual Revenue with Authorized Revenue
RBAs record the monthly differences between target revenues and the adjusted recorded electric sales revenues The RBA also applies monthly interest equal to the annual rate for short-term debt from the cost of capital in each HECO Companyrsquos last base rate case to the simple average of the beginning and ending balances each month in the RBA In effect the RBA applies one-twelfth of the rate each month Finally the RBA provides for collection or return of the calendar year-end balances in the RBA and recovery of the RAM Revenue Adjustment over the subsequent May 1 through April 30 period The target revenue is the most recent Authorized Base Revenue or the re-determined Authorized Base Revenue calculated under the RAM
On or before March 28 the Company must file with the Commission a statement of the previous year-end balance in each RBA sub-account and the Authorized Base Revenue level for the current calendar year with supporting calculations An amortization of the year-end balance in the
RBA sub-accounts and the RAM Revenue Adjustment are recovered through the per-kWh RBA rate adjustments The rate adjustment occurs from May 1 of the current calendar year to April 30 of the next year
Complementary PoliciesCurrently electric utilities in Hawaii may use energy
efficiency to meet a portion of their Renewable Portfolio Standard requirements Starting in 2015 electricity savings from energy efficiency will be applied to the Statersquos Energy Efficiency Portfolio Standard which sets a target equivalent to 30-percent forecast sales by 2030 This goal is translated into a target of 14 percent annual savings HECO trans-ferred administration of all of its energy efficiency programs to a third party administrator in 2009 The administrator is compensated for satisfactory performance43
Because of its heavy dependence on petroleum as a generation fuel electricity prices in Hawaii are very high solar and wind are typically lower-cost resources for these systems HECOrsquos default residential rates are inclining block rates with a $900month customer charge and a three-block inclining rate design of $034kWh to $037kWh Residential customers can elect to take service under a TOU rate with off-peak mid-peak and priority-peak tiers Gen-eral service and large power service customers take service under a flat rate unless they opt to take service under a TOU
Hawaii is developing reliability standards in part as a response to deteriorating service quality as a result of distributed and customer-owned generation (see text box) In an effort to make electricity reliability and interconnection standards as transparent as possible the Reliability Standards Working Group was formed in the Feed-In Tariff docket and continues its work in Docket No 2011-0206 to find solutions to integrating high penetrations of renewable energy consistent with reliability and power quality standards
Energy Efficiency OutcomesHECO implemented revenue regulation in 2011 Since
2003 HECO has reported incremental energy efficiency savings between 0 and 05 percent of retail load with 131 percent savings reported in 2011 by Hawaii Energy the
Decoupling Case Studies Revenue Regulation Implementation in Six States
23
44 Hawaii PUC Decision and Order No 31288 Maui Electric Company Limited Docket No 2011-0092 (2013 May 31) Appendix C p 2
Statersquos ratepayer funded efficiency program administrator The company has not yet reported its savings for 201245 In addition HECO has seen more than a sixfold increase in renewable installations under its net metering and feed-in tariff policies since the inception of the revenue regulation plan
Revenue regulation represents a regulatory framework that removes the financial disincentive for utilities to pursue clean
energy strategies It doesnrsquot in and of itself align the utility business model with those utility policies and practices that address customer expectations In fact some commissions are concerned that it might create a dynamic in which the utility assured of its revenue needs becomes complacent and lacks motivation to innovate and develop strategies that may be more in line with the public interest
In a recent order (Docket 2011-0092 May 31 2013) the Hawaiian Public Utilities Commission addressed this big picture issue in a rate order for Maui Electric The Commission called out the management as lacking a long-term vision for creating customer value and expressed concern that ldquothe HECO Companiesrsquo over-reliance upon a link between the [Decoupling]
Agreement and utility financial health obfuscates utility performance and ultimately customer service and satisfactionrdquo44 The implementation of clean energy policies is not a singular goal but rather a policy that must be part of a larger effort to create customer value
The Commission laid out a hard path and a soft path to achieve the results they desire for consumers The hard path involves a closer examination of utility investments operations and expenditures The soft path is opened through the actions of management to create and execute a vision for the utility of the future The Commission remains committed to regulatory innovations that are in the public interest and will work with the utility consumer advocate and other stakeholders to create and implement this vision
The results of this effort will likely produce ideas and outcomes that will have applicability beyond this one utility
ResourcesHawaii Public Utilities CommissionDocket No 2008-0274 Final Decision and Order (August 31 2010)Docket No 2008-0083 Final Decision and Order (December 29 2010)Docket No 2011-0092 Final Decision and Order May 31 2013 including
Decision and Orders Nos 31288 and 31289Docket No 2013-0141 Final Decision and Order (February 1 2014) including
Decision and Order No 31908
45 EIA Form EIA-861 data files Available at httpwwweiagovelectricitydataeia861
Decoupling Case Studies Revenue Regulation Implementation in Six States
24
46 Lazar et al 2011
Discussion of the Six Utilities Overall
Authority The first step in implementing a revenue regulation
mechanism is to understand the authority of the regulating body the Public Utility Commission or PSC It is important for any Commission to clarify its justification for acting on revenue regulation in order to prevent any decisions from being overturned Over the years Utilities Commissions have relied on different justifications for implementing revenue regulation mechanisms Commissions have imple-mented revenue regulation at their own discretion justified by their directive to ensure safe reliable and economic public utility service to citizens to justify changing the regulatory environment In some cases the Commission is unable to engage on narrow issue ratemaking and rates can change only as the result of a full rate case In this case statutes must be amended to enable revenue regulation
In all of the case studies discussed here the Commis-sions first implemented revenue regulation at their own dis-cretion but each followed slightly different paths to do so The CPUC first implemented revenue regulation in 1978 at its discretion In 2001 after a period when mechanisms were suspended the California Legislature required that deviations from projected sales not result in under- or over-collections by utilities and so the CPUC re-implemented revenue regulation according to statutory requirement The Hawaii Public Utilities Commission implemented rev-enue regulation after an agreement between the utility the Governor and other stakeholders called for it In Idaho the Commission established a case in which to investigate rev-enue regulation and held a series of stakeholder workshops before implementing the policy The Massachusetts DPU adopted revenue regulation as a statewide regulatory policy and required individual utilities to file tariffs in response as the result of its general investigation into rate structures that promote demand-side resources The Maryland Com-mission implemented revenue regulation for BGE when the utility requested the mechanism Thus the impetus to develop a revenue regulation mechanism may come from different sources and the Commission may be comfortable
in moving forward under their general supervisory statutes Nevertheless specific statutory language can be helpful to shore up the existing authority
Authorized Revenue Requirement Under the traditional regulatory framework the Com-
mission (or other authority in the case of publicly owned utilities) must determine a utilityrsquos revenue requirement This function does not change under revenue regulation The revenue requirement of a utility is the aggregate of all the operating and other costs incurred to provide service to the public This typically includes operating expenses depreciation and the cost of capital invested including in-terest on debt and a ldquofairrdquo return on equity to investors The (simplistic) formula for determining revenue requirements is as follows
Revenue Requirements = (Rate Base times Rate of Return) + Operating Expenses + Depreciation +Taxes
Traditionally the revenue requirement along with sales is used to determine the rates consumers will pay for elec-tricity46 The rates are also broken down by customer class and intraclass tariffs are created based usually on a cost of service study that determines each customer class and subclass contribution to the utilityrsquos costs The (simplistic) formula for determining the rate per unit is
Rate = Revenue Requirement divide Units Sold
In this way rates are set to allow the utility to exactly recover its revenue requirement when the sales level used to calculate rates is equal to actual sales However it is important to recognize that actual expense and revenue varies with actual sales When actual sales are greater than the sales level used in ratemaking revenue increases and expenses increase by a different amount when actual sales are lower than the ratemaking sales level actual revenue
Decoupling Case Studies Revenue Regulation Implementation in Six States
25
declines and expenses decrease by a different amount Under revenue regulation rates are initially set in the same way but when actual sales differ from the level used to calculate rates the actual revenue level is maintained at the rate case amount as rates are allowed to vary inversely with salesmdashincreased sales lead to decreased rates and vice versa Because the primary expenses that change in the short run as sales levels change are power supply expenses and most regulators allow these to be tracked using a power cost adjustment mechanism revenue regulation mechanisms are generally designed to ensure recovery of the non-power costs (which do not change significantly in the short-run) as sales volumes change
Revenue regulation ensures that actual revenue is equal to the revenue requirement established by the Commission or appropriate authority Although the description above presents an overly simplified view of the revenue require-ment and its use in traditional price regulation and revenue regulation there are many variations on how a Commis-sion can establish a revenue requirement particularly when implementing revenue regulation With revenue regulation as in traditional ratemaking imprudent costs can always be removed from rates and there is no change to the ability of a Commission to impose penalties
Utility Functions to be IncludedFirst the regulator must determine which utility func-
tions will be included in the revenue regulation framework With vertically integrated utilities this usually includes a utilityrsquos regulated generation transmission and distribution units As we discuss below however it is critical to struc-ture power supply recovery mechanisms to avoid providing for double-recovery of certain power supply costs For utili-ties operating in areas of the country that have restructured electricity markets only the regulated distribution busi-ness is decoupled Utilities that also provide gas services
Pacific Gas amp Electric Future test year
Idaho Power Company Historic test year
Baltimore Gas amp Electric Hybrid test year
Wisconsin Public Service Corporation Future test year
National Grid Historic test year
Hawaiian Electric Company Future test year
Table 2
Test Year Used
may have their gas distribution business operating under revenue regulation as well
Test YearOne consideration in establishing the revenue require-
ment is what period of time will be used as a ldquotest periodrdquo or ldquotest yearrdquo The test year is the year on which the Com-mission will base its computations of the utilityrsquos total costs and sales levels A historic test year uses actual data on sales and costs from a past year Whereas a historic test year allows for the use of actual cost data it cannot account for expected variations in sales A future test year requires assumptions to be made about a utilityrsquos sales in a future year This can allow expected changes in sales like those from energy efficiency programs to be included in sales
projections however because regulators are relying on estimates provided by the utility there may be a greater risk for inaccuracy A Commission may also choose to use a test year that includes both past and future periods This may provide a sense of balance between historic and future data Furthermore as the case proceeds the Commission can require the utility to substitute historical data for projected data from the test year
Rate of ReturnAs in any rate case regulators
must determine the appropriate rate of return that a utility can earn on its investments including the cost of debt and the allowed ROE for its shareholders The approved ROE is only used to establish the return on investments that are included in the rate base when determining revenue require-
Pacific Gas amp Electric Electric generation and distribution gas distribution
Idaho Power Company Electric generation and distribution
Baltimore Gas amp Electric Electric distribution gas distribution
Wisconsin Public Service Corporation Electric generation and distribution
National Grid Electric distribution
Hawaiian Electric Company Electric generation and distribution
Table 1
Business Unit Included in the Revenue Regulation Model
Decoupling Case Studies Revenue Regulation Implementation in Six States
26
47 In a rate case the Commission determines an allowed return on equity This is used to set a price (price regulation) or an allowed revenue requirement (revenue regulation) Once set however the actual return earned by the utility is affected by anything that changes either revenue or expenses for example an increase in employee compensation a change in the number of employees or under price regulation a change in sales volumes
48 Lazar et al 2011
ments Although revenue regulation ensures that a utility recovers no more or less than its target revenue revenue regulation does not guarantee that the utility will earn the authorized ROE Depending on how a utility manages its costs between rate cases it will realize an actual ROE either higher (in the case of reduced costs) or lower (in the case of increased costs) than the authorized level47
A utilityrsquos allowed ROE generally represents the return deemed necessary to attract investment considering the level of risk of that investment Riskier investments require a higher return to attract investors and vice versa Util-ity earnings can be volatile because of short-run impacts on sales volumes and revenues which include changes in sales owing to weather economic conditions and energy efficiency and DG programs This volatility typically causes utilities to retain a higher level of equity in their capital structures so that reduced revenues do not leave them un-able to service their debt Revenue regulation can reduce this volatility by stabilizing revenues regardless of the cause Because of this reduced risk many stakeholders have proposed that the implementation of a revenue regulation mechanism be associated with a corresponding reduction in the utilityrsquos equity capital ratio (the percentage of capital supplied by common equity) This reflects the utilityrsquos more stable revenue owing to revenue regulation and reduces the overall revenue requirement that will be recovered from consumers48
An alternative option to reducing the utilityrsquos equity ratio is to reduce the ROE reflecting a lower risk level For the utilities included in these case studies only BGE and Mass Electric experienced a reduction in their ROE The Com-mission did not reduce BGErsquos ROE at the time the revenue regulation mechanism was implemented but reduced it by 50 basis points during the subsequent rate case The Mas-
sachusetts Commission did not reveal its adjustment but incorporated a lowered ROE into its decision
Absent an explicit adjustment to the cost of capital investorsrsquo expectations will adjust to the presence of rev-enue regulation if its presence is reliable The more stable earnings will likely in time contribute to a higher credit rating That in turn will lead to lower cost debt that will be revealed in future cost of capital calculations An adjust-ment to the ROE or capital structure by the regulator in a rate proceeding will be reflected immediately in lower rates to consumers simply allowing the utilityrsquos credit rating to improve over time and its cost of debt to decline will have the same effect but on a lagged basis as new bonds are is-sued at lower interest rates49
Beginning in 2004 Standard and Poorrsquos began publish-ing ldquorisk profilesrdquo for utilities which classified utilities based on their earnings variability and other risks those with more stable earnings were determined eligible for higher bond ratings at any given equity capitalization ratio (or alternatively able to retain a given bond rating with a lower equity ratio)50 One utility with a revenue regulation mechanism Northwest Natural Gas was believed to have had their business risk profile upgraded by one step in response to the benefits of the mechanism51
Effect on Bond RatingsRevenue regulation stabilizes a utilityrsquos revenue streams
reducing risk to investors this reduced risk may be a contributing factor in an increase in a utilityrsquos bond rating Bond rating agencies have recognized that revenue regula-tion mechanisms and other mechanisms that reduce net earnings volatility and risk contribute to a lower cost of capital for the utility52 Standard and Poorrsquos has explicitly stated that it ldquoviews decoupling as a positive develop-
49 Lazar et al 2011
50 Standard and Poorrsquos (2004 June 2) New Business Profile Scores Assigned for US Utility and Power Companies Financial Guidelines Revised
51 Christensen Associates (2005 March) A review of distribution margin normalization as approved by the Oregon Public Utility Commission for Northwest Natural
52 Lazar et al 2011
Decoupling Case Studies Revenue Regulation Implementation in Six States
27
This topic raises a note of caution if mechanisms are not well designed double-recovery of costs can occur for verti-cally integrated utilities that provide both power supply and distribution services For example if a per-customer
revenue regulation mechanism includes investment-related power supply costs in the revenue-per-customer formula but excludes fuel and purchased power costs that are recovered through a separate tracking mechanism double recovery of some power supply costs is likely If the utility experiences cus-tomer and sales growth the amount it recovers for investment-related power supply costs will go up However if that utility serves this growth by operat-
ing existing power plants more by selling less power on the surplus market or by purchasing power from other suppli-ers it will not incur any increases in the type of power sup-
53 Standard amp Poorrsquos (2008 February 19) Decoupling the vehicle for energy conservation
ment from a credit perspectiverdquo53 However in the case of the utilities examined in this report none experienced an improved credit rating after the implementation of revenue regulation with the exception of PGampE However PGampE came out of Chapter 11 bankruptcy in the same year that its revenue regulation mechanism was implemented mak-ing it impossible to attribute the improvement to revenue regulation alone Bond rating changes are generally slow to evolve Numerous other factors are taken into account when assigning an overall credit rating which appear to have outweighed any positive effect of revenue regulation These factors certainly include the recession of the US economy that began in 2007
Customer Classes IncludedWhen determining the target revenue for a utility rev-
enue regulation mechanism regulators must also consider which customer classes to include in the mechanism In some cases industrial customers have objected to a rev-enue regulation mechanism This is due to the wide dif-ference in rates among customers making the design of a revenue regulation mechanism more challenging If regula-tors choose to exclude a class of customers from revenue regulation they must determine the revenue requirement associated with serving only the included customer classes This generally requires a detailed cost of service study to ensure that revenue responsibility is accurately allocated by customer class
Included CostsFinally regulators may wish to exclude specific costs
from the overall revenue requirement if those costs will be tracked through another mechanism like fuel costs in a PCA mechanism energy efficiency program expenditures or smart grid costs for example Separate tracking mecha-nisms can also be used for those costs that are difficult to
Pacific Gas amp Electric All customer classes
Idaho Power Company Residential and small general service
Baltimore Gas amp Electric Residential and small general service
Wisconsin Public Service Corporation All customer classes
National Grid All customer classes
Hawaiian Electric Company All customer classes
Pacific Gas amp Electric
Idaho Power Company
Baltimore Gas amp Electric
Wisconsin Public Service Corporation
National Grid
Hawaiian Electric Company
Table 3
Customer Classes Included in Revenue Regulation Mechanism
Table 4
Costs Excluded From Revenue Regulation Mechanism
project based on historical data or costs over which the util-ity has very little control like fuel costs Although revenue regulation tracks collected revenue mechanisms like Fuel Adjustment Clauses Purchased Power Adjustments and Energy Efficiency Riders can be designed to track actual costs as well as collected revenue
Energy procurement costs
All variable costs
Energy supply costs
Energy costs
Energy supply costs for basic service customers transmission costs the energy efficiency system benefits charge and reconciling charge and costs recovered through the residential assistance adjustment factor
Fuel and purchased power
Decoupling Case Studies Revenue Regulation Implementation in Six States
28
54 We use the RAM term applied in Hawaii here to address any type of attrition or similar mechanism other than a revenue-per-customer framework that changes the allowed revenue between general rate cases
ply costs accounted for in the revenue per customer (RPC) calculation The increased power supply costs to serve that growth will be recovered through the fuel and purchased power tracking mechanism The net effect for the utility will be to recover incremental power supply costs twicemdashonce in the per-customer mechanism and again in the fuel and purchased power mechanism It is essential to make sure that the other adjustment mechanisms do not overlap the cost impacts that are treated in the revenue regulation mechanism One way to do this is to ensure that all power supply costs (investment labor fuel purchased power) are recovered through a single mechanism There are several ways to achieve this
a) A comprehensive power supply recovery mechanism that includes all power supply costs that is separate from the costs treated in the revenue regulation adjustment (eg Puget Sound Energy Washington State)
b) No power supply adjustment whatsoever with all utility costs included in an RPC mechanism (eg National Grid)
c) An annual attrition calculation with all costs reviewed for changes since the last proceeding (eg HECO)
Revenue Adjustment Mechanism in Revenue Regulation
A RAM54 is not necessary to achieve revenue regulation but provides attrition reliefmdashincreasing authorized revenue commensurate with increased costsmdashbetween rate cases Whereas revenue regulation sets a target revenue that the utility will earn regardless of sales levels the RAM adjusts the target revenue between rate cases Regulators may choose to take several different approaches to RAM
bull No RAM Regulators may choose not to implement a RAM leaving the revenue requirement unchanged between rate cases This requires the utility to request a rate case when it requires additional revenue to cover its costs
bull Stairstep Stairstep adjustments provide predetermined increases in target revenue These increases can be determined during a rate case and generally reflect forecasts of cost growth
bull Indexing Indexing ties adjustments to the target revenue to multiple factors like inflation productivity customer growth and changes in capital expenditures
bull RPC The RPC approach is a form of indexing RPC adjusts the total revenue requirement for the
number of customers served Regulators using an RPC mechanism will determine the revenue requirement per customer and the overall revenue requirement will be determined by multiplying the total number of customers by the revenue requirement per customer The amount of revenue required to serve each customer can be determined separately for customer classes and for existing and new customers This way the RPC method accounts for a utilityrsquos growth in fixed costs that is related to growth in the number of customers served RPC is useful where the correlation between cost growth and customer growth is significant It also protects customers from making up the deficit if there is a loss in customer load such as if a large business closes down or relocates
bull Hybrid Hybrid RAMs generally use stairstep increases to account for projected capital costs and indexing to account for OampM expenses
Adjustments from any type of RAM can be implemented automatically or through an attrition proceeding Some stakeholders oppose adjustments to the revenue require-ment outside of a rate case on the basis that this could allow the revenue requirement to increase significantly without examination of the impact on ratepayers or with-out due consideration of other costs and revenues For this reason some regulators choose to cap the total adjustment that can be made to the revenue requirement outside of a rate case
Table 5
Type of Revenue Adjustment Mechanism
Pacific Gas amp Electric
Idaho Power Company
Baltimore Gas amp Electric
Wisconsin Public Service Corporation
National Grid
Hawaiian Electric Company
Hybrid
RPC
RPC
RPC
No RAM potential capital expenditure adjustment
Hybrid
Decoupling Case Studies Revenue Regulation Implementation in Six States
29
55 Because this method results in changes in the price for service that are calculated after that service has been provided it fails the ldquono retroactive ratemakingrdquo statutes that guide most electricity regulators Customers are entitled to know the price of the commodity they are consuming at the time they use it
56 The closest to a current method in use for electric utilities in the BGE system of monthly reconciliation
Table 6
Tracking and Accrual of Difference BetweenActual and Authorized Revenue
Pacific Gas amp Electric
Idaho Power Company
Baltimore Gas amp Electric
Wisconsin Public Service Corporation
National Grid
Hawaiian Electric Company
Track Difference
Monthly
Monthly
Monthly
Yearly
Yearly
Monthly
Accrual Period
Year
Year
Month
Year
Year
Year
Calculation of Actual RevenueRegulators have options when ensuring that actual
revenue equals target revenue under revenue regulation First regulators must decide how to determine ldquoactual revenuerdquo In most cases actual revenue simply equals the amount of revenue a utility collects from its customers The Idaho Public Utilities Commission however has chosen to use weather-normalized revenues as the basis for utility revenues in revenue regulation Although this prevents the utility from recovering revenue lost to it owing to milder than expected weather it further complicates the revenue regulation mechanism and reduces its risk-reduction ben-efits By the same token if weather is severe and increases sales above the revenue requirements weather normaliza-tion would allow the utility to retain some of the revenues
Next regulators must determine whether to implement revenue regulation using a current or accrual method
bull Current Method With the current method of revenue regulation the target revenue for a period say a month is divided by the actual sales in that period to determine the rate per kWh The current method ensures that actual revenue equals target revenue by calculating the rate at the end of the period so that the target revenue can be recovered The current method allows for no lag in revenue recovery One effect of this method is that although customer rates vary total bills are generally more stable For example in a hotter than expected July customers will purchase more kWh but they will be charged a lower rate A milder than average winter would lead to fewer sales but at slightly increased rates This way customers do not experience the same bill variability as they would if rates were set before the sales deviations occurred On the other hand the current method does not provide customers with the ability to plan ahead based on a predictable rate for electricity This method has been used for revenue regulation of natural gas utilities55
bull Accrual Method Under the accrual method rates are set based on an assumed sales level and the differences between actual and target revenue are allowed to accrue over some period Then the total difference between actual and target revenue is reconciled through an adjustment to rates in the subsequent period this is known as the true-up process Presently all revenue regulation mechanisms for electric utilities use the accrual method56
If regulators use the accrual method of revenue
regulation they will next need to determine the period over which the difference between actual and target revenue will be allowed to accrue One year is typical however shorter periods are also used Next the frequency of comparing collected revenue to target revenue should be determined It is possible to do this comparison only once at the end of the accrual period It is common however for comparisons to occur more frequently often monthly When revenues are compared within the accrual period the differences are tracked generally for the purpose of applying interest to the difference that will be deferred until the end of the accrual period
Rate AdjustmentsIn designing a revenue regulation mechanism there are a
number of decision points that regulators need to consider to balance the interests of all the stakeholders One of the decision points revolves around the determination of the mechanism used to adjust rates The issues that regulators need to consider include the following1 Rate Case Requirements One of the often-mentioned
concerns about surcharges especially when they are numerous is how that will impact the frequency of rate cases For regulators and stakeholders rate cases provide
Decoupling Case Studies Revenue Regulation Implementation in Six States
30
the best mechanism to correctly align rates and costs but they are time-consuming and expensive for all parties This is because a rate case presents an opportunity to closely examine all of the utilityrsquos expenses and adjust rates to reflect cost increases and decreases Because under a revenue regulation mechanism the goal is to match revenues received from all customers with revenue requirements a correct determination of revenue requirements is important as is the specification of appropriate cost indices to adjust the revenue requirements As the time between rate cases increases some regulators feel the base rate case data even with adjustments need to be reexamined As a result some regulators have chosen to mandate the frequency of rate cases to address this whereas others have not It may be that in some cases where there are numerous surcharges recovering a multitude of costs there may not be as many costs subject to review in the rate case making it less significant to a regulator than a case in which most costs are being analyzed and recovered in the rate case itself
2 Collection Mechanism Integrally tied to the mechanism for recovering revenues is how the utility will collect or refund the revenues Options that are available include recovery through a rate case or periodic adjustments to rates through a surcharge mechanism As can be seen by the case studies depending on the plan in place some utilities have very discreet requirements dictating the frequency of rate cases with adjustments occurring in those cases or between those cases Other utilities have no requirements upon them with respect to the frequency of rate case filings This will be discussed in more detail below What does emerge from these case studies is that the discreet components or choices in how to execute a revenue regulation plan are carefully interwoven to create a holistic approach Each component works with the other and the value of this case study is in examining the different pathways that can be chosen As discussed previously some of the commissions have authorized revenue regulation to recover the revenue requirements in the last rate case whereas others have authorized adjustments to rates between rate cases this impacts the pathway that the adjustment mechanism takes
3 Timing How often should rates be adjusted to true up to the utilityrsquos revenue requirement States have chosen different options ranging from monthly to annually
4 Allocation of Revenue Regulation Revenue Surpluses or Deficits There are a number of decision points regarding allocation Should the revenue regulation apply to all rate classes or just the smaller customers whose usage per customer and load variations are not as dramatic as those of larger-use customer classes Should there be a different allocation to each rate class or should the allocation of costs among the classes be the same Different mechanisms accomplish different goals Some states have allocated revenue regulation revenues based on the revenues lost by customer class as a result of energy efficiency This can sometimes be a political decision to mitigate opposition to energy efficiency programs by large customers Other states recognize that the system savings resulting from energy efficiency benefit all customers so that all customers should pay equally
5 Carrying Charges Depending on the timing issue discussed previously regulators may want to consider carrying charges on any adjustments This should be symmetrical in its application however so that it applies to surcharges and refunds Consideration should be given for the basis of the carrying charge rate whether weighted average cost of capital rate of return a risk-free rate or some other mechanism should be adopted
6 Rate Caps In order to mitigate potential rate impacts a regulator may want to consider a cap on how much rates can go up when the revenue regulation adjustment is made This might be more critical if the regulator is aware of other potential rate increases that will impact customersrsquo bills If a cap is used the case in which the utilityrsquos adjustment would exceed the cap must be considered Some regulators have opted to allow the utility to carry over the excess unrecovered amount for a period of years whereas others do not This allows the utility to recover those revenues in a subsequent year when perhaps the adjustment is less As a practical matter however adjustments of greater than three percent are less common as shall be discussed later
7 Impact on At-Risk Consumers Low-income and consumer advocates have expressed concern about revenue regulation as a vehicle for annual rate increases without the scrutiny of a general rate case creating rate increases for the low-use customers doing the most to constrain usage and help achieve targeted energy savings One proposal to address this has been to impose any resulting surcharges only to above-average usage
Decoupling Case Studies Revenue Regulation Implementation in Six States
31
57 Cavanagh and Howat (2012 May 2) Finding common ground between consumer and environmental advocates Electricity Policy
58 The most common criticism of future test years is that utilities forecast costs under an assumption that all authorized personnel positions will be filled while in retrospect any large organization has some level of vacancy in its employee count A historic test year captures this effect fully
customers and any resulting credits only to below-average usage57
Rate Case RequirementRequirements as to the frequency of rate cases can be
tied to the recovery mechanism or to the entire regulatory framework for implementing revenue regulation In the cases studied two of the utilities require periodic rate cases PGampE every three years and WPS every year Two others National Grid and HECO require annual mini rate cases explained later in which adjustments are made and two others IPC and BGE have no requirements for scheduled rate cases Nevertheless if the concern is to ensure that the utilityrsquos revenue recovery meets its revenue requirements some kind of periodic rate case to examine costs is appropriate Having periodic rate cases can provide a measure of assurance to consumer advocates that the level at which the revenues and hence the rates are set is correct One of the criticisms of revenue regulation is in fact the lack of rate cases to produce a proper level of confidence in the allowed amounts Multiple surcharges are usually additive to existing rates therefore not permitting an opportunity to reduce the base rate for reductions in cost Moreover the infrequency in cases impedes the examination of rate allocations as would occur through a cost of service study
This is a particular issue where utilities are augmenting power supply with purchased power from independent power producers which is the most common method for acquiring wind and solar production today The increased cost for purchased power may flow through a fuel and purchased power adjustment mechanism while the (depreciating) investment in conventional power plants remains static in base rates
Both PGampE and WPS use a future test year that allows the utility to project revenue requirements during the time period that the rates are to be in effect The benefit to this is that it can help identify and account for projected changes in costs over the timeframe between rate cases However given that these costs are utility projections most consumer advocates have less confidence in these numbers than they would using actual numbers from a historical or only hybrid test year58 When trying to garner support for revenue regulation from more skeptical stakeholders using a future test year may not be helpful Furthermore in the case of WPS that has annual rate cases using a future test year becomes less justifiable as revenues are recalculated annually anyway
The absence of a rate case requirement can also cause consternation among detractors of revenue regulation because of the belief that the utility will be guaranteed its revenue requirements for as long as it is satisfied with that level irrespective of how well it manages However this is no different from the status quo in traditional regulation in most places The incentive to manage well is always there with or without revenue regulation as it translates into more profit for the utility
In the cases of HECO and National Grid the mini rate cases serve two purposes In the one instance it serves as a means to reconcile revenue recovery with revenue requirements and in the second instance it provides an opportunity to adjust rates in accordance with changes in costs Specifically for National Grid the revenue requirement is adjusted to reflect capital expenditures For HECO revenues are adjusted to reflect changes in the cost of service In the two examples here revenue regulation is wrapped in with other adjustments as part of a mini adjustment Given the structure for determining revenue requirements which accounts for changes in costs including revenue regulation within the mini rate cases is a workable option
These examples highlight how rate cases can be used to adjust revenue requirements either in a more controlled regulatory environment with frequent rate cases or left to the utilityrsquos discretion to decide when to adjust costs A set schedule of periodic rate cases such as that used by PGampE may strike an appropriate balance for reviewing revenue requirements however with the modification of a partial historical partial forecasted test year Frequent rate cases can depending on the resources of the regulator and stakeholders be too costly and time-intensive When there are too many rate cases stakeholders and regulators may not be able to dedicate the level of resources needed for any one proceeding and may be spread too thin Regular known rate cases at reasonable intervals may strike the best balance of adequate review and adjustment of revenue requirements
Decoupling Case Studies Revenue Regulation Implementation in Six States
32
Collection Mechanism and TimingThe collection mechanism for the differential between
actual and authorized revenue requirements varies by util-ity as well Both PGampE and WPS do not have adjustment clauses or surcharges but instead have structured their revenue regulation plans to recover their costs in a rate case with rates adjusted annually Although PGampE has rate cases every three years the utility files its preliminary forecast every September 1 for the following year including adjust-ments for revenue regulation and other costs This practice promotes transparency keeping all stakeholders aware of the current situation of the utility IPC BGE National Grid and HECO use surcharges on customer bills to collect or credit the difference between actual revenues collected and the revenue requirement Although the other three (IPC National Grid and HECO) calculate the rate adjustment annually only BGE does a more contemporaneous adjust-ment of one month Certainly where there are no regularly scheduled rate cases using an adjustment mechanism becomes more critical PGampE has created a tracking mecha-nism known as a balancing account that allows the utility to track the surpluses and deficits to help ensure accuracy at year end when rates are actually adjusted The creation of such monthly balancing accounts will make it easier at the end of the year to track what happened each month and then determine the adjustment for that year It provides a more detailed trail for review and analysis by stakeholders and regulators However other mechanisms that just look at total revenues as compared to revenue requirements at the end of the year can work as well
Table 7
Rate Case Requirements
Table 8
Rate Adjustments
Table 9
Allocation of Surplus or Deficit
Pacific Gas amp Electric
Idaho Power Company
Baltimore Gas amp Electric
Wisconsin Public Service Corporation
National Grid
Hawaiian Electric Company
Pacific Gas amp Electric
Idaho Power Company
Baltimore Gas amp Electric
Wisconsin Public Service Corporation
National Grid
Hawaiian Electric Company
Pacific Gas amp Electric
Idaho Power Company
Baltimore Gas amp Electric
Wisconsin Public Service Corporation
National Grid
Hawaiian Electric Company
Every three years annual ldquoattritionrdquo adjustments in between
No requirement
No requirement
Annual rate case
Annual capital expenditure adjustment case
Abbreviated annual rate case
Base rates adjusted annually
Annual adjustment through surcharge
Monthly adjustment through surcharge
Annual adjustment through rate case
Annual adjustment
Annual adjustment
Allocated to all customers according to business unit (eg electric distribution electric generation)
Included in the annual adjustment mechanism for each customer class
Separate for each customer class
Allocated to all customers except certain tariffs (see above)
Separate for each customer class
Separate for residential and commercialindustrial
Allocation of Revenue Regulation Revenue Surpluses or Deficits
The allocation of revenue regulation revenue surpluses or deficits should be symmetrical so that overpayments are credited to customers just as underpayments are paid by those same customers The six utilities studied fol-low that formula The application of revenue regulation however varies from utility to utility BGE and IPC ap-ply revenue regulation to the residential and commercial classes thereby excluding industrial customers In contrast however PGampE WPS National Grid and HECO allocate revenue regulation adjustments to all customer classes In terms of how the costs are allocated IPC BGE WPS National Grid and HECO allocate costs differently among the customer classes PGampE however allocates costs uni-formly among the customers Because PGampE has separated its business units it also separately calculates and allocates
Decoupling Case Studies Revenue Regulation Implementation in Six States
33
Table 10
Carrying Charges
Table 11
Cap on Rate Adjustment
Pacific Gas amp Electric
Idaho Power Company
Baltimore Gas amp Electric
Wisconsin Public Service Corporation
National Grid
Hawaiian Electric CompanyPacific Gas amp Electric
Idaho Power Company
Baltimore Gas amp Electric
Wisconsin Public Service Corporation
National Grid
Hawaiian Electric Company
None
Yes
None
Yes at the short-term debt rate
Yes at the customer deposit rate
Yes at the customer deposit rateNo
3 rate cap excess carried over to next period
10 rate cap excess carried over to next period
Cap of $14 million per year
$170 million in CapEx
No
revenue regulation surpluses and deficits among its electric distribution gas distribution and electric generation busi-nesses This illustrates that there are several ways to address revenues from revenue regulation depending on the policy outcomes that are desired
Carrying ChargesCarrying charges applied to uncollected or surplus rev-
enues can be used to account for the time value of money and the lost opportunity or value to having those revenues in hand PGampE and BGE do not accrue carrying charges On the other hand IPC WPS National Grid and HECO do For BGE given that the revenue regulation revenues are reconciled and recovered monthly it would make little sense to include a carrying cost Where carrying costs have been used they have included in the cases of these utili-ties the short-term debt rate or the customer deposit rate which for one utility is six percent and probably close to the short-term debt rate Thus the carrying charge rates are appropriately at the lower end of the spectrum reflecting their short-term nature In the application of the carrying charge symmetry should be preserved by applying it to both deficits and surpluses Application of carrying charges given the short period that costs are carried (one year) is somewhat discretionary Although it does more accurately account for costs it does add a modest level of complica-tion in tracking costs
Rate Caps and CollarsOne of the ways to protect customers in the event of sig-
nificant adjustments is to impose a rate cap (or collar) that limits the amount of a rate increase (and decrease) Some customers are sensitive to changes in foundational costs like utility bills and if costs are going to rise they benefit from a pattern of steady modest increases rather than a large step increase Any structural increases in rates attributable
to reductions in sales or increases in costs recognized by the revenue regulation plan would be eventually included in rates under any system A cap reflects a controlled way to manage customer expectations and customer impacts Structural changes can only be managed for a while until a complete rate case is needed to reset all assumptions
Typically when a rate cap is imposed if the formulaic increase exceeds the cap or collar the utility will be able to carry over any uncollected revenues until the next rate adjustment Two of the utilities studied PGampE and HECO do not have rate caps On the other hand the other four utilities do include rate caps in varying amounts National Grid has a one-percent revenue cap whereas IPC and BGE have a one-percent and a ten-percent rate cap respectively WPS unlike the others has a cap tied to the dollar amount of $14 million as opposed to a percentage Consistent with the goals of revenue regulation all of the utilities studied have a carryover provision that is important for reducing the risk that the utility will not recover its revenue require-ments
Note that National Grid differs from BGE and HECO in that its cap is on revenues whereas the other two utilities cap rates and rate impacts A revenue cap is more focused on ensuring minimal change to the revenue requirements authorized by the commission National Grid as discussed previously allows for mini rate cases to adjust the rev-enue requirements Having the one-percent cap limits the amount of increase that can occur through that process requiring revenue changes that are greater to occur in a full rate case However note also that some of the adjustments allowed in the mini rate case have their own separate cap The IPC rate cap is in line with what many other utilities with caps have in place which generally range from one to three percent The ten-percent rate cap in the BGE plan is
Decoupling Case Studies Revenue Regulation Implementation in Six States
34
59 Morgan P (2012 December) Graceful Systems LLC A decade of decoupling for US energy utilities rate impacts designs and observa-tions p5
reflective of its monthly adjustment pattern An annual ad-justment allows more time to smooth out peaks and valleys in revenues whereas a monthly adjustment will be influ-enced by more of the spikes (particularly weather-driven variation) thus the need for a larger bandwidth for the car-ryover Like a variable energy rate or fuel adjustment clause that fluctuates monthly the monthly adjustment introduces more volatility into the rates
Actual Historical AdjustmentsFor many ratepayer advocates there is a concern that
some of the utility management risk will be transferred to customers as a consequence of a policy that seeks to ensure that the utility will be made whole However the utility re-tains management risk and the requirement to demonstrate that it has acted prudently Thus the utility still has just as much of an incentive to operate efficiently as it did without revenue regulation If the utility can lower its costs it can still increase its profits Second by designing rates symmet-rically such that under- and over-recoveries are reconciled it provides customers with an opportunity to obtain credits that under traditional regulation would be retained by the utility It has often been opined that when there are large
gaps in time between utility rate cases it is because the utility is over-earning and exceeding its revenue require-ments In those instances customers never get to examine what the utility is collecting much less receive a refund Under revenue regulation with its periodic adjustments and scheduled general rate cases the revenue requirements are examined and refunds or credits allocated such that customers have a better knowledge base for understanding the utilityrsquos earnings And annual reconciliation of the util-ityrsquos actual revenues versus authorized revenues provides consumers with a tool to reign in excess revenue recovery beyond authorized amounts Third the adjustments that do occur under revenue regulation are manageable and frequently less than the adjustments customers are used to seeing on their bills for fuel or variable generation rates or for the myriad of other surcharges that can be tacked on to a customerrsquos bill such as an infrastructure (smart grid) sur-charge maintenance upgrade fee regulatory asset charge or system benefit charge
As seen in Figure 1 the range of rate impacts cluster around plus or minus two percent but can at times exceed plus or minus five percent The total of surcharges has somewhat exceeded the total of credits
Figure 1
Total Utility Decoupling Adjustment Rate Impacts59
300
250
200
150
100
50
0
Nu
mber
of
Dec
oup
lin
g A
dju
stm
ents
Over -5 -4 to -5 -3 to -4 -2 to -3 -1 to -2 0 to -1 0 to 1 1 to 2 2 to 3 3 to 4 4 to 5 Over 5
Percentage Rate Impacts
SurchargesRefunds
ResidentialAll
Other
Commercial
Total
Decoupling Case Studies Revenue Regulation Implementation in Six States
35
60 Id p 3
61 Schultz T Energy Efficiency at Idaho Power Available at httpwwwenergyidahogovenergyalliancedida_powerpdf
As can be seen with the utilities studied above the larger fluctuations are attributable to adjustment mechanisms that are reconciled more frequently such as monthly as those are less able to smooth out anomalies as an annual adjust-ment would do From a dollar perspective for the roughly 64 percent of adjustments that fall within the plus or minus two-percent range the monthly bill impact is approxi-mately $230 for average electric customers and $140 for average gas customers60
Of the six utilities studied the fluctuations in adjustment have for the most part stayed within the one- to three-per-cent range as shown below
bull PGampE from 2005 to 2012 has had annual revenue regulation adjustments ranging from minus143 percent to 415 percent with an average adjustment of 197 percent
bull For IPC the adjustments are separated between residential and commercial customers For residential customers the annual adjustments from 2007 through 2011 ranged from 077 percent to 258 percent for an average of 162 percent As for the commercial customers the annual adjustments for that same period were higher ranging from 104 percent to 424 percent with an average adjustment of 252 percent
bull BGE has monthly adjustments that ranged from minus1853 percent to 3013 percent with an average of 057 percent for residential customers from March 2008 through August 2012 For General Service Customers the monthly adjustment ranged from minus2264 percent to 2462 percent The average adjustment was 1308 percent
bull For WPS the annual adjustments from 2009 through 2011 ranged from minus145 percent to 378 percent for residential and small commercial and from minus314 percent to 899 percent for commercial Note that because of a $14 million per year cap some of these percentages were carried over The average annual adjustment for residential and small commercial and for commercial was 163 percent and 215 percent respectively with carry-overs to subsequent years
bull For Massachusetts Electric and Nantucket Electric both of which operate under National Grid the annual revenue regulation adjustment for all for 2011 and 2012 was minus0105 percent and 0315 percent for an average revenue regulation adjustment over the two years of 0105 percent
bull HECO like National Grid has one annual revenue
regulation mechanism for its customers which resulted in adjustments in 2011 and 2012 of 063 percent and 107 percent respectively for an average adjustment of 085 percent
As can be gleaned from the above information the range of average adjustments for small use customers was a low of 0105 percent for National Grid to a high of 197 percent for PGampE For larger use customers the range was a low of 0105 percent for National Grid to a high of 252 percent for IPC This demonstrates that on average for these utilities with well-developed and diversely designed revenue regula-tion proposals their adjustments on average stayed at or below approximately 25 percent
One of the metrics for determining if a revenue regula-tion program is working successfully that was discussed above was the impact on rates of a revenue regulation mechanism As can be seen by the analysis of the adjust-ment levels for each of the utilities they are within a rea-sonable range
Complementary Policies Although a revenue regulation mechanism does not need
to be accompanied by other policies energy efficiency is frequently at the root of the reason revenue regulation was proposed in the first place The states examined in this pa-per have various obligations for energy efficiency achieve-ment placed upon their utilities Only Idaho does not have an Energy Efficiency Resource Standard but energy efficiency objectives are developed through an integrated resource plan process Energy efficiency spending at IPC has increased dramatically in recent years61
In recognition of the fact that revenue regulation only removes the disincentive to pursue energy efficiency several states have instituted some form of incentives to reward the desired outcome This mechanism can not only incentivize management to aggressively pursue energy efficiency but also make shareholders supportive in the face of lost invest-ment opportunity
Rate design can also play an important part in assist-ing the utility in achieving favorable energy efficiency outcomes Inclining block rates penalize inefficient use of electricity and shorten payback times from the customer perspective Because efficiency reduces consumption at
Decoupling Case Studies Revenue Regulation Implementation in Six States
36
62 Optional rate designs for PGampE include TOU and Peak Time Pricing
63 IPC also has an optional TOU rate design
64 Optional rate designs for this utility include TOU Critical Peak Pricing and Contract
65 National Grid also offers optional TOU and flat rate designs
66 HECO also offers optional TOU and flat rate designs
67 See eg Alexander B (1996 April) How to construct a service quality index in performance-based ratemaking Electricity Policy
the tail block rate the value of kWh savings is greater than with flat rates On the other side of the spectrum declining block rates which have a reduced rate in the tail block do little to encourage conservation In fact they operate more like a discounted bulk rate by reducing the average cost of a kWh in a customerrsquos bill for the more kWh used
Performance incentives or other ways to avoid destruc-tive cost-cutting in the name of creating margins that reduce service or reliability or lessen customer value have been implemented only in Massachusetts of the six utilities illustrated here Several other states have implemented vari-ous schemes in reaction to perceived deficiencies in utility service67 Performance incentives are not unique to rev-enue regulation Commissions wishing to implement such a scheme can find many models of incentive reward and penalty mechanisms developed for other purposes
Taken together a suite of policy and program features can create an atmosphere that is conducive to achievement of energy efficiency goals within the utility and for the customers By appropriate application of these techniques regulators working with utilities and stakeholders can remove barriers and create an opportunity for energy ef-ficiency to be fully integrated into the utility supply option portfolio
Energy Efficiency OutcomesAlthough revenue regulation itself does not create an
incentive for a utility to implement energy efficiency it does address the issue of lost revenues associated with energy
Table 12
Complementary Policies for Energy Efficiency
Pacific Gas amp Electric62
Idaho Power Company63
Baltimore Gas amp Electric
Wisconsin Public Service Corporation64
National Grid65
Hawaiian Electric Company66
Energy Efficiency Requirement
1 annually
IRP
10 by 2015
075 annually
24 annually
Energy efficiency can satisfy portion of RPS
Default Residential Rate Design
Inclining block
Inclining block
TOU seasonal
Flat
Inclining block
Inclining block
Incentive Structure
Risk reward incentive mechanism
No
No
No
5 of program costs
Third-party administrator paid for contract performance
Performance Incentives
Reliability reporting only
None
Under consideration
Reliability reporting only
Service quality reward and penalty
Under consideration
efficiency and DG programs Revenue regulation should be combined with other mechanisms that require or incentiv-ize the implementation of energy efficiency by the utility or a third party The level of energy efficiency achieved can be one measure of the success of a revenue regulation mechanism as implemented in a larger program designed to achieve energy efficiency Table 13 shows the incremental annual energy efficiency savings reported by each utility with the shaded box indicating the year that the utilityrsquos revenue regulation mechanism was implemented National Grid had achieved a high level of energy efficiency savings in the years before it implemented revenue regulation
This paper has not evaluated DG outcomes to correlate with revenue regulation as it is not perceived that states and utilities have made that connection expressly in histori-cal mechanisms However it is expected that this connec-
Decoupling Case Studies Revenue Regulation Implementation in Six States
37
68 EIA Form EIA-861 data files Available at httpwwweiagovelectricitydataeia861
69 PGampE began revenue regulation in 1974 and it was later suspended and recommenced in 2001
70 WPS savings are represented by the statewide program savings from the Focus on Energy program WPS provided additional funds to Focus on Energy starting in CY10 through their territory-wide program activities
71 In 2009 Hawaii Energy a ratepayer-funded statewide energy efficiency provider began delivering services Savings reported after 2009 represent savings achieved through the programs of Hawaii Energy
Table 13
Annual Incremental Energy Efficiency Savings as Percentage of Retail Sales68
Highlighted cells are the year that utility started decoupling
Pacific Gas amp Electric69
Idaho Power Company
Baltimore Gas amp Electric
Wisconsin Public Service Corporation70
National Grid
Hawaiian Electric Company71
2004
11
01
00
03
11
00
2005
16
03
00
03
09
05
2006
10
05
00
03
12
05
2010
19
13
17
09
136
12
tion will be made in future mechanisms and furthermore it is anticipated that follow on work to this paper will want to study that connection between revenue regulation and DG performance
Conclusions
An increasing number of states are looking to increase the rate of energy efficiency investments for their long-run cost and risk advantages The benefits of energy efficiency include not only its ability to reduce system costs across the distribution transmission and generation functions but also the opportunity for customers to reduce their individ-ual energy costs for their own electric bills Nevertheless it is counterintuitive to encourage or order a utility to sell less of its product In order to encourage the proliferation of en-ergy efficiency programs as a solution that can contribute to this nationrsquos energy needs this tension between the goals of society versus the goals of the utility needs to be addressed Revenue regulation can be such a solution by removing the link between sales and revenues
There are many ways to implement revenue regulation and multiple decision points that regulators must consider in designing a revenue regulation mechanism This paper focused on six utilities each of which implemented revenue regulation in different ways in accordance with the objectives of that state Different decision points discussed include
bull Should revenue regulation apply to all functions (generation transmission and distribution) which sometimes depends on if the utility is regulated or restructured
bull Should revenue regulation apply to all customer classes
bull Should there be symmetry such that a reconciliation adjustment occurs for both over- and under-recoveries of the revenue requirements
bull Should recovery of indicated surcharges be conditioned on acceptable performance on customer service quality or energy efficiency goals
bull Should there be an attrition adjustment to account for other expenses or should the revenue regulation adjustment be limited to reconciling existing revenue requirements
bull Should there be an inflation adjustmentbull To calculate the revenue requirements should the
current or accrual method be usedbull Should the adjustments be made in rate cases or
through a riderbull How frequently should adjustments be made
monthly annually or some other time periodbull Depending on the period of time between true up and
recovery should there be carrying charges and if so how should they be calculated
2007
21
06
00
03
09
04
2008
35
10
05
09
05
05
2009
20
11
06
10
11
11
Decoupling Case Studies Revenue Regulation Implementation in Six States
38
72 Avista Utilities (2009) Washington Utilities and Transportation Commission Docket UE-090134
bull Should there be a requirement authorizing the frequency of rate case
bull Should there be an annual cap on the amount of the adjustment and if so should there be an opportunity to carry over any additional amounts and for how many years
bull Should there be an adjustment to the cost of capital to reflect the reduced risk
Other considerations for regulators whether or not they implement revenue regulation but certainly as part of a comprehensive package are other measures that can be put in place to encourage consumers and utilities alike to actively participate in energy efficiency For example an inclining block rate structure by virtue of its incentive to consume less pairs well with an energy efficiency program helps drive consumers to participate in efficiency programs and accelerates the payback of an energy efficiency investment By the same token an incentive payment to the utility helps provide its management with a good reason to excel and exceed targets for energy efficiency programs
A key point illustrated by the list of considerations above is that there is not just one static way to design and implement revenue regulation but rather there are a variety of options for doing so In this study a diverse group of utilities were reviewed The differences among the utilities included geographic diversity vertically integrated and restructured utilities different levels of energy efficiency in place and certainly differences in how the revenue regulation mechanisms were implemented No two utilities were alike and no two utilities had the same revenue regulation mechanism The key is that revenue regulation should eliminate the throughput incentive but the means for accomplishing this goal can vary and be tailored to each jurisdiction and each utility and still be successful
There are several considerations in the design of a revenue regulation mechanism that can help ensure its successful adoption To begin revenue regulation should be granted to utilities only as a precondition to implementing comprehensive energy efficiency andor DG policies Unless accompanied by a commitment to engage in providing least-cost resource options that could impact sales there is not really any good policy reason for its adoption All of the utilities studied are actively engaging in energy efficiency Furthermore as a matter of fairness the revenue regulation mechanism should be symmetrical so that any revenues above those authorized are refunded back to consumers As Figure 1 demonstrates although there are more surcharges to customers there is nevertheless a healthy amount of
credits back to consumers This is the bargain Barring imprudence or other unforeseen circumstances the utility receives its authorized revenue requirements and nothing more or less under a simple revenue regulation mechanism
Rate design plays an important role in the effectiveness of energy efficiency in concert with revenue regulation A low customer charge is preferable so that the customer can benefit from real bill reductions tied to reduced volumetric consumption Reductions in consumption not only reduce bills but also positively impact the payback period for investments in energy efficient appliances Declining block rates in which the tail block rate is lower than the first tier also do not encourage conservation Inclining block rates that reward low usage in the first block with a lower rate send the better price signals None of the six utilities studied had declining block residential rates They were inclining flat and time-varying
The revenue adjustment mechanism is also a critical decision point in terms of whether a revenue per customer mechanism is adopted that accounts for only the current revenue requirements or whether latitude is given to include an inflation adjustment or other cost increases in the revenue adjustment mechanism Three of the utilities studied adopted this approach whereas another two used a hybrid approach Finally to reduce volatility five of the six utilities opted for annual rather than monthly adjustments thereby creating a level of rate stability that customers in general prefer
Once the goals for revenue regulation are set by the regulators the next step is to design programs that will implement that goal For energy efficiency to be as successful as possible regulators may want to adopt a complement of other policies to accompany revenue regulation These can include rate designs that reward reduced use and conservation as well as incentive payments to utilities that reward them for meeting or exceeding targets Of the six utilities studied three have adopted some form of incentive One simple approach that was used in Washington was to link recovery of any surcharges under the revenue regulation mechanism to achievement of energy efficiency targets72
For the utilities examined above that have implemented revenue regulation the evidence demonstrates that revenue regulation as a strategy and a mechanism to enable
Decoupling Case Studies Revenue Regulation Implementation in Six States
39
energy efficiency has been working well The fact that each revenue regulation mechanism varies from the next demonstrates that there are many different paths that can be followed in implementing revenue regulation based on the needs of the utility and its stakeholders in a particular
region This study demonstrates that revenue regulation does work and provides examples of how it can be implemented each one different and unique because of the number of decision points to be considered in designing a revenue regulation mechanism
Decoupling Case Studies Revenue Regulation Implementation in Six States
40
Appendix
Historic Rate Adjustments
Table 14
PGampE Revenue Regulation Rate Adjustments 1983 to 199373
Table 15
PGampE Revenue Regulation Adjustments 2005 to 201274
Table 16
IPC Revenue Regulation Adjustments76
Idaho Power Company
1983 23
1984 (34)
1985 (48)
1986 19
1987 21
1988 50
1989 (43)
1990 (54)
1991 39
1992 34
1993 00
2005 8925 minus12773 minus143
2006 9933 2246 226
2007 10409 21727 209
2008 10261 4032 039
2009 11169 10355 093
2010 11224 46556 415
2011 10306 38390 373
2012 11032 40304 365
2007 Residential minus00457 590 minus077
Commercial minus00457 428 minus107
2008 Residential 00529 670 090
Commercial 00529 510 104
2009 Residential 01220 770 158
Commercial 01535 603 255
2010 Residential 01800 785 229
Commercial 02273 613 371
2011 Residential 02028 785 258
Commercial 02597 613 424
Revenue Regulation Adjustment as of
Total Rates
Delivery Revenue
Requirement ($ millions)
Adjustment Rate
Revenue Regulation Adjustment($ millions)
Retail Rate
of Delivery Revenue
Revenue Regulation Adjustment
Year
Year
73 Lesh P (2009 June 30) Rate impacts and key design elements of gas and electric utility decoupling
74 Morgan P (2012 November) A decade of decoupling for US energy utilities rate impacts designs and observations
75 Morgan P (2012 November) A decade of decoupling for US energy utilities rate impacts designs and observations
76 All numbers provided by the utility
Decoupling Case Studies Revenue Regulation Implementation in Six States
41
77 Idaho Power Company Case No IPC-E-11-19- fixed cost adjustment permanent mechanism Available at httpwwwpucidahogovinternetcaseselecIPCIPCE1119company20120928COMPLIANCE20FILINGPDF
Figure 2
IPC Revenue Regulation Adjustments77
Residential FCA Balance and Use per Customer
$10000000
$8000000
$6000000
$4000000
$2000000
$0
-$2000000
-$4000000
-$6000000
1080
1070
1060
1050
1040
1030
1020
1010
1000Res
idu
al A
uth
oriz
ed F
CA
Am
oun
t
Residual Authorized FCA Amount ($)
Monthly Use Per Customer (kWh)
kW
h U
sed
2006 2007 2008 2009 2010 2011
78 Morgan P (2012 November) A decade of decoupling for US energy utilities rate impacts designs and observations
Decoupling Case Studies Revenue Regulation Implementation in Six States
42
Table 17a
Baltimore Gas and ElectricBGE Monthly Revenue Regulation Adjustments 2008 to 201278
Table 17b
Baltimore Gas and ElectricBGE Monthly Revenue Regulation Adjustments 2008 to 201278
March Residential 000172 01477 1165General Service 000230 01526 1507
April Residential 000016 01477 0108General Service 000146 01526 0957
May Residential 000066 01477 0447General Service 000230 01526 1507
June Residential minus000066 01477 minus0447General Service 000230 01526 1507
July Residential 000158 01477 1070General Service 000230 01526 1507
August Residential minus000040 01477 minus0271General Service 000214 01526 1402
September Residential 000237 01477 1605General Service 000230 01526 1507
October Residential 000237 01477 1605General Service 000143 01526 0937
November Residential 000237 01477 1605General Service 000140 01526 0917
December Residential 000445 01477 3013General Service 000230 01526 1507
January Residential 000035 01579 0222General Service minus000073 01346 minus0542
February Residential 000025 01579 0158General Service 000230 01346 1709
March Residential minus000237 01579 minus1501General Service 000230 01346 1709
April Residential minus000237 01579 minus1501General Service 000230 01346 1709
May Residential 000234 01579 1482General Service 000132 01346 0981
June Residential 000237 01579 1501General Service 000230 01346 1709
July Residential 000237 01579 1501General Service 000230 01346 1709
August Residential 000237 01579 1501General Service 000190 01346 1412
September Residential 000237 01579 1501General Service 000230 01346 1709
October Residential 000237 01579 1501General Service 000124 01346 0921
November Residential 000237 01579 1501General Service 000230 01346 1709
December Residential 000156 01579 0988General Service 000204 01346 1516
Adjustment $kWh
Adjustment $kWh2008 2009
Retail Rate
$kWh
Retail Rate
$kWhAdjustment
Adjustment
Decoupling Case Studies Revenue Regulation Implementation in Six States
43
Table 17c
Baltimore Gas and ElectricBGE Monthly Revenue Regulation Adjustments 2008 to 201278
Table 17d
Baltimore Gas and ElectricBGE Monthly Revenue Regulation Adjustments 2008 to 201278
January Residential 000203 01465 1386General Service 000230 01261 1824
February Residential minus000142 01465 minus0969General Service 000230 01261 1824
March Residential minus000237 01465 minus1618General Service 000230 01261 1824
April Residential minus000237 01465 minus1618General Service 000230 01261 1824
May Residential 000192 01465 1311General Service 000230 01261 1824
June Residential 000191 01465 1304General Service 000230 01261 1824
July Residential 000095 01465 0648General Service 000230 01261 1824
August Residential minus000176 01465 minus1201General Service 000224 01261 1776
September Residential minus000237 01465 minus1618General Service 000116 01261 0920
October Residential minus000237 01465 minus1618General Service 000081 01261 0642
November Residential minus000237 01465 minus1618General Service 000098 01261 0777
December Residential minus000079 01465 minus0539General Service 000229 01261 1816
January Residential minus000130 01365 minus0952General Service 000230 01156 1990
February Residential minus000253 01365 minus1853General Service minus000020 01156 minus0173
March Residential minus000018 01365 minus0132General Service minus000063 01156 minus0545
April Residential 000110 01365 0806General Service minus000262 01156 minus2266
May Residential 000010 01365 0073General Service minus000160 01156 minus1384
June Residential 000226 01365 1656General Service 000042 01156 0363
July Residential 000253 01365 1853General Service 000209 01156 1808
August Residential minus000007 01365 minus0051General Service minus000157 01156 minus1358
September Residential minus000253 01365 minus1853General Service minus000177 01156 minus1531
October Residential 000228 01365 1670General Service 000262 01156 2266
November Residential minus000059 01365 minus0432General Service 000262 01156 2266
December Residential 000071 01365 0520General Service 000262 01156 2266
Adjustment $kWh
Adjustment $kWh2010 2011
Retail Rate
$kWh
Retail Rate
$kWhAdjustment
Adjustment
Decoupling Case Studies Revenue Regulation Implementation in Six States
44
Table 17e
Baltimore Gas and ElectricBGE Monthly Revenue Regulation Adjustments 2008 to 201278
January Residential 000253 01291 1960General Service 000262 01064 2462
February Residential 000253 01291 1960General Service 000262 01064 2462
March Residential 000253 01291 1960General Service 000262 01064 2462
April Residential 000253 01291 1960General Service 000262 01064 2462
May Residential 000253 01291 1960General Service 000262 01064 2462
June Residential 000253 01291 1960General Service 000262 01064 2462
July Residential 000253 01291 1960General Service 000262 01064 2462
August Residential 000253 01291 1960General Service 000160 01064 1504
Adjustment $kWh2012
Retail Rate
$kWhAdjustment
Decoupling Case Studies Revenue Regulation Implementation in Six States
45
79 Morgan P (2012 November) A decade of decoupling for US energy utilities rate impacts designs and observations
80 Morgan P (2012 November) A decade of decoupling for US energy utilities rate impacts designs and observations
Table 18
Wisconsin Public Service Corporation Revenue Regulation Adjustments 2009 to 201179
2009 ResidentialSmall Commercial 00048705 000168154 01290 378 130Commercial 00084951 000293293 00945 899 310
2010 ResidentialSmall Commercial 00033043 000166936 01291 256 129Commercial 00056630 000286103 09460 060 030
2011 ResidentialSmall Commercial (00018666) $ (000163719) 01288 minus145 minus127Commercial (00032565) $ (000285629) 01037 minus314 minus275
Derived Adjustment
$kWh
Derived Adjustment Capped $
kWh
Retail Rate
$kWh
Revenue Regulation Actual
Revenue Regulation Capped
Table 19
National Grid Revenue Regulation Adjustments 2011-201276
Massachusetts Electric and Nantucket Electric
Table 20
Hawaiian Electric Company
2011 All minus0015 1429 minus0105
2012 All 0044 1396 0315
2011 01995 3149 063
2012 03894 3641 107
Revenue Regulation Adjustment
centkWh
Revenue Regulation Adjustment
centkWhRetail Rate
centkWh
Retail Rate
Revenue Regulation Adjustment
Revenue Regulation
ldquoThe 2011 adjustment took effect June 1 but was reduced to $0 on July 26 2011 when the Commission granted HECO an interim rate increase of $532 million in a 2011 test year general rate case The 2012 Adjustment runs from June 1 2012 through May 31 2013 About 25 of the total relates to the portion of the decoupling mechanism that updates OampM and rate baserdquo (Morgan 2013)
Decoupling Case Studies Revenue Regulation Implementation in Six States
46
Revenue Regulation and Decoupling A Guide to Theory and Applicationhttpwwwraponlineorgdocumentdownloadid902
This guide was prepared to assist anyone who needs to understand both the mechanics of a regulatory tool known as decoupling and the policy issues associated with its use This would include public utility commissioners and staff utility management advocates and others with a stake in the regulated energy system While this guide is somewhat technical at points we have tried to make it accessible to a broad audience to make comprehensible the underlying concepts and the implications of different design choices This guide includes a detailed case study that demonstrates the impacts of decoupling using different pricing structures (rate designs) and usage patterns
Pricing Dorsquos and Donrsquots Designing Retail Rates as if Efficiency Countshttpwwwraponlineorgdocumentdownloadid939
Rate design is a crucial element of an overall regulatory strategy that fosters energy efficiency and sends appropriate signals about efficient system investment and operations Rate design is also fully under the control of state regulators Progressive rate design elements can guide consumers to participate in energy efficiency programs and reduce peak demand yet relatively few utilities and commissions have implemented many of these elements This RAP paper identifies some best practices Because pricing issues tie closely to utility growth incentives we also address revenue decoupling
A Decade of Decoupling for US Energy Utilities Rate Impacts Designs and Observationshttpwwwraponlineorgdocumentdownloadid6356
This report written by Pamela Morgan of Graceful Systems LLC builds on a 2009 report Now covering 25 states including 49 LDCs and 24 electric utilities this report summarizes the decoupling mechanism designs these utilities use and the rate adjustments they have made under those mechanisms In total this report estimates the retail rate impacts of 1244 decoupling mechanism adjustments since 2005
Additional Resources
The Role of Decoupling Where Energy Efficiency is Required by Lawhttpwwwraponlineorgdocumentdownloadid275
This Issuesletter gives an overview of energy efficiency resource standards the need to decouple utility profits from utility sales and explains why decoupling is needed even where a third party administers energy efficiency programs
Revenue Decoupling Standards and Criteria A Report to the Minnesota Public Utilities Commissionhttpwwwraponlineorgdocumentdownloadid850
In 2007 the Minnesota legislature enacted a new statute Section 216B2412 in which it defined an alternative approach to utility regulation decoupling and directed the Public Utilities Commission (PUC) to ldquoestablish criteria and standardsrdquo by which decoupling could be adopted for the statersquos rate-regulated utilitiesTo fulfill its obligation to develop criteria and standards for decoupling the PUC sought the advice of the Regulatory Assistance Project (RAP) This report is the output of that collaboration
Designing Distributed Generation Tariffs Wellhttpwwwraponlineorgdocumentdownloadid6898
Improvements in distributed generation economics increasing consumer preference for clean distributed energy resources and a favorable policy environment in many states have combined to produce significant increases in distributed generation adoption in the United States Regulators are looking for the well-designed tariff that compensates distributed generation adopters fairly for the value they provide to the electric system compensates the utility fairly for the grid services it provides and charges non-participating consumers fairly for the value of the services they receive This paper offers regulatory options for dealing with distributed generation The authors outline current tariffs and ponder what regulators should consider as they weigh the benefits costs and net value to distributed generation adopters non-adopters the utility and society as a whole The paper highlights the importance of deciding upon a valuation methodology so that the presence or absence of cross-subsidies can be determined Finally the paper offers rate design and ratemaking options for regulators to consider and includes recommendations for fairly implementing tariffs and ratemaking treatments to promote the public interest and ensure fair compensation
Decoupling Case Studies Revenue Regulation Implementation in Six States
47
The Regulatory Assistance Project (RAP)trade is a global non-profit team of experts focused on thelong-term economic and environmental sustainability of the power sector We provide technical and policy assistance on regulatory and market policies that promote economic efficiency environmental protection system reliability and the fair allocation of system benefits among consumers We work extensively in the US China the European Union and India Visit our website at wwwraponlineorg to learn more about our work
Rate Design Where Advanced Metering Infrastructure Has Not Been Fully Deployedhttpwwwraponlineorgdocumentdownloadid6516
This paper identifies sound practices in rate design applied around the globe using conventional metering technology Rate design for most residential and small commercial customers (mass market consumers) is most often reflected in a simple monthly access charge and a per-kWh usage rate in one or more blocks and one or more seasons A central theme across the practices highlighted in this paper is that of sending effective pricing signals through the usage-sensitive components of rates in a way that reflects the character of underlying long-run costs associated with production and usage While new technology is enabling innovations in rate design that carry some promise of better capturing opportunities for more responsive load the majority of the worldrsquos electricity usage is expected to remain under conventional pricing at least through the end of the decade and much longer in some areas Experience to date has shown that the traditional approaches to rate design persist well after the enabling technology is in place that leads to change
Time-Varying and Dynamic Rate Designhttpwwwraponlineorgdocumentdownloadid5131
This report discusses important issues in the design and deployment of time-varying rates The term time-varying rates is used in this report as encompassing traditional time-of-use rates (such as time-of-day rates and seasonal rates) as well as newer dynamic pricing rates (such as critical peak pricing and real time pricing) The discussion is primarily focused on residential customers and small commercial customers who are collectively referred to as the mass market The report also summarizes international experience with time-varying rate offerings
50 State Street Suite 3Montpelier Vermont 05602802-223-8199wwwraponlineorg
- Table of Contents
- Introduction
- California Pacific Gas and Electric Company
- Idaho Idaho Power Company
- Maryland Baltimore Gas and Electric
- Wisconsin Wisconsin Public Service Corporation
- Massachusetts National Grid
- Hawaii Hawaiian Electric Company
- Discussion of the Six Utilities Overall
- Conclusions
- Appendix
- Additional Resources
-
Decoupling Case Studies Revenue Regulation Implementation in Six States
15
1 Calculate the revenue adjustment for the change in the number of customers by multiplying the change in the number of customers by the Customer Charge
2 Calculate the revenue adjustment associated with the change in sales by multiplying the change in the number of customers by the average use per customer and multiplying that product by the Delivery Price for the class
3 Calculate the target base revenues for each class for the current period by adding the two types of adjustments to the revenue requirement
The Delivery Price for each class is the delivery rate established by the PSC adjusted for the electric universal service charge nuclear decommissioning credits and the administrative credit associated with the administrative adder portion of the Standard Offer Service rates22
BGE had a full electric and gas rate case in 201023 and another one filed in 2013 and concluded in 201424 Both reset the required decoupling elementsmdashmonthly revenue requirement monthly average usage per customer and number of customers Neither case changed the mechanism
The decoupling mechanism now excludes lost sales resulting from major storms
Reconciling Actual Revenue With Authorized Revenue
On a monthly basis each rate classrsquos target base revenues are compared to the actual base revenues for the month The difference is divided by the forecasted sales for the following period to calculate the monthly rate adjustment Balancing accounts are used to record the timing differ-ences associated with when the adjustments are calculated versus when they are billed or refunded The monthly rate adjustment Rider 25 is capped at ten percent of rates Any amount beyond ten percent of the current rate will be car-ried over and reconciled in the subsequent period
Complementary PoliciesMaryland requires its electric utilities to provide energy
efficiency services to achieve a ten-percent reduction in per capita electricity use by 2015 The statersquos overall goal is a 15 percent reduction of per capita electricity use by 2015 Although the PSC is explicitly allowed to approve financial incentive mechanisms to promote energy efficiency no incentives have been approved yet25
BGErsquos default service to its standard offer residential cus-tomers (those customers who have not elected to take gen-eration service from an alternate supplier) features seasonal
ratesmdashsummer and winter BGE also offers a TOU rate as an option to standard offer residential customers and as the default rate for small general service customers
Regarding performance incentives under revenue regula-tion in October 2012 Maryland issued a four-part plan designed to speed up investments that will strengthen the statersquos distribution grid Part of that plan would set a rate-making structure that aligns customer and utility incentives by rewarding reliability that exceeds established reliability metrics and penalizing failure to reach those metrics A task force has encouraged the Maryland state regulatory com-mission to implement a performance-based ratemaking process for IOUs such as BGE linking a utilityrsquos progress or failure to meet certain reliability metrics with its authorized rate of return
Energy Efficiency OutcomesWhen BGE implemented electric revenue regulation in
mid 2007 it had not achieved incremental energy savings for several years In 2008 it reported incremental savings of 05 percent of retail load increasing to 17 percent in 2010 and 2011
ResourcesMaryland Public Service CommissionLetter Order ML 108061 (December 27 2007)Letter Orders ML 108069 (November 30 2007) Case No 9036 Order No 80460 (December 21 2005) Case No 9230 Order No 83907 (December 13 2013) Case No 9326 Order No 86060 (December 13 2013)
22 BGE (2007 October 26) 9111FilingConser-va102607F Available at httpwebapppscstatemdusintranetmaillogcontentcfmfilepath=C5CCasenum5CAdmin20Filings5C60000-1099995C1080615C9111FilingConserva102607Fpdf
23 Case No 9230 ndash See references above
24 Case No 9326 ndash See references above
25 ACEEE Maryland Available at httpaceeeorgsectorstate-policymarylandEnergy Efficiency Resource Standards
26 EIA Form EIA-861 data files Available at httpwwweiagovelectricitydataeia861
Decoupling Case Studies Revenue Regulation Implementation in Six States
16
27 The pilot extension is in effect until the effective date of a Final Decision issued by the Commission on an application for a general base rate case filed after January 1 2013
28 Except the Direct Load Control Cp - Large Commercial amp Industrial Service Cp-ND - Pilot Large Commercial amp Industrial - Day Ahead Cp-RR - Large Commercial amp Industrial Response Rewards Automatic Transfer Switch Parallel Generation Lighting Nature Wise and Real Time Market Pricing tariffs
Wisconsin Wisconsin Public Service Corporation
Wisconsin Public Service Corporationrsquos (WPS) Revenue Stabilization Mechanism (RSM) began in 2009 as a four-year revenue regulation pilot that reconciled
target marginal revenue per customer with actual marginal revenue per customer As of 2012 the pilot was extended27 albeit with some modifications This section focuses on the current iteration of the RSM
AuthorityThe Public Service Commission of Wisconsin (PSCW)
approved a revenue regulation pilot for WPS in a Decem-ber 2008 rate case order (Docket No 6690-UR-119) The revenue regulation mechanism was effective from January 1 2009 through December 31 2012 and applied to the util-ityrsquos electric and gas operations In a rate case completed in December 2012 (Docket No 6690-UR-121) the pilot was extended and a modified RSM was approved The extended RSM is in effect from January 2013 until the next rate case
Authorized Revenue RequirementThe authorized revenue requirement is determined
through a rate case The Commission uses a future test year to determine the revenue requirement The cost of fuel is not included in the revenue requirement but is addressed through a ldquoRetail Electric Fuel Rulerdquo adjustment
Rate of ReturnThe Commission authorized a rate of return on utility
common equity of 1030 percent in Docket No 6690-UR-120 This rate remained the same in Docket No 6690-UR-121 and is currently in effect
Revenue Adjustment MechanismWPS implemented a new electric RSM based on a ldquoTotal
Rate Case Marginrdquo mechanism instead of a ldquoTotal Rate Case Margin per Customerrdquo mechanism which had been the practice during the initial four-year pilot phase The revision was intended to remove the calculation sensitivities related
to sales per customer from the original RSM calculation The margin reflected in the formula equals the total revenue for each tariff less the costs associated with the annual per-kWh value established for monitored fuel costs and excluding any surcharges credits taxes or similar charges The ldquoTotal Rate Case Marginrdquo mechanism allows WPS to achieve the total margin assumed in the forecasted test year no more and no less The new RSM will be in effect on a pilot basis until the effective date of WPSrsquos next general rate order which WPS committed to filing for the 2014 andor 2015 test years The RSM applies to most tariffs except large commercial and industrial customers28
Reconciling Actual Revenue With Authorized Revenue
Each year the utility compares the total target revenue and the total actual revenue and defers the difference subject to carrying costs based on WPSrsquos last approved short-term debt rate The margin will be based on annual per-kWh value established for monitored fuel costs which is done in a rate case The margin is determined by subtracting the aver-age kWh value from the authorized energy rates
The formula for calculating an electric under-recovery or over-recovery is
Under-recovery or over-recovery equals
[actual margin minus ratecase forecasted margin established in the most recent rate proceeding]
The summation is over each tariff A positive value equals an over-recovery and a negative value equals an
Decoupling Case Studies Revenue Regulation Implementation in Six States
17
29 The required spending level was higher for the year 2011 owing to a temporary change in state policy
30 ACEEE Wisconsin Available at httpaceeeorgsectorstate-policywisconsin
31 The Cadmus Group Inc (2013)
under-recovery The margin reflected in the formula equals the total revenue for each tariff less the costs associated with the annual per-kWh value established for monitored fuel costs and excluding any surcharges credits taxes or similar charges
In the event that a true-up will cause rates to increase the Commission will provide an opportunity for a hear-ing Revenue regulation adjustments occur as a part of the general rate case
The revenue regulation adjustments are subject to a $14 million per year cap for electric excluding carrying costs Any adjustments over that amount will not be carried over and will not be collected from ratepayers Equivalently revenue over collection in excess of $14 million will not be returned to ratepayers
Complementary PoliciesWPS like all other investor-owned utilities
in Wisconsin is required to spend 12 per-cent of its annual operating revenues on en-ergy efficiency and customer-owned renew-able resource programs that are administered by a third party through the Focus on Energy program which was established in 200229 Separately through a contract the PSCW ap-proves annual electricity savings goals for the Focus on Energy program The savings goals were equivalent to 075 percent of electric sales for the participating utilities from 2011 to 2013 In addition the PSCW approved a rate of return on investments in energy efficiency for Wisconsin Power amp Light and other utilities can propose incentives as part of their rate cases However WPS has not yet proposed an incentive mechanism30
WPS offers residential customers a default flat rate but they also offer a TOU option with winter and summer on-peak off-peak and shoulder tiers For small commercial and industrial customers there are flat rates TOU rates and critical peak rates Large commercial and industrial customers can take service under a TOU rate with summer and winter on-peak and off-peak rates a TOU with criti-cal peak rate or under a special contract rate unique to the customer and approved by the Commission
The authorized level of expensed conservation costs recoverable in rates for the test year (2013) is $19778728 The level for electric utility operations consists of the conservation budget of $17669792 and an escrow adjustment of $2108936 which represents the test year amortization of the projected overspent escrow balance at
December 31 2012 over two years Wisconsin has a statute requiring filing of reliability data
but no reward or penalty system to support its revenue regulation system
Energy Efficiency OutcomesWPS implemented revenue regulation in 2009 In order
to gain approval for the original revenue regulation mecha-nism WPS agreed to fund energy efficiency and renewable energy programs at levels above their 12-percent statutory minimum contribution to Focus on Energy Focus on Energy produces an annual report of energy efficiency program activities In its 2012 report Focus on Energy reports the following outcomes achieved for WPSrsquo service territory The table below represents the savings under the statewide Focus on Energy Programs and does not represent the savings at-tributed under the funding levels above 12 percent31
Territory Segment
Customer Participation
Rate () Utility Type
Per Capita Lifecycle Bill Savings ($)
Per Capita Incentive
($)
WPS Electric Commercial $115258 3 $8330
WPS Electric Industrial $9026768 96 $892463
WPS Electric Residential $6494 36 $666
ResourcesPublic Service Commission of WisconsinApplication of Wisconsin Public Service Corporation for
Authority to Adjust Electric and Natural Gas Rates Final Decision (December 7 2012) Docket No 6690-UR-121
David J Kyto Wisconsin Public Service Corporation Application of Wisconsin Public Service Corporation for
Authority to Adjust Electric and Natural Gas Rates Supplemental Direct Testimony (May 15 2012) Docket No 6690-UR-121
Focus on EnergyThe Cadmus Group Inc (2013) Focus on Energy Calendar
Year 2012 Evaluation Report Appendixes Portland OR The Cadmus Group Inc Retrieved from httpwwwfocusonenergycomsitesdefaultfilesFOC_XC_CY201220Report20Appendices20A-O20Final2005-3-13pdf
Decoupling Case Studies Revenue Regulation Implementation in Six States
18
32 DPU 07-50 (2007)
33 DPU 07-50 (2007) pp 392ndash396
Massachusetts National Grid
The revenue regulation mechanism for National Grid (Massachusetts Electric Company and Nantucket Electric Company together doing business as National Grid) compares authorized
distribution revenue to actual distribution revenue Revenue is compared and adjustments are made separately for each customer class
AuthorityThe Massachusetts Department of Public Utilities (DPU)
adopted revenue regulation as a statewide regulatory policy in 2008 and individual utilities filed revenue regulation tariffs in response In its Investigation Into Rate Structures that will Promote Efficient Deployment of Demand Resources32 the DPU investigated rate structures and revenue recovery mechanisms that may reduce disincentives to the efficient deployment of demand resources in the state and consid-ered how the electric and natural gas distribution compa-niesrsquo existing cost recovery mechanism could be changed to better align the companiesrsquo financial incentives with policy objectives while ensuring that the companies are not finan-cially harmed by the increased use of demand resources The DPU finally concluded that revenue regulation mecha-nisms would eliminate the financial disincentives because they sever the link between the companiesrsquo revenue and reduction in sales The DPU also endorsed a revenue per customer approach but recognized that other factors could result in changes to distribution-related costs and consent-ed to consider company-specific ratemaking proposals that accounted for the impact of capital spending and inflation-ary pressures on the companyrsquos required revenue
Authorized Revenue RequirementThe authorized revenue requirement does not include
costs that are reconciled outside of base distribution rates including energy supply costs for basic service customers transmission costs the energy efficiency system benefits charge and reconciling charge and costs recovered through the residential assistance adjustment factor
Rate of ReturnThe Commission recognized the effects of revenue
regulation on ROE and determined that revenue regulation reduces volatility which reduces risk and a downward ad-justment to ROE was appropriate but did not make its ac-tual ROE adjustment for the revenue regulation mechanism explicit in its order33 The DPU determined that a return on equity equal to 1035 percent was sufficient The testimony from National Grid supporting its proposed ROE presented comparisons of allowed ROE for a set of companies that had revenue regulation or another risk management mecha-nism in place to account for an implied reduced risk profile in developing that proposal
Revenue Adjustment MechanismEach year the authorized revenue requirement is ad-
justed to account for capital expenditures in the previous year The CapEx Adjustment applies to capital expenditures incurred by National Grid for distribution system invest-ments in the previous year net of the amount recovered through depreciation expense in base rates This accounts for the material difference in expected capital expenditures compared with prior years In this way the CapEx Adjust-ment in the National Grid revenue regulation mechanism is a special case of a ldquoK Factorrdquo which characterizes an expected change in costs in the future and accounts for those changes when they occur Each year the Company files with the Department documentation in support of the capital expenditures it has incurred since the previous review The Department reviews the filings to determine the prudence of the incremental expenditures and whether the expenditures are used and useful National Grid then allocates approved expenditures to rate classes based on the cost of service study For each class the Company determines the adjustment allocated to the rate class then divides this sum by the forecasted kWh sales for the follow-
Decoupling Case Studies Revenue Regulation Implementation in Six States
19
34 DPU 07-50 (2007) p 87
35 ACEEE Massachusetts Available at httpaceeeorgsectorstate-policymassachusetts
36 Personal communication with National Grid
ing year to determine the per-kWh adjustment In order to provide a balance between providing the
Company with sufficient funds to ensure the safety and reliability of the distribution system and protecting ratepay-ers against the incentive the Company has to overinvest in infrastructure the mechanism limits the level of annual capital expenditures that is recoverable through the mecha-nism To arrive at the amount the Department set a limit of $170 million per year which is equal to the approximate three-year average of the Companyrsquos capital spending in previous years Should the Companyrsquos capital expenditures exceed this limit it may seek to include the investment in the rate base during the next base rate proceeding
The Company submits its CapEx filing no later than July 1 of each year On November 1 of each year the Company submits all other information in support of its proposed adjustment factors The factors will take effect on March 1 of each year
The authorized revenue is also adjusted to include a 50-percent sharing for earnings above the authorized ROE
Reconciling Actual Revenue With Authorized Revenue
Each year National Grid calculates on a rate class-spe-cific basis the difference between the actual distribution revenue billed to customers through distribution rates and the annual target revenue For each rate class the difference between the actual billed distribution revenue and the an-nual target revenue is summed to determine the Company-wide reconciliation amount That amount is divided by the Company-wide kWh forecasted for the upcoming year to arrive at a cent-per-kWh reconciliation charge or credit To determine the final adjustment for each rate class the Company-wide reconciliation adjustment is added to the rate class-specific adjustment resulting from the target rev-enue adjustment mechanisms
The adjustment to the authorized revenue in any year is capped at three percent of total revenues34 Any excess can be carried forward to a future year with carrying charges equal to the customer deposit rate
National Grid must report to the DPU if the difference between the year-to-date billed revenue and year-to-date annual target revenue equals or exceeds ten percent of the target revenue and the Company believes that the difference will fall outside of the ten-percent threshold in the coming months In this case interim revenue regulation adjust-ments can be made In order to avoid an interim adjust-ment too close to the scheduled annual rate adjustment
National Grid must notify the Department of variances exceeding ten percent of annual target revenue by August 31 of each year
Complementary Policies Massachusetts requires that electric utilities procure
all cost-effective energy efficiency before more expensive supply-side resources This requirement was translated into annual savings requirements for electric utilities starting from 1 percent of sales in 2009 to 14 percent in 2010 2 percent in 2011 and 24 percent in 2012 and potentially increased savings in subsequent years Utilities can earn approximately five percent of program costs for meeting or exceeding savings targets35
National Grid offers inclining block rates as the default residential rate but there is an optional TOU rate with peak and off-peak tiers also available to residential customers Small and large industrial and commercial customers can take service under flat rates inclining block rates or TOU rates
National Grid operates under a penalty and reward sys-tem for service quality established in Docket DTE 99-84 The impetus behind the DPUrsquos original establishment of the Service Quality Guidelines was to prevent Massachusetts utilities from allowing service quality to deteriorate under a new regulatory regime
Energy Efficiency OutcomesBefore Massachusetts Electric implemented revenue
regulation in 2009 it reported consistently high levels of incremental energy efficiency savings approximately 09 percent of retail load In 2010 the company reported 136 percent savings and 159 percent in 2010 and 2011 respectively36
ResourcesMassachusetts Department of Public UtilitiesDocket 09-39 Petition of Massachusetts Electric Company
(November 30 2009)
Decoupling Case Studies Revenue Regulation Implementation in Six States
20
37 Energy Agreement Among the State of Hawaii Division of Consumer Advocacy of the Department of Commerce amp Consumer Affairs and Hawaiian Electric Companies Available at httpwwwhecocomvcmcontentStaticFilespdfHCEIpdf
38 The HECO Companies described as follows in their Reply SOP in the Schedule A decoupling proceedings ldquothe
Hawaii Hawaiian Electric Company
Hawaiian Electric Company (HECO) uses a revenue regulation mechanism that compares actual revenue to target revenue in each year The target revenue is based on the authorized
revenue for the last test year adjusted for operation and maintenance (OampM) increases and rate base changes
HECO is a subsidiary of Hawaiian Electric Industries which also operates Maui Electric Company (MECO) and Hawaiian Electric Light Company these subsidiaries service the islands of Maui and Hawaii County while HECO serves Oahu (Honolulu)
Authority In 2008 the Governor of Hawaii the Division of Con-
sumer Advocacy and HECO entered into an agreement as a result of the Hawaii Clean Energy Initiative37 The agreement is intended to move Hawaii away from its dependence on imported fossil fuels for electricity and ground transporta-tion and toward locally produced renewable energy and energy efficiency In the agreement the State the Consumer Advocate and HECO committed to among other things a transition away from a model that encourages increased elec-tricity usage and to a model that implements revenue regula-tion decoupling to encourage the development of renewable energy by HECO The Commission opened Docket 2008-0274 in order to examine the features of a revenue regula-tion mechanism The Opening Order directed HECO and the Consumer Advocate to file a joint proposal on revenue regulation within 60 days This joint proposal was modeled closely after the California mechanism described earlier for PGampE with a rate-case determined revenue requirement plus annual attrition adjustments plus separate mechanisms
to recover power supply and energy efficiency costsThe Hawaii Public Utilities Commission approved
revenue regulation for HECO in August 2010 based on an investigation into the appropriateness of revenue regula-tion and its design The revenue regulation mechanism took effect on March 1 2011 This replaced a previous lost revenue adjustment mechanism
Authorized Revenue RequirementThe Commission establishes the Authorized Base Rev-
enues through a general rate case based on traditional cost-of-service ratemaking principles The Authorized Base Revenue is the annual amount of revenues required for the utility to recover its estimated OampM depreciation amorti-zation and tax expenses for the period
The Target Revenue is equal to the base revenue require-ment less any revenue being separately tracked or recov-ered through any other surcharge or tracking mechanism including revenue for fuel and purchased power expenses
The revenue regulation order also requires staggered triennial rate cases for each of the Hawaiian Electric Indus-tries Companies to determine approved baseline Revenue Adjustment Mechanism (RAM) inputs
Rate of ReturnThe Commission made no explicit adjustment to ROE
owing to the revenue regulation mechanism but noted that the allowed ROE of ten percent reflects the approval of revenue regulation and other cost-recovery mechanisms that will lower HECOrsquos business risk38 Most recently the Hawaiian Public Utilities Commission approved a 90-per-cent ROE for MECO reflecting both a lower baseline cost
Commission effectively reduced the Companiesrsquo return on common equity by 50 basis points to ldquofairly compensate ratepayersrdquo for what it perceived as the ldquorisk-reducingrdquo effects of the RBA and RAM mechanisms the Renewable Energy Infrastructure Program (lsquoREIPrdquo) Surcharge and the Purchased Power Adjustment Clause (ldquoPPACrdquo)rdquo Available at httpdmspuchawaiigovdmsDocumentViewerpid=A1001001A10L29B55326B47993
Decoupling Case Studies Revenue Regulation Implementation in Six States
21
39 Hawaii PUC Decision and Order No 31288 (2013 May 31) pp 97ndash112
40 Hawaii PUC Decision and Order No 31289 (2013 May 31)
41 Hawaii PUC Decision and Order No 31908 (2014 Feb 1)
42 February 7 2014 order on schedule A issues Available at httpdmspuchawaiigovdmsDocumentViewerpid=A1001001A14B10B22326F07922 p 42ndash47
of capital and a penalty of 050 percent associated with inadequate performance bringing renewable energy into the MECO system39 A companion Order also established new guidance on future revenue regulation mechanisms40
Revenue Adjustment MechanismThe RAM is designed to replace the need for annual rate
cases by adjusting Authorized Base Revenue levels to reflect estimated changes in the utilityrsquos cost of service The RAM is intended to via formula-driven estimates and escalators compensate the HECO Companies for changes in util-ity costs and infrastructure investment between rate cases and reduce the frequency of rate cases The RAM Period is the calendar year containing the Annual Evaluation Date (March 31 the date of the annual RAM filing) The RAM adjusts the revenue requirement according to changes in four main categories of expenses
bull Base expenses which are changes in designated OampM expenses
bull Rate base the return on incremental investment in designated rate base components41
bull The incremental depreciation and amortization expenses and
bull Exogenous tax changes changes in costs owing to significant changes in tax laws or tax regulations
Base expenses are segregated between labor and non-labor amounts The labor component is adjusted annually by the Labor Cost Escalation Rate reduced by the Labor Productiv-ity Offset (fixed at 076 percent) The non-labor component uses the Non-labor Escalation Rate to annually adjust those costs Tracked OampM expenses for fuel purchased power pension and post-employment benefits integrated resource planning DSM and other rate adjustment provisions are not adjusted in the RAM because any changes in these costs are accounted for in other cost-tracking mechanisms
The Rate Base equals the average net investment esti-mated for the RAM Period The average rate base is the rate base for the rate case test year with adjustments for changes in only four components of rate base (1) average plant-in-service (2) average Accumulated Depreciation (3) average accumulated contributions in aid of construc-tion and (4) average accumulated deferred income taxes All other components of the rate base remain the same as in the preceding rate case test year The average plant-in-service is equal to the average of the actual plant-in-service at the end of the year prior to the RAM period the Evalu-ation Year and the same year-end balance plus estimated plant additions for the RAM period Plant additions include
Baseline Capital Project plant additions and Major Capital Projects plant additions estimated to be in service by Sep-tember 30 of the RAM period
The RAM also includes an Earnings Sharing Revenue Credit mechanism in order to protect against excessive over-all utility revenue levels The RAM will escalate and update the Companyrsquos approved base revenue requirement reduced by earnings sharing credits and major project revenue credits to customers Based on the Companyrsquos achieved return on common equity for the Evaluation Year the mechanism cred-its the RBAs according to the following chart
ROE at or below the authorized ROE
First 100 basis points (1) over authorized ROE
Next 200 basis points (2) over authorized ROE
ROE exceeding 300 basis points (3) over
authorized ROE
Retained entirely by shareholders no customer credits
25 share credit to customers
50 share credit to customers
90 share credit to customers
Finally the RAM includes additional consumer protectionsbull A provision for Major Capital Projects Creditsbull A provision for Baseline Capital Projects Creditsbull Notification is provided to all affected customers of
the RAM filing in newspapers and billsbull Evaluation procedures for filing examination and any
exceptions to annual revenue regulation filingsbull Continued ability of HECO or the Consumer
Advocate to request formal rate proceedings to replace and terminate RAM at any time and
bull Formal review of revenue regulation as a part of the next round of rate case proceedings
A recent order42 added two additional consumer protections
bull A limitation that only 90 percent of the current
Decoupling Case Studies Revenue Regulation Implementation in Six States
22
43 ACEEE Hawaii Available at httpaceeeorgsectorstate-policyhawaii
RAM Period Rate Base that exceeds the Rate Base Adjustment Mechanism from the prior year can be included in the Decoupling Mechanism for baseline utility plant projects which unlike major capital projects are not subject to prior Commission review and approval and
bull A requirement to post a number of metrics online for customer review although not at this point tied to performance
This order also examined four issues with respect to the application of the RAM The Commission determined that the short-term debt rate as reflected in the most recent rate case should be used to adjust over- and under-collections The Commission also resolved its concern that without a sustainable business plan there exists no strategic frame-work under which to evaluate capital expenditure pro-grams The Commission required the parties in the Docket to further explore capital expenditure issues in conjunction with other risk-sharing mechanisms discussed elsewhere in the order The commission ordered a further evaluation of a proposed risk-sharing mechanism within the RBA Further-more the Commission ordered the parties to work together to establish appropriate metrics which the utility would report on its website
Once the total RAM Revenue Adjustment is calculated it is applied through a uniform adjustment to the per-kWh energy charge for all customer classes
Reconciling Actual Revenue with Authorized Revenue
RBAs record the monthly differences between target revenues and the adjusted recorded electric sales revenues The RBA also applies monthly interest equal to the annual rate for short-term debt from the cost of capital in each HECO Companyrsquos last base rate case to the simple average of the beginning and ending balances each month in the RBA In effect the RBA applies one-twelfth of the rate each month Finally the RBA provides for collection or return of the calendar year-end balances in the RBA and recovery of the RAM Revenue Adjustment over the subsequent May 1 through April 30 period The target revenue is the most recent Authorized Base Revenue or the re-determined Authorized Base Revenue calculated under the RAM
On or before March 28 the Company must file with the Commission a statement of the previous year-end balance in each RBA sub-account and the Authorized Base Revenue level for the current calendar year with supporting calculations An amortization of the year-end balance in the
RBA sub-accounts and the RAM Revenue Adjustment are recovered through the per-kWh RBA rate adjustments The rate adjustment occurs from May 1 of the current calendar year to April 30 of the next year
Complementary PoliciesCurrently electric utilities in Hawaii may use energy
efficiency to meet a portion of their Renewable Portfolio Standard requirements Starting in 2015 electricity savings from energy efficiency will be applied to the Statersquos Energy Efficiency Portfolio Standard which sets a target equivalent to 30-percent forecast sales by 2030 This goal is translated into a target of 14 percent annual savings HECO trans-ferred administration of all of its energy efficiency programs to a third party administrator in 2009 The administrator is compensated for satisfactory performance43
Because of its heavy dependence on petroleum as a generation fuel electricity prices in Hawaii are very high solar and wind are typically lower-cost resources for these systems HECOrsquos default residential rates are inclining block rates with a $900month customer charge and a three-block inclining rate design of $034kWh to $037kWh Residential customers can elect to take service under a TOU rate with off-peak mid-peak and priority-peak tiers Gen-eral service and large power service customers take service under a flat rate unless they opt to take service under a TOU
Hawaii is developing reliability standards in part as a response to deteriorating service quality as a result of distributed and customer-owned generation (see text box) In an effort to make electricity reliability and interconnection standards as transparent as possible the Reliability Standards Working Group was formed in the Feed-In Tariff docket and continues its work in Docket No 2011-0206 to find solutions to integrating high penetrations of renewable energy consistent with reliability and power quality standards
Energy Efficiency OutcomesHECO implemented revenue regulation in 2011 Since
2003 HECO has reported incremental energy efficiency savings between 0 and 05 percent of retail load with 131 percent savings reported in 2011 by Hawaii Energy the
Decoupling Case Studies Revenue Regulation Implementation in Six States
23
44 Hawaii PUC Decision and Order No 31288 Maui Electric Company Limited Docket No 2011-0092 (2013 May 31) Appendix C p 2
Statersquos ratepayer funded efficiency program administrator The company has not yet reported its savings for 201245 In addition HECO has seen more than a sixfold increase in renewable installations under its net metering and feed-in tariff policies since the inception of the revenue regulation plan
Revenue regulation represents a regulatory framework that removes the financial disincentive for utilities to pursue clean
energy strategies It doesnrsquot in and of itself align the utility business model with those utility policies and practices that address customer expectations In fact some commissions are concerned that it might create a dynamic in which the utility assured of its revenue needs becomes complacent and lacks motivation to innovate and develop strategies that may be more in line with the public interest
In a recent order (Docket 2011-0092 May 31 2013) the Hawaiian Public Utilities Commission addressed this big picture issue in a rate order for Maui Electric The Commission called out the management as lacking a long-term vision for creating customer value and expressed concern that ldquothe HECO Companiesrsquo over-reliance upon a link between the [Decoupling]
Agreement and utility financial health obfuscates utility performance and ultimately customer service and satisfactionrdquo44 The implementation of clean energy policies is not a singular goal but rather a policy that must be part of a larger effort to create customer value
The Commission laid out a hard path and a soft path to achieve the results they desire for consumers The hard path involves a closer examination of utility investments operations and expenditures The soft path is opened through the actions of management to create and execute a vision for the utility of the future The Commission remains committed to regulatory innovations that are in the public interest and will work with the utility consumer advocate and other stakeholders to create and implement this vision
The results of this effort will likely produce ideas and outcomes that will have applicability beyond this one utility
ResourcesHawaii Public Utilities CommissionDocket No 2008-0274 Final Decision and Order (August 31 2010)Docket No 2008-0083 Final Decision and Order (December 29 2010)Docket No 2011-0092 Final Decision and Order May 31 2013 including
Decision and Orders Nos 31288 and 31289Docket No 2013-0141 Final Decision and Order (February 1 2014) including
Decision and Order No 31908
45 EIA Form EIA-861 data files Available at httpwwweiagovelectricitydataeia861
Decoupling Case Studies Revenue Regulation Implementation in Six States
24
46 Lazar et al 2011
Discussion of the Six Utilities Overall
Authority The first step in implementing a revenue regulation
mechanism is to understand the authority of the regulating body the Public Utility Commission or PSC It is important for any Commission to clarify its justification for acting on revenue regulation in order to prevent any decisions from being overturned Over the years Utilities Commissions have relied on different justifications for implementing revenue regulation mechanisms Commissions have imple-mented revenue regulation at their own discretion justified by their directive to ensure safe reliable and economic public utility service to citizens to justify changing the regulatory environment In some cases the Commission is unable to engage on narrow issue ratemaking and rates can change only as the result of a full rate case In this case statutes must be amended to enable revenue regulation
In all of the case studies discussed here the Commis-sions first implemented revenue regulation at their own dis-cretion but each followed slightly different paths to do so The CPUC first implemented revenue regulation in 1978 at its discretion In 2001 after a period when mechanisms were suspended the California Legislature required that deviations from projected sales not result in under- or over-collections by utilities and so the CPUC re-implemented revenue regulation according to statutory requirement The Hawaii Public Utilities Commission implemented rev-enue regulation after an agreement between the utility the Governor and other stakeholders called for it In Idaho the Commission established a case in which to investigate rev-enue regulation and held a series of stakeholder workshops before implementing the policy The Massachusetts DPU adopted revenue regulation as a statewide regulatory policy and required individual utilities to file tariffs in response as the result of its general investigation into rate structures that promote demand-side resources The Maryland Com-mission implemented revenue regulation for BGE when the utility requested the mechanism Thus the impetus to develop a revenue regulation mechanism may come from different sources and the Commission may be comfortable
in moving forward under their general supervisory statutes Nevertheless specific statutory language can be helpful to shore up the existing authority
Authorized Revenue Requirement Under the traditional regulatory framework the Com-
mission (or other authority in the case of publicly owned utilities) must determine a utilityrsquos revenue requirement This function does not change under revenue regulation The revenue requirement of a utility is the aggregate of all the operating and other costs incurred to provide service to the public This typically includes operating expenses depreciation and the cost of capital invested including in-terest on debt and a ldquofairrdquo return on equity to investors The (simplistic) formula for determining revenue requirements is as follows
Revenue Requirements = (Rate Base times Rate of Return) + Operating Expenses + Depreciation +Taxes
Traditionally the revenue requirement along with sales is used to determine the rates consumers will pay for elec-tricity46 The rates are also broken down by customer class and intraclass tariffs are created based usually on a cost of service study that determines each customer class and subclass contribution to the utilityrsquos costs The (simplistic) formula for determining the rate per unit is
Rate = Revenue Requirement divide Units Sold
In this way rates are set to allow the utility to exactly recover its revenue requirement when the sales level used to calculate rates is equal to actual sales However it is important to recognize that actual expense and revenue varies with actual sales When actual sales are greater than the sales level used in ratemaking revenue increases and expenses increase by a different amount when actual sales are lower than the ratemaking sales level actual revenue
Decoupling Case Studies Revenue Regulation Implementation in Six States
25
declines and expenses decrease by a different amount Under revenue regulation rates are initially set in the same way but when actual sales differ from the level used to calculate rates the actual revenue level is maintained at the rate case amount as rates are allowed to vary inversely with salesmdashincreased sales lead to decreased rates and vice versa Because the primary expenses that change in the short run as sales levels change are power supply expenses and most regulators allow these to be tracked using a power cost adjustment mechanism revenue regulation mechanisms are generally designed to ensure recovery of the non-power costs (which do not change significantly in the short-run) as sales volumes change
Revenue regulation ensures that actual revenue is equal to the revenue requirement established by the Commission or appropriate authority Although the description above presents an overly simplified view of the revenue require-ment and its use in traditional price regulation and revenue regulation there are many variations on how a Commis-sion can establish a revenue requirement particularly when implementing revenue regulation With revenue regulation as in traditional ratemaking imprudent costs can always be removed from rates and there is no change to the ability of a Commission to impose penalties
Utility Functions to be IncludedFirst the regulator must determine which utility func-
tions will be included in the revenue regulation framework With vertically integrated utilities this usually includes a utilityrsquos regulated generation transmission and distribution units As we discuss below however it is critical to struc-ture power supply recovery mechanisms to avoid providing for double-recovery of certain power supply costs For utili-ties operating in areas of the country that have restructured electricity markets only the regulated distribution busi-ness is decoupled Utilities that also provide gas services
Pacific Gas amp Electric Future test year
Idaho Power Company Historic test year
Baltimore Gas amp Electric Hybrid test year
Wisconsin Public Service Corporation Future test year
National Grid Historic test year
Hawaiian Electric Company Future test year
Table 2
Test Year Used
may have their gas distribution business operating under revenue regulation as well
Test YearOne consideration in establishing the revenue require-
ment is what period of time will be used as a ldquotest periodrdquo or ldquotest yearrdquo The test year is the year on which the Com-mission will base its computations of the utilityrsquos total costs and sales levels A historic test year uses actual data on sales and costs from a past year Whereas a historic test year allows for the use of actual cost data it cannot account for expected variations in sales A future test year requires assumptions to be made about a utilityrsquos sales in a future year This can allow expected changes in sales like those from energy efficiency programs to be included in sales
projections however because regulators are relying on estimates provided by the utility there may be a greater risk for inaccuracy A Commission may also choose to use a test year that includes both past and future periods This may provide a sense of balance between historic and future data Furthermore as the case proceeds the Commission can require the utility to substitute historical data for projected data from the test year
Rate of ReturnAs in any rate case regulators
must determine the appropriate rate of return that a utility can earn on its investments including the cost of debt and the allowed ROE for its shareholders The approved ROE is only used to establish the return on investments that are included in the rate base when determining revenue require-
Pacific Gas amp Electric Electric generation and distribution gas distribution
Idaho Power Company Electric generation and distribution
Baltimore Gas amp Electric Electric distribution gas distribution
Wisconsin Public Service Corporation Electric generation and distribution
National Grid Electric distribution
Hawaiian Electric Company Electric generation and distribution
Table 1
Business Unit Included in the Revenue Regulation Model
Decoupling Case Studies Revenue Regulation Implementation in Six States
26
47 In a rate case the Commission determines an allowed return on equity This is used to set a price (price regulation) or an allowed revenue requirement (revenue regulation) Once set however the actual return earned by the utility is affected by anything that changes either revenue or expenses for example an increase in employee compensation a change in the number of employees or under price regulation a change in sales volumes
48 Lazar et al 2011
ments Although revenue regulation ensures that a utility recovers no more or less than its target revenue revenue regulation does not guarantee that the utility will earn the authorized ROE Depending on how a utility manages its costs between rate cases it will realize an actual ROE either higher (in the case of reduced costs) or lower (in the case of increased costs) than the authorized level47
A utilityrsquos allowed ROE generally represents the return deemed necessary to attract investment considering the level of risk of that investment Riskier investments require a higher return to attract investors and vice versa Util-ity earnings can be volatile because of short-run impacts on sales volumes and revenues which include changes in sales owing to weather economic conditions and energy efficiency and DG programs This volatility typically causes utilities to retain a higher level of equity in their capital structures so that reduced revenues do not leave them un-able to service their debt Revenue regulation can reduce this volatility by stabilizing revenues regardless of the cause Because of this reduced risk many stakeholders have proposed that the implementation of a revenue regulation mechanism be associated with a corresponding reduction in the utilityrsquos equity capital ratio (the percentage of capital supplied by common equity) This reflects the utilityrsquos more stable revenue owing to revenue regulation and reduces the overall revenue requirement that will be recovered from consumers48
An alternative option to reducing the utilityrsquos equity ratio is to reduce the ROE reflecting a lower risk level For the utilities included in these case studies only BGE and Mass Electric experienced a reduction in their ROE The Com-mission did not reduce BGErsquos ROE at the time the revenue regulation mechanism was implemented but reduced it by 50 basis points during the subsequent rate case The Mas-
sachusetts Commission did not reveal its adjustment but incorporated a lowered ROE into its decision
Absent an explicit adjustment to the cost of capital investorsrsquo expectations will adjust to the presence of rev-enue regulation if its presence is reliable The more stable earnings will likely in time contribute to a higher credit rating That in turn will lead to lower cost debt that will be revealed in future cost of capital calculations An adjust-ment to the ROE or capital structure by the regulator in a rate proceeding will be reflected immediately in lower rates to consumers simply allowing the utilityrsquos credit rating to improve over time and its cost of debt to decline will have the same effect but on a lagged basis as new bonds are is-sued at lower interest rates49
Beginning in 2004 Standard and Poorrsquos began publish-ing ldquorisk profilesrdquo for utilities which classified utilities based on their earnings variability and other risks those with more stable earnings were determined eligible for higher bond ratings at any given equity capitalization ratio (or alternatively able to retain a given bond rating with a lower equity ratio)50 One utility with a revenue regulation mechanism Northwest Natural Gas was believed to have had their business risk profile upgraded by one step in response to the benefits of the mechanism51
Effect on Bond RatingsRevenue regulation stabilizes a utilityrsquos revenue streams
reducing risk to investors this reduced risk may be a contributing factor in an increase in a utilityrsquos bond rating Bond rating agencies have recognized that revenue regula-tion mechanisms and other mechanisms that reduce net earnings volatility and risk contribute to a lower cost of capital for the utility52 Standard and Poorrsquos has explicitly stated that it ldquoviews decoupling as a positive develop-
49 Lazar et al 2011
50 Standard and Poorrsquos (2004 June 2) New Business Profile Scores Assigned for US Utility and Power Companies Financial Guidelines Revised
51 Christensen Associates (2005 March) A review of distribution margin normalization as approved by the Oregon Public Utility Commission for Northwest Natural
52 Lazar et al 2011
Decoupling Case Studies Revenue Regulation Implementation in Six States
27
This topic raises a note of caution if mechanisms are not well designed double-recovery of costs can occur for verti-cally integrated utilities that provide both power supply and distribution services For example if a per-customer
revenue regulation mechanism includes investment-related power supply costs in the revenue-per-customer formula but excludes fuel and purchased power costs that are recovered through a separate tracking mechanism double recovery of some power supply costs is likely If the utility experiences cus-tomer and sales growth the amount it recovers for investment-related power supply costs will go up However if that utility serves this growth by operat-
ing existing power plants more by selling less power on the surplus market or by purchasing power from other suppli-ers it will not incur any increases in the type of power sup-
53 Standard amp Poorrsquos (2008 February 19) Decoupling the vehicle for energy conservation
ment from a credit perspectiverdquo53 However in the case of the utilities examined in this report none experienced an improved credit rating after the implementation of revenue regulation with the exception of PGampE However PGampE came out of Chapter 11 bankruptcy in the same year that its revenue regulation mechanism was implemented mak-ing it impossible to attribute the improvement to revenue regulation alone Bond rating changes are generally slow to evolve Numerous other factors are taken into account when assigning an overall credit rating which appear to have outweighed any positive effect of revenue regulation These factors certainly include the recession of the US economy that began in 2007
Customer Classes IncludedWhen determining the target revenue for a utility rev-
enue regulation mechanism regulators must also consider which customer classes to include in the mechanism In some cases industrial customers have objected to a rev-enue regulation mechanism This is due to the wide dif-ference in rates among customers making the design of a revenue regulation mechanism more challenging If regula-tors choose to exclude a class of customers from revenue regulation they must determine the revenue requirement associated with serving only the included customer classes This generally requires a detailed cost of service study to ensure that revenue responsibility is accurately allocated by customer class
Included CostsFinally regulators may wish to exclude specific costs
from the overall revenue requirement if those costs will be tracked through another mechanism like fuel costs in a PCA mechanism energy efficiency program expenditures or smart grid costs for example Separate tracking mecha-nisms can also be used for those costs that are difficult to
Pacific Gas amp Electric All customer classes
Idaho Power Company Residential and small general service
Baltimore Gas amp Electric Residential and small general service
Wisconsin Public Service Corporation All customer classes
National Grid All customer classes
Hawaiian Electric Company All customer classes
Pacific Gas amp Electric
Idaho Power Company
Baltimore Gas amp Electric
Wisconsin Public Service Corporation
National Grid
Hawaiian Electric Company
Table 3
Customer Classes Included in Revenue Regulation Mechanism
Table 4
Costs Excluded From Revenue Regulation Mechanism
project based on historical data or costs over which the util-ity has very little control like fuel costs Although revenue regulation tracks collected revenue mechanisms like Fuel Adjustment Clauses Purchased Power Adjustments and Energy Efficiency Riders can be designed to track actual costs as well as collected revenue
Energy procurement costs
All variable costs
Energy supply costs
Energy costs
Energy supply costs for basic service customers transmission costs the energy efficiency system benefits charge and reconciling charge and costs recovered through the residential assistance adjustment factor
Fuel and purchased power
Decoupling Case Studies Revenue Regulation Implementation in Six States
28
54 We use the RAM term applied in Hawaii here to address any type of attrition or similar mechanism other than a revenue-per-customer framework that changes the allowed revenue between general rate cases
ply costs accounted for in the revenue per customer (RPC) calculation The increased power supply costs to serve that growth will be recovered through the fuel and purchased power tracking mechanism The net effect for the utility will be to recover incremental power supply costs twicemdashonce in the per-customer mechanism and again in the fuel and purchased power mechanism It is essential to make sure that the other adjustment mechanisms do not overlap the cost impacts that are treated in the revenue regulation mechanism One way to do this is to ensure that all power supply costs (investment labor fuel purchased power) are recovered through a single mechanism There are several ways to achieve this
a) A comprehensive power supply recovery mechanism that includes all power supply costs that is separate from the costs treated in the revenue regulation adjustment (eg Puget Sound Energy Washington State)
b) No power supply adjustment whatsoever with all utility costs included in an RPC mechanism (eg National Grid)
c) An annual attrition calculation with all costs reviewed for changes since the last proceeding (eg HECO)
Revenue Adjustment Mechanism in Revenue Regulation
A RAM54 is not necessary to achieve revenue regulation but provides attrition reliefmdashincreasing authorized revenue commensurate with increased costsmdashbetween rate cases Whereas revenue regulation sets a target revenue that the utility will earn regardless of sales levels the RAM adjusts the target revenue between rate cases Regulators may choose to take several different approaches to RAM
bull No RAM Regulators may choose not to implement a RAM leaving the revenue requirement unchanged between rate cases This requires the utility to request a rate case when it requires additional revenue to cover its costs
bull Stairstep Stairstep adjustments provide predetermined increases in target revenue These increases can be determined during a rate case and generally reflect forecasts of cost growth
bull Indexing Indexing ties adjustments to the target revenue to multiple factors like inflation productivity customer growth and changes in capital expenditures
bull RPC The RPC approach is a form of indexing RPC adjusts the total revenue requirement for the
number of customers served Regulators using an RPC mechanism will determine the revenue requirement per customer and the overall revenue requirement will be determined by multiplying the total number of customers by the revenue requirement per customer The amount of revenue required to serve each customer can be determined separately for customer classes and for existing and new customers This way the RPC method accounts for a utilityrsquos growth in fixed costs that is related to growth in the number of customers served RPC is useful where the correlation between cost growth and customer growth is significant It also protects customers from making up the deficit if there is a loss in customer load such as if a large business closes down or relocates
bull Hybrid Hybrid RAMs generally use stairstep increases to account for projected capital costs and indexing to account for OampM expenses
Adjustments from any type of RAM can be implemented automatically or through an attrition proceeding Some stakeholders oppose adjustments to the revenue require-ment outside of a rate case on the basis that this could allow the revenue requirement to increase significantly without examination of the impact on ratepayers or with-out due consideration of other costs and revenues For this reason some regulators choose to cap the total adjustment that can be made to the revenue requirement outside of a rate case
Table 5
Type of Revenue Adjustment Mechanism
Pacific Gas amp Electric
Idaho Power Company
Baltimore Gas amp Electric
Wisconsin Public Service Corporation
National Grid
Hawaiian Electric Company
Hybrid
RPC
RPC
RPC
No RAM potential capital expenditure adjustment
Hybrid
Decoupling Case Studies Revenue Regulation Implementation in Six States
29
55 Because this method results in changes in the price for service that are calculated after that service has been provided it fails the ldquono retroactive ratemakingrdquo statutes that guide most electricity regulators Customers are entitled to know the price of the commodity they are consuming at the time they use it
56 The closest to a current method in use for electric utilities in the BGE system of monthly reconciliation
Table 6
Tracking and Accrual of Difference BetweenActual and Authorized Revenue
Pacific Gas amp Electric
Idaho Power Company
Baltimore Gas amp Electric
Wisconsin Public Service Corporation
National Grid
Hawaiian Electric Company
Track Difference
Monthly
Monthly
Monthly
Yearly
Yearly
Monthly
Accrual Period
Year
Year
Month
Year
Year
Year
Calculation of Actual RevenueRegulators have options when ensuring that actual
revenue equals target revenue under revenue regulation First regulators must decide how to determine ldquoactual revenuerdquo In most cases actual revenue simply equals the amount of revenue a utility collects from its customers The Idaho Public Utilities Commission however has chosen to use weather-normalized revenues as the basis for utility revenues in revenue regulation Although this prevents the utility from recovering revenue lost to it owing to milder than expected weather it further complicates the revenue regulation mechanism and reduces its risk-reduction ben-efits By the same token if weather is severe and increases sales above the revenue requirements weather normaliza-tion would allow the utility to retain some of the revenues
Next regulators must determine whether to implement revenue regulation using a current or accrual method
bull Current Method With the current method of revenue regulation the target revenue for a period say a month is divided by the actual sales in that period to determine the rate per kWh The current method ensures that actual revenue equals target revenue by calculating the rate at the end of the period so that the target revenue can be recovered The current method allows for no lag in revenue recovery One effect of this method is that although customer rates vary total bills are generally more stable For example in a hotter than expected July customers will purchase more kWh but they will be charged a lower rate A milder than average winter would lead to fewer sales but at slightly increased rates This way customers do not experience the same bill variability as they would if rates were set before the sales deviations occurred On the other hand the current method does not provide customers with the ability to plan ahead based on a predictable rate for electricity This method has been used for revenue regulation of natural gas utilities55
bull Accrual Method Under the accrual method rates are set based on an assumed sales level and the differences between actual and target revenue are allowed to accrue over some period Then the total difference between actual and target revenue is reconciled through an adjustment to rates in the subsequent period this is known as the true-up process Presently all revenue regulation mechanisms for electric utilities use the accrual method56
If regulators use the accrual method of revenue
regulation they will next need to determine the period over which the difference between actual and target revenue will be allowed to accrue One year is typical however shorter periods are also used Next the frequency of comparing collected revenue to target revenue should be determined It is possible to do this comparison only once at the end of the accrual period It is common however for comparisons to occur more frequently often monthly When revenues are compared within the accrual period the differences are tracked generally for the purpose of applying interest to the difference that will be deferred until the end of the accrual period
Rate AdjustmentsIn designing a revenue regulation mechanism there are a
number of decision points that regulators need to consider to balance the interests of all the stakeholders One of the decision points revolves around the determination of the mechanism used to adjust rates The issues that regulators need to consider include the following1 Rate Case Requirements One of the often-mentioned
concerns about surcharges especially when they are numerous is how that will impact the frequency of rate cases For regulators and stakeholders rate cases provide
Decoupling Case Studies Revenue Regulation Implementation in Six States
30
the best mechanism to correctly align rates and costs but they are time-consuming and expensive for all parties This is because a rate case presents an opportunity to closely examine all of the utilityrsquos expenses and adjust rates to reflect cost increases and decreases Because under a revenue regulation mechanism the goal is to match revenues received from all customers with revenue requirements a correct determination of revenue requirements is important as is the specification of appropriate cost indices to adjust the revenue requirements As the time between rate cases increases some regulators feel the base rate case data even with adjustments need to be reexamined As a result some regulators have chosen to mandate the frequency of rate cases to address this whereas others have not It may be that in some cases where there are numerous surcharges recovering a multitude of costs there may not be as many costs subject to review in the rate case making it less significant to a regulator than a case in which most costs are being analyzed and recovered in the rate case itself
2 Collection Mechanism Integrally tied to the mechanism for recovering revenues is how the utility will collect or refund the revenues Options that are available include recovery through a rate case or periodic adjustments to rates through a surcharge mechanism As can be seen by the case studies depending on the plan in place some utilities have very discreet requirements dictating the frequency of rate cases with adjustments occurring in those cases or between those cases Other utilities have no requirements upon them with respect to the frequency of rate case filings This will be discussed in more detail below What does emerge from these case studies is that the discreet components or choices in how to execute a revenue regulation plan are carefully interwoven to create a holistic approach Each component works with the other and the value of this case study is in examining the different pathways that can be chosen As discussed previously some of the commissions have authorized revenue regulation to recover the revenue requirements in the last rate case whereas others have authorized adjustments to rates between rate cases this impacts the pathway that the adjustment mechanism takes
3 Timing How often should rates be adjusted to true up to the utilityrsquos revenue requirement States have chosen different options ranging from monthly to annually
4 Allocation of Revenue Regulation Revenue Surpluses or Deficits There are a number of decision points regarding allocation Should the revenue regulation apply to all rate classes or just the smaller customers whose usage per customer and load variations are not as dramatic as those of larger-use customer classes Should there be a different allocation to each rate class or should the allocation of costs among the classes be the same Different mechanisms accomplish different goals Some states have allocated revenue regulation revenues based on the revenues lost by customer class as a result of energy efficiency This can sometimes be a political decision to mitigate opposition to energy efficiency programs by large customers Other states recognize that the system savings resulting from energy efficiency benefit all customers so that all customers should pay equally
5 Carrying Charges Depending on the timing issue discussed previously regulators may want to consider carrying charges on any adjustments This should be symmetrical in its application however so that it applies to surcharges and refunds Consideration should be given for the basis of the carrying charge rate whether weighted average cost of capital rate of return a risk-free rate or some other mechanism should be adopted
6 Rate Caps In order to mitigate potential rate impacts a regulator may want to consider a cap on how much rates can go up when the revenue regulation adjustment is made This might be more critical if the regulator is aware of other potential rate increases that will impact customersrsquo bills If a cap is used the case in which the utilityrsquos adjustment would exceed the cap must be considered Some regulators have opted to allow the utility to carry over the excess unrecovered amount for a period of years whereas others do not This allows the utility to recover those revenues in a subsequent year when perhaps the adjustment is less As a practical matter however adjustments of greater than three percent are less common as shall be discussed later
7 Impact on At-Risk Consumers Low-income and consumer advocates have expressed concern about revenue regulation as a vehicle for annual rate increases without the scrutiny of a general rate case creating rate increases for the low-use customers doing the most to constrain usage and help achieve targeted energy savings One proposal to address this has been to impose any resulting surcharges only to above-average usage
Decoupling Case Studies Revenue Regulation Implementation in Six States
31
57 Cavanagh and Howat (2012 May 2) Finding common ground between consumer and environmental advocates Electricity Policy
58 The most common criticism of future test years is that utilities forecast costs under an assumption that all authorized personnel positions will be filled while in retrospect any large organization has some level of vacancy in its employee count A historic test year captures this effect fully
customers and any resulting credits only to below-average usage57
Rate Case RequirementRequirements as to the frequency of rate cases can be
tied to the recovery mechanism or to the entire regulatory framework for implementing revenue regulation In the cases studied two of the utilities require periodic rate cases PGampE every three years and WPS every year Two others National Grid and HECO require annual mini rate cases explained later in which adjustments are made and two others IPC and BGE have no requirements for scheduled rate cases Nevertheless if the concern is to ensure that the utilityrsquos revenue recovery meets its revenue requirements some kind of periodic rate case to examine costs is appropriate Having periodic rate cases can provide a measure of assurance to consumer advocates that the level at which the revenues and hence the rates are set is correct One of the criticisms of revenue regulation is in fact the lack of rate cases to produce a proper level of confidence in the allowed amounts Multiple surcharges are usually additive to existing rates therefore not permitting an opportunity to reduce the base rate for reductions in cost Moreover the infrequency in cases impedes the examination of rate allocations as would occur through a cost of service study
This is a particular issue where utilities are augmenting power supply with purchased power from independent power producers which is the most common method for acquiring wind and solar production today The increased cost for purchased power may flow through a fuel and purchased power adjustment mechanism while the (depreciating) investment in conventional power plants remains static in base rates
Both PGampE and WPS use a future test year that allows the utility to project revenue requirements during the time period that the rates are to be in effect The benefit to this is that it can help identify and account for projected changes in costs over the timeframe between rate cases However given that these costs are utility projections most consumer advocates have less confidence in these numbers than they would using actual numbers from a historical or only hybrid test year58 When trying to garner support for revenue regulation from more skeptical stakeholders using a future test year may not be helpful Furthermore in the case of WPS that has annual rate cases using a future test year becomes less justifiable as revenues are recalculated annually anyway
The absence of a rate case requirement can also cause consternation among detractors of revenue regulation because of the belief that the utility will be guaranteed its revenue requirements for as long as it is satisfied with that level irrespective of how well it manages However this is no different from the status quo in traditional regulation in most places The incentive to manage well is always there with or without revenue regulation as it translates into more profit for the utility
In the cases of HECO and National Grid the mini rate cases serve two purposes In the one instance it serves as a means to reconcile revenue recovery with revenue requirements and in the second instance it provides an opportunity to adjust rates in accordance with changes in costs Specifically for National Grid the revenue requirement is adjusted to reflect capital expenditures For HECO revenues are adjusted to reflect changes in the cost of service In the two examples here revenue regulation is wrapped in with other adjustments as part of a mini adjustment Given the structure for determining revenue requirements which accounts for changes in costs including revenue regulation within the mini rate cases is a workable option
These examples highlight how rate cases can be used to adjust revenue requirements either in a more controlled regulatory environment with frequent rate cases or left to the utilityrsquos discretion to decide when to adjust costs A set schedule of periodic rate cases such as that used by PGampE may strike an appropriate balance for reviewing revenue requirements however with the modification of a partial historical partial forecasted test year Frequent rate cases can depending on the resources of the regulator and stakeholders be too costly and time-intensive When there are too many rate cases stakeholders and regulators may not be able to dedicate the level of resources needed for any one proceeding and may be spread too thin Regular known rate cases at reasonable intervals may strike the best balance of adequate review and adjustment of revenue requirements
Decoupling Case Studies Revenue Regulation Implementation in Six States
32
Collection Mechanism and TimingThe collection mechanism for the differential between
actual and authorized revenue requirements varies by util-ity as well Both PGampE and WPS do not have adjustment clauses or surcharges but instead have structured their revenue regulation plans to recover their costs in a rate case with rates adjusted annually Although PGampE has rate cases every three years the utility files its preliminary forecast every September 1 for the following year including adjust-ments for revenue regulation and other costs This practice promotes transparency keeping all stakeholders aware of the current situation of the utility IPC BGE National Grid and HECO use surcharges on customer bills to collect or credit the difference between actual revenues collected and the revenue requirement Although the other three (IPC National Grid and HECO) calculate the rate adjustment annually only BGE does a more contemporaneous adjust-ment of one month Certainly where there are no regularly scheduled rate cases using an adjustment mechanism becomes more critical PGampE has created a tracking mecha-nism known as a balancing account that allows the utility to track the surpluses and deficits to help ensure accuracy at year end when rates are actually adjusted The creation of such monthly balancing accounts will make it easier at the end of the year to track what happened each month and then determine the adjustment for that year It provides a more detailed trail for review and analysis by stakeholders and regulators However other mechanisms that just look at total revenues as compared to revenue requirements at the end of the year can work as well
Table 7
Rate Case Requirements
Table 8
Rate Adjustments
Table 9
Allocation of Surplus or Deficit
Pacific Gas amp Electric
Idaho Power Company
Baltimore Gas amp Electric
Wisconsin Public Service Corporation
National Grid
Hawaiian Electric Company
Pacific Gas amp Electric
Idaho Power Company
Baltimore Gas amp Electric
Wisconsin Public Service Corporation
National Grid
Hawaiian Electric Company
Pacific Gas amp Electric
Idaho Power Company
Baltimore Gas amp Electric
Wisconsin Public Service Corporation
National Grid
Hawaiian Electric Company
Every three years annual ldquoattritionrdquo adjustments in between
No requirement
No requirement
Annual rate case
Annual capital expenditure adjustment case
Abbreviated annual rate case
Base rates adjusted annually
Annual adjustment through surcharge
Monthly adjustment through surcharge
Annual adjustment through rate case
Annual adjustment
Annual adjustment
Allocated to all customers according to business unit (eg electric distribution electric generation)
Included in the annual adjustment mechanism for each customer class
Separate for each customer class
Allocated to all customers except certain tariffs (see above)
Separate for each customer class
Separate for residential and commercialindustrial
Allocation of Revenue Regulation Revenue Surpluses or Deficits
The allocation of revenue regulation revenue surpluses or deficits should be symmetrical so that overpayments are credited to customers just as underpayments are paid by those same customers The six utilities studied fol-low that formula The application of revenue regulation however varies from utility to utility BGE and IPC ap-ply revenue regulation to the residential and commercial classes thereby excluding industrial customers In contrast however PGampE WPS National Grid and HECO allocate revenue regulation adjustments to all customer classes In terms of how the costs are allocated IPC BGE WPS National Grid and HECO allocate costs differently among the customer classes PGampE however allocates costs uni-formly among the customers Because PGampE has separated its business units it also separately calculates and allocates
Decoupling Case Studies Revenue Regulation Implementation in Six States
33
Table 10
Carrying Charges
Table 11
Cap on Rate Adjustment
Pacific Gas amp Electric
Idaho Power Company
Baltimore Gas amp Electric
Wisconsin Public Service Corporation
National Grid
Hawaiian Electric CompanyPacific Gas amp Electric
Idaho Power Company
Baltimore Gas amp Electric
Wisconsin Public Service Corporation
National Grid
Hawaiian Electric Company
None
Yes
None
Yes at the short-term debt rate
Yes at the customer deposit rate
Yes at the customer deposit rateNo
3 rate cap excess carried over to next period
10 rate cap excess carried over to next period
Cap of $14 million per year
$170 million in CapEx
No
revenue regulation surpluses and deficits among its electric distribution gas distribution and electric generation busi-nesses This illustrates that there are several ways to address revenues from revenue regulation depending on the policy outcomes that are desired
Carrying ChargesCarrying charges applied to uncollected or surplus rev-
enues can be used to account for the time value of money and the lost opportunity or value to having those revenues in hand PGampE and BGE do not accrue carrying charges On the other hand IPC WPS National Grid and HECO do For BGE given that the revenue regulation revenues are reconciled and recovered monthly it would make little sense to include a carrying cost Where carrying costs have been used they have included in the cases of these utili-ties the short-term debt rate or the customer deposit rate which for one utility is six percent and probably close to the short-term debt rate Thus the carrying charge rates are appropriately at the lower end of the spectrum reflecting their short-term nature In the application of the carrying charge symmetry should be preserved by applying it to both deficits and surpluses Application of carrying charges given the short period that costs are carried (one year) is somewhat discretionary Although it does more accurately account for costs it does add a modest level of complica-tion in tracking costs
Rate Caps and CollarsOne of the ways to protect customers in the event of sig-
nificant adjustments is to impose a rate cap (or collar) that limits the amount of a rate increase (and decrease) Some customers are sensitive to changes in foundational costs like utility bills and if costs are going to rise they benefit from a pattern of steady modest increases rather than a large step increase Any structural increases in rates attributable
to reductions in sales or increases in costs recognized by the revenue regulation plan would be eventually included in rates under any system A cap reflects a controlled way to manage customer expectations and customer impacts Structural changes can only be managed for a while until a complete rate case is needed to reset all assumptions
Typically when a rate cap is imposed if the formulaic increase exceeds the cap or collar the utility will be able to carry over any uncollected revenues until the next rate adjustment Two of the utilities studied PGampE and HECO do not have rate caps On the other hand the other four utilities do include rate caps in varying amounts National Grid has a one-percent revenue cap whereas IPC and BGE have a one-percent and a ten-percent rate cap respectively WPS unlike the others has a cap tied to the dollar amount of $14 million as opposed to a percentage Consistent with the goals of revenue regulation all of the utilities studied have a carryover provision that is important for reducing the risk that the utility will not recover its revenue require-ments
Note that National Grid differs from BGE and HECO in that its cap is on revenues whereas the other two utilities cap rates and rate impacts A revenue cap is more focused on ensuring minimal change to the revenue requirements authorized by the commission National Grid as discussed previously allows for mini rate cases to adjust the rev-enue requirements Having the one-percent cap limits the amount of increase that can occur through that process requiring revenue changes that are greater to occur in a full rate case However note also that some of the adjustments allowed in the mini rate case have their own separate cap The IPC rate cap is in line with what many other utilities with caps have in place which generally range from one to three percent The ten-percent rate cap in the BGE plan is
Decoupling Case Studies Revenue Regulation Implementation in Six States
34
59 Morgan P (2012 December) Graceful Systems LLC A decade of decoupling for US energy utilities rate impacts designs and observa-tions p5
reflective of its monthly adjustment pattern An annual ad-justment allows more time to smooth out peaks and valleys in revenues whereas a monthly adjustment will be influ-enced by more of the spikes (particularly weather-driven variation) thus the need for a larger bandwidth for the car-ryover Like a variable energy rate or fuel adjustment clause that fluctuates monthly the monthly adjustment introduces more volatility into the rates
Actual Historical AdjustmentsFor many ratepayer advocates there is a concern that
some of the utility management risk will be transferred to customers as a consequence of a policy that seeks to ensure that the utility will be made whole However the utility re-tains management risk and the requirement to demonstrate that it has acted prudently Thus the utility still has just as much of an incentive to operate efficiently as it did without revenue regulation If the utility can lower its costs it can still increase its profits Second by designing rates symmet-rically such that under- and over-recoveries are reconciled it provides customers with an opportunity to obtain credits that under traditional regulation would be retained by the utility It has often been opined that when there are large
gaps in time between utility rate cases it is because the utility is over-earning and exceeding its revenue require-ments In those instances customers never get to examine what the utility is collecting much less receive a refund Under revenue regulation with its periodic adjustments and scheduled general rate cases the revenue requirements are examined and refunds or credits allocated such that customers have a better knowledge base for understanding the utilityrsquos earnings And annual reconciliation of the util-ityrsquos actual revenues versus authorized revenues provides consumers with a tool to reign in excess revenue recovery beyond authorized amounts Third the adjustments that do occur under revenue regulation are manageable and frequently less than the adjustments customers are used to seeing on their bills for fuel or variable generation rates or for the myriad of other surcharges that can be tacked on to a customerrsquos bill such as an infrastructure (smart grid) sur-charge maintenance upgrade fee regulatory asset charge or system benefit charge
As seen in Figure 1 the range of rate impacts cluster around plus or minus two percent but can at times exceed plus or minus five percent The total of surcharges has somewhat exceeded the total of credits
Figure 1
Total Utility Decoupling Adjustment Rate Impacts59
300
250
200
150
100
50
0
Nu
mber
of
Dec
oup
lin
g A
dju
stm
ents
Over -5 -4 to -5 -3 to -4 -2 to -3 -1 to -2 0 to -1 0 to 1 1 to 2 2 to 3 3 to 4 4 to 5 Over 5
Percentage Rate Impacts
SurchargesRefunds
ResidentialAll
Other
Commercial
Total
Decoupling Case Studies Revenue Regulation Implementation in Six States
35
60 Id p 3
61 Schultz T Energy Efficiency at Idaho Power Available at httpwwwenergyidahogovenergyalliancedida_powerpdf
As can be seen with the utilities studied above the larger fluctuations are attributable to adjustment mechanisms that are reconciled more frequently such as monthly as those are less able to smooth out anomalies as an annual adjust-ment would do From a dollar perspective for the roughly 64 percent of adjustments that fall within the plus or minus two-percent range the monthly bill impact is approxi-mately $230 for average electric customers and $140 for average gas customers60
Of the six utilities studied the fluctuations in adjustment have for the most part stayed within the one- to three-per-cent range as shown below
bull PGampE from 2005 to 2012 has had annual revenue regulation adjustments ranging from minus143 percent to 415 percent with an average adjustment of 197 percent
bull For IPC the adjustments are separated between residential and commercial customers For residential customers the annual adjustments from 2007 through 2011 ranged from 077 percent to 258 percent for an average of 162 percent As for the commercial customers the annual adjustments for that same period were higher ranging from 104 percent to 424 percent with an average adjustment of 252 percent
bull BGE has monthly adjustments that ranged from minus1853 percent to 3013 percent with an average of 057 percent for residential customers from March 2008 through August 2012 For General Service Customers the monthly adjustment ranged from minus2264 percent to 2462 percent The average adjustment was 1308 percent
bull For WPS the annual adjustments from 2009 through 2011 ranged from minus145 percent to 378 percent for residential and small commercial and from minus314 percent to 899 percent for commercial Note that because of a $14 million per year cap some of these percentages were carried over The average annual adjustment for residential and small commercial and for commercial was 163 percent and 215 percent respectively with carry-overs to subsequent years
bull For Massachusetts Electric and Nantucket Electric both of which operate under National Grid the annual revenue regulation adjustment for all for 2011 and 2012 was minus0105 percent and 0315 percent for an average revenue regulation adjustment over the two years of 0105 percent
bull HECO like National Grid has one annual revenue
regulation mechanism for its customers which resulted in adjustments in 2011 and 2012 of 063 percent and 107 percent respectively for an average adjustment of 085 percent
As can be gleaned from the above information the range of average adjustments for small use customers was a low of 0105 percent for National Grid to a high of 197 percent for PGampE For larger use customers the range was a low of 0105 percent for National Grid to a high of 252 percent for IPC This demonstrates that on average for these utilities with well-developed and diversely designed revenue regula-tion proposals their adjustments on average stayed at or below approximately 25 percent
One of the metrics for determining if a revenue regula-tion program is working successfully that was discussed above was the impact on rates of a revenue regulation mechanism As can be seen by the analysis of the adjust-ment levels for each of the utilities they are within a rea-sonable range
Complementary Policies Although a revenue regulation mechanism does not need
to be accompanied by other policies energy efficiency is frequently at the root of the reason revenue regulation was proposed in the first place The states examined in this pa-per have various obligations for energy efficiency achieve-ment placed upon their utilities Only Idaho does not have an Energy Efficiency Resource Standard but energy efficiency objectives are developed through an integrated resource plan process Energy efficiency spending at IPC has increased dramatically in recent years61
In recognition of the fact that revenue regulation only removes the disincentive to pursue energy efficiency several states have instituted some form of incentives to reward the desired outcome This mechanism can not only incentivize management to aggressively pursue energy efficiency but also make shareholders supportive in the face of lost invest-ment opportunity
Rate design can also play an important part in assist-ing the utility in achieving favorable energy efficiency outcomes Inclining block rates penalize inefficient use of electricity and shorten payback times from the customer perspective Because efficiency reduces consumption at
Decoupling Case Studies Revenue Regulation Implementation in Six States
36
62 Optional rate designs for PGampE include TOU and Peak Time Pricing
63 IPC also has an optional TOU rate design
64 Optional rate designs for this utility include TOU Critical Peak Pricing and Contract
65 National Grid also offers optional TOU and flat rate designs
66 HECO also offers optional TOU and flat rate designs
67 See eg Alexander B (1996 April) How to construct a service quality index in performance-based ratemaking Electricity Policy
the tail block rate the value of kWh savings is greater than with flat rates On the other side of the spectrum declining block rates which have a reduced rate in the tail block do little to encourage conservation In fact they operate more like a discounted bulk rate by reducing the average cost of a kWh in a customerrsquos bill for the more kWh used
Performance incentives or other ways to avoid destruc-tive cost-cutting in the name of creating margins that reduce service or reliability or lessen customer value have been implemented only in Massachusetts of the six utilities illustrated here Several other states have implemented vari-ous schemes in reaction to perceived deficiencies in utility service67 Performance incentives are not unique to rev-enue regulation Commissions wishing to implement such a scheme can find many models of incentive reward and penalty mechanisms developed for other purposes
Taken together a suite of policy and program features can create an atmosphere that is conducive to achievement of energy efficiency goals within the utility and for the customers By appropriate application of these techniques regulators working with utilities and stakeholders can remove barriers and create an opportunity for energy ef-ficiency to be fully integrated into the utility supply option portfolio
Energy Efficiency OutcomesAlthough revenue regulation itself does not create an
incentive for a utility to implement energy efficiency it does address the issue of lost revenues associated with energy
Table 12
Complementary Policies for Energy Efficiency
Pacific Gas amp Electric62
Idaho Power Company63
Baltimore Gas amp Electric
Wisconsin Public Service Corporation64
National Grid65
Hawaiian Electric Company66
Energy Efficiency Requirement
1 annually
IRP
10 by 2015
075 annually
24 annually
Energy efficiency can satisfy portion of RPS
Default Residential Rate Design
Inclining block
Inclining block
TOU seasonal
Flat
Inclining block
Inclining block
Incentive Structure
Risk reward incentive mechanism
No
No
No
5 of program costs
Third-party administrator paid for contract performance
Performance Incentives
Reliability reporting only
None
Under consideration
Reliability reporting only
Service quality reward and penalty
Under consideration
efficiency and DG programs Revenue regulation should be combined with other mechanisms that require or incentiv-ize the implementation of energy efficiency by the utility or a third party The level of energy efficiency achieved can be one measure of the success of a revenue regulation mechanism as implemented in a larger program designed to achieve energy efficiency Table 13 shows the incremental annual energy efficiency savings reported by each utility with the shaded box indicating the year that the utilityrsquos revenue regulation mechanism was implemented National Grid had achieved a high level of energy efficiency savings in the years before it implemented revenue regulation
This paper has not evaluated DG outcomes to correlate with revenue regulation as it is not perceived that states and utilities have made that connection expressly in histori-cal mechanisms However it is expected that this connec-
Decoupling Case Studies Revenue Regulation Implementation in Six States
37
68 EIA Form EIA-861 data files Available at httpwwweiagovelectricitydataeia861
69 PGampE began revenue regulation in 1974 and it was later suspended and recommenced in 2001
70 WPS savings are represented by the statewide program savings from the Focus on Energy program WPS provided additional funds to Focus on Energy starting in CY10 through their territory-wide program activities
71 In 2009 Hawaii Energy a ratepayer-funded statewide energy efficiency provider began delivering services Savings reported after 2009 represent savings achieved through the programs of Hawaii Energy
Table 13
Annual Incremental Energy Efficiency Savings as Percentage of Retail Sales68
Highlighted cells are the year that utility started decoupling
Pacific Gas amp Electric69
Idaho Power Company
Baltimore Gas amp Electric
Wisconsin Public Service Corporation70
National Grid
Hawaiian Electric Company71
2004
11
01
00
03
11
00
2005
16
03
00
03
09
05
2006
10
05
00
03
12
05
2010
19
13
17
09
136
12
tion will be made in future mechanisms and furthermore it is anticipated that follow on work to this paper will want to study that connection between revenue regulation and DG performance
Conclusions
An increasing number of states are looking to increase the rate of energy efficiency investments for their long-run cost and risk advantages The benefits of energy efficiency include not only its ability to reduce system costs across the distribution transmission and generation functions but also the opportunity for customers to reduce their individ-ual energy costs for their own electric bills Nevertheless it is counterintuitive to encourage or order a utility to sell less of its product In order to encourage the proliferation of en-ergy efficiency programs as a solution that can contribute to this nationrsquos energy needs this tension between the goals of society versus the goals of the utility needs to be addressed Revenue regulation can be such a solution by removing the link between sales and revenues
There are many ways to implement revenue regulation and multiple decision points that regulators must consider in designing a revenue regulation mechanism This paper focused on six utilities each of which implemented revenue regulation in different ways in accordance with the objectives of that state Different decision points discussed include
bull Should revenue regulation apply to all functions (generation transmission and distribution) which sometimes depends on if the utility is regulated or restructured
bull Should revenue regulation apply to all customer classes
bull Should there be symmetry such that a reconciliation adjustment occurs for both over- and under-recoveries of the revenue requirements
bull Should recovery of indicated surcharges be conditioned on acceptable performance on customer service quality or energy efficiency goals
bull Should there be an attrition adjustment to account for other expenses or should the revenue regulation adjustment be limited to reconciling existing revenue requirements
bull Should there be an inflation adjustmentbull To calculate the revenue requirements should the
current or accrual method be usedbull Should the adjustments be made in rate cases or
through a riderbull How frequently should adjustments be made
monthly annually or some other time periodbull Depending on the period of time between true up and
recovery should there be carrying charges and if so how should they be calculated
2007
21
06
00
03
09
04
2008
35
10
05
09
05
05
2009
20
11
06
10
11
11
Decoupling Case Studies Revenue Regulation Implementation in Six States
38
72 Avista Utilities (2009) Washington Utilities and Transportation Commission Docket UE-090134
bull Should there be a requirement authorizing the frequency of rate case
bull Should there be an annual cap on the amount of the adjustment and if so should there be an opportunity to carry over any additional amounts and for how many years
bull Should there be an adjustment to the cost of capital to reflect the reduced risk
Other considerations for regulators whether or not they implement revenue regulation but certainly as part of a comprehensive package are other measures that can be put in place to encourage consumers and utilities alike to actively participate in energy efficiency For example an inclining block rate structure by virtue of its incentive to consume less pairs well with an energy efficiency program helps drive consumers to participate in efficiency programs and accelerates the payback of an energy efficiency investment By the same token an incentive payment to the utility helps provide its management with a good reason to excel and exceed targets for energy efficiency programs
A key point illustrated by the list of considerations above is that there is not just one static way to design and implement revenue regulation but rather there are a variety of options for doing so In this study a diverse group of utilities were reviewed The differences among the utilities included geographic diversity vertically integrated and restructured utilities different levels of energy efficiency in place and certainly differences in how the revenue regulation mechanisms were implemented No two utilities were alike and no two utilities had the same revenue regulation mechanism The key is that revenue regulation should eliminate the throughput incentive but the means for accomplishing this goal can vary and be tailored to each jurisdiction and each utility and still be successful
There are several considerations in the design of a revenue regulation mechanism that can help ensure its successful adoption To begin revenue regulation should be granted to utilities only as a precondition to implementing comprehensive energy efficiency andor DG policies Unless accompanied by a commitment to engage in providing least-cost resource options that could impact sales there is not really any good policy reason for its adoption All of the utilities studied are actively engaging in energy efficiency Furthermore as a matter of fairness the revenue regulation mechanism should be symmetrical so that any revenues above those authorized are refunded back to consumers As Figure 1 demonstrates although there are more surcharges to customers there is nevertheless a healthy amount of
credits back to consumers This is the bargain Barring imprudence or other unforeseen circumstances the utility receives its authorized revenue requirements and nothing more or less under a simple revenue regulation mechanism
Rate design plays an important role in the effectiveness of energy efficiency in concert with revenue regulation A low customer charge is preferable so that the customer can benefit from real bill reductions tied to reduced volumetric consumption Reductions in consumption not only reduce bills but also positively impact the payback period for investments in energy efficient appliances Declining block rates in which the tail block rate is lower than the first tier also do not encourage conservation Inclining block rates that reward low usage in the first block with a lower rate send the better price signals None of the six utilities studied had declining block residential rates They were inclining flat and time-varying
The revenue adjustment mechanism is also a critical decision point in terms of whether a revenue per customer mechanism is adopted that accounts for only the current revenue requirements or whether latitude is given to include an inflation adjustment or other cost increases in the revenue adjustment mechanism Three of the utilities studied adopted this approach whereas another two used a hybrid approach Finally to reduce volatility five of the six utilities opted for annual rather than monthly adjustments thereby creating a level of rate stability that customers in general prefer
Once the goals for revenue regulation are set by the regulators the next step is to design programs that will implement that goal For energy efficiency to be as successful as possible regulators may want to adopt a complement of other policies to accompany revenue regulation These can include rate designs that reward reduced use and conservation as well as incentive payments to utilities that reward them for meeting or exceeding targets Of the six utilities studied three have adopted some form of incentive One simple approach that was used in Washington was to link recovery of any surcharges under the revenue regulation mechanism to achievement of energy efficiency targets72
For the utilities examined above that have implemented revenue regulation the evidence demonstrates that revenue regulation as a strategy and a mechanism to enable
Decoupling Case Studies Revenue Regulation Implementation in Six States
39
energy efficiency has been working well The fact that each revenue regulation mechanism varies from the next demonstrates that there are many different paths that can be followed in implementing revenue regulation based on the needs of the utility and its stakeholders in a particular
region This study demonstrates that revenue regulation does work and provides examples of how it can be implemented each one different and unique because of the number of decision points to be considered in designing a revenue regulation mechanism
Decoupling Case Studies Revenue Regulation Implementation in Six States
40
Appendix
Historic Rate Adjustments
Table 14
PGampE Revenue Regulation Rate Adjustments 1983 to 199373
Table 15
PGampE Revenue Regulation Adjustments 2005 to 201274
Table 16
IPC Revenue Regulation Adjustments76
Idaho Power Company
1983 23
1984 (34)
1985 (48)
1986 19
1987 21
1988 50
1989 (43)
1990 (54)
1991 39
1992 34
1993 00
2005 8925 minus12773 minus143
2006 9933 2246 226
2007 10409 21727 209
2008 10261 4032 039
2009 11169 10355 093
2010 11224 46556 415
2011 10306 38390 373
2012 11032 40304 365
2007 Residential minus00457 590 minus077
Commercial minus00457 428 minus107
2008 Residential 00529 670 090
Commercial 00529 510 104
2009 Residential 01220 770 158
Commercial 01535 603 255
2010 Residential 01800 785 229
Commercial 02273 613 371
2011 Residential 02028 785 258
Commercial 02597 613 424
Revenue Regulation Adjustment as of
Total Rates
Delivery Revenue
Requirement ($ millions)
Adjustment Rate
Revenue Regulation Adjustment($ millions)
Retail Rate
of Delivery Revenue
Revenue Regulation Adjustment
Year
Year
73 Lesh P (2009 June 30) Rate impacts and key design elements of gas and electric utility decoupling
74 Morgan P (2012 November) A decade of decoupling for US energy utilities rate impacts designs and observations
75 Morgan P (2012 November) A decade of decoupling for US energy utilities rate impacts designs and observations
76 All numbers provided by the utility
Decoupling Case Studies Revenue Regulation Implementation in Six States
41
77 Idaho Power Company Case No IPC-E-11-19- fixed cost adjustment permanent mechanism Available at httpwwwpucidahogovinternetcaseselecIPCIPCE1119company20120928COMPLIANCE20FILINGPDF
Figure 2
IPC Revenue Regulation Adjustments77
Residential FCA Balance and Use per Customer
$10000000
$8000000
$6000000
$4000000
$2000000
$0
-$2000000
-$4000000
-$6000000
1080
1070
1060
1050
1040
1030
1020
1010
1000Res
idu
al A
uth
oriz
ed F
CA
Am
oun
t
Residual Authorized FCA Amount ($)
Monthly Use Per Customer (kWh)
kW
h U
sed
2006 2007 2008 2009 2010 2011
78 Morgan P (2012 November) A decade of decoupling for US energy utilities rate impacts designs and observations
Decoupling Case Studies Revenue Regulation Implementation in Six States
42
Table 17a
Baltimore Gas and ElectricBGE Monthly Revenue Regulation Adjustments 2008 to 201278
Table 17b
Baltimore Gas and ElectricBGE Monthly Revenue Regulation Adjustments 2008 to 201278
March Residential 000172 01477 1165General Service 000230 01526 1507
April Residential 000016 01477 0108General Service 000146 01526 0957
May Residential 000066 01477 0447General Service 000230 01526 1507
June Residential minus000066 01477 minus0447General Service 000230 01526 1507
July Residential 000158 01477 1070General Service 000230 01526 1507
August Residential minus000040 01477 minus0271General Service 000214 01526 1402
September Residential 000237 01477 1605General Service 000230 01526 1507
October Residential 000237 01477 1605General Service 000143 01526 0937
November Residential 000237 01477 1605General Service 000140 01526 0917
December Residential 000445 01477 3013General Service 000230 01526 1507
January Residential 000035 01579 0222General Service minus000073 01346 minus0542
February Residential 000025 01579 0158General Service 000230 01346 1709
March Residential minus000237 01579 minus1501General Service 000230 01346 1709
April Residential minus000237 01579 minus1501General Service 000230 01346 1709
May Residential 000234 01579 1482General Service 000132 01346 0981
June Residential 000237 01579 1501General Service 000230 01346 1709
July Residential 000237 01579 1501General Service 000230 01346 1709
August Residential 000237 01579 1501General Service 000190 01346 1412
September Residential 000237 01579 1501General Service 000230 01346 1709
October Residential 000237 01579 1501General Service 000124 01346 0921
November Residential 000237 01579 1501General Service 000230 01346 1709
December Residential 000156 01579 0988General Service 000204 01346 1516
Adjustment $kWh
Adjustment $kWh2008 2009
Retail Rate
$kWh
Retail Rate
$kWhAdjustment
Adjustment
Decoupling Case Studies Revenue Regulation Implementation in Six States
43
Table 17c
Baltimore Gas and ElectricBGE Monthly Revenue Regulation Adjustments 2008 to 201278
Table 17d
Baltimore Gas and ElectricBGE Monthly Revenue Regulation Adjustments 2008 to 201278
January Residential 000203 01465 1386General Service 000230 01261 1824
February Residential minus000142 01465 minus0969General Service 000230 01261 1824
March Residential minus000237 01465 minus1618General Service 000230 01261 1824
April Residential minus000237 01465 minus1618General Service 000230 01261 1824
May Residential 000192 01465 1311General Service 000230 01261 1824
June Residential 000191 01465 1304General Service 000230 01261 1824
July Residential 000095 01465 0648General Service 000230 01261 1824
August Residential minus000176 01465 minus1201General Service 000224 01261 1776
September Residential minus000237 01465 minus1618General Service 000116 01261 0920
October Residential minus000237 01465 minus1618General Service 000081 01261 0642
November Residential minus000237 01465 minus1618General Service 000098 01261 0777
December Residential minus000079 01465 minus0539General Service 000229 01261 1816
January Residential minus000130 01365 minus0952General Service 000230 01156 1990
February Residential minus000253 01365 minus1853General Service minus000020 01156 minus0173
March Residential minus000018 01365 minus0132General Service minus000063 01156 minus0545
April Residential 000110 01365 0806General Service minus000262 01156 minus2266
May Residential 000010 01365 0073General Service minus000160 01156 minus1384
June Residential 000226 01365 1656General Service 000042 01156 0363
July Residential 000253 01365 1853General Service 000209 01156 1808
August Residential minus000007 01365 minus0051General Service minus000157 01156 minus1358
September Residential minus000253 01365 minus1853General Service minus000177 01156 minus1531
October Residential 000228 01365 1670General Service 000262 01156 2266
November Residential minus000059 01365 minus0432General Service 000262 01156 2266
December Residential 000071 01365 0520General Service 000262 01156 2266
Adjustment $kWh
Adjustment $kWh2010 2011
Retail Rate
$kWh
Retail Rate
$kWhAdjustment
Adjustment
Decoupling Case Studies Revenue Regulation Implementation in Six States
44
Table 17e
Baltimore Gas and ElectricBGE Monthly Revenue Regulation Adjustments 2008 to 201278
January Residential 000253 01291 1960General Service 000262 01064 2462
February Residential 000253 01291 1960General Service 000262 01064 2462
March Residential 000253 01291 1960General Service 000262 01064 2462
April Residential 000253 01291 1960General Service 000262 01064 2462
May Residential 000253 01291 1960General Service 000262 01064 2462
June Residential 000253 01291 1960General Service 000262 01064 2462
July Residential 000253 01291 1960General Service 000262 01064 2462
August Residential 000253 01291 1960General Service 000160 01064 1504
Adjustment $kWh2012
Retail Rate
$kWhAdjustment
Decoupling Case Studies Revenue Regulation Implementation in Six States
45
79 Morgan P (2012 November) A decade of decoupling for US energy utilities rate impacts designs and observations
80 Morgan P (2012 November) A decade of decoupling for US energy utilities rate impacts designs and observations
Table 18
Wisconsin Public Service Corporation Revenue Regulation Adjustments 2009 to 201179
2009 ResidentialSmall Commercial 00048705 000168154 01290 378 130Commercial 00084951 000293293 00945 899 310
2010 ResidentialSmall Commercial 00033043 000166936 01291 256 129Commercial 00056630 000286103 09460 060 030
2011 ResidentialSmall Commercial (00018666) $ (000163719) 01288 minus145 minus127Commercial (00032565) $ (000285629) 01037 minus314 minus275
Derived Adjustment
$kWh
Derived Adjustment Capped $
kWh
Retail Rate
$kWh
Revenue Regulation Actual
Revenue Regulation Capped
Table 19
National Grid Revenue Regulation Adjustments 2011-201276
Massachusetts Electric and Nantucket Electric
Table 20
Hawaiian Electric Company
2011 All minus0015 1429 minus0105
2012 All 0044 1396 0315
2011 01995 3149 063
2012 03894 3641 107
Revenue Regulation Adjustment
centkWh
Revenue Regulation Adjustment
centkWhRetail Rate
centkWh
Retail Rate
Revenue Regulation Adjustment
Revenue Regulation
ldquoThe 2011 adjustment took effect June 1 but was reduced to $0 on July 26 2011 when the Commission granted HECO an interim rate increase of $532 million in a 2011 test year general rate case The 2012 Adjustment runs from June 1 2012 through May 31 2013 About 25 of the total relates to the portion of the decoupling mechanism that updates OampM and rate baserdquo (Morgan 2013)
Decoupling Case Studies Revenue Regulation Implementation in Six States
46
Revenue Regulation and Decoupling A Guide to Theory and Applicationhttpwwwraponlineorgdocumentdownloadid902
This guide was prepared to assist anyone who needs to understand both the mechanics of a regulatory tool known as decoupling and the policy issues associated with its use This would include public utility commissioners and staff utility management advocates and others with a stake in the regulated energy system While this guide is somewhat technical at points we have tried to make it accessible to a broad audience to make comprehensible the underlying concepts and the implications of different design choices This guide includes a detailed case study that demonstrates the impacts of decoupling using different pricing structures (rate designs) and usage patterns
Pricing Dorsquos and Donrsquots Designing Retail Rates as if Efficiency Countshttpwwwraponlineorgdocumentdownloadid939
Rate design is a crucial element of an overall regulatory strategy that fosters energy efficiency and sends appropriate signals about efficient system investment and operations Rate design is also fully under the control of state regulators Progressive rate design elements can guide consumers to participate in energy efficiency programs and reduce peak demand yet relatively few utilities and commissions have implemented many of these elements This RAP paper identifies some best practices Because pricing issues tie closely to utility growth incentives we also address revenue decoupling
A Decade of Decoupling for US Energy Utilities Rate Impacts Designs and Observationshttpwwwraponlineorgdocumentdownloadid6356
This report written by Pamela Morgan of Graceful Systems LLC builds on a 2009 report Now covering 25 states including 49 LDCs and 24 electric utilities this report summarizes the decoupling mechanism designs these utilities use and the rate adjustments they have made under those mechanisms In total this report estimates the retail rate impacts of 1244 decoupling mechanism adjustments since 2005
Additional Resources
The Role of Decoupling Where Energy Efficiency is Required by Lawhttpwwwraponlineorgdocumentdownloadid275
This Issuesletter gives an overview of energy efficiency resource standards the need to decouple utility profits from utility sales and explains why decoupling is needed even where a third party administers energy efficiency programs
Revenue Decoupling Standards and Criteria A Report to the Minnesota Public Utilities Commissionhttpwwwraponlineorgdocumentdownloadid850
In 2007 the Minnesota legislature enacted a new statute Section 216B2412 in which it defined an alternative approach to utility regulation decoupling and directed the Public Utilities Commission (PUC) to ldquoestablish criteria and standardsrdquo by which decoupling could be adopted for the statersquos rate-regulated utilitiesTo fulfill its obligation to develop criteria and standards for decoupling the PUC sought the advice of the Regulatory Assistance Project (RAP) This report is the output of that collaboration
Designing Distributed Generation Tariffs Wellhttpwwwraponlineorgdocumentdownloadid6898
Improvements in distributed generation economics increasing consumer preference for clean distributed energy resources and a favorable policy environment in many states have combined to produce significant increases in distributed generation adoption in the United States Regulators are looking for the well-designed tariff that compensates distributed generation adopters fairly for the value they provide to the electric system compensates the utility fairly for the grid services it provides and charges non-participating consumers fairly for the value of the services they receive This paper offers regulatory options for dealing with distributed generation The authors outline current tariffs and ponder what regulators should consider as they weigh the benefits costs and net value to distributed generation adopters non-adopters the utility and society as a whole The paper highlights the importance of deciding upon a valuation methodology so that the presence or absence of cross-subsidies can be determined Finally the paper offers rate design and ratemaking options for regulators to consider and includes recommendations for fairly implementing tariffs and ratemaking treatments to promote the public interest and ensure fair compensation
Decoupling Case Studies Revenue Regulation Implementation in Six States
47
The Regulatory Assistance Project (RAP)trade is a global non-profit team of experts focused on thelong-term economic and environmental sustainability of the power sector We provide technical and policy assistance on regulatory and market policies that promote economic efficiency environmental protection system reliability and the fair allocation of system benefits among consumers We work extensively in the US China the European Union and India Visit our website at wwwraponlineorg to learn more about our work
Rate Design Where Advanced Metering Infrastructure Has Not Been Fully Deployedhttpwwwraponlineorgdocumentdownloadid6516
This paper identifies sound practices in rate design applied around the globe using conventional metering technology Rate design for most residential and small commercial customers (mass market consumers) is most often reflected in a simple monthly access charge and a per-kWh usage rate in one or more blocks and one or more seasons A central theme across the practices highlighted in this paper is that of sending effective pricing signals through the usage-sensitive components of rates in a way that reflects the character of underlying long-run costs associated with production and usage While new technology is enabling innovations in rate design that carry some promise of better capturing opportunities for more responsive load the majority of the worldrsquos electricity usage is expected to remain under conventional pricing at least through the end of the decade and much longer in some areas Experience to date has shown that the traditional approaches to rate design persist well after the enabling technology is in place that leads to change
Time-Varying and Dynamic Rate Designhttpwwwraponlineorgdocumentdownloadid5131
This report discusses important issues in the design and deployment of time-varying rates The term time-varying rates is used in this report as encompassing traditional time-of-use rates (such as time-of-day rates and seasonal rates) as well as newer dynamic pricing rates (such as critical peak pricing and real time pricing) The discussion is primarily focused on residential customers and small commercial customers who are collectively referred to as the mass market The report also summarizes international experience with time-varying rate offerings
50 State Street Suite 3Montpelier Vermont 05602802-223-8199wwwraponlineorg
- Table of Contents
- Introduction
- California Pacific Gas and Electric Company
- Idaho Idaho Power Company
- Maryland Baltimore Gas and Electric
- Wisconsin Wisconsin Public Service Corporation
- Massachusetts National Grid
- Hawaii Hawaiian Electric Company
- Discussion of the Six Utilities Overall
- Conclusions
- Appendix
- Additional Resources
-

Decoupling Case Studies Revenue Regulation Implementation in Six States
16
27 The pilot extension is in effect until the effective date of a Final Decision issued by the Commission on an application for a general base rate case filed after January 1 2013
28 Except the Direct Load Control Cp - Large Commercial amp Industrial Service Cp-ND - Pilot Large Commercial amp Industrial - Day Ahead Cp-RR - Large Commercial amp Industrial Response Rewards Automatic Transfer Switch Parallel Generation Lighting Nature Wise and Real Time Market Pricing tariffs
Wisconsin Wisconsin Public Service Corporation
Wisconsin Public Service Corporationrsquos (WPS) Revenue Stabilization Mechanism (RSM) began in 2009 as a four-year revenue regulation pilot that reconciled
target marginal revenue per customer with actual marginal revenue per customer As of 2012 the pilot was extended27 albeit with some modifications This section focuses on the current iteration of the RSM
AuthorityThe Public Service Commission of Wisconsin (PSCW)
approved a revenue regulation pilot for WPS in a Decem-ber 2008 rate case order (Docket No 6690-UR-119) The revenue regulation mechanism was effective from January 1 2009 through December 31 2012 and applied to the util-ityrsquos electric and gas operations In a rate case completed in December 2012 (Docket No 6690-UR-121) the pilot was extended and a modified RSM was approved The extended RSM is in effect from January 2013 until the next rate case
Authorized Revenue RequirementThe authorized revenue requirement is determined
through a rate case The Commission uses a future test year to determine the revenue requirement The cost of fuel is not included in the revenue requirement but is addressed through a ldquoRetail Electric Fuel Rulerdquo adjustment
Rate of ReturnThe Commission authorized a rate of return on utility
common equity of 1030 percent in Docket No 6690-UR-120 This rate remained the same in Docket No 6690-UR-121 and is currently in effect
Revenue Adjustment MechanismWPS implemented a new electric RSM based on a ldquoTotal
Rate Case Marginrdquo mechanism instead of a ldquoTotal Rate Case Margin per Customerrdquo mechanism which had been the practice during the initial four-year pilot phase The revision was intended to remove the calculation sensitivities related
to sales per customer from the original RSM calculation The margin reflected in the formula equals the total revenue for each tariff less the costs associated with the annual per-kWh value established for monitored fuel costs and excluding any surcharges credits taxes or similar charges The ldquoTotal Rate Case Marginrdquo mechanism allows WPS to achieve the total margin assumed in the forecasted test year no more and no less The new RSM will be in effect on a pilot basis until the effective date of WPSrsquos next general rate order which WPS committed to filing for the 2014 andor 2015 test years The RSM applies to most tariffs except large commercial and industrial customers28
Reconciling Actual Revenue With Authorized Revenue
Each year the utility compares the total target revenue and the total actual revenue and defers the difference subject to carrying costs based on WPSrsquos last approved short-term debt rate The margin will be based on annual per-kWh value established for monitored fuel costs which is done in a rate case The margin is determined by subtracting the aver-age kWh value from the authorized energy rates
The formula for calculating an electric under-recovery or over-recovery is
Under-recovery or over-recovery equals
[actual margin minus ratecase forecasted margin established in the most recent rate proceeding]
The summation is over each tariff A positive value equals an over-recovery and a negative value equals an
Decoupling Case Studies Revenue Regulation Implementation in Six States
17
29 The required spending level was higher for the year 2011 owing to a temporary change in state policy
30 ACEEE Wisconsin Available at httpaceeeorgsectorstate-policywisconsin
31 The Cadmus Group Inc (2013)
under-recovery The margin reflected in the formula equals the total revenue for each tariff less the costs associated with the annual per-kWh value established for monitored fuel costs and excluding any surcharges credits taxes or similar charges
In the event that a true-up will cause rates to increase the Commission will provide an opportunity for a hear-ing Revenue regulation adjustments occur as a part of the general rate case
The revenue regulation adjustments are subject to a $14 million per year cap for electric excluding carrying costs Any adjustments over that amount will not be carried over and will not be collected from ratepayers Equivalently revenue over collection in excess of $14 million will not be returned to ratepayers
Complementary PoliciesWPS like all other investor-owned utilities
in Wisconsin is required to spend 12 per-cent of its annual operating revenues on en-ergy efficiency and customer-owned renew-able resource programs that are administered by a third party through the Focus on Energy program which was established in 200229 Separately through a contract the PSCW ap-proves annual electricity savings goals for the Focus on Energy program The savings goals were equivalent to 075 percent of electric sales for the participating utilities from 2011 to 2013 In addition the PSCW approved a rate of return on investments in energy efficiency for Wisconsin Power amp Light and other utilities can propose incentives as part of their rate cases However WPS has not yet proposed an incentive mechanism30
WPS offers residential customers a default flat rate but they also offer a TOU option with winter and summer on-peak off-peak and shoulder tiers For small commercial and industrial customers there are flat rates TOU rates and critical peak rates Large commercial and industrial customers can take service under a TOU rate with summer and winter on-peak and off-peak rates a TOU with criti-cal peak rate or under a special contract rate unique to the customer and approved by the Commission
The authorized level of expensed conservation costs recoverable in rates for the test year (2013) is $19778728 The level for electric utility operations consists of the conservation budget of $17669792 and an escrow adjustment of $2108936 which represents the test year amortization of the projected overspent escrow balance at
December 31 2012 over two years Wisconsin has a statute requiring filing of reliability data
but no reward or penalty system to support its revenue regulation system
Energy Efficiency OutcomesWPS implemented revenue regulation in 2009 In order
to gain approval for the original revenue regulation mecha-nism WPS agreed to fund energy efficiency and renewable energy programs at levels above their 12-percent statutory minimum contribution to Focus on Energy Focus on Energy produces an annual report of energy efficiency program activities In its 2012 report Focus on Energy reports the following outcomes achieved for WPSrsquo service territory The table below represents the savings under the statewide Focus on Energy Programs and does not represent the savings at-tributed under the funding levels above 12 percent31
Territory Segment
Customer Participation
Rate () Utility Type
Per Capita Lifecycle Bill Savings ($)
Per Capita Incentive
($)
WPS Electric Commercial $115258 3 $8330
WPS Electric Industrial $9026768 96 $892463
WPS Electric Residential $6494 36 $666
ResourcesPublic Service Commission of WisconsinApplication of Wisconsin Public Service Corporation for
Authority to Adjust Electric and Natural Gas Rates Final Decision (December 7 2012) Docket No 6690-UR-121
David J Kyto Wisconsin Public Service Corporation Application of Wisconsin Public Service Corporation for
Authority to Adjust Electric and Natural Gas Rates Supplemental Direct Testimony (May 15 2012) Docket No 6690-UR-121
Focus on EnergyThe Cadmus Group Inc (2013) Focus on Energy Calendar
Year 2012 Evaluation Report Appendixes Portland OR The Cadmus Group Inc Retrieved from httpwwwfocusonenergycomsitesdefaultfilesFOC_XC_CY201220Report20Appendices20A-O20Final2005-3-13pdf
Decoupling Case Studies Revenue Regulation Implementation in Six States
18
32 DPU 07-50 (2007)
33 DPU 07-50 (2007) pp 392ndash396
Massachusetts National Grid
The revenue regulation mechanism for National Grid (Massachusetts Electric Company and Nantucket Electric Company together doing business as National Grid) compares authorized
distribution revenue to actual distribution revenue Revenue is compared and adjustments are made separately for each customer class
AuthorityThe Massachusetts Department of Public Utilities (DPU)
adopted revenue regulation as a statewide regulatory policy in 2008 and individual utilities filed revenue regulation tariffs in response In its Investigation Into Rate Structures that will Promote Efficient Deployment of Demand Resources32 the DPU investigated rate structures and revenue recovery mechanisms that may reduce disincentives to the efficient deployment of demand resources in the state and consid-ered how the electric and natural gas distribution compa-niesrsquo existing cost recovery mechanism could be changed to better align the companiesrsquo financial incentives with policy objectives while ensuring that the companies are not finan-cially harmed by the increased use of demand resources The DPU finally concluded that revenue regulation mecha-nisms would eliminate the financial disincentives because they sever the link between the companiesrsquo revenue and reduction in sales The DPU also endorsed a revenue per customer approach but recognized that other factors could result in changes to distribution-related costs and consent-ed to consider company-specific ratemaking proposals that accounted for the impact of capital spending and inflation-ary pressures on the companyrsquos required revenue
Authorized Revenue RequirementThe authorized revenue requirement does not include
costs that are reconciled outside of base distribution rates including energy supply costs for basic service customers transmission costs the energy efficiency system benefits charge and reconciling charge and costs recovered through the residential assistance adjustment factor
Rate of ReturnThe Commission recognized the effects of revenue
regulation on ROE and determined that revenue regulation reduces volatility which reduces risk and a downward ad-justment to ROE was appropriate but did not make its ac-tual ROE adjustment for the revenue regulation mechanism explicit in its order33 The DPU determined that a return on equity equal to 1035 percent was sufficient The testimony from National Grid supporting its proposed ROE presented comparisons of allowed ROE for a set of companies that had revenue regulation or another risk management mecha-nism in place to account for an implied reduced risk profile in developing that proposal
Revenue Adjustment MechanismEach year the authorized revenue requirement is ad-
justed to account for capital expenditures in the previous year The CapEx Adjustment applies to capital expenditures incurred by National Grid for distribution system invest-ments in the previous year net of the amount recovered through depreciation expense in base rates This accounts for the material difference in expected capital expenditures compared with prior years In this way the CapEx Adjust-ment in the National Grid revenue regulation mechanism is a special case of a ldquoK Factorrdquo which characterizes an expected change in costs in the future and accounts for those changes when they occur Each year the Company files with the Department documentation in support of the capital expenditures it has incurred since the previous review The Department reviews the filings to determine the prudence of the incremental expenditures and whether the expenditures are used and useful National Grid then allocates approved expenditures to rate classes based on the cost of service study For each class the Company determines the adjustment allocated to the rate class then divides this sum by the forecasted kWh sales for the follow-
Decoupling Case Studies Revenue Regulation Implementation in Six States
19
34 DPU 07-50 (2007) p 87
35 ACEEE Massachusetts Available at httpaceeeorgsectorstate-policymassachusetts
36 Personal communication with National Grid
ing year to determine the per-kWh adjustment In order to provide a balance between providing the
Company with sufficient funds to ensure the safety and reliability of the distribution system and protecting ratepay-ers against the incentive the Company has to overinvest in infrastructure the mechanism limits the level of annual capital expenditures that is recoverable through the mecha-nism To arrive at the amount the Department set a limit of $170 million per year which is equal to the approximate three-year average of the Companyrsquos capital spending in previous years Should the Companyrsquos capital expenditures exceed this limit it may seek to include the investment in the rate base during the next base rate proceeding
The Company submits its CapEx filing no later than July 1 of each year On November 1 of each year the Company submits all other information in support of its proposed adjustment factors The factors will take effect on March 1 of each year
The authorized revenue is also adjusted to include a 50-percent sharing for earnings above the authorized ROE
Reconciling Actual Revenue With Authorized Revenue
Each year National Grid calculates on a rate class-spe-cific basis the difference between the actual distribution revenue billed to customers through distribution rates and the annual target revenue For each rate class the difference between the actual billed distribution revenue and the an-nual target revenue is summed to determine the Company-wide reconciliation amount That amount is divided by the Company-wide kWh forecasted for the upcoming year to arrive at a cent-per-kWh reconciliation charge or credit To determine the final adjustment for each rate class the Company-wide reconciliation adjustment is added to the rate class-specific adjustment resulting from the target rev-enue adjustment mechanisms
The adjustment to the authorized revenue in any year is capped at three percent of total revenues34 Any excess can be carried forward to a future year with carrying charges equal to the customer deposit rate
National Grid must report to the DPU if the difference between the year-to-date billed revenue and year-to-date annual target revenue equals or exceeds ten percent of the target revenue and the Company believes that the difference will fall outside of the ten-percent threshold in the coming months In this case interim revenue regulation adjust-ments can be made In order to avoid an interim adjust-ment too close to the scheduled annual rate adjustment
National Grid must notify the Department of variances exceeding ten percent of annual target revenue by August 31 of each year
Complementary Policies Massachusetts requires that electric utilities procure
all cost-effective energy efficiency before more expensive supply-side resources This requirement was translated into annual savings requirements for electric utilities starting from 1 percent of sales in 2009 to 14 percent in 2010 2 percent in 2011 and 24 percent in 2012 and potentially increased savings in subsequent years Utilities can earn approximately five percent of program costs for meeting or exceeding savings targets35
National Grid offers inclining block rates as the default residential rate but there is an optional TOU rate with peak and off-peak tiers also available to residential customers Small and large industrial and commercial customers can take service under flat rates inclining block rates or TOU rates
National Grid operates under a penalty and reward sys-tem for service quality established in Docket DTE 99-84 The impetus behind the DPUrsquos original establishment of the Service Quality Guidelines was to prevent Massachusetts utilities from allowing service quality to deteriorate under a new regulatory regime
Energy Efficiency OutcomesBefore Massachusetts Electric implemented revenue
regulation in 2009 it reported consistently high levels of incremental energy efficiency savings approximately 09 percent of retail load In 2010 the company reported 136 percent savings and 159 percent in 2010 and 2011 respectively36
ResourcesMassachusetts Department of Public UtilitiesDocket 09-39 Petition of Massachusetts Electric Company
(November 30 2009)
Decoupling Case Studies Revenue Regulation Implementation in Six States
20
37 Energy Agreement Among the State of Hawaii Division of Consumer Advocacy of the Department of Commerce amp Consumer Affairs and Hawaiian Electric Companies Available at httpwwwhecocomvcmcontentStaticFilespdfHCEIpdf
38 The HECO Companies described as follows in their Reply SOP in the Schedule A decoupling proceedings ldquothe
Hawaii Hawaiian Electric Company
Hawaiian Electric Company (HECO) uses a revenue regulation mechanism that compares actual revenue to target revenue in each year The target revenue is based on the authorized
revenue for the last test year adjusted for operation and maintenance (OampM) increases and rate base changes
HECO is a subsidiary of Hawaiian Electric Industries which also operates Maui Electric Company (MECO) and Hawaiian Electric Light Company these subsidiaries service the islands of Maui and Hawaii County while HECO serves Oahu (Honolulu)
Authority In 2008 the Governor of Hawaii the Division of Con-
sumer Advocacy and HECO entered into an agreement as a result of the Hawaii Clean Energy Initiative37 The agreement is intended to move Hawaii away from its dependence on imported fossil fuels for electricity and ground transporta-tion and toward locally produced renewable energy and energy efficiency In the agreement the State the Consumer Advocate and HECO committed to among other things a transition away from a model that encourages increased elec-tricity usage and to a model that implements revenue regula-tion decoupling to encourage the development of renewable energy by HECO The Commission opened Docket 2008-0274 in order to examine the features of a revenue regula-tion mechanism The Opening Order directed HECO and the Consumer Advocate to file a joint proposal on revenue regulation within 60 days This joint proposal was modeled closely after the California mechanism described earlier for PGampE with a rate-case determined revenue requirement plus annual attrition adjustments plus separate mechanisms
to recover power supply and energy efficiency costsThe Hawaii Public Utilities Commission approved
revenue regulation for HECO in August 2010 based on an investigation into the appropriateness of revenue regula-tion and its design The revenue regulation mechanism took effect on March 1 2011 This replaced a previous lost revenue adjustment mechanism
Authorized Revenue RequirementThe Commission establishes the Authorized Base Rev-
enues through a general rate case based on traditional cost-of-service ratemaking principles The Authorized Base Revenue is the annual amount of revenues required for the utility to recover its estimated OampM depreciation amorti-zation and tax expenses for the period
The Target Revenue is equal to the base revenue require-ment less any revenue being separately tracked or recov-ered through any other surcharge or tracking mechanism including revenue for fuel and purchased power expenses
The revenue regulation order also requires staggered triennial rate cases for each of the Hawaiian Electric Indus-tries Companies to determine approved baseline Revenue Adjustment Mechanism (RAM) inputs
Rate of ReturnThe Commission made no explicit adjustment to ROE
owing to the revenue regulation mechanism but noted that the allowed ROE of ten percent reflects the approval of revenue regulation and other cost-recovery mechanisms that will lower HECOrsquos business risk38 Most recently the Hawaiian Public Utilities Commission approved a 90-per-cent ROE for MECO reflecting both a lower baseline cost
Commission effectively reduced the Companiesrsquo return on common equity by 50 basis points to ldquofairly compensate ratepayersrdquo for what it perceived as the ldquorisk-reducingrdquo effects of the RBA and RAM mechanisms the Renewable Energy Infrastructure Program (lsquoREIPrdquo) Surcharge and the Purchased Power Adjustment Clause (ldquoPPACrdquo)rdquo Available at httpdmspuchawaiigovdmsDocumentViewerpid=A1001001A10L29B55326B47993
Decoupling Case Studies Revenue Regulation Implementation in Six States
21
39 Hawaii PUC Decision and Order No 31288 (2013 May 31) pp 97ndash112
40 Hawaii PUC Decision and Order No 31289 (2013 May 31)
41 Hawaii PUC Decision and Order No 31908 (2014 Feb 1)
42 February 7 2014 order on schedule A issues Available at httpdmspuchawaiigovdmsDocumentViewerpid=A1001001A14B10B22326F07922 p 42ndash47
of capital and a penalty of 050 percent associated with inadequate performance bringing renewable energy into the MECO system39 A companion Order also established new guidance on future revenue regulation mechanisms40
Revenue Adjustment MechanismThe RAM is designed to replace the need for annual rate
cases by adjusting Authorized Base Revenue levels to reflect estimated changes in the utilityrsquos cost of service The RAM is intended to via formula-driven estimates and escalators compensate the HECO Companies for changes in util-ity costs and infrastructure investment between rate cases and reduce the frequency of rate cases The RAM Period is the calendar year containing the Annual Evaluation Date (March 31 the date of the annual RAM filing) The RAM adjusts the revenue requirement according to changes in four main categories of expenses
bull Base expenses which are changes in designated OampM expenses
bull Rate base the return on incremental investment in designated rate base components41
bull The incremental depreciation and amortization expenses and
bull Exogenous tax changes changes in costs owing to significant changes in tax laws or tax regulations
Base expenses are segregated between labor and non-labor amounts The labor component is adjusted annually by the Labor Cost Escalation Rate reduced by the Labor Productiv-ity Offset (fixed at 076 percent) The non-labor component uses the Non-labor Escalation Rate to annually adjust those costs Tracked OampM expenses for fuel purchased power pension and post-employment benefits integrated resource planning DSM and other rate adjustment provisions are not adjusted in the RAM because any changes in these costs are accounted for in other cost-tracking mechanisms
The Rate Base equals the average net investment esti-mated for the RAM Period The average rate base is the rate base for the rate case test year with adjustments for changes in only four components of rate base (1) average plant-in-service (2) average Accumulated Depreciation (3) average accumulated contributions in aid of construc-tion and (4) average accumulated deferred income taxes All other components of the rate base remain the same as in the preceding rate case test year The average plant-in-service is equal to the average of the actual plant-in-service at the end of the year prior to the RAM period the Evalu-ation Year and the same year-end balance plus estimated plant additions for the RAM period Plant additions include
Baseline Capital Project plant additions and Major Capital Projects plant additions estimated to be in service by Sep-tember 30 of the RAM period
The RAM also includes an Earnings Sharing Revenue Credit mechanism in order to protect against excessive over-all utility revenue levels The RAM will escalate and update the Companyrsquos approved base revenue requirement reduced by earnings sharing credits and major project revenue credits to customers Based on the Companyrsquos achieved return on common equity for the Evaluation Year the mechanism cred-its the RBAs according to the following chart
ROE at or below the authorized ROE
First 100 basis points (1) over authorized ROE
Next 200 basis points (2) over authorized ROE
ROE exceeding 300 basis points (3) over
authorized ROE
Retained entirely by shareholders no customer credits
25 share credit to customers
50 share credit to customers
90 share credit to customers
Finally the RAM includes additional consumer protectionsbull A provision for Major Capital Projects Creditsbull A provision for Baseline Capital Projects Creditsbull Notification is provided to all affected customers of
the RAM filing in newspapers and billsbull Evaluation procedures for filing examination and any
exceptions to annual revenue regulation filingsbull Continued ability of HECO or the Consumer
Advocate to request formal rate proceedings to replace and terminate RAM at any time and
bull Formal review of revenue regulation as a part of the next round of rate case proceedings
A recent order42 added two additional consumer protections
bull A limitation that only 90 percent of the current
Decoupling Case Studies Revenue Regulation Implementation in Six States
22
43 ACEEE Hawaii Available at httpaceeeorgsectorstate-policyhawaii
RAM Period Rate Base that exceeds the Rate Base Adjustment Mechanism from the prior year can be included in the Decoupling Mechanism for baseline utility plant projects which unlike major capital projects are not subject to prior Commission review and approval and
bull A requirement to post a number of metrics online for customer review although not at this point tied to performance
This order also examined four issues with respect to the application of the RAM The Commission determined that the short-term debt rate as reflected in the most recent rate case should be used to adjust over- and under-collections The Commission also resolved its concern that without a sustainable business plan there exists no strategic frame-work under which to evaluate capital expenditure pro-grams The Commission required the parties in the Docket to further explore capital expenditure issues in conjunction with other risk-sharing mechanisms discussed elsewhere in the order The commission ordered a further evaluation of a proposed risk-sharing mechanism within the RBA Further-more the Commission ordered the parties to work together to establish appropriate metrics which the utility would report on its website
Once the total RAM Revenue Adjustment is calculated it is applied through a uniform adjustment to the per-kWh energy charge for all customer classes
Reconciling Actual Revenue with Authorized Revenue
RBAs record the monthly differences between target revenues and the adjusted recorded electric sales revenues The RBA also applies monthly interest equal to the annual rate for short-term debt from the cost of capital in each HECO Companyrsquos last base rate case to the simple average of the beginning and ending balances each month in the RBA In effect the RBA applies one-twelfth of the rate each month Finally the RBA provides for collection or return of the calendar year-end balances in the RBA and recovery of the RAM Revenue Adjustment over the subsequent May 1 through April 30 period The target revenue is the most recent Authorized Base Revenue or the re-determined Authorized Base Revenue calculated under the RAM
On or before March 28 the Company must file with the Commission a statement of the previous year-end balance in each RBA sub-account and the Authorized Base Revenue level for the current calendar year with supporting calculations An amortization of the year-end balance in the
RBA sub-accounts and the RAM Revenue Adjustment are recovered through the per-kWh RBA rate adjustments The rate adjustment occurs from May 1 of the current calendar year to April 30 of the next year
Complementary PoliciesCurrently electric utilities in Hawaii may use energy
efficiency to meet a portion of their Renewable Portfolio Standard requirements Starting in 2015 electricity savings from energy efficiency will be applied to the Statersquos Energy Efficiency Portfolio Standard which sets a target equivalent to 30-percent forecast sales by 2030 This goal is translated into a target of 14 percent annual savings HECO trans-ferred administration of all of its energy efficiency programs to a third party administrator in 2009 The administrator is compensated for satisfactory performance43
Because of its heavy dependence on petroleum as a generation fuel electricity prices in Hawaii are very high solar and wind are typically lower-cost resources for these systems HECOrsquos default residential rates are inclining block rates with a $900month customer charge and a three-block inclining rate design of $034kWh to $037kWh Residential customers can elect to take service under a TOU rate with off-peak mid-peak and priority-peak tiers Gen-eral service and large power service customers take service under a flat rate unless they opt to take service under a TOU
Hawaii is developing reliability standards in part as a response to deteriorating service quality as a result of distributed and customer-owned generation (see text box) In an effort to make electricity reliability and interconnection standards as transparent as possible the Reliability Standards Working Group was formed in the Feed-In Tariff docket and continues its work in Docket No 2011-0206 to find solutions to integrating high penetrations of renewable energy consistent with reliability and power quality standards
Energy Efficiency OutcomesHECO implemented revenue regulation in 2011 Since
2003 HECO has reported incremental energy efficiency savings between 0 and 05 percent of retail load with 131 percent savings reported in 2011 by Hawaii Energy the
Decoupling Case Studies Revenue Regulation Implementation in Six States
23
44 Hawaii PUC Decision and Order No 31288 Maui Electric Company Limited Docket No 2011-0092 (2013 May 31) Appendix C p 2
Statersquos ratepayer funded efficiency program administrator The company has not yet reported its savings for 201245 In addition HECO has seen more than a sixfold increase in renewable installations under its net metering and feed-in tariff policies since the inception of the revenue regulation plan
Revenue regulation represents a regulatory framework that removes the financial disincentive for utilities to pursue clean
energy strategies It doesnrsquot in and of itself align the utility business model with those utility policies and practices that address customer expectations In fact some commissions are concerned that it might create a dynamic in which the utility assured of its revenue needs becomes complacent and lacks motivation to innovate and develop strategies that may be more in line with the public interest
In a recent order (Docket 2011-0092 May 31 2013) the Hawaiian Public Utilities Commission addressed this big picture issue in a rate order for Maui Electric The Commission called out the management as lacking a long-term vision for creating customer value and expressed concern that ldquothe HECO Companiesrsquo over-reliance upon a link between the [Decoupling]
Agreement and utility financial health obfuscates utility performance and ultimately customer service and satisfactionrdquo44 The implementation of clean energy policies is not a singular goal but rather a policy that must be part of a larger effort to create customer value
The Commission laid out a hard path and a soft path to achieve the results they desire for consumers The hard path involves a closer examination of utility investments operations and expenditures The soft path is opened through the actions of management to create and execute a vision for the utility of the future The Commission remains committed to regulatory innovations that are in the public interest and will work with the utility consumer advocate and other stakeholders to create and implement this vision
The results of this effort will likely produce ideas and outcomes that will have applicability beyond this one utility
ResourcesHawaii Public Utilities CommissionDocket No 2008-0274 Final Decision and Order (August 31 2010)Docket No 2008-0083 Final Decision and Order (December 29 2010)Docket No 2011-0092 Final Decision and Order May 31 2013 including
Decision and Orders Nos 31288 and 31289Docket No 2013-0141 Final Decision and Order (February 1 2014) including
Decision and Order No 31908
45 EIA Form EIA-861 data files Available at httpwwweiagovelectricitydataeia861
Decoupling Case Studies Revenue Regulation Implementation in Six States
24
46 Lazar et al 2011
Discussion of the Six Utilities Overall
Authority The first step in implementing a revenue regulation
mechanism is to understand the authority of the regulating body the Public Utility Commission or PSC It is important for any Commission to clarify its justification for acting on revenue regulation in order to prevent any decisions from being overturned Over the years Utilities Commissions have relied on different justifications for implementing revenue regulation mechanisms Commissions have imple-mented revenue regulation at their own discretion justified by their directive to ensure safe reliable and economic public utility service to citizens to justify changing the regulatory environment In some cases the Commission is unable to engage on narrow issue ratemaking and rates can change only as the result of a full rate case In this case statutes must be amended to enable revenue regulation
In all of the case studies discussed here the Commis-sions first implemented revenue regulation at their own dis-cretion but each followed slightly different paths to do so The CPUC first implemented revenue regulation in 1978 at its discretion In 2001 after a period when mechanisms were suspended the California Legislature required that deviations from projected sales not result in under- or over-collections by utilities and so the CPUC re-implemented revenue regulation according to statutory requirement The Hawaii Public Utilities Commission implemented rev-enue regulation after an agreement between the utility the Governor and other stakeholders called for it In Idaho the Commission established a case in which to investigate rev-enue regulation and held a series of stakeholder workshops before implementing the policy The Massachusetts DPU adopted revenue regulation as a statewide regulatory policy and required individual utilities to file tariffs in response as the result of its general investigation into rate structures that promote demand-side resources The Maryland Com-mission implemented revenue regulation for BGE when the utility requested the mechanism Thus the impetus to develop a revenue regulation mechanism may come from different sources and the Commission may be comfortable
in moving forward under their general supervisory statutes Nevertheless specific statutory language can be helpful to shore up the existing authority
Authorized Revenue Requirement Under the traditional regulatory framework the Com-
mission (or other authority in the case of publicly owned utilities) must determine a utilityrsquos revenue requirement This function does not change under revenue regulation The revenue requirement of a utility is the aggregate of all the operating and other costs incurred to provide service to the public This typically includes operating expenses depreciation and the cost of capital invested including in-terest on debt and a ldquofairrdquo return on equity to investors The (simplistic) formula for determining revenue requirements is as follows
Revenue Requirements = (Rate Base times Rate of Return) + Operating Expenses + Depreciation +Taxes
Traditionally the revenue requirement along with sales is used to determine the rates consumers will pay for elec-tricity46 The rates are also broken down by customer class and intraclass tariffs are created based usually on a cost of service study that determines each customer class and subclass contribution to the utilityrsquos costs The (simplistic) formula for determining the rate per unit is
Rate = Revenue Requirement divide Units Sold
In this way rates are set to allow the utility to exactly recover its revenue requirement when the sales level used to calculate rates is equal to actual sales However it is important to recognize that actual expense and revenue varies with actual sales When actual sales are greater than the sales level used in ratemaking revenue increases and expenses increase by a different amount when actual sales are lower than the ratemaking sales level actual revenue
Decoupling Case Studies Revenue Regulation Implementation in Six States
25
declines and expenses decrease by a different amount Under revenue regulation rates are initially set in the same way but when actual sales differ from the level used to calculate rates the actual revenue level is maintained at the rate case amount as rates are allowed to vary inversely with salesmdashincreased sales lead to decreased rates and vice versa Because the primary expenses that change in the short run as sales levels change are power supply expenses and most regulators allow these to be tracked using a power cost adjustment mechanism revenue regulation mechanisms are generally designed to ensure recovery of the non-power costs (which do not change significantly in the short-run) as sales volumes change
Revenue regulation ensures that actual revenue is equal to the revenue requirement established by the Commission or appropriate authority Although the description above presents an overly simplified view of the revenue require-ment and its use in traditional price regulation and revenue regulation there are many variations on how a Commis-sion can establish a revenue requirement particularly when implementing revenue regulation With revenue regulation as in traditional ratemaking imprudent costs can always be removed from rates and there is no change to the ability of a Commission to impose penalties
Utility Functions to be IncludedFirst the regulator must determine which utility func-
tions will be included in the revenue regulation framework With vertically integrated utilities this usually includes a utilityrsquos regulated generation transmission and distribution units As we discuss below however it is critical to struc-ture power supply recovery mechanisms to avoid providing for double-recovery of certain power supply costs For utili-ties operating in areas of the country that have restructured electricity markets only the regulated distribution busi-ness is decoupled Utilities that also provide gas services
Pacific Gas amp Electric Future test year
Idaho Power Company Historic test year
Baltimore Gas amp Electric Hybrid test year
Wisconsin Public Service Corporation Future test year
National Grid Historic test year
Hawaiian Electric Company Future test year
Table 2
Test Year Used
may have their gas distribution business operating under revenue regulation as well
Test YearOne consideration in establishing the revenue require-
ment is what period of time will be used as a ldquotest periodrdquo or ldquotest yearrdquo The test year is the year on which the Com-mission will base its computations of the utilityrsquos total costs and sales levels A historic test year uses actual data on sales and costs from a past year Whereas a historic test year allows for the use of actual cost data it cannot account for expected variations in sales A future test year requires assumptions to be made about a utilityrsquos sales in a future year This can allow expected changes in sales like those from energy efficiency programs to be included in sales
projections however because regulators are relying on estimates provided by the utility there may be a greater risk for inaccuracy A Commission may also choose to use a test year that includes both past and future periods This may provide a sense of balance between historic and future data Furthermore as the case proceeds the Commission can require the utility to substitute historical data for projected data from the test year
Rate of ReturnAs in any rate case regulators
must determine the appropriate rate of return that a utility can earn on its investments including the cost of debt and the allowed ROE for its shareholders The approved ROE is only used to establish the return on investments that are included in the rate base when determining revenue require-
Pacific Gas amp Electric Electric generation and distribution gas distribution
Idaho Power Company Electric generation and distribution
Baltimore Gas amp Electric Electric distribution gas distribution
Wisconsin Public Service Corporation Electric generation and distribution
National Grid Electric distribution
Hawaiian Electric Company Electric generation and distribution
Table 1
Business Unit Included in the Revenue Regulation Model
Decoupling Case Studies Revenue Regulation Implementation in Six States
26
47 In a rate case the Commission determines an allowed return on equity This is used to set a price (price regulation) or an allowed revenue requirement (revenue regulation) Once set however the actual return earned by the utility is affected by anything that changes either revenue or expenses for example an increase in employee compensation a change in the number of employees or under price regulation a change in sales volumes
48 Lazar et al 2011
ments Although revenue regulation ensures that a utility recovers no more or less than its target revenue revenue regulation does not guarantee that the utility will earn the authorized ROE Depending on how a utility manages its costs between rate cases it will realize an actual ROE either higher (in the case of reduced costs) or lower (in the case of increased costs) than the authorized level47
A utilityrsquos allowed ROE generally represents the return deemed necessary to attract investment considering the level of risk of that investment Riskier investments require a higher return to attract investors and vice versa Util-ity earnings can be volatile because of short-run impacts on sales volumes and revenues which include changes in sales owing to weather economic conditions and energy efficiency and DG programs This volatility typically causes utilities to retain a higher level of equity in their capital structures so that reduced revenues do not leave them un-able to service their debt Revenue regulation can reduce this volatility by stabilizing revenues regardless of the cause Because of this reduced risk many stakeholders have proposed that the implementation of a revenue regulation mechanism be associated with a corresponding reduction in the utilityrsquos equity capital ratio (the percentage of capital supplied by common equity) This reflects the utilityrsquos more stable revenue owing to revenue regulation and reduces the overall revenue requirement that will be recovered from consumers48
An alternative option to reducing the utilityrsquos equity ratio is to reduce the ROE reflecting a lower risk level For the utilities included in these case studies only BGE and Mass Electric experienced a reduction in their ROE The Com-mission did not reduce BGErsquos ROE at the time the revenue regulation mechanism was implemented but reduced it by 50 basis points during the subsequent rate case The Mas-
sachusetts Commission did not reveal its adjustment but incorporated a lowered ROE into its decision
Absent an explicit adjustment to the cost of capital investorsrsquo expectations will adjust to the presence of rev-enue regulation if its presence is reliable The more stable earnings will likely in time contribute to a higher credit rating That in turn will lead to lower cost debt that will be revealed in future cost of capital calculations An adjust-ment to the ROE or capital structure by the regulator in a rate proceeding will be reflected immediately in lower rates to consumers simply allowing the utilityrsquos credit rating to improve over time and its cost of debt to decline will have the same effect but on a lagged basis as new bonds are is-sued at lower interest rates49
Beginning in 2004 Standard and Poorrsquos began publish-ing ldquorisk profilesrdquo for utilities which classified utilities based on their earnings variability and other risks those with more stable earnings were determined eligible for higher bond ratings at any given equity capitalization ratio (or alternatively able to retain a given bond rating with a lower equity ratio)50 One utility with a revenue regulation mechanism Northwest Natural Gas was believed to have had their business risk profile upgraded by one step in response to the benefits of the mechanism51
Effect on Bond RatingsRevenue regulation stabilizes a utilityrsquos revenue streams
reducing risk to investors this reduced risk may be a contributing factor in an increase in a utilityrsquos bond rating Bond rating agencies have recognized that revenue regula-tion mechanisms and other mechanisms that reduce net earnings volatility and risk contribute to a lower cost of capital for the utility52 Standard and Poorrsquos has explicitly stated that it ldquoviews decoupling as a positive develop-
49 Lazar et al 2011
50 Standard and Poorrsquos (2004 June 2) New Business Profile Scores Assigned for US Utility and Power Companies Financial Guidelines Revised
51 Christensen Associates (2005 March) A review of distribution margin normalization as approved by the Oregon Public Utility Commission for Northwest Natural
52 Lazar et al 2011
Decoupling Case Studies Revenue Regulation Implementation in Six States
27
This topic raises a note of caution if mechanisms are not well designed double-recovery of costs can occur for verti-cally integrated utilities that provide both power supply and distribution services For example if a per-customer
revenue regulation mechanism includes investment-related power supply costs in the revenue-per-customer formula but excludes fuel and purchased power costs that are recovered through a separate tracking mechanism double recovery of some power supply costs is likely If the utility experiences cus-tomer and sales growth the amount it recovers for investment-related power supply costs will go up However if that utility serves this growth by operat-
ing existing power plants more by selling less power on the surplus market or by purchasing power from other suppli-ers it will not incur any increases in the type of power sup-
53 Standard amp Poorrsquos (2008 February 19) Decoupling the vehicle for energy conservation
ment from a credit perspectiverdquo53 However in the case of the utilities examined in this report none experienced an improved credit rating after the implementation of revenue regulation with the exception of PGampE However PGampE came out of Chapter 11 bankruptcy in the same year that its revenue regulation mechanism was implemented mak-ing it impossible to attribute the improvement to revenue regulation alone Bond rating changes are generally slow to evolve Numerous other factors are taken into account when assigning an overall credit rating which appear to have outweighed any positive effect of revenue regulation These factors certainly include the recession of the US economy that began in 2007
Customer Classes IncludedWhen determining the target revenue for a utility rev-
enue regulation mechanism regulators must also consider which customer classes to include in the mechanism In some cases industrial customers have objected to a rev-enue regulation mechanism This is due to the wide dif-ference in rates among customers making the design of a revenue regulation mechanism more challenging If regula-tors choose to exclude a class of customers from revenue regulation they must determine the revenue requirement associated with serving only the included customer classes This generally requires a detailed cost of service study to ensure that revenue responsibility is accurately allocated by customer class
Included CostsFinally regulators may wish to exclude specific costs
from the overall revenue requirement if those costs will be tracked through another mechanism like fuel costs in a PCA mechanism energy efficiency program expenditures or smart grid costs for example Separate tracking mecha-nisms can also be used for those costs that are difficult to
Pacific Gas amp Electric All customer classes
Idaho Power Company Residential and small general service
Baltimore Gas amp Electric Residential and small general service
Wisconsin Public Service Corporation All customer classes
National Grid All customer classes
Hawaiian Electric Company All customer classes
Pacific Gas amp Electric
Idaho Power Company
Baltimore Gas amp Electric
Wisconsin Public Service Corporation
National Grid
Hawaiian Electric Company
Table 3
Customer Classes Included in Revenue Regulation Mechanism
Table 4
Costs Excluded From Revenue Regulation Mechanism
project based on historical data or costs over which the util-ity has very little control like fuel costs Although revenue regulation tracks collected revenue mechanisms like Fuel Adjustment Clauses Purchased Power Adjustments and Energy Efficiency Riders can be designed to track actual costs as well as collected revenue
Energy procurement costs
All variable costs
Energy supply costs
Energy costs
Energy supply costs for basic service customers transmission costs the energy efficiency system benefits charge and reconciling charge and costs recovered through the residential assistance adjustment factor
Fuel and purchased power
Decoupling Case Studies Revenue Regulation Implementation in Six States
28
54 We use the RAM term applied in Hawaii here to address any type of attrition or similar mechanism other than a revenue-per-customer framework that changes the allowed revenue between general rate cases
ply costs accounted for in the revenue per customer (RPC) calculation The increased power supply costs to serve that growth will be recovered through the fuel and purchased power tracking mechanism The net effect for the utility will be to recover incremental power supply costs twicemdashonce in the per-customer mechanism and again in the fuel and purchased power mechanism It is essential to make sure that the other adjustment mechanisms do not overlap the cost impacts that are treated in the revenue regulation mechanism One way to do this is to ensure that all power supply costs (investment labor fuel purchased power) are recovered through a single mechanism There are several ways to achieve this
a) A comprehensive power supply recovery mechanism that includes all power supply costs that is separate from the costs treated in the revenue regulation adjustment (eg Puget Sound Energy Washington State)
b) No power supply adjustment whatsoever with all utility costs included in an RPC mechanism (eg National Grid)
c) An annual attrition calculation with all costs reviewed for changes since the last proceeding (eg HECO)
Revenue Adjustment Mechanism in Revenue Regulation
A RAM54 is not necessary to achieve revenue regulation but provides attrition reliefmdashincreasing authorized revenue commensurate with increased costsmdashbetween rate cases Whereas revenue regulation sets a target revenue that the utility will earn regardless of sales levels the RAM adjusts the target revenue between rate cases Regulators may choose to take several different approaches to RAM
bull No RAM Regulators may choose not to implement a RAM leaving the revenue requirement unchanged between rate cases This requires the utility to request a rate case when it requires additional revenue to cover its costs
bull Stairstep Stairstep adjustments provide predetermined increases in target revenue These increases can be determined during a rate case and generally reflect forecasts of cost growth
bull Indexing Indexing ties adjustments to the target revenue to multiple factors like inflation productivity customer growth and changes in capital expenditures
bull RPC The RPC approach is a form of indexing RPC adjusts the total revenue requirement for the
number of customers served Regulators using an RPC mechanism will determine the revenue requirement per customer and the overall revenue requirement will be determined by multiplying the total number of customers by the revenue requirement per customer The amount of revenue required to serve each customer can be determined separately for customer classes and for existing and new customers This way the RPC method accounts for a utilityrsquos growth in fixed costs that is related to growth in the number of customers served RPC is useful where the correlation between cost growth and customer growth is significant It also protects customers from making up the deficit if there is a loss in customer load such as if a large business closes down or relocates
bull Hybrid Hybrid RAMs generally use stairstep increases to account for projected capital costs and indexing to account for OampM expenses
Adjustments from any type of RAM can be implemented automatically or through an attrition proceeding Some stakeholders oppose adjustments to the revenue require-ment outside of a rate case on the basis that this could allow the revenue requirement to increase significantly without examination of the impact on ratepayers or with-out due consideration of other costs and revenues For this reason some regulators choose to cap the total adjustment that can be made to the revenue requirement outside of a rate case
Table 5
Type of Revenue Adjustment Mechanism
Pacific Gas amp Electric
Idaho Power Company
Baltimore Gas amp Electric
Wisconsin Public Service Corporation
National Grid
Hawaiian Electric Company
Hybrid
RPC
RPC
RPC
No RAM potential capital expenditure adjustment
Hybrid
Decoupling Case Studies Revenue Regulation Implementation in Six States
29
55 Because this method results in changes in the price for service that are calculated after that service has been provided it fails the ldquono retroactive ratemakingrdquo statutes that guide most electricity regulators Customers are entitled to know the price of the commodity they are consuming at the time they use it
56 The closest to a current method in use for electric utilities in the BGE system of monthly reconciliation
Table 6
Tracking and Accrual of Difference BetweenActual and Authorized Revenue
Pacific Gas amp Electric
Idaho Power Company
Baltimore Gas amp Electric
Wisconsin Public Service Corporation
National Grid
Hawaiian Electric Company
Track Difference
Monthly
Monthly
Monthly
Yearly
Yearly
Monthly
Accrual Period
Year
Year
Month
Year
Year
Year
Calculation of Actual RevenueRegulators have options when ensuring that actual
revenue equals target revenue under revenue regulation First regulators must decide how to determine ldquoactual revenuerdquo In most cases actual revenue simply equals the amount of revenue a utility collects from its customers The Idaho Public Utilities Commission however has chosen to use weather-normalized revenues as the basis for utility revenues in revenue regulation Although this prevents the utility from recovering revenue lost to it owing to milder than expected weather it further complicates the revenue regulation mechanism and reduces its risk-reduction ben-efits By the same token if weather is severe and increases sales above the revenue requirements weather normaliza-tion would allow the utility to retain some of the revenues
Next regulators must determine whether to implement revenue regulation using a current or accrual method
bull Current Method With the current method of revenue regulation the target revenue for a period say a month is divided by the actual sales in that period to determine the rate per kWh The current method ensures that actual revenue equals target revenue by calculating the rate at the end of the period so that the target revenue can be recovered The current method allows for no lag in revenue recovery One effect of this method is that although customer rates vary total bills are generally more stable For example in a hotter than expected July customers will purchase more kWh but they will be charged a lower rate A milder than average winter would lead to fewer sales but at slightly increased rates This way customers do not experience the same bill variability as they would if rates were set before the sales deviations occurred On the other hand the current method does not provide customers with the ability to plan ahead based on a predictable rate for electricity This method has been used for revenue regulation of natural gas utilities55
bull Accrual Method Under the accrual method rates are set based on an assumed sales level and the differences between actual and target revenue are allowed to accrue over some period Then the total difference between actual and target revenue is reconciled through an adjustment to rates in the subsequent period this is known as the true-up process Presently all revenue regulation mechanisms for electric utilities use the accrual method56
If regulators use the accrual method of revenue
regulation they will next need to determine the period over which the difference between actual and target revenue will be allowed to accrue One year is typical however shorter periods are also used Next the frequency of comparing collected revenue to target revenue should be determined It is possible to do this comparison only once at the end of the accrual period It is common however for comparisons to occur more frequently often monthly When revenues are compared within the accrual period the differences are tracked generally for the purpose of applying interest to the difference that will be deferred until the end of the accrual period
Rate AdjustmentsIn designing a revenue regulation mechanism there are a
number of decision points that regulators need to consider to balance the interests of all the stakeholders One of the decision points revolves around the determination of the mechanism used to adjust rates The issues that regulators need to consider include the following1 Rate Case Requirements One of the often-mentioned
concerns about surcharges especially when they are numerous is how that will impact the frequency of rate cases For regulators and stakeholders rate cases provide
Decoupling Case Studies Revenue Regulation Implementation in Six States
30
the best mechanism to correctly align rates and costs but they are time-consuming and expensive for all parties This is because a rate case presents an opportunity to closely examine all of the utilityrsquos expenses and adjust rates to reflect cost increases and decreases Because under a revenue regulation mechanism the goal is to match revenues received from all customers with revenue requirements a correct determination of revenue requirements is important as is the specification of appropriate cost indices to adjust the revenue requirements As the time between rate cases increases some regulators feel the base rate case data even with adjustments need to be reexamined As a result some regulators have chosen to mandate the frequency of rate cases to address this whereas others have not It may be that in some cases where there are numerous surcharges recovering a multitude of costs there may not be as many costs subject to review in the rate case making it less significant to a regulator than a case in which most costs are being analyzed and recovered in the rate case itself
2 Collection Mechanism Integrally tied to the mechanism for recovering revenues is how the utility will collect or refund the revenues Options that are available include recovery through a rate case or periodic adjustments to rates through a surcharge mechanism As can be seen by the case studies depending on the plan in place some utilities have very discreet requirements dictating the frequency of rate cases with adjustments occurring in those cases or between those cases Other utilities have no requirements upon them with respect to the frequency of rate case filings This will be discussed in more detail below What does emerge from these case studies is that the discreet components or choices in how to execute a revenue regulation plan are carefully interwoven to create a holistic approach Each component works with the other and the value of this case study is in examining the different pathways that can be chosen As discussed previously some of the commissions have authorized revenue regulation to recover the revenue requirements in the last rate case whereas others have authorized adjustments to rates between rate cases this impacts the pathway that the adjustment mechanism takes
3 Timing How often should rates be adjusted to true up to the utilityrsquos revenue requirement States have chosen different options ranging from monthly to annually
4 Allocation of Revenue Regulation Revenue Surpluses or Deficits There are a number of decision points regarding allocation Should the revenue regulation apply to all rate classes or just the smaller customers whose usage per customer and load variations are not as dramatic as those of larger-use customer classes Should there be a different allocation to each rate class or should the allocation of costs among the classes be the same Different mechanisms accomplish different goals Some states have allocated revenue regulation revenues based on the revenues lost by customer class as a result of energy efficiency This can sometimes be a political decision to mitigate opposition to energy efficiency programs by large customers Other states recognize that the system savings resulting from energy efficiency benefit all customers so that all customers should pay equally
5 Carrying Charges Depending on the timing issue discussed previously regulators may want to consider carrying charges on any adjustments This should be symmetrical in its application however so that it applies to surcharges and refunds Consideration should be given for the basis of the carrying charge rate whether weighted average cost of capital rate of return a risk-free rate or some other mechanism should be adopted
6 Rate Caps In order to mitigate potential rate impacts a regulator may want to consider a cap on how much rates can go up when the revenue regulation adjustment is made This might be more critical if the regulator is aware of other potential rate increases that will impact customersrsquo bills If a cap is used the case in which the utilityrsquos adjustment would exceed the cap must be considered Some regulators have opted to allow the utility to carry over the excess unrecovered amount for a period of years whereas others do not This allows the utility to recover those revenues in a subsequent year when perhaps the adjustment is less As a practical matter however adjustments of greater than three percent are less common as shall be discussed later
7 Impact on At-Risk Consumers Low-income and consumer advocates have expressed concern about revenue regulation as a vehicle for annual rate increases without the scrutiny of a general rate case creating rate increases for the low-use customers doing the most to constrain usage and help achieve targeted energy savings One proposal to address this has been to impose any resulting surcharges only to above-average usage
Decoupling Case Studies Revenue Regulation Implementation in Six States
31
57 Cavanagh and Howat (2012 May 2) Finding common ground between consumer and environmental advocates Electricity Policy
58 The most common criticism of future test years is that utilities forecast costs under an assumption that all authorized personnel positions will be filled while in retrospect any large organization has some level of vacancy in its employee count A historic test year captures this effect fully
customers and any resulting credits only to below-average usage57
Rate Case RequirementRequirements as to the frequency of rate cases can be
tied to the recovery mechanism or to the entire regulatory framework for implementing revenue regulation In the cases studied two of the utilities require periodic rate cases PGampE every three years and WPS every year Two others National Grid and HECO require annual mini rate cases explained later in which adjustments are made and two others IPC and BGE have no requirements for scheduled rate cases Nevertheless if the concern is to ensure that the utilityrsquos revenue recovery meets its revenue requirements some kind of periodic rate case to examine costs is appropriate Having periodic rate cases can provide a measure of assurance to consumer advocates that the level at which the revenues and hence the rates are set is correct One of the criticisms of revenue regulation is in fact the lack of rate cases to produce a proper level of confidence in the allowed amounts Multiple surcharges are usually additive to existing rates therefore not permitting an opportunity to reduce the base rate for reductions in cost Moreover the infrequency in cases impedes the examination of rate allocations as would occur through a cost of service study
This is a particular issue where utilities are augmenting power supply with purchased power from independent power producers which is the most common method for acquiring wind and solar production today The increased cost for purchased power may flow through a fuel and purchased power adjustment mechanism while the (depreciating) investment in conventional power plants remains static in base rates
Both PGampE and WPS use a future test year that allows the utility to project revenue requirements during the time period that the rates are to be in effect The benefit to this is that it can help identify and account for projected changes in costs over the timeframe between rate cases However given that these costs are utility projections most consumer advocates have less confidence in these numbers than they would using actual numbers from a historical or only hybrid test year58 When trying to garner support for revenue regulation from more skeptical stakeholders using a future test year may not be helpful Furthermore in the case of WPS that has annual rate cases using a future test year becomes less justifiable as revenues are recalculated annually anyway
The absence of a rate case requirement can also cause consternation among detractors of revenue regulation because of the belief that the utility will be guaranteed its revenue requirements for as long as it is satisfied with that level irrespective of how well it manages However this is no different from the status quo in traditional regulation in most places The incentive to manage well is always there with or without revenue regulation as it translates into more profit for the utility
In the cases of HECO and National Grid the mini rate cases serve two purposes In the one instance it serves as a means to reconcile revenue recovery with revenue requirements and in the second instance it provides an opportunity to adjust rates in accordance with changes in costs Specifically for National Grid the revenue requirement is adjusted to reflect capital expenditures For HECO revenues are adjusted to reflect changes in the cost of service In the two examples here revenue regulation is wrapped in with other adjustments as part of a mini adjustment Given the structure for determining revenue requirements which accounts for changes in costs including revenue regulation within the mini rate cases is a workable option
These examples highlight how rate cases can be used to adjust revenue requirements either in a more controlled regulatory environment with frequent rate cases or left to the utilityrsquos discretion to decide when to adjust costs A set schedule of periodic rate cases such as that used by PGampE may strike an appropriate balance for reviewing revenue requirements however with the modification of a partial historical partial forecasted test year Frequent rate cases can depending on the resources of the regulator and stakeholders be too costly and time-intensive When there are too many rate cases stakeholders and regulators may not be able to dedicate the level of resources needed for any one proceeding and may be spread too thin Regular known rate cases at reasonable intervals may strike the best balance of adequate review and adjustment of revenue requirements
Decoupling Case Studies Revenue Regulation Implementation in Six States
32
Collection Mechanism and TimingThe collection mechanism for the differential between
actual and authorized revenue requirements varies by util-ity as well Both PGampE and WPS do not have adjustment clauses or surcharges but instead have structured their revenue regulation plans to recover their costs in a rate case with rates adjusted annually Although PGampE has rate cases every three years the utility files its preliminary forecast every September 1 for the following year including adjust-ments for revenue regulation and other costs This practice promotes transparency keeping all stakeholders aware of the current situation of the utility IPC BGE National Grid and HECO use surcharges on customer bills to collect or credit the difference between actual revenues collected and the revenue requirement Although the other three (IPC National Grid and HECO) calculate the rate adjustment annually only BGE does a more contemporaneous adjust-ment of one month Certainly where there are no regularly scheduled rate cases using an adjustment mechanism becomes more critical PGampE has created a tracking mecha-nism known as a balancing account that allows the utility to track the surpluses and deficits to help ensure accuracy at year end when rates are actually adjusted The creation of such monthly balancing accounts will make it easier at the end of the year to track what happened each month and then determine the adjustment for that year It provides a more detailed trail for review and analysis by stakeholders and regulators However other mechanisms that just look at total revenues as compared to revenue requirements at the end of the year can work as well
Table 7
Rate Case Requirements
Table 8
Rate Adjustments
Table 9
Allocation of Surplus or Deficit
Pacific Gas amp Electric
Idaho Power Company
Baltimore Gas amp Electric
Wisconsin Public Service Corporation
National Grid
Hawaiian Electric Company
Pacific Gas amp Electric
Idaho Power Company
Baltimore Gas amp Electric
Wisconsin Public Service Corporation
National Grid
Hawaiian Electric Company
Pacific Gas amp Electric
Idaho Power Company
Baltimore Gas amp Electric
Wisconsin Public Service Corporation
National Grid
Hawaiian Electric Company
Every three years annual ldquoattritionrdquo adjustments in between
No requirement
No requirement
Annual rate case
Annual capital expenditure adjustment case
Abbreviated annual rate case
Base rates adjusted annually
Annual adjustment through surcharge
Monthly adjustment through surcharge
Annual adjustment through rate case
Annual adjustment
Annual adjustment
Allocated to all customers according to business unit (eg electric distribution electric generation)
Included in the annual adjustment mechanism for each customer class
Separate for each customer class
Allocated to all customers except certain tariffs (see above)
Separate for each customer class
Separate for residential and commercialindustrial
Allocation of Revenue Regulation Revenue Surpluses or Deficits
The allocation of revenue regulation revenue surpluses or deficits should be symmetrical so that overpayments are credited to customers just as underpayments are paid by those same customers The six utilities studied fol-low that formula The application of revenue regulation however varies from utility to utility BGE and IPC ap-ply revenue regulation to the residential and commercial classes thereby excluding industrial customers In contrast however PGampE WPS National Grid and HECO allocate revenue regulation adjustments to all customer classes In terms of how the costs are allocated IPC BGE WPS National Grid and HECO allocate costs differently among the customer classes PGampE however allocates costs uni-formly among the customers Because PGampE has separated its business units it also separately calculates and allocates
Decoupling Case Studies Revenue Regulation Implementation in Six States
33
Table 10
Carrying Charges
Table 11
Cap on Rate Adjustment
Pacific Gas amp Electric
Idaho Power Company
Baltimore Gas amp Electric
Wisconsin Public Service Corporation
National Grid
Hawaiian Electric CompanyPacific Gas amp Electric
Idaho Power Company
Baltimore Gas amp Electric
Wisconsin Public Service Corporation
National Grid
Hawaiian Electric Company
None
Yes
None
Yes at the short-term debt rate
Yes at the customer deposit rate
Yes at the customer deposit rateNo
3 rate cap excess carried over to next period
10 rate cap excess carried over to next period
Cap of $14 million per year
$170 million in CapEx
No
revenue regulation surpluses and deficits among its electric distribution gas distribution and electric generation busi-nesses This illustrates that there are several ways to address revenues from revenue regulation depending on the policy outcomes that are desired
Carrying ChargesCarrying charges applied to uncollected or surplus rev-
enues can be used to account for the time value of money and the lost opportunity or value to having those revenues in hand PGampE and BGE do not accrue carrying charges On the other hand IPC WPS National Grid and HECO do For BGE given that the revenue regulation revenues are reconciled and recovered monthly it would make little sense to include a carrying cost Where carrying costs have been used they have included in the cases of these utili-ties the short-term debt rate or the customer deposit rate which for one utility is six percent and probably close to the short-term debt rate Thus the carrying charge rates are appropriately at the lower end of the spectrum reflecting their short-term nature In the application of the carrying charge symmetry should be preserved by applying it to both deficits and surpluses Application of carrying charges given the short period that costs are carried (one year) is somewhat discretionary Although it does more accurately account for costs it does add a modest level of complica-tion in tracking costs
Rate Caps and CollarsOne of the ways to protect customers in the event of sig-
nificant adjustments is to impose a rate cap (or collar) that limits the amount of a rate increase (and decrease) Some customers are sensitive to changes in foundational costs like utility bills and if costs are going to rise they benefit from a pattern of steady modest increases rather than a large step increase Any structural increases in rates attributable
to reductions in sales or increases in costs recognized by the revenue regulation plan would be eventually included in rates under any system A cap reflects a controlled way to manage customer expectations and customer impacts Structural changes can only be managed for a while until a complete rate case is needed to reset all assumptions
Typically when a rate cap is imposed if the formulaic increase exceeds the cap or collar the utility will be able to carry over any uncollected revenues until the next rate adjustment Two of the utilities studied PGampE and HECO do not have rate caps On the other hand the other four utilities do include rate caps in varying amounts National Grid has a one-percent revenue cap whereas IPC and BGE have a one-percent and a ten-percent rate cap respectively WPS unlike the others has a cap tied to the dollar amount of $14 million as opposed to a percentage Consistent with the goals of revenue regulation all of the utilities studied have a carryover provision that is important for reducing the risk that the utility will not recover its revenue require-ments
Note that National Grid differs from BGE and HECO in that its cap is on revenues whereas the other two utilities cap rates and rate impacts A revenue cap is more focused on ensuring minimal change to the revenue requirements authorized by the commission National Grid as discussed previously allows for mini rate cases to adjust the rev-enue requirements Having the one-percent cap limits the amount of increase that can occur through that process requiring revenue changes that are greater to occur in a full rate case However note also that some of the adjustments allowed in the mini rate case have their own separate cap The IPC rate cap is in line with what many other utilities with caps have in place which generally range from one to three percent The ten-percent rate cap in the BGE plan is
Decoupling Case Studies Revenue Regulation Implementation in Six States
34
59 Morgan P (2012 December) Graceful Systems LLC A decade of decoupling for US energy utilities rate impacts designs and observa-tions p5
reflective of its monthly adjustment pattern An annual ad-justment allows more time to smooth out peaks and valleys in revenues whereas a monthly adjustment will be influ-enced by more of the spikes (particularly weather-driven variation) thus the need for a larger bandwidth for the car-ryover Like a variable energy rate or fuel adjustment clause that fluctuates monthly the monthly adjustment introduces more volatility into the rates
Actual Historical AdjustmentsFor many ratepayer advocates there is a concern that
some of the utility management risk will be transferred to customers as a consequence of a policy that seeks to ensure that the utility will be made whole However the utility re-tains management risk and the requirement to demonstrate that it has acted prudently Thus the utility still has just as much of an incentive to operate efficiently as it did without revenue regulation If the utility can lower its costs it can still increase its profits Second by designing rates symmet-rically such that under- and over-recoveries are reconciled it provides customers with an opportunity to obtain credits that under traditional regulation would be retained by the utility It has often been opined that when there are large
gaps in time between utility rate cases it is because the utility is over-earning and exceeding its revenue require-ments In those instances customers never get to examine what the utility is collecting much less receive a refund Under revenue regulation with its periodic adjustments and scheduled general rate cases the revenue requirements are examined and refunds or credits allocated such that customers have a better knowledge base for understanding the utilityrsquos earnings And annual reconciliation of the util-ityrsquos actual revenues versus authorized revenues provides consumers with a tool to reign in excess revenue recovery beyond authorized amounts Third the adjustments that do occur under revenue regulation are manageable and frequently less than the adjustments customers are used to seeing on their bills for fuel or variable generation rates or for the myriad of other surcharges that can be tacked on to a customerrsquos bill such as an infrastructure (smart grid) sur-charge maintenance upgrade fee regulatory asset charge or system benefit charge
As seen in Figure 1 the range of rate impacts cluster around plus or minus two percent but can at times exceed plus or minus five percent The total of surcharges has somewhat exceeded the total of credits
Figure 1
Total Utility Decoupling Adjustment Rate Impacts59
300
250
200
150
100
50
0
Nu
mber
of
Dec
oup
lin
g A
dju
stm
ents
Over -5 -4 to -5 -3 to -4 -2 to -3 -1 to -2 0 to -1 0 to 1 1 to 2 2 to 3 3 to 4 4 to 5 Over 5
Percentage Rate Impacts
SurchargesRefunds
ResidentialAll
Other
Commercial
Total
Decoupling Case Studies Revenue Regulation Implementation in Six States
35
60 Id p 3
61 Schultz T Energy Efficiency at Idaho Power Available at httpwwwenergyidahogovenergyalliancedida_powerpdf
As can be seen with the utilities studied above the larger fluctuations are attributable to adjustment mechanisms that are reconciled more frequently such as monthly as those are less able to smooth out anomalies as an annual adjust-ment would do From a dollar perspective for the roughly 64 percent of adjustments that fall within the plus or minus two-percent range the monthly bill impact is approxi-mately $230 for average electric customers and $140 for average gas customers60
Of the six utilities studied the fluctuations in adjustment have for the most part stayed within the one- to three-per-cent range as shown below
bull PGampE from 2005 to 2012 has had annual revenue regulation adjustments ranging from minus143 percent to 415 percent with an average adjustment of 197 percent
bull For IPC the adjustments are separated between residential and commercial customers For residential customers the annual adjustments from 2007 through 2011 ranged from 077 percent to 258 percent for an average of 162 percent As for the commercial customers the annual adjustments for that same period were higher ranging from 104 percent to 424 percent with an average adjustment of 252 percent
bull BGE has monthly adjustments that ranged from minus1853 percent to 3013 percent with an average of 057 percent for residential customers from March 2008 through August 2012 For General Service Customers the monthly adjustment ranged from minus2264 percent to 2462 percent The average adjustment was 1308 percent
bull For WPS the annual adjustments from 2009 through 2011 ranged from minus145 percent to 378 percent for residential and small commercial and from minus314 percent to 899 percent for commercial Note that because of a $14 million per year cap some of these percentages were carried over The average annual adjustment for residential and small commercial and for commercial was 163 percent and 215 percent respectively with carry-overs to subsequent years
bull For Massachusetts Electric and Nantucket Electric both of which operate under National Grid the annual revenue regulation adjustment for all for 2011 and 2012 was minus0105 percent and 0315 percent for an average revenue regulation adjustment over the two years of 0105 percent
bull HECO like National Grid has one annual revenue
regulation mechanism for its customers which resulted in adjustments in 2011 and 2012 of 063 percent and 107 percent respectively for an average adjustment of 085 percent
As can be gleaned from the above information the range of average adjustments for small use customers was a low of 0105 percent for National Grid to a high of 197 percent for PGampE For larger use customers the range was a low of 0105 percent for National Grid to a high of 252 percent for IPC This demonstrates that on average for these utilities with well-developed and diversely designed revenue regula-tion proposals their adjustments on average stayed at or below approximately 25 percent
One of the metrics for determining if a revenue regula-tion program is working successfully that was discussed above was the impact on rates of a revenue regulation mechanism As can be seen by the analysis of the adjust-ment levels for each of the utilities they are within a rea-sonable range
Complementary Policies Although a revenue regulation mechanism does not need
to be accompanied by other policies energy efficiency is frequently at the root of the reason revenue regulation was proposed in the first place The states examined in this pa-per have various obligations for energy efficiency achieve-ment placed upon their utilities Only Idaho does not have an Energy Efficiency Resource Standard but energy efficiency objectives are developed through an integrated resource plan process Energy efficiency spending at IPC has increased dramatically in recent years61
In recognition of the fact that revenue regulation only removes the disincentive to pursue energy efficiency several states have instituted some form of incentives to reward the desired outcome This mechanism can not only incentivize management to aggressively pursue energy efficiency but also make shareholders supportive in the face of lost invest-ment opportunity
Rate design can also play an important part in assist-ing the utility in achieving favorable energy efficiency outcomes Inclining block rates penalize inefficient use of electricity and shorten payback times from the customer perspective Because efficiency reduces consumption at
Decoupling Case Studies Revenue Regulation Implementation in Six States
36
62 Optional rate designs for PGampE include TOU and Peak Time Pricing
63 IPC also has an optional TOU rate design
64 Optional rate designs for this utility include TOU Critical Peak Pricing and Contract
65 National Grid also offers optional TOU and flat rate designs
66 HECO also offers optional TOU and flat rate designs
67 See eg Alexander B (1996 April) How to construct a service quality index in performance-based ratemaking Electricity Policy
the tail block rate the value of kWh savings is greater than with flat rates On the other side of the spectrum declining block rates which have a reduced rate in the tail block do little to encourage conservation In fact they operate more like a discounted bulk rate by reducing the average cost of a kWh in a customerrsquos bill for the more kWh used
Performance incentives or other ways to avoid destruc-tive cost-cutting in the name of creating margins that reduce service or reliability or lessen customer value have been implemented only in Massachusetts of the six utilities illustrated here Several other states have implemented vari-ous schemes in reaction to perceived deficiencies in utility service67 Performance incentives are not unique to rev-enue regulation Commissions wishing to implement such a scheme can find many models of incentive reward and penalty mechanisms developed for other purposes
Taken together a suite of policy and program features can create an atmosphere that is conducive to achievement of energy efficiency goals within the utility and for the customers By appropriate application of these techniques regulators working with utilities and stakeholders can remove barriers and create an opportunity for energy ef-ficiency to be fully integrated into the utility supply option portfolio
Energy Efficiency OutcomesAlthough revenue regulation itself does not create an
incentive for a utility to implement energy efficiency it does address the issue of lost revenues associated with energy
Table 12
Complementary Policies for Energy Efficiency
Pacific Gas amp Electric62
Idaho Power Company63
Baltimore Gas amp Electric
Wisconsin Public Service Corporation64
National Grid65
Hawaiian Electric Company66
Energy Efficiency Requirement
1 annually
IRP
10 by 2015
075 annually
24 annually
Energy efficiency can satisfy portion of RPS
Default Residential Rate Design
Inclining block
Inclining block
TOU seasonal
Flat
Inclining block
Inclining block
Incentive Structure
Risk reward incentive mechanism
No
No
No
5 of program costs
Third-party administrator paid for contract performance
Performance Incentives
Reliability reporting only
None
Under consideration
Reliability reporting only
Service quality reward and penalty
Under consideration
efficiency and DG programs Revenue regulation should be combined with other mechanisms that require or incentiv-ize the implementation of energy efficiency by the utility or a third party The level of energy efficiency achieved can be one measure of the success of a revenue regulation mechanism as implemented in a larger program designed to achieve energy efficiency Table 13 shows the incremental annual energy efficiency savings reported by each utility with the shaded box indicating the year that the utilityrsquos revenue regulation mechanism was implemented National Grid had achieved a high level of energy efficiency savings in the years before it implemented revenue regulation
This paper has not evaluated DG outcomes to correlate with revenue regulation as it is not perceived that states and utilities have made that connection expressly in histori-cal mechanisms However it is expected that this connec-
Decoupling Case Studies Revenue Regulation Implementation in Six States
37
68 EIA Form EIA-861 data files Available at httpwwweiagovelectricitydataeia861
69 PGampE began revenue regulation in 1974 and it was later suspended and recommenced in 2001
70 WPS savings are represented by the statewide program savings from the Focus on Energy program WPS provided additional funds to Focus on Energy starting in CY10 through their territory-wide program activities
71 In 2009 Hawaii Energy a ratepayer-funded statewide energy efficiency provider began delivering services Savings reported after 2009 represent savings achieved through the programs of Hawaii Energy
Table 13
Annual Incremental Energy Efficiency Savings as Percentage of Retail Sales68
Highlighted cells are the year that utility started decoupling
Pacific Gas amp Electric69
Idaho Power Company
Baltimore Gas amp Electric
Wisconsin Public Service Corporation70
National Grid
Hawaiian Electric Company71
2004
11
01
00
03
11
00
2005
16
03
00
03
09
05
2006
10
05
00
03
12
05
2010
19
13
17
09
136
12
tion will be made in future mechanisms and furthermore it is anticipated that follow on work to this paper will want to study that connection between revenue regulation and DG performance
Conclusions
An increasing number of states are looking to increase the rate of energy efficiency investments for their long-run cost and risk advantages The benefits of energy efficiency include not only its ability to reduce system costs across the distribution transmission and generation functions but also the opportunity for customers to reduce their individ-ual energy costs for their own electric bills Nevertheless it is counterintuitive to encourage or order a utility to sell less of its product In order to encourage the proliferation of en-ergy efficiency programs as a solution that can contribute to this nationrsquos energy needs this tension between the goals of society versus the goals of the utility needs to be addressed Revenue regulation can be such a solution by removing the link between sales and revenues
There are many ways to implement revenue regulation and multiple decision points that regulators must consider in designing a revenue regulation mechanism This paper focused on six utilities each of which implemented revenue regulation in different ways in accordance with the objectives of that state Different decision points discussed include
bull Should revenue regulation apply to all functions (generation transmission and distribution) which sometimes depends on if the utility is regulated or restructured
bull Should revenue regulation apply to all customer classes
bull Should there be symmetry such that a reconciliation adjustment occurs for both over- and under-recoveries of the revenue requirements
bull Should recovery of indicated surcharges be conditioned on acceptable performance on customer service quality or energy efficiency goals
bull Should there be an attrition adjustment to account for other expenses or should the revenue regulation adjustment be limited to reconciling existing revenue requirements
bull Should there be an inflation adjustmentbull To calculate the revenue requirements should the
current or accrual method be usedbull Should the adjustments be made in rate cases or
through a riderbull How frequently should adjustments be made
monthly annually or some other time periodbull Depending on the period of time between true up and
recovery should there be carrying charges and if so how should they be calculated
2007
21
06
00
03
09
04
2008
35
10
05
09
05
05
2009
20
11
06
10
11
11
Decoupling Case Studies Revenue Regulation Implementation in Six States
38
72 Avista Utilities (2009) Washington Utilities and Transportation Commission Docket UE-090134
bull Should there be a requirement authorizing the frequency of rate case
bull Should there be an annual cap on the amount of the adjustment and if so should there be an opportunity to carry over any additional amounts and for how many years
bull Should there be an adjustment to the cost of capital to reflect the reduced risk
Other considerations for regulators whether or not they implement revenue regulation but certainly as part of a comprehensive package are other measures that can be put in place to encourage consumers and utilities alike to actively participate in energy efficiency For example an inclining block rate structure by virtue of its incentive to consume less pairs well with an energy efficiency program helps drive consumers to participate in efficiency programs and accelerates the payback of an energy efficiency investment By the same token an incentive payment to the utility helps provide its management with a good reason to excel and exceed targets for energy efficiency programs
A key point illustrated by the list of considerations above is that there is not just one static way to design and implement revenue regulation but rather there are a variety of options for doing so In this study a diverse group of utilities were reviewed The differences among the utilities included geographic diversity vertically integrated and restructured utilities different levels of energy efficiency in place and certainly differences in how the revenue regulation mechanisms were implemented No two utilities were alike and no two utilities had the same revenue regulation mechanism The key is that revenue regulation should eliminate the throughput incentive but the means for accomplishing this goal can vary and be tailored to each jurisdiction and each utility and still be successful
There are several considerations in the design of a revenue regulation mechanism that can help ensure its successful adoption To begin revenue regulation should be granted to utilities only as a precondition to implementing comprehensive energy efficiency andor DG policies Unless accompanied by a commitment to engage in providing least-cost resource options that could impact sales there is not really any good policy reason for its adoption All of the utilities studied are actively engaging in energy efficiency Furthermore as a matter of fairness the revenue regulation mechanism should be symmetrical so that any revenues above those authorized are refunded back to consumers As Figure 1 demonstrates although there are more surcharges to customers there is nevertheless a healthy amount of
credits back to consumers This is the bargain Barring imprudence or other unforeseen circumstances the utility receives its authorized revenue requirements and nothing more or less under a simple revenue regulation mechanism
Rate design plays an important role in the effectiveness of energy efficiency in concert with revenue regulation A low customer charge is preferable so that the customer can benefit from real bill reductions tied to reduced volumetric consumption Reductions in consumption not only reduce bills but also positively impact the payback period for investments in energy efficient appliances Declining block rates in which the tail block rate is lower than the first tier also do not encourage conservation Inclining block rates that reward low usage in the first block with a lower rate send the better price signals None of the six utilities studied had declining block residential rates They were inclining flat and time-varying
The revenue adjustment mechanism is also a critical decision point in terms of whether a revenue per customer mechanism is adopted that accounts for only the current revenue requirements or whether latitude is given to include an inflation adjustment or other cost increases in the revenue adjustment mechanism Three of the utilities studied adopted this approach whereas another two used a hybrid approach Finally to reduce volatility five of the six utilities opted for annual rather than monthly adjustments thereby creating a level of rate stability that customers in general prefer
Once the goals for revenue regulation are set by the regulators the next step is to design programs that will implement that goal For energy efficiency to be as successful as possible regulators may want to adopt a complement of other policies to accompany revenue regulation These can include rate designs that reward reduced use and conservation as well as incentive payments to utilities that reward them for meeting or exceeding targets Of the six utilities studied three have adopted some form of incentive One simple approach that was used in Washington was to link recovery of any surcharges under the revenue regulation mechanism to achievement of energy efficiency targets72
For the utilities examined above that have implemented revenue regulation the evidence demonstrates that revenue regulation as a strategy and a mechanism to enable
Decoupling Case Studies Revenue Regulation Implementation in Six States
39
energy efficiency has been working well The fact that each revenue regulation mechanism varies from the next demonstrates that there are many different paths that can be followed in implementing revenue regulation based on the needs of the utility and its stakeholders in a particular
region This study demonstrates that revenue regulation does work and provides examples of how it can be implemented each one different and unique because of the number of decision points to be considered in designing a revenue regulation mechanism
Decoupling Case Studies Revenue Regulation Implementation in Six States
40
Appendix
Historic Rate Adjustments
Table 14
PGampE Revenue Regulation Rate Adjustments 1983 to 199373
Table 15
PGampE Revenue Regulation Adjustments 2005 to 201274
Table 16
IPC Revenue Regulation Adjustments76
Idaho Power Company
1983 23
1984 (34)
1985 (48)
1986 19
1987 21
1988 50
1989 (43)
1990 (54)
1991 39
1992 34
1993 00
2005 8925 minus12773 minus143
2006 9933 2246 226
2007 10409 21727 209
2008 10261 4032 039
2009 11169 10355 093
2010 11224 46556 415
2011 10306 38390 373
2012 11032 40304 365
2007 Residential minus00457 590 minus077
Commercial minus00457 428 minus107
2008 Residential 00529 670 090
Commercial 00529 510 104
2009 Residential 01220 770 158
Commercial 01535 603 255
2010 Residential 01800 785 229
Commercial 02273 613 371
2011 Residential 02028 785 258
Commercial 02597 613 424
Revenue Regulation Adjustment as of
Total Rates
Delivery Revenue
Requirement ($ millions)
Adjustment Rate
Revenue Regulation Adjustment($ millions)
Retail Rate
of Delivery Revenue
Revenue Regulation Adjustment
Year
Year
73 Lesh P (2009 June 30) Rate impacts and key design elements of gas and electric utility decoupling
74 Morgan P (2012 November) A decade of decoupling for US energy utilities rate impacts designs and observations
75 Morgan P (2012 November) A decade of decoupling for US energy utilities rate impacts designs and observations
76 All numbers provided by the utility
Decoupling Case Studies Revenue Regulation Implementation in Six States
41
77 Idaho Power Company Case No IPC-E-11-19- fixed cost adjustment permanent mechanism Available at httpwwwpucidahogovinternetcaseselecIPCIPCE1119company20120928COMPLIANCE20FILINGPDF
Figure 2
IPC Revenue Regulation Adjustments77
Residential FCA Balance and Use per Customer
$10000000
$8000000
$6000000
$4000000
$2000000
$0
-$2000000
-$4000000
-$6000000
1080
1070
1060
1050
1040
1030
1020
1010
1000Res
idu
al A
uth
oriz
ed F
CA
Am
oun
t
Residual Authorized FCA Amount ($)
Monthly Use Per Customer (kWh)
kW
h U
sed
2006 2007 2008 2009 2010 2011
78 Morgan P (2012 November) A decade of decoupling for US energy utilities rate impacts designs and observations
Decoupling Case Studies Revenue Regulation Implementation in Six States
42
Table 17a
Baltimore Gas and ElectricBGE Monthly Revenue Regulation Adjustments 2008 to 201278
Table 17b
Baltimore Gas and ElectricBGE Monthly Revenue Regulation Adjustments 2008 to 201278
March Residential 000172 01477 1165General Service 000230 01526 1507
April Residential 000016 01477 0108General Service 000146 01526 0957
May Residential 000066 01477 0447General Service 000230 01526 1507
June Residential minus000066 01477 minus0447General Service 000230 01526 1507
July Residential 000158 01477 1070General Service 000230 01526 1507
August Residential minus000040 01477 minus0271General Service 000214 01526 1402
September Residential 000237 01477 1605General Service 000230 01526 1507
October Residential 000237 01477 1605General Service 000143 01526 0937
November Residential 000237 01477 1605General Service 000140 01526 0917
December Residential 000445 01477 3013General Service 000230 01526 1507
January Residential 000035 01579 0222General Service minus000073 01346 minus0542
February Residential 000025 01579 0158General Service 000230 01346 1709
March Residential minus000237 01579 minus1501General Service 000230 01346 1709
April Residential minus000237 01579 minus1501General Service 000230 01346 1709
May Residential 000234 01579 1482General Service 000132 01346 0981
June Residential 000237 01579 1501General Service 000230 01346 1709
July Residential 000237 01579 1501General Service 000230 01346 1709
August Residential 000237 01579 1501General Service 000190 01346 1412
September Residential 000237 01579 1501General Service 000230 01346 1709
October Residential 000237 01579 1501General Service 000124 01346 0921
November Residential 000237 01579 1501General Service 000230 01346 1709
December Residential 000156 01579 0988General Service 000204 01346 1516
Adjustment $kWh
Adjustment $kWh2008 2009
Retail Rate
$kWh
Retail Rate
$kWhAdjustment
Adjustment
Decoupling Case Studies Revenue Regulation Implementation in Six States
43
Table 17c
Baltimore Gas and ElectricBGE Monthly Revenue Regulation Adjustments 2008 to 201278
Table 17d
Baltimore Gas and ElectricBGE Monthly Revenue Regulation Adjustments 2008 to 201278
January Residential 000203 01465 1386General Service 000230 01261 1824
February Residential minus000142 01465 minus0969General Service 000230 01261 1824
March Residential minus000237 01465 minus1618General Service 000230 01261 1824
April Residential minus000237 01465 minus1618General Service 000230 01261 1824
May Residential 000192 01465 1311General Service 000230 01261 1824
June Residential 000191 01465 1304General Service 000230 01261 1824
July Residential 000095 01465 0648General Service 000230 01261 1824
August Residential minus000176 01465 minus1201General Service 000224 01261 1776
September Residential minus000237 01465 minus1618General Service 000116 01261 0920
October Residential minus000237 01465 minus1618General Service 000081 01261 0642
November Residential minus000237 01465 minus1618General Service 000098 01261 0777
December Residential minus000079 01465 minus0539General Service 000229 01261 1816
January Residential minus000130 01365 minus0952General Service 000230 01156 1990
February Residential minus000253 01365 minus1853General Service minus000020 01156 minus0173
March Residential minus000018 01365 minus0132General Service minus000063 01156 minus0545
April Residential 000110 01365 0806General Service minus000262 01156 minus2266
May Residential 000010 01365 0073General Service minus000160 01156 minus1384
June Residential 000226 01365 1656General Service 000042 01156 0363
July Residential 000253 01365 1853General Service 000209 01156 1808
August Residential minus000007 01365 minus0051General Service minus000157 01156 minus1358
September Residential minus000253 01365 minus1853General Service minus000177 01156 minus1531
October Residential 000228 01365 1670General Service 000262 01156 2266
November Residential minus000059 01365 minus0432General Service 000262 01156 2266
December Residential 000071 01365 0520General Service 000262 01156 2266
Adjustment $kWh
Adjustment $kWh2010 2011
Retail Rate
$kWh
Retail Rate
$kWhAdjustment
Adjustment
Decoupling Case Studies Revenue Regulation Implementation in Six States
44
Table 17e
Baltimore Gas and ElectricBGE Monthly Revenue Regulation Adjustments 2008 to 201278
January Residential 000253 01291 1960General Service 000262 01064 2462
February Residential 000253 01291 1960General Service 000262 01064 2462
March Residential 000253 01291 1960General Service 000262 01064 2462
April Residential 000253 01291 1960General Service 000262 01064 2462
May Residential 000253 01291 1960General Service 000262 01064 2462
June Residential 000253 01291 1960General Service 000262 01064 2462
July Residential 000253 01291 1960General Service 000262 01064 2462
August Residential 000253 01291 1960General Service 000160 01064 1504
Adjustment $kWh2012
Retail Rate
$kWhAdjustment
Decoupling Case Studies Revenue Regulation Implementation in Six States
45
79 Morgan P (2012 November) A decade of decoupling for US energy utilities rate impacts designs and observations
80 Morgan P (2012 November) A decade of decoupling for US energy utilities rate impacts designs and observations
Table 18
Wisconsin Public Service Corporation Revenue Regulation Adjustments 2009 to 201179
2009 ResidentialSmall Commercial 00048705 000168154 01290 378 130Commercial 00084951 000293293 00945 899 310
2010 ResidentialSmall Commercial 00033043 000166936 01291 256 129Commercial 00056630 000286103 09460 060 030
2011 ResidentialSmall Commercial (00018666) $ (000163719) 01288 minus145 minus127Commercial (00032565) $ (000285629) 01037 minus314 minus275
Derived Adjustment
$kWh
Derived Adjustment Capped $
kWh
Retail Rate
$kWh
Revenue Regulation Actual
Revenue Regulation Capped
Table 19
National Grid Revenue Regulation Adjustments 2011-201276
Massachusetts Electric and Nantucket Electric
Table 20
Hawaiian Electric Company
2011 All minus0015 1429 minus0105
2012 All 0044 1396 0315
2011 01995 3149 063
2012 03894 3641 107
Revenue Regulation Adjustment
centkWh
Revenue Regulation Adjustment
centkWhRetail Rate
centkWh
Retail Rate
Revenue Regulation Adjustment
Revenue Regulation
ldquoThe 2011 adjustment took effect June 1 but was reduced to $0 on July 26 2011 when the Commission granted HECO an interim rate increase of $532 million in a 2011 test year general rate case The 2012 Adjustment runs from June 1 2012 through May 31 2013 About 25 of the total relates to the portion of the decoupling mechanism that updates OampM and rate baserdquo (Morgan 2013)
Decoupling Case Studies Revenue Regulation Implementation in Six States
46
Revenue Regulation and Decoupling A Guide to Theory and Applicationhttpwwwraponlineorgdocumentdownloadid902
This guide was prepared to assist anyone who needs to understand both the mechanics of a regulatory tool known as decoupling and the policy issues associated with its use This would include public utility commissioners and staff utility management advocates and others with a stake in the regulated energy system While this guide is somewhat technical at points we have tried to make it accessible to a broad audience to make comprehensible the underlying concepts and the implications of different design choices This guide includes a detailed case study that demonstrates the impacts of decoupling using different pricing structures (rate designs) and usage patterns
Pricing Dorsquos and Donrsquots Designing Retail Rates as if Efficiency Countshttpwwwraponlineorgdocumentdownloadid939
Rate design is a crucial element of an overall regulatory strategy that fosters energy efficiency and sends appropriate signals about efficient system investment and operations Rate design is also fully under the control of state regulators Progressive rate design elements can guide consumers to participate in energy efficiency programs and reduce peak demand yet relatively few utilities and commissions have implemented many of these elements This RAP paper identifies some best practices Because pricing issues tie closely to utility growth incentives we also address revenue decoupling
A Decade of Decoupling for US Energy Utilities Rate Impacts Designs and Observationshttpwwwraponlineorgdocumentdownloadid6356
This report written by Pamela Morgan of Graceful Systems LLC builds on a 2009 report Now covering 25 states including 49 LDCs and 24 electric utilities this report summarizes the decoupling mechanism designs these utilities use and the rate adjustments they have made under those mechanisms In total this report estimates the retail rate impacts of 1244 decoupling mechanism adjustments since 2005
Additional Resources
The Role of Decoupling Where Energy Efficiency is Required by Lawhttpwwwraponlineorgdocumentdownloadid275
This Issuesletter gives an overview of energy efficiency resource standards the need to decouple utility profits from utility sales and explains why decoupling is needed even where a third party administers energy efficiency programs
Revenue Decoupling Standards and Criteria A Report to the Minnesota Public Utilities Commissionhttpwwwraponlineorgdocumentdownloadid850
In 2007 the Minnesota legislature enacted a new statute Section 216B2412 in which it defined an alternative approach to utility regulation decoupling and directed the Public Utilities Commission (PUC) to ldquoestablish criteria and standardsrdquo by which decoupling could be adopted for the statersquos rate-regulated utilitiesTo fulfill its obligation to develop criteria and standards for decoupling the PUC sought the advice of the Regulatory Assistance Project (RAP) This report is the output of that collaboration
Designing Distributed Generation Tariffs Wellhttpwwwraponlineorgdocumentdownloadid6898
Improvements in distributed generation economics increasing consumer preference for clean distributed energy resources and a favorable policy environment in many states have combined to produce significant increases in distributed generation adoption in the United States Regulators are looking for the well-designed tariff that compensates distributed generation adopters fairly for the value they provide to the electric system compensates the utility fairly for the grid services it provides and charges non-participating consumers fairly for the value of the services they receive This paper offers regulatory options for dealing with distributed generation The authors outline current tariffs and ponder what regulators should consider as they weigh the benefits costs and net value to distributed generation adopters non-adopters the utility and society as a whole The paper highlights the importance of deciding upon a valuation methodology so that the presence or absence of cross-subsidies can be determined Finally the paper offers rate design and ratemaking options for regulators to consider and includes recommendations for fairly implementing tariffs and ratemaking treatments to promote the public interest and ensure fair compensation
Decoupling Case Studies Revenue Regulation Implementation in Six States
47
The Regulatory Assistance Project (RAP)trade is a global non-profit team of experts focused on thelong-term economic and environmental sustainability of the power sector We provide technical and policy assistance on regulatory and market policies that promote economic efficiency environmental protection system reliability and the fair allocation of system benefits among consumers We work extensively in the US China the European Union and India Visit our website at wwwraponlineorg to learn more about our work
Rate Design Where Advanced Metering Infrastructure Has Not Been Fully Deployedhttpwwwraponlineorgdocumentdownloadid6516
This paper identifies sound practices in rate design applied around the globe using conventional metering technology Rate design for most residential and small commercial customers (mass market consumers) is most often reflected in a simple monthly access charge and a per-kWh usage rate in one or more blocks and one or more seasons A central theme across the practices highlighted in this paper is that of sending effective pricing signals through the usage-sensitive components of rates in a way that reflects the character of underlying long-run costs associated with production and usage While new technology is enabling innovations in rate design that carry some promise of better capturing opportunities for more responsive load the majority of the worldrsquos electricity usage is expected to remain under conventional pricing at least through the end of the decade and much longer in some areas Experience to date has shown that the traditional approaches to rate design persist well after the enabling technology is in place that leads to change
Time-Varying and Dynamic Rate Designhttpwwwraponlineorgdocumentdownloadid5131
This report discusses important issues in the design and deployment of time-varying rates The term time-varying rates is used in this report as encompassing traditional time-of-use rates (such as time-of-day rates and seasonal rates) as well as newer dynamic pricing rates (such as critical peak pricing and real time pricing) The discussion is primarily focused on residential customers and small commercial customers who are collectively referred to as the mass market The report also summarizes international experience with time-varying rate offerings
50 State Street Suite 3Montpelier Vermont 05602802-223-8199wwwraponlineorg
- Table of Contents
- Introduction
- California Pacific Gas and Electric Company
- Idaho Idaho Power Company
- Maryland Baltimore Gas and Electric
- Wisconsin Wisconsin Public Service Corporation
- Massachusetts National Grid
- Hawaii Hawaiian Electric Company
- Discussion of the Six Utilities Overall
- Conclusions
- Appendix
- Additional Resources
-

Decoupling Case Studies Revenue Regulation Implementation in Six States
17
29 The required spending level was higher for the year 2011 owing to a temporary change in state policy
30 ACEEE Wisconsin Available at httpaceeeorgsectorstate-policywisconsin
31 The Cadmus Group Inc (2013)
under-recovery The margin reflected in the formula equals the total revenue for each tariff less the costs associated with the annual per-kWh value established for monitored fuel costs and excluding any surcharges credits taxes or similar charges
In the event that a true-up will cause rates to increase the Commission will provide an opportunity for a hear-ing Revenue regulation adjustments occur as a part of the general rate case
The revenue regulation adjustments are subject to a $14 million per year cap for electric excluding carrying costs Any adjustments over that amount will not be carried over and will not be collected from ratepayers Equivalently revenue over collection in excess of $14 million will not be returned to ratepayers
Complementary PoliciesWPS like all other investor-owned utilities
in Wisconsin is required to spend 12 per-cent of its annual operating revenues on en-ergy efficiency and customer-owned renew-able resource programs that are administered by a third party through the Focus on Energy program which was established in 200229 Separately through a contract the PSCW ap-proves annual electricity savings goals for the Focus on Energy program The savings goals were equivalent to 075 percent of electric sales for the participating utilities from 2011 to 2013 In addition the PSCW approved a rate of return on investments in energy efficiency for Wisconsin Power amp Light and other utilities can propose incentives as part of their rate cases However WPS has not yet proposed an incentive mechanism30
WPS offers residential customers a default flat rate but they also offer a TOU option with winter and summer on-peak off-peak and shoulder tiers For small commercial and industrial customers there are flat rates TOU rates and critical peak rates Large commercial and industrial customers can take service under a TOU rate with summer and winter on-peak and off-peak rates a TOU with criti-cal peak rate or under a special contract rate unique to the customer and approved by the Commission
The authorized level of expensed conservation costs recoverable in rates for the test year (2013) is $19778728 The level for electric utility operations consists of the conservation budget of $17669792 and an escrow adjustment of $2108936 which represents the test year amortization of the projected overspent escrow balance at
December 31 2012 over two years Wisconsin has a statute requiring filing of reliability data
but no reward or penalty system to support its revenue regulation system
Energy Efficiency OutcomesWPS implemented revenue regulation in 2009 In order
to gain approval for the original revenue regulation mecha-nism WPS agreed to fund energy efficiency and renewable energy programs at levels above their 12-percent statutory minimum contribution to Focus on Energy Focus on Energy produces an annual report of energy efficiency program activities In its 2012 report Focus on Energy reports the following outcomes achieved for WPSrsquo service territory The table below represents the savings under the statewide Focus on Energy Programs and does not represent the savings at-tributed under the funding levels above 12 percent31
Territory Segment
Customer Participation
Rate () Utility Type
Per Capita Lifecycle Bill Savings ($)
Per Capita Incentive
($)
WPS Electric Commercial $115258 3 $8330
WPS Electric Industrial $9026768 96 $892463
WPS Electric Residential $6494 36 $666
ResourcesPublic Service Commission of WisconsinApplication of Wisconsin Public Service Corporation for
Authority to Adjust Electric and Natural Gas Rates Final Decision (December 7 2012) Docket No 6690-UR-121
David J Kyto Wisconsin Public Service Corporation Application of Wisconsin Public Service Corporation for
Authority to Adjust Electric and Natural Gas Rates Supplemental Direct Testimony (May 15 2012) Docket No 6690-UR-121
Focus on EnergyThe Cadmus Group Inc (2013) Focus on Energy Calendar
Year 2012 Evaluation Report Appendixes Portland OR The Cadmus Group Inc Retrieved from httpwwwfocusonenergycomsitesdefaultfilesFOC_XC_CY201220Report20Appendices20A-O20Final2005-3-13pdf
Decoupling Case Studies Revenue Regulation Implementation in Six States
18
32 DPU 07-50 (2007)
33 DPU 07-50 (2007) pp 392ndash396
Massachusetts National Grid
The revenue regulation mechanism for National Grid (Massachusetts Electric Company and Nantucket Electric Company together doing business as National Grid) compares authorized
distribution revenue to actual distribution revenue Revenue is compared and adjustments are made separately for each customer class
AuthorityThe Massachusetts Department of Public Utilities (DPU)
adopted revenue regulation as a statewide regulatory policy in 2008 and individual utilities filed revenue regulation tariffs in response In its Investigation Into Rate Structures that will Promote Efficient Deployment of Demand Resources32 the DPU investigated rate structures and revenue recovery mechanisms that may reduce disincentives to the efficient deployment of demand resources in the state and consid-ered how the electric and natural gas distribution compa-niesrsquo existing cost recovery mechanism could be changed to better align the companiesrsquo financial incentives with policy objectives while ensuring that the companies are not finan-cially harmed by the increased use of demand resources The DPU finally concluded that revenue regulation mecha-nisms would eliminate the financial disincentives because they sever the link between the companiesrsquo revenue and reduction in sales The DPU also endorsed a revenue per customer approach but recognized that other factors could result in changes to distribution-related costs and consent-ed to consider company-specific ratemaking proposals that accounted for the impact of capital spending and inflation-ary pressures on the companyrsquos required revenue
Authorized Revenue RequirementThe authorized revenue requirement does not include
costs that are reconciled outside of base distribution rates including energy supply costs for basic service customers transmission costs the energy efficiency system benefits charge and reconciling charge and costs recovered through the residential assistance adjustment factor
Rate of ReturnThe Commission recognized the effects of revenue
regulation on ROE and determined that revenue regulation reduces volatility which reduces risk and a downward ad-justment to ROE was appropriate but did not make its ac-tual ROE adjustment for the revenue regulation mechanism explicit in its order33 The DPU determined that a return on equity equal to 1035 percent was sufficient The testimony from National Grid supporting its proposed ROE presented comparisons of allowed ROE for a set of companies that had revenue regulation or another risk management mecha-nism in place to account for an implied reduced risk profile in developing that proposal
Revenue Adjustment MechanismEach year the authorized revenue requirement is ad-
justed to account for capital expenditures in the previous year The CapEx Adjustment applies to capital expenditures incurred by National Grid for distribution system invest-ments in the previous year net of the amount recovered through depreciation expense in base rates This accounts for the material difference in expected capital expenditures compared with prior years In this way the CapEx Adjust-ment in the National Grid revenue regulation mechanism is a special case of a ldquoK Factorrdquo which characterizes an expected change in costs in the future and accounts for those changes when they occur Each year the Company files with the Department documentation in support of the capital expenditures it has incurred since the previous review The Department reviews the filings to determine the prudence of the incremental expenditures and whether the expenditures are used and useful National Grid then allocates approved expenditures to rate classes based on the cost of service study For each class the Company determines the adjustment allocated to the rate class then divides this sum by the forecasted kWh sales for the follow-
Decoupling Case Studies Revenue Regulation Implementation in Six States
19
34 DPU 07-50 (2007) p 87
35 ACEEE Massachusetts Available at httpaceeeorgsectorstate-policymassachusetts
36 Personal communication with National Grid
ing year to determine the per-kWh adjustment In order to provide a balance between providing the
Company with sufficient funds to ensure the safety and reliability of the distribution system and protecting ratepay-ers against the incentive the Company has to overinvest in infrastructure the mechanism limits the level of annual capital expenditures that is recoverable through the mecha-nism To arrive at the amount the Department set a limit of $170 million per year which is equal to the approximate three-year average of the Companyrsquos capital spending in previous years Should the Companyrsquos capital expenditures exceed this limit it may seek to include the investment in the rate base during the next base rate proceeding
The Company submits its CapEx filing no later than July 1 of each year On November 1 of each year the Company submits all other information in support of its proposed adjustment factors The factors will take effect on March 1 of each year
The authorized revenue is also adjusted to include a 50-percent sharing for earnings above the authorized ROE
Reconciling Actual Revenue With Authorized Revenue
Each year National Grid calculates on a rate class-spe-cific basis the difference between the actual distribution revenue billed to customers through distribution rates and the annual target revenue For each rate class the difference between the actual billed distribution revenue and the an-nual target revenue is summed to determine the Company-wide reconciliation amount That amount is divided by the Company-wide kWh forecasted for the upcoming year to arrive at a cent-per-kWh reconciliation charge or credit To determine the final adjustment for each rate class the Company-wide reconciliation adjustment is added to the rate class-specific adjustment resulting from the target rev-enue adjustment mechanisms
The adjustment to the authorized revenue in any year is capped at three percent of total revenues34 Any excess can be carried forward to a future year with carrying charges equal to the customer deposit rate
National Grid must report to the DPU if the difference between the year-to-date billed revenue and year-to-date annual target revenue equals or exceeds ten percent of the target revenue and the Company believes that the difference will fall outside of the ten-percent threshold in the coming months In this case interim revenue regulation adjust-ments can be made In order to avoid an interim adjust-ment too close to the scheduled annual rate adjustment
National Grid must notify the Department of variances exceeding ten percent of annual target revenue by August 31 of each year
Complementary Policies Massachusetts requires that electric utilities procure
all cost-effective energy efficiency before more expensive supply-side resources This requirement was translated into annual savings requirements for electric utilities starting from 1 percent of sales in 2009 to 14 percent in 2010 2 percent in 2011 and 24 percent in 2012 and potentially increased savings in subsequent years Utilities can earn approximately five percent of program costs for meeting or exceeding savings targets35
National Grid offers inclining block rates as the default residential rate but there is an optional TOU rate with peak and off-peak tiers also available to residential customers Small and large industrial and commercial customers can take service under flat rates inclining block rates or TOU rates
National Grid operates under a penalty and reward sys-tem for service quality established in Docket DTE 99-84 The impetus behind the DPUrsquos original establishment of the Service Quality Guidelines was to prevent Massachusetts utilities from allowing service quality to deteriorate under a new regulatory regime
Energy Efficiency OutcomesBefore Massachusetts Electric implemented revenue
regulation in 2009 it reported consistently high levels of incremental energy efficiency savings approximately 09 percent of retail load In 2010 the company reported 136 percent savings and 159 percent in 2010 and 2011 respectively36
ResourcesMassachusetts Department of Public UtilitiesDocket 09-39 Petition of Massachusetts Electric Company
(November 30 2009)
Decoupling Case Studies Revenue Regulation Implementation in Six States
20
37 Energy Agreement Among the State of Hawaii Division of Consumer Advocacy of the Department of Commerce amp Consumer Affairs and Hawaiian Electric Companies Available at httpwwwhecocomvcmcontentStaticFilespdfHCEIpdf
38 The HECO Companies described as follows in their Reply SOP in the Schedule A decoupling proceedings ldquothe
Hawaii Hawaiian Electric Company
Hawaiian Electric Company (HECO) uses a revenue regulation mechanism that compares actual revenue to target revenue in each year The target revenue is based on the authorized
revenue for the last test year adjusted for operation and maintenance (OampM) increases and rate base changes
HECO is a subsidiary of Hawaiian Electric Industries which also operates Maui Electric Company (MECO) and Hawaiian Electric Light Company these subsidiaries service the islands of Maui and Hawaii County while HECO serves Oahu (Honolulu)
Authority In 2008 the Governor of Hawaii the Division of Con-
sumer Advocacy and HECO entered into an agreement as a result of the Hawaii Clean Energy Initiative37 The agreement is intended to move Hawaii away from its dependence on imported fossil fuels for electricity and ground transporta-tion and toward locally produced renewable energy and energy efficiency In the agreement the State the Consumer Advocate and HECO committed to among other things a transition away from a model that encourages increased elec-tricity usage and to a model that implements revenue regula-tion decoupling to encourage the development of renewable energy by HECO The Commission opened Docket 2008-0274 in order to examine the features of a revenue regula-tion mechanism The Opening Order directed HECO and the Consumer Advocate to file a joint proposal on revenue regulation within 60 days This joint proposal was modeled closely after the California mechanism described earlier for PGampE with a rate-case determined revenue requirement plus annual attrition adjustments plus separate mechanisms
to recover power supply and energy efficiency costsThe Hawaii Public Utilities Commission approved
revenue regulation for HECO in August 2010 based on an investigation into the appropriateness of revenue regula-tion and its design The revenue regulation mechanism took effect on March 1 2011 This replaced a previous lost revenue adjustment mechanism
Authorized Revenue RequirementThe Commission establishes the Authorized Base Rev-
enues through a general rate case based on traditional cost-of-service ratemaking principles The Authorized Base Revenue is the annual amount of revenues required for the utility to recover its estimated OampM depreciation amorti-zation and tax expenses for the period
The Target Revenue is equal to the base revenue require-ment less any revenue being separately tracked or recov-ered through any other surcharge or tracking mechanism including revenue for fuel and purchased power expenses
The revenue regulation order also requires staggered triennial rate cases for each of the Hawaiian Electric Indus-tries Companies to determine approved baseline Revenue Adjustment Mechanism (RAM) inputs
Rate of ReturnThe Commission made no explicit adjustment to ROE
owing to the revenue regulation mechanism but noted that the allowed ROE of ten percent reflects the approval of revenue regulation and other cost-recovery mechanisms that will lower HECOrsquos business risk38 Most recently the Hawaiian Public Utilities Commission approved a 90-per-cent ROE for MECO reflecting both a lower baseline cost
Commission effectively reduced the Companiesrsquo return on common equity by 50 basis points to ldquofairly compensate ratepayersrdquo for what it perceived as the ldquorisk-reducingrdquo effects of the RBA and RAM mechanisms the Renewable Energy Infrastructure Program (lsquoREIPrdquo) Surcharge and the Purchased Power Adjustment Clause (ldquoPPACrdquo)rdquo Available at httpdmspuchawaiigovdmsDocumentViewerpid=A1001001A10L29B55326B47993
Decoupling Case Studies Revenue Regulation Implementation in Six States
21
39 Hawaii PUC Decision and Order No 31288 (2013 May 31) pp 97ndash112
40 Hawaii PUC Decision and Order No 31289 (2013 May 31)
41 Hawaii PUC Decision and Order No 31908 (2014 Feb 1)
42 February 7 2014 order on schedule A issues Available at httpdmspuchawaiigovdmsDocumentViewerpid=A1001001A14B10B22326F07922 p 42ndash47
of capital and a penalty of 050 percent associated with inadequate performance bringing renewable energy into the MECO system39 A companion Order also established new guidance on future revenue regulation mechanisms40
Revenue Adjustment MechanismThe RAM is designed to replace the need for annual rate
cases by adjusting Authorized Base Revenue levels to reflect estimated changes in the utilityrsquos cost of service The RAM is intended to via formula-driven estimates and escalators compensate the HECO Companies for changes in util-ity costs and infrastructure investment between rate cases and reduce the frequency of rate cases The RAM Period is the calendar year containing the Annual Evaluation Date (March 31 the date of the annual RAM filing) The RAM adjusts the revenue requirement according to changes in four main categories of expenses
bull Base expenses which are changes in designated OampM expenses
bull Rate base the return on incremental investment in designated rate base components41
bull The incremental depreciation and amortization expenses and
bull Exogenous tax changes changes in costs owing to significant changes in tax laws or tax regulations
Base expenses are segregated between labor and non-labor amounts The labor component is adjusted annually by the Labor Cost Escalation Rate reduced by the Labor Productiv-ity Offset (fixed at 076 percent) The non-labor component uses the Non-labor Escalation Rate to annually adjust those costs Tracked OampM expenses for fuel purchased power pension and post-employment benefits integrated resource planning DSM and other rate adjustment provisions are not adjusted in the RAM because any changes in these costs are accounted for in other cost-tracking mechanisms
The Rate Base equals the average net investment esti-mated for the RAM Period The average rate base is the rate base for the rate case test year with adjustments for changes in only four components of rate base (1) average plant-in-service (2) average Accumulated Depreciation (3) average accumulated contributions in aid of construc-tion and (4) average accumulated deferred income taxes All other components of the rate base remain the same as in the preceding rate case test year The average plant-in-service is equal to the average of the actual plant-in-service at the end of the year prior to the RAM period the Evalu-ation Year and the same year-end balance plus estimated plant additions for the RAM period Plant additions include
Baseline Capital Project plant additions and Major Capital Projects plant additions estimated to be in service by Sep-tember 30 of the RAM period
The RAM also includes an Earnings Sharing Revenue Credit mechanism in order to protect against excessive over-all utility revenue levels The RAM will escalate and update the Companyrsquos approved base revenue requirement reduced by earnings sharing credits and major project revenue credits to customers Based on the Companyrsquos achieved return on common equity for the Evaluation Year the mechanism cred-its the RBAs according to the following chart
ROE at or below the authorized ROE
First 100 basis points (1) over authorized ROE
Next 200 basis points (2) over authorized ROE
ROE exceeding 300 basis points (3) over
authorized ROE
Retained entirely by shareholders no customer credits
25 share credit to customers
50 share credit to customers
90 share credit to customers
Finally the RAM includes additional consumer protectionsbull A provision for Major Capital Projects Creditsbull A provision for Baseline Capital Projects Creditsbull Notification is provided to all affected customers of
the RAM filing in newspapers and billsbull Evaluation procedures for filing examination and any
exceptions to annual revenue regulation filingsbull Continued ability of HECO or the Consumer
Advocate to request formal rate proceedings to replace and terminate RAM at any time and
bull Formal review of revenue regulation as a part of the next round of rate case proceedings
A recent order42 added two additional consumer protections
bull A limitation that only 90 percent of the current
Decoupling Case Studies Revenue Regulation Implementation in Six States
22
43 ACEEE Hawaii Available at httpaceeeorgsectorstate-policyhawaii
RAM Period Rate Base that exceeds the Rate Base Adjustment Mechanism from the prior year can be included in the Decoupling Mechanism for baseline utility plant projects which unlike major capital projects are not subject to prior Commission review and approval and
bull A requirement to post a number of metrics online for customer review although not at this point tied to performance
This order also examined four issues with respect to the application of the RAM The Commission determined that the short-term debt rate as reflected in the most recent rate case should be used to adjust over- and under-collections The Commission also resolved its concern that without a sustainable business plan there exists no strategic frame-work under which to evaluate capital expenditure pro-grams The Commission required the parties in the Docket to further explore capital expenditure issues in conjunction with other risk-sharing mechanisms discussed elsewhere in the order The commission ordered a further evaluation of a proposed risk-sharing mechanism within the RBA Further-more the Commission ordered the parties to work together to establish appropriate metrics which the utility would report on its website
Once the total RAM Revenue Adjustment is calculated it is applied through a uniform adjustment to the per-kWh energy charge for all customer classes
Reconciling Actual Revenue with Authorized Revenue
RBAs record the monthly differences between target revenues and the adjusted recorded electric sales revenues The RBA also applies monthly interest equal to the annual rate for short-term debt from the cost of capital in each HECO Companyrsquos last base rate case to the simple average of the beginning and ending balances each month in the RBA In effect the RBA applies one-twelfth of the rate each month Finally the RBA provides for collection or return of the calendar year-end balances in the RBA and recovery of the RAM Revenue Adjustment over the subsequent May 1 through April 30 period The target revenue is the most recent Authorized Base Revenue or the re-determined Authorized Base Revenue calculated under the RAM
On or before March 28 the Company must file with the Commission a statement of the previous year-end balance in each RBA sub-account and the Authorized Base Revenue level for the current calendar year with supporting calculations An amortization of the year-end balance in the
RBA sub-accounts and the RAM Revenue Adjustment are recovered through the per-kWh RBA rate adjustments The rate adjustment occurs from May 1 of the current calendar year to April 30 of the next year
Complementary PoliciesCurrently electric utilities in Hawaii may use energy
efficiency to meet a portion of their Renewable Portfolio Standard requirements Starting in 2015 electricity savings from energy efficiency will be applied to the Statersquos Energy Efficiency Portfolio Standard which sets a target equivalent to 30-percent forecast sales by 2030 This goal is translated into a target of 14 percent annual savings HECO trans-ferred administration of all of its energy efficiency programs to a third party administrator in 2009 The administrator is compensated for satisfactory performance43
Because of its heavy dependence on petroleum as a generation fuel electricity prices in Hawaii are very high solar and wind are typically lower-cost resources for these systems HECOrsquos default residential rates are inclining block rates with a $900month customer charge and a three-block inclining rate design of $034kWh to $037kWh Residential customers can elect to take service under a TOU rate with off-peak mid-peak and priority-peak tiers Gen-eral service and large power service customers take service under a flat rate unless they opt to take service under a TOU
Hawaii is developing reliability standards in part as a response to deteriorating service quality as a result of distributed and customer-owned generation (see text box) In an effort to make electricity reliability and interconnection standards as transparent as possible the Reliability Standards Working Group was formed in the Feed-In Tariff docket and continues its work in Docket No 2011-0206 to find solutions to integrating high penetrations of renewable energy consistent with reliability and power quality standards
Energy Efficiency OutcomesHECO implemented revenue regulation in 2011 Since
2003 HECO has reported incremental energy efficiency savings between 0 and 05 percent of retail load with 131 percent savings reported in 2011 by Hawaii Energy the
Decoupling Case Studies Revenue Regulation Implementation in Six States
23
44 Hawaii PUC Decision and Order No 31288 Maui Electric Company Limited Docket No 2011-0092 (2013 May 31) Appendix C p 2
Statersquos ratepayer funded efficiency program administrator The company has not yet reported its savings for 201245 In addition HECO has seen more than a sixfold increase in renewable installations under its net metering and feed-in tariff policies since the inception of the revenue regulation plan
Revenue regulation represents a regulatory framework that removes the financial disincentive for utilities to pursue clean
energy strategies It doesnrsquot in and of itself align the utility business model with those utility policies and practices that address customer expectations In fact some commissions are concerned that it might create a dynamic in which the utility assured of its revenue needs becomes complacent and lacks motivation to innovate and develop strategies that may be more in line with the public interest
In a recent order (Docket 2011-0092 May 31 2013) the Hawaiian Public Utilities Commission addressed this big picture issue in a rate order for Maui Electric The Commission called out the management as lacking a long-term vision for creating customer value and expressed concern that ldquothe HECO Companiesrsquo over-reliance upon a link between the [Decoupling]
Agreement and utility financial health obfuscates utility performance and ultimately customer service and satisfactionrdquo44 The implementation of clean energy policies is not a singular goal but rather a policy that must be part of a larger effort to create customer value
The Commission laid out a hard path and a soft path to achieve the results they desire for consumers The hard path involves a closer examination of utility investments operations and expenditures The soft path is opened through the actions of management to create and execute a vision for the utility of the future The Commission remains committed to regulatory innovations that are in the public interest and will work with the utility consumer advocate and other stakeholders to create and implement this vision
The results of this effort will likely produce ideas and outcomes that will have applicability beyond this one utility
ResourcesHawaii Public Utilities CommissionDocket No 2008-0274 Final Decision and Order (August 31 2010)Docket No 2008-0083 Final Decision and Order (December 29 2010)Docket No 2011-0092 Final Decision and Order May 31 2013 including
Decision and Orders Nos 31288 and 31289Docket No 2013-0141 Final Decision and Order (February 1 2014) including
Decision and Order No 31908
45 EIA Form EIA-861 data files Available at httpwwweiagovelectricitydataeia861
Decoupling Case Studies Revenue Regulation Implementation in Six States
24
46 Lazar et al 2011
Discussion of the Six Utilities Overall
Authority The first step in implementing a revenue regulation
mechanism is to understand the authority of the regulating body the Public Utility Commission or PSC It is important for any Commission to clarify its justification for acting on revenue regulation in order to prevent any decisions from being overturned Over the years Utilities Commissions have relied on different justifications for implementing revenue regulation mechanisms Commissions have imple-mented revenue regulation at their own discretion justified by their directive to ensure safe reliable and economic public utility service to citizens to justify changing the regulatory environment In some cases the Commission is unable to engage on narrow issue ratemaking and rates can change only as the result of a full rate case In this case statutes must be amended to enable revenue regulation
In all of the case studies discussed here the Commis-sions first implemented revenue regulation at their own dis-cretion but each followed slightly different paths to do so The CPUC first implemented revenue regulation in 1978 at its discretion In 2001 after a period when mechanisms were suspended the California Legislature required that deviations from projected sales not result in under- or over-collections by utilities and so the CPUC re-implemented revenue regulation according to statutory requirement The Hawaii Public Utilities Commission implemented rev-enue regulation after an agreement between the utility the Governor and other stakeholders called for it In Idaho the Commission established a case in which to investigate rev-enue regulation and held a series of stakeholder workshops before implementing the policy The Massachusetts DPU adopted revenue regulation as a statewide regulatory policy and required individual utilities to file tariffs in response as the result of its general investigation into rate structures that promote demand-side resources The Maryland Com-mission implemented revenue regulation for BGE when the utility requested the mechanism Thus the impetus to develop a revenue regulation mechanism may come from different sources and the Commission may be comfortable
in moving forward under their general supervisory statutes Nevertheless specific statutory language can be helpful to shore up the existing authority
Authorized Revenue Requirement Under the traditional regulatory framework the Com-
mission (or other authority in the case of publicly owned utilities) must determine a utilityrsquos revenue requirement This function does not change under revenue regulation The revenue requirement of a utility is the aggregate of all the operating and other costs incurred to provide service to the public This typically includes operating expenses depreciation and the cost of capital invested including in-terest on debt and a ldquofairrdquo return on equity to investors The (simplistic) formula for determining revenue requirements is as follows
Revenue Requirements = (Rate Base times Rate of Return) + Operating Expenses + Depreciation +Taxes
Traditionally the revenue requirement along with sales is used to determine the rates consumers will pay for elec-tricity46 The rates are also broken down by customer class and intraclass tariffs are created based usually on a cost of service study that determines each customer class and subclass contribution to the utilityrsquos costs The (simplistic) formula for determining the rate per unit is
Rate = Revenue Requirement divide Units Sold
In this way rates are set to allow the utility to exactly recover its revenue requirement when the sales level used to calculate rates is equal to actual sales However it is important to recognize that actual expense and revenue varies with actual sales When actual sales are greater than the sales level used in ratemaking revenue increases and expenses increase by a different amount when actual sales are lower than the ratemaking sales level actual revenue
Decoupling Case Studies Revenue Regulation Implementation in Six States
25
declines and expenses decrease by a different amount Under revenue regulation rates are initially set in the same way but when actual sales differ from the level used to calculate rates the actual revenue level is maintained at the rate case amount as rates are allowed to vary inversely with salesmdashincreased sales lead to decreased rates and vice versa Because the primary expenses that change in the short run as sales levels change are power supply expenses and most regulators allow these to be tracked using a power cost adjustment mechanism revenue regulation mechanisms are generally designed to ensure recovery of the non-power costs (which do not change significantly in the short-run) as sales volumes change
Revenue regulation ensures that actual revenue is equal to the revenue requirement established by the Commission or appropriate authority Although the description above presents an overly simplified view of the revenue require-ment and its use in traditional price regulation and revenue regulation there are many variations on how a Commis-sion can establish a revenue requirement particularly when implementing revenue regulation With revenue regulation as in traditional ratemaking imprudent costs can always be removed from rates and there is no change to the ability of a Commission to impose penalties
Utility Functions to be IncludedFirst the regulator must determine which utility func-
tions will be included in the revenue regulation framework With vertically integrated utilities this usually includes a utilityrsquos regulated generation transmission and distribution units As we discuss below however it is critical to struc-ture power supply recovery mechanisms to avoid providing for double-recovery of certain power supply costs For utili-ties operating in areas of the country that have restructured electricity markets only the regulated distribution busi-ness is decoupled Utilities that also provide gas services
Pacific Gas amp Electric Future test year
Idaho Power Company Historic test year
Baltimore Gas amp Electric Hybrid test year
Wisconsin Public Service Corporation Future test year
National Grid Historic test year
Hawaiian Electric Company Future test year
Table 2
Test Year Used
may have their gas distribution business operating under revenue regulation as well
Test YearOne consideration in establishing the revenue require-
ment is what period of time will be used as a ldquotest periodrdquo or ldquotest yearrdquo The test year is the year on which the Com-mission will base its computations of the utilityrsquos total costs and sales levels A historic test year uses actual data on sales and costs from a past year Whereas a historic test year allows for the use of actual cost data it cannot account for expected variations in sales A future test year requires assumptions to be made about a utilityrsquos sales in a future year This can allow expected changes in sales like those from energy efficiency programs to be included in sales
projections however because regulators are relying on estimates provided by the utility there may be a greater risk for inaccuracy A Commission may also choose to use a test year that includes both past and future periods This may provide a sense of balance between historic and future data Furthermore as the case proceeds the Commission can require the utility to substitute historical data for projected data from the test year
Rate of ReturnAs in any rate case regulators
must determine the appropriate rate of return that a utility can earn on its investments including the cost of debt and the allowed ROE for its shareholders The approved ROE is only used to establish the return on investments that are included in the rate base when determining revenue require-
Pacific Gas amp Electric Electric generation and distribution gas distribution
Idaho Power Company Electric generation and distribution
Baltimore Gas amp Electric Electric distribution gas distribution
Wisconsin Public Service Corporation Electric generation and distribution
National Grid Electric distribution
Hawaiian Electric Company Electric generation and distribution
Table 1
Business Unit Included in the Revenue Regulation Model
Decoupling Case Studies Revenue Regulation Implementation in Six States
26
47 In a rate case the Commission determines an allowed return on equity This is used to set a price (price regulation) or an allowed revenue requirement (revenue regulation) Once set however the actual return earned by the utility is affected by anything that changes either revenue or expenses for example an increase in employee compensation a change in the number of employees or under price regulation a change in sales volumes
48 Lazar et al 2011
ments Although revenue regulation ensures that a utility recovers no more or less than its target revenue revenue regulation does not guarantee that the utility will earn the authorized ROE Depending on how a utility manages its costs between rate cases it will realize an actual ROE either higher (in the case of reduced costs) or lower (in the case of increased costs) than the authorized level47
A utilityrsquos allowed ROE generally represents the return deemed necessary to attract investment considering the level of risk of that investment Riskier investments require a higher return to attract investors and vice versa Util-ity earnings can be volatile because of short-run impacts on sales volumes and revenues which include changes in sales owing to weather economic conditions and energy efficiency and DG programs This volatility typically causes utilities to retain a higher level of equity in their capital structures so that reduced revenues do not leave them un-able to service their debt Revenue regulation can reduce this volatility by stabilizing revenues regardless of the cause Because of this reduced risk many stakeholders have proposed that the implementation of a revenue regulation mechanism be associated with a corresponding reduction in the utilityrsquos equity capital ratio (the percentage of capital supplied by common equity) This reflects the utilityrsquos more stable revenue owing to revenue regulation and reduces the overall revenue requirement that will be recovered from consumers48
An alternative option to reducing the utilityrsquos equity ratio is to reduce the ROE reflecting a lower risk level For the utilities included in these case studies only BGE and Mass Electric experienced a reduction in their ROE The Com-mission did not reduce BGErsquos ROE at the time the revenue regulation mechanism was implemented but reduced it by 50 basis points during the subsequent rate case The Mas-
sachusetts Commission did not reveal its adjustment but incorporated a lowered ROE into its decision
Absent an explicit adjustment to the cost of capital investorsrsquo expectations will adjust to the presence of rev-enue regulation if its presence is reliable The more stable earnings will likely in time contribute to a higher credit rating That in turn will lead to lower cost debt that will be revealed in future cost of capital calculations An adjust-ment to the ROE or capital structure by the regulator in a rate proceeding will be reflected immediately in lower rates to consumers simply allowing the utilityrsquos credit rating to improve over time and its cost of debt to decline will have the same effect but on a lagged basis as new bonds are is-sued at lower interest rates49
Beginning in 2004 Standard and Poorrsquos began publish-ing ldquorisk profilesrdquo for utilities which classified utilities based on their earnings variability and other risks those with more stable earnings were determined eligible for higher bond ratings at any given equity capitalization ratio (or alternatively able to retain a given bond rating with a lower equity ratio)50 One utility with a revenue regulation mechanism Northwest Natural Gas was believed to have had their business risk profile upgraded by one step in response to the benefits of the mechanism51
Effect on Bond RatingsRevenue regulation stabilizes a utilityrsquos revenue streams
reducing risk to investors this reduced risk may be a contributing factor in an increase in a utilityrsquos bond rating Bond rating agencies have recognized that revenue regula-tion mechanisms and other mechanisms that reduce net earnings volatility and risk contribute to a lower cost of capital for the utility52 Standard and Poorrsquos has explicitly stated that it ldquoviews decoupling as a positive develop-
49 Lazar et al 2011
50 Standard and Poorrsquos (2004 June 2) New Business Profile Scores Assigned for US Utility and Power Companies Financial Guidelines Revised
51 Christensen Associates (2005 March) A review of distribution margin normalization as approved by the Oregon Public Utility Commission for Northwest Natural
52 Lazar et al 2011
Decoupling Case Studies Revenue Regulation Implementation in Six States
27
This topic raises a note of caution if mechanisms are not well designed double-recovery of costs can occur for verti-cally integrated utilities that provide both power supply and distribution services For example if a per-customer
revenue regulation mechanism includes investment-related power supply costs in the revenue-per-customer formula but excludes fuel and purchased power costs that are recovered through a separate tracking mechanism double recovery of some power supply costs is likely If the utility experiences cus-tomer and sales growth the amount it recovers for investment-related power supply costs will go up However if that utility serves this growth by operat-
ing existing power plants more by selling less power on the surplus market or by purchasing power from other suppli-ers it will not incur any increases in the type of power sup-
53 Standard amp Poorrsquos (2008 February 19) Decoupling the vehicle for energy conservation
ment from a credit perspectiverdquo53 However in the case of the utilities examined in this report none experienced an improved credit rating after the implementation of revenue regulation with the exception of PGampE However PGampE came out of Chapter 11 bankruptcy in the same year that its revenue regulation mechanism was implemented mak-ing it impossible to attribute the improvement to revenue regulation alone Bond rating changes are generally slow to evolve Numerous other factors are taken into account when assigning an overall credit rating which appear to have outweighed any positive effect of revenue regulation These factors certainly include the recession of the US economy that began in 2007
Customer Classes IncludedWhen determining the target revenue for a utility rev-
enue regulation mechanism regulators must also consider which customer classes to include in the mechanism In some cases industrial customers have objected to a rev-enue regulation mechanism This is due to the wide dif-ference in rates among customers making the design of a revenue regulation mechanism more challenging If regula-tors choose to exclude a class of customers from revenue regulation they must determine the revenue requirement associated with serving only the included customer classes This generally requires a detailed cost of service study to ensure that revenue responsibility is accurately allocated by customer class
Included CostsFinally regulators may wish to exclude specific costs
from the overall revenue requirement if those costs will be tracked through another mechanism like fuel costs in a PCA mechanism energy efficiency program expenditures or smart grid costs for example Separate tracking mecha-nisms can also be used for those costs that are difficult to
Pacific Gas amp Electric All customer classes
Idaho Power Company Residential and small general service
Baltimore Gas amp Electric Residential and small general service
Wisconsin Public Service Corporation All customer classes
National Grid All customer classes
Hawaiian Electric Company All customer classes
Pacific Gas amp Electric
Idaho Power Company
Baltimore Gas amp Electric
Wisconsin Public Service Corporation
National Grid
Hawaiian Electric Company
Table 3
Customer Classes Included in Revenue Regulation Mechanism
Table 4
Costs Excluded From Revenue Regulation Mechanism
project based on historical data or costs over which the util-ity has very little control like fuel costs Although revenue regulation tracks collected revenue mechanisms like Fuel Adjustment Clauses Purchased Power Adjustments and Energy Efficiency Riders can be designed to track actual costs as well as collected revenue
Energy procurement costs
All variable costs
Energy supply costs
Energy costs
Energy supply costs for basic service customers transmission costs the energy efficiency system benefits charge and reconciling charge and costs recovered through the residential assistance adjustment factor
Fuel and purchased power
Decoupling Case Studies Revenue Regulation Implementation in Six States
28
54 We use the RAM term applied in Hawaii here to address any type of attrition or similar mechanism other than a revenue-per-customer framework that changes the allowed revenue between general rate cases
ply costs accounted for in the revenue per customer (RPC) calculation The increased power supply costs to serve that growth will be recovered through the fuel and purchased power tracking mechanism The net effect for the utility will be to recover incremental power supply costs twicemdashonce in the per-customer mechanism and again in the fuel and purchased power mechanism It is essential to make sure that the other adjustment mechanisms do not overlap the cost impacts that are treated in the revenue regulation mechanism One way to do this is to ensure that all power supply costs (investment labor fuel purchased power) are recovered through a single mechanism There are several ways to achieve this
a) A comprehensive power supply recovery mechanism that includes all power supply costs that is separate from the costs treated in the revenue regulation adjustment (eg Puget Sound Energy Washington State)
b) No power supply adjustment whatsoever with all utility costs included in an RPC mechanism (eg National Grid)
c) An annual attrition calculation with all costs reviewed for changes since the last proceeding (eg HECO)
Revenue Adjustment Mechanism in Revenue Regulation
A RAM54 is not necessary to achieve revenue regulation but provides attrition reliefmdashincreasing authorized revenue commensurate with increased costsmdashbetween rate cases Whereas revenue regulation sets a target revenue that the utility will earn regardless of sales levels the RAM adjusts the target revenue between rate cases Regulators may choose to take several different approaches to RAM
bull No RAM Regulators may choose not to implement a RAM leaving the revenue requirement unchanged between rate cases This requires the utility to request a rate case when it requires additional revenue to cover its costs
bull Stairstep Stairstep adjustments provide predetermined increases in target revenue These increases can be determined during a rate case and generally reflect forecasts of cost growth
bull Indexing Indexing ties adjustments to the target revenue to multiple factors like inflation productivity customer growth and changes in capital expenditures
bull RPC The RPC approach is a form of indexing RPC adjusts the total revenue requirement for the
number of customers served Regulators using an RPC mechanism will determine the revenue requirement per customer and the overall revenue requirement will be determined by multiplying the total number of customers by the revenue requirement per customer The amount of revenue required to serve each customer can be determined separately for customer classes and for existing and new customers This way the RPC method accounts for a utilityrsquos growth in fixed costs that is related to growth in the number of customers served RPC is useful where the correlation between cost growth and customer growth is significant It also protects customers from making up the deficit if there is a loss in customer load such as if a large business closes down or relocates
bull Hybrid Hybrid RAMs generally use stairstep increases to account for projected capital costs and indexing to account for OampM expenses
Adjustments from any type of RAM can be implemented automatically or through an attrition proceeding Some stakeholders oppose adjustments to the revenue require-ment outside of a rate case on the basis that this could allow the revenue requirement to increase significantly without examination of the impact on ratepayers or with-out due consideration of other costs and revenues For this reason some regulators choose to cap the total adjustment that can be made to the revenue requirement outside of a rate case
Table 5
Type of Revenue Adjustment Mechanism
Pacific Gas amp Electric
Idaho Power Company
Baltimore Gas amp Electric
Wisconsin Public Service Corporation
National Grid
Hawaiian Electric Company
Hybrid
RPC
RPC
RPC
No RAM potential capital expenditure adjustment
Hybrid
Decoupling Case Studies Revenue Regulation Implementation in Six States
29
55 Because this method results in changes in the price for service that are calculated after that service has been provided it fails the ldquono retroactive ratemakingrdquo statutes that guide most electricity regulators Customers are entitled to know the price of the commodity they are consuming at the time they use it
56 The closest to a current method in use for electric utilities in the BGE system of monthly reconciliation
Table 6
Tracking and Accrual of Difference BetweenActual and Authorized Revenue
Pacific Gas amp Electric
Idaho Power Company
Baltimore Gas amp Electric
Wisconsin Public Service Corporation
National Grid
Hawaiian Electric Company
Track Difference
Monthly
Monthly
Monthly
Yearly
Yearly
Monthly
Accrual Period
Year
Year
Month
Year
Year
Year
Calculation of Actual RevenueRegulators have options when ensuring that actual
revenue equals target revenue under revenue regulation First regulators must decide how to determine ldquoactual revenuerdquo In most cases actual revenue simply equals the amount of revenue a utility collects from its customers The Idaho Public Utilities Commission however has chosen to use weather-normalized revenues as the basis for utility revenues in revenue regulation Although this prevents the utility from recovering revenue lost to it owing to milder than expected weather it further complicates the revenue regulation mechanism and reduces its risk-reduction ben-efits By the same token if weather is severe and increases sales above the revenue requirements weather normaliza-tion would allow the utility to retain some of the revenues
Next regulators must determine whether to implement revenue regulation using a current or accrual method
bull Current Method With the current method of revenue regulation the target revenue for a period say a month is divided by the actual sales in that period to determine the rate per kWh The current method ensures that actual revenue equals target revenue by calculating the rate at the end of the period so that the target revenue can be recovered The current method allows for no lag in revenue recovery One effect of this method is that although customer rates vary total bills are generally more stable For example in a hotter than expected July customers will purchase more kWh but they will be charged a lower rate A milder than average winter would lead to fewer sales but at slightly increased rates This way customers do not experience the same bill variability as they would if rates were set before the sales deviations occurred On the other hand the current method does not provide customers with the ability to plan ahead based on a predictable rate for electricity This method has been used for revenue regulation of natural gas utilities55
bull Accrual Method Under the accrual method rates are set based on an assumed sales level and the differences between actual and target revenue are allowed to accrue over some period Then the total difference between actual and target revenue is reconciled through an adjustment to rates in the subsequent period this is known as the true-up process Presently all revenue regulation mechanisms for electric utilities use the accrual method56
If regulators use the accrual method of revenue
regulation they will next need to determine the period over which the difference between actual and target revenue will be allowed to accrue One year is typical however shorter periods are also used Next the frequency of comparing collected revenue to target revenue should be determined It is possible to do this comparison only once at the end of the accrual period It is common however for comparisons to occur more frequently often monthly When revenues are compared within the accrual period the differences are tracked generally for the purpose of applying interest to the difference that will be deferred until the end of the accrual period
Rate AdjustmentsIn designing a revenue regulation mechanism there are a
number of decision points that regulators need to consider to balance the interests of all the stakeholders One of the decision points revolves around the determination of the mechanism used to adjust rates The issues that regulators need to consider include the following1 Rate Case Requirements One of the often-mentioned
concerns about surcharges especially when they are numerous is how that will impact the frequency of rate cases For regulators and stakeholders rate cases provide
Decoupling Case Studies Revenue Regulation Implementation in Six States
30
the best mechanism to correctly align rates and costs but they are time-consuming and expensive for all parties This is because a rate case presents an opportunity to closely examine all of the utilityrsquos expenses and adjust rates to reflect cost increases and decreases Because under a revenue regulation mechanism the goal is to match revenues received from all customers with revenue requirements a correct determination of revenue requirements is important as is the specification of appropriate cost indices to adjust the revenue requirements As the time between rate cases increases some regulators feel the base rate case data even with adjustments need to be reexamined As a result some regulators have chosen to mandate the frequency of rate cases to address this whereas others have not It may be that in some cases where there are numerous surcharges recovering a multitude of costs there may not be as many costs subject to review in the rate case making it less significant to a regulator than a case in which most costs are being analyzed and recovered in the rate case itself
2 Collection Mechanism Integrally tied to the mechanism for recovering revenues is how the utility will collect or refund the revenues Options that are available include recovery through a rate case or periodic adjustments to rates through a surcharge mechanism As can be seen by the case studies depending on the plan in place some utilities have very discreet requirements dictating the frequency of rate cases with adjustments occurring in those cases or between those cases Other utilities have no requirements upon them with respect to the frequency of rate case filings This will be discussed in more detail below What does emerge from these case studies is that the discreet components or choices in how to execute a revenue regulation plan are carefully interwoven to create a holistic approach Each component works with the other and the value of this case study is in examining the different pathways that can be chosen As discussed previously some of the commissions have authorized revenue regulation to recover the revenue requirements in the last rate case whereas others have authorized adjustments to rates between rate cases this impacts the pathway that the adjustment mechanism takes
3 Timing How often should rates be adjusted to true up to the utilityrsquos revenue requirement States have chosen different options ranging from monthly to annually
4 Allocation of Revenue Regulation Revenue Surpluses or Deficits There are a number of decision points regarding allocation Should the revenue regulation apply to all rate classes or just the smaller customers whose usage per customer and load variations are not as dramatic as those of larger-use customer classes Should there be a different allocation to each rate class or should the allocation of costs among the classes be the same Different mechanisms accomplish different goals Some states have allocated revenue regulation revenues based on the revenues lost by customer class as a result of energy efficiency This can sometimes be a political decision to mitigate opposition to energy efficiency programs by large customers Other states recognize that the system savings resulting from energy efficiency benefit all customers so that all customers should pay equally
5 Carrying Charges Depending on the timing issue discussed previously regulators may want to consider carrying charges on any adjustments This should be symmetrical in its application however so that it applies to surcharges and refunds Consideration should be given for the basis of the carrying charge rate whether weighted average cost of capital rate of return a risk-free rate or some other mechanism should be adopted
6 Rate Caps In order to mitigate potential rate impacts a regulator may want to consider a cap on how much rates can go up when the revenue regulation adjustment is made This might be more critical if the regulator is aware of other potential rate increases that will impact customersrsquo bills If a cap is used the case in which the utilityrsquos adjustment would exceed the cap must be considered Some regulators have opted to allow the utility to carry over the excess unrecovered amount for a period of years whereas others do not This allows the utility to recover those revenues in a subsequent year when perhaps the adjustment is less As a practical matter however adjustments of greater than three percent are less common as shall be discussed later
7 Impact on At-Risk Consumers Low-income and consumer advocates have expressed concern about revenue regulation as a vehicle for annual rate increases without the scrutiny of a general rate case creating rate increases for the low-use customers doing the most to constrain usage and help achieve targeted energy savings One proposal to address this has been to impose any resulting surcharges only to above-average usage
Decoupling Case Studies Revenue Regulation Implementation in Six States
31
57 Cavanagh and Howat (2012 May 2) Finding common ground between consumer and environmental advocates Electricity Policy
58 The most common criticism of future test years is that utilities forecast costs under an assumption that all authorized personnel positions will be filled while in retrospect any large organization has some level of vacancy in its employee count A historic test year captures this effect fully
customers and any resulting credits only to below-average usage57
Rate Case RequirementRequirements as to the frequency of rate cases can be
tied to the recovery mechanism or to the entire regulatory framework for implementing revenue regulation In the cases studied two of the utilities require periodic rate cases PGampE every three years and WPS every year Two others National Grid and HECO require annual mini rate cases explained later in which adjustments are made and two others IPC and BGE have no requirements for scheduled rate cases Nevertheless if the concern is to ensure that the utilityrsquos revenue recovery meets its revenue requirements some kind of periodic rate case to examine costs is appropriate Having periodic rate cases can provide a measure of assurance to consumer advocates that the level at which the revenues and hence the rates are set is correct One of the criticisms of revenue regulation is in fact the lack of rate cases to produce a proper level of confidence in the allowed amounts Multiple surcharges are usually additive to existing rates therefore not permitting an opportunity to reduce the base rate for reductions in cost Moreover the infrequency in cases impedes the examination of rate allocations as would occur through a cost of service study
This is a particular issue where utilities are augmenting power supply with purchased power from independent power producers which is the most common method for acquiring wind and solar production today The increased cost for purchased power may flow through a fuel and purchased power adjustment mechanism while the (depreciating) investment in conventional power plants remains static in base rates
Both PGampE and WPS use a future test year that allows the utility to project revenue requirements during the time period that the rates are to be in effect The benefit to this is that it can help identify and account for projected changes in costs over the timeframe between rate cases However given that these costs are utility projections most consumer advocates have less confidence in these numbers than they would using actual numbers from a historical or only hybrid test year58 When trying to garner support for revenue regulation from more skeptical stakeholders using a future test year may not be helpful Furthermore in the case of WPS that has annual rate cases using a future test year becomes less justifiable as revenues are recalculated annually anyway
The absence of a rate case requirement can also cause consternation among detractors of revenue regulation because of the belief that the utility will be guaranteed its revenue requirements for as long as it is satisfied with that level irrespective of how well it manages However this is no different from the status quo in traditional regulation in most places The incentive to manage well is always there with or without revenue regulation as it translates into more profit for the utility
In the cases of HECO and National Grid the mini rate cases serve two purposes In the one instance it serves as a means to reconcile revenue recovery with revenue requirements and in the second instance it provides an opportunity to adjust rates in accordance with changes in costs Specifically for National Grid the revenue requirement is adjusted to reflect capital expenditures For HECO revenues are adjusted to reflect changes in the cost of service In the two examples here revenue regulation is wrapped in with other adjustments as part of a mini adjustment Given the structure for determining revenue requirements which accounts for changes in costs including revenue regulation within the mini rate cases is a workable option
These examples highlight how rate cases can be used to adjust revenue requirements either in a more controlled regulatory environment with frequent rate cases or left to the utilityrsquos discretion to decide when to adjust costs A set schedule of periodic rate cases such as that used by PGampE may strike an appropriate balance for reviewing revenue requirements however with the modification of a partial historical partial forecasted test year Frequent rate cases can depending on the resources of the regulator and stakeholders be too costly and time-intensive When there are too many rate cases stakeholders and regulators may not be able to dedicate the level of resources needed for any one proceeding and may be spread too thin Regular known rate cases at reasonable intervals may strike the best balance of adequate review and adjustment of revenue requirements
Decoupling Case Studies Revenue Regulation Implementation in Six States
32
Collection Mechanism and TimingThe collection mechanism for the differential between
actual and authorized revenue requirements varies by util-ity as well Both PGampE and WPS do not have adjustment clauses or surcharges but instead have structured their revenue regulation plans to recover their costs in a rate case with rates adjusted annually Although PGampE has rate cases every three years the utility files its preliminary forecast every September 1 for the following year including adjust-ments for revenue regulation and other costs This practice promotes transparency keeping all stakeholders aware of the current situation of the utility IPC BGE National Grid and HECO use surcharges on customer bills to collect or credit the difference between actual revenues collected and the revenue requirement Although the other three (IPC National Grid and HECO) calculate the rate adjustment annually only BGE does a more contemporaneous adjust-ment of one month Certainly where there are no regularly scheduled rate cases using an adjustment mechanism becomes more critical PGampE has created a tracking mecha-nism known as a balancing account that allows the utility to track the surpluses and deficits to help ensure accuracy at year end when rates are actually adjusted The creation of such monthly balancing accounts will make it easier at the end of the year to track what happened each month and then determine the adjustment for that year It provides a more detailed trail for review and analysis by stakeholders and regulators However other mechanisms that just look at total revenues as compared to revenue requirements at the end of the year can work as well
Table 7
Rate Case Requirements
Table 8
Rate Adjustments
Table 9
Allocation of Surplus or Deficit
Pacific Gas amp Electric
Idaho Power Company
Baltimore Gas amp Electric
Wisconsin Public Service Corporation
National Grid
Hawaiian Electric Company
Pacific Gas amp Electric
Idaho Power Company
Baltimore Gas amp Electric
Wisconsin Public Service Corporation
National Grid
Hawaiian Electric Company
Pacific Gas amp Electric
Idaho Power Company
Baltimore Gas amp Electric
Wisconsin Public Service Corporation
National Grid
Hawaiian Electric Company
Every three years annual ldquoattritionrdquo adjustments in between
No requirement
No requirement
Annual rate case
Annual capital expenditure adjustment case
Abbreviated annual rate case
Base rates adjusted annually
Annual adjustment through surcharge
Monthly adjustment through surcharge
Annual adjustment through rate case
Annual adjustment
Annual adjustment
Allocated to all customers according to business unit (eg electric distribution electric generation)
Included in the annual adjustment mechanism for each customer class
Separate for each customer class
Allocated to all customers except certain tariffs (see above)
Separate for each customer class
Separate for residential and commercialindustrial
Allocation of Revenue Regulation Revenue Surpluses or Deficits
The allocation of revenue regulation revenue surpluses or deficits should be symmetrical so that overpayments are credited to customers just as underpayments are paid by those same customers The six utilities studied fol-low that formula The application of revenue regulation however varies from utility to utility BGE and IPC ap-ply revenue regulation to the residential and commercial classes thereby excluding industrial customers In contrast however PGampE WPS National Grid and HECO allocate revenue regulation adjustments to all customer classes In terms of how the costs are allocated IPC BGE WPS National Grid and HECO allocate costs differently among the customer classes PGampE however allocates costs uni-formly among the customers Because PGampE has separated its business units it also separately calculates and allocates
Decoupling Case Studies Revenue Regulation Implementation in Six States
33
Table 10
Carrying Charges
Table 11
Cap on Rate Adjustment
Pacific Gas amp Electric
Idaho Power Company
Baltimore Gas amp Electric
Wisconsin Public Service Corporation
National Grid
Hawaiian Electric CompanyPacific Gas amp Electric
Idaho Power Company
Baltimore Gas amp Electric
Wisconsin Public Service Corporation
National Grid
Hawaiian Electric Company
None
Yes
None
Yes at the short-term debt rate
Yes at the customer deposit rate
Yes at the customer deposit rateNo
3 rate cap excess carried over to next period
10 rate cap excess carried over to next period
Cap of $14 million per year
$170 million in CapEx
No
revenue regulation surpluses and deficits among its electric distribution gas distribution and electric generation busi-nesses This illustrates that there are several ways to address revenues from revenue regulation depending on the policy outcomes that are desired
Carrying ChargesCarrying charges applied to uncollected or surplus rev-
enues can be used to account for the time value of money and the lost opportunity or value to having those revenues in hand PGampE and BGE do not accrue carrying charges On the other hand IPC WPS National Grid and HECO do For BGE given that the revenue regulation revenues are reconciled and recovered monthly it would make little sense to include a carrying cost Where carrying costs have been used they have included in the cases of these utili-ties the short-term debt rate or the customer deposit rate which for one utility is six percent and probably close to the short-term debt rate Thus the carrying charge rates are appropriately at the lower end of the spectrum reflecting their short-term nature In the application of the carrying charge symmetry should be preserved by applying it to both deficits and surpluses Application of carrying charges given the short period that costs are carried (one year) is somewhat discretionary Although it does more accurately account for costs it does add a modest level of complica-tion in tracking costs
Rate Caps and CollarsOne of the ways to protect customers in the event of sig-
nificant adjustments is to impose a rate cap (or collar) that limits the amount of a rate increase (and decrease) Some customers are sensitive to changes in foundational costs like utility bills and if costs are going to rise they benefit from a pattern of steady modest increases rather than a large step increase Any structural increases in rates attributable
to reductions in sales or increases in costs recognized by the revenue regulation plan would be eventually included in rates under any system A cap reflects a controlled way to manage customer expectations and customer impacts Structural changes can only be managed for a while until a complete rate case is needed to reset all assumptions
Typically when a rate cap is imposed if the formulaic increase exceeds the cap or collar the utility will be able to carry over any uncollected revenues until the next rate adjustment Two of the utilities studied PGampE and HECO do not have rate caps On the other hand the other four utilities do include rate caps in varying amounts National Grid has a one-percent revenue cap whereas IPC and BGE have a one-percent and a ten-percent rate cap respectively WPS unlike the others has a cap tied to the dollar amount of $14 million as opposed to a percentage Consistent with the goals of revenue regulation all of the utilities studied have a carryover provision that is important for reducing the risk that the utility will not recover its revenue require-ments
Note that National Grid differs from BGE and HECO in that its cap is on revenues whereas the other two utilities cap rates and rate impacts A revenue cap is more focused on ensuring minimal change to the revenue requirements authorized by the commission National Grid as discussed previously allows for mini rate cases to adjust the rev-enue requirements Having the one-percent cap limits the amount of increase that can occur through that process requiring revenue changes that are greater to occur in a full rate case However note also that some of the adjustments allowed in the mini rate case have their own separate cap The IPC rate cap is in line with what many other utilities with caps have in place which generally range from one to three percent The ten-percent rate cap in the BGE plan is
Decoupling Case Studies Revenue Regulation Implementation in Six States
34
59 Morgan P (2012 December) Graceful Systems LLC A decade of decoupling for US energy utilities rate impacts designs and observa-tions p5
reflective of its monthly adjustment pattern An annual ad-justment allows more time to smooth out peaks and valleys in revenues whereas a monthly adjustment will be influ-enced by more of the spikes (particularly weather-driven variation) thus the need for a larger bandwidth for the car-ryover Like a variable energy rate or fuel adjustment clause that fluctuates monthly the monthly adjustment introduces more volatility into the rates
Actual Historical AdjustmentsFor many ratepayer advocates there is a concern that
some of the utility management risk will be transferred to customers as a consequence of a policy that seeks to ensure that the utility will be made whole However the utility re-tains management risk and the requirement to demonstrate that it has acted prudently Thus the utility still has just as much of an incentive to operate efficiently as it did without revenue regulation If the utility can lower its costs it can still increase its profits Second by designing rates symmet-rically such that under- and over-recoveries are reconciled it provides customers with an opportunity to obtain credits that under traditional regulation would be retained by the utility It has often been opined that when there are large
gaps in time between utility rate cases it is because the utility is over-earning and exceeding its revenue require-ments In those instances customers never get to examine what the utility is collecting much less receive a refund Under revenue regulation with its periodic adjustments and scheduled general rate cases the revenue requirements are examined and refunds or credits allocated such that customers have a better knowledge base for understanding the utilityrsquos earnings And annual reconciliation of the util-ityrsquos actual revenues versus authorized revenues provides consumers with a tool to reign in excess revenue recovery beyond authorized amounts Third the adjustments that do occur under revenue regulation are manageable and frequently less than the adjustments customers are used to seeing on their bills for fuel or variable generation rates or for the myriad of other surcharges that can be tacked on to a customerrsquos bill such as an infrastructure (smart grid) sur-charge maintenance upgrade fee regulatory asset charge or system benefit charge
As seen in Figure 1 the range of rate impacts cluster around plus or minus two percent but can at times exceed plus or minus five percent The total of surcharges has somewhat exceeded the total of credits
Figure 1
Total Utility Decoupling Adjustment Rate Impacts59
300
250
200
150
100
50
0
Nu
mber
of
Dec
oup
lin
g A
dju
stm
ents
Over -5 -4 to -5 -3 to -4 -2 to -3 -1 to -2 0 to -1 0 to 1 1 to 2 2 to 3 3 to 4 4 to 5 Over 5
Percentage Rate Impacts
SurchargesRefunds
ResidentialAll
Other
Commercial
Total
Decoupling Case Studies Revenue Regulation Implementation in Six States
35
60 Id p 3
61 Schultz T Energy Efficiency at Idaho Power Available at httpwwwenergyidahogovenergyalliancedida_powerpdf
As can be seen with the utilities studied above the larger fluctuations are attributable to adjustment mechanisms that are reconciled more frequently such as monthly as those are less able to smooth out anomalies as an annual adjust-ment would do From a dollar perspective for the roughly 64 percent of adjustments that fall within the plus or minus two-percent range the monthly bill impact is approxi-mately $230 for average electric customers and $140 for average gas customers60
Of the six utilities studied the fluctuations in adjustment have for the most part stayed within the one- to three-per-cent range as shown below
bull PGampE from 2005 to 2012 has had annual revenue regulation adjustments ranging from minus143 percent to 415 percent with an average adjustment of 197 percent
bull For IPC the adjustments are separated between residential and commercial customers For residential customers the annual adjustments from 2007 through 2011 ranged from 077 percent to 258 percent for an average of 162 percent As for the commercial customers the annual adjustments for that same period were higher ranging from 104 percent to 424 percent with an average adjustment of 252 percent
bull BGE has monthly adjustments that ranged from minus1853 percent to 3013 percent with an average of 057 percent for residential customers from March 2008 through August 2012 For General Service Customers the monthly adjustment ranged from minus2264 percent to 2462 percent The average adjustment was 1308 percent
bull For WPS the annual adjustments from 2009 through 2011 ranged from minus145 percent to 378 percent for residential and small commercial and from minus314 percent to 899 percent for commercial Note that because of a $14 million per year cap some of these percentages were carried over The average annual adjustment for residential and small commercial and for commercial was 163 percent and 215 percent respectively with carry-overs to subsequent years
bull For Massachusetts Electric and Nantucket Electric both of which operate under National Grid the annual revenue regulation adjustment for all for 2011 and 2012 was minus0105 percent and 0315 percent for an average revenue regulation adjustment over the two years of 0105 percent
bull HECO like National Grid has one annual revenue
regulation mechanism for its customers which resulted in adjustments in 2011 and 2012 of 063 percent and 107 percent respectively for an average adjustment of 085 percent
As can be gleaned from the above information the range of average adjustments for small use customers was a low of 0105 percent for National Grid to a high of 197 percent for PGampE For larger use customers the range was a low of 0105 percent for National Grid to a high of 252 percent for IPC This demonstrates that on average for these utilities with well-developed and diversely designed revenue regula-tion proposals their adjustments on average stayed at or below approximately 25 percent
One of the metrics for determining if a revenue regula-tion program is working successfully that was discussed above was the impact on rates of a revenue regulation mechanism As can be seen by the analysis of the adjust-ment levels for each of the utilities they are within a rea-sonable range
Complementary Policies Although a revenue regulation mechanism does not need
to be accompanied by other policies energy efficiency is frequently at the root of the reason revenue regulation was proposed in the first place The states examined in this pa-per have various obligations for energy efficiency achieve-ment placed upon their utilities Only Idaho does not have an Energy Efficiency Resource Standard but energy efficiency objectives are developed through an integrated resource plan process Energy efficiency spending at IPC has increased dramatically in recent years61
In recognition of the fact that revenue regulation only removes the disincentive to pursue energy efficiency several states have instituted some form of incentives to reward the desired outcome This mechanism can not only incentivize management to aggressively pursue energy efficiency but also make shareholders supportive in the face of lost invest-ment opportunity
Rate design can also play an important part in assist-ing the utility in achieving favorable energy efficiency outcomes Inclining block rates penalize inefficient use of electricity and shorten payback times from the customer perspective Because efficiency reduces consumption at
Decoupling Case Studies Revenue Regulation Implementation in Six States
36
62 Optional rate designs for PGampE include TOU and Peak Time Pricing
63 IPC also has an optional TOU rate design
64 Optional rate designs for this utility include TOU Critical Peak Pricing and Contract
65 National Grid also offers optional TOU and flat rate designs
66 HECO also offers optional TOU and flat rate designs
67 See eg Alexander B (1996 April) How to construct a service quality index in performance-based ratemaking Electricity Policy
the tail block rate the value of kWh savings is greater than with flat rates On the other side of the spectrum declining block rates which have a reduced rate in the tail block do little to encourage conservation In fact they operate more like a discounted bulk rate by reducing the average cost of a kWh in a customerrsquos bill for the more kWh used
Performance incentives or other ways to avoid destruc-tive cost-cutting in the name of creating margins that reduce service or reliability or lessen customer value have been implemented only in Massachusetts of the six utilities illustrated here Several other states have implemented vari-ous schemes in reaction to perceived deficiencies in utility service67 Performance incentives are not unique to rev-enue regulation Commissions wishing to implement such a scheme can find many models of incentive reward and penalty mechanisms developed for other purposes
Taken together a suite of policy and program features can create an atmosphere that is conducive to achievement of energy efficiency goals within the utility and for the customers By appropriate application of these techniques regulators working with utilities and stakeholders can remove barriers and create an opportunity for energy ef-ficiency to be fully integrated into the utility supply option portfolio
Energy Efficiency OutcomesAlthough revenue regulation itself does not create an
incentive for a utility to implement energy efficiency it does address the issue of lost revenues associated with energy
Table 12
Complementary Policies for Energy Efficiency
Pacific Gas amp Electric62
Idaho Power Company63
Baltimore Gas amp Electric
Wisconsin Public Service Corporation64
National Grid65
Hawaiian Electric Company66
Energy Efficiency Requirement
1 annually
IRP
10 by 2015
075 annually
24 annually
Energy efficiency can satisfy portion of RPS
Default Residential Rate Design
Inclining block
Inclining block
TOU seasonal
Flat
Inclining block
Inclining block
Incentive Structure
Risk reward incentive mechanism
No
No
No
5 of program costs
Third-party administrator paid for contract performance
Performance Incentives
Reliability reporting only
None
Under consideration
Reliability reporting only
Service quality reward and penalty
Under consideration
efficiency and DG programs Revenue regulation should be combined with other mechanisms that require or incentiv-ize the implementation of energy efficiency by the utility or a third party The level of energy efficiency achieved can be one measure of the success of a revenue regulation mechanism as implemented in a larger program designed to achieve energy efficiency Table 13 shows the incremental annual energy efficiency savings reported by each utility with the shaded box indicating the year that the utilityrsquos revenue regulation mechanism was implemented National Grid had achieved a high level of energy efficiency savings in the years before it implemented revenue regulation
This paper has not evaluated DG outcomes to correlate with revenue regulation as it is not perceived that states and utilities have made that connection expressly in histori-cal mechanisms However it is expected that this connec-
Decoupling Case Studies Revenue Regulation Implementation in Six States
37
68 EIA Form EIA-861 data files Available at httpwwweiagovelectricitydataeia861
69 PGampE began revenue regulation in 1974 and it was later suspended and recommenced in 2001
70 WPS savings are represented by the statewide program savings from the Focus on Energy program WPS provided additional funds to Focus on Energy starting in CY10 through their territory-wide program activities
71 In 2009 Hawaii Energy a ratepayer-funded statewide energy efficiency provider began delivering services Savings reported after 2009 represent savings achieved through the programs of Hawaii Energy
Table 13
Annual Incremental Energy Efficiency Savings as Percentage of Retail Sales68
Highlighted cells are the year that utility started decoupling
Pacific Gas amp Electric69
Idaho Power Company
Baltimore Gas amp Electric
Wisconsin Public Service Corporation70
National Grid
Hawaiian Electric Company71
2004
11
01
00
03
11
00
2005
16
03
00
03
09
05
2006
10
05
00
03
12
05
2010
19
13
17
09
136
12
tion will be made in future mechanisms and furthermore it is anticipated that follow on work to this paper will want to study that connection between revenue regulation and DG performance
Conclusions
An increasing number of states are looking to increase the rate of energy efficiency investments for their long-run cost and risk advantages The benefits of energy efficiency include not only its ability to reduce system costs across the distribution transmission and generation functions but also the opportunity for customers to reduce their individ-ual energy costs for their own electric bills Nevertheless it is counterintuitive to encourage or order a utility to sell less of its product In order to encourage the proliferation of en-ergy efficiency programs as a solution that can contribute to this nationrsquos energy needs this tension between the goals of society versus the goals of the utility needs to be addressed Revenue regulation can be such a solution by removing the link between sales and revenues
There are many ways to implement revenue regulation and multiple decision points that regulators must consider in designing a revenue regulation mechanism This paper focused on six utilities each of which implemented revenue regulation in different ways in accordance with the objectives of that state Different decision points discussed include
bull Should revenue regulation apply to all functions (generation transmission and distribution) which sometimes depends on if the utility is regulated or restructured
bull Should revenue regulation apply to all customer classes
bull Should there be symmetry such that a reconciliation adjustment occurs for both over- and under-recoveries of the revenue requirements
bull Should recovery of indicated surcharges be conditioned on acceptable performance on customer service quality or energy efficiency goals
bull Should there be an attrition adjustment to account for other expenses or should the revenue regulation adjustment be limited to reconciling existing revenue requirements
bull Should there be an inflation adjustmentbull To calculate the revenue requirements should the
current or accrual method be usedbull Should the adjustments be made in rate cases or
through a riderbull How frequently should adjustments be made
monthly annually or some other time periodbull Depending on the period of time between true up and
recovery should there be carrying charges and if so how should they be calculated
2007
21
06
00
03
09
04
2008
35
10
05
09
05
05
2009
20
11
06
10
11
11
Decoupling Case Studies Revenue Regulation Implementation in Six States
38
72 Avista Utilities (2009) Washington Utilities and Transportation Commission Docket UE-090134
bull Should there be a requirement authorizing the frequency of rate case
bull Should there be an annual cap on the amount of the adjustment and if so should there be an opportunity to carry over any additional amounts and for how many years
bull Should there be an adjustment to the cost of capital to reflect the reduced risk
Other considerations for regulators whether or not they implement revenue regulation but certainly as part of a comprehensive package are other measures that can be put in place to encourage consumers and utilities alike to actively participate in energy efficiency For example an inclining block rate structure by virtue of its incentive to consume less pairs well with an energy efficiency program helps drive consumers to participate in efficiency programs and accelerates the payback of an energy efficiency investment By the same token an incentive payment to the utility helps provide its management with a good reason to excel and exceed targets for energy efficiency programs
A key point illustrated by the list of considerations above is that there is not just one static way to design and implement revenue regulation but rather there are a variety of options for doing so In this study a diverse group of utilities were reviewed The differences among the utilities included geographic diversity vertically integrated and restructured utilities different levels of energy efficiency in place and certainly differences in how the revenue regulation mechanisms were implemented No two utilities were alike and no two utilities had the same revenue regulation mechanism The key is that revenue regulation should eliminate the throughput incentive but the means for accomplishing this goal can vary and be tailored to each jurisdiction and each utility and still be successful
There are several considerations in the design of a revenue regulation mechanism that can help ensure its successful adoption To begin revenue regulation should be granted to utilities only as a precondition to implementing comprehensive energy efficiency andor DG policies Unless accompanied by a commitment to engage in providing least-cost resource options that could impact sales there is not really any good policy reason for its adoption All of the utilities studied are actively engaging in energy efficiency Furthermore as a matter of fairness the revenue regulation mechanism should be symmetrical so that any revenues above those authorized are refunded back to consumers As Figure 1 demonstrates although there are more surcharges to customers there is nevertheless a healthy amount of
credits back to consumers This is the bargain Barring imprudence or other unforeseen circumstances the utility receives its authorized revenue requirements and nothing more or less under a simple revenue regulation mechanism
Rate design plays an important role in the effectiveness of energy efficiency in concert with revenue regulation A low customer charge is preferable so that the customer can benefit from real bill reductions tied to reduced volumetric consumption Reductions in consumption not only reduce bills but also positively impact the payback period for investments in energy efficient appliances Declining block rates in which the tail block rate is lower than the first tier also do not encourage conservation Inclining block rates that reward low usage in the first block with a lower rate send the better price signals None of the six utilities studied had declining block residential rates They were inclining flat and time-varying
The revenue adjustment mechanism is also a critical decision point in terms of whether a revenue per customer mechanism is adopted that accounts for only the current revenue requirements or whether latitude is given to include an inflation adjustment or other cost increases in the revenue adjustment mechanism Three of the utilities studied adopted this approach whereas another two used a hybrid approach Finally to reduce volatility five of the six utilities opted for annual rather than monthly adjustments thereby creating a level of rate stability that customers in general prefer
Once the goals for revenue regulation are set by the regulators the next step is to design programs that will implement that goal For energy efficiency to be as successful as possible regulators may want to adopt a complement of other policies to accompany revenue regulation These can include rate designs that reward reduced use and conservation as well as incentive payments to utilities that reward them for meeting or exceeding targets Of the six utilities studied three have adopted some form of incentive One simple approach that was used in Washington was to link recovery of any surcharges under the revenue regulation mechanism to achievement of energy efficiency targets72
For the utilities examined above that have implemented revenue regulation the evidence demonstrates that revenue regulation as a strategy and a mechanism to enable
Decoupling Case Studies Revenue Regulation Implementation in Six States
39
energy efficiency has been working well The fact that each revenue regulation mechanism varies from the next demonstrates that there are many different paths that can be followed in implementing revenue regulation based on the needs of the utility and its stakeholders in a particular
region This study demonstrates that revenue regulation does work and provides examples of how it can be implemented each one different and unique because of the number of decision points to be considered in designing a revenue regulation mechanism
Decoupling Case Studies Revenue Regulation Implementation in Six States
40
Appendix
Historic Rate Adjustments
Table 14
PGampE Revenue Regulation Rate Adjustments 1983 to 199373
Table 15
PGampE Revenue Regulation Adjustments 2005 to 201274
Table 16
IPC Revenue Regulation Adjustments76
Idaho Power Company
1983 23
1984 (34)
1985 (48)
1986 19
1987 21
1988 50
1989 (43)
1990 (54)
1991 39
1992 34
1993 00
2005 8925 minus12773 minus143
2006 9933 2246 226
2007 10409 21727 209
2008 10261 4032 039
2009 11169 10355 093
2010 11224 46556 415
2011 10306 38390 373
2012 11032 40304 365
2007 Residential minus00457 590 minus077
Commercial minus00457 428 minus107
2008 Residential 00529 670 090
Commercial 00529 510 104
2009 Residential 01220 770 158
Commercial 01535 603 255
2010 Residential 01800 785 229
Commercial 02273 613 371
2011 Residential 02028 785 258
Commercial 02597 613 424
Revenue Regulation Adjustment as of
Total Rates
Delivery Revenue
Requirement ($ millions)
Adjustment Rate
Revenue Regulation Adjustment($ millions)
Retail Rate
of Delivery Revenue
Revenue Regulation Adjustment
Year
Year
73 Lesh P (2009 June 30) Rate impacts and key design elements of gas and electric utility decoupling
74 Morgan P (2012 November) A decade of decoupling for US energy utilities rate impacts designs and observations
75 Morgan P (2012 November) A decade of decoupling for US energy utilities rate impacts designs and observations
76 All numbers provided by the utility
Decoupling Case Studies Revenue Regulation Implementation in Six States
41
77 Idaho Power Company Case No IPC-E-11-19- fixed cost adjustment permanent mechanism Available at httpwwwpucidahogovinternetcaseselecIPCIPCE1119company20120928COMPLIANCE20FILINGPDF
Figure 2
IPC Revenue Regulation Adjustments77
Residential FCA Balance and Use per Customer
$10000000
$8000000
$6000000
$4000000
$2000000
$0
-$2000000
-$4000000
-$6000000
1080
1070
1060
1050
1040
1030
1020
1010
1000Res
idu
al A
uth
oriz
ed F
CA
Am
oun
t
Residual Authorized FCA Amount ($)
Monthly Use Per Customer (kWh)
kW
h U
sed
2006 2007 2008 2009 2010 2011
78 Morgan P (2012 November) A decade of decoupling for US energy utilities rate impacts designs and observations
Decoupling Case Studies Revenue Regulation Implementation in Six States
42
Table 17a
Baltimore Gas and ElectricBGE Monthly Revenue Regulation Adjustments 2008 to 201278
Table 17b
Baltimore Gas and ElectricBGE Monthly Revenue Regulation Adjustments 2008 to 201278
March Residential 000172 01477 1165General Service 000230 01526 1507
April Residential 000016 01477 0108General Service 000146 01526 0957
May Residential 000066 01477 0447General Service 000230 01526 1507
June Residential minus000066 01477 minus0447General Service 000230 01526 1507
July Residential 000158 01477 1070General Service 000230 01526 1507
August Residential minus000040 01477 minus0271General Service 000214 01526 1402
September Residential 000237 01477 1605General Service 000230 01526 1507
October Residential 000237 01477 1605General Service 000143 01526 0937
November Residential 000237 01477 1605General Service 000140 01526 0917
December Residential 000445 01477 3013General Service 000230 01526 1507
January Residential 000035 01579 0222General Service minus000073 01346 minus0542
February Residential 000025 01579 0158General Service 000230 01346 1709
March Residential minus000237 01579 minus1501General Service 000230 01346 1709
April Residential minus000237 01579 minus1501General Service 000230 01346 1709
May Residential 000234 01579 1482General Service 000132 01346 0981
June Residential 000237 01579 1501General Service 000230 01346 1709
July Residential 000237 01579 1501General Service 000230 01346 1709
August Residential 000237 01579 1501General Service 000190 01346 1412
September Residential 000237 01579 1501General Service 000230 01346 1709
October Residential 000237 01579 1501General Service 000124 01346 0921
November Residential 000237 01579 1501General Service 000230 01346 1709
December Residential 000156 01579 0988General Service 000204 01346 1516
Adjustment $kWh
Adjustment $kWh2008 2009
Retail Rate
$kWh
Retail Rate
$kWhAdjustment
Adjustment
Decoupling Case Studies Revenue Regulation Implementation in Six States
43
Table 17c
Baltimore Gas and ElectricBGE Monthly Revenue Regulation Adjustments 2008 to 201278
Table 17d
Baltimore Gas and ElectricBGE Monthly Revenue Regulation Adjustments 2008 to 201278
January Residential 000203 01465 1386General Service 000230 01261 1824
February Residential minus000142 01465 minus0969General Service 000230 01261 1824
March Residential minus000237 01465 minus1618General Service 000230 01261 1824
April Residential minus000237 01465 minus1618General Service 000230 01261 1824
May Residential 000192 01465 1311General Service 000230 01261 1824
June Residential 000191 01465 1304General Service 000230 01261 1824
July Residential 000095 01465 0648General Service 000230 01261 1824
August Residential minus000176 01465 minus1201General Service 000224 01261 1776
September Residential minus000237 01465 minus1618General Service 000116 01261 0920
October Residential minus000237 01465 minus1618General Service 000081 01261 0642
November Residential minus000237 01465 minus1618General Service 000098 01261 0777
December Residential minus000079 01465 minus0539General Service 000229 01261 1816
January Residential minus000130 01365 minus0952General Service 000230 01156 1990
February Residential minus000253 01365 minus1853General Service minus000020 01156 minus0173
March Residential minus000018 01365 minus0132General Service minus000063 01156 minus0545
April Residential 000110 01365 0806General Service minus000262 01156 minus2266
May Residential 000010 01365 0073General Service minus000160 01156 minus1384
June Residential 000226 01365 1656General Service 000042 01156 0363
July Residential 000253 01365 1853General Service 000209 01156 1808
August Residential minus000007 01365 minus0051General Service minus000157 01156 minus1358
September Residential minus000253 01365 minus1853General Service minus000177 01156 minus1531
October Residential 000228 01365 1670General Service 000262 01156 2266
November Residential minus000059 01365 minus0432General Service 000262 01156 2266
December Residential 000071 01365 0520General Service 000262 01156 2266
Adjustment $kWh
Adjustment $kWh2010 2011
Retail Rate
$kWh
Retail Rate
$kWhAdjustment
Adjustment
Decoupling Case Studies Revenue Regulation Implementation in Six States
44
Table 17e
Baltimore Gas and ElectricBGE Monthly Revenue Regulation Adjustments 2008 to 201278
January Residential 000253 01291 1960General Service 000262 01064 2462
February Residential 000253 01291 1960General Service 000262 01064 2462
March Residential 000253 01291 1960General Service 000262 01064 2462
April Residential 000253 01291 1960General Service 000262 01064 2462
May Residential 000253 01291 1960General Service 000262 01064 2462
June Residential 000253 01291 1960General Service 000262 01064 2462
July Residential 000253 01291 1960General Service 000262 01064 2462
August Residential 000253 01291 1960General Service 000160 01064 1504
Adjustment $kWh2012
Retail Rate
$kWhAdjustment
Decoupling Case Studies Revenue Regulation Implementation in Six States
45
79 Morgan P (2012 November) A decade of decoupling for US energy utilities rate impacts designs and observations
80 Morgan P (2012 November) A decade of decoupling for US energy utilities rate impacts designs and observations
Table 18
Wisconsin Public Service Corporation Revenue Regulation Adjustments 2009 to 201179
2009 ResidentialSmall Commercial 00048705 000168154 01290 378 130Commercial 00084951 000293293 00945 899 310
2010 ResidentialSmall Commercial 00033043 000166936 01291 256 129Commercial 00056630 000286103 09460 060 030
2011 ResidentialSmall Commercial (00018666) $ (000163719) 01288 minus145 minus127Commercial (00032565) $ (000285629) 01037 minus314 minus275
Derived Adjustment
$kWh
Derived Adjustment Capped $
kWh
Retail Rate
$kWh
Revenue Regulation Actual
Revenue Regulation Capped
Table 19
National Grid Revenue Regulation Adjustments 2011-201276
Massachusetts Electric and Nantucket Electric
Table 20
Hawaiian Electric Company
2011 All minus0015 1429 minus0105
2012 All 0044 1396 0315
2011 01995 3149 063
2012 03894 3641 107
Revenue Regulation Adjustment
centkWh
Revenue Regulation Adjustment
centkWhRetail Rate
centkWh
Retail Rate
Revenue Regulation Adjustment
Revenue Regulation
ldquoThe 2011 adjustment took effect June 1 but was reduced to $0 on July 26 2011 when the Commission granted HECO an interim rate increase of $532 million in a 2011 test year general rate case The 2012 Adjustment runs from June 1 2012 through May 31 2013 About 25 of the total relates to the portion of the decoupling mechanism that updates OampM and rate baserdquo (Morgan 2013)
Decoupling Case Studies Revenue Regulation Implementation in Six States
46
Revenue Regulation and Decoupling A Guide to Theory and Applicationhttpwwwraponlineorgdocumentdownloadid902
This guide was prepared to assist anyone who needs to understand both the mechanics of a regulatory tool known as decoupling and the policy issues associated with its use This would include public utility commissioners and staff utility management advocates and others with a stake in the regulated energy system While this guide is somewhat technical at points we have tried to make it accessible to a broad audience to make comprehensible the underlying concepts and the implications of different design choices This guide includes a detailed case study that demonstrates the impacts of decoupling using different pricing structures (rate designs) and usage patterns
Pricing Dorsquos and Donrsquots Designing Retail Rates as if Efficiency Countshttpwwwraponlineorgdocumentdownloadid939
Rate design is a crucial element of an overall regulatory strategy that fosters energy efficiency and sends appropriate signals about efficient system investment and operations Rate design is also fully under the control of state regulators Progressive rate design elements can guide consumers to participate in energy efficiency programs and reduce peak demand yet relatively few utilities and commissions have implemented many of these elements This RAP paper identifies some best practices Because pricing issues tie closely to utility growth incentives we also address revenue decoupling
A Decade of Decoupling for US Energy Utilities Rate Impacts Designs and Observationshttpwwwraponlineorgdocumentdownloadid6356
This report written by Pamela Morgan of Graceful Systems LLC builds on a 2009 report Now covering 25 states including 49 LDCs and 24 electric utilities this report summarizes the decoupling mechanism designs these utilities use and the rate adjustments they have made under those mechanisms In total this report estimates the retail rate impacts of 1244 decoupling mechanism adjustments since 2005
Additional Resources
The Role of Decoupling Where Energy Efficiency is Required by Lawhttpwwwraponlineorgdocumentdownloadid275
This Issuesletter gives an overview of energy efficiency resource standards the need to decouple utility profits from utility sales and explains why decoupling is needed even where a third party administers energy efficiency programs
Revenue Decoupling Standards and Criteria A Report to the Minnesota Public Utilities Commissionhttpwwwraponlineorgdocumentdownloadid850
In 2007 the Minnesota legislature enacted a new statute Section 216B2412 in which it defined an alternative approach to utility regulation decoupling and directed the Public Utilities Commission (PUC) to ldquoestablish criteria and standardsrdquo by which decoupling could be adopted for the statersquos rate-regulated utilitiesTo fulfill its obligation to develop criteria and standards for decoupling the PUC sought the advice of the Regulatory Assistance Project (RAP) This report is the output of that collaboration
Designing Distributed Generation Tariffs Wellhttpwwwraponlineorgdocumentdownloadid6898
Improvements in distributed generation economics increasing consumer preference for clean distributed energy resources and a favorable policy environment in many states have combined to produce significant increases in distributed generation adoption in the United States Regulators are looking for the well-designed tariff that compensates distributed generation adopters fairly for the value they provide to the electric system compensates the utility fairly for the grid services it provides and charges non-participating consumers fairly for the value of the services they receive This paper offers regulatory options for dealing with distributed generation The authors outline current tariffs and ponder what regulators should consider as they weigh the benefits costs and net value to distributed generation adopters non-adopters the utility and society as a whole The paper highlights the importance of deciding upon a valuation methodology so that the presence or absence of cross-subsidies can be determined Finally the paper offers rate design and ratemaking options for regulators to consider and includes recommendations for fairly implementing tariffs and ratemaking treatments to promote the public interest and ensure fair compensation
Decoupling Case Studies Revenue Regulation Implementation in Six States
47
The Regulatory Assistance Project (RAP)trade is a global non-profit team of experts focused on thelong-term economic and environmental sustainability of the power sector We provide technical and policy assistance on regulatory and market policies that promote economic efficiency environmental protection system reliability and the fair allocation of system benefits among consumers We work extensively in the US China the European Union and India Visit our website at wwwraponlineorg to learn more about our work
Rate Design Where Advanced Metering Infrastructure Has Not Been Fully Deployedhttpwwwraponlineorgdocumentdownloadid6516
This paper identifies sound practices in rate design applied around the globe using conventional metering technology Rate design for most residential and small commercial customers (mass market consumers) is most often reflected in a simple monthly access charge and a per-kWh usage rate in one or more blocks and one or more seasons A central theme across the practices highlighted in this paper is that of sending effective pricing signals through the usage-sensitive components of rates in a way that reflects the character of underlying long-run costs associated with production and usage While new technology is enabling innovations in rate design that carry some promise of better capturing opportunities for more responsive load the majority of the worldrsquos electricity usage is expected to remain under conventional pricing at least through the end of the decade and much longer in some areas Experience to date has shown that the traditional approaches to rate design persist well after the enabling technology is in place that leads to change
Time-Varying and Dynamic Rate Designhttpwwwraponlineorgdocumentdownloadid5131
This report discusses important issues in the design and deployment of time-varying rates The term time-varying rates is used in this report as encompassing traditional time-of-use rates (such as time-of-day rates and seasonal rates) as well as newer dynamic pricing rates (such as critical peak pricing and real time pricing) The discussion is primarily focused on residential customers and small commercial customers who are collectively referred to as the mass market The report also summarizes international experience with time-varying rate offerings
50 State Street Suite 3Montpelier Vermont 05602802-223-8199wwwraponlineorg
- Table of Contents
- Introduction
- California Pacific Gas and Electric Company
- Idaho Idaho Power Company
- Maryland Baltimore Gas and Electric
- Wisconsin Wisconsin Public Service Corporation
- Massachusetts National Grid
- Hawaii Hawaiian Electric Company
- Discussion of the Six Utilities Overall
- Conclusions
- Appendix
- Additional Resources
-
Decoupling Case Studies Revenue Regulation Implementation in Six States
18
32 DPU 07-50 (2007)
33 DPU 07-50 (2007) pp 392ndash396
Massachusetts National Grid
The revenue regulation mechanism for National Grid (Massachusetts Electric Company and Nantucket Electric Company together doing business as National Grid) compares authorized
distribution revenue to actual distribution revenue Revenue is compared and adjustments are made separately for each customer class
AuthorityThe Massachusetts Department of Public Utilities (DPU)
adopted revenue regulation as a statewide regulatory policy in 2008 and individual utilities filed revenue regulation tariffs in response In its Investigation Into Rate Structures that will Promote Efficient Deployment of Demand Resources32 the DPU investigated rate structures and revenue recovery mechanisms that may reduce disincentives to the efficient deployment of demand resources in the state and consid-ered how the electric and natural gas distribution compa-niesrsquo existing cost recovery mechanism could be changed to better align the companiesrsquo financial incentives with policy objectives while ensuring that the companies are not finan-cially harmed by the increased use of demand resources The DPU finally concluded that revenue regulation mecha-nisms would eliminate the financial disincentives because they sever the link between the companiesrsquo revenue and reduction in sales The DPU also endorsed a revenue per customer approach but recognized that other factors could result in changes to distribution-related costs and consent-ed to consider company-specific ratemaking proposals that accounted for the impact of capital spending and inflation-ary pressures on the companyrsquos required revenue
Authorized Revenue RequirementThe authorized revenue requirement does not include
costs that are reconciled outside of base distribution rates including energy supply costs for basic service customers transmission costs the energy efficiency system benefits charge and reconciling charge and costs recovered through the residential assistance adjustment factor
Rate of ReturnThe Commission recognized the effects of revenue
regulation on ROE and determined that revenue regulation reduces volatility which reduces risk and a downward ad-justment to ROE was appropriate but did not make its ac-tual ROE adjustment for the revenue regulation mechanism explicit in its order33 The DPU determined that a return on equity equal to 1035 percent was sufficient The testimony from National Grid supporting its proposed ROE presented comparisons of allowed ROE for a set of companies that had revenue regulation or another risk management mecha-nism in place to account for an implied reduced risk profile in developing that proposal
Revenue Adjustment MechanismEach year the authorized revenue requirement is ad-
justed to account for capital expenditures in the previous year The CapEx Adjustment applies to capital expenditures incurred by National Grid for distribution system invest-ments in the previous year net of the amount recovered through depreciation expense in base rates This accounts for the material difference in expected capital expenditures compared with prior years In this way the CapEx Adjust-ment in the National Grid revenue regulation mechanism is a special case of a ldquoK Factorrdquo which characterizes an expected change in costs in the future and accounts for those changes when they occur Each year the Company files with the Department documentation in support of the capital expenditures it has incurred since the previous review The Department reviews the filings to determine the prudence of the incremental expenditures and whether the expenditures are used and useful National Grid then allocates approved expenditures to rate classes based on the cost of service study For each class the Company determines the adjustment allocated to the rate class then divides this sum by the forecasted kWh sales for the follow-
Decoupling Case Studies Revenue Regulation Implementation in Six States
19
34 DPU 07-50 (2007) p 87
35 ACEEE Massachusetts Available at httpaceeeorgsectorstate-policymassachusetts
36 Personal communication with National Grid
ing year to determine the per-kWh adjustment In order to provide a balance between providing the
Company with sufficient funds to ensure the safety and reliability of the distribution system and protecting ratepay-ers against the incentive the Company has to overinvest in infrastructure the mechanism limits the level of annual capital expenditures that is recoverable through the mecha-nism To arrive at the amount the Department set a limit of $170 million per year which is equal to the approximate three-year average of the Companyrsquos capital spending in previous years Should the Companyrsquos capital expenditures exceed this limit it may seek to include the investment in the rate base during the next base rate proceeding
The Company submits its CapEx filing no later than July 1 of each year On November 1 of each year the Company submits all other information in support of its proposed adjustment factors The factors will take effect on March 1 of each year
The authorized revenue is also adjusted to include a 50-percent sharing for earnings above the authorized ROE
Reconciling Actual Revenue With Authorized Revenue
Each year National Grid calculates on a rate class-spe-cific basis the difference between the actual distribution revenue billed to customers through distribution rates and the annual target revenue For each rate class the difference between the actual billed distribution revenue and the an-nual target revenue is summed to determine the Company-wide reconciliation amount That amount is divided by the Company-wide kWh forecasted for the upcoming year to arrive at a cent-per-kWh reconciliation charge or credit To determine the final adjustment for each rate class the Company-wide reconciliation adjustment is added to the rate class-specific adjustment resulting from the target rev-enue adjustment mechanisms
The adjustment to the authorized revenue in any year is capped at three percent of total revenues34 Any excess can be carried forward to a future year with carrying charges equal to the customer deposit rate
National Grid must report to the DPU if the difference between the year-to-date billed revenue and year-to-date annual target revenue equals or exceeds ten percent of the target revenue and the Company believes that the difference will fall outside of the ten-percent threshold in the coming months In this case interim revenue regulation adjust-ments can be made In order to avoid an interim adjust-ment too close to the scheduled annual rate adjustment
National Grid must notify the Department of variances exceeding ten percent of annual target revenue by August 31 of each year
Complementary Policies Massachusetts requires that electric utilities procure
all cost-effective energy efficiency before more expensive supply-side resources This requirement was translated into annual savings requirements for electric utilities starting from 1 percent of sales in 2009 to 14 percent in 2010 2 percent in 2011 and 24 percent in 2012 and potentially increased savings in subsequent years Utilities can earn approximately five percent of program costs for meeting or exceeding savings targets35
National Grid offers inclining block rates as the default residential rate but there is an optional TOU rate with peak and off-peak tiers also available to residential customers Small and large industrial and commercial customers can take service under flat rates inclining block rates or TOU rates
National Grid operates under a penalty and reward sys-tem for service quality established in Docket DTE 99-84 The impetus behind the DPUrsquos original establishment of the Service Quality Guidelines was to prevent Massachusetts utilities from allowing service quality to deteriorate under a new regulatory regime
Energy Efficiency OutcomesBefore Massachusetts Electric implemented revenue
regulation in 2009 it reported consistently high levels of incremental energy efficiency savings approximately 09 percent of retail load In 2010 the company reported 136 percent savings and 159 percent in 2010 and 2011 respectively36
ResourcesMassachusetts Department of Public UtilitiesDocket 09-39 Petition of Massachusetts Electric Company
(November 30 2009)
Decoupling Case Studies Revenue Regulation Implementation in Six States
20
37 Energy Agreement Among the State of Hawaii Division of Consumer Advocacy of the Department of Commerce amp Consumer Affairs and Hawaiian Electric Companies Available at httpwwwhecocomvcmcontentStaticFilespdfHCEIpdf
38 The HECO Companies described as follows in their Reply SOP in the Schedule A decoupling proceedings ldquothe
Hawaii Hawaiian Electric Company
Hawaiian Electric Company (HECO) uses a revenue regulation mechanism that compares actual revenue to target revenue in each year The target revenue is based on the authorized
revenue for the last test year adjusted for operation and maintenance (OampM) increases and rate base changes
HECO is a subsidiary of Hawaiian Electric Industries which also operates Maui Electric Company (MECO) and Hawaiian Electric Light Company these subsidiaries service the islands of Maui and Hawaii County while HECO serves Oahu (Honolulu)
Authority In 2008 the Governor of Hawaii the Division of Con-
sumer Advocacy and HECO entered into an agreement as a result of the Hawaii Clean Energy Initiative37 The agreement is intended to move Hawaii away from its dependence on imported fossil fuels for electricity and ground transporta-tion and toward locally produced renewable energy and energy efficiency In the agreement the State the Consumer Advocate and HECO committed to among other things a transition away from a model that encourages increased elec-tricity usage and to a model that implements revenue regula-tion decoupling to encourage the development of renewable energy by HECO The Commission opened Docket 2008-0274 in order to examine the features of a revenue regula-tion mechanism The Opening Order directed HECO and the Consumer Advocate to file a joint proposal on revenue regulation within 60 days This joint proposal was modeled closely after the California mechanism described earlier for PGampE with a rate-case determined revenue requirement plus annual attrition adjustments plus separate mechanisms
to recover power supply and energy efficiency costsThe Hawaii Public Utilities Commission approved
revenue regulation for HECO in August 2010 based on an investigation into the appropriateness of revenue regula-tion and its design The revenue regulation mechanism took effect on March 1 2011 This replaced a previous lost revenue adjustment mechanism
Authorized Revenue RequirementThe Commission establishes the Authorized Base Rev-
enues through a general rate case based on traditional cost-of-service ratemaking principles The Authorized Base Revenue is the annual amount of revenues required for the utility to recover its estimated OampM depreciation amorti-zation and tax expenses for the period
The Target Revenue is equal to the base revenue require-ment less any revenue being separately tracked or recov-ered through any other surcharge or tracking mechanism including revenue for fuel and purchased power expenses
The revenue regulation order also requires staggered triennial rate cases for each of the Hawaiian Electric Indus-tries Companies to determine approved baseline Revenue Adjustment Mechanism (RAM) inputs
Rate of ReturnThe Commission made no explicit adjustment to ROE
owing to the revenue regulation mechanism but noted that the allowed ROE of ten percent reflects the approval of revenue regulation and other cost-recovery mechanisms that will lower HECOrsquos business risk38 Most recently the Hawaiian Public Utilities Commission approved a 90-per-cent ROE for MECO reflecting both a lower baseline cost
Commission effectively reduced the Companiesrsquo return on common equity by 50 basis points to ldquofairly compensate ratepayersrdquo for what it perceived as the ldquorisk-reducingrdquo effects of the RBA and RAM mechanisms the Renewable Energy Infrastructure Program (lsquoREIPrdquo) Surcharge and the Purchased Power Adjustment Clause (ldquoPPACrdquo)rdquo Available at httpdmspuchawaiigovdmsDocumentViewerpid=A1001001A10L29B55326B47993
Decoupling Case Studies Revenue Regulation Implementation in Six States
21
39 Hawaii PUC Decision and Order No 31288 (2013 May 31) pp 97ndash112
40 Hawaii PUC Decision and Order No 31289 (2013 May 31)
41 Hawaii PUC Decision and Order No 31908 (2014 Feb 1)
42 February 7 2014 order on schedule A issues Available at httpdmspuchawaiigovdmsDocumentViewerpid=A1001001A14B10B22326F07922 p 42ndash47
of capital and a penalty of 050 percent associated with inadequate performance bringing renewable energy into the MECO system39 A companion Order also established new guidance on future revenue regulation mechanisms40
Revenue Adjustment MechanismThe RAM is designed to replace the need for annual rate
cases by adjusting Authorized Base Revenue levels to reflect estimated changes in the utilityrsquos cost of service The RAM is intended to via formula-driven estimates and escalators compensate the HECO Companies for changes in util-ity costs and infrastructure investment between rate cases and reduce the frequency of rate cases The RAM Period is the calendar year containing the Annual Evaluation Date (March 31 the date of the annual RAM filing) The RAM adjusts the revenue requirement according to changes in four main categories of expenses
bull Base expenses which are changes in designated OampM expenses
bull Rate base the return on incremental investment in designated rate base components41
bull The incremental depreciation and amortization expenses and
bull Exogenous tax changes changes in costs owing to significant changes in tax laws or tax regulations
Base expenses are segregated between labor and non-labor amounts The labor component is adjusted annually by the Labor Cost Escalation Rate reduced by the Labor Productiv-ity Offset (fixed at 076 percent) The non-labor component uses the Non-labor Escalation Rate to annually adjust those costs Tracked OampM expenses for fuel purchased power pension and post-employment benefits integrated resource planning DSM and other rate adjustment provisions are not adjusted in the RAM because any changes in these costs are accounted for in other cost-tracking mechanisms
The Rate Base equals the average net investment esti-mated for the RAM Period The average rate base is the rate base for the rate case test year with adjustments for changes in only four components of rate base (1) average plant-in-service (2) average Accumulated Depreciation (3) average accumulated contributions in aid of construc-tion and (4) average accumulated deferred income taxes All other components of the rate base remain the same as in the preceding rate case test year The average plant-in-service is equal to the average of the actual plant-in-service at the end of the year prior to the RAM period the Evalu-ation Year and the same year-end balance plus estimated plant additions for the RAM period Plant additions include
Baseline Capital Project plant additions and Major Capital Projects plant additions estimated to be in service by Sep-tember 30 of the RAM period
The RAM also includes an Earnings Sharing Revenue Credit mechanism in order to protect against excessive over-all utility revenue levels The RAM will escalate and update the Companyrsquos approved base revenue requirement reduced by earnings sharing credits and major project revenue credits to customers Based on the Companyrsquos achieved return on common equity for the Evaluation Year the mechanism cred-its the RBAs according to the following chart
ROE at or below the authorized ROE
First 100 basis points (1) over authorized ROE
Next 200 basis points (2) over authorized ROE
ROE exceeding 300 basis points (3) over
authorized ROE
Retained entirely by shareholders no customer credits
25 share credit to customers
50 share credit to customers
90 share credit to customers
Finally the RAM includes additional consumer protectionsbull A provision for Major Capital Projects Creditsbull A provision for Baseline Capital Projects Creditsbull Notification is provided to all affected customers of
the RAM filing in newspapers and billsbull Evaluation procedures for filing examination and any
exceptions to annual revenue regulation filingsbull Continued ability of HECO or the Consumer
Advocate to request formal rate proceedings to replace and terminate RAM at any time and
bull Formal review of revenue regulation as a part of the next round of rate case proceedings
A recent order42 added two additional consumer protections
bull A limitation that only 90 percent of the current
Decoupling Case Studies Revenue Regulation Implementation in Six States
22
43 ACEEE Hawaii Available at httpaceeeorgsectorstate-policyhawaii
RAM Period Rate Base that exceeds the Rate Base Adjustment Mechanism from the prior year can be included in the Decoupling Mechanism for baseline utility plant projects which unlike major capital projects are not subject to prior Commission review and approval and
bull A requirement to post a number of metrics online for customer review although not at this point tied to performance
This order also examined four issues with respect to the application of the RAM The Commission determined that the short-term debt rate as reflected in the most recent rate case should be used to adjust over- and under-collections The Commission also resolved its concern that without a sustainable business plan there exists no strategic frame-work under which to evaluate capital expenditure pro-grams The Commission required the parties in the Docket to further explore capital expenditure issues in conjunction with other risk-sharing mechanisms discussed elsewhere in the order The commission ordered a further evaluation of a proposed risk-sharing mechanism within the RBA Further-more the Commission ordered the parties to work together to establish appropriate metrics which the utility would report on its website
Once the total RAM Revenue Adjustment is calculated it is applied through a uniform adjustment to the per-kWh energy charge for all customer classes
Reconciling Actual Revenue with Authorized Revenue
RBAs record the monthly differences between target revenues and the adjusted recorded electric sales revenues The RBA also applies monthly interest equal to the annual rate for short-term debt from the cost of capital in each HECO Companyrsquos last base rate case to the simple average of the beginning and ending balances each month in the RBA In effect the RBA applies one-twelfth of the rate each month Finally the RBA provides for collection or return of the calendar year-end balances in the RBA and recovery of the RAM Revenue Adjustment over the subsequent May 1 through April 30 period The target revenue is the most recent Authorized Base Revenue or the re-determined Authorized Base Revenue calculated under the RAM
On or before March 28 the Company must file with the Commission a statement of the previous year-end balance in each RBA sub-account and the Authorized Base Revenue level for the current calendar year with supporting calculations An amortization of the year-end balance in the
RBA sub-accounts and the RAM Revenue Adjustment are recovered through the per-kWh RBA rate adjustments The rate adjustment occurs from May 1 of the current calendar year to April 30 of the next year
Complementary PoliciesCurrently electric utilities in Hawaii may use energy
efficiency to meet a portion of their Renewable Portfolio Standard requirements Starting in 2015 electricity savings from energy efficiency will be applied to the Statersquos Energy Efficiency Portfolio Standard which sets a target equivalent to 30-percent forecast sales by 2030 This goal is translated into a target of 14 percent annual savings HECO trans-ferred administration of all of its energy efficiency programs to a third party administrator in 2009 The administrator is compensated for satisfactory performance43
Because of its heavy dependence on petroleum as a generation fuel electricity prices in Hawaii are very high solar and wind are typically lower-cost resources for these systems HECOrsquos default residential rates are inclining block rates with a $900month customer charge and a three-block inclining rate design of $034kWh to $037kWh Residential customers can elect to take service under a TOU rate with off-peak mid-peak and priority-peak tiers Gen-eral service and large power service customers take service under a flat rate unless they opt to take service under a TOU
Hawaii is developing reliability standards in part as a response to deteriorating service quality as a result of distributed and customer-owned generation (see text box) In an effort to make electricity reliability and interconnection standards as transparent as possible the Reliability Standards Working Group was formed in the Feed-In Tariff docket and continues its work in Docket No 2011-0206 to find solutions to integrating high penetrations of renewable energy consistent with reliability and power quality standards
Energy Efficiency OutcomesHECO implemented revenue regulation in 2011 Since
2003 HECO has reported incremental energy efficiency savings between 0 and 05 percent of retail load with 131 percent savings reported in 2011 by Hawaii Energy the
Decoupling Case Studies Revenue Regulation Implementation in Six States
23
44 Hawaii PUC Decision and Order No 31288 Maui Electric Company Limited Docket No 2011-0092 (2013 May 31) Appendix C p 2
Statersquos ratepayer funded efficiency program administrator The company has not yet reported its savings for 201245 In addition HECO has seen more than a sixfold increase in renewable installations under its net metering and feed-in tariff policies since the inception of the revenue regulation plan
Revenue regulation represents a regulatory framework that removes the financial disincentive for utilities to pursue clean
energy strategies It doesnrsquot in and of itself align the utility business model with those utility policies and practices that address customer expectations In fact some commissions are concerned that it might create a dynamic in which the utility assured of its revenue needs becomes complacent and lacks motivation to innovate and develop strategies that may be more in line with the public interest
In a recent order (Docket 2011-0092 May 31 2013) the Hawaiian Public Utilities Commission addressed this big picture issue in a rate order for Maui Electric The Commission called out the management as lacking a long-term vision for creating customer value and expressed concern that ldquothe HECO Companiesrsquo over-reliance upon a link between the [Decoupling]
Agreement and utility financial health obfuscates utility performance and ultimately customer service and satisfactionrdquo44 The implementation of clean energy policies is not a singular goal but rather a policy that must be part of a larger effort to create customer value
The Commission laid out a hard path and a soft path to achieve the results they desire for consumers The hard path involves a closer examination of utility investments operations and expenditures The soft path is opened through the actions of management to create and execute a vision for the utility of the future The Commission remains committed to regulatory innovations that are in the public interest and will work with the utility consumer advocate and other stakeholders to create and implement this vision
The results of this effort will likely produce ideas and outcomes that will have applicability beyond this one utility
ResourcesHawaii Public Utilities CommissionDocket No 2008-0274 Final Decision and Order (August 31 2010)Docket No 2008-0083 Final Decision and Order (December 29 2010)Docket No 2011-0092 Final Decision and Order May 31 2013 including
Decision and Orders Nos 31288 and 31289Docket No 2013-0141 Final Decision and Order (February 1 2014) including
Decision and Order No 31908
45 EIA Form EIA-861 data files Available at httpwwweiagovelectricitydataeia861
Decoupling Case Studies Revenue Regulation Implementation in Six States
24
46 Lazar et al 2011
Discussion of the Six Utilities Overall
Authority The first step in implementing a revenue regulation
mechanism is to understand the authority of the regulating body the Public Utility Commission or PSC It is important for any Commission to clarify its justification for acting on revenue regulation in order to prevent any decisions from being overturned Over the years Utilities Commissions have relied on different justifications for implementing revenue regulation mechanisms Commissions have imple-mented revenue regulation at their own discretion justified by their directive to ensure safe reliable and economic public utility service to citizens to justify changing the regulatory environment In some cases the Commission is unable to engage on narrow issue ratemaking and rates can change only as the result of a full rate case In this case statutes must be amended to enable revenue regulation
In all of the case studies discussed here the Commis-sions first implemented revenue regulation at their own dis-cretion but each followed slightly different paths to do so The CPUC first implemented revenue regulation in 1978 at its discretion In 2001 after a period when mechanisms were suspended the California Legislature required that deviations from projected sales not result in under- or over-collections by utilities and so the CPUC re-implemented revenue regulation according to statutory requirement The Hawaii Public Utilities Commission implemented rev-enue regulation after an agreement between the utility the Governor and other stakeholders called for it In Idaho the Commission established a case in which to investigate rev-enue regulation and held a series of stakeholder workshops before implementing the policy The Massachusetts DPU adopted revenue regulation as a statewide regulatory policy and required individual utilities to file tariffs in response as the result of its general investigation into rate structures that promote demand-side resources The Maryland Com-mission implemented revenue regulation for BGE when the utility requested the mechanism Thus the impetus to develop a revenue regulation mechanism may come from different sources and the Commission may be comfortable
in moving forward under their general supervisory statutes Nevertheless specific statutory language can be helpful to shore up the existing authority
Authorized Revenue Requirement Under the traditional regulatory framework the Com-
mission (or other authority in the case of publicly owned utilities) must determine a utilityrsquos revenue requirement This function does not change under revenue regulation The revenue requirement of a utility is the aggregate of all the operating and other costs incurred to provide service to the public This typically includes operating expenses depreciation and the cost of capital invested including in-terest on debt and a ldquofairrdquo return on equity to investors The (simplistic) formula for determining revenue requirements is as follows
Revenue Requirements = (Rate Base times Rate of Return) + Operating Expenses + Depreciation +Taxes
Traditionally the revenue requirement along with sales is used to determine the rates consumers will pay for elec-tricity46 The rates are also broken down by customer class and intraclass tariffs are created based usually on a cost of service study that determines each customer class and subclass contribution to the utilityrsquos costs The (simplistic) formula for determining the rate per unit is
Rate = Revenue Requirement divide Units Sold
In this way rates are set to allow the utility to exactly recover its revenue requirement when the sales level used to calculate rates is equal to actual sales However it is important to recognize that actual expense and revenue varies with actual sales When actual sales are greater than the sales level used in ratemaking revenue increases and expenses increase by a different amount when actual sales are lower than the ratemaking sales level actual revenue
Decoupling Case Studies Revenue Regulation Implementation in Six States
25
declines and expenses decrease by a different amount Under revenue regulation rates are initially set in the same way but when actual sales differ from the level used to calculate rates the actual revenue level is maintained at the rate case amount as rates are allowed to vary inversely with salesmdashincreased sales lead to decreased rates and vice versa Because the primary expenses that change in the short run as sales levels change are power supply expenses and most regulators allow these to be tracked using a power cost adjustment mechanism revenue regulation mechanisms are generally designed to ensure recovery of the non-power costs (which do not change significantly in the short-run) as sales volumes change
Revenue regulation ensures that actual revenue is equal to the revenue requirement established by the Commission or appropriate authority Although the description above presents an overly simplified view of the revenue require-ment and its use in traditional price regulation and revenue regulation there are many variations on how a Commis-sion can establish a revenue requirement particularly when implementing revenue regulation With revenue regulation as in traditional ratemaking imprudent costs can always be removed from rates and there is no change to the ability of a Commission to impose penalties
Utility Functions to be IncludedFirst the regulator must determine which utility func-
tions will be included in the revenue regulation framework With vertically integrated utilities this usually includes a utilityrsquos regulated generation transmission and distribution units As we discuss below however it is critical to struc-ture power supply recovery mechanisms to avoid providing for double-recovery of certain power supply costs For utili-ties operating in areas of the country that have restructured electricity markets only the regulated distribution busi-ness is decoupled Utilities that also provide gas services
Pacific Gas amp Electric Future test year
Idaho Power Company Historic test year
Baltimore Gas amp Electric Hybrid test year
Wisconsin Public Service Corporation Future test year
National Grid Historic test year
Hawaiian Electric Company Future test year
Table 2
Test Year Used
may have their gas distribution business operating under revenue regulation as well
Test YearOne consideration in establishing the revenue require-
ment is what period of time will be used as a ldquotest periodrdquo or ldquotest yearrdquo The test year is the year on which the Com-mission will base its computations of the utilityrsquos total costs and sales levels A historic test year uses actual data on sales and costs from a past year Whereas a historic test year allows for the use of actual cost data it cannot account for expected variations in sales A future test year requires assumptions to be made about a utilityrsquos sales in a future year This can allow expected changes in sales like those from energy efficiency programs to be included in sales
projections however because regulators are relying on estimates provided by the utility there may be a greater risk for inaccuracy A Commission may also choose to use a test year that includes both past and future periods This may provide a sense of balance between historic and future data Furthermore as the case proceeds the Commission can require the utility to substitute historical data for projected data from the test year
Rate of ReturnAs in any rate case regulators
must determine the appropriate rate of return that a utility can earn on its investments including the cost of debt and the allowed ROE for its shareholders The approved ROE is only used to establish the return on investments that are included in the rate base when determining revenue require-
Pacific Gas amp Electric Electric generation and distribution gas distribution
Idaho Power Company Electric generation and distribution
Baltimore Gas amp Electric Electric distribution gas distribution
Wisconsin Public Service Corporation Electric generation and distribution
National Grid Electric distribution
Hawaiian Electric Company Electric generation and distribution
Table 1
Business Unit Included in the Revenue Regulation Model
Decoupling Case Studies Revenue Regulation Implementation in Six States
26
47 In a rate case the Commission determines an allowed return on equity This is used to set a price (price regulation) or an allowed revenue requirement (revenue regulation) Once set however the actual return earned by the utility is affected by anything that changes either revenue or expenses for example an increase in employee compensation a change in the number of employees or under price regulation a change in sales volumes
48 Lazar et al 2011
ments Although revenue regulation ensures that a utility recovers no more or less than its target revenue revenue regulation does not guarantee that the utility will earn the authorized ROE Depending on how a utility manages its costs between rate cases it will realize an actual ROE either higher (in the case of reduced costs) or lower (in the case of increased costs) than the authorized level47
A utilityrsquos allowed ROE generally represents the return deemed necessary to attract investment considering the level of risk of that investment Riskier investments require a higher return to attract investors and vice versa Util-ity earnings can be volatile because of short-run impacts on sales volumes and revenues which include changes in sales owing to weather economic conditions and energy efficiency and DG programs This volatility typically causes utilities to retain a higher level of equity in their capital structures so that reduced revenues do not leave them un-able to service their debt Revenue regulation can reduce this volatility by stabilizing revenues regardless of the cause Because of this reduced risk many stakeholders have proposed that the implementation of a revenue regulation mechanism be associated with a corresponding reduction in the utilityrsquos equity capital ratio (the percentage of capital supplied by common equity) This reflects the utilityrsquos more stable revenue owing to revenue regulation and reduces the overall revenue requirement that will be recovered from consumers48
An alternative option to reducing the utilityrsquos equity ratio is to reduce the ROE reflecting a lower risk level For the utilities included in these case studies only BGE and Mass Electric experienced a reduction in their ROE The Com-mission did not reduce BGErsquos ROE at the time the revenue regulation mechanism was implemented but reduced it by 50 basis points during the subsequent rate case The Mas-
sachusetts Commission did not reveal its adjustment but incorporated a lowered ROE into its decision
Absent an explicit adjustment to the cost of capital investorsrsquo expectations will adjust to the presence of rev-enue regulation if its presence is reliable The more stable earnings will likely in time contribute to a higher credit rating That in turn will lead to lower cost debt that will be revealed in future cost of capital calculations An adjust-ment to the ROE or capital structure by the regulator in a rate proceeding will be reflected immediately in lower rates to consumers simply allowing the utilityrsquos credit rating to improve over time and its cost of debt to decline will have the same effect but on a lagged basis as new bonds are is-sued at lower interest rates49
Beginning in 2004 Standard and Poorrsquos began publish-ing ldquorisk profilesrdquo for utilities which classified utilities based on their earnings variability and other risks those with more stable earnings were determined eligible for higher bond ratings at any given equity capitalization ratio (or alternatively able to retain a given bond rating with a lower equity ratio)50 One utility with a revenue regulation mechanism Northwest Natural Gas was believed to have had their business risk profile upgraded by one step in response to the benefits of the mechanism51
Effect on Bond RatingsRevenue regulation stabilizes a utilityrsquos revenue streams
reducing risk to investors this reduced risk may be a contributing factor in an increase in a utilityrsquos bond rating Bond rating agencies have recognized that revenue regula-tion mechanisms and other mechanisms that reduce net earnings volatility and risk contribute to a lower cost of capital for the utility52 Standard and Poorrsquos has explicitly stated that it ldquoviews decoupling as a positive develop-
49 Lazar et al 2011
50 Standard and Poorrsquos (2004 June 2) New Business Profile Scores Assigned for US Utility and Power Companies Financial Guidelines Revised
51 Christensen Associates (2005 March) A review of distribution margin normalization as approved by the Oregon Public Utility Commission for Northwest Natural
52 Lazar et al 2011
Decoupling Case Studies Revenue Regulation Implementation in Six States
27
This topic raises a note of caution if mechanisms are not well designed double-recovery of costs can occur for verti-cally integrated utilities that provide both power supply and distribution services For example if a per-customer
revenue regulation mechanism includes investment-related power supply costs in the revenue-per-customer formula but excludes fuel and purchased power costs that are recovered through a separate tracking mechanism double recovery of some power supply costs is likely If the utility experiences cus-tomer and sales growth the amount it recovers for investment-related power supply costs will go up However if that utility serves this growth by operat-
ing existing power plants more by selling less power on the surplus market or by purchasing power from other suppli-ers it will not incur any increases in the type of power sup-
53 Standard amp Poorrsquos (2008 February 19) Decoupling the vehicle for energy conservation
ment from a credit perspectiverdquo53 However in the case of the utilities examined in this report none experienced an improved credit rating after the implementation of revenue regulation with the exception of PGampE However PGampE came out of Chapter 11 bankruptcy in the same year that its revenue regulation mechanism was implemented mak-ing it impossible to attribute the improvement to revenue regulation alone Bond rating changes are generally slow to evolve Numerous other factors are taken into account when assigning an overall credit rating which appear to have outweighed any positive effect of revenue regulation These factors certainly include the recession of the US economy that began in 2007
Customer Classes IncludedWhen determining the target revenue for a utility rev-
enue regulation mechanism regulators must also consider which customer classes to include in the mechanism In some cases industrial customers have objected to a rev-enue regulation mechanism This is due to the wide dif-ference in rates among customers making the design of a revenue regulation mechanism more challenging If regula-tors choose to exclude a class of customers from revenue regulation they must determine the revenue requirement associated with serving only the included customer classes This generally requires a detailed cost of service study to ensure that revenue responsibility is accurately allocated by customer class
Included CostsFinally regulators may wish to exclude specific costs
from the overall revenue requirement if those costs will be tracked through another mechanism like fuel costs in a PCA mechanism energy efficiency program expenditures or smart grid costs for example Separate tracking mecha-nisms can also be used for those costs that are difficult to
Pacific Gas amp Electric All customer classes
Idaho Power Company Residential and small general service
Baltimore Gas amp Electric Residential and small general service
Wisconsin Public Service Corporation All customer classes
National Grid All customer classes
Hawaiian Electric Company All customer classes
Pacific Gas amp Electric
Idaho Power Company
Baltimore Gas amp Electric
Wisconsin Public Service Corporation
National Grid
Hawaiian Electric Company
Table 3
Customer Classes Included in Revenue Regulation Mechanism
Table 4
Costs Excluded From Revenue Regulation Mechanism
project based on historical data or costs over which the util-ity has very little control like fuel costs Although revenue regulation tracks collected revenue mechanisms like Fuel Adjustment Clauses Purchased Power Adjustments and Energy Efficiency Riders can be designed to track actual costs as well as collected revenue
Energy procurement costs
All variable costs
Energy supply costs
Energy costs
Energy supply costs for basic service customers transmission costs the energy efficiency system benefits charge and reconciling charge and costs recovered through the residential assistance adjustment factor
Fuel and purchased power
Decoupling Case Studies Revenue Regulation Implementation in Six States
28
54 We use the RAM term applied in Hawaii here to address any type of attrition or similar mechanism other than a revenue-per-customer framework that changes the allowed revenue between general rate cases
ply costs accounted for in the revenue per customer (RPC) calculation The increased power supply costs to serve that growth will be recovered through the fuel and purchased power tracking mechanism The net effect for the utility will be to recover incremental power supply costs twicemdashonce in the per-customer mechanism and again in the fuel and purchased power mechanism It is essential to make sure that the other adjustment mechanisms do not overlap the cost impacts that are treated in the revenue regulation mechanism One way to do this is to ensure that all power supply costs (investment labor fuel purchased power) are recovered through a single mechanism There are several ways to achieve this
a) A comprehensive power supply recovery mechanism that includes all power supply costs that is separate from the costs treated in the revenue regulation adjustment (eg Puget Sound Energy Washington State)
b) No power supply adjustment whatsoever with all utility costs included in an RPC mechanism (eg National Grid)
c) An annual attrition calculation with all costs reviewed for changes since the last proceeding (eg HECO)
Revenue Adjustment Mechanism in Revenue Regulation
A RAM54 is not necessary to achieve revenue regulation but provides attrition reliefmdashincreasing authorized revenue commensurate with increased costsmdashbetween rate cases Whereas revenue regulation sets a target revenue that the utility will earn regardless of sales levels the RAM adjusts the target revenue between rate cases Regulators may choose to take several different approaches to RAM
bull No RAM Regulators may choose not to implement a RAM leaving the revenue requirement unchanged between rate cases This requires the utility to request a rate case when it requires additional revenue to cover its costs
bull Stairstep Stairstep adjustments provide predetermined increases in target revenue These increases can be determined during a rate case and generally reflect forecasts of cost growth
bull Indexing Indexing ties adjustments to the target revenue to multiple factors like inflation productivity customer growth and changes in capital expenditures
bull RPC The RPC approach is a form of indexing RPC adjusts the total revenue requirement for the
number of customers served Regulators using an RPC mechanism will determine the revenue requirement per customer and the overall revenue requirement will be determined by multiplying the total number of customers by the revenue requirement per customer The amount of revenue required to serve each customer can be determined separately for customer classes and for existing and new customers This way the RPC method accounts for a utilityrsquos growth in fixed costs that is related to growth in the number of customers served RPC is useful where the correlation between cost growth and customer growth is significant It also protects customers from making up the deficit if there is a loss in customer load such as if a large business closes down or relocates
bull Hybrid Hybrid RAMs generally use stairstep increases to account for projected capital costs and indexing to account for OampM expenses
Adjustments from any type of RAM can be implemented automatically or through an attrition proceeding Some stakeholders oppose adjustments to the revenue require-ment outside of a rate case on the basis that this could allow the revenue requirement to increase significantly without examination of the impact on ratepayers or with-out due consideration of other costs and revenues For this reason some regulators choose to cap the total adjustment that can be made to the revenue requirement outside of a rate case
Table 5
Type of Revenue Adjustment Mechanism
Pacific Gas amp Electric
Idaho Power Company
Baltimore Gas amp Electric
Wisconsin Public Service Corporation
National Grid
Hawaiian Electric Company
Hybrid
RPC
RPC
RPC
No RAM potential capital expenditure adjustment
Hybrid
Decoupling Case Studies Revenue Regulation Implementation in Six States
29
55 Because this method results in changes in the price for service that are calculated after that service has been provided it fails the ldquono retroactive ratemakingrdquo statutes that guide most electricity regulators Customers are entitled to know the price of the commodity they are consuming at the time they use it
56 The closest to a current method in use for electric utilities in the BGE system of monthly reconciliation
Table 6
Tracking and Accrual of Difference BetweenActual and Authorized Revenue
Pacific Gas amp Electric
Idaho Power Company
Baltimore Gas amp Electric
Wisconsin Public Service Corporation
National Grid
Hawaiian Electric Company
Track Difference
Monthly
Monthly
Monthly
Yearly
Yearly
Monthly
Accrual Period
Year
Year
Month
Year
Year
Year
Calculation of Actual RevenueRegulators have options when ensuring that actual
revenue equals target revenue under revenue regulation First regulators must decide how to determine ldquoactual revenuerdquo In most cases actual revenue simply equals the amount of revenue a utility collects from its customers The Idaho Public Utilities Commission however has chosen to use weather-normalized revenues as the basis for utility revenues in revenue regulation Although this prevents the utility from recovering revenue lost to it owing to milder than expected weather it further complicates the revenue regulation mechanism and reduces its risk-reduction ben-efits By the same token if weather is severe and increases sales above the revenue requirements weather normaliza-tion would allow the utility to retain some of the revenues
Next regulators must determine whether to implement revenue regulation using a current or accrual method
bull Current Method With the current method of revenue regulation the target revenue for a period say a month is divided by the actual sales in that period to determine the rate per kWh The current method ensures that actual revenue equals target revenue by calculating the rate at the end of the period so that the target revenue can be recovered The current method allows for no lag in revenue recovery One effect of this method is that although customer rates vary total bills are generally more stable For example in a hotter than expected July customers will purchase more kWh but they will be charged a lower rate A milder than average winter would lead to fewer sales but at slightly increased rates This way customers do not experience the same bill variability as they would if rates were set before the sales deviations occurred On the other hand the current method does not provide customers with the ability to plan ahead based on a predictable rate for electricity This method has been used for revenue regulation of natural gas utilities55
bull Accrual Method Under the accrual method rates are set based on an assumed sales level and the differences between actual and target revenue are allowed to accrue over some period Then the total difference between actual and target revenue is reconciled through an adjustment to rates in the subsequent period this is known as the true-up process Presently all revenue regulation mechanisms for electric utilities use the accrual method56
If regulators use the accrual method of revenue
regulation they will next need to determine the period over which the difference between actual and target revenue will be allowed to accrue One year is typical however shorter periods are also used Next the frequency of comparing collected revenue to target revenue should be determined It is possible to do this comparison only once at the end of the accrual period It is common however for comparisons to occur more frequently often monthly When revenues are compared within the accrual period the differences are tracked generally for the purpose of applying interest to the difference that will be deferred until the end of the accrual period
Rate AdjustmentsIn designing a revenue regulation mechanism there are a
number of decision points that regulators need to consider to balance the interests of all the stakeholders One of the decision points revolves around the determination of the mechanism used to adjust rates The issues that regulators need to consider include the following1 Rate Case Requirements One of the often-mentioned
concerns about surcharges especially when they are numerous is how that will impact the frequency of rate cases For regulators and stakeholders rate cases provide
Decoupling Case Studies Revenue Regulation Implementation in Six States
30
the best mechanism to correctly align rates and costs but they are time-consuming and expensive for all parties This is because a rate case presents an opportunity to closely examine all of the utilityrsquos expenses and adjust rates to reflect cost increases and decreases Because under a revenue regulation mechanism the goal is to match revenues received from all customers with revenue requirements a correct determination of revenue requirements is important as is the specification of appropriate cost indices to adjust the revenue requirements As the time between rate cases increases some regulators feel the base rate case data even with adjustments need to be reexamined As a result some regulators have chosen to mandate the frequency of rate cases to address this whereas others have not It may be that in some cases where there are numerous surcharges recovering a multitude of costs there may not be as many costs subject to review in the rate case making it less significant to a regulator than a case in which most costs are being analyzed and recovered in the rate case itself
2 Collection Mechanism Integrally tied to the mechanism for recovering revenues is how the utility will collect or refund the revenues Options that are available include recovery through a rate case or periodic adjustments to rates through a surcharge mechanism As can be seen by the case studies depending on the plan in place some utilities have very discreet requirements dictating the frequency of rate cases with adjustments occurring in those cases or between those cases Other utilities have no requirements upon them with respect to the frequency of rate case filings This will be discussed in more detail below What does emerge from these case studies is that the discreet components or choices in how to execute a revenue regulation plan are carefully interwoven to create a holistic approach Each component works with the other and the value of this case study is in examining the different pathways that can be chosen As discussed previously some of the commissions have authorized revenue regulation to recover the revenue requirements in the last rate case whereas others have authorized adjustments to rates between rate cases this impacts the pathway that the adjustment mechanism takes
3 Timing How often should rates be adjusted to true up to the utilityrsquos revenue requirement States have chosen different options ranging from monthly to annually
4 Allocation of Revenue Regulation Revenue Surpluses or Deficits There are a number of decision points regarding allocation Should the revenue regulation apply to all rate classes or just the smaller customers whose usage per customer and load variations are not as dramatic as those of larger-use customer classes Should there be a different allocation to each rate class or should the allocation of costs among the classes be the same Different mechanisms accomplish different goals Some states have allocated revenue regulation revenues based on the revenues lost by customer class as a result of energy efficiency This can sometimes be a political decision to mitigate opposition to energy efficiency programs by large customers Other states recognize that the system savings resulting from energy efficiency benefit all customers so that all customers should pay equally
5 Carrying Charges Depending on the timing issue discussed previously regulators may want to consider carrying charges on any adjustments This should be symmetrical in its application however so that it applies to surcharges and refunds Consideration should be given for the basis of the carrying charge rate whether weighted average cost of capital rate of return a risk-free rate or some other mechanism should be adopted
6 Rate Caps In order to mitigate potential rate impacts a regulator may want to consider a cap on how much rates can go up when the revenue regulation adjustment is made This might be more critical if the regulator is aware of other potential rate increases that will impact customersrsquo bills If a cap is used the case in which the utilityrsquos adjustment would exceed the cap must be considered Some regulators have opted to allow the utility to carry over the excess unrecovered amount for a period of years whereas others do not This allows the utility to recover those revenues in a subsequent year when perhaps the adjustment is less As a practical matter however adjustments of greater than three percent are less common as shall be discussed later
7 Impact on At-Risk Consumers Low-income and consumer advocates have expressed concern about revenue regulation as a vehicle for annual rate increases without the scrutiny of a general rate case creating rate increases for the low-use customers doing the most to constrain usage and help achieve targeted energy savings One proposal to address this has been to impose any resulting surcharges only to above-average usage
Decoupling Case Studies Revenue Regulation Implementation in Six States
31
57 Cavanagh and Howat (2012 May 2) Finding common ground between consumer and environmental advocates Electricity Policy
58 The most common criticism of future test years is that utilities forecast costs under an assumption that all authorized personnel positions will be filled while in retrospect any large organization has some level of vacancy in its employee count A historic test year captures this effect fully
customers and any resulting credits only to below-average usage57
Rate Case RequirementRequirements as to the frequency of rate cases can be
tied to the recovery mechanism or to the entire regulatory framework for implementing revenue regulation In the cases studied two of the utilities require periodic rate cases PGampE every three years and WPS every year Two others National Grid and HECO require annual mini rate cases explained later in which adjustments are made and two others IPC and BGE have no requirements for scheduled rate cases Nevertheless if the concern is to ensure that the utilityrsquos revenue recovery meets its revenue requirements some kind of periodic rate case to examine costs is appropriate Having periodic rate cases can provide a measure of assurance to consumer advocates that the level at which the revenues and hence the rates are set is correct One of the criticisms of revenue regulation is in fact the lack of rate cases to produce a proper level of confidence in the allowed amounts Multiple surcharges are usually additive to existing rates therefore not permitting an opportunity to reduce the base rate for reductions in cost Moreover the infrequency in cases impedes the examination of rate allocations as would occur through a cost of service study
This is a particular issue where utilities are augmenting power supply with purchased power from independent power producers which is the most common method for acquiring wind and solar production today The increased cost for purchased power may flow through a fuel and purchased power adjustment mechanism while the (depreciating) investment in conventional power plants remains static in base rates
Both PGampE and WPS use a future test year that allows the utility to project revenue requirements during the time period that the rates are to be in effect The benefit to this is that it can help identify and account for projected changes in costs over the timeframe between rate cases However given that these costs are utility projections most consumer advocates have less confidence in these numbers than they would using actual numbers from a historical or only hybrid test year58 When trying to garner support for revenue regulation from more skeptical stakeholders using a future test year may not be helpful Furthermore in the case of WPS that has annual rate cases using a future test year becomes less justifiable as revenues are recalculated annually anyway
The absence of a rate case requirement can also cause consternation among detractors of revenue regulation because of the belief that the utility will be guaranteed its revenue requirements for as long as it is satisfied with that level irrespective of how well it manages However this is no different from the status quo in traditional regulation in most places The incentive to manage well is always there with or without revenue regulation as it translates into more profit for the utility
In the cases of HECO and National Grid the mini rate cases serve two purposes In the one instance it serves as a means to reconcile revenue recovery with revenue requirements and in the second instance it provides an opportunity to adjust rates in accordance with changes in costs Specifically for National Grid the revenue requirement is adjusted to reflect capital expenditures For HECO revenues are adjusted to reflect changes in the cost of service In the two examples here revenue regulation is wrapped in with other adjustments as part of a mini adjustment Given the structure for determining revenue requirements which accounts for changes in costs including revenue regulation within the mini rate cases is a workable option
These examples highlight how rate cases can be used to adjust revenue requirements either in a more controlled regulatory environment with frequent rate cases or left to the utilityrsquos discretion to decide when to adjust costs A set schedule of periodic rate cases such as that used by PGampE may strike an appropriate balance for reviewing revenue requirements however with the modification of a partial historical partial forecasted test year Frequent rate cases can depending on the resources of the regulator and stakeholders be too costly and time-intensive When there are too many rate cases stakeholders and regulators may not be able to dedicate the level of resources needed for any one proceeding and may be spread too thin Regular known rate cases at reasonable intervals may strike the best balance of adequate review and adjustment of revenue requirements
Decoupling Case Studies Revenue Regulation Implementation in Six States
32
Collection Mechanism and TimingThe collection mechanism for the differential between
actual and authorized revenue requirements varies by util-ity as well Both PGampE and WPS do not have adjustment clauses or surcharges but instead have structured their revenue regulation plans to recover their costs in a rate case with rates adjusted annually Although PGampE has rate cases every three years the utility files its preliminary forecast every September 1 for the following year including adjust-ments for revenue regulation and other costs This practice promotes transparency keeping all stakeholders aware of the current situation of the utility IPC BGE National Grid and HECO use surcharges on customer bills to collect or credit the difference between actual revenues collected and the revenue requirement Although the other three (IPC National Grid and HECO) calculate the rate adjustment annually only BGE does a more contemporaneous adjust-ment of one month Certainly where there are no regularly scheduled rate cases using an adjustment mechanism becomes more critical PGampE has created a tracking mecha-nism known as a balancing account that allows the utility to track the surpluses and deficits to help ensure accuracy at year end when rates are actually adjusted The creation of such monthly balancing accounts will make it easier at the end of the year to track what happened each month and then determine the adjustment for that year It provides a more detailed trail for review and analysis by stakeholders and regulators However other mechanisms that just look at total revenues as compared to revenue requirements at the end of the year can work as well
Table 7
Rate Case Requirements
Table 8
Rate Adjustments
Table 9
Allocation of Surplus or Deficit
Pacific Gas amp Electric
Idaho Power Company
Baltimore Gas amp Electric
Wisconsin Public Service Corporation
National Grid
Hawaiian Electric Company
Pacific Gas amp Electric
Idaho Power Company
Baltimore Gas amp Electric
Wisconsin Public Service Corporation
National Grid
Hawaiian Electric Company
Pacific Gas amp Electric
Idaho Power Company
Baltimore Gas amp Electric
Wisconsin Public Service Corporation
National Grid
Hawaiian Electric Company
Every three years annual ldquoattritionrdquo adjustments in between
No requirement
No requirement
Annual rate case
Annual capital expenditure adjustment case
Abbreviated annual rate case
Base rates adjusted annually
Annual adjustment through surcharge
Monthly adjustment through surcharge
Annual adjustment through rate case
Annual adjustment
Annual adjustment
Allocated to all customers according to business unit (eg electric distribution electric generation)
Included in the annual adjustment mechanism for each customer class
Separate for each customer class
Allocated to all customers except certain tariffs (see above)
Separate for each customer class
Separate for residential and commercialindustrial
Allocation of Revenue Regulation Revenue Surpluses or Deficits
The allocation of revenue regulation revenue surpluses or deficits should be symmetrical so that overpayments are credited to customers just as underpayments are paid by those same customers The six utilities studied fol-low that formula The application of revenue regulation however varies from utility to utility BGE and IPC ap-ply revenue regulation to the residential and commercial classes thereby excluding industrial customers In contrast however PGampE WPS National Grid and HECO allocate revenue regulation adjustments to all customer classes In terms of how the costs are allocated IPC BGE WPS National Grid and HECO allocate costs differently among the customer classes PGampE however allocates costs uni-formly among the customers Because PGampE has separated its business units it also separately calculates and allocates
Decoupling Case Studies Revenue Regulation Implementation in Six States
33
Table 10
Carrying Charges
Table 11
Cap on Rate Adjustment
Pacific Gas amp Electric
Idaho Power Company
Baltimore Gas amp Electric
Wisconsin Public Service Corporation
National Grid
Hawaiian Electric CompanyPacific Gas amp Electric
Idaho Power Company
Baltimore Gas amp Electric
Wisconsin Public Service Corporation
National Grid
Hawaiian Electric Company
None
Yes
None
Yes at the short-term debt rate
Yes at the customer deposit rate
Yes at the customer deposit rateNo
3 rate cap excess carried over to next period
10 rate cap excess carried over to next period
Cap of $14 million per year
$170 million in CapEx
No
revenue regulation surpluses and deficits among its electric distribution gas distribution and electric generation busi-nesses This illustrates that there are several ways to address revenues from revenue regulation depending on the policy outcomes that are desired
Carrying ChargesCarrying charges applied to uncollected or surplus rev-
enues can be used to account for the time value of money and the lost opportunity or value to having those revenues in hand PGampE and BGE do not accrue carrying charges On the other hand IPC WPS National Grid and HECO do For BGE given that the revenue regulation revenues are reconciled and recovered monthly it would make little sense to include a carrying cost Where carrying costs have been used they have included in the cases of these utili-ties the short-term debt rate or the customer deposit rate which for one utility is six percent and probably close to the short-term debt rate Thus the carrying charge rates are appropriately at the lower end of the spectrum reflecting their short-term nature In the application of the carrying charge symmetry should be preserved by applying it to both deficits and surpluses Application of carrying charges given the short period that costs are carried (one year) is somewhat discretionary Although it does more accurately account for costs it does add a modest level of complica-tion in tracking costs
Rate Caps and CollarsOne of the ways to protect customers in the event of sig-
nificant adjustments is to impose a rate cap (or collar) that limits the amount of a rate increase (and decrease) Some customers are sensitive to changes in foundational costs like utility bills and if costs are going to rise they benefit from a pattern of steady modest increases rather than a large step increase Any structural increases in rates attributable
to reductions in sales or increases in costs recognized by the revenue regulation plan would be eventually included in rates under any system A cap reflects a controlled way to manage customer expectations and customer impacts Structural changes can only be managed for a while until a complete rate case is needed to reset all assumptions
Typically when a rate cap is imposed if the formulaic increase exceeds the cap or collar the utility will be able to carry over any uncollected revenues until the next rate adjustment Two of the utilities studied PGampE and HECO do not have rate caps On the other hand the other four utilities do include rate caps in varying amounts National Grid has a one-percent revenue cap whereas IPC and BGE have a one-percent and a ten-percent rate cap respectively WPS unlike the others has a cap tied to the dollar amount of $14 million as opposed to a percentage Consistent with the goals of revenue regulation all of the utilities studied have a carryover provision that is important for reducing the risk that the utility will not recover its revenue require-ments
Note that National Grid differs from BGE and HECO in that its cap is on revenues whereas the other two utilities cap rates and rate impacts A revenue cap is more focused on ensuring minimal change to the revenue requirements authorized by the commission National Grid as discussed previously allows for mini rate cases to adjust the rev-enue requirements Having the one-percent cap limits the amount of increase that can occur through that process requiring revenue changes that are greater to occur in a full rate case However note also that some of the adjustments allowed in the mini rate case have their own separate cap The IPC rate cap is in line with what many other utilities with caps have in place which generally range from one to three percent The ten-percent rate cap in the BGE plan is
Decoupling Case Studies Revenue Regulation Implementation in Six States
34
59 Morgan P (2012 December) Graceful Systems LLC A decade of decoupling for US energy utilities rate impacts designs and observa-tions p5
reflective of its monthly adjustment pattern An annual ad-justment allows more time to smooth out peaks and valleys in revenues whereas a monthly adjustment will be influ-enced by more of the spikes (particularly weather-driven variation) thus the need for a larger bandwidth for the car-ryover Like a variable energy rate or fuel adjustment clause that fluctuates monthly the monthly adjustment introduces more volatility into the rates
Actual Historical AdjustmentsFor many ratepayer advocates there is a concern that
some of the utility management risk will be transferred to customers as a consequence of a policy that seeks to ensure that the utility will be made whole However the utility re-tains management risk and the requirement to demonstrate that it has acted prudently Thus the utility still has just as much of an incentive to operate efficiently as it did without revenue regulation If the utility can lower its costs it can still increase its profits Second by designing rates symmet-rically such that under- and over-recoveries are reconciled it provides customers with an opportunity to obtain credits that under traditional regulation would be retained by the utility It has often been opined that when there are large
gaps in time between utility rate cases it is because the utility is over-earning and exceeding its revenue require-ments In those instances customers never get to examine what the utility is collecting much less receive a refund Under revenue regulation with its periodic adjustments and scheduled general rate cases the revenue requirements are examined and refunds or credits allocated such that customers have a better knowledge base for understanding the utilityrsquos earnings And annual reconciliation of the util-ityrsquos actual revenues versus authorized revenues provides consumers with a tool to reign in excess revenue recovery beyond authorized amounts Third the adjustments that do occur under revenue regulation are manageable and frequently less than the adjustments customers are used to seeing on their bills for fuel or variable generation rates or for the myriad of other surcharges that can be tacked on to a customerrsquos bill such as an infrastructure (smart grid) sur-charge maintenance upgrade fee regulatory asset charge or system benefit charge
As seen in Figure 1 the range of rate impacts cluster around plus or minus two percent but can at times exceed plus or minus five percent The total of surcharges has somewhat exceeded the total of credits
Figure 1
Total Utility Decoupling Adjustment Rate Impacts59
300
250
200
150
100
50
0
Nu
mber
of
Dec
oup
lin
g A
dju
stm
ents
Over -5 -4 to -5 -3 to -4 -2 to -3 -1 to -2 0 to -1 0 to 1 1 to 2 2 to 3 3 to 4 4 to 5 Over 5
Percentage Rate Impacts
SurchargesRefunds
ResidentialAll
Other
Commercial
Total
Decoupling Case Studies Revenue Regulation Implementation in Six States
35
60 Id p 3
61 Schultz T Energy Efficiency at Idaho Power Available at httpwwwenergyidahogovenergyalliancedida_powerpdf
As can be seen with the utilities studied above the larger fluctuations are attributable to adjustment mechanisms that are reconciled more frequently such as monthly as those are less able to smooth out anomalies as an annual adjust-ment would do From a dollar perspective for the roughly 64 percent of adjustments that fall within the plus or minus two-percent range the monthly bill impact is approxi-mately $230 for average electric customers and $140 for average gas customers60
Of the six utilities studied the fluctuations in adjustment have for the most part stayed within the one- to three-per-cent range as shown below
bull PGampE from 2005 to 2012 has had annual revenue regulation adjustments ranging from minus143 percent to 415 percent with an average adjustment of 197 percent
bull For IPC the adjustments are separated between residential and commercial customers For residential customers the annual adjustments from 2007 through 2011 ranged from 077 percent to 258 percent for an average of 162 percent As for the commercial customers the annual adjustments for that same period were higher ranging from 104 percent to 424 percent with an average adjustment of 252 percent
bull BGE has monthly adjustments that ranged from minus1853 percent to 3013 percent with an average of 057 percent for residential customers from March 2008 through August 2012 For General Service Customers the monthly adjustment ranged from minus2264 percent to 2462 percent The average adjustment was 1308 percent
bull For WPS the annual adjustments from 2009 through 2011 ranged from minus145 percent to 378 percent for residential and small commercial and from minus314 percent to 899 percent for commercial Note that because of a $14 million per year cap some of these percentages were carried over The average annual adjustment for residential and small commercial and for commercial was 163 percent and 215 percent respectively with carry-overs to subsequent years
bull For Massachusetts Electric and Nantucket Electric both of which operate under National Grid the annual revenue regulation adjustment for all for 2011 and 2012 was minus0105 percent and 0315 percent for an average revenue regulation adjustment over the two years of 0105 percent
bull HECO like National Grid has one annual revenue
regulation mechanism for its customers which resulted in adjustments in 2011 and 2012 of 063 percent and 107 percent respectively for an average adjustment of 085 percent
As can be gleaned from the above information the range of average adjustments for small use customers was a low of 0105 percent for National Grid to a high of 197 percent for PGampE For larger use customers the range was a low of 0105 percent for National Grid to a high of 252 percent for IPC This demonstrates that on average for these utilities with well-developed and diversely designed revenue regula-tion proposals their adjustments on average stayed at or below approximately 25 percent
One of the metrics for determining if a revenue regula-tion program is working successfully that was discussed above was the impact on rates of a revenue regulation mechanism As can be seen by the analysis of the adjust-ment levels for each of the utilities they are within a rea-sonable range
Complementary Policies Although a revenue regulation mechanism does not need
to be accompanied by other policies energy efficiency is frequently at the root of the reason revenue regulation was proposed in the first place The states examined in this pa-per have various obligations for energy efficiency achieve-ment placed upon their utilities Only Idaho does not have an Energy Efficiency Resource Standard but energy efficiency objectives are developed through an integrated resource plan process Energy efficiency spending at IPC has increased dramatically in recent years61
In recognition of the fact that revenue regulation only removes the disincentive to pursue energy efficiency several states have instituted some form of incentives to reward the desired outcome This mechanism can not only incentivize management to aggressively pursue energy efficiency but also make shareholders supportive in the face of lost invest-ment opportunity
Rate design can also play an important part in assist-ing the utility in achieving favorable energy efficiency outcomes Inclining block rates penalize inefficient use of electricity and shorten payback times from the customer perspective Because efficiency reduces consumption at
Decoupling Case Studies Revenue Regulation Implementation in Six States
36
62 Optional rate designs for PGampE include TOU and Peak Time Pricing
63 IPC also has an optional TOU rate design
64 Optional rate designs for this utility include TOU Critical Peak Pricing and Contract
65 National Grid also offers optional TOU and flat rate designs
66 HECO also offers optional TOU and flat rate designs
67 See eg Alexander B (1996 April) How to construct a service quality index in performance-based ratemaking Electricity Policy
the tail block rate the value of kWh savings is greater than with flat rates On the other side of the spectrum declining block rates which have a reduced rate in the tail block do little to encourage conservation In fact they operate more like a discounted bulk rate by reducing the average cost of a kWh in a customerrsquos bill for the more kWh used
Performance incentives or other ways to avoid destruc-tive cost-cutting in the name of creating margins that reduce service or reliability or lessen customer value have been implemented only in Massachusetts of the six utilities illustrated here Several other states have implemented vari-ous schemes in reaction to perceived deficiencies in utility service67 Performance incentives are not unique to rev-enue regulation Commissions wishing to implement such a scheme can find many models of incentive reward and penalty mechanisms developed for other purposes
Taken together a suite of policy and program features can create an atmosphere that is conducive to achievement of energy efficiency goals within the utility and for the customers By appropriate application of these techniques regulators working with utilities and stakeholders can remove barriers and create an opportunity for energy ef-ficiency to be fully integrated into the utility supply option portfolio
Energy Efficiency OutcomesAlthough revenue regulation itself does not create an
incentive for a utility to implement energy efficiency it does address the issue of lost revenues associated with energy
Table 12
Complementary Policies for Energy Efficiency
Pacific Gas amp Electric62
Idaho Power Company63
Baltimore Gas amp Electric
Wisconsin Public Service Corporation64
National Grid65
Hawaiian Electric Company66
Energy Efficiency Requirement
1 annually
IRP
10 by 2015
075 annually
24 annually
Energy efficiency can satisfy portion of RPS
Default Residential Rate Design
Inclining block
Inclining block
TOU seasonal
Flat
Inclining block
Inclining block
Incentive Structure
Risk reward incentive mechanism
No
No
No
5 of program costs
Third-party administrator paid for contract performance
Performance Incentives
Reliability reporting only
None
Under consideration
Reliability reporting only
Service quality reward and penalty
Under consideration
efficiency and DG programs Revenue regulation should be combined with other mechanisms that require or incentiv-ize the implementation of energy efficiency by the utility or a third party The level of energy efficiency achieved can be one measure of the success of a revenue regulation mechanism as implemented in a larger program designed to achieve energy efficiency Table 13 shows the incremental annual energy efficiency savings reported by each utility with the shaded box indicating the year that the utilityrsquos revenue regulation mechanism was implemented National Grid had achieved a high level of energy efficiency savings in the years before it implemented revenue regulation
This paper has not evaluated DG outcomes to correlate with revenue regulation as it is not perceived that states and utilities have made that connection expressly in histori-cal mechanisms However it is expected that this connec-
Decoupling Case Studies Revenue Regulation Implementation in Six States
37
68 EIA Form EIA-861 data files Available at httpwwweiagovelectricitydataeia861
69 PGampE began revenue regulation in 1974 and it was later suspended and recommenced in 2001
70 WPS savings are represented by the statewide program savings from the Focus on Energy program WPS provided additional funds to Focus on Energy starting in CY10 through their territory-wide program activities
71 In 2009 Hawaii Energy a ratepayer-funded statewide energy efficiency provider began delivering services Savings reported after 2009 represent savings achieved through the programs of Hawaii Energy
Table 13
Annual Incremental Energy Efficiency Savings as Percentage of Retail Sales68
Highlighted cells are the year that utility started decoupling
Pacific Gas amp Electric69
Idaho Power Company
Baltimore Gas amp Electric
Wisconsin Public Service Corporation70
National Grid
Hawaiian Electric Company71
2004
11
01
00
03
11
00
2005
16
03
00
03
09
05
2006
10
05
00
03
12
05
2010
19
13
17
09
136
12
tion will be made in future mechanisms and furthermore it is anticipated that follow on work to this paper will want to study that connection between revenue regulation and DG performance
Conclusions
An increasing number of states are looking to increase the rate of energy efficiency investments for their long-run cost and risk advantages The benefits of energy efficiency include not only its ability to reduce system costs across the distribution transmission and generation functions but also the opportunity for customers to reduce their individ-ual energy costs for their own electric bills Nevertheless it is counterintuitive to encourage or order a utility to sell less of its product In order to encourage the proliferation of en-ergy efficiency programs as a solution that can contribute to this nationrsquos energy needs this tension between the goals of society versus the goals of the utility needs to be addressed Revenue regulation can be such a solution by removing the link between sales and revenues
There are many ways to implement revenue regulation and multiple decision points that regulators must consider in designing a revenue regulation mechanism This paper focused on six utilities each of which implemented revenue regulation in different ways in accordance with the objectives of that state Different decision points discussed include
bull Should revenue regulation apply to all functions (generation transmission and distribution) which sometimes depends on if the utility is regulated or restructured
bull Should revenue regulation apply to all customer classes
bull Should there be symmetry such that a reconciliation adjustment occurs for both over- and under-recoveries of the revenue requirements
bull Should recovery of indicated surcharges be conditioned on acceptable performance on customer service quality or energy efficiency goals
bull Should there be an attrition adjustment to account for other expenses or should the revenue regulation adjustment be limited to reconciling existing revenue requirements
bull Should there be an inflation adjustmentbull To calculate the revenue requirements should the
current or accrual method be usedbull Should the adjustments be made in rate cases or
through a riderbull How frequently should adjustments be made
monthly annually or some other time periodbull Depending on the period of time between true up and
recovery should there be carrying charges and if so how should they be calculated
2007
21
06
00
03
09
04
2008
35
10
05
09
05
05
2009
20
11
06
10
11
11
Decoupling Case Studies Revenue Regulation Implementation in Six States
38
72 Avista Utilities (2009) Washington Utilities and Transportation Commission Docket UE-090134
bull Should there be a requirement authorizing the frequency of rate case
bull Should there be an annual cap on the amount of the adjustment and if so should there be an opportunity to carry over any additional amounts and for how many years
bull Should there be an adjustment to the cost of capital to reflect the reduced risk
Other considerations for regulators whether or not they implement revenue regulation but certainly as part of a comprehensive package are other measures that can be put in place to encourage consumers and utilities alike to actively participate in energy efficiency For example an inclining block rate structure by virtue of its incentive to consume less pairs well with an energy efficiency program helps drive consumers to participate in efficiency programs and accelerates the payback of an energy efficiency investment By the same token an incentive payment to the utility helps provide its management with a good reason to excel and exceed targets for energy efficiency programs
A key point illustrated by the list of considerations above is that there is not just one static way to design and implement revenue regulation but rather there are a variety of options for doing so In this study a diverse group of utilities were reviewed The differences among the utilities included geographic diversity vertically integrated and restructured utilities different levels of energy efficiency in place and certainly differences in how the revenue regulation mechanisms were implemented No two utilities were alike and no two utilities had the same revenue regulation mechanism The key is that revenue regulation should eliminate the throughput incentive but the means for accomplishing this goal can vary and be tailored to each jurisdiction and each utility and still be successful
There are several considerations in the design of a revenue regulation mechanism that can help ensure its successful adoption To begin revenue regulation should be granted to utilities only as a precondition to implementing comprehensive energy efficiency andor DG policies Unless accompanied by a commitment to engage in providing least-cost resource options that could impact sales there is not really any good policy reason for its adoption All of the utilities studied are actively engaging in energy efficiency Furthermore as a matter of fairness the revenue regulation mechanism should be symmetrical so that any revenues above those authorized are refunded back to consumers As Figure 1 demonstrates although there are more surcharges to customers there is nevertheless a healthy amount of
credits back to consumers This is the bargain Barring imprudence or other unforeseen circumstances the utility receives its authorized revenue requirements and nothing more or less under a simple revenue regulation mechanism
Rate design plays an important role in the effectiveness of energy efficiency in concert with revenue regulation A low customer charge is preferable so that the customer can benefit from real bill reductions tied to reduced volumetric consumption Reductions in consumption not only reduce bills but also positively impact the payback period for investments in energy efficient appliances Declining block rates in which the tail block rate is lower than the first tier also do not encourage conservation Inclining block rates that reward low usage in the first block with a lower rate send the better price signals None of the six utilities studied had declining block residential rates They were inclining flat and time-varying
The revenue adjustment mechanism is also a critical decision point in terms of whether a revenue per customer mechanism is adopted that accounts for only the current revenue requirements or whether latitude is given to include an inflation adjustment or other cost increases in the revenue adjustment mechanism Three of the utilities studied adopted this approach whereas another two used a hybrid approach Finally to reduce volatility five of the six utilities opted for annual rather than monthly adjustments thereby creating a level of rate stability that customers in general prefer
Once the goals for revenue regulation are set by the regulators the next step is to design programs that will implement that goal For energy efficiency to be as successful as possible regulators may want to adopt a complement of other policies to accompany revenue regulation These can include rate designs that reward reduced use and conservation as well as incentive payments to utilities that reward them for meeting or exceeding targets Of the six utilities studied three have adopted some form of incentive One simple approach that was used in Washington was to link recovery of any surcharges under the revenue regulation mechanism to achievement of energy efficiency targets72
For the utilities examined above that have implemented revenue regulation the evidence demonstrates that revenue regulation as a strategy and a mechanism to enable
Decoupling Case Studies Revenue Regulation Implementation in Six States
39
energy efficiency has been working well The fact that each revenue regulation mechanism varies from the next demonstrates that there are many different paths that can be followed in implementing revenue regulation based on the needs of the utility and its stakeholders in a particular
region This study demonstrates that revenue regulation does work and provides examples of how it can be implemented each one different and unique because of the number of decision points to be considered in designing a revenue regulation mechanism
Decoupling Case Studies Revenue Regulation Implementation in Six States
40
Appendix
Historic Rate Adjustments
Table 14
PGampE Revenue Regulation Rate Adjustments 1983 to 199373
Table 15
PGampE Revenue Regulation Adjustments 2005 to 201274
Table 16
IPC Revenue Regulation Adjustments76
Idaho Power Company
1983 23
1984 (34)
1985 (48)
1986 19
1987 21
1988 50
1989 (43)
1990 (54)
1991 39
1992 34
1993 00
2005 8925 minus12773 minus143
2006 9933 2246 226
2007 10409 21727 209
2008 10261 4032 039
2009 11169 10355 093
2010 11224 46556 415
2011 10306 38390 373
2012 11032 40304 365
2007 Residential minus00457 590 minus077
Commercial minus00457 428 minus107
2008 Residential 00529 670 090
Commercial 00529 510 104
2009 Residential 01220 770 158
Commercial 01535 603 255
2010 Residential 01800 785 229
Commercial 02273 613 371
2011 Residential 02028 785 258
Commercial 02597 613 424
Revenue Regulation Adjustment as of
Total Rates
Delivery Revenue
Requirement ($ millions)
Adjustment Rate
Revenue Regulation Adjustment($ millions)
Retail Rate
of Delivery Revenue
Revenue Regulation Adjustment
Year
Year
73 Lesh P (2009 June 30) Rate impacts and key design elements of gas and electric utility decoupling
74 Morgan P (2012 November) A decade of decoupling for US energy utilities rate impacts designs and observations
75 Morgan P (2012 November) A decade of decoupling for US energy utilities rate impacts designs and observations
76 All numbers provided by the utility
Decoupling Case Studies Revenue Regulation Implementation in Six States
41
77 Idaho Power Company Case No IPC-E-11-19- fixed cost adjustment permanent mechanism Available at httpwwwpucidahogovinternetcaseselecIPCIPCE1119company20120928COMPLIANCE20FILINGPDF
Figure 2
IPC Revenue Regulation Adjustments77
Residential FCA Balance and Use per Customer
$10000000
$8000000
$6000000
$4000000
$2000000
$0
-$2000000
-$4000000
-$6000000
1080
1070
1060
1050
1040
1030
1020
1010
1000Res
idu
al A
uth
oriz
ed F
CA
Am
oun
t
Residual Authorized FCA Amount ($)
Monthly Use Per Customer (kWh)
kW
h U
sed
2006 2007 2008 2009 2010 2011
78 Morgan P (2012 November) A decade of decoupling for US energy utilities rate impacts designs and observations
Decoupling Case Studies Revenue Regulation Implementation in Six States
42
Table 17a
Baltimore Gas and ElectricBGE Monthly Revenue Regulation Adjustments 2008 to 201278
Table 17b
Baltimore Gas and ElectricBGE Monthly Revenue Regulation Adjustments 2008 to 201278
March Residential 000172 01477 1165General Service 000230 01526 1507
April Residential 000016 01477 0108General Service 000146 01526 0957
May Residential 000066 01477 0447General Service 000230 01526 1507
June Residential minus000066 01477 minus0447General Service 000230 01526 1507
July Residential 000158 01477 1070General Service 000230 01526 1507
August Residential minus000040 01477 minus0271General Service 000214 01526 1402
September Residential 000237 01477 1605General Service 000230 01526 1507
October Residential 000237 01477 1605General Service 000143 01526 0937
November Residential 000237 01477 1605General Service 000140 01526 0917
December Residential 000445 01477 3013General Service 000230 01526 1507
January Residential 000035 01579 0222General Service minus000073 01346 minus0542
February Residential 000025 01579 0158General Service 000230 01346 1709
March Residential minus000237 01579 minus1501General Service 000230 01346 1709
April Residential minus000237 01579 minus1501General Service 000230 01346 1709
May Residential 000234 01579 1482General Service 000132 01346 0981
June Residential 000237 01579 1501General Service 000230 01346 1709
July Residential 000237 01579 1501General Service 000230 01346 1709
August Residential 000237 01579 1501General Service 000190 01346 1412
September Residential 000237 01579 1501General Service 000230 01346 1709
October Residential 000237 01579 1501General Service 000124 01346 0921
November Residential 000237 01579 1501General Service 000230 01346 1709
December Residential 000156 01579 0988General Service 000204 01346 1516
Adjustment $kWh
Adjustment $kWh2008 2009
Retail Rate
$kWh
Retail Rate
$kWhAdjustment
Adjustment
Decoupling Case Studies Revenue Regulation Implementation in Six States
43
Table 17c
Baltimore Gas and ElectricBGE Monthly Revenue Regulation Adjustments 2008 to 201278
Table 17d
Baltimore Gas and ElectricBGE Monthly Revenue Regulation Adjustments 2008 to 201278
January Residential 000203 01465 1386General Service 000230 01261 1824
February Residential minus000142 01465 minus0969General Service 000230 01261 1824
March Residential minus000237 01465 minus1618General Service 000230 01261 1824
April Residential minus000237 01465 minus1618General Service 000230 01261 1824
May Residential 000192 01465 1311General Service 000230 01261 1824
June Residential 000191 01465 1304General Service 000230 01261 1824
July Residential 000095 01465 0648General Service 000230 01261 1824
August Residential minus000176 01465 minus1201General Service 000224 01261 1776
September Residential minus000237 01465 minus1618General Service 000116 01261 0920
October Residential minus000237 01465 minus1618General Service 000081 01261 0642
November Residential minus000237 01465 minus1618General Service 000098 01261 0777
December Residential minus000079 01465 minus0539General Service 000229 01261 1816
January Residential minus000130 01365 minus0952General Service 000230 01156 1990
February Residential minus000253 01365 minus1853General Service minus000020 01156 minus0173
March Residential minus000018 01365 minus0132General Service minus000063 01156 minus0545
April Residential 000110 01365 0806General Service minus000262 01156 minus2266
May Residential 000010 01365 0073General Service minus000160 01156 minus1384
June Residential 000226 01365 1656General Service 000042 01156 0363
July Residential 000253 01365 1853General Service 000209 01156 1808
August Residential minus000007 01365 minus0051General Service minus000157 01156 minus1358
September Residential minus000253 01365 minus1853General Service minus000177 01156 minus1531
October Residential 000228 01365 1670General Service 000262 01156 2266
November Residential minus000059 01365 minus0432General Service 000262 01156 2266
December Residential 000071 01365 0520General Service 000262 01156 2266
Adjustment $kWh
Adjustment $kWh2010 2011
Retail Rate
$kWh
Retail Rate
$kWhAdjustment
Adjustment
Decoupling Case Studies Revenue Regulation Implementation in Six States
44
Table 17e
Baltimore Gas and ElectricBGE Monthly Revenue Regulation Adjustments 2008 to 201278
January Residential 000253 01291 1960General Service 000262 01064 2462
February Residential 000253 01291 1960General Service 000262 01064 2462
March Residential 000253 01291 1960General Service 000262 01064 2462
April Residential 000253 01291 1960General Service 000262 01064 2462
May Residential 000253 01291 1960General Service 000262 01064 2462
June Residential 000253 01291 1960General Service 000262 01064 2462
July Residential 000253 01291 1960General Service 000262 01064 2462
August Residential 000253 01291 1960General Service 000160 01064 1504
Adjustment $kWh2012
Retail Rate
$kWhAdjustment
Decoupling Case Studies Revenue Regulation Implementation in Six States
45
79 Morgan P (2012 November) A decade of decoupling for US energy utilities rate impacts designs and observations
80 Morgan P (2012 November) A decade of decoupling for US energy utilities rate impacts designs and observations
Table 18
Wisconsin Public Service Corporation Revenue Regulation Adjustments 2009 to 201179
2009 ResidentialSmall Commercial 00048705 000168154 01290 378 130Commercial 00084951 000293293 00945 899 310
2010 ResidentialSmall Commercial 00033043 000166936 01291 256 129Commercial 00056630 000286103 09460 060 030
2011 ResidentialSmall Commercial (00018666) $ (000163719) 01288 minus145 minus127Commercial (00032565) $ (000285629) 01037 minus314 minus275
Derived Adjustment
$kWh
Derived Adjustment Capped $
kWh
Retail Rate
$kWh
Revenue Regulation Actual
Revenue Regulation Capped
Table 19
National Grid Revenue Regulation Adjustments 2011-201276
Massachusetts Electric and Nantucket Electric
Table 20
Hawaiian Electric Company
2011 All minus0015 1429 minus0105
2012 All 0044 1396 0315
2011 01995 3149 063
2012 03894 3641 107
Revenue Regulation Adjustment
centkWh
Revenue Regulation Adjustment
centkWhRetail Rate
centkWh
Retail Rate
Revenue Regulation Adjustment
Revenue Regulation
ldquoThe 2011 adjustment took effect June 1 but was reduced to $0 on July 26 2011 when the Commission granted HECO an interim rate increase of $532 million in a 2011 test year general rate case The 2012 Adjustment runs from June 1 2012 through May 31 2013 About 25 of the total relates to the portion of the decoupling mechanism that updates OampM and rate baserdquo (Morgan 2013)
Decoupling Case Studies Revenue Regulation Implementation in Six States
46
Revenue Regulation and Decoupling A Guide to Theory and Applicationhttpwwwraponlineorgdocumentdownloadid902
This guide was prepared to assist anyone who needs to understand both the mechanics of a regulatory tool known as decoupling and the policy issues associated with its use This would include public utility commissioners and staff utility management advocates and others with a stake in the regulated energy system While this guide is somewhat technical at points we have tried to make it accessible to a broad audience to make comprehensible the underlying concepts and the implications of different design choices This guide includes a detailed case study that demonstrates the impacts of decoupling using different pricing structures (rate designs) and usage patterns
Pricing Dorsquos and Donrsquots Designing Retail Rates as if Efficiency Countshttpwwwraponlineorgdocumentdownloadid939
Rate design is a crucial element of an overall regulatory strategy that fosters energy efficiency and sends appropriate signals about efficient system investment and operations Rate design is also fully under the control of state regulators Progressive rate design elements can guide consumers to participate in energy efficiency programs and reduce peak demand yet relatively few utilities and commissions have implemented many of these elements This RAP paper identifies some best practices Because pricing issues tie closely to utility growth incentives we also address revenue decoupling
A Decade of Decoupling for US Energy Utilities Rate Impacts Designs and Observationshttpwwwraponlineorgdocumentdownloadid6356
This report written by Pamela Morgan of Graceful Systems LLC builds on a 2009 report Now covering 25 states including 49 LDCs and 24 electric utilities this report summarizes the decoupling mechanism designs these utilities use and the rate adjustments they have made under those mechanisms In total this report estimates the retail rate impacts of 1244 decoupling mechanism adjustments since 2005
Additional Resources
The Role of Decoupling Where Energy Efficiency is Required by Lawhttpwwwraponlineorgdocumentdownloadid275
This Issuesletter gives an overview of energy efficiency resource standards the need to decouple utility profits from utility sales and explains why decoupling is needed even where a third party administers energy efficiency programs
Revenue Decoupling Standards and Criteria A Report to the Minnesota Public Utilities Commissionhttpwwwraponlineorgdocumentdownloadid850
In 2007 the Minnesota legislature enacted a new statute Section 216B2412 in which it defined an alternative approach to utility regulation decoupling and directed the Public Utilities Commission (PUC) to ldquoestablish criteria and standardsrdquo by which decoupling could be adopted for the statersquos rate-regulated utilitiesTo fulfill its obligation to develop criteria and standards for decoupling the PUC sought the advice of the Regulatory Assistance Project (RAP) This report is the output of that collaboration
Designing Distributed Generation Tariffs Wellhttpwwwraponlineorgdocumentdownloadid6898
Improvements in distributed generation economics increasing consumer preference for clean distributed energy resources and a favorable policy environment in many states have combined to produce significant increases in distributed generation adoption in the United States Regulators are looking for the well-designed tariff that compensates distributed generation adopters fairly for the value they provide to the electric system compensates the utility fairly for the grid services it provides and charges non-participating consumers fairly for the value of the services they receive This paper offers regulatory options for dealing with distributed generation The authors outline current tariffs and ponder what regulators should consider as they weigh the benefits costs and net value to distributed generation adopters non-adopters the utility and society as a whole The paper highlights the importance of deciding upon a valuation methodology so that the presence or absence of cross-subsidies can be determined Finally the paper offers rate design and ratemaking options for regulators to consider and includes recommendations for fairly implementing tariffs and ratemaking treatments to promote the public interest and ensure fair compensation
Decoupling Case Studies Revenue Regulation Implementation in Six States
47
The Regulatory Assistance Project (RAP)trade is a global non-profit team of experts focused on thelong-term economic and environmental sustainability of the power sector We provide technical and policy assistance on regulatory and market policies that promote economic efficiency environmental protection system reliability and the fair allocation of system benefits among consumers We work extensively in the US China the European Union and India Visit our website at wwwraponlineorg to learn more about our work
Rate Design Where Advanced Metering Infrastructure Has Not Been Fully Deployedhttpwwwraponlineorgdocumentdownloadid6516
This paper identifies sound practices in rate design applied around the globe using conventional metering technology Rate design for most residential and small commercial customers (mass market consumers) is most often reflected in a simple monthly access charge and a per-kWh usage rate in one or more blocks and one or more seasons A central theme across the practices highlighted in this paper is that of sending effective pricing signals through the usage-sensitive components of rates in a way that reflects the character of underlying long-run costs associated with production and usage While new technology is enabling innovations in rate design that carry some promise of better capturing opportunities for more responsive load the majority of the worldrsquos electricity usage is expected to remain under conventional pricing at least through the end of the decade and much longer in some areas Experience to date has shown that the traditional approaches to rate design persist well after the enabling technology is in place that leads to change
Time-Varying and Dynamic Rate Designhttpwwwraponlineorgdocumentdownloadid5131
This report discusses important issues in the design and deployment of time-varying rates The term time-varying rates is used in this report as encompassing traditional time-of-use rates (such as time-of-day rates and seasonal rates) as well as newer dynamic pricing rates (such as critical peak pricing and real time pricing) The discussion is primarily focused on residential customers and small commercial customers who are collectively referred to as the mass market The report also summarizes international experience with time-varying rate offerings
50 State Street Suite 3Montpelier Vermont 05602802-223-8199wwwraponlineorg
- Table of Contents
- Introduction
- California Pacific Gas and Electric Company
- Idaho Idaho Power Company
- Maryland Baltimore Gas and Electric
- Wisconsin Wisconsin Public Service Corporation
- Massachusetts National Grid
- Hawaii Hawaiian Electric Company
- Discussion of the Six Utilities Overall
- Conclusions
- Appendix
- Additional Resources
-

Decoupling Case Studies Revenue Regulation Implementation in Six States
19
34 DPU 07-50 (2007) p 87
35 ACEEE Massachusetts Available at httpaceeeorgsectorstate-policymassachusetts
36 Personal communication with National Grid
ing year to determine the per-kWh adjustment In order to provide a balance between providing the
Company with sufficient funds to ensure the safety and reliability of the distribution system and protecting ratepay-ers against the incentive the Company has to overinvest in infrastructure the mechanism limits the level of annual capital expenditures that is recoverable through the mecha-nism To arrive at the amount the Department set a limit of $170 million per year which is equal to the approximate three-year average of the Companyrsquos capital spending in previous years Should the Companyrsquos capital expenditures exceed this limit it may seek to include the investment in the rate base during the next base rate proceeding
The Company submits its CapEx filing no later than July 1 of each year On November 1 of each year the Company submits all other information in support of its proposed adjustment factors The factors will take effect on March 1 of each year
The authorized revenue is also adjusted to include a 50-percent sharing for earnings above the authorized ROE
Reconciling Actual Revenue With Authorized Revenue
Each year National Grid calculates on a rate class-spe-cific basis the difference between the actual distribution revenue billed to customers through distribution rates and the annual target revenue For each rate class the difference between the actual billed distribution revenue and the an-nual target revenue is summed to determine the Company-wide reconciliation amount That amount is divided by the Company-wide kWh forecasted for the upcoming year to arrive at a cent-per-kWh reconciliation charge or credit To determine the final adjustment for each rate class the Company-wide reconciliation adjustment is added to the rate class-specific adjustment resulting from the target rev-enue adjustment mechanisms
The adjustment to the authorized revenue in any year is capped at three percent of total revenues34 Any excess can be carried forward to a future year with carrying charges equal to the customer deposit rate
National Grid must report to the DPU if the difference between the year-to-date billed revenue and year-to-date annual target revenue equals or exceeds ten percent of the target revenue and the Company believes that the difference will fall outside of the ten-percent threshold in the coming months In this case interim revenue regulation adjust-ments can be made In order to avoid an interim adjust-ment too close to the scheduled annual rate adjustment
National Grid must notify the Department of variances exceeding ten percent of annual target revenue by August 31 of each year
Complementary Policies Massachusetts requires that electric utilities procure
all cost-effective energy efficiency before more expensive supply-side resources This requirement was translated into annual savings requirements for electric utilities starting from 1 percent of sales in 2009 to 14 percent in 2010 2 percent in 2011 and 24 percent in 2012 and potentially increased savings in subsequent years Utilities can earn approximately five percent of program costs for meeting or exceeding savings targets35
National Grid offers inclining block rates as the default residential rate but there is an optional TOU rate with peak and off-peak tiers also available to residential customers Small and large industrial and commercial customers can take service under flat rates inclining block rates or TOU rates
National Grid operates under a penalty and reward sys-tem for service quality established in Docket DTE 99-84 The impetus behind the DPUrsquos original establishment of the Service Quality Guidelines was to prevent Massachusetts utilities from allowing service quality to deteriorate under a new regulatory regime
Energy Efficiency OutcomesBefore Massachusetts Electric implemented revenue
regulation in 2009 it reported consistently high levels of incremental energy efficiency savings approximately 09 percent of retail load In 2010 the company reported 136 percent savings and 159 percent in 2010 and 2011 respectively36
ResourcesMassachusetts Department of Public UtilitiesDocket 09-39 Petition of Massachusetts Electric Company
(November 30 2009)
Decoupling Case Studies Revenue Regulation Implementation in Six States
20
37 Energy Agreement Among the State of Hawaii Division of Consumer Advocacy of the Department of Commerce amp Consumer Affairs and Hawaiian Electric Companies Available at httpwwwhecocomvcmcontentStaticFilespdfHCEIpdf
38 The HECO Companies described as follows in their Reply SOP in the Schedule A decoupling proceedings ldquothe
Hawaii Hawaiian Electric Company
Hawaiian Electric Company (HECO) uses a revenue regulation mechanism that compares actual revenue to target revenue in each year The target revenue is based on the authorized
revenue for the last test year adjusted for operation and maintenance (OampM) increases and rate base changes
HECO is a subsidiary of Hawaiian Electric Industries which also operates Maui Electric Company (MECO) and Hawaiian Electric Light Company these subsidiaries service the islands of Maui and Hawaii County while HECO serves Oahu (Honolulu)
Authority In 2008 the Governor of Hawaii the Division of Con-
sumer Advocacy and HECO entered into an agreement as a result of the Hawaii Clean Energy Initiative37 The agreement is intended to move Hawaii away from its dependence on imported fossil fuels for electricity and ground transporta-tion and toward locally produced renewable energy and energy efficiency In the agreement the State the Consumer Advocate and HECO committed to among other things a transition away from a model that encourages increased elec-tricity usage and to a model that implements revenue regula-tion decoupling to encourage the development of renewable energy by HECO The Commission opened Docket 2008-0274 in order to examine the features of a revenue regula-tion mechanism The Opening Order directed HECO and the Consumer Advocate to file a joint proposal on revenue regulation within 60 days This joint proposal was modeled closely after the California mechanism described earlier for PGampE with a rate-case determined revenue requirement plus annual attrition adjustments plus separate mechanisms
to recover power supply and energy efficiency costsThe Hawaii Public Utilities Commission approved
revenue regulation for HECO in August 2010 based on an investigation into the appropriateness of revenue regula-tion and its design The revenue regulation mechanism took effect on March 1 2011 This replaced a previous lost revenue adjustment mechanism
Authorized Revenue RequirementThe Commission establishes the Authorized Base Rev-
enues through a general rate case based on traditional cost-of-service ratemaking principles The Authorized Base Revenue is the annual amount of revenues required for the utility to recover its estimated OampM depreciation amorti-zation and tax expenses for the period
The Target Revenue is equal to the base revenue require-ment less any revenue being separately tracked or recov-ered through any other surcharge or tracking mechanism including revenue for fuel and purchased power expenses
The revenue regulation order also requires staggered triennial rate cases for each of the Hawaiian Electric Indus-tries Companies to determine approved baseline Revenue Adjustment Mechanism (RAM) inputs
Rate of ReturnThe Commission made no explicit adjustment to ROE
owing to the revenue regulation mechanism but noted that the allowed ROE of ten percent reflects the approval of revenue regulation and other cost-recovery mechanisms that will lower HECOrsquos business risk38 Most recently the Hawaiian Public Utilities Commission approved a 90-per-cent ROE for MECO reflecting both a lower baseline cost
Commission effectively reduced the Companiesrsquo return on common equity by 50 basis points to ldquofairly compensate ratepayersrdquo for what it perceived as the ldquorisk-reducingrdquo effects of the RBA and RAM mechanisms the Renewable Energy Infrastructure Program (lsquoREIPrdquo) Surcharge and the Purchased Power Adjustment Clause (ldquoPPACrdquo)rdquo Available at httpdmspuchawaiigovdmsDocumentViewerpid=A1001001A10L29B55326B47993
Decoupling Case Studies Revenue Regulation Implementation in Six States
21
39 Hawaii PUC Decision and Order No 31288 (2013 May 31) pp 97ndash112
40 Hawaii PUC Decision and Order No 31289 (2013 May 31)
41 Hawaii PUC Decision and Order No 31908 (2014 Feb 1)
42 February 7 2014 order on schedule A issues Available at httpdmspuchawaiigovdmsDocumentViewerpid=A1001001A14B10B22326F07922 p 42ndash47
of capital and a penalty of 050 percent associated with inadequate performance bringing renewable energy into the MECO system39 A companion Order also established new guidance on future revenue regulation mechanisms40
Revenue Adjustment MechanismThe RAM is designed to replace the need for annual rate
cases by adjusting Authorized Base Revenue levels to reflect estimated changes in the utilityrsquos cost of service The RAM is intended to via formula-driven estimates and escalators compensate the HECO Companies for changes in util-ity costs and infrastructure investment between rate cases and reduce the frequency of rate cases The RAM Period is the calendar year containing the Annual Evaluation Date (March 31 the date of the annual RAM filing) The RAM adjusts the revenue requirement according to changes in four main categories of expenses
bull Base expenses which are changes in designated OampM expenses
bull Rate base the return on incremental investment in designated rate base components41
bull The incremental depreciation and amortization expenses and
bull Exogenous tax changes changes in costs owing to significant changes in tax laws or tax regulations
Base expenses are segregated between labor and non-labor amounts The labor component is adjusted annually by the Labor Cost Escalation Rate reduced by the Labor Productiv-ity Offset (fixed at 076 percent) The non-labor component uses the Non-labor Escalation Rate to annually adjust those costs Tracked OampM expenses for fuel purchased power pension and post-employment benefits integrated resource planning DSM and other rate adjustment provisions are not adjusted in the RAM because any changes in these costs are accounted for in other cost-tracking mechanisms
The Rate Base equals the average net investment esti-mated for the RAM Period The average rate base is the rate base for the rate case test year with adjustments for changes in only four components of rate base (1) average plant-in-service (2) average Accumulated Depreciation (3) average accumulated contributions in aid of construc-tion and (4) average accumulated deferred income taxes All other components of the rate base remain the same as in the preceding rate case test year The average plant-in-service is equal to the average of the actual plant-in-service at the end of the year prior to the RAM period the Evalu-ation Year and the same year-end balance plus estimated plant additions for the RAM period Plant additions include
Baseline Capital Project plant additions and Major Capital Projects plant additions estimated to be in service by Sep-tember 30 of the RAM period
The RAM also includes an Earnings Sharing Revenue Credit mechanism in order to protect against excessive over-all utility revenue levels The RAM will escalate and update the Companyrsquos approved base revenue requirement reduced by earnings sharing credits and major project revenue credits to customers Based on the Companyrsquos achieved return on common equity for the Evaluation Year the mechanism cred-its the RBAs according to the following chart
ROE at or below the authorized ROE
First 100 basis points (1) over authorized ROE
Next 200 basis points (2) over authorized ROE
ROE exceeding 300 basis points (3) over
authorized ROE
Retained entirely by shareholders no customer credits
25 share credit to customers
50 share credit to customers
90 share credit to customers
Finally the RAM includes additional consumer protectionsbull A provision for Major Capital Projects Creditsbull A provision for Baseline Capital Projects Creditsbull Notification is provided to all affected customers of
the RAM filing in newspapers and billsbull Evaluation procedures for filing examination and any
exceptions to annual revenue regulation filingsbull Continued ability of HECO or the Consumer
Advocate to request formal rate proceedings to replace and terminate RAM at any time and
bull Formal review of revenue regulation as a part of the next round of rate case proceedings
A recent order42 added two additional consumer protections
bull A limitation that only 90 percent of the current
Decoupling Case Studies Revenue Regulation Implementation in Six States
22
43 ACEEE Hawaii Available at httpaceeeorgsectorstate-policyhawaii
RAM Period Rate Base that exceeds the Rate Base Adjustment Mechanism from the prior year can be included in the Decoupling Mechanism for baseline utility plant projects which unlike major capital projects are not subject to prior Commission review and approval and
bull A requirement to post a number of metrics online for customer review although not at this point tied to performance
This order also examined four issues with respect to the application of the RAM The Commission determined that the short-term debt rate as reflected in the most recent rate case should be used to adjust over- and under-collections The Commission also resolved its concern that without a sustainable business plan there exists no strategic frame-work under which to evaluate capital expenditure pro-grams The Commission required the parties in the Docket to further explore capital expenditure issues in conjunction with other risk-sharing mechanisms discussed elsewhere in the order The commission ordered a further evaluation of a proposed risk-sharing mechanism within the RBA Further-more the Commission ordered the parties to work together to establish appropriate metrics which the utility would report on its website
Once the total RAM Revenue Adjustment is calculated it is applied through a uniform adjustment to the per-kWh energy charge for all customer classes
Reconciling Actual Revenue with Authorized Revenue
RBAs record the monthly differences between target revenues and the adjusted recorded electric sales revenues The RBA also applies monthly interest equal to the annual rate for short-term debt from the cost of capital in each HECO Companyrsquos last base rate case to the simple average of the beginning and ending balances each month in the RBA In effect the RBA applies one-twelfth of the rate each month Finally the RBA provides for collection or return of the calendar year-end balances in the RBA and recovery of the RAM Revenue Adjustment over the subsequent May 1 through April 30 period The target revenue is the most recent Authorized Base Revenue or the re-determined Authorized Base Revenue calculated under the RAM
On or before March 28 the Company must file with the Commission a statement of the previous year-end balance in each RBA sub-account and the Authorized Base Revenue level for the current calendar year with supporting calculations An amortization of the year-end balance in the
RBA sub-accounts and the RAM Revenue Adjustment are recovered through the per-kWh RBA rate adjustments The rate adjustment occurs from May 1 of the current calendar year to April 30 of the next year
Complementary PoliciesCurrently electric utilities in Hawaii may use energy
efficiency to meet a portion of their Renewable Portfolio Standard requirements Starting in 2015 electricity savings from energy efficiency will be applied to the Statersquos Energy Efficiency Portfolio Standard which sets a target equivalent to 30-percent forecast sales by 2030 This goal is translated into a target of 14 percent annual savings HECO trans-ferred administration of all of its energy efficiency programs to a third party administrator in 2009 The administrator is compensated for satisfactory performance43
Because of its heavy dependence on petroleum as a generation fuel electricity prices in Hawaii are very high solar and wind are typically lower-cost resources for these systems HECOrsquos default residential rates are inclining block rates with a $900month customer charge and a three-block inclining rate design of $034kWh to $037kWh Residential customers can elect to take service under a TOU rate with off-peak mid-peak and priority-peak tiers Gen-eral service and large power service customers take service under a flat rate unless they opt to take service under a TOU
Hawaii is developing reliability standards in part as a response to deteriorating service quality as a result of distributed and customer-owned generation (see text box) In an effort to make electricity reliability and interconnection standards as transparent as possible the Reliability Standards Working Group was formed in the Feed-In Tariff docket and continues its work in Docket No 2011-0206 to find solutions to integrating high penetrations of renewable energy consistent with reliability and power quality standards
Energy Efficiency OutcomesHECO implemented revenue regulation in 2011 Since
2003 HECO has reported incremental energy efficiency savings between 0 and 05 percent of retail load with 131 percent savings reported in 2011 by Hawaii Energy the
Decoupling Case Studies Revenue Regulation Implementation in Six States
23
44 Hawaii PUC Decision and Order No 31288 Maui Electric Company Limited Docket No 2011-0092 (2013 May 31) Appendix C p 2
Statersquos ratepayer funded efficiency program administrator The company has not yet reported its savings for 201245 In addition HECO has seen more than a sixfold increase in renewable installations under its net metering and feed-in tariff policies since the inception of the revenue regulation plan
Revenue regulation represents a regulatory framework that removes the financial disincentive for utilities to pursue clean
energy strategies It doesnrsquot in and of itself align the utility business model with those utility policies and practices that address customer expectations In fact some commissions are concerned that it might create a dynamic in which the utility assured of its revenue needs becomes complacent and lacks motivation to innovate and develop strategies that may be more in line with the public interest
In a recent order (Docket 2011-0092 May 31 2013) the Hawaiian Public Utilities Commission addressed this big picture issue in a rate order for Maui Electric The Commission called out the management as lacking a long-term vision for creating customer value and expressed concern that ldquothe HECO Companiesrsquo over-reliance upon a link between the [Decoupling]
Agreement and utility financial health obfuscates utility performance and ultimately customer service and satisfactionrdquo44 The implementation of clean energy policies is not a singular goal but rather a policy that must be part of a larger effort to create customer value
The Commission laid out a hard path and a soft path to achieve the results they desire for consumers The hard path involves a closer examination of utility investments operations and expenditures The soft path is opened through the actions of management to create and execute a vision for the utility of the future The Commission remains committed to regulatory innovations that are in the public interest and will work with the utility consumer advocate and other stakeholders to create and implement this vision
The results of this effort will likely produce ideas and outcomes that will have applicability beyond this one utility
ResourcesHawaii Public Utilities CommissionDocket No 2008-0274 Final Decision and Order (August 31 2010)Docket No 2008-0083 Final Decision and Order (December 29 2010)Docket No 2011-0092 Final Decision and Order May 31 2013 including
Decision and Orders Nos 31288 and 31289Docket No 2013-0141 Final Decision and Order (February 1 2014) including
Decision and Order No 31908
45 EIA Form EIA-861 data files Available at httpwwweiagovelectricitydataeia861
Decoupling Case Studies Revenue Regulation Implementation in Six States
24
46 Lazar et al 2011
Discussion of the Six Utilities Overall
Authority The first step in implementing a revenue regulation
mechanism is to understand the authority of the regulating body the Public Utility Commission or PSC It is important for any Commission to clarify its justification for acting on revenue regulation in order to prevent any decisions from being overturned Over the years Utilities Commissions have relied on different justifications for implementing revenue regulation mechanisms Commissions have imple-mented revenue regulation at their own discretion justified by their directive to ensure safe reliable and economic public utility service to citizens to justify changing the regulatory environment In some cases the Commission is unable to engage on narrow issue ratemaking and rates can change only as the result of a full rate case In this case statutes must be amended to enable revenue regulation
In all of the case studies discussed here the Commis-sions first implemented revenue regulation at their own dis-cretion but each followed slightly different paths to do so The CPUC first implemented revenue regulation in 1978 at its discretion In 2001 after a period when mechanisms were suspended the California Legislature required that deviations from projected sales not result in under- or over-collections by utilities and so the CPUC re-implemented revenue regulation according to statutory requirement The Hawaii Public Utilities Commission implemented rev-enue regulation after an agreement between the utility the Governor and other stakeholders called for it In Idaho the Commission established a case in which to investigate rev-enue regulation and held a series of stakeholder workshops before implementing the policy The Massachusetts DPU adopted revenue regulation as a statewide regulatory policy and required individual utilities to file tariffs in response as the result of its general investigation into rate structures that promote demand-side resources The Maryland Com-mission implemented revenue regulation for BGE when the utility requested the mechanism Thus the impetus to develop a revenue regulation mechanism may come from different sources and the Commission may be comfortable
in moving forward under their general supervisory statutes Nevertheless specific statutory language can be helpful to shore up the existing authority
Authorized Revenue Requirement Under the traditional regulatory framework the Com-
mission (or other authority in the case of publicly owned utilities) must determine a utilityrsquos revenue requirement This function does not change under revenue regulation The revenue requirement of a utility is the aggregate of all the operating and other costs incurred to provide service to the public This typically includes operating expenses depreciation and the cost of capital invested including in-terest on debt and a ldquofairrdquo return on equity to investors The (simplistic) formula for determining revenue requirements is as follows
Revenue Requirements = (Rate Base times Rate of Return) + Operating Expenses + Depreciation +Taxes
Traditionally the revenue requirement along with sales is used to determine the rates consumers will pay for elec-tricity46 The rates are also broken down by customer class and intraclass tariffs are created based usually on a cost of service study that determines each customer class and subclass contribution to the utilityrsquos costs The (simplistic) formula for determining the rate per unit is
Rate = Revenue Requirement divide Units Sold
In this way rates are set to allow the utility to exactly recover its revenue requirement when the sales level used to calculate rates is equal to actual sales However it is important to recognize that actual expense and revenue varies with actual sales When actual sales are greater than the sales level used in ratemaking revenue increases and expenses increase by a different amount when actual sales are lower than the ratemaking sales level actual revenue
Decoupling Case Studies Revenue Regulation Implementation in Six States
25
declines and expenses decrease by a different amount Under revenue regulation rates are initially set in the same way but when actual sales differ from the level used to calculate rates the actual revenue level is maintained at the rate case amount as rates are allowed to vary inversely with salesmdashincreased sales lead to decreased rates and vice versa Because the primary expenses that change in the short run as sales levels change are power supply expenses and most regulators allow these to be tracked using a power cost adjustment mechanism revenue regulation mechanisms are generally designed to ensure recovery of the non-power costs (which do not change significantly in the short-run) as sales volumes change
Revenue regulation ensures that actual revenue is equal to the revenue requirement established by the Commission or appropriate authority Although the description above presents an overly simplified view of the revenue require-ment and its use in traditional price regulation and revenue regulation there are many variations on how a Commis-sion can establish a revenue requirement particularly when implementing revenue regulation With revenue regulation as in traditional ratemaking imprudent costs can always be removed from rates and there is no change to the ability of a Commission to impose penalties
Utility Functions to be IncludedFirst the regulator must determine which utility func-
tions will be included in the revenue regulation framework With vertically integrated utilities this usually includes a utilityrsquos regulated generation transmission and distribution units As we discuss below however it is critical to struc-ture power supply recovery mechanisms to avoid providing for double-recovery of certain power supply costs For utili-ties operating in areas of the country that have restructured electricity markets only the regulated distribution busi-ness is decoupled Utilities that also provide gas services
Pacific Gas amp Electric Future test year
Idaho Power Company Historic test year
Baltimore Gas amp Electric Hybrid test year
Wisconsin Public Service Corporation Future test year
National Grid Historic test year
Hawaiian Electric Company Future test year
Table 2
Test Year Used
may have their gas distribution business operating under revenue regulation as well
Test YearOne consideration in establishing the revenue require-
ment is what period of time will be used as a ldquotest periodrdquo or ldquotest yearrdquo The test year is the year on which the Com-mission will base its computations of the utilityrsquos total costs and sales levels A historic test year uses actual data on sales and costs from a past year Whereas a historic test year allows for the use of actual cost data it cannot account for expected variations in sales A future test year requires assumptions to be made about a utilityrsquos sales in a future year This can allow expected changes in sales like those from energy efficiency programs to be included in sales
projections however because regulators are relying on estimates provided by the utility there may be a greater risk for inaccuracy A Commission may also choose to use a test year that includes both past and future periods This may provide a sense of balance between historic and future data Furthermore as the case proceeds the Commission can require the utility to substitute historical data for projected data from the test year
Rate of ReturnAs in any rate case regulators
must determine the appropriate rate of return that a utility can earn on its investments including the cost of debt and the allowed ROE for its shareholders The approved ROE is only used to establish the return on investments that are included in the rate base when determining revenue require-
Pacific Gas amp Electric Electric generation and distribution gas distribution
Idaho Power Company Electric generation and distribution
Baltimore Gas amp Electric Electric distribution gas distribution
Wisconsin Public Service Corporation Electric generation and distribution
National Grid Electric distribution
Hawaiian Electric Company Electric generation and distribution
Table 1
Business Unit Included in the Revenue Regulation Model
Decoupling Case Studies Revenue Regulation Implementation in Six States
26
47 In a rate case the Commission determines an allowed return on equity This is used to set a price (price regulation) or an allowed revenue requirement (revenue regulation) Once set however the actual return earned by the utility is affected by anything that changes either revenue or expenses for example an increase in employee compensation a change in the number of employees or under price regulation a change in sales volumes
48 Lazar et al 2011
ments Although revenue regulation ensures that a utility recovers no more or less than its target revenue revenue regulation does not guarantee that the utility will earn the authorized ROE Depending on how a utility manages its costs between rate cases it will realize an actual ROE either higher (in the case of reduced costs) or lower (in the case of increased costs) than the authorized level47
A utilityrsquos allowed ROE generally represents the return deemed necessary to attract investment considering the level of risk of that investment Riskier investments require a higher return to attract investors and vice versa Util-ity earnings can be volatile because of short-run impacts on sales volumes and revenues which include changes in sales owing to weather economic conditions and energy efficiency and DG programs This volatility typically causes utilities to retain a higher level of equity in their capital structures so that reduced revenues do not leave them un-able to service their debt Revenue regulation can reduce this volatility by stabilizing revenues regardless of the cause Because of this reduced risk many stakeholders have proposed that the implementation of a revenue regulation mechanism be associated with a corresponding reduction in the utilityrsquos equity capital ratio (the percentage of capital supplied by common equity) This reflects the utilityrsquos more stable revenue owing to revenue regulation and reduces the overall revenue requirement that will be recovered from consumers48
An alternative option to reducing the utilityrsquos equity ratio is to reduce the ROE reflecting a lower risk level For the utilities included in these case studies only BGE and Mass Electric experienced a reduction in their ROE The Com-mission did not reduce BGErsquos ROE at the time the revenue regulation mechanism was implemented but reduced it by 50 basis points during the subsequent rate case The Mas-
sachusetts Commission did not reveal its adjustment but incorporated a lowered ROE into its decision
Absent an explicit adjustment to the cost of capital investorsrsquo expectations will adjust to the presence of rev-enue regulation if its presence is reliable The more stable earnings will likely in time contribute to a higher credit rating That in turn will lead to lower cost debt that will be revealed in future cost of capital calculations An adjust-ment to the ROE or capital structure by the regulator in a rate proceeding will be reflected immediately in lower rates to consumers simply allowing the utilityrsquos credit rating to improve over time and its cost of debt to decline will have the same effect but on a lagged basis as new bonds are is-sued at lower interest rates49
Beginning in 2004 Standard and Poorrsquos began publish-ing ldquorisk profilesrdquo for utilities which classified utilities based on their earnings variability and other risks those with more stable earnings were determined eligible for higher bond ratings at any given equity capitalization ratio (or alternatively able to retain a given bond rating with a lower equity ratio)50 One utility with a revenue regulation mechanism Northwest Natural Gas was believed to have had their business risk profile upgraded by one step in response to the benefits of the mechanism51
Effect on Bond RatingsRevenue regulation stabilizes a utilityrsquos revenue streams
reducing risk to investors this reduced risk may be a contributing factor in an increase in a utilityrsquos bond rating Bond rating agencies have recognized that revenue regula-tion mechanisms and other mechanisms that reduce net earnings volatility and risk contribute to a lower cost of capital for the utility52 Standard and Poorrsquos has explicitly stated that it ldquoviews decoupling as a positive develop-
49 Lazar et al 2011
50 Standard and Poorrsquos (2004 June 2) New Business Profile Scores Assigned for US Utility and Power Companies Financial Guidelines Revised
51 Christensen Associates (2005 March) A review of distribution margin normalization as approved by the Oregon Public Utility Commission for Northwest Natural
52 Lazar et al 2011
Decoupling Case Studies Revenue Regulation Implementation in Six States
27
This topic raises a note of caution if mechanisms are not well designed double-recovery of costs can occur for verti-cally integrated utilities that provide both power supply and distribution services For example if a per-customer
revenue regulation mechanism includes investment-related power supply costs in the revenue-per-customer formula but excludes fuel and purchased power costs that are recovered through a separate tracking mechanism double recovery of some power supply costs is likely If the utility experiences cus-tomer and sales growth the amount it recovers for investment-related power supply costs will go up However if that utility serves this growth by operat-
ing existing power plants more by selling less power on the surplus market or by purchasing power from other suppli-ers it will not incur any increases in the type of power sup-
53 Standard amp Poorrsquos (2008 February 19) Decoupling the vehicle for energy conservation
ment from a credit perspectiverdquo53 However in the case of the utilities examined in this report none experienced an improved credit rating after the implementation of revenue regulation with the exception of PGampE However PGampE came out of Chapter 11 bankruptcy in the same year that its revenue regulation mechanism was implemented mak-ing it impossible to attribute the improvement to revenue regulation alone Bond rating changes are generally slow to evolve Numerous other factors are taken into account when assigning an overall credit rating which appear to have outweighed any positive effect of revenue regulation These factors certainly include the recession of the US economy that began in 2007
Customer Classes IncludedWhen determining the target revenue for a utility rev-
enue regulation mechanism regulators must also consider which customer classes to include in the mechanism In some cases industrial customers have objected to a rev-enue regulation mechanism This is due to the wide dif-ference in rates among customers making the design of a revenue regulation mechanism more challenging If regula-tors choose to exclude a class of customers from revenue regulation they must determine the revenue requirement associated with serving only the included customer classes This generally requires a detailed cost of service study to ensure that revenue responsibility is accurately allocated by customer class
Included CostsFinally regulators may wish to exclude specific costs
from the overall revenue requirement if those costs will be tracked through another mechanism like fuel costs in a PCA mechanism energy efficiency program expenditures or smart grid costs for example Separate tracking mecha-nisms can also be used for those costs that are difficult to
Pacific Gas amp Electric All customer classes
Idaho Power Company Residential and small general service
Baltimore Gas amp Electric Residential and small general service
Wisconsin Public Service Corporation All customer classes
National Grid All customer classes
Hawaiian Electric Company All customer classes
Pacific Gas amp Electric
Idaho Power Company
Baltimore Gas amp Electric
Wisconsin Public Service Corporation
National Grid
Hawaiian Electric Company
Table 3
Customer Classes Included in Revenue Regulation Mechanism
Table 4
Costs Excluded From Revenue Regulation Mechanism
project based on historical data or costs over which the util-ity has very little control like fuel costs Although revenue regulation tracks collected revenue mechanisms like Fuel Adjustment Clauses Purchased Power Adjustments and Energy Efficiency Riders can be designed to track actual costs as well as collected revenue
Energy procurement costs
All variable costs
Energy supply costs
Energy costs
Energy supply costs for basic service customers transmission costs the energy efficiency system benefits charge and reconciling charge and costs recovered through the residential assistance adjustment factor
Fuel and purchased power
Decoupling Case Studies Revenue Regulation Implementation in Six States
28
54 We use the RAM term applied in Hawaii here to address any type of attrition or similar mechanism other than a revenue-per-customer framework that changes the allowed revenue between general rate cases
ply costs accounted for in the revenue per customer (RPC) calculation The increased power supply costs to serve that growth will be recovered through the fuel and purchased power tracking mechanism The net effect for the utility will be to recover incremental power supply costs twicemdashonce in the per-customer mechanism and again in the fuel and purchased power mechanism It is essential to make sure that the other adjustment mechanisms do not overlap the cost impacts that are treated in the revenue regulation mechanism One way to do this is to ensure that all power supply costs (investment labor fuel purchased power) are recovered through a single mechanism There are several ways to achieve this
a) A comprehensive power supply recovery mechanism that includes all power supply costs that is separate from the costs treated in the revenue regulation adjustment (eg Puget Sound Energy Washington State)
b) No power supply adjustment whatsoever with all utility costs included in an RPC mechanism (eg National Grid)
c) An annual attrition calculation with all costs reviewed for changes since the last proceeding (eg HECO)
Revenue Adjustment Mechanism in Revenue Regulation
A RAM54 is not necessary to achieve revenue regulation but provides attrition reliefmdashincreasing authorized revenue commensurate with increased costsmdashbetween rate cases Whereas revenue regulation sets a target revenue that the utility will earn regardless of sales levels the RAM adjusts the target revenue between rate cases Regulators may choose to take several different approaches to RAM
bull No RAM Regulators may choose not to implement a RAM leaving the revenue requirement unchanged between rate cases This requires the utility to request a rate case when it requires additional revenue to cover its costs
bull Stairstep Stairstep adjustments provide predetermined increases in target revenue These increases can be determined during a rate case and generally reflect forecasts of cost growth
bull Indexing Indexing ties adjustments to the target revenue to multiple factors like inflation productivity customer growth and changes in capital expenditures
bull RPC The RPC approach is a form of indexing RPC adjusts the total revenue requirement for the
number of customers served Regulators using an RPC mechanism will determine the revenue requirement per customer and the overall revenue requirement will be determined by multiplying the total number of customers by the revenue requirement per customer The amount of revenue required to serve each customer can be determined separately for customer classes and for existing and new customers This way the RPC method accounts for a utilityrsquos growth in fixed costs that is related to growth in the number of customers served RPC is useful where the correlation between cost growth and customer growth is significant It also protects customers from making up the deficit if there is a loss in customer load such as if a large business closes down or relocates
bull Hybrid Hybrid RAMs generally use stairstep increases to account for projected capital costs and indexing to account for OampM expenses
Adjustments from any type of RAM can be implemented automatically or through an attrition proceeding Some stakeholders oppose adjustments to the revenue require-ment outside of a rate case on the basis that this could allow the revenue requirement to increase significantly without examination of the impact on ratepayers or with-out due consideration of other costs and revenues For this reason some regulators choose to cap the total adjustment that can be made to the revenue requirement outside of a rate case
Table 5
Type of Revenue Adjustment Mechanism
Pacific Gas amp Electric
Idaho Power Company
Baltimore Gas amp Electric
Wisconsin Public Service Corporation
National Grid
Hawaiian Electric Company
Hybrid
RPC
RPC
RPC
No RAM potential capital expenditure adjustment
Hybrid
Decoupling Case Studies Revenue Regulation Implementation in Six States
29
55 Because this method results in changes in the price for service that are calculated after that service has been provided it fails the ldquono retroactive ratemakingrdquo statutes that guide most electricity regulators Customers are entitled to know the price of the commodity they are consuming at the time they use it
56 The closest to a current method in use for electric utilities in the BGE system of monthly reconciliation
Table 6
Tracking and Accrual of Difference BetweenActual and Authorized Revenue
Pacific Gas amp Electric
Idaho Power Company
Baltimore Gas amp Electric
Wisconsin Public Service Corporation
National Grid
Hawaiian Electric Company
Track Difference
Monthly
Monthly
Monthly
Yearly
Yearly
Monthly
Accrual Period
Year
Year
Month
Year
Year
Year
Calculation of Actual RevenueRegulators have options when ensuring that actual
revenue equals target revenue under revenue regulation First regulators must decide how to determine ldquoactual revenuerdquo In most cases actual revenue simply equals the amount of revenue a utility collects from its customers The Idaho Public Utilities Commission however has chosen to use weather-normalized revenues as the basis for utility revenues in revenue regulation Although this prevents the utility from recovering revenue lost to it owing to milder than expected weather it further complicates the revenue regulation mechanism and reduces its risk-reduction ben-efits By the same token if weather is severe and increases sales above the revenue requirements weather normaliza-tion would allow the utility to retain some of the revenues
Next regulators must determine whether to implement revenue regulation using a current or accrual method
bull Current Method With the current method of revenue regulation the target revenue for a period say a month is divided by the actual sales in that period to determine the rate per kWh The current method ensures that actual revenue equals target revenue by calculating the rate at the end of the period so that the target revenue can be recovered The current method allows for no lag in revenue recovery One effect of this method is that although customer rates vary total bills are generally more stable For example in a hotter than expected July customers will purchase more kWh but they will be charged a lower rate A milder than average winter would lead to fewer sales but at slightly increased rates This way customers do not experience the same bill variability as they would if rates were set before the sales deviations occurred On the other hand the current method does not provide customers with the ability to plan ahead based on a predictable rate for electricity This method has been used for revenue regulation of natural gas utilities55
bull Accrual Method Under the accrual method rates are set based on an assumed sales level and the differences between actual and target revenue are allowed to accrue over some period Then the total difference between actual and target revenue is reconciled through an adjustment to rates in the subsequent period this is known as the true-up process Presently all revenue regulation mechanisms for electric utilities use the accrual method56
If regulators use the accrual method of revenue
regulation they will next need to determine the period over which the difference between actual and target revenue will be allowed to accrue One year is typical however shorter periods are also used Next the frequency of comparing collected revenue to target revenue should be determined It is possible to do this comparison only once at the end of the accrual period It is common however for comparisons to occur more frequently often monthly When revenues are compared within the accrual period the differences are tracked generally for the purpose of applying interest to the difference that will be deferred until the end of the accrual period
Rate AdjustmentsIn designing a revenue regulation mechanism there are a
number of decision points that regulators need to consider to balance the interests of all the stakeholders One of the decision points revolves around the determination of the mechanism used to adjust rates The issues that regulators need to consider include the following1 Rate Case Requirements One of the often-mentioned
concerns about surcharges especially when they are numerous is how that will impact the frequency of rate cases For regulators and stakeholders rate cases provide
Decoupling Case Studies Revenue Regulation Implementation in Six States
30
the best mechanism to correctly align rates and costs but they are time-consuming and expensive for all parties This is because a rate case presents an opportunity to closely examine all of the utilityrsquos expenses and adjust rates to reflect cost increases and decreases Because under a revenue regulation mechanism the goal is to match revenues received from all customers with revenue requirements a correct determination of revenue requirements is important as is the specification of appropriate cost indices to adjust the revenue requirements As the time between rate cases increases some regulators feel the base rate case data even with adjustments need to be reexamined As a result some regulators have chosen to mandate the frequency of rate cases to address this whereas others have not It may be that in some cases where there are numerous surcharges recovering a multitude of costs there may not be as many costs subject to review in the rate case making it less significant to a regulator than a case in which most costs are being analyzed and recovered in the rate case itself
2 Collection Mechanism Integrally tied to the mechanism for recovering revenues is how the utility will collect or refund the revenues Options that are available include recovery through a rate case or periodic adjustments to rates through a surcharge mechanism As can be seen by the case studies depending on the plan in place some utilities have very discreet requirements dictating the frequency of rate cases with adjustments occurring in those cases or between those cases Other utilities have no requirements upon them with respect to the frequency of rate case filings This will be discussed in more detail below What does emerge from these case studies is that the discreet components or choices in how to execute a revenue regulation plan are carefully interwoven to create a holistic approach Each component works with the other and the value of this case study is in examining the different pathways that can be chosen As discussed previously some of the commissions have authorized revenue regulation to recover the revenue requirements in the last rate case whereas others have authorized adjustments to rates between rate cases this impacts the pathway that the adjustment mechanism takes
3 Timing How often should rates be adjusted to true up to the utilityrsquos revenue requirement States have chosen different options ranging from monthly to annually
4 Allocation of Revenue Regulation Revenue Surpluses or Deficits There are a number of decision points regarding allocation Should the revenue regulation apply to all rate classes or just the smaller customers whose usage per customer and load variations are not as dramatic as those of larger-use customer classes Should there be a different allocation to each rate class or should the allocation of costs among the classes be the same Different mechanisms accomplish different goals Some states have allocated revenue regulation revenues based on the revenues lost by customer class as a result of energy efficiency This can sometimes be a political decision to mitigate opposition to energy efficiency programs by large customers Other states recognize that the system savings resulting from energy efficiency benefit all customers so that all customers should pay equally
5 Carrying Charges Depending on the timing issue discussed previously regulators may want to consider carrying charges on any adjustments This should be symmetrical in its application however so that it applies to surcharges and refunds Consideration should be given for the basis of the carrying charge rate whether weighted average cost of capital rate of return a risk-free rate or some other mechanism should be adopted
6 Rate Caps In order to mitigate potential rate impacts a regulator may want to consider a cap on how much rates can go up when the revenue regulation adjustment is made This might be more critical if the regulator is aware of other potential rate increases that will impact customersrsquo bills If a cap is used the case in which the utilityrsquos adjustment would exceed the cap must be considered Some regulators have opted to allow the utility to carry over the excess unrecovered amount for a period of years whereas others do not This allows the utility to recover those revenues in a subsequent year when perhaps the adjustment is less As a practical matter however adjustments of greater than three percent are less common as shall be discussed later
7 Impact on At-Risk Consumers Low-income and consumer advocates have expressed concern about revenue regulation as a vehicle for annual rate increases without the scrutiny of a general rate case creating rate increases for the low-use customers doing the most to constrain usage and help achieve targeted energy savings One proposal to address this has been to impose any resulting surcharges only to above-average usage
Decoupling Case Studies Revenue Regulation Implementation in Six States
31
57 Cavanagh and Howat (2012 May 2) Finding common ground between consumer and environmental advocates Electricity Policy
58 The most common criticism of future test years is that utilities forecast costs under an assumption that all authorized personnel positions will be filled while in retrospect any large organization has some level of vacancy in its employee count A historic test year captures this effect fully
customers and any resulting credits only to below-average usage57
Rate Case RequirementRequirements as to the frequency of rate cases can be
tied to the recovery mechanism or to the entire regulatory framework for implementing revenue regulation In the cases studied two of the utilities require periodic rate cases PGampE every three years and WPS every year Two others National Grid and HECO require annual mini rate cases explained later in which adjustments are made and two others IPC and BGE have no requirements for scheduled rate cases Nevertheless if the concern is to ensure that the utilityrsquos revenue recovery meets its revenue requirements some kind of periodic rate case to examine costs is appropriate Having periodic rate cases can provide a measure of assurance to consumer advocates that the level at which the revenues and hence the rates are set is correct One of the criticisms of revenue regulation is in fact the lack of rate cases to produce a proper level of confidence in the allowed amounts Multiple surcharges are usually additive to existing rates therefore not permitting an opportunity to reduce the base rate for reductions in cost Moreover the infrequency in cases impedes the examination of rate allocations as would occur through a cost of service study
This is a particular issue where utilities are augmenting power supply with purchased power from independent power producers which is the most common method for acquiring wind and solar production today The increased cost for purchased power may flow through a fuel and purchased power adjustment mechanism while the (depreciating) investment in conventional power plants remains static in base rates
Both PGampE and WPS use a future test year that allows the utility to project revenue requirements during the time period that the rates are to be in effect The benefit to this is that it can help identify and account for projected changes in costs over the timeframe between rate cases However given that these costs are utility projections most consumer advocates have less confidence in these numbers than they would using actual numbers from a historical or only hybrid test year58 When trying to garner support for revenue regulation from more skeptical stakeholders using a future test year may not be helpful Furthermore in the case of WPS that has annual rate cases using a future test year becomes less justifiable as revenues are recalculated annually anyway
The absence of a rate case requirement can also cause consternation among detractors of revenue regulation because of the belief that the utility will be guaranteed its revenue requirements for as long as it is satisfied with that level irrespective of how well it manages However this is no different from the status quo in traditional regulation in most places The incentive to manage well is always there with or without revenue regulation as it translates into more profit for the utility
In the cases of HECO and National Grid the mini rate cases serve two purposes In the one instance it serves as a means to reconcile revenue recovery with revenue requirements and in the second instance it provides an opportunity to adjust rates in accordance with changes in costs Specifically for National Grid the revenue requirement is adjusted to reflect capital expenditures For HECO revenues are adjusted to reflect changes in the cost of service In the two examples here revenue regulation is wrapped in with other adjustments as part of a mini adjustment Given the structure for determining revenue requirements which accounts for changes in costs including revenue regulation within the mini rate cases is a workable option
These examples highlight how rate cases can be used to adjust revenue requirements either in a more controlled regulatory environment with frequent rate cases or left to the utilityrsquos discretion to decide when to adjust costs A set schedule of periodic rate cases such as that used by PGampE may strike an appropriate balance for reviewing revenue requirements however with the modification of a partial historical partial forecasted test year Frequent rate cases can depending on the resources of the regulator and stakeholders be too costly and time-intensive When there are too many rate cases stakeholders and regulators may not be able to dedicate the level of resources needed for any one proceeding and may be spread too thin Regular known rate cases at reasonable intervals may strike the best balance of adequate review and adjustment of revenue requirements
Decoupling Case Studies Revenue Regulation Implementation in Six States
32
Collection Mechanism and TimingThe collection mechanism for the differential between
actual and authorized revenue requirements varies by util-ity as well Both PGampE and WPS do not have adjustment clauses or surcharges but instead have structured their revenue regulation plans to recover their costs in a rate case with rates adjusted annually Although PGampE has rate cases every three years the utility files its preliminary forecast every September 1 for the following year including adjust-ments for revenue regulation and other costs This practice promotes transparency keeping all stakeholders aware of the current situation of the utility IPC BGE National Grid and HECO use surcharges on customer bills to collect or credit the difference between actual revenues collected and the revenue requirement Although the other three (IPC National Grid and HECO) calculate the rate adjustment annually only BGE does a more contemporaneous adjust-ment of one month Certainly where there are no regularly scheduled rate cases using an adjustment mechanism becomes more critical PGampE has created a tracking mecha-nism known as a balancing account that allows the utility to track the surpluses and deficits to help ensure accuracy at year end when rates are actually adjusted The creation of such monthly balancing accounts will make it easier at the end of the year to track what happened each month and then determine the adjustment for that year It provides a more detailed trail for review and analysis by stakeholders and regulators However other mechanisms that just look at total revenues as compared to revenue requirements at the end of the year can work as well
Table 7
Rate Case Requirements
Table 8
Rate Adjustments
Table 9
Allocation of Surplus or Deficit
Pacific Gas amp Electric
Idaho Power Company
Baltimore Gas amp Electric
Wisconsin Public Service Corporation
National Grid
Hawaiian Electric Company
Pacific Gas amp Electric
Idaho Power Company
Baltimore Gas amp Electric
Wisconsin Public Service Corporation
National Grid
Hawaiian Electric Company
Pacific Gas amp Electric
Idaho Power Company
Baltimore Gas amp Electric
Wisconsin Public Service Corporation
National Grid
Hawaiian Electric Company
Every three years annual ldquoattritionrdquo adjustments in between
No requirement
No requirement
Annual rate case
Annual capital expenditure adjustment case
Abbreviated annual rate case
Base rates adjusted annually
Annual adjustment through surcharge
Monthly adjustment through surcharge
Annual adjustment through rate case
Annual adjustment
Annual adjustment
Allocated to all customers according to business unit (eg electric distribution electric generation)
Included in the annual adjustment mechanism for each customer class
Separate for each customer class
Allocated to all customers except certain tariffs (see above)
Separate for each customer class
Separate for residential and commercialindustrial
Allocation of Revenue Regulation Revenue Surpluses or Deficits
The allocation of revenue regulation revenue surpluses or deficits should be symmetrical so that overpayments are credited to customers just as underpayments are paid by those same customers The six utilities studied fol-low that formula The application of revenue regulation however varies from utility to utility BGE and IPC ap-ply revenue regulation to the residential and commercial classes thereby excluding industrial customers In contrast however PGampE WPS National Grid and HECO allocate revenue regulation adjustments to all customer classes In terms of how the costs are allocated IPC BGE WPS National Grid and HECO allocate costs differently among the customer classes PGampE however allocates costs uni-formly among the customers Because PGampE has separated its business units it also separately calculates and allocates
Decoupling Case Studies Revenue Regulation Implementation in Six States
33
Table 10
Carrying Charges
Table 11
Cap on Rate Adjustment
Pacific Gas amp Electric
Idaho Power Company
Baltimore Gas amp Electric
Wisconsin Public Service Corporation
National Grid
Hawaiian Electric CompanyPacific Gas amp Electric
Idaho Power Company
Baltimore Gas amp Electric
Wisconsin Public Service Corporation
National Grid
Hawaiian Electric Company
None
Yes
None
Yes at the short-term debt rate
Yes at the customer deposit rate
Yes at the customer deposit rateNo
3 rate cap excess carried over to next period
10 rate cap excess carried over to next period
Cap of $14 million per year
$170 million in CapEx
No
revenue regulation surpluses and deficits among its electric distribution gas distribution and electric generation busi-nesses This illustrates that there are several ways to address revenues from revenue regulation depending on the policy outcomes that are desired
Carrying ChargesCarrying charges applied to uncollected or surplus rev-
enues can be used to account for the time value of money and the lost opportunity or value to having those revenues in hand PGampE and BGE do not accrue carrying charges On the other hand IPC WPS National Grid and HECO do For BGE given that the revenue regulation revenues are reconciled and recovered monthly it would make little sense to include a carrying cost Where carrying costs have been used they have included in the cases of these utili-ties the short-term debt rate or the customer deposit rate which for one utility is six percent and probably close to the short-term debt rate Thus the carrying charge rates are appropriately at the lower end of the spectrum reflecting their short-term nature In the application of the carrying charge symmetry should be preserved by applying it to both deficits and surpluses Application of carrying charges given the short period that costs are carried (one year) is somewhat discretionary Although it does more accurately account for costs it does add a modest level of complica-tion in tracking costs
Rate Caps and CollarsOne of the ways to protect customers in the event of sig-
nificant adjustments is to impose a rate cap (or collar) that limits the amount of a rate increase (and decrease) Some customers are sensitive to changes in foundational costs like utility bills and if costs are going to rise they benefit from a pattern of steady modest increases rather than a large step increase Any structural increases in rates attributable
to reductions in sales or increases in costs recognized by the revenue regulation plan would be eventually included in rates under any system A cap reflects a controlled way to manage customer expectations and customer impacts Structural changes can only be managed for a while until a complete rate case is needed to reset all assumptions
Typically when a rate cap is imposed if the formulaic increase exceeds the cap or collar the utility will be able to carry over any uncollected revenues until the next rate adjustment Two of the utilities studied PGampE and HECO do not have rate caps On the other hand the other four utilities do include rate caps in varying amounts National Grid has a one-percent revenue cap whereas IPC and BGE have a one-percent and a ten-percent rate cap respectively WPS unlike the others has a cap tied to the dollar amount of $14 million as opposed to a percentage Consistent with the goals of revenue regulation all of the utilities studied have a carryover provision that is important for reducing the risk that the utility will not recover its revenue require-ments
Note that National Grid differs from BGE and HECO in that its cap is on revenues whereas the other two utilities cap rates and rate impacts A revenue cap is more focused on ensuring minimal change to the revenue requirements authorized by the commission National Grid as discussed previously allows for mini rate cases to adjust the rev-enue requirements Having the one-percent cap limits the amount of increase that can occur through that process requiring revenue changes that are greater to occur in a full rate case However note also that some of the adjustments allowed in the mini rate case have their own separate cap The IPC rate cap is in line with what many other utilities with caps have in place which generally range from one to three percent The ten-percent rate cap in the BGE plan is
Decoupling Case Studies Revenue Regulation Implementation in Six States
34
59 Morgan P (2012 December) Graceful Systems LLC A decade of decoupling for US energy utilities rate impacts designs and observa-tions p5
reflective of its monthly adjustment pattern An annual ad-justment allows more time to smooth out peaks and valleys in revenues whereas a monthly adjustment will be influ-enced by more of the spikes (particularly weather-driven variation) thus the need for a larger bandwidth for the car-ryover Like a variable energy rate or fuel adjustment clause that fluctuates monthly the monthly adjustment introduces more volatility into the rates
Actual Historical AdjustmentsFor many ratepayer advocates there is a concern that
some of the utility management risk will be transferred to customers as a consequence of a policy that seeks to ensure that the utility will be made whole However the utility re-tains management risk and the requirement to demonstrate that it has acted prudently Thus the utility still has just as much of an incentive to operate efficiently as it did without revenue regulation If the utility can lower its costs it can still increase its profits Second by designing rates symmet-rically such that under- and over-recoveries are reconciled it provides customers with an opportunity to obtain credits that under traditional regulation would be retained by the utility It has often been opined that when there are large
gaps in time between utility rate cases it is because the utility is over-earning and exceeding its revenue require-ments In those instances customers never get to examine what the utility is collecting much less receive a refund Under revenue regulation with its periodic adjustments and scheduled general rate cases the revenue requirements are examined and refunds or credits allocated such that customers have a better knowledge base for understanding the utilityrsquos earnings And annual reconciliation of the util-ityrsquos actual revenues versus authorized revenues provides consumers with a tool to reign in excess revenue recovery beyond authorized amounts Third the adjustments that do occur under revenue regulation are manageable and frequently less than the adjustments customers are used to seeing on their bills for fuel or variable generation rates or for the myriad of other surcharges that can be tacked on to a customerrsquos bill such as an infrastructure (smart grid) sur-charge maintenance upgrade fee regulatory asset charge or system benefit charge
As seen in Figure 1 the range of rate impacts cluster around plus or minus two percent but can at times exceed plus or minus five percent The total of surcharges has somewhat exceeded the total of credits
Figure 1
Total Utility Decoupling Adjustment Rate Impacts59
300
250
200
150
100
50
0
Nu
mber
of
Dec
oup
lin
g A
dju
stm
ents
Over -5 -4 to -5 -3 to -4 -2 to -3 -1 to -2 0 to -1 0 to 1 1 to 2 2 to 3 3 to 4 4 to 5 Over 5
Percentage Rate Impacts
SurchargesRefunds
ResidentialAll
Other
Commercial
Total
Decoupling Case Studies Revenue Regulation Implementation in Six States
35
60 Id p 3
61 Schultz T Energy Efficiency at Idaho Power Available at httpwwwenergyidahogovenergyalliancedida_powerpdf
As can be seen with the utilities studied above the larger fluctuations are attributable to adjustment mechanisms that are reconciled more frequently such as monthly as those are less able to smooth out anomalies as an annual adjust-ment would do From a dollar perspective for the roughly 64 percent of adjustments that fall within the plus or minus two-percent range the monthly bill impact is approxi-mately $230 for average electric customers and $140 for average gas customers60
Of the six utilities studied the fluctuations in adjustment have for the most part stayed within the one- to three-per-cent range as shown below
bull PGampE from 2005 to 2012 has had annual revenue regulation adjustments ranging from minus143 percent to 415 percent with an average adjustment of 197 percent
bull For IPC the adjustments are separated between residential and commercial customers For residential customers the annual adjustments from 2007 through 2011 ranged from 077 percent to 258 percent for an average of 162 percent As for the commercial customers the annual adjustments for that same period were higher ranging from 104 percent to 424 percent with an average adjustment of 252 percent
bull BGE has monthly adjustments that ranged from minus1853 percent to 3013 percent with an average of 057 percent for residential customers from March 2008 through August 2012 For General Service Customers the monthly adjustment ranged from minus2264 percent to 2462 percent The average adjustment was 1308 percent
bull For WPS the annual adjustments from 2009 through 2011 ranged from minus145 percent to 378 percent for residential and small commercial and from minus314 percent to 899 percent for commercial Note that because of a $14 million per year cap some of these percentages were carried over The average annual adjustment for residential and small commercial and for commercial was 163 percent and 215 percent respectively with carry-overs to subsequent years
bull For Massachusetts Electric and Nantucket Electric both of which operate under National Grid the annual revenue regulation adjustment for all for 2011 and 2012 was minus0105 percent and 0315 percent for an average revenue regulation adjustment over the two years of 0105 percent
bull HECO like National Grid has one annual revenue
regulation mechanism for its customers which resulted in adjustments in 2011 and 2012 of 063 percent and 107 percent respectively for an average adjustment of 085 percent
As can be gleaned from the above information the range of average adjustments for small use customers was a low of 0105 percent for National Grid to a high of 197 percent for PGampE For larger use customers the range was a low of 0105 percent for National Grid to a high of 252 percent for IPC This demonstrates that on average for these utilities with well-developed and diversely designed revenue regula-tion proposals their adjustments on average stayed at or below approximately 25 percent
One of the metrics for determining if a revenue regula-tion program is working successfully that was discussed above was the impact on rates of a revenue regulation mechanism As can be seen by the analysis of the adjust-ment levels for each of the utilities they are within a rea-sonable range
Complementary Policies Although a revenue regulation mechanism does not need
to be accompanied by other policies energy efficiency is frequently at the root of the reason revenue regulation was proposed in the first place The states examined in this pa-per have various obligations for energy efficiency achieve-ment placed upon their utilities Only Idaho does not have an Energy Efficiency Resource Standard but energy efficiency objectives are developed through an integrated resource plan process Energy efficiency spending at IPC has increased dramatically in recent years61
In recognition of the fact that revenue regulation only removes the disincentive to pursue energy efficiency several states have instituted some form of incentives to reward the desired outcome This mechanism can not only incentivize management to aggressively pursue energy efficiency but also make shareholders supportive in the face of lost invest-ment opportunity
Rate design can also play an important part in assist-ing the utility in achieving favorable energy efficiency outcomes Inclining block rates penalize inefficient use of electricity and shorten payback times from the customer perspective Because efficiency reduces consumption at
Decoupling Case Studies Revenue Regulation Implementation in Six States
36
62 Optional rate designs for PGampE include TOU and Peak Time Pricing
63 IPC also has an optional TOU rate design
64 Optional rate designs for this utility include TOU Critical Peak Pricing and Contract
65 National Grid also offers optional TOU and flat rate designs
66 HECO also offers optional TOU and flat rate designs
67 See eg Alexander B (1996 April) How to construct a service quality index in performance-based ratemaking Electricity Policy
the tail block rate the value of kWh savings is greater than with flat rates On the other side of the spectrum declining block rates which have a reduced rate in the tail block do little to encourage conservation In fact they operate more like a discounted bulk rate by reducing the average cost of a kWh in a customerrsquos bill for the more kWh used
Performance incentives or other ways to avoid destruc-tive cost-cutting in the name of creating margins that reduce service or reliability or lessen customer value have been implemented only in Massachusetts of the six utilities illustrated here Several other states have implemented vari-ous schemes in reaction to perceived deficiencies in utility service67 Performance incentives are not unique to rev-enue regulation Commissions wishing to implement such a scheme can find many models of incentive reward and penalty mechanisms developed for other purposes
Taken together a suite of policy and program features can create an atmosphere that is conducive to achievement of energy efficiency goals within the utility and for the customers By appropriate application of these techniques regulators working with utilities and stakeholders can remove barriers and create an opportunity for energy ef-ficiency to be fully integrated into the utility supply option portfolio
Energy Efficiency OutcomesAlthough revenue regulation itself does not create an
incentive for a utility to implement energy efficiency it does address the issue of lost revenues associated with energy
Table 12
Complementary Policies for Energy Efficiency
Pacific Gas amp Electric62
Idaho Power Company63
Baltimore Gas amp Electric
Wisconsin Public Service Corporation64
National Grid65
Hawaiian Electric Company66
Energy Efficiency Requirement
1 annually
IRP
10 by 2015
075 annually
24 annually
Energy efficiency can satisfy portion of RPS
Default Residential Rate Design
Inclining block
Inclining block
TOU seasonal
Flat
Inclining block
Inclining block
Incentive Structure
Risk reward incentive mechanism
No
No
No
5 of program costs
Third-party administrator paid for contract performance
Performance Incentives
Reliability reporting only
None
Under consideration
Reliability reporting only
Service quality reward and penalty
Under consideration
efficiency and DG programs Revenue regulation should be combined with other mechanisms that require or incentiv-ize the implementation of energy efficiency by the utility or a third party The level of energy efficiency achieved can be one measure of the success of a revenue regulation mechanism as implemented in a larger program designed to achieve energy efficiency Table 13 shows the incremental annual energy efficiency savings reported by each utility with the shaded box indicating the year that the utilityrsquos revenue regulation mechanism was implemented National Grid had achieved a high level of energy efficiency savings in the years before it implemented revenue regulation
This paper has not evaluated DG outcomes to correlate with revenue regulation as it is not perceived that states and utilities have made that connection expressly in histori-cal mechanisms However it is expected that this connec-
Decoupling Case Studies Revenue Regulation Implementation in Six States
37
68 EIA Form EIA-861 data files Available at httpwwweiagovelectricitydataeia861
69 PGampE began revenue regulation in 1974 and it was later suspended and recommenced in 2001
70 WPS savings are represented by the statewide program savings from the Focus on Energy program WPS provided additional funds to Focus on Energy starting in CY10 through their territory-wide program activities
71 In 2009 Hawaii Energy a ratepayer-funded statewide energy efficiency provider began delivering services Savings reported after 2009 represent savings achieved through the programs of Hawaii Energy
Table 13
Annual Incremental Energy Efficiency Savings as Percentage of Retail Sales68
Highlighted cells are the year that utility started decoupling
Pacific Gas amp Electric69
Idaho Power Company
Baltimore Gas amp Electric
Wisconsin Public Service Corporation70
National Grid
Hawaiian Electric Company71
2004
11
01
00
03
11
00
2005
16
03
00
03
09
05
2006
10
05
00
03
12
05
2010
19
13
17
09
136
12
tion will be made in future mechanisms and furthermore it is anticipated that follow on work to this paper will want to study that connection between revenue regulation and DG performance
Conclusions
An increasing number of states are looking to increase the rate of energy efficiency investments for their long-run cost and risk advantages The benefits of energy efficiency include not only its ability to reduce system costs across the distribution transmission and generation functions but also the opportunity for customers to reduce their individ-ual energy costs for their own electric bills Nevertheless it is counterintuitive to encourage or order a utility to sell less of its product In order to encourage the proliferation of en-ergy efficiency programs as a solution that can contribute to this nationrsquos energy needs this tension between the goals of society versus the goals of the utility needs to be addressed Revenue regulation can be such a solution by removing the link between sales and revenues
There are many ways to implement revenue regulation and multiple decision points that regulators must consider in designing a revenue regulation mechanism This paper focused on six utilities each of which implemented revenue regulation in different ways in accordance with the objectives of that state Different decision points discussed include
bull Should revenue regulation apply to all functions (generation transmission and distribution) which sometimes depends on if the utility is regulated or restructured
bull Should revenue regulation apply to all customer classes
bull Should there be symmetry such that a reconciliation adjustment occurs for both over- and under-recoveries of the revenue requirements
bull Should recovery of indicated surcharges be conditioned on acceptable performance on customer service quality or energy efficiency goals
bull Should there be an attrition adjustment to account for other expenses or should the revenue regulation adjustment be limited to reconciling existing revenue requirements
bull Should there be an inflation adjustmentbull To calculate the revenue requirements should the
current or accrual method be usedbull Should the adjustments be made in rate cases or
through a riderbull How frequently should adjustments be made
monthly annually or some other time periodbull Depending on the period of time between true up and
recovery should there be carrying charges and if so how should they be calculated
2007
21
06
00
03
09
04
2008
35
10
05
09
05
05
2009
20
11
06
10
11
11
Decoupling Case Studies Revenue Regulation Implementation in Six States
38
72 Avista Utilities (2009) Washington Utilities and Transportation Commission Docket UE-090134
bull Should there be a requirement authorizing the frequency of rate case
bull Should there be an annual cap on the amount of the adjustment and if so should there be an opportunity to carry over any additional amounts and for how many years
bull Should there be an adjustment to the cost of capital to reflect the reduced risk
Other considerations for regulators whether or not they implement revenue regulation but certainly as part of a comprehensive package are other measures that can be put in place to encourage consumers and utilities alike to actively participate in energy efficiency For example an inclining block rate structure by virtue of its incentive to consume less pairs well with an energy efficiency program helps drive consumers to participate in efficiency programs and accelerates the payback of an energy efficiency investment By the same token an incentive payment to the utility helps provide its management with a good reason to excel and exceed targets for energy efficiency programs
A key point illustrated by the list of considerations above is that there is not just one static way to design and implement revenue regulation but rather there are a variety of options for doing so In this study a diverse group of utilities were reviewed The differences among the utilities included geographic diversity vertically integrated and restructured utilities different levels of energy efficiency in place and certainly differences in how the revenue regulation mechanisms were implemented No two utilities were alike and no two utilities had the same revenue regulation mechanism The key is that revenue regulation should eliminate the throughput incentive but the means for accomplishing this goal can vary and be tailored to each jurisdiction and each utility and still be successful
There are several considerations in the design of a revenue regulation mechanism that can help ensure its successful adoption To begin revenue regulation should be granted to utilities only as a precondition to implementing comprehensive energy efficiency andor DG policies Unless accompanied by a commitment to engage in providing least-cost resource options that could impact sales there is not really any good policy reason for its adoption All of the utilities studied are actively engaging in energy efficiency Furthermore as a matter of fairness the revenue regulation mechanism should be symmetrical so that any revenues above those authorized are refunded back to consumers As Figure 1 demonstrates although there are more surcharges to customers there is nevertheless a healthy amount of
credits back to consumers This is the bargain Barring imprudence or other unforeseen circumstances the utility receives its authorized revenue requirements and nothing more or less under a simple revenue regulation mechanism
Rate design plays an important role in the effectiveness of energy efficiency in concert with revenue regulation A low customer charge is preferable so that the customer can benefit from real bill reductions tied to reduced volumetric consumption Reductions in consumption not only reduce bills but also positively impact the payback period for investments in energy efficient appliances Declining block rates in which the tail block rate is lower than the first tier also do not encourage conservation Inclining block rates that reward low usage in the first block with a lower rate send the better price signals None of the six utilities studied had declining block residential rates They were inclining flat and time-varying
The revenue adjustment mechanism is also a critical decision point in terms of whether a revenue per customer mechanism is adopted that accounts for only the current revenue requirements or whether latitude is given to include an inflation adjustment or other cost increases in the revenue adjustment mechanism Three of the utilities studied adopted this approach whereas another two used a hybrid approach Finally to reduce volatility five of the six utilities opted for annual rather than monthly adjustments thereby creating a level of rate stability that customers in general prefer
Once the goals for revenue regulation are set by the regulators the next step is to design programs that will implement that goal For energy efficiency to be as successful as possible regulators may want to adopt a complement of other policies to accompany revenue regulation These can include rate designs that reward reduced use and conservation as well as incentive payments to utilities that reward them for meeting or exceeding targets Of the six utilities studied three have adopted some form of incentive One simple approach that was used in Washington was to link recovery of any surcharges under the revenue regulation mechanism to achievement of energy efficiency targets72
For the utilities examined above that have implemented revenue regulation the evidence demonstrates that revenue regulation as a strategy and a mechanism to enable
Decoupling Case Studies Revenue Regulation Implementation in Six States
39
energy efficiency has been working well The fact that each revenue regulation mechanism varies from the next demonstrates that there are many different paths that can be followed in implementing revenue regulation based on the needs of the utility and its stakeholders in a particular
region This study demonstrates that revenue regulation does work and provides examples of how it can be implemented each one different and unique because of the number of decision points to be considered in designing a revenue regulation mechanism
Decoupling Case Studies Revenue Regulation Implementation in Six States
40
Appendix
Historic Rate Adjustments
Table 14
PGampE Revenue Regulation Rate Adjustments 1983 to 199373
Table 15
PGampE Revenue Regulation Adjustments 2005 to 201274
Table 16
IPC Revenue Regulation Adjustments76
Idaho Power Company
1983 23
1984 (34)
1985 (48)
1986 19
1987 21
1988 50
1989 (43)
1990 (54)
1991 39
1992 34
1993 00
2005 8925 minus12773 minus143
2006 9933 2246 226
2007 10409 21727 209
2008 10261 4032 039
2009 11169 10355 093
2010 11224 46556 415
2011 10306 38390 373
2012 11032 40304 365
2007 Residential minus00457 590 minus077
Commercial minus00457 428 minus107
2008 Residential 00529 670 090
Commercial 00529 510 104
2009 Residential 01220 770 158
Commercial 01535 603 255
2010 Residential 01800 785 229
Commercial 02273 613 371
2011 Residential 02028 785 258
Commercial 02597 613 424
Revenue Regulation Adjustment as of
Total Rates
Delivery Revenue
Requirement ($ millions)
Adjustment Rate
Revenue Regulation Adjustment($ millions)
Retail Rate
of Delivery Revenue
Revenue Regulation Adjustment
Year
Year
73 Lesh P (2009 June 30) Rate impacts and key design elements of gas and electric utility decoupling
74 Morgan P (2012 November) A decade of decoupling for US energy utilities rate impacts designs and observations
75 Morgan P (2012 November) A decade of decoupling for US energy utilities rate impacts designs and observations
76 All numbers provided by the utility
Decoupling Case Studies Revenue Regulation Implementation in Six States
41
77 Idaho Power Company Case No IPC-E-11-19- fixed cost adjustment permanent mechanism Available at httpwwwpucidahogovinternetcaseselecIPCIPCE1119company20120928COMPLIANCE20FILINGPDF
Figure 2
IPC Revenue Regulation Adjustments77
Residential FCA Balance and Use per Customer
$10000000
$8000000
$6000000
$4000000
$2000000
$0
-$2000000
-$4000000
-$6000000
1080
1070
1060
1050
1040
1030
1020
1010
1000Res
idu
al A
uth
oriz
ed F
CA
Am
oun
t
Residual Authorized FCA Amount ($)
Monthly Use Per Customer (kWh)
kW
h U
sed
2006 2007 2008 2009 2010 2011
78 Morgan P (2012 November) A decade of decoupling for US energy utilities rate impacts designs and observations
Decoupling Case Studies Revenue Regulation Implementation in Six States
42
Table 17a
Baltimore Gas and ElectricBGE Monthly Revenue Regulation Adjustments 2008 to 201278
Table 17b
Baltimore Gas and ElectricBGE Monthly Revenue Regulation Adjustments 2008 to 201278
March Residential 000172 01477 1165General Service 000230 01526 1507
April Residential 000016 01477 0108General Service 000146 01526 0957
May Residential 000066 01477 0447General Service 000230 01526 1507
June Residential minus000066 01477 minus0447General Service 000230 01526 1507
July Residential 000158 01477 1070General Service 000230 01526 1507
August Residential minus000040 01477 minus0271General Service 000214 01526 1402
September Residential 000237 01477 1605General Service 000230 01526 1507
October Residential 000237 01477 1605General Service 000143 01526 0937
November Residential 000237 01477 1605General Service 000140 01526 0917
December Residential 000445 01477 3013General Service 000230 01526 1507
January Residential 000035 01579 0222General Service minus000073 01346 minus0542
February Residential 000025 01579 0158General Service 000230 01346 1709
March Residential minus000237 01579 minus1501General Service 000230 01346 1709
April Residential minus000237 01579 minus1501General Service 000230 01346 1709
May Residential 000234 01579 1482General Service 000132 01346 0981
June Residential 000237 01579 1501General Service 000230 01346 1709
July Residential 000237 01579 1501General Service 000230 01346 1709
August Residential 000237 01579 1501General Service 000190 01346 1412
September Residential 000237 01579 1501General Service 000230 01346 1709
October Residential 000237 01579 1501General Service 000124 01346 0921
November Residential 000237 01579 1501General Service 000230 01346 1709
December Residential 000156 01579 0988General Service 000204 01346 1516
Adjustment $kWh
Adjustment $kWh2008 2009
Retail Rate
$kWh
Retail Rate
$kWhAdjustment
Adjustment
Decoupling Case Studies Revenue Regulation Implementation in Six States
43
Table 17c
Baltimore Gas and ElectricBGE Monthly Revenue Regulation Adjustments 2008 to 201278
Table 17d
Baltimore Gas and ElectricBGE Monthly Revenue Regulation Adjustments 2008 to 201278
January Residential 000203 01465 1386General Service 000230 01261 1824
February Residential minus000142 01465 minus0969General Service 000230 01261 1824
March Residential minus000237 01465 minus1618General Service 000230 01261 1824
April Residential minus000237 01465 minus1618General Service 000230 01261 1824
May Residential 000192 01465 1311General Service 000230 01261 1824
June Residential 000191 01465 1304General Service 000230 01261 1824
July Residential 000095 01465 0648General Service 000230 01261 1824
August Residential minus000176 01465 minus1201General Service 000224 01261 1776
September Residential minus000237 01465 minus1618General Service 000116 01261 0920
October Residential minus000237 01465 minus1618General Service 000081 01261 0642
November Residential minus000237 01465 minus1618General Service 000098 01261 0777
December Residential minus000079 01465 minus0539General Service 000229 01261 1816
January Residential minus000130 01365 minus0952General Service 000230 01156 1990
February Residential minus000253 01365 minus1853General Service minus000020 01156 minus0173
March Residential minus000018 01365 minus0132General Service minus000063 01156 minus0545
April Residential 000110 01365 0806General Service minus000262 01156 minus2266
May Residential 000010 01365 0073General Service minus000160 01156 minus1384
June Residential 000226 01365 1656General Service 000042 01156 0363
July Residential 000253 01365 1853General Service 000209 01156 1808
August Residential minus000007 01365 minus0051General Service minus000157 01156 minus1358
September Residential minus000253 01365 minus1853General Service minus000177 01156 minus1531
October Residential 000228 01365 1670General Service 000262 01156 2266
November Residential minus000059 01365 minus0432General Service 000262 01156 2266
December Residential 000071 01365 0520General Service 000262 01156 2266
Adjustment $kWh
Adjustment $kWh2010 2011
Retail Rate
$kWh
Retail Rate
$kWhAdjustment
Adjustment
Decoupling Case Studies Revenue Regulation Implementation in Six States
44
Table 17e
Baltimore Gas and ElectricBGE Monthly Revenue Regulation Adjustments 2008 to 201278
January Residential 000253 01291 1960General Service 000262 01064 2462
February Residential 000253 01291 1960General Service 000262 01064 2462
March Residential 000253 01291 1960General Service 000262 01064 2462
April Residential 000253 01291 1960General Service 000262 01064 2462
May Residential 000253 01291 1960General Service 000262 01064 2462
June Residential 000253 01291 1960General Service 000262 01064 2462
July Residential 000253 01291 1960General Service 000262 01064 2462
August Residential 000253 01291 1960General Service 000160 01064 1504
Adjustment $kWh2012
Retail Rate
$kWhAdjustment
Decoupling Case Studies Revenue Regulation Implementation in Six States
45
79 Morgan P (2012 November) A decade of decoupling for US energy utilities rate impacts designs and observations
80 Morgan P (2012 November) A decade of decoupling for US energy utilities rate impacts designs and observations
Table 18
Wisconsin Public Service Corporation Revenue Regulation Adjustments 2009 to 201179
2009 ResidentialSmall Commercial 00048705 000168154 01290 378 130Commercial 00084951 000293293 00945 899 310
2010 ResidentialSmall Commercial 00033043 000166936 01291 256 129Commercial 00056630 000286103 09460 060 030
2011 ResidentialSmall Commercial (00018666) $ (000163719) 01288 minus145 minus127Commercial (00032565) $ (000285629) 01037 minus314 minus275
Derived Adjustment
$kWh
Derived Adjustment Capped $
kWh
Retail Rate
$kWh
Revenue Regulation Actual
Revenue Regulation Capped
Table 19
National Grid Revenue Regulation Adjustments 2011-201276
Massachusetts Electric and Nantucket Electric
Table 20
Hawaiian Electric Company
2011 All minus0015 1429 minus0105
2012 All 0044 1396 0315
2011 01995 3149 063
2012 03894 3641 107
Revenue Regulation Adjustment
centkWh
Revenue Regulation Adjustment
centkWhRetail Rate
centkWh
Retail Rate
Revenue Regulation Adjustment
Revenue Regulation
ldquoThe 2011 adjustment took effect June 1 but was reduced to $0 on July 26 2011 when the Commission granted HECO an interim rate increase of $532 million in a 2011 test year general rate case The 2012 Adjustment runs from June 1 2012 through May 31 2013 About 25 of the total relates to the portion of the decoupling mechanism that updates OampM and rate baserdquo (Morgan 2013)
Decoupling Case Studies Revenue Regulation Implementation in Six States
46
Revenue Regulation and Decoupling A Guide to Theory and Applicationhttpwwwraponlineorgdocumentdownloadid902
This guide was prepared to assist anyone who needs to understand both the mechanics of a regulatory tool known as decoupling and the policy issues associated with its use This would include public utility commissioners and staff utility management advocates and others with a stake in the regulated energy system While this guide is somewhat technical at points we have tried to make it accessible to a broad audience to make comprehensible the underlying concepts and the implications of different design choices This guide includes a detailed case study that demonstrates the impacts of decoupling using different pricing structures (rate designs) and usage patterns
Pricing Dorsquos and Donrsquots Designing Retail Rates as if Efficiency Countshttpwwwraponlineorgdocumentdownloadid939
Rate design is a crucial element of an overall regulatory strategy that fosters energy efficiency and sends appropriate signals about efficient system investment and operations Rate design is also fully under the control of state regulators Progressive rate design elements can guide consumers to participate in energy efficiency programs and reduce peak demand yet relatively few utilities and commissions have implemented many of these elements This RAP paper identifies some best practices Because pricing issues tie closely to utility growth incentives we also address revenue decoupling
A Decade of Decoupling for US Energy Utilities Rate Impacts Designs and Observationshttpwwwraponlineorgdocumentdownloadid6356
This report written by Pamela Morgan of Graceful Systems LLC builds on a 2009 report Now covering 25 states including 49 LDCs and 24 electric utilities this report summarizes the decoupling mechanism designs these utilities use and the rate adjustments they have made under those mechanisms In total this report estimates the retail rate impacts of 1244 decoupling mechanism adjustments since 2005
Additional Resources
The Role of Decoupling Where Energy Efficiency is Required by Lawhttpwwwraponlineorgdocumentdownloadid275
This Issuesletter gives an overview of energy efficiency resource standards the need to decouple utility profits from utility sales and explains why decoupling is needed even where a third party administers energy efficiency programs
Revenue Decoupling Standards and Criteria A Report to the Minnesota Public Utilities Commissionhttpwwwraponlineorgdocumentdownloadid850
In 2007 the Minnesota legislature enacted a new statute Section 216B2412 in which it defined an alternative approach to utility regulation decoupling and directed the Public Utilities Commission (PUC) to ldquoestablish criteria and standardsrdquo by which decoupling could be adopted for the statersquos rate-regulated utilitiesTo fulfill its obligation to develop criteria and standards for decoupling the PUC sought the advice of the Regulatory Assistance Project (RAP) This report is the output of that collaboration
Designing Distributed Generation Tariffs Wellhttpwwwraponlineorgdocumentdownloadid6898
Improvements in distributed generation economics increasing consumer preference for clean distributed energy resources and a favorable policy environment in many states have combined to produce significant increases in distributed generation adoption in the United States Regulators are looking for the well-designed tariff that compensates distributed generation adopters fairly for the value they provide to the electric system compensates the utility fairly for the grid services it provides and charges non-participating consumers fairly for the value of the services they receive This paper offers regulatory options for dealing with distributed generation The authors outline current tariffs and ponder what regulators should consider as they weigh the benefits costs and net value to distributed generation adopters non-adopters the utility and society as a whole The paper highlights the importance of deciding upon a valuation methodology so that the presence or absence of cross-subsidies can be determined Finally the paper offers rate design and ratemaking options for regulators to consider and includes recommendations for fairly implementing tariffs and ratemaking treatments to promote the public interest and ensure fair compensation
Decoupling Case Studies Revenue Regulation Implementation in Six States
47
The Regulatory Assistance Project (RAP)trade is a global non-profit team of experts focused on thelong-term economic and environmental sustainability of the power sector We provide technical and policy assistance on regulatory and market policies that promote economic efficiency environmental protection system reliability and the fair allocation of system benefits among consumers We work extensively in the US China the European Union and India Visit our website at wwwraponlineorg to learn more about our work
Rate Design Where Advanced Metering Infrastructure Has Not Been Fully Deployedhttpwwwraponlineorgdocumentdownloadid6516
This paper identifies sound practices in rate design applied around the globe using conventional metering technology Rate design for most residential and small commercial customers (mass market consumers) is most often reflected in a simple monthly access charge and a per-kWh usage rate in one or more blocks and one or more seasons A central theme across the practices highlighted in this paper is that of sending effective pricing signals through the usage-sensitive components of rates in a way that reflects the character of underlying long-run costs associated with production and usage While new technology is enabling innovations in rate design that carry some promise of better capturing opportunities for more responsive load the majority of the worldrsquos electricity usage is expected to remain under conventional pricing at least through the end of the decade and much longer in some areas Experience to date has shown that the traditional approaches to rate design persist well after the enabling technology is in place that leads to change
Time-Varying and Dynamic Rate Designhttpwwwraponlineorgdocumentdownloadid5131
This report discusses important issues in the design and deployment of time-varying rates The term time-varying rates is used in this report as encompassing traditional time-of-use rates (such as time-of-day rates and seasonal rates) as well as newer dynamic pricing rates (such as critical peak pricing and real time pricing) The discussion is primarily focused on residential customers and small commercial customers who are collectively referred to as the mass market The report also summarizes international experience with time-varying rate offerings
50 State Street Suite 3Montpelier Vermont 05602802-223-8199wwwraponlineorg
- Table of Contents
- Introduction
- California Pacific Gas and Electric Company
- Idaho Idaho Power Company
- Maryland Baltimore Gas and Electric
- Wisconsin Wisconsin Public Service Corporation
- Massachusetts National Grid
- Hawaii Hawaiian Electric Company
- Discussion of the Six Utilities Overall
- Conclusions
- Appendix
- Additional Resources
-

Decoupling Case Studies Revenue Regulation Implementation in Six States
20
37 Energy Agreement Among the State of Hawaii Division of Consumer Advocacy of the Department of Commerce amp Consumer Affairs and Hawaiian Electric Companies Available at httpwwwhecocomvcmcontentStaticFilespdfHCEIpdf
38 The HECO Companies described as follows in their Reply SOP in the Schedule A decoupling proceedings ldquothe
Hawaii Hawaiian Electric Company
Hawaiian Electric Company (HECO) uses a revenue regulation mechanism that compares actual revenue to target revenue in each year The target revenue is based on the authorized
revenue for the last test year adjusted for operation and maintenance (OampM) increases and rate base changes
HECO is a subsidiary of Hawaiian Electric Industries which also operates Maui Electric Company (MECO) and Hawaiian Electric Light Company these subsidiaries service the islands of Maui and Hawaii County while HECO serves Oahu (Honolulu)
Authority In 2008 the Governor of Hawaii the Division of Con-
sumer Advocacy and HECO entered into an agreement as a result of the Hawaii Clean Energy Initiative37 The agreement is intended to move Hawaii away from its dependence on imported fossil fuels for electricity and ground transporta-tion and toward locally produced renewable energy and energy efficiency In the agreement the State the Consumer Advocate and HECO committed to among other things a transition away from a model that encourages increased elec-tricity usage and to a model that implements revenue regula-tion decoupling to encourage the development of renewable energy by HECO The Commission opened Docket 2008-0274 in order to examine the features of a revenue regula-tion mechanism The Opening Order directed HECO and the Consumer Advocate to file a joint proposal on revenue regulation within 60 days This joint proposal was modeled closely after the California mechanism described earlier for PGampE with a rate-case determined revenue requirement plus annual attrition adjustments plus separate mechanisms
to recover power supply and energy efficiency costsThe Hawaii Public Utilities Commission approved
revenue regulation for HECO in August 2010 based on an investigation into the appropriateness of revenue regula-tion and its design The revenue regulation mechanism took effect on March 1 2011 This replaced a previous lost revenue adjustment mechanism
Authorized Revenue RequirementThe Commission establishes the Authorized Base Rev-
enues through a general rate case based on traditional cost-of-service ratemaking principles The Authorized Base Revenue is the annual amount of revenues required for the utility to recover its estimated OampM depreciation amorti-zation and tax expenses for the period
The Target Revenue is equal to the base revenue require-ment less any revenue being separately tracked or recov-ered through any other surcharge or tracking mechanism including revenue for fuel and purchased power expenses
The revenue regulation order also requires staggered triennial rate cases for each of the Hawaiian Electric Indus-tries Companies to determine approved baseline Revenue Adjustment Mechanism (RAM) inputs
Rate of ReturnThe Commission made no explicit adjustment to ROE
owing to the revenue regulation mechanism but noted that the allowed ROE of ten percent reflects the approval of revenue regulation and other cost-recovery mechanisms that will lower HECOrsquos business risk38 Most recently the Hawaiian Public Utilities Commission approved a 90-per-cent ROE for MECO reflecting both a lower baseline cost
Commission effectively reduced the Companiesrsquo return on common equity by 50 basis points to ldquofairly compensate ratepayersrdquo for what it perceived as the ldquorisk-reducingrdquo effects of the RBA and RAM mechanisms the Renewable Energy Infrastructure Program (lsquoREIPrdquo) Surcharge and the Purchased Power Adjustment Clause (ldquoPPACrdquo)rdquo Available at httpdmspuchawaiigovdmsDocumentViewerpid=A1001001A10L29B55326B47993
Decoupling Case Studies Revenue Regulation Implementation in Six States
21
39 Hawaii PUC Decision and Order No 31288 (2013 May 31) pp 97ndash112
40 Hawaii PUC Decision and Order No 31289 (2013 May 31)
41 Hawaii PUC Decision and Order No 31908 (2014 Feb 1)
42 February 7 2014 order on schedule A issues Available at httpdmspuchawaiigovdmsDocumentViewerpid=A1001001A14B10B22326F07922 p 42ndash47
of capital and a penalty of 050 percent associated with inadequate performance bringing renewable energy into the MECO system39 A companion Order also established new guidance on future revenue regulation mechanisms40
Revenue Adjustment MechanismThe RAM is designed to replace the need for annual rate
cases by adjusting Authorized Base Revenue levels to reflect estimated changes in the utilityrsquos cost of service The RAM is intended to via formula-driven estimates and escalators compensate the HECO Companies for changes in util-ity costs and infrastructure investment between rate cases and reduce the frequency of rate cases The RAM Period is the calendar year containing the Annual Evaluation Date (March 31 the date of the annual RAM filing) The RAM adjusts the revenue requirement according to changes in four main categories of expenses
bull Base expenses which are changes in designated OampM expenses
bull Rate base the return on incremental investment in designated rate base components41
bull The incremental depreciation and amortization expenses and
bull Exogenous tax changes changes in costs owing to significant changes in tax laws or tax regulations
Base expenses are segregated between labor and non-labor amounts The labor component is adjusted annually by the Labor Cost Escalation Rate reduced by the Labor Productiv-ity Offset (fixed at 076 percent) The non-labor component uses the Non-labor Escalation Rate to annually adjust those costs Tracked OampM expenses for fuel purchased power pension and post-employment benefits integrated resource planning DSM and other rate adjustment provisions are not adjusted in the RAM because any changes in these costs are accounted for in other cost-tracking mechanisms
The Rate Base equals the average net investment esti-mated for the RAM Period The average rate base is the rate base for the rate case test year with adjustments for changes in only four components of rate base (1) average plant-in-service (2) average Accumulated Depreciation (3) average accumulated contributions in aid of construc-tion and (4) average accumulated deferred income taxes All other components of the rate base remain the same as in the preceding rate case test year The average plant-in-service is equal to the average of the actual plant-in-service at the end of the year prior to the RAM period the Evalu-ation Year and the same year-end balance plus estimated plant additions for the RAM period Plant additions include
Baseline Capital Project plant additions and Major Capital Projects plant additions estimated to be in service by Sep-tember 30 of the RAM period
The RAM also includes an Earnings Sharing Revenue Credit mechanism in order to protect against excessive over-all utility revenue levels The RAM will escalate and update the Companyrsquos approved base revenue requirement reduced by earnings sharing credits and major project revenue credits to customers Based on the Companyrsquos achieved return on common equity for the Evaluation Year the mechanism cred-its the RBAs according to the following chart
ROE at or below the authorized ROE
First 100 basis points (1) over authorized ROE
Next 200 basis points (2) over authorized ROE
ROE exceeding 300 basis points (3) over
authorized ROE
Retained entirely by shareholders no customer credits
25 share credit to customers
50 share credit to customers
90 share credit to customers
Finally the RAM includes additional consumer protectionsbull A provision for Major Capital Projects Creditsbull A provision for Baseline Capital Projects Creditsbull Notification is provided to all affected customers of
the RAM filing in newspapers and billsbull Evaluation procedures for filing examination and any
exceptions to annual revenue regulation filingsbull Continued ability of HECO or the Consumer
Advocate to request formal rate proceedings to replace and terminate RAM at any time and
bull Formal review of revenue regulation as a part of the next round of rate case proceedings
A recent order42 added two additional consumer protections
bull A limitation that only 90 percent of the current
Decoupling Case Studies Revenue Regulation Implementation in Six States
22
43 ACEEE Hawaii Available at httpaceeeorgsectorstate-policyhawaii
RAM Period Rate Base that exceeds the Rate Base Adjustment Mechanism from the prior year can be included in the Decoupling Mechanism for baseline utility plant projects which unlike major capital projects are not subject to prior Commission review and approval and
bull A requirement to post a number of metrics online for customer review although not at this point tied to performance
This order also examined four issues with respect to the application of the RAM The Commission determined that the short-term debt rate as reflected in the most recent rate case should be used to adjust over- and under-collections The Commission also resolved its concern that without a sustainable business plan there exists no strategic frame-work under which to evaluate capital expenditure pro-grams The Commission required the parties in the Docket to further explore capital expenditure issues in conjunction with other risk-sharing mechanisms discussed elsewhere in the order The commission ordered a further evaluation of a proposed risk-sharing mechanism within the RBA Further-more the Commission ordered the parties to work together to establish appropriate metrics which the utility would report on its website
Once the total RAM Revenue Adjustment is calculated it is applied through a uniform adjustment to the per-kWh energy charge for all customer classes
Reconciling Actual Revenue with Authorized Revenue
RBAs record the monthly differences between target revenues and the adjusted recorded electric sales revenues The RBA also applies monthly interest equal to the annual rate for short-term debt from the cost of capital in each HECO Companyrsquos last base rate case to the simple average of the beginning and ending balances each month in the RBA In effect the RBA applies one-twelfth of the rate each month Finally the RBA provides for collection or return of the calendar year-end balances in the RBA and recovery of the RAM Revenue Adjustment over the subsequent May 1 through April 30 period The target revenue is the most recent Authorized Base Revenue or the re-determined Authorized Base Revenue calculated under the RAM
On or before March 28 the Company must file with the Commission a statement of the previous year-end balance in each RBA sub-account and the Authorized Base Revenue level for the current calendar year with supporting calculations An amortization of the year-end balance in the
RBA sub-accounts and the RAM Revenue Adjustment are recovered through the per-kWh RBA rate adjustments The rate adjustment occurs from May 1 of the current calendar year to April 30 of the next year
Complementary PoliciesCurrently electric utilities in Hawaii may use energy
efficiency to meet a portion of their Renewable Portfolio Standard requirements Starting in 2015 electricity savings from energy efficiency will be applied to the Statersquos Energy Efficiency Portfolio Standard which sets a target equivalent to 30-percent forecast sales by 2030 This goal is translated into a target of 14 percent annual savings HECO trans-ferred administration of all of its energy efficiency programs to a third party administrator in 2009 The administrator is compensated for satisfactory performance43
Because of its heavy dependence on petroleum as a generation fuel electricity prices in Hawaii are very high solar and wind are typically lower-cost resources for these systems HECOrsquos default residential rates are inclining block rates with a $900month customer charge and a three-block inclining rate design of $034kWh to $037kWh Residential customers can elect to take service under a TOU rate with off-peak mid-peak and priority-peak tiers Gen-eral service and large power service customers take service under a flat rate unless they opt to take service under a TOU
Hawaii is developing reliability standards in part as a response to deteriorating service quality as a result of distributed and customer-owned generation (see text box) In an effort to make electricity reliability and interconnection standards as transparent as possible the Reliability Standards Working Group was formed in the Feed-In Tariff docket and continues its work in Docket No 2011-0206 to find solutions to integrating high penetrations of renewable energy consistent with reliability and power quality standards
Energy Efficiency OutcomesHECO implemented revenue regulation in 2011 Since
2003 HECO has reported incremental energy efficiency savings between 0 and 05 percent of retail load with 131 percent savings reported in 2011 by Hawaii Energy the
Decoupling Case Studies Revenue Regulation Implementation in Six States
23
44 Hawaii PUC Decision and Order No 31288 Maui Electric Company Limited Docket No 2011-0092 (2013 May 31) Appendix C p 2
Statersquos ratepayer funded efficiency program administrator The company has not yet reported its savings for 201245 In addition HECO has seen more than a sixfold increase in renewable installations under its net metering and feed-in tariff policies since the inception of the revenue regulation plan
Revenue regulation represents a regulatory framework that removes the financial disincentive for utilities to pursue clean
energy strategies It doesnrsquot in and of itself align the utility business model with those utility policies and practices that address customer expectations In fact some commissions are concerned that it might create a dynamic in which the utility assured of its revenue needs becomes complacent and lacks motivation to innovate and develop strategies that may be more in line with the public interest
In a recent order (Docket 2011-0092 May 31 2013) the Hawaiian Public Utilities Commission addressed this big picture issue in a rate order for Maui Electric The Commission called out the management as lacking a long-term vision for creating customer value and expressed concern that ldquothe HECO Companiesrsquo over-reliance upon a link between the [Decoupling]
Agreement and utility financial health obfuscates utility performance and ultimately customer service and satisfactionrdquo44 The implementation of clean energy policies is not a singular goal but rather a policy that must be part of a larger effort to create customer value
The Commission laid out a hard path and a soft path to achieve the results they desire for consumers The hard path involves a closer examination of utility investments operations and expenditures The soft path is opened through the actions of management to create and execute a vision for the utility of the future The Commission remains committed to regulatory innovations that are in the public interest and will work with the utility consumer advocate and other stakeholders to create and implement this vision
The results of this effort will likely produce ideas and outcomes that will have applicability beyond this one utility
ResourcesHawaii Public Utilities CommissionDocket No 2008-0274 Final Decision and Order (August 31 2010)Docket No 2008-0083 Final Decision and Order (December 29 2010)Docket No 2011-0092 Final Decision and Order May 31 2013 including
Decision and Orders Nos 31288 and 31289Docket No 2013-0141 Final Decision and Order (February 1 2014) including
Decision and Order No 31908
45 EIA Form EIA-861 data files Available at httpwwweiagovelectricitydataeia861
Decoupling Case Studies Revenue Regulation Implementation in Six States
24
46 Lazar et al 2011
Discussion of the Six Utilities Overall
Authority The first step in implementing a revenue regulation
mechanism is to understand the authority of the regulating body the Public Utility Commission or PSC It is important for any Commission to clarify its justification for acting on revenue regulation in order to prevent any decisions from being overturned Over the years Utilities Commissions have relied on different justifications for implementing revenue regulation mechanisms Commissions have imple-mented revenue regulation at their own discretion justified by their directive to ensure safe reliable and economic public utility service to citizens to justify changing the regulatory environment In some cases the Commission is unable to engage on narrow issue ratemaking and rates can change only as the result of a full rate case In this case statutes must be amended to enable revenue regulation
In all of the case studies discussed here the Commis-sions first implemented revenue regulation at their own dis-cretion but each followed slightly different paths to do so The CPUC first implemented revenue regulation in 1978 at its discretion In 2001 after a period when mechanisms were suspended the California Legislature required that deviations from projected sales not result in under- or over-collections by utilities and so the CPUC re-implemented revenue regulation according to statutory requirement The Hawaii Public Utilities Commission implemented rev-enue regulation after an agreement between the utility the Governor and other stakeholders called for it In Idaho the Commission established a case in which to investigate rev-enue regulation and held a series of stakeholder workshops before implementing the policy The Massachusetts DPU adopted revenue regulation as a statewide regulatory policy and required individual utilities to file tariffs in response as the result of its general investigation into rate structures that promote demand-side resources The Maryland Com-mission implemented revenue regulation for BGE when the utility requested the mechanism Thus the impetus to develop a revenue regulation mechanism may come from different sources and the Commission may be comfortable
in moving forward under their general supervisory statutes Nevertheless specific statutory language can be helpful to shore up the existing authority
Authorized Revenue Requirement Under the traditional regulatory framework the Com-
mission (or other authority in the case of publicly owned utilities) must determine a utilityrsquos revenue requirement This function does not change under revenue regulation The revenue requirement of a utility is the aggregate of all the operating and other costs incurred to provide service to the public This typically includes operating expenses depreciation and the cost of capital invested including in-terest on debt and a ldquofairrdquo return on equity to investors The (simplistic) formula for determining revenue requirements is as follows
Revenue Requirements = (Rate Base times Rate of Return) + Operating Expenses + Depreciation +Taxes
Traditionally the revenue requirement along with sales is used to determine the rates consumers will pay for elec-tricity46 The rates are also broken down by customer class and intraclass tariffs are created based usually on a cost of service study that determines each customer class and subclass contribution to the utilityrsquos costs The (simplistic) formula for determining the rate per unit is
Rate = Revenue Requirement divide Units Sold
In this way rates are set to allow the utility to exactly recover its revenue requirement when the sales level used to calculate rates is equal to actual sales However it is important to recognize that actual expense and revenue varies with actual sales When actual sales are greater than the sales level used in ratemaking revenue increases and expenses increase by a different amount when actual sales are lower than the ratemaking sales level actual revenue
Decoupling Case Studies Revenue Regulation Implementation in Six States
25
declines and expenses decrease by a different amount Under revenue regulation rates are initially set in the same way but when actual sales differ from the level used to calculate rates the actual revenue level is maintained at the rate case amount as rates are allowed to vary inversely with salesmdashincreased sales lead to decreased rates and vice versa Because the primary expenses that change in the short run as sales levels change are power supply expenses and most regulators allow these to be tracked using a power cost adjustment mechanism revenue regulation mechanisms are generally designed to ensure recovery of the non-power costs (which do not change significantly in the short-run) as sales volumes change
Revenue regulation ensures that actual revenue is equal to the revenue requirement established by the Commission or appropriate authority Although the description above presents an overly simplified view of the revenue require-ment and its use in traditional price regulation and revenue regulation there are many variations on how a Commis-sion can establish a revenue requirement particularly when implementing revenue regulation With revenue regulation as in traditional ratemaking imprudent costs can always be removed from rates and there is no change to the ability of a Commission to impose penalties
Utility Functions to be IncludedFirst the regulator must determine which utility func-
tions will be included in the revenue regulation framework With vertically integrated utilities this usually includes a utilityrsquos regulated generation transmission and distribution units As we discuss below however it is critical to struc-ture power supply recovery mechanisms to avoid providing for double-recovery of certain power supply costs For utili-ties operating in areas of the country that have restructured electricity markets only the regulated distribution busi-ness is decoupled Utilities that also provide gas services
Pacific Gas amp Electric Future test year
Idaho Power Company Historic test year
Baltimore Gas amp Electric Hybrid test year
Wisconsin Public Service Corporation Future test year
National Grid Historic test year
Hawaiian Electric Company Future test year
Table 2
Test Year Used
may have their gas distribution business operating under revenue regulation as well
Test YearOne consideration in establishing the revenue require-
ment is what period of time will be used as a ldquotest periodrdquo or ldquotest yearrdquo The test year is the year on which the Com-mission will base its computations of the utilityrsquos total costs and sales levels A historic test year uses actual data on sales and costs from a past year Whereas a historic test year allows for the use of actual cost data it cannot account for expected variations in sales A future test year requires assumptions to be made about a utilityrsquos sales in a future year This can allow expected changes in sales like those from energy efficiency programs to be included in sales
projections however because regulators are relying on estimates provided by the utility there may be a greater risk for inaccuracy A Commission may also choose to use a test year that includes both past and future periods This may provide a sense of balance between historic and future data Furthermore as the case proceeds the Commission can require the utility to substitute historical data for projected data from the test year
Rate of ReturnAs in any rate case regulators
must determine the appropriate rate of return that a utility can earn on its investments including the cost of debt and the allowed ROE for its shareholders The approved ROE is only used to establish the return on investments that are included in the rate base when determining revenue require-
Pacific Gas amp Electric Electric generation and distribution gas distribution
Idaho Power Company Electric generation and distribution
Baltimore Gas amp Electric Electric distribution gas distribution
Wisconsin Public Service Corporation Electric generation and distribution
National Grid Electric distribution
Hawaiian Electric Company Electric generation and distribution
Table 1
Business Unit Included in the Revenue Regulation Model
Decoupling Case Studies Revenue Regulation Implementation in Six States
26
47 In a rate case the Commission determines an allowed return on equity This is used to set a price (price regulation) or an allowed revenue requirement (revenue regulation) Once set however the actual return earned by the utility is affected by anything that changes either revenue or expenses for example an increase in employee compensation a change in the number of employees or under price regulation a change in sales volumes
48 Lazar et al 2011
ments Although revenue regulation ensures that a utility recovers no more or less than its target revenue revenue regulation does not guarantee that the utility will earn the authorized ROE Depending on how a utility manages its costs between rate cases it will realize an actual ROE either higher (in the case of reduced costs) or lower (in the case of increased costs) than the authorized level47
A utilityrsquos allowed ROE generally represents the return deemed necessary to attract investment considering the level of risk of that investment Riskier investments require a higher return to attract investors and vice versa Util-ity earnings can be volatile because of short-run impacts on sales volumes and revenues which include changes in sales owing to weather economic conditions and energy efficiency and DG programs This volatility typically causes utilities to retain a higher level of equity in their capital structures so that reduced revenues do not leave them un-able to service their debt Revenue regulation can reduce this volatility by stabilizing revenues regardless of the cause Because of this reduced risk many stakeholders have proposed that the implementation of a revenue regulation mechanism be associated with a corresponding reduction in the utilityrsquos equity capital ratio (the percentage of capital supplied by common equity) This reflects the utilityrsquos more stable revenue owing to revenue regulation and reduces the overall revenue requirement that will be recovered from consumers48
An alternative option to reducing the utilityrsquos equity ratio is to reduce the ROE reflecting a lower risk level For the utilities included in these case studies only BGE and Mass Electric experienced a reduction in their ROE The Com-mission did not reduce BGErsquos ROE at the time the revenue regulation mechanism was implemented but reduced it by 50 basis points during the subsequent rate case The Mas-
sachusetts Commission did not reveal its adjustment but incorporated a lowered ROE into its decision
Absent an explicit adjustment to the cost of capital investorsrsquo expectations will adjust to the presence of rev-enue regulation if its presence is reliable The more stable earnings will likely in time contribute to a higher credit rating That in turn will lead to lower cost debt that will be revealed in future cost of capital calculations An adjust-ment to the ROE or capital structure by the regulator in a rate proceeding will be reflected immediately in lower rates to consumers simply allowing the utilityrsquos credit rating to improve over time and its cost of debt to decline will have the same effect but on a lagged basis as new bonds are is-sued at lower interest rates49
Beginning in 2004 Standard and Poorrsquos began publish-ing ldquorisk profilesrdquo for utilities which classified utilities based on their earnings variability and other risks those with more stable earnings were determined eligible for higher bond ratings at any given equity capitalization ratio (or alternatively able to retain a given bond rating with a lower equity ratio)50 One utility with a revenue regulation mechanism Northwest Natural Gas was believed to have had their business risk profile upgraded by one step in response to the benefits of the mechanism51
Effect on Bond RatingsRevenue regulation stabilizes a utilityrsquos revenue streams
reducing risk to investors this reduced risk may be a contributing factor in an increase in a utilityrsquos bond rating Bond rating agencies have recognized that revenue regula-tion mechanisms and other mechanisms that reduce net earnings volatility and risk contribute to a lower cost of capital for the utility52 Standard and Poorrsquos has explicitly stated that it ldquoviews decoupling as a positive develop-
49 Lazar et al 2011
50 Standard and Poorrsquos (2004 June 2) New Business Profile Scores Assigned for US Utility and Power Companies Financial Guidelines Revised
51 Christensen Associates (2005 March) A review of distribution margin normalization as approved by the Oregon Public Utility Commission for Northwest Natural
52 Lazar et al 2011
Decoupling Case Studies Revenue Regulation Implementation in Six States
27
This topic raises a note of caution if mechanisms are not well designed double-recovery of costs can occur for verti-cally integrated utilities that provide both power supply and distribution services For example if a per-customer
revenue regulation mechanism includes investment-related power supply costs in the revenue-per-customer formula but excludes fuel and purchased power costs that are recovered through a separate tracking mechanism double recovery of some power supply costs is likely If the utility experiences cus-tomer and sales growth the amount it recovers for investment-related power supply costs will go up However if that utility serves this growth by operat-
ing existing power plants more by selling less power on the surplus market or by purchasing power from other suppli-ers it will not incur any increases in the type of power sup-
53 Standard amp Poorrsquos (2008 February 19) Decoupling the vehicle for energy conservation
ment from a credit perspectiverdquo53 However in the case of the utilities examined in this report none experienced an improved credit rating after the implementation of revenue regulation with the exception of PGampE However PGampE came out of Chapter 11 bankruptcy in the same year that its revenue regulation mechanism was implemented mak-ing it impossible to attribute the improvement to revenue regulation alone Bond rating changes are generally slow to evolve Numerous other factors are taken into account when assigning an overall credit rating which appear to have outweighed any positive effect of revenue regulation These factors certainly include the recession of the US economy that began in 2007
Customer Classes IncludedWhen determining the target revenue for a utility rev-
enue regulation mechanism regulators must also consider which customer classes to include in the mechanism In some cases industrial customers have objected to a rev-enue regulation mechanism This is due to the wide dif-ference in rates among customers making the design of a revenue regulation mechanism more challenging If regula-tors choose to exclude a class of customers from revenue regulation they must determine the revenue requirement associated with serving only the included customer classes This generally requires a detailed cost of service study to ensure that revenue responsibility is accurately allocated by customer class
Included CostsFinally regulators may wish to exclude specific costs
from the overall revenue requirement if those costs will be tracked through another mechanism like fuel costs in a PCA mechanism energy efficiency program expenditures or smart grid costs for example Separate tracking mecha-nisms can also be used for those costs that are difficult to
Pacific Gas amp Electric All customer classes
Idaho Power Company Residential and small general service
Baltimore Gas amp Electric Residential and small general service
Wisconsin Public Service Corporation All customer classes
National Grid All customer classes
Hawaiian Electric Company All customer classes
Pacific Gas amp Electric
Idaho Power Company
Baltimore Gas amp Electric
Wisconsin Public Service Corporation
National Grid
Hawaiian Electric Company
Table 3
Customer Classes Included in Revenue Regulation Mechanism
Table 4
Costs Excluded From Revenue Regulation Mechanism
project based on historical data or costs over which the util-ity has very little control like fuel costs Although revenue regulation tracks collected revenue mechanisms like Fuel Adjustment Clauses Purchased Power Adjustments and Energy Efficiency Riders can be designed to track actual costs as well as collected revenue
Energy procurement costs
All variable costs
Energy supply costs
Energy costs
Energy supply costs for basic service customers transmission costs the energy efficiency system benefits charge and reconciling charge and costs recovered through the residential assistance adjustment factor
Fuel and purchased power
Decoupling Case Studies Revenue Regulation Implementation in Six States
28
54 We use the RAM term applied in Hawaii here to address any type of attrition or similar mechanism other than a revenue-per-customer framework that changes the allowed revenue between general rate cases
ply costs accounted for in the revenue per customer (RPC) calculation The increased power supply costs to serve that growth will be recovered through the fuel and purchased power tracking mechanism The net effect for the utility will be to recover incremental power supply costs twicemdashonce in the per-customer mechanism and again in the fuel and purchased power mechanism It is essential to make sure that the other adjustment mechanisms do not overlap the cost impacts that are treated in the revenue regulation mechanism One way to do this is to ensure that all power supply costs (investment labor fuel purchased power) are recovered through a single mechanism There are several ways to achieve this
a) A comprehensive power supply recovery mechanism that includes all power supply costs that is separate from the costs treated in the revenue regulation adjustment (eg Puget Sound Energy Washington State)
b) No power supply adjustment whatsoever with all utility costs included in an RPC mechanism (eg National Grid)
c) An annual attrition calculation with all costs reviewed for changes since the last proceeding (eg HECO)
Revenue Adjustment Mechanism in Revenue Regulation
A RAM54 is not necessary to achieve revenue regulation but provides attrition reliefmdashincreasing authorized revenue commensurate with increased costsmdashbetween rate cases Whereas revenue regulation sets a target revenue that the utility will earn regardless of sales levels the RAM adjusts the target revenue between rate cases Regulators may choose to take several different approaches to RAM
bull No RAM Regulators may choose not to implement a RAM leaving the revenue requirement unchanged between rate cases This requires the utility to request a rate case when it requires additional revenue to cover its costs
bull Stairstep Stairstep adjustments provide predetermined increases in target revenue These increases can be determined during a rate case and generally reflect forecasts of cost growth
bull Indexing Indexing ties adjustments to the target revenue to multiple factors like inflation productivity customer growth and changes in capital expenditures
bull RPC The RPC approach is a form of indexing RPC adjusts the total revenue requirement for the
number of customers served Regulators using an RPC mechanism will determine the revenue requirement per customer and the overall revenue requirement will be determined by multiplying the total number of customers by the revenue requirement per customer The amount of revenue required to serve each customer can be determined separately for customer classes and for existing and new customers This way the RPC method accounts for a utilityrsquos growth in fixed costs that is related to growth in the number of customers served RPC is useful where the correlation between cost growth and customer growth is significant It also protects customers from making up the deficit if there is a loss in customer load such as if a large business closes down or relocates
bull Hybrid Hybrid RAMs generally use stairstep increases to account for projected capital costs and indexing to account for OampM expenses
Adjustments from any type of RAM can be implemented automatically or through an attrition proceeding Some stakeholders oppose adjustments to the revenue require-ment outside of a rate case on the basis that this could allow the revenue requirement to increase significantly without examination of the impact on ratepayers or with-out due consideration of other costs and revenues For this reason some regulators choose to cap the total adjustment that can be made to the revenue requirement outside of a rate case
Table 5
Type of Revenue Adjustment Mechanism
Pacific Gas amp Electric
Idaho Power Company
Baltimore Gas amp Electric
Wisconsin Public Service Corporation
National Grid
Hawaiian Electric Company
Hybrid
RPC
RPC
RPC
No RAM potential capital expenditure adjustment
Hybrid
Decoupling Case Studies Revenue Regulation Implementation in Six States
29
55 Because this method results in changes in the price for service that are calculated after that service has been provided it fails the ldquono retroactive ratemakingrdquo statutes that guide most electricity regulators Customers are entitled to know the price of the commodity they are consuming at the time they use it
56 The closest to a current method in use for electric utilities in the BGE system of monthly reconciliation
Table 6
Tracking and Accrual of Difference BetweenActual and Authorized Revenue
Pacific Gas amp Electric
Idaho Power Company
Baltimore Gas amp Electric
Wisconsin Public Service Corporation
National Grid
Hawaiian Electric Company
Track Difference
Monthly
Monthly
Monthly
Yearly
Yearly
Monthly
Accrual Period
Year
Year
Month
Year
Year
Year
Calculation of Actual RevenueRegulators have options when ensuring that actual
revenue equals target revenue under revenue regulation First regulators must decide how to determine ldquoactual revenuerdquo In most cases actual revenue simply equals the amount of revenue a utility collects from its customers The Idaho Public Utilities Commission however has chosen to use weather-normalized revenues as the basis for utility revenues in revenue regulation Although this prevents the utility from recovering revenue lost to it owing to milder than expected weather it further complicates the revenue regulation mechanism and reduces its risk-reduction ben-efits By the same token if weather is severe and increases sales above the revenue requirements weather normaliza-tion would allow the utility to retain some of the revenues
Next regulators must determine whether to implement revenue regulation using a current or accrual method
bull Current Method With the current method of revenue regulation the target revenue for a period say a month is divided by the actual sales in that period to determine the rate per kWh The current method ensures that actual revenue equals target revenue by calculating the rate at the end of the period so that the target revenue can be recovered The current method allows for no lag in revenue recovery One effect of this method is that although customer rates vary total bills are generally more stable For example in a hotter than expected July customers will purchase more kWh but they will be charged a lower rate A milder than average winter would lead to fewer sales but at slightly increased rates This way customers do not experience the same bill variability as they would if rates were set before the sales deviations occurred On the other hand the current method does not provide customers with the ability to plan ahead based on a predictable rate for electricity This method has been used for revenue regulation of natural gas utilities55
bull Accrual Method Under the accrual method rates are set based on an assumed sales level and the differences between actual and target revenue are allowed to accrue over some period Then the total difference between actual and target revenue is reconciled through an adjustment to rates in the subsequent period this is known as the true-up process Presently all revenue regulation mechanisms for electric utilities use the accrual method56
If regulators use the accrual method of revenue
regulation they will next need to determine the period over which the difference between actual and target revenue will be allowed to accrue One year is typical however shorter periods are also used Next the frequency of comparing collected revenue to target revenue should be determined It is possible to do this comparison only once at the end of the accrual period It is common however for comparisons to occur more frequently often monthly When revenues are compared within the accrual period the differences are tracked generally for the purpose of applying interest to the difference that will be deferred until the end of the accrual period
Rate AdjustmentsIn designing a revenue regulation mechanism there are a
number of decision points that regulators need to consider to balance the interests of all the stakeholders One of the decision points revolves around the determination of the mechanism used to adjust rates The issues that regulators need to consider include the following1 Rate Case Requirements One of the often-mentioned
concerns about surcharges especially when they are numerous is how that will impact the frequency of rate cases For regulators and stakeholders rate cases provide
Decoupling Case Studies Revenue Regulation Implementation in Six States
30
the best mechanism to correctly align rates and costs but they are time-consuming and expensive for all parties This is because a rate case presents an opportunity to closely examine all of the utilityrsquos expenses and adjust rates to reflect cost increases and decreases Because under a revenue regulation mechanism the goal is to match revenues received from all customers with revenue requirements a correct determination of revenue requirements is important as is the specification of appropriate cost indices to adjust the revenue requirements As the time between rate cases increases some regulators feel the base rate case data even with adjustments need to be reexamined As a result some regulators have chosen to mandate the frequency of rate cases to address this whereas others have not It may be that in some cases where there are numerous surcharges recovering a multitude of costs there may not be as many costs subject to review in the rate case making it less significant to a regulator than a case in which most costs are being analyzed and recovered in the rate case itself
2 Collection Mechanism Integrally tied to the mechanism for recovering revenues is how the utility will collect or refund the revenues Options that are available include recovery through a rate case or periodic adjustments to rates through a surcharge mechanism As can be seen by the case studies depending on the plan in place some utilities have very discreet requirements dictating the frequency of rate cases with adjustments occurring in those cases or between those cases Other utilities have no requirements upon them with respect to the frequency of rate case filings This will be discussed in more detail below What does emerge from these case studies is that the discreet components or choices in how to execute a revenue regulation plan are carefully interwoven to create a holistic approach Each component works with the other and the value of this case study is in examining the different pathways that can be chosen As discussed previously some of the commissions have authorized revenue regulation to recover the revenue requirements in the last rate case whereas others have authorized adjustments to rates between rate cases this impacts the pathway that the adjustment mechanism takes
3 Timing How often should rates be adjusted to true up to the utilityrsquos revenue requirement States have chosen different options ranging from monthly to annually
4 Allocation of Revenue Regulation Revenue Surpluses or Deficits There are a number of decision points regarding allocation Should the revenue regulation apply to all rate classes or just the smaller customers whose usage per customer and load variations are not as dramatic as those of larger-use customer classes Should there be a different allocation to each rate class or should the allocation of costs among the classes be the same Different mechanisms accomplish different goals Some states have allocated revenue regulation revenues based on the revenues lost by customer class as a result of energy efficiency This can sometimes be a political decision to mitigate opposition to energy efficiency programs by large customers Other states recognize that the system savings resulting from energy efficiency benefit all customers so that all customers should pay equally
5 Carrying Charges Depending on the timing issue discussed previously regulators may want to consider carrying charges on any adjustments This should be symmetrical in its application however so that it applies to surcharges and refunds Consideration should be given for the basis of the carrying charge rate whether weighted average cost of capital rate of return a risk-free rate or some other mechanism should be adopted
6 Rate Caps In order to mitigate potential rate impacts a regulator may want to consider a cap on how much rates can go up when the revenue regulation adjustment is made This might be more critical if the regulator is aware of other potential rate increases that will impact customersrsquo bills If a cap is used the case in which the utilityrsquos adjustment would exceed the cap must be considered Some regulators have opted to allow the utility to carry over the excess unrecovered amount for a period of years whereas others do not This allows the utility to recover those revenues in a subsequent year when perhaps the adjustment is less As a practical matter however adjustments of greater than three percent are less common as shall be discussed later
7 Impact on At-Risk Consumers Low-income and consumer advocates have expressed concern about revenue regulation as a vehicle for annual rate increases without the scrutiny of a general rate case creating rate increases for the low-use customers doing the most to constrain usage and help achieve targeted energy savings One proposal to address this has been to impose any resulting surcharges only to above-average usage
Decoupling Case Studies Revenue Regulation Implementation in Six States
31
57 Cavanagh and Howat (2012 May 2) Finding common ground between consumer and environmental advocates Electricity Policy
58 The most common criticism of future test years is that utilities forecast costs under an assumption that all authorized personnel positions will be filled while in retrospect any large organization has some level of vacancy in its employee count A historic test year captures this effect fully
customers and any resulting credits only to below-average usage57
Rate Case RequirementRequirements as to the frequency of rate cases can be
tied to the recovery mechanism or to the entire regulatory framework for implementing revenue regulation In the cases studied two of the utilities require periodic rate cases PGampE every three years and WPS every year Two others National Grid and HECO require annual mini rate cases explained later in which adjustments are made and two others IPC and BGE have no requirements for scheduled rate cases Nevertheless if the concern is to ensure that the utilityrsquos revenue recovery meets its revenue requirements some kind of periodic rate case to examine costs is appropriate Having periodic rate cases can provide a measure of assurance to consumer advocates that the level at which the revenues and hence the rates are set is correct One of the criticisms of revenue regulation is in fact the lack of rate cases to produce a proper level of confidence in the allowed amounts Multiple surcharges are usually additive to existing rates therefore not permitting an opportunity to reduce the base rate for reductions in cost Moreover the infrequency in cases impedes the examination of rate allocations as would occur through a cost of service study
This is a particular issue where utilities are augmenting power supply with purchased power from independent power producers which is the most common method for acquiring wind and solar production today The increased cost for purchased power may flow through a fuel and purchased power adjustment mechanism while the (depreciating) investment in conventional power plants remains static in base rates
Both PGampE and WPS use a future test year that allows the utility to project revenue requirements during the time period that the rates are to be in effect The benefit to this is that it can help identify and account for projected changes in costs over the timeframe between rate cases However given that these costs are utility projections most consumer advocates have less confidence in these numbers than they would using actual numbers from a historical or only hybrid test year58 When trying to garner support for revenue regulation from more skeptical stakeholders using a future test year may not be helpful Furthermore in the case of WPS that has annual rate cases using a future test year becomes less justifiable as revenues are recalculated annually anyway
The absence of a rate case requirement can also cause consternation among detractors of revenue regulation because of the belief that the utility will be guaranteed its revenue requirements for as long as it is satisfied with that level irrespective of how well it manages However this is no different from the status quo in traditional regulation in most places The incentive to manage well is always there with or without revenue regulation as it translates into more profit for the utility
In the cases of HECO and National Grid the mini rate cases serve two purposes In the one instance it serves as a means to reconcile revenue recovery with revenue requirements and in the second instance it provides an opportunity to adjust rates in accordance with changes in costs Specifically for National Grid the revenue requirement is adjusted to reflect capital expenditures For HECO revenues are adjusted to reflect changes in the cost of service In the two examples here revenue regulation is wrapped in with other adjustments as part of a mini adjustment Given the structure for determining revenue requirements which accounts for changes in costs including revenue regulation within the mini rate cases is a workable option
These examples highlight how rate cases can be used to adjust revenue requirements either in a more controlled regulatory environment with frequent rate cases or left to the utilityrsquos discretion to decide when to adjust costs A set schedule of periodic rate cases such as that used by PGampE may strike an appropriate balance for reviewing revenue requirements however with the modification of a partial historical partial forecasted test year Frequent rate cases can depending on the resources of the regulator and stakeholders be too costly and time-intensive When there are too many rate cases stakeholders and regulators may not be able to dedicate the level of resources needed for any one proceeding and may be spread too thin Regular known rate cases at reasonable intervals may strike the best balance of adequate review and adjustment of revenue requirements
Decoupling Case Studies Revenue Regulation Implementation in Six States
32
Collection Mechanism and TimingThe collection mechanism for the differential between
actual and authorized revenue requirements varies by util-ity as well Both PGampE and WPS do not have adjustment clauses or surcharges but instead have structured their revenue regulation plans to recover their costs in a rate case with rates adjusted annually Although PGampE has rate cases every three years the utility files its preliminary forecast every September 1 for the following year including adjust-ments for revenue regulation and other costs This practice promotes transparency keeping all stakeholders aware of the current situation of the utility IPC BGE National Grid and HECO use surcharges on customer bills to collect or credit the difference between actual revenues collected and the revenue requirement Although the other three (IPC National Grid and HECO) calculate the rate adjustment annually only BGE does a more contemporaneous adjust-ment of one month Certainly where there are no regularly scheduled rate cases using an adjustment mechanism becomes more critical PGampE has created a tracking mecha-nism known as a balancing account that allows the utility to track the surpluses and deficits to help ensure accuracy at year end when rates are actually adjusted The creation of such monthly balancing accounts will make it easier at the end of the year to track what happened each month and then determine the adjustment for that year It provides a more detailed trail for review and analysis by stakeholders and regulators However other mechanisms that just look at total revenues as compared to revenue requirements at the end of the year can work as well
Table 7
Rate Case Requirements
Table 8
Rate Adjustments
Table 9
Allocation of Surplus or Deficit
Pacific Gas amp Electric
Idaho Power Company
Baltimore Gas amp Electric
Wisconsin Public Service Corporation
National Grid
Hawaiian Electric Company
Pacific Gas amp Electric
Idaho Power Company
Baltimore Gas amp Electric
Wisconsin Public Service Corporation
National Grid
Hawaiian Electric Company
Pacific Gas amp Electric
Idaho Power Company
Baltimore Gas amp Electric
Wisconsin Public Service Corporation
National Grid
Hawaiian Electric Company
Every three years annual ldquoattritionrdquo adjustments in between
No requirement
No requirement
Annual rate case
Annual capital expenditure adjustment case
Abbreviated annual rate case
Base rates adjusted annually
Annual adjustment through surcharge
Monthly adjustment through surcharge
Annual adjustment through rate case
Annual adjustment
Annual adjustment
Allocated to all customers according to business unit (eg electric distribution electric generation)
Included in the annual adjustment mechanism for each customer class
Separate for each customer class
Allocated to all customers except certain tariffs (see above)
Separate for each customer class
Separate for residential and commercialindustrial
Allocation of Revenue Regulation Revenue Surpluses or Deficits
The allocation of revenue regulation revenue surpluses or deficits should be symmetrical so that overpayments are credited to customers just as underpayments are paid by those same customers The six utilities studied fol-low that formula The application of revenue regulation however varies from utility to utility BGE and IPC ap-ply revenue regulation to the residential and commercial classes thereby excluding industrial customers In contrast however PGampE WPS National Grid and HECO allocate revenue regulation adjustments to all customer classes In terms of how the costs are allocated IPC BGE WPS National Grid and HECO allocate costs differently among the customer classes PGampE however allocates costs uni-formly among the customers Because PGampE has separated its business units it also separately calculates and allocates
Decoupling Case Studies Revenue Regulation Implementation in Six States
33
Table 10
Carrying Charges
Table 11
Cap on Rate Adjustment
Pacific Gas amp Electric
Idaho Power Company
Baltimore Gas amp Electric
Wisconsin Public Service Corporation
National Grid
Hawaiian Electric CompanyPacific Gas amp Electric
Idaho Power Company
Baltimore Gas amp Electric
Wisconsin Public Service Corporation
National Grid
Hawaiian Electric Company
None
Yes
None
Yes at the short-term debt rate
Yes at the customer deposit rate
Yes at the customer deposit rateNo
3 rate cap excess carried over to next period
10 rate cap excess carried over to next period
Cap of $14 million per year
$170 million in CapEx
No
revenue regulation surpluses and deficits among its electric distribution gas distribution and electric generation busi-nesses This illustrates that there are several ways to address revenues from revenue regulation depending on the policy outcomes that are desired
Carrying ChargesCarrying charges applied to uncollected or surplus rev-
enues can be used to account for the time value of money and the lost opportunity or value to having those revenues in hand PGampE and BGE do not accrue carrying charges On the other hand IPC WPS National Grid and HECO do For BGE given that the revenue regulation revenues are reconciled and recovered monthly it would make little sense to include a carrying cost Where carrying costs have been used they have included in the cases of these utili-ties the short-term debt rate or the customer deposit rate which for one utility is six percent and probably close to the short-term debt rate Thus the carrying charge rates are appropriately at the lower end of the spectrum reflecting their short-term nature In the application of the carrying charge symmetry should be preserved by applying it to both deficits and surpluses Application of carrying charges given the short period that costs are carried (one year) is somewhat discretionary Although it does more accurately account for costs it does add a modest level of complica-tion in tracking costs
Rate Caps and CollarsOne of the ways to protect customers in the event of sig-
nificant adjustments is to impose a rate cap (or collar) that limits the amount of a rate increase (and decrease) Some customers are sensitive to changes in foundational costs like utility bills and if costs are going to rise they benefit from a pattern of steady modest increases rather than a large step increase Any structural increases in rates attributable
to reductions in sales or increases in costs recognized by the revenue regulation plan would be eventually included in rates under any system A cap reflects a controlled way to manage customer expectations and customer impacts Structural changes can only be managed for a while until a complete rate case is needed to reset all assumptions
Typically when a rate cap is imposed if the formulaic increase exceeds the cap or collar the utility will be able to carry over any uncollected revenues until the next rate adjustment Two of the utilities studied PGampE and HECO do not have rate caps On the other hand the other four utilities do include rate caps in varying amounts National Grid has a one-percent revenue cap whereas IPC and BGE have a one-percent and a ten-percent rate cap respectively WPS unlike the others has a cap tied to the dollar amount of $14 million as opposed to a percentage Consistent with the goals of revenue regulation all of the utilities studied have a carryover provision that is important for reducing the risk that the utility will not recover its revenue require-ments
Note that National Grid differs from BGE and HECO in that its cap is on revenues whereas the other two utilities cap rates and rate impacts A revenue cap is more focused on ensuring minimal change to the revenue requirements authorized by the commission National Grid as discussed previously allows for mini rate cases to adjust the rev-enue requirements Having the one-percent cap limits the amount of increase that can occur through that process requiring revenue changes that are greater to occur in a full rate case However note also that some of the adjustments allowed in the mini rate case have their own separate cap The IPC rate cap is in line with what many other utilities with caps have in place which generally range from one to three percent The ten-percent rate cap in the BGE plan is
Decoupling Case Studies Revenue Regulation Implementation in Six States
34
59 Morgan P (2012 December) Graceful Systems LLC A decade of decoupling for US energy utilities rate impacts designs and observa-tions p5
reflective of its monthly adjustment pattern An annual ad-justment allows more time to smooth out peaks and valleys in revenues whereas a monthly adjustment will be influ-enced by more of the spikes (particularly weather-driven variation) thus the need for a larger bandwidth for the car-ryover Like a variable energy rate or fuel adjustment clause that fluctuates monthly the monthly adjustment introduces more volatility into the rates
Actual Historical AdjustmentsFor many ratepayer advocates there is a concern that
some of the utility management risk will be transferred to customers as a consequence of a policy that seeks to ensure that the utility will be made whole However the utility re-tains management risk and the requirement to demonstrate that it has acted prudently Thus the utility still has just as much of an incentive to operate efficiently as it did without revenue regulation If the utility can lower its costs it can still increase its profits Second by designing rates symmet-rically such that under- and over-recoveries are reconciled it provides customers with an opportunity to obtain credits that under traditional regulation would be retained by the utility It has often been opined that when there are large
gaps in time between utility rate cases it is because the utility is over-earning and exceeding its revenue require-ments In those instances customers never get to examine what the utility is collecting much less receive a refund Under revenue regulation with its periodic adjustments and scheduled general rate cases the revenue requirements are examined and refunds or credits allocated such that customers have a better knowledge base for understanding the utilityrsquos earnings And annual reconciliation of the util-ityrsquos actual revenues versus authorized revenues provides consumers with a tool to reign in excess revenue recovery beyond authorized amounts Third the adjustments that do occur under revenue regulation are manageable and frequently less than the adjustments customers are used to seeing on their bills for fuel or variable generation rates or for the myriad of other surcharges that can be tacked on to a customerrsquos bill such as an infrastructure (smart grid) sur-charge maintenance upgrade fee regulatory asset charge or system benefit charge
As seen in Figure 1 the range of rate impacts cluster around plus or minus two percent but can at times exceed plus or minus five percent The total of surcharges has somewhat exceeded the total of credits
Figure 1
Total Utility Decoupling Adjustment Rate Impacts59
300
250
200
150
100
50
0
Nu
mber
of
Dec
oup
lin
g A
dju
stm
ents
Over -5 -4 to -5 -3 to -4 -2 to -3 -1 to -2 0 to -1 0 to 1 1 to 2 2 to 3 3 to 4 4 to 5 Over 5
Percentage Rate Impacts
SurchargesRefunds
ResidentialAll
Other
Commercial
Total
Decoupling Case Studies Revenue Regulation Implementation in Six States
35
60 Id p 3
61 Schultz T Energy Efficiency at Idaho Power Available at httpwwwenergyidahogovenergyalliancedida_powerpdf
As can be seen with the utilities studied above the larger fluctuations are attributable to adjustment mechanisms that are reconciled more frequently such as monthly as those are less able to smooth out anomalies as an annual adjust-ment would do From a dollar perspective for the roughly 64 percent of adjustments that fall within the plus or minus two-percent range the monthly bill impact is approxi-mately $230 for average electric customers and $140 for average gas customers60
Of the six utilities studied the fluctuations in adjustment have for the most part stayed within the one- to three-per-cent range as shown below
bull PGampE from 2005 to 2012 has had annual revenue regulation adjustments ranging from minus143 percent to 415 percent with an average adjustment of 197 percent
bull For IPC the adjustments are separated between residential and commercial customers For residential customers the annual adjustments from 2007 through 2011 ranged from 077 percent to 258 percent for an average of 162 percent As for the commercial customers the annual adjustments for that same period were higher ranging from 104 percent to 424 percent with an average adjustment of 252 percent
bull BGE has monthly adjustments that ranged from minus1853 percent to 3013 percent with an average of 057 percent for residential customers from March 2008 through August 2012 For General Service Customers the monthly adjustment ranged from minus2264 percent to 2462 percent The average adjustment was 1308 percent
bull For WPS the annual adjustments from 2009 through 2011 ranged from minus145 percent to 378 percent for residential and small commercial and from minus314 percent to 899 percent for commercial Note that because of a $14 million per year cap some of these percentages were carried over The average annual adjustment for residential and small commercial and for commercial was 163 percent and 215 percent respectively with carry-overs to subsequent years
bull For Massachusetts Electric and Nantucket Electric both of which operate under National Grid the annual revenue regulation adjustment for all for 2011 and 2012 was minus0105 percent and 0315 percent for an average revenue regulation adjustment over the two years of 0105 percent
bull HECO like National Grid has one annual revenue
regulation mechanism for its customers which resulted in adjustments in 2011 and 2012 of 063 percent and 107 percent respectively for an average adjustment of 085 percent
As can be gleaned from the above information the range of average adjustments for small use customers was a low of 0105 percent for National Grid to a high of 197 percent for PGampE For larger use customers the range was a low of 0105 percent for National Grid to a high of 252 percent for IPC This demonstrates that on average for these utilities with well-developed and diversely designed revenue regula-tion proposals their adjustments on average stayed at or below approximately 25 percent
One of the metrics for determining if a revenue regula-tion program is working successfully that was discussed above was the impact on rates of a revenue regulation mechanism As can be seen by the analysis of the adjust-ment levels for each of the utilities they are within a rea-sonable range
Complementary Policies Although a revenue regulation mechanism does not need
to be accompanied by other policies energy efficiency is frequently at the root of the reason revenue regulation was proposed in the first place The states examined in this pa-per have various obligations for energy efficiency achieve-ment placed upon their utilities Only Idaho does not have an Energy Efficiency Resource Standard but energy efficiency objectives are developed through an integrated resource plan process Energy efficiency spending at IPC has increased dramatically in recent years61
In recognition of the fact that revenue regulation only removes the disincentive to pursue energy efficiency several states have instituted some form of incentives to reward the desired outcome This mechanism can not only incentivize management to aggressively pursue energy efficiency but also make shareholders supportive in the face of lost invest-ment opportunity
Rate design can also play an important part in assist-ing the utility in achieving favorable energy efficiency outcomes Inclining block rates penalize inefficient use of electricity and shorten payback times from the customer perspective Because efficiency reduces consumption at
Decoupling Case Studies Revenue Regulation Implementation in Six States
36
62 Optional rate designs for PGampE include TOU and Peak Time Pricing
63 IPC also has an optional TOU rate design
64 Optional rate designs for this utility include TOU Critical Peak Pricing and Contract
65 National Grid also offers optional TOU and flat rate designs
66 HECO also offers optional TOU and flat rate designs
67 See eg Alexander B (1996 April) How to construct a service quality index in performance-based ratemaking Electricity Policy
the tail block rate the value of kWh savings is greater than with flat rates On the other side of the spectrum declining block rates which have a reduced rate in the tail block do little to encourage conservation In fact they operate more like a discounted bulk rate by reducing the average cost of a kWh in a customerrsquos bill for the more kWh used
Performance incentives or other ways to avoid destruc-tive cost-cutting in the name of creating margins that reduce service or reliability or lessen customer value have been implemented only in Massachusetts of the six utilities illustrated here Several other states have implemented vari-ous schemes in reaction to perceived deficiencies in utility service67 Performance incentives are not unique to rev-enue regulation Commissions wishing to implement such a scheme can find many models of incentive reward and penalty mechanisms developed for other purposes
Taken together a suite of policy and program features can create an atmosphere that is conducive to achievement of energy efficiency goals within the utility and for the customers By appropriate application of these techniques regulators working with utilities and stakeholders can remove barriers and create an opportunity for energy ef-ficiency to be fully integrated into the utility supply option portfolio
Energy Efficiency OutcomesAlthough revenue regulation itself does not create an
incentive for a utility to implement energy efficiency it does address the issue of lost revenues associated with energy
Table 12
Complementary Policies for Energy Efficiency
Pacific Gas amp Electric62
Idaho Power Company63
Baltimore Gas amp Electric
Wisconsin Public Service Corporation64
National Grid65
Hawaiian Electric Company66
Energy Efficiency Requirement
1 annually
IRP
10 by 2015
075 annually
24 annually
Energy efficiency can satisfy portion of RPS
Default Residential Rate Design
Inclining block
Inclining block
TOU seasonal
Flat
Inclining block
Inclining block
Incentive Structure
Risk reward incentive mechanism
No
No
No
5 of program costs
Third-party administrator paid for contract performance
Performance Incentives
Reliability reporting only
None
Under consideration
Reliability reporting only
Service quality reward and penalty
Under consideration
efficiency and DG programs Revenue regulation should be combined with other mechanisms that require or incentiv-ize the implementation of energy efficiency by the utility or a third party The level of energy efficiency achieved can be one measure of the success of a revenue regulation mechanism as implemented in a larger program designed to achieve energy efficiency Table 13 shows the incremental annual energy efficiency savings reported by each utility with the shaded box indicating the year that the utilityrsquos revenue regulation mechanism was implemented National Grid had achieved a high level of energy efficiency savings in the years before it implemented revenue regulation
This paper has not evaluated DG outcomes to correlate with revenue regulation as it is not perceived that states and utilities have made that connection expressly in histori-cal mechanisms However it is expected that this connec-
Decoupling Case Studies Revenue Regulation Implementation in Six States
37
68 EIA Form EIA-861 data files Available at httpwwweiagovelectricitydataeia861
69 PGampE began revenue regulation in 1974 and it was later suspended and recommenced in 2001
70 WPS savings are represented by the statewide program savings from the Focus on Energy program WPS provided additional funds to Focus on Energy starting in CY10 through their territory-wide program activities
71 In 2009 Hawaii Energy a ratepayer-funded statewide energy efficiency provider began delivering services Savings reported after 2009 represent savings achieved through the programs of Hawaii Energy
Table 13
Annual Incremental Energy Efficiency Savings as Percentage of Retail Sales68
Highlighted cells are the year that utility started decoupling
Pacific Gas amp Electric69
Idaho Power Company
Baltimore Gas amp Electric
Wisconsin Public Service Corporation70
National Grid
Hawaiian Electric Company71
2004
11
01
00
03
11
00
2005
16
03
00
03
09
05
2006
10
05
00
03
12
05
2010
19
13
17
09
136
12
tion will be made in future mechanisms and furthermore it is anticipated that follow on work to this paper will want to study that connection between revenue regulation and DG performance
Conclusions
An increasing number of states are looking to increase the rate of energy efficiency investments for their long-run cost and risk advantages The benefits of energy efficiency include not only its ability to reduce system costs across the distribution transmission and generation functions but also the opportunity for customers to reduce their individ-ual energy costs for their own electric bills Nevertheless it is counterintuitive to encourage or order a utility to sell less of its product In order to encourage the proliferation of en-ergy efficiency programs as a solution that can contribute to this nationrsquos energy needs this tension between the goals of society versus the goals of the utility needs to be addressed Revenue regulation can be such a solution by removing the link between sales and revenues
There are many ways to implement revenue regulation and multiple decision points that regulators must consider in designing a revenue regulation mechanism This paper focused on six utilities each of which implemented revenue regulation in different ways in accordance with the objectives of that state Different decision points discussed include
bull Should revenue regulation apply to all functions (generation transmission and distribution) which sometimes depends on if the utility is regulated or restructured
bull Should revenue regulation apply to all customer classes
bull Should there be symmetry such that a reconciliation adjustment occurs for both over- and under-recoveries of the revenue requirements
bull Should recovery of indicated surcharges be conditioned on acceptable performance on customer service quality or energy efficiency goals
bull Should there be an attrition adjustment to account for other expenses or should the revenue regulation adjustment be limited to reconciling existing revenue requirements
bull Should there be an inflation adjustmentbull To calculate the revenue requirements should the
current or accrual method be usedbull Should the adjustments be made in rate cases or
through a riderbull How frequently should adjustments be made
monthly annually or some other time periodbull Depending on the period of time between true up and
recovery should there be carrying charges and if so how should they be calculated
2007
21
06
00
03
09
04
2008
35
10
05
09
05
05
2009
20
11
06
10
11
11
Decoupling Case Studies Revenue Regulation Implementation in Six States
38
72 Avista Utilities (2009) Washington Utilities and Transportation Commission Docket UE-090134
bull Should there be a requirement authorizing the frequency of rate case
bull Should there be an annual cap on the amount of the adjustment and if so should there be an opportunity to carry over any additional amounts and for how many years
bull Should there be an adjustment to the cost of capital to reflect the reduced risk
Other considerations for regulators whether or not they implement revenue regulation but certainly as part of a comprehensive package are other measures that can be put in place to encourage consumers and utilities alike to actively participate in energy efficiency For example an inclining block rate structure by virtue of its incentive to consume less pairs well with an energy efficiency program helps drive consumers to participate in efficiency programs and accelerates the payback of an energy efficiency investment By the same token an incentive payment to the utility helps provide its management with a good reason to excel and exceed targets for energy efficiency programs
A key point illustrated by the list of considerations above is that there is not just one static way to design and implement revenue regulation but rather there are a variety of options for doing so In this study a diverse group of utilities were reviewed The differences among the utilities included geographic diversity vertically integrated and restructured utilities different levels of energy efficiency in place and certainly differences in how the revenue regulation mechanisms were implemented No two utilities were alike and no two utilities had the same revenue regulation mechanism The key is that revenue regulation should eliminate the throughput incentive but the means for accomplishing this goal can vary and be tailored to each jurisdiction and each utility and still be successful
There are several considerations in the design of a revenue regulation mechanism that can help ensure its successful adoption To begin revenue regulation should be granted to utilities only as a precondition to implementing comprehensive energy efficiency andor DG policies Unless accompanied by a commitment to engage in providing least-cost resource options that could impact sales there is not really any good policy reason for its adoption All of the utilities studied are actively engaging in energy efficiency Furthermore as a matter of fairness the revenue regulation mechanism should be symmetrical so that any revenues above those authorized are refunded back to consumers As Figure 1 demonstrates although there are more surcharges to customers there is nevertheless a healthy amount of
credits back to consumers This is the bargain Barring imprudence or other unforeseen circumstances the utility receives its authorized revenue requirements and nothing more or less under a simple revenue regulation mechanism
Rate design plays an important role in the effectiveness of energy efficiency in concert with revenue regulation A low customer charge is preferable so that the customer can benefit from real bill reductions tied to reduced volumetric consumption Reductions in consumption not only reduce bills but also positively impact the payback period for investments in energy efficient appliances Declining block rates in which the tail block rate is lower than the first tier also do not encourage conservation Inclining block rates that reward low usage in the first block with a lower rate send the better price signals None of the six utilities studied had declining block residential rates They were inclining flat and time-varying
The revenue adjustment mechanism is also a critical decision point in terms of whether a revenue per customer mechanism is adopted that accounts for only the current revenue requirements or whether latitude is given to include an inflation adjustment or other cost increases in the revenue adjustment mechanism Three of the utilities studied adopted this approach whereas another two used a hybrid approach Finally to reduce volatility five of the six utilities opted for annual rather than monthly adjustments thereby creating a level of rate stability that customers in general prefer
Once the goals for revenue regulation are set by the regulators the next step is to design programs that will implement that goal For energy efficiency to be as successful as possible regulators may want to adopt a complement of other policies to accompany revenue regulation These can include rate designs that reward reduced use and conservation as well as incentive payments to utilities that reward them for meeting or exceeding targets Of the six utilities studied three have adopted some form of incentive One simple approach that was used in Washington was to link recovery of any surcharges under the revenue regulation mechanism to achievement of energy efficiency targets72
For the utilities examined above that have implemented revenue regulation the evidence demonstrates that revenue regulation as a strategy and a mechanism to enable
Decoupling Case Studies Revenue Regulation Implementation in Six States
39
energy efficiency has been working well The fact that each revenue regulation mechanism varies from the next demonstrates that there are many different paths that can be followed in implementing revenue regulation based on the needs of the utility and its stakeholders in a particular
region This study demonstrates that revenue regulation does work and provides examples of how it can be implemented each one different and unique because of the number of decision points to be considered in designing a revenue regulation mechanism
Decoupling Case Studies Revenue Regulation Implementation in Six States
40
Appendix
Historic Rate Adjustments
Table 14
PGampE Revenue Regulation Rate Adjustments 1983 to 199373
Table 15
PGampE Revenue Regulation Adjustments 2005 to 201274
Table 16
IPC Revenue Regulation Adjustments76
Idaho Power Company
1983 23
1984 (34)
1985 (48)
1986 19
1987 21
1988 50
1989 (43)
1990 (54)
1991 39
1992 34
1993 00
2005 8925 minus12773 minus143
2006 9933 2246 226
2007 10409 21727 209
2008 10261 4032 039
2009 11169 10355 093
2010 11224 46556 415
2011 10306 38390 373
2012 11032 40304 365
2007 Residential minus00457 590 minus077
Commercial minus00457 428 minus107
2008 Residential 00529 670 090
Commercial 00529 510 104
2009 Residential 01220 770 158
Commercial 01535 603 255
2010 Residential 01800 785 229
Commercial 02273 613 371
2011 Residential 02028 785 258
Commercial 02597 613 424
Revenue Regulation Adjustment as of
Total Rates
Delivery Revenue
Requirement ($ millions)
Adjustment Rate
Revenue Regulation Adjustment($ millions)
Retail Rate
of Delivery Revenue
Revenue Regulation Adjustment
Year
Year
73 Lesh P (2009 June 30) Rate impacts and key design elements of gas and electric utility decoupling
74 Morgan P (2012 November) A decade of decoupling for US energy utilities rate impacts designs and observations
75 Morgan P (2012 November) A decade of decoupling for US energy utilities rate impacts designs and observations
76 All numbers provided by the utility
Decoupling Case Studies Revenue Regulation Implementation in Six States
41
77 Idaho Power Company Case No IPC-E-11-19- fixed cost adjustment permanent mechanism Available at httpwwwpucidahogovinternetcaseselecIPCIPCE1119company20120928COMPLIANCE20FILINGPDF
Figure 2
IPC Revenue Regulation Adjustments77
Residential FCA Balance and Use per Customer
$10000000
$8000000
$6000000
$4000000
$2000000
$0
-$2000000
-$4000000
-$6000000
1080
1070
1060
1050
1040
1030
1020
1010
1000Res
idu
al A
uth
oriz
ed F
CA
Am
oun
t
Residual Authorized FCA Amount ($)
Monthly Use Per Customer (kWh)
kW
h U
sed
2006 2007 2008 2009 2010 2011
78 Morgan P (2012 November) A decade of decoupling for US energy utilities rate impacts designs and observations
Decoupling Case Studies Revenue Regulation Implementation in Six States
42
Table 17a
Baltimore Gas and ElectricBGE Monthly Revenue Regulation Adjustments 2008 to 201278
Table 17b
Baltimore Gas and ElectricBGE Monthly Revenue Regulation Adjustments 2008 to 201278
March Residential 000172 01477 1165General Service 000230 01526 1507
April Residential 000016 01477 0108General Service 000146 01526 0957
May Residential 000066 01477 0447General Service 000230 01526 1507
June Residential minus000066 01477 minus0447General Service 000230 01526 1507
July Residential 000158 01477 1070General Service 000230 01526 1507
August Residential minus000040 01477 minus0271General Service 000214 01526 1402
September Residential 000237 01477 1605General Service 000230 01526 1507
October Residential 000237 01477 1605General Service 000143 01526 0937
November Residential 000237 01477 1605General Service 000140 01526 0917
December Residential 000445 01477 3013General Service 000230 01526 1507
January Residential 000035 01579 0222General Service minus000073 01346 minus0542
February Residential 000025 01579 0158General Service 000230 01346 1709
March Residential minus000237 01579 minus1501General Service 000230 01346 1709
April Residential minus000237 01579 minus1501General Service 000230 01346 1709
May Residential 000234 01579 1482General Service 000132 01346 0981
June Residential 000237 01579 1501General Service 000230 01346 1709
July Residential 000237 01579 1501General Service 000230 01346 1709
August Residential 000237 01579 1501General Service 000190 01346 1412
September Residential 000237 01579 1501General Service 000230 01346 1709
October Residential 000237 01579 1501General Service 000124 01346 0921
November Residential 000237 01579 1501General Service 000230 01346 1709
December Residential 000156 01579 0988General Service 000204 01346 1516
Adjustment $kWh
Adjustment $kWh2008 2009
Retail Rate
$kWh
Retail Rate
$kWhAdjustment
Adjustment
Decoupling Case Studies Revenue Regulation Implementation in Six States
43
Table 17c
Baltimore Gas and ElectricBGE Monthly Revenue Regulation Adjustments 2008 to 201278
Table 17d
Baltimore Gas and ElectricBGE Monthly Revenue Regulation Adjustments 2008 to 201278
January Residential 000203 01465 1386General Service 000230 01261 1824
February Residential minus000142 01465 minus0969General Service 000230 01261 1824
March Residential minus000237 01465 minus1618General Service 000230 01261 1824
April Residential minus000237 01465 minus1618General Service 000230 01261 1824
May Residential 000192 01465 1311General Service 000230 01261 1824
June Residential 000191 01465 1304General Service 000230 01261 1824
July Residential 000095 01465 0648General Service 000230 01261 1824
August Residential minus000176 01465 minus1201General Service 000224 01261 1776
September Residential minus000237 01465 minus1618General Service 000116 01261 0920
October Residential minus000237 01465 minus1618General Service 000081 01261 0642
November Residential minus000237 01465 minus1618General Service 000098 01261 0777
December Residential minus000079 01465 minus0539General Service 000229 01261 1816
January Residential minus000130 01365 minus0952General Service 000230 01156 1990
February Residential minus000253 01365 minus1853General Service minus000020 01156 minus0173
March Residential minus000018 01365 minus0132General Service minus000063 01156 minus0545
April Residential 000110 01365 0806General Service minus000262 01156 minus2266
May Residential 000010 01365 0073General Service minus000160 01156 minus1384
June Residential 000226 01365 1656General Service 000042 01156 0363
July Residential 000253 01365 1853General Service 000209 01156 1808
August Residential minus000007 01365 minus0051General Service minus000157 01156 minus1358
September Residential minus000253 01365 minus1853General Service minus000177 01156 minus1531
October Residential 000228 01365 1670General Service 000262 01156 2266
November Residential minus000059 01365 minus0432General Service 000262 01156 2266
December Residential 000071 01365 0520General Service 000262 01156 2266
Adjustment $kWh
Adjustment $kWh2010 2011
Retail Rate
$kWh
Retail Rate
$kWhAdjustment
Adjustment
Decoupling Case Studies Revenue Regulation Implementation in Six States
44
Table 17e
Baltimore Gas and ElectricBGE Monthly Revenue Regulation Adjustments 2008 to 201278
January Residential 000253 01291 1960General Service 000262 01064 2462
February Residential 000253 01291 1960General Service 000262 01064 2462
March Residential 000253 01291 1960General Service 000262 01064 2462
April Residential 000253 01291 1960General Service 000262 01064 2462
May Residential 000253 01291 1960General Service 000262 01064 2462
June Residential 000253 01291 1960General Service 000262 01064 2462
July Residential 000253 01291 1960General Service 000262 01064 2462
August Residential 000253 01291 1960General Service 000160 01064 1504
Adjustment $kWh2012
Retail Rate
$kWhAdjustment
Decoupling Case Studies Revenue Regulation Implementation in Six States
45
79 Morgan P (2012 November) A decade of decoupling for US energy utilities rate impacts designs and observations
80 Morgan P (2012 November) A decade of decoupling for US energy utilities rate impacts designs and observations
Table 18
Wisconsin Public Service Corporation Revenue Regulation Adjustments 2009 to 201179
2009 ResidentialSmall Commercial 00048705 000168154 01290 378 130Commercial 00084951 000293293 00945 899 310
2010 ResidentialSmall Commercial 00033043 000166936 01291 256 129Commercial 00056630 000286103 09460 060 030
2011 ResidentialSmall Commercial (00018666) $ (000163719) 01288 minus145 minus127Commercial (00032565) $ (000285629) 01037 minus314 minus275
Derived Adjustment
$kWh
Derived Adjustment Capped $
kWh
Retail Rate
$kWh
Revenue Regulation Actual
Revenue Regulation Capped
Table 19
National Grid Revenue Regulation Adjustments 2011-201276
Massachusetts Electric and Nantucket Electric
Table 20
Hawaiian Electric Company
2011 All minus0015 1429 minus0105
2012 All 0044 1396 0315
2011 01995 3149 063
2012 03894 3641 107
Revenue Regulation Adjustment
centkWh
Revenue Regulation Adjustment
centkWhRetail Rate
centkWh
Retail Rate
Revenue Regulation Adjustment
Revenue Regulation
ldquoThe 2011 adjustment took effect June 1 but was reduced to $0 on July 26 2011 when the Commission granted HECO an interim rate increase of $532 million in a 2011 test year general rate case The 2012 Adjustment runs from June 1 2012 through May 31 2013 About 25 of the total relates to the portion of the decoupling mechanism that updates OampM and rate baserdquo (Morgan 2013)
Decoupling Case Studies Revenue Regulation Implementation in Six States
46
Revenue Regulation and Decoupling A Guide to Theory and Applicationhttpwwwraponlineorgdocumentdownloadid902
This guide was prepared to assist anyone who needs to understand both the mechanics of a regulatory tool known as decoupling and the policy issues associated with its use This would include public utility commissioners and staff utility management advocates and others with a stake in the regulated energy system While this guide is somewhat technical at points we have tried to make it accessible to a broad audience to make comprehensible the underlying concepts and the implications of different design choices This guide includes a detailed case study that demonstrates the impacts of decoupling using different pricing structures (rate designs) and usage patterns
Pricing Dorsquos and Donrsquots Designing Retail Rates as if Efficiency Countshttpwwwraponlineorgdocumentdownloadid939
Rate design is a crucial element of an overall regulatory strategy that fosters energy efficiency and sends appropriate signals about efficient system investment and operations Rate design is also fully under the control of state regulators Progressive rate design elements can guide consumers to participate in energy efficiency programs and reduce peak demand yet relatively few utilities and commissions have implemented many of these elements This RAP paper identifies some best practices Because pricing issues tie closely to utility growth incentives we also address revenue decoupling
A Decade of Decoupling for US Energy Utilities Rate Impacts Designs and Observationshttpwwwraponlineorgdocumentdownloadid6356
This report written by Pamela Morgan of Graceful Systems LLC builds on a 2009 report Now covering 25 states including 49 LDCs and 24 electric utilities this report summarizes the decoupling mechanism designs these utilities use and the rate adjustments they have made under those mechanisms In total this report estimates the retail rate impacts of 1244 decoupling mechanism adjustments since 2005
Additional Resources
The Role of Decoupling Where Energy Efficiency is Required by Lawhttpwwwraponlineorgdocumentdownloadid275
This Issuesletter gives an overview of energy efficiency resource standards the need to decouple utility profits from utility sales and explains why decoupling is needed even where a third party administers energy efficiency programs
Revenue Decoupling Standards and Criteria A Report to the Minnesota Public Utilities Commissionhttpwwwraponlineorgdocumentdownloadid850
In 2007 the Minnesota legislature enacted a new statute Section 216B2412 in which it defined an alternative approach to utility regulation decoupling and directed the Public Utilities Commission (PUC) to ldquoestablish criteria and standardsrdquo by which decoupling could be adopted for the statersquos rate-regulated utilitiesTo fulfill its obligation to develop criteria and standards for decoupling the PUC sought the advice of the Regulatory Assistance Project (RAP) This report is the output of that collaboration
Designing Distributed Generation Tariffs Wellhttpwwwraponlineorgdocumentdownloadid6898
Improvements in distributed generation economics increasing consumer preference for clean distributed energy resources and a favorable policy environment in many states have combined to produce significant increases in distributed generation adoption in the United States Regulators are looking for the well-designed tariff that compensates distributed generation adopters fairly for the value they provide to the electric system compensates the utility fairly for the grid services it provides and charges non-participating consumers fairly for the value of the services they receive This paper offers regulatory options for dealing with distributed generation The authors outline current tariffs and ponder what regulators should consider as they weigh the benefits costs and net value to distributed generation adopters non-adopters the utility and society as a whole The paper highlights the importance of deciding upon a valuation methodology so that the presence or absence of cross-subsidies can be determined Finally the paper offers rate design and ratemaking options for regulators to consider and includes recommendations for fairly implementing tariffs and ratemaking treatments to promote the public interest and ensure fair compensation
Decoupling Case Studies Revenue Regulation Implementation in Six States
47
The Regulatory Assistance Project (RAP)trade is a global non-profit team of experts focused on thelong-term economic and environmental sustainability of the power sector We provide technical and policy assistance on regulatory and market policies that promote economic efficiency environmental protection system reliability and the fair allocation of system benefits among consumers We work extensively in the US China the European Union and India Visit our website at wwwraponlineorg to learn more about our work
Rate Design Where Advanced Metering Infrastructure Has Not Been Fully Deployedhttpwwwraponlineorgdocumentdownloadid6516
This paper identifies sound practices in rate design applied around the globe using conventional metering technology Rate design for most residential and small commercial customers (mass market consumers) is most often reflected in a simple monthly access charge and a per-kWh usage rate in one or more blocks and one or more seasons A central theme across the practices highlighted in this paper is that of sending effective pricing signals through the usage-sensitive components of rates in a way that reflects the character of underlying long-run costs associated with production and usage While new technology is enabling innovations in rate design that carry some promise of better capturing opportunities for more responsive load the majority of the worldrsquos electricity usage is expected to remain under conventional pricing at least through the end of the decade and much longer in some areas Experience to date has shown that the traditional approaches to rate design persist well after the enabling technology is in place that leads to change
Time-Varying and Dynamic Rate Designhttpwwwraponlineorgdocumentdownloadid5131
This report discusses important issues in the design and deployment of time-varying rates The term time-varying rates is used in this report as encompassing traditional time-of-use rates (such as time-of-day rates and seasonal rates) as well as newer dynamic pricing rates (such as critical peak pricing and real time pricing) The discussion is primarily focused on residential customers and small commercial customers who are collectively referred to as the mass market The report also summarizes international experience with time-varying rate offerings
50 State Street Suite 3Montpelier Vermont 05602802-223-8199wwwraponlineorg
- Table of Contents
- Introduction
- California Pacific Gas and Electric Company
- Idaho Idaho Power Company
- Maryland Baltimore Gas and Electric
- Wisconsin Wisconsin Public Service Corporation
- Massachusetts National Grid
- Hawaii Hawaiian Electric Company
- Discussion of the Six Utilities Overall
- Conclusions
- Appendix
- Additional Resources
-
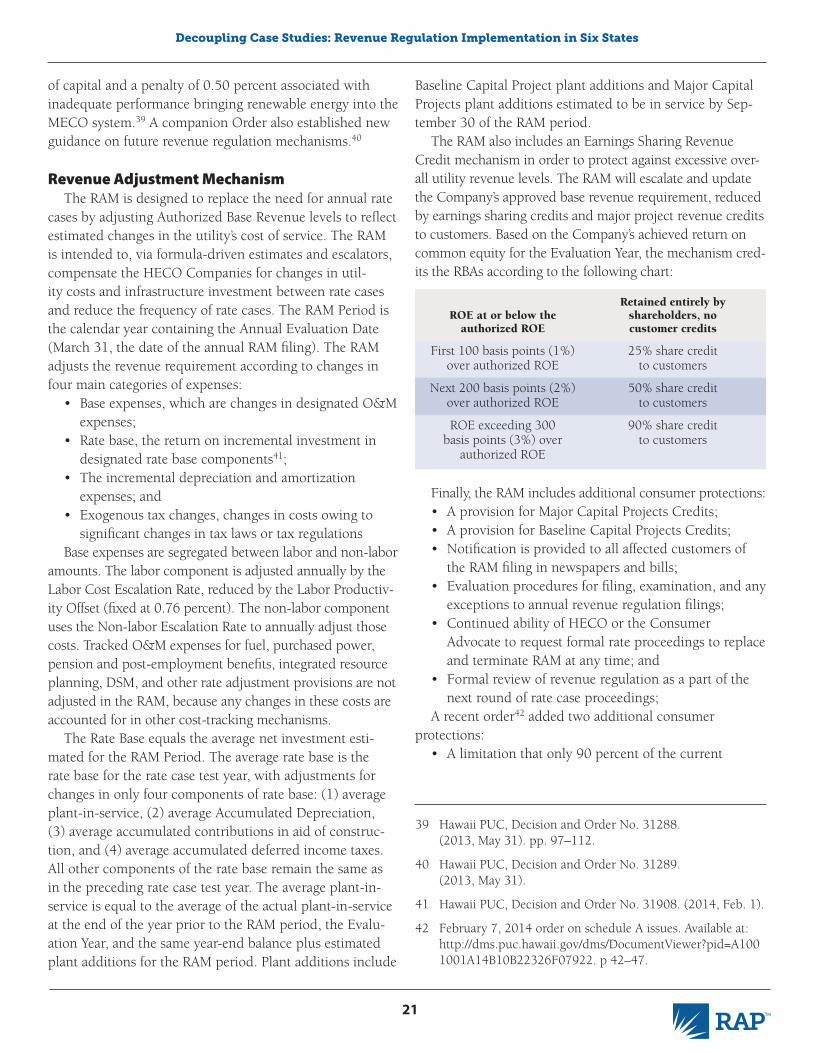
Decoupling Case Studies Revenue Regulation Implementation in Six States
21
39 Hawaii PUC Decision and Order No 31288 (2013 May 31) pp 97ndash112
40 Hawaii PUC Decision and Order No 31289 (2013 May 31)
41 Hawaii PUC Decision and Order No 31908 (2014 Feb 1)
42 February 7 2014 order on schedule A issues Available at httpdmspuchawaiigovdmsDocumentViewerpid=A1001001A14B10B22326F07922 p 42ndash47
of capital and a penalty of 050 percent associated with inadequate performance bringing renewable energy into the MECO system39 A companion Order also established new guidance on future revenue regulation mechanisms40
Revenue Adjustment MechanismThe RAM is designed to replace the need for annual rate
cases by adjusting Authorized Base Revenue levels to reflect estimated changes in the utilityrsquos cost of service The RAM is intended to via formula-driven estimates and escalators compensate the HECO Companies for changes in util-ity costs and infrastructure investment between rate cases and reduce the frequency of rate cases The RAM Period is the calendar year containing the Annual Evaluation Date (March 31 the date of the annual RAM filing) The RAM adjusts the revenue requirement according to changes in four main categories of expenses
bull Base expenses which are changes in designated OampM expenses
bull Rate base the return on incremental investment in designated rate base components41
bull The incremental depreciation and amortization expenses and
bull Exogenous tax changes changes in costs owing to significant changes in tax laws or tax regulations
Base expenses are segregated between labor and non-labor amounts The labor component is adjusted annually by the Labor Cost Escalation Rate reduced by the Labor Productiv-ity Offset (fixed at 076 percent) The non-labor component uses the Non-labor Escalation Rate to annually adjust those costs Tracked OampM expenses for fuel purchased power pension and post-employment benefits integrated resource planning DSM and other rate adjustment provisions are not adjusted in the RAM because any changes in these costs are accounted for in other cost-tracking mechanisms
The Rate Base equals the average net investment esti-mated for the RAM Period The average rate base is the rate base for the rate case test year with adjustments for changes in only four components of rate base (1) average plant-in-service (2) average Accumulated Depreciation (3) average accumulated contributions in aid of construc-tion and (4) average accumulated deferred income taxes All other components of the rate base remain the same as in the preceding rate case test year The average plant-in-service is equal to the average of the actual plant-in-service at the end of the year prior to the RAM period the Evalu-ation Year and the same year-end balance plus estimated plant additions for the RAM period Plant additions include
Baseline Capital Project plant additions and Major Capital Projects plant additions estimated to be in service by Sep-tember 30 of the RAM period
The RAM also includes an Earnings Sharing Revenue Credit mechanism in order to protect against excessive over-all utility revenue levels The RAM will escalate and update the Companyrsquos approved base revenue requirement reduced by earnings sharing credits and major project revenue credits to customers Based on the Companyrsquos achieved return on common equity for the Evaluation Year the mechanism cred-its the RBAs according to the following chart
ROE at or below the authorized ROE
First 100 basis points (1) over authorized ROE
Next 200 basis points (2) over authorized ROE
ROE exceeding 300 basis points (3) over
authorized ROE
Retained entirely by shareholders no customer credits
25 share credit to customers
50 share credit to customers
90 share credit to customers
Finally the RAM includes additional consumer protectionsbull A provision for Major Capital Projects Creditsbull A provision for Baseline Capital Projects Creditsbull Notification is provided to all affected customers of
the RAM filing in newspapers and billsbull Evaluation procedures for filing examination and any
exceptions to annual revenue regulation filingsbull Continued ability of HECO or the Consumer
Advocate to request formal rate proceedings to replace and terminate RAM at any time and
bull Formal review of revenue regulation as a part of the next round of rate case proceedings
A recent order42 added two additional consumer protections
bull A limitation that only 90 percent of the current
Decoupling Case Studies Revenue Regulation Implementation in Six States
22
43 ACEEE Hawaii Available at httpaceeeorgsectorstate-policyhawaii
RAM Period Rate Base that exceeds the Rate Base Adjustment Mechanism from the prior year can be included in the Decoupling Mechanism for baseline utility plant projects which unlike major capital projects are not subject to prior Commission review and approval and
bull A requirement to post a number of metrics online for customer review although not at this point tied to performance
This order also examined four issues with respect to the application of the RAM The Commission determined that the short-term debt rate as reflected in the most recent rate case should be used to adjust over- and under-collections The Commission also resolved its concern that without a sustainable business plan there exists no strategic frame-work under which to evaluate capital expenditure pro-grams The Commission required the parties in the Docket to further explore capital expenditure issues in conjunction with other risk-sharing mechanisms discussed elsewhere in the order The commission ordered a further evaluation of a proposed risk-sharing mechanism within the RBA Further-more the Commission ordered the parties to work together to establish appropriate metrics which the utility would report on its website
Once the total RAM Revenue Adjustment is calculated it is applied through a uniform adjustment to the per-kWh energy charge for all customer classes
Reconciling Actual Revenue with Authorized Revenue
RBAs record the monthly differences between target revenues and the adjusted recorded electric sales revenues The RBA also applies monthly interest equal to the annual rate for short-term debt from the cost of capital in each HECO Companyrsquos last base rate case to the simple average of the beginning and ending balances each month in the RBA In effect the RBA applies one-twelfth of the rate each month Finally the RBA provides for collection or return of the calendar year-end balances in the RBA and recovery of the RAM Revenue Adjustment over the subsequent May 1 through April 30 period The target revenue is the most recent Authorized Base Revenue or the re-determined Authorized Base Revenue calculated under the RAM
On or before March 28 the Company must file with the Commission a statement of the previous year-end balance in each RBA sub-account and the Authorized Base Revenue level for the current calendar year with supporting calculations An amortization of the year-end balance in the
RBA sub-accounts and the RAM Revenue Adjustment are recovered through the per-kWh RBA rate adjustments The rate adjustment occurs from May 1 of the current calendar year to April 30 of the next year
Complementary PoliciesCurrently electric utilities in Hawaii may use energy
efficiency to meet a portion of their Renewable Portfolio Standard requirements Starting in 2015 electricity savings from energy efficiency will be applied to the Statersquos Energy Efficiency Portfolio Standard which sets a target equivalent to 30-percent forecast sales by 2030 This goal is translated into a target of 14 percent annual savings HECO trans-ferred administration of all of its energy efficiency programs to a third party administrator in 2009 The administrator is compensated for satisfactory performance43
Because of its heavy dependence on petroleum as a generation fuel electricity prices in Hawaii are very high solar and wind are typically lower-cost resources for these systems HECOrsquos default residential rates are inclining block rates with a $900month customer charge and a three-block inclining rate design of $034kWh to $037kWh Residential customers can elect to take service under a TOU rate with off-peak mid-peak and priority-peak tiers Gen-eral service and large power service customers take service under a flat rate unless they opt to take service under a TOU
Hawaii is developing reliability standards in part as a response to deteriorating service quality as a result of distributed and customer-owned generation (see text box) In an effort to make electricity reliability and interconnection standards as transparent as possible the Reliability Standards Working Group was formed in the Feed-In Tariff docket and continues its work in Docket No 2011-0206 to find solutions to integrating high penetrations of renewable energy consistent with reliability and power quality standards
Energy Efficiency OutcomesHECO implemented revenue regulation in 2011 Since
2003 HECO has reported incremental energy efficiency savings between 0 and 05 percent of retail load with 131 percent savings reported in 2011 by Hawaii Energy the
Decoupling Case Studies Revenue Regulation Implementation in Six States
23
44 Hawaii PUC Decision and Order No 31288 Maui Electric Company Limited Docket No 2011-0092 (2013 May 31) Appendix C p 2
Statersquos ratepayer funded efficiency program administrator The company has not yet reported its savings for 201245 In addition HECO has seen more than a sixfold increase in renewable installations under its net metering and feed-in tariff policies since the inception of the revenue regulation plan
Revenue regulation represents a regulatory framework that removes the financial disincentive for utilities to pursue clean
energy strategies It doesnrsquot in and of itself align the utility business model with those utility policies and practices that address customer expectations In fact some commissions are concerned that it might create a dynamic in which the utility assured of its revenue needs becomes complacent and lacks motivation to innovate and develop strategies that may be more in line with the public interest
In a recent order (Docket 2011-0092 May 31 2013) the Hawaiian Public Utilities Commission addressed this big picture issue in a rate order for Maui Electric The Commission called out the management as lacking a long-term vision for creating customer value and expressed concern that ldquothe HECO Companiesrsquo over-reliance upon a link between the [Decoupling]
Agreement and utility financial health obfuscates utility performance and ultimately customer service and satisfactionrdquo44 The implementation of clean energy policies is not a singular goal but rather a policy that must be part of a larger effort to create customer value
The Commission laid out a hard path and a soft path to achieve the results they desire for consumers The hard path involves a closer examination of utility investments operations and expenditures The soft path is opened through the actions of management to create and execute a vision for the utility of the future The Commission remains committed to regulatory innovations that are in the public interest and will work with the utility consumer advocate and other stakeholders to create and implement this vision
The results of this effort will likely produce ideas and outcomes that will have applicability beyond this one utility
ResourcesHawaii Public Utilities CommissionDocket No 2008-0274 Final Decision and Order (August 31 2010)Docket No 2008-0083 Final Decision and Order (December 29 2010)Docket No 2011-0092 Final Decision and Order May 31 2013 including
Decision and Orders Nos 31288 and 31289Docket No 2013-0141 Final Decision and Order (February 1 2014) including
Decision and Order No 31908
45 EIA Form EIA-861 data files Available at httpwwweiagovelectricitydataeia861
Decoupling Case Studies Revenue Regulation Implementation in Six States
24
46 Lazar et al 2011
Discussion of the Six Utilities Overall
Authority The first step in implementing a revenue regulation
mechanism is to understand the authority of the regulating body the Public Utility Commission or PSC It is important for any Commission to clarify its justification for acting on revenue regulation in order to prevent any decisions from being overturned Over the years Utilities Commissions have relied on different justifications for implementing revenue regulation mechanisms Commissions have imple-mented revenue regulation at their own discretion justified by their directive to ensure safe reliable and economic public utility service to citizens to justify changing the regulatory environment In some cases the Commission is unable to engage on narrow issue ratemaking and rates can change only as the result of a full rate case In this case statutes must be amended to enable revenue regulation
In all of the case studies discussed here the Commis-sions first implemented revenue regulation at their own dis-cretion but each followed slightly different paths to do so The CPUC first implemented revenue regulation in 1978 at its discretion In 2001 after a period when mechanisms were suspended the California Legislature required that deviations from projected sales not result in under- or over-collections by utilities and so the CPUC re-implemented revenue regulation according to statutory requirement The Hawaii Public Utilities Commission implemented rev-enue regulation after an agreement between the utility the Governor and other stakeholders called for it In Idaho the Commission established a case in which to investigate rev-enue regulation and held a series of stakeholder workshops before implementing the policy The Massachusetts DPU adopted revenue regulation as a statewide regulatory policy and required individual utilities to file tariffs in response as the result of its general investigation into rate structures that promote demand-side resources The Maryland Com-mission implemented revenue regulation for BGE when the utility requested the mechanism Thus the impetus to develop a revenue regulation mechanism may come from different sources and the Commission may be comfortable
in moving forward under their general supervisory statutes Nevertheless specific statutory language can be helpful to shore up the existing authority
Authorized Revenue Requirement Under the traditional regulatory framework the Com-
mission (or other authority in the case of publicly owned utilities) must determine a utilityrsquos revenue requirement This function does not change under revenue regulation The revenue requirement of a utility is the aggregate of all the operating and other costs incurred to provide service to the public This typically includes operating expenses depreciation and the cost of capital invested including in-terest on debt and a ldquofairrdquo return on equity to investors The (simplistic) formula for determining revenue requirements is as follows
Revenue Requirements = (Rate Base times Rate of Return) + Operating Expenses + Depreciation +Taxes
Traditionally the revenue requirement along with sales is used to determine the rates consumers will pay for elec-tricity46 The rates are also broken down by customer class and intraclass tariffs are created based usually on a cost of service study that determines each customer class and subclass contribution to the utilityrsquos costs The (simplistic) formula for determining the rate per unit is
Rate = Revenue Requirement divide Units Sold
In this way rates are set to allow the utility to exactly recover its revenue requirement when the sales level used to calculate rates is equal to actual sales However it is important to recognize that actual expense and revenue varies with actual sales When actual sales are greater than the sales level used in ratemaking revenue increases and expenses increase by a different amount when actual sales are lower than the ratemaking sales level actual revenue
Decoupling Case Studies Revenue Regulation Implementation in Six States
25
declines and expenses decrease by a different amount Under revenue regulation rates are initially set in the same way but when actual sales differ from the level used to calculate rates the actual revenue level is maintained at the rate case amount as rates are allowed to vary inversely with salesmdashincreased sales lead to decreased rates and vice versa Because the primary expenses that change in the short run as sales levels change are power supply expenses and most regulators allow these to be tracked using a power cost adjustment mechanism revenue regulation mechanisms are generally designed to ensure recovery of the non-power costs (which do not change significantly in the short-run) as sales volumes change
Revenue regulation ensures that actual revenue is equal to the revenue requirement established by the Commission or appropriate authority Although the description above presents an overly simplified view of the revenue require-ment and its use in traditional price regulation and revenue regulation there are many variations on how a Commis-sion can establish a revenue requirement particularly when implementing revenue regulation With revenue regulation as in traditional ratemaking imprudent costs can always be removed from rates and there is no change to the ability of a Commission to impose penalties
Utility Functions to be IncludedFirst the regulator must determine which utility func-
tions will be included in the revenue regulation framework With vertically integrated utilities this usually includes a utilityrsquos regulated generation transmission and distribution units As we discuss below however it is critical to struc-ture power supply recovery mechanisms to avoid providing for double-recovery of certain power supply costs For utili-ties operating in areas of the country that have restructured electricity markets only the regulated distribution busi-ness is decoupled Utilities that also provide gas services
Pacific Gas amp Electric Future test year
Idaho Power Company Historic test year
Baltimore Gas amp Electric Hybrid test year
Wisconsin Public Service Corporation Future test year
National Grid Historic test year
Hawaiian Electric Company Future test year
Table 2
Test Year Used
may have their gas distribution business operating under revenue regulation as well
Test YearOne consideration in establishing the revenue require-
ment is what period of time will be used as a ldquotest periodrdquo or ldquotest yearrdquo The test year is the year on which the Com-mission will base its computations of the utilityrsquos total costs and sales levels A historic test year uses actual data on sales and costs from a past year Whereas a historic test year allows for the use of actual cost data it cannot account for expected variations in sales A future test year requires assumptions to be made about a utilityrsquos sales in a future year This can allow expected changes in sales like those from energy efficiency programs to be included in sales
projections however because regulators are relying on estimates provided by the utility there may be a greater risk for inaccuracy A Commission may also choose to use a test year that includes both past and future periods This may provide a sense of balance between historic and future data Furthermore as the case proceeds the Commission can require the utility to substitute historical data for projected data from the test year
Rate of ReturnAs in any rate case regulators
must determine the appropriate rate of return that a utility can earn on its investments including the cost of debt and the allowed ROE for its shareholders The approved ROE is only used to establish the return on investments that are included in the rate base when determining revenue require-
Pacific Gas amp Electric Electric generation and distribution gas distribution
Idaho Power Company Electric generation and distribution
Baltimore Gas amp Electric Electric distribution gas distribution
Wisconsin Public Service Corporation Electric generation and distribution
National Grid Electric distribution
Hawaiian Electric Company Electric generation and distribution
Table 1
Business Unit Included in the Revenue Regulation Model
Decoupling Case Studies Revenue Regulation Implementation in Six States
26
47 In a rate case the Commission determines an allowed return on equity This is used to set a price (price regulation) or an allowed revenue requirement (revenue regulation) Once set however the actual return earned by the utility is affected by anything that changes either revenue or expenses for example an increase in employee compensation a change in the number of employees or under price regulation a change in sales volumes
48 Lazar et al 2011
ments Although revenue regulation ensures that a utility recovers no more or less than its target revenue revenue regulation does not guarantee that the utility will earn the authorized ROE Depending on how a utility manages its costs between rate cases it will realize an actual ROE either higher (in the case of reduced costs) or lower (in the case of increased costs) than the authorized level47
A utilityrsquos allowed ROE generally represents the return deemed necessary to attract investment considering the level of risk of that investment Riskier investments require a higher return to attract investors and vice versa Util-ity earnings can be volatile because of short-run impacts on sales volumes and revenues which include changes in sales owing to weather economic conditions and energy efficiency and DG programs This volatility typically causes utilities to retain a higher level of equity in their capital structures so that reduced revenues do not leave them un-able to service their debt Revenue regulation can reduce this volatility by stabilizing revenues regardless of the cause Because of this reduced risk many stakeholders have proposed that the implementation of a revenue regulation mechanism be associated with a corresponding reduction in the utilityrsquos equity capital ratio (the percentage of capital supplied by common equity) This reflects the utilityrsquos more stable revenue owing to revenue regulation and reduces the overall revenue requirement that will be recovered from consumers48
An alternative option to reducing the utilityrsquos equity ratio is to reduce the ROE reflecting a lower risk level For the utilities included in these case studies only BGE and Mass Electric experienced a reduction in their ROE The Com-mission did not reduce BGErsquos ROE at the time the revenue regulation mechanism was implemented but reduced it by 50 basis points during the subsequent rate case The Mas-
sachusetts Commission did not reveal its adjustment but incorporated a lowered ROE into its decision
Absent an explicit adjustment to the cost of capital investorsrsquo expectations will adjust to the presence of rev-enue regulation if its presence is reliable The more stable earnings will likely in time contribute to a higher credit rating That in turn will lead to lower cost debt that will be revealed in future cost of capital calculations An adjust-ment to the ROE or capital structure by the regulator in a rate proceeding will be reflected immediately in lower rates to consumers simply allowing the utilityrsquos credit rating to improve over time and its cost of debt to decline will have the same effect but on a lagged basis as new bonds are is-sued at lower interest rates49
Beginning in 2004 Standard and Poorrsquos began publish-ing ldquorisk profilesrdquo for utilities which classified utilities based on their earnings variability and other risks those with more stable earnings were determined eligible for higher bond ratings at any given equity capitalization ratio (or alternatively able to retain a given bond rating with a lower equity ratio)50 One utility with a revenue regulation mechanism Northwest Natural Gas was believed to have had their business risk profile upgraded by one step in response to the benefits of the mechanism51
Effect on Bond RatingsRevenue regulation stabilizes a utilityrsquos revenue streams
reducing risk to investors this reduced risk may be a contributing factor in an increase in a utilityrsquos bond rating Bond rating agencies have recognized that revenue regula-tion mechanisms and other mechanisms that reduce net earnings volatility and risk contribute to a lower cost of capital for the utility52 Standard and Poorrsquos has explicitly stated that it ldquoviews decoupling as a positive develop-
49 Lazar et al 2011
50 Standard and Poorrsquos (2004 June 2) New Business Profile Scores Assigned for US Utility and Power Companies Financial Guidelines Revised
51 Christensen Associates (2005 March) A review of distribution margin normalization as approved by the Oregon Public Utility Commission for Northwest Natural
52 Lazar et al 2011
Decoupling Case Studies Revenue Regulation Implementation in Six States
27
This topic raises a note of caution if mechanisms are not well designed double-recovery of costs can occur for verti-cally integrated utilities that provide both power supply and distribution services For example if a per-customer
revenue regulation mechanism includes investment-related power supply costs in the revenue-per-customer formula but excludes fuel and purchased power costs that are recovered through a separate tracking mechanism double recovery of some power supply costs is likely If the utility experiences cus-tomer and sales growth the amount it recovers for investment-related power supply costs will go up However if that utility serves this growth by operat-
ing existing power plants more by selling less power on the surplus market or by purchasing power from other suppli-ers it will not incur any increases in the type of power sup-
53 Standard amp Poorrsquos (2008 February 19) Decoupling the vehicle for energy conservation
ment from a credit perspectiverdquo53 However in the case of the utilities examined in this report none experienced an improved credit rating after the implementation of revenue regulation with the exception of PGampE However PGampE came out of Chapter 11 bankruptcy in the same year that its revenue regulation mechanism was implemented mak-ing it impossible to attribute the improvement to revenue regulation alone Bond rating changes are generally slow to evolve Numerous other factors are taken into account when assigning an overall credit rating which appear to have outweighed any positive effect of revenue regulation These factors certainly include the recession of the US economy that began in 2007
Customer Classes IncludedWhen determining the target revenue for a utility rev-
enue regulation mechanism regulators must also consider which customer classes to include in the mechanism In some cases industrial customers have objected to a rev-enue regulation mechanism This is due to the wide dif-ference in rates among customers making the design of a revenue regulation mechanism more challenging If regula-tors choose to exclude a class of customers from revenue regulation they must determine the revenue requirement associated with serving only the included customer classes This generally requires a detailed cost of service study to ensure that revenue responsibility is accurately allocated by customer class
Included CostsFinally regulators may wish to exclude specific costs
from the overall revenue requirement if those costs will be tracked through another mechanism like fuel costs in a PCA mechanism energy efficiency program expenditures or smart grid costs for example Separate tracking mecha-nisms can also be used for those costs that are difficult to
Pacific Gas amp Electric All customer classes
Idaho Power Company Residential and small general service
Baltimore Gas amp Electric Residential and small general service
Wisconsin Public Service Corporation All customer classes
National Grid All customer classes
Hawaiian Electric Company All customer classes
Pacific Gas amp Electric
Idaho Power Company
Baltimore Gas amp Electric
Wisconsin Public Service Corporation
National Grid
Hawaiian Electric Company
Table 3
Customer Classes Included in Revenue Regulation Mechanism
Table 4
Costs Excluded From Revenue Regulation Mechanism
project based on historical data or costs over which the util-ity has very little control like fuel costs Although revenue regulation tracks collected revenue mechanisms like Fuel Adjustment Clauses Purchased Power Adjustments and Energy Efficiency Riders can be designed to track actual costs as well as collected revenue
Energy procurement costs
All variable costs
Energy supply costs
Energy costs
Energy supply costs for basic service customers transmission costs the energy efficiency system benefits charge and reconciling charge and costs recovered through the residential assistance adjustment factor
Fuel and purchased power
Decoupling Case Studies Revenue Regulation Implementation in Six States
28
54 We use the RAM term applied in Hawaii here to address any type of attrition or similar mechanism other than a revenue-per-customer framework that changes the allowed revenue between general rate cases
ply costs accounted for in the revenue per customer (RPC) calculation The increased power supply costs to serve that growth will be recovered through the fuel and purchased power tracking mechanism The net effect for the utility will be to recover incremental power supply costs twicemdashonce in the per-customer mechanism and again in the fuel and purchased power mechanism It is essential to make sure that the other adjustment mechanisms do not overlap the cost impacts that are treated in the revenue regulation mechanism One way to do this is to ensure that all power supply costs (investment labor fuel purchased power) are recovered through a single mechanism There are several ways to achieve this
a) A comprehensive power supply recovery mechanism that includes all power supply costs that is separate from the costs treated in the revenue regulation adjustment (eg Puget Sound Energy Washington State)
b) No power supply adjustment whatsoever with all utility costs included in an RPC mechanism (eg National Grid)
c) An annual attrition calculation with all costs reviewed for changes since the last proceeding (eg HECO)
Revenue Adjustment Mechanism in Revenue Regulation
A RAM54 is not necessary to achieve revenue regulation but provides attrition reliefmdashincreasing authorized revenue commensurate with increased costsmdashbetween rate cases Whereas revenue regulation sets a target revenue that the utility will earn regardless of sales levels the RAM adjusts the target revenue between rate cases Regulators may choose to take several different approaches to RAM
bull No RAM Regulators may choose not to implement a RAM leaving the revenue requirement unchanged between rate cases This requires the utility to request a rate case when it requires additional revenue to cover its costs
bull Stairstep Stairstep adjustments provide predetermined increases in target revenue These increases can be determined during a rate case and generally reflect forecasts of cost growth
bull Indexing Indexing ties adjustments to the target revenue to multiple factors like inflation productivity customer growth and changes in capital expenditures
bull RPC The RPC approach is a form of indexing RPC adjusts the total revenue requirement for the
number of customers served Regulators using an RPC mechanism will determine the revenue requirement per customer and the overall revenue requirement will be determined by multiplying the total number of customers by the revenue requirement per customer The amount of revenue required to serve each customer can be determined separately for customer classes and for existing and new customers This way the RPC method accounts for a utilityrsquos growth in fixed costs that is related to growth in the number of customers served RPC is useful where the correlation between cost growth and customer growth is significant It also protects customers from making up the deficit if there is a loss in customer load such as if a large business closes down or relocates
bull Hybrid Hybrid RAMs generally use stairstep increases to account for projected capital costs and indexing to account for OampM expenses
Adjustments from any type of RAM can be implemented automatically or through an attrition proceeding Some stakeholders oppose adjustments to the revenue require-ment outside of a rate case on the basis that this could allow the revenue requirement to increase significantly without examination of the impact on ratepayers or with-out due consideration of other costs and revenues For this reason some regulators choose to cap the total adjustment that can be made to the revenue requirement outside of a rate case
Table 5
Type of Revenue Adjustment Mechanism
Pacific Gas amp Electric
Idaho Power Company
Baltimore Gas amp Electric
Wisconsin Public Service Corporation
National Grid
Hawaiian Electric Company
Hybrid
RPC
RPC
RPC
No RAM potential capital expenditure adjustment
Hybrid
Decoupling Case Studies Revenue Regulation Implementation in Six States
29
55 Because this method results in changes in the price for service that are calculated after that service has been provided it fails the ldquono retroactive ratemakingrdquo statutes that guide most electricity regulators Customers are entitled to know the price of the commodity they are consuming at the time they use it
56 The closest to a current method in use for electric utilities in the BGE system of monthly reconciliation
Table 6
Tracking and Accrual of Difference BetweenActual and Authorized Revenue
Pacific Gas amp Electric
Idaho Power Company
Baltimore Gas amp Electric
Wisconsin Public Service Corporation
National Grid
Hawaiian Electric Company
Track Difference
Monthly
Monthly
Monthly
Yearly
Yearly
Monthly
Accrual Period
Year
Year
Month
Year
Year
Year
Calculation of Actual RevenueRegulators have options when ensuring that actual
revenue equals target revenue under revenue regulation First regulators must decide how to determine ldquoactual revenuerdquo In most cases actual revenue simply equals the amount of revenue a utility collects from its customers The Idaho Public Utilities Commission however has chosen to use weather-normalized revenues as the basis for utility revenues in revenue regulation Although this prevents the utility from recovering revenue lost to it owing to milder than expected weather it further complicates the revenue regulation mechanism and reduces its risk-reduction ben-efits By the same token if weather is severe and increases sales above the revenue requirements weather normaliza-tion would allow the utility to retain some of the revenues
Next regulators must determine whether to implement revenue regulation using a current or accrual method
bull Current Method With the current method of revenue regulation the target revenue for a period say a month is divided by the actual sales in that period to determine the rate per kWh The current method ensures that actual revenue equals target revenue by calculating the rate at the end of the period so that the target revenue can be recovered The current method allows for no lag in revenue recovery One effect of this method is that although customer rates vary total bills are generally more stable For example in a hotter than expected July customers will purchase more kWh but they will be charged a lower rate A milder than average winter would lead to fewer sales but at slightly increased rates This way customers do not experience the same bill variability as they would if rates were set before the sales deviations occurred On the other hand the current method does not provide customers with the ability to plan ahead based on a predictable rate for electricity This method has been used for revenue regulation of natural gas utilities55
bull Accrual Method Under the accrual method rates are set based on an assumed sales level and the differences between actual and target revenue are allowed to accrue over some period Then the total difference between actual and target revenue is reconciled through an adjustment to rates in the subsequent period this is known as the true-up process Presently all revenue regulation mechanisms for electric utilities use the accrual method56
If regulators use the accrual method of revenue
regulation they will next need to determine the period over which the difference between actual and target revenue will be allowed to accrue One year is typical however shorter periods are also used Next the frequency of comparing collected revenue to target revenue should be determined It is possible to do this comparison only once at the end of the accrual period It is common however for comparisons to occur more frequently often monthly When revenues are compared within the accrual period the differences are tracked generally for the purpose of applying interest to the difference that will be deferred until the end of the accrual period
Rate AdjustmentsIn designing a revenue regulation mechanism there are a
number of decision points that regulators need to consider to balance the interests of all the stakeholders One of the decision points revolves around the determination of the mechanism used to adjust rates The issues that regulators need to consider include the following1 Rate Case Requirements One of the often-mentioned
concerns about surcharges especially when they are numerous is how that will impact the frequency of rate cases For regulators and stakeholders rate cases provide
Decoupling Case Studies Revenue Regulation Implementation in Six States
30
the best mechanism to correctly align rates and costs but they are time-consuming and expensive for all parties This is because a rate case presents an opportunity to closely examine all of the utilityrsquos expenses and adjust rates to reflect cost increases and decreases Because under a revenue regulation mechanism the goal is to match revenues received from all customers with revenue requirements a correct determination of revenue requirements is important as is the specification of appropriate cost indices to adjust the revenue requirements As the time between rate cases increases some regulators feel the base rate case data even with adjustments need to be reexamined As a result some regulators have chosen to mandate the frequency of rate cases to address this whereas others have not It may be that in some cases where there are numerous surcharges recovering a multitude of costs there may not be as many costs subject to review in the rate case making it less significant to a regulator than a case in which most costs are being analyzed and recovered in the rate case itself
2 Collection Mechanism Integrally tied to the mechanism for recovering revenues is how the utility will collect or refund the revenues Options that are available include recovery through a rate case or periodic adjustments to rates through a surcharge mechanism As can be seen by the case studies depending on the plan in place some utilities have very discreet requirements dictating the frequency of rate cases with adjustments occurring in those cases or between those cases Other utilities have no requirements upon them with respect to the frequency of rate case filings This will be discussed in more detail below What does emerge from these case studies is that the discreet components or choices in how to execute a revenue regulation plan are carefully interwoven to create a holistic approach Each component works with the other and the value of this case study is in examining the different pathways that can be chosen As discussed previously some of the commissions have authorized revenue regulation to recover the revenue requirements in the last rate case whereas others have authorized adjustments to rates between rate cases this impacts the pathway that the adjustment mechanism takes
3 Timing How often should rates be adjusted to true up to the utilityrsquos revenue requirement States have chosen different options ranging from monthly to annually
4 Allocation of Revenue Regulation Revenue Surpluses or Deficits There are a number of decision points regarding allocation Should the revenue regulation apply to all rate classes or just the smaller customers whose usage per customer and load variations are not as dramatic as those of larger-use customer classes Should there be a different allocation to each rate class or should the allocation of costs among the classes be the same Different mechanisms accomplish different goals Some states have allocated revenue regulation revenues based on the revenues lost by customer class as a result of energy efficiency This can sometimes be a political decision to mitigate opposition to energy efficiency programs by large customers Other states recognize that the system savings resulting from energy efficiency benefit all customers so that all customers should pay equally
5 Carrying Charges Depending on the timing issue discussed previously regulators may want to consider carrying charges on any adjustments This should be symmetrical in its application however so that it applies to surcharges and refunds Consideration should be given for the basis of the carrying charge rate whether weighted average cost of capital rate of return a risk-free rate or some other mechanism should be adopted
6 Rate Caps In order to mitigate potential rate impacts a regulator may want to consider a cap on how much rates can go up when the revenue regulation adjustment is made This might be more critical if the regulator is aware of other potential rate increases that will impact customersrsquo bills If a cap is used the case in which the utilityrsquos adjustment would exceed the cap must be considered Some regulators have opted to allow the utility to carry over the excess unrecovered amount for a period of years whereas others do not This allows the utility to recover those revenues in a subsequent year when perhaps the adjustment is less As a practical matter however adjustments of greater than three percent are less common as shall be discussed later
7 Impact on At-Risk Consumers Low-income and consumer advocates have expressed concern about revenue regulation as a vehicle for annual rate increases without the scrutiny of a general rate case creating rate increases for the low-use customers doing the most to constrain usage and help achieve targeted energy savings One proposal to address this has been to impose any resulting surcharges only to above-average usage
Decoupling Case Studies Revenue Regulation Implementation in Six States
31
57 Cavanagh and Howat (2012 May 2) Finding common ground between consumer and environmental advocates Electricity Policy
58 The most common criticism of future test years is that utilities forecast costs under an assumption that all authorized personnel positions will be filled while in retrospect any large organization has some level of vacancy in its employee count A historic test year captures this effect fully
customers and any resulting credits only to below-average usage57
Rate Case RequirementRequirements as to the frequency of rate cases can be
tied to the recovery mechanism or to the entire regulatory framework for implementing revenue regulation In the cases studied two of the utilities require periodic rate cases PGampE every three years and WPS every year Two others National Grid and HECO require annual mini rate cases explained later in which adjustments are made and two others IPC and BGE have no requirements for scheduled rate cases Nevertheless if the concern is to ensure that the utilityrsquos revenue recovery meets its revenue requirements some kind of periodic rate case to examine costs is appropriate Having periodic rate cases can provide a measure of assurance to consumer advocates that the level at which the revenues and hence the rates are set is correct One of the criticisms of revenue regulation is in fact the lack of rate cases to produce a proper level of confidence in the allowed amounts Multiple surcharges are usually additive to existing rates therefore not permitting an opportunity to reduce the base rate for reductions in cost Moreover the infrequency in cases impedes the examination of rate allocations as would occur through a cost of service study
This is a particular issue where utilities are augmenting power supply with purchased power from independent power producers which is the most common method for acquiring wind and solar production today The increased cost for purchased power may flow through a fuel and purchased power adjustment mechanism while the (depreciating) investment in conventional power plants remains static in base rates
Both PGampE and WPS use a future test year that allows the utility to project revenue requirements during the time period that the rates are to be in effect The benefit to this is that it can help identify and account for projected changes in costs over the timeframe between rate cases However given that these costs are utility projections most consumer advocates have less confidence in these numbers than they would using actual numbers from a historical or only hybrid test year58 When trying to garner support for revenue regulation from more skeptical stakeholders using a future test year may not be helpful Furthermore in the case of WPS that has annual rate cases using a future test year becomes less justifiable as revenues are recalculated annually anyway
The absence of a rate case requirement can also cause consternation among detractors of revenue regulation because of the belief that the utility will be guaranteed its revenue requirements for as long as it is satisfied with that level irrespective of how well it manages However this is no different from the status quo in traditional regulation in most places The incentive to manage well is always there with or without revenue regulation as it translates into more profit for the utility
In the cases of HECO and National Grid the mini rate cases serve two purposes In the one instance it serves as a means to reconcile revenue recovery with revenue requirements and in the second instance it provides an opportunity to adjust rates in accordance with changes in costs Specifically for National Grid the revenue requirement is adjusted to reflect capital expenditures For HECO revenues are adjusted to reflect changes in the cost of service In the two examples here revenue regulation is wrapped in with other adjustments as part of a mini adjustment Given the structure for determining revenue requirements which accounts for changes in costs including revenue regulation within the mini rate cases is a workable option
These examples highlight how rate cases can be used to adjust revenue requirements either in a more controlled regulatory environment with frequent rate cases or left to the utilityrsquos discretion to decide when to adjust costs A set schedule of periodic rate cases such as that used by PGampE may strike an appropriate balance for reviewing revenue requirements however with the modification of a partial historical partial forecasted test year Frequent rate cases can depending on the resources of the regulator and stakeholders be too costly and time-intensive When there are too many rate cases stakeholders and regulators may not be able to dedicate the level of resources needed for any one proceeding and may be spread too thin Regular known rate cases at reasonable intervals may strike the best balance of adequate review and adjustment of revenue requirements
Decoupling Case Studies Revenue Regulation Implementation in Six States
32
Collection Mechanism and TimingThe collection mechanism for the differential between
actual and authorized revenue requirements varies by util-ity as well Both PGampE and WPS do not have adjustment clauses or surcharges but instead have structured their revenue regulation plans to recover their costs in a rate case with rates adjusted annually Although PGampE has rate cases every three years the utility files its preliminary forecast every September 1 for the following year including adjust-ments for revenue regulation and other costs This practice promotes transparency keeping all stakeholders aware of the current situation of the utility IPC BGE National Grid and HECO use surcharges on customer bills to collect or credit the difference between actual revenues collected and the revenue requirement Although the other three (IPC National Grid and HECO) calculate the rate adjustment annually only BGE does a more contemporaneous adjust-ment of one month Certainly where there are no regularly scheduled rate cases using an adjustment mechanism becomes more critical PGampE has created a tracking mecha-nism known as a balancing account that allows the utility to track the surpluses and deficits to help ensure accuracy at year end when rates are actually adjusted The creation of such monthly balancing accounts will make it easier at the end of the year to track what happened each month and then determine the adjustment for that year It provides a more detailed trail for review and analysis by stakeholders and regulators However other mechanisms that just look at total revenues as compared to revenue requirements at the end of the year can work as well
Table 7
Rate Case Requirements
Table 8
Rate Adjustments
Table 9
Allocation of Surplus or Deficit
Pacific Gas amp Electric
Idaho Power Company
Baltimore Gas amp Electric
Wisconsin Public Service Corporation
National Grid
Hawaiian Electric Company
Pacific Gas amp Electric
Idaho Power Company
Baltimore Gas amp Electric
Wisconsin Public Service Corporation
National Grid
Hawaiian Electric Company
Pacific Gas amp Electric
Idaho Power Company
Baltimore Gas amp Electric
Wisconsin Public Service Corporation
National Grid
Hawaiian Electric Company
Every three years annual ldquoattritionrdquo adjustments in between
No requirement
No requirement
Annual rate case
Annual capital expenditure adjustment case
Abbreviated annual rate case
Base rates adjusted annually
Annual adjustment through surcharge
Monthly adjustment through surcharge
Annual adjustment through rate case
Annual adjustment
Annual adjustment
Allocated to all customers according to business unit (eg electric distribution electric generation)
Included in the annual adjustment mechanism for each customer class
Separate for each customer class
Allocated to all customers except certain tariffs (see above)
Separate for each customer class
Separate for residential and commercialindustrial
Allocation of Revenue Regulation Revenue Surpluses or Deficits
The allocation of revenue regulation revenue surpluses or deficits should be symmetrical so that overpayments are credited to customers just as underpayments are paid by those same customers The six utilities studied fol-low that formula The application of revenue regulation however varies from utility to utility BGE and IPC ap-ply revenue regulation to the residential and commercial classes thereby excluding industrial customers In contrast however PGampE WPS National Grid and HECO allocate revenue regulation adjustments to all customer classes In terms of how the costs are allocated IPC BGE WPS National Grid and HECO allocate costs differently among the customer classes PGampE however allocates costs uni-formly among the customers Because PGampE has separated its business units it also separately calculates and allocates
Decoupling Case Studies Revenue Regulation Implementation in Six States
33
Table 10
Carrying Charges
Table 11
Cap on Rate Adjustment
Pacific Gas amp Electric
Idaho Power Company
Baltimore Gas amp Electric
Wisconsin Public Service Corporation
National Grid
Hawaiian Electric CompanyPacific Gas amp Electric
Idaho Power Company
Baltimore Gas amp Electric
Wisconsin Public Service Corporation
National Grid
Hawaiian Electric Company
None
Yes
None
Yes at the short-term debt rate
Yes at the customer deposit rate
Yes at the customer deposit rateNo
3 rate cap excess carried over to next period
10 rate cap excess carried over to next period
Cap of $14 million per year
$170 million in CapEx
No
revenue regulation surpluses and deficits among its electric distribution gas distribution and electric generation busi-nesses This illustrates that there are several ways to address revenues from revenue regulation depending on the policy outcomes that are desired
Carrying ChargesCarrying charges applied to uncollected or surplus rev-
enues can be used to account for the time value of money and the lost opportunity or value to having those revenues in hand PGampE and BGE do not accrue carrying charges On the other hand IPC WPS National Grid and HECO do For BGE given that the revenue regulation revenues are reconciled and recovered monthly it would make little sense to include a carrying cost Where carrying costs have been used they have included in the cases of these utili-ties the short-term debt rate or the customer deposit rate which for one utility is six percent and probably close to the short-term debt rate Thus the carrying charge rates are appropriately at the lower end of the spectrum reflecting their short-term nature In the application of the carrying charge symmetry should be preserved by applying it to both deficits and surpluses Application of carrying charges given the short period that costs are carried (one year) is somewhat discretionary Although it does more accurately account for costs it does add a modest level of complica-tion in tracking costs
Rate Caps and CollarsOne of the ways to protect customers in the event of sig-
nificant adjustments is to impose a rate cap (or collar) that limits the amount of a rate increase (and decrease) Some customers are sensitive to changes in foundational costs like utility bills and if costs are going to rise they benefit from a pattern of steady modest increases rather than a large step increase Any structural increases in rates attributable
to reductions in sales or increases in costs recognized by the revenue regulation plan would be eventually included in rates under any system A cap reflects a controlled way to manage customer expectations and customer impacts Structural changes can only be managed for a while until a complete rate case is needed to reset all assumptions
Typically when a rate cap is imposed if the formulaic increase exceeds the cap or collar the utility will be able to carry over any uncollected revenues until the next rate adjustment Two of the utilities studied PGampE and HECO do not have rate caps On the other hand the other four utilities do include rate caps in varying amounts National Grid has a one-percent revenue cap whereas IPC and BGE have a one-percent and a ten-percent rate cap respectively WPS unlike the others has a cap tied to the dollar amount of $14 million as opposed to a percentage Consistent with the goals of revenue regulation all of the utilities studied have a carryover provision that is important for reducing the risk that the utility will not recover its revenue require-ments
Note that National Grid differs from BGE and HECO in that its cap is on revenues whereas the other two utilities cap rates and rate impacts A revenue cap is more focused on ensuring minimal change to the revenue requirements authorized by the commission National Grid as discussed previously allows for mini rate cases to adjust the rev-enue requirements Having the one-percent cap limits the amount of increase that can occur through that process requiring revenue changes that are greater to occur in a full rate case However note also that some of the adjustments allowed in the mini rate case have their own separate cap The IPC rate cap is in line with what many other utilities with caps have in place which generally range from one to three percent The ten-percent rate cap in the BGE plan is
Decoupling Case Studies Revenue Regulation Implementation in Six States
34
59 Morgan P (2012 December) Graceful Systems LLC A decade of decoupling for US energy utilities rate impacts designs and observa-tions p5
reflective of its monthly adjustment pattern An annual ad-justment allows more time to smooth out peaks and valleys in revenues whereas a monthly adjustment will be influ-enced by more of the spikes (particularly weather-driven variation) thus the need for a larger bandwidth for the car-ryover Like a variable energy rate or fuel adjustment clause that fluctuates monthly the monthly adjustment introduces more volatility into the rates
Actual Historical AdjustmentsFor many ratepayer advocates there is a concern that
some of the utility management risk will be transferred to customers as a consequence of a policy that seeks to ensure that the utility will be made whole However the utility re-tains management risk and the requirement to demonstrate that it has acted prudently Thus the utility still has just as much of an incentive to operate efficiently as it did without revenue regulation If the utility can lower its costs it can still increase its profits Second by designing rates symmet-rically such that under- and over-recoveries are reconciled it provides customers with an opportunity to obtain credits that under traditional regulation would be retained by the utility It has often been opined that when there are large
gaps in time between utility rate cases it is because the utility is over-earning and exceeding its revenue require-ments In those instances customers never get to examine what the utility is collecting much less receive a refund Under revenue regulation with its periodic adjustments and scheduled general rate cases the revenue requirements are examined and refunds or credits allocated such that customers have a better knowledge base for understanding the utilityrsquos earnings And annual reconciliation of the util-ityrsquos actual revenues versus authorized revenues provides consumers with a tool to reign in excess revenue recovery beyond authorized amounts Third the adjustments that do occur under revenue regulation are manageable and frequently less than the adjustments customers are used to seeing on their bills for fuel or variable generation rates or for the myriad of other surcharges that can be tacked on to a customerrsquos bill such as an infrastructure (smart grid) sur-charge maintenance upgrade fee regulatory asset charge or system benefit charge
As seen in Figure 1 the range of rate impacts cluster around plus or minus two percent but can at times exceed plus or minus five percent The total of surcharges has somewhat exceeded the total of credits
Figure 1
Total Utility Decoupling Adjustment Rate Impacts59
300
250
200
150
100
50
0
Nu
mber
of
Dec
oup
lin
g A
dju
stm
ents
Over -5 -4 to -5 -3 to -4 -2 to -3 -1 to -2 0 to -1 0 to 1 1 to 2 2 to 3 3 to 4 4 to 5 Over 5
Percentage Rate Impacts
SurchargesRefunds
ResidentialAll
Other
Commercial
Total
Decoupling Case Studies Revenue Regulation Implementation in Six States
35
60 Id p 3
61 Schultz T Energy Efficiency at Idaho Power Available at httpwwwenergyidahogovenergyalliancedida_powerpdf
As can be seen with the utilities studied above the larger fluctuations are attributable to adjustment mechanisms that are reconciled more frequently such as monthly as those are less able to smooth out anomalies as an annual adjust-ment would do From a dollar perspective for the roughly 64 percent of adjustments that fall within the plus or minus two-percent range the monthly bill impact is approxi-mately $230 for average electric customers and $140 for average gas customers60
Of the six utilities studied the fluctuations in adjustment have for the most part stayed within the one- to three-per-cent range as shown below
bull PGampE from 2005 to 2012 has had annual revenue regulation adjustments ranging from minus143 percent to 415 percent with an average adjustment of 197 percent
bull For IPC the adjustments are separated between residential and commercial customers For residential customers the annual adjustments from 2007 through 2011 ranged from 077 percent to 258 percent for an average of 162 percent As for the commercial customers the annual adjustments for that same period were higher ranging from 104 percent to 424 percent with an average adjustment of 252 percent
bull BGE has monthly adjustments that ranged from minus1853 percent to 3013 percent with an average of 057 percent for residential customers from March 2008 through August 2012 For General Service Customers the monthly adjustment ranged from minus2264 percent to 2462 percent The average adjustment was 1308 percent
bull For WPS the annual adjustments from 2009 through 2011 ranged from minus145 percent to 378 percent for residential and small commercial and from minus314 percent to 899 percent for commercial Note that because of a $14 million per year cap some of these percentages were carried over The average annual adjustment for residential and small commercial and for commercial was 163 percent and 215 percent respectively with carry-overs to subsequent years
bull For Massachusetts Electric and Nantucket Electric both of which operate under National Grid the annual revenue regulation adjustment for all for 2011 and 2012 was minus0105 percent and 0315 percent for an average revenue regulation adjustment over the two years of 0105 percent
bull HECO like National Grid has one annual revenue
regulation mechanism for its customers which resulted in adjustments in 2011 and 2012 of 063 percent and 107 percent respectively for an average adjustment of 085 percent
As can be gleaned from the above information the range of average adjustments for small use customers was a low of 0105 percent for National Grid to a high of 197 percent for PGampE For larger use customers the range was a low of 0105 percent for National Grid to a high of 252 percent for IPC This demonstrates that on average for these utilities with well-developed and diversely designed revenue regula-tion proposals their adjustments on average stayed at or below approximately 25 percent
One of the metrics for determining if a revenue regula-tion program is working successfully that was discussed above was the impact on rates of a revenue regulation mechanism As can be seen by the analysis of the adjust-ment levels for each of the utilities they are within a rea-sonable range
Complementary Policies Although a revenue regulation mechanism does not need
to be accompanied by other policies energy efficiency is frequently at the root of the reason revenue regulation was proposed in the first place The states examined in this pa-per have various obligations for energy efficiency achieve-ment placed upon their utilities Only Idaho does not have an Energy Efficiency Resource Standard but energy efficiency objectives are developed through an integrated resource plan process Energy efficiency spending at IPC has increased dramatically in recent years61
In recognition of the fact that revenue regulation only removes the disincentive to pursue energy efficiency several states have instituted some form of incentives to reward the desired outcome This mechanism can not only incentivize management to aggressively pursue energy efficiency but also make shareholders supportive in the face of lost invest-ment opportunity
Rate design can also play an important part in assist-ing the utility in achieving favorable energy efficiency outcomes Inclining block rates penalize inefficient use of electricity and shorten payback times from the customer perspective Because efficiency reduces consumption at
Decoupling Case Studies Revenue Regulation Implementation in Six States
36
62 Optional rate designs for PGampE include TOU and Peak Time Pricing
63 IPC also has an optional TOU rate design
64 Optional rate designs for this utility include TOU Critical Peak Pricing and Contract
65 National Grid also offers optional TOU and flat rate designs
66 HECO also offers optional TOU and flat rate designs
67 See eg Alexander B (1996 April) How to construct a service quality index in performance-based ratemaking Electricity Policy
the tail block rate the value of kWh savings is greater than with flat rates On the other side of the spectrum declining block rates which have a reduced rate in the tail block do little to encourage conservation In fact they operate more like a discounted bulk rate by reducing the average cost of a kWh in a customerrsquos bill for the more kWh used
Performance incentives or other ways to avoid destruc-tive cost-cutting in the name of creating margins that reduce service or reliability or lessen customer value have been implemented only in Massachusetts of the six utilities illustrated here Several other states have implemented vari-ous schemes in reaction to perceived deficiencies in utility service67 Performance incentives are not unique to rev-enue regulation Commissions wishing to implement such a scheme can find many models of incentive reward and penalty mechanisms developed for other purposes
Taken together a suite of policy and program features can create an atmosphere that is conducive to achievement of energy efficiency goals within the utility and for the customers By appropriate application of these techniques regulators working with utilities and stakeholders can remove barriers and create an opportunity for energy ef-ficiency to be fully integrated into the utility supply option portfolio
Energy Efficiency OutcomesAlthough revenue regulation itself does not create an
incentive for a utility to implement energy efficiency it does address the issue of lost revenues associated with energy
Table 12
Complementary Policies for Energy Efficiency
Pacific Gas amp Electric62
Idaho Power Company63
Baltimore Gas amp Electric
Wisconsin Public Service Corporation64
National Grid65
Hawaiian Electric Company66
Energy Efficiency Requirement
1 annually
IRP
10 by 2015
075 annually
24 annually
Energy efficiency can satisfy portion of RPS
Default Residential Rate Design
Inclining block
Inclining block
TOU seasonal
Flat
Inclining block
Inclining block
Incentive Structure
Risk reward incentive mechanism
No
No
No
5 of program costs
Third-party administrator paid for contract performance
Performance Incentives
Reliability reporting only
None
Under consideration
Reliability reporting only
Service quality reward and penalty
Under consideration
efficiency and DG programs Revenue regulation should be combined with other mechanisms that require or incentiv-ize the implementation of energy efficiency by the utility or a third party The level of energy efficiency achieved can be one measure of the success of a revenue regulation mechanism as implemented in a larger program designed to achieve energy efficiency Table 13 shows the incremental annual energy efficiency savings reported by each utility with the shaded box indicating the year that the utilityrsquos revenue regulation mechanism was implemented National Grid had achieved a high level of energy efficiency savings in the years before it implemented revenue regulation
This paper has not evaluated DG outcomes to correlate with revenue regulation as it is not perceived that states and utilities have made that connection expressly in histori-cal mechanisms However it is expected that this connec-
Decoupling Case Studies Revenue Regulation Implementation in Six States
37
68 EIA Form EIA-861 data files Available at httpwwweiagovelectricitydataeia861
69 PGampE began revenue regulation in 1974 and it was later suspended and recommenced in 2001
70 WPS savings are represented by the statewide program savings from the Focus on Energy program WPS provided additional funds to Focus on Energy starting in CY10 through their territory-wide program activities
71 In 2009 Hawaii Energy a ratepayer-funded statewide energy efficiency provider began delivering services Savings reported after 2009 represent savings achieved through the programs of Hawaii Energy
Table 13
Annual Incremental Energy Efficiency Savings as Percentage of Retail Sales68
Highlighted cells are the year that utility started decoupling
Pacific Gas amp Electric69
Idaho Power Company
Baltimore Gas amp Electric
Wisconsin Public Service Corporation70
National Grid
Hawaiian Electric Company71
2004
11
01
00
03
11
00
2005
16
03
00
03
09
05
2006
10
05
00
03
12
05
2010
19
13
17
09
136
12
tion will be made in future mechanisms and furthermore it is anticipated that follow on work to this paper will want to study that connection between revenue regulation and DG performance
Conclusions
An increasing number of states are looking to increase the rate of energy efficiency investments for their long-run cost and risk advantages The benefits of energy efficiency include not only its ability to reduce system costs across the distribution transmission and generation functions but also the opportunity for customers to reduce their individ-ual energy costs for their own electric bills Nevertheless it is counterintuitive to encourage or order a utility to sell less of its product In order to encourage the proliferation of en-ergy efficiency programs as a solution that can contribute to this nationrsquos energy needs this tension between the goals of society versus the goals of the utility needs to be addressed Revenue regulation can be such a solution by removing the link between sales and revenues
There are many ways to implement revenue regulation and multiple decision points that regulators must consider in designing a revenue regulation mechanism This paper focused on six utilities each of which implemented revenue regulation in different ways in accordance with the objectives of that state Different decision points discussed include
bull Should revenue regulation apply to all functions (generation transmission and distribution) which sometimes depends on if the utility is regulated or restructured
bull Should revenue regulation apply to all customer classes
bull Should there be symmetry such that a reconciliation adjustment occurs for both over- and under-recoveries of the revenue requirements
bull Should recovery of indicated surcharges be conditioned on acceptable performance on customer service quality or energy efficiency goals
bull Should there be an attrition adjustment to account for other expenses or should the revenue regulation adjustment be limited to reconciling existing revenue requirements
bull Should there be an inflation adjustmentbull To calculate the revenue requirements should the
current or accrual method be usedbull Should the adjustments be made in rate cases or
through a riderbull How frequently should adjustments be made
monthly annually or some other time periodbull Depending on the period of time between true up and
recovery should there be carrying charges and if so how should they be calculated
2007
21
06
00
03
09
04
2008
35
10
05
09
05
05
2009
20
11
06
10
11
11
Decoupling Case Studies Revenue Regulation Implementation in Six States
38
72 Avista Utilities (2009) Washington Utilities and Transportation Commission Docket UE-090134
bull Should there be a requirement authorizing the frequency of rate case
bull Should there be an annual cap on the amount of the adjustment and if so should there be an opportunity to carry over any additional amounts and for how many years
bull Should there be an adjustment to the cost of capital to reflect the reduced risk
Other considerations for regulators whether or not they implement revenue regulation but certainly as part of a comprehensive package are other measures that can be put in place to encourage consumers and utilities alike to actively participate in energy efficiency For example an inclining block rate structure by virtue of its incentive to consume less pairs well with an energy efficiency program helps drive consumers to participate in efficiency programs and accelerates the payback of an energy efficiency investment By the same token an incentive payment to the utility helps provide its management with a good reason to excel and exceed targets for energy efficiency programs
A key point illustrated by the list of considerations above is that there is not just one static way to design and implement revenue regulation but rather there are a variety of options for doing so In this study a diverse group of utilities were reviewed The differences among the utilities included geographic diversity vertically integrated and restructured utilities different levels of energy efficiency in place and certainly differences in how the revenue regulation mechanisms were implemented No two utilities were alike and no two utilities had the same revenue regulation mechanism The key is that revenue regulation should eliminate the throughput incentive but the means for accomplishing this goal can vary and be tailored to each jurisdiction and each utility and still be successful
There are several considerations in the design of a revenue regulation mechanism that can help ensure its successful adoption To begin revenue regulation should be granted to utilities only as a precondition to implementing comprehensive energy efficiency andor DG policies Unless accompanied by a commitment to engage in providing least-cost resource options that could impact sales there is not really any good policy reason for its adoption All of the utilities studied are actively engaging in energy efficiency Furthermore as a matter of fairness the revenue regulation mechanism should be symmetrical so that any revenues above those authorized are refunded back to consumers As Figure 1 demonstrates although there are more surcharges to customers there is nevertheless a healthy amount of
credits back to consumers This is the bargain Barring imprudence or other unforeseen circumstances the utility receives its authorized revenue requirements and nothing more or less under a simple revenue regulation mechanism
Rate design plays an important role in the effectiveness of energy efficiency in concert with revenue regulation A low customer charge is preferable so that the customer can benefit from real bill reductions tied to reduced volumetric consumption Reductions in consumption not only reduce bills but also positively impact the payback period for investments in energy efficient appliances Declining block rates in which the tail block rate is lower than the first tier also do not encourage conservation Inclining block rates that reward low usage in the first block with a lower rate send the better price signals None of the six utilities studied had declining block residential rates They were inclining flat and time-varying
The revenue adjustment mechanism is also a critical decision point in terms of whether a revenue per customer mechanism is adopted that accounts for only the current revenue requirements or whether latitude is given to include an inflation adjustment or other cost increases in the revenue adjustment mechanism Three of the utilities studied adopted this approach whereas another two used a hybrid approach Finally to reduce volatility five of the six utilities opted for annual rather than monthly adjustments thereby creating a level of rate stability that customers in general prefer
Once the goals for revenue regulation are set by the regulators the next step is to design programs that will implement that goal For energy efficiency to be as successful as possible regulators may want to adopt a complement of other policies to accompany revenue regulation These can include rate designs that reward reduced use and conservation as well as incentive payments to utilities that reward them for meeting or exceeding targets Of the six utilities studied three have adopted some form of incentive One simple approach that was used in Washington was to link recovery of any surcharges under the revenue regulation mechanism to achievement of energy efficiency targets72
For the utilities examined above that have implemented revenue regulation the evidence demonstrates that revenue regulation as a strategy and a mechanism to enable
Decoupling Case Studies Revenue Regulation Implementation in Six States
39
energy efficiency has been working well The fact that each revenue regulation mechanism varies from the next demonstrates that there are many different paths that can be followed in implementing revenue regulation based on the needs of the utility and its stakeholders in a particular
region This study demonstrates that revenue regulation does work and provides examples of how it can be implemented each one different and unique because of the number of decision points to be considered in designing a revenue regulation mechanism
Decoupling Case Studies Revenue Regulation Implementation in Six States
40
Appendix
Historic Rate Adjustments
Table 14
PGampE Revenue Regulation Rate Adjustments 1983 to 199373
Table 15
PGampE Revenue Regulation Adjustments 2005 to 201274
Table 16
IPC Revenue Regulation Adjustments76
Idaho Power Company
1983 23
1984 (34)
1985 (48)
1986 19
1987 21
1988 50
1989 (43)
1990 (54)
1991 39
1992 34
1993 00
2005 8925 minus12773 minus143
2006 9933 2246 226
2007 10409 21727 209
2008 10261 4032 039
2009 11169 10355 093
2010 11224 46556 415
2011 10306 38390 373
2012 11032 40304 365
2007 Residential minus00457 590 minus077
Commercial minus00457 428 minus107
2008 Residential 00529 670 090
Commercial 00529 510 104
2009 Residential 01220 770 158
Commercial 01535 603 255
2010 Residential 01800 785 229
Commercial 02273 613 371
2011 Residential 02028 785 258
Commercial 02597 613 424
Revenue Regulation Adjustment as of
Total Rates
Delivery Revenue
Requirement ($ millions)
Adjustment Rate
Revenue Regulation Adjustment($ millions)
Retail Rate
of Delivery Revenue
Revenue Regulation Adjustment
Year
Year
73 Lesh P (2009 June 30) Rate impacts and key design elements of gas and electric utility decoupling
74 Morgan P (2012 November) A decade of decoupling for US energy utilities rate impacts designs and observations
75 Morgan P (2012 November) A decade of decoupling for US energy utilities rate impacts designs and observations
76 All numbers provided by the utility
Decoupling Case Studies Revenue Regulation Implementation in Six States
41
77 Idaho Power Company Case No IPC-E-11-19- fixed cost adjustment permanent mechanism Available at httpwwwpucidahogovinternetcaseselecIPCIPCE1119company20120928COMPLIANCE20FILINGPDF
Figure 2
IPC Revenue Regulation Adjustments77
Residential FCA Balance and Use per Customer
$10000000
$8000000
$6000000
$4000000
$2000000
$0
-$2000000
-$4000000
-$6000000
1080
1070
1060
1050
1040
1030
1020
1010
1000Res
idu
al A
uth
oriz
ed F
CA
Am
oun
t
Residual Authorized FCA Amount ($)
Monthly Use Per Customer (kWh)
kW
h U
sed
2006 2007 2008 2009 2010 2011
78 Morgan P (2012 November) A decade of decoupling for US energy utilities rate impacts designs and observations
Decoupling Case Studies Revenue Regulation Implementation in Six States
42
Table 17a
Baltimore Gas and ElectricBGE Monthly Revenue Regulation Adjustments 2008 to 201278
Table 17b
Baltimore Gas and ElectricBGE Monthly Revenue Regulation Adjustments 2008 to 201278
March Residential 000172 01477 1165General Service 000230 01526 1507
April Residential 000016 01477 0108General Service 000146 01526 0957
May Residential 000066 01477 0447General Service 000230 01526 1507
June Residential minus000066 01477 minus0447General Service 000230 01526 1507
July Residential 000158 01477 1070General Service 000230 01526 1507
August Residential minus000040 01477 minus0271General Service 000214 01526 1402
September Residential 000237 01477 1605General Service 000230 01526 1507
October Residential 000237 01477 1605General Service 000143 01526 0937
November Residential 000237 01477 1605General Service 000140 01526 0917
December Residential 000445 01477 3013General Service 000230 01526 1507
January Residential 000035 01579 0222General Service minus000073 01346 minus0542
February Residential 000025 01579 0158General Service 000230 01346 1709
March Residential minus000237 01579 minus1501General Service 000230 01346 1709
April Residential minus000237 01579 minus1501General Service 000230 01346 1709
May Residential 000234 01579 1482General Service 000132 01346 0981
June Residential 000237 01579 1501General Service 000230 01346 1709
July Residential 000237 01579 1501General Service 000230 01346 1709
August Residential 000237 01579 1501General Service 000190 01346 1412
September Residential 000237 01579 1501General Service 000230 01346 1709
October Residential 000237 01579 1501General Service 000124 01346 0921
November Residential 000237 01579 1501General Service 000230 01346 1709
December Residential 000156 01579 0988General Service 000204 01346 1516
Adjustment $kWh
Adjustment $kWh2008 2009
Retail Rate
$kWh
Retail Rate
$kWhAdjustment
Adjustment
Decoupling Case Studies Revenue Regulation Implementation in Six States
43
Table 17c
Baltimore Gas and ElectricBGE Monthly Revenue Regulation Adjustments 2008 to 201278
Table 17d
Baltimore Gas and ElectricBGE Monthly Revenue Regulation Adjustments 2008 to 201278
January Residential 000203 01465 1386General Service 000230 01261 1824
February Residential minus000142 01465 minus0969General Service 000230 01261 1824
March Residential minus000237 01465 minus1618General Service 000230 01261 1824
April Residential minus000237 01465 minus1618General Service 000230 01261 1824
May Residential 000192 01465 1311General Service 000230 01261 1824
June Residential 000191 01465 1304General Service 000230 01261 1824
July Residential 000095 01465 0648General Service 000230 01261 1824
August Residential minus000176 01465 minus1201General Service 000224 01261 1776
September Residential minus000237 01465 minus1618General Service 000116 01261 0920
October Residential minus000237 01465 minus1618General Service 000081 01261 0642
November Residential minus000237 01465 minus1618General Service 000098 01261 0777
December Residential minus000079 01465 minus0539General Service 000229 01261 1816
January Residential minus000130 01365 minus0952General Service 000230 01156 1990
February Residential minus000253 01365 minus1853General Service minus000020 01156 minus0173
March Residential minus000018 01365 minus0132General Service minus000063 01156 minus0545
April Residential 000110 01365 0806General Service minus000262 01156 minus2266
May Residential 000010 01365 0073General Service minus000160 01156 minus1384
June Residential 000226 01365 1656General Service 000042 01156 0363
July Residential 000253 01365 1853General Service 000209 01156 1808
August Residential minus000007 01365 minus0051General Service minus000157 01156 minus1358
September Residential minus000253 01365 minus1853General Service minus000177 01156 minus1531
October Residential 000228 01365 1670General Service 000262 01156 2266
November Residential minus000059 01365 minus0432General Service 000262 01156 2266
December Residential 000071 01365 0520General Service 000262 01156 2266
Adjustment $kWh
Adjustment $kWh2010 2011
Retail Rate
$kWh
Retail Rate
$kWhAdjustment
Adjustment
Decoupling Case Studies Revenue Regulation Implementation in Six States
44
Table 17e
Baltimore Gas and ElectricBGE Monthly Revenue Regulation Adjustments 2008 to 201278
January Residential 000253 01291 1960General Service 000262 01064 2462
February Residential 000253 01291 1960General Service 000262 01064 2462
March Residential 000253 01291 1960General Service 000262 01064 2462
April Residential 000253 01291 1960General Service 000262 01064 2462
May Residential 000253 01291 1960General Service 000262 01064 2462
June Residential 000253 01291 1960General Service 000262 01064 2462
July Residential 000253 01291 1960General Service 000262 01064 2462
August Residential 000253 01291 1960General Service 000160 01064 1504
Adjustment $kWh2012
Retail Rate
$kWhAdjustment
Decoupling Case Studies Revenue Regulation Implementation in Six States
45
79 Morgan P (2012 November) A decade of decoupling for US energy utilities rate impacts designs and observations
80 Morgan P (2012 November) A decade of decoupling for US energy utilities rate impacts designs and observations
Table 18
Wisconsin Public Service Corporation Revenue Regulation Adjustments 2009 to 201179
2009 ResidentialSmall Commercial 00048705 000168154 01290 378 130Commercial 00084951 000293293 00945 899 310
2010 ResidentialSmall Commercial 00033043 000166936 01291 256 129Commercial 00056630 000286103 09460 060 030
2011 ResidentialSmall Commercial (00018666) $ (000163719) 01288 minus145 minus127Commercial (00032565) $ (000285629) 01037 minus314 minus275
Derived Adjustment
$kWh
Derived Adjustment Capped $
kWh
Retail Rate
$kWh
Revenue Regulation Actual
Revenue Regulation Capped
Table 19
National Grid Revenue Regulation Adjustments 2011-201276
Massachusetts Electric and Nantucket Electric
Table 20
Hawaiian Electric Company
2011 All minus0015 1429 minus0105
2012 All 0044 1396 0315
2011 01995 3149 063
2012 03894 3641 107
Revenue Regulation Adjustment
centkWh
Revenue Regulation Adjustment
centkWhRetail Rate
centkWh
Retail Rate
Revenue Regulation Adjustment
Revenue Regulation
ldquoThe 2011 adjustment took effect June 1 but was reduced to $0 on July 26 2011 when the Commission granted HECO an interim rate increase of $532 million in a 2011 test year general rate case The 2012 Adjustment runs from June 1 2012 through May 31 2013 About 25 of the total relates to the portion of the decoupling mechanism that updates OampM and rate baserdquo (Morgan 2013)
Decoupling Case Studies Revenue Regulation Implementation in Six States
46
Revenue Regulation and Decoupling A Guide to Theory and Applicationhttpwwwraponlineorgdocumentdownloadid902
This guide was prepared to assist anyone who needs to understand both the mechanics of a regulatory tool known as decoupling and the policy issues associated with its use This would include public utility commissioners and staff utility management advocates and others with a stake in the regulated energy system While this guide is somewhat technical at points we have tried to make it accessible to a broad audience to make comprehensible the underlying concepts and the implications of different design choices This guide includes a detailed case study that demonstrates the impacts of decoupling using different pricing structures (rate designs) and usage patterns
Pricing Dorsquos and Donrsquots Designing Retail Rates as if Efficiency Countshttpwwwraponlineorgdocumentdownloadid939
Rate design is a crucial element of an overall regulatory strategy that fosters energy efficiency and sends appropriate signals about efficient system investment and operations Rate design is also fully under the control of state regulators Progressive rate design elements can guide consumers to participate in energy efficiency programs and reduce peak demand yet relatively few utilities and commissions have implemented many of these elements This RAP paper identifies some best practices Because pricing issues tie closely to utility growth incentives we also address revenue decoupling
A Decade of Decoupling for US Energy Utilities Rate Impacts Designs and Observationshttpwwwraponlineorgdocumentdownloadid6356
This report written by Pamela Morgan of Graceful Systems LLC builds on a 2009 report Now covering 25 states including 49 LDCs and 24 electric utilities this report summarizes the decoupling mechanism designs these utilities use and the rate adjustments they have made under those mechanisms In total this report estimates the retail rate impacts of 1244 decoupling mechanism adjustments since 2005
Additional Resources
The Role of Decoupling Where Energy Efficiency is Required by Lawhttpwwwraponlineorgdocumentdownloadid275
This Issuesletter gives an overview of energy efficiency resource standards the need to decouple utility profits from utility sales and explains why decoupling is needed even where a third party administers energy efficiency programs
Revenue Decoupling Standards and Criteria A Report to the Minnesota Public Utilities Commissionhttpwwwraponlineorgdocumentdownloadid850
In 2007 the Minnesota legislature enacted a new statute Section 216B2412 in which it defined an alternative approach to utility regulation decoupling and directed the Public Utilities Commission (PUC) to ldquoestablish criteria and standardsrdquo by which decoupling could be adopted for the statersquos rate-regulated utilitiesTo fulfill its obligation to develop criteria and standards for decoupling the PUC sought the advice of the Regulatory Assistance Project (RAP) This report is the output of that collaboration
Designing Distributed Generation Tariffs Wellhttpwwwraponlineorgdocumentdownloadid6898
Improvements in distributed generation economics increasing consumer preference for clean distributed energy resources and a favorable policy environment in many states have combined to produce significant increases in distributed generation adoption in the United States Regulators are looking for the well-designed tariff that compensates distributed generation adopters fairly for the value they provide to the electric system compensates the utility fairly for the grid services it provides and charges non-participating consumers fairly for the value of the services they receive This paper offers regulatory options for dealing with distributed generation The authors outline current tariffs and ponder what regulators should consider as they weigh the benefits costs and net value to distributed generation adopters non-adopters the utility and society as a whole The paper highlights the importance of deciding upon a valuation methodology so that the presence or absence of cross-subsidies can be determined Finally the paper offers rate design and ratemaking options for regulators to consider and includes recommendations for fairly implementing tariffs and ratemaking treatments to promote the public interest and ensure fair compensation
Decoupling Case Studies Revenue Regulation Implementation in Six States
47
The Regulatory Assistance Project (RAP)trade is a global non-profit team of experts focused on thelong-term economic and environmental sustainability of the power sector We provide technical and policy assistance on regulatory and market policies that promote economic efficiency environmental protection system reliability and the fair allocation of system benefits among consumers We work extensively in the US China the European Union and India Visit our website at wwwraponlineorg to learn more about our work
Rate Design Where Advanced Metering Infrastructure Has Not Been Fully Deployedhttpwwwraponlineorgdocumentdownloadid6516
This paper identifies sound practices in rate design applied around the globe using conventional metering technology Rate design for most residential and small commercial customers (mass market consumers) is most often reflected in a simple monthly access charge and a per-kWh usage rate in one or more blocks and one or more seasons A central theme across the practices highlighted in this paper is that of sending effective pricing signals through the usage-sensitive components of rates in a way that reflects the character of underlying long-run costs associated with production and usage While new technology is enabling innovations in rate design that carry some promise of better capturing opportunities for more responsive load the majority of the worldrsquos electricity usage is expected to remain under conventional pricing at least through the end of the decade and much longer in some areas Experience to date has shown that the traditional approaches to rate design persist well after the enabling technology is in place that leads to change
Time-Varying and Dynamic Rate Designhttpwwwraponlineorgdocumentdownloadid5131
This report discusses important issues in the design and deployment of time-varying rates The term time-varying rates is used in this report as encompassing traditional time-of-use rates (such as time-of-day rates and seasonal rates) as well as newer dynamic pricing rates (such as critical peak pricing and real time pricing) The discussion is primarily focused on residential customers and small commercial customers who are collectively referred to as the mass market The report also summarizes international experience with time-varying rate offerings
50 State Street Suite 3Montpelier Vermont 05602802-223-8199wwwraponlineorg
- Table of Contents
- Introduction
- California Pacific Gas and Electric Company
- Idaho Idaho Power Company
- Maryland Baltimore Gas and Electric
- Wisconsin Wisconsin Public Service Corporation
- Massachusetts National Grid
- Hawaii Hawaiian Electric Company
- Discussion of the Six Utilities Overall
- Conclusions
- Appendix
- Additional Resources
-

Decoupling Case Studies Revenue Regulation Implementation in Six States
23
44 Hawaii PUC Decision and Order No 31288 Maui Electric Company Limited Docket No 2011-0092 (2013 May 31) Appendix C p 2
Statersquos ratepayer funded efficiency program administrator The company has not yet reported its savings for 201245 In addition HECO has seen more than a sixfold increase in renewable installations under its net metering and feed-in tariff policies since the inception of the revenue regulation plan
Revenue regulation represents a regulatory framework that removes the financial disincentive for utilities to pursue clean
energy strategies It doesnrsquot in and of itself align the utility business model with those utility policies and practices that address customer expectations In fact some commissions are concerned that it might create a dynamic in which the utility assured of its revenue needs becomes complacent and lacks motivation to innovate and develop strategies that may be more in line with the public interest
In a recent order (Docket 2011-0092 May 31 2013) the Hawaiian Public Utilities Commission addressed this big picture issue in a rate order for Maui Electric The Commission called out the management as lacking a long-term vision for creating customer value and expressed concern that ldquothe HECO Companiesrsquo over-reliance upon a link between the [Decoupling]
Agreement and utility financial health obfuscates utility performance and ultimately customer service and satisfactionrdquo44 The implementation of clean energy policies is not a singular goal but rather a policy that must be part of a larger effort to create customer value
The Commission laid out a hard path and a soft path to achieve the results they desire for consumers The hard path involves a closer examination of utility investments operations and expenditures The soft path is opened through the actions of management to create and execute a vision for the utility of the future The Commission remains committed to regulatory innovations that are in the public interest and will work with the utility consumer advocate and other stakeholders to create and implement this vision
The results of this effort will likely produce ideas and outcomes that will have applicability beyond this one utility
ResourcesHawaii Public Utilities CommissionDocket No 2008-0274 Final Decision and Order (August 31 2010)Docket No 2008-0083 Final Decision and Order (December 29 2010)Docket No 2011-0092 Final Decision and Order May 31 2013 including
Decision and Orders Nos 31288 and 31289Docket No 2013-0141 Final Decision and Order (February 1 2014) including
Decision and Order No 31908
45 EIA Form EIA-861 data files Available at httpwwweiagovelectricitydataeia861
Decoupling Case Studies Revenue Regulation Implementation in Six States
24
46 Lazar et al 2011
Discussion of the Six Utilities Overall
Authority The first step in implementing a revenue regulation
mechanism is to understand the authority of the regulating body the Public Utility Commission or PSC It is important for any Commission to clarify its justification for acting on revenue regulation in order to prevent any decisions from being overturned Over the years Utilities Commissions have relied on different justifications for implementing revenue regulation mechanisms Commissions have imple-mented revenue regulation at their own discretion justified by their directive to ensure safe reliable and economic public utility service to citizens to justify changing the regulatory environment In some cases the Commission is unable to engage on narrow issue ratemaking and rates can change only as the result of a full rate case In this case statutes must be amended to enable revenue regulation
In all of the case studies discussed here the Commis-sions first implemented revenue regulation at their own dis-cretion but each followed slightly different paths to do so The CPUC first implemented revenue regulation in 1978 at its discretion In 2001 after a period when mechanisms were suspended the California Legislature required that deviations from projected sales not result in under- or over-collections by utilities and so the CPUC re-implemented revenue regulation according to statutory requirement The Hawaii Public Utilities Commission implemented rev-enue regulation after an agreement between the utility the Governor and other stakeholders called for it In Idaho the Commission established a case in which to investigate rev-enue regulation and held a series of stakeholder workshops before implementing the policy The Massachusetts DPU adopted revenue regulation as a statewide regulatory policy and required individual utilities to file tariffs in response as the result of its general investigation into rate structures that promote demand-side resources The Maryland Com-mission implemented revenue regulation for BGE when the utility requested the mechanism Thus the impetus to develop a revenue regulation mechanism may come from different sources and the Commission may be comfortable
in moving forward under their general supervisory statutes Nevertheless specific statutory language can be helpful to shore up the existing authority
Authorized Revenue Requirement Under the traditional regulatory framework the Com-
mission (or other authority in the case of publicly owned utilities) must determine a utilityrsquos revenue requirement This function does not change under revenue regulation The revenue requirement of a utility is the aggregate of all the operating and other costs incurred to provide service to the public This typically includes operating expenses depreciation and the cost of capital invested including in-terest on debt and a ldquofairrdquo return on equity to investors The (simplistic) formula for determining revenue requirements is as follows
Revenue Requirements = (Rate Base times Rate of Return) + Operating Expenses + Depreciation +Taxes
Traditionally the revenue requirement along with sales is used to determine the rates consumers will pay for elec-tricity46 The rates are also broken down by customer class and intraclass tariffs are created based usually on a cost of service study that determines each customer class and subclass contribution to the utilityrsquos costs The (simplistic) formula for determining the rate per unit is
Rate = Revenue Requirement divide Units Sold
In this way rates are set to allow the utility to exactly recover its revenue requirement when the sales level used to calculate rates is equal to actual sales However it is important to recognize that actual expense and revenue varies with actual sales When actual sales are greater than the sales level used in ratemaking revenue increases and expenses increase by a different amount when actual sales are lower than the ratemaking sales level actual revenue
Decoupling Case Studies Revenue Regulation Implementation in Six States
25
declines and expenses decrease by a different amount Under revenue regulation rates are initially set in the same way but when actual sales differ from the level used to calculate rates the actual revenue level is maintained at the rate case amount as rates are allowed to vary inversely with salesmdashincreased sales lead to decreased rates and vice versa Because the primary expenses that change in the short run as sales levels change are power supply expenses and most regulators allow these to be tracked using a power cost adjustment mechanism revenue regulation mechanisms are generally designed to ensure recovery of the non-power costs (which do not change significantly in the short-run) as sales volumes change
Revenue regulation ensures that actual revenue is equal to the revenue requirement established by the Commission or appropriate authority Although the description above presents an overly simplified view of the revenue require-ment and its use in traditional price regulation and revenue regulation there are many variations on how a Commis-sion can establish a revenue requirement particularly when implementing revenue regulation With revenue regulation as in traditional ratemaking imprudent costs can always be removed from rates and there is no change to the ability of a Commission to impose penalties
Utility Functions to be IncludedFirst the regulator must determine which utility func-
tions will be included in the revenue regulation framework With vertically integrated utilities this usually includes a utilityrsquos regulated generation transmission and distribution units As we discuss below however it is critical to struc-ture power supply recovery mechanisms to avoid providing for double-recovery of certain power supply costs For utili-ties operating in areas of the country that have restructured electricity markets only the regulated distribution busi-ness is decoupled Utilities that also provide gas services
Pacific Gas amp Electric Future test year
Idaho Power Company Historic test year
Baltimore Gas amp Electric Hybrid test year
Wisconsin Public Service Corporation Future test year
National Grid Historic test year
Hawaiian Electric Company Future test year
Table 2
Test Year Used
may have their gas distribution business operating under revenue regulation as well
Test YearOne consideration in establishing the revenue require-
ment is what period of time will be used as a ldquotest periodrdquo or ldquotest yearrdquo The test year is the year on which the Com-mission will base its computations of the utilityrsquos total costs and sales levels A historic test year uses actual data on sales and costs from a past year Whereas a historic test year allows for the use of actual cost data it cannot account for expected variations in sales A future test year requires assumptions to be made about a utilityrsquos sales in a future year This can allow expected changes in sales like those from energy efficiency programs to be included in sales
projections however because regulators are relying on estimates provided by the utility there may be a greater risk for inaccuracy A Commission may also choose to use a test year that includes both past and future periods This may provide a sense of balance between historic and future data Furthermore as the case proceeds the Commission can require the utility to substitute historical data for projected data from the test year
Rate of ReturnAs in any rate case regulators
must determine the appropriate rate of return that a utility can earn on its investments including the cost of debt and the allowed ROE for its shareholders The approved ROE is only used to establish the return on investments that are included in the rate base when determining revenue require-
Pacific Gas amp Electric Electric generation and distribution gas distribution
Idaho Power Company Electric generation and distribution
Baltimore Gas amp Electric Electric distribution gas distribution
Wisconsin Public Service Corporation Electric generation and distribution
National Grid Electric distribution
Hawaiian Electric Company Electric generation and distribution
Table 1
Business Unit Included in the Revenue Regulation Model
Decoupling Case Studies Revenue Regulation Implementation in Six States
26
47 In a rate case the Commission determines an allowed return on equity This is used to set a price (price regulation) or an allowed revenue requirement (revenue regulation) Once set however the actual return earned by the utility is affected by anything that changes either revenue or expenses for example an increase in employee compensation a change in the number of employees or under price regulation a change in sales volumes
48 Lazar et al 2011
ments Although revenue regulation ensures that a utility recovers no more or less than its target revenue revenue regulation does not guarantee that the utility will earn the authorized ROE Depending on how a utility manages its costs between rate cases it will realize an actual ROE either higher (in the case of reduced costs) or lower (in the case of increased costs) than the authorized level47
A utilityrsquos allowed ROE generally represents the return deemed necessary to attract investment considering the level of risk of that investment Riskier investments require a higher return to attract investors and vice versa Util-ity earnings can be volatile because of short-run impacts on sales volumes and revenues which include changes in sales owing to weather economic conditions and energy efficiency and DG programs This volatility typically causes utilities to retain a higher level of equity in their capital structures so that reduced revenues do not leave them un-able to service their debt Revenue regulation can reduce this volatility by stabilizing revenues regardless of the cause Because of this reduced risk many stakeholders have proposed that the implementation of a revenue regulation mechanism be associated with a corresponding reduction in the utilityrsquos equity capital ratio (the percentage of capital supplied by common equity) This reflects the utilityrsquos more stable revenue owing to revenue regulation and reduces the overall revenue requirement that will be recovered from consumers48
An alternative option to reducing the utilityrsquos equity ratio is to reduce the ROE reflecting a lower risk level For the utilities included in these case studies only BGE and Mass Electric experienced a reduction in their ROE The Com-mission did not reduce BGErsquos ROE at the time the revenue regulation mechanism was implemented but reduced it by 50 basis points during the subsequent rate case The Mas-
sachusetts Commission did not reveal its adjustment but incorporated a lowered ROE into its decision
Absent an explicit adjustment to the cost of capital investorsrsquo expectations will adjust to the presence of rev-enue regulation if its presence is reliable The more stable earnings will likely in time contribute to a higher credit rating That in turn will lead to lower cost debt that will be revealed in future cost of capital calculations An adjust-ment to the ROE or capital structure by the regulator in a rate proceeding will be reflected immediately in lower rates to consumers simply allowing the utilityrsquos credit rating to improve over time and its cost of debt to decline will have the same effect but on a lagged basis as new bonds are is-sued at lower interest rates49
Beginning in 2004 Standard and Poorrsquos began publish-ing ldquorisk profilesrdquo for utilities which classified utilities based on their earnings variability and other risks those with more stable earnings were determined eligible for higher bond ratings at any given equity capitalization ratio (or alternatively able to retain a given bond rating with a lower equity ratio)50 One utility with a revenue regulation mechanism Northwest Natural Gas was believed to have had their business risk profile upgraded by one step in response to the benefits of the mechanism51
Effect on Bond RatingsRevenue regulation stabilizes a utilityrsquos revenue streams
reducing risk to investors this reduced risk may be a contributing factor in an increase in a utilityrsquos bond rating Bond rating agencies have recognized that revenue regula-tion mechanisms and other mechanisms that reduce net earnings volatility and risk contribute to a lower cost of capital for the utility52 Standard and Poorrsquos has explicitly stated that it ldquoviews decoupling as a positive develop-
49 Lazar et al 2011
50 Standard and Poorrsquos (2004 June 2) New Business Profile Scores Assigned for US Utility and Power Companies Financial Guidelines Revised
51 Christensen Associates (2005 March) A review of distribution margin normalization as approved by the Oregon Public Utility Commission for Northwest Natural
52 Lazar et al 2011
Decoupling Case Studies Revenue Regulation Implementation in Six States
27
This topic raises a note of caution if mechanisms are not well designed double-recovery of costs can occur for verti-cally integrated utilities that provide both power supply and distribution services For example if a per-customer
revenue regulation mechanism includes investment-related power supply costs in the revenue-per-customer formula but excludes fuel and purchased power costs that are recovered through a separate tracking mechanism double recovery of some power supply costs is likely If the utility experiences cus-tomer and sales growth the amount it recovers for investment-related power supply costs will go up However if that utility serves this growth by operat-
ing existing power plants more by selling less power on the surplus market or by purchasing power from other suppli-ers it will not incur any increases in the type of power sup-
53 Standard amp Poorrsquos (2008 February 19) Decoupling the vehicle for energy conservation
ment from a credit perspectiverdquo53 However in the case of the utilities examined in this report none experienced an improved credit rating after the implementation of revenue regulation with the exception of PGampE However PGampE came out of Chapter 11 bankruptcy in the same year that its revenue regulation mechanism was implemented mak-ing it impossible to attribute the improvement to revenue regulation alone Bond rating changes are generally slow to evolve Numerous other factors are taken into account when assigning an overall credit rating which appear to have outweighed any positive effect of revenue regulation These factors certainly include the recession of the US economy that began in 2007
Customer Classes IncludedWhen determining the target revenue for a utility rev-
enue regulation mechanism regulators must also consider which customer classes to include in the mechanism In some cases industrial customers have objected to a rev-enue regulation mechanism This is due to the wide dif-ference in rates among customers making the design of a revenue regulation mechanism more challenging If regula-tors choose to exclude a class of customers from revenue regulation they must determine the revenue requirement associated with serving only the included customer classes This generally requires a detailed cost of service study to ensure that revenue responsibility is accurately allocated by customer class
Included CostsFinally regulators may wish to exclude specific costs
from the overall revenue requirement if those costs will be tracked through another mechanism like fuel costs in a PCA mechanism energy efficiency program expenditures or smart grid costs for example Separate tracking mecha-nisms can also be used for those costs that are difficult to
Pacific Gas amp Electric All customer classes
Idaho Power Company Residential and small general service
Baltimore Gas amp Electric Residential and small general service
Wisconsin Public Service Corporation All customer classes
National Grid All customer classes
Hawaiian Electric Company All customer classes
Pacific Gas amp Electric
Idaho Power Company
Baltimore Gas amp Electric
Wisconsin Public Service Corporation
National Grid
Hawaiian Electric Company
Table 3
Customer Classes Included in Revenue Regulation Mechanism
Table 4
Costs Excluded From Revenue Regulation Mechanism
project based on historical data or costs over which the util-ity has very little control like fuel costs Although revenue regulation tracks collected revenue mechanisms like Fuel Adjustment Clauses Purchased Power Adjustments and Energy Efficiency Riders can be designed to track actual costs as well as collected revenue
Energy procurement costs
All variable costs
Energy supply costs
Energy costs
Energy supply costs for basic service customers transmission costs the energy efficiency system benefits charge and reconciling charge and costs recovered through the residential assistance adjustment factor
Fuel and purchased power
Decoupling Case Studies Revenue Regulation Implementation in Six States
28
54 We use the RAM term applied in Hawaii here to address any type of attrition or similar mechanism other than a revenue-per-customer framework that changes the allowed revenue between general rate cases
ply costs accounted for in the revenue per customer (RPC) calculation The increased power supply costs to serve that growth will be recovered through the fuel and purchased power tracking mechanism The net effect for the utility will be to recover incremental power supply costs twicemdashonce in the per-customer mechanism and again in the fuel and purchased power mechanism It is essential to make sure that the other adjustment mechanisms do not overlap the cost impacts that are treated in the revenue regulation mechanism One way to do this is to ensure that all power supply costs (investment labor fuel purchased power) are recovered through a single mechanism There are several ways to achieve this
a) A comprehensive power supply recovery mechanism that includes all power supply costs that is separate from the costs treated in the revenue regulation adjustment (eg Puget Sound Energy Washington State)
b) No power supply adjustment whatsoever with all utility costs included in an RPC mechanism (eg National Grid)
c) An annual attrition calculation with all costs reviewed for changes since the last proceeding (eg HECO)
Revenue Adjustment Mechanism in Revenue Regulation
A RAM54 is not necessary to achieve revenue regulation but provides attrition reliefmdashincreasing authorized revenue commensurate with increased costsmdashbetween rate cases Whereas revenue regulation sets a target revenue that the utility will earn regardless of sales levels the RAM adjusts the target revenue between rate cases Regulators may choose to take several different approaches to RAM
bull No RAM Regulators may choose not to implement a RAM leaving the revenue requirement unchanged between rate cases This requires the utility to request a rate case when it requires additional revenue to cover its costs
bull Stairstep Stairstep adjustments provide predetermined increases in target revenue These increases can be determined during a rate case and generally reflect forecasts of cost growth
bull Indexing Indexing ties adjustments to the target revenue to multiple factors like inflation productivity customer growth and changes in capital expenditures
bull RPC The RPC approach is a form of indexing RPC adjusts the total revenue requirement for the
number of customers served Regulators using an RPC mechanism will determine the revenue requirement per customer and the overall revenue requirement will be determined by multiplying the total number of customers by the revenue requirement per customer The amount of revenue required to serve each customer can be determined separately for customer classes and for existing and new customers This way the RPC method accounts for a utilityrsquos growth in fixed costs that is related to growth in the number of customers served RPC is useful where the correlation between cost growth and customer growth is significant It also protects customers from making up the deficit if there is a loss in customer load such as if a large business closes down or relocates
bull Hybrid Hybrid RAMs generally use stairstep increases to account for projected capital costs and indexing to account for OampM expenses
Adjustments from any type of RAM can be implemented automatically or through an attrition proceeding Some stakeholders oppose adjustments to the revenue require-ment outside of a rate case on the basis that this could allow the revenue requirement to increase significantly without examination of the impact on ratepayers or with-out due consideration of other costs and revenues For this reason some regulators choose to cap the total adjustment that can be made to the revenue requirement outside of a rate case
Table 5
Type of Revenue Adjustment Mechanism
Pacific Gas amp Electric
Idaho Power Company
Baltimore Gas amp Electric
Wisconsin Public Service Corporation
National Grid
Hawaiian Electric Company
Hybrid
RPC
RPC
RPC
No RAM potential capital expenditure adjustment
Hybrid
Decoupling Case Studies Revenue Regulation Implementation in Six States
29
55 Because this method results in changes in the price for service that are calculated after that service has been provided it fails the ldquono retroactive ratemakingrdquo statutes that guide most electricity regulators Customers are entitled to know the price of the commodity they are consuming at the time they use it
56 The closest to a current method in use for electric utilities in the BGE system of monthly reconciliation
Table 6
Tracking and Accrual of Difference BetweenActual and Authorized Revenue
Pacific Gas amp Electric
Idaho Power Company
Baltimore Gas amp Electric
Wisconsin Public Service Corporation
National Grid
Hawaiian Electric Company
Track Difference
Monthly
Monthly
Monthly
Yearly
Yearly
Monthly
Accrual Period
Year
Year
Month
Year
Year
Year
Calculation of Actual RevenueRegulators have options when ensuring that actual
revenue equals target revenue under revenue regulation First regulators must decide how to determine ldquoactual revenuerdquo In most cases actual revenue simply equals the amount of revenue a utility collects from its customers The Idaho Public Utilities Commission however has chosen to use weather-normalized revenues as the basis for utility revenues in revenue regulation Although this prevents the utility from recovering revenue lost to it owing to milder than expected weather it further complicates the revenue regulation mechanism and reduces its risk-reduction ben-efits By the same token if weather is severe and increases sales above the revenue requirements weather normaliza-tion would allow the utility to retain some of the revenues
Next regulators must determine whether to implement revenue regulation using a current or accrual method
bull Current Method With the current method of revenue regulation the target revenue for a period say a month is divided by the actual sales in that period to determine the rate per kWh The current method ensures that actual revenue equals target revenue by calculating the rate at the end of the period so that the target revenue can be recovered The current method allows for no lag in revenue recovery One effect of this method is that although customer rates vary total bills are generally more stable For example in a hotter than expected July customers will purchase more kWh but they will be charged a lower rate A milder than average winter would lead to fewer sales but at slightly increased rates This way customers do not experience the same bill variability as they would if rates were set before the sales deviations occurred On the other hand the current method does not provide customers with the ability to plan ahead based on a predictable rate for electricity This method has been used for revenue regulation of natural gas utilities55
bull Accrual Method Under the accrual method rates are set based on an assumed sales level and the differences between actual and target revenue are allowed to accrue over some period Then the total difference between actual and target revenue is reconciled through an adjustment to rates in the subsequent period this is known as the true-up process Presently all revenue regulation mechanisms for electric utilities use the accrual method56
If regulators use the accrual method of revenue
regulation they will next need to determine the period over which the difference between actual and target revenue will be allowed to accrue One year is typical however shorter periods are also used Next the frequency of comparing collected revenue to target revenue should be determined It is possible to do this comparison only once at the end of the accrual period It is common however for comparisons to occur more frequently often monthly When revenues are compared within the accrual period the differences are tracked generally for the purpose of applying interest to the difference that will be deferred until the end of the accrual period
Rate AdjustmentsIn designing a revenue regulation mechanism there are a
number of decision points that regulators need to consider to balance the interests of all the stakeholders One of the decision points revolves around the determination of the mechanism used to adjust rates The issues that regulators need to consider include the following1 Rate Case Requirements One of the often-mentioned
concerns about surcharges especially when they are numerous is how that will impact the frequency of rate cases For regulators and stakeholders rate cases provide
Decoupling Case Studies Revenue Regulation Implementation in Six States
30
the best mechanism to correctly align rates and costs but they are time-consuming and expensive for all parties This is because a rate case presents an opportunity to closely examine all of the utilityrsquos expenses and adjust rates to reflect cost increases and decreases Because under a revenue regulation mechanism the goal is to match revenues received from all customers with revenue requirements a correct determination of revenue requirements is important as is the specification of appropriate cost indices to adjust the revenue requirements As the time between rate cases increases some regulators feel the base rate case data even with adjustments need to be reexamined As a result some regulators have chosen to mandate the frequency of rate cases to address this whereas others have not It may be that in some cases where there are numerous surcharges recovering a multitude of costs there may not be as many costs subject to review in the rate case making it less significant to a regulator than a case in which most costs are being analyzed and recovered in the rate case itself
2 Collection Mechanism Integrally tied to the mechanism for recovering revenues is how the utility will collect or refund the revenues Options that are available include recovery through a rate case or periodic adjustments to rates through a surcharge mechanism As can be seen by the case studies depending on the plan in place some utilities have very discreet requirements dictating the frequency of rate cases with adjustments occurring in those cases or between those cases Other utilities have no requirements upon them with respect to the frequency of rate case filings This will be discussed in more detail below What does emerge from these case studies is that the discreet components or choices in how to execute a revenue regulation plan are carefully interwoven to create a holistic approach Each component works with the other and the value of this case study is in examining the different pathways that can be chosen As discussed previously some of the commissions have authorized revenue regulation to recover the revenue requirements in the last rate case whereas others have authorized adjustments to rates between rate cases this impacts the pathway that the adjustment mechanism takes
3 Timing How often should rates be adjusted to true up to the utilityrsquos revenue requirement States have chosen different options ranging from monthly to annually
4 Allocation of Revenue Regulation Revenue Surpluses or Deficits There are a number of decision points regarding allocation Should the revenue regulation apply to all rate classes or just the smaller customers whose usage per customer and load variations are not as dramatic as those of larger-use customer classes Should there be a different allocation to each rate class or should the allocation of costs among the classes be the same Different mechanisms accomplish different goals Some states have allocated revenue regulation revenues based on the revenues lost by customer class as a result of energy efficiency This can sometimes be a political decision to mitigate opposition to energy efficiency programs by large customers Other states recognize that the system savings resulting from energy efficiency benefit all customers so that all customers should pay equally
5 Carrying Charges Depending on the timing issue discussed previously regulators may want to consider carrying charges on any adjustments This should be symmetrical in its application however so that it applies to surcharges and refunds Consideration should be given for the basis of the carrying charge rate whether weighted average cost of capital rate of return a risk-free rate or some other mechanism should be adopted
6 Rate Caps In order to mitigate potential rate impacts a regulator may want to consider a cap on how much rates can go up when the revenue regulation adjustment is made This might be more critical if the regulator is aware of other potential rate increases that will impact customersrsquo bills If a cap is used the case in which the utilityrsquos adjustment would exceed the cap must be considered Some regulators have opted to allow the utility to carry over the excess unrecovered amount for a period of years whereas others do not This allows the utility to recover those revenues in a subsequent year when perhaps the adjustment is less As a practical matter however adjustments of greater than three percent are less common as shall be discussed later
7 Impact on At-Risk Consumers Low-income and consumer advocates have expressed concern about revenue regulation as a vehicle for annual rate increases without the scrutiny of a general rate case creating rate increases for the low-use customers doing the most to constrain usage and help achieve targeted energy savings One proposal to address this has been to impose any resulting surcharges only to above-average usage
Decoupling Case Studies Revenue Regulation Implementation in Six States
31
57 Cavanagh and Howat (2012 May 2) Finding common ground between consumer and environmental advocates Electricity Policy
58 The most common criticism of future test years is that utilities forecast costs under an assumption that all authorized personnel positions will be filled while in retrospect any large organization has some level of vacancy in its employee count A historic test year captures this effect fully
customers and any resulting credits only to below-average usage57
Rate Case RequirementRequirements as to the frequency of rate cases can be
tied to the recovery mechanism or to the entire regulatory framework for implementing revenue regulation In the cases studied two of the utilities require periodic rate cases PGampE every three years and WPS every year Two others National Grid and HECO require annual mini rate cases explained later in which adjustments are made and two others IPC and BGE have no requirements for scheduled rate cases Nevertheless if the concern is to ensure that the utilityrsquos revenue recovery meets its revenue requirements some kind of periodic rate case to examine costs is appropriate Having periodic rate cases can provide a measure of assurance to consumer advocates that the level at which the revenues and hence the rates are set is correct One of the criticisms of revenue regulation is in fact the lack of rate cases to produce a proper level of confidence in the allowed amounts Multiple surcharges are usually additive to existing rates therefore not permitting an opportunity to reduce the base rate for reductions in cost Moreover the infrequency in cases impedes the examination of rate allocations as would occur through a cost of service study
This is a particular issue where utilities are augmenting power supply with purchased power from independent power producers which is the most common method for acquiring wind and solar production today The increased cost for purchased power may flow through a fuel and purchased power adjustment mechanism while the (depreciating) investment in conventional power plants remains static in base rates
Both PGampE and WPS use a future test year that allows the utility to project revenue requirements during the time period that the rates are to be in effect The benefit to this is that it can help identify and account for projected changes in costs over the timeframe between rate cases However given that these costs are utility projections most consumer advocates have less confidence in these numbers than they would using actual numbers from a historical or only hybrid test year58 When trying to garner support for revenue regulation from more skeptical stakeholders using a future test year may not be helpful Furthermore in the case of WPS that has annual rate cases using a future test year becomes less justifiable as revenues are recalculated annually anyway
The absence of a rate case requirement can also cause consternation among detractors of revenue regulation because of the belief that the utility will be guaranteed its revenue requirements for as long as it is satisfied with that level irrespective of how well it manages However this is no different from the status quo in traditional regulation in most places The incentive to manage well is always there with or without revenue regulation as it translates into more profit for the utility
In the cases of HECO and National Grid the mini rate cases serve two purposes In the one instance it serves as a means to reconcile revenue recovery with revenue requirements and in the second instance it provides an opportunity to adjust rates in accordance with changes in costs Specifically for National Grid the revenue requirement is adjusted to reflect capital expenditures For HECO revenues are adjusted to reflect changes in the cost of service In the two examples here revenue regulation is wrapped in with other adjustments as part of a mini adjustment Given the structure for determining revenue requirements which accounts for changes in costs including revenue regulation within the mini rate cases is a workable option
These examples highlight how rate cases can be used to adjust revenue requirements either in a more controlled regulatory environment with frequent rate cases or left to the utilityrsquos discretion to decide when to adjust costs A set schedule of periodic rate cases such as that used by PGampE may strike an appropriate balance for reviewing revenue requirements however with the modification of a partial historical partial forecasted test year Frequent rate cases can depending on the resources of the regulator and stakeholders be too costly and time-intensive When there are too many rate cases stakeholders and regulators may not be able to dedicate the level of resources needed for any one proceeding and may be spread too thin Regular known rate cases at reasonable intervals may strike the best balance of adequate review and adjustment of revenue requirements
Decoupling Case Studies Revenue Regulation Implementation in Six States
32
Collection Mechanism and TimingThe collection mechanism for the differential between
actual and authorized revenue requirements varies by util-ity as well Both PGampE and WPS do not have adjustment clauses or surcharges but instead have structured their revenue regulation plans to recover their costs in a rate case with rates adjusted annually Although PGampE has rate cases every three years the utility files its preliminary forecast every September 1 for the following year including adjust-ments for revenue regulation and other costs This practice promotes transparency keeping all stakeholders aware of the current situation of the utility IPC BGE National Grid and HECO use surcharges on customer bills to collect or credit the difference between actual revenues collected and the revenue requirement Although the other three (IPC National Grid and HECO) calculate the rate adjustment annually only BGE does a more contemporaneous adjust-ment of one month Certainly where there are no regularly scheduled rate cases using an adjustment mechanism becomes more critical PGampE has created a tracking mecha-nism known as a balancing account that allows the utility to track the surpluses and deficits to help ensure accuracy at year end when rates are actually adjusted The creation of such monthly balancing accounts will make it easier at the end of the year to track what happened each month and then determine the adjustment for that year It provides a more detailed trail for review and analysis by stakeholders and regulators However other mechanisms that just look at total revenues as compared to revenue requirements at the end of the year can work as well
Table 7
Rate Case Requirements
Table 8
Rate Adjustments
Table 9
Allocation of Surplus or Deficit
Pacific Gas amp Electric
Idaho Power Company
Baltimore Gas amp Electric
Wisconsin Public Service Corporation
National Grid
Hawaiian Electric Company
Pacific Gas amp Electric
Idaho Power Company
Baltimore Gas amp Electric
Wisconsin Public Service Corporation
National Grid
Hawaiian Electric Company
Pacific Gas amp Electric
Idaho Power Company
Baltimore Gas amp Electric
Wisconsin Public Service Corporation
National Grid
Hawaiian Electric Company
Every three years annual ldquoattritionrdquo adjustments in between
No requirement
No requirement
Annual rate case
Annual capital expenditure adjustment case
Abbreviated annual rate case
Base rates adjusted annually
Annual adjustment through surcharge
Monthly adjustment through surcharge
Annual adjustment through rate case
Annual adjustment
Annual adjustment
Allocated to all customers according to business unit (eg electric distribution electric generation)
Included in the annual adjustment mechanism for each customer class
Separate for each customer class
Allocated to all customers except certain tariffs (see above)
Separate for each customer class
Separate for residential and commercialindustrial
Allocation of Revenue Regulation Revenue Surpluses or Deficits
The allocation of revenue regulation revenue surpluses or deficits should be symmetrical so that overpayments are credited to customers just as underpayments are paid by those same customers The six utilities studied fol-low that formula The application of revenue regulation however varies from utility to utility BGE and IPC ap-ply revenue regulation to the residential and commercial classes thereby excluding industrial customers In contrast however PGampE WPS National Grid and HECO allocate revenue regulation adjustments to all customer classes In terms of how the costs are allocated IPC BGE WPS National Grid and HECO allocate costs differently among the customer classes PGampE however allocates costs uni-formly among the customers Because PGampE has separated its business units it also separately calculates and allocates
Decoupling Case Studies Revenue Regulation Implementation in Six States
33
Table 10
Carrying Charges
Table 11
Cap on Rate Adjustment
Pacific Gas amp Electric
Idaho Power Company
Baltimore Gas amp Electric
Wisconsin Public Service Corporation
National Grid
Hawaiian Electric CompanyPacific Gas amp Electric
Idaho Power Company
Baltimore Gas amp Electric
Wisconsin Public Service Corporation
National Grid
Hawaiian Electric Company
None
Yes
None
Yes at the short-term debt rate
Yes at the customer deposit rate
Yes at the customer deposit rateNo
3 rate cap excess carried over to next period
10 rate cap excess carried over to next period
Cap of $14 million per year
$170 million in CapEx
No
revenue regulation surpluses and deficits among its electric distribution gas distribution and electric generation busi-nesses This illustrates that there are several ways to address revenues from revenue regulation depending on the policy outcomes that are desired
Carrying ChargesCarrying charges applied to uncollected or surplus rev-
enues can be used to account for the time value of money and the lost opportunity or value to having those revenues in hand PGampE and BGE do not accrue carrying charges On the other hand IPC WPS National Grid and HECO do For BGE given that the revenue regulation revenues are reconciled and recovered monthly it would make little sense to include a carrying cost Where carrying costs have been used they have included in the cases of these utili-ties the short-term debt rate or the customer deposit rate which for one utility is six percent and probably close to the short-term debt rate Thus the carrying charge rates are appropriately at the lower end of the spectrum reflecting their short-term nature In the application of the carrying charge symmetry should be preserved by applying it to both deficits and surpluses Application of carrying charges given the short period that costs are carried (one year) is somewhat discretionary Although it does more accurately account for costs it does add a modest level of complica-tion in tracking costs
Rate Caps and CollarsOne of the ways to protect customers in the event of sig-
nificant adjustments is to impose a rate cap (or collar) that limits the amount of a rate increase (and decrease) Some customers are sensitive to changes in foundational costs like utility bills and if costs are going to rise they benefit from a pattern of steady modest increases rather than a large step increase Any structural increases in rates attributable
to reductions in sales or increases in costs recognized by the revenue regulation plan would be eventually included in rates under any system A cap reflects a controlled way to manage customer expectations and customer impacts Structural changes can only be managed for a while until a complete rate case is needed to reset all assumptions
Typically when a rate cap is imposed if the formulaic increase exceeds the cap or collar the utility will be able to carry over any uncollected revenues until the next rate adjustment Two of the utilities studied PGampE and HECO do not have rate caps On the other hand the other four utilities do include rate caps in varying amounts National Grid has a one-percent revenue cap whereas IPC and BGE have a one-percent and a ten-percent rate cap respectively WPS unlike the others has a cap tied to the dollar amount of $14 million as opposed to a percentage Consistent with the goals of revenue regulation all of the utilities studied have a carryover provision that is important for reducing the risk that the utility will not recover its revenue require-ments
Note that National Grid differs from BGE and HECO in that its cap is on revenues whereas the other two utilities cap rates and rate impacts A revenue cap is more focused on ensuring minimal change to the revenue requirements authorized by the commission National Grid as discussed previously allows for mini rate cases to adjust the rev-enue requirements Having the one-percent cap limits the amount of increase that can occur through that process requiring revenue changes that are greater to occur in a full rate case However note also that some of the adjustments allowed in the mini rate case have their own separate cap The IPC rate cap is in line with what many other utilities with caps have in place which generally range from one to three percent The ten-percent rate cap in the BGE plan is
Decoupling Case Studies Revenue Regulation Implementation in Six States
34
59 Morgan P (2012 December) Graceful Systems LLC A decade of decoupling for US energy utilities rate impacts designs and observa-tions p5
reflective of its monthly adjustment pattern An annual ad-justment allows more time to smooth out peaks and valleys in revenues whereas a monthly adjustment will be influ-enced by more of the spikes (particularly weather-driven variation) thus the need for a larger bandwidth for the car-ryover Like a variable energy rate or fuel adjustment clause that fluctuates monthly the monthly adjustment introduces more volatility into the rates
Actual Historical AdjustmentsFor many ratepayer advocates there is a concern that
some of the utility management risk will be transferred to customers as a consequence of a policy that seeks to ensure that the utility will be made whole However the utility re-tains management risk and the requirement to demonstrate that it has acted prudently Thus the utility still has just as much of an incentive to operate efficiently as it did without revenue regulation If the utility can lower its costs it can still increase its profits Second by designing rates symmet-rically such that under- and over-recoveries are reconciled it provides customers with an opportunity to obtain credits that under traditional regulation would be retained by the utility It has often been opined that when there are large
gaps in time between utility rate cases it is because the utility is over-earning and exceeding its revenue require-ments In those instances customers never get to examine what the utility is collecting much less receive a refund Under revenue regulation with its periodic adjustments and scheduled general rate cases the revenue requirements are examined and refunds or credits allocated such that customers have a better knowledge base for understanding the utilityrsquos earnings And annual reconciliation of the util-ityrsquos actual revenues versus authorized revenues provides consumers with a tool to reign in excess revenue recovery beyond authorized amounts Third the adjustments that do occur under revenue regulation are manageable and frequently less than the adjustments customers are used to seeing on their bills for fuel or variable generation rates or for the myriad of other surcharges that can be tacked on to a customerrsquos bill such as an infrastructure (smart grid) sur-charge maintenance upgrade fee regulatory asset charge or system benefit charge
As seen in Figure 1 the range of rate impacts cluster around plus or minus two percent but can at times exceed plus or minus five percent The total of surcharges has somewhat exceeded the total of credits
Figure 1
Total Utility Decoupling Adjustment Rate Impacts59
300
250
200
150
100
50
0
Nu
mber
of
Dec
oup
lin
g A
dju
stm
ents
Over -5 -4 to -5 -3 to -4 -2 to -3 -1 to -2 0 to -1 0 to 1 1 to 2 2 to 3 3 to 4 4 to 5 Over 5
Percentage Rate Impacts
SurchargesRefunds
ResidentialAll
Other
Commercial
Total
Decoupling Case Studies Revenue Regulation Implementation in Six States
35
60 Id p 3
61 Schultz T Energy Efficiency at Idaho Power Available at httpwwwenergyidahogovenergyalliancedida_powerpdf
As can be seen with the utilities studied above the larger fluctuations are attributable to adjustment mechanisms that are reconciled more frequently such as monthly as those are less able to smooth out anomalies as an annual adjust-ment would do From a dollar perspective for the roughly 64 percent of adjustments that fall within the plus or minus two-percent range the monthly bill impact is approxi-mately $230 for average electric customers and $140 for average gas customers60
Of the six utilities studied the fluctuations in adjustment have for the most part stayed within the one- to three-per-cent range as shown below
bull PGampE from 2005 to 2012 has had annual revenue regulation adjustments ranging from minus143 percent to 415 percent with an average adjustment of 197 percent
bull For IPC the adjustments are separated between residential and commercial customers For residential customers the annual adjustments from 2007 through 2011 ranged from 077 percent to 258 percent for an average of 162 percent As for the commercial customers the annual adjustments for that same period were higher ranging from 104 percent to 424 percent with an average adjustment of 252 percent
bull BGE has monthly adjustments that ranged from minus1853 percent to 3013 percent with an average of 057 percent for residential customers from March 2008 through August 2012 For General Service Customers the monthly adjustment ranged from minus2264 percent to 2462 percent The average adjustment was 1308 percent
bull For WPS the annual adjustments from 2009 through 2011 ranged from minus145 percent to 378 percent for residential and small commercial and from minus314 percent to 899 percent for commercial Note that because of a $14 million per year cap some of these percentages were carried over The average annual adjustment for residential and small commercial and for commercial was 163 percent and 215 percent respectively with carry-overs to subsequent years
bull For Massachusetts Electric and Nantucket Electric both of which operate under National Grid the annual revenue regulation adjustment for all for 2011 and 2012 was minus0105 percent and 0315 percent for an average revenue regulation adjustment over the two years of 0105 percent
bull HECO like National Grid has one annual revenue
regulation mechanism for its customers which resulted in adjustments in 2011 and 2012 of 063 percent and 107 percent respectively for an average adjustment of 085 percent
As can be gleaned from the above information the range of average adjustments for small use customers was a low of 0105 percent for National Grid to a high of 197 percent for PGampE For larger use customers the range was a low of 0105 percent for National Grid to a high of 252 percent for IPC This demonstrates that on average for these utilities with well-developed and diversely designed revenue regula-tion proposals their adjustments on average stayed at or below approximately 25 percent
One of the metrics for determining if a revenue regula-tion program is working successfully that was discussed above was the impact on rates of a revenue regulation mechanism As can be seen by the analysis of the adjust-ment levels for each of the utilities they are within a rea-sonable range
Complementary Policies Although a revenue regulation mechanism does not need
to be accompanied by other policies energy efficiency is frequently at the root of the reason revenue regulation was proposed in the first place The states examined in this pa-per have various obligations for energy efficiency achieve-ment placed upon their utilities Only Idaho does not have an Energy Efficiency Resource Standard but energy efficiency objectives are developed through an integrated resource plan process Energy efficiency spending at IPC has increased dramatically in recent years61
In recognition of the fact that revenue regulation only removes the disincentive to pursue energy efficiency several states have instituted some form of incentives to reward the desired outcome This mechanism can not only incentivize management to aggressively pursue energy efficiency but also make shareholders supportive in the face of lost invest-ment opportunity
Rate design can also play an important part in assist-ing the utility in achieving favorable energy efficiency outcomes Inclining block rates penalize inefficient use of electricity and shorten payback times from the customer perspective Because efficiency reduces consumption at
Decoupling Case Studies Revenue Regulation Implementation in Six States
36
62 Optional rate designs for PGampE include TOU and Peak Time Pricing
63 IPC also has an optional TOU rate design
64 Optional rate designs for this utility include TOU Critical Peak Pricing and Contract
65 National Grid also offers optional TOU and flat rate designs
66 HECO also offers optional TOU and flat rate designs
67 See eg Alexander B (1996 April) How to construct a service quality index in performance-based ratemaking Electricity Policy
the tail block rate the value of kWh savings is greater than with flat rates On the other side of the spectrum declining block rates which have a reduced rate in the tail block do little to encourage conservation In fact they operate more like a discounted bulk rate by reducing the average cost of a kWh in a customerrsquos bill for the more kWh used
Performance incentives or other ways to avoid destruc-tive cost-cutting in the name of creating margins that reduce service or reliability or lessen customer value have been implemented only in Massachusetts of the six utilities illustrated here Several other states have implemented vari-ous schemes in reaction to perceived deficiencies in utility service67 Performance incentives are not unique to rev-enue regulation Commissions wishing to implement such a scheme can find many models of incentive reward and penalty mechanisms developed for other purposes
Taken together a suite of policy and program features can create an atmosphere that is conducive to achievement of energy efficiency goals within the utility and for the customers By appropriate application of these techniques regulators working with utilities and stakeholders can remove barriers and create an opportunity for energy ef-ficiency to be fully integrated into the utility supply option portfolio
Energy Efficiency OutcomesAlthough revenue regulation itself does not create an
incentive for a utility to implement energy efficiency it does address the issue of lost revenues associated with energy
Table 12
Complementary Policies for Energy Efficiency
Pacific Gas amp Electric62
Idaho Power Company63
Baltimore Gas amp Electric
Wisconsin Public Service Corporation64
National Grid65
Hawaiian Electric Company66
Energy Efficiency Requirement
1 annually
IRP
10 by 2015
075 annually
24 annually
Energy efficiency can satisfy portion of RPS
Default Residential Rate Design
Inclining block
Inclining block
TOU seasonal
Flat
Inclining block
Inclining block
Incentive Structure
Risk reward incentive mechanism
No
No
No
5 of program costs
Third-party administrator paid for contract performance
Performance Incentives
Reliability reporting only
None
Under consideration
Reliability reporting only
Service quality reward and penalty
Under consideration
efficiency and DG programs Revenue regulation should be combined with other mechanisms that require or incentiv-ize the implementation of energy efficiency by the utility or a third party The level of energy efficiency achieved can be one measure of the success of a revenue regulation mechanism as implemented in a larger program designed to achieve energy efficiency Table 13 shows the incremental annual energy efficiency savings reported by each utility with the shaded box indicating the year that the utilityrsquos revenue regulation mechanism was implemented National Grid had achieved a high level of energy efficiency savings in the years before it implemented revenue regulation
This paper has not evaluated DG outcomes to correlate with revenue regulation as it is not perceived that states and utilities have made that connection expressly in histori-cal mechanisms However it is expected that this connec-
Decoupling Case Studies Revenue Regulation Implementation in Six States
37
68 EIA Form EIA-861 data files Available at httpwwweiagovelectricitydataeia861
69 PGampE began revenue regulation in 1974 and it was later suspended and recommenced in 2001
70 WPS savings are represented by the statewide program savings from the Focus on Energy program WPS provided additional funds to Focus on Energy starting in CY10 through their territory-wide program activities
71 In 2009 Hawaii Energy a ratepayer-funded statewide energy efficiency provider began delivering services Savings reported after 2009 represent savings achieved through the programs of Hawaii Energy
Table 13
Annual Incremental Energy Efficiency Savings as Percentage of Retail Sales68
Highlighted cells are the year that utility started decoupling
Pacific Gas amp Electric69
Idaho Power Company
Baltimore Gas amp Electric
Wisconsin Public Service Corporation70
National Grid
Hawaiian Electric Company71
2004
11
01
00
03
11
00
2005
16
03
00
03
09
05
2006
10
05
00
03
12
05
2010
19
13
17
09
136
12
tion will be made in future mechanisms and furthermore it is anticipated that follow on work to this paper will want to study that connection between revenue regulation and DG performance
Conclusions
An increasing number of states are looking to increase the rate of energy efficiency investments for their long-run cost and risk advantages The benefits of energy efficiency include not only its ability to reduce system costs across the distribution transmission and generation functions but also the opportunity for customers to reduce their individ-ual energy costs for their own electric bills Nevertheless it is counterintuitive to encourage or order a utility to sell less of its product In order to encourage the proliferation of en-ergy efficiency programs as a solution that can contribute to this nationrsquos energy needs this tension between the goals of society versus the goals of the utility needs to be addressed Revenue regulation can be such a solution by removing the link between sales and revenues
There are many ways to implement revenue regulation and multiple decision points that regulators must consider in designing a revenue regulation mechanism This paper focused on six utilities each of which implemented revenue regulation in different ways in accordance with the objectives of that state Different decision points discussed include
bull Should revenue regulation apply to all functions (generation transmission and distribution) which sometimes depends on if the utility is regulated or restructured
bull Should revenue regulation apply to all customer classes
bull Should there be symmetry such that a reconciliation adjustment occurs for both over- and under-recoveries of the revenue requirements
bull Should recovery of indicated surcharges be conditioned on acceptable performance on customer service quality or energy efficiency goals
bull Should there be an attrition adjustment to account for other expenses or should the revenue regulation adjustment be limited to reconciling existing revenue requirements
bull Should there be an inflation adjustmentbull To calculate the revenue requirements should the
current or accrual method be usedbull Should the adjustments be made in rate cases or
through a riderbull How frequently should adjustments be made
monthly annually or some other time periodbull Depending on the period of time between true up and
recovery should there be carrying charges and if so how should they be calculated
2007
21
06
00
03
09
04
2008
35
10
05
09
05
05
2009
20
11
06
10
11
11
Decoupling Case Studies Revenue Regulation Implementation in Six States
38
72 Avista Utilities (2009) Washington Utilities and Transportation Commission Docket UE-090134
bull Should there be a requirement authorizing the frequency of rate case
bull Should there be an annual cap on the amount of the adjustment and if so should there be an opportunity to carry over any additional amounts and for how many years
bull Should there be an adjustment to the cost of capital to reflect the reduced risk
Other considerations for regulators whether or not they implement revenue regulation but certainly as part of a comprehensive package are other measures that can be put in place to encourage consumers and utilities alike to actively participate in energy efficiency For example an inclining block rate structure by virtue of its incentive to consume less pairs well with an energy efficiency program helps drive consumers to participate in efficiency programs and accelerates the payback of an energy efficiency investment By the same token an incentive payment to the utility helps provide its management with a good reason to excel and exceed targets for energy efficiency programs
A key point illustrated by the list of considerations above is that there is not just one static way to design and implement revenue regulation but rather there are a variety of options for doing so In this study a diverse group of utilities were reviewed The differences among the utilities included geographic diversity vertically integrated and restructured utilities different levels of energy efficiency in place and certainly differences in how the revenue regulation mechanisms were implemented No two utilities were alike and no two utilities had the same revenue regulation mechanism The key is that revenue regulation should eliminate the throughput incentive but the means for accomplishing this goal can vary and be tailored to each jurisdiction and each utility and still be successful
There are several considerations in the design of a revenue regulation mechanism that can help ensure its successful adoption To begin revenue regulation should be granted to utilities only as a precondition to implementing comprehensive energy efficiency andor DG policies Unless accompanied by a commitment to engage in providing least-cost resource options that could impact sales there is not really any good policy reason for its adoption All of the utilities studied are actively engaging in energy efficiency Furthermore as a matter of fairness the revenue regulation mechanism should be symmetrical so that any revenues above those authorized are refunded back to consumers As Figure 1 demonstrates although there are more surcharges to customers there is nevertheless a healthy amount of
credits back to consumers This is the bargain Barring imprudence or other unforeseen circumstances the utility receives its authorized revenue requirements and nothing more or less under a simple revenue regulation mechanism
Rate design plays an important role in the effectiveness of energy efficiency in concert with revenue regulation A low customer charge is preferable so that the customer can benefit from real bill reductions tied to reduced volumetric consumption Reductions in consumption not only reduce bills but also positively impact the payback period for investments in energy efficient appliances Declining block rates in which the tail block rate is lower than the first tier also do not encourage conservation Inclining block rates that reward low usage in the first block with a lower rate send the better price signals None of the six utilities studied had declining block residential rates They were inclining flat and time-varying
The revenue adjustment mechanism is also a critical decision point in terms of whether a revenue per customer mechanism is adopted that accounts for only the current revenue requirements or whether latitude is given to include an inflation adjustment or other cost increases in the revenue adjustment mechanism Three of the utilities studied adopted this approach whereas another two used a hybrid approach Finally to reduce volatility five of the six utilities opted for annual rather than monthly adjustments thereby creating a level of rate stability that customers in general prefer
Once the goals for revenue regulation are set by the regulators the next step is to design programs that will implement that goal For energy efficiency to be as successful as possible regulators may want to adopt a complement of other policies to accompany revenue regulation These can include rate designs that reward reduced use and conservation as well as incentive payments to utilities that reward them for meeting or exceeding targets Of the six utilities studied three have adopted some form of incentive One simple approach that was used in Washington was to link recovery of any surcharges under the revenue regulation mechanism to achievement of energy efficiency targets72
For the utilities examined above that have implemented revenue regulation the evidence demonstrates that revenue regulation as a strategy and a mechanism to enable
Decoupling Case Studies Revenue Regulation Implementation in Six States
39
energy efficiency has been working well The fact that each revenue regulation mechanism varies from the next demonstrates that there are many different paths that can be followed in implementing revenue regulation based on the needs of the utility and its stakeholders in a particular
region This study demonstrates that revenue regulation does work and provides examples of how it can be implemented each one different and unique because of the number of decision points to be considered in designing a revenue regulation mechanism
Decoupling Case Studies Revenue Regulation Implementation in Six States
40
Appendix
Historic Rate Adjustments
Table 14
PGampE Revenue Regulation Rate Adjustments 1983 to 199373
Table 15
PGampE Revenue Regulation Adjustments 2005 to 201274
Table 16
IPC Revenue Regulation Adjustments76
Idaho Power Company
1983 23
1984 (34)
1985 (48)
1986 19
1987 21
1988 50
1989 (43)
1990 (54)
1991 39
1992 34
1993 00
2005 8925 minus12773 minus143
2006 9933 2246 226
2007 10409 21727 209
2008 10261 4032 039
2009 11169 10355 093
2010 11224 46556 415
2011 10306 38390 373
2012 11032 40304 365
2007 Residential minus00457 590 minus077
Commercial minus00457 428 minus107
2008 Residential 00529 670 090
Commercial 00529 510 104
2009 Residential 01220 770 158
Commercial 01535 603 255
2010 Residential 01800 785 229
Commercial 02273 613 371
2011 Residential 02028 785 258
Commercial 02597 613 424
Revenue Regulation Adjustment as of
Total Rates
Delivery Revenue
Requirement ($ millions)
Adjustment Rate
Revenue Regulation Adjustment($ millions)
Retail Rate
of Delivery Revenue
Revenue Regulation Adjustment
Year
Year
73 Lesh P (2009 June 30) Rate impacts and key design elements of gas and electric utility decoupling
74 Morgan P (2012 November) A decade of decoupling for US energy utilities rate impacts designs and observations
75 Morgan P (2012 November) A decade of decoupling for US energy utilities rate impacts designs and observations
76 All numbers provided by the utility
Decoupling Case Studies Revenue Regulation Implementation in Six States
41
77 Idaho Power Company Case No IPC-E-11-19- fixed cost adjustment permanent mechanism Available at httpwwwpucidahogovinternetcaseselecIPCIPCE1119company20120928COMPLIANCE20FILINGPDF
Figure 2
IPC Revenue Regulation Adjustments77
Residential FCA Balance and Use per Customer
$10000000
$8000000
$6000000
$4000000
$2000000
$0
-$2000000
-$4000000
-$6000000
1080
1070
1060
1050
1040
1030
1020
1010
1000Res
idu
al A
uth
oriz
ed F
CA
Am
oun
t
Residual Authorized FCA Amount ($)
Monthly Use Per Customer (kWh)
kW
h U
sed
2006 2007 2008 2009 2010 2011
78 Morgan P (2012 November) A decade of decoupling for US energy utilities rate impacts designs and observations
Decoupling Case Studies Revenue Regulation Implementation in Six States
42
Table 17a
Baltimore Gas and ElectricBGE Monthly Revenue Regulation Adjustments 2008 to 201278
Table 17b
Baltimore Gas and ElectricBGE Monthly Revenue Regulation Adjustments 2008 to 201278
March Residential 000172 01477 1165General Service 000230 01526 1507
April Residential 000016 01477 0108General Service 000146 01526 0957
May Residential 000066 01477 0447General Service 000230 01526 1507
June Residential minus000066 01477 minus0447General Service 000230 01526 1507
July Residential 000158 01477 1070General Service 000230 01526 1507
August Residential minus000040 01477 minus0271General Service 000214 01526 1402
September Residential 000237 01477 1605General Service 000230 01526 1507
October Residential 000237 01477 1605General Service 000143 01526 0937
November Residential 000237 01477 1605General Service 000140 01526 0917
December Residential 000445 01477 3013General Service 000230 01526 1507
January Residential 000035 01579 0222General Service minus000073 01346 minus0542
February Residential 000025 01579 0158General Service 000230 01346 1709
March Residential minus000237 01579 minus1501General Service 000230 01346 1709
April Residential minus000237 01579 minus1501General Service 000230 01346 1709
May Residential 000234 01579 1482General Service 000132 01346 0981
June Residential 000237 01579 1501General Service 000230 01346 1709
July Residential 000237 01579 1501General Service 000230 01346 1709
August Residential 000237 01579 1501General Service 000190 01346 1412
September Residential 000237 01579 1501General Service 000230 01346 1709
October Residential 000237 01579 1501General Service 000124 01346 0921
November Residential 000237 01579 1501General Service 000230 01346 1709
December Residential 000156 01579 0988General Service 000204 01346 1516
Adjustment $kWh
Adjustment $kWh2008 2009
Retail Rate
$kWh
Retail Rate
$kWhAdjustment
Adjustment
Decoupling Case Studies Revenue Regulation Implementation in Six States
43
Table 17c
Baltimore Gas and ElectricBGE Monthly Revenue Regulation Adjustments 2008 to 201278
Table 17d
Baltimore Gas and ElectricBGE Monthly Revenue Regulation Adjustments 2008 to 201278
January Residential 000203 01465 1386General Service 000230 01261 1824
February Residential minus000142 01465 minus0969General Service 000230 01261 1824
March Residential minus000237 01465 minus1618General Service 000230 01261 1824
April Residential minus000237 01465 minus1618General Service 000230 01261 1824
May Residential 000192 01465 1311General Service 000230 01261 1824
June Residential 000191 01465 1304General Service 000230 01261 1824
July Residential 000095 01465 0648General Service 000230 01261 1824
August Residential minus000176 01465 minus1201General Service 000224 01261 1776
September Residential minus000237 01465 minus1618General Service 000116 01261 0920
October Residential minus000237 01465 minus1618General Service 000081 01261 0642
November Residential minus000237 01465 minus1618General Service 000098 01261 0777
December Residential minus000079 01465 minus0539General Service 000229 01261 1816
January Residential minus000130 01365 minus0952General Service 000230 01156 1990
February Residential minus000253 01365 minus1853General Service minus000020 01156 minus0173
March Residential minus000018 01365 minus0132General Service minus000063 01156 minus0545
April Residential 000110 01365 0806General Service minus000262 01156 minus2266
May Residential 000010 01365 0073General Service minus000160 01156 minus1384
June Residential 000226 01365 1656General Service 000042 01156 0363
July Residential 000253 01365 1853General Service 000209 01156 1808
August Residential minus000007 01365 minus0051General Service minus000157 01156 minus1358
September Residential minus000253 01365 minus1853General Service minus000177 01156 minus1531
October Residential 000228 01365 1670General Service 000262 01156 2266
November Residential minus000059 01365 minus0432General Service 000262 01156 2266
December Residential 000071 01365 0520General Service 000262 01156 2266
Adjustment $kWh
Adjustment $kWh2010 2011
Retail Rate
$kWh
Retail Rate
$kWhAdjustment
Adjustment
Decoupling Case Studies Revenue Regulation Implementation in Six States
44
Table 17e
Baltimore Gas and ElectricBGE Monthly Revenue Regulation Adjustments 2008 to 201278
January Residential 000253 01291 1960General Service 000262 01064 2462
February Residential 000253 01291 1960General Service 000262 01064 2462
March Residential 000253 01291 1960General Service 000262 01064 2462
April Residential 000253 01291 1960General Service 000262 01064 2462
May Residential 000253 01291 1960General Service 000262 01064 2462
June Residential 000253 01291 1960General Service 000262 01064 2462
July Residential 000253 01291 1960General Service 000262 01064 2462
August Residential 000253 01291 1960General Service 000160 01064 1504
Adjustment $kWh2012
Retail Rate
$kWhAdjustment
Decoupling Case Studies Revenue Regulation Implementation in Six States
45
79 Morgan P (2012 November) A decade of decoupling for US energy utilities rate impacts designs and observations
80 Morgan P (2012 November) A decade of decoupling for US energy utilities rate impacts designs and observations
Table 18
Wisconsin Public Service Corporation Revenue Regulation Adjustments 2009 to 201179
2009 ResidentialSmall Commercial 00048705 000168154 01290 378 130Commercial 00084951 000293293 00945 899 310
2010 ResidentialSmall Commercial 00033043 000166936 01291 256 129Commercial 00056630 000286103 09460 060 030
2011 ResidentialSmall Commercial (00018666) $ (000163719) 01288 minus145 minus127Commercial (00032565) $ (000285629) 01037 minus314 minus275
Derived Adjustment
$kWh
Derived Adjustment Capped $
kWh
Retail Rate
$kWh
Revenue Regulation Actual
Revenue Regulation Capped
Table 19
National Grid Revenue Regulation Adjustments 2011-201276
Massachusetts Electric and Nantucket Electric
Table 20
Hawaiian Electric Company
2011 All minus0015 1429 minus0105
2012 All 0044 1396 0315
2011 01995 3149 063
2012 03894 3641 107
Revenue Regulation Adjustment
centkWh
Revenue Regulation Adjustment
centkWhRetail Rate
centkWh
Retail Rate
Revenue Regulation Adjustment
Revenue Regulation
ldquoThe 2011 adjustment took effect June 1 but was reduced to $0 on July 26 2011 when the Commission granted HECO an interim rate increase of $532 million in a 2011 test year general rate case The 2012 Adjustment runs from June 1 2012 through May 31 2013 About 25 of the total relates to the portion of the decoupling mechanism that updates OampM and rate baserdquo (Morgan 2013)
Decoupling Case Studies Revenue Regulation Implementation in Six States
46
Revenue Regulation and Decoupling A Guide to Theory and Applicationhttpwwwraponlineorgdocumentdownloadid902
This guide was prepared to assist anyone who needs to understand both the mechanics of a regulatory tool known as decoupling and the policy issues associated with its use This would include public utility commissioners and staff utility management advocates and others with a stake in the regulated energy system While this guide is somewhat technical at points we have tried to make it accessible to a broad audience to make comprehensible the underlying concepts and the implications of different design choices This guide includes a detailed case study that demonstrates the impacts of decoupling using different pricing structures (rate designs) and usage patterns
Pricing Dorsquos and Donrsquots Designing Retail Rates as if Efficiency Countshttpwwwraponlineorgdocumentdownloadid939
Rate design is a crucial element of an overall regulatory strategy that fosters energy efficiency and sends appropriate signals about efficient system investment and operations Rate design is also fully under the control of state regulators Progressive rate design elements can guide consumers to participate in energy efficiency programs and reduce peak demand yet relatively few utilities and commissions have implemented many of these elements This RAP paper identifies some best practices Because pricing issues tie closely to utility growth incentives we also address revenue decoupling
A Decade of Decoupling for US Energy Utilities Rate Impacts Designs and Observationshttpwwwraponlineorgdocumentdownloadid6356
This report written by Pamela Morgan of Graceful Systems LLC builds on a 2009 report Now covering 25 states including 49 LDCs and 24 electric utilities this report summarizes the decoupling mechanism designs these utilities use and the rate adjustments they have made under those mechanisms In total this report estimates the retail rate impacts of 1244 decoupling mechanism adjustments since 2005
Additional Resources
The Role of Decoupling Where Energy Efficiency is Required by Lawhttpwwwraponlineorgdocumentdownloadid275
This Issuesletter gives an overview of energy efficiency resource standards the need to decouple utility profits from utility sales and explains why decoupling is needed even where a third party administers energy efficiency programs
Revenue Decoupling Standards and Criteria A Report to the Minnesota Public Utilities Commissionhttpwwwraponlineorgdocumentdownloadid850
In 2007 the Minnesota legislature enacted a new statute Section 216B2412 in which it defined an alternative approach to utility regulation decoupling and directed the Public Utilities Commission (PUC) to ldquoestablish criteria and standardsrdquo by which decoupling could be adopted for the statersquos rate-regulated utilitiesTo fulfill its obligation to develop criteria and standards for decoupling the PUC sought the advice of the Regulatory Assistance Project (RAP) This report is the output of that collaboration
Designing Distributed Generation Tariffs Wellhttpwwwraponlineorgdocumentdownloadid6898
Improvements in distributed generation economics increasing consumer preference for clean distributed energy resources and a favorable policy environment in many states have combined to produce significant increases in distributed generation adoption in the United States Regulators are looking for the well-designed tariff that compensates distributed generation adopters fairly for the value they provide to the electric system compensates the utility fairly for the grid services it provides and charges non-participating consumers fairly for the value of the services they receive This paper offers regulatory options for dealing with distributed generation The authors outline current tariffs and ponder what regulators should consider as they weigh the benefits costs and net value to distributed generation adopters non-adopters the utility and society as a whole The paper highlights the importance of deciding upon a valuation methodology so that the presence or absence of cross-subsidies can be determined Finally the paper offers rate design and ratemaking options for regulators to consider and includes recommendations for fairly implementing tariffs and ratemaking treatments to promote the public interest and ensure fair compensation
Decoupling Case Studies Revenue Regulation Implementation in Six States
47
The Regulatory Assistance Project (RAP)trade is a global non-profit team of experts focused on thelong-term economic and environmental sustainability of the power sector We provide technical and policy assistance on regulatory and market policies that promote economic efficiency environmental protection system reliability and the fair allocation of system benefits among consumers We work extensively in the US China the European Union and India Visit our website at wwwraponlineorg to learn more about our work
Rate Design Where Advanced Metering Infrastructure Has Not Been Fully Deployedhttpwwwraponlineorgdocumentdownloadid6516
This paper identifies sound practices in rate design applied around the globe using conventional metering technology Rate design for most residential and small commercial customers (mass market consumers) is most often reflected in a simple monthly access charge and a per-kWh usage rate in one or more blocks and one or more seasons A central theme across the practices highlighted in this paper is that of sending effective pricing signals through the usage-sensitive components of rates in a way that reflects the character of underlying long-run costs associated with production and usage While new technology is enabling innovations in rate design that carry some promise of better capturing opportunities for more responsive load the majority of the worldrsquos electricity usage is expected to remain under conventional pricing at least through the end of the decade and much longer in some areas Experience to date has shown that the traditional approaches to rate design persist well after the enabling technology is in place that leads to change
Time-Varying and Dynamic Rate Designhttpwwwraponlineorgdocumentdownloadid5131
This report discusses important issues in the design and deployment of time-varying rates The term time-varying rates is used in this report as encompassing traditional time-of-use rates (such as time-of-day rates and seasonal rates) as well as newer dynamic pricing rates (such as critical peak pricing and real time pricing) The discussion is primarily focused on residential customers and small commercial customers who are collectively referred to as the mass market The report also summarizes international experience with time-varying rate offerings
50 State Street Suite 3Montpelier Vermont 05602802-223-8199wwwraponlineorg
- Table of Contents
- Introduction
- California Pacific Gas and Electric Company
- Idaho Idaho Power Company
- Maryland Baltimore Gas and Electric
- Wisconsin Wisconsin Public Service Corporation
- Massachusetts National Grid
- Hawaii Hawaiian Electric Company
- Discussion of the Six Utilities Overall
- Conclusions
- Appendix
- Additional Resources
-
Decoupling Case Studies Revenue Regulation Implementation in Six States
24
46 Lazar et al 2011
Discussion of the Six Utilities Overall
Authority The first step in implementing a revenue regulation
mechanism is to understand the authority of the regulating body the Public Utility Commission or PSC It is important for any Commission to clarify its justification for acting on revenue regulation in order to prevent any decisions from being overturned Over the years Utilities Commissions have relied on different justifications for implementing revenue regulation mechanisms Commissions have imple-mented revenue regulation at their own discretion justified by their directive to ensure safe reliable and economic public utility service to citizens to justify changing the regulatory environment In some cases the Commission is unable to engage on narrow issue ratemaking and rates can change only as the result of a full rate case In this case statutes must be amended to enable revenue regulation
In all of the case studies discussed here the Commis-sions first implemented revenue regulation at their own dis-cretion but each followed slightly different paths to do so The CPUC first implemented revenue regulation in 1978 at its discretion In 2001 after a period when mechanisms were suspended the California Legislature required that deviations from projected sales not result in under- or over-collections by utilities and so the CPUC re-implemented revenue regulation according to statutory requirement The Hawaii Public Utilities Commission implemented rev-enue regulation after an agreement between the utility the Governor and other stakeholders called for it In Idaho the Commission established a case in which to investigate rev-enue regulation and held a series of stakeholder workshops before implementing the policy The Massachusetts DPU adopted revenue regulation as a statewide regulatory policy and required individual utilities to file tariffs in response as the result of its general investigation into rate structures that promote demand-side resources The Maryland Com-mission implemented revenue regulation for BGE when the utility requested the mechanism Thus the impetus to develop a revenue regulation mechanism may come from different sources and the Commission may be comfortable
in moving forward under their general supervisory statutes Nevertheless specific statutory language can be helpful to shore up the existing authority
Authorized Revenue Requirement Under the traditional regulatory framework the Com-
mission (or other authority in the case of publicly owned utilities) must determine a utilityrsquos revenue requirement This function does not change under revenue regulation The revenue requirement of a utility is the aggregate of all the operating and other costs incurred to provide service to the public This typically includes operating expenses depreciation and the cost of capital invested including in-terest on debt and a ldquofairrdquo return on equity to investors The (simplistic) formula for determining revenue requirements is as follows
Revenue Requirements = (Rate Base times Rate of Return) + Operating Expenses + Depreciation +Taxes
Traditionally the revenue requirement along with sales is used to determine the rates consumers will pay for elec-tricity46 The rates are also broken down by customer class and intraclass tariffs are created based usually on a cost of service study that determines each customer class and subclass contribution to the utilityrsquos costs The (simplistic) formula for determining the rate per unit is
Rate = Revenue Requirement divide Units Sold
In this way rates are set to allow the utility to exactly recover its revenue requirement when the sales level used to calculate rates is equal to actual sales However it is important to recognize that actual expense and revenue varies with actual sales When actual sales are greater than the sales level used in ratemaking revenue increases and expenses increase by a different amount when actual sales are lower than the ratemaking sales level actual revenue
Decoupling Case Studies Revenue Regulation Implementation in Six States
25
declines and expenses decrease by a different amount Under revenue regulation rates are initially set in the same way but when actual sales differ from the level used to calculate rates the actual revenue level is maintained at the rate case amount as rates are allowed to vary inversely with salesmdashincreased sales lead to decreased rates and vice versa Because the primary expenses that change in the short run as sales levels change are power supply expenses and most regulators allow these to be tracked using a power cost adjustment mechanism revenue regulation mechanisms are generally designed to ensure recovery of the non-power costs (which do not change significantly in the short-run) as sales volumes change
Revenue regulation ensures that actual revenue is equal to the revenue requirement established by the Commission or appropriate authority Although the description above presents an overly simplified view of the revenue require-ment and its use in traditional price regulation and revenue regulation there are many variations on how a Commis-sion can establish a revenue requirement particularly when implementing revenue regulation With revenue regulation as in traditional ratemaking imprudent costs can always be removed from rates and there is no change to the ability of a Commission to impose penalties
Utility Functions to be IncludedFirst the regulator must determine which utility func-
tions will be included in the revenue regulation framework With vertically integrated utilities this usually includes a utilityrsquos regulated generation transmission and distribution units As we discuss below however it is critical to struc-ture power supply recovery mechanisms to avoid providing for double-recovery of certain power supply costs For utili-ties operating in areas of the country that have restructured electricity markets only the regulated distribution busi-ness is decoupled Utilities that also provide gas services
Pacific Gas amp Electric Future test year
Idaho Power Company Historic test year
Baltimore Gas amp Electric Hybrid test year
Wisconsin Public Service Corporation Future test year
National Grid Historic test year
Hawaiian Electric Company Future test year
Table 2
Test Year Used
may have their gas distribution business operating under revenue regulation as well
Test YearOne consideration in establishing the revenue require-
ment is what period of time will be used as a ldquotest periodrdquo or ldquotest yearrdquo The test year is the year on which the Com-mission will base its computations of the utilityrsquos total costs and sales levels A historic test year uses actual data on sales and costs from a past year Whereas a historic test year allows for the use of actual cost data it cannot account for expected variations in sales A future test year requires assumptions to be made about a utilityrsquos sales in a future year This can allow expected changes in sales like those from energy efficiency programs to be included in sales
projections however because regulators are relying on estimates provided by the utility there may be a greater risk for inaccuracy A Commission may also choose to use a test year that includes both past and future periods This may provide a sense of balance between historic and future data Furthermore as the case proceeds the Commission can require the utility to substitute historical data for projected data from the test year
Rate of ReturnAs in any rate case regulators
must determine the appropriate rate of return that a utility can earn on its investments including the cost of debt and the allowed ROE for its shareholders The approved ROE is only used to establish the return on investments that are included in the rate base when determining revenue require-
Pacific Gas amp Electric Electric generation and distribution gas distribution
Idaho Power Company Electric generation and distribution
Baltimore Gas amp Electric Electric distribution gas distribution
Wisconsin Public Service Corporation Electric generation and distribution
National Grid Electric distribution
Hawaiian Electric Company Electric generation and distribution
Table 1
Business Unit Included in the Revenue Regulation Model
Decoupling Case Studies Revenue Regulation Implementation in Six States
26
47 In a rate case the Commission determines an allowed return on equity This is used to set a price (price regulation) or an allowed revenue requirement (revenue regulation) Once set however the actual return earned by the utility is affected by anything that changes either revenue or expenses for example an increase in employee compensation a change in the number of employees or under price regulation a change in sales volumes
48 Lazar et al 2011
ments Although revenue regulation ensures that a utility recovers no more or less than its target revenue revenue regulation does not guarantee that the utility will earn the authorized ROE Depending on how a utility manages its costs between rate cases it will realize an actual ROE either higher (in the case of reduced costs) or lower (in the case of increased costs) than the authorized level47
A utilityrsquos allowed ROE generally represents the return deemed necessary to attract investment considering the level of risk of that investment Riskier investments require a higher return to attract investors and vice versa Util-ity earnings can be volatile because of short-run impacts on sales volumes and revenues which include changes in sales owing to weather economic conditions and energy efficiency and DG programs This volatility typically causes utilities to retain a higher level of equity in their capital structures so that reduced revenues do not leave them un-able to service their debt Revenue regulation can reduce this volatility by stabilizing revenues regardless of the cause Because of this reduced risk many stakeholders have proposed that the implementation of a revenue regulation mechanism be associated with a corresponding reduction in the utilityrsquos equity capital ratio (the percentage of capital supplied by common equity) This reflects the utilityrsquos more stable revenue owing to revenue regulation and reduces the overall revenue requirement that will be recovered from consumers48
An alternative option to reducing the utilityrsquos equity ratio is to reduce the ROE reflecting a lower risk level For the utilities included in these case studies only BGE and Mass Electric experienced a reduction in their ROE The Com-mission did not reduce BGErsquos ROE at the time the revenue regulation mechanism was implemented but reduced it by 50 basis points during the subsequent rate case The Mas-
sachusetts Commission did not reveal its adjustment but incorporated a lowered ROE into its decision
Absent an explicit adjustment to the cost of capital investorsrsquo expectations will adjust to the presence of rev-enue regulation if its presence is reliable The more stable earnings will likely in time contribute to a higher credit rating That in turn will lead to lower cost debt that will be revealed in future cost of capital calculations An adjust-ment to the ROE or capital structure by the regulator in a rate proceeding will be reflected immediately in lower rates to consumers simply allowing the utilityrsquos credit rating to improve over time and its cost of debt to decline will have the same effect but on a lagged basis as new bonds are is-sued at lower interest rates49
Beginning in 2004 Standard and Poorrsquos began publish-ing ldquorisk profilesrdquo for utilities which classified utilities based on their earnings variability and other risks those with more stable earnings were determined eligible for higher bond ratings at any given equity capitalization ratio (or alternatively able to retain a given bond rating with a lower equity ratio)50 One utility with a revenue regulation mechanism Northwest Natural Gas was believed to have had their business risk profile upgraded by one step in response to the benefits of the mechanism51
Effect on Bond RatingsRevenue regulation stabilizes a utilityrsquos revenue streams
reducing risk to investors this reduced risk may be a contributing factor in an increase in a utilityrsquos bond rating Bond rating agencies have recognized that revenue regula-tion mechanisms and other mechanisms that reduce net earnings volatility and risk contribute to a lower cost of capital for the utility52 Standard and Poorrsquos has explicitly stated that it ldquoviews decoupling as a positive develop-
49 Lazar et al 2011
50 Standard and Poorrsquos (2004 June 2) New Business Profile Scores Assigned for US Utility and Power Companies Financial Guidelines Revised
51 Christensen Associates (2005 March) A review of distribution margin normalization as approved by the Oregon Public Utility Commission for Northwest Natural
52 Lazar et al 2011
Decoupling Case Studies Revenue Regulation Implementation in Six States
27
This topic raises a note of caution if mechanisms are not well designed double-recovery of costs can occur for verti-cally integrated utilities that provide both power supply and distribution services For example if a per-customer
revenue regulation mechanism includes investment-related power supply costs in the revenue-per-customer formula but excludes fuel and purchased power costs that are recovered through a separate tracking mechanism double recovery of some power supply costs is likely If the utility experiences cus-tomer and sales growth the amount it recovers for investment-related power supply costs will go up However if that utility serves this growth by operat-
ing existing power plants more by selling less power on the surplus market or by purchasing power from other suppli-ers it will not incur any increases in the type of power sup-
53 Standard amp Poorrsquos (2008 February 19) Decoupling the vehicle for energy conservation
ment from a credit perspectiverdquo53 However in the case of the utilities examined in this report none experienced an improved credit rating after the implementation of revenue regulation with the exception of PGampE However PGampE came out of Chapter 11 bankruptcy in the same year that its revenue regulation mechanism was implemented mak-ing it impossible to attribute the improvement to revenue regulation alone Bond rating changes are generally slow to evolve Numerous other factors are taken into account when assigning an overall credit rating which appear to have outweighed any positive effect of revenue regulation These factors certainly include the recession of the US economy that began in 2007
Customer Classes IncludedWhen determining the target revenue for a utility rev-
enue regulation mechanism regulators must also consider which customer classes to include in the mechanism In some cases industrial customers have objected to a rev-enue regulation mechanism This is due to the wide dif-ference in rates among customers making the design of a revenue regulation mechanism more challenging If regula-tors choose to exclude a class of customers from revenue regulation they must determine the revenue requirement associated with serving only the included customer classes This generally requires a detailed cost of service study to ensure that revenue responsibility is accurately allocated by customer class
Included CostsFinally regulators may wish to exclude specific costs
from the overall revenue requirement if those costs will be tracked through another mechanism like fuel costs in a PCA mechanism energy efficiency program expenditures or smart grid costs for example Separate tracking mecha-nisms can also be used for those costs that are difficult to
Pacific Gas amp Electric All customer classes
Idaho Power Company Residential and small general service
Baltimore Gas amp Electric Residential and small general service
Wisconsin Public Service Corporation All customer classes
National Grid All customer classes
Hawaiian Electric Company All customer classes
Pacific Gas amp Electric
Idaho Power Company
Baltimore Gas amp Electric
Wisconsin Public Service Corporation
National Grid
Hawaiian Electric Company
Table 3
Customer Classes Included in Revenue Regulation Mechanism
Table 4
Costs Excluded From Revenue Regulation Mechanism
project based on historical data or costs over which the util-ity has very little control like fuel costs Although revenue regulation tracks collected revenue mechanisms like Fuel Adjustment Clauses Purchased Power Adjustments and Energy Efficiency Riders can be designed to track actual costs as well as collected revenue
Energy procurement costs
All variable costs
Energy supply costs
Energy costs
Energy supply costs for basic service customers transmission costs the energy efficiency system benefits charge and reconciling charge and costs recovered through the residential assistance adjustment factor
Fuel and purchased power
Decoupling Case Studies Revenue Regulation Implementation in Six States
28
54 We use the RAM term applied in Hawaii here to address any type of attrition or similar mechanism other than a revenue-per-customer framework that changes the allowed revenue between general rate cases
ply costs accounted for in the revenue per customer (RPC) calculation The increased power supply costs to serve that growth will be recovered through the fuel and purchased power tracking mechanism The net effect for the utility will be to recover incremental power supply costs twicemdashonce in the per-customer mechanism and again in the fuel and purchased power mechanism It is essential to make sure that the other adjustment mechanisms do not overlap the cost impacts that are treated in the revenue regulation mechanism One way to do this is to ensure that all power supply costs (investment labor fuel purchased power) are recovered through a single mechanism There are several ways to achieve this
a) A comprehensive power supply recovery mechanism that includes all power supply costs that is separate from the costs treated in the revenue regulation adjustment (eg Puget Sound Energy Washington State)
b) No power supply adjustment whatsoever with all utility costs included in an RPC mechanism (eg National Grid)
c) An annual attrition calculation with all costs reviewed for changes since the last proceeding (eg HECO)
Revenue Adjustment Mechanism in Revenue Regulation
A RAM54 is not necessary to achieve revenue regulation but provides attrition reliefmdashincreasing authorized revenue commensurate with increased costsmdashbetween rate cases Whereas revenue regulation sets a target revenue that the utility will earn regardless of sales levels the RAM adjusts the target revenue between rate cases Regulators may choose to take several different approaches to RAM
bull No RAM Regulators may choose not to implement a RAM leaving the revenue requirement unchanged between rate cases This requires the utility to request a rate case when it requires additional revenue to cover its costs
bull Stairstep Stairstep adjustments provide predetermined increases in target revenue These increases can be determined during a rate case and generally reflect forecasts of cost growth
bull Indexing Indexing ties adjustments to the target revenue to multiple factors like inflation productivity customer growth and changes in capital expenditures
bull RPC The RPC approach is a form of indexing RPC adjusts the total revenue requirement for the
number of customers served Regulators using an RPC mechanism will determine the revenue requirement per customer and the overall revenue requirement will be determined by multiplying the total number of customers by the revenue requirement per customer The amount of revenue required to serve each customer can be determined separately for customer classes and for existing and new customers This way the RPC method accounts for a utilityrsquos growth in fixed costs that is related to growth in the number of customers served RPC is useful where the correlation between cost growth and customer growth is significant It also protects customers from making up the deficit if there is a loss in customer load such as if a large business closes down or relocates
bull Hybrid Hybrid RAMs generally use stairstep increases to account for projected capital costs and indexing to account for OampM expenses
Adjustments from any type of RAM can be implemented automatically or through an attrition proceeding Some stakeholders oppose adjustments to the revenue require-ment outside of a rate case on the basis that this could allow the revenue requirement to increase significantly without examination of the impact on ratepayers or with-out due consideration of other costs and revenues For this reason some regulators choose to cap the total adjustment that can be made to the revenue requirement outside of a rate case
Table 5
Type of Revenue Adjustment Mechanism
Pacific Gas amp Electric
Idaho Power Company
Baltimore Gas amp Electric
Wisconsin Public Service Corporation
National Grid
Hawaiian Electric Company
Hybrid
RPC
RPC
RPC
No RAM potential capital expenditure adjustment
Hybrid
Decoupling Case Studies Revenue Regulation Implementation in Six States
29
55 Because this method results in changes in the price for service that are calculated after that service has been provided it fails the ldquono retroactive ratemakingrdquo statutes that guide most electricity regulators Customers are entitled to know the price of the commodity they are consuming at the time they use it
56 The closest to a current method in use for electric utilities in the BGE system of monthly reconciliation
Table 6
Tracking and Accrual of Difference BetweenActual and Authorized Revenue
Pacific Gas amp Electric
Idaho Power Company
Baltimore Gas amp Electric
Wisconsin Public Service Corporation
National Grid
Hawaiian Electric Company
Track Difference
Monthly
Monthly
Monthly
Yearly
Yearly
Monthly
Accrual Period
Year
Year
Month
Year
Year
Year
Calculation of Actual RevenueRegulators have options when ensuring that actual
revenue equals target revenue under revenue regulation First regulators must decide how to determine ldquoactual revenuerdquo In most cases actual revenue simply equals the amount of revenue a utility collects from its customers The Idaho Public Utilities Commission however has chosen to use weather-normalized revenues as the basis for utility revenues in revenue regulation Although this prevents the utility from recovering revenue lost to it owing to milder than expected weather it further complicates the revenue regulation mechanism and reduces its risk-reduction ben-efits By the same token if weather is severe and increases sales above the revenue requirements weather normaliza-tion would allow the utility to retain some of the revenues
Next regulators must determine whether to implement revenue regulation using a current or accrual method
bull Current Method With the current method of revenue regulation the target revenue for a period say a month is divided by the actual sales in that period to determine the rate per kWh The current method ensures that actual revenue equals target revenue by calculating the rate at the end of the period so that the target revenue can be recovered The current method allows for no lag in revenue recovery One effect of this method is that although customer rates vary total bills are generally more stable For example in a hotter than expected July customers will purchase more kWh but they will be charged a lower rate A milder than average winter would lead to fewer sales but at slightly increased rates This way customers do not experience the same bill variability as they would if rates were set before the sales deviations occurred On the other hand the current method does not provide customers with the ability to plan ahead based on a predictable rate for electricity This method has been used for revenue regulation of natural gas utilities55
bull Accrual Method Under the accrual method rates are set based on an assumed sales level and the differences between actual and target revenue are allowed to accrue over some period Then the total difference between actual and target revenue is reconciled through an adjustment to rates in the subsequent period this is known as the true-up process Presently all revenue regulation mechanisms for electric utilities use the accrual method56
If regulators use the accrual method of revenue
regulation they will next need to determine the period over which the difference between actual and target revenue will be allowed to accrue One year is typical however shorter periods are also used Next the frequency of comparing collected revenue to target revenue should be determined It is possible to do this comparison only once at the end of the accrual period It is common however for comparisons to occur more frequently often monthly When revenues are compared within the accrual period the differences are tracked generally for the purpose of applying interest to the difference that will be deferred until the end of the accrual period
Rate AdjustmentsIn designing a revenue regulation mechanism there are a
number of decision points that regulators need to consider to balance the interests of all the stakeholders One of the decision points revolves around the determination of the mechanism used to adjust rates The issues that regulators need to consider include the following1 Rate Case Requirements One of the often-mentioned
concerns about surcharges especially when they are numerous is how that will impact the frequency of rate cases For regulators and stakeholders rate cases provide
Decoupling Case Studies Revenue Regulation Implementation in Six States
30
the best mechanism to correctly align rates and costs but they are time-consuming and expensive for all parties This is because a rate case presents an opportunity to closely examine all of the utilityrsquos expenses and adjust rates to reflect cost increases and decreases Because under a revenue regulation mechanism the goal is to match revenues received from all customers with revenue requirements a correct determination of revenue requirements is important as is the specification of appropriate cost indices to adjust the revenue requirements As the time between rate cases increases some regulators feel the base rate case data even with adjustments need to be reexamined As a result some regulators have chosen to mandate the frequency of rate cases to address this whereas others have not It may be that in some cases where there are numerous surcharges recovering a multitude of costs there may not be as many costs subject to review in the rate case making it less significant to a regulator than a case in which most costs are being analyzed and recovered in the rate case itself
2 Collection Mechanism Integrally tied to the mechanism for recovering revenues is how the utility will collect or refund the revenues Options that are available include recovery through a rate case or periodic adjustments to rates through a surcharge mechanism As can be seen by the case studies depending on the plan in place some utilities have very discreet requirements dictating the frequency of rate cases with adjustments occurring in those cases or between those cases Other utilities have no requirements upon them with respect to the frequency of rate case filings This will be discussed in more detail below What does emerge from these case studies is that the discreet components or choices in how to execute a revenue regulation plan are carefully interwoven to create a holistic approach Each component works with the other and the value of this case study is in examining the different pathways that can be chosen As discussed previously some of the commissions have authorized revenue regulation to recover the revenue requirements in the last rate case whereas others have authorized adjustments to rates between rate cases this impacts the pathway that the adjustment mechanism takes
3 Timing How often should rates be adjusted to true up to the utilityrsquos revenue requirement States have chosen different options ranging from monthly to annually
4 Allocation of Revenue Regulation Revenue Surpluses or Deficits There are a number of decision points regarding allocation Should the revenue regulation apply to all rate classes or just the smaller customers whose usage per customer and load variations are not as dramatic as those of larger-use customer classes Should there be a different allocation to each rate class or should the allocation of costs among the classes be the same Different mechanisms accomplish different goals Some states have allocated revenue regulation revenues based on the revenues lost by customer class as a result of energy efficiency This can sometimes be a political decision to mitigate opposition to energy efficiency programs by large customers Other states recognize that the system savings resulting from energy efficiency benefit all customers so that all customers should pay equally
5 Carrying Charges Depending on the timing issue discussed previously regulators may want to consider carrying charges on any adjustments This should be symmetrical in its application however so that it applies to surcharges and refunds Consideration should be given for the basis of the carrying charge rate whether weighted average cost of capital rate of return a risk-free rate or some other mechanism should be adopted
6 Rate Caps In order to mitigate potential rate impacts a regulator may want to consider a cap on how much rates can go up when the revenue regulation adjustment is made This might be more critical if the regulator is aware of other potential rate increases that will impact customersrsquo bills If a cap is used the case in which the utilityrsquos adjustment would exceed the cap must be considered Some regulators have opted to allow the utility to carry over the excess unrecovered amount for a period of years whereas others do not This allows the utility to recover those revenues in a subsequent year when perhaps the adjustment is less As a practical matter however adjustments of greater than three percent are less common as shall be discussed later
7 Impact on At-Risk Consumers Low-income and consumer advocates have expressed concern about revenue regulation as a vehicle for annual rate increases without the scrutiny of a general rate case creating rate increases for the low-use customers doing the most to constrain usage and help achieve targeted energy savings One proposal to address this has been to impose any resulting surcharges only to above-average usage
Decoupling Case Studies Revenue Regulation Implementation in Six States
31
57 Cavanagh and Howat (2012 May 2) Finding common ground between consumer and environmental advocates Electricity Policy
58 The most common criticism of future test years is that utilities forecast costs under an assumption that all authorized personnel positions will be filled while in retrospect any large organization has some level of vacancy in its employee count A historic test year captures this effect fully
customers and any resulting credits only to below-average usage57
Rate Case RequirementRequirements as to the frequency of rate cases can be
tied to the recovery mechanism or to the entire regulatory framework for implementing revenue regulation In the cases studied two of the utilities require periodic rate cases PGampE every three years and WPS every year Two others National Grid and HECO require annual mini rate cases explained later in which adjustments are made and two others IPC and BGE have no requirements for scheduled rate cases Nevertheless if the concern is to ensure that the utilityrsquos revenue recovery meets its revenue requirements some kind of periodic rate case to examine costs is appropriate Having periodic rate cases can provide a measure of assurance to consumer advocates that the level at which the revenues and hence the rates are set is correct One of the criticisms of revenue regulation is in fact the lack of rate cases to produce a proper level of confidence in the allowed amounts Multiple surcharges are usually additive to existing rates therefore not permitting an opportunity to reduce the base rate for reductions in cost Moreover the infrequency in cases impedes the examination of rate allocations as would occur through a cost of service study
This is a particular issue where utilities are augmenting power supply with purchased power from independent power producers which is the most common method for acquiring wind and solar production today The increased cost for purchased power may flow through a fuel and purchased power adjustment mechanism while the (depreciating) investment in conventional power plants remains static in base rates
Both PGampE and WPS use a future test year that allows the utility to project revenue requirements during the time period that the rates are to be in effect The benefit to this is that it can help identify and account for projected changes in costs over the timeframe between rate cases However given that these costs are utility projections most consumer advocates have less confidence in these numbers than they would using actual numbers from a historical or only hybrid test year58 When trying to garner support for revenue regulation from more skeptical stakeholders using a future test year may not be helpful Furthermore in the case of WPS that has annual rate cases using a future test year becomes less justifiable as revenues are recalculated annually anyway
The absence of a rate case requirement can also cause consternation among detractors of revenue regulation because of the belief that the utility will be guaranteed its revenue requirements for as long as it is satisfied with that level irrespective of how well it manages However this is no different from the status quo in traditional regulation in most places The incentive to manage well is always there with or without revenue regulation as it translates into more profit for the utility
In the cases of HECO and National Grid the mini rate cases serve two purposes In the one instance it serves as a means to reconcile revenue recovery with revenue requirements and in the second instance it provides an opportunity to adjust rates in accordance with changes in costs Specifically for National Grid the revenue requirement is adjusted to reflect capital expenditures For HECO revenues are adjusted to reflect changes in the cost of service In the two examples here revenue regulation is wrapped in with other adjustments as part of a mini adjustment Given the structure for determining revenue requirements which accounts for changes in costs including revenue regulation within the mini rate cases is a workable option
These examples highlight how rate cases can be used to adjust revenue requirements either in a more controlled regulatory environment with frequent rate cases or left to the utilityrsquos discretion to decide when to adjust costs A set schedule of periodic rate cases such as that used by PGampE may strike an appropriate balance for reviewing revenue requirements however with the modification of a partial historical partial forecasted test year Frequent rate cases can depending on the resources of the regulator and stakeholders be too costly and time-intensive When there are too many rate cases stakeholders and regulators may not be able to dedicate the level of resources needed for any one proceeding and may be spread too thin Regular known rate cases at reasonable intervals may strike the best balance of adequate review and adjustment of revenue requirements
Decoupling Case Studies Revenue Regulation Implementation in Six States
32
Collection Mechanism and TimingThe collection mechanism for the differential between
actual and authorized revenue requirements varies by util-ity as well Both PGampE and WPS do not have adjustment clauses or surcharges but instead have structured their revenue regulation plans to recover their costs in a rate case with rates adjusted annually Although PGampE has rate cases every three years the utility files its preliminary forecast every September 1 for the following year including adjust-ments for revenue regulation and other costs This practice promotes transparency keeping all stakeholders aware of the current situation of the utility IPC BGE National Grid and HECO use surcharges on customer bills to collect or credit the difference between actual revenues collected and the revenue requirement Although the other three (IPC National Grid and HECO) calculate the rate adjustment annually only BGE does a more contemporaneous adjust-ment of one month Certainly where there are no regularly scheduled rate cases using an adjustment mechanism becomes more critical PGampE has created a tracking mecha-nism known as a balancing account that allows the utility to track the surpluses and deficits to help ensure accuracy at year end when rates are actually adjusted The creation of such monthly balancing accounts will make it easier at the end of the year to track what happened each month and then determine the adjustment for that year It provides a more detailed trail for review and analysis by stakeholders and regulators However other mechanisms that just look at total revenues as compared to revenue requirements at the end of the year can work as well
Table 7
Rate Case Requirements
Table 8
Rate Adjustments
Table 9
Allocation of Surplus or Deficit
Pacific Gas amp Electric
Idaho Power Company
Baltimore Gas amp Electric
Wisconsin Public Service Corporation
National Grid
Hawaiian Electric Company
Pacific Gas amp Electric
Idaho Power Company
Baltimore Gas amp Electric
Wisconsin Public Service Corporation
National Grid
Hawaiian Electric Company
Pacific Gas amp Electric
Idaho Power Company
Baltimore Gas amp Electric
Wisconsin Public Service Corporation
National Grid
Hawaiian Electric Company
Every three years annual ldquoattritionrdquo adjustments in between
No requirement
No requirement
Annual rate case
Annual capital expenditure adjustment case
Abbreviated annual rate case
Base rates adjusted annually
Annual adjustment through surcharge
Monthly adjustment through surcharge
Annual adjustment through rate case
Annual adjustment
Annual adjustment
Allocated to all customers according to business unit (eg electric distribution electric generation)
Included in the annual adjustment mechanism for each customer class
Separate for each customer class
Allocated to all customers except certain tariffs (see above)
Separate for each customer class
Separate for residential and commercialindustrial
Allocation of Revenue Regulation Revenue Surpluses or Deficits
The allocation of revenue regulation revenue surpluses or deficits should be symmetrical so that overpayments are credited to customers just as underpayments are paid by those same customers The six utilities studied fol-low that formula The application of revenue regulation however varies from utility to utility BGE and IPC ap-ply revenue regulation to the residential and commercial classes thereby excluding industrial customers In contrast however PGampE WPS National Grid and HECO allocate revenue regulation adjustments to all customer classes In terms of how the costs are allocated IPC BGE WPS National Grid and HECO allocate costs differently among the customer classes PGampE however allocates costs uni-formly among the customers Because PGampE has separated its business units it also separately calculates and allocates
Decoupling Case Studies Revenue Regulation Implementation in Six States
33
Table 10
Carrying Charges
Table 11
Cap on Rate Adjustment
Pacific Gas amp Electric
Idaho Power Company
Baltimore Gas amp Electric
Wisconsin Public Service Corporation
National Grid
Hawaiian Electric CompanyPacific Gas amp Electric
Idaho Power Company
Baltimore Gas amp Electric
Wisconsin Public Service Corporation
National Grid
Hawaiian Electric Company
None
Yes
None
Yes at the short-term debt rate
Yes at the customer deposit rate
Yes at the customer deposit rateNo
3 rate cap excess carried over to next period
10 rate cap excess carried over to next period
Cap of $14 million per year
$170 million in CapEx
No
revenue regulation surpluses and deficits among its electric distribution gas distribution and electric generation busi-nesses This illustrates that there are several ways to address revenues from revenue regulation depending on the policy outcomes that are desired
Carrying ChargesCarrying charges applied to uncollected or surplus rev-
enues can be used to account for the time value of money and the lost opportunity or value to having those revenues in hand PGampE and BGE do not accrue carrying charges On the other hand IPC WPS National Grid and HECO do For BGE given that the revenue regulation revenues are reconciled and recovered monthly it would make little sense to include a carrying cost Where carrying costs have been used they have included in the cases of these utili-ties the short-term debt rate or the customer deposit rate which for one utility is six percent and probably close to the short-term debt rate Thus the carrying charge rates are appropriately at the lower end of the spectrum reflecting their short-term nature In the application of the carrying charge symmetry should be preserved by applying it to both deficits and surpluses Application of carrying charges given the short period that costs are carried (one year) is somewhat discretionary Although it does more accurately account for costs it does add a modest level of complica-tion in tracking costs
Rate Caps and CollarsOne of the ways to protect customers in the event of sig-
nificant adjustments is to impose a rate cap (or collar) that limits the amount of a rate increase (and decrease) Some customers are sensitive to changes in foundational costs like utility bills and if costs are going to rise they benefit from a pattern of steady modest increases rather than a large step increase Any structural increases in rates attributable
to reductions in sales or increases in costs recognized by the revenue regulation plan would be eventually included in rates under any system A cap reflects a controlled way to manage customer expectations and customer impacts Structural changes can only be managed for a while until a complete rate case is needed to reset all assumptions
Typically when a rate cap is imposed if the formulaic increase exceeds the cap or collar the utility will be able to carry over any uncollected revenues until the next rate adjustment Two of the utilities studied PGampE and HECO do not have rate caps On the other hand the other four utilities do include rate caps in varying amounts National Grid has a one-percent revenue cap whereas IPC and BGE have a one-percent and a ten-percent rate cap respectively WPS unlike the others has a cap tied to the dollar amount of $14 million as opposed to a percentage Consistent with the goals of revenue regulation all of the utilities studied have a carryover provision that is important for reducing the risk that the utility will not recover its revenue require-ments
Note that National Grid differs from BGE and HECO in that its cap is on revenues whereas the other two utilities cap rates and rate impacts A revenue cap is more focused on ensuring minimal change to the revenue requirements authorized by the commission National Grid as discussed previously allows for mini rate cases to adjust the rev-enue requirements Having the one-percent cap limits the amount of increase that can occur through that process requiring revenue changes that are greater to occur in a full rate case However note also that some of the adjustments allowed in the mini rate case have their own separate cap The IPC rate cap is in line with what many other utilities with caps have in place which generally range from one to three percent The ten-percent rate cap in the BGE plan is
Decoupling Case Studies Revenue Regulation Implementation in Six States
34
59 Morgan P (2012 December) Graceful Systems LLC A decade of decoupling for US energy utilities rate impacts designs and observa-tions p5
reflective of its monthly adjustment pattern An annual ad-justment allows more time to smooth out peaks and valleys in revenues whereas a monthly adjustment will be influ-enced by more of the spikes (particularly weather-driven variation) thus the need for a larger bandwidth for the car-ryover Like a variable energy rate or fuel adjustment clause that fluctuates monthly the monthly adjustment introduces more volatility into the rates
Actual Historical AdjustmentsFor many ratepayer advocates there is a concern that
some of the utility management risk will be transferred to customers as a consequence of a policy that seeks to ensure that the utility will be made whole However the utility re-tains management risk and the requirement to demonstrate that it has acted prudently Thus the utility still has just as much of an incentive to operate efficiently as it did without revenue regulation If the utility can lower its costs it can still increase its profits Second by designing rates symmet-rically such that under- and over-recoveries are reconciled it provides customers with an opportunity to obtain credits that under traditional regulation would be retained by the utility It has often been opined that when there are large
gaps in time between utility rate cases it is because the utility is over-earning and exceeding its revenue require-ments In those instances customers never get to examine what the utility is collecting much less receive a refund Under revenue regulation with its periodic adjustments and scheduled general rate cases the revenue requirements are examined and refunds or credits allocated such that customers have a better knowledge base for understanding the utilityrsquos earnings And annual reconciliation of the util-ityrsquos actual revenues versus authorized revenues provides consumers with a tool to reign in excess revenue recovery beyond authorized amounts Third the adjustments that do occur under revenue regulation are manageable and frequently less than the adjustments customers are used to seeing on their bills for fuel or variable generation rates or for the myriad of other surcharges that can be tacked on to a customerrsquos bill such as an infrastructure (smart grid) sur-charge maintenance upgrade fee regulatory asset charge or system benefit charge
As seen in Figure 1 the range of rate impacts cluster around plus or minus two percent but can at times exceed plus or minus five percent The total of surcharges has somewhat exceeded the total of credits
Figure 1
Total Utility Decoupling Adjustment Rate Impacts59
300
250
200
150
100
50
0
Nu
mber
of
Dec
oup
lin
g A
dju
stm
ents
Over -5 -4 to -5 -3 to -4 -2 to -3 -1 to -2 0 to -1 0 to 1 1 to 2 2 to 3 3 to 4 4 to 5 Over 5
Percentage Rate Impacts
SurchargesRefunds
ResidentialAll
Other
Commercial
Total
Decoupling Case Studies Revenue Regulation Implementation in Six States
35
60 Id p 3
61 Schultz T Energy Efficiency at Idaho Power Available at httpwwwenergyidahogovenergyalliancedida_powerpdf
As can be seen with the utilities studied above the larger fluctuations are attributable to adjustment mechanisms that are reconciled more frequently such as monthly as those are less able to smooth out anomalies as an annual adjust-ment would do From a dollar perspective for the roughly 64 percent of adjustments that fall within the plus or minus two-percent range the monthly bill impact is approxi-mately $230 for average electric customers and $140 for average gas customers60
Of the six utilities studied the fluctuations in adjustment have for the most part stayed within the one- to three-per-cent range as shown below
bull PGampE from 2005 to 2012 has had annual revenue regulation adjustments ranging from minus143 percent to 415 percent with an average adjustment of 197 percent
bull For IPC the adjustments are separated between residential and commercial customers For residential customers the annual adjustments from 2007 through 2011 ranged from 077 percent to 258 percent for an average of 162 percent As for the commercial customers the annual adjustments for that same period were higher ranging from 104 percent to 424 percent with an average adjustment of 252 percent
bull BGE has monthly adjustments that ranged from minus1853 percent to 3013 percent with an average of 057 percent for residential customers from March 2008 through August 2012 For General Service Customers the monthly adjustment ranged from minus2264 percent to 2462 percent The average adjustment was 1308 percent
bull For WPS the annual adjustments from 2009 through 2011 ranged from minus145 percent to 378 percent for residential and small commercial and from minus314 percent to 899 percent for commercial Note that because of a $14 million per year cap some of these percentages were carried over The average annual adjustment for residential and small commercial and for commercial was 163 percent and 215 percent respectively with carry-overs to subsequent years
bull For Massachusetts Electric and Nantucket Electric both of which operate under National Grid the annual revenue regulation adjustment for all for 2011 and 2012 was minus0105 percent and 0315 percent for an average revenue regulation adjustment over the two years of 0105 percent
bull HECO like National Grid has one annual revenue
regulation mechanism for its customers which resulted in adjustments in 2011 and 2012 of 063 percent and 107 percent respectively for an average adjustment of 085 percent
As can be gleaned from the above information the range of average adjustments for small use customers was a low of 0105 percent for National Grid to a high of 197 percent for PGampE For larger use customers the range was a low of 0105 percent for National Grid to a high of 252 percent for IPC This demonstrates that on average for these utilities with well-developed and diversely designed revenue regula-tion proposals their adjustments on average stayed at or below approximately 25 percent
One of the metrics for determining if a revenue regula-tion program is working successfully that was discussed above was the impact on rates of a revenue regulation mechanism As can be seen by the analysis of the adjust-ment levels for each of the utilities they are within a rea-sonable range
Complementary Policies Although a revenue regulation mechanism does not need
to be accompanied by other policies energy efficiency is frequently at the root of the reason revenue regulation was proposed in the first place The states examined in this pa-per have various obligations for energy efficiency achieve-ment placed upon their utilities Only Idaho does not have an Energy Efficiency Resource Standard but energy efficiency objectives are developed through an integrated resource plan process Energy efficiency spending at IPC has increased dramatically in recent years61
In recognition of the fact that revenue regulation only removes the disincentive to pursue energy efficiency several states have instituted some form of incentives to reward the desired outcome This mechanism can not only incentivize management to aggressively pursue energy efficiency but also make shareholders supportive in the face of lost invest-ment opportunity
Rate design can also play an important part in assist-ing the utility in achieving favorable energy efficiency outcomes Inclining block rates penalize inefficient use of electricity and shorten payback times from the customer perspective Because efficiency reduces consumption at
Decoupling Case Studies Revenue Regulation Implementation in Six States
36
62 Optional rate designs for PGampE include TOU and Peak Time Pricing
63 IPC also has an optional TOU rate design
64 Optional rate designs for this utility include TOU Critical Peak Pricing and Contract
65 National Grid also offers optional TOU and flat rate designs
66 HECO also offers optional TOU and flat rate designs
67 See eg Alexander B (1996 April) How to construct a service quality index in performance-based ratemaking Electricity Policy
the tail block rate the value of kWh savings is greater than with flat rates On the other side of the spectrum declining block rates which have a reduced rate in the tail block do little to encourage conservation In fact they operate more like a discounted bulk rate by reducing the average cost of a kWh in a customerrsquos bill for the more kWh used
Performance incentives or other ways to avoid destruc-tive cost-cutting in the name of creating margins that reduce service or reliability or lessen customer value have been implemented only in Massachusetts of the six utilities illustrated here Several other states have implemented vari-ous schemes in reaction to perceived deficiencies in utility service67 Performance incentives are not unique to rev-enue regulation Commissions wishing to implement such a scheme can find many models of incentive reward and penalty mechanisms developed for other purposes
Taken together a suite of policy and program features can create an atmosphere that is conducive to achievement of energy efficiency goals within the utility and for the customers By appropriate application of these techniques regulators working with utilities and stakeholders can remove barriers and create an opportunity for energy ef-ficiency to be fully integrated into the utility supply option portfolio
Energy Efficiency OutcomesAlthough revenue regulation itself does not create an
incentive for a utility to implement energy efficiency it does address the issue of lost revenues associated with energy
Table 12
Complementary Policies for Energy Efficiency
Pacific Gas amp Electric62
Idaho Power Company63
Baltimore Gas amp Electric
Wisconsin Public Service Corporation64
National Grid65
Hawaiian Electric Company66
Energy Efficiency Requirement
1 annually
IRP
10 by 2015
075 annually
24 annually
Energy efficiency can satisfy portion of RPS
Default Residential Rate Design
Inclining block
Inclining block
TOU seasonal
Flat
Inclining block
Inclining block
Incentive Structure
Risk reward incentive mechanism
No
No
No
5 of program costs
Third-party administrator paid for contract performance
Performance Incentives
Reliability reporting only
None
Under consideration
Reliability reporting only
Service quality reward and penalty
Under consideration
efficiency and DG programs Revenue regulation should be combined with other mechanisms that require or incentiv-ize the implementation of energy efficiency by the utility or a third party The level of energy efficiency achieved can be one measure of the success of a revenue regulation mechanism as implemented in a larger program designed to achieve energy efficiency Table 13 shows the incremental annual energy efficiency savings reported by each utility with the shaded box indicating the year that the utilityrsquos revenue regulation mechanism was implemented National Grid had achieved a high level of energy efficiency savings in the years before it implemented revenue regulation
This paper has not evaluated DG outcomes to correlate with revenue regulation as it is not perceived that states and utilities have made that connection expressly in histori-cal mechanisms However it is expected that this connec-
Decoupling Case Studies Revenue Regulation Implementation in Six States
37
68 EIA Form EIA-861 data files Available at httpwwweiagovelectricitydataeia861
69 PGampE began revenue regulation in 1974 and it was later suspended and recommenced in 2001
70 WPS savings are represented by the statewide program savings from the Focus on Energy program WPS provided additional funds to Focus on Energy starting in CY10 through their territory-wide program activities
71 In 2009 Hawaii Energy a ratepayer-funded statewide energy efficiency provider began delivering services Savings reported after 2009 represent savings achieved through the programs of Hawaii Energy
Table 13
Annual Incremental Energy Efficiency Savings as Percentage of Retail Sales68
Highlighted cells are the year that utility started decoupling
Pacific Gas amp Electric69
Idaho Power Company
Baltimore Gas amp Electric
Wisconsin Public Service Corporation70
National Grid
Hawaiian Electric Company71
2004
11
01
00
03
11
00
2005
16
03
00
03
09
05
2006
10
05
00
03
12
05
2010
19
13
17
09
136
12
tion will be made in future mechanisms and furthermore it is anticipated that follow on work to this paper will want to study that connection between revenue regulation and DG performance
Conclusions
An increasing number of states are looking to increase the rate of energy efficiency investments for their long-run cost and risk advantages The benefits of energy efficiency include not only its ability to reduce system costs across the distribution transmission and generation functions but also the opportunity for customers to reduce their individ-ual energy costs for their own electric bills Nevertheless it is counterintuitive to encourage or order a utility to sell less of its product In order to encourage the proliferation of en-ergy efficiency programs as a solution that can contribute to this nationrsquos energy needs this tension between the goals of society versus the goals of the utility needs to be addressed Revenue regulation can be such a solution by removing the link between sales and revenues
There are many ways to implement revenue regulation and multiple decision points that regulators must consider in designing a revenue regulation mechanism This paper focused on six utilities each of which implemented revenue regulation in different ways in accordance with the objectives of that state Different decision points discussed include
bull Should revenue regulation apply to all functions (generation transmission and distribution) which sometimes depends on if the utility is regulated or restructured
bull Should revenue regulation apply to all customer classes
bull Should there be symmetry such that a reconciliation adjustment occurs for both over- and under-recoveries of the revenue requirements
bull Should recovery of indicated surcharges be conditioned on acceptable performance on customer service quality or energy efficiency goals
bull Should there be an attrition adjustment to account for other expenses or should the revenue regulation adjustment be limited to reconciling existing revenue requirements
bull Should there be an inflation adjustmentbull To calculate the revenue requirements should the
current or accrual method be usedbull Should the adjustments be made in rate cases or
through a riderbull How frequently should adjustments be made
monthly annually or some other time periodbull Depending on the period of time between true up and
recovery should there be carrying charges and if so how should they be calculated
2007
21
06
00
03
09
04
2008
35
10
05
09
05
05
2009
20
11
06
10
11
11
Decoupling Case Studies Revenue Regulation Implementation in Six States
38
72 Avista Utilities (2009) Washington Utilities and Transportation Commission Docket UE-090134
bull Should there be a requirement authorizing the frequency of rate case
bull Should there be an annual cap on the amount of the adjustment and if so should there be an opportunity to carry over any additional amounts and for how many years
bull Should there be an adjustment to the cost of capital to reflect the reduced risk
Other considerations for regulators whether or not they implement revenue regulation but certainly as part of a comprehensive package are other measures that can be put in place to encourage consumers and utilities alike to actively participate in energy efficiency For example an inclining block rate structure by virtue of its incentive to consume less pairs well with an energy efficiency program helps drive consumers to participate in efficiency programs and accelerates the payback of an energy efficiency investment By the same token an incentive payment to the utility helps provide its management with a good reason to excel and exceed targets for energy efficiency programs
A key point illustrated by the list of considerations above is that there is not just one static way to design and implement revenue regulation but rather there are a variety of options for doing so In this study a diverse group of utilities were reviewed The differences among the utilities included geographic diversity vertically integrated and restructured utilities different levels of energy efficiency in place and certainly differences in how the revenue regulation mechanisms were implemented No two utilities were alike and no two utilities had the same revenue regulation mechanism The key is that revenue regulation should eliminate the throughput incentive but the means for accomplishing this goal can vary and be tailored to each jurisdiction and each utility and still be successful
There are several considerations in the design of a revenue regulation mechanism that can help ensure its successful adoption To begin revenue regulation should be granted to utilities only as a precondition to implementing comprehensive energy efficiency andor DG policies Unless accompanied by a commitment to engage in providing least-cost resource options that could impact sales there is not really any good policy reason for its adoption All of the utilities studied are actively engaging in energy efficiency Furthermore as a matter of fairness the revenue regulation mechanism should be symmetrical so that any revenues above those authorized are refunded back to consumers As Figure 1 demonstrates although there are more surcharges to customers there is nevertheless a healthy amount of
credits back to consumers This is the bargain Barring imprudence or other unforeseen circumstances the utility receives its authorized revenue requirements and nothing more or less under a simple revenue regulation mechanism
Rate design plays an important role in the effectiveness of energy efficiency in concert with revenue regulation A low customer charge is preferable so that the customer can benefit from real bill reductions tied to reduced volumetric consumption Reductions in consumption not only reduce bills but also positively impact the payback period for investments in energy efficient appliances Declining block rates in which the tail block rate is lower than the first tier also do not encourage conservation Inclining block rates that reward low usage in the first block with a lower rate send the better price signals None of the six utilities studied had declining block residential rates They were inclining flat and time-varying
The revenue adjustment mechanism is also a critical decision point in terms of whether a revenue per customer mechanism is adopted that accounts for only the current revenue requirements or whether latitude is given to include an inflation adjustment or other cost increases in the revenue adjustment mechanism Three of the utilities studied adopted this approach whereas another two used a hybrid approach Finally to reduce volatility five of the six utilities opted for annual rather than monthly adjustments thereby creating a level of rate stability that customers in general prefer
Once the goals for revenue regulation are set by the regulators the next step is to design programs that will implement that goal For energy efficiency to be as successful as possible regulators may want to adopt a complement of other policies to accompany revenue regulation These can include rate designs that reward reduced use and conservation as well as incentive payments to utilities that reward them for meeting or exceeding targets Of the six utilities studied three have adopted some form of incentive One simple approach that was used in Washington was to link recovery of any surcharges under the revenue regulation mechanism to achievement of energy efficiency targets72
For the utilities examined above that have implemented revenue regulation the evidence demonstrates that revenue regulation as a strategy and a mechanism to enable
Decoupling Case Studies Revenue Regulation Implementation in Six States
39
energy efficiency has been working well The fact that each revenue regulation mechanism varies from the next demonstrates that there are many different paths that can be followed in implementing revenue regulation based on the needs of the utility and its stakeholders in a particular
region This study demonstrates that revenue regulation does work and provides examples of how it can be implemented each one different and unique because of the number of decision points to be considered in designing a revenue regulation mechanism
Decoupling Case Studies Revenue Regulation Implementation in Six States
40
Appendix
Historic Rate Adjustments
Table 14
PGampE Revenue Regulation Rate Adjustments 1983 to 199373
Table 15
PGampE Revenue Regulation Adjustments 2005 to 201274
Table 16
IPC Revenue Regulation Adjustments76
Idaho Power Company
1983 23
1984 (34)
1985 (48)
1986 19
1987 21
1988 50
1989 (43)
1990 (54)
1991 39
1992 34
1993 00
2005 8925 minus12773 minus143
2006 9933 2246 226
2007 10409 21727 209
2008 10261 4032 039
2009 11169 10355 093
2010 11224 46556 415
2011 10306 38390 373
2012 11032 40304 365
2007 Residential minus00457 590 minus077
Commercial minus00457 428 minus107
2008 Residential 00529 670 090
Commercial 00529 510 104
2009 Residential 01220 770 158
Commercial 01535 603 255
2010 Residential 01800 785 229
Commercial 02273 613 371
2011 Residential 02028 785 258
Commercial 02597 613 424
Revenue Regulation Adjustment as of
Total Rates
Delivery Revenue
Requirement ($ millions)
Adjustment Rate
Revenue Regulation Adjustment($ millions)
Retail Rate
of Delivery Revenue
Revenue Regulation Adjustment
Year
Year
73 Lesh P (2009 June 30) Rate impacts and key design elements of gas and electric utility decoupling
74 Morgan P (2012 November) A decade of decoupling for US energy utilities rate impacts designs and observations
75 Morgan P (2012 November) A decade of decoupling for US energy utilities rate impacts designs and observations
76 All numbers provided by the utility
Decoupling Case Studies Revenue Regulation Implementation in Six States
41
77 Idaho Power Company Case No IPC-E-11-19- fixed cost adjustment permanent mechanism Available at httpwwwpucidahogovinternetcaseselecIPCIPCE1119company20120928COMPLIANCE20FILINGPDF
Figure 2
IPC Revenue Regulation Adjustments77
Residential FCA Balance and Use per Customer
$10000000
$8000000
$6000000
$4000000
$2000000
$0
-$2000000
-$4000000
-$6000000
1080
1070
1060
1050
1040
1030
1020
1010
1000Res
idu
al A
uth
oriz
ed F
CA
Am
oun
t
Residual Authorized FCA Amount ($)
Monthly Use Per Customer (kWh)
kW
h U
sed
2006 2007 2008 2009 2010 2011
78 Morgan P (2012 November) A decade of decoupling for US energy utilities rate impacts designs and observations
Decoupling Case Studies Revenue Regulation Implementation in Six States
42
Table 17a
Baltimore Gas and ElectricBGE Monthly Revenue Regulation Adjustments 2008 to 201278
Table 17b
Baltimore Gas and ElectricBGE Monthly Revenue Regulation Adjustments 2008 to 201278
March Residential 000172 01477 1165General Service 000230 01526 1507
April Residential 000016 01477 0108General Service 000146 01526 0957
May Residential 000066 01477 0447General Service 000230 01526 1507
June Residential minus000066 01477 minus0447General Service 000230 01526 1507
July Residential 000158 01477 1070General Service 000230 01526 1507
August Residential minus000040 01477 minus0271General Service 000214 01526 1402
September Residential 000237 01477 1605General Service 000230 01526 1507
October Residential 000237 01477 1605General Service 000143 01526 0937
November Residential 000237 01477 1605General Service 000140 01526 0917
December Residential 000445 01477 3013General Service 000230 01526 1507
January Residential 000035 01579 0222General Service minus000073 01346 minus0542
February Residential 000025 01579 0158General Service 000230 01346 1709
March Residential minus000237 01579 minus1501General Service 000230 01346 1709
April Residential minus000237 01579 minus1501General Service 000230 01346 1709
May Residential 000234 01579 1482General Service 000132 01346 0981
June Residential 000237 01579 1501General Service 000230 01346 1709
July Residential 000237 01579 1501General Service 000230 01346 1709
August Residential 000237 01579 1501General Service 000190 01346 1412
September Residential 000237 01579 1501General Service 000230 01346 1709
October Residential 000237 01579 1501General Service 000124 01346 0921
November Residential 000237 01579 1501General Service 000230 01346 1709
December Residential 000156 01579 0988General Service 000204 01346 1516
Adjustment $kWh
Adjustment $kWh2008 2009
Retail Rate
$kWh
Retail Rate
$kWhAdjustment
Adjustment
Decoupling Case Studies Revenue Regulation Implementation in Six States
43
Table 17c
Baltimore Gas and ElectricBGE Monthly Revenue Regulation Adjustments 2008 to 201278
Table 17d
Baltimore Gas and ElectricBGE Monthly Revenue Regulation Adjustments 2008 to 201278
January Residential 000203 01465 1386General Service 000230 01261 1824
February Residential minus000142 01465 minus0969General Service 000230 01261 1824
March Residential minus000237 01465 minus1618General Service 000230 01261 1824
April Residential minus000237 01465 minus1618General Service 000230 01261 1824
May Residential 000192 01465 1311General Service 000230 01261 1824
June Residential 000191 01465 1304General Service 000230 01261 1824
July Residential 000095 01465 0648General Service 000230 01261 1824
August Residential minus000176 01465 minus1201General Service 000224 01261 1776
September Residential minus000237 01465 minus1618General Service 000116 01261 0920
October Residential minus000237 01465 minus1618General Service 000081 01261 0642
November Residential minus000237 01465 minus1618General Service 000098 01261 0777
December Residential minus000079 01465 minus0539General Service 000229 01261 1816
January Residential minus000130 01365 minus0952General Service 000230 01156 1990
February Residential minus000253 01365 minus1853General Service minus000020 01156 minus0173
March Residential minus000018 01365 minus0132General Service minus000063 01156 minus0545
April Residential 000110 01365 0806General Service minus000262 01156 minus2266
May Residential 000010 01365 0073General Service minus000160 01156 minus1384
June Residential 000226 01365 1656General Service 000042 01156 0363
July Residential 000253 01365 1853General Service 000209 01156 1808
August Residential minus000007 01365 minus0051General Service minus000157 01156 minus1358
September Residential minus000253 01365 minus1853General Service minus000177 01156 minus1531
October Residential 000228 01365 1670General Service 000262 01156 2266
November Residential minus000059 01365 minus0432General Service 000262 01156 2266
December Residential 000071 01365 0520General Service 000262 01156 2266
Adjustment $kWh
Adjustment $kWh2010 2011
Retail Rate
$kWh
Retail Rate
$kWhAdjustment
Adjustment
Decoupling Case Studies Revenue Regulation Implementation in Six States
44
Table 17e
Baltimore Gas and ElectricBGE Monthly Revenue Regulation Adjustments 2008 to 201278
January Residential 000253 01291 1960General Service 000262 01064 2462
February Residential 000253 01291 1960General Service 000262 01064 2462
March Residential 000253 01291 1960General Service 000262 01064 2462
April Residential 000253 01291 1960General Service 000262 01064 2462
May Residential 000253 01291 1960General Service 000262 01064 2462
June Residential 000253 01291 1960General Service 000262 01064 2462
July Residential 000253 01291 1960General Service 000262 01064 2462
August Residential 000253 01291 1960General Service 000160 01064 1504
Adjustment $kWh2012
Retail Rate
$kWhAdjustment
Decoupling Case Studies Revenue Regulation Implementation in Six States
45
79 Morgan P (2012 November) A decade of decoupling for US energy utilities rate impacts designs and observations
80 Morgan P (2012 November) A decade of decoupling for US energy utilities rate impacts designs and observations
Table 18
Wisconsin Public Service Corporation Revenue Regulation Adjustments 2009 to 201179
2009 ResidentialSmall Commercial 00048705 000168154 01290 378 130Commercial 00084951 000293293 00945 899 310
2010 ResidentialSmall Commercial 00033043 000166936 01291 256 129Commercial 00056630 000286103 09460 060 030
2011 ResidentialSmall Commercial (00018666) $ (000163719) 01288 minus145 minus127Commercial (00032565) $ (000285629) 01037 minus314 minus275
Derived Adjustment
$kWh
Derived Adjustment Capped $
kWh
Retail Rate
$kWh
Revenue Regulation Actual
Revenue Regulation Capped
Table 19
National Grid Revenue Regulation Adjustments 2011-201276
Massachusetts Electric and Nantucket Electric
Table 20
Hawaiian Electric Company
2011 All minus0015 1429 minus0105
2012 All 0044 1396 0315
2011 01995 3149 063
2012 03894 3641 107
Revenue Regulation Adjustment
centkWh
Revenue Regulation Adjustment
centkWhRetail Rate
centkWh
Retail Rate
Revenue Regulation Adjustment
Revenue Regulation
ldquoThe 2011 adjustment took effect June 1 but was reduced to $0 on July 26 2011 when the Commission granted HECO an interim rate increase of $532 million in a 2011 test year general rate case The 2012 Adjustment runs from June 1 2012 through May 31 2013 About 25 of the total relates to the portion of the decoupling mechanism that updates OampM and rate baserdquo (Morgan 2013)
Decoupling Case Studies Revenue Regulation Implementation in Six States
46
Revenue Regulation and Decoupling A Guide to Theory and Applicationhttpwwwraponlineorgdocumentdownloadid902
This guide was prepared to assist anyone who needs to understand both the mechanics of a regulatory tool known as decoupling and the policy issues associated with its use This would include public utility commissioners and staff utility management advocates and others with a stake in the regulated energy system While this guide is somewhat technical at points we have tried to make it accessible to a broad audience to make comprehensible the underlying concepts and the implications of different design choices This guide includes a detailed case study that demonstrates the impacts of decoupling using different pricing structures (rate designs) and usage patterns
Pricing Dorsquos and Donrsquots Designing Retail Rates as if Efficiency Countshttpwwwraponlineorgdocumentdownloadid939
Rate design is a crucial element of an overall regulatory strategy that fosters energy efficiency and sends appropriate signals about efficient system investment and operations Rate design is also fully under the control of state regulators Progressive rate design elements can guide consumers to participate in energy efficiency programs and reduce peak demand yet relatively few utilities and commissions have implemented many of these elements This RAP paper identifies some best practices Because pricing issues tie closely to utility growth incentives we also address revenue decoupling
A Decade of Decoupling for US Energy Utilities Rate Impacts Designs and Observationshttpwwwraponlineorgdocumentdownloadid6356
This report written by Pamela Morgan of Graceful Systems LLC builds on a 2009 report Now covering 25 states including 49 LDCs and 24 electric utilities this report summarizes the decoupling mechanism designs these utilities use and the rate adjustments they have made under those mechanisms In total this report estimates the retail rate impacts of 1244 decoupling mechanism adjustments since 2005
Additional Resources
The Role of Decoupling Where Energy Efficiency is Required by Lawhttpwwwraponlineorgdocumentdownloadid275
This Issuesletter gives an overview of energy efficiency resource standards the need to decouple utility profits from utility sales and explains why decoupling is needed even where a third party administers energy efficiency programs
Revenue Decoupling Standards and Criteria A Report to the Minnesota Public Utilities Commissionhttpwwwraponlineorgdocumentdownloadid850
In 2007 the Minnesota legislature enacted a new statute Section 216B2412 in which it defined an alternative approach to utility regulation decoupling and directed the Public Utilities Commission (PUC) to ldquoestablish criteria and standardsrdquo by which decoupling could be adopted for the statersquos rate-regulated utilitiesTo fulfill its obligation to develop criteria and standards for decoupling the PUC sought the advice of the Regulatory Assistance Project (RAP) This report is the output of that collaboration
Designing Distributed Generation Tariffs Wellhttpwwwraponlineorgdocumentdownloadid6898
Improvements in distributed generation economics increasing consumer preference for clean distributed energy resources and a favorable policy environment in many states have combined to produce significant increases in distributed generation adoption in the United States Regulators are looking for the well-designed tariff that compensates distributed generation adopters fairly for the value they provide to the electric system compensates the utility fairly for the grid services it provides and charges non-participating consumers fairly for the value of the services they receive This paper offers regulatory options for dealing with distributed generation The authors outline current tariffs and ponder what regulators should consider as they weigh the benefits costs and net value to distributed generation adopters non-adopters the utility and society as a whole The paper highlights the importance of deciding upon a valuation methodology so that the presence or absence of cross-subsidies can be determined Finally the paper offers rate design and ratemaking options for regulators to consider and includes recommendations for fairly implementing tariffs and ratemaking treatments to promote the public interest and ensure fair compensation
Decoupling Case Studies Revenue Regulation Implementation in Six States
47
The Regulatory Assistance Project (RAP)trade is a global non-profit team of experts focused on thelong-term economic and environmental sustainability of the power sector We provide technical and policy assistance on regulatory and market policies that promote economic efficiency environmental protection system reliability and the fair allocation of system benefits among consumers We work extensively in the US China the European Union and India Visit our website at wwwraponlineorg to learn more about our work
Rate Design Where Advanced Metering Infrastructure Has Not Been Fully Deployedhttpwwwraponlineorgdocumentdownloadid6516
This paper identifies sound practices in rate design applied around the globe using conventional metering technology Rate design for most residential and small commercial customers (mass market consumers) is most often reflected in a simple monthly access charge and a per-kWh usage rate in one or more blocks and one or more seasons A central theme across the practices highlighted in this paper is that of sending effective pricing signals through the usage-sensitive components of rates in a way that reflects the character of underlying long-run costs associated with production and usage While new technology is enabling innovations in rate design that carry some promise of better capturing opportunities for more responsive load the majority of the worldrsquos electricity usage is expected to remain under conventional pricing at least through the end of the decade and much longer in some areas Experience to date has shown that the traditional approaches to rate design persist well after the enabling technology is in place that leads to change
Time-Varying and Dynamic Rate Designhttpwwwraponlineorgdocumentdownloadid5131
This report discusses important issues in the design and deployment of time-varying rates The term time-varying rates is used in this report as encompassing traditional time-of-use rates (such as time-of-day rates and seasonal rates) as well as newer dynamic pricing rates (such as critical peak pricing and real time pricing) The discussion is primarily focused on residential customers and small commercial customers who are collectively referred to as the mass market The report also summarizes international experience with time-varying rate offerings
50 State Street Suite 3Montpelier Vermont 05602802-223-8199wwwraponlineorg
- Table of Contents
- Introduction
- California Pacific Gas and Electric Company
- Idaho Idaho Power Company
- Maryland Baltimore Gas and Electric
- Wisconsin Wisconsin Public Service Corporation
- Massachusetts National Grid
- Hawaii Hawaiian Electric Company
- Discussion of the Six Utilities Overall
- Conclusions
- Appendix
- Additional Resources
-
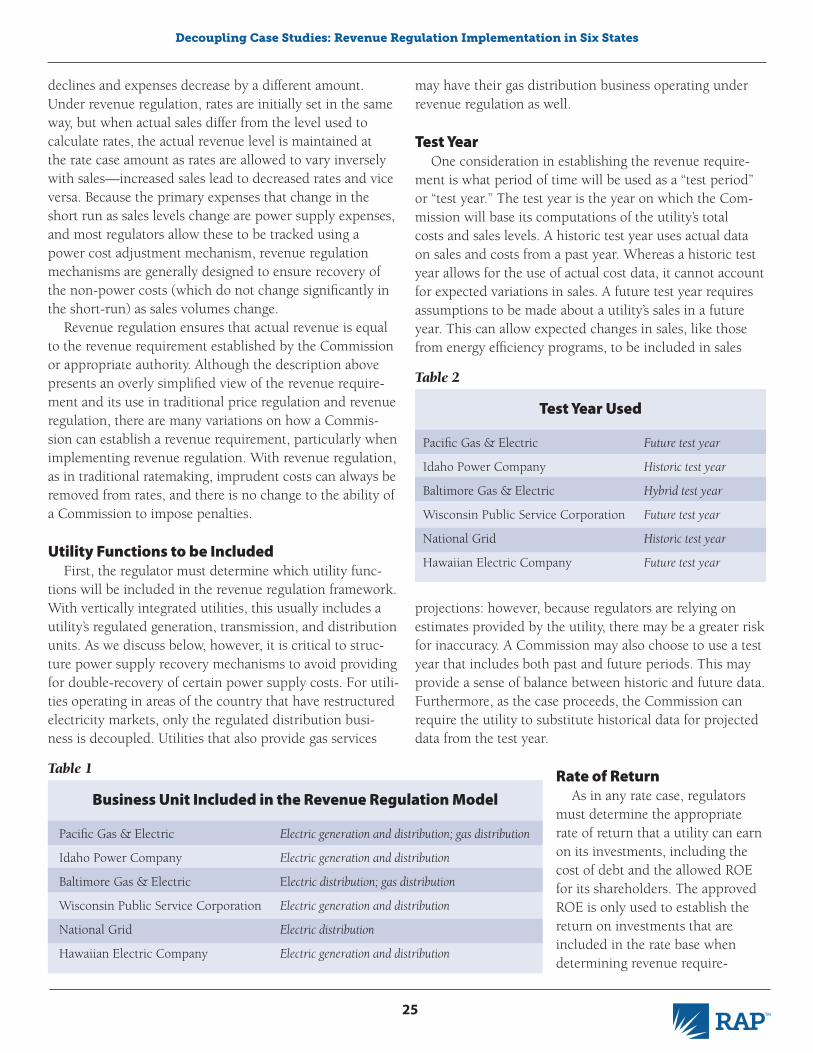
Decoupling Case Studies Revenue Regulation Implementation in Six States
28
54 We use the RAM term applied in Hawaii here to address any type of attrition or similar mechanism other than a revenue-per-customer framework that changes the allowed revenue between general rate cases
ply costs accounted for in the revenue per customer (RPC) calculation The increased power supply costs to serve that growth will be recovered through the fuel and purchased power tracking mechanism The net effect for the utility will be to recover incremental power supply costs twicemdashonce in the per-customer mechanism and again in the fuel and purchased power mechanism It is essential to make sure that the other adjustment mechanisms do not overlap the cost impacts that are treated in the revenue regulation mechanism One way to do this is to ensure that all power supply costs (investment labor fuel purchased power) are recovered through a single mechanism There are several ways to achieve this
a) A comprehensive power supply recovery mechanism that includes all power supply costs that is separate from the costs treated in the revenue regulation adjustment (eg Puget Sound Energy Washington State)
b) No power supply adjustment whatsoever with all utility costs included in an RPC mechanism (eg National Grid)
c) An annual attrition calculation with all costs reviewed for changes since the last proceeding (eg HECO)
Revenue Adjustment Mechanism in Revenue Regulation
A RAM54 is not necessary to achieve revenue regulation but provides attrition reliefmdashincreasing authorized revenue commensurate with increased costsmdashbetween rate cases Whereas revenue regulation sets a target revenue that the utility will earn regardless of sales levels the RAM adjusts the target revenue between rate cases Regulators may choose to take several different approaches to RAM
bull No RAM Regulators may choose not to implement a RAM leaving the revenue requirement unchanged between rate cases This requires the utility to request a rate case when it requires additional revenue to cover its costs
bull Stairstep Stairstep adjustments provide predetermined increases in target revenue These increases can be determined during a rate case and generally reflect forecasts of cost growth
bull Indexing Indexing ties adjustments to the target revenue to multiple factors like inflation productivity customer growth and changes in capital expenditures
bull RPC The RPC approach is a form of indexing RPC adjusts the total revenue requirement for the
number of customers served Regulators using an RPC mechanism will determine the revenue requirement per customer and the overall revenue requirement will be determined by multiplying the total number of customers by the revenue requirement per customer The amount of revenue required to serve each customer can be determined separately for customer classes and for existing and new customers This way the RPC method accounts for a utilityrsquos growth in fixed costs that is related to growth in the number of customers served RPC is useful where the correlation between cost growth and customer growth is significant It also protects customers from making up the deficit if there is a loss in customer load such as if a large business closes down or relocates
bull Hybrid Hybrid RAMs generally use stairstep increases to account for projected capital costs and indexing to account for OampM expenses
Adjustments from any type of RAM can be implemented automatically or through an attrition proceeding Some stakeholders oppose adjustments to the revenue require-ment outside of a rate case on the basis that this could allow the revenue requirement to increase significantly without examination of the impact on ratepayers or with-out due consideration of other costs and revenues For this reason some regulators choose to cap the total adjustment that can be made to the revenue requirement outside of a rate case
Table 5
Type of Revenue Adjustment Mechanism
Pacific Gas amp Electric
Idaho Power Company
Baltimore Gas amp Electric
Wisconsin Public Service Corporation
National Grid
Hawaiian Electric Company
Hybrid
RPC
RPC
RPC
No RAM potential capital expenditure adjustment
Hybrid
Decoupling Case Studies Revenue Regulation Implementation in Six States
29
55 Because this method results in changes in the price for service that are calculated after that service has been provided it fails the ldquono retroactive ratemakingrdquo statutes that guide most electricity regulators Customers are entitled to know the price of the commodity they are consuming at the time they use it
56 The closest to a current method in use for electric utilities in the BGE system of monthly reconciliation
Table 6
Tracking and Accrual of Difference BetweenActual and Authorized Revenue
Pacific Gas amp Electric
Idaho Power Company
Baltimore Gas amp Electric
Wisconsin Public Service Corporation
National Grid
Hawaiian Electric Company
Track Difference
Monthly
Monthly
Monthly
Yearly
Yearly
Monthly
Accrual Period
Year
Year
Month
Year
Year
Year
Calculation of Actual RevenueRegulators have options when ensuring that actual
revenue equals target revenue under revenue regulation First regulators must decide how to determine ldquoactual revenuerdquo In most cases actual revenue simply equals the amount of revenue a utility collects from its customers The Idaho Public Utilities Commission however has chosen to use weather-normalized revenues as the basis for utility revenues in revenue regulation Although this prevents the utility from recovering revenue lost to it owing to milder than expected weather it further complicates the revenue regulation mechanism and reduces its risk-reduction ben-efits By the same token if weather is severe and increases sales above the revenue requirements weather normaliza-tion would allow the utility to retain some of the revenues
Next regulators must determine whether to implement revenue regulation using a current or accrual method
bull Current Method With the current method of revenue regulation the target revenue for a period say a month is divided by the actual sales in that period to determine the rate per kWh The current method ensures that actual revenue equals target revenue by calculating the rate at the end of the period so that the target revenue can be recovered The current method allows for no lag in revenue recovery One effect of this method is that although customer rates vary total bills are generally more stable For example in a hotter than expected July customers will purchase more kWh but they will be charged a lower rate A milder than average winter would lead to fewer sales but at slightly increased rates This way customers do not experience the same bill variability as they would if rates were set before the sales deviations occurred On the other hand the current method does not provide customers with the ability to plan ahead based on a predictable rate for electricity This method has been used for revenue regulation of natural gas utilities55
bull Accrual Method Under the accrual method rates are set based on an assumed sales level and the differences between actual and target revenue are allowed to accrue over some period Then the total difference between actual and target revenue is reconciled through an adjustment to rates in the subsequent period this is known as the true-up process Presently all revenue regulation mechanisms for electric utilities use the accrual method56
If regulators use the accrual method of revenue
regulation they will next need to determine the period over which the difference between actual and target revenue will be allowed to accrue One year is typical however shorter periods are also used Next the frequency of comparing collected revenue to target revenue should be determined It is possible to do this comparison only once at the end of the accrual period It is common however for comparisons to occur more frequently often monthly When revenues are compared within the accrual period the differences are tracked generally for the purpose of applying interest to the difference that will be deferred until the end of the accrual period
Rate AdjustmentsIn designing a revenue regulation mechanism there are a
number of decision points that regulators need to consider to balance the interests of all the stakeholders One of the decision points revolves around the determination of the mechanism used to adjust rates The issues that regulators need to consider include the following1 Rate Case Requirements One of the often-mentioned
concerns about surcharges especially when they are numerous is how that will impact the frequency of rate cases For regulators and stakeholders rate cases provide
Decoupling Case Studies Revenue Regulation Implementation in Six States
30
the best mechanism to correctly align rates and costs but they are time-consuming and expensive for all parties This is because a rate case presents an opportunity to closely examine all of the utilityrsquos expenses and adjust rates to reflect cost increases and decreases Because under a revenue regulation mechanism the goal is to match revenues received from all customers with revenue requirements a correct determination of revenue requirements is important as is the specification of appropriate cost indices to adjust the revenue requirements As the time between rate cases increases some regulators feel the base rate case data even with adjustments need to be reexamined As a result some regulators have chosen to mandate the frequency of rate cases to address this whereas others have not It may be that in some cases where there are numerous surcharges recovering a multitude of costs there may not be as many costs subject to review in the rate case making it less significant to a regulator than a case in which most costs are being analyzed and recovered in the rate case itself
2 Collection Mechanism Integrally tied to the mechanism for recovering revenues is how the utility will collect or refund the revenues Options that are available include recovery through a rate case or periodic adjustments to rates through a surcharge mechanism As can be seen by the case studies depending on the plan in place some utilities have very discreet requirements dictating the frequency of rate cases with adjustments occurring in those cases or between those cases Other utilities have no requirements upon them with respect to the frequency of rate case filings This will be discussed in more detail below What does emerge from these case studies is that the discreet components or choices in how to execute a revenue regulation plan are carefully interwoven to create a holistic approach Each component works with the other and the value of this case study is in examining the different pathways that can be chosen As discussed previously some of the commissions have authorized revenue regulation to recover the revenue requirements in the last rate case whereas others have authorized adjustments to rates between rate cases this impacts the pathway that the adjustment mechanism takes
3 Timing How often should rates be adjusted to true up to the utilityrsquos revenue requirement States have chosen different options ranging from monthly to annually
4 Allocation of Revenue Regulation Revenue Surpluses or Deficits There are a number of decision points regarding allocation Should the revenue regulation apply to all rate classes or just the smaller customers whose usage per customer and load variations are not as dramatic as those of larger-use customer classes Should there be a different allocation to each rate class or should the allocation of costs among the classes be the same Different mechanisms accomplish different goals Some states have allocated revenue regulation revenues based on the revenues lost by customer class as a result of energy efficiency This can sometimes be a political decision to mitigate opposition to energy efficiency programs by large customers Other states recognize that the system savings resulting from energy efficiency benefit all customers so that all customers should pay equally
5 Carrying Charges Depending on the timing issue discussed previously regulators may want to consider carrying charges on any adjustments This should be symmetrical in its application however so that it applies to surcharges and refunds Consideration should be given for the basis of the carrying charge rate whether weighted average cost of capital rate of return a risk-free rate or some other mechanism should be adopted
6 Rate Caps In order to mitigate potential rate impacts a regulator may want to consider a cap on how much rates can go up when the revenue regulation adjustment is made This might be more critical if the regulator is aware of other potential rate increases that will impact customersrsquo bills If a cap is used the case in which the utilityrsquos adjustment would exceed the cap must be considered Some regulators have opted to allow the utility to carry over the excess unrecovered amount for a period of years whereas others do not This allows the utility to recover those revenues in a subsequent year when perhaps the adjustment is less As a practical matter however adjustments of greater than three percent are less common as shall be discussed later
7 Impact on At-Risk Consumers Low-income and consumer advocates have expressed concern about revenue regulation as a vehicle for annual rate increases without the scrutiny of a general rate case creating rate increases for the low-use customers doing the most to constrain usage and help achieve targeted energy savings One proposal to address this has been to impose any resulting surcharges only to above-average usage
Decoupling Case Studies Revenue Regulation Implementation in Six States
31
57 Cavanagh and Howat (2012 May 2) Finding common ground between consumer and environmental advocates Electricity Policy
58 The most common criticism of future test years is that utilities forecast costs under an assumption that all authorized personnel positions will be filled while in retrospect any large organization has some level of vacancy in its employee count A historic test year captures this effect fully
customers and any resulting credits only to below-average usage57
Rate Case RequirementRequirements as to the frequency of rate cases can be
tied to the recovery mechanism or to the entire regulatory framework for implementing revenue regulation In the cases studied two of the utilities require periodic rate cases PGampE every three years and WPS every year Two others National Grid and HECO require annual mini rate cases explained later in which adjustments are made and two others IPC and BGE have no requirements for scheduled rate cases Nevertheless if the concern is to ensure that the utilityrsquos revenue recovery meets its revenue requirements some kind of periodic rate case to examine costs is appropriate Having periodic rate cases can provide a measure of assurance to consumer advocates that the level at which the revenues and hence the rates are set is correct One of the criticisms of revenue regulation is in fact the lack of rate cases to produce a proper level of confidence in the allowed amounts Multiple surcharges are usually additive to existing rates therefore not permitting an opportunity to reduce the base rate for reductions in cost Moreover the infrequency in cases impedes the examination of rate allocations as would occur through a cost of service study
This is a particular issue where utilities are augmenting power supply with purchased power from independent power producers which is the most common method for acquiring wind and solar production today The increased cost for purchased power may flow through a fuel and purchased power adjustment mechanism while the (depreciating) investment in conventional power plants remains static in base rates
Both PGampE and WPS use a future test year that allows the utility to project revenue requirements during the time period that the rates are to be in effect The benefit to this is that it can help identify and account for projected changes in costs over the timeframe between rate cases However given that these costs are utility projections most consumer advocates have less confidence in these numbers than they would using actual numbers from a historical or only hybrid test year58 When trying to garner support for revenue regulation from more skeptical stakeholders using a future test year may not be helpful Furthermore in the case of WPS that has annual rate cases using a future test year becomes less justifiable as revenues are recalculated annually anyway
The absence of a rate case requirement can also cause consternation among detractors of revenue regulation because of the belief that the utility will be guaranteed its revenue requirements for as long as it is satisfied with that level irrespective of how well it manages However this is no different from the status quo in traditional regulation in most places The incentive to manage well is always there with or without revenue regulation as it translates into more profit for the utility
In the cases of HECO and National Grid the mini rate cases serve two purposes In the one instance it serves as a means to reconcile revenue recovery with revenue requirements and in the second instance it provides an opportunity to adjust rates in accordance with changes in costs Specifically for National Grid the revenue requirement is adjusted to reflect capital expenditures For HECO revenues are adjusted to reflect changes in the cost of service In the two examples here revenue regulation is wrapped in with other adjustments as part of a mini adjustment Given the structure for determining revenue requirements which accounts for changes in costs including revenue regulation within the mini rate cases is a workable option
These examples highlight how rate cases can be used to adjust revenue requirements either in a more controlled regulatory environment with frequent rate cases or left to the utilityrsquos discretion to decide when to adjust costs A set schedule of periodic rate cases such as that used by PGampE may strike an appropriate balance for reviewing revenue requirements however with the modification of a partial historical partial forecasted test year Frequent rate cases can depending on the resources of the regulator and stakeholders be too costly and time-intensive When there are too many rate cases stakeholders and regulators may not be able to dedicate the level of resources needed for any one proceeding and may be spread too thin Regular known rate cases at reasonable intervals may strike the best balance of adequate review and adjustment of revenue requirements
Decoupling Case Studies Revenue Regulation Implementation in Six States
32
Collection Mechanism and TimingThe collection mechanism for the differential between
actual and authorized revenue requirements varies by util-ity as well Both PGampE and WPS do not have adjustment clauses or surcharges but instead have structured their revenue regulation plans to recover their costs in a rate case with rates adjusted annually Although PGampE has rate cases every three years the utility files its preliminary forecast every September 1 for the following year including adjust-ments for revenue regulation and other costs This practice promotes transparency keeping all stakeholders aware of the current situation of the utility IPC BGE National Grid and HECO use surcharges on customer bills to collect or credit the difference between actual revenues collected and the revenue requirement Although the other three (IPC National Grid and HECO) calculate the rate adjustment annually only BGE does a more contemporaneous adjust-ment of one month Certainly where there are no regularly scheduled rate cases using an adjustment mechanism becomes more critical PGampE has created a tracking mecha-nism known as a balancing account that allows the utility to track the surpluses and deficits to help ensure accuracy at year end when rates are actually adjusted The creation of such monthly balancing accounts will make it easier at the end of the year to track what happened each month and then determine the adjustment for that year It provides a more detailed trail for review and analysis by stakeholders and regulators However other mechanisms that just look at total revenues as compared to revenue requirements at the end of the year can work as well
Table 7
Rate Case Requirements
Table 8
Rate Adjustments
Table 9
Allocation of Surplus or Deficit
Pacific Gas amp Electric
Idaho Power Company
Baltimore Gas amp Electric
Wisconsin Public Service Corporation
National Grid
Hawaiian Electric Company
Pacific Gas amp Electric
Idaho Power Company
Baltimore Gas amp Electric
Wisconsin Public Service Corporation
National Grid
Hawaiian Electric Company
Pacific Gas amp Electric
Idaho Power Company
Baltimore Gas amp Electric
Wisconsin Public Service Corporation
National Grid
Hawaiian Electric Company
Every three years annual ldquoattritionrdquo adjustments in between
No requirement
No requirement
Annual rate case
Annual capital expenditure adjustment case
Abbreviated annual rate case
Base rates adjusted annually
Annual adjustment through surcharge
Monthly adjustment through surcharge
Annual adjustment through rate case
Annual adjustment
Annual adjustment
Allocated to all customers according to business unit (eg electric distribution electric generation)
Included in the annual adjustment mechanism for each customer class
Separate for each customer class
Allocated to all customers except certain tariffs (see above)
Separate for each customer class
Separate for residential and commercialindustrial
Allocation of Revenue Regulation Revenue Surpluses or Deficits
The allocation of revenue regulation revenue surpluses or deficits should be symmetrical so that overpayments are credited to customers just as underpayments are paid by those same customers The six utilities studied fol-low that formula The application of revenue regulation however varies from utility to utility BGE and IPC ap-ply revenue regulation to the residential and commercial classes thereby excluding industrial customers In contrast however PGampE WPS National Grid and HECO allocate revenue regulation adjustments to all customer classes In terms of how the costs are allocated IPC BGE WPS National Grid and HECO allocate costs differently among the customer classes PGampE however allocates costs uni-formly among the customers Because PGampE has separated its business units it also separately calculates and allocates
Decoupling Case Studies Revenue Regulation Implementation in Six States
33
Table 10
Carrying Charges
Table 11
Cap on Rate Adjustment
Pacific Gas amp Electric
Idaho Power Company
Baltimore Gas amp Electric
Wisconsin Public Service Corporation
National Grid
Hawaiian Electric CompanyPacific Gas amp Electric
Idaho Power Company
Baltimore Gas amp Electric
Wisconsin Public Service Corporation
National Grid
Hawaiian Electric Company
None
Yes
None
Yes at the short-term debt rate
Yes at the customer deposit rate
Yes at the customer deposit rateNo
3 rate cap excess carried over to next period
10 rate cap excess carried over to next period
Cap of $14 million per year
$170 million in CapEx
No
revenue regulation surpluses and deficits among its electric distribution gas distribution and electric generation busi-nesses This illustrates that there are several ways to address revenues from revenue regulation depending on the policy outcomes that are desired
Carrying ChargesCarrying charges applied to uncollected or surplus rev-
enues can be used to account for the time value of money and the lost opportunity or value to having those revenues in hand PGampE and BGE do not accrue carrying charges On the other hand IPC WPS National Grid and HECO do For BGE given that the revenue regulation revenues are reconciled and recovered monthly it would make little sense to include a carrying cost Where carrying costs have been used they have included in the cases of these utili-ties the short-term debt rate or the customer deposit rate which for one utility is six percent and probably close to the short-term debt rate Thus the carrying charge rates are appropriately at the lower end of the spectrum reflecting their short-term nature In the application of the carrying charge symmetry should be preserved by applying it to both deficits and surpluses Application of carrying charges given the short period that costs are carried (one year) is somewhat discretionary Although it does more accurately account for costs it does add a modest level of complica-tion in tracking costs
Rate Caps and CollarsOne of the ways to protect customers in the event of sig-
nificant adjustments is to impose a rate cap (or collar) that limits the amount of a rate increase (and decrease) Some customers are sensitive to changes in foundational costs like utility bills and if costs are going to rise they benefit from a pattern of steady modest increases rather than a large step increase Any structural increases in rates attributable
to reductions in sales or increases in costs recognized by the revenue regulation plan would be eventually included in rates under any system A cap reflects a controlled way to manage customer expectations and customer impacts Structural changes can only be managed for a while until a complete rate case is needed to reset all assumptions
Typically when a rate cap is imposed if the formulaic increase exceeds the cap or collar the utility will be able to carry over any uncollected revenues until the next rate adjustment Two of the utilities studied PGampE and HECO do not have rate caps On the other hand the other four utilities do include rate caps in varying amounts National Grid has a one-percent revenue cap whereas IPC and BGE have a one-percent and a ten-percent rate cap respectively WPS unlike the others has a cap tied to the dollar amount of $14 million as opposed to a percentage Consistent with the goals of revenue regulation all of the utilities studied have a carryover provision that is important for reducing the risk that the utility will not recover its revenue require-ments
Note that National Grid differs from BGE and HECO in that its cap is on revenues whereas the other two utilities cap rates and rate impacts A revenue cap is more focused on ensuring minimal change to the revenue requirements authorized by the commission National Grid as discussed previously allows for mini rate cases to adjust the rev-enue requirements Having the one-percent cap limits the amount of increase that can occur through that process requiring revenue changes that are greater to occur in a full rate case However note also that some of the adjustments allowed in the mini rate case have their own separate cap The IPC rate cap is in line with what many other utilities with caps have in place which generally range from one to three percent The ten-percent rate cap in the BGE plan is
Decoupling Case Studies Revenue Regulation Implementation in Six States
34
59 Morgan P (2012 December) Graceful Systems LLC A decade of decoupling for US energy utilities rate impacts designs and observa-tions p5
reflective of its monthly adjustment pattern An annual ad-justment allows more time to smooth out peaks and valleys in revenues whereas a monthly adjustment will be influ-enced by more of the spikes (particularly weather-driven variation) thus the need for a larger bandwidth for the car-ryover Like a variable energy rate or fuel adjustment clause that fluctuates monthly the monthly adjustment introduces more volatility into the rates
Actual Historical AdjustmentsFor many ratepayer advocates there is a concern that
some of the utility management risk will be transferred to customers as a consequence of a policy that seeks to ensure that the utility will be made whole However the utility re-tains management risk and the requirement to demonstrate that it has acted prudently Thus the utility still has just as much of an incentive to operate efficiently as it did without revenue regulation If the utility can lower its costs it can still increase its profits Second by designing rates symmet-rically such that under- and over-recoveries are reconciled it provides customers with an opportunity to obtain credits that under traditional regulation would be retained by the utility It has often been opined that when there are large
gaps in time between utility rate cases it is because the utility is over-earning and exceeding its revenue require-ments In those instances customers never get to examine what the utility is collecting much less receive a refund Under revenue regulation with its periodic adjustments and scheduled general rate cases the revenue requirements are examined and refunds or credits allocated such that customers have a better knowledge base for understanding the utilityrsquos earnings And annual reconciliation of the util-ityrsquos actual revenues versus authorized revenues provides consumers with a tool to reign in excess revenue recovery beyond authorized amounts Third the adjustments that do occur under revenue regulation are manageable and frequently less than the adjustments customers are used to seeing on their bills for fuel or variable generation rates or for the myriad of other surcharges that can be tacked on to a customerrsquos bill such as an infrastructure (smart grid) sur-charge maintenance upgrade fee regulatory asset charge or system benefit charge
As seen in Figure 1 the range of rate impacts cluster around plus or minus two percent but can at times exceed plus or minus five percent The total of surcharges has somewhat exceeded the total of credits
Figure 1
Total Utility Decoupling Adjustment Rate Impacts59
300
250
200
150
100
50
0
Nu
mber
of
Dec
oup
lin
g A
dju
stm
ents
Over -5 -4 to -5 -3 to -4 -2 to -3 -1 to -2 0 to -1 0 to 1 1 to 2 2 to 3 3 to 4 4 to 5 Over 5
Percentage Rate Impacts
SurchargesRefunds
ResidentialAll
Other
Commercial
Total
Decoupling Case Studies Revenue Regulation Implementation in Six States
35
60 Id p 3
61 Schultz T Energy Efficiency at Idaho Power Available at httpwwwenergyidahogovenergyalliancedida_powerpdf
As can be seen with the utilities studied above the larger fluctuations are attributable to adjustment mechanisms that are reconciled more frequently such as monthly as those are less able to smooth out anomalies as an annual adjust-ment would do From a dollar perspective for the roughly 64 percent of adjustments that fall within the plus or minus two-percent range the monthly bill impact is approxi-mately $230 for average electric customers and $140 for average gas customers60
Of the six utilities studied the fluctuations in adjustment have for the most part stayed within the one- to three-per-cent range as shown below
bull PGampE from 2005 to 2012 has had annual revenue regulation adjustments ranging from minus143 percent to 415 percent with an average adjustment of 197 percent
bull For IPC the adjustments are separated between residential and commercial customers For residential customers the annual adjustments from 2007 through 2011 ranged from 077 percent to 258 percent for an average of 162 percent As for the commercial customers the annual adjustments for that same period were higher ranging from 104 percent to 424 percent with an average adjustment of 252 percent
bull BGE has monthly adjustments that ranged from minus1853 percent to 3013 percent with an average of 057 percent for residential customers from March 2008 through August 2012 For General Service Customers the monthly adjustment ranged from minus2264 percent to 2462 percent The average adjustment was 1308 percent
bull For WPS the annual adjustments from 2009 through 2011 ranged from minus145 percent to 378 percent for residential and small commercial and from minus314 percent to 899 percent for commercial Note that because of a $14 million per year cap some of these percentages were carried over The average annual adjustment for residential and small commercial and for commercial was 163 percent and 215 percent respectively with carry-overs to subsequent years
bull For Massachusetts Electric and Nantucket Electric both of which operate under National Grid the annual revenue regulation adjustment for all for 2011 and 2012 was minus0105 percent and 0315 percent for an average revenue regulation adjustment over the two years of 0105 percent
bull HECO like National Grid has one annual revenue
regulation mechanism for its customers which resulted in adjustments in 2011 and 2012 of 063 percent and 107 percent respectively for an average adjustment of 085 percent
As can be gleaned from the above information the range of average adjustments for small use customers was a low of 0105 percent for National Grid to a high of 197 percent for PGampE For larger use customers the range was a low of 0105 percent for National Grid to a high of 252 percent for IPC This demonstrates that on average for these utilities with well-developed and diversely designed revenue regula-tion proposals their adjustments on average stayed at or below approximately 25 percent
One of the metrics for determining if a revenue regula-tion program is working successfully that was discussed above was the impact on rates of a revenue regulation mechanism As can be seen by the analysis of the adjust-ment levels for each of the utilities they are within a rea-sonable range
Complementary Policies Although a revenue regulation mechanism does not need
to be accompanied by other policies energy efficiency is frequently at the root of the reason revenue regulation was proposed in the first place The states examined in this pa-per have various obligations for energy efficiency achieve-ment placed upon their utilities Only Idaho does not have an Energy Efficiency Resource Standard but energy efficiency objectives are developed through an integrated resource plan process Energy efficiency spending at IPC has increased dramatically in recent years61
In recognition of the fact that revenue regulation only removes the disincentive to pursue energy efficiency several states have instituted some form of incentives to reward the desired outcome This mechanism can not only incentivize management to aggressively pursue energy efficiency but also make shareholders supportive in the face of lost invest-ment opportunity
Rate design can also play an important part in assist-ing the utility in achieving favorable energy efficiency outcomes Inclining block rates penalize inefficient use of electricity and shorten payback times from the customer perspective Because efficiency reduces consumption at
Decoupling Case Studies Revenue Regulation Implementation in Six States
36
62 Optional rate designs for PGampE include TOU and Peak Time Pricing
63 IPC also has an optional TOU rate design
64 Optional rate designs for this utility include TOU Critical Peak Pricing and Contract
65 National Grid also offers optional TOU and flat rate designs
66 HECO also offers optional TOU and flat rate designs
67 See eg Alexander B (1996 April) How to construct a service quality index in performance-based ratemaking Electricity Policy
the tail block rate the value of kWh savings is greater than with flat rates On the other side of the spectrum declining block rates which have a reduced rate in the tail block do little to encourage conservation In fact they operate more like a discounted bulk rate by reducing the average cost of a kWh in a customerrsquos bill for the more kWh used
Performance incentives or other ways to avoid destruc-tive cost-cutting in the name of creating margins that reduce service or reliability or lessen customer value have been implemented only in Massachusetts of the six utilities illustrated here Several other states have implemented vari-ous schemes in reaction to perceived deficiencies in utility service67 Performance incentives are not unique to rev-enue regulation Commissions wishing to implement such a scheme can find many models of incentive reward and penalty mechanisms developed for other purposes
Taken together a suite of policy and program features can create an atmosphere that is conducive to achievement of energy efficiency goals within the utility and for the customers By appropriate application of these techniques regulators working with utilities and stakeholders can remove barriers and create an opportunity for energy ef-ficiency to be fully integrated into the utility supply option portfolio
Energy Efficiency OutcomesAlthough revenue regulation itself does not create an
incentive for a utility to implement energy efficiency it does address the issue of lost revenues associated with energy
Table 12
Complementary Policies for Energy Efficiency
Pacific Gas amp Electric62
Idaho Power Company63
Baltimore Gas amp Electric
Wisconsin Public Service Corporation64
National Grid65
Hawaiian Electric Company66
Energy Efficiency Requirement
1 annually
IRP
10 by 2015
075 annually
24 annually
Energy efficiency can satisfy portion of RPS
Default Residential Rate Design
Inclining block
Inclining block
TOU seasonal
Flat
Inclining block
Inclining block
Incentive Structure
Risk reward incentive mechanism
No
No
No
5 of program costs
Third-party administrator paid for contract performance
Performance Incentives
Reliability reporting only
None
Under consideration
Reliability reporting only
Service quality reward and penalty
Under consideration
efficiency and DG programs Revenue regulation should be combined with other mechanisms that require or incentiv-ize the implementation of energy efficiency by the utility or a third party The level of energy efficiency achieved can be one measure of the success of a revenue regulation mechanism as implemented in a larger program designed to achieve energy efficiency Table 13 shows the incremental annual energy efficiency savings reported by each utility with the shaded box indicating the year that the utilityrsquos revenue regulation mechanism was implemented National Grid had achieved a high level of energy efficiency savings in the years before it implemented revenue regulation
This paper has not evaluated DG outcomes to correlate with revenue regulation as it is not perceived that states and utilities have made that connection expressly in histori-cal mechanisms However it is expected that this connec-
Decoupling Case Studies Revenue Regulation Implementation in Six States
37
68 EIA Form EIA-861 data files Available at httpwwweiagovelectricitydataeia861
69 PGampE began revenue regulation in 1974 and it was later suspended and recommenced in 2001
70 WPS savings are represented by the statewide program savings from the Focus on Energy program WPS provided additional funds to Focus on Energy starting in CY10 through their territory-wide program activities
71 In 2009 Hawaii Energy a ratepayer-funded statewide energy efficiency provider began delivering services Savings reported after 2009 represent savings achieved through the programs of Hawaii Energy
Table 13
Annual Incremental Energy Efficiency Savings as Percentage of Retail Sales68
Highlighted cells are the year that utility started decoupling
Pacific Gas amp Electric69
Idaho Power Company
Baltimore Gas amp Electric
Wisconsin Public Service Corporation70
National Grid
Hawaiian Electric Company71
2004
11
01
00
03
11
00
2005
16
03
00
03
09
05
2006
10
05
00
03
12
05
2010
19
13
17
09
136
12
tion will be made in future mechanisms and furthermore it is anticipated that follow on work to this paper will want to study that connection between revenue regulation and DG performance
Conclusions
An increasing number of states are looking to increase the rate of energy efficiency investments for their long-run cost and risk advantages The benefits of energy efficiency include not only its ability to reduce system costs across the distribution transmission and generation functions but also the opportunity for customers to reduce their individ-ual energy costs for their own electric bills Nevertheless it is counterintuitive to encourage or order a utility to sell less of its product In order to encourage the proliferation of en-ergy efficiency programs as a solution that can contribute to this nationrsquos energy needs this tension between the goals of society versus the goals of the utility needs to be addressed Revenue regulation can be such a solution by removing the link between sales and revenues
There are many ways to implement revenue regulation and multiple decision points that regulators must consider in designing a revenue regulation mechanism This paper focused on six utilities each of which implemented revenue regulation in different ways in accordance with the objectives of that state Different decision points discussed include
bull Should revenue regulation apply to all functions (generation transmission and distribution) which sometimes depends on if the utility is regulated or restructured
bull Should revenue regulation apply to all customer classes
bull Should there be symmetry such that a reconciliation adjustment occurs for both over- and under-recoveries of the revenue requirements
bull Should recovery of indicated surcharges be conditioned on acceptable performance on customer service quality or energy efficiency goals
bull Should there be an attrition adjustment to account for other expenses or should the revenue regulation adjustment be limited to reconciling existing revenue requirements
bull Should there be an inflation adjustmentbull To calculate the revenue requirements should the
current or accrual method be usedbull Should the adjustments be made in rate cases or
through a riderbull How frequently should adjustments be made
monthly annually or some other time periodbull Depending on the period of time between true up and
recovery should there be carrying charges and if so how should they be calculated
2007
21
06
00
03
09
04
2008
35
10
05
09
05
05
2009
20
11
06
10
11
11
Decoupling Case Studies Revenue Regulation Implementation in Six States
38
72 Avista Utilities (2009) Washington Utilities and Transportation Commission Docket UE-090134
bull Should there be a requirement authorizing the frequency of rate case
bull Should there be an annual cap on the amount of the adjustment and if so should there be an opportunity to carry over any additional amounts and for how many years
bull Should there be an adjustment to the cost of capital to reflect the reduced risk
Other considerations for regulators whether or not they implement revenue regulation but certainly as part of a comprehensive package are other measures that can be put in place to encourage consumers and utilities alike to actively participate in energy efficiency For example an inclining block rate structure by virtue of its incentive to consume less pairs well with an energy efficiency program helps drive consumers to participate in efficiency programs and accelerates the payback of an energy efficiency investment By the same token an incentive payment to the utility helps provide its management with a good reason to excel and exceed targets for energy efficiency programs
A key point illustrated by the list of considerations above is that there is not just one static way to design and implement revenue regulation but rather there are a variety of options for doing so In this study a diverse group of utilities were reviewed The differences among the utilities included geographic diversity vertically integrated and restructured utilities different levels of energy efficiency in place and certainly differences in how the revenue regulation mechanisms were implemented No two utilities were alike and no two utilities had the same revenue regulation mechanism The key is that revenue regulation should eliminate the throughput incentive but the means for accomplishing this goal can vary and be tailored to each jurisdiction and each utility and still be successful
There are several considerations in the design of a revenue regulation mechanism that can help ensure its successful adoption To begin revenue regulation should be granted to utilities only as a precondition to implementing comprehensive energy efficiency andor DG policies Unless accompanied by a commitment to engage in providing least-cost resource options that could impact sales there is not really any good policy reason for its adoption All of the utilities studied are actively engaging in energy efficiency Furthermore as a matter of fairness the revenue regulation mechanism should be symmetrical so that any revenues above those authorized are refunded back to consumers As Figure 1 demonstrates although there are more surcharges to customers there is nevertheless a healthy amount of
credits back to consumers This is the bargain Barring imprudence or other unforeseen circumstances the utility receives its authorized revenue requirements and nothing more or less under a simple revenue regulation mechanism
Rate design plays an important role in the effectiveness of energy efficiency in concert with revenue regulation A low customer charge is preferable so that the customer can benefit from real bill reductions tied to reduced volumetric consumption Reductions in consumption not only reduce bills but also positively impact the payback period for investments in energy efficient appliances Declining block rates in which the tail block rate is lower than the first tier also do not encourage conservation Inclining block rates that reward low usage in the first block with a lower rate send the better price signals None of the six utilities studied had declining block residential rates They were inclining flat and time-varying
The revenue adjustment mechanism is also a critical decision point in terms of whether a revenue per customer mechanism is adopted that accounts for only the current revenue requirements or whether latitude is given to include an inflation adjustment or other cost increases in the revenue adjustment mechanism Three of the utilities studied adopted this approach whereas another two used a hybrid approach Finally to reduce volatility five of the six utilities opted for annual rather than monthly adjustments thereby creating a level of rate stability that customers in general prefer
Once the goals for revenue regulation are set by the regulators the next step is to design programs that will implement that goal For energy efficiency to be as successful as possible regulators may want to adopt a complement of other policies to accompany revenue regulation These can include rate designs that reward reduced use and conservation as well as incentive payments to utilities that reward them for meeting or exceeding targets Of the six utilities studied three have adopted some form of incentive One simple approach that was used in Washington was to link recovery of any surcharges under the revenue regulation mechanism to achievement of energy efficiency targets72
For the utilities examined above that have implemented revenue regulation the evidence demonstrates that revenue regulation as a strategy and a mechanism to enable
Decoupling Case Studies Revenue Regulation Implementation in Six States
39
energy efficiency has been working well The fact that each revenue regulation mechanism varies from the next demonstrates that there are many different paths that can be followed in implementing revenue regulation based on the needs of the utility and its stakeholders in a particular
region This study demonstrates that revenue regulation does work and provides examples of how it can be implemented each one different and unique because of the number of decision points to be considered in designing a revenue regulation mechanism
Decoupling Case Studies Revenue Regulation Implementation in Six States
40
Appendix
Historic Rate Adjustments
Table 14
PGampE Revenue Regulation Rate Adjustments 1983 to 199373
Table 15
PGampE Revenue Regulation Adjustments 2005 to 201274
Table 16
IPC Revenue Regulation Adjustments76
Idaho Power Company
1983 23
1984 (34)
1985 (48)
1986 19
1987 21
1988 50
1989 (43)
1990 (54)
1991 39
1992 34
1993 00
2005 8925 minus12773 minus143
2006 9933 2246 226
2007 10409 21727 209
2008 10261 4032 039
2009 11169 10355 093
2010 11224 46556 415
2011 10306 38390 373
2012 11032 40304 365
2007 Residential minus00457 590 minus077
Commercial minus00457 428 minus107
2008 Residential 00529 670 090
Commercial 00529 510 104
2009 Residential 01220 770 158
Commercial 01535 603 255
2010 Residential 01800 785 229
Commercial 02273 613 371
2011 Residential 02028 785 258
Commercial 02597 613 424
Revenue Regulation Adjustment as of
Total Rates
Delivery Revenue
Requirement ($ millions)
Adjustment Rate
Revenue Regulation Adjustment($ millions)
Retail Rate
of Delivery Revenue
Revenue Regulation Adjustment
Year
Year
73 Lesh P (2009 June 30) Rate impacts and key design elements of gas and electric utility decoupling
74 Morgan P (2012 November) A decade of decoupling for US energy utilities rate impacts designs and observations
75 Morgan P (2012 November) A decade of decoupling for US energy utilities rate impacts designs and observations
76 All numbers provided by the utility
Decoupling Case Studies Revenue Regulation Implementation in Six States
41
77 Idaho Power Company Case No IPC-E-11-19- fixed cost adjustment permanent mechanism Available at httpwwwpucidahogovinternetcaseselecIPCIPCE1119company20120928COMPLIANCE20FILINGPDF
Figure 2
IPC Revenue Regulation Adjustments77
Residential FCA Balance and Use per Customer
$10000000
$8000000
$6000000
$4000000
$2000000
$0
-$2000000
-$4000000
-$6000000
1080
1070
1060
1050
1040
1030
1020
1010
1000Res
idu
al A
uth
oriz
ed F
CA
Am
oun
t
Residual Authorized FCA Amount ($)
Monthly Use Per Customer (kWh)
kW
h U
sed
2006 2007 2008 2009 2010 2011
78 Morgan P (2012 November) A decade of decoupling for US energy utilities rate impacts designs and observations
Decoupling Case Studies Revenue Regulation Implementation in Six States
42
Table 17a
Baltimore Gas and ElectricBGE Monthly Revenue Regulation Adjustments 2008 to 201278
Table 17b
Baltimore Gas and ElectricBGE Monthly Revenue Regulation Adjustments 2008 to 201278
March Residential 000172 01477 1165General Service 000230 01526 1507
April Residential 000016 01477 0108General Service 000146 01526 0957
May Residential 000066 01477 0447General Service 000230 01526 1507
June Residential minus000066 01477 minus0447General Service 000230 01526 1507
July Residential 000158 01477 1070General Service 000230 01526 1507
August Residential minus000040 01477 minus0271General Service 000214 01526 1402
September Residential 000237 01477 1605General Service 000230 01526 1507
October Residential 000237 01477 1605General Service 000143 01526 0937
November Residential 000237 01477 1605General Service 000140 01526 0917
December Residential 000445 01477 3013General Service 000230 01526 1507
January Residential 000035 01579 0222General Service minus000073 01346 minus0542
February Residential 000025 01579 0158General Service 000230 01346 1709
March Residential minus000237 01579 minus1501General Service 000230 01346 1709
April Residential minus000237 01579 minus1501General Service 000230 01346 1709
May Residential 000234 01579 1482General Service 000132 01346 0981
June Residential 000237 01579 1501General Service 000230 01346 1709
July Residential 000237 01579 1501General Service 000230 01346 1709
August Residential 000237 01579 1501General Service 000190 01346 1412
September Residential 000237 01579 1501General Service 000230 01346 1709
October Residential 000237 01579 1501General Service 000124 01346 0921
November Residential 000237 01579 1501General Service 000230 01346 1709
December Residential 000156 01579 0988General Service 000204 01346 1516
Adjustment $kWh
Adjustment $kWh2008 2009
Retail Rate
$kWh
Retail Rate
$kWhAdjustment
Adjustment
Decoupling Case Studies Revenue Regulation Implementation in Six States
43
Table 17c
Baltimore Gas and ElectricBGE Monthly Revenue Regulation Adjustments 2008 to 201278
Table 17d
Baltimore Gas and ElectricBGE Monthly Revenue Regulation Adjustments 2008 to 201278
January Residential 000203 01465 1386General Service 000230 01261 1824
February Residential minus000142 01465 minus0969General Service 000230 01261 1824
March Residential minus000237 01465 minus1618General Service 000230 01261 1824
April Residential minus000237 01465 minus1618General Service 000230 01261 1824
May Residential 000192 01465 1311General Service 000230 01261 1824
June Residential 000191 01465 1304General Service 000230 01261 1824
July Residential 000095 01465 0648General Service 000230 01261 1824
August Residential minus000176 01465 minus1201General Service 000224 01261 1776
September Residential minus000237 01465 minus1618General Service 000116 01261 0920
October Residential minus000237 01465 minus1618General Service 000081 01261 0642
November Residential minus000237 01465 minus1618General Service 000098 01261 0777
December Residential minus000079 01465 minus0539General Service 000229 01261 1816
January Residential minus000130 01365 minus0952General Service 000230 01156 1990
February Residential minus000253 01365 minus1853General Service minus000020 01156 minus0173
March Residential minus000018 01365 minus0132General Service minus000063 01156 minus0545
April Residential 000110 01365 0806General Service minus000262 01156 minus2266
May Residential 000010 01365 0073General Service minus000160 01156 minus1384
June Residential 000226 01365 1656General Service 000042 01156 0363
July Residential 000253 01365 1853General Service 000209 01156 1808
August Residential minus000007 01365 minus0051General Service minus000157 01156 minus1358
September Residential minus000253 01365 minus1853General Service minus000177 01156 minus1531
October Residential 000228 01365 1670General Service 000262 01156 2266
November Residential minus000059 01365 minus0432General Service 000262 01156 2266
December Residential 000071 01365 0520General Service 000262 01156 2266
Adjustment $kWh
Adjustment $kWh2010 2011
Retail Rate
$kWh
Retail Rate
$kWhAdjustment
Adjustment
Decoupling Case Studies Revenue Regulation Implementation in Six States
44
Table 17e
Baltimore Gas and ElectricBGE Monthly Revenue Regulation Adjustments 2008 to 201278
January Residential 000253 01291 1960General Service 000262 01064 2462
February Residential 000253 01291 1960General Service 000262 01064 2462
March Residential 000253 01291 1960General Service 000262 01064 2462
April Residential 000253 01291 1960General Service 000262 01064 2462
May Residential 000253 01291 1960General Service 000262 01064 2462
June Residential 000253 01291 1960General Service 000262 01064 2462
July Residential 000253 01291 1960General Service 000262 01064 2462
August Residential 000253 01291 1960General Service 000160 01064 1504
Adjustment $kWh2012
Retail Rate
$kWhAdjustment
Decoupling Case Studies Revenue Regulation Implementation in Six States
45
79 Morgan P (2012 November) A decade of decoupling for US energy utilities rate impacts designs and observations
80 Morgan P (2012 November) A decade of decoupling for US energy utilities rate impacts designs and observations
Table 18
Wisconsin Public Service Corporation Revenue Regulation Adjustments 2009 to 201179
2009 ResidentialSmall Commercial 00048705 000168154 01290 378 130Commercial 00084951 000293293 00945 899 310
2010 ResidentialSmall Commercial 00033043 000166936 01291 256 129Commercial 00056630 000286103 09460 060 030
2011 ResidentialSmall Commercial (00018666) $ (000163719) 01288 minus145 minus127Commercial (00032565) $ (000285629) 01037 minus314 minus275
Derived Adjustment
$kWh
Derived Adjustment Capped $
kWh
Retail Rate
$kWh
Revenue Regulation Actual
Revenue Regulation Capped
Table 19
National Grid Revenue Regulation Adjustments 2011-201276
Massachusetts Electric and Nantucket Electric
Table 20
Hawaiian Electric Company
2011 All minus0015 1429 minus0105
2012 All 0044 1396 0315
2011 01995 3149 063
2012 03894 3641 107
Revenue Regulation Adjustment
centkWh
Revenue Regulation Adjustment
centkWhRetail Rate
centkWh
Retail Rate
Revenue Regulation Adjustment
Revenue Regulation
ldquoThe 2011 adjustment took effect June 1 but was reduced to $0 on July 26 2011 when the Commission granted HECO an interim rate increase of $532 million in a 2011 test year general rate case The 2012 Adjustment runs from June 1 2012 through May 31 2013 About 25 of the total relates to the portion of the decoupling mechanism that updates OampM and rate baserdquo (Morgan 2013)
Decoupling Case Studies Revenue Regulation Implementation in Six States
46
Revenue Regulation and Decoupling A Guide to Theory and Applicationhttpwwwraponlineorgdocumentdownloadid902
This guide was prepared to assist anyone who needs to understand both the mechanics of a regulatory tool known as decoupling and the policy issues associated with its use This would include public utility commissioners and staff utility management advocates and others with a stake in the regulated energy system While this guide is somewhat technical at points we have tried to make it accessible to a broad audience to make comprehensible the underlying concepts and the implications of different design choices This guide includes a detailed case study that demonstrates the impacts of decoupling using different pricing structures (rate designs) and usage patterns
Pricing Dorsquos and Donrsquots Designing Retail Rates as if Efficiency Countshttpwwwraponlineorgdocumentdownloadid939
Rate design is a crucial element of an overall regulatory strategy that fosters energy efficiency and sends appropriate signals about efficient system investment and operations Rate design is also fully under the control of state regulators Progressive rate design elements can guide consumers to participate in energy efficiency programs and reduce peak demand yet relatively few utilities and commissions have implemented many of these elements This RAP paper identifies some best practices Because pricing issues tie closely to utility growth incentives we also address revenue decoupling
A Decade of Decoupling for US Energy Utilities Rate Impacts Designs and Observationshttpwwwraponlineorgdocumentdownloadid6356
This report written by Pamela Morgan of Graceful Systems LLC builds on a 2009 report Now covering 25 states including 49 LDCs and 24 electric utilities this report summarizes the decoupling mechanism designs these utilities use and the rate adjustments they have made under those mechanisms In total this report estimates the retail rate impacts of 1244 decoupling mechanism adjustments since 2005
Additional Resources
The Role of Decoupling Where Energy Efficiency is Required by Lawhttpwwwraponlineorgdocumentdownloadid275
This Issuesletter gives an overview of energy efficiency resource standards the need to decouple utility profits from utility sales and explains why decoupling is needed even where a third party administers energy efficiency programs
Revenue Decoupling Standards and Criteria A Report to the Minnesota Public Utilities Commissionhttpwwwraponlineorgdocumentdownloadid850
In 2007 the Minnesota legislature enacted a new statute Section 216B2412 in which it defined an alternative approach to utility regulation decoupling and directed the Public Utilities Commission (PUC) to ldquoestablish criteria and standardsrdquo by which decoupling could be adopted for the statersquos rate-regulated utilitiesTo fulfill its obligation to develop criteria and standards for decoupling the PUC sought the advice of the Regulatory Assistance Project (RAP) This report is the output of that collaboration
Designing Distributed Generation Tariffs Wellhttpwwwraponlineorgdocumentdownloadid6898
Improvements in distributed generation economics increasing consumer preference for clean distributed energy resources and a favorable policy environment in many states have combined to produce significant increases in distributed generation adoption in the United States Regulators are looking for the well-designed tariff that compensates distributed generation adopters fairly for the value they provide to the electric system compensates the utility fairly for the grid services it provides and charges non-participating consumers fairly for the value of the services they receive This paper offers regulatory options for dealing with distributed generation The authors outline current tariffs and ponder what regulators should consider as they weigh the benefits costs and net value to distributed generation adopters non-adopters the utility and society as a whole The paper highlights the importance of deciding upon a valuation methodology so that the presence or absence of cross-subsidies can be determined Finally the paper offers rate design and ratemaking options for regulators to consider and includes recommendations for fairly implementing tariffs and ratemaking treatments to promote the public interest and ensure fair compensation
Decoupling Case Studies Revenue Regulation Implementation in Six States
47
The Regulatory Assistance Project (RAP)trade is a global non-profit team of experts focused on thelong-term economic and environmental sustainability of the power sector We provide technical and policy assistance on regulatory and market policies that promote economic efficiency environmental protection system reliability and the fair allocation of system benefits among consumers We work extensively in the US China the European Union and India Visit our website at wwwraponlineorg to learn more about our work
Rate Design Where Advanced Metering Infrastructure Has Not Been Fully Deployedhttpwwwraponlineorgdocumentdownloadid6516
This paper identifies sound practices in rate design applied around the globe using conventional metering technology Rate design for most residential and small commercial customers (mass market consumers) is most often reflected in a simple monthly access charge and a per-kWh usage rate in one or more blocks and one or more seasons A central theme across the practices highlighted in this paper is that of sending effective pricing signals through the usage-sensitive components of rates in a way that reflects the character of underlying long-run costs associated with production and usage While new technology is enabling innovations in rate design that carry some promise of better capturing opportunities for more responsive load the majority of the worldrsquos electricity usage is expected to remain under conventional pricing at least through the end of the decade and much longer in some areas Experience to date has shown that the traditional approaches to rate design persist well after the enabling technology is in place that leads to change
Time-Varying and Dynamic Rate Designhttpwwwraponlineorgdocumentdownloadid5131
This report discusses important issues in the design and deployment of time-varying rates The term time-varying rates is used in this report as encompassing traditional time-of-use rates (such as time-of-day rates and seasonal rates) as well as newer dynamic pricing rates (such as critical peak pricing and real time pricing) The discussion is primarily focused on residential customers and small commercial customers who are collectively referred to as the mass market The report also summarizes international experience with time-varying rate offerings
50 State Street Suite 3Montpelier Vermont 05602802-223-8199wwwraponlineorg
- Table of Contents
- Introduction
- California Pacific Gas and Electric Company
- Idaho Idaho Power Company
- Maryland Baltimore Gas and Electric
- Wisconsin Wisconsin Public Service Corporation
- Massachusetts National Grid
- Hawaii Hawaiian Electric Company
- Discussion of the Six Utilities Overall
- Conclusions
- Appendix
- Additional Resources
-
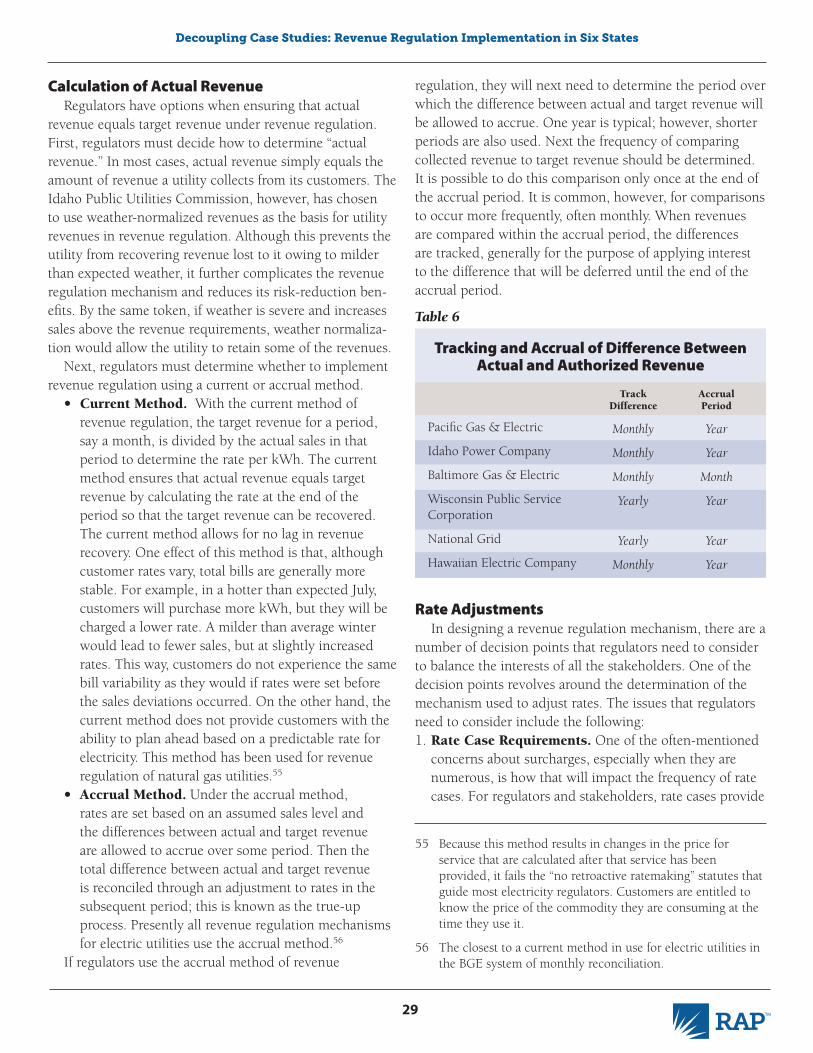
Decoupling Case Studies Revenue Regulation Implementation in Six States
29
55 Because this method results in changes in the price for service that are calculated after that service has been provided it fails the ldquono retroactive ratemakingrdquo statutes that guide most electricity regulators Customers are entitled to know the price of the commodity they are consuming at the time they use it
56 The closest to a current method in use for electric utilities in the BGE system of monthly reconciliation
Table 6
Tracking and Accrual of Difference BetweenActual and Authorized Revenue
Pacific Gas amp Electric
Idaho Power Company
Baltimore Gas amp Electric
Wisconsin Public Service Corporation
National Grid
Hawaiian Electric Company
Track Difference
Monthly
Monthly
Monthly
Yearly
Yearly
Monthly
Accrual Period
Year
Year
Month
Year
Year
Year
Calculation of Actual RevenueRegulators have options when ensuring that actual
revenue equals target revenue under revenue regulation First regulators must decide how to determine ldquoactual revenuerdquo In most cases actual revenue simply equals the amount of revenue a utility collects from its customers The Idaho Public Utilities Commission however has chosen to use weather-normalized revenues as the basis for utility revenues in revenue regulation Although this prevents the utility from recovering revenue lost to it owing to milder than expected weather it further complicates the revenue regulation mechanism and reduces its risk-reduction ben-efits By the same token if weather is severe and increases sales above the revenue requirements weather normaliza-tion would allow the utility to retain some of the revenues
Next regulators must determine whether to implement revenue regulation using a current or accrual method
bull Current Method With the current method of revenue regulation the target revenue for a period say a month is divided by the actual sales in that period to determine the rate per kWh The current method ensures that actual revenue equals target revenue by calculating the rate at the end of the period so that the target revenue can be recovered The current method allows for no lag in revenue recovery One effect of this method is that although customer rates vary total bills are generally more stable For example in a hotter than expected July customers will purchase more kWh but they will be charged a lower rate A milder than average winter would lead to fewer sales but at slightly increased rates This way customers do not experience the same bill variability as they would if rates were set before the sales deviations occurred On the other hand the current method does not provide customers with the ability to plan ahead based on a predictable rate for electricity This method has been used for revenue regulation of natural gas utilities55
bull Accrual Method Under the accrual method rates are set based on an assumed sales level and the differences between actual and target revenue are allowed to accrue over some period Then the total difference between actual and target revenue is reconciled through an adjustment to rates in the subsequent period this is known as the true-up process Presently all revenue regulation mechanisms for electric utilities use the accrual method56
If regulators use the accrual method of revenue
regulation they will next need to determine the period over which the difference between actual and target revenue will be allowed to accrue One year is typical however shorter periods are also used Next the frequency of comparing collected revenue to target revenue should be determined It is possible to do this comparison only once at the end of the accrual period It is common however for comparisons to occur more frequently often monthly When revenues are compared within the accrual period the differences are tracked generally for the purpose of applying interest to the difference that will be deferred until the end of the accrual period
Rate AdjustmentsIn designing a revenue regulation mechanism there are a
number of decision points that regulators need to consider to balance the interests of all the stakeholders One of the decision points revolves around the determination of the mechanism used to adjust rates The issues that regulators need to consider include the following1 Rate Case Requirements One of the often-mentioned
concerns about surcharges especially when they are numerous is how that will impact the frequency of rate cases For regulators and stakeholders rate cases provide
Decoupling Case Studies Revenue Regulation Implementation in Six States
30
the best mechanism to correctly align rates and costs but they are time-consuming and expensive for all parties This is because a rate case presents an opportunity to closely examine all of the utilityrsquos expenses and adjust rates to reflect cost increases and decreases Because under a revenue regulation mechanism the goal is to match revenues received from all customers with revenue requirements a correct determination of revenue requirements is important as is the specification of appropriate cost indices to adjust the revenue requirements As the time between rate cases increases some regulators feel the base rate case data even with adjustments need to be reexamined As a result some regulators have chosen to mandate the frequency of rate cases to address this whereas others have not It may be that in some cases where there are numerous surcharges recovering a multitude of costs there may not be as many costs subject to review in the rate case making it less significant to a regulator than a case in which most costs are being analyzed and recovered in the rate case itself
2 Collection Mechanism Integrally tied to the mechanism for recovering revenues is how the utility will collect or refund the revenues Options that are available include recovery through a rate case or periodic adjustments to rates through a surcharge mechanism As can be seen by the case studies depending on the plan in place some utilities have very discreet requirements dictating the frequency of rate cases with adjustments occurring in those cases or between those cases Other utilities have no requirements upon them with respect to the frequency of rate case filings This will be discussed in more detail below What does emerge from these case studies is that the discreet components or choices in how to execute a revenue regulation plan are carefully interwoven to create a holistic approach Each component works with the other and the value of this case study is in examining the different pathways that can be chosen As discussed previously some of the commissions have authorized revenue regulation to recover the revenue requirements in the last rate case whereas others have authorized adjustments to rates between rate cases this impacts the pathway that the adjustment mechanism takes
3 Timing How often should rates be adjusted to true up to the utilityrsquos revenue requirement States have chosen different options ranging from monthly to annually
4 Allocation of Revenue Regulation Revenue Surpluses or Deficits There are a number of decision points regarding allocation Should the revenue regulation apply to all rate classes or just the smaller customers whose usage per customer and load variations are not as dramatic as those of larger-use customer classes Should there be a different allocation to each rate class or should the allocation of costs among the classes be the same Different mechanisms accomplish different goals Some states have allocated revenue regulation revenues based on the revenues lost by customer class as a result of energy efficiency This can sometimes be a political decision to mitigate opposition to energy efficiency programs by large customers Other states recognize that the system savings resulting from energy efficiency benefit all customers so that all customers should pay equally
5 Carrying Charges Depending on the timing issue discussed previously regulators may want to consider carrying charges on any adjustments This should be symmetrical in its application however so that it applies to surcharges and refunds Consideration should be given for the basis of the carrying charge rate whether weighted average cost of capital rate of return a risk-free rate or some other mechanism should be adopted
6 Rate Caps In order to mitigate potential rate impacts a regulator may want to consider a cap on how much rates can go up when the revenue regulation adjustment is made This might be more critical if the regulator is aware of other potential rate increases that will impact customersrsquo bills If a cap is used the case in which the utilityrsquos adjustment would exceed the cap must be considered Some regulators have opted to allow the utility to carry over the excess unrecovered amount for a period of years whereas others do not This allows the utility to recover those revenues in a subsequent year when perhaps the adjustment is less As a practical matter however adjustments of greater than three percent are less common as shall be discussed later
7 Impact on At-Risk Consumers Low-income and consumer advocates have expressed concern about revenue regulation as a vehicle for annual rate increases without the scrutiny of a general rate case creating rate increases for the low-use customers doing the most to constrain usage and help achieve targeted energy savings One proposal to address this has been to impose any resulting surcharges only to above-average usage
Decoupling Case Studies Revenue Regulation Implementation in Six States
31
57 Cavanagh and Howat (2012 May 2) Finding common ground between consumer and environmental advocates Electricity Policy
58 The most common criticism of future test years is that utilities forecast costs under an assumption that all authorized personnel positions will be filled while in retrospect any large organization has some level of vacancy in its employee count A historic test year captures this effect fully
customers and any resulting credits only to below-average usage57
Rate Case RequirementRequirements as to the frequency of rate cases can be
tied to the recovery mechanism or to the entire regulatory framework for implementing revenue regulation In the cases studied two of the utilities require periodic rate cases PGampE every three years and WPS every year Two others National Grid and HECO require annual mini rate cases explained later in which adjustments are made and two others IPC and BGE have no requirements for scheduled rate cases Nevertheless if the concern is to ensure that the utilityrsquos revenue recovery meets its revenue requirements some kind of periodic rate case to examine costs is appropriate Having periodic rate cases can provide a measure of assurance to consumer advocates that the level at which the revenues and hence the rates are set is correct One of the criticisms of revenue regulation is in fact the lack of rate cases to produce a proper level of confidence in the allowed amounts Multiple surcharges are usually additive to existing rates therefore not permitting an opportunity to reduce the base rate for reductions in cost Moreover the infrequency in cases impedes the examination of rate allocations as would occur through a cost of service study
This is a particular issue where utilities are augmenting power supply with purchased power from independent power producers which is the most common method for acquiring wind and solar production today The increased cost for purchased power may flow through a fuel and purchased power adjustment mechanism while the (depreciating) investment in conventional power plants remains static in base rates
Both PGampE and WPS use a future test year that allows the utility to project revenue requirements during the time period that the rates are to be in effect The benefit to this is that it can help identify and account for projected changes in costs over the timeframe between rate cases However given that these costs are utility projections most consumer advocates have less confidence in these numbers than they would using actual numbers from a historical or only hybrid test year58 When trying to garner support for revenue regulation from more skeptical stakeholders using a future test year may not be helpful Furthermore in the case of WPS that has annual rate cases using a future test year becomes less justifiable as revenues are recalculated annually anyway
The absence of a rate case requirement can also cause consternation among detractors of revenue regulation because of the belief that the utility will be guaranteed its revenue requirements for as long as it is satisfied with that level irrespective of how well it manages However this is no different from the status quo in traditional regulation in most places The incentive to manage well is always there with or without revenue regulation as it translates into more profit for the utility
In the cases of HECO and National Grid the mini rate cases serve two purposes In the one instance it serves as a means to reconcile revenue recovery with revenue requirements and in the second instance it provides an opportunity to adjust rates in accordance with changes in costs Specifically for National Grid the revenue requirement is adjusted to reflect capital expenditures For HECO revenues are adjusted to reflect changes in the cost of service In the two examples here revenue regulation is wrapped in with other adjustments as part of a mini adjustment Given the structure for determining revenue requirements which accounts for changes in costs including revenue regulation within the mini rate cases is a workable option
These examples highlight how rate cases can be used to adjust revenue requirements either in a more controlled regulatory environment with frequent rate cases or left to the utilityrsquos discretion to decide when to adjust costs A set schedule of periodic rate cases such as that used by PGampE may strike an appropriate balance for reviewing revenue requirements however with the modification of a partial historical partial forecasted test year Frequent rate cases can depending on the resources of the regulator and stakeholders be too costly and time-intensive When there are too many rate cases stakeholders and regulators may not be able to dedicate the level of resources needed for any one proceeding and may be spread too thin Regular known rate cases at reasonable intervals may strike the best balance of adequate review and adjustment of revenue requirements
Decoupling Case Studies Revenue Regulation Implementation in Six States
32
Collection Mechanism and TimingThe collection mechanism for the differential between
actual and authorized revenue requirements varies by util-ity as well Both PGampE and WPS do not have adjustment clauses or surcharges but instead have structured their revenue regulation plans to recover their costs in a rate case with rates adjusted annually Although PGampE has rate cases every three years the utility files its preliminary forecast every September 1 for the following year including adjust-ments for revenue regulation and other costs This practice promotes transparency keeping all stakeholders aware of the current situation of the utility IPC BGE National Grid and HECO use surcharges on customer bills to collect or credit the difference between actual revenues collected and the revenue requirement Although the other three (IPC National Grid and HECO) calculate the rate adjustment annually only BGE does a more contemporaneous adjust-ment of one month Certainly where there are no regularly scheduled rate cases using an adjustment mechanism becomes more critical PGampE has created a tracking mecha-nism known as a balancing account that allows the utility to track the surpluses and deficits to help ensure accuracy at year end when rates are actually adjusted The creation of such monthly balancing accounts will make it easier at the end of the year to track what happened each month and then determine the adjustment for that year It provides a more detailed trail for review and analysis by stakeholders and regulators However other mechanisms that just look at total revenues as compared to revenue requirements at the end of the year can work as well
Table 7
Rate Case Requirements
Table 8
Rate Adjustments
Table 9
Allocation of Surplus or Deficit
Pacific Gas amp Electric
Idaho Power Company
Baltimore Gas amp Electric
Wisconsin Public Service Corporation
National Grid
Hawaiian Electric Company
Pacific Gas amp Electric
Idaho Power Company
Baltimore Gas amp Electric
Wisconsin Public Service Corporation
National Grid
Hawaiian Electric Company
Pacific Gas amp Electric
Idaho Power Company
Baltimore Gas amp Electric
Wisconsin Public Service Corporation
National Grid
Hawaiian Electric Company
Every three years annual ldquoattritionrdquo adjustments in between
No requirement
No requirement
Annual rate case
Annual capital expenditure adjustment case
Abbreviated annual rate case
Base rates adjusted annually
Annual adjustment through surcharge
Monthly adjustment through surcharge
Annual adjustment through rate case
Annual adjustment
Annual adjustment
Allocated to all customers according to business unit (eg electric distribution electric generation)
Included in the annual adjustment mechanism for each customer class
Separate for each customer class
Allocated to all customers except certain tariffs (see above)
Separate for each customer class
Separate for residential and commercialindustrial
Allocation of Revenue Regulation Revenue Surpluses or Deficits
The allocation of revenue regulation revenue surpluses or deficits should be symmetrical so that overpayments are credited to customers just as underpayments are paid by those same customers The six utilities studied fol-low that formula The application of revenue regulation however varies from utility to utility BGE and IPC ap-ply revenue regulation to the residential and commercial classes thereby excluding industrial customers In contrast however PGampE WPS National Grid and HECO allocate revenue regulation adjustments to all customer classes In terms of how the costs are allocated IPC BGE WPS National Grid and HECO allocate costs differently among the customer classes PGampE however allocates costs uni-formly among the customers Because PGampE has separated its business units it also separately calculates and allocates
Decoupling Case Studies Revenue Regulation Implementation in Six States
33
Table 10
Carrying Charges
Table 11
Cap on Rate Adjustment
Pacific Gas amp Electric
Idaho Power Company
Baltimore Gas amp Electric
Wisconsin Public Service Corporation
National Grid
Hawaiian Electric CompanyPacific Gas amp Electric
Idaho Power Company
Baltimore Gas amp Electric
Wisconsin Public Service Corporation
National Grid
Hawaiian Electric Company
None
Yes
None
Yes at the short-term debt rate
Yes at the customer deposit rate
Yes at the customer deposit rateNo
3 rate cap excess carried over to next period
10 rate cap excess carried over to next period
Cap of $14 million per year
$170 million in CapEx
No
revenue regulation surpluses and deficits among its electric distribution gas distribution and electric generation busi-nesses This illustrates that there are several ways to address revenues from revenue regulation depending on the policy outcomes that are desired
Carrying ChargesCarrying charges applied to uncollected or surplus rev-
enues can be used to account for the time value of money and the lost opportunity or value to having those revenues in hand PGampE and BGE do not accrue carrying charges On the other hand IPC WPS National Grid and HECO do For BGE given that the revenue regulation revenues are reconciled and recovered monthly it would make little sense to include a carrying cost Where carrying costs have been used they have included in the cases of these utili-ties the short-term debt rate or the customer deposit rate which for one utility is six percent and probably close to the short-term debt rate Thus the carrying charge rates are appropriately at the lower end of the spectrum reflecting their short-term nature In the application of the carrying charge symmetry should be preserved by applying it to both deficits and surpluses Application of carrying charges given the short period that costs are carried (one year) is somewhat discretionary Although it does more accurately account for costs it does add a modest level of complica-tion in tracking costs
Rate Caps and CollarsOne of the ways to protect customers in the event of sig-
nificant adjustments is to impose a rate cap (or collar) that limits the amount of a rate increase (and decrease) Some customers are sensitive to changes in foundational costs like utility bills and if costs are going to rise they benefit from a pattern of steady modest increases rather than a large step increase Any structural increases in rates attributable
to reductions in sales or increases in costs recognized by the revenue regulation plan would be eventually included in rates under any system A cap reflects a controlled way to manage customer expectations and customer impacts Structural changes can only be managed for a while until a complete rate case is needed to reset all assumptions
Typically when a rate cap is imposed if the formulaic increase exceeds the cap or collar the utility will be able to carry over any uncollected revenues until the next rate adjustment Two of the utilities studied PGampE and HECO do not have rate caps On the other hand the other four utilities do include rate caps in varying amounts National Grid has a one-percent revenue cap whereas IPC and BGE have a one-percent and a ten-percent rate cap respectively WPS unlike the others has a cap tied to the dollar amount of $14 million as opposed to a percentage Consistent with the goals of revenue regulation all of the utilities studied have a carryover provision that is important for reducing the risk that the utility will not recover its revenue require-ments
Note that National Grid differs from BGE and HECO in that its cap is on revenues whereas the other two utilities cap rates and rate impacts A revenue cap is more focused on ensuring minimal change to the revenue requirements authorized by the commission National Grid as discussed previously allows for mini rate cases to adjust the rev-enue requirements Having the one-percent cap limits the amount of increase that can occur through that process requiring revenue changes that are greater to occur in a full rate case However note also that some of the adjustments allowed in the mini rate case have their own separate cap The IPC rate cap is in line with what many other utilities with caps have in place which generally range from one to three percent The ten-percent rate cap in the BGE plan is
Decoupling Case Studies Revenue Regulation Implementation in Six States
34
59 Morgan P (2012 December) Graceful Systems LLC A decade of decoupling for US energy utilities rate impacts designs and observa-tions p5
reflective of its monthly adjustment pattern An annual ad-justment allows more time to smooth out peaks and valleys in revenues whereas a monthly adjustment will be influ-enced by more of the spikes (particularly weather-driven variation) thus the need for a larger bandwidth for the car-ryover Like a variable energy rate or fuel adjustment clause that fluctuates monthly the monthly adjustment introduces more volatility into the rates
Actual Historical AdjustmentsFor many ratepayer advocates there is a concern that
some of the utility management risk will be transferred to customers as a consequence of a policy that seeks to ensure that the utility will be made whole However the utility re-tains management risk and the requirement to demonstrate that it has acted prudently Thus the utility still has just as much of an incentive to operate efficiently as it did without revenue regulation If the utility can lower its costs it can still increase its profits Second by designing rates symmet-rically such that under- and over-recoveries are reconciled it provides customers with an opportunity to obtain credits that under traditional regulation would be retained by the utility It has often been opined that when there are large
gaps in time between utility rate cases it is because the utility is over-earning and exceeding its revenue require-ments In those instances customers never get to examine what the utility is collecting much less receive a refund Under revenue regulation with its periodic adjustments and scheduled general rate cases the revenue requirements are examined and refunds or credits allocated such that customers have a better knowledge base for understanding the utilityrsquos earnings And annual reconciliation of the util-ityrsquos actual revenues versus authorized revenues provides consumers with a tool to reign in excess revenue recovery beyond authorized amounts Third the adjustments that do occur under revenue regulation are manageable and frequently less than the adjustments customers are used to seeing on their bills for fuel or variable generation rates or for the myriad of other surcharges that can be tacked on to a customerrsquos bill such as an infrastructure (smart grid) sur-charge maintenance upgrade fee regulatory asset charge or system benefit charge
As seen in Figure 1 the range of rate impacts cluster around plus or minus two percent but can at times exceed plus or minus five percent The total of surcharges has somewhat exceeded the total of credits
Figure 1
Total Utility Decoupling Adjustment Rate Impacts59
300
250
200
150
100
50
0
Nu
mber
of
Dec
oup
lin
g A
dju
stm
ents
Over -5 -4 to -5 -3 to -4 -2 to -3 -1 to -2 0 to -1 0 to 1 1 to 2 2 to 3 3 to 4 4 to 5 Over 5
Percentage Rate Impacts
SurchargesRefunds
ResidentialAll
Other
Commercial
Total
Decoupling Case Studies Revenue Regulation Implementation in Six States
35
60 Id p 3
61 Schultz T Energy Efficiency at Idaho Power Available at httpwwwenergyidahogovenergyalliancedida_powerpdf
As can be seen with the utilities studied above the larger fluctuations are attributable to adjustment mechanisms that are reconciled more frequently such as monthly as those are less able to smooth out anomalies as an annual adjust-ment would do From a dollar perspective for the roughly 64 percent of adjustments that fall within the plus or minus two-percent range the monthly bill impact is approxi-mately $230 for average electric customers and $140 for average gas customers60
Of the six utilities studied the fluctuations in adjustment have for the most part stayed within the one- to three-per-cent range as shown below
bull PGampE from 2005 to 2012 has had annual revenue regulation adjustments ranging from minus143 percent to 415 percent with an average adjustment of 197 percent
bull For IPC the adjustments are separated between residential and commercial customers For residential customers the annual adjustments from 2007 through 2011 ranged from 077 percent to 258 percent for an average of 162 percent As for the commercial customers the annual adjustments for that same period were higher ranging from 104 percent to 424 percent with an average adjustment of 252 percent
bull BGE has monthly adjustments that ranged from minus1853 percent to 3013 percent with an average of 057 percent for residential customers from March 2008 through August 2012 For General Service Customers the monthly adjustment ranged from minus2264 percent to 2462 percent The average adjustment was 1308 percent
bull For WPS the annual adjustments from 2009 through 2011 ranged from minus145 percent to 378 percent for residential and small commercial and from minus314 percent to 899 percent for commercial Note that because of a $14 million per year cap some of these percentages were carried over The average annual adjustment for residential and small commercial and for commercial was 163 percent and 215 percent respectively with carry-overs to subsequent years
bull For Massachusetts Electric and Nantucket Electric both of which operate under National Grid the annual revenue regulation adjustment for all for 2011 and 2012 was minus0105 percent and 0315 percent for an average revenue regulation adjustment over the two years of 0105 percent
bull HECO like National Grid has one annual revenue
regulation mechanism for its customers which resulted in adjustments in 2011 and 2012 of 063 percent and 107 percent respectively for an average adjustment of 085 percent
As can be gleaned from the above information the range of average adjustments for small use customers was a low of 0105 percent for National Grid to a high of 197 percent for PGampE For larger use customers the range was a low of 0105 percent for National Grid to a high of 252 percent for IPC This demonstrates that on average for these utilities with well-developed and diversely designed revenue regula-tion proposals their adjustments on average stayed at or below approximately 25 percent
One of the metrics for determining if a revenue regula-tion program is working successfully that was discussed above was the impact on rates of a revenue regulation mechanism As can be seen by the analysis of the adjust-ment levels for each of the utilities they are within a rea-sonable range
Complementary Policies Although a revenue regulation mechanism does not need
to be accompanied by other policies energy efficiency is frequently at the root of the reason revenue regulation was proposed in the first place The states examined in this pa-per have various obligations for energy efficiency achieve-ment placed upon their utilities Only Idaho does not have an Energy Efficiency Resource Standard but energy efficiency objectives are developed through an integrated resource plan process Energy efficiency spending at IPC has increased dramatically in recent years61
In recognition of the fact that revenue regulation only removes the disincentive to pursue energy efficiency several states have instituted some form of incentives to reward the desired outcome This mechanism can not only incentivize management to aggressively pursue energy efficiency but also make shareholders supportive in the face of lost invest-ment opportunity
Rate design can also play an important part in assist-ing the utility in achieving favorable energy efficiency outcomes Inclining block rates penalize inefficient use of electricity and shorten payback times from the customer perspective Because efficiency reduces consumption at
Decoupling Case Studies Revenue Regulation Implementation in Six States
36
62 Optional rate designs for PGampE include TOU and Peak Time Pricing
63 IPC also has an optional TOU rate design
64 Optional rate designs for this utility include TOU Critical Peak Pricing and Contract
65 National Grid also offers optional TOU and flat rate designs
66 HECO also offers optional TOU and flat rate designs
67 See eg Alexander B (1996 April) How to construct a service quality index in performance-based ratemaking Electricity Policy
the tail block rate the value of kWh savings is greater than with flat rates On the other side of the spectrum declining block rates which have a reduced rate in the tail block do little to encourage conservation In fact they operate more like a discounted bulk rate by reducing the average cost of a kWh in a customerrsquos bill for the more kWh used
Performance incentives or other ways to avoid destruc-tive cost-cutting in the name of creating margins that reduce service or reliability or lessen customer value have been implemented only in Massachusetts of the six utilities illustrated here Several other states have implemented vari-ous schemes in reaction to perceived deficiencies in utility service67 Performance incentives are not unique to rev-enue regulation Commissions wishing to implement such a scheme can find many models of incentive reward and penalty mechanisms developed for other purposes
Taken together a suite of policy and program features can create an atmosphere that is conducive to achievement of energy efficiency goals within the utility and for the customers By appropriate application of these techniques regulators working with utilities and stakeholders can remove barriers and create an opportunity for energy ef-ficiency to be fully integrated into the utility supply option portfolio
Energy Efficiency OutcomesAlthough revenue regulation itself does not create an
incentive for a utility to implement energy efficiency it does address the issue of lost revenues associated with energy
Table 12
Complementary Policies for Energy Efficiency
Pacific Gas amp Electric62
Idaho Power Company63
Baltimore Gas amp Electric
Wisconsin Public Service Corporation64
National Grid65
Hawaiian Electric Company66
Energy Efficiency Requirement
1 annually
IRP
10 by 2015
075 annually
24 annually
Energy efficiency can satisfy portion of RPS
Default Residential Rate Design
Inclining block
Inclining block
TOU seasonal
Flat
Inclining block
Inclining block
Incentive Structure
Risk reward incentive mechanism
No
No
No
5 of program costs
Third-party administrator paid for contract performance
Performance Incentives
Reliability reporting only
None
Under consideration
Reliability reporting only
Service quality reward and penalty
Under consideration
efficiency and DG programs Revenue regulation should be combined with other mechanisms that require or incentiv-ize the implementation of energy efficiency by the utility or a third party The level of energy efficiency achieved can be one measure of the success of a revenue regulation mechanism as implemented in a larger program designed to achieve energy efficiency Table 13 shows the incremental annual energy efficiency savings reported by each utility with the shaded box indicating the year that the utilityrsquos revenue regulation mechanism was implemented National Grid had achieved a high level of energy efficiency savings in the years before it implemented revenue regulation
This paper has not evaluated DG outcomes to correlate with revenue regulation as it is not perceived that states and utilities have made that connection expressly in histori-cal mechanisms However it is expected that this connec-
Decoupling Case Studies Revenue Regulation Implementation in Six States
37
68 EIA Form EIA-861 data files Available at httpwwweiagovelectricitydataeia861
69 PGampE began revenue regulation in 1974 and it was later suspended and recommenced in 2001
70 WPS savings are represented by the statewide program savings from the Focus on Energy program WPS provided additional funds to Focus on Energy starting in CY10 through their territory-wide program activities
71 In 2009 Hawaii Energy a ratepayer-funded statewide energy efficiency provider began delivering services Savings reported after 2009 represent savings achieved through the programs of Hawaii Energy
Table 13
Annual Incremental Energy Efficiency Savings as Percentage of Retail Sales68
Highlighted cells are the year that utility started decoupling
Pacific Gas amp Electric69
Idaho Power Company
Baltimore Gas amp Electric
Wisconsin Public Service Corporation70
National Grid
Hawaiian Electric Company71
2004
11
01
00
03
11
00
2005
16
03
00
03
09
05
2006
10
05
00
03
12
05
2010
19
13
17
09
136
12
tion will be made in future mechanisms and furthermore it is anticipated that follow on work to this paper will want to study that connection between revenue regulation and DG performance
Conclusions
An increasing number of states are looking to increase the rate of energy efficiency investments for their long-run cost and risk advantages The benefits of energy efficiency include not only its ability to reduce system costs across the distribution transmission and generation functions but also the opportunity for customers to reduce their individ-ual energy costs for their own electric bills Nevertheless it is counterintuitive to encourage or order a utility to sell less of its product In order to encourage the proliferation of en-ergy efficiency programs as a solution that can contribute to this nationrsquos energy needs this tension between the goals of society versus the goals of the utility needs to be addressed Revenue regulation can be such a solution by removing the link between sales and revenues
There are many ways to implement revenue regulation and multiple decision points that regulators must consider in designing a revenue regulation mechanism This paper focused on six utilities each of which implemented revenue regulation in different ways in accordance with the objectives of that state Different decision points discussed include
bull Should revenue regulation apply to all functions (generation transmission and distribution) which sometimes depends on if the utility is regulated or restructured
bull Should revenue regulation apply to all customer classes
bull Should there be symmetry such that a reconciliation adjustment occurs for both over- and under-recoveries of the revenue requirements
bull Should recovery of indicated surcharges be conditioned on acceptable performance on customer service quality or energy efficiency goals
bull Should there be an attrition adjustment to account for other expenses or should the revenue regulation adjustment be limited to reconciling existing revenue requirements
bull Should there be an inflation adjustmentbull To calculate the revenue requirements should the
current or accrual method be usedbull Should the adjustments be made in rate cases or
through a riderbull How frequently should adjustments be made
monthly annually or some other time periodbull Depending on the period of time between true up and
recovery should there be carrying charges and if so how should they be calculated
2007
21
06
00
03
09
04
2008
35
10
05
09
05
05
2009
20
11
06
10
11
11
Decoupling Case Studies Revenue Regulation Implementation in Six States
38
72 Avista Utilities (2009) Washington Utilities and Transportation Commission Docket UE-090134
bull Should there be a requirement authorizing the frequency of rate case
bull Should there be an annual cap on the amount of the adjustment and if so should there be an opportunity to carry over any additional amounts and for how many years
bull Should there be an adjustment to the cost of capital to reflect the reduced risk
Other considerations for regulators whether or not they implement revenue regulation but certainly as part of a comprehensive package are other measures that can be put in place to encourage consumers and utilities alike to actively participate in energy efficiency For example an inclining block rate structure by virtue of its incentive to consume less pairs well with an energy efficiency program helps drive consumers to participate in efficiency programs and accelerates the payback of an energy efficiency investment By the same token an incentive payment to the utility helps provide its management with a good reason to excel and exceed targets for energy efficiency programs
A key point illustrated by the list of considerations above is that there is not just one static way to design and implement revenue regulation but rather there are a variety of options for doing so In this study a diverse group of utilities were reviewed The differences among the utilities included geographic diversity vertically integrated and restructured utilities different levels of energy efficiency in place and certainly differences in how the revenue regulation mechanisms were implemented No two utilities were alike and no two utilities had the same revenue regulation mechanism The key is that revenue regulation should eliminate the throughput incentive but the means for accomplishing this goal can vary and be tailored to each jurisdiction and each utility and still be successful
There are several considerations in the design of a revenue regulation mechanism that can help ensure its successful adoption To begin revenue regulation should be granted to utilities only as a precondition to implementing comprehensive energy efficiency andor DG policies Unless accompanied by a commitment to engage in providing least-cost resource options that could impact sales there is not really any good policy reason for its adoption All of the utilities studied are actively engaging in energy efficiency Furthermore as a matter of fairness the revenue regulation mechanism should be symmetrical so that any revenues above those authorized are refunded back to consumers As Figure 1 demonstrates although there are more surcharges to customers there is nevertheless a healthy amount of
credits back to consumers This is the bargain Barring imprudence or other unforeseen circumstances the utility receives its authorized revenue requirements and nothing more or less under a simple revenue regulation mechanism
Rate design plays an important role in the effectiveness of energy efficiency in concert with revenue regulation A low customer charge is preferable so that the customer can benefit from real bill reductions tied to reduced volumetric consumption Reductions in consumption not only reduce bills but also positively impact the payback period for investments in energy efficient appliances Declining block rates in which the tail block rate is lower than the first tier also do not encourage conservation Inclining block rates that reward low usage in the first block with a lower rate send the better price signals None of the six utilities studied had declining block residential rates They were inclining flat and time-varying
The revenue adjustment mechanism is also a critical decision point in terms of whether a revenue per customer mechanism is adopted that accounts for only the current revenue requirements or whether latitude is given to include an inflation adjustment or other cost increases in the revenue adjustment mechanism Three of the utilities studied adopted this approach whereas another two used a hybrid approach Finally to reduce volatility five of the six utilities opted for annual rather than monthly adjustments thereby creating a level of rate stability that customers in general prefer
Once the goals for revenue regulation are set by the regulators the next step is to design programs that will implement that goal For energy efficiency to be as successful as possible regulators may want to adopt a complement of other policies to accompany revenue regulation These can include rate designs that reward reduced use and conservation as well as incentive payments to utilities that reward them for meeting or exceeding targets Of the six utilities studied three have adopted some form of incentive One simple approach that was used in Washington was to link recovery of any surcharges under the revenue regulation mechanism to achievement of energy efficiency targets72
For the utilities examined above that have implemented revenue regulation the evidence demonstrates that revenue regulation as a strategy and a mechanism to enable
Decoupling Case Studies Revenue Regulation Implementation in Six States
39
energy efficiency has been working well The fact that each revenue regulation mechanism varies from the next demonstrates that there are many different paths that can be followed in implementing revenue regulation based on the needs of the utility and its stakeholders in a particular
region This study demonstrates that revenue regulation does work and provides examples of how it can be implemented each one different and unique because of the number of decision points to be considered in designing a revenue regulation mechanism
Decoupling Case Studies Revenue Regulation Implementation in Six States
40
Appendix
Historic Rate Adjustments
Table 14
PGampE Revenue Regulation Rate Adjustments 1983 to 199373
Table 15
PGampE Revenue Regulation Adjustments 2005 to 201274
Table 16
IPC Revenue Regulation Adjustments76
Idaho Power Company
1983 23
1984 (34)
1985 (48)
1986 19
1987 21
1988 50
1989 (43)
1990 (54)
1991 39
1992 34
1993 00
2005 8925 minus12773 minus143
2006 9933 2246 226
2007 10409 21727 209
2008 10261 4032 039
2009 11169 10355 093
2010 11224 46556 415
2011 10306 38390 373
2012 11032 40304 365
2007 Residential minus00457 590 minus077
Commercial minus00457 428 minus107
2008 Residential 00529 670 090
Commercial 00529 510 104
2009 Residential 01220 770 158
Commercial 01535 603 255
2010 Residential 01800 785 229
Commercial 02273 613 371
2011 Residential 02028 785 258
Commercial 02597 613 424
Revenue Regulation Adjustment as of
Total Rates
Delivery Revenue
Requirement ($ millions)
Adjustment Rate
Revenue Regulation Adjustment($ millions)
Retail Rate
of Delivery Revenue
Revenue Regulation Adjustment
Year
Year
73 Lesh P (2009 June 30) Rate impacts and key design elements of gas and electric utility decoupling
74 Morgan P (2012 November) A decade of decoupling for US energy utilities rate impacts designs and observations
75 Morgan P (2012 November) A decade of decoupling for US energy utilities rate impacts designs and observations
76 All numbers provided by the utility
Decoupling Case Studies Revenue Regulation Implementation in Six States
41
77 Idaho Power Company Case No IPC-E-11-19- fixed cost adjustment permanent mechanism Available at httpwwwpucidahogovinternetcaseselecIPCIPCE1119company20120928COMPLIANCE20FILINGPDF
Figure 2
IPC Revenue Regulation Adjustments77
Residential FCA Balance and Use per Customer
$10000000
$8000000
$6000000
$4000000
$2000000
$0
-$2000000
-$4000000
-$6000000
1080
1070
1060
1050
1040
1030
1020
1010
1000Res
idu
al A
uth
oriz
ed F
CA
Am
oun
t
Residual Authorized FCA Amount ($)
Monthly Use Per Customer (kWh)
kW
h U
sed
2006 2007 2008 2009 2010 2011
78 Morgan P (2012 November) A decade of decoupling for US energy utilities rate impacts designs and observations
Decoupling Case Studies Revenue Regulation Implementation in Six States
42
Table 17a
Baltimore Gas and ElectricBGE Monthly Revenue Regulation Adjustments 2008 to 201278
Table 17b
Baltimore Gas and ElectricBGE Monthly Revenue Regulation Adjustments 2008 to 201278
March Residential 000172 01477 1165General Service 000230 01526 1507
April Residential 000016 01477 0108General Service 000146 01526 0957
May Residential 000066 01477 0447General Service 000230 01526 1507
June Residential minus000066 01477 minus0447General Service 000230 01526 1507
July Residential 000158 01477 1070General Service 000230 01526 1507
August Residential minus000040 01477 minus0271General Service 000214 01526 1402
September Residential 000237 01477 1605General Service 000230 01526 1507
October Residential 000237 01477 1605General Service 000143 01526 0937
November Residential 000237 01477 1605General Service 000140 01526 0917
December Residential 000445 01477 3013General Service 000230 01526 1507
January Residential 000035 01579 0222General Service minus000073 01346 minus0542
February Residential 000025 01579 0158General Service 000230 01346 1709
March Residential minus000237 01579 minus1501General Service 000230 01346 1709
April Residential minus000237 01579 minus1501General Service 000230 01346 1709
May Residential 000234 01579 1482General Service 000132 01346 0981
June Residential 000237 01579 1501General Service 000230 01346 1709
July Residential 000237 01579 1501General Service 000230 01346 1709
August Residential 000237 01579 1501General Service 000190 01346 1412
September Residential 000237 01579 1501General Service 000230 01346 1709
October Residential 000237 01579 1501General Service 000124 01346 0921
November Residential 000237 01579 1501General Service 000230 01346 1709
December Residential 000156 01579 0988General Service 000204 01346 1516
Adjustment $kWh
Adjustment $kWh2008 2009
Retail Rate
$kWh
Retail Rate
$kWhAdjustment
Adjustment
Decoupling Case Studies Revenue Regulation Implementation in Six States
43
Table 17c
Baltimore Gas and ElectricBGE Monthly Revenue Regulation Adjustments 2008 to 201278
Table 17d
Baltimore Gas and ElectricBGE Monthly Revenue Regulation Adjustments 2008 to 201278
January Residential 000203 01465 1386General Service 000230 01261 1824
February Residential minus000142 01465 minus0969General Service 000230 01261 1824
March Residential minus000237 01465 minus1618General Service 000230 01261 1824
April Residential minus000237 01465 minus1618General Service 000230 01261 1824
May Residential 000192 01465 1311General Service 000230 01261 1824
June Residential 000191 01465 1304General Service 000230 01261 1824
July Residential 000095 01465 0648General Service 000230 01261 1824
August Residential minus000176 01465 minus1201General Service 000224 01261 1776
September Residential minus000237 01465 minus1618General Service 000116 01261 0920
October Residential minus000237 01465 minus1618General Service 000081 01261 0642
November Residential minus000237 01465 minus1618General Service 000098 01261 0777
December Residential minus000079 01465 minus0539General Service 000229 01261 1816
January Residential minus000130 01365 minus0952General Service 000230 01156 1990
February Residential minus000253 01365 minus1853General Service minus000020 01156 minus0173
March Residential minus000018 01365 minus0132General Service minus000063 01156 minus0545
April Residential 000110 01365 0806General Service minus000262 01156 minus2266
May Residential 000010 01365 0073General Service minus000160 01156 minus1384
June Residential 000226 01365 1656General Service 000042 01156 0363
July Residential 000253 01365 1853General Service 000209 01156 1808
August Residential minus000007 01365 minus0051General Service minus000157 01156 minus1358
September Residential minus000253 01365 minus1853General Service minus000177 01156 minus1531
October Residential 000228 01365 1670General Service 000262 01156 2266
November Residential minus000059 01365 minus0432General Service 000262 01156 2266
December Residential 000071 01365 0520General Service 000262 01156 2266
Adjustment $kWh
Adjustment $kWh2010 2011
Retail Rate
$kWh
Retail Rate
$kWhAdjustment
Adjustment
Decoupling Case Studies Revenue Regulation Implementation in Six States
44
Table 17e
Baltimore Gas and ElectricBGE Monthly Revenue Regulation Adjustments 2008 to 201278
January Residential 000253 01291 1960General Service 000262 01064 2462
February Residential 000253 01291 1960General Service 000262 01064 2462
March Residential 000253 01291 1960General Service 000262 01064 2462
April Residential 000253 01291 1960General Service 000262 01064 2462
May Residential 000253 01291 1960General Service 000262 01064 2462
June Residential 000253 01291 1960General Service 000262 01064 2462
July Residential 000253 01291 1960General Service 000262 01064 2462
August Residential 000253 01291 1960General Service 000160 01064 1504
Adjustment $kWh2012
Retail Rate
$kWhAdjustment
Decoupling Case Studies Revenue Regulation Implementation in Six States
45
79 Morgan P (2012 November) A decade of decoupling for US energy utilities rate impacts designs and observations
80 Morgan P (2012 November) A decade of decoupling for US energy utilities rate impacts designs and observations
Table 18
Wisconsin Public Service Corporation Revenue Regulation Adjustments 2009 to 201179
2009 ResidentialSmall Commercial 00048705 000168154 01290 378 130Commercial 00084951 000293293 00945 899 310
2010 ResidentialSmall Commercial 00033043 000166936 01291 256 129Commercial 00056630 000286103 09460 060 030
2011 ResidentialSmall Commercial (00018666) $ (000163719) 01288 minus145 minus127Commercial (00032565) $ (000285629) 01037 minus314 minus275
Derived Adjustment
$kWh
Derived Adjustment Capped $
kWh
Retail Rate
$kWh
Revenue Regulation Actual
Revenue Regulation Capped
Table 19
National Grid Revenue Regulation Adjustments 2011-201276
Massachusetts Electric and Nantucket Electric
Table 20
Hawaiian Electric Company
2011 All minus0015 1429 minus0105
2012 All 0044 1396 0315
2011 01995 3149 063
2012 03894 3641 107
Revenue Regulation Adjustment
centkWh
Revenue Regulation Adjustment
centkWhRetail Rate
centkWh
Retail Rate
Revenue Regulation Adjustment
Revenue Regulation
ldquoThe 2011 adjustment took effect June 1 but was reduced to $0 on July 26 2011 when the Commission granted HECO an interim rate increase of $532 million in a 2011 test year general rate case The 2012 Adjustment runs from June 1 2012 through May 31 2013 About 25 of the total relates to the portion of the decoupling mechanism that updates OampM and rate baserdquo (Morgan 2013)
Decoupling Case Studies Revenue Regulation Implementation in Six States
46
Revenue Regulation and Decoupling A Guide to Theory and Applicationhttpwwwraponlineorgdocumentdownloadid902
This guide was prepared to assist anyone who needs to understand both the mechanics of a regulatory tool known as decoupling and the policy issues associated with its use This would include public utility commissioners and staff utility management advocates and others with a stake in the regulated energy system While this guide is somewhat technical at points we have tried to make it accessible to a broad audience to make comprehensible the underlying concepts and the implications of different design choices This guide includes a detailed case study that demonstrates the impacts of decoupling using different pricing structures (rate designs) and usage patterns
Pricing Dorsquos and Donrsquots Designing Retail Rates as if Efficiency Countshttpwwwraponlineorgdocumentdownloadid939
Rate design is a crucial element of an overall regulatory strategy that fosters energy efficiency and sends appropriate signals about efficient system investment and operations Rate design is also fully under the control of state regulators Progressive rate design elements can guide consumers to participate in energy efficiency programs and reduce peak demand yet relatively few utilities and commissions have implemented many of these elements This RAP paper identifies some best practices Because pricing issues tie closely to utility growth incentives we also address revenue decoupling
A Decade of Decoupling for US Energy Utilities Rate Impacts Designs and Observationshttpwwwraponlineorgdocumentdownloadid6356
This report written by Pamela Morgan of Graceful Systems LLC builds on a 2009 report Now covering 25 states including 49 LDCs and 24 electric utilities this report summarizes the decoupling mechanism designs these utilities use and the rate adjustments they have made under those mechanisms In total this report estimates the retail rate impacts of 1244 decoupling mechanism adjustments since 2005
Additional Resources
The Role of Decoupling Where Energy Efficiency is Required by Lawhttpwwwraponlineorgdocumentdownloadid275
This Issuesletter gives an overview of energy efficiency resource standards the need to decouple utility profits from utility sales and explains why decoupling is needed even where a third party administers energy efficiency programs
Revenue Decoupling Standards and Criteria A Report to the Minnesota Public Utilities Commissionhttpwwwraponlineorgdocumentdownloadid850
In 2007 the Minnesota legislature enacted a new statute Section 216B2412 in which it defined an alternative approach to utility regulation decoupling and directed the Public Utilities Commission (PUC) to ldquoestablish criteria and standardsrdquo by which decoupling could be adopted for the statersquos rate-regulated utilitiesTo fulfill its obligation to develop criteria and standards for decoupling the PUC sought the advice of the Regulatory Assistance Project (RAP) This report is the output of that collaboration
Designing Distributed Generation Tariffs Wellhttpwwwraponlineorgdocumentdownloadid6898
Improvements in distributed generation economics increasing consumer preference for clean distributed energy resources and a favorable policy environment in many states have combined to produce significant increases in distributed generation adoption in the United States Regulators are looking for the well-designed tariff that compensates distributed generation adopters fairly for the value they provide to the electric system compensates the utility fairly for the grid services it provides and charges non-participating consumers fairly for the value of the services they receive This paper offers regulatory options for dealing with distributed generation The authors outline current tariffs and ponder what regulators should consider as they weigh the benefits costs and net value to distributed generation adopters non-adopters the utility and society as a whole The paper highlights the importance of deciding upon a valuation methodology so that the presence or absence of cross-subsidies can be determined Finally the paper offers rate design and ratemaking options for regulators to consider and includes recommendations for fairly implementing tariffs and ratemaking treatments to promote the public interest and ensure fair compensation
Decoupling Case Studies Revenue Regulation Implementation in Six States
47
The Regulatory Assistance Project (RAP)trade is a global non-profit team of experts focused on thelong-term economic and environmental sustainability of the power sector We provide technical and policy assistance on regulatory and market policies that promote economic efficiency environmental protection system reliability and the fair allocation of system benefits among consumers We work extensively in the US China the European Union and India Visit our website at wwwraponlineorg to learn more about our work
Rate Design Where Advanced Metering Infrastructure Has Not Been Fully Deployedhttpwwwraponlineorgdocumentdownloadid6516
This paper identifies sound practices in rate design applied around the globe using conventional metering technology Rate design for most residential and small commercial customers (mass market consumers) is most often reflected in a simple monthly access charge and a per-kWh usage rate in one or more blocks and one or more seasons A central theme across the practices highlighted in this paper is that of sending effective pricing signals through the usage-sensitive components of rates in a way that reflects the character of underlying long-run costs associated with production and usage While new technology is enabling innovations in rate design that carry some promise of better capturing opportunities for more responsive load the majority of the worldrsquos electricity usage is expected to remain under conventional pricing at least through the end of the decade and much longer in some areas Experience to date has shown that the traditional approaches to rate design persist well after the enabling technology is in place that leads to change
Time-Varying and Dynamic Rate Designhttpwwwraponlineorgdocumentdownloadid5131
This report discusses important issues in the design and deployment of time-varying rates The term time-varying rates is used in this report as encompassing traditional time-of-use rates (such as time-of-day rates and seasonal rates) as well as newer dynamic pricing rates (such as critical peak pricing and real time pricing) The discussion is primarily focused on residential customers and small commercial customers who are collectively referred to as the mass market The report also summarizes international experience with time-varying rate offerings
50 State Street Suite 3Montpelier Vermont 05602802-223-8199wwwraponlineorg
- Table of Contents
- Introduction
- California Pacific Gas and Electric Company
- Idaho Idaho Power Company
- Maryland Baltimore Gas and Electric
- Wisconsin Wisconsin Public Service Corporation
- Massachusetts National Grid
- Hawaii Hawaiian Electric Company
- Discussion of the Six Utilities Overall
- Conclusions
- Appendix
- Additional Resources
-
Decoupling Case Studies Revenue Regulation Implementation in Six States
30
the best mechanism to correctly align rates and costs but they are time-consuming and expensive for all parties This is because a rate case presents an opportunity to closely examine all of the utilityrsquos expenses and adjust rates to reflect cost increases and decreases Because under a revenue regulation mechanism the goal is to match revenues received from all customers with revenue requirements a correct determination of revenue requirements is important as is the specification of appropriate cost indices to adjust the revenue requirements As the time between rate cases increases some regulators feel the base rate case data even with adjustments need to be reexamined As a result some regulators have chosen to mandate the frequency of rate cases to address this whereas others have not It may be that in some cases where there are numerous surcharges recovering a multitude of costs there may not be as many costs subject to review in the rate case making it less significant to a regulator than a case in which most costs are being analyzed and recovered in the rate case itself
2 Collection Mechanism Integrally tied to the mechanism for recovering revenues is how the utility will collect or refund the revenues Options that are available include recovery through a rate case or periodic adjustments to rates through a surcharge mechanism As can be seen by the case studies depending on the plan in place some utilities have very discreet requirements dictating the frequency of rate cases with adjustments occurring in those cases or between those cases Other utilities have no requirements upon them with respect to the frequency of rate case filings This will be discussed in more detail below What does emerge from these case studies is that the discreet components or choices in how to execute a revenue regulation plan are carefully interwoven to create a holistic approach Each component works with the other and the value of this case study is in examining the different pathways that can be chosen As discussed previously some of the commissions have authorized revenue regulation to recover the revenue requirements in the last rate case whereas others have authorized adjustments to rates between rate cases this impacts the pathway that the adjustment mechanism takes
3 Timing How often should rates be adjusted to true up to the utilityrsquos revenue requirement States have chosen different options ranging from monthly to annually
4 Allocation of Revenue Regulation Revenue Surpluses or Deficits There are a number of decision points regarding allocation Should the revenue regulation apply to all rate classes or just the smaller customers whose usage per customer and load variations are not as dramatic as those of larger-use customer classes Should there be a different allocation to each rate class or should the allocation of costs among the classes be the same Different mechanisms accomplish different goals Some states have allocated revenue regulation revenues based on the revenues lost by customer class as a result of energy efficiency This can sometimes be a political decision to mitigate opposition to energy efficiency programs by large customers Other states recognize that the system savings resulting from energy efficiency benefit all customers so that all customers should pay equally
5 Carrying Charges Depending on the timing issue discussed previously regulators may want to consider carrying charges on any adjustments This should be symmetrical in its application however so that it applies to surcharges and refunds Consideration should be given for the basis of the carrying charge rate whether weighted average cost of capital rate of return a risk-free rate or some other mechanism should be adopted
6 Rate Caps In order to mitigate potential rate impacts a regulator may want to consider a cap on how much rates can go up when the revenue regulation adjustment is made This might be more critical if the regulator is aware of other potential rate increases that will impact customersrsquo bills If a cap is used the case in which the utilityrsquos adjustment would exceed the cap must be considered Some regulators have opted to allow the utility to carry over the excess unrecovered amount for a period of years whereas others do not This allows the utility to recover those revenues in a subsequent year when perhaps the adjustment is less As a practical matter however adjustments of greater than three percent are less common as shall be discussed later
7 Impact on At-Risk Consumers Low-income and consumer advocates have expressed concern about revenue regulation as a vehicle for annual rate increases without the scrutiny of a general rate case creating rate increases for the low-use customers doing the most to constrain usage and help achieve targeted energy savings One proposal to address this has been to impose any resulting surcharges only to above-average usage
Decoupling Case Studies Revenue Regulation Implementation in Six States
31
57 Cavanagh and Howat (2012 May 2) Finding common ground between consumer and environmental advocates Electricity Policy
58 The most common criticism of future test years is that utilities forecast costs under an assumption that all authorized personnel positions will be filled while in retrospect any large organization has some level of vacancy in its employee count A historic test year captures this effect fully
customers and any resulting credits only to below-average usage57
Rate Case RequirementRequirements as to the frequency of rate cases can be
tied to the recovery mechanism or to the entire regulatory framework for implementing revenue regulation In the cases studied two of the utilities require periodic rate cases PGampE every three years and WPS every year Two others National Grid and HECO require annual mini rate cases explained later in which adjustments are made and two others IPC and BGE have no requirements for scheduled rate cases Nevertheless if the concern is to ensure that the utilityrsquos revenue recovery meets its revenue requirements some kind of periodic rate case to examine costs is appropriate Having periodic rate cases can provide a measure of assurance to consumer advocates that the level at which the revenues and hence the rates are set is correct One of the criticisms of revenue regulation is in fact the lack of rate cases to produce a proper level of confidence in the allowed amounts Multiple surcharges are usually additive to existing rates therefore not permitting an opportunity to reduce the base rate for reductions in cost Moreover the infrequency in cases impedes the examination of rate allocations as would occur through a cost of service study
This is a particular issue where utilities are augmenting power supply with purchased power from independent power producers which is the most common method for acquiring wind and solar production today The increased cost for purchased power may flow through a fuel and purchased power adjustment mechanism while the (depreciating) investment in conventional power plants remains static in base rates
Both PGampE and WPS use a future test year that allows the utility to project revenue requirements during the time period that the rates are to be in effect The benefit to this is that it can help identify and account for projected changes in costs over the timeframe between rate cases However given that these costs are utility projections most consumer advocates have less confidence in these numbers than they would using actual numbers from a historical or only hybrid test year58 When trying to garner support for revenue regulation from more skeptical stakeholders using a future test year may not be helpful Furthermore in the case of WPS that has annual rate cases using a future test year becomes less justifiable as revenues are recalculated annually anyway
The absence of a rate case requirement can also cause consternation among detractors of revenue regulation because of the belief that the utility will be guaranteed its revenue requirements for as long as it is satisfied with that level irrespective of how well it manages However this is no different from the status quo in traditional regulation in most places The incentive to manage well is always there with or without revenue regulation as it translates into more profit for the utility
In the cases of HECO and National Grid the mini rate cases serve two purposes In the one instance it serves as a means to reconcile revenue recovery with revenue requirements and in the second instance it provides an opportunity to adjust rates in accordance with changes in costs Specifically for National Grid the revenue requirement is adjusted to reflect capital expenditures For HECO revenues are adjusted to reflect changes in the cost of service In the two examples here revenue regulation is wrapped in with other adjustments as part of a mini adjustment Given the structure for determining revenue requirements which accounts for changes in costs including revenue regulation within the mini rate cases is a workable option
These examples highlight how rate cases can be used to adjust revenue requirements either in a more controlled regulatory environment with frequent rate cases or left to the utilityrsquos discretion to decide when to adjust costs A set schedule of periodic rate cases such as that used by PGampE may strike an appropriate balance for reviewing revenue requirements however with the modification of a partial historical partial forecasted test year Frequent rate cases can depending on the resources of the regulator and stakeholders be too costly and time-intensive When there are too many rate cases stakeholders and regulators may not be able to dedicate the level of resources needed for any one proceeding and may be spread too thin Regular known rate cases at reasonable intervals may strike the best balance of adequate review and adjustment of revenue requirements
Decoupling Case Studies Revenue Regulation Implementation in Six States
32
Collection Mechanism and TimingThe collection mechanism for the differential between
actual and authorized revenue requirements varies by util-ity as well Both PGampE and WPS do not have adjustment clauses or surcharges but instead have structured their revenue regulation plans to recover their costs in a rate case with rates adjusted annually Although PGampE has rate cases every three years the utility files its preliminary forecast every September 1 for the following year including adjust-ments for revenue regulation and other costs This practice promotes transparency keeping all stakeholders aware of the current situation of the utility IPC BGE National Grid and HECO use surcharges on customer bills to collect or credit the difference between actual revenues collected and the revenue requirement Although the other three (IPC National Grid and HECO) calculate the rate adjustment annually only BGE does a more contemporaneous adjust-ment of one month Certainly where there are no regularly scheduled rate cases using an adjustment mechanism becomes more critical PGampE has created a tracking mecha-nism known as a balancing account that allows the utility to track the surpluses and deficits to help ensure accuracy at year end when rates are actually adjusted The creation of such monthly balancing accounts will make it easier at the end of the year to track what happened each month and then determine the adjustment for that year It provides a more detailed trail for review and analysis by stakeholders and regulators However other mechanisms that just look at total revenues as compared to revenue requirements at the end of the year can work as well
Table 7
Rate Case Requirements
Table 8
Rate Adjustments
Table 9
Allocation of Surplus or Deficit
Pacific Gas amp Electric
Idaho Power Company
Baltimore Gas amp Electric
Wisconsin Public Service Corporation
National Grid
Hawaiian Electric Company
Pacific Gas amp Electric
Idaho Power Company
Baltimore Gas amp Electric
Wisconsin Public Service Corporation
National Grid
Hawaiian Electric Company
Pacific Gas amp Electric
Idaho Power Company
Baltimore Gas amp Electric
Wisconsin Public Service Corporation
National Grid
Hawaiian Electric Company
Every three years annual ldquoattritionrdquo adjustments in between
No requirement
No requirement
Annual rate case
Annual capital expenditure adjustment case
Abbreviated annual rate case
Base rates adjusted annually
Annual adjustment through surcharge
Monthly adjustment through surcharge
Annual adjustment through rate case
Annual adjustment
Annual adjustment
Allocated to all customers according to business unit (eg electric distribution electric generation)
Included in the annual adjustment mechanism for each customer class
Separate for each customer class
Allocated to all customers except certain tariffs (see above)
Separate for each customer class
Separate for residential and commercialindustrial
Allocation of Revenue Regulation Revenue Surpluses or Deficits
The allocation of revenue regulation revenue surpluses or deficits should be symmetrical so that overpayments are credited to customers just as underpayments are paid by those same customers The six utilities studied fol-low that formula The application of revenue regulation however varies from utility to utility BGE and IPC ap-ply revenue regulation to the residential and commercial classes thereby excluding industrial customers In contrast however PGampE WPS National Grid and HECO allocate revenue regulation adjustments to all customer classes In terms of how the costs are allocated IPC BGE WPS National Grid and HECO allocate costs differently among the customer classes PGampE however allocates costs uni-formly among the customers Because PGampE has separated its business units it also separately calculates and allocates
Decoupling Case Studies Revenue Regulation Implementation in Six States
33
Table 10
Carrying Charges
Table 11
Cap on Rate Adjustment
Pacific Gas amp Electric
Idaho Power Company
Baltimore Gas amp Electric
Wisconsin Public Service Corporation
National Grid
Hawaiian Electric CompanyPacific Gas amp Electric
Idaho Power Company
Baltimore Gas amp Electric
Wisconsin Public Service Corporation
National Grid
Hawaiian Electric Company
None
Yes
None
Yes at the short-term debt rate
Yes at the customer deposit rate
Yes at the customer deposit rateNo
3 rate cap excess carried over to next period
10 rate cap excess carried over to next period
Cap of $14 million per year
$170 million in CapEx
No
revenue regulation surpluses and deficits among its electric distribution gas distribution and electric generation busi-nesses This illustrates that there are several ways to address revenues from revenue regulation depending on the policy outcomes that are desired
Carrying ChargesCarrying charges applied to uncollected or surplus rev-
enues can be used to account for the time value of money and the lost opportunity or value to having those revenues in hand PGampE and BGE do not accrue carrying charges On the other hand IPC WPS National Grid and HECO do For BGE given that the revenue regulation revenues are reconciled and recovered monthly it would make little sense to include a carrying cost Where carrying costs have been used they have included in the cases of these utili-ties the short-term debt rate or the customer deposit rate which for one utility is six percent and probably close to the short-term debt rate Thus the carrying charge rates are appropriately at the lower end of the spectrum reflecting their short-term nature In the application of the carrying charge symmetry should be preserved by applying it to both deficits and surpluses Application of carrying charges given the short period that costs are carried (one year) is somewhat discretionary Although it does more accurately account for costs it does add a modest level of complica-tion in tracking costs
Rate Caps and CollarsOne of the ways to protect customers in the event of sig-
nificant adjustments is to impose a rate cap (or collar) that limits the amount of a rate increase (and decrease) Some customers are sensitive to changes in foundational costs like utility bills and if costs are going to rise they benefit from a pattern of steady modest increases rather than a large step increase Any structural increases in rates attributable
to reductions in sales or increases in costs recognized by the revenue regulation plan would be eventually included in rates under any system A cap reflects a controlled way to manage customer expectations and customer impacts Structural changes can only be managed for a while until a complete rate case is needed to reset all assumptions
Typically when a rate cap is imposed if the formulaic increase exceeds the cap or collar the utility will be able to carry over any uncollected revenues until the next rate adjustment Two of the utilities studied PGampE and HECO do not have rate caps On the other hand the other four utilities do include rate caps in varying amounts National Grid has a one-percent revenue cap whereas IPC and BGE have a one-percent and a ten-percent rate cap respectively WPS unlike the others has a cap tied to the dollar amount of $14 million as opposed to a percentage Consistent with the goals of revenue regulation all of the utilities studied have a carryover provision that is important for reducing the risk that the utility will not recover its revenue require-ments
Note that National Grid differs from BGE and HECO in that its cap is on revenues whereas the other two utilities cap rates and rate impacts A revenue cap is more focused on ensuring minimal change to the revenue requirements authorized by the commission National Grid as discussed previously allows for mini rate cases to adjust the rev-enue requirements Having the one-percent cap limits the amount of increase that can occur through that process requiring revenue changes that are greater to occur in a full rate case However note also that some of the adjustments allowed in the mini rate case have their own separate cap The IPC rate cap is in line with what many other utilities with caps have in place which generally range from one to three percent The ten-percent rate cap in the BGE plan is
Decoupling Case Studies Revenue Regulation Implementation in Six States
34
59 Morgan P (2012 December) Graceful Systems LLC A decade of decoupling for US energy utilities rate impacts designs and observa-tions p5
reflective of its monthly adjustment pattern An annual ad-justment allows more time to smooth out peaks and valleys in revenues whereas a monthly adjustment will be influ-enced by more of the spikes (particularly weather-driven variation) thus the need for a larger bandwidth for the car-ryover Like a variable energy rate or fuel adjustment clause that fluctuates monthly the monthly adjustment introduces more volatility into the rates
Actual Historical AdjustmentsFor many ratepayer advocates there is a concern that
some of the utility management risk will be transferred to customers as a consequence of a policy that seeks to ensure that the utility will be made whole However the utility re-tains management risk and the requirement to demonstrate that it has acted prudently Thus the utility still has just as much of an incentive to operate efficiently as it did without revenue regulation If the utility can lower its costs it can still increase its profits Second by designing rates symmet-rically such that under- and over-recoveries are reconciled it provides customers with an opportunity to obtain credits that under traditional regulation would be retained by the utility It has often been opined that when there are large
gaps in time between utility rate cases it is because the utility is over-earning and exceeding its revenue require-ments In those instances customers never get to examine what the utility is collecting much less receive a refund Under revenue regulation with its periodic adjustments and scheduled general rate cases the revenue requirements are examined and refunds or credits allocated such that customers have a better knowledge base for understanding the utilityrsquos earnings And annual reconciliation of the util-ityrsquos actual revenues versus authorized revenues provides consumers with a tool to reign in excess revenue recovery beyond authorized amounts Third the adjustments that do occur under revenue regulation are manageable and frequently less than the adjustments customers are used to seeing on their bills for fuel or variable generation rates or for the myriad of other surcharges that can be tacked on to a customerrsquos bill such as an infrastructure (smart grid) sur-charge maintenance upgrade fee regulatory asset charge or system benefit charge
As seen in Figure 1 the range of rate impacts cluster around plus or minus two percent but can at times exceed plus or minus five percent The total of surcharges has somewhat exceeded the total of credits
Figure 1
Total Utility Decoupling Adjustment Rate Impacts59
300
250
200
150
100
50
0
Nu
mber
of
Dec
oup
lin
g A
dju
stm
ents
Over -5 -4 to -5 -3 to -4 -2 to -3 -1 to -2 0 to -1 0 to 1 1 to 2 2 to 3 3 to 4 4 to 5 Over 5
Percentage Rate Impacts
SurchargesRefunds
ResidentialAll
Other
Commercial
Total
Decoupling Case Studies Revenue Regulation Implementation in Six States
35
60 Id p 3
61 Schultz T Energy Efficiency at Idaho Power Available at httpwwwenergyidahogovenergyalliancedida_powerpdf
As can be seen with the utilities studied above the larger fluctuations are attributable to adjustment mechanisms that are reconciled more frequently such as monthly as those are less able to smooth out anomalies as an annual adjust-ment would do From a dollar perspective for the roughly 64 percent of adjustments that fall within the plus or minus two-percent range the monthly bill impact is approxi-mately $230 for average electric customers and $140 for average gas customers60
Of the six utilities studied the fluctuations in adjustment have for the most part stayed within the one- to three-per-cent range as shown below
bull PGampE from 2005 to 2012 has had annual revenue regulation adjustments ranging from minus143 percent to 415 percent with an average adjustment of 197 percent
bull For IPC the adjustments are separated between residential and commercial customers For residential customers the annual adjustments from 2007 through 2011 ranged from 077 percent to 258 percent for an average of 162 percent As for the commercial customers the annual adjustments for that same period were higher ranging from 104 percent to 424 percent with an average adjustment of 252 percent
bull BGE has monthly adjustments that ranged from minus1853 percent to 3013 percent with an average of 057 percent for residential customers from March 2008 through August 2012 For General Service Customers the monthly adjustment ranged from minus2264 percent to 2462 percent The average adjustment was 1308 percent
bull For WPS the annual adjustments from 2009 through 2011 ranged from minus145 percent to 378 percent for residential and small commercial and from minus314 percent to 899 percent for commercial Note that because of a $14 million per year cap some of these percentages were carried over The average annual adjustment for residential and small commercial and for commercial was 163 percent and 215 percent respectively with carry-overs to subsequent years
bull For Massachusetts Electric and Nantucket Electric both of which operate under National Grid the annual revenue regulation adjustment for all for 2011 and 2012 was minus0105 percent and 0315 percent for an average revenue regulation adjustment over the two years of 0105 percent
bull HECO like National Grid has one annual revenue
regulation mechanism for its customers which resulted in adjustments in 2011 and 2012 of 063 percent and 107 percent respectively for an average adjustment of 085 percent
As can be gleaned from the above information the range of average adjustments for small use customers was a low of 0105 percent for National Grid to a high of 197 percent for PGampE For larger use customers the range was a low of 0105 percent for National Grid to a high of 252 percent for IPC This demonstrates that on average for these utilities with well-developed and diversely designed revenue regula-tion proposals their adjustments on average stayed at or below approximately 25 percent
One of the metrics for determining if a revenue regula-tion program is working successfully that was discussed above was the impact on rates of a revenue regulation mechanism As can be seen by the analysis of the adjust-ment levels for each of the utilities they are within a rea-sonable range
Complementary Policies Although a revenue regulation mechanism does not need
to be accompanied by other policies energy efficiency is frequently at the root of the reason revenue regulation was proposed in the first place The states examined in this pa-per have various obligations for energy efficiency achieve-ment placed upon their utilities Only Idaho does not have an Energy Efficiency Resource Standard but energy efficiency objectives are developed through an integrated resource plan process Energy efficiency spending at IPC has increased dramatically in recent years61
In recognition of the fact that revenue regulation only removes the disincentive to pursue energy efficiency several states have instituted some form of incentives to reward the desired outcome This mechanism can not only incentivize management to aggressively pursue energy efficiency but also make shareholders supportive in the face of lost invest-ment opportunity
Rate design can also play an important part in assist-ing the utility in achieving favorable energy efficiency outcomes Inclining block rates penalize inefficient use of electricity and shorten payback times from the customer perspective Because efficiency reduces consumption at
Decoupling Case Studies Revenue Regulation Implementation in Six States
36
62 Optional rate designs for PGampE include TOU and Peak Time Pricing
63 IPC also has an optional TOU rate design
64 Optional rate designs for this utility include TOU Critical Peak Pricing and Contract
65 National Grid also offers optional TOU and flat rate designs
66 HECO also offers optional TOU and flat rate designs
67 See eg Alexander B (1996 April) How to construct a service quality index in performance-based ratemaking Electricity Policy
the tail block rate the value of kWh savings is greater than with flat rates On the other side of the spectrum declining block rates which have a reduced rate in the tail block do little to encourage conservation In fact they operate more like a discounted bulk rate by reducing the average cost of a kWh in a customerrsquos bill for the more kWh used
Performance incentives or other ways to avoid destruc-tive cost-cutting in the name of creating margins that reduce service or reliability or lessen customer value have been implemented only in Massachusetts of the six utilities illustrated here Several other states have implemented vari-ous schemes in reaction to perceived deficiencies in utility service67 Performance incentives are not unique to rev-enue regulation Commissions wishing to implement such a scheme can find many models of incentive reward and penalty mechanisms developed for other purposes
Taken together a suite of policy and program features can create an atmosphere that is conducive to achievement of energy efficiency goals within the utility and for the customers By appropriate application of these techniques regulators working with utilities and stakeholders can remove barriers and create an opportunity for energy ef-ficiency to be fully integrated into the utility supply option portfolio
Energy Efficiency OutcomesAlthough revenue regulation itself does not create an
incentive for a utility to implement energy efficiency it does address the issue of lost revenues associated with energy
Table 12
Complementary Policies for Energy Efficiency
Pacific Gas amp Electric62
Idaho Power Company63
Baltimore Gas amp Electric
Wisconsin Public Service Corporation64
National Grid65
Hawaiian Electric Company66
Energy Efficiency Requirement
1 annually
IRP
10 by 2015
075 annually
24 annually
Energy efficiency can satisfy portion of RPS
Default Residential Rate Design
Inclining block
Inclining block
TOU seasonal
Flat
Inclining block
Inclining block
Incentive Structure
Risk reward incentive mechanism
No
No
No
5 of program costs
Third-party administrator paid for contract performance
Performance Incentives
Reliability reporting only
None
Under consideration
Reliability reporting only
Service quality reward and penalty
Under consideration
efficiency and DG programs Revenue regulation should be combined with other mechanisms that require or incentiv-ize the implementation of energy efficiency by the utility or a third party The level of energy efficiency achieved can be one measure of the success of a revenue regulation mechanism as implemented in a larger program designed to achieve energy efficiency Table 13 shows the incremental annual energy efficiency savings reported by each utility with the shaded box indicating the year that the utilityrsquos revenue regulation mechanism was implemented National Grid had achieved a high level of energy efficiency savings in the years before it implemented revenue regulation
This paper has not evaluated DG outcomes to correlate with revenue regulation as it is not perceived that states and utilities have made that connection expressly in histori-cal mechanisms However it is expected that this connec-
Decoupling Case Studies Revenue Regulation Implementation in Six States
37
68 EIA Form EIA-861 data files Available at httpwwweiagovelectricitydataeia861
69 PGampE began revenue regulation in 1974 and it was later suspended and recommenced in 2001
70 WPS savings are represented by the statewide program savings from the Focus on Energy program WPS provided additional funds to Focus on Energy starting in CY10 through their territory-wide program activities
71 In 2009 Hawaii Energy a ratepayer-funded statewide energy efficiency provider began delivering services Savings reported after 2009 represent savings achieved through the programs of Hawaii Energy
Table 13
Annual Incremental Energy Efficiency Savings as Percentage of Retail Sales68
Highlighted cells are the year that utility started decoupling
Pacific Gas amp Electric69
Idaho Power Company
Baltimore Gas amp Electric
Wisconsin Public Service Corporation70
National Grid
Hawaiian Electric Company71
2004
11
01
00
03
11
00
2005
16
03
00
03
09
05
2006
10
05
00
03
12
05
2010
19
13
17
09
136
12
tion will be made in future mechanisms and furthermore it is anticipated that follow on work to this paper will want to study that connection between revenue regulation and DG performance
Conclusions
An increasing number of states are looking to increase the rate of energy efficiency investments for their long-run cost and risk advantages The benefits of energy efficiency include not only its ability to reduce system costs across the distribution transmission and generation functions but also the opportunity for customers to reduce their individ-ual energy costs for their own electric bills Nevertheless it is counterintuitive to encourage or order a utility to sell less of its product In order to encourage the proliferation of en-ergy efficiency programs as a solution that can contribute to this nationrsquos energy needs this tension between the goals of society versus the goals of the utility needs to be addressed Revenue regulation can be such a solution by removing the link between sales and revenues
There are many ways to implement revenue regulation and multiple decision points that regulators must consider in designing a revenue regulation mechanism This paper focused on six utilities each of which implemented revenue regulation in different ways in accordance with the objectives of that state Different decision points discussed include
bull Should revenue regulation apply to all functions (generation transmission and distribution) which sometimes depends on if the utility is regulated or restructured
bull Should revenue regulation apply to all customer classes
bull Should there be symmetry such that a reconciliation adjustment occurs for both over- and under-recoveries of the revenue requirements
bull Should recovery of indicated surcharges be conditioned on acceptable performance on customer service quality or energy efficiency goals
bull Should there be an attrition adjustment to account for other expenses or should the revenue regulation adjustment be limited to reconciling existing revenue requirements
bull Should there be an inflation adjustmentbull To calculate the revenue requirements should the
current or accrual method be usedbull Should the adjustments be made in rate cases or
through a riderbull How frequently should adjustments be made
monthly annually or some other time periodbull Depending on the period of time between true up and
recovery should there be carrying charges and if so how should they be calculated
2007
21
06
00
03
09
04
2008
35
10
05
09
05
05
2009
20
11
06
10
11
11
Decoupling Case Studies Revenue Regulation Implementation in Six States
38
72 Avista Utilities (2009) Washington Utilities and Transportation Commission Docket UE-090134
bull Should there be a requirement authorizing the frequency of rate case
bull Should there be an annual cap on the amount of the adjustment and if so should there be an opportunity to carry over any additional amounts and for how many years
bull Should there be an adjustment to the cost of capital to reflect the reduced risk
Other considerations for regulators whether or not they implement revenue regulation but certainly as part of a comprehensive package are other measures that can be put in place to encourage consumers and utilities alike to actively participate in energy efficiency For example an inclining block rate structure by virtue of its incentive to consume less pairs well with an energy efficiency program helps drive consumers to participate in efficiency programs and accelerates the payback of an energy efficiency investment By the same token an incentive payment to the utility helps provide its management with a good reason to excel and exceed targets for energy efficiency programs
A key point illustrated by the list of considerations above is that there is not just one static way to design and implement revenue regulation but rather there are a variety of options for doing so In this study a diverse group of utilities were reviewed The differences among the utilities included geographic diversity vertically integrated and restructured utilities different levels of energy efficiency in place and certainly differences in how the revenue regulation mechanisms were implemented No two utilities were alike and no two utilities had the same revenue regulation mechanism The key is that revenue regulation should eliminate the throughput incentive but the means for accomplishing this goal can vary and be tailored to each jurisdiction and each utility and still be successful
There are several considerations in the design of a revenue regulation mechanism that can help ensure its successful adoption To begin revenue regulation should be granted to utilities only as a precondition to implementing comprehensive energy efficiency andor DG policies Unless accompanied by a commitment to engage in providing least-cost resource options that could impact sales there is not really any good policy reason for its adoption All of the utilities studied are actively engaging in energy efficiency Furthermore as a matter of fairness the revenue regulation mechanism should be symmetrical so that any revenues above those authorized are refunded back to consumers As Figure 1 demonstrates although there are more surcharges to customers there is nevertheless a healthy amount of
credits back to consumers This is the bargain Barring imprudence or other unforeseen circumstances the utility receives its authorized revenue requirements and nothing more or less under a simple revenue regulation mechanism
Rate design plays an important role in the effectiveness of energy efficiency in concert with revenue regulation A low customer charge is preferable so that the customer can benefit from real bill reductions tied to reduced volumetric consumption Reductions in consumption not only reduce bills but also positively impact the payback period for investments in energy efficient appliances Declining block rates in which the tail block rate is lower than the first tier also do not encourage conservation Inclining block rates that reward low usage in the first block with a lower rate send the better price signals None of the six utilities studied had declining block residential rates They were inclining flat and time-varying
The revenue adjustment mechanism is also a critical decision point in terms of whether a revenue per customer mechanism is adopted that accounts for only the current revenue requirements or whether latitude is given to include an inflation adjustment or other cost increases in the revenue adjustment mechanism Three of the utilities studied adopted this approach whereas another two used a hybrid approach Finally to reduce volatility five of the six utilities opted for annual rather than monthly adjustments thereby creating a level of rate stability that customers in general prefer
Once the goals for revenue regulation are set by the regulators the next step is to design programs that will implement that goal For energy efficiency to be as successful as possible regulators may want to adopt a complement of other policies to accompany revenue regulation These can include rate designs that reward reduced use and conservation as well as incentive payments to utilities that reward them for meeting or exceeding targets Of the six utilities studied three have adopted some form of incentive One simple approach that was used in Washington was to link recovery of any surcharges under the revenue regulation mechanism to achievement of energy efficiency targets72
For the utilities examined above that have implemented revenue regulation the evidence demonstrates that revenue regulation as a strategy and a mechanism to enable
Decoupling Case Studies Revenue Regulation Implementation in Six States
39
energy efficiency has been working well The fact that each revenue regulation mechanism varies from the next demonstrates that there are many different paths that can be followed in implementing revenue regulation based on the needs of the utility and its stakeholders in a particular
region This study demonstrates that revenue regulation does work and provides examples of how it can be implemented each one different and unique because of the number of decision points to be considered in designing a revenue regulation mechanism
Decoupling Case Studies Revenue Regulation Implementation in Six States
40
Appendix
Historic Rate Adjustments
Table 14
PGampE Revenue Regulation Rate Adjustments 1983 to 199373
Table 15
PGampE Revenue Regulation Adjustments 2005 to 201274
Table 16
IPC Revenue Regulation Adjustments76
Idaho Power Company
1983 23
1984 (34)
1985 (48)
1986 19
1987 21
1988 50
1989 (43)
1990 (54)
1991 39
1992 34
1993 00
2005 8925 minus12773 minus143
2006 9933 2246 226
2007 10409 21727 209
2008 10261 4032 039
2009 11169 10355 093
2010 11224 46556 415
2011 10306 38390 373
2012 11032 40304 365
2007 Residential minus00457 590 minus077
Commercial minus00457 428 minus107
2008 Residential 00529 670 090
Commercial 00529 510 104
2009 Residential 01220 770 158
Commercial 01535 603 255
2010 Residential 01800 785 229
Commercial 02273 613 371
2011 Residential 02028 785 258
Commercial 02597 613 424
Revenue Regulation Adjustment as of
Total Rates
Delivery Revenue
Requirement ($ millions)
Adjustment Rate
Revenue Regulation Adjustment($ millions)
Retail Rate
of Delivery Revenue
Revenue Regulation Adjustment
Year
Year
73 Lesh P (2009 June 30) Rate impacts and key design elements of gas and electric utility decoupling
74 Morgan P (2012 November) A decade of decoupling for US energy utilities rate impacts designs and observations
75 Morgan P (2012 November) A decade of decoupling for US energy utilities rate impacts designs and observations
76 All numbers provided by the utility
Decoupling Case Studies Revenue Regulation Implementation in Six States
41
77 Idaho Power Company Case No IPC-E-11-19- fixed cost adjustment permanent mechanism Available at httpwwwpucidahogovinternetcaseselecIPCIPCE1119company20120928COMPLIANCE20FILINGPDF
Figure 2
IPC Revenue Regulation Adjustments77
Residential FCA Balance and Use per Customer
$10000000
$8000000
$6000000
$4000000
$2000000
$0
-$2000000
-$4000000
-$6000000
1080
1070
1060
1050
1040
1030
1020
1010
1000Res
idu
al A
uth
oriz
ed F
CA
Am
oun
t
Residual Authorized FCA Amount ($)
Monthly Use Per Customer (kWh)
kW
h U
sed
2006 2007 2008 2009 2010 2011
78 Morgan P (2012 November) A decade of decoupling for US energy utilities rate impacts designs and observations
Decoupling Case Studies Revenue Regulation Implementation in Six States
42
Table 17a
Baltimore Gas and ElectricBGE Monthly Revenue Regulation Adjustments 2008 to 201278
Table 17b
Baltimore Gas and ElectricBGE Monthly Revenue Regulation Adjustments 2008 to 201278
March Residential 000172 01477 1165General Service 000230 01526 1507
April Residential 000016 01477 0108General Service 000146 01526 0957
May Residential 000066 01477 0447General Service 000230 01526 1507
June Residential minus000066 01477 minus0447General Service 000230 01526 1507
July Residential 000158 01477 1070General Service 000230 01526 1507
August Residential minus000040 01477 minus0271General Service 000214 01526 1402
September Residential 000237 01477 1605General Service 000230 01526 1507
October Residential 000237 01477 1605General Service 000143 01526 0937
November Residential 000237 01477 1605General Service 000140 01526 0917
December Residential 000445 01477 3013General Service 000230 01526 1507
January Residential 000035 01579 0222General Service minus000073 01346 minus0542
February Residential 000025 01579 0158General Service 000230 01346 1709
March Residential minus000237 01579 minus1501General Service 000230 01346 1709
April Residential minus000237 01579 minus1501General Service 000230 01346 1709
May Residential 000234 01579 1482General Service 000132 01346 0981
June Residential 000237 01579 1501General Service 000230 01346 1709
July Residential 000237 01579 1501General Service 000230 01346 1709
August Residential 000237 01579 1501General Service 000190 01346 1412
September Residential 000237 01579 1501General Service 000230 01346 1709
October Residential 000237 01579 1501General Service 000124 01346 0921
November Residential 000237 01579 1501General Service 000230 01346 1709
December Residential 000156 01579 0988General Service 000204 01346 1516
Adjustment $kWh
Adjustment $kWh2008 2009
Retail Rate
$kWh
Retail Rate
$kWhAdjustment
Adjustment
Decoupling Case Studies Revenue Regulation Implementation in Six States
43
Table 17c
Baltimore Gas and ElectricBGE Monthly Revenue Regulation Adjustments 2008 to 201278
Table 17d
Baltimore Gas and ElectricBGE Monthly Revenue Regulation Adjustments 2008 to 201278
January Residential 000203 01465 1386General Service 000230 01261 1824
February Residential minus000142 01465 minus0969General Service 000230 01261 1824
March Residential minus000237 01465 minus1618General Service 000230 01261 1824
April Residential minus000237 01465 minus1618General Service 000230 01261 1824
May Residential 000192 01465 1311General Service 000230 01261 1824
June Residential 000191 01465 1304General Service 000230 01261 1824
July Residential 000095 01465 0648General Service 000230 01261 1824
August Residential minus000176 01465 minus1201General Service 000224 01261 1776
September Residential minus000237 01465 minus1618General Service 000116 01261 0920
October Residential minus000237 01465 minus1618General Service 000081 01261 0642
November Residential minus000237 01465 minus1618General Service 000098 01261 0777
December Residential minus000079 01465 minus0539General Service 000229 01261 1816
January Residential minus000130 01365 minus0952General Service 000230 01156 1990
February Residential minus000253 01365 minus1853General Service minus000020 01156 minus0173
March Residential minus000018 01365 minus0132General Service minus000063 01156 minus0545
April Residential 000110 01365 0806General Service minus000262 01156 minus2266
May Residential 000010 01365 0073General Service minus000160 01156 minus1384
June Residential 000226 01365 1656General Service 000042 01156 0363
July Residential 000253 01365 1853General Service 000209 01156 1808
August Residential minus000007 01365 minus0051General Service minus000157 01156 minus1358
September Residential minus000253 01365 minus1853General Service minus000177 01156 minus1531
October Residential 000228 01365 1670General Service 000262 01156 2266
November Residential minus000059 01365 minus0432General Service 000262 01156 2266
December Residential 000071 01365 0520General Service 000262 01156 2266
Adjustment $kWh
Adjustment $kWh2010 2011
Retail Rate
$kWh
Retail Rate
$kWhAdjustment
Adjustment
Decoupling Case Studies Revenue Regulation Implementation in Six States
44
Table 17e
Baltimore Gas and ElectricBGE Monthly Revenue Regulation Adjustments 2008 to 201278
January Residential 000253 01291 1960General Service 000262 01064 2462
February Residential 000253 01291 1960General Service 000262 01064 2462
March Residential 000253 01291 1960General Service 000262 01064 2462
April Residential 000253 01291 1960General Service 000262 01064 2462
May Residential 000253 01291 1960General Service 000262 01064 2462
June Residential 000253 01291 1960General Service 000262 01064 2462
July Residential 000253 01291 1960General Service 000262 01064 2462
August Residential 000253 01291 1960General Service 000160 01064 1504
Adjustment $kWh2012
Retail Rate
$kWhAdjustment
Decoupling Case Studies Revenue Regulation Implementation in Six States
45
79 Morgan P (2012 November) A decade of decoupling for US energy utilities rate impacts designs and observations
80 Morgan P (2012 November) A decade of decoupling for US energy utilities rate impacts designs and observations
Table 18
Wisconsin Public Service Corporation Revenue Regulation Adjustments 2009 to 201179
2009 ResidentialSmall Commercial 00048705 000168154 01290 378 130Commercial 00084951 000293293 00945 899 310
2010 ResidentialSmall Commercial 00033043 000166936 01291 256 129Commercial 00056630 000286103 09460 060 030
2011 ResidentialSmall Commercial (00018666) $ (000163719) 01288 minus145 minus127Commercial (00032565) $ (000285629) 01037 minus314 minus275
Derived Adjustment
$kWh
Derived Adjustment Capped $
kWh
Retail Rate
$kWh
Revenue Regulation Actual
Revenue Regulation Capped
Table 19
National Grid Revenue Regulation Adjustments 2011-201276
Massachusetts Electric and Nantucket Electric
Table 20
Hawaiian Electric Company
2011 All minus0015 1429 minus0105
2012 All 0044 1396 0315
2011 01995 3149 063
2012 03894 3641 107
Revenue Regulation Adjustment
centkWh
Revenue Regulation Adjustment
centkWhRetail Rate
centkWh
Retail Rate
Revenue Regulation Adjustment
Revenue Regulation
ldquoThe 2011 adjustment took effect June 1 but was reduced to $0 on July 26 2011 when the Commission granted HECO an interim rate increase of $532 million in a 2011 test year general rate case The 2012 Adjustment runs from June 1 2012 through May 31 2013 About 25 of the total relates to the portion of the decoupling mechanism that updates OampM and rate baserdquo (Morgan 2013)
Decoupling Case Studies Revenue Regulation Implementation in Six States
46
Revenue Regulation and Decoupling A Guide to Theory and Applicationhttpwwwraponlineorgdocumentdownloadid902
This guide was prepared to assist anyone who needs to understand both the mechanics of a regulatory tool known as decoupling and the policy issues associated with its use This would include public utility commissioners and staff utility management advocates and others with a stake in the regulated energy system While this guide is somewhat technical at points we have tried to make it accessible to a broad audience to make comprehensible the underlying concepts and the implications of different design choices This guide includes a detailed case study that demonstrates the impacts of decoupling using different pricing structures (rate designs) and usage patterns
Pricing Dorsquos and Donrsquots Designing Retail Rates as if Efficiency Countshttpwwwraponlineorgdocumentdownloadid939
Rate design is a crucial element of an overall regulatory strategy that fosters energy efficiency and sends appropriate signals about efficient system investment and operations Rate design is also fully under the control of state regulators Progressive rate design elements can guide consumers to participate in energy efficiency programs and reduce peak demand yet relatively few utilities and commissions have implemented many of these elements This RAP paper identifies some best practices Because pricing issues tie closely to utility growth incentives we also address revenue decoupling
A Decade of Decoupling for US Energy Utilities Rate Impacts Designs and Observationshttpwwwraponlineorgdocumentdownloadid6356
This report written by Pamela Morgan of Graceful Systems LLC builds on a 2009 report Now covering 25 states including 49 LDCs and 24 electric utilities this report summarizes the decoupling mechanism designs these utilities use and the rate adjustments they have made under those mechanisms In total this report estimates the retail rate impacts of 1244 decoupling mechanism adjustments since 2005
Additional Resources
The Role of Decoupling Where Energy Efficiency is Required by Lawhttpwwwraponlineorgdocumentdownloadid275
This Issuesletter gives an overview of energy efficiency resource standards the need to decouple utility profits from utility sales and explains why decoupling is needed even where a third party administers energy efficiency programs
Revenue Decoupling Standards and Criteria A Report to the Minnesota Public Utilities Commissionhttpwwwraponlineorgdocumentdownloadid850
In 2007 the Minnesota legislature enacted a new statute Section 216B2412 in which it defined an alternative approach to utility regulation decoupling and directed the Public Utilities Commission (PUC) to ldquoestablish criteria and standardsrdquo by which decoupling could be adopted for the statersquos rate-regulated utilitiesTo fulfill its obligation to develop criteria and standards for decoupling the PUC sought the advice of the Regulatory Assistance Project (RAP) This report is the output of that collaboration
Designing Distributed Generation Tariffs Wellhttpwwwraponlineorgdocumentdownloadid6898
Improvements in distributed generation economics increasing consumer preference for clean distributed energy resources and a favorable policy environment in many states have combined to produce significant increases in distributed generation adoption in the United States Regulators are looking for the well-designed tariff that compensates distributed generation adopters fairly for the value they provide to the electric system compensates the utility fairly for the grid services it provides and charges non-participating consumers fairly for the value of the services they receive This paper offers regulatory options for dealing with distributed generation The authors outline current tariffs and ponder what regulators should consider as they weigh the benefits costs and net value to distributed generation adopters non-adopters the utility and society as a whole The paper highlights the importance of deciding upon a valuation methodology so that the presence or absence of cross-subsidies can be determined Finally the paper offers rate design and ratemaking options for regulators to consider and includes recommendations for fairly implementing tariffs and ratemaking treatments to promote the public interest and ensure fair compensation
Decoupling Case Studies Revenue Regulation Implementation in Six States
47
The Regulatory Assistance Project (RAP)trade is a global non-profit team of experts focused on thelong-term economic and environmental sustainability of the power sector We provide technical and policy assistance on regulatory and market policies that promote economic efficiency environmental protection system reliability and the fair allocation of system benefits among consumers We work extensively in the US China the European Union and India Visit our website at wwwraponlineorg to learn more about our work
Rate Design Where Advanced Metering Infrastructure Has Not Been Fully Deployedhttpwwwraponlineorgdocumentdownloadid6516
This paper identifies sound practices in rate design applied around the globe using conventional metering technology Rate design for most residential and small commercial customers (mass market consumers) is most often reflected in a simple monthly access charge and a per-kWh usage rate in one or more blocks and one or more seasons A central theme across the practices highlighted in this paper is that of sending effective pricing signals through the usage-sensitive components of rates in a way that reflects the character of underlying long-run costs associated with production and usage While new technology is enabling innovations in rate design that carry some promise of better capturing opportunities for more responsive load the majority of the worldrsquos electricity usage is expected to remain under conventional pricing at least through the end of the decade and much longer in some areas Experience to date has shown that the traditional approaches to rate design persist well after the enabling technology is in place that leads to change
Time-Varying and Dynamic Rate Designhttpwwwraponlineorgdocumentdownloadid5131
This report discusses important issues in the design and deployment of time-varying rates The term time-varying rates is used in this report as encompassing traditional time-of-use rates (such as time-of-day rates and seasonal rates) as well as newer dynamic pricing rates (such as critical peak pricing and real time pricing) The discussion is primarily focused on residential customers and small commercial customers who are collectively referred to as the mass market The report also summarizes international experience with time-varying rate offerings
50 State Street Suite 3Montpelier Vermont 05602802-223-8199wwwraponlineorg
- Table of Contents
- Introduction
- California Pacific Gas and Electric Company
- Idaho Idaho Power Company
- Maryland Baltimore Gas and Electric
- Wisconsin Wisconsin Public Service Corporation
- Massachusetts National Grid
- Hawaii Hawaiian Electric Company
- Discussion of the Six Utilities Overall
- Conclusions
- Appendix
- Additional Resources
-

Decoupling Case Studies Revenue Regulation Implementation in Six States
32
Collection Mechanism and TimingThe collection mechanism for the differential between
actual and authorized revenue requirements varies by util-ity as well Both PGampE and WPS do not have adjustment clauses or surcharges but instead have structured their revenue regulation plans to recover their costs in a rate case with rates adjusted annually Although PGampE has rate cases every three years the utility files its preliminary forecast every September 1 for the following year including adjust-ments for revenue regulation and other costs This practice promotes transparency keeping all stakeholders aware of the current situation of the utility IPC BGE National Grid and HECO use surcharges on customer bills to collect or credit the difference between actual revenues collected and the revenue requirement Although the other three (IPC National Grid and HECO) calculate the rate adjustment annually only BGE does a more contemporaneous adjust-ment of one month Certainly where there are no regularly scheduled rate cases using an adjustment mechanism becomes more critical PGampE has created a tracking mecha-nism known as a balancing account that allows the utility to track the surpluses and deficits to help ensure accuracy at year end when rates are actually adjusted The creation of such monthly balancing accounts will make it easier at the end of the year to track what happened each month and then determine the adjustment for that year It provides a more detailed trail for review and analysis by stakeholders and regulators However other mechanisms that just look at total revenues as compared to revenue requirements at the end of the year can work as well
Table 7
Rate Case Requirements
Table 8
Rate Adjustments
Table 9
Allocation of Surplus or Deficit
Pacific Gas amp Electric
Idaho Power Company
Baltimore Gas amp Electric
Wisconsin Public Service Corporation
National Grid
Hawaiian Electric Company
Pacific Gas amp Electric
Idaho Power Company
Baltimore Gas amp Electric
Wisconsin Public Service Corporation
National Grid
Hawaiian Electric Company
Pacific Gas amp Electric
Idaho Power Company
Baltimore Gas amp Electric
Wisconsin Public Service Corporation
National Grid
Hawaiian Electric Company
Every three years annual ldquoattritionrdquo adjustments in between
No requirement
No requirement
Annual rate case
Annual capital expenditure adjustment case
Abbreviated annual rate case
Base rates adjusted annually
Annual adjustment through surcharge
Monthly adjustment through surcharge
Annual adjustment through rate case
Annual adjustment
Annual adjustment
Allocated to all customers according to business unit (eg electric distribution electric generation)
Included in the annual adjustment mechanism for each customer class
Separate for each customer class
Allocated to all customers except certain tariffs (see above)
Separate for each customer class
Separate for residential and commercialindustrial
Allocation of Revenue Regulation Revenue Surpluses or Deficits
The allocation of revenue regulation revenue surpluses or deficits should be symmetrical so that overpayments are credited to customers just as underpayments are paid by those same customers The six utilities studied fol-low that formula The application of revenue regulation however varies from utility to utility BGE and IPC ap-ply revenue regulation to the residential and commercial classes thereby excluding industrial customers In contrast however PGampE WPS National Grid and HECO allocate revenue regulation adjustments to all customer classes In terms of how the costs are allocated IPC BGE WPS National Grid and HECO allocate costs differently among the customer classes PGampE however allocates costs uni-formly among the customers Because PGampE has separated its business units it also separately calculates and allocates
Decoupling Case Studies Revenue Regulation Implementation in Six States
33
Table 10
Carrying Charges
Table 11
Cap on Rate Adjustment
Pacific Gas amp Electric
Idaho Power Company
Baltimore Gas amp Electric
Wisconsin Public Service Corporation
National Grid
Hawaiian Electric CompanyPacific Gas amp Electric
Idaho Power Company
Baltimore Gas amp Electric
Wisconsin Public Service Corporation
National Grid
Hawaiian Electric Company
None
Yes
None
Yes at the short-term debt rate
Yes at the customer deposit rate
Yes at the customer deposit rateNo
3 rate cap excess carried over to next period
10 rate cap excess carried over to next period
Cap of $14 million per year
$170 million in CapEx
No
revenue regulation surpluses and deficits among its electric distribution gas distribution and electric generation busi-nesses This illustrates that there are several ways to address revenues from revenue regulation depending on the policy outcomes that are desired
Carrying ChargesCarrying charges applied to uncollected or surplus rev-
enues can be used to account for the time value of money and the lost opportunity or value to having those revenues in hand PGampE and BGE do not accrue carrying charges On the other hand IPC WPS National Grid and HECO do For BGE given that the revenue regulation revenues are reconciled and recovered monthly it would make little sense to include a carrying cost Where carrying costs have been used they have included in the cases of these utili-ties the short-term debt rate or the customer deposit rate which for one utility is six percent and probably close to the short-term debt rate Thus the carrying charge rates are appropriately at the lower end of the spectrum reflecting their short-term nature In the application of the carrying charge symmetry should be preserved by applying it to both deficits and surpluses Application of carrying charges given the short period that costs are carried (one year) is somewhat discretionary Although it does more accurately account for costs it does add a modest level of complica-tion in tracking costs
Rate Caps and CollarsOne of the ways to protect customers in the event of sig-
nificant adjustments is to impose a rate cap (or collar) that limits the amount of a rate increase (and decrease) Some customers are sensitive to changes in foundational costs like utility bills and if costs are going to rise they benefit from a pattern of steady modest increases rather than a large step increase Any structural increases in rates attributable
to reductions in sales or increases in costs recognized by the revenue regulation plan would be eventually included in rates under any system A cap reflects a controlled way to manage customer expectations and customer impacts Structural changes can only be managed for a while until a complete rate case is needed to reset all assumptions
Typically when a rate cap is imposed if the formulaic increase exceeds the cap or collar the utility will be able to carry over any uncollected revenues until the next rate adjustment Two of the utilities studied PGampE and HECO do not have rate caps On the other hand the other four utilities do include rate caps in varying amounts National Grid has a one-percent revenue cap whereas IPC and BGE have a one-percent and a ten-percent rate cap respectively WPS unlike the others has a cap tied to the dollar amount of $14 million as opposed to a percentage Consistent with the goals of revenue regulation all of the utilities studied have a carryover provision that is important for reducing the risk that the utility will not recover its revenue require-ments
Note that National Grid differs from BGE and HECO in that its cap is on revenues whereas the other two utilities cap rates and rate impacts A revenue cap is more focused on ensuring minimal change to the revenue requirements authorized by the commission National Grid as discussed previously allows for mini rate cases to adjust the rev-enue requirements Having the one-percent cap limits the amount of increase that can occur through that process requiring revenue changes that are greater to occur in a full rate case However note also that some of the adjustments allowed in the mini rate case have their own separate cap The IPC rate cap is in line with what many other utilities with caps have in place which generally range from one to three percent The ten-percent rate cap in the BGE plan is
Decoupling Case Studies Revenue Regulation Implementation in Six States
34
59 Morgan P (2012 December) Graceful Systems LLC A decade of decoupling for US energy utilities rate impacts designs and observa-tions p5
reflective of its monthly adjustment pattern An annual ad-justment allows more time to smooth out peaks and valleys in revenues whereas a monthly adjustment will be influ-enced by more of the spikes (particularly weather-driven variation) thus the need for a larger bandwidth for the car-ryover Like a variable energy rate or fuel adjustment clause that fluctuates monthly the monthly adjustment introduces more volatility into the rates
Actual Historical AdjustmentsFor many ratepayer advocates there is a concern that
some of the utility management risk will be transferred to customers as a consequence of a policy that seeks to ensure that the utility will be made whole However the utility re-tains management risk and the requirement to demonstrate that it has acted prudently Thus the utility still has just as much of an incentive to operate efficiently as it did without revenue regulation If the utility can lower its costs it can still increase its profits Second by designing rates symmet-rically such that under- and over-recoveries are reconciled it provides customers with an opportunity to obtain credits that under traditional regulation would be retained by the utility It has often been opined that when there are large
gaps in time between utility rate cases it is because the utility is over-earning and exceeding its revenue require-ments In those instances customers never get to examine what the utility is collecting much less receive a refund Under revenue regulation with its periodic adjustments and scheduled general rate cases the revenue requirements are examined and refunds or credits allocated such that customers have a better knowledge base for understanding the utilityrsquos earnings And annual reconciliation of the util-ityrsquos actual revenues versus authorized revenues provides consumers with a tool to reign in excess revenue recovery beyond authorized amounts Third the adjustments that do occur under revenue regulation are manageable and frequently less than the adjustments customers are used to seeing on their bills for fuel or variable generation rates or for the myriad of other surcharges that can be tacked on to a customerrsquos bill such as an infrastructure (smart grid) sur-charge maintenance upgrade fee regulatory asset charge or system benefit charge
As seen in Figure 1 the range of rate impacts cluster around plus or minus two percent but can at times exceed plus or minus five percent The total of surcharges has somewhat exceeded the total of credits
Figure 1
Total Utility Decoupling Adjustment Rate Impacts59
300
250
200
150
100
50
0
Nu
mber
of
Dec
oup
lin
g A
dju
stm
ents
Over -5 -4 to -5 -3 to -4 -2 to -3 -1 to -2 0 to -1 0 to 1 1 to 2 2 to 3 3 to 4 4 to 5 Over 5
Percentage Rate Impacts
SurchargesRefunds
ResidentialAll
Other
Commercial
Total
Decoupling Case Studies Revenue Regulation Implementation in Six States
35
60 Id p 3
61 Schultz T Energy Efficiency at Idaho Power Available at httpwwwenergyidahogovenergyalliancedida_powerpdf
As can be seen with the utilities studied above the larger fluctuations are attributable to adjustment mechanisms that are reconciled more frequently such as monthly as those are less able to smooth out anomalies as an annual adjust-ment would do From a dollar perspective for the roughly 64 percent of adjustments that fall within the plus or minus two-percent range the monthly bill impact is approxi-mately $230 for average electric customers and $140 for average gas customers60
Of the six utilities studied the fluctuations in adjustment have for the most part stayed within the one- to three-per-cent range as shown below
bull PGampE from 2005 to 2012 has had annual revenue regulation adjustments ranging from minus143 percent to 415 percent with an average adjustment of 197 percent
bull For IPC the adjustments are separated between residential and commercial customers For residential customers the annual adjustments from 2007 through 2011 ranged from 077 percent to 258 percent for an average of 162 percent As for the commercial customers the annual adjustments for that same period were higher ranging from 104 percent to 424 percent with an average adjustment of 252 percent
bull BGE has monthly adjustments that ranged from minus1853 percent to 3013 percent with an average of 057 percent for residential customers from March 2008 through August 2012 For General Service Customers the monthly adjustment ranged from minus2264 percent to 2462 percent The average adjustment was 1308 percent
bull For WPS the annual adjustments from 2009 through 2011 ranged from minus145 percent to 378 percent for residential and small commercial and from minus314 percent to 899 percent for commercial Note that because of a $14 million per year cap some of these percentages were carried over The average annual adjustment for residential and small commercial and for commercial was 163 percent and 215 percent respectively with carry-overs to subsequent years
bull For Massachusetts Electric and Nantucket Electric both of which operate under National Grid the annual revenue regulation adjustment for all for 2011 and 2012 was minus0105 percent and 0315 percent for an average revenue regulation adjustment over the two years of 0105 percent
bull HECO like National Grid has one annual revenue
regulation mechanism for its customers which resulted in adjustments in 2011 and 2012 of 063 percent and 107 percent respectively for an average adjustment of 085 percent
As can be gleaned from the above information the range of average adjustments for small use customers was a low of 0105 percent for National Grid to a high of 197 percent for PGampE For larger use customers the range was a low of 0105 percent for National Grid to a high of 252 percent for IPC This demonstrates that on average for these utilities with well-developed and diversely designed revenue regula-tion proposals their adjustments on average stayed at or below approximately 25 percent
One of the metrics for determining if a revenue regula-tion program is working successfully that was discussed above was the impact on rates of a revenue regulation mechanism As can be seen by the analysis of the adjust-ment levels for each of the utilities they are within a rea-sonable range
Complementary Policies Although a revenue regulation mechanism does not need
to be accompanied by other policies energy efficiency is frequently at the root of the reason revenue regulation was proposed in the first place The states examined in this pa-per have various obligations for energy efficiency achieve-ment placed upon their utilities Only Idaho does not have an Energy Efficiency Resource Standard but energy efficiency objectives are developed through an integrated resource plan process Energy efficiency spending at IPC has increased dramatically in recent years61
In recognition of the fact that revenue regulation only removes the disincentive to pursue energy efficiency several states have instituted some form of incentives to reward the desired outcome This mechanism can not only incentivize management to aggressively pursue energy efficiency but also make shareholders supportive in the face of lost invest-ment opportunity
Rate design can also play an important part in assist-ing the utility in achieving favorable energy efficiency outcomes Inclining block rates penalize inefficient use of electricity and shorten payback times from the customer perspective Because efficiency reduces consumption at
Decoupling Case Studies Revenue Regulation Implementation in Six States
36
62 Optional rate designs for PGampE include TOU and Peak Time Pricing
63 IPC also has an optional TOU rate design
64 Optional rate designs for this utility include TOU Critical Peak Pricing and Contract
65 National Grid also offers optional TOU and flat rate designs
66 HECO also offers optional TOU and flat rate designs
67 See eg Alexander B (1996 April) How to construct a service quality index in performance-based ratemaking Electricity Policy
the tail block rate the value of kWh savings is greater than with flat rates On the other side of the spectrum declining block rates which have a reduced rate in the tail block do little to encourage conservation In fact they operate more like a discounted bulk rate by reducing the average cost of a kWh in a customerrsquos bill for the more kWh used
Performance incentives or other ways to avoid destruc-tive cost-cutting in the name of creating margins that reduce service or reliability or lessen customer value have been implemented only in Massachusetts of the six utilities illustrated here Several other states have implemented vari-ous schemes in reaction to perceived deficiencies in utility service67 Performance incentives are not unique to rev-enue regulation Commissions wishing to implement such a scheme can find many models of incentive reward and penalty mechanisms developed for other purposes
Taken together a suite of policy and program features can create an atmosphere that is conducive to achievement of energy efficiency goals within the utility and for the customers By appropriate application of these techniques regulators working with utilities and stakeholders can remove barriers and create an opportunity for energy ef-ficiency to be fully integrated into the utility supply option portfolio
Energy Efficiency OutcomesAlthough revenue regulation itself does not create an
incentive for a utility to implement energy efficiency it does address the issue of lost revenues associated with energy
Table 12
Complementary Policies for Energy Efficiency
Pacific Gas amp Electric62
Idaho Power Company63
Baltimore Gas amp Electric
Wisconsin Public Service Corporation64
National Grid65
Hawaiian Electric Company66
Energy Efficiency Requirement
1 annually
IRP
10 by 2015
075 annually
24 annually
Energy efficiency can satisfy portion of RPS
Default Residential Rate Design
Inclining block
Inclining block
TOU seasonal
Flat
Inclining block
Inclining block
Incentive Structure
Risk reward incentive mechanism
No
No
No
5 of program costs
Third-party administrator paid for contract performance
Performance Incentives
Reliability reporting only
None
Under consideration
Reliability reporting only
Service quality reward and penalty
Under consideration
efficiency and DG programs Revenue regulation should be combined with other mechanisms that require or incentiv-ize the implementation of energy efficiency by the utility or a third party The level of energy efficiency achieved can be one measure of the success of a revenue regulation mechanism as implemented in a larger program designed to achieve energy efficiency Table 13 shows the incremental annual energy efficiency savings reported by each utility with the shaded box indicating the year that the utilityrsquos revenue regulation mechanism was implemented National Grid had achieved a high level of energy efficiency savings in the years before it implemented revenue regulation
This paper has not evaluated DG outcomes to correlate with revenue regulation as it is not perceived that states and utilities have made that connection expressly in histori-cal mechanisms However it is expected that this connec-
Decoupling Case Studies Revenue Regulation Implementation in Six States
37
68 EIA Form EIA-861 data files Available at httpwwweiagovelectricitydataeia861
69 PGampE began revenue regulation in 1974 and it was later suspended and recommenced in 2001
70 WPS savings are represented by the statewide program savings from the Focus on Energy program WPS provided additional funds to Focus on Energy starting in CY10 through their territory-wide program activities
71 In 2009 Hawaii Energy a ratepayer-funded statewide energy efficiency provider began delivering services Savings reported after 2009 represent savings achieved through the programs of Hawaii Energy
Table 13
Annual Incremental Energy Efficiency Savings as Percentage of Retail Sales68
Highlighted cells are the year that utility started decoupling
Pacific Gas amp Electric69
Idaho Power Company
Baltimore Gas amp Electric
Wisconsin Public Service Corporation70
National Grid
Hawaiian Electric Company71
2004
11
01
00
03
11
00
2005
16
03
00
03
09
05
2006
10
05
00
03
12
05
2010
19
13
17
09
136
12
tion will be made in future mechanisms and furthermore it is anticipated that follow on work to this paper will want to study that connection between revenue regulation and DG performance
Conclusions
An increasing number of states are looking to increase the rate of energy efficiency investments for their long-run cost and risk advantages The benefits of energy efficiency include not only its ability to reduce system costs across the distribution transmission and generation functions but also the opportunity for customers to reduce their individ-ual energy costs for their own electric bills Nevertheless it is counterintuitive to encourage or order a utility to sell less of its product In order to encourage the proliferation of en-ergy efficiency programs as a solution that can contribute to this nationrsquos energy needs this tension between the goals of society versus the goals of the utility needs to be addressed Revenue regulation can be such a solution by removing the link between sales and revenues
There are many ways to implement revenue regulation and multiple decision points that regulators must consider in designing a revenue regulation mechanism This paper focused on six utilities each of which implemented revenue regulation in different ways in accordance with the objectives of that state Different decision points discussed include
bull Should revenue regulation apply to all functions (generation transmission and distribution) which sometimes depends on if the utility is regulated or restructured
bull Should revenue regulation apply to all customer classes
bull Should there be symmetry such that a reconciliation adjustment occurs for both over- and under-recoveries of the revenue requirements
bull Should recovery of indicated surcharges be conditioned on acceptable performance on customer service quality or energy efficiency goals
bull Should there be an attrition adjustment to account for other expenses or should the revenue regulation adjustment be limited to reconciling existing revenue requirements
bull Should there be an inflation adjustmentbull To calculate the revenue requirements should the
current or accrual method be usedbull Should the adjustments be made in rate cases or
through a riderbull How frequently should adjustments be made
monthly annually or some other time periodbull Depending on the period of time between true up and
recovery should there be carrying charges and if so how should they be calculated
2007
21
06
00
03
09
04
2008
35
10
05
09
05
05
2009
20
11
06
10
11
11
Decoupling Case Studies Revenue Regulation Implementation in Six States
38
72 Avista Utilities (2009) Washington Utilities and Transportation Commission Docket UE-090134
bull Should there be a requirement authorizing the frequency of rate case
bull Should there be an annual cap on the amount of the adjustment and if so should there be an opportunity to carry over any additional amounts and for how many years
bull Should there be an adjustment to the cost of capital to reflect the reduced risk
Other considerations for regulators whether or not they implement revenue regulation but certainly as part of a comprehensive package are other measures that can be put in place to encourage consumers and utilities alike to actively participate in energy efficiency For example an inclining block rate structure by virtue of its incentive to consume less pairs well with an energy efficiency program helps drive consumers to participate in efficiency programs and accelerates the payback of an energy efficiency investment By the same token an incentive payment to the utility helps provide its management with a good reason to excel and exceed targets for energy efficiency programs
A key point illustrated by the list of considerations above is that there is not just one static way to design and implement revenue regulation but rather there are a variety of options for doing so In this study a diverse group of utilities were reviewed The differences among the utilities included geographic diversity vertically integrated and restructured utilities different levels of energy efficiency in place and certainly differences in how the revenue regulation mechanisms were implemented No two utilities were alike and no two utilities had the same revenue regulation mechanism The key is that revenue regulation should eliminate the throughput incentive but the means for accomplishing this goal can vary and be tailored to each jurisdiction and each utility and still be successful
There are several considerations in the design of a revenue regulation mechanism that can help ensure its successful adoption To begin revenue regulation should be granted to utilities only as a precondition to implementing comprehensive energy efficiency andor DG policies Unless accompanied by a commitment to engage in providing least-cost resource options that could impact sales there is not really any good policy reason for its adoption All of the utilities studied are actively engaging in energy efficiency Furthermore as a matter of fairness the revenue regulation mechanism should be symmetrical so that any revenues above those authorized are refunded back to consumers As Figure 1 demonstrates although there are more surcharges to customers there is nevertheless a healthy amount of
credits back to consumers This is the bargain Barring imprudence or other unforeseen circumstances the utility receives its authorized revenue requirements and nothing more or less under a simple revenue regulation mechanism
Rate design plays an important role in the effectiveness of energy efficiency in concert with revenue regulation A low customer charge is preferable so that the customer can benefit from real bill reductions tied to reduced volumetric consumption Reductions in consumption not only reduce bills but also positively impact the payback period for investments in energy efficient appliances Declining block rates in which the tail block rate is lower than the first tier also do not encourage conservation Inclining block rates that reward low usage in the first block with a lower rate send the better price signals None of the six utilities studied had declining block residential rates They were inclining flat and time-varying
The revenue adjustment mechanism is also a critical decision point in terms of whether a revenue per customer mechanism is adopted that accounts for only the current revenue requirements or whether latitude is given to include an inflation adjustment or other cost increases in the revenue adjustment mechanism Three of the utilities studied adopted this approach whereas another two used a hybrid approach Finally to reduce volatility five of the six utilities opted for annual rather than monthly adjustments thereby creating a level of rate stability that customers in general prefer
Once the goals for revenue regulation are set by the regulators the next step is to design programs that will implement that goal For energy efficiency to be as successful as possible regulators may want to adopt a complement of other policies to accompany revenue regulation These can include rate designs that reward reduced use and conservation as well as incentive payments to utilities that reward them for meeting or exceeding targets Of the six utilities studied three have adopted some form of incentive One simple approach that was used in Washington was to link recovery of any surcharges under the revenue regulation mechanism to achievement of energy efficiency targets72
For the utilities examined above that have implemented revenue regulation the evidence demonstrates that revenue regulation as a strategy and a mechanism to enable
Decoupling Case Studies Revenue Regulation Implementation in Six States
39
energy efficiency has been working well The fact that each revenue regulation mechanism varies from the next demonstrates that there are many different paths that can be followed in implementing revenue regulation based on the needs of the utility and its stakeholders in a particular
region This study demonstrates that revenue regulation does work and provides examples of how it can be implemented each one different and unique because of the number of decision points to be considered in designing a revenue regulation mechanism
Decoupling Case Studies Revenue Regulation Implementation in Six States
40
Appendix
Historic Rate Adjustments
Table 14
PGampE Revenue Regulation Rate Adjustments 1983 to 199373
Table 15
PGampE Revenue Regulation Adjustments 2005 to 201274
Table 16
IPC Revenue Regulation Adjustments76
Idaho Power Company
1983 23
1984 (34)
1985 (48)
1986 19
1987 21
1988 50
1989 (43)
1990 (54)
1991 39
1992 34
1993 00
2005 8925 minus12773 minus143
2006 9933 2246 226
2007 10409 21727 209
2008 10261 4032 039
2009 11169 10355 093
2010 11224 46556 415
2011 10306 38390 373
2012 11032 40304 365
2007 Residential minus00457 590 minus077
Commercial minus00457 428 minus107
2008 Residential 00529 670 090
Commercial 00529 510 104
2009 Residential 01220 770 158
Commercial 01535 603 255
2010 Residential 01800 785 229
Commercial 02273 613 371
2011 Residential 02028 785 258
Commercial 02597 613 424
Revenue Regulation Adjustment as of
Total Rates
Delivery Revenue
Requirement ($ millions)
Adjustment Rate
Revenue Regulation Adjustment($ millions)
Retail Rate
of Delivery Revenue
Revenue Regulation Adjustment
Year
Year
73 Lesh P (2009 June 30) Rate impacts and key design elements of gas and electric utility decoupling
74 Morgan P (2012 November) A decade of decoupling for US energy utilities rate impacts designs and observations
75 Morgan P (2012 November) A decade of decoupling for US energy utilities rate impacts designs and observations
76 All numbers provided by the utility
Decoupling Case Studies Revenue Regulation Implementation in Six States
41
77 Idaho Power Company Case No IPC-E-11-19- fixed cost adjustment permanent mechanism Available at httpwwwpucidahogovinternetcaseselecIPCIPCE1119company20120928COMPLIANCE20FILINGPDF
Figure 2
IPC Revenue Regulation Adjustments77
Residential FCA Balance and Use per Customer
$10000000
$8000000
$6000000
$4000000
$2000000
$0
-$2000000
-$4000000
-$6000000
1080
1070
1060
1050
1040
1030
1020
1010
1000Res
idu
al A
uth
oriz
ed F
CA
Am
oun
t
Residual Authorized FCA Amount ($)
Monthly Use Per Customer (kWh)
kW
h U
sed
2006 2007 2008 2009 2010 2011
78 Morgan P (2012 November) A decade of decoupling for US energy utilities rate impacts designs and observations
Decoupling Case Studies Revenue Regulation Implementation in Six States
42
Table 17a
Baltimore Gas and ElectricBGE Monthly Revenue Regulation Adjustments 2008 to 201278
Table 17b
Baltimore Gas and ElectricBGE Monthly Revenue Regulation Adjustments 2008 to 201278
March Residential 000172 01477 1165General Service 000230 01526 1507
April Residential 000016 01477 0108General Service 000146 01526 0957
May Residential 000066 01477 0447General Service 000230 01526 1507
June Residential minus000066 01477 minus0447General Service 000230 01526 1507
July Residential 000158 01477 1070General Service 000230 01526 1507
August Residential minus000040 01477 minus0271General Service 000214 01526 1402
September Residential 000237 01477 1605General Service 000230 01526 1507
October Residential 000237 01477 1605General Service 000143 01526 0937
November Residential 000237 01477 1605General Service 000140 01526 0917
December Residential 000445 01477 3013General Service 000230 01526 1507
January Residential 000035 01579 0222General Service minus000073 01346 minus0542
February Residential 000025 01579 0158General Service 000230 01346 1709
March Residential minus000237 01579 minus1501General Service 000230 01346 1709
April Residential minus000237 01579 minus1501General Service 000230 01346 1709
May Residential 000234 01579 1482General Service 000132 01346 0981
June Residential 000237 01579 1501General Service 000230 01346 1709
July Residential 000237 01579 1501General Service 000230 01346 1709
August Residential 000237 01579 1501General Service 000190 01346 1412
September Residential 000237 01579 1501General Service 000230 01346 1709
October Residential 000237 01579 1501General Service 000124 01346 0921
November Residential 000237 01579 1501General Service 000230 01346 1709
December Residential 000156 01579 0988General Service 000204 01346 1516
Adjustment $kWh
Adjustment $kWh2008 2009
Retail Rate
$kWh
Retail Rate
$kWhAdjustment
Adjustment
Decoupling Case Studies Revenue Regulation Implementation in Six States
43
Table 17c
Baltimore Gas and ElectricBGE Monthly Revenue Regulation Adjustments 2008 to 201278
Table 17d
Baltimore Gas and ElectricBGE Monthly Revenue Regulation Adjustments 2008 to 201278
January Residential 000203 01465 1386General Service 000230 01261 1824
February Residential minus000142 01465 minus0969General Service 000230 01261 1824
March Residential minus000237 01465 minus1618General Service 000230 01261 1824
April Residential minus000237 01465 minus1618General Service 000230 01261 1824
May Residential 000192 01465 1311General Service 000230 01261 1824
June Residential 000191 01465 1304General Service 000230 01261 1824
July Residential 000095 01465 0648General Service 000230 01261 1824
August Residential minus000176 01465 minus1201General Service 000224 01261 1776
September Residential minus000237 01465 minus1618General Service 000116 01261 0920
October Residential minus000237 01465 minus1618General Service 000081 01261 0642
November Residential minus000237 01465 minus1618General Service 000098 01261 0777
December Residential minus000079 01465 minus0539General Service 000229 01261 1816
January Residential minus000130 01365 minus0952General Service 000230 01156 1990
February Residential minus000253 01365 minus1853General Service minus000020 01156 minus0173
March Residential minus000018 01365 minus0132General Service minus000063 01156 minus0545
April Residential 000110 01365 0806General Service minus000262 01156 minus2266
May Residential 000010 01365 0073General Service minus000160 01156 minus1384
June Residential 000226 01365 1656General Service 000042 01156 0363
July Residential 000253 01365 1853General Service 000209 01156 1808
August Residential minus000007 01365 minus0051General Service minus000157 01156 minus1358
September Residential minus000253 01365 minus1853General Service minus000177 01156 minus1531
October Residential 000228 01365 1670General Service 000262 01156 2266
November Residential minus000059 01365 minus0432General Service 000262 01156 2266
December Residential 000071 01365 0520General Service 000262 01156 2266
Adjustment $kWh
Adjustment $kWh2010 2011
Retail Rate
$kWh
Retail Rate
$kWhAdjustment
Adjustment
Decoupling Case Studies Revenue Regulation Implementation in Six States
44
Table 17e
Baltimore Gas and ElectricBGE Monthly Revenue Regulation Adjustments 2008 to 201278
January Residential 000253 01291 1960General Service 000262 01064 2462
February Residential 000253 01291 1960General Service 000262 01064 2462
March Residential 000253 01291 1960General Service 000262 01064 2462
April Residential 000253 01291 1960General Service 000262 01064 2462
May Residential 000253 01291 1960General Service 000262 01064 2462
June Residential 000253 01291 1960General Service 000262 01064 2462
July Residential 000253 01291 1960General Service 000262 01064 2462
August Residential 000253 01291 1960General Service 000160 01064 1504
Adjustment $kWh2012
Retail Rate
$kWhAdjustment
Decoupling Case Studies Revenue Regulation Implementation in Six States
45
79 Morgan P (2012 November) A decade of decoupling for US energy utilities rate impacts designs and observations
80 Morgan P (2012 November) A decade of decoupling for US energy utilities rate impacts designs and observations
Table 18
Wisconsin Public Service Corporation Revenue Regulation Adjustments 2009 to 201179
2009 ResidentialSmall Commercial 00048705 000168154 01290 378 130Commercial 00084951 000293293 00945 899 310
2010 ResidentialSmall Commercial 00033043 000166936 01291 256 129Commercial 00056630 000286103 09460 060 030
2011 ResidentialSmall Commercial (00018666) $ (000163719) 01288 minus145 minus127Commercial (00032565) $ (000285629) 01037 minus314 minus275
Derived Adjustment
$kWh
Derived Adjustment Capped $
kWh
Retail Rate
$kWh
Revenue Regulation Actual
Revenue Regulation Capped
Table 19
National Grid Revenue Regulation Adjustments 2011-201276
Massachusetts Electric and Nantucket Electric
Table 20
Hawaiian Electric Company
2011 All minus0015 1429 minus0105
2012 All 0044 1396 0315
2011 01995 3149 063
2012 03894 3641 107
Revenue Regulation Adjustment
centkWh
Revenue Regulation Adjustment
centkWhRetail Rate
centkWh
Retail Rate
Revenue Regulation Adjustment
Revenue Regulation
ldquoThe 2011 adjustment took effect June 1 but was reduced to $0 on July 26 2011 when the Commission granted HECO an interim rate increase of $532 million in a 2011 test year general rate case The 2012 Adjustment runs from June 1 2012 through May 31 2013 About 25 of the total relates to the portion of the decoupling mechanism that updates OampM and rate baserdquo (Morgan 2013)
Decoupling Case Studies Revenue Regulation Implementation in Six States
46
Revenue Regulation and Decoupling A Guide to Theory and Applicationhttpwwwraponlineorgdocumentdownloadid902
This guide was prepared to assist anyone who needs to understand both the mechanics of a regulatory tool known as decoupling and the policy issues associated with its use This would include public utility commissioners and staff utility management advocates and others with a stake in the regulated energy system While this guide is somewhat technical at points we have tried to make it accessible to a broad audience to make comprehensible the underlying concepts and the implications of different design choices This guide includes a detailed case study that demonstrates the impacts of decoupling using different pricing structures (rate designs) and usage patterns
Pricing Dorsquos and Donrsquots Designing Retail Rates as if Efficiency Countshttpwwwraponlineorgdocumentdownloadid939
Rate design is a crucial element of an overall regulatory strategy that fosters energy efficiency and sends appropriate signals about efficient system investment and operations Rate design is also fully under the control of state regulators Progressive rate design elements can guide consumers to participate in energy efficiency programs and reduce peak demand yet relatively few utilities and commissions have implemented many of these elements This RAP paper identifies some best practices Because pricing issues tie closely to utility growth incentives we also address revenue decoupling
A Decade of Decoupling for US Energy Utilities Rate Impacts Designs and Observationshttpwwwraponlineorgdocumentdownloadid6356
This report written by Pamela Morgan of Graceful Systems LLC builds on a 2009 report Now covering 25 states including 49 LDCs and 24 electric utilities this report summarizes the decoupling mechanism designs these utilities use and the rate adjustments they have made under those mechanisms In total this report estimates the retail rate impacts of 1244 decoupling mechanism adjustments since 2005
Additional Resources
The Role of Decoupling Where Energy Efficiency is Required by Lawhttpwwwraponlineorgdocumentdownloadid275
This Issuesletter gives an overview of energy efficiency resource standards the need to decouple utility profits from utility sales and explains why decoupling is needed even where a third party administers energy efficiency programs
Revenue Decoupling Standards and Criteria A Report to the Minnesota Public Utilities Commissionhttpwwwraponlineorgdocumentdownloadid850
In 2007 the Minnesota legislature enacted a new statute Section 216B2412 in which it defined an alternative approach to utility regulation decoupling and directed the Public Utilities Commission (PUC) to ldquoestablish criteria and standardsrdquo by which decoupling could be adopted for the statersquos rate-regulated utilitiesTo fulfill its obligation to develop criteria and standards for decoupling the PUC sought the advice of the Regulatory Assistance Project (RAP) This report is the output of that collaboration
Designing Distributed Generation Tariffs Wellhttpwwwraponlineorgdocumentdownloadid6898
Improvements in distributed generation economics increasing consumer preference for clean distributed energy resources and a favorable policy environment in many states have combined to produce significant increases in distributed generation adoption in the United States Regulators are looking for the well-designed tariff that compensates distributed generation adopters fairly for the value they provide to the electric system compensates the utility fairly for the grid services it provides and charges non-participating consumers fairly for the value of the services they receive This paper offers regulatory options for dealing with distributed generation The authors outline current tariffs and ponder what regulators should consider as they weigh the benefits costs and net value to distributed generation adopters non-adopters the utility and society as a whole The paper highlights the importance of deciding upon a valuation methodology so that the presence or absence of cross-subsidies can be determined Finally the paper offers rate design and ratemaking options for regulators to consider and includes recommendations for fairly implementing tariffs and ratemaking treatments to promote the public interest and ensure fair compensation
Decoupling Case Studies Revenue Regulation Implementation in Six States
47
The Regulatory Assistance Project (RAP)trade is a global non-profit team of experts focused on thelong-term economic and environmental sustainability of the power sector We provide technical and policy assistance on regulatory and market policies that promote economic efficiency environmental protection system reliability and the fair allocation of system benefits among consumers We work extensively in the US China the European Union and India Visit our website at wwwraponlineorg to learn more about our work
Rate Design Where Advanced Metering Infrastructure Has Not Been Fully Deployedhttpwwwraponlineorgdocumentdownloadid6516
This paper identifies sound practices in rate design applied around the globe using conventional metering technology Rate design for most residential and small commercial customers (mass market consumers) is most often reflected in a simple monthly access charge and a per-kWh usage rate in one or more blocks and one or more seasons A central theme across the practices highlighted in this paper is that of sending effective pricing signals through the usage-sensitive components of rates in a way that reflects the character of underlying long-run costs associated with production and usage While new technology is enabling innovations in rate design that carry some promise of better capturing opportunities for more responsive load the majority of the worldrsquos electricity usage is expected to remain under conventional pricing at least through the end of the decade and much longer in some areas Experience to date has shown that the traditional approaches to rate design persist well after the enabling technology is in place that leads to change
Time-Varying and Dynamic Rate Designhttpwwwraponlineorgdocumentdownloadid5131
This report discusses important issues in the design and deployment of time-varying rates The term time-varying rates is used in this report as encompassing traditional time-of-use rates (such as time-of-day rates and seasonal rates) as well as newer dynamic pricing rates (such as critical peak pricing and real time pricing) The discussion is primarily focused on residential customers and small commercial customers who are collectively referred to as the mass market The report also summarizes international experience with time-varying rate offerings
50 State Street Suite 3Montpelier Vermont 05602802-223-8199wwwraponlineorg
- Table of Contents
- Introduction
- California Pacific Gas and Electric Company
- Idaho Idaho Power Company
- Maryland Baltimore Gas and Electric
- Wisconsin Wisconsin Public Service Corporation
- Massachusetts National Grid
- Hawaii Hawaiian Electric Company
- Discussion of the Six Utilities Overall
- Conclusions
- Appendix
- Additional Resources
-
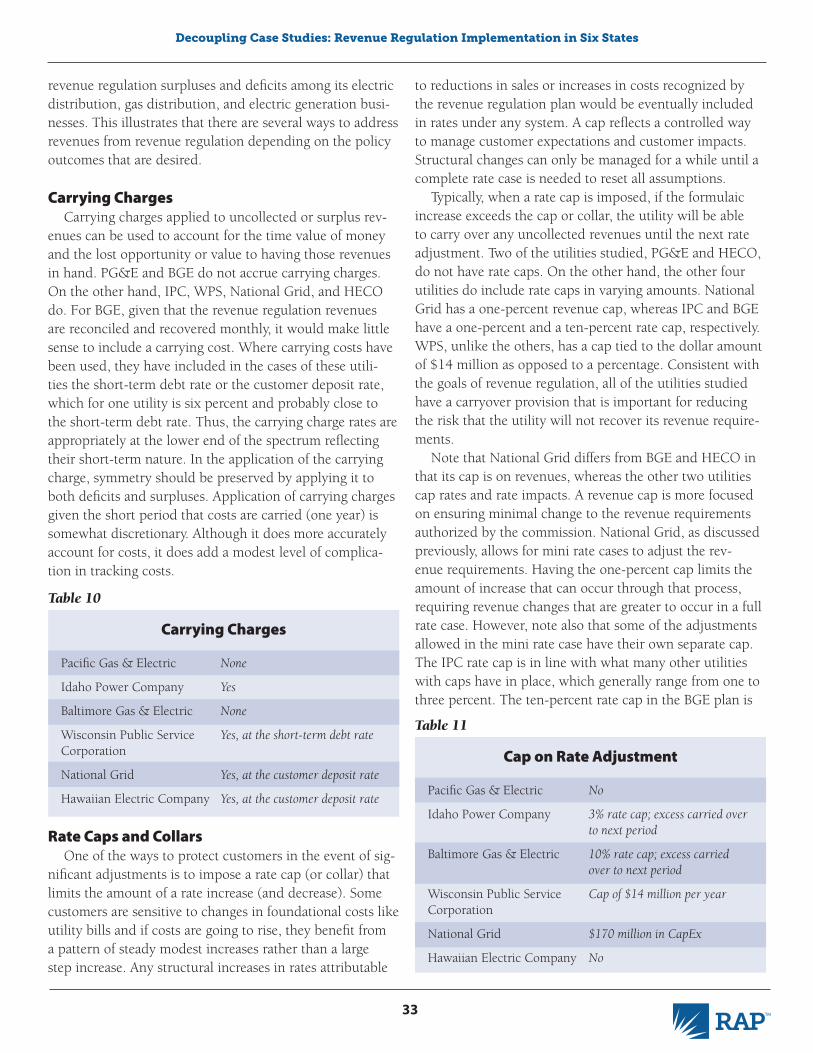
Decoupling Case Studies Revenue Regulation Implementation in Six States
34
59 Morgan P (2012 December) Graceful Systems LLC A decade of decoupling for US energy utilities rate impacts designs and observa-tions p5
reflective of its monthly adjustment pattern An annual ad-justment allows more time to smooth out peaks and valleys in revenues whereas a monthly adjustment will be influ-enced by more of the spikes (particularly weather-driven variation) thus the need for a larger bandwidth for the car-ryover Like a variable energy rate or fuel adjustment clause that fluctuates monthly the monthly adjustment introduces more volatility into the rates
Actual Historical AdjustmentsFor many ratepayer advocates there is a concern that
some of the utility management risk will be transferred to customers as a consequence of a policy that seeks to ensure that the utility will be made whole However the utility re-tains management risk and the requirement to demonstrate that it has acted prudently Thus the utility still has just as much of an incentive to operate efficiently as it did without revenue regulation If the utility can lower its costs it can still increase its profits Second by designing rates symmet-rically such that under- and over-recoveries are reconciled it provides customers with an opportunity to obtain credits that under traditional regulation would be retained by the utility It has often been opined that when there are large
gaps in time between utility rate cases it is because the utility is over-earning and exceeding its revenue require-ments In those instances customers never get to examine what the utility is collecting much less receive a refund Under revenue regulation with its periodic adjustments and scheduled general rate cases the revenue requirements are examined and refunds or credits allocated such that customers have a better knowledge base for understanding the utilityrsquos earnings And annual reconciliation of the util-ityrsquos actual revenues versus authorized revenues provides consumers with a tool to reign in excess revenue recovery beyond authorized amounts Third the adjustments that do occur under revenue regulation are manageable and frequently less than the adjustments customers are used to seeing on their bills for fuel or variable generation rates or for the myriad of other surcharges that can be tacked on to a customerrsquos bill such as an infrastructure (smart grid) sur-charge maintenance upgrade fee regulatory asset charge or system benefit charge
As seen in Figure 1 the range of rate impacts cluster around plus or minus two percent but can at times exceed plus or minus five percent The total of surcharges has somewhat exceeded the total of credits
Figure 1
Total Utility Decoupling Adjustment Rate Impacts59
300
250
200
150
100
50
0
Nu
mber
of
Dec
oup
lin
g A
dju
stm
ents
Over -5 -4 to -5 -3 to -4 -2 to -3 -1 to -2 0 to -1 0 to 1 1 to 2 2 to 3 3 to 4 4 to 5 Over 5
Percentage Rate Impacts
SurchargesRefunds
ResidentialAll
Other
Commercial
Total
Decoupling Case Studies Revenue Regulation Implementation in Six States
35
60 Id p 3
61 Schultz T Energy Efficiency at Idaho Power Available at httpwwwenergyidahogovenergyalliancedida_powerpdf
As can be seen with the utilities studied above the larger fluctuations are attributable to adjustment mechanisms that are reconciled more frequently such as monthly as those are less able to smooth out anomalies as an annual adjust-ment would do From a dollar perspective for the roughly 64 percent of adjustments that fall within the plus or minus two-percent range the monthly bill impact is approxi-mately $230 for average electric customers and $140 for average gas customers60
Of the six utilities studied the fluctuations in adjustment have for the most part stayed within the one- to three-per-cent range as shown below
bull PGampE from 2005 to 2012 has had annual revenue regulation adjustments ranging from minus143 percent to 415 percent with an average adjustment of 197 percent
bull For IPC the adjustments are separated between residential and commercial customers For residential customers the annual adjustments from 2007 through 2011 ranged from 077 percent to 258 percent for an average of 162 percent As for the commercial customers the annual adjustments for that same period were higher ranging from 104 percent to 424 percent with an average adjustment of 252 percent
bull BGE has monthly adjustments that ranged from minus1853 percent to 3013 percent with an average of 057 percent for residential customers from March 2008 through August 2012 For General Service Customers the monthly adjustment ranged from minus2264 percent to 2462 percent The average adjustment was 1308 percent
bull For WPS the annual adjustments from 2009 through 2011 ranged from minus145 percent to 378 percent for residential and small commercial and from minus314 percent to 899 percent for commercial Note that because of a $14 million per year cap some of these percentages were carried over The average annual adjustment for residential and small commercial and for commercial was 163 percent and 215 percent respectively with carry-overs to subsequent years
bull For Massachusetts Electric and Nantucket Electric both of which operate under National Grid the annual revenue regulation adjustment for all for 2011 and 2012 was minus0105 percent and 0315 percent for an average revenue regulation adjustment over the two years of 0105 percent
bull HECO like National Grid has one annual revenue
regulation mechanism for its customers which resulted in adjustments in 2011 and 2012 of 063 percent and 107 percent respectively for an average adjustment of 085 percent
As can be gleaned from the above information the range of average adjustments for small use customers was a low of 0105 percent for National Grid to a high of 197 percent for PGampE For larger use customers the range was a low of 0105 percent for National Grid to a high of 252 percent for IPC This demonstrates that on average for these utilities with well-developed and diversely designed revenue regula-tion proposals their adjustments on average stayed at or below approximately 25 percent
One of the metrics for determining if a revenue regula-tion program is working successfully that was discussed above was the impact on rates of a revenue regulation mechanism As can be seen by the analysis of the adjust-ment levels for each of the utilities they are within a rea-sonable range
Complementary Policies Although a revenue regulation mechanism does not need
to be accompanied by other policies energy efficiency is frequently at the root of the reason revenue regulation was proposed in the first place The states examined in this pa-per have various obligations for energy efficiency achieve-ment placed upon their utilities Only Idaho does not have an Energy Efficiency Resource Standard but energy efficiency objectives are developed through an integrated resource plan process Energy efficiency spending at IPC has increased dramatically in recent years61
In recognition of the fact that revenue regulation only removes the disincentive to pursue energy efficiency several states have instituted some form of incentives to reward the desired outcome This mechanism can not only incentivize management to aggressively pursue energy efficiency but also make shareholders supportive in the face of lost invest-ment opportunity
Rate design can also play an important part in assist-ing the utility in achieving favorable energy efficiency outcomes Inclining block rates penalize inefficient use of electricity and shorten payback times from the customer perspective Because efficiency reduces consumption at
Decoupling Case Studies Revenue Regulation Implementation in Six States
36
62 Optional rate designs for PGampE include TOU and Peak Time Pricing
63 IPC also has an optional TOU rate design
64 Optional rate designs for this utility include TOU Critical Peak Pricing and Contract
65 National Grid also offers optional TOU and flat rate designs
66 HECO also offers optional TOU and flat rate designs
67 See eg Alexander B (1996 April) How to construct a service quality index in performance-based ratemaking Electricity Policy
the tail block rate the value of kWh savings is greater than with flat rates On the other side of the spectrum declining block rates which have a reduced rate in the tail block do little to encourage conservation In fact they operate more like a discounted bulk rate by reducing the average cost of a kWh in a customerrsquos bill for the more kWh used
Performance incentives or other ways to avoid destruc-tive cost-cutting in the name of creating margins that reduce service or reliability or lessen customer value have been implemented only in Massachusetts of the six utilities illustrated here Several other states have implemented vari-ous schemes in reaction to perceived deficiencies in utility service67 Performance incentives are not unique to rev-enue regulation Commissions wishing to implement such a scheme can find many models of incentive reward and penalty mechanisms developed for other purposes
Taken together a suite of policy and program features can create an atmosphere that is conducive to achievement of energy efficiency goals within the utility and for the customers By appropriate application of these techniques regulators working with utilities and stakeholders can remove barriers and create an opportunity for energy ef-ficiency to be fully integrated into the utility supply option portfolio
Energy Efficiency OutcomesAlthough revenue regulation itself does not create an
incentive for a utility to implement energy efficiency it does address the issue of lost revenues associated with energy
Table 12
Complementary Policies for Energy Efficiency
Pacific Gas amp Electric62
Idaho Power Company63
Baltimore Gas amp Electric
Wisconsin Public Service Corporation64
National Grid65
Hawaiian Electric Company66
Energy Efficiency Requirement
1 annually
IRP
10 by 2015
075 annually
24 annually
Energy efficiency can satisfy portion of RPS
Default Residential Rate Design
Inclining block
Inclining block
TOU seasonal
Flat
Inclining block
Inclining block
Incentive Structure
Risk reward incentive mechanism
No
No
No
5 of program costs
Third-party administrator paid for contract performance
Performance Incentives
Reliability reporting only
None
Under consideration
Reliability reporting only
Service quality reward and penalty
Under consideration
efficiency and DG programs Revenue regulation should be combined with other mechanisms that require or incentiv-ize the implementation of energy efficiency by the utility or a third party The level of energy efficiency achieved can be one measure of the success of a revenue regulation mechanism as implemented in a larger program designed to achieve energy efficiency Table 13 shows the incremental annual energy efficiency savings reported by each utility with the shaded box indicating the year that the utilityrsquos revenue regulation mechanism was implemented National Grid had achieved a high level of energy efficiency savings in the years before it implemented revenue regulation
This paper has not evaluated DG outcomes to correlate with revenue regulation as it is not perceived that states and utilities have made that connection expressly in histori-cal mechanisms However it is expected that this connec-
Decoupling Case Studies Revenue Regulation Implementation in Six States
37
68 EIA Form EIA-861 data files Available at httpwwweiagovelectricitydataeia861
69 PGampE began revenue regulation in 1974 and it was later suspended and recommenced in 2001
70 WPS savings are represented by the statewide program savings from the Focus on Energy program WPS provided additional funds to Focus on Energy starting in CY10 through their territory-wide program activities
71 In 2009 Hawaii Energy a ratepayer-funded statewide energy efficiency provider began delivering services Savings reported after 2009 represent savings achieved through the programs of Hawaii Energy
Table 13
Annual Incremental Energy Efficiency Savings as Percentage of Retail Sales68
Highlighted cells are the year that utility started decoupling
Pacific Gas amp Electric69
Idaho Power Company
Baltimore Gas amp Electric
Wisconsin Public Service Corporation70
National Grid
Hawaiian Electric Company71
2004
11
01
00
03
11
00
2005
16
03
00
03
09
05
2006
10
05
00
03
12
05
2010
19
13
17
09
136
12
tion will be made in future mechanisms and furthermore it is anticipated that follow on work to this paper will want to study that connection between revenue regulation and DG performance
Conclusions
An increasing number of states are looking to increase the rate of energy efficiency investments for their long-run cost and risk advantages The benefits of energy efficiency include not only its ability to reduce system costs across the distribution transmission and generation functions but also the opportunity for customers to reduce their individ-ual energy costs for their own electric bills Nevertheless it is counterintuitive to encourage or order a utility to sell less of its product In order to encourage the proliferation of en-ergy efficiency programs as a solution that can contribute to this nationrsquos energy needs this tension between the goals of society versus the goals of the utility needs to be addressed Revenue regulation can be such a solution by removing the link between sales and revenues
There are many ways to implement revenue regulation and multiple decision points that regulators must consider in designing a revenue regulation mechanism This paper focused on six utilities each of which implemented revenue regulation in different ways in accordance with the objectives of that state Different decision points discussed include
bull Should revenue regulation apply to all functions (generation transmission and distribution) which sometimes depends on if the utility is regulated or restructured
bull Should revenue regulation apply to all customer classes
bull Should there be symmetry such that a reconciliation adjustment occurs for both over- and under-recoveries of the revenue requirements
bull Should recovery of indicated surcharges be conditioned on acceptable performance on customer service quality or energy efficiency goals
bull Should there be an attrition adjustment to account for other expenses or should the revenue regulation adjustment be limited to reconciling existing revenue requirements
bull Should there be an inflation adjustmentbull To calculate the revenue requirements should the
current or accrual method be usedbull Should the adjustments be made in rate cases or
through a riderbull How frequently should adjustments be made
monthly annually or some other time periodbull Depending on the period of time between true up and
recovery should there be carrying charges and if so how should they be calculated
2007
21
06
00
03
09
04
2008
35
10
05
09
05
05
2009
20
11
06
10
11
11
Decoupling Case Studies Revenue Regulation Implementation in Six States
38
72 Avista Utilities (2009) Washington Utilities and Transportation Commission Docket UE-090134
bull Should there be a requirement authorizing the frequency of rate case
bull Should there be an annual cap on the amount of the adjustment and if so should there be an opportunity to carry over any additional amounts and for how many years
bull Should there be an adjustment to the cost of capital to reflect the reduced risk
Other considerations for regulators whether or not they implement revenue regulation but certainly as part of a comprehensive package are other measures that can be put in place to encourage consumers and utilities alike to actively participate in energy efficiency For example an inclining block rate structure by virtue of its incentive to consume less pairs well with an energy efficiency program helps drive consumers to participate in efficiency programs and accelerates the payback of an energy efficiency investment By the same token an incentive payment to the utility helps provide its management with a good reason to excel and exceed targets for energy efficiency programs
A key point illustrated by the list of considerations above is that there is not just one static way to design and implement revenue regulation but rather there are a variety of options for doing so In this study a diverse group of utilities were reviewed The differences among the utilities included geographic diversity vertically integrated and restructured utilities different levels of energy efficiency in place and certainly differences in how the revenue regulation mechanisms were implemented No two utilities were alike and no two utilities had the same revenue regulation mechanism The key is that revenue regulation should eliminate the throughput incentive but the means for accomplishing this goal can vary and be tailored to each jurisdiction and each utility and still be successful
There are several considerations in the design of a revenue regulation mechanism that can help ensure its successful adoption To begin revenue regulation should be granted to utilities only as a precondition to implementing comprehensive energy efficiency andor DG policies Unless accompanied by a commitment to engage in providing least-cost resource options that could impact sales there is not really any good policy reason for its adoption All of the utilities studied are actively engaging in energy efficiency Furthermore as a matter of fairness the revenue regulation mechanism should be symmetrical so that any revenues above those authorized are refunded back to consumers As Figure 1 demonstrates although there are more surcharges to customers there is nevertheless a healthy amount of
credits back to consumers This is the bargain Barring imprudence or other unforeseen circumstances the utility receives its authorized revenue requirements and nothing more or less under a simple revenue regulation mechanism
Rate design plays an important role in the effectiveness of energy efficiency in concert with revenue regulation A low customer charge is preferable so that the customer can benefit from real bill reductions tied to reduced volumetric consumption Reductions in consumption not only reduce bills but also positively impact the payback period for investments in energy efficient appliances Declining block rates in which the tail block rate is lower than the first tier also do not encourage conservation Inclining block rates that reward low usage in the first block with a lower rate send the better price signals None of the six utilities studied had declining block residential rates They were inclining flat and time-varying
The revenue adjustment mechanism is also a critical decision point in terms of whether a revenue per customer mechanism is adopted that accounts for only the current revenue requirements or whether latitude is given to include an inflation adjustment or other cost increases in the revenue adjustment mechanism Three of the utilities studied adopted this approach whereas another two used a hybrid approach Finally to reduce volatility five of the six utilities opted for annual rather than monthly adjustments thereby creating a level of rate stability that customers in general prefer
Once the goals for revenue regulation are set by the regulators the next step is to design programs that will implement that goal For energy efficiency to be as successful as possible regulators may want to adopt a complement of other policies to accompany revenue regulation These can include rate designs that reward reduced use and conservation as well as incentive payments to utilities that reward them for meeting or exceeding targets Of the six utilities studied three have adopted some form of incentive One simple approach that was used in Washington was to link recovery of any surcharges under the revenue regulation mechanism to achievement of energy efficiency targets72
For the utilities examined above that have implemented revenue regulation the evidence demonstrates that revenue regulation as a strategy and a mechanism to enable
Decoupling Case Studies Revenue Regulation Implementation in Six States
39
energy efficiency has been working well The fact that each revenue regulation mechanism varies from the next demonstrates that there are many different paths that can be followed in implementing revenue regulation based on the needs of the utility and its stakeholders in a particular
region This study demonstrates that revenue regulation does work and provides examples of how it can be implemented each one different and unique because of the number of decision points to be considered in designing a revenue regulation mechanism
Decoupling Case Studies Revenue Regulation Implementation in Six States
40
Appendix
Historic Rate Adjustments
Table 14
PGampE Revenue Regulation Rate Adjustments 1983 to 199373
Table 15
PGampE Revenue Regulation Adjustments 2005 to 201274
Table 16
IPC Revenue Regulation Adjustments76
Idaho Power Company
1983 23
1984 (34)
1985 (48)
1986 19
1987 21
1988 50
1989 (43)
1990 (54)
1991 39
1992 34
1993 00
2005 8925 minus12773 minus143
2006 9933 2246 226
2007 10409 21727 209
2008 10261 4032 039
2009 11169 10355 093
2010 11224 46556 415
2011 10306 38390 373
2012 11032 40304 365
2007 Residential minus00457 590 minus077
Commercial minus00457 428 minus107
2008 Residential 00529 670 090
Commercial 00529 510 104
2009 Residential 01220 770 158
Commercial 01535 603 255
2010 Residential 01800 785 229
Commercial 02273 613 371
2011 Residential 02028 785 258
Commercial 02597 613 424
Revenue Regulation Adjustment as of
Total Rates
Delivery Revenue
Requirement ($ millions)
Adjustment Rate
Revenue Regulation Adjustment($ millions)
Retail Rate
of Delivery Revenue
Revenue Regulation Adjustment
Year
Year
73 Lesh P (2009 June 30) Rate impacts and key design elements of gas and electric utility decoupling
74 Morgan P (2012 November) A decade of decoupling for US energy utilities rate impacts designs and observations
75 Morgan P (2012 November) A decade of decoupling for US energy utilities rate impacts designs and observations
76 All numbers provided by the utility
Decoupling Case Studies Revenue Regulation Implementation in Six States
41
77 Idaho Power Company Case No IPC-E-11-19- fixed cost adjustment permanent mechanism Available at httpwwwpucidahogovinternetcaseselecIPCIPCE1119company20120928COMPLIANCE20FILINGPDF
Figure 2
IPC Revenue Regulation Adjustments77
Residential FCA Balance and Use per Customer
$10000000
$8000000
$6000000
$4000000
$2000000
$0
-$2000000
-$4000000
-$6000000
1080
1070
1060
1050
1040
1030
1020
1010
1000Res
idu
al A
uth
oriz
ed F
CA
Am
oun
t
Residual Authorized FCA Amount ($)
Monthly Use Per Customer (kWh)
kW
h U
sed
2006 2007 2008 2009 2010 2011
78 Morgan P (2012 November) A decade of decoupling for US energy utilities rate impacts designs and observations
Decoupling Case Studies Revenue Regulation Implementation in Six States
42
Table 17a
Baltimore Gas and ElectricBGE Monthly Revenue Regulation Adjustments 2008 to 201278
Table 17b
Baltimore Gas and ElectricBGE Monthly Revenue Regulation Adjustments 2008 to 201278
March Residential 000172 01477 1165General Service 000230 01526 1507
April Residential 000016 01477 0108General Service 000146 01526 0957
May Residential 000066 01477 0447General Service 000230 01526 1507
June Residential minus000066 01477 minus0447General Service 000230 01526 1507
July Residential 000158 01477 1070General Service 000230 01526 1507
August Residential minus000040 01477 minus0271General Service 000214 01526 1402
September Residential 000237 01477 1605General Service 000230 01526 1507
October Residential 000237 01477 1605General Service 000143 01526 0937
November Residential 000237 01477 1605General Service 000140 01526 0917
December Residential 000445 01477 3013General Service 000230 01526 1507
January Residential 000035 01579 0222General Service minus000073 01346 minus0542
February Residential 000025 01579 0158General Service 000230 01346 1709
March Residential minus000237 01579 minus1501General Service 000230 01346 1709
April Residential minus000237 01579 minus1501General Service 000230 01346 1709
May Residential 000234 01579 1482General Service 000132 01346 0981
June Residential 000237 01579 1501General Service 000230 01346 1709
July Residential 000237 01579 1501General Service 000230 01346 1709
August Residential 000237 01579 1501General Service 000190 01346 1412
September Residential 000237 01579 1501General Service 000230 01346 1709
October Residential 000237 01579 1501General Service 000124 01346 0921
November Residential 000237 01579 1501General Service 000230 01346 1709
December Residential 000156 01579 0988General Service 000204 01346 1516
Adjustment $kWh
Adjustment $kWh2008 2009
Retail Rate
$kWh
Retail Rate
$kWhAdjustment
Adjustment
Decoupling Case Studies Revenue Regulation Implementation in Six States
43
Table 17c
Baltimore Gas and ElectricBGE Monthly Revenue Regulation Adjustments 2008 to 201278
Table 17d
Baltimore Gas and ElectricBGE Monthly Revenue Regulation Adjustments 2008 to 201278
January Residential 000203 01465 1386General Service 000230 01261 1824
February Residential minus000142 01465 minus0969General Service 000230 01261 1824
March Residential minus000237 01465 minus1618General Service 000230 01261 1824
April Residential minus000237 01465 minus1618General Service 000230 01261 1824
May Residential 000192 01465 1311General Service 000230 01261 1824
June Residential 000191 01465 1304General Service 000230 01261 1824
July Residential 000095 01465 0648General Service 000230 01261 1824
August Residential minus000176 01465 minus1201General Service 000224 01261 1776
September Residential minus000237 01465 minus1618General Service 000116 01261 0920
October Residential minus000237 01465 minus1618General Service 000081 01261 0642
November Residential minus000237 01465 minus1618General Service 000098 01261 0777
December Residential minus000079 01465 minus0539General Service 000229 01261 1816
January Residential minus000130 01365 minus0952General Service 000230 01156 1990
February Residential minus000253 01365 minus1853General Service minus000020 01156 minus0173
March Residential minus000018 01365 minus0132General Service minus000063 01156 minus0545
April Residential 000110 01365 0806General Service minus000262 01156 minus2266
May Residential 000010 01365 0073General Service minus000160 01156 minus1384
June Residential 000226 01365 1656General Service 000042 01156 0363
July Residential 000253 01365 1853General Service 000209 01156 1808
August Residential minus000007 01365 minus0051General Service minus000157 01156 minus1358
September Residential minus000253 01365 minus1853General Service minus000177 01156 minus1531
October Residential 000228 01365 1670General Service 000262 01156 2266
November Residential minus000059 01365 minus0432General Service 000262 01156 2266
December Residential 000071 01365 0520General Service 000262 01156 2266
Adjustment $kWh
Adjustment $kWh2010 2011
Retail Rate
$kWh
Retail Rate
$kWhAdjustment
Adjustment
Decoupling Case Studies Revenue Regulation Implementation in Six States
44
Table 17e
Baltimore Gas and ElectricBGE Monthly Revenue Regulation Adjustments 2008 to 201278
January Residential 000253 01291 1960General Service 000262 01064 2462
February Residential 000253 01291 1960General Service 000262 01064 2462
March Residential 000253 01291 1960General Service 000262 01064 2462
April Residential 000253 01291 1960General Service 000262 01064 2462
May Residential 000253 01291 1960General Service 000262 01064 2462
June Residential 000253 01291 1960General Service 000262 01064 2462
July Residential 000253 01291 1960General Service 000262 01064 2462
August Residential 000253 01291 1960General Service 000160 01064 1504
Adjustment $kWh2012
Retail Rate
$kWhAdjustment
Decoupling Case Studies Revenue Regulation Implementation in Six States
45
79 Morgan P (2012 November) A decade of decoupling for US energy utilities rate impacts designs and observations
80 Morgan P (2012 November) A decade of decoupling for US energy utilities rate impacts designs and observations
Table 18
Wisconsin Public Service Corporation Revenue Regulation Adjustments 2009 to 201179
2009 ResidentialSmall Commercial 00048705 000168154 01290 378 130Commercial 00084951 000293293 00945 899 310
2010 ResidentialSmall Commercial 00033043 000166936 01291 256 129Commercial 00056630 000286103 09460 060 030
2011 ResidentialSmall Commercial (00018666) $ (000163719) 01288 minus145 minus127Commercial (00032565) $ (000285629) 01037 minus314 minus275
Derived Adjustment
$kWh
Derived Adjustment Capped $
kWh
Retail Rate
$kWh
Revenue Regulation Actual
Revenue Regulation Capped
Table 19
National Grid Revenue Regulation Adjustments 2011-201276
Massachusetts Electric and Nantucket Electric
Table 20
Hawaiian Electric Company
2011 All minus0015 1429 minus0105
2012 All 0044 1396 0315
2011 01995 3149 063
2012 03894 3641 107
Revenue Regulation Adjustment
centkWh
Revenue Regulation Adjustment
centkWhRetail Rate
centkWh
Retail Rate
Revenue Regulation Adjustment
Revenue Regulation
ldquoThe 2011 adjustment took effect June 1 but was reduced to $0 on July 26 2011 when the Commission granted HECO an interim rate increase of $532 million in a 2011 test year general rate case The 2012 Adjustment runs from June 1 2012 through May 31 2013 About 25 of the total relates to the portion of the decoupling mechanism that updates OampM and rate baserdquo (Morgan 2013)
Decoupling Case Studies Revenue Regulation Implementation in Six States
46
Revenue Regulation and Decoupling A Guide to Theory and Applicationhttpwwwraponlineorgdocumentdownloadid902
This guide was prepared to assist anyone who needs to understand both the mechanics of a regulatory tool known as decoupling and the policy issues associated with its use This would include public utility commissioners and staff utility management advocates and others with a stake in the regulated energy system While this guide is somewhat technical at points we have tried to make it accessible to a broad audience to make comprehensible the underlying concepts and the implications of different design choices This guide includes a detailed case study that demonstrates the impacts of decoupling using different pricing structures (rate designs) and usage patterns
Pricing Dorsquos and Donrsquots Designing Retail Rates as if Efficiency Countshttpwwwraponlineorgdocumentdownloadid939
Rate design is a crucial element of an overall regulatory strategy that fosters energy efficiency and sends appropriate signals about efficient system investment and operations Rate design is also fully under the control of state regulators Progressive rate design elements can guide consumers to participate in energy efficiency programs and reduce peak demand yet relatively few utilities and commissions have implemented many of these elements This RAP paper identifies some best practices Because pricing issues tie closely to utility growth incentives we also address revenue decoupling
A Decade of Decoupling for US Energy Utilities Rate Impacts Designs and Observationshttpwwwraponlineorgdocumentdownloadid6356
This report written by Pamela Morgan of Graceful Systems LLC builds on a 2009 report Now covering 25 states including 49 LDCs and 24 electric utilities this report summarizes the decoupling mechanism designs these utilities use and the rate adjustments they have made under those mechanisms In total this report estimates the retail rate impacts of 1244 decoupling mechanism adjustments since 2005
Additional Resources
The Role of Decoupling Where Energy Efficiency is Required by Lawhttpwwwraponlineorgdocumentdownloadid275
This Issuesletter gives an overview of energy efficiency resource standards the need to decouple utility profits from utility sales and explains why decoupling is needed even where a third party administers energy efficiency programs
Revenue Decoupling Standards and Criteria A Report to the Minnesota Public Utilities Commissionhttpwwwraponlineorgdocumentdownloadid850
In 2007 the Minnesota legislature enacted a new statute Section 216B2412 in which it defined an alternative approach to utility regulation decoupling and directed the Public Utilities Commission (PUC) to ldquoestablish criteria and standardsrdquo by which decoupling could be adopted for the statersquos rate-regulated utilitiesTo fulfill its obligation to develop criteria and standards for decoupling the PUC sought the advice of the Regulatory Assistance Project (RAP) This report is the output of that collaboration
Designing Distributed Generation Tariffs Wellhttpwwwraponlineorgdocumentdownloadid6898
Improvements in distributed generation economics increasing consumer preference for clean distributed energy resources and a favorable policy environment in many states have combined to produce significant increases in distributed generation adoption in the United States Regulators are looking for the well-designed tariff that compensates distributed generation adopters fairly for the value they provide to the electric system compensates the utility fairly for the grid services it provides and charges non-participating consumers fairly for the value of the services they receive This paper offers regulatory options for dealing with distributed generation The authors outline current tariffs and ponder what regulators should consider as they weigh the benefits costs and net value to distributed generation adopters non-adopters the utility and society as a whole The paper highlights the importance of deciding upon a valuation methodology so that the presence or absence of cross-subsidies can be determined Finally the paper offers rate design and ratemaking options for regulators to consider and includes recommendations for fairly implementing tariffs and ratemaking treatments to promote the public interest and ensure fair compensation
Decoupling Case Studies Revenue Regulation Implementation in Six States
47
The Regulatory Assistance Project (RAP)trade is a global non-profit team of experts focused on thelong-term economic and environmental sustainability of the power sector We provide technical and policy assistance on regulatory and market policies that promote economic efficiency environmental protection system reliability and the fair allocation of system benefits among consumers We work extensively in the US China the European Union and India Visit our website at wwwraponlineorg to learn more about our work
Rate Design Where Advanced Metering Infrastructure Has Not Been Fully Deployedhttpwwwraponlineorgdocumentdownloadid6516
This paper identifies sound practices in rate design applied around the globe using conventional metering technology Rate design for most residential and small commercial customers (mass market consumers) is most often reflected in a simple monthly access charge and a per-kWh usage rate in one or more blocks and one or more seasons A central theme across the practices highlighted in this paper is that of sending effective pricing signals through the usage-sensitive components of rates in a way that reflects the character of underlying long-run costs associated with production and usage While new technology is enabling innovations in rate design that carry some promise of better capturing opportunities for more responsive load the majority of the worldrsquos electricity usage is expected to remain under conventional pricing at least through the end of the decade and much longer in some areas Experience to date has shown that the traditional approaches to rate design persist well after the enabling technology is in place that leads to change
Time-Varying and Dynamic Rate Designhttpwwwraponlineorgdocumentdownloadid5131
This report discusses important issues in the design and deployment of time-varying rates The term time-varying rates is used in this report as encompassing traditional time-of-use rates (such as time-of-day rates and seasonal rates) as well as newer dynamic pricing rates (such as critical peak pricing and real time pricing) The discussion is primarily focused on residential customers and small commercial customers who are collectively referred to as the mass market The report also summarizes international experience with time-varying rate offerings
50 State Street Suite 3Montpelier Vermont 05602802-223-8199wwwraponlineorg
- Table of Contents
- Introduction
- California Pacific Gas and Electric Company
- Idaho Idaho Power Company
- Maryland Baltimore Gas and Electric
- Wisconsin Wisconsin Public Service Corporation
- Massachusetts National Grid
- Hawaii Hawaiian Electric Company
- Discussion of the Six Utilities Overall
- Conclusions
- Appendix
- Additional Resources
-
Decoupling Case Studies Revenue Regulation Implementation in Six States
35
60 Id p 3
61 Schultz T Energy Efficiency at Idaho Power Available at httpwwwenergyidahogovenergyalliancedida_powerpdf
As can be seen with the utilities studied above the larger fluctuations are attributable to adjustment mechanisms that are reconciled more frequently such as monthly as those are less able to smooth out anomalies as an annual adjust-ment would do From a dollar perspective for the roughly 64 percent of adjustments that fall within the plus or minus two-percent range the monthly bill impact is approxi-mately $230 for average electric customers and $140 for average gas customers60
Of the six utilities studied the fluctuations in adjustment have for the most part stayed within the one- to three-per-cent range as shown below
bull PGampE from 2005 to 2012 has had annual revenue regulation adjustments ranging from minus143 percent to 415 percent with an average adjustment of 197 percent
bull For IPC the adjustments are separated between residential and commercial customers For residential customers the annual adjustments from 2007 through 2011 ranged from 077 percent to 258 percent for an average of 162 percent As for the commercial customers the annual adjustments for that same period were higher ranging from 104 percent to 424 percent with an average adjustment of 252 percent
bull BGE has monthly adjustments that ranged from minus1853 percent to 3013 percent with an average of 057 percent for residential customers from March 2008 through August 2012 For General Service Customers the monthly adjustment ranged from minus2264 percent to 2462 percent The average adjustment was 1308 percent
bull For WPS the annual adjustments from 2009 through 2011 ranged from minus145 percent to 378 percent for residential and small commercial and from minus314 percent to 899 percent for commercial Note that because of a $14 million per year cap some of these percentages were carried over The average annual adjustment for residential and small commercial and for commercial was 163 percent and 215 percent respectively with carry-overs to subsequent years
bull For Massachusetts Electric and Nantucket Electric both of which operate under National Grid the annual revenue regulation adjustment for all for 2011 and 2012 was minus0105 percent and 0315 percent for an average revenue regulation adjustment over the two years of 0105 percent
bull HECO like National Grid has one annual revenue
regulation mechanism for its customers which resulted in adjustments in 2011 and 2012 of 063 percent and 107 percent respectively for an average adjustment of 085 percent
As can be gleaned from the above information the range of average adjustments for small use customers was a low of 0105 percent for National Grid to a high of 197 percent for PGampE For larger use customers the range was a low of 0105 percent for National Grid to a high of 252 percent for IPC This demonstrates that on average for these utilities with well-developed and diversely designed revenue regula-tion proposals their adjustments on average stayed at or below approximately 25 percent
One of the metrics for determining if a revenue regula-tion program is working successfully that was discussed above was the impact on rates of a revenue regulation mechanism As can be seen by the analysis of the adjust-ment levels for each of the utilities they are within a rea-sonable range
Complementary Policies Although a revenue regulation mechanism does not need
to be accompanied by other policies energy efficiency is frequently at the root of the reason revenue regulation was proposed in the first place The states examined in this pa-per have various obligations for energy efficiency achieve-ment placed upon their utilities Only Idaho does not have an Energy Efficiency Resource Standard but energy efficiency objectives are developed through an integrated resource plan process Energy efficiency spending at IPC has increased dramatically in recent years61
In recognition of the fact that revenue regulation only removes the disincentive to pursue energy efficiency several states have instituted some form of incentives to reward the desired outcome This mechanism can not only incentivize management to aggressively pursue energy efficiency but also make shareholders supportive in the face of lost invest-ment opportunity
Rate design can also play an important part in assist-ing the utility in achieving favorable energy efficiency outcomes Inclining block rates penalize inefficient use of electricity and shorten payback times from the customer perspective Because efficiency reduces consumption at
Decoupling Case Studies Revenue Regulation Implementation in Six States
36
62 Optional rate designs for PGampE include TOU and Peak Time Pricing
63 IPC also has an optional TOU rate design
64 Optional rate designs for this utility include TOU Critical Peak Pricing and Contract
65 National Grid also offers optional TOU and flat rate designs
66 HECO also offers optional TOU and flat rate designs
67 See eg Alexander B (1996 April) How to construct a service quality index in performance-based ratemaking Electricity Policy
the tail block rate the value of kWh savings is greater than with flat rates On the other side of the spectrum declining block rates which have a reduced rate in the tail block do little to encourage conservation In fact they operate more like a discounted bulk rate by reducing the average cost of a kWh in a customerrsquos bill for the more kWh used
Performance incentives or other ways to avoid destruc-tive cost-cutting in the name of creating margins that reduce service or reliability or lessen customer value have been implemented only in Massachusetts of the six utilities illustrated here Several other states have implemented vari-ous schemes in reaction to perceived deficiencies in utility service67 Performance incentives are not unique to rev-enue regulation Commissions wishing to implement such a scheme can find many models of incentive reward and penalty mechanisms developed for other purposes
Taken together a suite of policy and program features can create an atmosphere that is conducive to achievement of energy efficiency goals within the utility and for the customers By appropriate application of these techniques regulators working with utilities and stakeholders can remove barriers and create an opportunity for energy ef-ficiency to be fully integrated into the utility supply option portfolio
Energy Efficiency OutcomesAlthough revenue regulation itself does not create an
incentive for a utility to implement energy efficiency it does address the issue of lost revenues associated with energy
Table 12
Complementary Policies for Energy Efficiency
Pacific Gas amp Electric62
Idaho Power Company63
Baltimore Gas amp Electric
Wisconsin Public Service Corporation64
National Grid65
Hawaiian Electric Company66
Energy Efficiency Requirement
1 annually
IRP
10 by 2015
075 annually
24 annually
Energy efficiency can satisfy portion of RPS
Default Residential Rate Design
Inclining block
Inclining block
TOU seasonal
Flat
Inclining block
Inclining block
Incentive Structure
Risk reward incentive mechanism
No
No
No
5 of program costs
Third-party administrator paid for contract performance
Performance Incentives
Reliability reporting only
None
Under consideration
Reliability reporting only
Service quality reward and penalty
Under consideration
efficiency and DG programs Revenue regulation should be combined with other mechanisms that require or incentiv-ize the implementation of energy efficiency by the utility or a third party The level of energy efficiency achieved can be one measure of the success of a revenue regulation mechanism as implemented in a larger program designed to achieve energy efficiency Table 13 shows the incremental annual energy efficiency savings reported by each utility with the shaded box indicating the year that the utilityrsquos revenue regulation mechanism was implemented National Grid had achieved a high level of energy efficiency savings in the years before it implemented revenue regulation
This paper has not evaluated DG outcomes to correlate with revenue regulation as it is not perceived that states and utilities have made that connection expressly in histori-cal mechanisms However it is expected that this connec-
Decoupling Case Studies Revenue Regulation Implementation in Six States
37
68 EIA Form EIA-861 data files Available at httpwwweiagovelectricitydataeia861
69 PGampE began revenue regulation in 1974 and it was later suspended and recommenced in 2001
70 WPS savings are represented by the statewide program savings from the Focus on Energy program WPS provided additional funds to Focus on Energy starting in CY10 through their territory-wide program activities
71 In 2009 Hawaii Energy a ratepayer-funded statewide energy efficiency provider began delivering services Savings reported after 2009 represent savings achieved through the programs of Hawaii Energy
Table 13
Annual Incremental Energy Efficiency Savings as Percentage of Retail Sales68
Highlighted cells are the year that utility started decoupling
Pacific Gas amp Electric69
Idaho Power Company
Baltimore Gas amp Electric
Wisconsin Public Service Corporation70
National Grid
Hawaiian Electric Company71
2004
11
01
00
03
11
00
2005
16
03
00
03
09
05
2006
10
05
00
03
12
05
2010
19
13
17
09
136
12
tion will be made in future mechanisms and furthermore it is anticipated that follow on work to this paper will want to study that connection between revenue regulation and DG performance
Conclusions
An increasing number of states are looking to increase the rate of energy efficiency investments for their long-run cost and risk advantages The benefits of energy efficiency include not only its ability to reduce system costs across the distribution transmission and generation functions but also the opportunity for customers to reduce their individ-ual energy costs for their own electric bills Nevertheless it is counterintuitive to encourage or order a utility to sell less of its product In order to encourage the proliferation of en-ergy efficiency programs as a solution that can contribute to this nationrsquos energy needs this tension between the goals of society versus the goals of the utility needs to be addressed Revenue regulation can be such a solution by removing the link between sales and revenues
There are many ways to implement revenue regulation and multiple decision points that regulators must consider in designing a revenue regulation mechanism This paper focused on six utilities each of which implemented revenue regulation in different ways in accordance with the objectives of that state Different decision points discussed include
bull Should revenue regulation apply to all functions (generation transmission and distribution) which sometimes depends on if the utility is regulated or restructured
bull Should revenue regulation apply to all customer classes
bull Should there be symmetry such that a reconciliation adjustment occurs for both over- and under-recoveries of the revenue requirements
bull Should recovery of indicated surcharges be conditioned on acceptable performance on customer service quality or energy efficiency goals
bull Should there be an attrition adjustment to account for other expenses or should the revenue regulation adjustment be limited to reconciling existing revenue requirements
bull Should there be an inflation adjustmentbull To calculate the revenue requirements should the
current or accrual method be usedbull Should the adjustments be made in rate cases or
through a riderbull How frequently should adjustments be made
monthly annually or some other time periodbull Depending on the period of time between true up and
recovery should there be carrying charges and if so how should they be calculated
2007
21
06
00
03
09
04
2008
35
10
05
09
05
05
2009
20
11
06
10
11
11
Decoupling Case Studies Revenue Regulation Implementation in Six States
38
72 Avista Utilities (2009) Washington Utilities and Transportation Commission Docket UE-090134
bull Should there be a requirement authorizing the frequency of rate case
bull Should there be an annual cap on the amount of the adjustment and if so should there be an opportunity to carry over any additional amounts and for how many years
bull Should there be an adjustment to the cost of capital to reflect the reduced risk
Other considerations for regulators whether or not they implement revenue regulation but certainly as part of a comprehensive package are other measures that can be put in place to encourage consumers and utilities alike to actively participate in energy efficiency For example an inclining block rate structure by virtue of its incentive to consume less pairs well with an energy efficiency program helps drive consumers to participate in efficiency programs and accelerates the payback of an energy efficiency investment By the same token an incentive payment to the utility helps provide its management with a good reason to excel and exceed targets for energy efficiency programs
A key point illustrated by the list of considerations above is that there is not just one static way to design and implement revenue regulation but rather there are a variety of options for doing so In this study a diverse group of utilities were reviewed The differences among the utilities included geographic diversity vertically integrated and restructured utilities different levels of energy efficiency in place and certainly differences in how the revenue regulation mechanisms were implemented No two utilities were alike and no two utilities had the same revenue regulation mechanism The key is that revenue regulation should eliminate the throughput incentive but the means for accomplishing this goal can vary and be tailored to each jurisdiction and each utility and still be successful
There are several considerations in the design of a revenue regulation mechanism that can help ensure its successful adoption To begin revenue regulation should be granted to utilities only as a precondition to implementing comprehensive energy efficiency andor DG policies Unless accompanied by a commitment to engage in providing least-cost resource options that could impact sales there is not really any good policy reason for its adoption All of the utilities studied are actively engaging in energy efficiency Furthermore as a matter of fairness the revenue regulation mechanism should be symmetrical so that any revenues above those authorized are refunded back to consumers As Figure 1 demonstrates although there are more surcharges to customers there is nevertheless a healthy amount of
credits back to consumers This is the bargain Barring imprudence or other unforeseen circumstances the utility receives its authorized revenue requirements and nothing more or less under a simple revenue regulation mechanism
Rate design plays an important role in the effectiveness of energy efficiency in concert with revenue regulation A low customer charge is preferable so that the customer can benefit from real bill reductions tied to reduced volumetric consumption Reductions in consumption not only reduce bills but also positively impact the payback period for investments in energy efficient appliances Declining block rates in which the tail block rate is lower than the first tier also do not encourage conservation Inclining block rates that reward low usage in the first block with a lower rate send the better price signals None of the six utilities studied had declining block residential rates They were inclining flat and time-varying
The revenue adjustment mechanism is also a critical decision point in terms of whether a revenue per customer mechanism is adopted that accounts for only the current revenue requirements or whether latitude is given to include an inflation adjustment or other cost increases in the revenue adjustment mechanism Three of the utilities studied adopted this approach whereas another two used a hybrid approach Finally to reduce volatility five of the six utilities opted for annual rather than monthly adjustments thereby creating a level of rate stability that customers in general prefer
Once the goals for revenue regulation are set by the regulators the next step is to design programs that will implement that goal For energy efficiency to be as successful as possible regulators may want to adopt a complement of other policies to accompany revenue regulation These can include rate designs that reward reduced use and conservation as well as incentive payments to utilities that reward them for meeting or exceeding targets Of the six utilities studied three have adopted some form of incentive One simple approach that was used in Washington was to link recovery of any surcharges under the revenue regulation mechanism to achievement of energy efficiency targets72
For the utilities examined above that have implemented revenue regulation the evidence demonstrates that revenue regulation as a strategy and a mechanism to enable
Decoupling Case Studies Revenue Regulation Implementation in Six States
39
energy efficiency has been working well The fact that each revenue regulation mechanism varies from the next demonstrates that there are many different paths that can be followed in implementing revenue regulation based on the needs of the utility and its stakeholders in a particular
region This study demonstrates that revenue regulation does work and provides examples of how it can be implemented each one different and unique because of the number of decision points to be considered in designing a revenue regulation mechanism
Decoupling Case Studies Revenue Regulation Implementation in Six States
40
Appendix
Historic Rate Adjustments
Table 14
PGampE Revenue Regulation Rate Adjustments 1983 to 199373
Table 15
PGampE Revenue Regulation Adjustments 2005 to 201274
Table 16
IPC Revenue Regulation Adjustments76
Idaho Power Company
1983 23
1984 (34)
1985 (48)
1986 19
1987 21
1988 50
1989 (43)
1990 (54)
1991 39
1992 34
1993 00
2005 8925 minus12773 minus143
2006 9933 2246 226
2007 10409 21727 209
2008 10261 4032 039
2009 11169 10355 093
2010 11224 46556 415
2011 10306 38390 373
2012 11032 40304 365
2007 Residential minus00457 590 minus077
Commercial minus00457 428 minus107
2008 Residential 00529 670 090
Commercial 00529 510 104
2009 Residential 01220 770 158
Commercial 01535 603 255
2010 Residential 01800 785 229
Commercial 02273 613 371
2011 Residential 02028 785 258
Commercial 02597 613 424
Revenue Regulation Adjustment as of
Total Rates
Delivery Revenue
Requirement ($ millions)
Adjustment Rate
Revenue Regulation Adjustment($ millions)
Retail Rate
of Delivery Revenue
Revenue Regulation Adjustment
Year
Year
73 Lesh P (2009 June 30) Rate impacts and key design elements of gas and electric utility decoupling
74 Morgan P (2012 November) A decade of decoupling for US energy utilities rate impacts designs and observations
75 Morgan P (2012 November) A decade of decoupling for US energy utilities rate impacts designs and observations
76 All numbers provided by the utility
Decoupling Case Studies Revenue Regulation Implementation in Six States
41
77 Idaho Power Company Case No IPC-E-11-19- fixed cost adjustment permanent mechanism Available at httpwwwpucidahogovinternetcaseselecIPCIPCE1119company20120928COMPLIANCE20FILINGPDF
Figure 2
IPC Revenue Regulation Adjustments77
Residential FCA Balance and Use per Customer
$10000000
$8000000
$6000000
$4000000
$2000000
$0
-$2000000
-$4000000
-$6000000
1080
1070
1060
1050
1040
1030
1020
1010
1000Res
idu
al A
uth
oriz
ed F
CA
Am
oun
t
Residual Authorized FCA Amount ($)
Monthly Use Per Customer (kWh)
kW
h U
sed
2006 2007 2008 2009 2010 2011
78 Morgan P (2012 November) A decade of decoupling for US energy utilities rate impacts designs and observations
Decoupling Case Studies Revenue Regulation Implementation in Six States
42
Table 17a
Baltimore Gas and ElectricBGE Monthly Revenue Regulation Adjustments 2008 to 201278
Table 17b
Baltimore Gas and ElectricBGE Monthly Revenue Regulation Adjustments 2008 to 201278
March Residential 000172 01477 1165General Service 000230 01526 1507
April Residential 000016 01477 0108General Service 000146 01526 0957
May Residential 000066 01477 0447General Service 000230 01526 1507
June Residential minus000066 01477 minus0447General Service 000230 01526 1507
July Residential 000158 01477 1070General Service 000230 01526 1507
August Residential minus000040 01477 minus0271General Service 000214 01526 1402
September Residential 000237 01477 1605General Service 000230 01526 1507
October Residential 000237 01477 1605General Service 000143 01526 0937
November Residential 000237 01477 1605General Service 000140 01526 0917
December Residential 000445 01477 3013General Service 000230 01526 1507
January Residential 000035 01579 0222General Service minus000073 01346 minus0542
February Residential 000025 01579 0158General Service 000230 01346 1709
March Residential minus000237 01579 minus1501General Service 000230 01346 1709
April Residential minus000237 01579 minus1501General Service 000230 01346 1709
May Residential 000234 01579 1482General Service 000132 01346 0981
June Residential 000237 01579 1501General Service 000230 01346 1709
July Residential 000237 01579 1501General Service 000230 01346 1709
August Residential 000237 01579 1501General Service 000190 01346 1412
September Residential 000237 01579 1501General Service 000230 01346 1709
October Residential 000237 01579 1501General Service 000124 01346 0921
November Residential 000237 01579 1501General Service 000230 01346 1709
December Residential 000156 01579 0988General Service 000204 01346 1516
Adjustment $kWh
Adjustment $kWh2008 2009
Retail Rate
$kWh
Retail Rate
$kWhAdjustment
Adjustment
Decoupling Case Studies Revenue Regulation Implementation in Six States
43
Table 17c
Baltimore Gas and ElectricBGE Monthly Revenue Regulation Adjustments 2008 to 201278
Table 17d
Baltimore Gas and ElectricBGE Monthly Revenue Regulation Adjustments 2008 to 201278
January Residential 000203 01465 1386General Service 000230 01261 1824
February Residential minus000142 01465 minus0969General Service 000230 01261 1824
March Residential minus000237 01465 minus1618General Service 000230 01261 1824
April Residential minus000237 01465 minus1618General Service 000230 01261 1824
May Residential 000192 01465 1311General Service 000230 01261 1824
June Residential 000191 01465 1304General Service 000230 01261 1824
July Residential 000095 01465 0648General Service 000230 01261 1824
August Residential minus000176 01465 minus1201General Service 000224 01261 1776
September Residential minus000237 01465 minus1618General Service 000116 01261 0920
October Residential minus000237 01465 minus1618General Service 000081 01261 0642
November Residential minus000237 01465 minus1618General Service 000098 01261 0777
December Residential minus000079 01465 minus0539General Service 000229 01261 1816
January Residential minus000130 01365 minus0952General Service 000230 01156 1990
February Residential minus000253 01365 minus1853General Service minus000020 01156 minus0173
March Residential minus000018 01365 minus0132General Service minus000063 01156 minus0545
April Residential 000110 01365 0806General Service minus000262 01156 minus2266
May Residential 000010 01365 0073General Service minus000160 01156 minus1384
June Residential 000226 01365 1656General Service 000042 01156 0363
July Residential 000253 01365 1853General Service 000209 01156 1808
August Residential minus000007 01365 minus0051General Service minus000157 01156 minus1358
September Residential minus000253 01365 minus1853General Service minus000177 01156 minus1531
October Residential 000228 01365 1670General Service 000262 01156 2266
November Residential minus000059 01365 minus0432General Service 000262 01156 2266
December Residential 000071 01365 0520General Service 000262 01156 2266
Adjustment $kWh
Adjustment $kWh2010 2011
Retail Rate
$kWh
Retail Rate
$kWhAdjustment
Adjustment
Decoupling Case Studies Revenue Regulation Implementation in Six States
44
Table 17e
Baltimore Gas and ElectricBGE Monthly Revenue Regulation Adjustments 2008 to 201278
January Residential 000253 01291 1960General Service 000262 01064 2462
February Residential 000253 01291 1960General Service 000262 01064 2462
March Residential 000253 01291 1960General Service 000262 01064 2462
April Residential 000253 01291 1960General Service 000262 01064 2462
May Residential 000253 01291 1960General Service 000262 01064 2462
June Residential 000253 01291 1960General Service 000262 01064 2462
July Residential 000253 01291 1960General Service 000262 01064 2462
August Residential 000253 01291 1960General Service 000160 01064 1504
Adjustment $kWh2012
Retail Rate
$kWhAdjustment
Decoupling Case Studies Revenue Regulation Implementation in Six States
45
79 Morgan P (2012 November) A decade of decoupling for US energy utilities rate impacts designs and observations
80 Morgan P (2012 November) A decade of decoupling for US energy utilities rate impacts designs and observations
Table 18
Wisconsin Public Service Corporation Revenue Regulation Adjustments 2009 to 201179
2009 ResidentialSmall Commercial 00048705 000168154 01290 378 130Commercial 00084951 000293293 00945 899 310
2010 ResidentialSmall Commercial 00033043 000166936 01291 256 129Commercial 00056630 000286103 09460 060 030
2011 ResidentialSmall Commercial (00018666) $ (000163719) 01288 minus145 minus127Commercial (00032565) $ (000285629) 01037 minus314 minus275
Derived Adjustment
$kWh
Derived Adjustment Capped $
kWh
Retail Rate
$kWh
Revenue Regulation Actual
Revenue Regulation Capped
Table 19
National Grid Revenue Regulation Adjustments 2011-201276
Massachusetts Electric and Nantucket Electric
Table 20
Hawaiian Electric Company
2011 All minus0015 1429 minus0105
2012 All 0044 1396 0315
2011 01995 3149 063
2012 03894 3641 107
Revenue Regulation Adjustment
centkWh
Revenue Regulation Adjustment
centkWhRetail Rate
centkWh
Retail Rate
Revenue Regulation Adjustment
Revenue Regulation
ldquoThe 2011 adjustment took effect June 1 but was reduced to $0 on July 26 2011 when the Commission granted HECO an interim rate increase of $532 million in a 2011 test year general rate case The 2012 Adjustment runs from June 1 2012 through May 31 2013 About 25 of the total relates to the portion of the decoupling mechanism that updates OampM and rate baserdquo (Morgan 2013)
Decoupling Case Studies Revenue Regulation Implementation in Six States
46
Revenue Regulation and Decoupling A Guide to Theory and Applicationhttpwwwraponlineorgdocumentdownloadid902
This guide was prepared to assist anyone who needs to understand both the mechanics of a regulatory tool known as decoupling and the policy issues associated with its use This would include public utility commissioners and staff utility management advocates and others with a stake in the regulated energy system While this guide is somewhat technical at points we have tried to make it accessible to a broad audience to make comprehensible the underlying concepts and the implications of different design choices This guide includes a detailed case study that demonstrates the impacts of decoupling using different pricing structures (rate designs) and usage patterns
Pricing Dorsquos and Donrsquots Designing Retail Rates as if Efficiency Countshttpwwwraponlineorgdocumentdownloadid939
Rate design is a crucial element of an overall regulatory strategy that fosters energy efficiency and sends appropriate signals about efficient system investment and operations Rate design is also fully under the control of state regulators Progressive rate design elements can guide consumers to participate in energy efficiency programs and reduce peak demand yet relatively few utilities and commissions have implemented many of these elements This RAP paper identifies some best practices Because pricing issues tie closely to utility growth incentives we also address revenue decoupling
A Decade of Decoupling for US Energy Utilities Rate Impacts Designs and Observationshttpwwwraponlineorgdocumentdownloadid6356
This report written by Pamela Morgan of Graceful Systems LLC builds on a 2009 report Now covering 25 states including 49 LDCs and 24 electric utilities this report summarizes the decoupling mechanism designs these utilities use and the rate adjustments they have made under those mechanisms In total this report estimates the retail rate impacts of 1244 decoupling mechanism adjustments since 2005
Additional Resources
The Role of Decoupling Where Energy Efficiency is Required by Lawhttpwwwraponlineorgdocumentdownloadid275
This Issuesletter gives an overview of energy efficiency resource standards the need to decouple utility profits from utility sales and explains why decoupling is needed even where a third party administers energy efficiency programs
Revenue Decoupling Standards and Criteria A Report to the Minnesota Public Utilities Commissionhttpwwwraponlineorgdocumentdownloadid850
In 2007 the Minnesota legislature enacted a new statute Section 216B2412 in which it defined an alternative approach to utility regulation decoupling and directed the Public Utilities Commission (PUC) to ldquoestablish criteria and standardsrdquo by which decoupling could be adopted for the statersquos rate-regulated utilitiesTo fulfill its obligation to develop criteria and standards for decoupling the PUC sought the advice of the Regulatory Assistance Project (RAP) This report is the output of that collaboration
Designing Distributed Generation Tariffs Wellhttpwwwraponlineorgdocumentdownloadid6898
Improvements in distributed generation economics increasing consumer preference for clean distributed energy resources and a favorable policy environment in many states have combined to produce significant increases in distributed generation adoption in the United States Regulators are looking for the well-designed tariff that compensates distributed generation adopters fairly for the value they provide to the electric system compensates the utility fairly for the grid services it provides and charges non-participating consumers fairly for the value of the services they receive This paper offers regulatory options for dealing with distributed generation The authors outline current tariffs and ponder what regulators should consider as they weigh the benefits costs and net value to distributed generation adopters non-adopters the utility and society as a whole The paper highlights the importance of deciding upon a valuation methodology so that the presence or absence of cross-subsidies can be determined Finally the paper offers rate design and ratemaking options for regulators to consider and includes recommendations for fairly implementing tariffs and ratemaking treatments to promote the public interest and ensure fair compensation
Decoupling Case Studies Revenue Regulation Implementation in Six States
47
The Regulatory Assistance Project (RAP)trade is a global non-profit team of experts focused on thelong-term economic and environmental sustainability of the power sector We provide technical and policy assistance on regulatory and market policies that promote economic efficiency environmental protection system reliability and the fair allocation of system benefits among consumers We work extensively in the US China the European Union and India Visit our website at wwwraponlineorg to learn more about our work
Rate Design Where Advanced Metering Infrastructure Has Not Been Fully Deployedhttpwwwraponlineorgdocumentdownloadid6516
This paper identifies sound practices in rate design applied around the globe using conventional metering technology Rate design for most residential and small commercial customers (mass market consumers) is most often reflected in a simple monthly access charge and a per-kWh usage rate in one or more blocks and one or more seasons A central theme across the practices highlighted in this paper is that of sending effective pricing signals through the usage-sensitive components of rates in a way that reflects the character of underlying long-run costs associated with production and usage While new technology is enabling innovations in rate design that carry some promise of better capturing opportunities for more responsive load the majority of the worldrsquos electricity usage is expected to remain under conventional pricing at least through the end of the decade and much longer in some areas Experience to date has shown that the traditional approaches to rate design persist well after the enabling technology is in place that leads to change
Time-Varying and Dynamic Rate Designhttpwwwraponlineorgdocumentdownloadid5131
This report discusses important issues in the design and deployment of time-varying rates The term time-varying rates is used in this report as encompassing traditional time-of-use rates (such as time-of-day rates and seasonal rates) as well as newer dynamic pricing rates (such as critical peak pricing and real time pricing) The discussion is primarily focused on residential customers and small commercial customers who are collectively referred to as the mass market The report also summarizes international experience with time-varying rate offerings
50 State Street Suite 3Montpelier Vermont 05602802-223-8199wwwraponlineorg
- Table of Contents
- Introduction
- California Pacific Gas and Electric Company
- Idaho Idaho Power Company
- Maryland Baltimore Gas and Electric
- Wisconsin Wisconsin Public Service Corporation
- Massachusetts National Grid
- Hawaii Hawaiian Electric Company
- Discussion of the Six Utilities Overall
- Conclusions
- Appendix
- Additional Resources
-

Decoupling Case Studies Revenue Regulation Implementation in Six States
38
72 Avista Utilities (2009) Washington Utilities and Transportation Commission Docket UE-090134
bull Should there be a requirement authorizing the frequency of rate case
bull Should there be an annual cap on the amount of the adjustment and if so should there be an opportunity to carry over any additional amounts and for how many years
bull Should there be an adjustment to the cost of capital to reflect the reduced risk
Other considerations for regulators whether or not they implement revenue regulation but certainly as part of a comprehensive package are other measures that can be put in place to encourage consumers and utilities alike to actively participate in energy efficiency For example an inclining block rate structure by virtue of its incentive to consume less pairs well with an energy efficiency program helps drive consumers to participate in efficiency programs and accelerates the payback of an energy efficiency investment By the same token an incentive payment to the utility helps provide its management with a good reason to excel and exceed targets for energy efficiency programs
A key point illustrated by the list of considerations above is that there is not just one static way to design and implement revenue regulation but rather there are a variety of options for doing so In this study a diverse group of utilities were reviewed The differences among the utilities included geographic diversity vertically integrated and restructured utilities different levels of energy efficiency in place and certainly differences in how the revenue regulation mechanisms were implemented No two utilities were alike and no two utilities had the same revenue regulation mechanism The key is that revenue regulation should eliminate the throughput incentive but the means for accomplishing this goal can vary and be tailored to each jurisdiction and each utility and still be successful
There are several considerations in the design of a revenue regulation mechanism that can help ensure its successful adoption To begin revenue regulation should be granted to utilities only as a precondition to implementing comprehensive energy efficiency andor DG policies Unless accompanied by a commitment to engage in providing least-cost resource options that could impact sales there is not really any good policy reason for its adoption All of the utilities studied are actively engaging in energy efficiency Furthermore as a matter of fairness the revenue regulation mechanism should be symmetrical so that any revenues above those authorized are refunded back to consumers As Figure 1 demonstrates although there are more surcharges to customers there is nevertheless a healthy amount of
credits back to consumers This is the bargain Barring imprudence or other unforeseen circumstances the utility receives its authorized revenue requirements and nothing more or less under a simple revenue regulation mechanism
Rate design plays an important role in the effectiveness of energy efficiency in concert with revenue regulation A low customer charge is preferable so that the customer can benefit from real bill reductions tied to reduced volumetric consumption Reductions in consumption not only reduce bills but also positively impact the payback period for investments in energy efficient appliances Declining block rates in which the tail block rate is lower than the first tier also do not encourage conservation Inclining block rates that reward low usage in the first block with a lower rate send the better price signals None of the six utilities studied had declining block residential rates They were inclining flat and time-varying
The revenue adjustment mechanism is also a critical decision point in terms of whether a revenue per customer mechanism is adopted that accounts for only the current revenue requirements or whether latitude is given to include an inflation adjustment or other cost increases in the revenue adjustment mechanism Three of the utilities studied adopted this approach whereas another two used a hybrid approach Finally to reduce volatility five of the six utilities opted for annual rather than monthly adjustments thereby creating a level of rate stability that customers in general prefer
Once the goals for revenue regulation are set by the regulators the next step is to design programs that will implement that goal For energy efficiency to be as successful as possible regulators may want to adopt a complement of other policies to accompany revenue regulation These can include rate designs that reward reduced use and conservation as well as incentive payments to utilities that reward them for meeting or exceeding targets Of the six utilities studied three have adopted some form of incentive One simple approach that was used in Washington was to link recovery of any surcharges under the revenue regulation mechanism to achievement of energy efficiency targets72
For the utilities examined above that have implemented revenue regulation the evidence demonstrates that revenue regulation as a strategy and a mechanism to enable
Decoupling Case Studies Revenue Regulation Implementation in Six States
39
energy efficiency has been working well The fact that each revenue regulation mechanism varies from the next demonstrates that there are many different paths that can be followed in implementing revenue regulation based on the needs of the utility and its stakeholders in a particular
region This study demonstrates that revenue regulation does work and provides examples of how it can be implemented each one different and unique because of the number of decision points to be considered in designing a revenue regulation mechanism
Decoupling Case Studies Revenue Regulation Implementation in Six States
40
Appendix
Historic Rate Adjustments
Table 14
PGampE Revenue Regulation Rate Adjustments 1983 to 199373
Table 15
PGampE Revenue Regulation Adjustments 2005 to 201274
Table 16
IPC Revenue Regulation Adjustments76
Idaho Power Company
1983 23
1984 (34)
1985 (48)
1986 19
1987 21
1988 50
1989 (43)
1990 (54)
1991 39
1992 34
1993 00
2005 8925 minus12773 minus143
2006 9933 2246 226
2007 10409 21727 209
2008 10261 4032 039
2009 11169 10355 093
2010 11224 46556 415
2011 10306 38390 373
2012 11032 40304 365
2007 Residential minus00457 590 minus077
Commercial minus00457 428 minus107
2008 Residential 00529 670 090
Commercial 00529 510 104
2009 Residential 01220 770 158
Commercial 01535 603 255
2010 Residential 01800 785 229
Commercial 02273 613 371
2011 Residential 02028 785 258
Commercial 02597 613 424
Revenue Regulation Adjustment as of
Total Rates
Delivery Revenue
Requirement ($ millions)
Adjustment Rate
Revenue Regulation Adjustment($ millions)
Retail Rate
of Delivery Revenue
Revenue Regulation Adjustment
Year
Year
73 Lesh P (2009 June 30) Rate impacts and key design elements of gas and electric utility decoupling
74 Morgan P (2012 November) A decade of decoupling for US energy utilities rate impacts designs and observations
75 Morgan P (2012 November) A decade of decoupling for US energy utilities rate impacts designs and observations
76 All numbers provided by the utility
Decoupling Case Studies Revenue Regulation Implementation in Six States
41
77 Idaho Power Company Case No IPC-E-11-19- fixed cost adjustment permanent mechanism Available at httpwwwpucidahogovinternetcaseselecIPCIPCE1119company20120928COMPLIANCE20FILINGPDF
Figure 2
IPC Revenue Regulation Adjustments77
Residential FCA Balance and Use per Customer
$10000000
$8000000
$6000000
$4000000
$2000000
$0
-$2000000
-$4000000
-$6000000
1080
1070
1060
1050
1040
1030
1020
1010
1000Res
idu
al A
uth
oriz
ed F
CA
Am
oun
t
Residual Authorized FCA Amount ($)
Monthly Use Per Customer (kWh)
kW
h U
sed
2006 2007 2008 2009 2010 2011
78 Morgan P (2012 November) A decade of decoupling for US energy utilities rate impacts designs and observations
Decoupling Case Studies Revenue Regulation Implementation in Six States
42
Table 17a
Baltimore Gas and ElectricBGE Monthly Revenue Regulation Adjustments 2008 to 201278
Table 17b
Baltimore Gas and ElectricBGE Monthly Revenue Regulation Adjustments 2008 to 201278
March Residential 000172 01477 1165General Service 000230 01526 1507
April Residential 000016 01477 0108General Service 000146 01526 0957
May Residential 000066 01477 0447General Service 000230 01526 1507
June Residential minus000066 01477 minus0447General Service 000230 01526 1507
July Residential 000158 01477 1070General Service 000230 01526 1507
August Residential minus000040 01477 minus0271General Service 000214 01526 1402
September Residential 000237 01477 1605General Service 000230 01526 1507
October Residential 000237 01477 1605General Service 000143 01526 0937
November Residential 000237 01477 1605General Service 000140 01526 0917
December Residential 000445 01477 3013General Service 000230 01526 1507
January Residential 000035 01579 0222General Service minus000073 01346 minus0542
February Residential 000025 01579 0158General Service 000230 01346 1709
March Residential minus000237 01579 minus1501General Service 000230 01346 1709
April Residential minus000237 01579 minus1501General Service 000230 01346 1709
May Residential 000234 01579 1482General Service 000132 01346 0981
June Residential 000237 01579 1501General Service 000230 01346 1709
July Residential 000237 01579 1501General Service 000230 01346 1709
August Residential 000237 01579 1501General Service 000190 01346 1412
September Residential 000237 01579 1501General Service 000230 01346 1709
October Residential 000237 01579 1501General Service 000124 01346 0921
November Residential 000237 01579 1501General Service 000230 01346 1709
December Residential 000156 01579 0988General Service 000204 01346 1516
Adjustment $kWh
Adjustment $kWh2008 2009
Retail Rate
$kWh
Retail Rate
$kWhAdjustment
Adjustment
Decoupling Case Studies Revenue Regulation Implementation in Six States
43
Table 17c
Baltimore Gas and ElectricBGE Monthly Revenue Regulation Adjustments 2008 to 201278
Table 17d
Baltimore Gas and ElectricBGE Monthly Revenue Regulation Adjustments 2008 to 201278
January Residential 000203 01465 1386General Service 000230 01261 1824
February Residential minus000142 01465 minus0969General Service 000230 01261 1824
March Residential minus000237 01465 minus1618General Service 000230 01261 1824
April Residential minus000237 01465 minus1618General Service 000230 01261 1824
May Residential 000192 01465 1311General Service 000230 01261 1824
June Residential 000191 01465 1304General Service 000230 01261 1824
July Residential 000095 01465 0648General Service 000230 01261 1824
August Residential minus000176 01465 minus1201General Service 000224 01261 1776
September Residential minus000237 01465 minus1618General Service 000116 01261 0920
October Residential minus000237 01465 minus1618General Service 000081 01261 0642
November Residential minus000237 01465 minus1618General Service 000098 01261 0777
December Residential minus000079 01465 minus0539General Service 000229 01261 1816
January Residential minus000130 01365 minus0952General Service 000230 01156 1990
February Residential minus000253 01365 minus1853General Service minus000020 01156 minus0173
March Residential minus000018 01365 minus0132General Service minus000063 01156 minus0545
April Residential 000110 01365 0806General Service minus000262 01156 minus2266
May Residential 000010 01365 0073General Service minus000160 01156 minus1384
June Residential 000226 01365 1656General Service 000042 01156 0363
July Residential 000253 01365 1853General Service 000209 01156 1808
August Residential minus000007 01365 minus0051General Service minus000157 01156 minus1358
September Residential minus000253 01365 minus1853General Service minus000177 01156 minus1531
October Residential 000228 01365 1670General Service 000262 01156 2266
November Residential minus000059 01365 minus0432General Service 000262 01156 2266
December Residential 000071 01365 0520General Service 000262 01156 2266
Adjustment $kWh
Adjustment $kWh2010 2011
Retail Rate
$kWh
Retail Rate
$kWhAdjustment
Adjustment
Decoupling Case Studies Revenue Regulation Implementation in Six States
44
Table 17e
Baltimore Gas and ElectricBGE Monthly Revenue Regulation Adjustments 2008 to 201278
January Residential 000253 01291 1960General Service 000262 01064 2462
February Residential 000253 01291 1960General Service 000262 01064 2462
March Residential 000253 01291 1960General Service 000262 01064 2462
April Residential 000253 01291 1960General Service 000262 01064 2462
May Residential 000253 01291 1960General Service 000262 01064 2462
June Residential 000253 01291 1960General Service 000262 01064 2462
July Residential 000253 01291 1960General Service 000262 01064 2462
August Residential 000253 01291 1960General Service 000160 01064 1504
Adjustment $kWh2012
Retail Rate
$kWhAdjustment
Decoupling Case Studies Revenue Regulation Implementation in Six States
45
79 Morgan P (2012 November) A decade of decoupling for US energy utilities rate impacts designs and observations
80 Morgan P (2012 November) A decade of decoupling for US energy utilities rate impacts designs and observations
Table 18
Wisconsin Public Service Corporation Revenue Regulation Adjustments 2009 to 201179
2009 ResidentialSmall Commercial 00048705 000168154 01290 378 130Commercial 00084951 000293293 00945 899 310
2010 ResidentialSmall Commercial 00033043 000166936 01291 256 129Commercial 00056630 000286103 09460 060 030
2011 ResidentialSmall Commercial (00018666) $ (000163719) 01288 minus145 minus127Commercial (00032565) $ (000285629) 01037 minus314 minus275
Derived Adjustment
$kWh
Derived Adjustment Capped $
kWh
Retail Rate
$kWh
Revenue Regulation Actual
Revenue Regulation Capped
Table 19
National Grid Revenue Regulation Adjustments 2011-201276
Massachusetts Electric and Nantucket Electric
Table 20
Hawaiian Electric Company
2011 All minus0015 1429 minus0105
2012 All 0044 1396 0315
2011 01995 3149 063
2012 03894 3641 107
Revenue Regulation Adjustment
centkWh
Revenue Regulation Adjustment
centkWhRetail Rate
centkWh
Retail Rate
Revenue Regulation Adjustment
Revenue Regulation
ldquoThe 2011 adjustment took effect June 1 but was reduced to $0 on July 26 2011 when the Commission granted HECO an interim rate increase of $532 million in a 2011 test year general rate case The 2012 Adjustment runs from June 1 2012 through May 31 2013 About 25 of the total relates to the portion of the decoupling mechanism that updates OampM and rate baserdquo (Morgan 2013)
Decoupling Case Studies Revenue Regulation Implementation in Six States
46
Revenue Regulation and Decoupling A Guide to Theory and Applicationhttpwwwraponlineorgdocumentdownloadid902
This guide was prepared to assist anyone who needs to understand both the mechanics of a regulatory tool known as decoupling and the policy issues associated with its use This would include public utility commissioners and staff utility management advocates and others with a stake in the regulated energy system While this guide is somewhat technical at points we have tried to make it accessible to a broad audience to make comprehensible the underlying concepts and the implications of different design choices This guide includes a detailed case study that demonstrates the impacts of decoupling using different pricing structures (rate designs) and usage patterns
Pricing Dorsquos and Donrsquots Designing Retail Rates as if Efficiency Countshttpwwwraponlineorgdocumentdownloadid939
Rate design is a crucial element of an overall regulatory strategy that fosters energy efficiency and sends appropriate signals about efficient system investment and operations Rate design is also fully under the control of state regulators Progressive rate design elements can guide consumers to participate in energy efficiency programs and reduce peak demand yet relatively few utilities and commissions have implemented many of these elements This RAP paper identifies some best practices Because pricing issues tie closely to utility growth incentives we also address revenue decoupling
A Decade of Decoupling for US Energy Utilities Rate Impacts Designs and Observationshttpwwwraponlineorgdocumentdownloadid6356
This report written by Pamela Morgan of Graceful Systems LLC builds on a 2009 report Now covering 25 states including 49 LDCs and 24 electric utilities this report summarizes the decoupling mechanism designs these utilities use and the rate adjustments they have made under those mechanisms In total this report estimates the retail rate impacts of 1244 decoupling mechanism adjustments since 2005
Additional Resources
The Role of Decoupling Where Energy Efficiency is Required by Lawhttpwwwraponlineorgdocumentdownloadid275
This Issuesletter gives an overview of energy efficiency resource standards the need to decouple utility profits from utility sales and explains why decoupling is needed even where a third party administers energy efficiency programs
Revenue Decoupling Standards and Criteria A Report to the Minnesota Public Utilities Commissionhttpwwwraponlineorgdocumentdownloadid850
In 2007 the Minnesota legislature enacted a new statute Section 216B2412 in which it defined an alternative approach to utility regulation decoupling and directed the Public Utilities Commission (PUC) to ldquoestablish criteria and standardsrdquo by which decoupling could be adopted for the statersquos rate-regulated utilitiesTo fulfill its obligation to develop criteria and standards for decoupling the PUC sought the advice of the Regulatory Assistance Project (RAP) This report is the output of that collaboration
Designing Distributed Generation Tariffs Wellhttpwwwraponlineorgdocumentdownloadid6898
Improvements in distributed generation economics increasing consumer preference for clean distributed energy resources and a favorable policy environment in many states have combined to produce significant increases in distributed generation adoption in the United States Regulators are looking for the well-designed tariff that compensates distributed generation adopters fairly for the value they provide to the electric system compensates the utility fairly for the grid services it provides and charges non-participating consumers fairly for the value of the services they receive This paper offers regulatory options for dealing with distributed generation The authors outline current tariffs and ponder what regulators should consider as they weigh the benefits costs and net value to distributed generation adopters non-adopters the utility and society as a whole The paper highlights the importance of deciding upon a valuation methodology so that the presence or absence of cross-subsidies can be determined Finally the paper offers rate design and ratemaking options for regulators to consider and includes recommendations for fairly implementing tariffs and ratemaking treatments to promote the public interest and ensure fair compensation
Decoupling Case Studies Revenue Regulation Implementation in Six States
47
The Regulatory Assistance Project (RAP)trade is a global non-profit team of experts focused on thelong-term economic and environmental sustainability of the power sector We provide technical and policy assistance on regulatory and market policies that promote economic efficiency environmental protection system reliability and the fair allocation of system benefits among consumers We work extensively in the US China the European Union and India Visit our website at wwwraponlineorg to learn more about our work
Rate Design Where Advanced Metering Infrastructure Has Not Been Fully Deployedhttpwwwraponlineorgdocumentdownloadid6516
This paper identifies sound practices in rate design applied around the globe using conventional metering technology Rate design for most residential and small commercial customers (mass market consumers) is most often reflected in a simple monthly access charge and a per-kWh usage rate in one or more blocks and one or more seasons A central theme across the practices highlighted in this paper is that of sending effective pricing signals through the usage-sensitive components of rates in a way that reflects the character of underlying long-run costs associated with production and usage While new technology is enabling innovations in rate design that carry some promise of better capturing opportunities for more responsive load the majority of the worldrsquos electricity usage is expected to remain under conventional pricing at least through the end of the decade and much longer in some areas Experience to date has shown that the traditional approaches to rate design persist well after the enabling technology is in place that leads to change
Time-Varying and Dynamic Rate Designhttpwwwraponlineorgdocumentdownloadid5131
This report discusses important issues in the design and deployment of time-varying rates The term time-varying rates is used in this report as encompassing traditional time-of-use rates (such as time-of-day rates and seasonal rates) as well as newer dynamic pricing rates (such as critical peak pricing and real time pricing) The discussion is primarily focused on residential customers and small commercial customers who are collectively referred to as the mass market The report also summarizes international experience with time-varying rate offerings
50 State Street Suite 3Montpelier Vermont 05602802-223-8199wwwraponlineorg
- Table of Contents
- Introduction
- California Pacific Gas and Electric Company
- Idaho Idaho Power Company
- Maryland Baltimore Gas and Electric
- Wisconsin Wisconsin Public Service Corporation
- Massachusetts National Grid
- Hawaii Hawaiian Electric Company
- Discussion of the Six Utilities Overall
- Conclusions
- Appendix
- Additional Resources
-
Decoupling Case Studies Revenue Regulation Implementation in Six States
39
energy efficiency has been working well The fact that each revenue regulation mechanism varies from the next demonstrates that there are many different paths that can be followed in implementing revenue regulation based on the needs of the utility and its stakeholders in a particular
region This study demonstrates that revenue regulation does work and provides examples of how it can be implemented each one different and unique because of the number of decision points to be considered in designing a revenue regulation mechanism
Decoupling Case Studies Revenue Regulation Implementation in Six States
40
Appendix
Historic Rate Adjustments
Table 14
PGampE Revenue Regulation Rate Adjustments 1983 to 199373
Table 15
PGampE Revenue Regulation Adjustments 2005 to 201274
Table 16
IPC Revenue Regulation Adjustments76
Idaho Power Company
1983 23
1984 (34)
1985 (48)
1986 19
1987 21
1988 50
1989 (43)
1990 (54)
1991 39
1992 34
1993 00
2005 8925 minus12773 minus143
2006 9933 2246 226
2007 10409 21727 209
2008 10261 4032 039
2009 11169 10355 093
2010 11224 46556 415
2011 10306 38390 373
2012 11032 40304 365
2007 Residential minus00457 590 minus077
Commercial minus00457 428 minus107
2008 Residential 00529 670 090
Commercial 00529 510 104
2009 Residential 01220 770 158
Commercial 01535 603 255
2010 Residential 01800 785 229
Commercial 02273 613 371
2011 Residential 02028 785 258
Commercial 02597 613 424
Revenue Regulation Adjustment as of
Total Rates
Delivery Revenue
Requirement ($ millions)
Adjustment Rate
Revenue Regulation Adjustment($ millions)
Retail Rate
of Delivery Revenue
Revenue Regulation Adjustment
Year
Year
73 Lesh P (2009 June 30) Rate impacts and key design elements of gas and electric utility decoupling
74 Morgan P (2012 November) A decade of decoupling for US energy utilities rate impacts designs and observations
75 Morgan P (2012 November) A decade of decoupling for US energy utilities rate impacts designs and observations
76 All numbers provided by the utility
Decoupling Case Studies Revenue Regulation Implementation in Six States
41
77 Idaho Power Company Case No IPC-E-11-19- fixed cost adjustment permanent mechanism Available at httpwwwpucidahogovinternetcaseselecIPCIPCE1119company20120928COMPLIANCE20FILINGPDF
Figure 2
IPC Revenue Regulation Adjustments77
Residential FCA Balance and Use per Customer
$10000000
$8000000
$6000000
$4000000
$2000000
$0
-$2000000
-$4000000
-$6000000
1080
1070
1060
1050
1040
1030
1020
1010
1000Res
idu
al A
uth
oriz
ed F
CA
Am
oun
t
Residual Authorized FCA Amount ($)
Monthly Use Per Customer (kWh)
kW
h U
sed
2006 2007 2008 2009 2010 2011
78 Morgan P (2012 November) A decade of decoupling for US energy utilities rate impacts designs and observations
Decoupling Case Studies Revenue Regulation Implementation in Six States
42
Table 17a
Baltimore Gas and ElectricBGE Monthly Revenue Regulation Adjustments 2008 to 201278
Table 17b
Baltimore Gas and ElectricBGE Monthly Revenue Regulation Adjustments 2008 to 201278
March Residential 000172 01477 1165General Service 000230 01526 1507
April Residential 000016 01477 0108General Service 000146 01526 0957
May Residential 000066 01477 0447General Service 000230 01526 1507
June Residential minus000066 01477 minus0447General Service 000230 01526 1507
July Residential 000158 01477 1070General Service 000230 01526 1507
August Residential minus000040 01477 minus0271General Service 000214 01526 1402
September Residential 000237 01477 1605General Service 000230 01526 1507
October Residential 000237 01477 1605General Service 000143 01526 0937
November Residential 000237 01477 1605General Service 000140 01526 0917
December Residential 000445 01477 3013General Service 000230 01526 1507
January Residential 000035 01579 0222General Service minus000073 01346 minus0542
February Residential 000025 01579 0158General Service 000230 01346 1709
March Residential minus000237 01579 minus1501General Service 000230 01346 1709
April Residential minus000237 01579 minus1501General Service 000230 01346 1709
May Residential 000234 01579 1482General Service 000132 01346 0981
June Residential 000237 01579 1501General Service 000230 01346 1709
July Residential 000237 01579 1501General Service 000230 01346 1709
August Residential 000237 01579 1501General Service 000190 01346 1412
September Residential 000237 01579 1501General Service 000230 01346 1709
October Residential 000237 01579 1501General Service 000124 01346 0921
November Residential 000237 01579 1501General Service 000230 01346 1709
December Residential 000156 01579 0988General Service 000204 01346 1516
Adjustment $kWh
Adjustment $kWh2008 2009
Retail Rate
$kWh
Retail Rate
$kWhAdjustment
Adjustment
Decoupling Case Studies Revenue Regulation Implementation in Six States
43
Table 17c
Baltimore Gas and ElectricBGE Monthly Revenue Regulation Adjustments 2008 to 201278
Table 17d
Baltimore Gas and ElectricBGE Monthly Revenue Regulation Adjustments 2008 to 201278
January Residential 000203 01465 1386General Service 000230 01261 1824
February Residential minus000142 01465 minus0969General Service 000230 01261 1824
March Residential minus000237 01465 minus1618General Service 000230 01261 1824
April Residential minus000237 01465 minus1618General Service 000230 01261 1824
May Residential 000192 01465 1311General Service 000230 01261 1824
June Residential 000191 01465 1304General Service 000230 01261 1824
July Residential 000095 01465 0648General Service 000230 01261 1824
August Residential minus000176 01465 minus1201General Service 000224 01261 1776
September Residential minus000237 01465 minus1618General Service 000116 01261 0920
October Residential minus000237 01465 minus1618General Service 000081 01261 0642
November Residential minus000237 01465 minus1618General Service 000098 01261 0777
December Residential minus000079 01465 minus0539General Service 000229 01261 1816
January Residential minus000130 01365 minus0952General Service 000230 01156 1990
February Residential minus000253 01365 minus1853General Service minus000020 01156 minus0173
March Residential minus000018 01365 minus0132General Service minus000063 01156 minus0545
April Residential 000110 01365 0806General Service minus000262 01156 minus2266
May Residential 000010 01365 0073General Service minus000160 01156 minus1384
June Residential 000226 01365 1656General Service 000042 01156 0363
July Residential 000253 01365 1853General Service 000209 01156 1808
August Residential minus000007 01365 minus0051General Service minus000157 01156 minus1358
September Residential minus000253 01365 minus1853General Service minus000177 01156 minus1531
October Residential 000228 01365 1670General Service 000262 01156 2266
November Residential minus000059 01365 minus0432General Service 000262 01156 2266
December Residential 000071 01365 0520General Service 000262 01156 2266
Adjustment $kWh
Adjustment $kWh2010 2011
Retail Rate
$kWh
Retail Rate
$kWhAdjustment
Adjustment
Decoupling Case Studies Revenue Regulation Implementation in Six States
44
Table 17e
Baltimore Gas and ElectricBGE Monthly Revenue Regulation Adjustments 2008 to 201278
January Residential 000253 01291 1960General Service 000262 01064 2462
February Residential 000253 01291 1960General Service 000262 01064 2462
March Residential 000253 01291 1960General Service 000262 01064 2462
April Residential 000253 01291 1960General Service 000262 01064 2462
May Residential 000253 01291 1960General Service 000262 01064 2462
June Residential 000253 01291 1960General Service 000262 01064 2462
July Residential 000253 01291 1960General Service 000262 01064 2462
August Residential 000253 01291 1960General Service 000160 01064 1504
Adjustment $kWh2012
Retail Rate
$kWhAdjustment
Decoupling Case Studies Revenue Regulation Implementation in Six States
45
79 Morgan P (2012 November) A decade of decoupling for US energy utilities rate impacts designs and observations
80 Morgan P (2012 November) A decade of decoupling for US energy utilities rate impacts designs and observations
Table 18
Wisconsin Public Service Corporation Revenue Regulation Adjustments 2009 to 201179
2009 ResidentialSmall Commercial 00048705 000168154 01290 378 130Commercial 00084951 000293293 00945 899 310
2010 ResidentialSmall Commercial 00033043 000166936 01291 256 129Commercial 00056630 000286103 09460 060 030
2011 ResidentialSmall Commercial (00018666) $ (000163719) 01288 minus145 minus127Commercial (00032565) $ (000285629) 01037 minus314 minus275
Derived Adjustment
$kWh
Derived Adjustment Capped $
kWh
Retail Rate
$kWh
Revenue Regulation Actual
Revenue Regulation Capped
Table 19
National Grid Revenue Regulation Adjustments 2011-201276
Massachusetts Electric and Nantucket Electric
Table 20
Hawaiian Electric Company
2011 All minus0015 1429 minus0105
2012 All 0044 1396 0315
2011 01995 3149 063
2012 03894 3641 107
Revenue Regulation Adjustment
centkWh
Revenue Regulation Adjustment
centkWhRetail Rate
centkWh
Retail Rate
Revenue Regulation Adjustment
Revenue Regulation
ldquoThe 2011 adjustment took effect June 1 but was reduced to $0 on July 26 2011 when the Commission granted HECO an interim rate increase of $532 million in a 2011 test year general rate case The 2012 Adjustment runs from June 1 2012 through May 31 2013 About 25 of the total relates to the portion of the decoupling mechanism that updates OampM and rate baserdquo (Morgan 2013)
Decoupling Case Studies Revenue Regulation Implementation in Six States
46
Revenue Regulation and Decoupling A Guide to Theory and Applicationhttpwwwraponlineorgdocumentdownloadid902
This guide was prepared to assist anyone who needs to understand both the mechanics of a regulatory tool known as decoupling and the policy issues associated with its use This would include public utility commissioners and staff utility management advocates and others with a stake in the regulated energy system While this guide is somewhat technical at points we have tried to make it accessible to a broad audience to make comprehensible the underlying concepts and the implications of different design choices This guide includes a detailed case study that demonstrates the impacts of decoupling using different pricing structures (rate designs) and usage patterns
Pricing Dorsquos and Donrsquots Designing Retail Rates as if Efficiency Countshttpwwwraponlineorgdocumentdownloadid939
Rate design is a crucial element of an overall regulatory strategy that fosters energy efficiency and sends appropriate signals about efficient system investment and operations Rate design is also fully under the control of state regulators Progressive rate design elements can guide consumers to participate in energy efficiency programs and reduce peak demand yet relatively few utilities and commissions have implemented many of these elements This RAP paper identifies some best practices Because pricing issues tie closely to utility growth incentives we also address revenue decoupling
A Decade of Decoupling for US Energy Utilities Rate Impacts Designs and Observationshttpwwwraponlineorgdocumentdownloadid6356
This report written by Pamela Morgan of Graceful Systems LLC builds on a 2009 report Now covering 25 states including 49 LDCs and 24 electric utilities this report summarizes the decoupling mechanism designs these utilities use and the rate adjustments they have made under those mechanisms In total this report estimates the retail rate impacts of 1244 decoupling mechanism adjustments since 2005
Additional Resources
The Role of Decoupling Where Energy Efficiency is Required by Lawhttpwwwraponlineorgdocumentdownloadid275
This Issuesletter gives an overview of energy efficiency resource standards the need to decouple utility profits from utility sales and explains why decoupling is needed even where a third party administers energy efficiency programs
Revenue Decoupling Standards and Criteria A Report to the Minnesota Public Utilities Commissionhttpwwwraponlineorgdocumentdownloadid850
In 2007 the Minnesota legislature enacted a new statute Section 216B2412 in which it defined an alternative approach to utility regulation decoupling and directed the Public Utilities Commission (PUC) to ldquoestablish criteria and standardsrdquo by which decoupling could be adopted for the statersquos rate-regulated utilitiesTo fulfill its obligation to develop criteria and standards for decoupling the PUC sought the advice of the Regulatory Assistance Project (RAP) This report is the output of that collaboration
Designing Distributed Generation Tariffs Wellhttpwwwraponlineorgdocumentdownloadid6898
Improvements in distributed generation economics increasing consumer preference for clean distributed energy resources and a favorable policy environment in many states have combined to produce significant increases in distributed generation adoption in the United States Regulators are looking for the well-designed tariff that compensates distributed generation adopters fairly for the value they provide to the electric system compensates the utility fairly for the grid services it provides and charges non-participating consumers fairly for the value of the services they receive This paper offers regulatory options for dealing with distributed generation The authors outline current tariffs and ponder what regulators should consider as they weigh the benefits costs and net value to distributed generation adopters non-adopters the utility and society as a whole The paper highlights the importance of deciding upon a valuation methodology so that the presence or absence of cross-subsidies can be determined Finally the paper offers rate design and ratemaking options for regulators to consider and includes recommendations for fairly implementing tariffs and ratemaking treatments to promote the public interest and ensure fair compensation
Decoupling Case Studies Revenue Regulation Implementation in Six States
47
The Regulatory Assistance Project (RAP)trade is a global non-profit team of experts focused on thelong-term economic and environmental sustainability of the power sector We provide technical and policy assistance on regulatory and market policies that promote economic efficiency environmental protection system reliability and the fair allocation of system benefits among consumers We work extensively in the US China the European Union and India Visit our website at wwwraponlineorg to learn more about our work
Rate Design Where Advanced Metering Infrastructure Has Not Been Fully Deployedhttpwwwraponlineorgdocumentdownloadid6516
This paper identifies sound practices in rate design applied around the globe using conventional metering technology Rate design for most residential and small commercial customers (mass market consumers) is most often reflected in a simple monthly access charge and a per-kWh usage rate in one or more blocks and one or more seasons A central theme across the practices highlighted in this paper is that of sending effective pricing signals through the usage-sensitive components of rates in a way that reflects the character of underlying long-run costs associated with production and usage While new technology is enabling innovations in rate design that carry some promise of better capturing opportunities for more responsive load the majority of the worldrsquos electricity usage is expected to remain under conventional pricing at least through the end of the decade and much longer in some areas Experience to date has shown that the traditional approaches to rate design persist well after the enabling technology is in place that leads to change
Time-Varying and Dynamic Rate Designhttpwwwraponlineorgdocumentdownloadid5131
This report discusses important issues in the design and deployment of time-varying rates The term time-varying rates is used in this report as encompassing traditional time-of-use rates (such as time-of-day rates and seasonal rates) as well as newer dynamic pricing rates (such as critical peak pricing and real time pricing) The discussion is primarily focused on residential customers and small commercial customers who are collectively referred to as the mass market The report also summarizes international experience with time-varying rate offerings
50 State Street Suite 3Montpelier Vermont 05602802-223-8199wwwraponlineorg
- Table of Contents
- Introduction
- California Pacific Gas and Electric Company
- Idaho Idaho Power Company
- Maryland Baltimore Gas and Electric
- Wisconsin Wisconsin Public Service Corporation
- Massachusetts National Grid
- Hawaii Hawaiian Electric Company
- Discussion of the Six Utilities Overall
- Conclusions
- Appendix
- Additional Resources
-

Decoupling Case Studies Revenue Regulation Implementation in Six States
42
Table 17a
Baltimore Gas and ElectricBGE Monthly Revenue Regulation Adjustments 2008 to 201278
Table 17b
Baltimore Gas and ElectricBGE Monthly Revenue Regulation Adjustments 2008 to 201278
March Residential 000172 01477 1165General Service 000230 01526 1507
April Residential 000016 01477 0108General Service 000146 01526 0957
May Residential 000066 01477 0447General Service 000230 01526 1507
June Residential minus000066 01477 minus0447General Service 000230 01526 1507
July Residential 000158 01477 1070General Service 000230 01526 1507
August Residential minus000040 01477 minus0271General Service 000214 01526 1402
September Residential 000237 01477 1605General Service 000230 01526 1507
October Residential 000237 01477 1605General Service 000143 01526 0937
November Residential 000237 01477 1605General Service 000140 01526 0917
December Residential 000445 01477 3013General Service 000230 01526 1507
January Residential 000035 01579 0222General Service minus000073 01346 minus0542
February Residential 000025 01579 0158General Service 000230 01346 1709
March Residential minus000237 01579 minus1501General Service 000230 01346 1709
April Residential minus000237 01579 minus1501General Service 000230 01346 1709
May Residential 000234 01579 1482General Service 000132 01346 0981
June Residential 000237 01579 1501General Service 000230 01346 1709
July Residential 000237 01579 1501General Service 000230 01346 1709
August Residential 000237 01579 1501General Service 000190 01346 1412
September Residential 000237 01579 1501General Service 000230 01346 1709
October Residential 000237 01579 1501General Service 000124 01346 0921
November Residential 000237 01579 1501General Service 000230 01346 1709
December Residential 000156 01579 0988General Service 000204 01346 1516
Adjustment $kWh
Adjustment $kWh2008 2009
Retail Rate
$kWh
Retail Rate
$kWhAdjustment
Adjustment
Decoupling Case Studies Revenue Regulation Implementation in Six States
43
Table 17c
Baltimore Gas and ElectricBGE Monthly Revenue Regulation Adjustments 2008 to 201278
Table 17d
Baltimore Gas and ElectricBGE Monthly Revenue Regulation Adjustments 2008 to 201278
January Residential 000203 01465 1386General Service 000230 01261 1824
February Residential minus000142 01465 minus0969General Service 000230 01261 1824
March Residential minus000237 01465 minus1618General Service 000230 01261 1824
April Residential minus000237 01465 minus1618General Service 000230 01261 1824
May Residential 000192 01465 1311General Service 000230 01261 1824
June Residential 000191 01465 1304General Service 000230 01261 1824
July Residential 000095 01465 0648General Service 000230 01261 1824
August Residential minus000176 01465 minus1201General Service 000224 01261 1776
September Residential minus000237 01465 minus1618General Service 000116 01261 0920
October Residential minus000237 01465 minus1618General Service 000081 01261 0642
November Residential minus000237 01465 minus1618General Service 000098 01261 0777
December Residential minus000079 01465 minus0539General Service 000229 01261 1816
January Residential minus000130 01365 minus0952General Service 000230 01156 1990
February Residential minus000253 01365 minus1853General Service minus000020 01156 minus0173
March Residential minus000018 01365 minus0132General Service minus000063 01156 minus0545
April Residential 000110 01365 0806General Service minus000262 01156 minus2266
May Residential 000010 01365 0073General Service minus000160 01156 minus1384
June Residential 000226 01365 1656General Service 000042 01156 0363
July Residential 000253 01365 1853General Service 000209 01156 1808
August Residential minus000007 01365 minus0051General Service minus000157 01156 minus1358
September Residential minus000253 01365 minus1853General Service minus000177 01156 minus1531
October Residential 000228 01365 1670General Service 000262 01156 2266
November Residential minus000059 01365 minus0432General Service 000262 01156 2266
December Residential 000071 01365 0520General Service 000262 01156 2266
Adjustment $kWh
Adjustment $kWh2010 2011
Retail Rate
$kWh
Retail Rate
$kWhAdjustment
Adjustment
Decoupling Case Studies Revenue Regulation Implementation in Six States
44
Table 17e
Baltimore Gas and ElectricBGE Monthly Revenue Regulation Adjustments 2008 to 201278
January Residential 000253 01291 1960General Service 000262 01064 2462
February Residential 000253 01291 1960General Service 000262 01064 2462
March Residential 000253 01291 1960General Service 000262 01064 2462
April Residential 000253 01291 1960General Service 000262 01064 2462
May Residential 000253 01291 1960General Service 000262 01064 2462
June Residential 000253 01291 1960General Service 000262 01064 2462
July Residential 000253 01291 1960General Service 000262 01064 2462
August Residential 000253 01291 1960General Service 000160 01064 1504
Adjustment $kWh2012
Retail Rate
$kWhAdjustment
Decoupling Case Studies Revenue Regulation Implementation in Six States
45
79 Morgan P (2012 November) A decade of decoupling for US energy utilities rate impacts designs and observations
80 Morgan P (2012 November) A decade of decoupling for US energy utilities rate impacts designs and observations
Table 18
Wisconsin Public Service Corporation Revenue Regulation Adjustments 2009 to 201179
2009 ResidentialSmall Commercial 00048705 000168154 01290 378 130Commercial 00084951 000293293 00945 899 310
2010 ResidentialSmall Commercial 00033043 000166936 01291 256 129Commercial 00056630 000286103 09460 060 030
2011 ResidentialSmall Commercial (00018666) $ (000163719) 01288 minus145 minus127Commercial (00032565) $ (000285629) 01037 minus314 minus275
Derived Adjustment
$kWh
Derived Adjustment Capped $
kWh
Retail Rate
$kWh
Revenue Regulation Actual
Revenue Regulation Capped
Table 19
National Grid Revenue Regulation Adjustments 2011-201276
Massachusetts Electric and Nantucket Electric
Table 20
Hawaiian Electric Company
2011 All minus0015 1429 minus0105
2012 All 0044 1396 0315
2011 01995 3149 063
2012 03894 3641 107
Revenue Regulation Adjustment
centkWh
Revenue Regulation Adjustment
centkWhRetail Rate
centkWh
Retail Rate
Revenue Regulation Adjustment
Revenue Regulation
ldquoThe 2011 adjustment took effect June 1 but was reduced to $0 on July 26 2011 when the Commission granted HECO an interim rate increase of $532 million in a 2011 test year general rate case The 2012 Adjustment runs from June 1 2012 through May 31 2013 About 25 of the total relates to the portion of the decoupling mechanism that updates OampM and rate baserdquo (Morgan 2013)
Decoupling Case Studies Revenue Regulation Implementation in Six States
46
Revenue Regulation and Decoupling A Guide to Theory and Applicationhttpwwwraponlineorgdocumentdownloadid902
This guide was prepared to assist anyone who needs to understand both the mechanics of a regulatory tool known as decoupling and the policy issues associated with its use This would include public utility commissioners and staff utility management advocates and others with a stake in the regulated energy system While this guide is somewhat technical at points we have tried to make it accessible to a broad audience to make comprehensible the underlying concepts and the implications of different design choices This guide includes a detailed case study that demonstrates the impacts of decoupling using different pricing structures (rate designs) and usage patterns
Pricing Dorsquos and Donrsquots Designing Retail Rates as if Efficiency Countshttpwwwraponlineorgdocumentdownloadid939
Rate design is a crucial element of an overall regulatory strategy that fosters energy efficiency and sends appropriate signals about efficient system investment and operations Rate design is also fully under the control of state regulators Progressive rate design elements can guide consumers to participate in energy efficiency programs and reduce peak demand yet relatively few utilities and commissions have implemented many of these elements This RAP paper identifies some best practices Because pricing issues tie closely to utility growth incentives we also address revenue decoupling
A Decade of Decoupling for US Energy Utilities Rate Impacts Designs and Observationshttpwwwraponlineorgdocumentdownloadid6356
This report written by Pamela Morgan of Graceful Systems LLC builds on a 2009 report Now covering 25 states including 49 LDCs and 24 electric utilities this report summarizes the decoupling mechanism designs these utilities use and the rate adjustments they have made under those mechanisms In total this report estimates the retail rate impacts of 1244 decoupling mechanism adjustments since 2005
Additional Resources
The Role of Decoupling Where Energy Efficiency is Required by Lawhttpwwwraponlineorgdocumentdownloadid275
This Issuesletter gives an overview of energy efficiency resource standards the need to decouple utility profits from utility sales and explains why decoupling is needed even where a third party administers energy efficiency programs
Revenue Decoupling Standards and Criteria A Report to the Minnesota Public Utilities Commissionhttpwwwraponlineorgdocumentdownloadid850
In 2007 the Minnesota legislature enacted a new statute Section 216B2412 in which it defined an alternative approach to utility regulation decoupling and directed the Public Utilities Commission (PUC) to ldquoestablish criteria and standardsrdquo by which decoupling could be adopted for the statersquos rate-regulated utilitiesTo fulfill its obligation to develop criteria and standards for decoupling the PUC sought the advice of the Regulatory Assistance Project (RAP) This report is the output of that collaboration
Designing Distributed Generation Tariffs Wellhttpwwwraponlineorgdocumentdownloadid6898
Improvements in distributed generation economics increasing consumer preference for clean distributed energy resources and a favorable policy environment in many states have combined to produce significant increases in distributed generation adoption in the United States Regulators are looking for the well-designed tariff that compensates distributed generation adopters fairly for the value they provide to the electric system compensates the utility fairly for the grid services it provides and charges non-participating consumers fairly for the value of the services they receive This paper offers regulatory options for dealing with distributed generation The authors outline current tariffs and ponder what regulators should consider as they weigh the benefits costs and net value to distributed generation adopters non-adopters the utility and society as a whole The paper highlights the importance of deciding upon a valuation methodology so that the presence or absence of cross-subsidies can be determined Finally the paper offers rate design and ratemaking options for regulators to consider and includes recommendations for fairly implementing tariffs and ratemaking treatments to promote the public interest and ensure fair compensation
Decoupling Case Studies Revenue Regulation Implementation in Six States
47
The Regulatory Assistance Project (RAP)trade is a global non-profit team of experts focused on thelong-term economic and environmental sustainability of the power sector We provide technical and policy assistance on regulatory and market policies that promote economic efficiency environmental protection system reliability and the fair allocation of system benefits among consumers We work extensively in the US China the European Union and India Visit our website at wwwraponlineorg to learn more about our work
Rate Design Where Advanced Metering Infrastructure Has Not Been Fully Deployedhttpwwwraponlineorgdocumentdownloadid6516
This paper identifies sound practices in rate design applied around the globe using conventional metering technology Rate design for most residential and small commercial customers (mass market consumers) is most often reflected in a simple monthly access charge and a per-kWh usage rate in one or more blocks and one or more seasons A central theme across the practices highlighted in this paper is that of sending effective pricing signals through the usage-sensitive components of rates in a way that reflects the character of underlying long-run costs associated with production and usage While new technology is enabling innovations in rate design that carry some promise of better capturing opportunities for more responsive load the majority of the worldrsquos electricity usage is expected to remain under conventional pricing at least through the end of the decade and much longer in some areas Experience to date has shown that the traditional approaches to rate design persist well after the enabling technology is in place that leads to change
Time-Varying and Dynamic Rate Designhttpwwwraponlineorgdocumentdownloadid5131
This report discusses important issues in the design and deployment of time-varying rates The term time-varying rates is used in this report as encompassing traditional time-of-use rates (such as time-of-day rates and seasonal rates) as well as newer dynamic pricing rates (such as critical peak pricing and real time pricing) The discussion is primarily focused on residential customers and small commercial customers who are collectively referred to as the mass market The report also summarizes international experience with time-varying rate offerings
50 State Street Suite 3Montpelier Vermont 05602802-223-8199wwwraponlineorg
- Table of Contents
- Introduction
- California Pacific Gas and Electric Company
- Idaho Idaho Power Company
- Maryland Baltimore Gas and Electric
- Wisconsin Wisconsin Public Service Corporation
- Massachusetts National Grid
- Hawaii Hawaiian Electric Company
- Discussion of the Six Utilities Overall
- Conclusions
- Appendix
- Additional Resources
-
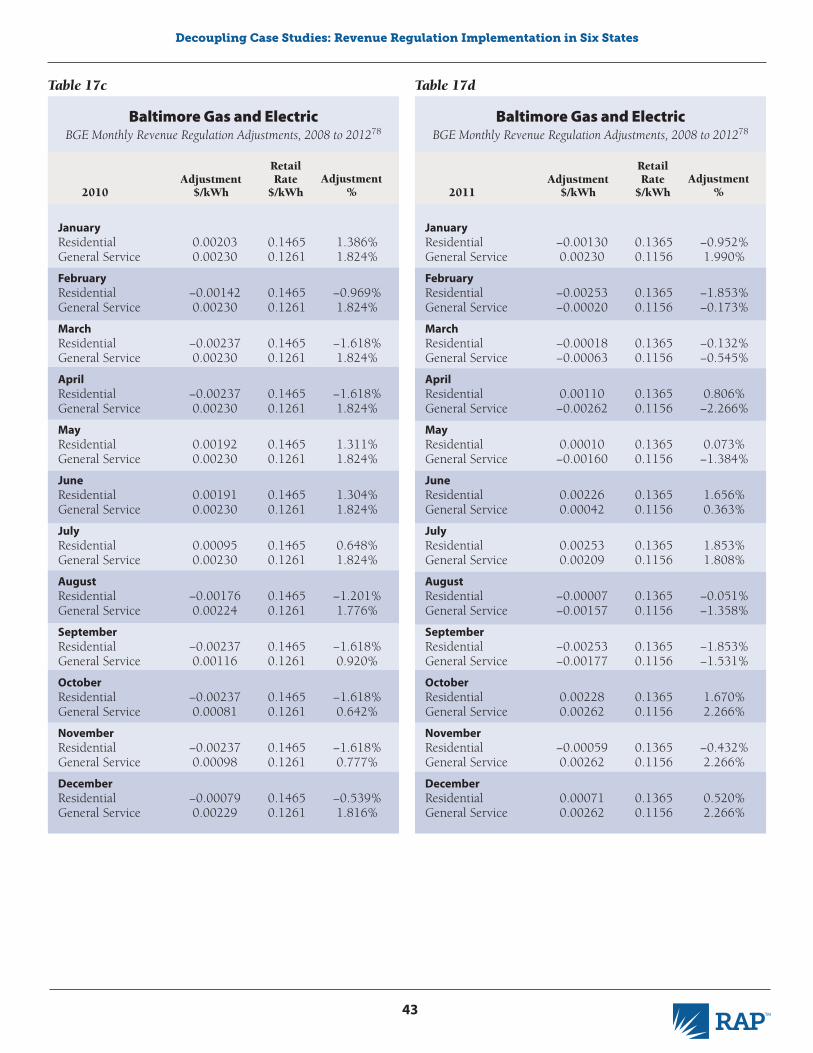
Decoupling Case Studies Revenue Regulation Implementation in Six States
46
Revenue Regulation and Decoupling A Guide to Theory and Applicationhttpwwwraponlineorgdocumentdownloadid902
This guide was prepared to assist anyone who needs to understand both the mechanics of a regulatory tool known as decoupling and the policy issues associated with its use This would include public utility commissioners and staff utility management advocates and others with a stake in the regulated energy system While this guide is somewhat technical at points we have tried to make it accessible to a broad audience to make comprehensible the underlying concepts and the implications of different design choices This guide includes a detailed case study that demonstrates the impacts of decoupling using different pricing structures (rate designs) and usage patterns
Pricing Dorsquos and Donrsquots Designing Retail Rates as if Efficiency Countshttpwwwraponlineorgdocumentdownloadid939
Rate design is a crucial element of an overall regulatory strategy that fosters energy efficiency and sends appropriate signals about efficient system investment and operations Rate design is also fully under the control of state regulators Progressive rate design elements can guide consumers to participate in energy efficiency programs and reduce peak demand yet relatively few utilities and commissions have implemented many of these elements This RAP paper identifies some best practices Because pricing issues tie closely to utility growth incentives we also address revenue decoupling
A Decade of Decoupling for US Energy Utilities Rate Impacts Designs and Observationshttpwwwraponlineorgdocumentdownloadid6356
This report written by Pamela Morgan of Graceful Systems LLC builds on a 2009 report Now covering 25 states including 49 LDCs and 24 electric utilities this report summarizes the decoupling mechanism designs these utilities use and the rate adjustments they have made under those mechanisms In total this report estimates the retail rate impacts of 1244 decoupling mechanism adjustments since 2005
Additional Resources
The Role of Decoupling Where Energy Efficiency is Required by Lawhttpwwwraponlineorgdocumentdownloadid275
This Issuesletter gives an overview of energy efficiency resource standards the need to decouple utility profits from utility sales and explains why decoupling is needed even where a third party administers energy efficiency programs
Revenue Decoupling Standards and Criteria A Report to the Minnesota Public Utilities Commissionhttpwwwraponlineorgdocumentdownloadid850
In 2007 the Minnesota legislature enacted a new statute Section 216B2412 in which it defined an alternative approach to utility regulation decoupling and directed the Public Utilities Commission (PUC) to ldquoestablish criteria and standardsrdquo by which decoupling could be adopted for the statersquos rate-regulated utilitiesTo fulfill its obligation to develop criteria and standards for decoupling the PUC sought the advice of the Regulatory Assistance Project (RAP) This report is the output of that collaboration
Designing Distributed Generation Tariffs Wellhttpwwwraponlineorgdocumentdownloadid6898
Improvements in distributed generation economics increasing consumer preference for clean distributed energy resources and a favorable policy environment in many states have combined to produce significant increases in distributed generation adoption in the United States Regulators are looking for the well-designed tariff that compensates distributed generation adopters fairly for the value they provide to the electric system compensates the utility fairly for the grid services it provides and charges non-participating consumers fairly for the value of the services they receive This paper offers regulatory options for dealing with distributed generation The authors outline current tariffs and ponder what regulators should consider as they weigh the benefits costs and net value to distributed generation adopters non-adopters the utility and society as a whole The paper highlights the importance of deciding upon a valuation methodology so that the presence or absence of cross-subsidies can be determined Finally the paper offers rate design and ratemaking options for regulators to consider and includes recommendations for fairly implementing tariffs and ratemaking treatments to promote the public interest and ensure fair compensation
Decoupling Case Studies Revenue Regulation Implementation in Six States
47
The Regulatory Assistance Project (RAP)trade is a global non-profit team of experts focused on thelong-term economic and environmental sustainability of the power sector We provide technical and policy assistance on regulatory and market policies that promote economic efficiency environmental protection system reliability and the fair allocation of system benefits among consumers We work extensively in the US China the European Union and India Visit our website at wwwraponlineorg to learn more about our work
Rate Design Where Advanced Metering Infrastructure Has Not Been Fully Deployedhttpwwwraponlineorgdocumentdownloadid6516
This paper identifies sound practices in rate design applied around the globe using conventional metering technology Rate design for most residential and small commercial customers (mass market consumers) is most often reflected in a simple monthly access charge and a per-kWh usage rate in one or more blocks and one or more seasons A central theme across the practices highlighted in this paper is that of sending effective pricing signals through the usage-sensitive components of rates in a way that reflects the character of underlying long-run costs associated with production and usage While new technology is enabling innovations in rate design that carry some promise of better capturing opportunities for more responsive load the majority of the worldrsquos electricity usage is expected to remain under conventional pricing at least through the end of the decade and much longer in some areas Experience to date has shown that the traditional approaches to rate design persist well after the enabling technology is in place that leads to change
Time-Varying and Dynamic Rate Designhttpwwwraponlineorgdocumentdownloadid5131
This report discusses important issues in the design and deployment of time-varying rates The term time-varying rates is used in this report as encompassing traditional time-of-use rates (such as time-of-day rates and seasonal rates) as well as newer dynamic pricing rates (such as critical peak pricing and real time pricing) The discussion is primarily focused on residential customers and small commercial customers who are collectively referred to as the mass market The report also summarizes international experience with time-varying rate offerings
50 State Street Suite 3Montpelier Vermont 05602802-223-8199wwwraponlineorg
- Table of Contents
- Introduction
- California Pacific Gas and Electric Company
- Idaho Idaho Power Company
- Maryland Baltimore Gas and Electric
- Wisconsin Wisconsin Public Service Corporation
- Massachusetts National Grid
- Hawaii Hawaiian Electric Company
- Discussion of the Six Utilities Overall
- Conclusions
- Appendix
- Additional Resources
-