delhi water supply & sewerage services : coping...
TRANSCRIPT

Delhi Water Supply & Sewerage Services : Coping Costs, Willingness to Pay and Affordability
Smita Misra, Sr. Economist, SASEI, World Bank
December 2006
Delhi Water Supply & Sewerage Services : Coping Costs, Willingness to Pay and Affordability
Smita Misra, Sr. Economist, SASEI, World Bank
December 2006

Overall Study ObjectivesOverall Study Objectives
• To understand Water Supply & Sewerage (WSS) conditions and preferences of representative consumers - Quantity & quality of water consumed- Coping strategies (including use of groundwater) and cost- Demand & preferences for water supply services- Affordable contributions for preferred options

Sample SizeSample Size Delhi (10,000)Delhi (10,000)Delhi (10,000)
Domestic Consumers
(8000)
Domestic Domestic Consumers Consumers
(8000)(8000)
Non-Domestic Consumers
(2000)
NonNon--Domestic Domestic Consumers Consumers
(2000)(2000)
UnderservedUnderserved Authorized Flatted
Authorized Flatted
Authorized Plotted
Authorized Plotted
Juggi Jhopri JJ (Slum) ClustersResettlementColoniesUnauthorized Non-RegularizedUnauthorized RegularizedUrban VillageRural Village
Juggi Jhopri JJ (Slum) ClustersResettlementColoniesUnauthorized Non-RegularizedUnauthorized RegularizedUrban VillageRural Village
Janta Flats/ Type I/ One room tenements
Low Income Group (LIG) Flats / Type II
Middle Income Group (MIG) Flats
High Income Group (HIG) Flats / Luxury Apartments
Janta Flats/ Type I/ One room tenements
Low Income Group (LIG) Flats / Type II
Middle Income Group (MIG) Flats
High Income Group (HIG) Flats / Luxury Apartments
Plots < 100 sq m
Plots 100-150 sq m
Plots 150-300 sq m
Plots > 300 sq m
Plots < 100 sq m
Plots 100-150 sq m
Plots 150-300 sq m
Plots > 300 sq m
Commercial
Institutional
Industrial
Commercial
Institutional
Industrial

Representative Consumer Categories Representative Consumer Categories Surveyed in Different ZonesSurveyed in Different Zones

Sampling Design: Domestic ConsumersSampling Design: Domestic Consumers
• Multi-stage stratified random sampling methodology (Voter List)- Stage I: Zones- Stage II: Colonies- Stage III: Households
• Sampling separately undertaken for:- Delhi Jal Board (DJB) Pilot Project in South 2 & 3 zones- Rest of Delhi under DJB, New Delhi Municipal Corporation
(NDMC) & Delhi Cantonment Board (DCB)
Structure of this PresentationStructure of this Presentation
• Existing Water Supply Arrangements; Compulsions for Coping Strategies and Costs
• Willingness to Pay for Improvements in WSS Services
• Affordability Analysis
• Key Findings

Existing Water Supply Arrangement Existing Water Supply Arrangement ……AuthorisedAuthorised ColoniesColonies

Sources of Water Supply by Zones Sources of Water Supply by Zones ––AuthorisedAuthorised coloniescolonies
12
12
6
9
6
99
96
99
984
4
3
1
1
1
2
3
2
7
4South 2
South 3
Other DJBzones
Average
% hhsOwn bore well Housing society bore wellDJB tanker Bottled waterPiped Water Supply

Sources of Water Supply by Zones Sources of Water Supply by Zones -- UnderservedUnderserved
13
6
13
12
7
2
7
6
67
73
53
62
1
5
7
5
4
2
6
5
22
23
24
23
South 2
South 3
Other DJB zones
Average
% hhs
Own bore well DJB tanker Community hand pumpCommunity stand post Galli tap Piped water supply

Average Hours of Water Supply Average Hours of Water Supply -- DomesticDomestic
0
1
2
3
4
5
6
7
8Ja
nta/
LIG
MIG
/HIG
Plot
s >1
50 s
qm
150-
300
& >
300
sq m To
tal
JJ
Res
et c
ols
Una
uth
Reg
Una
uth
Non
-re
g
Urb
an-R
ural
Villa
ge Tota
l
Hrs
of S
uppl
y
South 2 South 3 Other DJB zones Delhi average
AUTHORISEDAUTHORISED UNDERSERVEDUNDERSERVED

Water Pressure Water Pressure -- DomesticDomestic
30
40
50
60
70
80
90
100
Janta/
LIG
MIG/H
IGPlots
> 150
sq m
t
150-3
00 &
> 30
0 sq m Total
JJ co
loniesRes
et Cols
Unauth R
egUna
uth Non-re
g
Urban
-Rural
Villa
ge
Total%
HH
repo
rting
Low
-pre
ssur
e
South-2 South-3 Rest of Delhi Delhi Average
AUTHORISEDAUTHORISED UNDERSERVEDUNDERSERVED

Water PressureWater Pressure-- Non DomesticNon Domestic
% Establishments
37
38
59
47
57
58
36
48
6
4
5
5
Commercial
Institutional
Industrial
Delhi Total
Low Moderate High
Hrs. of Water Supply
3.6
3.9
3.7
2.9

Water Quality Water Quality
% Households with greater than permissible limit of water quality parameter
0
10
20
30
40
50
60
70
80
90
JJ C
olonies
Reset
ColsUna
uth Non-re
gUna
uth Reg
Urban
-Rural
Villa
ges
Janta/
LIG MIG HIGPlots
<100
m
Plots 10
0-150
sq m
Plots 15
0-300
sq m
Plots >3
00 sq
m
Total
Total Dissolved Solids (TDS) Total Hardness (TH) Alkalinity MPN E-coli

Coping StrategiesCoping Strategies……

Coping Strategies Coping Strategies ……AuthorisedAuthorised ColoniesColonies% Respondents
15
14
8
79
92
84
4
5
4
77
95
82
55
75
71
65
73
57
7
20
6
South - 2
South - 3
Other DJBZones
Borewell Booster PumpGround Level Reservoir (GLR) Over Head Tank (OHT)Internal pipe line Water FilterUnder Ground Reservoir (UGR)

Coping StrategiesCoping Strategies……UnderservedUnderserved % Respondents
1
4
20
25
17
16
1
86
80
72
83
81
2
2
1
5
3
1
80
83
76
75
78
1
76
76
75
75
75
7
25
30
16
18
0
3
6
2
2
3
0
13
13
2
4
JJ
Resettlement
URC
UNRC
Urban-RuralVillages
Total
Borewell Booster PumpGround Level Reservoir (GLR) Overhead Tank (OHT)Internal Pipeline Water FilterUnder Ground Reservoir (UGR) Others

Coping Strategies Coping Strategies -- Non DomesticNon Domestic
% Respondents
30
43
8
60
34
12
Borewell
Pump
UGR/GLR
OHT
Pipeline
Filter
Findings Findings –– Coping costsCoping costs

Coping Cost for Households in Authorized Coping Cost for Households in Authorized ColoniesColonies
10.3Coping cost per KL of water consumed (Rs)
226Total coping cost per HH per month (Rs)
124Recurring cost per HH per month (Rs)
102Capital cost per HH per month (Rs)
6829Investment per HH (Rs)
22Water Consumption per HH per month (KL)

Coping Cost for Households in Underserved Coping Cost for Households in Underserved Colonies Colonies
17.7Average Consumption of Water/month/HH (KL)3259Average investment in water assets per HH (Rs)
59Opportunity cost of time/month/HH (Rs)181 Total coping cost per month per HH (Rs)10.2Average coping cost per KL of water consumed
0.6Time spent on water collection/day/HH (hours)122Capital Cost + Recurring expenses/month (Rs)
73Recurring expenses per month per HH (Rs)49Capital cost per month per HH (Rs)
4355Total Number of Households Surveyed

Water Expenses in Authorized Colonies Water Expenses in Authorized Colonies
Cost/month (Rs)
89
115
111
137
135
140
155
198
248
147
54
92
57
105
141
108
138
204
237
123
33
74
40
83
112
102
150
151
194
102
Janta flat
LIG flat
Type II Govt. Qtrs.
MIG housing
HIG flats
Plots < 100 sq.m
Plots 100-150 sq.m
Plots 150-300 sq.m
Plots > 300 sq.m
All
Mthly water bill
Coping cost -recurring
Coping cost -Investment inassets

Coping Cost Estimates Coping Cost Estimates –– other key findingsother key findings
• Coping costs of domestic consumers in authorized colonies are about Rs 10 per KL of water used
• Coping costs of domestic consumers in underserved areas are about Rs 10 per KL of water used if cost of time spent for water collections is included and Rs 7 per KL of water used if time cost is not included.
• Coping costs of non-domestic consumers are about Rs 12-39 per KL of water used
• These estimates of coping costs of consumers are close to or higher than the cost of supply, estimated at about Rs 9.5 per KL(including interest and depreciation)

Coping Cost for NonCoping Cost for Non--domestic Consumersdomestic Consumers
311910Average Water consumption per consumer per month (KL)
123936Average coping cost of Water/KL (Rs)
384741360Total coping cost per consumer per month (Rs)
298636309Recurring expenses per consumer per month (Rs)
8610551Capital cost per consumer per month (Rs)
576869743375Average Investment per consumer (Rs)
505961534Number of Consumers surveyed
InstitutionalIndustrialCommercial

Coping Cost Coping Cost -- NonNon--domestic Consumersdomestic Consumers
Rs/kL
40
32
57
24
15
11
Comm South2&3
Comm Other
Industrial South2&3
Industrial Other
Institutional South2&3
Institutional Other
coping cost

Willingness to Pay for Improved Water Willingness to Pay for Improved Water ServicesServices……

Analysis of WTP in this study Analysis of WTP in this study -- methodologymethodology
• Contingent valuation method has been applied
• Care has been taken to minimize biases by appropriate scenario building and choice of value elicitation format
• For value elicitation, the payment card method is used: likely improvement in water and sewerage services are explained to the respondents (consumers) who are then asked to indicate acceptable monthly water bill (including sewerage charges) out of a list of possible payments shown to them.
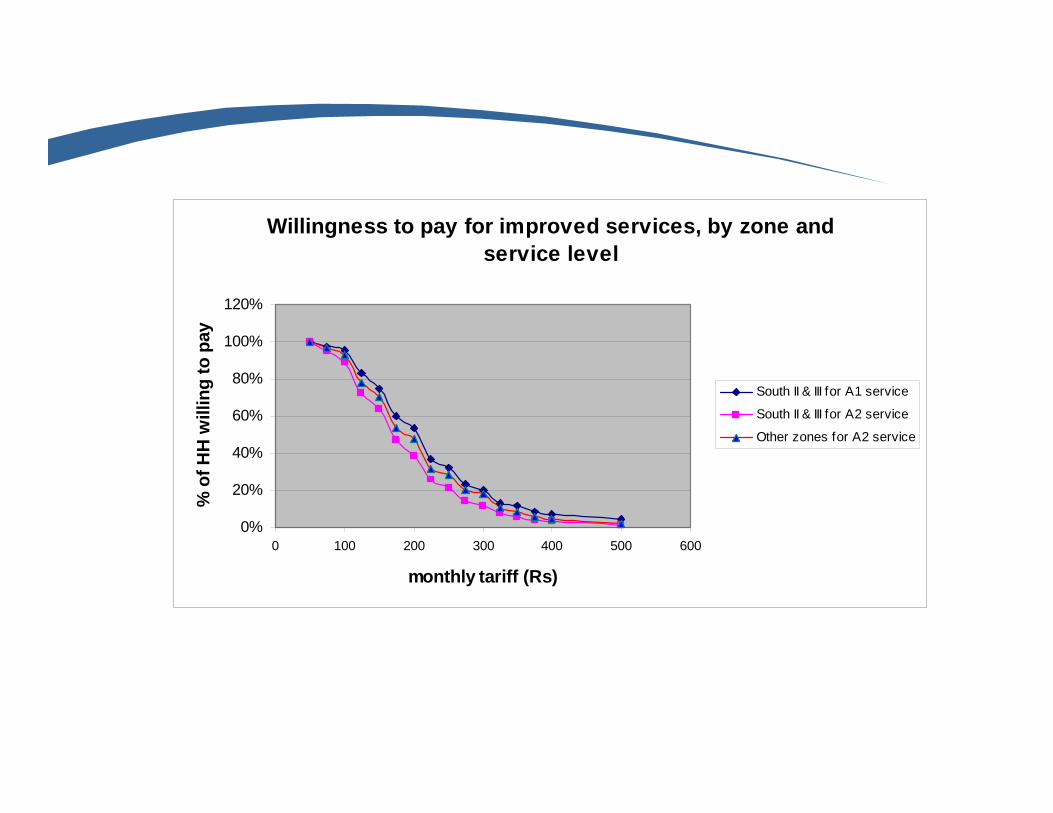
Willingness to pay for improved services, by zone and service level
0%
20%
40%
60%
80%
100%
120%
0 100 200 300 400 500 600
monthly tariff (Rs)
% o
f HH
will
ing
to p
ay
South II & III for A1 service
South II & III for A2 service
Other zones for A2 service

% HH in JJ cluster WTP for Group Connection % HH in JJ cluster WTP for Group Connection (mean = (mean = RsRs 64 to 78 per month)64 to 78 per month)
75 74
61
51
31
20 40 60 80 100
Monthly Tariff (Rs)
% HH Willing to Pay

Estimated Mean WTP of Various NonEstimated Mean WTP of Various Non--Domestic Domestic Consumers for Improved Water Supply Consumers for Improved Water Supply
R s / m o n t h
3 2 2
4 2 8
4 5 7
C o m m e r c i a l
I n d u s t r i a l
I n s t i t u t i o n a l
W T P p e r m o n t h

Comparison of Coping Costs and WTP for Improved Comparison of Coping Costs and WTP for Improved Services Services -- NonNon--domestic Consumersdomestic Consumers
R s / K L
3 6
3 9
1 2 . 4
3 2
2 3
1 5
C o m m e r c i a l
I n d u s t r i a l
I n s t i t u t i o n a l
C o p in g c o s t s W T P

Factors influencing householdsFactors influencing households’’ willingness willingness to pay for improved servicesto pay for improved services• Econometric analysis points out some of the important factors that
influence WTP: - Income- Household size - Education of respondent- Coping cost currently being borne, particularly electricity charges for
booster pumps, maintenance of large storage, repair and maintenance of filter, and expenditure on purchase of water - Perception factor: if the respondent perceived a marked improvement
in supply after the project is implemented

Factors influencing householdsFactors influencing households’’ willingness willingness to pay for improved servicesto pay for improved services• Other important factors influencing WTP:
- Quantity of water consumed (higher water requirement, higher WTP)- Whether the respondent is the owner rather than tenant (WTP more
for owners)- Whether current supply is adequate (WTP more if supply inadequate) - Whether the household is incurring expenses for maintenance of
pipeline (WTP more for households incurring such expenses)- Whether the household has invested in a borewell (low WTP if
invested in borewell)- Whether the household is currently getting water at high pressure (low
WTP for improved services, if getting water at high pressure)

Affordability Analysis Affordability Analysis ……

Considerations underlying determination of Considerations underlying determination of affordability (continued)affordability (continued)• Major difficulty in applying this approach to Delhi is that
a significant proportion of low income households are not paying any water bill- because they collect water from public sources, or- because they have their own source of water
• Therefore, to ascertain affordability, 80th percentile of the ratio in question among low income households (up to Rs 7000/month, accounting for 38% of sample) has been taken.

RATIO 3RATIO 3::Water bill + O&M cost + Water purchase + Maintenance cost of
storage as a proportion of income
RATIO 2:RATIO 2:Water bill + O&M cost of Booster Pump as a proportion of income
RATIO 1:RATIO 1:Water bill as a proportion of
income
POSSIBLE SCENARIOS:POSSIBLE SCENARIOS:
Water supply improvements do not lead to savings in HH coping costs (eg. Continue to use Booster Pumps)
Water supply improvements enable most HHsto save O&M cost (electricity charge) of Booster Pumps
Improvements in water supply enable HHs to save O&M cost of Booster Pumps, cost of water purchased and maintenance cost of large storage
LONGLONG--TERMTERMEFFECTEFFECT
SHORTSHORT--TERMTERMEFFECTEFFECT
IMMEDIATEIMMEDIATEEFFECTEFFECT
8080thth Percentile Percentile (Low(Low--income income HHsHHs):): 2.4%2.4% 3.3%3.3% 3.7%3.7%

Findings of affordability analysisFindings of affordability analysis
• Among medium and high income households almost all can afford to pay water tariff high enough to cover cost of operations, interest and depreciation.
• Among low income households, about 68% can afford to pay water tariff of Rs 4/KL (+50% sewerage charge) which is high enough to cover operating cost.
• About 44% of low income households can afford to pay water tariff high enough to cover operating cost, interest and depreciation.

Key Findings …

Comparison of Average Coping Cost, WTP and Affordability by Comparison of Average Coping Cost, WTP and Affordability by household category, authorized colonieshousehold category, authorized colonies
0
200
400
600
800
1000
1200
JantaFlat
LIG Flat Type IIGovt.Qrtrs.
MIGHousing
HIG Flats Plots <100 sq.m
Plots100-150
sq.m
Plots150-300
sq.m
Plots >300 sq.m
Rs
/ mon
th
Water bill WTP coping cost + current water bill Affordable water bill

Comparison of Average Coping Cost, WTP and Affordability by Comparison of Average Coping Cost, WTP and Affordability by household category, underserved colonieshousehold category, underserved colonies
0
50
100
150
200
250
300
350
400
ResettlementColonies
UnauthorizedRegularised
Colonies
Unauthorized Non-regularised
Colonies
Rural-UrbanVillages
Rs
/ mon
th
Water bill WTP coping cost + current water bill Affordable water bill
Recommendations to Delhi Recommendations to Delhi JalJal Board Board
• Use of Survey information to design consumer feed-back indicators for monitoring improvements in DJB service performance
• Use of Coping Cost, WTP and Affordability information for Design of Tariffs
• Use of tariffs to reduce groundwater (borewell) consumption